UNITED STATES
SECURITIES AND EXCHANGE COMMISSION
WASHINGTON, D.C. 20549
FORM 20-F
ANNUAL REPORT PURSUANT TO SECTION 13 OR 15(d)
OF THE SECURITIES EXCHANGE ACT OF 1934
For the fiscal year ended: December 31, 2018
Commission file number: 001-36165
AMBEV S.A.
(Exact name of Registrant as specified in its charter)
Federative Republic of Brazil
(Jurisdiction of incorporation or organization)
Rua Dr. Renato Paes de Barros, 1017, 3rd floor
04530-001 São Paulo, SP, Brazil
(Address of principal executive offices)
Fernando Mommensohn Tennenbaum, Chief Financial and Investor Relations Officer
Address: Rua Dr. Renato Paes de Barros, 1017, 3rd floor, 04530-001, São Paulo, SP, Brazil
Telephone No.: +55 (11) 2122-1200
e-mail: ir@ambev.com.br
(Name, Telephone, E-mail and/or Facsimile number and Address of Company Contact Person)
Securities registered or to be registered pursuant to Section 12(b) of the Act:
|
Title of each class |
Name of each exchange on which registered |
|
American Depositary Shares, |
New York Stock Exchange |
|
evidenced by American Depositary |
|
|
Receipts, each representing |
|
|
1 (one) common share*, |
|
|
no par value |
|
* Not for trading, but in connection with the registration of American Depositary Shares, pursuant to the requirements of the Securities and Exchange Commission.
Securities registered or to be registered pursuant to Section 12(g) of the Act: None
Securities for which there is a reporting obligation pursuant to Section 15(d) of the Act:
|
Title of each class |
Name of each exchange on which registered |
|
Not applicable |
Not applicable |
Indicate the number of outstanding shares of each of the issuer’s classes of capital or common stock as of the close of the period covered by the annual report.
15,721,119,008 common shares, without par value
Indicate by check mark if the registrant is a well-known seasoned issuer, as defined in Rule 405 of the Securities Act.
Yes x No
If this report is an annual or transition report, indicate by check mark if the registrant is not required to file reports pursuant to Section 13 or 15(d) of the Securities Exchange Act of 1934.
Yes No x
Indicate by check mark whether the registrant (1) has filed all reports required to be filed by Section 13 or 15(d) of the Securities Exchange Act of 1934 during the preceding 12 months (or for such shorter period that the registrant was required to file such reports), and (2) has been subject to such filing requirements for the past 90 days.
Yes x No
Indicate by check mark whether the registrant has submitted electronically every Interactive Data File required to be submitted pursuant to Rule 405 of Regulation S-T (§ 232.405 of this chapter) during the preceding 12 months (or for such shorter period that the registrant was required to submit such files).
Yes x No
Indicate by check mark whether the registrant is a large accelerated filer, an accelerated filer, a non-accelerated filer, or an emerging growth company. See definition of “accelerated filer,” “large accelerated filer,” and “emerging growth company” in Rule 12b-2 of the Exchange Act.
Large accelerated filer x Accelerated filer Non-accelerated filer Emerging growth company
If an emerging growth company that prepares its financial statements in accordance with U.S. GAAP, indicate by check mark if the registrant has elected not to use the extended transition period for complying with any new or revised financial accounting standards† provided pursuant to Section 13(a) of the Exchange Act.
† The term “new or revised financial accounting standard” refers to any update issued by the Financial Accounting Standards Board to its Accounting Standards Codification after April 5, 2012.
Indicate by check mark which basis of accounting the registrant has used to prepare the financial statements included in this filing:
|
U.S. GAAP |
International Financial Reporting Standards as issued by the International Accounting Standards Board x |
Other |
If “Other” has been checked in response to the previous question, indicate by check mark which financial statement item the registrant has elected to follow. N/A
Item 17 Item 18
If this is an annual report, indicate by check mark whether the registrant is a shell company (as defined in Rule 12b-2 of the Exchange Act).
Yes No x
TABLE OF CONTENTS
| Page | |
|
i | |
|
i | |
|
ii | |
|
ii | |
|
ii | |
|
ii | |
|
PART I 1 |
|
|
ITEM 1. IDENTITY OF DIRECTORS, SENIOR MANAGEMENT AND ADVISERS |
1 |
|
2 | |
|
3 | |
|
24 | |
|
47 | |
|
47 | |
|
71 | |
|
85 | |
|
94 | |
|
102 | |
|
104 | |
|
ITEM 11. QUANTITATIVE AND QUALITATIVE DISCLOSURES ABOUT MARKET RISK |
126 |
|
ITEM 12. DESCRIPTION OF SECURITIES OTHER THAN EQUITY SECURITIES |
132 |
|
PART II 133 |
|
|
134 | |
|
ITEM 14. MATERIAL MODIFICATIONS TO THE RIGHTS OF SECURITY HOLDERS AND USE OF PROCEEDS |
135 |
|
136 | |
|
138 | |
|
139 | |
|
140 | |
|
141 | |
|
ITEM 16D. EXEMPTIONS FROM THE LISTING STANDARDS FOR AUDIT COMMITTEES |
143 |
|
ITEM 16E. PURCHASES OF EQUITY SECURITIES BY THE ISSUER AND AFFILIATED PURCHASERS |
144 |
|
145 | |
|
146 |
|
147 | |
|
PART III 148 |
|
|
148 | |
|
149 | |
|
150 |
INTRODUCTION
This annual report on Form 20-F relates to the registered American Depositary Shares, or ADSs, of Ambev S.A., or Ambev, evidenced by American Depositary Receipts, or ADRs, each representing one common share, no par value, of Ambev.
In this annual report, except as otherwise indicated or as the context otherwise requires, the “Company,” “Ambev,” “we,” “us” and “our” refers to Ambev S.A. and its subsidiaries and, unless the context otherwise requires, the predecessor companies that have been merged out of existence with and into it. All references to “Old Ambev” refer to Companhia de Bebidas das Américas – Ambev, our former subsidiary that had common and preferred shares listed on the São Paulo Stock, Commodities and Futures Exchange (B3 S.A. – Brasil, Bolsa, Balcão), or the B3 (previously named as BM&FBovespa S.A. – Bolsa de Valores, Mercadorias e Futuros), and common and preferred ADSs listed on the New York Stock Exchange, or the NYSE, and that was merged out of existence with and into us in January 2014. All references to NAB are to the non-alcoholic beverages in our portfolio other than non-alcoholic beer. All references to “Brazil” are to the Federative Republic of Brazil, unless the context otherwise requires. All references to the “Brazilian government” are to the federal government of Brazil. All references to percent ownership interests in Ambev do not take into account treasury shares.
PRESENTATION OF FINANCIAL AND OTHER INFORMATION
We prepare our audited consolidated financial statements in accordance with International Financial Reporting Standards, or IFRS, as issued by the International Accounting Standards Board, or the IASB. The financial information and related discussion and analysis contained in this annual report on Form 20-F are presented in reais, except as otherwise specified. Unless otherwise specified, the financial information analysis in this annual report on Form 20-F is based on our consolidated financial statements as of December 31, 2018, 2017 and 2016 and for the three years ended December 31, 2018, included elsewhere in this document. Percentages and some amounts in this annual report on Form 20-F have been rounded for ease of presentation. Any discrepancies between totals and the sums of the amounts listed are due to rounding.
Unless otherwise specified, volumes, as used in this annual report on Form 20-F, include both beer (including near-beer) and NAB volumes. In addition, unless otherwise specified, our volumes refer not only to the brands that we own or license, but also third-party brands that we brew or otherwise produce as a subcontractor, and third-party products that we sell through our distribution network. Our volume figures in this Form 20-F reflect 100% of the volumes of entities that we fully consolidate in our financial reporting. In addition, market share data contained in this annual report on Form 20-F refers to volumes sold.
Application of IAS 29 – Argentine Hyperinflation Accounting
In July 2018, the Argentine peso underwent a severe devaluation resulting in the three-year cumulative inflation of Argentina exceeding 100%, thereby triggering the requirement to transition to hyperinflation accounting as prescribed by IAS 29 Financial Reporting in Hyperinflationary Economies, or IAS 29, applicable to all our business entities whose functional currency is the Argentine peso. Such adjustments were required to be shown from January 1, 2018 (period in which hyperinflation was identified).
IAS 29 requires that the financial information recorded in a hyperinflationary currency be adjusted by applying a general price index and expressed in the measuring unit (the hyperinflationary currency) current at the end of the reporting period.
As a result of the above, our audited consolidated financial statements for the year end December 31, 2018 included in this annual report reflect hyperinflation accounting for our Argentinean subsidiaries applying IAS 29 rules.
For additional information, see note 1(b) to our audited consolidated financial statements as of and for the year ended December 31, 2018.
i
MARKET DATA
Market information (including market share, market position and industry data for our operating activities and those of our subsidiaries or of companies acquired by us) or other statements presented in this Form 20-F regarding our position (or that of companies acquired by us) relative to our competitors largely reflect the best estimates of our management. These estimates are based upon information obtained from customers, trade or business organizations and associations, other contacts within the industries in which we operate and, in some cases, upon published statistical data. Except as otherwise stated, our market share data, as well as our management’s assessment of our comparative competitive position, has been derived by comparing our sales volumes for the relevant period to our management’s estimates of our competitors’ sales volumes for such period, as well as upon published statistical data, and, in particular the reports published and the information made publicly available by, among others, the local brewers’ associations and the national statistics bureaus in the various countries in which we sell our products. Although we have no reason to believe any of this information or these reports are inaccurate in any material respect and believe and act as if they are reliable, we have not independently verified it.
In this annual report, references to “real,” “reais” or “R$” are to the legal currency of Brazil, references to “U.S. dollar” or “US$” are to the official currency of the United States and references to “Canadian dollar” or “C$” are to the legal currency of Canada.
We maintain our books and records in reais. However, solely for the convenience of the reader, we have translated certain amounts included in this annual report from reais into U.S. dollars using the selling rate as reported by the Central Bank of Brazil (Banco Central do Brasil), or the Central Bank, as of December 31, 2018 of R$3.88 to US$1.00 or, where expressly indicated, at an average exchange rate prevailing during a certain period. We have also translated some amounts from U.S. dollars and Canadian dollars into reais. All such currency translations should not be considered representations that any such amounts represent, or could have been, or could be, converted into, U.S. or Canadian dollars or reais at that or at any other exchange rate. See “Item 3. Key Information—A. Selected Financial Data—Exchange Controls” for more detailed information regarding the translation of reais into U.S. dollars.
This annual report includes the names of our products which constitute trademarks or trade names which we own or which are owned by others and are licensed to us for our use. This annual report also contains other brand names, trade names, trademarks or service marks of other companies, and these brand names, trade names, trademarks or service marks are the property of those other companies.
CAUTIONARY STATEMENT REGARDING FORWARD-LOOKING INFORMATION
Some of the information contained in this annual report may constitute forward-looking statements within the meaning of Section 27A of the U.S. Securities Act of 1933, as amended, or the Securities Act, and Section 21E of the U.S. Securities Exchange Act of 1934, as amended, or the Exchange Act. We have based these forward-looking statements largely on our current expectations and projections about future events, industry and financial trends affecting our business.
Many of these forward-looking statements can be identified by the use of forward-looking words such as “anticipate,” “project,” “may,” “believe,” “could,” “expect,” “should,” “plan,” “intend,” “estimate,” “potential,” among others. These statements appear in a number of places in this annual report and include, but are not limited to, statements regarding our intent, belief or current expectations. Forward-looking statements are subject to certain risks and uncertainties that are outside our control and are difficult to predict. These risks and uncertainties could cause actual results to differ materially from those suggested by forward-looking statements. Factors that could cause actual results to differ materially from those contemplated by forward‑looking statements include, among others:
· greater than expected costs (including taxes) and expenses;
ii
|
· |
the risk of unexpected consequences resulting from acquisitions, joint ventures, strategic alliances, corporate reorganizations or divestiture plans, and our ability to successfully and cost-effectively implement these transactions and integrate the operations of businesses or other assets that we acquire; |
|
· |
our expectations with respect to expansion plans, projected asset divestitures, premium growth, accretion to reported earnings, working capital improvements and investment income or cash flow projections; |
|
· |
lower than expected revenue; |
|
· |
greater than expected customer losses and business disruptions; |
|
· |
limitations on our ability to contain costs and expenses; |
|
· |
local, regional, national and international economic conditions, including the risks of a global recession or a recession in one or more of our key markets, and the impact they may have on us and our customers and our assessment of that impact; |
|
· |
the monetary and interest rate policies of central banks; |
|
· |
continued availability of financing; |
|
· |
market and financial risks, such as interest rate risk, foreign exchange rate risk, commodity risk, asset price risk, equity market risk, inflation or deflation; |
|
· |
our ability to continue to introduce competitive new products and services on a timely, cost-effective basis; |
|
· |
the effects of competition and consolidation in the markets in which we operate, which may be influenced by regulation, deregulation or enforcement policies; |
|
· |
changes in pricing environments and volatility in commodity prices; |
|
· |
regional or general changes in asset valuations; |
|
· |
changes in consumer spending; |
|
· |
the outcome of pending and future litigation and governmental proceedings and investigations; |
|
· |
global political and economic developments; |
|
· |
changes in government policies, international trade policies, applicable laws, regulations and taxes in jurisdictions in which we operate including the laws and regulations governing our operations, as well as actions or decisions of courts and regulators; |
|
· |
natural and other disasters; |
|
· |
any inability to economically hedge certain risks; |
|
· |
inadequate impairment provisions and loss reserves; |
|
· |
technological changes; |
|
· |
our success in managing the risks involved in the foregoing; |
|
· |
governmental intervention, resulting in changes to the economic, tax or regulatory environment in Brazil or other countries in which we operate; |
iii
|
· |
inflation, appreciation, depreciation and devaluation of the real; |
|
· |
the declaration or payment of dividends; |
|
· |
the utilization of Ambev’s subsidiaries’ income tax loss carry forwards; and |
|
· |
other factors or trends affecting our financial condition or results of operations, including those factors identified or discussed under “Item 3. Key Information—D. Risk Factors.” |
We caution you that forward-looking statements are not guarantees of future performance and involve risks and uncertainties. Forward-looking statements reflect only our current expectations and are based on our management’s beliefs and assumptions and on information currently available to our management. Actual results may differ materially from those in forward-looking statements as a result of various factors, including, without limitation, those identified under “Item 3. Key Information—D. Risk Factors” in this annual report. As a result, investors are cautioned not to place undue reliance on forward-looking statements contained in this annual report when making an investment decision.
Forward-looking statements speak only as of the date they are made, and we do not undertake any obligation to update them in light of new information or future developments or to release publicly any revisions to these statements in order to reflect later events or circumstances or to reflect the occurrence of unanticipated events.
Investors should consider these cautionary statements together with any written or oral forward-looking statements that we may issue in the future.
iv
PART I
ITEM 1. IDENTITY OF DIRECTORS, SENIOR MANAGEMENT AND ADVISERS
Not Applicable.
1
ITEM 2. OFFER STATISTICS AND EXPECTED TIMETABLE
Not Applicable.
2
ITEM 3. KEY INFORMATION
A. Selected Financial Data
The following financial information of Ambev is only a summary and should be read in conjunction with, and is qualified in its entirety by reference to, our audited consolidated financial statements and related notes which are included elsewhere in this annual report on Form 20-F.
The tables below represent the selected consolidated income statement and balance sheet data as at and for the years ended December 31, 2018, 2017, 2016, 2015 and 2014 that has been derived from our audited consolidated financial statements, which were prepared in accordance with IFRS as issued by the IASB.
Selected Consolidated Income Statement Data
|
|
Year Ended December 31, | ||||
|
|
2018 |
2017 |
2016 |
2015 |
2014 |
|
|
|
|
|
|
|
|
|
(in R$ million) | ||||
|
Net sales |
50,231.3 |
47,899.3 |
45,602.6 |
46,720.2 |
38,079.8 |
|
Cost of sales |
(19,269.6) |
(18,041.8) |
(16,678.0) |
(16,061.4) |
(12,814.6) |
|
Gross profit |
30,961.7 |
29,857.5 |
28,924.6 |
30,658.8 |
25,265.2 |
|
Sales, marketing and distribution expenses |
(12,466.0) |
(11,915.5) |
(12,010.5) |
(11,177.9) |
(9,158.8) |
|
Administrative expenses |
(2,367.2) |
(2,623.8) |
(2,166.1) |
(2,281.3) |
(1,820.0) |
|
Other operating income/(expense) |
947.3 |
1,217.3 |
1,223.1 |
1,936.1 |
1,629.2 |
|
Exceptional items |
(86.4) |
(108.7) |
1,134.3 |
(357.2) |
(89.0) |
|
Income from operations |
16,989.4 |
16,426.8 |
17,105.4 |
18,778.5 |
15,826.6 |
|
Net finance cost |
(3,823.4) |
(3,493.9) |
(3,702.0) |
(2,268.2) |
(1,475.4) |
|
Share of results of associates |
1.0 |
(3.1) |
(5.0) |
3.1 |
17.4 |
|
Income tax expense |
(1,789.6) |
(5,079.3) |
(315.0) |
(3,634.2) |
(2,006.6) |
|
Net Income |
11,377.4 |
7,850.5 |
13,083.4 |
12,879.2 |
12,362.0 |
|
Attributable to: |
|
|
|
|
|
|
Equity holders of Ambev |
11,024.7 |
7,332.0 |
12,546.6 |
12,423.8 |
12,065.5 |
|
Non-controlling interests |
352.7 |
518.5 |
536.8 |
455.4 |
296.5 |
Earnings per Share and Dividend per Share
|
|
Year Ended December 31, | ||||
|
|
2018 |
2017 |
2016 |
2015 |
2014 |
|
|
|
|
|
|
|
|
|
(in R$, unless otherwise indicated) | ||||
|
Earnings per common share and per ADS(1): |
|
|
|
|
|
|
- Basic |
0.70 |
0.47 |
0.80 |
0.79 |
0.77 |
|
- Diluted |
0.70 |
0.46 |
0.79 |
0.79 |
0.76 |
|
Dividends and interest on shareholders’ equity per share and per ADS (weighted average)(2): |
|
|
|
|
|
|
- Basic (R$) |
0.56 |
0.56 |
0.66 |
0.73 |
0.77 |
|
- Basic (US$) |
0.14 |
0.17 |
0.20 |
0.19 |
0.29 |
|
Weighted average number of shares (million shares): |
|
|
|
|
|
|
- Basic |
15,718 |
15,706 |
15,697 |
15,696 |
15,683 |
|
- Diluted |
15,856 |
15,838 |
15,823 |
15,820 |
15,820 |
(1) The calculation of basic earnings per share is based on the net income attributable to equity holders of Ambev and the proportional weighted average number of shares outstanding during the year. Diluted earnings per share is based on the net income attributable to equity holders of Ambev and by adjusting the weighted average number of shares outstanding during the year to assume conversion of all potentially dilutive shares.
(2) Dividend and interest on shareholders’ equity per share information was calculated based on the amount paid during the year net of withholding tax.
3
Selected Consolidated Balance Sheet Data
|
|
As at December 31, | ||||
|
|
2018 |
2017 |
2016 |
2015 |
2014 |
|
|
|
|
|
|
|
|
|
(in R$ million) | ||||
|
Non-current assets |
68,796.5 |
62,133.9 |
59,954.6 |
61,861.8 |
51,414.8 |
|
Property, plant and equipment |
20,097.0 |
18,822.3 |
19,153.8 |
19,140.1 |
15,740.1 |
|
Goodwill |
34,276.2 |
31,401.9 |
30,511.2 |
30,953.1 |
27,502.9 |
|
Intangible assets |
5,840.6 |
4,674.7 |
5,245.9 |
5,092.2 |
3,754.9 |
|
Deferred tax assets |
2,017.5 |
2,279.3 |
2,268.2 |
2,749.9 |
1,392.5 |
|
Taxes and contributions receivable |
4,374.2 |
2,537.7 |
347.7 |
892.8 |
1,161.2 |
|
Trade and other receivables |
1,722.3 |
1,999.6 |
1,989.9 |
2,191.6 |
1,742.0 |
|
Other |
468.8 |
418.4 |
437.9 |
842.1 |
121.2 |
|
Current assets |
25,329.6 |
24,718.0 |
23,886.8 |
28,314.5 |
20,728.5 |
|
Inventories |
5,401.8 |
4,319.0 |
4,347.1 |
4,338.2 |
3,411.3 |
|
Trade and other receivables |
6,302.2 |
6,662.0 |
5,956.8 |
6,946.1 |
5,300.2 |
|
Taxes and contributions receivable |
2,148.7 |
3,370.6 |
5,423.3 |
3,194.9 |
1,581.9 |
|
Cash and cash equivalents |
11,463.5 |
10,354.5 |
7,876.8 |
13,620.2 |
9,722.1 |
|
Investment securities |
13.4 |
11.9 |
282.8 |
215.1 |
713.0 |
|
Total assets |
94,126.1 |
86,851.9 |
83,841.4 |
90,176.3 |
72,143.3 |
|
|
|
|
|
|
|
|
Shareholders’ equity |
57,547.4 |
47,982.8 |
46,651.3 |
50,333.7 |
43,644.7 |
|
Equity attributable to equity holders of Ambev |
56,340.6 |
46,008.8 |
44,825.0 |
48,331.9 |
42,221.6 |
|
Non-controlling interests |
1,206.8 |
1,974.0 |
1,826.3 |
2,001.8 |
1,423.1 |
|
Non-current liabilities |
11,750.3 |
10,180.6 |
8,416.5 |
9,700.7 |
6,673.8 |
|
Interest-bearing loans and borrowings |
862.1 |
1,231.9 |
1,765.7 |
2,316.9 |
1,634.6 |
|
Employee benefits |
2,343.7 |
2,310.7 |
2,137.7 |
2,221.9 |
1,757.0 |
|
Deferred tax liabilities |
2,424.6 |
2,329.2 |
2,329.7 |
2,473.6 |
1,737.6 |
|
Taxes and contributions payable |
2,903.4 |
3,189.6 |
681.4 |
910.0 |
610.9 |
|
Trade and other payables |
2,790.4 |
606.6 |
736.6 |
1,278.8 |
390.5 |
|
Provisions |
426.2 |
512.6 |
765.4 |
499.5 |
543.2 |
|
Current liabilities (1) |
24,828.4 |
28,688.5 |
28,773.6 |
30,141.9 |
21,824.8 |
|
Interest-bearing loans and borrowings |
1,560.6 |
1,321.1 |
3,630.6 |
1,282.6 |
988.1 |
|
Trade and other payables |
17,754.5 |
21,702.8 |
20,692.0 |
24,391.6 |
17,054.7 |
|
Taxes and contributions payable |
5,340.2 |
5,493.8 |
4,282.4 |
4,342.1 |
3,543.7 |
|
Provisions |
173.0 |
169.0 |
168.6 |
123.1 |
139.2 |
|
Bank overdraft |
0.0 |
1.8 |
0.0 |
2.5 |
99.1 |
|
Total shareholders’ equity and liabilities |
94,126.1 |
86,851.9 |
83,841.4 |
90,176.3 |
72,143.3 |
Other Data
|
|
As at and for the Year Ended December 31, | ||||
|
|
2018 |
2017 |
2016 |
2015 |
2014 |
|
|
|
|
|
|
|
|
|
(in R$ million, except for operating data) | ||||
|
Other Financial Data: |
|
|
|
|
|
|
Net working capital(1) |
501.2 |
(3,970.5) |
(4,886.8) |
(1,827.4) |
(1,096.3) |
|
Cash dividends and interest on shareholders’ equity paid |
8,814.1 |
8,819.8 |
10,330.6 |
11,490.2 |
12,059.6 |
|
Depreciation and amortization(2) |
4,023.1 |
3,612.1 |
3,512.0 |
3,074.6 |
2,392.5 |
|
Capital expenditures(3) |
3,571.0 |
3,203.6 |
4,132.7 |
5,261.2 |
4,493.1 |
|
Operating cash flows - generated(4) |
17,911.2 |
17,874.1 |
12,344.4 |
23,580.8 |
15,895.7 |
|
Investing cash flows - used(4) |
(3,675.7) |
(3,073.0) |
(5,898.0) |
(5,997.0) |
(4,768.0) |
|
Financing cash flows - used(4) |
(8,814.1) |
(12,864.2) |
(11,645.1) |
(15,327.9) |
(13,143.8) |
|
Other Operating Data: |
|
|
|
|
|
|
Total production capacity - million hl(5) |
270.1 |
276.5 |
280.4 |
269.9 |
292.3 |
|
Total volume sold - million hl(6) |
158.7 |
162.8 |
159.8 |
169.1 |
171.7 |
|
Number of employees(7) |
49,617 |
51,432 |
53,250 |
52,738 |
51,871 |
(1) Represents total current assets less total current liabilities.
(2) Includes depreciation of property, plant and equipment, amortization of intangible assets and impairment losses related to these assets.
(3) Represents cash expenditures for property, plant, equipment and intangible assets.
(4) Operating, investing and financing cash flow data is derived from our consolidated cash flow statements contained in our audited consolidated financial statements.
(5) Represents our available production capacity at year-end; capacity can vary from year to year depending on mix; “hl” is the abbreviation for hectoliters.
4
(6) Represents our full-year volumes.
(7) Includes all our production- and non-production-related employees.
Exchange Controls
There are no restrictions on ownership of the ADSs or the preferred shares or common shares by individuals or legal entities domiciled outside Brazil. However, the right to convert dividend payments, interest on shareholders’ equity payments and proceeds from the sale of preferred shares or common shares into foreign currency and to remit such amounts outside Brazil is subject to exchange control restrictions and foreign investment legislation which generally requires, among other things, that relevant investments be registered with the Central Bank and the Comissão de Valores Mobiliários (the Brazilian Securities Commission), or the CVM.
Restrictions on the remittance of foreign capital abroad could hinder or prevent Banco Bradesco S.A., the custodian of Ambev’s ADS program, or the custodian, or holders who have exchanged Ambev’s ADSs for shares of Ambev, from converting dividend distributions, interest on shareholders’ equity or the proceeds from any sale of shares of Ambev into U.S. dollars and remitting such U.S. dollars abroad. Holders of Ambev ADSs could be adversely affected by delays in or refusal to grant any required governmental approval for conversions of real payments and remittances abroad.
Under Brazilian law relating to foreign investment in the Brazilian capital markets, or the Foreign Investment Regulations, foreign investors registered with CVM, and acting through authorized custodial accounts managed by local agents may buy and sell shares on Brazilian stock exchanges without obtaining separate certificates of registration for each transaction. Foreign investors may register their investment under Law No. 4,131/62, as amended, or Law No. 4,131, or Resolution No. 4,373, dated September 29, 2014, or Resolution No. 4,373, of the Conselho Monetário Nacional (National Monetary Council), or the CMN.
Law No. 4,131 is the main legislation concerning foreign capital and direct equity investments in Brazilian companies and it is applicable to any amount that enters the country in the form of foreign currency, goods and services. Except for registration of the capital inflow/outflow with the Central Bank, non-resident investors directly investing in equity of Brazilian companies do not need any specific authorization to make such investments.
Portfolio foreign investments are regulated by Resolution No. 4,373 and CVM Rule No. 560, as amended.
Under Resolution No. 4,373, foreign investors may invest in almost all financial assets and engage in almost all transactions available in the Brazilian financial and capital markets, provided that certain requirements are fulfilled. In accordance with Resolution No. 4,373, the definition of a foreign investor includes individuals, legal entities, mutual funds and other collective investment entities, domiciled or headquartered abroad.
In order to become a Resolution No. 4,373 investor, a foreign investor must:
· appoint at least one representative in Brazil, with powers to perform actions relating to its investment;
· appoint an authorized custodian in Brazil for its investments, which must be a financial institution or entity duly authorized by the Central Bank or CVM;
· appoint a tax representative in Brazil;
· through its representative in Brazil, register itself as a foreign investor with the CVM; and
· through its representative in Brazil, register its foreign investment with the Central Bank.
In addition, an investor operating under the provisions of Resolution No. 4,373 must be registered with the Receita Federal do Brasil (the Brazilian Internal Revenue Service), or the RFB, pursuant to RFB Normative Instruction No. 1,548 of February 13, 2015, and RFB Normative Instruction No. 1,863 of December 28, 2018.
Pursuant to the registration obtained by Ambev with the Central Bank in the name of The Bank of New York Mellon, as depositary for the ADS programs of Ambev, or the Depositary, with respect to the ADSs to be maintained by the custodian on behalf of the Depositary, the custodian and the Depositary will be able to convert dividends and other distributions with respect to the Ambev shares represented by ADSs into foreign currency and remit the proceeds outside Brazil. Pursuant to CMN Resolution No. 4,373, in order for an investor to surrender ADSs for the purpose of withdrawing the shares represented thereby, the investor is required to appoint a Brazilian financial institution duly authorized by the Central Bank and the CVM to act as its legal representative, who shall be responsible, among other things, for keeping and updating the investors’ certificates of registrations with the Central Bank, which entitles registered foreign investors to trade the underlying shares directly on the B3.
5
Under current legislation, the Brazilian government may impose temporary restrictions on remittances of foreign capital abroad in the event of a serious imbalance or an anticipated serious imbalance of Brazil’s balance of payments. For approximately six months in 1989 and early 1990, the Brazilian government froze all dividend and capital repatriations held by the Central Bank that were owed to foreign equity investors in order to conserve Brazil’s foreign currency reserves. These amounts were subsequently released in accordance with Brazilian government directives. We cannot assure you that the Brazilian government will not impose similar restrictions on foreign repatriations in the future. See “—D. Risk Factors—Risks Relating to Brazil and Other Countries in Which We Operate” and “—D. Risk Factors—Risks Relating to Our Common Shares and ADSs.”
B. Capitalization and Indebtedness
Not applicable.
C. Reasons for the Offer and Use of Proceeds
Not applicable.
D. Risk Factors
Before making an investment decision, you should consider all of the information set forth in this annual report. In particular, you should consider the special features applicable to an investment in Brazil and applicable to an investment in Ambev, including those set forth below. In general, investing in the securities of issuers in emerging market countries, such as Brazil, involves a higher degree of risk than investing in the securities of issuers in the United States.
Risks Relating to Brazil and Other Countries in Which We Operate
Economic and political uncertainty and volatility in Brazil, and the perception of these conditions in the international financial markets, may adversely affect our business.
Our most significant market is Brazil, which has periodically experienced rates of inflation higher than expected. Inflation, along with governmental measures to fight inflation and public speculation about possible future measures, has had significant negative effects on the Brazilian economy. The annual rates of inflation, as measured by the Índice Nacional de Preços ao Consumidor (National Consumer Price Index), was 6.2% in 2014, 11.3% in 2015, 6.6% in 2016, 2.1% in 2017 and 3.8% in 2018. Future governmental actions, including actions to adjust the value of the real, may trigger increases in inflation. We cannot assure you that inflation will not affect our business in the future. In addition, any effort on the part of the Brazilian government to preserve economic stability, as well as any public speculation about possible future initiatives, may contribute significantly to economic uncertainty in Brazil and may heighten volatility in the Brazilian securities markets and securities issued abroad by Brazilian issuers. It is also difficult to assess the impact that turmoil in the credit markets will have in the Brazilian economy, and as a result on our operations and financial results in the future.
In addition, Brazil’s political environment has historically influenced, and continues to influence, the performance of the country’s economy. Political crises have affected and continue to affect the confidence of investors and the general public, which have historically resulted in economic deceleration and heightened volatility in the securities issued by Brazilian companies.
The recent economic and political instability in Brazil has contributed to a decline in market confidence in the Brazilian economy. In addition, in the context of the various ongoing investigations into allegations of money laundering and corruption being currently conducted by Brazilian Federal and State authorities the Brazilian economy and political environment have been negatively impacted. The potential outcome of such corruption-related investigations is uncertain, but they have already impacted the general market perception of the Brazilian economy, political environment and the Brazilian capital market. We have no control over, and cannot predict, whether such investigations or allegations will lead to further political and economic instability.
6
Amidst this background of political and economic uncertainty, in August 2016, the Brazilian Senate approved the removal from office of Brazil’s then-President, Dilma Rousseff, following a legal and administrative impeachment process for infringement of budgetary laws. Michel Temer, the former Vice-President, who assumed the presidency of Brazil following Rousseff’s ouster, was arrested as part of corruption investigations in March 2019. In addition, the former President, Luiz Inacio Lula da Silva, began serving a 12-year prison sentence on corruption and money laundering charges in April 2018.
On October 28, 2018, Jair Bolsonaro was elected the next President of Brazil and took office on January 1, 2019. We cannot predict with certainty how Bolsonaro’s victory may impact the overall stability, growth prospects and economic and political health of the country.
Driven by the recent economic and political instability in Brazil, among other factors, Brazil has faced a series of economic and political difficulties since 2014, including increasing unemployment rates, decreasing consumer and business confidence, falling industrial output, a deficit in Brazil’s primary accounts, shrinking gross domestic product until 2017 and meager growth since then, increasing uncertainties with regards to Congressional decisions and the significant devaluation and volatility of the real.
Consumption of beer, other alcoholic beverages and soft drinks in many of the jurisdictions in which we operate, including Brazil, is closely linked to general economic conditions, such that levels of consumption tend to rise during periods of rising per capita income and to fall during periods of declining per capita income. Additionally, per capita consumption is inversely related to the sale price of our products. Besides moving in concert with changes in per capita income, consumption of beer and other alcoholic beverages also varies in accordance with changes in disposable income. Any decrease in disposable income resulting from an increase in inflation, income taxes, cost of living, unemployment levels, political or economic instability or other factors would likely adversely affect the demand for beer, other alcoholic beverages, soft drinks and other non-alcoholic beverages, as well as our results of operations. Moreover, the recent instability and uncertainty in the Brazilian economic and political scenario may adversely affect the demand for our products, which in turn may negatively impact our operations and financial results.
Our results of operations are affected by fluctuations in exchange rates, and devaluation of the real relative to other currencies, including the U.S. dollar, which may adversely affect our financial performance.
Most of our sales are in reais; however, a relevant portion of our debt is denominated in foreign currencies, including U.S. dollars. In addition, a significant portion of our cost of sales in 2018, in particular those related to packaging such as cans and bottles made of polyethylene terephthalate, or PET, as well as sugar, hops and malt are also denominated in or linked to the U.S. dollar, which was very volatile in recent years. Therefore, any devaluation of the real when compared to those foreign currencies may increase our financial expenses and operating costs and could affect our ability to meet our foreign currency obligations. Although our current policy is to hedge substantially all of our U.S. dollar-denominated debt and cost of sales against changes in foreign exchange rates, we cannot assure you that such hedging will be possible or available at reasonable costs at all times in the future.
In addition, we have historically reported our consolidated results in reais. In 2018, we derived 46.6%of our net revenues from operating companies that have functional currencies that are not reais (that is, in most cases, the local currency of the respective operating company). Consequently, any change in exchange rates between our operating companies’ functional currencies and reais will affect our consolidated income statement and balance sheet. Decreases in the value of our operating companies’ functional currencies against reais will tend to reduce those operating companies’ contributions in terms of our financial condition and results of operations.
We also incur currency transaction risks whenever one of our operating companies enters into transactions using currencies other than their respective functional currencies, including purchase or sale transactions and the issuance or incurrence of debt. Although we have hedging policies in place to manage commodity price and foreign currency risks to mitigate our exposure to currencies other than our operating companies’ functional currencies, there can be no assurance that such policies will be able to successfully hedge against the effects of such foreign exchange exposure, particularly over the long term.
7
The Brazilian currency has devalued frequently, including during the last two decades. Throughout this period, the Brazilian government has implemented various economic plans and utilized a number of exchange rate policies, including sudden devaluations and periodic mini-devaluations, during which the frequency of adjustments has ranged from daily to monthly, floating exchange rate systems, exchange controls and dual exchange rate markets. There have been significant fluctuations in the exchange rates between Brazilian currency and the U.S. dollar and other currencies. For example, beginning in 2011, the U.S. dollar appreciated 12.5%, 8.9%, 14.6%, 13.4% and 47.0% against the real in 2011, 2012, 2013, 2014 and 2015, respectively, closing at R$3.905 per U.S. $1.00 as of December 31, 2015. However, the U.S. dollar depreciated 16.5% against the real in 2016, closing at R$3.259 per U.S.$1.00 as of December 31, 2016, while in 2017, the U.S. dollar appreciated 1.5% against the real, closing at R$3.308 per U.S.$1.00 as of December 31, 2017. The U.S. dollar appreciated 17.1% against the real in 2018, closing at R$3.88 per U.S.$1.00 as of December 31, 2018. As of March 8, 2019, the exchange rate was R$3.87 per US$1.00.
Devaluation of the real relative to the U.S. dollar may create additional inflationary pressures in Brazil by generally increasing the price of imported products and requiring recessionary governmental policies to curb aggregate demand. On the other hand, further appreciation of the real against the U.S. dollar may lead to a deterioration of the current account and the balance of payments, as well as dampen export-driven growth. The potential impact of the floating exchange rate and measures of the Brazilian government aimed at stabilizing the real is uncertain. In addition, a substantial increase in inflation may weaken investor confidence in Brazil, impacting our ability to finance our operations through the international capital markets.
Increases in taxes levied on beverage products in Brazil and unfair competition arising from tax evasion may adversely affect our results and profitability.
Increases in Brazil’s already high levels of taxation could adversely affect our profitability. Increases in taxes on beverage products usually result in higher beverage prices for consumers. Higher beverage prices generally result in lower levels of consumption and, therefore, lower net sales. Lower net sales result in lower margins because some of our costs are fixed and thus do not vary significantly based on the level of production. We cannot assure you that the Brazilian government will not increase current tax levels, at both state and/or federal levels, and that this will not impact our business. In January 2015 the Brazilian federal government enacted Law No. 13,097, which introduced a new federal taxation model for beer and soft drinks. The law is a result of the combined efforts of the Brazilian federal government and beverage companies with a view to creating a less complex and more predictable tax system for the industry. The new tax model came into force on May 1, 2015. Among other changes, the new set of rules establishes that the Excise Tax (Imposto sobre Produtos Industrializados), or the IPI Excise Tax, the Social Integration Program Contribution (Programa de Integração Social), or the PIS Contribution and the Social Security Funding Contribution (Contribuição para Financiamento da Seguridade Social), or the COFINS, are due by manufacturers and wholesalers and shall be calculated based on the respective sales price (ad valorem). Under the previous legislation, the referred taxes were due exclusively by the manufacturer at fixed amounts per liter of beer or soft drink produced (ad rem).
Moreover, in 2015 the States of São Paulo, Rio de Janeiro, Minas Gerais, Distrito Federal, Rio Grande do Sul, Ceará, Amapá, Rondonia, Amazonas, Tocantins, Piauí, Maranhão, Rio Grande do Norte, Bahia, Pernambuco, Paraíba, Alagoas, Sergipe and Mato Grosso do Sul increased their ICMS Value-Added Tax rate applicable to beer and/or soft drinks. In 2016, the States of Rio de Janeiro and Acre also increased their respective ICMS Value-Added Tax rates, scheduled to take effect in early 2017. In 2017, the States of Goiás and Amazonas increased their soft drinks and beer ICMS rates, respectively. In 2018, the States of Maranhão and Pernambuco increased their non-alcoholic beverages ICMS rates and Bahia and Maranhão increased beer ICMS burden, which will become effective in early 2019.
In May 2018, the Brazilian Federal Government enacted Decree No. 9,394/2018 increasing IPI taxes applicable to transactions with concentrate units and, in so doing, effectively reducing the value of the IPI presumed credits that we recorded on acquisitions of soft drinks concentrates from companies located in the Manaus Free Trade Zone from 20% to 4%. Due to the severe effects of such change, the Brazilian Federal Government subsequently enacted Decree No. 9,514/2018 so that such proposed changes to IPI tax structure be implemented gradually, as follows: (1) taxation of 12% in the first half of 2019; (2) taxation of 8% in the second half of 2019; and (3) taxation of 4% from 2020 onwards.
8
In addition, the Brazilian beverage industry experiences unfair competition arising from tax evasion, which is primarily due to the high level of taxes on beverage products in Brazil. An increase in taxes may lead to an increase in tax evasion, which could result in unfair pricing practices in the industry. In 2008, the federal government issued regulations requiring the mandatory installation of production (volume) control systems, known as “SICOBE,” in all Brazilian beer and carbonated soft drinks, or CSD, factories in order to assist governments to fight tax evasion in the beverage industry. Though the objective of reducing tax evasion was achieved for federal taxes, and while state governments did start using data from the SICOBE in order to identify potential state tax evasion, there was still no assurance that unfair competition arising from tax evasion was, or would be, eliminated from the Brazilian beverage industry. Nonetheless, the mandatory implementation of SICOBE was suspended in December 2016 and the Brazilian federal government and regulators are developing a new system with state-of-the-art technology, aimed to reduce costs. Despite many discussions with the Brazilian government regarding a new system for implementation, there is not yet any agreement on this subject.
The Brazilian government has exercised, and continues to exercise, significant influence over the Brazilian economy; Brazilian economic and political conditions have a direct impact on our business.
The Brazilian economy has been characterized by significant involvement on the part of the Brazilian government, which often changes monetary, credit and other policies to influence Brazil’s economy. The Brazilian government’s actions to control inflation and affect other policies have often involved wage and price controls, the Central Bank’s base interest rates, as well as other measures, such as the freezing of bank accounts, which occurred in 1990.
Actions taken by the Brazilian government concerning the economy may have important effects on Brazilian corporations and other entities, including Ambev, and on market conditions and prices of Brazilian securities. Our financial condition and results of operations may be adversely affected by the following factors and the Brazilian government’s response to the following factors:
· devaluations and other exchange rate movements;
· inflation;
· investments;
· exchange control policies;
· employment levels and labor regulation;
· social instability;
· price instability;
· energy shortages;
· water rationing;
· interest rates and monetary policy;
· liquidity of domestic capital and lending markets;
· growth or downturn of the Brazilian economy;
· import and export controls;
9
· exchange controls and restrictions on remittances abroad;
· fiscal policy and changes in tax laws; and
· other political, diplomatic, social and economic developments in or affecting Brazil.
Our Latin America South operations are subject to substantial risks relating to the businesses and operations conducted in Argentina and other South American countries.
We own 100% of the total share capital of Latin America South Investment, S.L., or LASI, the net revenues from which corresponded to 21% of our consolidated results of operations in 2018. LASI is a holding company with operating subsidiaries in Argentina and other South American countries. As a result, LASI’s financial condition and results of operations may be adversely affected by the political instability, fluctuations in the economy and governmental actions concerning the economy of Argentina and the other countries in which its subsidiaries operate and, consequently, affect our consolidated results.
The results of our Argentinian operations have been significantly impacted in reais terms in recent years by political instability, fluctuations in the Argentine economy (such as the devaluation of the Argentine peso in December 2015), governmental actions concerning the economy of Argentina (such as Argentina’s selective default on its restructured debt in July 2014), inflation and deteriorating macroeconomic conditions in the country. Continued deterioration of the Argentine economy, or new foreign exchange, export repatriation or expropriation regimes could adversely affect our liquidity and ability to access funds from Argentina, our financial condition and operating results.
For example, in the early 2000s, Argentina experienced political and economic instability. A widespread recession occurred in 2002, including a 10.9% decrease in real GDP, high unemployment and high inflation. In the past, the Argentine economic and social situation has rapidly deteriorated, and may quickly deteriorate in the future; we cannot assure you that the Argentine economy will not rapidly deteriorate as in the past. Additionally, in 2018 the Argentine peso underwent a significant devaluation, losing 51% of its value relative to the real, impacting the net assets, results and cash flows of our Argentinean operations. The 2018 devaluation of the Argentine peso relative to the real, and further devaluations of the Argentine peso in the future, if any, may decrease our net assets in Argentina, with a balancing entry in our equity. See “—Risks Relating to Our Operations—Our results of operations are affected by fluctuations in exchange rates and devaluation of the real relative to other currencies, including the U.S. dollar, which may adversely affect our financial performance.”
Following the categorization of Argentina in our results for the third quarter of 2018 as a country with a three-year cumulative inflation rate greater than 100%, the country is considered as a hyperinflationary economy in accordance with IFRS rules (IAS 29), requiring us to restate the results of our operations for the year ended December 31, 2018, in hyperinflationary economies for the change in the general purchasing power of the local currency, using official indices before converting the local amounts at the closing rate of the period. If the economic or political situation in Argentina further deteriorates, our Latin America South operations may be subject to restrictions under new Argentinean foreign exchange, export repatriation or expropriation regimes that could adversely affect our liquidity and operations, and our ability to access funds from Argentina.
In addition, on July 30, 2014 Argentina entered into a selective default of its restructured debt and, in early 2016, U.S. courts ruled that Argentina must make full payments to the remaining holdout bondholders. Under the context of the significant devaluation of the Argentine peso in 2018, along with increased inflation and weak macroeconomic conditions Argentina signed, on June 7, 2018, an agreement with IMF to obtain a significant loan to stabilize the macroeconomic situation. The maintenance of such a scenario or further deterioration could have a material adverse effect on our Latin America South operations and their results, as well as in our ability to transfer funds from and within Argentina. Despite a government that seems more committed to fiscal responsibility, our liquidity and operations and our ability to access funds from Argentina could be adversely affected to the extent the economic or political situation in Argentina deteriorates, or if foreign exchange restrictions are implemented in the country. It is also difficult to assess the impact that the Argentine political scenario will have in the Argentine economy, including uncertainty regarding elections in Argentina to occur in 2019, and as a result on our future operations and financial results.
10
Risks Relating to Our Operations
We are subject to Brazilian and other antitrust regulations.
We have a substantial share of the beer market in Brazil and thus we are subject to constant monitoring by Brazilian antitrust authorities. We cannot assure you that Brazilian antitrust regulation will not affect our business in the future.
Our participation in the Argentine beer market increased substantially following the acquisition of our interest in Quilmes Industrial Société Anonyme, or Quinsa. Our operation in Argentina is subject to constant monitoring by Argentinean antitrust authorities. We cannot assure you that Argentinean antitrust regulation will not affect our business in Argentina in the future.
We are subject to regulation on alcoholic and CSD beverages in the countries in which we operate.
Our business is regulated by federal, state and municipal laws and regulations. We may be subject to claims that we have not complied with existing laws and regulations, which could result in fines and penalties. In addition, we may also be subject to laws and regulations aimed at reducing the availability of beer and carbonated soft drink, or CSD beverages, in some of our markets to address alcohol abuse, underage drinking, health concerns and other social issues. For example, certain Brazilian states and small municipalities in which we operate have enacted legislation restricting the hours of operations of certain points of sale, prohibiting the sale of CSDs in schools and imposing restrictions on advertisement of alcoholic beverages. The Brazilian Congress is also evaluating proposed regulation imposing hygienic seals on beverage cans, as well as regulation on the consumption, sales and marketing of alcoholic beverages, including beer which, if enacted, may impose restrictions on the advertisement of alcoholic beverage products on television during specified times of the day and the hours of operation of certain points of sale, among other things. Furthermore, there are legal proceedings pending before Brazilian courts that may lead to restrictions on advertisement of alcoholic beverages. These rules and restrictions may adversely impact our results of operations. For further information, see “Item 4. Information on the Company—B. Business Overview—Regulation.”
In addition, the partnership between Labatt Brewing Company Ltd., our Canadian subsidiary, and Tilray to research non-alcohol beverages containing tetrahydrocannabinol and cannabidiol, both derived from cannabis, could lead to increased legal, reputational and financial risks. While this partnership is currently limited to research in Canada, the laws and regulations governing recreational cannabis are still developing, including in ways that we may not foresee. For instance, the involvement in the legal cannabis industry in Canada may invite new regulatory and enforcement scrutiny in other markets. Cannabis remains illegal in many markets in which we operate, and violations of law could result in significant fines, penalties, administrative sanctions, convictions or settlements arising from civil proceedings or criminal charges. Furthermore, the political environment and popular support for cannabis legalization is changing quickly and remains in flux.
There is a global trend of increasing regulatory restrictions with respect to the sale of alcoholic and CSD beverages. Compliance with such regulatory restrictions can be costly and may affect earnings in the countries in which we operate.
If we do not successfully comply with applicable anti-corruption laws and regulations designed to combat governmental corruption in countries in which we sell our products, we could become subject to fines, penalties or other regulatory sanctions, as well as to adverse press coverage, which could cause our reputation and sales to suffer.
We are committed to conducting business in a legal and ethical manner in compliance with local and international statutory requirements and standards applicable to our business. Nevertheless, there is a risk that our management, employees or representatives may take actions that violate applicable laws and regulations prohibiting the making of improper payments to foreign government officials for the purpose of obtaining or keeping business, including laws relating to the 1997 OECD Convention on Combating Bribery of Foreign Public Officials in International Business Transactions such as the U.S. Foreign Corrupt Practices Act, or the FCPA.
11
In addition, on January 29, 2014, the Brazilian government enforced Federal Law No. 12,846/2013, or the Brazilian Clean Company Act, or BCCA, imposing strict liability on companies for corruption acts involving public officials executed by a company's employees. According to the BCCA, companies found guilty of bribery could face fines of up to 20% of their gross annual income (recorded during the year prior to the illicit conduct) or, if gross income cannot be estimated, such fines could range from R$6 thousand to R$60 million. Among other penalties, BCCA’s potential sanctions include the disgorgement of illegally obtained benefits, suspension of corporate operations, asset confiscation and corporate dissolution. However, the scope of the BCCA is limited to administrative and civil penalties, not criminal sanctions. The adoption of an effective compliance program may be taken into consideration by Brazilian authorities when applying penalties under the BCCA.
Despite the BCCA, Brazil still has a perceived elevated risk of public corruption, which may, to a certain degree, leave us exposed to potential violations of the FCPA or other anti-bribery laws and regulations. For example, a number of high profile corporate corruption allegations have surfaced, principally since the beginning of 2014. See “—D. Risk Factors—Risks Relating to Brazil and Other Countries in Which We Operate—Economic and political uncertainty and volatility in Brazil, and the perception of these conditions in the international financial markets, may adversely affect our business.” In that respect, Brazilian authorities currently investigating alleged corruption cases have in the past released a list of companies that had contracted consulting services from a firm part-owned by a former elected government official who has been convicted of corruption and racketeering by Brazil’s highest court. Years ago, we retained the services of this consulting firm in connection with a specific matter and, thus, have been cited among these consultant’s clients. We have reviewed our internal control and compliance procedures in relation to these services and have not identified any evidence of misconduct.
Although we have implemented what we understand to be a very robust compliance and anti-corruption program to detect and prevent violations of applicable anti-corruption laws, which includes a strict requirement prohibiting our employees and agents from violating these laws, remains some degree of risk that improper conduct could occur, thereby exposing us to potential liability and the costs associated with investigating potential misconduct. Our existing internal controls and compliance procedures may not be sufficient to prevent or detect all inappropriate conduct, fraud or violations of applicable law by our employees, agents, and the companies to which we outsource certain of our business operations. If we are not in compliance with anti-corruption laws, anti-money laundering laws and other laws governing the conduct of business with government entities, including under the FCPA and BCCA, we may be subject to administrative, civil and even criminal penalties and other remedial measures, which could harm our brand and reputation and have a material adverse impact on our business, financial condition, results of operations and prospects. Another potential fallout from having our name or brands associated with any misconduct is adverse press coverage, which, even if unwarranted or baseless, could damage our reputation, brands and sales. Therefore, if we become involved in any investigations, subpoenas or other proceedings under the FCPA, the BCCA or other applicable anti-corruption statutes, our business could be adversely affected.
Volatility in commodities prices may adversely affect our financial performance.
A significant portion of our cost of sales is comprised of commodities such as aluminum, sugar, corn, wheat and PET bottles, the prices of which fluctuated in 2018. An increase in commodities prices directly affects our consolidated operating costs. Although our current policy is to mitigate our exposure risks to commodity prices whenever financial instruments are available, we cannot assure that such hedging will be possible or available at reasonable costs at all times in the future.
Set forth below is a table showing the volatility in 2018 prices of the principal commodities we purchase:
|
Commodity |
High Price |
Low Price |
Average in 2018 |
Fluctuation |
|
Aluminum (US$/ton) |
2,537.0 |
1,845.0 |
2,114.4 |
37.5% |
|
Sugar (US$ cents/pounds) |
15.3 |
9.9 |
12.2 |
54.8% |
|
Corn (US$ cents/bushel) |
408.5 |
330.3 |
368.2 |
23.7% |
|
Wheat (US$ cents/bushel) |
574.5 |
416.5 |
495.6 |
37.9% |
|
PET (US$/ton) |
1,343.5 |
1,058.1 |
1,221.5 |
27.0% |
Sources: Aluminum LME, Sugar ICE, Corn CBOT, Wheat CBOT and PET IHS (formerly CMAI).
12
Contractual and legal restrictions to which Ambev and its subsidiaries are potentially or allegedly subject may be triggered upon the consummation of certain transactions involving our indirect controlling shareholder, Anheuser-Busch InBev SA/NV, or ABI, resulting in adverse limitations to our operations.
Ambev and its subsidiaries are a party to certain joint venture, distribution and other agreements, guarantees and instruments that may contain restrictive provisions that our contractual counterparties may try to interpret as being triggered upon the consummation of certain unrelated transactions of ABI. Some of those contracts may be material and, to the extent they may contain any such restrictive provisions, our counterparties may seek to enforce certain contractual remedies that may curtail material contractual rights and benefits that we have thereunder under the argument that ABI’s consummation of certain transactions has triggered the referred provisions. Similarly, unrelated transactions consummated by ABI may subject us to further antitrust restrictions in the countries in which we already operate. Any such restrictions may limit the amount and quality of business we conduct in each of those countries.
Competition could lead to a reduction of our margins, increase costs and adversely affect our profitability.
We compete with both brewers and other beverages companies and our products compete with other beverages. Globally, brewers, as well as other players in the beverage industry, compete mainly on the basis of brand image, price, quality, distribution networks and customer service. Consolidation has significantly increased the capital base and geographic reach of our competitors in some of the markets in which we operate, and competition is expected to increase further as the trend towards consolidation among companies in the beverage industry continues.
Concurrently, competition in the beverage industry is expanding and the market is becoming more fragmented, complex and sophisticated as consumer preferences and tastes evolve. Competition may divert consumers and customers from our products. Competition in our various markets could cause us to reduce pricing, increase capital investment, increase marketing and other expenditures, prevent us from increasing prices to recover higher costs, and thereby cause us to reduce margins or lose market share. Any of the foregoing could have a material adverse effect on our business, financial condition and results of operations. Innovation faces inherent risks, and the new products we introduce may not be successful, while competitors may be able to respond more quickly than we can to emerging trends.
Additionally, the unfair pricing practices in some markets and the lack of transparency, or even certain illicit practices, such as tax evasion and corruption, may skew the competitive environment, with material adverse effects on our profitability or ability to operate.
The ability of our foreign subsidiaries to distribute cash upstream may be subject to various conditions and limitations.
Our foreign subsidiaries’ ability to distribute cash (to be used, among other things, to meet our financial obligations) through dividends, intercompany advances, management fees and other payments is, to a large extent, dependent on the availability of cash flows at the level of such foreign subsidiaries and may be restricted by applicable laws and accounting principles. In particular, 46.6% (R$23.4 billion) of our total net revenues of R$50.2 billion in 2018 came from our foreign subsidiaries. In addition, some of our subsidiaries are subject to laws restricting their ability to pay dividends or the amount of dividends they may pay.
If we are not able to obtain sufficient cash flows from our foreign subsidiaries, this could negatively impact our business, results of operations and financial condition because the insufficient availability of cash at our company level may constrain us from paying all of our obligations.
We rely on the reputation of our brands and damages to their reputation may have an adverse effect on our sales.
Our success depends on our ability to maintain and enhance the image and reputation of our existing products and to develop a favorable image and reputation for new products. The image and reputation of our products may be reduced in the future; concerns about product quality, even when unfounded, could tarnish the image and reputation of our products. An event or series of events that materially damages the reputation of one or more of our brands could have an adverse effect on the value of that brand and subsequent revenues from that brand or business. Restoring the image and reputation of our products may be costly or not possible.
13
Moreover, our marketing efforts are subject to restrictions on the permissible advertising style, media and messages used. In a number of countries, for example, television is a prohibited channel for advertising beer and other alcoholic products, and in other countries, television advertising, while permitted, is carefully regulated. Any additional restrictions in such countries, or the introduction of similar restrictions in other countries, may constrain our brand building potential and thus reduce the value of our brands and related revenues.
Negative publicity focusing on our products or on the way we conduct our operations may harm our business.
Media coverage and publicity generally can exert significant influence on consumer behavior and actions. If the social acceptability of beer, other alcoholic beverages or soft drinks were to decline significantly, sales of our products could materially decrease. In recent years, there has been increased public and political attention directed at the alcoholic beverage and soft drink industries. This attention is a result of public concern over alcohol-related problems, including drunk driving, underage drinking, drinking while pregnant and health consequences resulting from the misuse of beer (for example, alcoholism), as well as soft-drink related problems, including health consequences resulting from the excessive consumption of soft drinks (for example, obesity). Factors such as negative publicity regarding the consumption of beer, other alcoholic beverages or soft drinks, publication of studies indicating a significant health risk from consumption of those beverages, or changes in consumer perceptions affecting them could adversely affect the sale and consumption of our products and harm our business, results of operations, cash flows or financial condition to the extent consumers and customers change their purchasing patterns.
Key brand names are used by us, our subsidiaries, associates and joint ventures, and licensed to third-party brewers. To the extent that we or one of our subsidiaries, associates, joint ventures or licensees are subject to negative publicity, and the negative publicity causes consumers and customers to change their purchasing patterns, it could have a material adverse effect on our business, results of operations, cash flows or financial condition. As we continue to expand our operations into emerging and growth markets, there is a greater risk that we may be subject to negative publicity, in particular in relation to labor rights and local work conditions. Negative publicity that materially damages the reputation of one or more of our brands could have an adverse effect on the value of that brand and subsequent revenues from that brand or business, which could adversely impact our business, results of operations, cash flows and financial condition.
Demand for our products may be adversely affected by changes in consumer preferences and tastes.
We depend on our ability to satisfy consumer preferences and tastes. Consumer preferences and tastes can change in unpredictable ways due to a variety of factors, such as changes in demographics, consumer health concerns regarding obesity, product attributes and ingredients, changes in travel, vacation or leisure activity patterns, weather, negative publicity resulting from regulatory action or litigation against us or comparable companies or a downturn in economic conditions. Consumers also may begin to prefer the products of competitors or may generally reduce their demand for products of our business segment. Failure by us to anticipate or respond adequately to changes in consumer preferences and tastes could adversely impact our business, results of operations and financial condition.
Seasonal consumption cycles and adverse weather conditions may result in fluctuations in demand for our products.
Seasonal consumption cycles and adverse weather conditions in the markets in which we operate may have an impact on our operations. This is particularly true in the summer months, when unseasonably cool or wet weather can affect sales volumes.
If any of our products is defective or found to contain contaminants, we may be subject to product recalls or other liabilities.
We take precautions to ensure that our beverage products and our associated packaging materials (such as bottles, crowns, cans and other containers) meet accepted food safety and regulatory standards. Such precautions include quality‑control programs for primary materials, the production process and our final products. We have established procedures to correct issues or concerns that are detected.
14
In the event that any failure to comply with accepted food safety and regulatory standards (such as a contamination or a defect) does occur in the future, it may lead to business interruptions, product recalls or liability, each of which could have an adverse effect on our business, reputation, prospects, financial condition and results of operations.
Although we maintain insurance policies against certain product liability (but not product recall) risks, we may not be able to enforce our rights in respect of these policies, and, in the event that a contamination or defect occurs, any amounts that we recover may not be sufficient to offset any damage we may suffer, which could adversely impact our business, results of operations and financial condition.
We may not be able to protect our intellectual property rights.
Our future success depends significantly on our ability to protect our current and future brands and products and to defend our intellectual property rights, including trademarks, patents, domain names, trade secrets and know-how. We have been granted numerous trademark registrations and patents covering our brands and products and have filed, and expect to continue to file, trademark and patent applications seeking to protect newly developed brands and products. We cannot be sure that trademark and patent registrations will be issued with respect to any of our applications. There is also a risk that we could, by omission, fail to renew a trademark or patent on a timely basis or that our competitors will challenge, invalidate or circumvent any existing or future trademarks and patents issued to, or licensed by, us.
Although we have put in place appropriate actions to protect our portfolio of intellectual property rights (including patent applications, trademark registration and domain names), we cannot be certain that the steps we have taken will be sufficient or that third parties will not infringe upon or misappropriate proprietary rights. If we are unable to protect our proprietary rights against infringement or misappropriation, it could have a material adverse effect on our business, results of operations, cash flows or financial condition, and in particular, on our ability to develop our business.
We rely on key third parties, including key suppliers, and the termination or modification of the arrangements with such third parties could negatively affect our business.
We rely on third‑party suppliers for a range of raw materials for our beer and non-beer products, and for packaging material, including aluminum cans, glass, kegs and PET bottles. We seek to limit our exposure to market fluctuations in the supply of these raw materials by entering into medium- and long-term fixed‑price arrangements. We have a limited number of suppliers of aluminum cans, glass and PET bottles. Consolidation of the aluminum can industry, glass and PET bottle industry in certain markets in which we operate has reduced local supply alternatives and increased the risk of disruption to aluminum can, glass and PET bottle supplies. Although we generally have other suppliers of raw materials and packaging materials, the termination of or material change to arrangements with certain key suppliers, disagreements with those suppliers as to payment or other terms, or the failure of a key supplier to meet our contractual obligations or otherwise deliver materials consistent with current usage would or may require us to make purchases from alternative suppliers, in each case at potentially higher prices than those agreed with this supplier. Additionally, we may be subject to potential reputational damage if one of our suppliers violates applicable laws or regulations. These factors could have a material adverse effect on our business, results of operations, cash flows or financial condition.
For certain packaging supplies, raw materials and commodities, we rely on a small number of important suppliers. If these suppliers became unable to continue to meet our requirements, and we are unable to develop alternative sources of supply, our operations and financial results could be adversely affected.
We are exposed to the risk of litigation.
We are now and may in the future be party to legal proceedings and claims (including labor, tax and alcohol-related claims) and significant damages may be asserted against us. See “Item 8. Financial Information—A. Consolidated Financial Statements and Other Financial Information—Legal Proceedings” and notes 26 and 30 to our audited consolidated financial statements as of and for December 31, 2018, included elsewhere in this annual report, for a description of our material litigation contingencies. Given the inherent uncertainty of litigation, it is possible that we might incur liabilities as a consequence of the proceedings and claims brought against us, including those that are not currently believed by us to present a reasonably possible chance of loss to us.
15
Our tax contingency has grown in recent years mainly because (1) their principal amount is adjusted on a monthly basis in accordance with the SELIC rate and (2) because of the highly litigious environment in Brazil in connection with tax disputes. Such environment is caused, among other reasons, by the highly complex tax legislation in Brazil, which in many instances reduces certainty of interpretation, as well as impossibility of out of court settlements between the Brazilian IRS and taxpayers. As the administrative phase of our tax proceedings ends and the judicial proceedings begin, the Company will be required to guarantee the amounts under discussion, through insurance bonds, bank guarantees or bank deposits. We will continue to vigorously defend our position in connection with such disputes and we may take, as we have done in the past, the benefit of tax amnesty programs that from time to time are issued by the Federal or State Governments.
Moreover, companies in the alcoholic beverage and soft drink industries are, from time to time, exposed to collective suits (class actions) or other litigation relating to alcohol advertising, alcohol abuse problems or health consequences from the excessive consumption of beer, other alcoholic beverages and soft drinks. As an illustration, certain beer and other alcoholic beverage producers from Brazil and Canada have been involved in class actions and other litigation seeking damages. If any of these types of litigation were to result in fines, damages or reputational damage to us or our brands, this could have a material adverse effect on our business, results of operations, cash flows or financial position.
We may not be able to recruit or retain key personnel.
In order to develop, support and market our products, we must hire and retain skilled employees with particular expertise. The implementation of our strategic business plans could be undermined by a failure to recruit or retain key personnel or the unexpected loss of senior employees, including in acquired companies. We face various challenges inherent in the management of a large number of employees over diverse geographical regions. Key employees may choose to leave their employment for a variety of reasons, including reasons beyond our control. The impact of the departure of key employees cannot be determined and may depend on, among other things, our ability to recruit other individuals of similar experience and skill at an equivalent cost. It is not certain that we will be able to attract or retain key employees and successfully manage them, which could disrupt our business and have an unfavorable material effect on our financial position, income from operations and competitive position.
Climate change, or legal, regulatory or market measures to address climate change, may negatively affect our business or operations, and water scarcity or poor quality could negatively impact our production costs and capacity.
There is a growing concern that carbon dioxide and other greenhouse gases in the atmosphere may have an adverse impact on global temperatures, weather patterns and the frequency and severity of extreme weather and natural disasters. In the event that such climate change has a negative effect on agricultural productivity, we may be subject to decreased availability or less favorable pricing for certain agricultural commodities that are necessary for our products, such as barley, hops, sugar and corn. In addition, public expectations for reductions in greenhouse gas emissions could result in increased energy, transportation and raw material costs and may require us to make additional investments in facilities and equipment due to increased regulatory pressures. As a result, the effects of climate change could have a long-term, material adverse impact on our business and results of operations.
We also face water scarcity and quality risks. The availability of clean water is a limited resource in many parts of the world, facing unprecedented challenges from climate change and the resulting change in precipitation patterns and frequency of extreme weather, overexploitation, increasing pollution, and poor water management. We have implemented an internal strategy in order to considerably reduce the use of water in our operative plants. However, as demand for water continues to increase around the world, and as water becomes scarcer and the quality of available water deteriorates, we may be affected by increasing production costs or capacity constraints, which could adversely affect our business and results of operations.
16
Our operations are subject to safety and environmental regulations, which could expose us to significant compliance costs and litigation relating to environmental issues.
Our operations are subject to safety and environmental regulations by national, state and local agencies, including, in certain cases, regulations that impose liability without regard to fault. These regulations can result in liability that might adversely affect our operations. The environmental regulatory climate in the markets in which we operate is becoming stricter, with greater emphasis on enforcement.
While we have budgeted for future capital and operating expenditures to maintain compliance with environmental laws and regulations, there can be no assurance that we will not incur substantial environmental liability or those applicable environmental laws and regulations will not change or become more stringent in the future.
We operate a joint venture in Cuba, in which the Government of Cuba is our joint venture partner. Cuba is still targeted by broad and comprehensive economic and trade sanctions of the United States. Our operations in Cuba may adversely affect our reputation and the liquidity and value of our securities.
In January 2014, one of our wholly-owned subsidiaries acquired from ABI, a controlling interest of 50% in Cerveceria Bucanero S.A., or Bucanero, a Cuban company in the business of producing and selling beer. The other 50% equity interest in Bucanero is owned by the Government of Cuba. We have the right to appoint the general manager of Bucanero. Bucanero’s main brands are Bucanero and Cristal, but it also imports and sells in Cuba other brands produced by certain of our other subsidiaries. In 2018, Bucanero sold 1.6 million hectoliters of beer, representing about 1.0% of our total volume of 162.2 million hectoliters for the year. Although Bucanero production is primarily sold in Cuba, a small portion of its production is exported to and sold by certain distributors in other countries outside Cuba (but not the United States).
Based on U.S. foreign policy, the U.S. Treasury Department’s Office of Foreign Assets Control and the U.S. Commerce Department together administer and enforce broad and comprehensive economic and trade sanctions against Cuba. These sanctions were strengthened by the Trump administration through a National Security Presidential Memorandum, issued on June 16, 2017, that, among other things, introduced prohibitions on certain financial transactions with certain entities and sub-entities identified by the U.S. Department of State. Although our operations in Cuba are quantitatively immaterial, our overall business reputation may suffer or we may face additional regulatory scrutiny as a result of our activities in Cuba based on the fact that Cuba remains a target of U.S. economic and trade sanctions.
In addition, there have in the past been initiatives by federal and state lawmakers in the United States, and certain U.S. institutional investors, including pension funds, to adopt laws, regulations or policies requiring the divestment from, or reporting of interests in, companies that do business with countries designated as state sponsors of terrorism. Although the United States government ceased to identify Cuba as a state sponsor of terrorism in June 2015, this position may be revised by action of the U.S. government’s executive branch. If U.S. government policy towards Cuba were to be reversed, with that country being once again designated as a state sponsor of terrorism, Cuba could return to being a target of possible restrictions for U.S. investment. If U.S. investors decide to liquidate or otherwise divest their investments in companies that have operations of any magnitude in Cuba, the market in and value of our securities could be adversely impacted.
Also, the Cuban Liberty and Democratic Solidarity (LIBERTAD) Act of 1996 (known as the “Helms-Burton Act”) authorizes private lawsuits for damages against anyone who traffics in property confiscated without compensation by the Government of Cuba from persons who at the time were, or have since become, nationals of the United States. Although this section of the Helms-Burton Act is currently suspended by discretionary presidential action, the suspension may not continue in the future. Claims accrue notwithstanding the suspension and may be asserted if the suspension is discontinued. The Helms-Burton Act also includes a section that authorizes the U.S. Department of State to prohibit entry into the United States of non-U.S. persons who traffic in confiscated property, and corporate officers and principals of such persons, and their families. In 2009, ABI received notice of a claim purporting to be made under the Helms-Burton Act relating to the use of a trademark by Bucanero, which is alleged to have been confiscated by the Cuban government and trafficked by ABI through their former ownership and management of us. Although ABI and we have attempted to review and evaluate the validity of the claim, due to the uncertain underlying circumstances, we are currently unable to express a view as to the validity of such claim or as to the claimants’ standing to pursue it.
17
Information technology failures, including those that affect the privacy and security of sensitive customer and business information, could disrupt our operations.
We rely on information technology systems to process, transmit and store large amounts of electronic data, including personal information. A significant portion of the communication between our personnel, customers and suppliers depends on information technology. As with all large systems, our information systems may be vulnerable to a variety of interruptions due to events beyond our control, including, but not limited to, natural disasters, terrorist attacks, telecommunications failures, computer viruses, hackers attacks or other security issues.
We depend on information technology to enable us to operate efficiently and interface with customers, as well as to maintain in-house management and control. We also collect and store non-public personal information that customers provide to purchase products or services, including personal information and payment information.
In addition, the concentration of processes in shared services centers means that any technology disruption could impact a large portion of our business within the operating regions we serve. Any transitions of processes to, from or within shared services centers as well as other transformational projects, could lead to business disruptions. If we do not allocate, and effectively manage, the resources necessary to build and sustain the proper technology infrastructure, we could be subject to transaction errors, processing inefficiencies, loss of customers, operations disruptions, or the loss of or damage to intellectual property through a security breach. As with all information technology systems, our system could also be penetrated by outside parties with the purpose of extracting information, corrupting information or disrupting business processes.
We take various actions with the aim of minimizing potential technology disruptions but all of these protections may be compromised as a result of third-party security breaches, burglaries, cyberattack, errors by employees or employees of third-party vendors, of contractors, misappropriation of data by employees, vendors or unaffiliated third parties, or other irregularities that may result in persons obtaining unauthorized access to company data or otherwise disrupting our business. These or other similar technology disruptions can have a material adverse effect on our business, results of operations, cash flows or financial condition.
Natural and other disasters could disrupt our operations.
Our business and operating results could be negatively impacted by social, technical or physical risks such as earthquakes, hurricanes, flooding, fire, power loss, loss of water supply, telecommunications and information technology system failures, cyber-attacks, political instability, military conflict and uncertainties arising from terrorist attacks, including a global economic slowdown, the economic consequences of any military action and associated political instability.
Our insurance coverage may be insufficient to make us whole on any losses that we may sustain in the future.
The cost of some of our insurance policies could increase in the future. In addition, some types of losses, such as losses resulting from wars, acts of terrorism, or natural disasters, generally are not insured because they are either uninsurable or it is not economically practical to obtain insurance. Moreover, insurers recently have become more reluctant to insure against these types of events. Should a material uninsured loss or a loss in excess of insured limits occur, this could adversely impact our business, results of operations and financial condition.
Risks Relating to Our Common Shares and ADSs
The relative volatility and illiquidity of securities of Brazilian companies may substantially limit your ability to sell our common shares and ADSs at the price and time you desire.
Investing in securities of companies in emerging markets, such as Brazil, involves greater risk than investing in securities of companies from more developed countries, and those investments are generally considered speculative in nature. Brazilian investments, such as investments in our common shares and ADSs, are subject to economic and political risks, involving, among other factors:
18
· changes in the Brazilian regulatory, tax, economic and political environment that may affect the ability of investors to receive payment, in whole or in part, in respect of their investments; and
· restrictions on foreign investment and on repatriation of capital invested.
The Brazilian securities markets are substantially smaller, less liquid and more concentrated and volatile than major U.S. and European securities markets. They are also not as highly regulated or supervised as those other markets. The relative illiquidity and smaller market capitalization of Brazilian securities markets may substantially limit your ability to sell the Ambev common shares and ADSs at the price and time you desire.
Deterioration in economic and market conditions in other emerging market countries, as well as in developed economies, may adversely affect the market price of our common shares and ADSs.
Economic and market conditions in other emerging market countries, especially those in Latin America, influence the market for securities issued by Brazilian companies as well as investors’ perception of economic conditions in Brazil. In addition, global financial crisis originating in developed economies, including the subprime debt crisis in the United States and the sovereign debt crisis in Europe, have had an impact on many economies and capital markets around the world, including Brazil, which may adversely affect investors’ interest in the securities of Brazilian issuers such as Ambev. Therefore, the market value of our common shares and ADSs may be adversely affected by events occurring outside of Brazil.
Our current controlling shareholders will be able to determine the outcome of our most significant corporate actions.
Our two direct controlling shareholders, Interbrew International B.V., or IIBV, and AmBrew S.A., or AmBrew, both of which are subsidiaries of ABI, together with Fundação Antonio e Helena Zerrenner Instituição Nacional de Beneficência, or FAHZ, held in aggregate 72.1% of our total and voting capital stock (excluding treasury shares) as of December 31, 2018.
ABI indirectly held shares in us representing 61.9% of our total and voting capital stock (excluding treasury shares) as of December 31, 2018. ABI thus has control over us, even though (1) ABI remains subject to the Ambev shareholders’ agreement among IIBV, AmBrew and FAHZ dated April 16, 2013, or the Ambev Shareholders’ Agreement, and (2) ABI is controlled by Stichting Anheuser-Busch InBev (formerly Stichting InBev and Stichting Interbrew), or Stichting, a foundation organized under the laws of the Netherlands, which represents an important part of interests of the founding Belgian families of Interbrew N.V./S.A. (as ABI was then called) (mainly represented by Eugénie Patri Sébastien S.A.) and the interests of the Brazilian families which were previously our controlling shareholders (represented by BRC S.à.R.L.), or the Interbrew Founding Families. For further information on these matters see “Item 4. Information on the Company—A. History and Development of the Company—The InBev-Ambev Transactions” and “Item 7. Major Shareholders and Related Party Transactions—A. Major Shareholders—Ambev’s Major Shareholders—Ambev Shareholders’ Agreement.”
Our controlling shareholders are able to elect the majority of the members of our Board of Directors and Fiscal Council, and generally determine the outcome of most other actions requiring shareholder approval, including dividend distributions, the consummation of corporate restructurings, issuances of new shares, sales of materials assets and bylaw amendments. Under Brazilian Law No. 6,404/76, as amended, or the Brazilian Corporation Law, the protections afforded to non-controlling security holders may differ from, or be less comprehensive than, the corresponding protections and fiduciary duties of directors applicable in the U.S. or other jurisdictions. See “—As a Brazilian company, Ambev is subject to different corporate laws and regulations than those typically applicable to U.S.-listed companies, which may result in Ambev’s shareholders having fewer or less well-defined shareholder rights than the shareholder rights of those companies.”
Our shareholders may not receive any dividends.
According to our bylaws, we generally pay our shareholders 40% of our annual adjusted net income, calculated and adjusted pursuant to Brazilian Corporation Law in accordance with the mechanisms described in our bylaws as presented in our consolidated financial statements prepared under IFRS. The main sources for these dividends are cash flows from our operations and dividends from our operating subsidiaries. Therefore, that net income may not be available to be paid out to our shareholders in a given year. In addition, we might not pay dividends to our shareholders in any particular fiscal year upon the determination of the Board of Directors that any such distribution would be inadvisable in view of our financial condition. While the law does not establish the circumstances rendering the payment of dividends inadvisable, it is generally agreed that a company need not pay dividends if such payment threatens its existence as a going concern or harms its normal course of operations. Any dividends not distributed would be allocated to a special reserve account for future payment to shareholders, unless it is used to offset subsequent losses or as otherwise provided for in our bylaws. It is possible, therefore, that our shareholders will not receive dividends in any particular fiscal year.
19
Brazilian foreign exchange controls and regulations could restrict conversions and remittances abroad of the dividend payments and other shareholder distributions paid in Brazil in reais in respect of the Ambev common shares (including shares underlying the Ambev ADSs).
Brazilian law provides that whenever there is a serious imbalance in Brazil’s balance of payments or reasons to foresee such a serious imbalance, the Brazilian government may impose temporary restrictions on the remittance to foreign investors of the proceeds of their investments in Brazil. For example, for approximately six months in 1989 and early 1990 the Brazilian government froze all dividend and capital repatriations that were owed to foreign equity investors and had their remittance abroad withheld by the Central Bank in order to conserve Brazil’s foreign currency reserves at the time. These amounts were subsequently released in accordance with Brazilian government directives. Similar measures could be taken by the Brazilian government in the future.
As a result, the Brazilian government may in the future restrict the conversion and remittance abroad, to ADS holders or holders of Ambev common shares residing outside Brazil, of dividend payments and other shareholder distributions paid in Brazil in reais in respect of the Ambev common shares (including shares underlying the Ambev ADSs). The likelihood that the Brazilian government would impose such restrictions may be affected by the extent of Brazil’s foreign currency reserves, the availability of foreign currency in the foreign exchange markets on the date a payment is due, the size of Brazil’s debt service burden relative to the economy as a whole and other factors. We cannot assure you that the Central Bank will not modify its policies or that the Brazilian government will not institute restrictions or delays on cross-border remittances in respect of securities issued in the international capital markets. For further information on this matter, see “—A. Selected Financial Data—Exchange Controls.”
If you exchange your Ambev ADSs for the respective Ambev common shares underlying those ADSs, you risk forfeiting Brazilian tax advantages and losing the ability to timely remit foreign currency abroad.
The Ambev ADSs benefit from the foreign capital registration that The Bank of New York Mellon, as depositary of Ambev’s ADS program, or the Depositary, has in Brazil, which permits it to convert dividends and other distributions with respect to the Ambev common shares underlying the Ambev ADSs into foreign currency and remit the proceeds of such conversion abroad. Pursuant to CMN Resolution No. 4,373, in order for an investor to surrender ADSs for the purpose of withdrawing the shares represented thereby and be entitled to trade the underlying shares directly on the B3, the investor is required to appoint a Brazilian financial institution duly authorized by the Central Bank and the CVM to act as its legal representative, who shall be responsible, among other things, for keeping and updating the investors’ certificates of registrations with the Central Bank. If you exchange your Ambev ADSs for the respective Ambev common shares underlying those ADSs, you may be subject to a less favorable tax treatment on gains with respect to these investments. Moreover, if such representatives fail to obtain or update the relevant certificates of registration, investors may incur additional expenses or be subject to operational delays which could affect their ability to receive dividends or distributions relating to the common shares or the return of their capital in a timely manner. The custodian’s certificate of registration or any foreign capital registration directly obtained by such holders may be affected by future legislative or regulatory changes, and we cannot assure such holders that additional restrictions applicable to them, the disposition of the underlying common shares, or the repatriation of the proceeds from the process will not be imposed in the future. For a more complete description of Brazilian restrictions on foreign investments and Brazilian foreign investment regulations, see “Item 10. Additional Information—B. Memorandum and Articles of Association—Restrictions on Foreign Investment” and “—A. Selected Financial Data—Exchange Controls.” For a more complete description of Brazilian tax regulations, including any potential risks regarding the possibility that the sale or disposition of ADSs by a Non-Brazilian Holder may be subject to capital gains tax in Brazil, see “Item 10. Additional Information—E. Taxation—Brazilian Tax Considerations.”
20
As a Brazilian company, Ambev is subject to different corporate laws and regulations than those typically applicable to U.S.-listed companies, which may result in Ambev’s shareholders having fewer or less well-defined shareholder rights than the shareholder rights of those companies.
Ambev’s corporate affairs are governed by its bylaws and the Brazilian Corporation Law, which may differ from the legal principles that would apply to Ambev if the company were incorporated in a jurisdiction in the United States, such as Delaware or New York, or in other jurisdictions outside of Brazil. In addition, shareholder rights under the Brazilian Corporation Law to protect them from actions taken by the board of directors or controlling shareholders may be fewer and less well-defined than under the laws of jurisdictions outside of Brazil.
Although insider trading and price manipulation are restricted under applicable Brazilian capital markets regulations and treated as crimes under Brazilian law, the Brazilian securities markets may not be as highly regulated and supervised as the securities markets of the United States or other jurisdictions outside Brazil. In addition, rules and policies against self-dealing and for the preservation of shareholder interests may be less well-defined and enforced in Brazil than in the United States or other jurisdictions outside Brazil, potentially causing disadvantages to a holder of Ambev ADSs as compared to a holder of shares in a U.S. public company. Further, corporate disclosures may be less complete or informative than required of public companies in the United States or other jurisdictions outside Brazil.
Certain shareholder entitlements may not be available in the U.S. to holders of Ambev ADSs.
Due to certain United States laws and regulations, U.S. holders of Ambev ADSs may not be entitled to all of the rights possessed by holders of Ambev common shares. For instance, U.S. holders of Ambev ADSs may not be able to exercise preemptive, subscription or other rights in respect of the Ambev common shares underlying their Ambev ADSs, unless a registration statement under the Securities Act is effective with respect to those rights or an exemption from the registration requirements thereunder is available.
Holders of Ambev ADSs may be unable to fully exercise voting rights with respect to the Ambev shares underlying their ADSs.
Under Brazilian law, only shareholders registered as such in the corporate books of Brazilian companies may attend shareholders’ meetings. Because all the Ambev common shares underlying the Ambev ADSs are registered in the name of the Depositary (and not the ADS holder), only the Depositary (and not the ADS holder) is entitled to attend Ambev’s shareholders’ meetings. A holder of Ambev ADSs is entitled to instruct the Depositary as to how to vote the respective Ambev common shares underlying their ADSs only pursuant to the procedures set forth in the deposit agreement for Ambev’s ADS program. Accordingly, holders of Ambev ADSs will not be allowed to vote the corresponding Ambev common shares underlying their ADSs directly at an Ambev shareholders’ meeting (or to appoint a proxy other than the Depositary to do so), unless they surrender their Ambev ADSs for cancellation in exchange for the respective Ambev shares underlying their ADSs. We cannot ensure that such ADS cancellation and exchange process will be completed in time to allow Ambev ADS holders to attend a shareholders’ meeting of Ambev.
Further, the Depositary has no obligation to notify Ambev ADS holders of an upcoming vote or to distribute voting cards and related materials to those holders, unless Ambev specifically instructs the Depositary to do so. If Ambev provides such instruction to the Depositary, it will then notify Ambev’s ADS holders of the upcoming vote and arrange for the delivery of voting cards to those holders. We cannot ensure that Ambev’s ADS holders will receive proxy cards in time to allow them to instruct the Depositary as to how to vote the Ambev common shares underlying their Ambev ADSs. In addition, the Depositary and its agents are not responsible for a failure to carry out voting instructions or for an untimely solicitation of those instructions.
As a result of the factors discussed above, holders of Ambev ADSs may be unable to fully exercise their voting rights.
21
Future equity issuances may dilute the holdings of current holders of Ambev common shares or ADSs and could materially affect the market price for those securities.
We may in the future decide to offer additional equity to raise capital or for other purposes. Any such future equity offering could reduce the proportionate ownership and voting interests of holders of our common shares and ADSs, as well as our earnings and net equity value per common share or ADS. Any offering of shares and ADSs by us or our main shareholders, or a perception that any such offering is imminent, could have an adverse effect on the market price of these securities.
Our status as a foreign private issuer allows us to follow Brazilian corporate governance practices and exempts us from a number of rules under the U.S. securities laws and listing standards, which may limit the amount of public disclosures available to investors and the shareholder protections afforded to them.
We are a foreign private issuer, as defined by the Securities and Exchange Commission, or the SEC, for purposes of the Exchange Act. As a result, we are exempt from many of the corporate governance requirements of stock exchanges located in the United States, as well as from rules under the Exchange Act that impose certain disclosure obligations and procedural requirements for proxy solicitations under Section 14 of the Exchange Act. For example, our officers, directors and principal shareholders are exempt from the reporting and “short-swing” profit recovery provisions under Section 16 of the Exchange Act. Moreover, we are not required to file periodic reports and financial statements with the SEC as frequently or as promptly as U.S. companies whose securities are registered under the Exchange Act. Accordingly, there may be less publicly available information concerning us than there is for U.S. public companies.
In addition, for so long as we remain as a foreign private issuer, we will be exempt from most of the corporate governance requirements of stock exchanges located in the United States. Accordingly, you will not be provided with some of the benefits or have the same protections afforded to shareholders of U.S. public companies. The corporate governance standards applicable to us are considerably different than the standards applied to U.S. domestic issuers. For example, although Rule 10A-3 under the Exchange Act generally requires that a company listed in the United States have an audit committee of its board of directors composed solely of independent directors, as a foreign private issuer we are relying on an exemption from this requirement under Rule 10A-3(c)(3) of the Sarbanes-Oxley Act of 2002 that is available to us as a result of features of the Brazilian Corporation Law applicable to our Fiscal Council. In addition, we are not required under the Brazilian Corporation Law to, among other things:
|
· |
have a majority of our Board of Directors be independent (though our bylaws provide that two of our directors must be independent and, in certain circumstances pursuant to the Brazilian Corporation Law, our minority shareholders may be able to elect members to our Board of Directors); |
|
· |
have a compensation committee, a nominating committee, or corporate governance committee of the Board of Directors (though we currently have a non-permanent Operations, Finance and Compensation Committee that is responsible for evaluating our compensation policies applicable to management); |
|
· |
have regularly scheduled executive sessions with only non-management directors (though none of our current directors hold management positions in us); or |
|
· |
have at least one executive session of solely independent directors each year. |
For further information on the main differences in corporate governance standards in the United States and Brazil, see “Item 6. Directors, Senior Management and Employees—C. Board Practices—Differences Between United States and Brazilian Corporate Governance Practices.”
Foreign holders of our ADSs may face difficulties in serving process on or enforcing judgments against us and other persons.
We are organized under the laws of Brazil and most of our directors and executive officers, as well as our independent registered public accounting firm, reside or are based in Brazil. In addition, substantially all of our assets and those of these other persons are located in Brazil. As a result, it may not be possible for foreign holders of our ADSs to expediently effect service of process upon us or those persons within the United States or other jurisdictions outside Brazil or to efficiently enforce against us or them judgments obtained in the United States or other jurisdictions outside Brazil. Because judgments of U.S. courts for civil liabilities based upon the U.S. federal securities laws may only be enforced in Brazil if certain formal and procedural conditions are met (including non-violation of Brazilian national sovereignty, public policy and “good morals”), holders of our ADSs may face greater difficulties in protecting their interests in the context of legal, corporate or other disputes between them and us, our directors and/or our executive officers than would shareholders of a U.S. corporation. In addition, a plaintiff (whether or not Brazilian) residing outside Brazil during the course of litigation in Brazil must provide a bond to guarantee court costs and legal fees if the plaintiff owns no real property in Brazil that could secure such payment. The bond must have a value sufficient to satisfy the payment of court fees and defendant’s attorney fees, as determined by a Brazilian judge. This requirement does not apply to (1) the enforcement of debt instruments or awards, including foreign judgments that have been duly recognized by the Brazilian Superior Court of Justice (Superior Tribunal de Justiça); (2) counterclaims; and (3) circumstances where the plaintiff or other intervening parties (regardless of citizenship) resides in a country that is a party to a treaty in force in Brazil that establishes that no security, bond or deposit of any kind is required by reason only of their foreign nationality (e.g., the Hague Convention on International Access to Justice). Furthermore, Brazil does not have a treaty with the United States to facilitate or expedite the enforcement in Brazil of decisions issued by a state court in the United States, which shall necessarily be previously recognized by the Brazilian Superior Court of Justice in order to produce effects in Brazil. As to arbitral awards issued in the United States, it is important to note that Brazil has ratified the New York Convention on the Recognition and Enforcement of Foreign Arbitral Awards (Decree No. 4311/2002), and arbitral awards rendered outside of the Brazilian territory are enforceable if the requirements provided by such treaty are fulfilled, and the arbitral award is previously recognized by the Brazilian Superior Court of Justice.
22
Judgments of Brazilian courts with respect to our shares will be payable only in reais.
If proceedings are brought in the courts of Brazil seeking to enforce our obligations in respect of our common shares, we will not be required to discharge any such obligations in a currency other than reais. Under Brazilian exchange control limitations, an obligation in Brazil to pay amounts denominated in a currency other than reais may only be satisfied in Brazilian currency at the exchange rate, as determined by the Central Bank, in effect on the date of the effective payment. The then prevailing exchange rate may not afford non-Brazilian investors with full compensation for any claim arising out of, or related to, our obligations under our common shares.
23
ITEM 4. INFORMATION ON THE COMPANY
Ambev’s principal executive offices are located at Rua Dr. Renato Paes de Barros, 1017, 3rd floor, 04530‑001, São Paulo, SP, Brazil, and its telephone number and email are: +55 (11) 2122-1414 and ir@ambev.com.br.
A. History and Development of the Company
Overview
We are the successor of Brahma and Antarctica, two of the oldest brewers in Brazil. Antarctica was founded in 1885. Brahma was founded in 1888 as Villiger & Cia. The Brahma brand was registered on September 6, 1888, and in 1904 Villiger & Cia. changed its name to Companhia Cervejaria Brahma. However, the legal entity that has become Ambev S.A., the current NYSE- and B3-listed company, was incorporated on July 8, 2005 as a non-reporting Brazilian corporation under the Brazilian Corporation Law and is the successor of Old Ambev. Until the stock swap merger of Old Ambev with Ambev S.A. approved in July 2013 (see “—Stock Swap Merger of Old Ambev with Ambev S.A.”), Ambev S.A. did not conduct any operating activities and had served as a vehicle for ABI to hold a 0.5% interest in Old Ambev’s capital stock.
In the mid-1990s, Brahma started its international expansion into Latin America, and since then we have been buying assets in different parts of the continent including the South America, Central America and the Caribbean.
In the late 1990s, Brahma obtained the exclusive rights to produce, sell and distribute Pepsi CSD products throughout Brazil, and since then we have been distributing these products throughout that country. In addition, certain of our subsidiaries have franchise agreements for Pepsi products in Argentina, Bolivia, Uruguay and the Dominican Republic. See “Item 4. Information on the Company—B. Business Overview—Licenses—Pepsi.”
In the early 2000s, we acquired a 40.5% economic interest in Quinsa and the joint control of that entity, which we shared temporarily with Beverages Associates (BAC) Corp., or BAC, the former sole controlling shareholder of Quinsa. This transaction provided us with a leading presence in the beer markets of Argentina, Bolivia, Paraguay and Uruguay, and also set forth the terms for our future acquisition of Quinsa’s full control from BAC. In April 2006, we increased our equity interest in Quinsa to 91% of its total share capital, after which we started to fully consolidate Quinsa upon the closing of that transaction in August 2006.
In August 2004, we and a Belgian brewer called Interbrew S.A./N.V. (as ABI was then called) completed a business combination that involved the merger of an indirect holding company of Labatt one of the leading brewers in Canada, into us. At the same time, our controlling shareholders completed the contribution of all shares of an indirect holding company which owned a controlling stake in us to Interbrew S.A./N.V. in exchange for newly issued shares of Interbrew S.A./N.V. After this transaction, Interbrew S.A./N.V. changed its company name to InBev S.A./N.V. (and, since 2008, to Anheuser-Busch InBev SA/NV) and became our majority shareholder through subsidiaries and holding companies. (see “—The InBev-Ambev Transactions”).
The InBev-Ambev Transactions
The “InBev-Ambev transactions” consisted of two transactions negotiated simultaneously: (1) in the first transaction, BRC exchanged its Old Ambev shares for shares in Interbrew N.V./S.A. (as ABI was then called); and (2) in the second transaction, Old Ambev issued new shares to Interbrew N.V./S.A. in exchange for Interbrew’s 100% stake in Labatt.
Exchange of Shares Between BRC and the Interbrew Founding Families
In March 2004, various entities controlled by BRC entered into a contribution and subscription agreement with Interbrew N.V./S.A. (as ABI was then called) and various entities representing the interests of the Interbrew Founding Families to exchange their controlling interest in Old Ambev for newly issued voting shares of Interbrew N.V./S.A., which represented 24.7% of Interbrew N.V./S.A.’s voting shares.
24
Upon closing of this transaction in August 2004, (1) BRC received approximately 44% of the voting interest in Stichting, which thereupon owned approximately 56% of Interbrew N.V./S.A.’s common shares, and (2) Interbrew N.V./S.A. received approximately a 53% voting interest and a 22% economic interest in Old Ambev. Such voting interest was subject to our shareholders’ agreement at the time, as amended in connection with the InBev-Ambev transactions. In addition, Interbrew N.V./S.A. changed its legal name to InBev N.V./S.A. (and, since its acquisition of Anheuser-Busch, Inc. in the U.S. in 2008, to Anheuser Busch-InBev N.V./S.A.).
Acquisition of Labatt
Pursuant to the incorporação agreement dated March 3, 2004, Labatt Brewing Canada Holding Ltd., or Mergeco, was merged into Old Ambev by means of an upstream merger under the Brazilian Corporation Law, or the Incorporação. Mergeco held 99.9% of the capital stock of Labatt Holding ApS, or Labatt ApS, a corporation organized under the laws of Denmark, and Labatt ApS owned all the capital stock of Labatt. Upon completion of the Incorporação, Old Ambev held 99.9% of the capital stock of Labatt ApS, and, indirectly, of Labatt. As consideration for the acquisition of Labatt, Old Ambev issued common and preferred shares to Interbrew N.V./S.A. (as ABI was then called).
With the consummation of this transaction in August 2004, (1) Labatt became a wholly-owned subsidiary of Old Ambev, and (2) Interbrew N.V./S.A. (as ABI was then called) increased its stake in Old Ambev to approximately 68% of common shares and 34% of preferred shares.
Ownership Structure of InBev N.V./S.A. and Old Ambev Upon Consummation of the InBev-Ambev Transactions
InBev N.V./S.A.
Upon closing the InBev-Ambev transactions, 56% of InBev N.V./S.A.’s voting shares were owned by Stichting, 1% was jointly owned by Fonds Voorzitter Verhelst SPRL and Fonds InBev-Baillet Latour SPRL, 17% were owned directly by entities and individuals associated with the Interbrew Founding Families and the remaining 26% constituted the public float.
BRC became the holder of 44% of Stichting’s voting interests, while the Interbrew Founding Families held the remaining 56% of Stichting’s voting interests. In addition, BRC and entities representing the interests of the Interbrew Founding Families entered into a shareholders’ agreement, providing for, among other things, joint and equal influence over the exercise of the Stichting voting rights in InBev N.V./S.A. (as ABI was then called).
Old Ambev
Upon closing of the InBev-Ambev transactions, InBev N.V./S.A. (as ABI was then called) became the owner of approximately 68% of Old Ambev’s voting shares, FAHZ retained approximately 16% of such shares, and the remaining shares were held by the public.
Mandatory Tender Offer
Pursuant to the Brazilian Corporation Law, InBev N.V./S.A. (as ABI was then called) was required to conduct, following the consummation of the InBev-Ambev transactions, a mandatory tender offer, or the MTO, for all remaining outstanding common shares of Old Ambev. The MTO was completed in March 2005, and InBev N.V./S.A. (as ABI was then called) increased its stake in Old Ambev to approximately an 81% voting interest and a 56% economic interest in that company. FAHZ did not tender its Old Ambev shares in the MTO.
Stock Swap Merger of Old Ambev with Ambev S.A.
On July 30, 2013, the minority shareholders of Old Ambev approved a stock swap merger of Old Ambev with us, according to which each and every issued and outstanding common and preferred share of Old Ambev not held by Ambev S.A. (including in the form of ADSs) was exchanged for five newly issued common shares of Ambev S.A. (including in the form of ADSs). As a result of the stock swap merger, Old Ambev became a wholly-owned subsidiary of Ambev S.A., which continued the same operations of Old Ambev. The ratio adopted for the stock swap merger did not result in any ownership dilution in the equity interest held in us by our minority shareholders, including our former non-voting preferred shareholders, who were granted a separate class vote on the transaction without the interference of our controlling shareholder.
25
The stock swap merger combined our former dual-class capital structure, comprised of voting common shares and non-voting preferred shares, into a new, single-class capital structure, comprised exclusively of voting common shares. The purpose of this transaction was to simplify our corporate structure and improve our corporate governance, with a view to increasing liquidity for all shareholders, eliminating certain administrative, financial and other costs and providing more flexibility for the management of our capital structure. As a result of the stock swap merger, all shareholders of Old Ambev, including former holders of that company’s non-voting preferred shares, gained access to the same rights and privileges enjoyed by Old Ambev’s common shareholders, including full voting rights and the right to be included in a change-of-control tender offer under the Brazilian Corporation Law that ensures that holders of common stock are offered 80% of the price per share paid to a selling controlling shareholder in a change-of-control transaction.
Upstream Merger of Old Ambev with and into Ambev S.A.
In January 2014, and as a subsequent step of the stock swap merger, an upstream merger of Old Ambev and one of its majority-owned subsidiaries with and into Ambev S.A. was consummated. This upstream merger had no impact on the shareholdings that our shareholders held in us. As a result of this upstream merger, our corporate structure was simplified.
Recent Acquisitions, Divestments and Strategic Alliances
In January 2016, our subsidiary in Canada acquired a range of ready-to-drink, cider and craft beer brands for the Canadian market from the Mark Anthony Group of Companies. These brand additions include recognized and innovative brands such as Palm Bay, Mike’s Hard Lemonade and Okanagan Cider, leveraging our near-beer platform by expanding our portfolio into the fast growing ready to drink and cider segments in Canada. The deal also included the Turning Point Brewery in British Columbia, which brews the Stanley Park family of brands.
In April 2016, one of our subsidiaries in Canada acquired Archibald Microbrasserie, known for its local beers and seasonal specialties.
Also in April 2016, one of our subsidiaries acquired the Brazilian juice company “Do Bem”, which sells a variety of juices, teas and cereal bars.
In May 2016, we entered into an agreement with ABI, pursuant to which we agreed to transfer to ABI our businesses in Colombia, Peru and Ecuador, in exchange for which ABI has agreed to transfer ABI SAB Group Holding Limited’s (formerly SABMiller Limited and prior to that SABMiller plc), or SAB, Panamanian business to us. While ABI is our indirect controlling shareholder, the transaction was conducted at arms’ length on standard market terms, including having received a fairness opinion from Rothschild & Sons (Brazil). Other than post-closing debt and/or cash adjustments, the transaction did not involve any cash payments and involved an exchange of shares of the aforementioned entities. The transaction was conditioned on the successful closing of the SAB and ABI merger, which closed in the fourth quarter of 2016. As a result of this transaction, on December 31, 2016, we ceased operations in Colombia, Peru and Ecuador and commenced operations in the beverages market of Panama.
In December 2016, we acquired Cachoeiras de Macacu Bebidas Ltda. from Brasil Kirin Industria de Bebidas Ltda., a company that owns an operating industrial plant for the production and packaging of beer and non-alcoholic beverages in the State of Rio de Janeiro.
In September 2017, we entered into an agreement with ABI, pursuant to which our subsidiary Cervecería y Maltería Quilmes S.A., or Quilmes, agreed to transfer to a third-party, Compañia Cervecerías Unidas S.A. or its affiliates, or CCU, certain Argentinean brands (Norte, Iguana and Baltica) and related business assets as well as payment of US$50 million. In exchange, ABI has agreed to transfer to Quilmes the brewery of Cerveceria Argentina Sociedad Anonima Isenbeck, an Argentinean subsidiary of ABI. In addition, at closing ABI licensed to Quilmes in perpetuity the right to produce and commercialize the Budweiser brand, among other ABI brands, in Argentina upon ABI’s recovery of the distribution rights to such brands from CCU. The transaction was subject to certain conditions precedent and closed on May 2, 2018. Rothschild acted as our exclusive financial advisor.
26
In December 2017, E. León Jimenes, S.A., or ELJ, the other shareholder together with us in Tenedora CND, S.A., or Tenedora – a holding company incorporated in the Dominican Republic, owner of almost the totality of Cervecería Nacional Dominicana, S.A. – partially exercised, in accordance with the shareholders’ agreement of Tenedora, its put option in connection with shares representing 30% of Tenedora’s capital stock. The transaction was subject to certain conditions precedent and closed on January 18, 2018. As a result of the partial exercise of such put option, at closing we paid to ELJ the amount of US$926.5 million and became the owner of approximately 85% of Tenedora, with ELJ remaining with 15%. In addition, in light of the strategic importance of the alliance with ELJ, our Board of Directors approved amending from 2019 to 2022 the term for the call option granted by ELJ to us to become exercisable.
In June 2018, we concluded the sale of all shares of our subsidiary, Barbados Bottling Co. Limited, a subsidiary that produces and distributes carbonated soft drinks in Barbados, in the amount of US$53 million. We recorded a gain of approximately US$22 million as a result of this transaction.
In December 2018 our Canadian subsidiary Labatt Brewing Company Ltd., entered into a partnership agreement with High Park Farms Ltd., a subsidiary of Tilray, a global pioneer in cannabis production and distribution. Each company intends to invest up to US$50 million. The partnership’s main purpose is to research non-alcoholic beverages containing cannabis extracts for potential commercialization within Canada only.
For further information on these and other acquisitions, divestments and strategic alliances, please see note 1 to our audited financial statements as of and for the year ended December 31, 2018.
B. Business Overview
Description of Our Operations
We are the largest brewer in Latin America in terms of sales volumes and one of the largest beer producers in the world, according to our estimates. We currently produce, distribute and sell beer, CSDs and other non-alcoholic and non-carbonated products in 18 countries across the Americas.
As of December 31, 2018, we conducted our operations through three business segments, as follows:
· Latin America North, which included our operations in Brazil through two divisions (the beer sales division and the NAB sales division), and our Central America and the Caribbean, or CAC, operations, which in the past we referred to as “HILA-Ex” operations, that as of December 31, 2018 included our operations in the Dominican Republic, Saint Vincent, Antigua, Dominica, Cuba, Guatemala (which also serves El Salvador, Honduras and Nicaragua) Barbados and Panama;
· Latin America South, which includes our operations in Argentina, Bolivia, Paraguay, Uruguay, Chile; and
· Canada, represented by Labatt’s operations, which includes domestic sales in Canada and some exports to the U.S. market.
27
The following map illustrates our three business segments as of December 31, 2018:
An analysis of our consolidated net sales by business segment for the periods indicated is presented in the table below:
|
|
Net Sales (in R$ million) | |||||
|
|
2018 |
2017 |
2016 | |||
|
|
Sales |
% of Total |
Sales |
% of Total |
Sales |
% of Total |
|
Latin America North |
32,628.1 |
65.0% |
31,086.0 |
64.9% |
28,927.8 |
63.4% |
|
Brazil |
26,814.2 |
53.4% |
26,353.0 |
55.0% |
24,954.6 |
54.7% |
|
Beer Brazil |
23,008.5 |
45.8% |
22,509.3 |
47.0% |
21,173.1 |
46.4% |
|
NAB |
3,805.7 |
7.6% |
3,843.7 |
8.0% |
3,781.5 |
8.3% |
|
CAC |
5,813.9 |
11.6% |
4,733.0 |
9.9% |
3,973.2 |
8.7% |
|
Latin America South |
10,753.9 |
21.4% |
10,769.7 |
22.5% |
10,212.9 |
22.4% |
|
Canada |
6,849.3 |
13.6% |
6,043.5 |
12.6% |
6,461.9 |
14.2% |
|
Total |
50,231.3 |
100.0% |
47,899.3 |
100.0% |
45,602.6 |
100.0% |
An analysis of our sales volume by business segment for the periods indicated is presented in the table below:
|
|
Sales Volumes (‘000 hl) | |||||
|
|
2018 |
2017 |
2016 | |||
|
|
Volume |
% of Total |
Volume |
% of Total |
Volume |
% of Total |
|
Latin America North |
114,802.7 |
72.3% |
118,631.8 |
72.9% |
116,632.7 |
73.0% |
|
Brazil |
101,642.9 |
64.0% |
106,360.0 |
65.3% |
106,961.4 |
66.9% |
|
Beer Brazil |
77,784.2 |
49.0% |
80,233.6 |
49.3% |
79,670.1 |
49.8% |
|
NAB |
23,858.8 |
15.0% |
26,126.4 |
16.0% |
27,291.3 |
17.1% |
|
CAC |
13,159.8 |
8.3% |
12,271.8 |
7.5% |
9,671.3 |
6.1% |
|
Latin America South |
33,971.2 |
21.4% |
34,062.0 |
20.9% |
32,934.5 |
20.6% |
|
Canada |
9,942.9 |
6.3% |
10,135.7 |
6.2% |
10,254.5 |
6.4% |
|
Total |
158,716.9 |
100.0% |
162,829.4 |
100.0% |
159,821.6 |
100.0% |
28
Business Strategy
We aim to continuously create value for our stockholders. The main components of our strategy are:
· our people and culture;
· our growth platforms;
· building strong brands;
· excellence in route to market;
· quality of our products;
· permanent cost efficiency; and
· financial discipline.
Our People and Culture
We believe highly qualified, motivated and committed employees are critical to our long-term success. We carefully manage our hiring and training process with a view to recruiting and retaining outstanding professionals. In addition, we believe that through our compensation program, which is based both on variable pay and stock ownership, we have created financial incentives for high performance and results. Another core element of our culture is our distinguished managerial capability, which is characterized by (1) a hardworking ethos, (2) results-focused evaluations, (3) the encouragement of our executives to act as owners and not only as managers, (4) leadership by personal example, and (5) appreciation of field experience.
Growth Platforms
We are constantly seeking sustainable long term growth. For instance, in Brazil we have focused our efforts behind our main growth platforms, as follows:
|
· |
Elevate the core: we believe that building strong brands that create enduring bonds with our consumers is a fundamental prerequisite to assure the sustainability of our business in the future. By connecting with our consumers through relevant marketing platforms and breakthrough experiences, we are able to drive a superior top line performance by balancing volume and price/mix growth in a sustainable way; |
|
· |
Accelerate Premium: premium volumes have been growing above mainstream in Brazil and there is a significant opportunity to accelerate this growth and to increase even further the weight of premium volumes within beer. At Ambev, we are working towards leading this growth through our wide-ranging portfolio of domestic and global premium brands and by improving our route to market execution; |
|
· |
Drive Smart Affordability: in an effort to offer affordable products in Brazil without sacrificing profitability, we have recently been developing several initiatives to reduce product costs, including in relation to packaging and route-to-market, which in some cases has also led to the development of new brands. For example, during 2018 we launched Nossa and Magnífica beers brewed in the states of Pernambuco and Maranhão, respectively, produced by cassava from local farmers, an ingredient that provides a unique lightness to the beer. We are able to offer these products to consumers at a competitive price point with healthy profit margins, while simultaneously fostering social engagement, promoting the development of the local economy, and enhancing the culture of the states; |
29
|
· |
At Home: by better understanding consumption habits in our consumers’ own homes, we are able to capture significant volume opportunities through new liquids, new packaging or even new selling models, such as Emporiodacerveja.com.br, the biggest beer ecommerce in Brazil. We believe there is also significant room to enhance the beer category execution in different retail formats and regions in Brazil, delivering convenience to consumers and also increasing the penetration of returnable glass bottles in the off-trade channel, thus driving affordability in a profitable way; |
|
· |
Out of Home: having a beer at a boteco, a traditional type of bar in Brazil, continues to be a strong part of Brazilian culture and part of Brazilian consumers’ day-to-day lives. We deliver our brands to almost one million points of sale in Brazil, mainly botecos, through our unique distribution system, always looking for ways to improve our execution and better serve our clients. Along with that, we are constantly seeking ways to perfect the “out-of-home” experience to consumers; |
|
· |
Excellence in Client Services: as a service-oriented company, we acknowledge that enhancing our relationship with our clients is an important lever to drive sustainable growth and, thus, a consistent evolution of our route to market and of our service level is at the core of our priorities. Pursuing this excellency, our B2B platform, Parceiro Ambev, has become one of the largest e-commerce channels in Brazil, offering the clients a convenient buying experience, in addition to being a new communication channel for our clients; |
|
· |
Better World: We dream of bringing people together for a better world. This dream begins at the moment of celebration involving our beverages and is translated across six fronts where we believe we can contribute and make a greater social impact in relation to: (1) water, (2) climate action, (3) agriculture, (4) circular packaging, (5) entrepreneurship and (6) smart drinking. To track such impact, we have designed a platform with specific targets to be achieved by 2025. We are proud of our recent accomplishments in relation to our “Better World” initiatives. For instance, in relation to the water pillar, we launched AMA, a mineral water, in 2017, with 100% of the profits from this product applied to improve access to potable water in the semi-arid region of Brazil; such initiative has already benefited more than 25,000 people. In relation to our “smart drinking” endeavors, we have undertaken road safety projects in partnership with the State of São Paulo and the Federal District government to develop a traffic accident information management system, allowing the relevant authorities to make better informed decisions. Regarding our commitment to entrepreneurship, we have developed the VOA program, which helps NGOs to optimize their processes, budgets and also manage people and careers. |
Quality of our Products
We brew a wide variety of beers, including ales, lagers, clear, dark and full-bodied beers, amongst others, offering consumers a unique portfolio of high quality beers designed to satisfy different needs and tastes across different occasions. We also produce a number of non-alcoholic products, such as soft drinks, energy drinks and juices. The quality of our products is at the forefront of our priorities. We have strict processes, with more than 1,300 controls and more than 370 tests across our production lines, as we aim to provide to our consumers products matching the highest possible standards. Our R&D team is also constantly working to enhance our production process and the quality of our products.
Permanent Cost Efficiency
Cost control is one of the top priorities of our employees. Each of our departments must comply with its respective annual budget for fixed and variable costs. As a means of avoiding unnecessary expenses, we have designed a management control system inspired on “zero-base budgeting” concepts that requires every manager to build from scratch an annual budget for his/her respective department.
30
Financial Discipline
Our focus is not only on volumes and operating performance, but also on the disciplined management of our working capital and our cash flow generation. Our objective is to maximize the return to our shareholders through a combination of payments of dividends and interest on shareholders’ equity, while at the same time keeping our investment plans and holding an adequate level of liquidity to accommodate the seasonality of our business and cope with often volatile and uncertain financial market conditions.
Seasonality
Sales of beverages in our markets are seasonal. Generally, sales are stronger during the summer and major holidays. Therefore, in the Southern Hemisphere (Latin America North and Latin America South) volumes are usually stronger in the fourth calendar quarter due to early summer and year-end festivities. In Canada, volumes are stronger in the second and third calendar quarters due to the summer season. This is demonstrated by the table below, which shows our volumes by quarter and business segment:
|
|
2018 Quarterly Volumes | |||
|
|
1st Quarter |
2nd Quarter |
3rd Quarter |
4th Quarter |
|
Latin America North |
23.9% |
23.2% |
23.7% |
29.3% |
|
Brazil |
24.1% |
23.0% |
23.5% |
29.5% |
|
Beer Brazil |
24.3% |
22.8% |
23.0% |
29.9% |
|
NAB |
23.5% |
23.5% |
24.9% |
28.2% |
|
CAC |
22.1% |
24.8% |
25.5% |
27.6% |
|
Latin America South |
28.3% |
20.8% |
21.9% |
29.0% |
|
Canada |
19.3% |
29.2% |
28.6% |
22.8% |
|
Total |
24.5% |
23.0% |
23.6% |
28.8% |
Description of the Markets Where We Operate
Latin America North
Brazil
The Brazilian Beer Market
In Brazil, the two main packaging presentations are standardized, returnable 600-milliliter glass bottles sold in bars for on-premise consumption and 350-milliliter one-way aluminum cans, which are predominantly sold in supermarkets for off-premise consumption.
According to our estimates, in 2018 we were the market leader of the Brazilian market in terms of beer sales volumes, mainly through our three major brands: Skol, Brahma and Antarctica. Our closest competitors in Brazil are: Heineken, particularly following its May 2017 acquisition of Brasil Kirin operations, and Cervejaria Petrópolis.
Distribution represents an important feature in this market, as the retail channel is fragmented into approximately one million points of sale. Our distribution is structured under two separate branches, comprising (1) our network of exclusive third-party distributors, involving 149 operations, and (2) our proprietary direct distribution system, involving more than 104 distribution centers spanned over most Brazilian regions. We have been focusing on direct distribution in large urban regions, while strengthening our third-party distribution system. See “—Business Overview—Business Strategy.”
Near-Beer
Some of our products stretch beyond typical beer consumption occasions, such as Skol Beats Senses, Skol Beats Spirit and Skol Beats Secret, which are sweeter beverages with higher alcohol content, and Brahma 0.0%, a non-alcoholic beer. In 2018, the Skol Beats family accounted for 0.4% of our total beer volume in Brazil, while, according to our estimates, Brahma 0.0% is the leader in the Brazilian non-alcoholic beer segment and represents another 1.1% of our total beer volumes in the country.
31
The Brazilian NAB Markets
The NAB markets in Brazil are comprised of many different segments, including CSD, bottled water, isotonic beverages, energy drinks, coconut water, powdered and natural juices and ready-to-drink teas. The CSD segment is the most significant to our business representing approximately 94% of the volumes of our NAB unit.
According to our estimates, the leading CSD flavors in Brazil are (1) cola (with 50% of the market in 2018), (2) guaraná, (3) orange, and (4) lime. Most CSDs in Brazil are sold in supermarkets in two-liter non-returnable PET bottles for in-home consumption. The 350-milliliter one-way aluminum can is also an important packaging format for our business and is mainly sold in supermarkets and restaurants.
Our main competitor in this market is The Coca-Cola Company. In addition to The Coca-Cola Company, we face competition from small regional bottlers that produce what are usually referred to as “B Brands.” The B Brands compete mainly on price, usually being sold at a significantly lower price than our products.
Our main CSD brands are Guaraná Antarctica, the leader in the “non-cola” flavor segment, and Pepsi Cola. Pepsi Cola is sold under our exclusive production and bottling agreements with PepsiCo. Our NAB portfolio also includes such brands as Gatorade in the isotonic market, H2OH! in the flavored water market, and Lipton Iced Tea in the ready-to-drink tea market, which are also sold under license from PepsiCo, and Fusion, a proprietary brand that is today the third largest brand in the energy drinks segment in Brazil. Also in 2016, we acquired the Brazilian juice company “Do Bem,” which enjoys brand strength in health and wellness categories.
Our NAB products are sold in Brazil through the same distribution system used for beer.
ZX Ventures
ZX Ventures is our growth and innovation arm whose mandate is to invest in and develop new products and businesses that address emerging consumer needs. We seed, launch and scale new products that deliver customer experiences, from services that step-change convenience to rethinking delivery.
ZX Ventures operations are adjacent to our core beer business including eCommerce, craft (including our brands Colorado, Wäls and Patagonia) and specialty beer, and brand experience.
CAC (Central America and the Caribbean)
Central America
In Guatemala, the main packaging presentations are the returnable, 12 ounce and 1-liter glass bottles, and the 12 ounce and the 16 ounce cans. Our main competitor in Guatemala is Cerveceria Centro Americana, the market leader, which is a private company owned by local investors. According to our estimates, the total annual sales volume of the Guatemalan beer market was 3.98 million hectoliters in 2018.
In El Salvador, Honduras and Nicaragua, we are currently selling imported brands, and our main packaging presentation is the returnable one-liter glass bottle.
Specifically in Nicaragua, our main competitor is Compañía Cervecera de Nicaragua, the market leader, which is a joint venture between Guatemala’s Cerveceria Centro Americana and Florida Ice & Farm Co, an investor group from Costa Rica.
In all of these markets, beer is predominantly sold in returnable bottles through small retailers. We sell our Brahva, Brahva Gold, Extra, Budweiser, Bud Light, Stella Artois, Corona, Modelo Especial, Beck, Leffe and Hoegaarden beer brands in Central America, which are distributed through the CBC distribution system, jointly with CBC’s CSD portfolio.
32
In May 2016, we entered into an agreement with ABI pursuant to which we agreed to transfer to ABI our businesses in Colombia, Peru and Ecuador. In exchange, ABI has agreed to transfer SAB’s Panamanian business to us. We formally began operations in Panama on December 31, 2016. According to our estimates, we currently lead the beer market in Panama. The main packaging presentation are 285-milliliter bottles and 355-milliliter cans and our main beer brands in Panama are Atlas Golden Light and Balboa Ice. The main competitor in the Panamanian beer market is Baru. According to our estimates, the total annual sales volume of the Panamanian beer market was 3.3 million hectoliters in 2018. Our Panamanian business also produces and commercializes soft drinks, under franchise, being Pepsi, Canada Dry and Squirt the main brands distributed. In Panama, the annual sales volume of the CSD market was 2.7 million hectoliters in 2018.
In May 2018, our board of directors approved the distribution, sale and marketing of the brand Budweiser in Panama.
The Caribbean Beer Market
In Cuba, our main packaging presentation is the 12 ounce can. Our main competitor in Cuba is State Brewery. We currently sell the Bucanero, Cristal, Mayabe and Cacique local beer brands in Cuba. According to our estimates, the total annual sales volume of the Cuban beer market was approximately 2.72 million hectoliters in 2018.
In the Dominican Republic, the annual sales volume of the beer market was 4.33 million hectoliters in 2018, according to our estimates. The main packaging presentation in the Dominican beer market consists of the returnable 650-milliliter and 1-liter glass bottles, which are predominantly sold in small retail stores. We currently lead the beer market in the Dominican Republic after our acquisition of CND, with leading portfolio brands such as Presidente, Brahma Light, Presidente Light, Bohemia, The One, Corona, Stella Artois and Budweiser.Our distribution system in the Dominican Republic is comprised mainly of direct distribution operations.
In Barbados, the annual sales volume of the beer market was 0.16 million hectoliters in 2018, according to our estimates. We are the market leader with brands such as Banks and Deputy, which are produced locally by BHL. The main packaging presentation in Barbados is the 250-milliliter and 275-milliliter returnable glass bottles.
The Caribbean CSD Market
According to our estimates, the annual sales volume of the Dominican CSD market was 6.0 million hectoliters in 2018. The main packaging presentation in the Dominican CSD market is the returnable half-liter bottle, in either glass or PET format, which is predominantly sold in small retail stores. The Coca-Cola Company, represented by Bepensa, has the leadership of the Dominican CSD Market, followed by Ajegroup, which adopts a low price strategy. We are currently the third player in that market.
Our main CSD brands in the Dominican Republic are Red Rock, Pepsi-Cola and Seven Up all of which are marketed under an exclusive bottling agreement with PepsiCo. Our distribution system in the Dominican Republic is comprised of direct distribution operations and third-party distributors.
In Barbados, the sales volume of the CSD market was 0.25 million hectoliters in 2018, according to our estimates. Prior to our sale of Barbados Bottling Co. Ltd, a wholly owned subsidiary of BHL, in June 2018, Barbados Bottling Co. Ltd. was the market leader for CSD, according to our estimates.
Latin America South
Argentina
Argentina is one of our most important regions, second only to Brazil in terms of volume.
We serve more than 320 thousand points of sale throughout Argentina both directly and through our exclusive third-party distributors.
33
The Argentine Beer Market
According to our estimates, the annual sales volume of the Argentine beer market was 20.3 million hectoliters in 2018. With a population of approximately 44 million, Argentina is Latin America South’s largest and most important beer market.
In Argentina, 36% of our beer volume is distributed directly by us and 64% is distributed through exclusive third-party distributors. Our main package presentation in Argentina is the 1-liter returnable glass bottles, which accounted for 71% of our sales in 2018.
According to our estimates, on-premise consumption represented 8.1% of beer volumes in Argentina in 2018, and supermarkets sales represented 16% of beer volumes. The main channels of volume consumption in Argentina are through kiosks and small grocery stores.
Our most important beer brands in Argentina are Quilmes Clásica, Brahma and Stella Artois. According to Nielsen, we are the leading beer producers in Argentina, and our main competitor in Argentina is Compañía Cervecerías Unidas S.A.
The Argentine CSD Market
According to our estimates, in 2018, annual sales volume of the Argentine CSD market was 43.8 million hectoliters. In Argentina, 53% of our CSD volume is distributed directly by us and 47% is distributed through exclusive third-party distributors. Non-returnable bottles represented 84% of our CSD sales in Argentina in 2018.
We are the exclusive Pepsi bottlers in Argentina and our most important CSD brand in that country is Pepsi-Cola and Seven-Up. According to Nielsen, we were second in the Argentine CSD market in 2018, only after The Coca-Cola Company.
Bolivia
The Bolivian Beer Market
According to our estimates, the annual sales volume of the Bolivian beer market was 3.3 million hectoliters in 2018. The Bolivian market is strongly influenced by macroeconomic trends and governmental regulatory and fiscal policies.
In Bolivia, 12% of our beer volumes is directly distributed by us and 88% is distributed through exclusive third-party distributors. Our main package presentation in Bolivia is the 620-milliliter returnable glass bottle, which accounted for 50% of our sales in 2018.
Our most important beer brands in Bolivia are Paceña, Taquiña and Huari. We are the leading beer producer in Bolivia, according to Nielsen.
The Bolivian CSD Market
In March 2009, we, through Quinsa, acquired from SAB 100% of Bebidas y Aguas Gaseosas Occidente S.R.L., becoming the exclusive bottler of Pepsi in Bolivia.
According to our estimates, in 2018, the annual sales volume of the Bolivian CSD market was 8.7 million hectoliters. Of our total CSD volumes in Bolivia in 2018, 57% was directly distributed by us and 43% was distributed through exclusive third-party distributors, while 99% of our CSD sales in that country in 2018 were through non-returnable bottles.
Chile
According to our estimates, the annual sales volume of the Chilean beer market was 9.5 million hectoliters in 2018. Beer consumption in Chile has increased every year since 2009, except for 2017. Our most important beer brands in Chile are Becker, Corona, Budweiser, Báltica and Stella Artois.
34
We are the second beer producers in Chile, according to Nielsen, and our main competitor and the leader in the country is Compañía Cervecerías Unidas S.A.
In 2015, we became the exclusive distributors of the Corona brand in Chile, and since January 2016 we also started to import and distribute Budweiser in Chile.
Paraguay
According to our estimates, the annual sales volume of the Paraguayan beer market was 4.3 million hectoliters in 2018, excluding contraband.
The market for beer in Paraguay has traditionally distinguished itself from those in the southern cone countries in certain respects because (1) beer has not faced significant competition from wine as an alternative alcoholic beverage; (2) the domestic beer market has faced significant competition from imported brands, which accounted for a far higher market share in Paraguay than in neighboring countries; and (3) the seasonality of our products is lower due to warmer conditions throughout the year.
In Paraguay, 69% of our beer volumes is directly distributed by us and 31% is distributed through exclusive third-party distributors. Our main package presentation in Paraguay is the can, which accounted for 52% of our sales in 2018.
Our most important beer brands in Paraguay are Brahma, Pilsen and Ouro Fino, with a leader market position in the country in 2018, according to our estimates. We are also the exclusive distributor of the Budweiser brand in Paraguay.
Uruguay
The Uruguayan Beer Market
According to our estimates, the annual sales volume of the Uruguayan beer market was 1.0 million hectoliters in 2018. Our Latin America South business unit manages both the beer and CSD businesses in Uruguay out of a facility based in that country.
In Uruguay, 24% of our beer volumes is directly distributed by us and 76% is distributed through exclusive third-party distributors. Our main package presentation in Uruguay is the 1-liter returnable glass bottle, which accounted for 64% of our sales in 2018.
Our most important beer brands in Uruguay are Pilsen and Patricia, with a leader market position in 2018, according to our estimates.
The Uruguayan CSD Market
According to our estimates, in 2018, the annual sales volume of the Uruguayan CSD market was 0.8 million hectoliters.
In Uruguay, 38% of our CSD volume is directly distributed by us and 62% is distributed through exclusive third-party distributors. Non-returnable bottles accounted for 90% of our sales in that country in 2018. Our most important brand in Uruguay is Pepsi-Cola, with The Coca-Cola Company being our main competitor.
Canada - Labatt
The Canadian Beer Market
Our Canada business segment is represented by the Labatt operations, which sells domestic and ABI beer brands, a portfolio of ready-to-drink and cider brands, and exports the Kokanee beer brand to the United States.
According to our estimates, Labatt is the market leader in the Canadian beer market. The main packaging presentation in that country are the returnable, 341-milliliter glass bottle, and the 355-milliliter aluminum can, which are predominantly sold in privately owned and government-owned retail stores in addition to privately owned on-trade establishments. Our main competitor in Canada is Molson Coors, but we also compete with smaller brewers, such as Sleeman Breweries Ltd., or Sleeman, and Moosehead Breweries Ltd.
35
Our main brands in Canada are Budweiser, Bud Light and Michelob Ultra (brewed and sold under license from ABI’s subsidiary Anheuser-Busch, Inc., or Anheuser-Busch), along with Corona, Labatt Blue, Alexander Keith’s, Stella Artois and Kokanee. Our distribution system in Canada is structured in different ways across the country, as further explained below.
In January 2016, we, through our subsidiaries, acquired Mark Anthony Group’s ready-to-drink (RTD), cider and craft beer business in the Canadian market, and in April 2016, a subsidiary of Labatt Brewing Company Limited, one of our wholly-owned subsidiaries, acquired Archibald Microbrasserie, known for its local beers and seasonal specialties.
Distribution in Ontario
In Ontario, the province with the largest beer consumption in Canada, we own together with other brewers a distribution and retail company incorporated in 1927 named Brewers Retail Inc., operating as The Beer Store, or TBS. In 2015, we finalized a new Master Framework Agreement, or MFA, with the government of the Province of Ontario that specifies TBS’s role as a retailer and distributor of beer.
Under the MFA, TBS will continue to be the primary retailer for pack sizes larger than six bottles or cans of beer. The Liquor Control Board of Ontario, or LCBO, a chain of liquor stores owned by the government of the Province of Ontario, will continue to have the ability to sell beer. Most LCBO stores are limited to selling pack sizes of six bottles or cans of beer or less. Under the MFA up to 450 grocery stores may also be granted a license to sell beer in pack sizes of six bottles or cans or less. The MFA came into force on January 1, 2016 and has an initial term of ten years, subject to renewal for successive five-year terms, unless the agreement is terminated after the initial term in accordance with the MFA.
TBS ownership is now available to all qualifying Ontario-based brewers. TBS’s new 15-member Board of Directors is made up of the following members: four directors nominated by Labatt; four directors nominated by Molson Coors; four independent directors nominated by a selection committee jointly represented by the Province of Ontario, Labatt and Molson-Coors; two directors nominated by larger brewers (other than Labatt and Molson-Coors) with TBS sales greater than 50,000 hectoliters per year; one director nominated by small Ontario-based brewers who sell less than 50,000 hectoliters per year through TBS.
TBS operates as a self-funding corporation on a break-even cash flow basis under which it charges volume-based fees for services it provides to the brewers. The nature of TBS’s business requires compliance with laws and regulations and oversight by the Province of Ontario and its agents. The Liquor Control Act, the Liquor License Act and the Alcohol and Gaming Regulation and Public Protection Act are administered by the Minister of Finance or the Attorney General, which maintains control of the beverage alcohol sectors through the Liquor Control Board of Ontario and the Alcohol and Gaming Commission of Ontario.
Distribution in Quebec
Quebec is the province in Canada with the second largest beer consumption. In this province there are no exclusive rights for the sales of beer, and both the on-premise and off-premise sales channels are mostly comprised of privately owned stores. The SAQ, a government-operated liquor store, sells a select few beer brands that are not available in the private retail system.
We (as well as our competitors) sell our products in Quebec through a direct sales and distribution system.
Distribution in the Western Provinces
Molson and Labatt are each a shareholder in Brewers Distributor Limited, which operates a distribution network primarily for beer in the four western provinces of British Columbia, Alberta, Manitoba and Saskatchewan, as well as three territories (Yukon, the Northwest Territories and Nunavut). In Alberta, some volume is also sold through a third-party wholesaler. In these Western Provincial markets, there are both privately controlled retail stores (such as in Alberta and British Columbia) and government-controlled retail stores (such as in British Columbia, Manitoba and Saskatchewan).
36
Distribution in the Atlantic Provinces
We distribute and sell our products in the Atlantic Provinces (including New Brunswick, Newfoundland, Nova Scotia and Prince Edward Island) through (1) distribution and retail networks controlled by the government in the provinces of Nova Scotia, New Brunswick and Prince Edward Island; and (2) private distributors in Newfoundland.
Beer and CSD Production Process
The basic brewing process for most beers is straightforward, but significant know-how is involved in quality and cost control. The most important stages are brewing and fermentation, followed by maturation, filtering and packaging. Although malted barley (malt) is the primary ingredient, other grains such as unmalted barley, corn, rice or wheat are sometimes added to produce different beer flavors. The proportion and choice of other raw materials varies according to regional taste preferences and the type of beer.
The first step in the brewing process is making wort by mixing malt with warm water and then gradually heating it to approximately 75°C in large mash turns to dissolve the starch and transform it into a mixture, called “mash,” of maltose and other sugars. The spent grains are filtered out and the liquid, now called “wort,” is boiled. Hops are added at this point to give a special bitter taste and aroma to the beer, and help preserve it. The wort is boiled for one to two hours to sterilize and concentrate it, and extract the flavor from the hops. Cooling follows, using a heat exchanger. The hopped wort is saturated with air or oxygen, essential for the growth of the yeast in the next stage.
Yeast is a micro-organism that turns the sugar in the wort into alcohol and carbon dioxide. This process of fermentation takes five to eleven days, after which the wort finally becomes beer. Different types of beer are made using different strains of yeast and wort compositions. In some yeast varieties, the cells rise to the top at the end of fermentation. Ales and wheat beers are brewed in this way. Pilsen beers are made using yeast cells that settle to the bottom.
During the maturation process the liquid clarifies as yeast and other particles settle. Further filtering gives the beer more clarity. Maturation varies by type of beer and can take as long as three weeks. Then the beer is ready for packaging in kegs, cans or bottles.
CSDs are produced by mixing water, flavored concentrate and sugar or sweetener. Water is processed to eliminate mineral salts and filtered to eliminate impurities. Purified water is combined with processed sugar or, in the case of diet CSDs, with artificial sweeteners and concentrate. Carbon dioxide gas is injected into the mixture to produce carbonation. Immediately following carbonation, the mixture is packaged. In addition to these inputs, delivery of the product to consumers requires packaging materials such as PET bottles, aluminum cans, labels and plastic closures.
For information on our production facilities, see “—D. Property, Plant and Equipment.”
Sources and Availability of Raw Materials
Beer
The main raw materials used in our production are malt, non-malted cereals, hops and water.
Barley and Malt
Malt is widely available and our requirements are met by domestic and international suppliers as well as our own malting facilities. In the case of our beer operations in Brazil, approximately 75% of our malt needs are supplied by our own malting facilities located in the south of Brazil, Argentina and Uruguay.
37
For the rest of our needs, our most significant malt supplier is Cooperativa Agroindustrial Agraria in Brazil. Market prices for malt are volatile, and depend on the quality and the level of production of the barley crop across the world, as well as on the intensity of demand.
We purchase barley for our malting facilities directly from South America farmers. Barley prices depend on local winter crop markets, wheat market prices on the main boards of trade across the world and on the barley quality during the harvest. We enter into future contracts or financials instruments to avoid the impact of short-term volatility in barley and malt prices on our production costs. See “Item 11. Quantitative and Qualitative Disclosures about Market Risk.”
Hops
There are two types of hops used in our beer production: hops used to give beer its distinctive bitter flavor, which we generally import from the United States, and hops used to give beer its distinctive aroma, which we generally import from Europe. The supply of hops is concentrated into a few international companies, namely the Barth-Haas Group, Hopsteiner, Kalsec and HVG.
Non-malted Cereals
Corn syrup is purchased from Ingredion, Cargill and Tereos Syral. Corn is purchased to produce grits in-house in some plants and corn grits and rice are purchased in other plants from local suppliers and are generally widely available.
Water
Water represents a small portion of our raw material costs. We obtain our water requirements from several sources, such as: lakes and reservoirs, deep wells located near our breweries, rivers adjoining our plants and public utility companies. We monitor the quality, taste and composition of the water we use, and treat it to remove impurities and to comply with our high quality standards and applicable regulations. As a result of advances in technology, we have continuously reduced our water consumption per hectoliter produced.
CSDs
The main raw materials used in our production are: concentrate (including guaraná extract), sugar, sweetener, juices, water and carbon dioxide gas. Most of these materials are obtained from local suppliers.
Guaraná Berries
We have a 1,070 hectare farm that provides us with 25 tons of guaraná seeds (berries) per year, or about 10.0% of our requirements, with the remainder purchased directly from independent farmers in the Amazon region as well as other guaraná available regions in Brazil. The focus of our own farm is to provide Guaraná seedlings for local producers and promote the sustainable cultivation of Guaraná in the Amazon Region. Approximately 40 thousand seedlings are donated per year.
Concentrates
We have a concentrate facility in the north of Brazil which produces the concentrates to meet our requirements for the production of our proprietary brand Guaraná Antarctica among others. The concentrate for Pepsi CSD products is purchased from PepsiCo.
Sugar
Sugar is widely available and is purchased by our regional sourcing entity. We use sugar in our CSD products mainly in Brazil, Argentina, Bolivia, Uruguay, and Dominican Republic. We enter into derivative instruments to avoid the impact of short-term volatility in sugar prices on our production costs. See “Item 11. Quantitative and Qualitative Disclosures about Market Risk.”
38
Juices
Orange, lemon, grape, apple, and other juices are purchased in Brazil. We also use lemon and grapefruit juices in our CSD products in Argentina and Uruguay. Our main suppliers are Louis Dreyfus Commodities, Cutrale, Citrus Juice, San Miguel, Golden and Tecnovin.
Other
We buy all of the fruit juice, pulp and concentrate that we use in the manufacture of our fruit-flavored CSDs.
Packaging
Packaging costs are comprised of the cost of glass and PET bottles, aluminum cans, plastic film (shrink and stretch), paper labels, plastic closures, metal crowns and paperboard, and other materials. We enter into derivative instruments to mitigate the risks of short-term volatility in aluminum and some other packaging materials prices on our production costs; for further information on this matter see “Item 11. Quantitative and Qualitative Disclosures About Market Risk.”. We also set a fixed price for the period in accordance with the prevailing macroeconomic conditions for some materials.
In April 2008, we started operating a glass bottle producing facility in Rio de Janeiro, which we expanded in November 2015. This unit’s capacity is of approximately 240 thousand tons of glass and in 2018 such unit attended to more than 50% of our glass needs.
We have supply contracts with respect to most packaging materials. The choice of packaging materials varies by cost and availability in different regions, as well as consumer preferences and the image of each brand.
Our aluminum cans are mainly sourced regionally by global companies, while our glass containers are sourced by a variety of suppliers, both regionally and globally. We obtain the labels for our beer and CSD primarily from local suppliers; in Brazil, the majority of our requirements are met by a printing house that belongs to FAHZ and is operated by us pursuant to a lease agreement. Plastic closures are principally purchased regionally, and PET pre-forms are principally purchased regionally by both local and global companies. Crown caps in Brazil are mainly sourced from our vertical operation in Manaus (Arosuco). These producers also supply some of our other Latin American operations
Regulation
All our operations are subject to local governmental regulation and supervision, including (1) labor laws; (2) social security laws; (3) public health, consumer protection and environmental laws; (4) securities laws; and (5) antitrust laws. In addition, we may also be subject to regulations aimed at (1) ensuring healthy and safe conditions in facilities for the production, bottling, and distribution of beverages and (2) placing restrictions on beer and CSD consumption.
Environmental laws in the countries where we operate are mostly related to (1) the conformity of our operating procedures with environmental standards regarding, among other issues, the emission of gas and liquid effluents and (2) the disposal of one-way packaging.
Governmental restrictions on beer consumption in the markets where we operate vary from one country to another, and in some instances, from one local region to another. The most relevant restrictions are:
|
· |
each country or province has a minimum legal drinking age that is established by the government; the beer legal drinking age varies from 18 to 21 years; |
|
· |
some local and federal governments require that retail stores own special licenses for the sale of alcohol; this is the case in some regions of Argentina, Bolivia and Canada; |
39
|
· |
some local and federal governments (including Bolivia) prohibit the sale of alcoholic beverages within a certain distance from schools, hospitals and other designated areas, as well as place certain restrictions on the time of sale and consumption of these products in public places and private clubs; |
|
· |
some local governments in Canada establish a minimum price for beer sales, which is named Social Reference Price, or SRP. There is a specific SRP for each different packaging presentation. The SRP may vary from one province to another; |
|
· |
in some provinces in Canada the off-trade is restricted to government-owned or licensed stores. See “—Business Overview—Description of the Markets Where We Operate—Canada - Labatt”; and |
|
· |
beer sales in the off-premise channel in Canada in the Province of Ontario are restricted to three retail channels. One of them is the LCBO, which is government-owned. The second retail channel is TBS, which is jointly owned by Labatt and 33 other brewers. The third retail channel is eligible grocery. The Alcohol and Gaming Commission of Ontario regulates the alcohol industry. |
Many governments also impose restrictions on beer advertisement, which may affect, among other issues, (1) the media channels used, (2) the contents of advertising campaigns, and (3) the time and places where beer can be advertised.
Marketing
Our marketing initiatives are concentrated in off-trade and on-trade initiatives. Off-trade initiatives comprise mass media vehicles, such as television, radio, magazines and internet websites. On-trade initiatives include banners, and all types of enhancements to the point of sale, such as branded coolers and decorated furniture.
Licenses
Pepsi
We have had a long-term agreement with PepsiCo whereby we have been granted the exclusive right to bottle, sell and distribute certain brands of PepsiCo’s portfolio of CSDs in Brazil, including Pepsi-Cola, Gatorade, H2OH!, and Lipton Ice Tea. We are also, through our subsidiaries, PepsiCo’s bottler for Argentina, Uruguay, Bolivia and Dominican Republic. In 2018, sales volumes of PepsiCo products represented approximately 32% of our total NAB sales volumes in Brazil, nearly 64% of our total NAB sales volumes in the Dominican Republic and 95% of our NAB sales volumes in Argentina, Bolivia and Uruguay.
Licensing Agreements with ABI
Effective January 1998, Labatt entered into long-term licensing agreements with ABI whereby Labatt was granted the exclusive right and license to manufacture, bottle, sell, distribute and market some of ABI’s brands, including the Budweiser and Bud Light brands, in Canada, including the right to use ABI’s trademarks for those purposes. The agreements expire in January 2098 and are renewable by either party for a second term of 100 years. In 2018, the ABI brands sold by Labatt represented approximately 60% of Labatt’s total sales volumes. According to our estimates, the Budweiser brand is currently the largest selling brand, while Bud Light is the third largest selling brand, in Canada in terms of volume.
We also have a licensing agreement with ABI which allows us to exclusively produce, distribute and market Budweiser in Brazil. We also have certain arrangements to sell and distribute Budweiser products in Paraguay, Guatemala, Dominican Republic, El Salvador, Nicaragua, Uruguay and Chile.
We also have a cross-licensing agreement with ABI through which we are allowed to produce, bottle, sell and distribute beer under the Stella Artois brand in Latin America and Canada on an exclusive basis, and ABI is allowed to produce, bottle, sell and distribute beer under the brand Brahma in Europe, Asia, Africa and the United States on an exclusive basis. Ambev has agreed not to directly or indirectly produce, bottle, distribute, sell or resell (or have an interest in any of these), any other European premium branded beer in Latin America, and ABI has agreed to be bound by the same restrictions relating to any other Latin American premium branded beer in Europe, Asia, Africa and the United States. As a result, in June 2005 we launched Stella Artois in Brazil and, since March 2005, ABI has been distributing Brahma beer in the United States and several countries such as the United Kingdom, Spain, Sweden, Finland and Greece.
40
We also have ABI’s subsidiary, Metal Container Corporation, as one of our can suppliers.
We have also a licensing agreement with Grupo Modelo, S. de R.L. de C.V. (formerly Grupo Modelo, S.A.B. de C.V.), a subsidiary of ABI, to import, promote and resell Corona products (Corona Extra, Corona Light, Coronita, Pacifico and Negra Modelo) in Latin America countries, including Brazil, as well as in Canada.
Taxation
Beer
Taxation on beer in the countries where we operate is comprised of different taxes specific to each jurisdiction, such as an excise tax and a value-added tax. The amount of sales tax charged on our beer products in 2018, represented as a percentage of gross sales, was: 44.4% in Brazil; 22% in Canada; 21% in Central America; 43% in the Dominican Republic; 2% in Cuba; 6% in Barbados; 27.2% in Argentina; 35.2% in Bolivia; 23.8% in Chile; 12% in Paraguay; and 30.5% in Uruguay.
NAB
Taxation on NAB in the countries where we operate is comprised of taxes specific to each jurisdiction, such as an excise tax and a value-added tax. The amount of taxes charged on our NAB products in 2018, represented as a percentage of gross sales, was: 37.9% in Brazil; 15.0% in the Dominican Republic; 18.5% in Argentina; 27.0% in Bolivia; and 30.9% in Uruguay.
Changes to Brazilian Taxes on Beverages
In November 2008, the Brazilian Congress approved changes (effective as of January 1, 2009) to the taxable amount and tax rates for (1) the IPI Excise Tax, (2) the PIS Contribution and (3) the COFINS. Under the previous system, these taxes were paid as a fixed rate per hectoliter by all taxpayers. Under the system approved in 2008, higher priced brands pay higher taxes per hectoliter than lower priced brands based on a consumer price reference table. The taxable amount is calculated through the application of a rate to the consumer price established in the respective consumer price reference table. In recent years, taxes on the beverage industry were increased at the Brazilian federal and state levels. In April 2013, an aggregate increase of 2% was approved with respect to the rates of the IPI Excise Tax, the PIS Contribution and the COFINS on beer sales. In addition, in 2014 the IPI Excise Tax, the PIS Contribution and the COFINS were subject to another aggregate increase of 4% in April and 2% in October with respect to beer sales. Moreover, in January 2015 the Brazilian federal government enacted Law No. 13,097, which introduced a new federal taxation model for beer and soft drinks. The law is a result of the combined efforts of the Brazilian federal government and beverage companies with a view to creating a less complex and more predictable tax system for the industry. The new tax model came into force on May 1, 2015. Among other changes, the new set of rules establishes that the IPI Excise Tax, the PIS Contribution and the COFINS are due by manufacturers and wholesalers, and shall be calculated based on the respective sales price (ad valorem). Under the previous legislation, the referred taxes were due exclusively by the manufacturer at fixed amounts per liter of beer or soft drink produced (ad rem). The new taxation model introduced by Law No. 13,097, Decree No. 8,442/2015 brought temporary reductions on the tax rates applicable to beers and soft drinks. As of January 2018, such temporary reductions are no longer in force. Without such reduction, PIS Contribution and COFINS rates have increased between 5% and 12% over the previously reduced rates for breweries - except for special beers which have 75% or more of barley malt by weight on the original extract as a source of sugar.
In 2012, the following six Brazilian states increased their rates for ICMS Value-Added Tax applicable to beer: Minas Gerais, Sergipe, Amazonas, Mato Grosso, Bahia and the Federal District. In addition, in 2015 the States of São Paulo, Rio de Janeiro, Minas Gerais, Distrito Federal, Rio Grande do Sul, Ceará, Amapá, Rondonia, Amazonas, Tocantins, Piauí, Maranhão, Rio Grande do Norte, Bahia, Pernambuco, Paraíba, Alagoas, Sergipe and Mato Grosso do Sul increased their ICMS Value-Added Tax rate applicable to beer and soft drinks. In 2016, the States of Rio de Janeiro and Acre also increased their respective ICMS Value-Added Tax rates, scheduled to take effect in early 2017. In 2017, the States of Goiás and Amazonas increased their soft drinks and beer ICMS rates. In 2018, the States of Maranhão and Pernambuco increased their non-alcoholic beverages ICMS rates and Bahia and Maranhão increased beer ICMS burden, which will become effective in early 2019.
41
In May 2018, the Brazilian Federal Government enacted Decree No. 9,394/2018 changing the IPI taxation applicable on transactions with concentrate units, consequently reducing the value of the IPI presumed credits registered by Ambev on acquisitions from companies located in the Manaus Free Trade Zone from 20% to 4%. Due to the severe effects of such change, the Brazilian Federal Government enacted Decree No. 9,514/2018 to make a gradual change of the IPI taxation, as follows: (1) taxation of 12% in the first half of 2019; (2) taxation of 8% in the second half of 2019; and (3) taxation of 4% from 2020 onwards.
C. Organizational Structure
Our two direct controlling shareholders, IIBV and AmBrew, both of which are subsidiaries of ABI, together with FAHZ, held in aggregate 72.1% of our total and voting capital stock (excluding treasury shares) as of December 31, 2018.
ABI indirectly holds shares in us representing 61.9% of our total and voting capital stock (excluding treasury shares) as of December 31, 2018. ABI thus has control over us, even though (1) ABI remains subject to the Ambev Shareholders’ Agreement and (2) ABI is controlled by Stichting that represents an important part of interests of BRC and the Interbrew Founding Families. For further information on these matters see “Item 4. Information on the Company—A. History and Development of the Company—The InBev-Ambev Transactions” and “Item 7. Major Shareholders and Related Party Transactions—A. Major Shareholders—Ambev’s Major Shareholders —Ambev Shareholders’ Agreement.”
We conduct the bulk of our operations in Brazil directly. We also indirectly control Labatt and the operations conducted by our CAC and Latin America South units. The following chart illustrates the ownership structure of our principal subsidiaries as of December 31, 2018 based on total share capital owned.
42
Organizational Structure
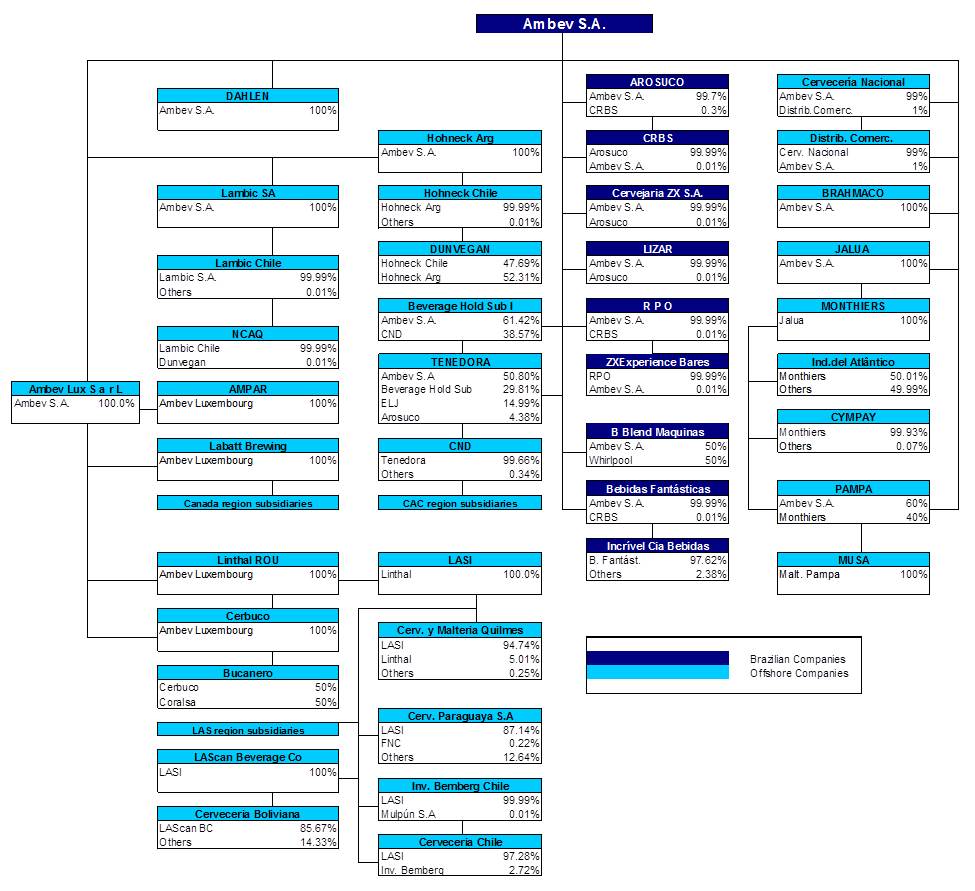
D. Property, Plant and Equipment
Our properties consist primarily of brewing, soft drink production, malting, bottling, distribution and office facilities in the countries where we operate.
As of December 31, 2018, our aggregate beer and CSD production capacity was 270.1 million hectoliters per year. In 2018, the total production at the facilities set forth below was equal to 154.4 million hectoliters.
The following is a list of our principal production facilities as of December 31, 2018:
43
|
Latin America North |
|
|
Plant |
Type of Plant |
|
Brazil |
|
|
Agudos, São Paulo |
Beer |
|
Equatorial, Maranhão |
Beer |
|
Jacareí, São Paulo |
Beer |
|
Lages, Santa Catarina |
Beer |
|
Guarulhos, São Paulo |
Beer |
|
Sete Lagoas, Minas Gerais |
Mixed |
|
Uberlândia, Minas Gerais |
Beer |
|
Petrópolis, Rio de Janeiro |
Beer |
|
Ponta Grossa, Paraná |
Beer |
|
Wals/Belo Horizonte, Minas Gerais |
Beer |
|
Colorado/Ribeirão Preto, São Paulo |
Beer |
|
Águas Claras, Sergipe |
Mixed |
|
Aquiraz, Ceará |
Mixed |
|
Camaçari, Bahia |
Mixed |
|
Cebrasa, Goiás |
Mixed |
|
Cuiabá, Mato Grosso |
Mixed |
|
Jaguariúna, São Paulo |
Mixed |
|
Cachoeiras de Macacu, Rio de Janeiro |
Soft drinks |
|
Itapissuma, Pernambuco |
Mixed |
|
Nova Rio, Rio de Janeiro |
Mixed |
|
Manaus, Amazonas |
Mixed |
|
Minas, Minas Gerais |
Mixed |
|
Teresina, Piauí |
Mixed |
|
Águas Claras do Sul, Rio Grande do Sul |
Mixed |
|
Piraí, Rio de Janeiro |
Mixed |
|
Curitibana, Paraná |
Soft drinks |
|
Contagem, Minas Gerais |
Soft drinks |
|
Jundiaí, São Paulo |
Soft drinks |
|
Sapucaia, Rio Grande do Sul |
Soft drinks |
|
São Paulo, São Paulo |
Labels |
|
Manaus, Amazonas |
Crown Cap |
|
Campo Grande, Rio de Janeiro |
Glass Bottle |
|
Manaus, Amazonas |
Concentrate |
|
Maltaria Navegantes, Rio Grande do Sul |
Malt |
|
Maltaria Passo Fundo, Rio Grande do Sul |
Malt |
|
CAC |
|
|
Ambev Centroamerica, Guatemala |
Beer |
|
Santo Domingo, Dominican Republic |
Mixed |
|
Hato Nuevo, Dominican Republic |
Mixed |
|
Saint Vincent |
Mixed |
|
Cuba |
Mixed |
|
Barbados |
Mixed |
|
Panama |
Mixed |
44
|
Latin America South |
|
|
Plant |
Type of Plant |
|
Cympay, Uruguay |
Malt |
|
Musa, Uruguay |
Malt |
|
Malteria Pampa, Argentina |
Malt |
|
Quilmes, Argentina |
Beer |
|
Corrientes, Argentina |
Mixed |
|
La Paz, Bolivia |
Beer |
|
Santa Cruz, Bolivia |
Beer |
|
Cochabamba, Bolivia |
Beer |
|
Huari, Bolivia |
Beer |
|
Tarija, Bolivia |
Beer |
|
Santiago, Chile |
Beer |
|
Minas, Uruguay |
Beer |
|
Ypane, Paraguay |
Beer |
|
Zarate, Argentina |
Beer |
|
Mendoza, Argentina |
Mixed |
|
Montevideo, Uruguay |
Mixed |
|
Cordoba, Argentina |
Soft Drinks |
|
Buenos Aires South, Argentina |
Soft Drinks and Juices |
|
Tucuman, Argentina |
Soft Drinks |
|
Tres Arroyos, Argentina |
Malt |
|
Llavallol, Argentina |
Malt |
|
Acheral, Argentina |
Beer |
|
Coroplas, Argentina |
Crown Cap |
|
FPV, Paraguay |
Bottles |
|
Sacaba, Bolivia |
Soft Drinks |
|
El Alto, Bolivia |
Soft Drinks |
|
Enalbo, Bolivia |
Cans |
|
Bariloche Craft Beer, Argentina |
Beer |
|
Canada |
|
|
Plant |
Type of Plant |
|
St. John’s |
Beer |
|
Halifax |
Beer |
|
Montreal |
Beer |
|
London |
Beer |
|
Edmonton |
Beer/RTD |
|
Creston |
Beer |
|
Mill Street |
Beer |
|
Turning Point |
Beer/RTD/Cider |
|
Archibald |
Beer |
|
Alexander Keith |
Beer |
45
ITEM 4A. UNRESOLVED STAFF COMMENTS
Not applicable.
ITEM 5. OPERATING AND FINANCIAL REVIEW AND PROSPECTS
A. Operating Results
Introduction
The following management’s discussion and analysis of financial condition and results of operations should be read in conjunction with our audited consolidated financial statements included elsewhere in this annual report on Form 20-F. This annual report contains forward-looking statements that involve risks and uncertainties. Our actual results may differ materially from those discussed in the forward-looking statements as a result of various factors including, without limitation, those set forth in “Cautionary Statement Regarding Forward-Looking Information” and the matters set forth in this annual report generally.
We have prepared our audited consolidated financial statements as of December 31, 2018, 2017 and 2016 and for the three years ended December 31, 2018 in reais and in accordance with IFRS as issued by the IASB.
The financial information and related discussion and analysis contained in this item are in accordance with IFRS as issued by the IASB. The amounts are in million reais, unless otherwise stated.
Critical Accounting Policies
The preparation of financial statements in conformity with IFRS requires our management to make judgments, estimates and assumptions that affect the application of accounting practices and the reported amounts of assets and liabilities, income and expenses. The estimates and associated assumptions are based on past experience and various other factors that are believed to be reasonable under the circumstances, the results of which form the basis for decision making regarding the judgments about carrying amounts of assets and liabilities that are not readily evident from other sources. Actual results may differ from these estimates. Notes 3 and 4 to our audited consolidated financial statements includes a summary of the critical accounting policies applied in the preparation of these financial statements. The estimates and assumptions are reviewed on a regular basis. Changes in accounting estimates may affect the period in which they are realized, or future periods.
The following standards issued by the International Accounting Standards Board became effective for annual periods beginning on January 1, 2018:
· IFRS 9 Financial Instruments, which replaces IAS 39 Financial Instruments: Recognition and Measurement for periods beginning after January 1, 2018, introduces new requirements for the classification of financial assets, that depends on the entity's business model and the contractual characteristics of the cash flow of the financial instruments; defines a new expected-loss impairment model that will require more effective recognition; and introduces a substantially-reformed model for hedge accounting, with enhanced disclosures about risk management activity. The new hedge accounting model represents a significant revision of the policy and aligns the accounting treatment with the risk management activities. IFRS 9 also removes the volatility in the result caused by changes in the credit risk of liabilities determined to be measured at fair value. We have applied IFRS 9 Financial Instruments as of the effective date, without restatement of the comparative information for the period beginning January 1, 2017. Consequently, the classification and measurement of the financial instruments for the comparative periods follow the requirements under IAS 39. We performed an impact assessment and concluded that IFRS 9 Financial Instruments does not impact materially our financial position, financial performance or risk management activities.
· IFRS 15 Revenue from Contracts with Customers requires that the revenue recognition be done depict the transfer of goods or services to customers on amounts that reflect the consideration to which we expect to be entitled in exchange for those goods or services. The new standard for periods beginning on after January 1, 2018 result in more and enhanced disclosures about revenue, provide guidance for transactions that were not previously addressed comprehensively (for example, service revenue and contract modifications) and improve guidance for multiple-element arrangements. We have applied IFRS 15 Revenue from Contracts with Customers as of the effective date, January 1, 2018, in accordance with the modified retrospective application. Under this approach, the cumulative effect of initially applying IFRS 15 must be recognized as an adjustment to the opening balance of equity, in Retained earnings, at the date of initial application without the restatement of prior periods. On the implementation date, the adjustment to the opening balance of equity resulted in a decrease of the Retained earnings by R$355,383, to reflect the changes in accounting policies related to certain rebates granted to customers that, in accordance whit the IFRS 15, should be tied to the transaction price underlying 2017 revenue.
46
· IFRS 16 Leases (effective from annual periods beginning on or after January 1, 2019) replaces the current lease accounting requirements and introduces significant changes to lessee accounting as it removes the distinction between operating and finance leases under IAS 17 Leases and related interpretations, and requires a lessee to recognize a right-of-use asset and a lease liability at lease commencement date. IFRS 16 also requires to recognize a depreciation charge related to the right-of-use assets and an interest expense on the lease liabilities, as compared to the recognition of operating lease expense or rental cost on a straight-line basis over the lease term under prior requirements. In addition, we will amend the consolidated cash flow statement presentation, to segregate the payment of leases into a principal portion presented within financing activities and an interest component presented within operating activities. For short-term leases and leases of low value assets, we will continue to recognize a lease expense on a straight-line basis as permitted by IFRS 16. We as a lessor will continue to classify leases as either finance leases or operating leases and account for those two types of leases differently. We have chosen the full retrospective application of IFRS 16 and, consequently, will restate the comparative information in the 2019 financial statements. In addition, we will apply the practical expedient available on transition to IFRS 16 to not reassess whether a contract is or contains a lease. Accordingly, the definition of a lease under IAS 17 and related interpretations will continue to apply to the leases entered or modified before January 1, 2019. We have assessed the estimated impact that the initial application of IFRS 16 will have on its consolidated financial statements. On transition to IFRS 16, we estimate that we will recognize R$1,547.4 of right-of-use assets and R$1,670.1 of lease liabilities, recognizing the difference in retained earnings. When measuring lease liabilities, the company discounted lease payments using incremental borrowing rates as of January 1, 2019. The weighted average rate applied is 12.5%.
Financial statements in hyperinflationary economies
Hyperinflation accounting as prescribed by IAS 29 stipulates that non-monetary assets and liabilities, equity and income statement of subsidiaries operating in hyperinflationary economies must be adjusted to reflect changes in the general purchasing power of the local currency applying a general price index. The financial statements of an entity whose functional currency is the currency of a hyperinflationary economy, whether they are based on a historical cost approach or a current cost approach, must be stated in terms of the measuring unit current at the end of the reporting period and translated into Brazilian real at the period closing exchange rate.
In July 2018, the Argentine peso underwent a severe devaluation resulting in the three-year cumulative inflation of Argentina exceeding 100%, thereby triggering the requirement to transition to hyperinflation accounting as prescribed by IAS 29.
Goodwill
Goodwill arises on the acquisition of subsidiaries, associates and joint arrangements. Goodwill is determined as the excess (1) of the consideration paid; (2) of the amount of any non-controlling interests in the acquiree (when applicable); and (3) of the fair value, at acquisition date, of any previous equity interest in the acquiree, over the fair value of the net identifiable assets acquired at the date of acquisition. All business combinations are accounted for by applying the purchase method.
47
In conformity with IFRS 3 Business Combinations, goodwill is carried at cost and is not amortized, but tested for impairment at least annually, or whenever there are indications that the cash generating unit to which the goodwill has been allocated may be impaired. Impairment losses recognized on goodwill are not reversed. Gains and losses on the disposal of an entity include the carrying amount of goodwill relating to the entity sold.
Goodwill is expressed in the functional currency of the subsidiary or joint operation to which it relates and translated to reais using the year-end exchange rate.
Regarding associates and joint ventures, goodwill is included in the carrying amount of the investment in the associate/joint ventures.
If our interest in the net fair value of the identifiable assets, liabilities and contingent liabilities recognized exceeds the cost of the business combination such excess is recognized immediately in the income statement.
Expenditure on internally generated goodwill is expensed as incurred. Goodwill includes the effects of the predecessor basis of accounting.
Business Combinations Between Entities Under Common Control
Business combinations between entities under common control have not been addressed by IFRS’s. The IFRS 3 is the pronouncement that shall be applied to business combinations, however it explicitly excludes business combinations between entities under common control from its scope.
Predecessor basis of accounting
In accordance with IAS 8, we adopted the predecessor basis of accounting to record the carrying amount of assets received (as recorded by the parent company), which we believe is consistent with United States Generally Accepted Accounting Principles (USGAAP) and United Kingdom Generally Accepted Accounting Principles (UKGAAP).
Under the predecessor basis of accounting, when accounting for a transfer of assets between entities under common control, the entity that receives the net assets or the equity interests (the acquirer) shall initially record the assets and liabilities transferred at their parent book value at the transfer date. If the book value of assets and liabilities transferred by the parent are different from the historical cost registered by the controlling entity of the entities under common control (the ultimate parent), the financial statements of the acquirer shall reflect the assets and liabilities transferred at the same cost of the ultimate parent against equity (Other Comprehensive Income).
Swap of assets
For transactions between entities under common control that involve the disposal or transfer of assets from the subsidiary to its parent company, i.e. - above the level of our consolidated financial statement – we assess the existence of (1) conflict of interests and (2) economic substance and purpose. Following such evaluation, we adopt as a policy the concepts of IAS 16 in order to provide adequate visibility and fair impact on the amount of the distributable results to our shareholders, especially non-controlling interests. This policy also includes assets acquired through the swap of non-cash assets, or swap with a combination of cash and non-cash assets. The assets subject to the swap may be of equal or different nature. The cost of such asset is measured at fair value, unless (1) the swap transaction is not commercial in nature, or (2) the fair value of the asset received (and the asset assigned) cannot be reliably measured. The acquired asset is measured through this way even if the assignor entity cannot immediately exclude the asset from its books. If the acquired asset is not measurable at fair value, its cost is determined by the book value of the assigned asset.
Whenever there is a distribution of assets that is not recorded as cash, the asset, before its distribution, is registered at fair value in the income account. This procedure is applicable to the distributions in which the assets are equal in nature and therefore treated equitably. However, similarly to IFRIC 17, in the absence of a specific accounting practice for transactions under common control, we apply this procedure in our accounting practice. Also, we apply the same procedure to sales (products, supplies, etc.) we perform to our controlling entity, where the positive result of the sale is recognized in the income account.
48
Joint Arrangements
Joint arrangements are all entities over which we share control with one or more parties. Joint arrangements are classified as either joint operations or joint ventures depending on the contractual rights and obligations of each investor.
Employee Benefits
Post-employment benefits
Post-employment benefits include pensions managed in Brazil by Instituto Ambev de Previdência Privada, or the IAPP, post-employment dental benefits and post-employment medical benefits managed by FAHZ. Usually, pension plans are funded by payments made by both us and our employees, taking into account the recommendations of independent actuaries. Post-employment dental benefits and post-employment medical benefits are maintained by the return on FAHZ’s plan assets. If necessary, we may contribute some of its profit to FAHZ.
We manage defined benefit, defined contribution plans, medical and dental assistance for employees of its companies located in Brazil and in its subsidiaries located in the Dominican Republic, Barbados, Panama, Uruguay, Bolivia, Argentina and Canada.
We maintain funded and unfunded plans.
Defined Contribution Plans
A defined contribution plan is a pension plan under which we pay fixed contributions into a fund. We have no legal or constructive obligations to pay further contributions if the fund does not hold sufficient assets to pay all employees for the benefits relating to employee service in the current and prior periods.
The contributions of these plans are recognized as expense in the period they are incurred.
Defined Benefit Plans
Typically, defined benefit plans define an amount of pension benefit that an employee will receive on retirement, usually dependent on one or more factors such as age, years of service and compensation.
For defined benefit plans, expenses are assessed separately for each plan using the projected credit unit method. The projected credit unit method takes into account each period of service as giving rise to an additional unit of benefit to measure each unit separately. Under this method, the cost of providing pensions is charged to the income statement during the period of service of the employee. The amounts charged to the income statement consist of current service cost, interest cost, past service costs and the effect of any settlements and curtailments. The obligations of the plan recognized in the balance sheet are measured at the present value of the estimated future cash outflows using a discount rate equivalent to the government’s bond rates with maturity terms similar to those of the obligation and the fair value of the plan assets.
Past service costs result from the introduction of a new plan or changes to an existing plan. They are recognized immediately in the income statement, at the earlier of when: (1) the settlements / curtailments occurs, or (2) we recognize related restructuring or termination costs, unless those changes are conditioned to the employee’s continued employment, for a specific period of time (the period in which the right is acquired). In such case, the past services costs are amortized using the straight-line method during the period in which the right was acquired.
Actuarial gains and losses consist of the effects of differences between the previous actuarial assumptions and what has actually occurred, and the effects of changes in actuarial assumptions. Actuarial gains and losses are fully recognized in carrying value adjustments.
Re-measurements, comprising of actuarial gains and losses, the effect of the asset ceiling and the return on plan assets, both excluding net interest, are recognized in full in the period in which they occur in the statement of comprehensive income. Re-measurements are not reclassified to profit or loss in subsequent periods.
49
When the amount of the defined benefit obligation is negative (an asset), we recognize those assets (prepaid expenses), to the extent of the value of the economic benefit available to us either from refunds or reductions in future contributions.
Other Post-Employment Obligations
We and some of our subsidiaries provide post-employment medical benefits, reimbursement of certain medication expenses and other benefits to certain retirees. These benefits are not granted to new retirees. The expected costs of these benefits are recognized over the period of employment, using an accounting methodology similar to that for defined benefit plans, including actuarial gains and losses.
Termination Benefits
Termination benefits are recognized as an expense at the earlier of: (1) when we are demonstrably committed, without realistic possibility of withdrawal, to a formal detailed plan to terminate employment before the normal retirement date, and (2) when we recognize costs for a restructuring.
Deferred and Current Income Tax and Social Contribution
Income tax and social contribution for the year comprises current tax and deferred tax. Income tax and social contribution are recognized in the income statement, unless they relate to items recognized directly in comprehensive income or other equity accounts. In these cases the tax effect is also recognized directly in comprehensive income or equity account (except interest on shareholder’s equity – see note 3(p) to our consolidated financial statements).
The current tax expense is the expectation of payment on the taxable income for the year, using tax rates enacted, or substantially enacted, at the balance sheet date, and any adjustment to tax payable in respect of previous years.
Deferred taxes are recognized using the balance sheet liability approach. This means that a deferred tax liability or asset is recognized for all taxable and tax deductible temporary differences between the tax and accounting basis of assets and liabilities. Under this method, a provision for deferred taxes is also calculated on the differences between the fair value of assets and liabilities acquired in a business combination and their tax basis. IAS 12 prescribes that no deferred tax liability on goodwill recognition, and no deferred tax asset/liability is recorded: (1) at the initial recognition of an asset or liability in a transaction other than a business combination that at the time of the transaction affects neither accounting nor taxable profit or loss and (2) on differences related to investments in subsidiaries to the extent that they are not reversed in the foreseeable future. The amount of deferred tax provided is based on the expectation of the realization or settlement of the temporary difference, using currently or substantially enacted tax rates.
Deferred tax assets and liabilities are offset if there is a legally enforceable right to offset current tax liabilities and assets, and they relate to income taxes levied by the same tax authority on the same taxable entity, or on different taxable entities which intend either to settle current tax liabilities and assets on a net basis, or to realize the assets and settle the liabilities simultaneously.
The deferred tax asset is recognized only to the extent that it is probable that future taxable profits will be available. The deferred income tax asset is reduced to the extent that it is no longer probable that the future taxable benefit will occur.
Our aggregate weighted nominal tax rate applicable for the years ended December 31, 2018, 2017 and 2016 was 29.9%, 29.2% and 30.2%, respectively. For the years ended December 31, 2018, 2017 and 2016, our IFRS effective tax rate was 13.6%, 39.3% and 2.4%, respectively.
The main events that impacted the effective tax rate in 2018 were:
|
· |
government subsidies on sales taxes: we have state tax incentives within certain local manufacturing that when reinvested are not taxed for income tax purposes, which explains the impact in the effective tax rate. The amounts above are impacted by fluctuations in production volumes, pricing and eventual fluctuations in state taxation rates; |
50
|
· |
deductible interest on net equity: under Brazilian law, companies have the option to distribute interest on equity, or JCP, calculated based on the long-term interest rate, or TJLP, which are deductible for income tax purposes under the applicable legislation; in 2018, we distributed approximately R$5,031 million as interest on equity, of which R$5,031 million was deductible, resulting in a tax impact of approximately R$1,710 million; |
|
· |
results from intercompany transactions: we make adjustments to reflect the tax scenario in countries in which some of Ambev’s subsidiaries are located and with whom Ambev has intercompany loan agreements. The non-taxability of the income arising from those countries is reflected in the effective tax rate; and |
|
· |
foreign income tax complement from offshore subsidiaries: in accordance with Law No. 12,973, we make adjustments to reflect the application of tax credits in relation to profits generated from consolidated and non-consolidated subsidiaries abroad, outside of Brazil. |
Financial Instruments and Hedge Accounting
We use financial instruments to implement our risk management strategy and policies. Derivatives are generally used to mitigate the impact of foreign currencies, interest rates, equity prices and commodity prices on our performance. Our financial risk management policy prohibits the use of derivatives when not related to the company’s core business.
Exceptional Items
Exceptional items are those that, in our management’s judgment, need to be disclosed separately by virtue of their size or incidence. In determining whether an event or transaction is special, our management considers quantitative as well as qualitative factors such as the frequency or predictability of occurrence, and the potential of impact on the variation of profit or loss. These items are disclosed in the income statement or separately disclosed in the notes to the financial statements. Transactions that may give rise to exceptional items are principally restructuring activities, acquisition of subsidiaries, impairment losses, and gains or losses on disposal of assets and investments.
Year Ended December 31, 2018 Compared to Year Ended December 31, 2017
In the periods discussed below, we conducted our operations through three business segments as follows:
|
· |
Latin America North, which includes our operations in Brazil, where we operate two divisions (the beer sales division and the NAB sales division), and our CAC operations, which includes our operations in the Dominican Republic, Saint Vincent, Antigua, Dominica, Cuba, Guatemala (which also serves El Salvador, Honduras and Nicaragua), Barbados and beginning on December 31, 2016, Panama. |
|
· |
Latin America South, which includes our operations in Argentina, Bolivia, Paraguay, Uruguay, Chile, and until December 31, 2016, Colombia, Ecuador and Peru. |
|
· |
Canada, represented by Labatt’s operations, which includes domestic sales in Canada and some exports to the U.S. market. |
51
The table below sets forth certain of our operating highlights for the years presented:
|
|
Consolidated Financial Highlights | ||
|
|
2018 |
2017 |
% Change |
|
|
(in R$ million, except volume amounts, | ||
|
Sales volume—’000 hectoliters |
158,716.9 |
162,829.4 |
(2.5) |
|
Net sales |
50,231.3 |
47,899.3 |
4.9 |
|
Net revenue per hectoliter—R$/hl |
316.5 |
294.2 |
7.6 |
|
Cost of sales |
(19,269.6) |
(18,041.8) |
6.8 |
|
Gross profit |
30,961.7 |
29,857.5 |
3.7 |
|
Gross margin (%) |
62% |
62% |
|
|
Sales, marketing and distribution expenses |
(12,466.0) |
(11,915.5) |
4.6 |
|
Administrative expenses |
(2,367.2) |
(2,623.8) |
(9.8) |
|
Other operating income/(expenses) |
947.3 |
1,217.3 |
(22.2) |
|
Exceptional items |
(86.4) |
(108.7) |
(20.5) |
|
Income from operations |
16,989.4 |
16,426.8 |
3.4 |
|
Operating margin (%) |
34% |
34% |
|
|
Net income |
11,377.4 |
7,850.5 |
44.9 |
|
Net margin (%) |
23% |
16% |
|
Margin Analysis
The following table sets forth certain line items of our income statement expressed as percentages of net sales for the years ended December 31, 2018 and 2017:
|
|
Year Ended December 31, | |
|
|
2018 |
2017 |
|
|
(%) |
(%) |
|
Net sales |
100.0 |
100.0 |
|
Cost of sales |
(38.4) |
(37.7) |
|
Gross profit |
61.6 |
62.3 |
|
Sales, marketing and distribution expenses |
(24.8) |
(24.9) |
|
Administrative expenses |
(4.7) |
(5.5) |
|
Other operating income/(expenses) |
1.9 |
2.5 |
|
Exceptional items |
(0.2) |
(0.2) |
|
Income from operations |
33.8 |
34.3 |
Selected Financial Data by Business Segment
The following table sets forth selected financial data by business segment, and business operations of Latin America North, for the years ended December 31, 2018 and 2017:
|
|
Year Ended December 31, | |||||||||
|
|
2018 |
2017 | ||||||||
|
|
Brazil(1) |
CAC(1) |
LAS |
Canada |
Total |
Brazil(1) |
CAC(1) |
LAS |
Canada |
Total |
|
|
(in R$ million) | |||||||||
|
Net sales |
26,814.2 |
5,813.9 |
10,753.9 |
6,849.3 |
50,231.3 |
26,353.0 |
4,733.0 |
10,769.7 |
6,043.5 |
47,899.3 |
|
Cost of sales |
(10,024.8) |
(2,560.2) |
(4,269.7) |
(2,415.0) |
(19,269.6) |
(9,889.5) |
(2,045.6) |
(4,122.6) |
(1,984.2) |
(18,041.8) |
|
Gross profit |
16,789.4 |
3,253.8 |
6,484.2 |
4,434.3 |
30,961.7 |
16,463.6 |
2,687.4 |
6,647.2 |
4,059.4 |
29,857.5 |
|
Sales, marketing, distribution and administrative expenses |
(8,269.5) |
(1,470.9) |
(2,577.7) |
(2,515.1) |
(14,833.2) |
(8,473.4) |
(1,330.0) |
(2,483.7) |
(2,252.2) |
(14,539.3) |
|
Other operating income/ (expenses) |
965.0 |
20.1 |
(24.6) |
(13.1) |
947.3 |
1,092.7 |
77.8 |
41.2 |
5.6 |
1,217.3 |
|
Exceptional items |
(43.7) |
62.5 |
(88.4) |
(16.8) |
(86.4) |
(33.0) |
(23.1) |
(41.3) |
(11.3) |
(108.7) |
|
Income from operations |
9,441.2 |
1,865.3 |
3,793.5 |
1,889.4 |
16,989.4 |
9,049.9 |
1,412.1 |
4,163.3 |
1,801.5 |
16,426.8 |
(1) The Latin America North business segment is comprised of Brazil and CAC.
52
Net Sales
Net sales increased by 4.9% in 2018, to R$50,231.3 million from R$47,899.3 million in 2017, as shown in tables set forth below:
|
|
Net Sales | ||||
|
|
2018 |
2017 |
| ||
|
|
Sales |
% of Total |
Sales |
% of Total |
% Change |
|
|
(in R$ million, except percentages) | ||||
|
Latin America North |
32,628.1 |
65.0% |
31,086.0 |
64.9% |
5.0% |
|
Brazil |
26,814.2 |
53.4% |
26,353.0 |
55.0% |
1.8% |
|
Beer Brazil |
23,008.5 |
45.8% |
22,509.3 |
47.0% |
2.2% |
|
NAB |
3,805.7 |
7.6% |
3,843.7 |
8.0% |
-1.0% |
|
CAC |
5,813.9 |
11.6% |
4,733.0 |
9.9% |
22.8% |
|
Latin America South |
10,753.9 |
21.4% |
10,769.7 |
22.5% |
-0.1% |
|
Canada |
6,849.3 |
13.6% |
6,043.5 |
12.6% |
13.3% |
|
Total |
50,231.3 |
100.0% |
47,899.3 |
100.0% |
4.9% |
|
|
Sales Volumes | ||||
|
|
2018 |
2017 |
| ||
|
|
Volume |
% of Total |
Volume |
% of Total |
% Change |
|
|
(in thousands of hectoliters, except percentages) | ||||
|
Latin America North |
114,802.7 |
72.3% |
118,631.8 |
72.9% |
(3.2)% |
|
Brazil |
101,642.9 |
64.0% |
106,360.0 |
65.3% |
(4.4)% |
|
Beer Brazil |
77,784.2 |
49.0% |
80,233.6 |
49.3% |
(3.1)% |
|
NAB |
23,858.8 |
15.0% |
26,126.4 |
16.0% |
(8.7)% |
|
CAC |
13,159.8 |
8.3% |
12,271.8 |
7.5% |
7.2% |
|
Latin America South |
33,971.2 |
21.4% |
34,062.0 |
20.9% |
(0.3)% |
|
Canada |
9,942.9 |
6.3% |
10,135.7 |
6.2% |
(1.9)% |
|
Total |
158,716.9 |
100.0% |
162,829.4 |
100.0 |
(2.5)% |
|
|
Net Revenue per Hectoliter | ||
|
|
2018 |
2017 |
% Change |
|
|
(in R$, except percentages) | ||
|
Latin America North |
284.2 |
262.0 |
8.5% |
|
Brazil |
263.8 |
247.8 |
6.5% |
|
Beer Brazil |
295.8 |
280.5 |
5.4% |
|
NAB |
159.5 |
147.1 |
8.4% |
|
CAC |
441.8 |
385.7 |
14.5% |
|
Latin America South |
316.6 |
316.2 |
0.1% |
|
Canada |
688.9 |
596.3 |
15.5% |
|
Total |
316.5 |
294.2 |
7.6% |
53
Latin America North Operations
Brazilian Operations
Total net sales from our Brazilian operations increased by 1.8% in 2018, to R$26,814.2 million from R$26,353.0 million in 2017.
Our net sales of beer in Brazil increased by 2.2% in 2018, to R$23,008.5 million from R$22,509.3 million in 2017 mainly as a consequence of a 5.4% increase in net revenue per hectoliter in 2018, reaching R$295.8 that year as a result of our revenue management initiatives and price increases. This result was partially offset by a 3.1% decrease in sales volume, mainly due to the continuing impact of the adverse macroeconomic environment and an overall retraction of the Brazilian beer market, primarily explained by (1) adverse weather conditions during the Brazilian summer months, particularly in the first quarter of 2018; (2) the continued effects of a high unemployment rate; (3) the slow growth of disposable income; (4) low consumer confidence; and (5) the disruptive effects of the nationwide Brazilian truck drivers’ strike in May and June of 2018 interrupting supply chains and resulting in shortages of food and fuel.
Our net sales of NAB in Brazil decreased by 1.0% in 2018, to R$3,805.7 million from R$3,843.7 million in 2017 mainly due to a 8.7% decrease in sales volume, reflecting an overall shrinkage of Brazilian soft drinks industry, primarily driven by (1) the continued effects of a high unemployment rate; (2) the slow growth of disposable income; (3) low consumer confidence; and (4) the disruptive effects of the nationwide Brazilian truck drivers’ strike in May and June of 2018. This decrease was offset by a 8.4% increase in net revenue per hectoliter mainly due to our revenue management initiatives.
CAC Operations
Net sales from our CAC operations increased by 22.8% in 2018, to R$$5,813.9 million from R$4,733.0 million in 2017, mainly driven by (1) a 7.2% increase in sales volume, primarily reflecting better sales in most of the Central America and the Caribbean countries where we operate and (2) higher net revenue per hectoliter. Net revenue per hectoliter increased by 14.5% in 2018, reaching R$441.8 that year, as our revenue management initiatives were positively impacted from currency translation due to the appreciation of local currencies in relation to the real during the period.
Latin America South Operations
Net sales from our Latin America South operations decreased by 0.1% in 2018, to R$10,753.9 million from R$10,769.7 million in 2017, mainly due to (1) a 0.3% decrease in volume sold, which was primarily driven by the adverse hyperinflationary macroeconomic conditions in Argentina that had a negative impact on consumption in this country and (2) the negative currency translation due to the weakening of the Argentine peso over the period, which led to a negative impact of R$557.8 million on net revenue. Such decreases were offset by strong volume performance in other key markets in the region outside of Argentina, such as in Bolivia and Chile. Net revenue per hectoliter increased only by 0.1% in 2018, reaching R$316.6 that year, as the positive impact of our revenue management initiatives was largely offset by the impact of the Argentine peso devaluation.
Canada Operations
Net sales from our Canadian operations increased by 13.3% in 2018, to R$6,849.3 million from R$6,043.5 million in 2017. The result was mainly due to (1) an increase in net revenue per hectoliter by 15.5%, reaching R$688.9 in 2018, (2) the positive impact from currency translation reflecting the appreciation of the Canadian dollar relative to the real over the period and (3) a favorable brand mix, which was partially offset by excise taxes increases coupled with a 1.9% decrease in sales volume reflecting the overall contraction of the Canadian beer industry in 2018 driven in part by unfavorable weather conditions.
Cost of Sales
Cost of sales increased 6.8% in 2018, to R$19,269.6 million from R$18,041.8 million in 2017. As a percentage of our net sales, total cost of sales increased to 38.4% in 2018 from 37.7% in 2017.
54
The table below sets forth information on cost of sales per hectoliter for the periods presented:
|
|
Cost of Sales per Hectoliter | ||
|
|
2018 |
2017 |
% Change |
|
|
(in R$, except percentages) | ||
|
Latin America North |
109.6 |
100.6 |
9.0% |
|
Brazil |
98.6 |
93.0 |
6.1% |
|
Beer Brazil |
105.7 |
98.4 |
7.4% |
|
NAB |
75.5 |
76.3 |
(1.1)% |
|
CAC |
194.5 |
166.7 |
16.7% |
|
Latin America South |
125.7 |
121.0 |
3.8% |
|
Canada |
242.9 |
195.8 |
24.1% |
|
Total |
121.4 |
110.8 |
9.6% |
Latin America North Operations
Brazilian Operations
Total cost of sales for our Brazilian operations increased by 1.4% in 2018, to R$10,024.8 million from R$9,889.5 million in 2017. On a per hectoliter basis, our Brazilian operations’ cost of sales increased by 6.1% in 2018, to R$98.6 from R$93.0 in 2017.
Cost of sales for our Brazilian beer operations increased by 4.2% in 2018, to R$8,222.9 million from R$7,895.1 million in 2017, mainly explained by (1) an increase in hedged commodities prices on the purchase of raw materials, especially aluminum in 2017, impacting costs in 2018, and (2) the appreciation of the real in 2017, impacting our costs in 2018. The impact of fluctuations of the local currency against the dollar and of commodity prices are typically postponed to the subsequent period as our policy is to hedge operational transactions reasonably expected to occur within a designated period of approximately 12 months from the current month. On a per hectoliter basis, cost of sales for our Brazilian beer operations increased by 7.4%, to R$105.7 in 2018 from R$98.4 in 2017, mainly as result of the same factors.
Cost of sales for our Brazilian NAB segment decreased by 9.7% in 2018, to R$1,801.9 million from R$1,994.4 million in 2017, mainly due to (1) decreased costs associated with lower sales volumes, and (2) a favorable impact resulting from hedged commodities prices and the foreign exchange, for the same reasons described above in relation to our hedging policy for our Brazilian beer operations in 2017, specifically related to lower sugar prices in 2017 and the appreciation of the real in 2017. The cost of sales per hectoliter decreased by 1.1% in 2018, totaling R$75.5 from R$76.3 in 2017, mainly as result of the same factors.
CAC Operations
Cost of sales for our CAC operations increased by 25.2% in 2018, to R$2,560.2 million from R$2,045.6 million in 2017 in line with the corresponding increase in our net sales over the same period, due mainly to (1) increased costs associated with higher sales volumes, (2) increased temporary costs to supply the Panamanian market with no disruption, as our current infrastructure in Panama was unable to support the strong sales volume growth since 2017 leading to production capacity restraints in the country, and (3) the currency translation impact due to the strengthening of local currencies, primarily the peso, in the Dominican Republic, and the dollar, in Panama, in relation to the real during the period. On a per hectoliter basis, our cost of sales per hectoliter for our CAC operations increased by 16.7% in 2018, to R$194.5 from R$166.7 in 2017, mainly as a result of the same factors.
Latin America South Operations
Cost of sales for our Latin America South operations increased by 3.6% in 2018, to R$4,629.7 million in 2018 from R$4,122.6 million in 2017 mainly due to higher inflation in Argentina in 2018 and higher commodities prices, especially aluminum in 2017, impacting our costs in 2018. Such impacts were partially offset by (1) the positive impact of currency translation reflecting the depreciation of the Argentine peso over the period, and (2) the positive impact of the application of hyperinflation accounting in Argentina. On a per hectoliter basis, our cost of sales for our Latin America South operations increased by 3.8% in 2018, to R$125.7 from R$121.0 in 2017, mainly as a result of the same factors.
55
Canada Operations
Cost of sales for our Canadian operations increased by 21.7% in 2018, to R$2,415.0 million from R$1,984.2 million in 2017, mainly due to (1) the negative impact of currency translation reflecting the strengthening of the Canadian dollar in relation to real over the period, (2) an increase in hedged commodity prices, especially aluminum in 2017, impacting costs in 2018, which was partially offset by a 1.9% decrease in sales volume over the period. Cost of goods sold per hectoliter increased by 24.1% in 2018, to R$242.9 in 2018 from R$195.8 in 2017, mainly as a result of the same factors.
Gross Profit
As a result of the foregoing, gross profit increased by 3.7% in 2018, to R$30,961.7 million from R$29,857.5 million in 2017. The table below sets forth the contribution of each business segment to our consolidated gross profit:
|
|
Gross Profit | |||||
|
|
2018 |
2017 | ||||
|
|
Amount |
% of Total |
Margin |
Amount |
% of Total |
Margin |
|
|
(in R$ million, except percentages) | |||||
|
Latin America North |
20,043.2 |
64.7% |
61% |
19,151.0 |
64.1% |
62% |
|
Brazil |
16,789.4 |
54.2% |
63% |
16,463.6 |
55.1% |
62% |
|
Beer Brazil |
14,785.6 |
47.8% |
64% |
14,614.3 |
48.9% |
65% |
|
NAB |
2,003.9 |
6.5% |
53% |
1,849.3 |
6.2% |
48% |
|
CAC |
3,253.8 |
10.5% |
56% |
2,687.4 |
9.0% |
57% |
|
Latin America South |
6,484.2 |
20.9% |
60% |
6,647.2 |
22.3% |
62% |
|
Canada |
4,434.3 |
14.3% |
65% |
4,059.4 |
13.6% |
67% |
|
Total |
30,961.7 |
100.0% |
62% |
29,857.5 |
100.0% |
62% |
Sales, Marketing, Distribution and Administrative Expenses
Our sales, marketing, distribution and administrative expenses increased by 2.0% in 2018, to R$14,833.2 million from R$14,539.3 million in 2017. An analysis of sales and marketing and administrative expenses for each business segment is set forth below.
Latin America North Operations
Brazilian Operations
Total sales, marketing, distribution and administrative expenses in Brazil decreased by 2.4% in 2018, to R$8,269.5 million from R$8,473.4 million in 2017.
Sales, marketing, distribution and administrative expenses for our Brazilian beer operations decreased by 2.9% in 2018, to R$7,173.3 million from R$7,390.9 million in 2017, primarily due to (1) decreased administrative expenses, driven by lower variable compensation accruals, which offset inflation, (2) lower sales and marketing expenses due to efficiency gains, and (3) slightly lower depreciation, which was partially offset by inflation-increases in distribution expenses.
Sales, marketing, distribution and administrative expenses for the NAB segment in Brazil increased by 1.3% in 2018, to R$1,096.2 million from R$1,082.5 million in 2017, mainly due to (1) higher sales and marketing expenses as we continued to invest in our brands, and (2) slightly higher distribution expenses, mainly driven by inflation, which was partially offset by lower depreciation and a decrease in administrative expenses, mainly due to lower variable compensation accruals.
56
CAC Operations
Sales, marketing, distribution and administrative expenses for our CAC operations increased by 10.6% in 2018, to R$1,470.9 million from R$1,330.0 million in 2017, reflecting (1) the corresponding increase in sales volumes, (2) the currency translation effects driven by the appreciation of local currencies, primarily the Dominican peso, and the U.S. dollar, in Panama, in relation to real over the period, and (3) higher distribution expenses, mainly driven by inflation and increased sales volumes, which were partially offset by efficiency gains in sales, marketing and administrative expenses.
Latin America South Operations
Sales, marketing, distribution and administrative expenses for our Latin America South operations increased by 3.8% in 2018, to R$2,577.7 million from R$2,483.7 million in 2017, primarily driven by higher inflation in the region, which was partially offset by the positive currency translation effect resulting from the depreciation of the Argentine peso over the period coupled with the impact from the application of hyperinflation accounting for our Argentine subsidiaries.
Canada Operations
Sales, marketing, distribution and administrative expenses for our Canadian operations increased by 11.7% in 2018, to R$2,515.1 million from R$2,252.2 million in 2017, mainly as a result of a negative currency translation effect resulting from the appreciation of the Canadian Dollar over the period, which more than offset lower sales and marketing and administrative expenses.
Other Operating Income (Expense)
Other net operating income decreased by 22.2% in 2018, to R$947.3 million from R$1,217.3 million in 2017, mainly explained by (1) a decline in government grants related to state VAT long-term tax incentives in Brazil, due to the lower volumes and revenue geographic mix and (2) losses on disposal of property, plant and equipment and intangible assets, as the retroactive application of hyperinflation accounting in Argentina to January 1, 2018 resulted in the restatement of fixed asset values and higher losses on disposal.
Exceptional Items
Exceptional items amounted to a R$86.4 million expense in 2018 compared to a R$108.7 million expense recorded in 2017. The expenses recorded in 2018 were mainly in connection with restructuring costs, primarily linked to sizing projects in Brazil, with blueprint review due to optimization of Full Time Equivalent (FTE), such as the closing of distribution centers, and with centralization and sizing projects in Latin America South, in the context of the agreement with ABI to transfer to Quilmes the brewery of Cerveceria Argentina Sociedad Anonima Isenbeck, an Argentinean subsidiary of ABI. See “Item 7. Major Shareholders and Related Party Transactions—B. Related Party Transactions— Ambev and ABI - Quilmes Perpetual Licensing Agreement.”
Income from Operations
As a result of the foregoing, income from operations increased by 3.4% in 2018, to R$16,989.4 million from R$16,426.8 million in 2017.
Net Finance Cost
Our net finance cost increased by 9.4% in 2018, to R$3,823.4 million from R$3,493.9 million in 2017. This result is mainly explained by (1) higher losses on derivative instruments mainly driven by the carry cost of our currency hedges, primarily linked to the exposure of our cost of goods sold in Brazil and Argentina and by non-cash expenses related to negative results of equity swaps, and (2) losses on non-derivative monetary financial instruments related to non-cash expenses due to exchange rate variation on intercompany loans held in local currency, mainly Brazilian reais and the Argentine peso.
The above effects were partially offset by (1) a positive impact resulting from the application of hyperinflationary accounting as prescribed by IAS 29, since the effect of the adjustment for cumulative inflation, from January 1, 2018, of non-monetary assets on the balance sheet of our operatons in Argentine was reported in a dedicated account in the finance results, and (2) lower interest expenses and higher interest income, as our total year-end indebtedness decreased by R$130.3 million in 2018, while our cash and cash equivalents less bank overdrafts and current investment securities increased by R$1,112.3 million in 2018.
57
Income Tax Expense
Our consolidated income tax and social contribution on profits totaled R$1,789.6 million in 2018 from R$5,079.3 million in 2017. The effective tax rate in 2018 was 13.6%, compared to 39.3% in the previous year. Such decrease in our effective tax rate in 2018 was primarily due to the non-recurring impact observed in 2017, related to our participation in the Brazilian Federal Tax Regularization Program (PERT), which involved payment of tax contingencies that were under dispute on favorable terms, including contingencies related to corporate income tax, with no corresponding impact in 2018.
Net Income
As a result of the foregoing, net income increased by 44.9% in 2018, to R$11,377.4 million from R$7,850.5 million in 2017.
Year Ended December 31, 2017 Compared to Year Ended December 31, 2016
In the periods discussed below, we conducted our operations through three business segments as follows:
|
· |
Latin America North, which includes our operations in Brazil, where we operate two divisions (the beer sales division and the NAB sales division), and our CAC operations, which includes our operations in the Dominican Republic, Saint Vincent, Antigua, Dominica, Cuba, Guatemala (which also serves El Salvador, Honduras and Nicaragua), Barbados and beginning on December 31, 2016, Panama. |
|
· |
Latin America South, which includes our operations in Argentina, Bolivia, Paraguay, Uruguay, Chile, and until December 31, 2016, Colombia, Ecuador and Peru. |
|
· |
Canada, represented by Labatt’s operations, which includes domestic sales in Canada and some exports to the U.S. market. |
The table below sets forth certain of our operating highlights for the years presented:
|
|
Consolidated Financial Highlights | ||
|
|
2017 |
2016 |
% Change |
|
|
(in R$ million, except volume amounts, | ||
|
Sales volume—’000 hectoliters |
162,829.4 |
159,821.6 |
1.9% |
|
Net sales |
47,899.3 |
45,602.6 |
5.0% |
|
Net revenue per hectoliter—R$/hl |
294.2 |
285.3 |
3.1% |
|
Cost of sales |
(18,041.8) |
(16,678.0) |
8.2% |
|
Gross profit |
29,857.5 |
28,924.6 |
3.2% |
|
Gross margin (%) |
62% |
63% |
|
|
Sales, marketing and distribution expenses |
(11,915.5) |
(12,010.5) |
(0.8%) |
|
Administrative expenses |
(2,623.8) |
(2,166.1) |
21.1% |
|
Other operating income/(expenses) |
1,217.3 |
1,223.1 |
(0.5%) |
|
Exceptional items |
(108.7) |
1,134.3 |
(109.6%) |
|
Income from operations |
16,426.8 |
17,105.4 |
(4.0%) |
|
Operating margin (%) |
34% |
38% |
|
|
Net income |
7,850.5 |
13,083.4 |
(40.0%) |
|
Net margin (%) |
16% |
29% |
|
58
Margin Analysis
The following table sets forth certain line items of our income statement expressed as percentages of net sales for the years ended December 31, 2017 and 2016:
|
|
Year Ended December 31, | |
|
|
2017 |
2016 |
|
|
(%) |
(%) |
|
Net sales |
100.0 |
100.0 |
|
Cost of sales |
(37.7) |
(36.6) |
|
Gross profit |
62.3 |
63.4 |
|
Sales, marketing and distribution expenses |
(24.9) |
(26.3) |
|
Administrative expenses |
(5.5) |
(4.7) |
|
Other operating income/(expenses) |
2.5 |
2.7 |
|
Exceptional items |
(0.2) |
2.5 |
|
Income from operations |
34.3 |
37.5 |
Selected Financial Data by Business Segment
The following table sets forth selected financial data by business segment, and business operations of Latin America North, for the years ended December 31, 2017 and 2016:
|
|
Year Ended December 31, | |||||||||
|
|
2017 |
2016 | ||||||||
|
|
Brazil(1) |
CAC(1) |
LAS |
Canada |
Total |
Brazil(1) |
CAC(1) |
LAS |
Canada |
Total |
|
|
(in R$ million) | |||||||||
|
Net sales |
26,353.0 |
4,733.0 |
10,769.7 |
6,043.5 |
47,899.3 |
24,954.6 |
3,973.2 |
10,212.9 |
6,461.9 |
45,602.6 |
|
Cost of sales |
(9,889.5) |
(2,045.6) |
(4,122.6) |
(1,984.2) |
(18,041.8) |
(9,071.8) |
(1,798.6) |
(3,685.4) |
(2,122.2) |
(16,678.0) |
|
Gross profit |
16,463.6 |
2,687.4 |
6,647.2 |
4,059.4 |
29,857.5 |
15,882.8 |
2,174.6 |
6,527.5 |
4,339.7 |
28,924.6 |
|
Sales, marketing, distribution and administrative expenses |
(8,473.4) |
(1,330.0) |
(2,483.7) |
(2,252.2) |
(14,539.3) |
(8,084.5) |
(1,038.3) |
(2,697.4) |
(2,356.4) |
(14,176.6) |
|
Other operating income/ (expenses) |
1,092.7 |
77.8 |
41.2 |
5.6 |
1,217.3 |
1,274.1 |
9.6 |
(39.0) |
(21.6) |
1,223.1 |
|
Exceptional items |
(33.0) |
(23.1) |
(41.3) |
(11.3) |
(108.7) |
1,196.7 |
(13.5) |
(41.5) |
(7.4) |
1,134.3 |
|
Income from operations |
9,049.9 |
1,412.1 |
4,163.3 |
1,801.5 |
16,426.8 |
10,269.1 |
1,132.4 |
3,749.6 |
1,954.3 |
17,105.4 |
(1) The Latin America North business segment is comprised of Brazil and CAC.
Net Sales
Net sales increased by 5.0% in 2017, to R$47,899.3 million from R$45,602.6 million in 2016, as shown in tables set forth below:
|
|
Net Sales | ||||
|
|
2017 |
2016 |
| ||
|
|
Sales |
% of Total |
Sales |
% of Total |
% Change |
|
|
(in R$ million, except percentages) | ||||
|
Latin America North |
31,086.0 |
64.9% |
28,927.8 |
63.4% |
7.5% |
|
Brazil |
26,353.0 |
55.0% |
24,954.6 |
54.7% |
5.6% |
|
Beer Brazil |
22,509.3 |
47.0% |
21,173.1 |
46.4% |
6.3% |
|
NAB |
3,843.7 |
8.0% |
3,781.5 |
8.3% |
1.6% |
|
CAC |
4,733.0 |
9.9% |
3,973.2 |
8.7% |
19.1% |
|
Latin America South |
10,769.7 |
22.5% |
10,212.9 |
22.4% |
5.5% |
|
Canada |
6,043.5 |
12.6% |
6,461.9 |
14.2% |
(6.5%) |
|
Total |
47,899.3 |
100.0% |
45,602.6 |
100.0% |
5.0% |
59
|
|
Sales Volumes | ||||
|
|
2017 |
2016 |
| ||
|
|
Volume |
% of Total |
Volume |
% of Total |
% Change |
|
|
(in thousands of hectoliters, except percentages) | ||||
|
Latin America North |
118,631.8 |
72.9% |
116,623.7 |
73.0% |
1.7% |
|
Brazil |
106,360.0 |
65.3% |
106,961.4 |
66.9% |
(0.6%) |
|
Beer Brazil |
80,233.6 |
49.3% |
79,670.1 |
49.8% |
0.7% |
|
NAB |
26,126.4 |
16.0% |
27,291.3 |
17.1% |
(4.3%) |
|
CAC |
12,271.8 |
7.5% |
9,671.3 |
6.1% |
26.9% |
|
Latin America South |
34,062.0 |
20.9% |
32,934.5 |
20.6% |
3.4% |
|
Canada |
10,135.7 |
6.2% |
10,254.5 |
6.4% |
(1.2%) |
|
Total |
162,829.4 |
100.0 |
159,821.6 |
100.0% |
1.9% |
|
|
Net Revenue per Hectoliter | ||
|
|
2017 |
2016 |
% Change |
|
|
(in R$, except percentages) | ||
|
Latin America North |
262.0 |
248.0 |
5.6% |
|
Brazil |
247.8 |
233.3 |
6.2% |
|
Beer Brazil |
280.5 |
265.8 |
5.5% |
|
NAB |
147.1 |
138.6 |
6.1% |
|
CAC |
385.7 |
410.8 |
(6.1%) |
|
Latin America South |
316.2 |
310.1 |
2.0% |
|
Canada |
596.3 |
630.2 |
(5.4%) |
|
Total |
294.2 |
285.3 |
3.1% |
Latin America North Operations
Brazilian Operations
Total net sales from our Brazilian operations increased by 5.6% in 2017, to R$26,353.0 million from R$24,954.6 million in 2016.
Our net sales of beer in Brazil increased by 6.3% in 2017, to R$22,509.3 million from R$21,173.1 million in 2016 mainly as a consequence of a 5.5% increase in net revenue per hectoliter in 2017, reaching R$280.5 that year, coupled with a 0.7% increase in sales volume. The increase in net revenue per hectoliter in 2017 resulted mainly from our revenue management initiatives, negatively impacted by a less favorable product mix. Although our sales volume increased in 2017, the Brazilian beer industry was slightly negative, mainly due to the continuing impact of the adverse macroeconomic environment and the retraction in domestic consumption, particularly in the first half of the year.
Our net sales of NAB in Brazil increased by 1.6% in 2017, to R$3,843.7 million from R$3,781.5 million in 2016, mainly due to a 6.1% increase in net revenue per hectoliter, reaching R$147.1 in 2017, mainly as a result of our revenue management initiatives. This increase was partially offset by 4.3% decrease in sales volume mainly driven by the adverse macroeconomic environment that led to a retraction in domestic consumption.
CAC Operations
Net sales from our CAC operations increased by 19.1% in 2017, to R$4,733.0 million from R$3,973.2 million in 2016, mainly driven by a 26.9% increase in sales volume, reflecting mainly the benefits from our December 2016 transaction with ABI pursuant to which we acquired SAB’s Panama operations, partially offset by lower net revenue per hectoliter. Net revenue per hectoliter contracted by 6.1% in 2017, reaching R$385.7 that year, as our revenue management initiatives were negatively impacted by currency translation due to the depreciation of local currencies, primarily the Dominican peso in relation to the real during the period.
60
Latin America South Operations
Net sales from our Latin America South operations increased by 5.5% in 2017, to R$10,769.7 million from R$10,212.9 million in 2016 mainly due to a 3.4% increase in volume sold, which was primarily driven by an improvement of macroeconomic conditions in Argentina that had a positive impact on consumption in this country coupled with strong performance in other key markets in the region, such as in Paraguay, led by the successful implementation of the 340ml returnable glass bottle strategy, and in Uruguay, due to execution improvements and favorable weather. In addition, net revenue per hectoliter increased by 2.0% in 2017, reaching R$316.2 that year, as our revenue management initiatives were largely impacted by the negative currency translation due to the weakening of the Argentine peso over the period.
Canada Operations
Net sales from our Canadian operations decreased by 6.5% in 2017, to R$6,043.5 million from R$6,461.9 million in 2016. This result was mainly due to (1) the 1.2% volume reduction, reflecting the overall contraction of the Canadian beer industry driven by unfavorable weather during that year and (2) the 5.4% decrease in net revenues per hectoliter, at R$596.3 in 2017, as our focused revenue management initiatives and favorable product mix with increased participation of premium and craft brands was fully offset by the negative impact from currency translation reflecting the depreciation of the Canadian dollar relative to the real over the period.
Cost of Sales
Cost of sales increased by 8.2% in 2017, to R$18,041.8 million from R$16,678.0 million in 2016. As a percentage of our net sales, total cost of sales increased to 37.7% in 2017 from 36.6% in 2016.
The table below sets forth information on cost of sales per hectoliter for the periods presented:
|
|
Cost of Sales per Hectoliter | ||
|
|
2017 |
2016 |
% Change |
|
|
(in R$, except percentages) | ||
|
Latin America North |
100.6 |
93.2 |
7.9% |
|
Brazil |
93.0 |
84.8 |
9.6% |
|
Beer Brazil |
98.4 |
92.1 |
6.8% |
|
NAB |
76.3 |
63.5 |
20.3% |
|
CAC |
166.7 |
186.0 |
(10.4%) |
|
Latin America South |
121.0 |
111.9 |
8.2% |
|
Canada |
195.8 |
206.9 |
(5.4%) |
|
Total |
110.8 |
104.4 |
6.2% |
Latin America North Operations
Brazilian Operations
Total cost of sales for our Brazilian operations increased by 9.0% in 2017, to R$9,889.5 million from R$9,071.8 million in 2016. On a per hectoliter basis, our Brazilian operations’ cost of sales increased by 9.6% in 2017, to R$93.0 from R$84.8 in 2016.
Cost of sales for our Brazilian beer operations increased by 7.6% in 2017, to R$7,895.1 million from R$7,339.9 million in 2016, mainly explained by the devaluation of the real in 2016, which impacted our costs in 2017, especially in the first half of the year, as the impact of fluctuations on our currency hedges are typically postponed to the subsequent period, partially offset by the cost-saving benefits derived from the greater mix of returnable glass bottles in our product portfolio together with procurement savings and our commodities hedges. On a per hectoliter basis, cost of sales for our Brazilian beer operations increased by 6.8%, to R$98.4 in 2017 from R$92.1 in 2016, mainly as result of the same factors.
61
Cost of sales for our Brazilian NAB segment increased by 15.2% in 2017, to R$1,994.4 million from R$1,731.9 million in 2016, mainly due to (1) an increase in foreign exchange hedges for the same reasons described above in relation to our Brazilian beer operations in 2017, (2) higher sugar prices, increasing by almost 50% in the second half of the year, (3) lower dilution of fixed costs and (4) a negative mix, which were all partially offset by procurement savings. The cost of sales per hectoliter increased by 20.3% in 2017, totaling R$76.3 from R$63.5 in 2016, mainly as a result of the same factors.
CAC Operations
Cost of sales for our CAC operations increased by 13.7% in 2017, to R$2,045.6 million from R$1,798.6 million in 2016. Such result was below the corresponding increase of sales volumes in the region over the same period as the increased costs for certain raw materials and packaging costs mainly due to inflation were offset by the positive currency translation impact due to the weakening of local currencies, primarily the Dominican peso, in relation to the real over the period. On a per hectoliter basis, our cost of sales per hectoliter for our CAC operations decreased by 10.4% in 2017, to R$166.7 from R$186.0 in 2016, mainly as a result of the same factors.
Latin America South Operations
Cost of sales for our Latin America South operations increased by 11.9% in 2017, to R$4,122.6 million in 2017 from R$3,685.4 million in 2016 mainly due to (1) higher inflation in Argentina, driving up costs, and (2) unfavorable foreign exchange transactional impacts as a result of our costs denominated in U.S. dollars, which was partially offset by the positive impact of currency translation reflecting the depreciation of the Argentine peso over the period together with benefits derived from our commodities hedges and procurement initiatives. On a per hectoliter basis, our cost of sales for our Latin America South operations increased by 8.2% in 2017, to R$121.0 from R$111.9 in 2016, mainly as a result of the same factors.
Canada Operations
Cost of sales for our Canadian operations decreased by 6.5% in 2017, to R$1,984.2 million from R$2,122.2 million in 2016, mainly due to (1) the corresponding decrease in sales volume over the period and (2) a positive impact of currency translation reflecting the weakening of the Canadian dollar in relation to real that were partially offset by a negative product mix and increased costs of certain raw materials and packaging mainly due to inflation. Cost of goods sold per hectoliter decreased by 5.4% in 2017, to R$195.8 in 2017 from R$206.9 in 2016, mainly as a result of the same factors.
Gross Profit
As a result of the foregoing, gross profit increased by 3.2% in 2017, to R$29,857.5 million from R$28,924.6 million in 2016. The table below sets forth the contribution of each business segment to our consolidated gross profit:
|
|
Gross Profit | |||||
|
|
2017 |
2016 | ||||
|
|
Amount |
% of Total |
Margin |
Amount |
% of Total |
Margin |
|
|
(in R$ million, except percentages) | |||||
|
Latin America North |
19,151.0 |
64.1% |
62% |
18,057.4 |
62.4% |
62.4% |
|
Brazil |
16,463.6 |
55.1% |
62% |
15,882.8 |
54.9% |
63.6% |
|
Beer Brazil |
14,614.3 |
48.9% |
65% |
13,833.2 |
47.8% |
65.3% |
|
NAB |
1,849.3 |
6.2% |
48% |
2,049.6 |
7.1% |
54.2% |
|
CAC |
2,687.4 |
9.0% |
57% |
2,174.6 |
7.5% |
54.7% |
|
Latin America South |
6,647.2 |
22.3% |
62% |
6,527.5 |
22.6% |
63.9% |
|
Canada |
4,059.4 |
13.6% |
67% |
4,339.7 |
15.0% |
67.2% |
|
Total |
29,857.5 |
100.0% |
62% |
28,924.6 |
100.0% |
63.4% |
62
Sales, Marketing, Distribution and Administrative Expenses
Our sales, marketing, distribution and administrative expenses increased by 2.6% in 2017, to R$14,539.3 million from R$14,176.6 million in 2016. An analysis of sales and marketing and administrative expenses for each business segment is set forth below.
Latin America North Operations
Brazilian Operations
Total sales, marketing, distribution and administrative expenses in Brazil increased by 4.8% in 2017, to R$8,473.4 million from R$8,084.5 million in 2016.
Sales, marketing, distribution and administrative expenses for our Brazilian beer operations increased by 4.2% in 2017, to R$7,390.9 million from R$7,095.9 million in 2016. The principal drivers for the increase in these expenses for our Brazilian beer operations were (1) higher administrative expenses that, along with inflation, were driven by variable compensation accruals, (2) an increase in distribution costs, mainly driven by inflation and the increased weight of returnable glass bottles in the off-trade channel direct distribution, and (3) higher depreciation. These were partially offset by lower sales and marketing expenses due to efficiency gains.
Sales, marketing, distribution and administrative expenses for the NAB segment in Brazil increased by 9.5% in 2017, to R$1,082.5 million from R$988.6 million in 2016, mainly due to (1) higher sales and marketing expenses as we continued to invest behind our brands, (2) an increase in administrative expenses, mainly due to variable compensation accruals and (3) higher distribution expenses, mainly driven by inflation, which were partially offset by lower depreciation.
CAC Operations
Sales, marketing, distribution and administrative expenses for our CAC operations increased by 28.1% in 2017, to R$1,330.0 million from R$1,038.3 million in 2016, reflecting the corresponding increase in sales volumes and the commencement of our operations in Panama, which were partially offset by (1) the currency translation effects driven by the depreciation of the Dominican peso in relation to real over the period and (2) efficiency gains in sales, marketing and administrative expenses.
Latin America South Operations
Sales, marketing, distribution and administrative expenses for our Latin America South operations decreased by 7.9% in 2017, to R$2,483.7 million from R$2,697.4 million in 2016, primarily driven by positive currency translation effect resulting from the depreciation of the Argentine peso over the period, that more than offset the higher inflation in the region.
Canada Operations
Sales, marketing, distribution and administrative expenses for our Canadian operations decreased by 4.4% in 2017, to R$2,252.2 million from R$2,356.4 million in 2016, mainly as a result of (1) a positive currency translation effect resulting from the depreciation of the Canadian Dollar over the period, and (2) lower sales and marketing expenses that more than offset the increase in distribution and administrative expenses, impacted by inflation and higher depreciation.
Other Operating Income (Expense)
Other net operating income decreased by 0.5% in 2017, to R$1,217.3 million from R$1,223.1 million in 2016, mainly explained by a decline in government grants related to state VAT long-term tax incentives in Brazil that were down year over year, due to the expiration of some VAT government grants’ agreements in the last quarter of 2016.
63
Exceptional Items
Exceptional items amounted to a R$108.7 million expense in 2017 compared to a R$1,134.3 million profit recorded in 2016. Such decrease is explained mainly by gains on stocks swap recorded in the last quarter of 2016 as a result of the agreement with ABI, pursuant to which we transferred to ABI our businesses in Colombia, Peru and Ecuador, in exchange for SAB’s Panamanian business. The expenses recorded in 2017 were mainly in connection with restructuring costs, primarily linked to centralization and sizing projects in Brazil and Latin America South and the start of our operations in Panama. See “Item 4. Information on the Company—A. History and Development of the Company—Recent Acquisitions, Divestments and Strategic Alliances.”
Income from Operations
As a result of the foregoing, income from operations decreased by 4.0% in 2017, to R$16,426.8 million from R$17,105.4 million in 2016.
Net Finance Cost
Our net finance cost decreased by 5.6% in 2017, to R$3,493.9 million from R$3,702.0 million in 2016. This result is mainly explained by lower losses on derivative instruments mainly driven by the carry cost of our currency hedges, primarily linked to the exposure of our cost of goods sold in Brazil and Argentina, which were partially offset by exceptional financial expenses in the amount of R$976.8 million, of which (1) R$835.7 million was related to foreign exchange translation losses on intragroup loans that were historically reported in equity and were recycled to profit and loss account, upon the reimbursement of these loans and (2) R$141.0 million was recorded in connection with our participation in the Brazilian Federal Tax Regularization Program (PERT).
Our total year-end indebtedness decreased by R$2,843.3 million in 2017, while our cash and cash equivalents less bank overdrafts and current investment securities increased by R$2,475.9 million in that year.
Income Tax Expense
Our consolidated income tax and social contribution on profits totaled R$5,079.3 million in 2017 from R$315.0 million in 2016. The effective tax rate in 2017 was 39.3%, compared to 2.4% in the previous year. Such increase in our effective tax rate in 2017 was primarily due to a tough comparable in 2016, lower accrued benefits from interest on shareholders’ equity and R$3,294.7 million exceptional losses on tax adjustments of which: (1) R$2,784.7 million is linked to the Brazilian Federal Tax Regularization Program (PERT) adhered by the Company on September 29, 2017, which involved tax contingencies that were under dispute, including contingencies related to corporate income tax, and (2) R$510.0 million due to the tax effects on foreign exchange variation related to intragroup loans, as aforementioned under “—Net Finance Cost” above.
Net Income
As a result of the foregoing, net income decreased by 40% in 2017, to R$7,850.5 million from R$13,083.4 million in 2016.
B. Liquidity and Capital Resources
Sources and Uses
The information in this section refers to 2018 and 2017. Our primary sources of liquidity have historically been cash flows from operating activities and borrowings. Our material cash requirements have included the following:
· debt service;
· capital expenditures;
· payments of dividends and interest on shareholders’ equity;
64
· increases in ownership of our consolidated subsidiaries or companies in which we have equity investments; and
· investments in companies participating in the brewing, NAB and malting industries.
Our cash and cash equivalents and current investment securities at December 31, 2018 and 2017 were R$11,476.9 million and R$10,366.4 million, respectively.
We believe that cash flows from operating activities, available cash and cash equivalents and current investment securities, along with our derivative instruments and our access to borrowing facilities, will be sufficient to fund our capital expenditures, debt service and dividend payments going forward.
Cash Flows
Operating Activities
Cash flows from our operating activities increased by 0.2% in 2018, to R$17,911.2 million from R$17,874.1 million in 2017, mainly as a result of (1) a 4.9% increase in net sales, partially offset by a 5.8% increase in cost of sales (excluding depreciation and amortization) and a growth of 1.5% in sales, marketing, distribution and administrative expenses (excluding depreciation and amortization) that led us to improved operational results, (2) a worsening in the variation of working capital during 2018, which decreased by R$11.3 million in 2018 and (3) a significant decrease in income taxes paid.
Investing Activities
Cash flows used in our investing activities increased by 19.6% in 2018, to R$3,675.7 million from R$3,073.0 million in 2017, mainly explained by the higher level of capital expenditures in property, plant and equipment and intangible assets reflecting mainly our investments in new production lines for premium products in Brazil and in capacity expansion in Chile over the period, coupled with investments in debt securities (sovereign fixed income securities).
Financing Activities
Cash flows used in our financing activities increased by 2.8% in 2018, to R$13,221.6 million from R$12,864.1 million cash outflow in 2017, mainly driven by the acquisition of non-controlling shareholders, as a result of the partial exercise of a put option in connection with Tenedora by E. León Jimenes, S.A. See “Item 7. Major Shareholders and Related Party Transactions—B. Related Party Transactions—Ambev and Certain Shareholders (E. León Jimenes, S.A. or ELJ).” This was partially offset by higher proceeds from borrowings and lower outflows related to cash net of finance costs other than interests.
The table below shows the profile of our debt instruments:
|
|
Maturity Schedule of Debt Portfolio as of December 31, 2018 | ||||||
|
Debt Instrument |
2019 |
2020 |
2021 |
2022 |
2023 |
Thereafter |
Total |
|
|
(in R$ million, except percentages) | ||||||
|
BNDES Currency Basket Debt Floating Rate: |
|
|
|
|
|
|
|
|
Currency Basket Debt Floating Rate |
- |
- |
- |
- |
- |
- |
- |
|
UMBNDES + Average Pay Rate |
- |
- |
- |
- |
- |
- |
- |
|
International Debt: |
|
|
|
|
|
|
|
|
Other Latin America Currency Floating Rate |
- |
- |
- |
- |
- |
- |
- |
|
Average Pay Rate |
- |
- |
- |
- |
- |
- |
- |
|
Other Latin America Currency Fixed Rate |
11.5 |
- |
212.1 |
- |
- |
- |
223.5 |
|
Average Pay Rate |
7.6% |
- |
10.1% |
- |
- |
- |
10.0% |
|
US$ Fixed Rate |
32.4 |
2.2 |
- |
7.8 |
- |
- |
42.4 |
|
Average Pay Rate |
4.6% |
2.2% |
- |
4.3% |
- |
- |
4.4% |
|
US$ Floating Rate |
538.8 |
91.2 |
- |
- |
- |
- |
630.0 |
|
Average Pay Rate |
3.3% |
5.1% |
- |
- |
- |
- |
3.6% |
|
CAD Floating Rate |
743.9 |
2.8 |
2.9 |
1.8 |
1.8 |
- |
753.2 |
|
Average Pay Rate |
2.4% |
2.8% |
2.8% |
2.8% |
2.8% |
- |
2.4% |
|
Reais Denominated Debt Floating Rate – TJLP & TR: |
|
|
|
|
|
|
|
|
Notional Amount |
75.3 |
9.7 |
10.1 |
10.8 |
11.8 |
120.0 |
237.7 |
|
TJLP & TR + Average Pay Rate |
9.1% |
9.3% |
9.3% |
9.3% |
9.3% |
9.3% |
9.1% |
|
Reais Debt – ICMS Fixed Rate: |
|
|
|
|
|
|
|
|
Notional Amount |
37.2 |
38.0 |
22.7 |
5.4 |
2.8 |
22.4 |
128.5 |
|
Average Pay Rate |
5.8% |
5.8% |
5.8% |
5.8% |
5.8% |
5.8% |
5.8% |
|
Reais Debt – Fixed Rate: |
|
|
|
|
|
|
|
|
Notional Amount |
121.5 |
56.1 |
149.6 |
43.5 |
35.7 |
1.2 |
407.6 |
|
Average Pay Rate |
7.0% |
7.5% |
8.6% |
4.0% |
4.0% |
5.6% |
7.0% |
|
Total Debt |
1,560.6 |
199.9 |
397.3 |
69.3 |
52.0 |
143.6 |
2,422.8 |
65
Borrowings
Most of our borrowings are for general use, based upon strategic capital structure considerations. Although seasonal factors affect the business, they have little effect on our borrowing requirements. We accrue interest based on different interest rates, the most significant of which are: (1) fixed, for the 2021 debentures; (2) Long-Term Interest Rate (Taxa de Juros de Longo Prazo), or the TJLP, for loans of the Brazilian Economic and Social Development Bank (Banco Nacional de Desenvolvimento Economico e Social), or the BNDES; (3) the Interest Rate Benchmark (Taxa Referencial), or TR, for Bank Credit Notes (Cédula de Crédito Bancário) and (4) floating for international loans. For further information, see note 22 of our audited consolidated financial statements.
The following table sets forth our net cash consolidated position as of December 31, 2018 and 2017:
|
|
Net Cash Consolidated Position | |||||
|
|
2018 |
2017 | ||||
|
|
LC(1) |
FC(2) |
Total |
LC(1) |
FC(2) |
Total |
|
|
(in R$ million) | |||||
|
Short-term debt |
(234.1) |
(1,326.6) |
(1,560.6) |
(351.4) |
(969.7) |
(1,321.1) |
|
Long-term debt |
(539.6) |
(322.5) |
(862.1) |
(733.5) |
(498.4) |
(1,231.9) |
|
Total |
(773.7) |
(1,649.1) |
2,422.8 |
(1,084.9) |
(1,468.1) |
(2,553.0) |
|
Cash and cash equivalents (net of bank overdrafts) |
|
|
11,463.5 |
|
|
10,352.7 |
|
Investment securities |
|
|
13.4 |
|
|
11.9 |
|
Net cash position |
|
|
9,054.1 |
|
|
7,811.6 |
(1) LC refers to our local currency indebtedness.
(2) FC refers to our foreign currency indebtedness.
Short-term Debt
As of December 31, 2018, our short-term debt totaled R$1,560.6 million, 85.0% of which was denominated in foreign currencies. As of December 31, 2017, our short-term debt totaled R$1,321.1 million, 73% of which was denominated in foreign currencies.
66
Long-term Debt
As of December 31, 2018, our long-term debt, excluding the current portion of long-term debt, totaled R$862.1 million, of which R$539.6 million was denominated in local currency. As of December 31, 2017, our long-term debt, excluding the current portion of long-term debt, totaled R$1,231.9 million, of which R$733.5 million was denominated in local currency.
The table below shows a breakdown of our long-term debt by year:
|
|
As of December 31, 2018 |
|
Long-term Debt Maturity in: |
(in R$ million) |
|
2020 |
199.9 |
|
2021 |
397.3 |
|
2022 and Later |
264.9 |
|
Total |
862.1 |
In accordance with our foreign currency risk management policy, we have entered into forward and cross-currency interest rate swap contracts in order to mitigate currency and interest rate risks. See “Item 11. Quantitative and Qualitative Disclosures About Market Risk” for our policy with respect to mitigating foreign currency and interest rate risks through the use of financial instruments and derivatives.
On October 30, 2015, Ambev issued R$1.0 billion in Brazilian debentures with a maturity date of October 30, 2021, or the 2021 debentures, to qualified investors as defined by applicable CVM regulations. The 2021 debentures bear interest at a rate of 14.476% per annum, payable semi-annually in arrears. This rate is subject to upper or downward adjustments in accordance with upgrades or downgrades to the credit rating of the Company, respectively, as set forth in the respective indenture. The 2021 debentures are unsecured and unsubordinated obligations of Ambev (except for statutorily preferred credits set forth in Brazilian bankruptcy laws). The 2021 debentures are denominated and payable in reais. The net proceeds of the offering were used for capital expenditure investments and, therefore, the 2021 debentures enjoy certain Brazilian federal income tax incentives pursuant to Law No. 12,431/2011.
As of December 31, 2018, our local currency long-term debt borrowings consisted primarily of the 2021 debentures and BNDES debts. Long-term local currency also includes long-term plant expansion and other loans from governmental agencies and special BNDES credit lines and programs, such as the Fund for Financing the Acquisition of Industrial Machinery and Equipment (FINAME) and the Enterprise Financing Program (FINEM).
Secured Debt
Certain loans provided by the BNDES are secured by some of our facilities and some of our equipment (mainly coolers).
Sales Tax Deferrals and Other Tax Credits
Many states in Brazil offer tax benefits programs to attract investments to their regions. We participate in ICMS Value-Added Tax Credit Programs offered by various Brazilian states which provide (1) tax credits to offset ICMS Value-Added Tax payables and (2) ICMS Value-Added Tax deferrals. In return, we are required to meet certain operational requirements including, depending on the state, production volume and employment targets, among others. All of these conditions are included in specific agreements between Ambev and the state governments. In the event that we do not meet the program’s targets, future benefits may be withdrawn. The total amount deferred (financing) as of December 31, 2018 was R$123.4 million with a current portion of R$37.2 million, and R$91.2 million as non-current. Percentages deferred typically range from 60% to 80% over the life of the program. Balances deferred generally accrue interest and are partially inflation indexed, with adjustments generally set at 60% to 80% of a general price index. The grants (tax waivers) are received over the lives of the respective programs. In the years ended December 31, 2018 and 2017, we recorded R$1,746.5 million and R$1,869.4 million, respectively, of tax credits as gains on tax incentive programs.
67
Capital Investment Program
In 2018, consolidated capital expenditures on property, plant and equipment and intangible assets totaled R$3,571.0 million consisting of R$2,312.4 million for our Latin America North business segment, R$1,040.8 million related to investments in our Latin America South operations and R$217.8 million related to investments in Canada. These expenditures primarily included investments in capacity expansion, quality controls, automation, modernization and replacement of packaging lines, innovations, warehousing for direct distribution, coolers, expenditures for the replacement of bottles and crates, market assets from former dealers, and continued investments in information technology.
In 2017, consolidated capital expenditures on property, plant and equipment and intangible assets totaled R$3,203.7 million consisting of R$1,859.7 million for our Latin America North business segment, R$1,051.2 million related to investments in our Latin America South operations and R$292.8 million related to investments in Canada. These expenditures primarily included investments in capacity expansion, quality controls, automation, modernization and replacement of packaging lines, innovations, warehousing for direct distribution, coolers, expenditures for the replacement of bottles and crates, market assets from former dealers, and continued investments in information technology.
C. Research and Development
We maintain an innovation, research and development center in the city of Rio de Janeiro, State of Rio de Janeiro, at the Universidade Federal do Rio de Janeiro (UFRJ). This new center (ZITEC – Zone Innovation and Technology Center) replaces the previous R&D structure based in Guarulhos. ZITEC commenced operations in the final months of 2017, ramping up activities in 2018, in order to accelerate product innovation by developing new liquids and the most modern packaging to assure continuous product differentiation and yearly increases in quality and efficiency. One of the main features of the development center is the prototype laboratory, which enables the creation of complete prototypes, supporting the process of creating new products. ZITEC made it possible for Ambev to launch a series of innovations in 2018. Another objective of the development center is to carry out studies of consumer perception and behavior, in order to capture future trends. The investment made in the center in the last three years was approximately R$182 million, including the installation, in 2018, of solar panels that produce enough energy to supply 100% of the center's operations.
D. Trend Information
For detailed information regarding the latest trends in our business, see “—A. Operating Results—Year Ended December 31, 2018 Compared to Year Ended December 31, 2017” and “Item 4. Information on the Company—B. Business Overview—Description of the Markets Where We Operate.”
E. Off-balance Sheet Arrangements
We have a number of off-balance sheet items which have been disclosed elsewhere in this annual report, under “Item 4. Information on the Company—B. Business Overview—Beer and CSD Production Process—Sources and Availability of Raw Materials,” under “Item 4. Information on the Company—B. Business Overview—Beer and CSD Production Process—Packaging” and under “Item 17. Financial Statements,” note 29 to our consolidated financial statements, “Collateral and contractual commitments with suppliers, advances from customers and other.” Off-balance sheet items include future commitments of R$12,078.6 million as of December 31, 2018, as set forth in the table below:
|
Contractual Obligation |
As of December 31, 2018 |
|
|
(in R$ million) |
|
Purchase commitments with respect to property, plant and equipment |
142.9 |
|
Purchase commitments with respect to raw materials |
1,319.6 |
|
Purchase commitments with respect to packaging materials |
9,696.8 |
|
Other commitments |
919.4 |
|
Total |
12,078.6 |
68
We also have operating leasing agreements for vehicles, warehouses, commercial rooms and industrial equipment. The total lease liability already discounted to present value is R$1,670.2 million as of December 31, 2018. For further information, see note 28 of our audited consolidated financial statements.
F. Commitments and Contingencies (Tabular Disclosure of Contractual Obligations)
The following table and discussion provide additional disclosure regarding our material contractual obligations and commercial commitments as of December 31, 2018:
|
|
Payments Due by Period | ||||
|
Contractual Obligations* |
Total |
Less Than |
1-3 Years |
3-5 Years |
More Than |
|
|
(in R$ million) | ||||
|
Short-term and long-term debt** |
2,709.8 |
1,659.7 |
256.2 |
454.4 |
339.6 |
|
Finance leasing liabilities |
22.2 |
22.2 |
- |
- |
- |
|
Trade and other payables |
18,547.0 |
15,017.1 |
623.4 |
281.4 |
2,625.2 |
|
Sales tax deferrals |
848.7 |
154.7 |
180.8 |
210.3 |
302.9 |
|
Total contractual cash commitments |
22,127.8 |
16,853.7 |
1,060.4 |
946.1 |
3,267.6 |
* Contractual obligations referred to in the table above do not include tax payments to be made by the Company, except payments made in connection with tax benefits.
** The long-term debt amounts presented above differ from the amounts presented in the financial statements in that they include our best estimates on future interest payable (not yet accrued) in order to better reflect our future cash flow position. Long-term debt amounts presented above also include other unsecured debts.
The above table does not reflect contractual commitments discussed above in “Off-Balance Sheet Arrangements.”
We are subject to numerous commitments and contingencies with respect to tax, labor, distributors and other claims. To the extent that we believe it is probable that these contingencies will be realized, they have been recorded in the balance sheet. We have estimated the total exposures of possible (but not probable) losses, which are not recorded as liabilities, to be R$72,055.0 million as of December 31, 2018. These are not considered commitments. Our estimates are based on reasonable assumptions and management assessments, but should the worst case scenario develop, subjecting us to losses in all cases, our expected net impact on the income statement would be an expense for this amount.
69
ITEM 6. DIRECTORS, SENIOR MANAGEMENT AND EMPLOYEES
A. Directors and Senior Management
The Board of Directors oversees Ambev’s executive officers. The Board of Directors is currently comprised of eleven effective members and two alternate members, and provides the overall strategic direction of Ambev. Directors are elected at general shareholders’ meetings for a three-year term, re-election being permitted. Day-to-day management is delegated to the executive officers of Ambev, of which there are currently eleven. The Board of Directors appoints executive officers for a three-year term, re-election being permitted. The Ambev Shareholders’ Agreement regulates the election of directors of Ambev by the controlling shareholders. See “Item 7. Major Shareholders and Related Party Transactions—A. Major Shareholders—Ambev’s Major Shareholders—Ambev Shareholders’ Agreement—Management of Ambev.”
Directors
The following table sets forth information with respect to the current directors of Ambev:
|
Board of Directors(1) | ||||
|
Name |
Age |
Position |
Director Since(2) |
Term Expires(3) |
|
Victorio Carlos De Marchi |
80 |
Co-Chairman and Director |
1999 |
2020 |
|
Carlos Alves de Brito |
58 |
Co-Chairman and Director |
2006 |
2020 |
|
Milton Seligman |
67 |
Director |
1999 |
2020 |
|
Roberto Moses Thompson Motta |
61 |
Director |
2008 |
2020 |
|
José Heitor Attilio Gracioso |
87 |
Director |
1999 |
2020 |
|
Vicente Falconi Campos |
78 |
Director |
1999 |
2020 |
|
Luis Felipe Pedreira Dutra Leite |
53 |
Director |
2005 |
2020 |
|
Cecília Sicupira(4) |
37 |
Director |
2017 |
2020 |
|
Nelson José Jamel |
46 |
Director |
2017 |
2020 |
|
Antonio Carlos Augusto Ribeiro Bonchristiano |
51 |
Director (Independent) |
2014 |
2020 |
|
Marcos de Barros Lisboa |
54 |
Director (Independent) |
2014 |
2020 |
|
Michel Dimitrios Doukeris |
45 |
Director (Alternate) |
2015 |
2020 |
|
Carlos Eduardo Klutzenschell Lisboa |
49 |
Director (Alternate) |
2018 |
2020 |
(1) Victorio Carlos De Marchi, Co-Chairman of the Board of Directors of Ambev, was appointed by FAHZ, the former controlling shareholder of Antarctica, while Carlos Alves de Brito was appointed by ABI and is also the Chief Executive Officer of ABI. ABI appointed six directors: Milton Seligman, Roberto Moses Thompson Motta, Luis Felipe Pedreira Dutra Leite, Vicente Falconi Campos, Nelson José Jamel and Cecília Sicupira in addition to the alternate directors Michel Dimitrios Doukeris and Carlos Eduardo Klutzenschell Lisboa. FAHZ also appointed José Heitor Attílio Gracioso. The two independent directors Antonio Carlos Augusto Ribeiro Bonchristiano and Marcos de Barros Lisboa were appointed jointly by ABI and FAHZ.
(2) Directors first elected to our board of directors prior to 2013 were originally appointed as directors of Old Ambev. Directors first elected to our board of directors on or after 2013 were originally elected as directors of Ambev S.A.
(3) Annual Shareholders’ General Meeting to be held in 2020.
(4) Cecilia Sicupira is the daughter of Carlos Alberto da Veiga Sicupira, one of our indirect controlling shareholders.
The following are brief biographies of each of Ambev’s directors:
Victorio Carlos De Marchi. Mr. De Marchi is Co-Chairman of the Board of Directors of Ambev. Mr. De Marchi joined Antarctica in 1961 and held various positions during his tenure, including Chief Executive Officer from 1998 to April 2000. Mr. De Marchi is currently a member of the board of directors of FAHZ, the president of the deliberative council of Instituto Ambev de Previdência Privada, a member of the board of Instituto de Estudos para o Desenvolvimento Industrial, the president of the executive committee of Cerveceros Latinoamericanos Association, the president of the board of directors of Instituto Brasileiro de Ética Concorrencial, the president of the deliberative council of Centro de Informações sobre Saúde e Alcool, and the vice president of Associação Brasileira de Indústria da Cerveja. Mr. De Marchi has a degree in economics from Faculdade de Economia, Finanças e Administração de São Paulo and a law degree from Faculdade de Direito de São Bernardo do Campo. His principal business address is Rua Dr. Renato Paes de Barros, 1017, 4th floor, São Paulo, SP, Brazil.
70
Carlos Alves de Brito. Mr. Brito is Co-Chairman of the Board of Directors of Ambev. He has also served, since December 2005, as Chief Executive Officer of ABI. He joined Brahma in 1989 and has held various management positions during his tenure. He served as Chief Operating Officer of Ambev from 1999 to 2003, as Chief Executive Officer for Latin America in 2004 and as Chief Executive Officer for North America in 2005. Mr. Brito holds a degree in mechanical engineering from the Universidade Federal do Rio de Janeiro and an MBA from Stanford University. His principal business address is Brouwerijplein 1, 3000, Leuven, Belgium.
Milton Seligman. Mr. Seligman is a member of the Board of Directors of Ambev. He served as Corporate Affairs Officer of the Company from 2004 until 2013 (previously Old Ambev) and was also a member of the Board of Directors of Tenedora from 2013 to 2016. He is currently the managing partner of Milton Seligman e Associados Consultoria e Participações Ltda., president of the board of directors of Instituto Sonho Grande, consultant member of Fundação Brava, consultant member of Fundação Lemann, and a member of the board of directors of FAHZ. Mr. Seligman has a degree in engineering from Universidade Federal de Santa Maria. His principal business address is Rua Dr. Renato Paes de Barros, 1017, 4th floor, São Paulo, SP, Brazil.
Roberto Moses Thompson Motta. Mr. Thompson is a member of the Board of Directors of Ambev. He is also a board member of ABI and Lojas Americanas S.A., São Carlos Empreendimentos e Participações S.A., Restaurant Brands International, and 3G Capital (private equity entity formed by the indirect controlling shareholders of the Company). He holds a degree in engineering from Pontifícia Universidade Católica do Rio de Janeiro, and an MBA from the Wharton School of the University of Pennsylvania. His principal business address is 600 Third Avenue, 37th floor, New York, NY, USA.
José Heitor Attílio Gracioso. Mr. Gracioso is a member of the Board of Directors of Ambev. Mr. Gracioso joined Antarctica in 1946 and held various positions during his tenure. In 1994, Mr. Gracioso was elected to Antarctica’s Board of Directors and, in 1999, he was elected Chairman of the Board of Directors, a position held until April 2000. He holds a degree in marketing from Escola Superior de Propaganda de São Paulo, a degree in business administration from Fundação Getulio Vargas and a degree in law from Faculdade de Direito de São Bernardo do Campo. His principal business address is Av. Brig. Faria Lima, 3900, 11th floor, São Paulo, SP, Brazil.
Vicente Falconi Campos. Mr. Campos is a member of the Board of Directors of Ambev. He is also a member of the Institutional Council of Instituto de Desenvolvimento Gerencial. Mr. Campos is also a consultant for the Brazilian government and Brazilian and multinational companies such as Grupo Gerdau, Grupo Votorantim and Mercedes-Benz. He is currently the president of the board of the Instituto Social para Motivar, Apoiar e Reconhecer Talentos, a member of the consultant board of FAHZ, and a member of the board of directors of BRF S.A. He holds a degree in Mining and Metal Engineering from Universidade Federal de Minas Gerais, and M.Sc. and Ph.D. degrees from the Colorado School of Mines. His principal business address is Rua Senador Milton Campos, 35, 7th floor, Nova Lima, MG, Brazil.
Luis Felipe Pedreira Dutra Leite. Mr. Dutra is a member of the Board of Directors of Ambev. He has also served, since January 2005, as Chief Financial Officer of ABI. He joined Brahma in 1990 and has held numerous positions during his tenure, including that of Chief Financial Officer and Investor Relations Officer of Ambev. Mr. Dutra holds a degree in economics from Universidade Cândido Mendes and an MBA in financial management from Universidade de São Paulo. His principal business address is Brouwerijplein 1, 3000, Leuven, Belgium.
Cecília Sicupira. Ms. Sicupira is a member of the Board of Directors of Ambev. Currently, she is an alternate member of the Board of Directors of São Carlos Empreendimentos e Participações S.A., a member of the Board of Directors of S-BR Global Investments Ltd., S-Velame Administração de Recursos e Participações S.A. (a holding company which holds an ownership interest in ABI), a member of the Board of Directors of Lojas Americanas S.A., and a member of the Board of Directors of Restaurants Brands International Inc. Ms. Sicupira holds a degree in International Business Administration from the American University of Paris and attended the Harvard Business School’s Management Program. Her principal business address is Rua Dr. Renato Paes de Barros, 1017, 15th floor, São Paulo, SP, Brazil.
71
Nelson José Jamel. Mr. Jamel is a member of the Board of Directors of Ambev. From 2007 to 2008, he held the position of Vice President of Finance for Western Europe of ABI. He was also Chief Financial Officer of Compañia Cervecera AmBev Dominicana, C. por A.. From 2009 to 2015, he held the position of Chief Financial and Investor Relations Officer of the Company (previously Old Ambev). Currently he is Chief Financial Officer of the North America Zone of Anheuser-Busch InBev N.V/S.A. Mr. Jamel holds a degree in production engineering from Universidade Federal do Rio de Janeiro from the Coordenação dos Programas de Pós-Graduação e Pesquisa de Engenharia. His principal business address is Brouwerijplein 1, 3000 Leuven, Belgium.
Antonio Carlos Augusto Ribeiro Bonchristiano. Mr. Bonchristiano is an independent member of the Board of Directors of Ambev. He has also acted as a member of the Board of Directors of several companies, including Apen Ltd./GP Advisors Zurich, GP Investments and Fundação Estudar. Mr. Bonchristiano has a degree in politics, philosophy and economics from the University of Oxford. His principal business address is Avenida Brig. Faria Lima, 3900, 7th floor, São Paulo, SP, Brazil.
Marcos de Barros Lisboa. Mr. Barros Lisboa is an independent member of the Board of Directors of Ambev. He has also acted as Executive Officer of Unibanco S/A and Vice-President of Operational Insurance, Controls and Support of Itaú Unibanco S/A, both companies with main activities in the financial segment. Further, between 2003 and 2005, he acted as Secretary of Economic Politics of Federal Revenue Office (Ministério da Fazenda). He is currently member of the board of directors of Natura S.A. and Mercedes-Benz do Brasil Ltda. Mr. Barros Lisboa has a degree and a masters in economics from Universidade Federal do Rio de Janeiro and a Ph.D. in economics from the University of Pennsylvania. Since the end of the 80s, he has developed activities in the faculty of several teaching institutions in Brazil and abroad. His principal business address is Rua Quatá, 300, São Paulo, SP, Brazil.
Michel Dimitrios Doukeris. Mr. Doukeris is an alternate member of the Board of Directors of Ambev. Since he joined the company in 1996, he held various positions, including Global Chief Sales Officer of ABI and Operations General Manager for the APAC Zone (Asia Pacific) of ABI. Currently he is also Chief Executive Officer for the North America Zone at ABI. Mr. Doukeris holds a degree in chemical engineering from Universidade Federal Santa Catarina and a master’s degree in marketing from Fundação Getulio Vargas. He has also completed post-graduate programs in marketing and marketing strategy from the Kellogg School of Management and Wharton Business School in the United States. His principal business address is Rua Dr. Renato Paes de Barros, 1017, 4th floor, São Paulo, SP, Brazil.
Carlos Eduardo Klutzenschell Lisboa. Mr. Klutzenschell Lisboa is an alternate member of the Board of Directors of Ambev. He joined Ambev in 1993 and has since then held several positions in the company. He served as Marketing Vice-President between 2005 and 2011, as President of BU Austral at Latin America South Zone between 2011 and 2012, and as President of Labatt, our operation in Canada, between 2013 and 2014. From 2014 to 2016, Mr. Klutzenschell Lisboa held the position of Global Vice President for Global Brands at ABI. Currently he serves as Zone President of Latin America South. His principal business address is Rua Dr. Renato Paes de Barros, 1017, 15th floor, São Paulo, SP, Brazil.
Executive Officers
The following table sets forth information with respect to the current executive officers of Ambev:
|
Name |
Age |
Position |
Executive Officer Since |
Term Expires(1) |
|
Bernardo Pinto Paiva |
50 |
Chief Executive Officer |
2015 |
2021 |
|
Fernando Mommensohn Tennenbaum |
42 |
Chief Financial and Investor Relations Officer |
2018 |
2021 |
|
Leticia Rudge Barbosa Kina(2) |
42 |
Chief Legal Officer |
2019 |
2021 |
|
Ricardo Morais Pereira de Melo |
47 |
Chief People Officer |
2016 |
2021 |
|
Eduardo Braga Cavalcanti de Lacerda |
42 |
Chief Soft Drinks Officer |
2017 |
2021 |
|
Mauricio Nogueira Soufen |
45 |
Chief Industrial Officer |
2016 |
2021 |
|
Paulo Zagman(2) |
42 |
Chief Logistics Officer |
2019 |
2021 |
|
Ricardo Gonçalves Melo(2) |
48 |
Chief Corporate Affairs and Compliance Officer |
2019 |
2021 |
|
Jean Jereissati(2) |
44 |
Chief Sales and Marketing Officer |
2019 |
2021 |
|
Fernando Maffessoni |
41 |
Chief of Shared Services and Information Technology Officer |
2018 |
2021 |
|
Rodrigo Figueiredo de Souza |
43 |
Chief Procurement Officer |
2015 |
2021 |
(1) The term of office will be unified until December 31, 2021.
(2) The term as an officer of Leticia Rudge Barbosa Kina, Ricardo Gonçalves Melo, Paulo Zagman and Jean Jereissati will commence on January 1, 2019 and, accordingly, they were not officers as of December 31, 2018.
72
The following are brief biographies of each of Ambev’s executive officers:
Bernardo Pinto Paiva. Mr. Pinto Paiva is Ambev’s Chief Executive Officer. He joined Ambev in 1991 as a management trainee and during his career at our company has held leadership positions in Sales, Supply, Distribution and Finance. He was appointed Zone President North America in January 2008, Zone President Latin America South in January 2009 and Chief Sales Officer of ABI in January 2012. He holds a degree in engineering from Universidade Federal do Rio de Janeiro and an Executive MBA from Pontifícia Universidade Católica do Rio de Janeiro. His principal business address is Rua Dr. Renato Paes de Barros, 1017, 4th floor, São Paulo, SP, Brazil.
Fernando Mommensohn Tennenbaum. Mr. Tennenbaum is Ambev’s Chief Financial and Investor Relations Officer. He joined the Company in 2004 and has held the positions of Investors Relation Officer, M&A Officer, Treasury Officer of the Company and ABI's Global Treasury Officer. Mr. Tennenbaum holds a degree in production engineering from Escola Politécnica de São Paulo, in addition to a corporate MBA from Ambev. His principal business address is Rua Dr. Renato Paes de Barros, 1017, 4th floor, São Paulo, SP, Brazil.
Leticia Rudge Barbosa Kina. Ms. Kina is Ambev’s Chief Legal Officer. She joined the Company in 2004 and has held several positions, including Legal Manager, Tax and Litigation Director and Legal Director. She holds a law degree from Pontifícia Universidade Católica de Campinas and a degree in economics from Universidade Estadual de Campinas, in addition to a Corporate MBA from Ambev. Her principal business address is Rua Dr. Renato Paes de Barros, 1017, 4th floor, São Paulo, SP, Brazil.
Ricardo Morais Pereira de Melo. Mr. Melo is Ambev’s Chief People Officer. Since he joined the Company in 1996, Mr. Melo held various sales positions, including Sales Manager, Commercial Manager in Salvador and in São Paulo, Regional Sales Executive Officer in the Northeast and in Rio de Janeiro, as well as Sales Vice-President of Ambev operations in Canada and Sales Strategy Vice-President at Anheuser-Busch InBev, in the United States. He holds a degree in civil engineering from Universidade Católica de Pernambuco and a Corporate MBA from Ambev. His principal business address is Rua Dr. Renato Paes de Barros, 1017, 4th floor, São Paulo, SP, Brazil.
Eduardo Braga Cavalcanti de Lacerda. Mr. Lacerda is Ambev’s Chief Soft Drinks Officer. Since 2001, when he joined the Company as a trainee, he held various positions, including as the Budget and Business Performance Officer of ABI, as head of Mergers and Acquisitions in Europe for ABI, as Financial Officer in Europe for ABI and as Chief Executive Officer of the CAC zone. Mr. Lacerda holds a degree in business administration from Pontifícia Universidade Católica do Rio de Janeiro. His principal business address is Rua Dr. Renato Paes de Barros, 1017, 4th floor, São Paulo, SP, Brazil.
Mauricio Nogueira Soufen. Mr. Soufen is Ambev’s Chief Industrial Officer. Since he joined the Company in 1996 as a Production Supervisor, he held positions of Brewery Manager in Scotia and Belgium, where he was the only foreigner that has led the historical Stella Artois brewery, in Leuven. When Mr. Soufen returned to Brazil, served as Regional Director for the North/Central-West region and Director of our Engineering Center based in Jacareí, State of São Paulo. Along with the title of brewmaster. Mr. Soufen has a degree in mechatronics engineering from Escola Politécnica da Universidade de São Paulo and an MBA from MIT - Sloan School of Management. His principal business address is Rua Dr. Renato Paes de Barros, 1017, 4th floor, São Paulo, SP, Brazil.
73
Paulo Zagman. Mr. Zagman is Ambev’s Chief Logistics Officer. Since 2002, when he joined the Company, he held several positions, including Chief People Officer in Latin America South and Chief Logistics Officer in Latin America South. He has a bachelor degree in civil engineering from Pontifícia Universidade Católica do Rio de Janeiro and an specialist degree in supply chain and logistics from Massachusetts Institute of Technology and Stanford Graduate School of Business Executive Education. His principal business address is Rua Dr. Renato Paes de Barros, 1017, 4th floor, São Paulo, SP, Brazil.
Ricardo Gonçalves Melo. Mr. Gonçalves Melo is Ambev’s Chief Corporate Affairs and Compliance Officer. Since 1991, when he joined the Company, he held several positions, including Tax Manager, Litigation Legal Manager, People Manager – Production and Legal Director. He has a law degree from Universidade do Estado do Rio de Janeiro and an MBA from Coordenação dos Programas de Pós-Graduação e Pesquisa de Engenharia. In addition, he concluded an executive program with the INSEAD-Wharton Alliance. His principal business address is Rua Dr. Renato Paes de Barros, 1017, 4th floor, São Paulo, SP, Brazil.
Jean Jereissati. Mr. Jereissati is Ambev’s Chief Sales and Marketing Officer. He joined Ambev in 2000 and has held various positions, including Chief Executive Officer of the CAC zone, China and Asia and Pacific North. He holds a bachelor degree in business administration from Fundação Getulio Vargas and a Corporate MBA from Ambev. His principal business address is Rua Dr. Renato Paes de Barros, 1017, 4th floor, São Paulo, SP, Brazil.
Fernando Maffessoni. Mr. Maffessoni’s term as Ambev’s Chief of Shared Services and Information Technology Officer. He joined Ambev in 1998 and held various leadership positions in Logistics and Shared Services. Mr. Maffessoni holds a bachelor degree in business administration from Pontifícia Universidade Católica do Rio Grande do Sul and a Corporate MBA from Ambev. His principal business address is Rua Dr. Renato Paes de Barros, 1017, 4th floor, São Paulo, SP, Brazil.
Rodrigo Figueiredo de Souza. Mr. Souza is Ambev’s Procurement Executive Officer. Over the past five years, Mr. Souza held various positions in the Company, including Facility Regional Executive Officer and Logistics Executive Officer in Latin America North. He holds a graduation degree in civil engineering from Politécnica de São Paulo. His principal business address is Rua Dr. Renato Paes de Barros, 1017, 4th floor, São Paulo, SP, Brazil.
B. Compensation
The aggregate remuneration of all members of the Board of Directors and Executive Officers of Ambev in 2018 for services in all capacities amounted to R$56.7 million (fixed and variable remuneration and share-based payment), as presented below:
|
|
Management’s Remuneration | |||||||||||||
|
|
(in R$ million, except where otherwise indicated) | |||||||||||||
|
|
|
Fixed Remuneration |
Variable Remuneration |
|
|
|
| |||||||
|
|
Number of Members |
Fees |
Direct and Indirect Benefits |
Remuneration for Sitting on Committees |
Others |
Bonus |
Profit Sharing |
Remuneration for Attending Meetings |
Commissions |
Others |
Post-Employment Benefits |
Termination Benefits |
Share-based Payment |
Total |
|
Board of Directors |
13.0 |
5.3 |
- |
- |
1.0 |
0.5 |
- |
- |
- |
- |
- |
- |
7.6 |
14.4 |
|
Fiscal Council |
5.6 |
1.5 |
- |
- |
0.3 |
- |
- |
- |
- |
- |
- |
- |
- |
1.8 |
|
Executive Officers |
10.7 |
11.6 |
- |
- |
2.5 |
2.3 |
- |
- |
- |
- |
0.8 |
- |
23.2 |
40.5 |
|
Total |
29.3 |
18.4 |
- |
- |
3.8 |
2.8 |
- |
- |
- |
- |
0.8 |
- |
30.8 |
56.7 |
In addition, the executive officers and members of the Board of Directors received some additional benefits provided to all Ambev S.A. employees and their beneficiaries and covered dependents, such as health and dental care. Such benefits were provided through FAHZ. These executive officers and directors also received benefits pursuant to Ambev’s pension and stock ownership plan. For a description of these plans, see notes 23 and 24 to our audited consolidated financial statements.
On various dates in 2018, pursuant to the terms and conditions of our stock ownership plan, we acquired from our directors and executive officers a total of 656,506 shares of Ambev for R$14.3 million. Such amounts were calculated and paid taking into consideration the closing market price on the day of the transaction.
74
The table below sets forth the minimum, maximum and average individual compensation figures attributable to our directors, executive officers and Fiscal Council members for each of the indicated periods:
|
|
Year Ended December 31, | |||||||||||
|
|
2018 |
2017 |
2016 | |||||||||
|
|
(in R$ million, except where otherwise indicated) | |||||||||||
|
|
Number of Members |
Minimum |
Average |
Maximum |
Number of Members |
Minimum |
Average |
Maximum |
Number of Members |
Minimum |
Average |
Maximum |
|
Board of Directors |
13.0 |
0.5 |
1.7 |
8.7 |
13.0 |
0.4 |
2.2 |
10.3 |
12.0 |
0.4 |
2.0 |
8.3 |
|
Fiscal Council |
5.6 |
0.2 |
0.3 |
0.4 |
6.0 |
0.2 |
0.3 |
0.4 |
6.0 |
0.1 |
0.3 |
0.4 |
|
Executive Officers |
10.7 |
2.1 |
3.8 |
12.2 |
11.0 |
2.5 |
4.8 |
14.1 |
11.0 |
1.2 |
3.6 |
14.9 |
Ambev Stock Ownership Plan
Under the Ambev Stock Option Plan dated as of July 30, 2013, or the Plan, senior employees and management of either Ambev or its direct or indirect subsidiaries are eligible to receive stock options for Ambev common shares, including in the form of ADSs. As of December 31, 2018, there were outstanding rights under the Plan providing for the acquisition of 140.9 million Ambev common shares by approximately 850 people (including executive management and employees).
The Plan establishes the general conditions for granting options, the criteria for defining the strike price and other general terms and conditions of these stock options. Restrictions apply to the divestment of the shares acquired through the Plan, which also defines the various duties and responsibilities of the Board of Directors as Plan Administrator.
Pursuant to the Plan, the Board of Directors is conferred with ample powers for the organization and management of the Plan in compliance with its general terms and conditions. The Board of Directors grants stock options and establishes the terms and conditions applicable to each grant through Stock Option Programs, or the Programs, which may define the relevant beneficiaries, the applicable number of Ambev common shares covered by the grant, the respective strike price, the exercise periods and the deadline for exercising the options, as well as the rules regarding option transfers and possible restrictions on the acquired shares, in addition to penalties. Additionally, targets may be set for Ambev’s performance, with the Board of Directors also being empowered to define specific rules for Ambev employees who are transferred to other countries or to other companies of the group, including to ABI.
Beneficiaries to whom stock options are granted must sign Stock Option Agreements, or the Agreements, with Ambev, according to which those beneficiaries have the option to purchase lots of Ambev common shares in compliance with the terms and conditions of the Plan, the corresponding Program and such Agreement.
There are currently three models of stock options that may be granted under the Plan. Under the first model, beneficiaries, in accordance with their internal category, may choose among allocating (1) 30% or 100%, (2) 40% or 100%, and (3) 60% or 100% of the amounts received by them as profit sharing during the year to the immediate exercise of options, thereby allowing them to acquire the corresponding amount of Ambev shares. Under this model, a substantial part of the shares acquired is to be delivered only within five years from the corresponding option grant date. During such five-year period, the beneficiary must remain employed at Ambev or any other company of its group. Under the second model, the beneficiary may exercise the options granted only after a period of up to five years from the corresponding grant date. Vesting of the options granted under the second model is not subject to company performance measures; however, the right to exercise such options may be forfeited in certain circumstances, including the beneficiary’s resignation or dismissal prior to the options’ vesting. Under the third model, the beneficiaries, in accordance with their internal category, may choose among allocating (1) 30% or 100%, (2) 40% or 100%, and (3) 60% or 100%, of the amounts received by them as profit sharing during the year to the immediate exercise of options, thereby allowing them to acquire the corresponding amount of Ambev shares. The totality of the shares acquired is to be delivered to the beneficiary within forty-five days from the corresponding exercising date (which shall not be later than forty-five days from the option grant date). The beneficiaries are under a five-year lock-up period.
Before our adoption of the three stock options models that we currently grant, as described above, six Programs were approved by the Board of Directors from 2006 to 2009 that allowed their beneficiaries to choose between allocating 50%, 75% or 100% of the amounts received by them as profit sharing during the year to the immediate exercise of options, thereby permitting them to acquire the corresponding amount of Ambev shares. Company performance measures applied in order for those stock options to vest and the right to exercise them could be forfeited in certain circumstances, including the beneficiary’s resignation or dismissal prior to the options’ vesting. Rights for the acquisition of a significant number of Ambev shares under this previous stock option model remain outstanding.
75
As a means of creating a long term incentive (wealth incentive) for certain senior employees and members of management considered as having “high potential,” share appreciation rights in the form of phantom stocks have been granted to those employees, pursuant to which the beneficiary shall receive two separate lots of phantom stock – Lot A and Lot B – subject to lock-up periods of five and ten years, respectively. On the fifth or tenth anniversary of the granting of such lots, as the case may be, a beneficiary still employed with us shall receive, in cash, the amount corresponding to the B3 closing price of the relevant Ambev shares (or NYSE closing price in the case of ADSs), on the trading session immediately preceding such anniversary, with each phantom stock corresponding to one share (or ADS, as the case may be). Such share appreciation rights shall not give the beneficiary the right to actually receive any Ambev shares or ADSs; those securities shall merely serve as basis for the calculation of the cash incentive to be received by such beneficiary. Although not subject to performance measures, the right to receive the cash incentive deriving from the phantom stocks may be forfeited in certain circumstances, including the beneficiary’s resignation or dismissal prior to the relevant anniversary of the share appreciation right.
We implemented a Share Based Payment Plan, or the Share Plan, dated as of April 29, 2016. Under the Share Plan, employees and management of Ambev or its direct or indirect subsidiaries are eligible to receive Ambev shares, including in the form of ADRs. The shares which are subject to the Share Plan are designated as Restricted Shares.
Pursuant to the Share Plan, the Board of Directors is conferred with ample powers for the organization and management of the Share Plan in compliance with its general terms and conditions. The Board of Directors may appoint a committee to assist its members in the management of the Share Plan. The Board of Directors or the committee establishes the terms and conditions applicable to each Share Based Payment Programs, or the Share Plan Programs, which defines the relevant beneficiaries, the applicable number of Restricted Shares subject to the Share Plan Program, the Restricted Shares’ transfer procedure and vesting periods, and any possible penalties.
Under the Share Plan, up to 0.3% of the shares corresponding to Ambev’s corporate capital may be granted in total in an amount that may vary according to Ambev internal policies. The delivery of the Restricted Shares is free of charges. Such Restricted Shares shall vest within up to five years from the corresponding grant date, provided that the beneficiary remains employed at Ambev during such vesting period.
Beneficiaries of the Share Plan must sign a Share Based Payment Agreement, or the Share Based Agreements, with Ambev, according to which, those beneficiaries have the right to receive a maximum number of Ambev Shares or ADRs, as applicable, provided that the terms and conditions set forth in the Share Plan, Share Plan Programs and in the Share Based Agreements are complied with.
The Restricted Shares may entitle beneficiaries to receive additional shares with the same vesting conditions as compensation for dividends and interest on shareholders’ equity paid during the vesting period on the Restricted Shares. The right to receive the Restricted Shares and the additional shares may be totally or partially forfeited in certain circumstances, including the beneficiaries’ resignation or dismissal during the vesting period.
Pursuant to the outstanding programs under the Plan or the Share Plan, following the lock-up or vesting periods, as applicable, in the event beneficiaries intend to sell the Ambev shares or ADRs, beneficiaries must first offer such shares or ADRs to Ambev.
ABI Exceptional Stock Option Grants
To encourage its and its subsidiaries’ employees to help with its deleveraging efforts, ABI granted a series of stock options to its executives, including Ambev executives, that had their vesting subject to, among other things, ABI’s net debt-to-EBITDA ratio falling below 2.5 before December 31, 2013. Such condition had been complied with at that date. Specific forfeiture rules relating to these ABI option grants apply in case of employment termination. Such grants were confirmed on April 28, 2009 by ABI’s annual general shareholders’ meeting. Though the exercise of these ABI exceptional stock options will not cause any dilution to Ambev, we record an expense in connection with them on our income statement.
76
On November 25, 2008, ABI’s board of directors had approved a grant of approximately 28 million of these exceptional stock options to several executives, including approximately 7 million options granted to Ambev executives. Each option gave its beneficiary the right to purchase one existing common share of ABI at an exercise price of EUR 10.32, which corresponded to their fair value at the time of granting of the options. Half of the options had a term of 10 years as from granting and became exercisable on January 1, 2014. The other half had a term of 15 years as from granting and became exercisable on January 1, 2019.
On April 30, 2009, ABI granted another approximate 4.9 million of these stock options to approximately 50 executives of the ABI group, including approximately 1.8 million options granted to Ambev executives. Each option gave its beneficiary the right to purchase one existing common share of ABI at an exercise price of EUR 21.94, which corresponded to their fair value at the time of granting of the options. The options have a term of 10 years as from granting and became exercisable on January 1, 2014.
On December 18, 2009, ABI granted another approximate 1.6 million exceptional stock options to its executives, including approximately 97.8 thousand options granted to Ambev executives. Each option gave its beneficiary the right to purchase one existing common share of ABI at an exercise price of EUR 35.90 and became exercisable on December 18, 2014.
Ambev Pension Plan
Ambev’s pension plans for employees in Brazil are administered by the IAPP. The IAPP operates both a defined benefit pension plan (closed to new participants since May 1998) and a defined contribution plan, which supplements benefits that the Brazilian government’s social security system provides to our employees. The defined contribution plan covers substantially all new employees. The IAPP was established solely for the benefit of our employees and its assets are held independently. The IAPP is managed by a Governing Board (Conselho Deliberativo), which has three members, two of whom are appointed by Ambev, and one member represents active and retired employees. The IAPP also has an Executive Board (Diretoria Executiva) containing three members, all of whom are appointed by IAPP’s Council Board. The IAPP also has a Fiscal Council with three members, two of whom appointed by Ambev and one member represents active and retired employees.
Any employee upon being hired may opt to join the defined contribution plan. When pension plans members leave Ambev before retirement, but having contributed at least three years to the IAPP plan, they have some options such as: (a) having their contributions refunded, (b) transferring their contributions to a bank or insurance company, (c) keeping their investment in IAPP to be paid in installments, and (d) continuing to IAPP for future retirement under the existing terms. In the event the employee leaves the Company prior to completing three years as a participant, such employee will only be entitled to refund his/her contributions to the plan.
As of December 31, 2018, we had 6,965 participants in our pension plans, including 511 participants in the defined benefit plan, 6,454 participants in the defined contribution plan, and 1,084 retired or assisted participants.
Plan assets are comprised mainly of equity securities, government and corporate bonds and real estate properties. All benefits are calculated and paid in inflation-indexed reais.
Labatt provides pension plan benefits in the defined contribution model and in the defined benefit model to its employees, as well as certain post-retirement benefits.
For information on amount recorded by us on December 31, 2018 as liabilities for pension plan benefits, see note 23 to our audited consolidated financial statements, included elsewhere in this annual report on Form 20-F.
Profit-Sharing Plan
Employees’ performance-based variable bonuses are determined on an annual basis taking into account the achievement of corporate, department or business-unit and individual goals, established by the Board of Directors.
77
The distribution of these bonuses is subject to a three-tier system in which Ambev must first achieve performance targets approved by the Board of Directors. Following that, each department or business segment must achieve its respective targets. Finally, individuals must achieve their respective performance targets.
For employees involved in operations, we have a collective award for production sites and distribution centers with outstanding performances. The bonus award at the distribution centers and production sites is based on a ranking between the different distribution centers and production sites (as the case may be), which, based on their relative ranking, may or may not receive the bonus.
We provisioned R$286.0 million under these programs for the year ended December 31, 2018, R$543.2 million for the year ended December 31, 2017 and R$188.0 million for the year ended December 31, 2016.
C. Board Practices
During 2018, our management held individual and group meetings with shareholders, investors and analysts to talk about the performance of our business and our opportunities for growth both in the short-term as well as in the future. We also participated in conferences and non-deal road shows in Brazil, the United States, Europe, Chile and Mexico. We hosted quarterly conference calls, transmitted simultaneously on the Internet, to clarify financial and operating results as well as answered questions from the investment community.
Fiscal Council (Conselho Fiscal)
Ambev’s Fiscal Council is a permanent body. At our annual shareholders’ meeting held on April 27, 2018, the following members of the Fiscal Council were appointed for a term expiring upon the annual general shareholders’ meeting of 2019: James Terence Coulter Wright, José Ronaldo Vilela Rezende and Aldo Luiz Mendes, and, as alternates, Emanuel Sotelino Schifferle, Ary Waddington and Vinicius Balbino Bouhid (the latter of whom serves as alternate only to Aldo Luiz Mendes). Considering James Terence Coulter Wright death on July 9, 2018, Ary Waddington took office as an effective member of the Fiscal Council on July 25, 2018. All of them are “independent” members as per Rule 10A-3(c)(3) of the Sarbanes-Oxley Act of 2002.
The responsibilities of the Fiscal Council include supervision of management, performing analyses and rendering opinions regarding our financial statements and performing other duties in accordance with the Brazilian Corporation Law and its charter. None of the members of the Fiscal Council is also a member of the Board of Directors or of any committee of the Board.
Minority holders representing at least 10% of our common shares are entitled to elect one member and respective alternate to the Fiscal Council without the participation of the controlling shareholders.
We have relied on the exemption provided for under Rule 10A-3(c)(3) of the Sarbanes-Oxley Act of 2002, which enables us to have our Fiscal Council perform the duties of an audit committee for the purposes of such Act, to the extent permitted by Brazilian law. We do not believe that reliance on this exemption would materially adversely affect the ability of our Fiscal Council to act independently and to satisfy the other requirements of such Act.
The Board of Directors
Most of our Board members have been in office for several years and were elected or reelected to the Board of Directors of Ambev at the Company’s extraordinary general shareholders’ meeting held on April 28, 2017 and the Company’s Board meetings held on May 16, 2017, January 11, 2018, May 15, 2018 and August 7, 2018 for a term expiring at the annual general shareholders’ meeting to be held in 2020. These Board members use their extensive knowledge of our business to help ensure that we reach our long-term goals, while maintaining our short-term competitiveness. Another objective of the Board of Directors is to encourage us to pursue our short-term business goals without compromising our long-term sustainable growth, while at the same time trying to make sure that our corporate values are observed.
78
Under our bylaws, at least two members of the Board of Directors shall be independent directors. For the applicable director independence criteria, see “Item 10. Additional Information—B. Memorandum and Articles of Association—Board of Directors.”
Ambev’s Co-Chairmen of the Board of Directors and the Chief Executive Officer are separate positions that must be held by different individuals.
The Board of Directors is supported in its decision-making by the following committees:
Operations, Finance and Compensation Committee
The Operations, Finance and Compensation Committee is the main link between the policies and decisions made by the Board of Directors and Ambev’s management team. The Operations, Finance and Compensation Committee’s responsibilities include:
· to present medium and long-term planning proposals to the Board of Directors;
· to analyze and issue an opinion on the decisions of the Board of Directors regarding the compensation policies for the Board of Directors and Executive Management, including their individual compensation packages, to help ensure that the members of the Board and executive management are being adequately motivated to reach an outstanding performance in consideration for proper compensation;
· to monitor the investors relations strategies and the performance of our rating, as issued by the official rating agencies;
· to monitor the evaluation of the executive officers, senior management and their respective succession plans;
· to analyze, monitor and propose to the Board of Directors suggestions regarding legal, tax and relevant regulatory matters;
· to analyze and monitor our annual investment plan;
· to analyze and monitor growth opportunities;
· to analyze and monitor our capital structure and cash flow; and
· to analyze and monitor the management of our financial risk, as well as budgetary and treasury policy.
The current members of the Committee are Messrs. Victorio Carlos De Marchi (Chairman), Luis Felipe Pedreira Dutra Leite and Roberto Moses Thompson Motta. The members of this committee are elected by the Board of Directors.
Antitrust Compliance and Related Parties Committee
The Antitrust Compliance and Related Parties Committee’s responsibilities are to assist the Board of Directors with the following matters:
· related party transactions;
· any general conflict of interest situations that may arise between the Company and related parties;
· compliance, by the Company, with legal, regulatory and statutory provisions concerning related party transactions;
· compliance, by the Company, with legal, regulatory and statutory provisions concerning antitrust matters; and
79
· other matters the Board of Directors may consider relevant and in the interest of the Company.
The current members of the Antitrust Compliance and Related Parties Committee are Messrs. Victorio Carlos De Marchi (Chairman), José Heitor Attilio Gracioso, Marcos de Barros Lisboa, Bolívar Moura Rocha and Everardo de Almeida Maciel. The members of this committee are elected by the Board of Directors.
Differences Between United States and Brazilian Corporate Governance Practices
In November 2003, the SEC approved corporate governance rules that had been adopted by the NYSE pursuant to the Sarbanes-Oxley Act of 2002. According to those governance rules, foreign private issuers that are listed on the NYSE must disclose the significant differences between their corporate governance practices and those required by the NYSE’s regulations for U.S. companies.
In November 2016, the Brazilian Corporate Governance Code, which provides for corporate governance practices guidelines for publicly-held companies, was released by an institution formed by several entities, such as ABRAPP, ABRASCA, ANBIMA, ABVCAP, AMEC, APIMEC, B3, BRAIN, IBGC, IBRI and Instituto IBMEC, after the contribution and comments made by the CVM. In June 2017, the CVM approved a new rule, which establishes that companies must inform whether they will implement the provisions set forth in the Brazilian Corporate Governance Code, or otherwise justify the reasons for non-compliance with such practices. Our report on the Brazilian Code of Corporate Governance, prepared in accordance with such rules, is available on our website at ir.ambev.com.br. Additionally, the B3 and the IBGC-Brazilian Institute of Corporate Governance have issued guidelines for corporate governance best practices.
The principal differences between the NYSE corporate governance standards and our corporate governance practices are as follows:
Independence of Directors and Independence Tests
NYSE corporate governance standards require listed companies to have a majority of independent directors and set forth the principles by which a listed company can determine whether a director is independent. “Controlled companies,” such as Ambev, need not to comply with these requirements. Nonetheless, our bylaws require that at least two of our directors be independent. In addition, our bylaws set forth that directors elected by a separate ballot vote of minority shareholders holding at least 10% of our capital stock shall be deemed independent.
As of the date of this annual report on Form 20-F, all of our directors, including the independent ones, had been appointed by our controlling shareholders.
The Brazilian Corporation Law and the CVM establish rules in relation to certain qualification requirements and restrictions, compensation, duties and responsibilities of a company’s officers and directors.
Executive Sessions
NYSE corporate governance standards require non-management directors of a listed company to meet at regularly scheduled executive sessions without management.
According to the Brazilian Corporation Law, up to one-third of the members of the Board of Directors can also hold executive officer positions. However, none of our directors holds an executive officer position in us at this time and, accordingly, we believe we would be in compliance with this NYSE corporate governance standard if we were a U.S. company.
Nominating/Corporate Governance and Compensation Committees
NYSE corporate governance standards require that a listed company have a nominating/corporate governance committee and a compensation committee each composed entirely of independent directors with a written charter that addresses certain duties. “Controlled companies” such as Ambev need not to comply with this requirement.
80
In addition, we are not required under the Brazilian Corporation Law to have, and accordingly we do not have, a nominating committee or corporate governance committee. According to the Brazilian Corporation Law, Board committees may not have any specific authority or mandate since the exclusive duties of the full Board of Directors may not be delegated. The role of the corporate governance committee is generally performed by either our Board of Directors or our executive officers.
Audit Committee and Audit Committee Additional Requirements
NYSE corporate governance standards require that a listed company have an audit committee composed of a minimum of three independent members that satisfy the independence requirements of Rule 10A-3 under the Exchange Act, with a written charter that addresses certain duties.
We maintain a permanent Fiscal Council, which is a body contemplated by the Brazilian Corporation Law that operates independently from our management and from our registered independent public accounting firm. Its principal function is to examine the annual and quarterly financial statements and provide a formal report to our shareholders. We are relying on the exemption provided by Rule 10A-3(c)(3) and believe that our reliance on this exemption will not materially affect the ability of the Fiscal Council to act independently and to satisfy the other requirements of Rule 10A-3.
Shareholder Approval of Equity Compensation Plans
NYSE corporate governance standards require that shareholders of a listed company must be given the opportunity to vote on all equity compensation plans and material revisions thereto, subject to certain exceptions.
Under Brazilian Corporation Law, shareholder pre-approval is required for the adoption and revision of any equity compensation plans. Our existing stock ownership and share based payment plans were approved by our extraordinary general shareholders’ meetings held on July 30, 2013 and on April 29, 2016, respectively.
Corporate Governance Guidelines
NYSE corporate governance standards require that a listed company must adopt and disclose corporate governance guidelines that address certain minimum specified standards, which include, director qualification standards, director responsibilities, director access to management and independent advisors, director compensation, director orientation and continuing education, management succession and annual performance evaluation of the Board.
We believe the corporate governance guidelines applicable to us under the Brazilian Corporation Law are consistent with the guidelines established by the NYSE. We have adopted and observe our Manual on Disclosure and Use of Information and Policies for Trading with Securities issued by Ambev which deals with the public disclosure of all relevant information as per CVM’s guidelines, as well as with rules relating to transactions involving the dealing by our management and controlling shareholders in our securities.
Code of Business Conduct
NYSE corporate governance standards require that a listed company must adopt and disclose a code of business conduct and ethics for directors, officers and employees and promptly disclose any waivers of the code for directors or officers. Each code of business conduct and ethics should address the following matters: (1) conflicts of interest; (2) corporate opportunities; (3) confidentiality; (4) fair dealing; (5) protection and proper use of company assets; (6) compliance with laws, rules and regulations (including insider trading laws); and (7) encouraging the reporting of any illegal or unethical behavior.
We have adopted a Code of Business Conduct that applies to all directors, officers and employees. Our code of business conduct is available on our website at ir.ambev.com.br. The information included on our website or that might be accessed through our website is not included in this annual report and is not incorporated into this annual report by reference. There are no waivers to our Code of Business Conduct.
81
Certification Requirements
NYSE corporate governance standards require that each listed company’s chief executive officer certify to the NYSE each year that he or she is not aware of any violation by the company of the NYSE corporate governance standards.
As required by Section 303A.12(b) of the NYSE corporate governance standards, our Chief Executive Officer will promptly notify the NYSE in writing after our executive officer becomes aware of any material non-compliance with any applicable provisions of the NYSE corporate governance standards.
D. Employees
As of December 31, 2018, we and our subsidiaries had a total of 49,617 employees, approximately 52% of whom were engaged in production, 41% in sales and distribution and 8% in administration.
The following table sets forth the total number of our employees as of the end of the periods indicated:
|
As of December 31, | ||
|
2018 |
2017 |
2016 |
|
49,617 |
51,432 |
53,250 |
The following table shows the geographical distribution of our employees as of December 31, 2017:
|
Geographical Distribution of Ambev Employees as of December 31, 2018 | |
|
Location |
Number of Employees |
|
Latin America North |
36,643 |
|
Brazil |
29,873 |
|
Dominican Republic |
3,895 |
|
Cuba |
827 |
|
Guatemala |
208 |
|
Panama |
1,840 |
|
Latin America South |
9,511 |
|
Argentina |
5,954 |
|
Bolivia |
1,789 |
|
Uruguay |
755 |
|
Paraguay |
562 |
|
Chile |
451 |
|
Canada |
3,463 |
|
Total |
49,617 |
Industrial Relations
All of our employees in Brazil are represented by labor unions, but only less than 5% of our employees in Brazil are actually members of labor unions. The number of administrative and distribution employees who are members of labor unions is not significant. Salary negotiations are conducted annually between the workers’ unions and us. Collective bargaining agreements are negotiated separately for each facility or distribution center. Our Brazilian collective bargaining agreements have a one- or two-year term, and we usually enter into new collective bargaining agreements on or prior to the expiration of the existing agreements. We conduct salary negotiations with labor unions in accordance with local law for our employees located in our CAC, Latin America South and Canadian operations.
Health and Severance Benefits
In addition to wages, our employees receive additional benefits. Some of these benefits are mandatory under Brazilian law, some are provided for in collective bargaining agreements and others are voluntarily granted. The benefits packages of our employees in Brazil consist of benefits provided both directly by the Company and through FAHZ, which provides medical, dental, educational and social assistance to current and retired employees of Ambev and their beneficiaries and covered dependents, either for free or at a reduced cost. We may voluntarily contribute up to 10% of our consolidated net income towards the support of FAHZ in connection with these benefits, as determined pursuant to the Brazilian Corporation Law and our bylaws.
82
We are required to contribute 8% of each Brazilian employee’s monthly gross pay to an account maintained in the employee’s name with the Brazilian government’s Severance Indemnity Fund (Fundo de Garantia por Tempo de Serviço), or the FGTS. Under Brazilian law, we are also required to pay termination benefits to Brazilian employees dismissed without cause equal to 40% (plus 10% to the Brazilian government) of the accumulated contributions made by us to the terminated employee’s FGTS account throughout the employee’s period of service, among other mandatory termination fees.
We provide health and benefits in accordance with local law for our employees located in our CAC, Latin America South and Canadian operations.
E. Share Ownership
The following table shows the amount and percentage of our shares held by members of our Board of Directors and by executive officers as of March 8, 2019:
|
Name |
Amount and Percentage of Common Shares |
|
Victorio Carlos De Marchi(1) |
* |
|
Carlos Alves de Brito |
* |
|
Milton Seligman |
* |
|
Roberto Moses Thompson Motta |
* |
|
José Heitor Attílio Gracioso(1) |
* |
|
Vicente Falconi Campos |
* |
|
Luis Felipe Pedreira Dutra Leite |
* |
|
Cecília Sicupira |
* |
|
Nelson José Jamel |
* |
|
Antonio Carlos Augusto Ribeiro Bonchristiano |
* |
|
Marcos de Barros Lisboa |
* |
|
Michel Dimitrios Doukeris |
* |
|
Carlos Eduardo Klutzenschell Lisboa |
* |
|
Bernardo Pinto Paiva(1) |
* |
|
Fernando Mommensohn Tennenbaum |
* |
|
Leticia Rudge Barbosa Kina(2) |
* |
|
Mauricio Soufen |
* |
|
Ricardo Morais Pereira de Melo |
* |
|
Jean Jereissati(2) |
* |
|
Ricardo Gonçalves Melo(2) |
* |
|
Eduardo Braga Cavalcante de Lacerda |
* |
|
Paulo Zagman(2) |
* |
|
Fernando Maffessoni |
* |
|
Rodrigo Figueiredo de Souza |
* |
* Indicates that the individual holds less than 1% of the class of securities.
(1) These Board members are also trustees of FAHZ. For information regarding the shareholdings of FAHZ in Ambev, see “Item 7. Major Shareholders and Related Party Transactions—A. Major Shareholders—Ambev’s Major Shareholders.”
(2) The term as an officer of Leticia Rudge Barbosa Kina, Ricardo Gonçalves Melo, Paulo Zagman and Jean Jereissati will commence on January 1, 2019 and, accordingly, they were not officers as of December 31, 2018.
83
ITEM 7. MAJOR SHAREHOLDERS AND RELATED PARTY TRANSACTIONS
A. Major Shareholders
Introduction
Ambev has only one class of shares (i.e, voting common shares), including in the form of ADSs (evidenced by ADRs), with each ADS representing one Ambev common share. The Ambev common shares and ADSs are registered under the Exchange Act. As of March 8, 2019, Ambev had 15,721,673,649 shares outstanding. As of March 8, 2019, there were 1,237,191,072 Ambev ADSs outstanding (representing 1,237,191,072 Ambev shares, which corresponds to 7.9% of the total Ambev shares outstanding). The Ambev shares held in the form of ADSs under the Ambev ADS facilities are deemed to be the shares held in the “host country” (i.e, the United States) for purposes of the Exchange Act. In addition, as of March 8, 2019, there were 126 registered holders of Ambev ADSs.
On December 21, 2017, our board of directors authorized us or our subsidiaries to enter into equity swap transactions, or Equity Swap Agreements, with an exposure of up to 44 million common shares (which may be, partially or totally, referenced in ADRs), limited to R$820 million. Such Equity Swap Agreements have to be liquidated within 18 months from our board of directors’ approval. On May 15, 2018, our board of directors authorized us or our subsidiaries to enter into new equity swap transactions, or First New Swap Agreements, without prejudice of the regular liquidation of the Equity Swap Agreements still in force. The First New Swap Agreements have to be liquidated within 18 months from our board of directors’ approval and may cause an exposure of up to 80 million common shares (which may be, partially or totally, referenced in ADRs), limited to R$1.8 billion. In addition, on December 20, 2018, our board of directors authorized us or our subsidiaries to enter into additional equity swap transactions, or Second New Swap Agreements, without prejudice of the regular liquidation of the existing Equity Swap Agreements and First New Swap Agreements still in force. The Second New Swap Agreements have to be liquidated within 18 months from our board of directors’ approval and may cause an exposure of up to 80 million common shares (which may be, partially or totally, referenced in ADRs), limited to R$1.5 billion. The Second New Swap Agreements considered together with the outstanding balances of the Equity Swap Agreements and the First New Swap Agreements to be liquidated do not reach the threshold set forth in CVM Instruction No. 567/2015.
Control
Our two direct controlling shareholders, IIBV and AmBrew, both of which are subsidiaries of ABI, together with FAHZ, held in aggregate 72.1% our total and voting capital stock (excluding treasury shares) as of March 8, 2019.
ABI indirectly holds shares in us representing 61.9% of our total and voting capital stock (excluding treasury shares) as of March 8, 2019. ABI thus has control over us, even though (1) ABI remains subject to the Ambev Shareholders’ Agreement and (2) ABI is controlled by Stichting that represents an important part of interests of BRC and the Interbrew Founding Families. For further information on these matters see “Item 4. Information on the Company—A. History and Development of the Company—The InBev-Ambev Transactions” and “—Ambev’s Major Shareholders—Ambev Shareholders’ Agreement.”
Share Buyback Program
In 2019, as of March 8, 2019, we did not acquire any Ambev shares in connection with preemptive rights related to stock ownership plans.
In 2018, we acquired 3,791,412 Ambev shares in connection with preemptive rights related to stock ownership plans at a total cost of R$84.3 million.
In 2017, we acquired 7,830,472 Ambev shares in connection with preemptive rights related to stock ownership plans at a total cost of R$141.9 million.
84
In 2016, we acquired 3,196,848 Ambev shares in connection with preemptive rights related to stock ownership plans at a total cost of R$59.4 million. On April 24, 2016, we terminated our share buyback program that we had commenced on August 28, 2015. Over the course of this share buyback program, we repurchased 5,454,202 common shares at market price at the time of acquisition in the total amount of R$102.9 million. The repurchased shares were held in treasury for cancellation and/or subsequent disposition.
For a further description of our share buyback programs, see “Item 16E. Purchases of Equity Securities by the Issuer and Affiliated Purchasers.”
Ambev’s Major Shareholders
The following table sets forth information as of March 8, 2019, with respect to any person known to us to be the beneficial owner of 5% or more of our outstanding shares:
|
Shareholder |
Amount and Percentage | |
|
The Bank of New York Mellon – ADR Department(1) |
1,237,191,072 |
7.9% |
|
Interbrew International B.V |
8,441,956,047 |
53.7% |
|
AmBrew S.A |
1,286,401,893 |
8.2% |
|
FAHZ(2) |
1,609,987,301 |
10.2% |
(1) Represents the number of shares held in the form of ADSs. The Bank of New York Mellon is the depositary of Ambev shares in accordance with the deposit agreement entered into with Ambev and the owners of Ambev ADSs.
(2) Messrs. Victório Carlos De Marchi and José Heitor Attílio Gracioso, who are FAHZ-appointed directors of Ambev, are also trustees of FAHZ.
For a description of our major shareholders’ voting rights, see “—Ambev Shareholders’ Agreement.”
Ambev Shareholders’ Agreement
On April 16, 2013, ABI (through IIBV and AmBrew) and FAHZ executed a shareholders’ agreement to be applicable to Ambev, or the Ambev Shareholders’ Agreement. The Ambev Shareholders’ Agreement will be effective up to and including July 1, 2019, and will be replaced by a new shareholders’ agreement, or the 2019 Shareholders’ Agreement, to be effective starting on July 2, 2019, as long as at that time FAHZ holds at least 1,501,432,405 Ambev common shares, adjusted for any future share dividends, stock-splits and reverse stock-splits (see “—The 2019 Shareholders’ Agreement”).
The parties to the Ambev Shareholders’ Agreement are IIBV and AmBrew, which represent ABI’s beneficial interest in Ambev, and FAHZ, as well as Ambev, as intervening party, and ABI, as intervening third-party beneficiary. Among other matters, the Ambev Shareholders’ Agreement governs the voting of the Ambev common shares subject to the agreement and the voting by Ambev of the shares of its majority-owned subsidiaries. The following discussion relates to the Ambev Shareholders’ Agreement.
Management of Ambev
Although each Ambev common share entitles its holder to one vote in connection with the election of Ambev’s Board of Directors, Ambev’s direct controlling shareholders (i.e, FAHZ, IIBV and AmBrew) have the ability to elect the majority of Ambev’s directors.
If cumulative voting is exercised together with the separate ballot vote of minority shareholders, thereby resulting in the number of directors so elected being equal to or greater than the number of directors elected by Ambev’s controlling shareholders, those controlling shareholders are entitled to elect the same number of Board members elected by minority shareholders plus one additional director, regardless of the maximum number of directors provided for in Ambev’s bylaws.
85
Presently, under the Ambev Shareholders’ Agreement each of FAHZ, IIBV and AmBrew are represented on the Board of Directors of Ambev and its majority-owned subsidiaries and, in addition to the members and respective alternates that they are entitled to appoint, each of FAHZ, on the one hand, and IIBV and AmBrew, on the other, may appoint up to two observers without voting rights to attend Ambev’s Board meetings. The Boards of Directors of Ambev and its majority-owned subsidiaries are to be composed of at least three and no more than 15 regular members and the same number of alternates, with a term of office of three years with reelection being permitted.
FAHZ will have the right to appoint four directors and their respective alternates to the Boards of Directors of Ambev and its majority-owned subsidiaries, as long as it maintains ownership of at least 1,501,432,405 Ambev common shares (adjusted for any future share dividends, stock-splits and reverse stock-splits). FAHZ held 1,501,432,405 Ambev common shares immediately after the Old Ambev-Ambev S.A. stock swap merger approved in July 2013. Under the Ambev Shareholders’ Agreement, FAHZ is not entitled to appoint more than four members to Ambev’s Board of Directors in the event that its holding of Ambev common shares increases. FAHZ will always be entitled to appoint at least one member to Ambev’s Board of Directors, as long as it holds a minimum of 10% of the Ambev common shares. IIBV and AmBrew have the right to appoint members and respective alternates to the Boards of Directors of Ambev and its majority-owned subsidiaries in a number proportionate to the number of members appointed by FAHZ. Such proportion is based on the ratio between FAHZ’s holding and the joint holding of IIBV and AmBrew in the Ambev common shares.
The Ambev Shareholders’ Agreement provides that Ambev will have two Co-Chairmen with identical rights and duties, with one being appointed by FAHZ and the other jointly by IIBV and AmBrew. In the event of a deadlock, neither of the Co-Chairmen has a deciding vote on matters submitted to Ambev’s Board of Directors.
Each of FAHZ, IIBV and AmBrew may remove a director that it has appointed to the Board of Directors of Ambev or its majority-owned subsidiaries, and each also has the right to appoint the respective replacement or a new alternate, if the originally appointed alternate is confirmed for the vacant position.
The Ambev Shareholders’ Agreement establishes that the shareholders may, by consensus, establish committees of the Board with the purpose of looking into specific matters, the analyses of which require that their members have specific technical knowledge.
Preliminary Meetings and Exercise of Voting Right
On matters submitted to a vote of the shareholders or their representatives on the Board of Directors of Ambev or its majority-owned subsidiaries, FAHZ, IIBV and AmBrew have agreed to endeavor to first reach a consensus with respect to voting their common shares of each of Ambev and its majority-owned subsidiaries, and have agreed on the manner to direct their representatives to vote on the matter being submitted. The Ambev Shareholders’ Agreement provides that the parties shall hold a preliminary meeting in advance of all meetings of shareholders or the Board of Directors of Ambev or of its majority-owned subsidiaries, with the purpose of discussing and determining a consensus position to be taken by the parties in such meetings.
If the parties fail to reach a consensus with respect to a particular matter, the position to be adopted by the parties to the Ambev Shareholders’ Agreement will be determined by the shareholders or group of shareholders holding a majority of the Ambev common shares, which currently is constituted of IIBV and AmBrew. However, this rule does not apply in connection with the election of members of the Board of Directors, as described above under “—Management of Ambev,” and with respect to matters that require unanimous approval by FAHZ, IIBV and AmBrew, as follows:
· any amendment to the bylaws of Ambev and/or any of its majority-owned subsidiaries with the purpose of amending: (1) the corporate purpose, (2) the term of duration, and/or (3) the composition, powers and duties of management bodies;
· the approval of the annual investment budget of Ambev and/or any of its majority-owned subsidiaries when the amount of the investments exceeds 8.7% of the net sales of Ambev foreseen for the same fiscal year;
86
|
· |
the designation, dismissal and substitution of the Chief Executive Officer (Diretor Geral) of Ambev; |
|
· |
the approval of, or amendment to, the compensation policy for the Board of Directors and the executive officers of Ambev, as well as of its majority-owned subsidiaries; |
|
· |
the approval of stock ownership plans for the directors, executive officers and employees of Ambev and/or its majority-owned subsidiaries; |
|
· |
a change in the dividend policy of Ambev and/or any of its majority-owned subsidiaries; |
|
· |
increases in the capital of Ambev and/or any of its majority-owned subsidiaries, with or without preemptive rights, through subscription, creation of a new share class, or changes in the characteristics of existing shares, as well as decreases of capital, issuances of debentures (whether or not convertible into shares), warrants and the creation of founders’ shares by Ambev and/or any of its majority-owned subsidiaries, except when such legal businesses are carried out between Ambev and its majority-owned subsidiaries or between the majority-owned subsidiaries; |
|
· |
amalgamations, spin-offs, transformations, mergers, acquisitions, and divestments involving Ambev and/or any of its majority-owned subsidiaries, in the latter case (1) when such transaction involves a company that is not a subsidiary, directly or indirectly, of Ambev and (2) provided that the transaction in question results in the reduction in the average dividend paid by Ambev in the past five years, adjusted by the General Market Price Inflation Index (Índice Geral de Preços ao Mercado), or the IGP-M index, published by the Getulio Vargas Foundation (Fundação Getulio Vargas) as of the date of payment; |
|
· |
the creation, acquisition, assignment, transfer, establishment of an encumbrance on and/or disposal of shares, quotas and/or any securities issued by any of Ambev’s majority-owned subsidiaries, under any title or form, except for the benefit of Ambev and/or another subsidiary; |
|
· |
the incurrence by Ambev and/or any of its majority-owned subsidiaries of a debt transaction that results in a net debt/equity ratio greater than 1.5:1; |
|
· |
the execution, amendment, termination, renewal or cancellation of any contracts, agreements or the like involving the registered or deposited trademarks of Ambev or its majority-owned subsidiaries; |
|
· |
the extension of loans or the offer of guarantees of any kind by Ambev and/or any of its majority-owned subsidiaries to any third party in an amount greater than 1% of Ambev’s shareholders’ equity as set forth in the last audited balance sheet prepared in accordance with Brazilian GAAP, except in favor of employees of Ambev and its majority-owned subsidiaries or in favor of the majority-owned subsidiaries themselves; |
|
· |
the election of members to committees of Ambev’s Board of Directors; |
|
· |
the cancellation of the registration of Ambev and/or any of its majority-owned subsidiaries as publicly traded companies; |
|
· |
the execution of a petition for an arrangement with creditors (recuperação judicial) or acknowledgment of bankruptcy by Ambev and/or any of its majority-owned subsidiaries; |
|
· |
the liquidation or dissolution of Ambev and/or any of its majority-owned subsidiaries; and |
|
· |
the appointment of the external auditors of Ambev and/or any of its majority-owned subsidiaries. |
The Ambev Shareholders’ Agreement provides that whenever the parties fail to reach a consensus in a preliminary meeting as to any matter listed above, they will exercise their voting rights so as not to approve such matter. The Ambev Shareholders’ Agreement provides that any votes cast by FAHZ, IIBV and AmBrew, or by any of the directors appointed by each of them, in violation of the provisions of the agreement will be deemed null, void and ineffective.
87
FAHZ, IIBV and AmBrew, as well as any member appointed by them to the Board of Directors of Ambev or any of its majority-owned subsidiaries, are not required to observe decisions reached at preliminary meetings when deciding on the following matters:
· analysis and approval of management accounts of Ambev and its majority-owned subsidiaries;
· analysis and approval of the financial statements and management reports of Ambev and its majority-owned subsidiaries;
· any matters or actions typified as abuse of control, as set forth in the first paragraph of Section 117 of the Brazilian Corporation Law; and
· actions and practices relating to management’s diligence, loyalty and other related duties, as established in Sections 153 to 158 of the Brazilian Corporation Law.
Transfer of Shares
The Ambev Shareholders’ Agreement contains the following provisions concerning the transfer of the Ambev common shares subject to the agreement:
|
· |
FAHZ, IIBV and AmBrew have agreed (1) not to dispose of their Ambev common shares, directly or indirectly, during the term of the agreement, whether through private trades, on the stock market or on the over-the-counter market, including by way of tender offers, either voluntary or mandatory, except as permitted in Section VI of the Ambev Shareholders’ Agreement and (2) not to create any type of encumbrance on their Ambev common shares, in either of the above cases without the prior written consent of FAHZ, in the case of IIBV and AmBrew, and of IIBV and AmBrew, in the case of FAHZ; |
|
· |
if the Ambev common shares owned by FAHZ, on the one hand, and by IIBV and AmBrew, on the other, become subject to seizure, attachment, judicial surety or any other restrictive measure, and such restriction is not lifted or waived within 30 days after its imposition, the shares subject to the restriction shall be automatically deemed offered for sale to the other party. The price for the relevant Ambev common shares will be the lesser of either (1) the book value per Ambev common share, as per the latest audited balance sheet of Ambev adjusted by the IGP-M index from the date the restrictive measure is imposed until the date a petition is filed to require that the restriction be lifted or waived or (2) the average quoted market price of the Ambev common shares on stock exchanges in the 20-day period prior to the petition for lifting or waiving the restriction, provided that the Ambev common shares were traded during such period. If the obligations in respect of such restriction exceed the above-mentioned price, the party whose shares have been subject to the restriction will be liable for the difference that the other party may be required to deposit in order to acquire the relevant Ambev common shares. If the obligations in respect of such restriction were lower than the price for the Ambev common shares as described above, then the party whose shares have been subject to the restriction will be entitled to receive the difference between the price for the Ambev common shares and the obligations in respect of such restriction; and |
|
· |
if either FAHZ, on the one hand, and IIBV or AmBrew, on the other, does not exercise its subscription rights relating to Ambev common shares it holds, then each such party must first offer such rights to the other party at market value, which such other party will then decide, within the following 10 days, on whether to exercise its right of first refusal to subscribe the new shares to be issued. If such other party elects not to acquire the subscription right offered, then the offering shareholder may dispose of its subscription rights to third parties. |
The Ambev Shareholders’ Agreement provides that any transfer of shares or subscription rights or creation of encumbrances in which the foregoing provisions on rights of first refusal are not observed will be deemed null, void and ineffective. Ambev’s management is also prohibited from reflecting any such events in its corporate books, as permitted by the Brazilian Corporation Law.
88
Specific Performance
The obligations of the parties under the Ambev Shareholders’ Agreement will be subject to specific performance under applicable Brazilian law.
The 2019 Shareholders’ Agreement
The 2019 Shareholders’ Agreement was executed on April 16, 2013 by IIBV, AmBrew and FAHZ, as well as Ambev, as intervening party. It will become effective on July 2, 2019, as long as at that time FAHZ holds at least 1,501,432,405 Ambev common shares, adjusted for any future share dividends, stock-splits and reverse stock-splits. After becoming effective, the 2019 Shareholders’ Agreement may be terminated at any time upon FAHZ ceasing to hold at least 1,501,432,405 Ambev common shares (adjusted for any future share dividends, stock-splits and reverse stock-splits) or if FAHZ decides to early terminate it. Among other matters, the 2019 Shareholders’ Agreement governs the voting of the Ambev common shares subject to the agreement and the voting by Ambev of the shares of its majority-owned subsidiaries.
Management of Ambev
The 2019 Shareholders’ Agreement establishes that Ambev will be managed by a Board of Directors and by an Executive Committee. Ambev’s Board of Directors will no longer be chaired by two Co-Chairmen.
Under the 2019 Shareholders’ Agreement, FAHZ will be entitled to appoint two directors and their respective alternates to the Board of Directors of Ambev, provided that it holds at least 1,501,432,405 Ambev common shares (adjusted for any future share dividends, stock-splits and reverse stock-splits). One of the FAHZ-appointed directors shall have the right to also be appointed as a member of Ambev’s Operations, Finance and Compensation Committee and of the Antitrust Compliance and Related Parties Committee, as well as any other committee that may be established by Ambev’s Board of Directors. Furthermore, the shareholders shall use their best efforts to allow one of the FAHZ-appointed directors to participate as an observer in meetings of Ambev’s Fiscal Council, whenever such body is installed in lieu of the audit committee required by the Sarbanes-Oxley Act of 2002.
FAHZ may remove a director that it has appointed to the Board of Directors of Ambev, and also has the right to appoint the respective replacement or a new alternate, if the originally appointed alternate is confirmed for the vacant position.
The foregoing provisions of the 2019 Shareholders’ Agreement regarding Ambev’s management bodies do not apply to the management bodies of Ambev’s majority-owned subsidiaries.
Preliminary Meetings and Exercise of Voting Rights
The 2019 Shareholders’ Agreement replicates the provisions of the Ambev Shareholders’ Agreement concerning preliminary meetings, including the need for consensus between FAHZ, IIBV and AmBrew, and applicable procedures when consensus is not reached, in respect to matters that will be resolved at shareholders’ or Board of Directors meetings of Ambev and its majority-owned subsidiaries.
If the parties fail to reach a consensus with respect to a particular matter, the position to be adopted by the parties to the 2019 Shareholders’ Agreement will be determined by the shareholder or group of shareholders holding a majority of Ambev common shares. The following matters are not subject to the foregoing rule: (1) election of members to the Board of Directors or to any committee of the Board of Directors, which shall follow the specific election procedure described above under “—Management of Ambev” and (2) matters that require unanimous approval by FAHZ, IIBV and AmBrew, as follows:
· any amendment to the bylaws of Ambev and/or any of its majority-owned subsidiaries with the purpose of changing: (1) the corporate purpose of those companies with a view to causing them to cease the production, commercialization and distribution of beverages, (2) the allocation of Ambev’s results of operations, as set forth in its bylaws, or other similar provisions in the bylaws of Ambev’s majority-owned subsidiaries that are meant to provide financial support to FAHZ, (3) the minimum mandatory dividend of 40% of Ambev’s adjusted net income, and/or (4) any other provision that affects FAHZ’s rights under the 2019 Shareholders’ Agreement; and
89
· the transformation of Ambev into a different form of legal entity.
FAHZ, IIBV and AmBrew, as well as any member appointed by them to the Board of Directors of Ambev or any of its majority-owned subsidiaries, are not required to observe decisions reached at preliminary meetings when deciding on the following matters:
· analysis and approval of management accounts of Ambev and its majority-owned subsidiaries;
· analysis and approval of the financial statements and management reports of Ambev and its majority-owned subsidiaries;
· any matters or actions typified as abuse of control, as set forth in the first paragraph of Section 117 of the Brazilian Corporation Law; and
· actions and practices relating to management’s diligence, loyalty and other related duties, as established in Sections 153 to 158 of the Brazilian Corporation Law.
Transfer of Shares
The 2019 Shareholders’ Agreement’s provisions regarding transfer of shares differ substantially from the equivalent provisions contained in the Ambev Shareholders’ Agreement. Under the 2019 Shareholders’ Agreement, the following rules shall apply:
|
· |
in the event of a transfer of Ambev common shares subject to the 2019 Shareholders’ Agreement (1) by IIBV and/or AmBrew, where such transfer results in these entities jointly holding a total equity interest in Ambev represented by less than 50% plus one Ambev common share, and/or (2) by FAHZ upon making one and only one eligible transfer of at least 1,501,432,405 Ambev common shares (adjusted for any future share dividends, stock-splits and reverse stock-splits) to a single buyer and subject to the first offer obligations described below, then, in either of those cases, the Ambev common shares subject to those transfers shall remain bound by the 2019 Shareholders’ Agreement. Only in those two cases shall a third party acquiring the Ambev common shares in those transfers be able to adhere to the 2019 Shareholders’ Agreement in order for the transfer to be effective; |
|
· |
at any time FAHZ may elect to release its Ambev common shares subject to the 2019 Shareholders’ Agreement for the exclusive purpose of selling them in the stock market or over-the-counter market, provided that (1) it maintains at least 1,501,432,405 Ambev common shares (adjusted for any future share dividends, stock-splits and reverse stock-splits) subject to the 2019 Shareholders’ Agreement, and (2) it observes the first offer obligations described below; and |
|
· |
in the event FAHZ intends to execute the above-referenced one and only one eligible transfer or release, it shall first offer the Ambev common shares to the remaining parties to the 2019 Shareholders’ Agreement for their average quoted market price on the 20 trading sessions immediately prior to the date of the relevant first offer (or the last 40 trading sessions if no Ambev common shares were negotiated in at least half of the 20 immediately preceding trading sessions). The offerees will have five days, as of the first offer date, to accept or refuse the offer, and, if expressly or tacitly refused (or in the event the offerees fail to timely pay the applicable purchase price), then FAHZ may either proceed with such transfer or release its Ambev common shares from the 2019 Shareholders’ Agreement and thereafter sell them to third parties within ten days. |
90
Specific Performance
The obligations of the parties under the 2019 Shareholders’ Agreement will be subject to specific performance under applicable Brazilian law.
B. Related Party Transactions
Overview
We have executed and may in the future execute related party transaction with certain of our significant shareholders or other related parties and certain of their affiliates. These transactions include, but are not limited to: (1) the purchase and sale of raw material with affiliated entities, (2) entering into distribution, cross-licensing, transfer pricing, indemnification, service and other agreements with affiliated entities, (3) import agreements with affiliated entities, and (4) royalty agreements with affiliated entities. These transactions have been entered into only on an arm’s length basis in accordance with our best interests and customary market practices at the time of their execution. In addition, the Antitrust Compliance and Related Parties Committee is responsible for assisting the Board in reviewing, analyzing and deciding on these transactions to help ensure that their terms are reasonable and that they comply with all applicable laws and regulations, as well as our corporate governance and best practices principles. See “Item 6. Directors, Senior Management and Employees—C. Board Practices—The Board of Directors—Antitrust Compliance and Related Parties Committee.” Set forth below is a discussion of our material related party transactions. For further information on our related party transactions, see note 32 to our audited consolidated financial statements.
Ambev and FAHZ
Medical, Dental and Social Assistance
One of the activities of FAHZ, as described in its bylaws, is to provide medical and dental assistance and other benefits both to active and certain of our retired employees and executive officers (including their dependents).
Label Production
We have entered into a lease agreement with FAHZ, pursuant to which we have leased and are operating FAHZ’s assets used to produce our labels in the total amount of R$85.1 thousand, maturing on May 31, 2020, with an option to extend the agreement for one additional year.
Lease on Commercial Properties
We have a lease of two commercial properties from FAHZ involving annual lease payments in the amount of R$3.3 million. This lease agreement is scheduled to expire in January 2020.
Ambev and ABI
Licensing Agreements
See “Item 4. Information on the Company—B. Business Overview—Licenses—Licensing Agreements with ABI.”
Special Goodwill Reserve
As a result of the merger of InBev Holding Brasil S.A., or InBev Brasil, into us in July 2005, we acquired tax benefits resulting from the partial amortization of the special premium reserve pursuant to article 7 of CVM Rule No. 319/99. Such amortization will be carried out within the next ten years following the merger. As permitted by CVM Rule No. 319/99, the Protocol and Justification of this merger, as entered into between ourselves, InBev Brasil and InBev N.V./S.A. (as ABI was then called) on July 7, 2005, established that 70% of the goodwill premium, which corresponded to the tax benefit resulting from the amortization of the tax goodwill derived from the merger, would be capitalized by us to the benefit of our controlling shareholder, with the remaining 30% being capitalized by us without the issuance of new shares to the benefit of all shareholders. Since 2005, pursuant to the Protocol and Justification of this merger, we have carried out, with shareholder approval, capital increases through the partial capitalization of the goodwill premium reserve. Accordingly, IIBV and AmBrew, which are subsidiaries of ABI, have subscribed shares corresponding to 70% of the goodwill premium reserve and our minority shareholders have been entitled to participate in these share issuances through the exercise of preemptive rights under the Brazilian Corporation Law. The remaining 30% of the tax benefit has been capitalized by us without issuance of new shares to the benefit of all shareholders. The Protocol and Justification of this merger also provides, among other matters, that ABI shall indemnify us for any undisclosed liabilities of InBev Brasil.
91
Transfer of Operations in Colombia, Peru, Ecuador and Panama
In May 2016, we entered into an agreement with ABI, pursuant to which we agreed to transfer to ABI our businesses in Colombia, Peru and Ecuador, in exchange for which ABI has agreed to transfer SAB’s Panamanian business to us. Other than post-closing debt and/or cash adjustments, the transaction did not involve any cash payments and involved an exchange of shares of the aforementioned entities. The transaction was conditioned on the successful closing of the SAB and ABI merger, which closed in the fourth quarter of 2016. As a result of this transaction, on December 31, 2016, we ceased operations in Colombia, Peru and Ecuador and commenced operations in the beverages market of Panama.
Quilmes Perpetual Licensing Agreement
In September 2017, we entered into an agreement with ABI, pursuant to which our subsidiary Cervecería y Maltería Quilmes S.A., or Quilmes, agreed to transfer to a third-party, Compañia Cervecerías Unidas S.A. or its affiliates, or CCU, certain Argentinean brands (Norte, Iguana and Baltica) and related business assets as well as payment of US$50 million. In exchange, ABI has agreed to transfer to Quilmes the brewery of Cerveceria Argentina Sociedad Anonima Isenbeck, an Argentinean subsidiary of ABI. In addition, at closing ABI will license to Quilmes in perpetuity the Budweiser brand, among other North American brands, in Argentina upon ABI’s recovery of the distribution rights to such brands from CCU. The transaction was subject to certain conditions precedent and closed on May 2, 2018. Rothschild acted as our exclusive financial advisor. For additional information, see note 1(b) to our audited consolidated financial statements as of and for the year ended December 31, 2018.
Ambev and Certain Shareholders (E. León Jimenes, S.A. or ELJ)
In December 2017, E. León Jimenes, S.A., or ELJ, the other shareholder together with us in Tenedora CND, S.A., or Tenedora – a holding company incorporated in the Dominican Republic, owner of almost the totality of Cervecería Nacional Dominicana, S.A. – partially exercised, in accordance with the shareholders’ agreement of Tenedora, its put option in connection with shares representing 30% of Tenedora’s capital stock. The transaction was subject to certain conditions precedent and closed in January 2018. As a result of the partial exercise of such put option, we paid to ELJ the amount of US$926.5 million and became the owner of approximately 85% of Tenedora, with ELJ remaining with 15%. In addition, in light of the strategic importance of the alliance with ELJ, our Board of Directors approved amending from 2019 to 2022 the term for the call option granted by ELJ to us to become exercisable. For additional information, see note 1(b) to our audited consolidated financial statements as of and for the year ended December 31, 2018.
C. Interests of Experts and Counsel
Not applicable.
92
ITEM 8. FINANCIAL INFORMATION
A. Consolidated Financial Statements and Other Financial Information
Consolidated Financial Statements
See “Item 17. Financial Statements.”
Legal Proceedings
We are subject to numerous claims with respect to tax, labor, civil and other matters (consisting of antitrust, environmental and other proceedings that do not fit in the other categories). Such proceedings involve inherent uncertainties including, but not limited to, as a result of court rulings, negotiations between affected parties and governmental actions, and, consequently, our management cannot at this stage estimate with certainty how and when these matters will be resolved.
To the extent that we believe contingencies arising from these proceedings will probably be realized, they have been recorded in the balance sheet. Our provisions for legal contingencies were R$599.2 million as of December 31, 2018. We have estimated the total exposures of possible (but not probable) losses, which are not recorded as liabilities, to be R$72.1 billion as of December 31, 2018. Our estimates are based on reasonable assumptions and management assessments, but should the worst case scenario develop, subjecting us to losses in all cases classified as possible (but not probable), our net impact on our results of operations would be an expense for this amount. Except as set forth herein, there are no legal proceedings to which we are a party, or to which any of our properties are subject which, either individually or in the aggregate, may have a material adverse effect on our results of operations, liquidity or financial condition. For more information, see notes 26 and 30 to our audited consolidated financial statements.
Tax Matters
As of December 31, 2018, we had several tax claims pending against us, including judicial and administrative proceedings. Most of these claims relate to ICMS Value-Added Tax, IPI Excise Tax, and income tax and social contributions. As of December 31, 2018, we had made provisions of R$417.4 million in connection with those tax proceedings for which we believe there is a probable chance of loss.
Among the pending tax claims, there are claims filed by us against Brazilian tax authorities alleging that certain taxes are unconstitutional. Such tax proceedings include claims for income taxes, ICMS Value-Added Tax, IPI Excise Tax and taxes on revenues, such as the Social Integration Program Contribution (Programa de Integração Social), or the PIS Contribution and the Social Security Funding Contribution (Contribuição para Financiamento da Seguridade Social), or COFINS. As these claims are contingent on obtaining favorable judicial decisions, the corresponding assets which might arise in the future are only recorded once it becomes certain that we will receive the amounts previously paid or deposited.
As of December 31, 2018, we were party to tax proceedings with a total estimated possible risk of loss of R$67.3 billion. Approximately 56.3% (R$37.9 billion) of this figure is related to controversies related to payment of income tax and social contribution, and approximately 35.5% (R$23.9 billion) is related to controversies involving the payment of ICMS value-added and IPI Excise taxes, and the remainder relates to controversies involving other taxes. The most significant proceedings are discussed below.
ICMS Value-Added Tax, IPI Excise Tax and Taxes on Net Sales
In 2013, 2014 and 2015, we received tax assessments issued by the States of Pará, and Piauí to pay the ICMS Value Added Tax allegedly due with respect to unconditional discounts granted by the Company. The tax assessments are being challenged at both the administrative and judicial levels of the Brazilian courts. Our management estimates the amount involved in these proceedings to be approximately R$623.2 million as of December 31, 2018, reflecting the payments made in October 2015 and January 2016. We have classified this as a possible loss and, therefore, for which no provision has been made.
93
In Brazil, goods manufactured within the Manaus Free Trade Zone (Zona Franca de Manaus) intended for remittance elsewhere in Brazil are exempt from the IPI Excise Tax. We have been registering IPI Excise Tax presumed credits upon the acquisition of exempted inputs manufactured in the Manaus Free Trade Zone. Since 2009, we have been receiving a number of tax assessments from the RFB relating to the disallowance of such presumed IPI excise tax credits, which are under discussion before the Brazilian Supreme Court, with a trial expected to be held in April 2019. Management estimates the possible losses in relation to these assessments to be R$3.8 billion as of December 31, 2018. We have not recorded any provision in connection with these assessments. See “Item 5. Operating and Financial Review and Prospects—B. Liquidity and Capital Resources—Sales Tax Deferrals and Other Tax Credits.”
In addition, over the years, we also received tax assessments from the Brazilian Federal Tax Authorities charging federal taxes that they considered unduly offset with the disallowed IPI excise tax credits which are under discussion in the above mentioned proceedings. We are currently challenging those charges in the courts. Our management estimates the possible losses related to these assessments to be approximately R$1.1 billion as of December 31, 2018. We have not recorded any provision in connection with these assessments.
In 2014 and 2015, we received tax assessments from the RFB relating to IPI excise tax allegedly due over remittances of manufactured goods to other related factories. The cases are being challenged at both administrative and judicial levels. Our management estimates the possible losses related to these assessments to be approximately R$1.6 billion as of December 31, 2018. We have not recorded any provision in connection with these assessments.
Over the years, we have also received tax assessments relating to supposed ICMS differences considered due in the tax substitution system when the price of products sold by us reaches levels close to or above the fixed price table basis established by certain states in cases where tax authorities understand that the calculation basis should be based on a value-added percentage over the actual prices, not the fixed table price. Among other similar cases, we received three assessments issued by the State of Minas Gerais in the original amount of R$1.4 billion. In the first quarter of 2018, the Upper House of the Administrative Tax Court of the State of Minas Gerais ruled against us. The State of Minas Gerais filed tax foreclosures to charge the amounts discussed in these three cases and we filed our defense with the courts. In 2018, we also received assessments from the State of Rio de Janeiro in the original amount of R$0.9 billion related to this same issue. We have presented defenses against such tax assessments and await judgment by the relevant administrative courts. Our management estimates the amount related to this issue to be approximately R$7.7 billion as of December 31, 2018, classified as a possible loss and, therefore, for which we have made no provision. We have recorded provisions in the total amount of R$7.8 million for proceedings where we consider the chances of loss to be probable considering specific procedural issues.
In 2015, we received a tax assessment issued by the State of Pernambuco to charge ICMS differences due to an alleged non-compliance with the State Tax Incentive Program (PRODEPE). As a result of the modification of our monthly reports, tax authorities decided that we were not able to use our tax incentives. In 2017, we received a favorable decision nullifying the assessment due to formal mistakes of the tax auditor. However, in September 2018, we received a new tax assessment to pay the same disputed amounts. There are other assessments related to this same State Tax Incentive Program. Our management estimates the possible losses related to this issue to be approximately R$0.6 billion as of December 31, 2018. We have recorded a provision in the total amount of R$2.9 million in relation to one proceeding it considers the chances of loss to be partially probable.
In addition to the ICMS matters, we are currently challenging tax assessments issued by various Brazilian states, as described below.
State Tax Incentives of the National Council on Fiscal Policy (Conselho Nacional de Política Fazendária), or CONFAZ
Many states in Brazil offer tax incentive programs to attract investments to their regions, pursuant to the rules of the CONFAZ, a council formed by the Treasury Secretaries from each of the 27 Brazilian states. We participate in ICMS value-added tax credit programs offered by various Brazilian states which provide (1) tax credits to offset ICMS value-added tax payables and (2) ICMS value-added tax deferrals. In return, we are required to meet certain operational requirements, including, depending on the state, production volume and employment targets, among others. All of these conditions are included in specific agreements between us and the relevant state governments.
94
As previously disclosed, there has in recent years been a controversy regarding whether these benefits are constitutional when granted without the prior approval of every Brazilian state participating in the CONFAZ. Some states and public prosecutors filed direct actions of unconstitutionality (Ação Direta de Inconstitucionalidade) before the Brazilian Supreme Court to challenge the constitutionality of certain state laws granting tax incentive programs unilaterally, without the prior approval of the CONFAZ.
Since 2007, we have received tax assessments from various states, challenging the legality of tax credits arising from existing tax incentives received by us in other states. Our management estimates the possible losses related to these assessments to be approximately R$2.1 billion as of December 31, 2018. We have not recorded any provision in connection therewith.
In 2017, Supplementary Law No. 160 was published authorizing the states and the Federal District to revalidate within 180 days the tax benefits allegedly created without the approvals required under Brazilian tax laws and regulations by means of an Interstate Agreement. Under the provisions of the aforementioned Supplementary Law, Confaz Interstate Agreement No. 190 was published on December 18, 2017, allowing the states to republish and to reinstall the state tax benefits created up to August 8, 2017. The validation of such tax incentives, however, is not self-applicable and depends on the fulfillment of certain conditions by the granting state. We believe that the states will be able to comply with such conditions, except for the State of Amazonas that decided to not be a party to the Interstate Agreement.
In any case, we will continue to defend our position in those assessments, including those related to the State of Amazonas and those related to the states in which the conditions for validation were not satisfied.
Profits Generated Abroad
During 2005, certain of our subsidiaries received a number of assessments from Brazilian federal tax authorities relating to profits of our foreign subsidiaries. In December 2008, the Administrative Court rendered a partially favorable decision to us, and in connection with the remaining part, we filed an appeal to the Upper House of the Administrative Court, which was denied in full in March 2017. In September 2017, we filed a judicial proceeding for this tax assessment and requested a motion for injunction, which was granted to the company.
In 2016, 2017 and 2018, we received other tax assessments relating to the same matter. In July and September 2018, with respect to two of the tax assessments, the Upper House of the Administrative Court rendered unfavorable decisions regarding two tax assessments against us. We filed a judicial proceeding in one of the cases and requested a motion for injunction that was granted to the company. The Company is considering its potential appeals in the other cases.
In October 2018, the Lower Administrative Court rendered a partially favorable decision in one tax assessment. The Company is waiting to be notified of such decision in order to analyze applicable appeals. The Upper House of the Administrative Court rendered a partially favorable decision to us in one of the assessments, and in another, rendered an unfavorable decision to us, by casting vote. Currently, we are awaiting formal notification in relation to such outcomes in order to analyze the applicable appeals.
As of December 31, 2018, our management estimates the exposure of approximately R$7.7 billion as a possible risk and, accordingly has not recorded a provision for such amount. We have recorded provisions of approximately R$45.8 million for proceedings where we consider the chance of loss to be probable.
Income Tax - Tax Loss Offset
We and certain of our subsidiaries received a number of assessments from the RFB relating to the offset of tax loss carry forwards arising in the context of business combinations. In February 2016, the Upper House of the Administrative Court ruled unfavorably to Ambev in two cases. Ambev filed judicial proceedings to discuss the matter. In September 2016, we received a favorable first level decision in one of the judicial claims. In March 2017, we received an unfavorable first level decision on the second judicial case and filed an appeal to the judicial court. Both cases are awaiting decisions by the judicial courts. We also have other cases at the administrative level which are pending final decision. Our management estimates the total exposures of possible losses in relation to these assessments to be R$533.3 million as of December 31, 2018. We have not recorded any provision in connection with these disputes.
95
Special Goodwill Reserve
In December 2011, we received a tax assessment from the RFB related to the goodwill amortization resulting from Inbev Brasil’s merger referred to under “Item 7. Major Shareholders and Related Party Transactions—B. Related Party Transactions—Ambev and ABI—Special Goodwill Reserve.” The final decision rendered by the Lower Administrative Court in this case was a partly favorable decision to us. Therefore, we filed a judicial proceeding to discuss the unfavorable part and requested a motion for injunction, which was granted to us. The favorable portion to Ambev will be reexamined by the Administrative Upper Court.
In June 2016, we received a new tax assessment charging the remaining value of the goodwill amortization and filed a defense.
In March 2017, we were notified of a partially favorable first level administrative decision on this tax assessment and filed an appeal to the Lower Administrative Court. In May 2018, we received a partly favorable decision at the Lower Administrative Court and are currently awaiting to be formally notified of the decision in order to analyze the applicable appeals.
We have not recorded any provisions for this matter and our management estimates possible losses in relation to this assessment to be approximately R$9.3 billion as of December 31, 2018. In the event we are required to pay these amounts, ABI will reimburse us in the amount proportional to the benefit received by ABI pursuant to the merger protocol, as well as related costs.
In October 2013, we also received a tax assessment related to the goodwill amortization resulting from the merger of Beverage Associates Holding Limited into us. The decision from the first level administrative court was unfavorable to us. After analysis of a motion to clarify presented by the Company, the unfavorable decision was confirmed and we filed an appeal to the Lower Administrative Court. In November 2018, we received a partly favorable decision from the Lower Administrative Court and is currently waiting to be notified of the decision to analyze the applicable appeals. In April and August 2018, we received new tax assessments charging the remaining value of the goodwill amortization and filed defenses, which are currently pending analysis by the first level administrative Court. We estimate the amount of possible losses in relation to this assessment to be approximately R$2.1 billion as of December 31, 2018. We have not recorded any provision in connection with this assessment.
In November 2017, we received a tax assessment related to the goodwill amortization resulting from the merger of CND Holdings into Ambev. In November 2018, we received an unfavorable decision from the first level administrative court and filed an appeal to the Lower Administrative Court, which is currently pending analysis. Our management estimates the amount of possible losses in relation to this assessment to be approximately R$1.1 billion as of December 31, 2018. We have not recorded any provision in connection with this assessment.
Disallowance of Expenses and Deductibility of Losses
In 2015 and 2016, we received new tax assessments from the RFB related to the same matter. Our management estimates the amount of possible loss in relation to those assessments to be approximately R$4.6 billion as of December 31, 2018. We have not recorded any provision in connection with these assessments.
Disallowance of Taxes Paid Abroad
Since 2014, we have been receiving tax assessments from the RFB related to the disallowance of deductions associated with alleged unproven taxes paid abroad, for which the decision from the Upper House of the Administrative Tax Court is still pending. In September 2017, we decided to include part of these tax assessments in the Brazilian Federal Tax Regularization Program of the Provisional Measure No. 783. In June 2018, we were notified of a favorable first administrative level decision cancelling four of these assessments (offsets in 2015 and 2016). However, in August and September 2018, the Brazilian Federal Revenue Service issued new decisions reestablishing these assessments and issued new tax assessments related to the matter. As of December 31, 2018, our management estimated the remaining exposure of approximately R$9.5 billion as a possible risk, and accordingly we have not recorded a provision for such amount.
96
Presumed Profit
In April 2016, Arosuco (a subsidiary of Ambev) received a tax assessment regarding the use of the “presumed profit” method for the calculation of income tax and the social contribution on net profit instead of the “real profit” method. In September 2017, Arosuco received the unfavorable first level administrative decision and filed an appeal to the Lower Administrative Court. In January 2019, the case was reviewed by the Lower Administrative Court, which ruled favorably to Ambev. Ambev is awaiting formal notification of the decision in order to analyze its content and any applicable appeals. Arosuco management estimates the amount of possible losses in relation to this assessment to be approximately R$645.1 million as of December 31, 2018. Arosuco has not recorded any provision in connection therewith.
Social Contributions
We received a number of tax assessments issued by the Brazilian federal tax authorities relating to amounts allegedly due under Integration Program / Social Security Financing Levy (PIS/COFINS) over bonus products granted to our customers. These cases are now being discussed at the relevant judicial and administrative courts. In January 2019, three lawsuits related to the matter were included in the judgment panel of the Lower Administrative Court. By majority of votes, the decision was favorable to us in all three cases. We are waiting to be notified of such decisions to analyze the applicable appeals. Management estimates the possible losses related to these assessments to be approximately R$4.0 billion as of December 31, 2018. No related provision has been made.
Adherence to the Special Tax Regularization Program
In September 2017, we decided to participate in the Federal Tax Amnesty Program established by Provisional Measure No. 783/2017, converted into Law No. 13,496/2017, or PERT 2017, undertaking to pay tax assessments that were in dispute under administrative or judicial level, including debts from our subsidiaries, in the total amount of R$3.5 billion (already considering discounts established by the program). The total amount paid in 2017 was approximately R$960.0 million and the balance will be paid in 145 monthly installments, with interest, as of January 2018. All installments due up to the date have been paid by the Company.
Despite our participation in this program, we could be subject to tax audits for subsequent periods, which may lead to additional tax challenges by the relevant authorities on similar claims. In addition, if we are delinquent in our payments under these programs or are otherwise unable to pay as scheduled, we may be barred from participating in this program and similar programs this.
Labor Matters
We are involved in more than 20,000 labor claims. Most of the labor claims we face relate to our Brazilian operations. In Brazil, it is not unusual for a large company to be named as a defendant in such a significant number of claims. As of December 31, 2018, we made provisions totaling R$114.1 million in connection the above labor claims involving former, current and outsourced employees relating mainly to overtime, dismissals, severance, health and safety premiums, supplementary retirement benefits and other matters, all of which are awaiting judicial resolution and have probable chance of loss.
In connection with the labor matters, we are also involved in claims regarding the social charges on payroll. Management estimates the possible losses related to these claims to be, approximately, R$291.1 million as of December 31, 2018. We have recorded provisions of approximately R$20 million for proceedings where we consider the chance of loss to be probable.
Civil Claims
As of December 31, 2018, we were involved in approximately 9,000 civil claims that were pending, including third-party distributors and product-related claims. We have established provisions totaling R$48.4 million reflecting applicable adjustments, such as accrued interest, as of December 31, 2018 in connection with civil claims.
97
Subscription Warrants
In 2002, we decided to request a ruling from the CVM in connection with a dispute between Old Ambev and some of its warrant holders regarding the criteria used in the calculation of the strike price of certain Old Ambev warrants. In March and April 2003, the CVM ruled that the criteria used by Old Ambev to calculate the strike price were correct. In response to the CVM’s final decision and seeking to reverse it, some of the warrant holders filed separate lawsuits before the courts of São Paulo and Rio de Janeiro.
Although the warrants expired without being exercised, the warrant holders claim that the strike price should be reduced to take into account the strike price of certain stock options granted by Old Ambev under its then-existing stock ownership program, as well as for the strike price of other warrants issued in 1993 by Brahma.
We are aware of at least seven claims in which the plaintiffs argue that they would be entitled to those rights. One of these cases was settled. Two of them were ruled favorably to us by the appellate court of the State of São Paulo. Both decisions were confirmed by the Superior Court of Justice . The plaintiffs have appealed to the Special Court of the Superior Court of Justice (requests for reconsideration based on conflicting precedent) and such appeals are pending Of the four other claims, we received a favorable ruling in one claim by a first level court in Rio de Janeiro, and the appellate court of the State of Rio de Janeiro ruled against us in another three claims. We have appealed to the Brazilian Superior Court of Justice with respect to the final decisions issued by the appellate court of the State of Rio de Janeiro. In 2016, we received a favorable ruling in one of such appeals, to which the plaintiffs filed an appeal of their own. In 2017, the Superior Court of Justice ruled two of the appeals in our favor, and the plaintiffs also filed appeals against such decisions. All three cases ruled favorable to us are pending final judgment. In November 2017, the Federal Public Prosecutor filled a motion favorable to our position in one of the cases, and the remaining appeals are still pending judgment.
In the event the plaintiffs prevail in the above six pending proceedings, we believe that the corresponding economic dilution for the existing shareholders would be the difference between the market value of the shares at the time they are issued and the value ultimately established in liquidation proceedings as being the subscription price pursuant to the exercise of the warrants. We believe the warrants object of those six proceedings represented, on December 31, 2018, 172,831,574 Ambev common share that would be issued at a value substantially below fair market value, should claimants ultimately prevail. The plaintiffs also claim they should receive past dividends related to these shares in the amount of R$921.6 million as of December 31, 2018.
Based on management assessments, our chances of receiving unfavorable final decisions in this matter are remote, and therefore we have not established a provision for this litigation in our audited consolidated financial statements. As these disputes are based on whether we should receive as a subscription price a lower price than the price that we consider correct, a provision of amounts with respect to these proceedings would only be applicable with respect to legal fees and past dividends.
Lawsuit Against the Brazilian Beer Industry
On October 28, 2008, the Brazilian Federal Prosecutor’s Office (Ministério Público Federal) filed a suit for damages against us and two other brewing companies claiming total damages of approximately R$2.8 billion (of which approximately R$2.1 billion are claimed against us). The public prosecutor alleges that: (1) alcohol causes serious damage to individual and public health, and that beer is the most consumed alcoholic beverage in Brazil; (2) defendants have approximately 90% of the national beer market share and are responsible for heavy investments in advertising; and (3) the advertising campaigns increase not only the market share of the defendants but also the total consumption of alcohol and, hence, cause damage to society and encourage underage consumption.
Shortly after the above lawsuit was filed, a consumer-protection association applied to be admitted as a joint-plaintiff. The association has made further requests in addition to the ones made by the Public Prosecutor, including the claim for “collective moral damages” in an amount to be ascertained by the court; however, it suggests that it should be equal to the initial request of R$2.8 billion (therefore, doubling the initial amount involved). The court has admitted the association as joint-plaintiff and has agreed to hear the new claims. After the exchange of written submissions and documentary evidence, the case was dismissed by the Lower Court Judge, which denied all the claims submitted against Ambev and the other defendants. The Prosecutor’s Office appealed to the Federal Court, but based on management assessments, we believe that our chances of loss are remote and, therefore, we have not made any provision with respect to such claim.
98
Class Action Canada (Brewers Retail Inc. Litigation)
On December 12, 2014, a lawsuit was commenced in the Ontario Superior Court of Justice against the Liquor Control Board of Ontario (LCBO), Brewers Retail Inc. (known as The Beer Store or “TBS”), and the owners of Brewers Retail Inc. (Molson Coors Canada, Sleeman Breweries Ltd. and Labatt Breweries of Canada LP, or the Brewers. The lawsuit was brought in Canada pursuant to the Ontario Class Proceedings Act, which sought, among other things: (1) to obtain a declaration that the defendants conspired with each other to allocate markets for the supply of beer sold in Ontario since June 1, 2000; (2) to obtain a declaration that the Brewers conspired to fix, increase and/or maintain prices charged to Ontario licensees (on-trade) for beer and the fees charged by TBS to other competitive brewers who wished to sell their products through TBS; and (3) damages for unjust enrichment. As part of this third allegation, the plaintiffs allege illegal trade practices by the Brewers. They are seeking damages not exceeding C$1.4 billion; punitive, exemplary and aggravated damages of C$5 million; and changes/repeals of the affected legislation. We have not recorded any provision in connection therewith. In March 2018, the court granted summary judgment and dismissed the class claims. The plaintiffs have appealed. The hearing before the Court of Appeals was held on January 28 and 29, 2019 and the judgement is expected in the second quarter of 2019.
Dividend Policy
The timing, frequency and amount of future dividend payments, if any, will depend upon various factors that our Board of Directors may consider relevant, including our earnings and financial condition. Our bylaws provide for a minimum mandatory dividend of 40% of our adjusted annual net income, if any, as determined under IFRS at our individual financial statements. Brazilian companies are permitted to make limited distributions to shareholders in the form of interest accrued on share capital, commonly referred to as “interest on shareholders’ equity,” and treat such payments as a deductible financial expense for purposes of Brazilian income tax and social contribution on profits. This notional interest distribution is treated for accounting purposes as a deduction from shareholders’ equity in a manner similar to a dividend. The benefit from the tax deductible interest on shareholders’ equity is recorded in the income statement. The minimum mandatory dividend includes amounts paid as interest on shareholders’ equity. However, payment of such interest on shareholders’ equity is subject to Brazilian withholding income tax, whereas no such withholding is required in connection with dividends paid. For further information on this matter see “Item 10. Additional Information—E. Taxation—Brazilian Tax Considerations—Income Tax.”
Annual adjusted net income not distributed as dividends or interest on shareholders’ equity may be capitalized, used to absorb losses or otherwise appropriated as allowed under the Brazilian Corporation Law and our bylaws. Therefore, annual adjusted net income amounts may not necessarily be available to be paid as dividends. We may also not pay dividends to our shareholders in any particular fiscal year upon the determination of the Board of Directors that such distribution would be inadvisable in view of our financial condition at the time. Any such dividends not distributed would be allocated to a special reserve account for future payment to shareholders, unless used to offset subsequent losses. For further information on this matter, see “Item 3. Key Information— D. Risk Factors—Risks Relating to Our Common Shares and ADSs—Our shareholders may not receive any dividends.”
For further information on provisions of the Brazilian Corporation Law relating to required reserves and payment of dividends or interest on shareholders’ equity, as well as specific rules applicable to the payment of dividends by us under our bylaws, see “Item 10. Additional Information—B. Memorandum and Articles of Association—Reserves.”
Ambev S.A.
The following table shows the cash dividends paid by Ambev to holders of Ambev’s common shares in reais and in U.S. dollars (translated from reais at the commercial exchange rate as of the date of payment) for each of the indicated periods. The amounts include interest on shareholders’ equity, net of withholding tax. The last distribution of interest on shareholders’ equity approved, which relates to the /second half of the 2018 fiscal year, was paid by Ambev on December 28, 2018.
99
|
Date of Approval |
First Payment Date |
Reais per Shares(1) |
U.S. Dollar Equivalent per Share at Payment Date(1)(2) |
|
First half 2016 |
February 29, 2016 |
0.111 |
0.028 |
|
|
July 29, 2016 |
0.130 |
0.040 |
|
|
|
|
|
|
Second half 2016 |
November 25, 2016 |
0.160 |
0.047 |
|
|
December 29, 2016 |
0.187 |
0.057 |
|
|
February 23, 2017 |
0.070 |
0.023 |
|
|
|
|
|
|
First half 2017 |
July 17, 2017 |
0.160 |
0.051 |
|
|
|
|
|
|
Second half 2017 |
December 28, 2017 |
0.264 |
0.080 |
|
|
February 22, 2018 |
0.070 |
0.022 |
|
|
|
|
|
|
First half 2018 |
July 30, 2018 |
0.160 |
0.043 |
|
|
|
|
|
|
Second half 2018 |
December 28, 2018 |
0.272 |
0.071 |
|
|
|
|
|
(1) The amounts set forth above are amounts actually received by shareholders, which are net of withholding tax. The financial statements present the amounts actually disbursed, including the withholding tax on interest on shareholders’ equity, which was paid by Ambev on behalf of shareholders. The dividends set forth above are calculated based on the number of outstanding shares at the date the distributions were declared. See “Item 7. Major Shareholders and Related Party Transactions—A. Major Shareholders.”
(2) Translated to U.S. dollars at the exchange rate in effect at the first scheduled payment date.
For more information on rules and procedures for shareholder distributions under our bylaws, see “Item 10. Additional Information—B. Memorandum and Articles of Association—Reserves.”
B. Significant Changes
Except as otherwise disclosed in our audited consolidated financial statements and in this annual report, there have been no significant changes in our business, financial conditions or results in December 31, 2018.
100
ITEM 9. THE OFFER AND LISTING
A. Offer and Listing Details
Not applicable. Information regarding the price history of the stock listed as required by Item 9.A.4 is set forth below in “—C. Principal Market and Trading Market Price Information.”
B. Plan of Distribution
Not applicable.
C. Principal Market and Trading Market Price Information
We are registered as a publicly held company with the CVM. Our common shares are listed on the B3 under the symbol “ABEV3” and our ADSs are listed on the NYSE under the symbol “ABEV”. Our shares and ADSs began trading on the B3 and the NYSE, respectively, on November 11, 2013. The shares and ADSs of Old Ambev ceased all trading activities on those stock exchanges on the close of business of November 8, 2013.
Ambev has only one class of shares (i.e, voting common shares), including in the form of ADSs (evidenced by ADRs), with each ADS representing one Ambev common share. The Ambev common shares and ADSs are registered under the Exchange Act. As of March 8, 2019, Ambev had 15,721,673,649 shares outstanding. As of March 8, 2019, there were 1,237,191,072 Ambev ADSs outstanding (representing 1,237,191,072 Ambev shares, which corresponds to 7.9% of the total Ambev shares outstanding). The Ambev shares held in the form of ADSs under the Ambev ADS facilities are deemed to be the shares held in the “host country” (i.e, the United States) for purposes of the Exchange Act. In addition, as of March 8, 2019 there were 126 registered holders of Ambev ADSs.
Regulation of the Brazilian Securities Market
The Brazilian securities market is regulated by the CVM, which has regulatory authority over the stock exchanges and securities markets, as well as by the Central Bank, which has, among other powers, licensing authority over brokerage firms and regulates foreign investment and foreign exchange transactions. The Brazilian securities market is governed primarily by Law No. 6,385 dated December 7, 1976, as amended, or the Brazilian Securities Law, and by the Brazilian Corporation Law, as amended and supplemented. These laws and regulations, among others, provide for disclosure requirements, restrictions on insider trading and price manipulation, and protection of minority shareholders. They also provide for licensing and oversight of brokerage firms and governance of Brazilian stock exchanges. However, the Brazilian securities markets are not as highly regulated and supervised as U.S. securities markets.
Under the Brazilian Corporation Law, a company is either publicly held, such as Ambev, whose shares are publicly traded on the B3, or privately held. All listed companies are registered with the CVM and are subject to reporting and regulatory requirements. The Brazilian Corporation Law allows the CVM to classify listed companies according to the kind of securities they issue. A company registered with the CVM may trade its securities either on the Brazilian stock exchanges or in the Brazilian over-the-counter market. Shares of companies like Ambev traded on the B3 may not simultaneously be traded on the Brazilian over-the-counter market. The shares of a listed company, including Ambev, may also be traded privately subject to several limitations. To be listed on the B3, a company must be registered as a publicly held Company with the CVM and apply for registration with the B3.
The trading of securities on the Brazilian stock exchanges may be halted at the request of a company in anticipation of a material announcement. Companies may be required by law to request such suspension. Trading may also be suspended on the initiative of a Brazilian stock exchange or the CVM, among other reasons, based on or due to a belief that a company has provided inadequate information regarding a significant event or has provided inadequate responses to inquiries by the CVM or a stock exchange.
Trading on the Brazilian Stock Exchanges
B3 is the only Brazilian stock exchange on which private equity and private debt may be traded.
101
B3 trading sessions, from September 21, 2018, are from 10:00 a.m. to 5:55 p.m., São Paulo time. Equity trading is executed fully electronically through an order-driven trading system called “PUMA Trading System,” or “PUMA.” Additionally, the home broker system through the Internet has been established allowing retail investors to transmit orders directly to the B3. B3 trading session hours may change from time to time due to daylight saving time in Brazil and in the United States, in such case B3 may shorten its sessions hours and permits trading after the session closure on an online system connected to PUMA and Internet brokers called the “after-market”. CVM has discretionary authority to suspend trading in shares of a particular issuer under specific circumstances. Securities listed on the B3 may also be traded off the exchange under specific circumstances, but such trading is very limited.
Settlement of transactions is effected three business days after the trade date, without any adjustment. Delivery of and payment for shares are made through the facilities of separate clearinghouses for each exchange, which maintain accounts for the member brokerage firms. The seller is ordinarily required to deliver the shares to the exchange on the second business day following the trade date. The B3 Equities Clearing is responsible for the registration, settlement and risk management of trades with shares through the PUMA Trading System.
In order to better control volatility, B3 has adopted a “circuit breaker” mechanism pursuant to which trading sessions may be suspended for a period of 30 minutes or one hour whenever the index of the stock exchange falls 10% or 15%, respectively, compared to the previous day’s closing index. If the market falls more than 20% compared to the previous day, the B3 may determine the suspension of trading in all markets for a defined period, at its sole discretion, and such decision must be disclosed to the market through the News Agency (ABO – Operações). The “circuit breaker” is not allowed to be started during the last 30 minutes of the trading session.
Although the Brazilian equity market is Latin America’s largest in terms of market capitalization, it is smaller, more volatile and less liquid than the major U.S. and European securities markets. As of December 31, 2018, the aggregate market capitalization of all companies included in the IBOVESPA index of the B3 was equivalent to approximately R$2.9 trillion. Although all of the outstanding shares of a listed company are actually available for trading by the public, in most cases fewer than half of the listed shares are actually traded by the public because the remainders of a listed company’s shares are usually held by small groups of controlling persons, by governmental entities or by one principal shareholder. For this reason, data showing the total market capitalization of Brazilian stock exchanges tend to overstate the liquidity of the Brazilian equity securities market.
There is also significantly greater concentration in the Brazilian securities markets. For example, as of December 31, 2018 the ten shares with greatest representation on the IBOVESPA index of the B3 accounted for 66% of the total weight of all companies included in that stock index.
Trading on Brazilian stock exchanges by non-residents of Brazil is subject to limitations under Brazilian foreign investment legislation. See “Item 3. Key Information—A. Selected Financial Data—Exchange Controls” and “Item 10. Additional Information—B. Memorandum and Articles of Association—Restrictions on Foreign Investment.”
D. Selling Shareholders
Not applicable.
E. Dilution
Not applicable.
F. Expenses of the Issue
Not applicable.
102
ITEM 10. ADDITIONAL INFORMATION
A. Share Capital
Not applicable.
B. Memorandum and Articles of Association
Below is a brief summary of the material provisions concerning our common shares, bylaws and the Brazilian Corporation Law. In Brazil, the principal governing document of a corporation is its bylaws (Estatuto Social). This description is qualified in its entirety by reference to the Brazilian Corporation Law and our bylaws. An English translation of our bylaws has been filed with the SEC as an exhibit to this annual report. A copy of our bylaws (together with an English translation) is also available for inspection at the principal office of the depositary and at our website (www.ri.ambev.com.br). Information on ownership of our shares is set forth under “Item 7. Major Shareholders and Related Party Transactions—A. Major Shareholders.”
As of March 8, 2019, our capital stock was equal to R$57,710,201,914.77 divided into 15,722,147,311 issued common shares, without par value, of which 473,662 were treasury shares. We are authorized to increase our capital up to 19,000,000,000 shares upon the decision of our Board of Directors, without the need to amend our bylaws. We have a single-class share structure, comprised exclusively of voting common shares, and there are no classes or series of preferred shares outstanding.
Pursuant to the Brazilian Corporation Law, we are allowed to sell in the open market any Ambev common shares that have been subscribed but not paid in full within the applicable deadline set forth in our bylaws or the applicable subscription bulletin under which those shares were issued. If an open market sale is impractical, any subscribed but unpaid Ambev common shares may be forfeited.
Each common share entitles the holder thereof to one vote at our shareholders’ meetings. Holders of common shares are not entitled to any preference upon our liquidation.
The Board of Directors does not vote on compensation payable to them or any of their members. For more information on management compensation, see “Item 6. Directors, Senior Management and Employees—C. Board Practices—The Board of Directors—Operations, Finance and Compensation Committee.”
There is no age limit for retirement applicable to the members of our Board of Director in our bylaws.
General
Our registered name is Ambev S.A. and our registered office is in the city of São Paulo, State of São Paulo, Brazil. Our registration number with the São Paulo Commercial Registry is 35,300,368,941. Our principal corporate purposes include the production and sale of beer, CSDs and other beverages. A more detailed description of our corporate purposes can be found in Chapter I, Article 3 of our bylaws.
Rights of the Ambev Common Shares
Each of our common shares is indivisible and entitles its holder to one vote at any shareholders’ meeting of Ambev. In accordance with our bylaws and the Brazilian Corporation Law, shareholders have the right to receive dividends or other distributions in proportion to their equity interest in our share capital. For additional information regarding the payment of dividends and other distributions relating to our common shares, see “Item 8. Financial Information—A. Consolidated Financial Statements and Other Financial Information—Dividend Policy.” In addition, our shareholders may freely transfer their shares and are entitled to be included in a statutory change of control tender offer upon a disposition of our control.
Also, upon our liquidation, and after the discharge of all our liabilities, our common shares entitle its holders to a participation in our remaining assets as capital reimbursement in proportion to their equity interest in our share capital. Holders of our common shares have the right, but not the obligation, to subscribe for our future capital increases.
103
Moreover, pursuant to the Brazilian Corporation Law, neither our bylaws nor actions taken at a shareholders’ meeting may deprive a shareholder of the following rights:
|
· |
the right to participate in our profit distributions; |
|
· |
the right to participate in our remaining assets in proportion to its equity interest in our share capital in the event of our liquidation; |
|
· |
preemptive rights to subscribe for our common shares, convertible debentures and warrants, except in certain circumstances under the Brazilian Corporation Law, as described in “—Preemptive Rights”; |
|
· |
the right to inspect and monitor our management, in accordance with the Brazilian Corporation Law; |
|
· |
the right to vote at shareholders’ meetings; and |
|
· |
the right to exercise appraisal rights and withdraw from the Company in the cases provided under the Brazilian Corporation Law, as described in “—Appraisal Rights.” |
Shareholders’ Meetings
Pursuant to the Brazilian Corporation Law, shareholders, during shareholders’ meetings regularly called and convened, are generally empowered to pass resolutions relating to our corporate purpose as they may deem necessary. Shareholders’ meetings may be ordinary, such as the annual meeting, or extraordinary. Shareholders at the annual shareholders’ meeting, which is required to be held within four months of the end of our fiscal year, have the exclusive power to approve our financial statements and to determine the allocation of our adjusted net income and the distribution of dividends with respect to the fiscal year ended immediately prior to the relevant annual meeting. Extraordinary shareholders’ meetings are convened to approve the remaining matters within their competency as provided by law and/or our bylaws. An extraordinary shareholders’ meeting may be held concurrently with an ordinary meeting.
A shareholders’ meeting is convened by publishing a meeting call notice no later than 15 days prior to the scheduled meeting date, on first call, and no later than eight days prior to the date of the meeting, on second call, and no fewer than three times, in the Diário Oficial do Estado de São Paulo and in a newspaper with general circulation in São Paulo, where we have our registered office. In certain circumstances, however, the CVM may require that the first notice be published no later than 30 days prior to the meeting. At the shareholders’ meeting held on March 1, 2013, our shareholders designated Valor Econômico, a newspaper with general circulation in São Paulo for this purpose. The call notice must contain the date, time, place and agenda of the meeting, and in case of amendments to the bylaws, the indication of the relevant matters. CVM Rule No. 481 of December 17, 2009, also requires that additional information be disclosed in the meeting call notice for certain matters. For example, in the event of an election of directors, the meeting call notice shall also disclose the minimum percentage of equity interest required from a shareholder to request the adoption of cumulative voting procedures. All documents in connection with the shareholders’ meeting’s agenda shall be made available to shareholders either within at least one month prior to the meeting or upon publication of the first meeting call notice, as the case may be, except if otherwise required by law or CVM regulations.
A shareholders’ meeting may be held if shareholders representing at least one quarter of the voting shares are present, except in some cases provided by law, such as in meetings seeking to amend the Company’s bylaws, which requires the presence of shareholders representing at least two-thirds of the voting shares. If no such quorum is present, an eight-day prior notice must be given in the same manner as described above, and a meeting may then be convened without any specific quorum requirement, subject to the minimum quorum and voting requirements for specific matters, as discussed below.
Except as otherwise provided by law, resolutions of a shareholders’ meeting are passed by a simple majority vote of the shares present or represented at the meeting, abstentions not being taken into account. Under the Brazilian Corporation Law, the approval of shareholders representing at least a majority of the issued and outstanding voting shares is required for the types of actions described below (among others):
104
|
· |
creating preferred shares or increasing disproportionately an existing class of preferred shares relative to the other classes of shares, unless such action is provided for or authorized by the bylaws; |
|
· |
modifying a preference, privilege or condition of redemption or amortization conferred upon one or more classes of preferred shares, or creating a new class with greater privileges than those of the existing classes of preferred shares; |
|
· |
reducing the minimum mandatory dividend; |
|
· |
merging Ambev with another company or consolidating or executing a spin-off of Ambev; |
|
· |
changing our corporate purpose; and |
|
· |
dissolving Ambev or ceasing its liquidation status. |
Shareholders may not exercise voting rights whenever they are contributing assets in a capital increase paid in kind or with respect to the approval of their own accounts, as well as in those resolutions that may favor those shareholders specifically, or whenever there is a conflicting interest with the Company. Mergers between affiliated parties are subject to a special statutory valuation procedure intended to determine whether the exchange ratio is adequate for all parties involved.
Shareholders’ meetings may be called by our Board of Directors. Under the Brazilian Corporation Law, meetings may also be convened by our shareholders as follows: (1) by any shareholder, if the directors take more than 60 days to convene a shareholders’ meeting after the date they were required to do so under applicable laws and our bylaws, (2) by shareholders holding at least 5% of our total capital stock, if our Board of Directors fails to call a meeting within eight days after receipt of a justified request to call a meeting by those shareholders indicating the proposed agenda, (3) by shareholders holding at least 5% of our voting capital stock, if the directors fail to call a general meeting within eight days after receipt of a request to call a shareholders’ meeting for purpose of assembling a Fiscal Council, and (4) by our Fiscal Council, if the Board of Directors fails to call an annual shareholders’ meeting within 30 days after the mandatory date for such call. The Fiscal Council may also call an extraordinary shareholders’ meeting if it believes that there are important or urgent matters to be addressed.
To attend a shareholders’ meeting, shareholders or their legal representatives willing to attend the meeting shall present proof of ownership of their Company shares, including identification and/or pertinent documentation that evidences their legal representation of such shareholder. A shareholder may be represented at a general meeting by an attorney-in-fact appointed no more than one year before the meeting, who must be another shareholder, a company officer or a lawyer. Notwithstanding the above, the CVM decided on November 4, 2014 that shareholders that are legal entities may be represented at general meetings by their legal representatives or by a duly appointed attorney-in-fact, pursuant to the bylaws and related corporate instruments of the legal entities and pursuant to the Brazilian Civil Code. For a publicly-held company, the attorney-in-fact may also be a financial institution. Investment funds must be represented by their investment fund officer.
The participation and remote voting in general shareholders’ meetings of publicly-held companies are regulated by CVM Rule No. 561, as amended, which aims to facilitate the participation of shareholders in general meetings either through the vote or through the submission of proposals, as well as to enhance the corporate governance instruments available in the Brazilian market. For this purpose, this regulation provided the following:
|
· |
the creation of a remote voting bulletin through which shareholders may exercise their right to vote prior to the date the general meeting is held; |
|
· |
the possibility of inclusion of candidates and proposals of deliberation of minority shareholders in that bulletin, with due observance of certain percentages of equity interest, in order to facilitate shareholders’ participation in general meetings; and |
105
· the deadlines, procedures and ways of sending this bulletin, which may be forwarded by the shareholder: (a) to the custodian (if the shares held by the shareholder are kept at a centralized deposit) or; (b) to the book-entry agent of the shares issued by the company (if such shares are not kept at a centralized deposit); or (c) directly to the company.
The application of CVM Rule No. 561, as amended, became mandatory on January 1, 2017 for companies that on April 9, 2015 had at least one share class included either on the Index Brasil 100 or the IBOVESPA index of the B3, such as Ambev. Additionally, CVM Rule No. 594 of December 20, 2017, introduced modifications to the rules applicable to remote voting, including, but not limited to, (1) the deadlines for inclusion of candidates in the bulletin by request of minority shareholders and for the company to resend the bulletin in case of inclusion of candidates by minority shareholders and (2) the disclosure of the detailed final voting map of the shareholders’ meetings, including the partial disclosure of each shareholders taxpayer’s registry number and their respective votes on each matter.
Board of Directors
In accordance with the Brazilian Corporation Law, any matters subject to the approval of our Board of Directors can be approved by the affirmative vote of a majority of our Board members present at the relevant meeting, except as provided in our Shareholders’ Agreement.
Under our bylaws, at least two members of our Board of Directors shall be independent directors. According to our bylaws, for a director to be considered independent he or she may not: (1) be a controlling shareholder, or a spouse or relative to the second degree of a controlling shareholder, (2) have been, within the last three years, an employee or executive officer of (a) Ambev or of any of our controlled companies or (b) our controlling shareholder or entities under common control with Ambev, (3) directly or indirectly, supply to, or purchase from, us, our controlled companies, controlling shareholder or entities under common control, any products or services, to such an extent as would cause that director to cease being independent, (4) be an employee or administrator of any corporation or entity that offers products or services to, or receives products or services from, us, our controlled companies, controlling shareholder or entities under common control, to such an extent as would cause that director to cease being independent, (5) be a spouse or relative to the second degree of any member of management of Ambev, its controlled companies, controlling company or entity under common control, or (6) receive any other compensation from Ambev, its controlled companies, controlling shareholder or entities under common control, aside from compensation for duties as a board member (gains arising from ownership of our stock are excluded from this restriction). Our bylaws also set forth that directors elected by a separate ballot vote of minority shareholders holding at least 10% of our capital stock, as provided in paragraphs 4 and 5 of Section 141 of the Brazilian Corporation Law, shall be deemed independent regardless of compliance with the abovementioned criteria.
According to the general principles of the Brazilian Corporation Law, if a director or an executive officer has a conflict of interest with a company in connection with any proposed transaction, the director or executive officer may not vote in any resolution of the Board of Directors or of the board of executive officers regarding such transaction and must disclose the nature and extent of the conflicting interest for purposes of recording such information in the minutes of the meeting. In any case, a director or an executive officer may not transact any business with a company, including any borrowings, except on reasonable or fair terms and conditions that are identical to the terms and conditions prevailing in the market or offered by third parties. Any transaction in which a director or executive officer may have an interest can only be approved if carried out on an arm’s-length basis.
Since the enactment of Brazilian Law No. 12,431/2011, which amended Section 146 of the Brazilian Corporation Law, directors no longer need to be shareholders to serve on the board of directors of a Brazilian corporation.
Election of Directors
Each Ambev common share represents one vote at any shareholders’ meeting in connection with the election of the Board of Directors of Ambev.
106
Common shareholders holding at least 10% of our capital may elect one member and respective alternate to the Board of Directors without the participation of the controlling shareholders. To exercise these minority rights, shareholders must prove their continuous ownership of their Ambev common shares for at least three months prior to the shareholders’ meeting convened to elect board members. If that prerogative is exercised with the adoption of cumulative voting procedures, as described below, the controlling shareholder will always have the right to elect the same number of members appointed by minority shareholders plus one, regardless of the number of directors provided in our bylaws.
Shareholders holding shares representing at least 10% of our capital, or a smaller applicable percentage according to a sliding scale determined by the CVM and based on a company’s capital stock (currently 5% of the Ambev common shares, pursuant to the CVM’s sliding scale), have the right to request that cumulative voting procedures be adopted. Under such procedures, each of our common shares shall entitle as many votes as the number of director positions to be filled, and each shareholder may cast all of his or her votes for a single candidate or distribute them among various candidates.
Pursuant to CVM Rule No. 561/15, publicly-held companies shall adopt the following measures regarding voting process: (1) inform the market of the adoption of cumulative voting process in annual meetings immediately upon the receipt of the first valid requirement; (2) disclose the voting final summary statements, the voting final detailed statements, as well as any voting statement presented by shareholders at the annual meetings; and (3) register in the minutes of the annual shareholders’ meeting the number of approving, rejecting or abstaining votes for each item of the agenda, including the votes received by each member of the Board of Directors and/or Fiscal Council elected in such annual shareholders’ meeting.
Under our bylaws and applicable law, the number of directors may be reduced to a minimum of three. Since our Shareholders’ Agreement provides that, as long as FAHZ maintains a minimum shareholding in our capital stock, it shall have the right to appoint four members to our Board of Directors, any reduction in the number of such members to fewer than four would be subject to FAHZ’s prior approval. After 2019, however, FAHZ shall have the right to appoint only two members to our Board of Directors.
The current members of our Board of Directors were elected by our controlling shareholders. Board members, regardless of the shareholder they represent, owe fiduciary duties to the Company and all of our shareholders. At the same time, any director appointed by shareholders bound by a shareholders’ agreement is also bound by the terms of that agreement. For more information on our shareholders’ agreements, see “Item 7. Major Shareholders and Related Party Transactions—A. Major Shareholders—Ambev’s Major Shareholders.”
Dividends
The discussion below summarizes the main provisions of the Brazilian Corporation Law regarding the establishment of reserves by corporations and rules with respect to the distribution of dividends, including provisions regarding interest on shareholders’ equity.
Calculation of Distributable Amounts
At each annual shareholders’ meeting, our Board of Directors is required to propose how Ambev’s net income for the preceding fiscal year is to be allocated. For purposes of the Brazilian Corporation Law, a company’s net income after income taxes and social contribution on profits for the immediately preceding fiscal year, net of any accumulated losses from prior fiscal years and amounts allocated to employees’ and management’s participation in earnings, represents its “adjusted net income” for such preceding fiscal year. In accordance with the Brazilian Corporation Law, an amount equal to such adjusted net income, which is also referred to in this section as the distributable amount, will be available for distribution to shareholders in any particular year. Such distributable amount is subject to:
| · | reductions that may be caused by amounts contributed for the purpose of meeting the charges of the assistance foundation for employees and management of the Company and its controlled companies, with due regard for the rules established by the Board of Directors to this effect; up to 10% of the distributable amount may be contributed under this concept; |
107
| · |
reductions caused by amounts allocated to the Legal Reserve or Contingency Reserves (see “—Reserves”); and |
| · |
increases caused by reversals of reserves constituted in prior years. |
Minimum Mandatory Dividend
We are required by our bylaws to distribute to shareholders as dividends in respect to each fiscal year ending on December 31 a minimum mandatory dividend equivalent to no less than 40% of the distributable amount. In addition to the minimum mandatory dividend, the Board of Directors may recommend payment of additional dividends to shareholders. The limit for dividend payment is the distributable amount plus the balance available in our statutory “Investment Reserve,” to which we allocate distributable amounts from previous fiscal years not paid as dividends. See “—Reserves.” Furthermore, the Board of Directors may also resolve on the distribution of interim dividends and/or interest on shareholders’ equity based on the accrued profits or existing profits reserves presented in the latest annual or six-month balance sheet. Interim dividends and interest on shareholders’ equity is always counted as an advancement towards the minimum mandatory dividend.
In addition, the minimum mandatory dividend, whether the full amount or only a portion thereof, may not be distributed in any given year should the Board of Directors consider that such payment is incompatible with the Ambev’s financial situation, subject to shareholder approval. While the law does not establish the circumstances in which distribution of the minimum mandatory dividend is incompatible with a company’s financial situation, it is generally agreed that a company is allowed to refrain from paying the minimum mandatory dividend if such payment threatens its existence as a going concern or harms its normal course of operations. The Fiscal Council must opine on the nonpayment of minimum mandatory dividends, and management must submit to the CVM a report explaining the reasons considered by the Board of Directors to withhold the payment of the minimum mandatory dividend no later than five business days after such a decision is taken.
Any postponed payment of minimum mandatory dividends must be allocated to a special reserve. Any remaining balance in such reserve not absorbed by losses in subsequent fiscal years must be paid to shareholders as soon as the Company’s financial situation allows.
Payment of Dividends
Under the Brazilian Corporation Law any holder of record of shares at the time of a dividend declaration is entitled to receive such dividends, which are generally required to be paid within 60 days following the date of such declaration, unless otherwise resolved by the shareholders’ meetings, which, in either case, must occur prior to the end of the fiscal year in which such dividends were declared. Our bylaws do not provide for a time frame for payment of dividends. The minimum mandatory dividend is satisfied through payments made both in the form of dividends and interest on shareholders’ equity, which, from an economic perspective, is equivalent to a dividend but represents a tax efficient alternative to distribute earnings to shareholders because it is deductible for income tax purposes up to a certain limit established by Brazilian tax laws (see “—Interest on Shareholders’ Equity”). Shareholders have a three-year period from the dividend payment date to claim the payment of dividends, after which we are no longer liable for such payment.
Shareholders who are not residents of Brazil must register their investment with the Central Bank in order for dividends, sales proceeds or other amounts to be eligible for remittance in foreign currency outside of Brazil. Our common shares underlying the Ambev ADSs will be deposited with the Brazilian custodian, Banco Bradesco S.A., which acts on behalf of and as agent for the Depositary, which is registered with the Central Bank as the fiduciary owner of those common shares underlying our ADSs. Payments of cash dividends and distributions on our common shares will be made in reais to the custodian on behalf of the Depositary. The custodian will then convert those proceeds into U.S. dollars and will deliver those U.S. dollars to the Depositary for distribution to ADS holders. If the custodian is unable to immediately convert dividends in reais into U.S. dollars, ADS holders may be adversely affected by devaluations of the real or other exchange rate fluctuations before those dividends can be converted into U.S. dollars and remitted abroad. Fluctuations in the exchange rate between the real and the U.S. dollar may also affect the U.S. dollar equivalent of the trading price of our common shares in reais on the B3.
108
Interest on Shareholders’ Equity
Brazilian companies are permitted to distribute earnings to shareholders under the concept of an interest payment on shareholders’ equity, calculated based on specific Ambev’s shareholders’ equity accounts multiplied by the TJLP rate. The TJLP is the official interest rate defined by the Central Bank and used as reference in long-term loans provided by the BNDES.
Amounts distributed by Ambev to its shareholders as interest on shareholders’ equity is deductible for purposes of income tax and social contribution applicable to our profits. The amount of the deduction may not exceed the greater of:
|
· |
50% of net income (after the deduction of social contribution on net income but before taking into consideration the provision for corporate income tax and the amounts attributable to shareholders as interest on shareholders’ equity) for the period in respect of which the payment is made; or |
|
· |
50% of the sum of retained profits and profit reserves as of the date of the beginning of the period in respect of which the payment is made. |
Interest on shareholders’ equity is treated similarly to dividends for purposes of distribution of profits. The only significant difference is that a 15% withholding income tax is due by nonexempt shareholders, resident or not of Brazil, upon receipt of such interest payment, which tax must be withheld by us on behalf of our shareholders when the distribution is implemented. If the shareholder is not a Brazilian resident, and is resident or domiciled in a tax-haven jurisdiction, withholding income tax is due at a 25% rate. The amount shareholders receive as interest on shareholders’ equity net of taxes is deducted from the minimum mandatory dividend owed to shareholders.
For further information on the taxation of interest on shareholders’ equity, including the concept of tax haven jurisdiction for such purposes, see “—E. Taxation—Brazilian Tax Considerations—Income Tax—Distributions of Interest on Shareholders’ Equity.”
Reserves
General
The Brazilian Corporation Law provides that all discretionary allocations of adjusted net income, including the Unrealized Income Reserve and the Investment Reserve, are subject to shareholder approval and may be added to capital (except for the amounts allocated to the Unrealized Income Reserve) or distributed as dividends in subsequent years. In the case of Tax Incentive Reserve and the Legal Reserve, they are also subject to shareholder approval; however, the use of their respective balances is limited to having those balances added to capital or used to absorb losses. They cannot be used as a source for income distribution to shareholders.
Legal Reserve
Under the Brazilian Corporation Law, corporations are required to maintain a “Legal Reserve” to which they must allocate 5% of their adjusted net income for each fiscal year until the balance of the reserve equals 20% of their share capital. However, corporations are not required to make any allocations to their legal reserve in a fiscal year in which the Legal Reserve, when added to other established capital reserves, exceeds 30% of their share capital. Accumulated losses, if any, may be charged against the Legal Reserve. Other than that, the Legal Reserve can only be used to increase a company’s share capital.
Contingency Reserve
Under the Brazilian Corporation Law, a portion of a corporation’s adjusted net income may also be discretionally allocated to a “Contingency Reserve” for an anticipated loss that is deemed probable in future years. Any amount so allocated in a prior year must be either reversed in the fiscal year in which the loss was anticipated if that loss does not in fact occur or is not charged off in the event that the anticipated loss occurs.
109
Investment Reserve
Under Brazilian Corporation Law, we are permitted to provide for the allocation of part of our net income to discretionary reserve accounts that may be established in accordance with our bylaws. The allocation of our net income to discretionary reserve accounts may not be made if it serves to prevent the distribution of the minimum mandatory distributable amount. According to our bylaws, a portion of our adjusted net income may be allocated to an “Investment Reserve” for the expansion of our activities, including to be capitalized by us or for our investment in new business ventures.
Pursuant to our bylaws, the Investment Reserve balance is not allowed to be greater than 80% of our share capital. In case such limit is reached, shareholders may resolve to use the exceeding amount for conversion into share capital or to be distributed as dividends.
Unrealized Income Reserve
Pursuant to the Brazilian Corporation Law, the amount by which the minimum mandatory dividend exceeds the “realized” portion of net income for any particular year may be allocated to the Unrealized Income Reserve. The realized portion of net income is the amount by which the adjusted net income exceeds the sum of:
|
· |
our net positive results, if any, from the equity method of accounting for earnings and losses of our subsidiaries and certain affiliates; and |
|
· |
the net profits, net gains or net return obtained on transactions or on accounting of assets and liabilities based on their market value, to be completed after the end of the following fiscal year. |
Tax Incentive Reserve
Under the Brazilian Corporation Law, a portion of the adjusted net income may also be allocated to a general “Tax Incentive Reserve” in amounts corresponding to reductions in a company’s income tax generated by credits for particular government-approved investments. This reserve is available only in connection with the acquisition of capital stock of companies undertaking specific government-approved projects.
Goodwill Premium from Shares Issued
Pursuant to the Brazilian Corporation Law, the amount received from subscription of shares in excess of the average book value of the shares must be allocated to this reserve. The amount can be used for future capital increases without the issuance of new shares or to support an approved share buyback program.
Fiscal Benefit of Goodwill Premium Amortization (CVM Rule No. 319/99)
Pursuant to CVM Rule No. 319/99, when a reporting company merges with its parent company, while remaining a reporting company, the goodwill previously paid by the parent company on its acquisition is deductible for purposes of income tax and social contribution on profits. This future tax benefit is recorded as a capital reserve by the reporting company. As this benefit is realized, the company increases its share capital proportionally to the benefit, and is able to issue new shares to the parent company, pursuant to the terms of the merger agreement.
Liquidation
In the event of our liquidation, an extraordinary general shareholders’ meeting shall determine the form of liquidation and appoint a committee to supervise the process during the liquidation period. A liquidator shall be appointed by the Board of Directors.
Restrictions on Foreign Investment
There are no restrictions on ownership or voting rights in respect of our common shares owned by individuals or legal entities domiciled outside Brazil. For a description of voting rights, see “—Rights of the Ambev Common Shares” and “—Shareholders’ Meetings.” The right to convert payments of dividends (including interest on shareholders’ equity) and proceeds from the sale of our common shares into foreign currency and to remit those amounts outside Brazil, however, is subject to exchange control and foreign investment legislation. For a description of these exchange control restrictions and foreign investment legislation, see “Item 3. Key Information—A. Selected Financial Data—Exchange Controls.”
110
Appraisal Rights
Under the Brazilian Corporation Law, dissenting shareholders have appraisal rights that allow them to withdraw from the Company and be reimbursed for the value of their Ambev common shares, whenever a decision is taken at a shareholders’ meeting by a qualified quorum of shareholders representing at least 50% of the total voting capital to (among others):
|
· |
create preferred shares or increase disproportionately an existing class of preferred shares relative to the other classes of shares, unless such action is provided for or authorized by our bylaws; |
|
· |
modify a preference, privilege or condition of redemption or amortization conferred upon one or more classes of preferred shares, or create a new class with greater privileges than the existing classes of preferred shares; |
|
· |
reduce the minimum mandatory dividend; |
|
· |
merge or consolidate us with another company; |
|
· |
change our corporate purpose; |
|
· |
conduct a spin-off of Ambev, if the new entities resulting from the spin-off have different primary corporate purposes or a lower minimum mandatory dividend or such spin-off causes us to join a group of companies (as defined in the Brazilian Corporation Law); |
|
· |
transform us into another corporate type; |
|
· |
conduct a stock swap merger of Ambev with another company, so that Ambev becomes a wholly-owned subsidiary of that company; or |
|
· |
approve the acquisition of control of another company, the price of which exceeds the limits set forth in the Brazilian Corporation Law. |
In cases where Ambev merges with another company or participates in a group of companies (as defined in the Brazilian Corporation Law), our shareholders will not be entitled to exercise appraisal rights if their Ambev common shares are (1) liquid, defined as being part of the IBOVESPA Index or another traded stock exchange index (as defined by the CVM) and (2) widely-held such that the controlling shareholder or companies under its control holds less than 50% of the referred common shares.
Appraisal rights expire within 30 days after publication of the minutes of the relevant shareholders’ meeting that approved the transaction. We are entitled to reconsider any action triggering appraisal rights within 10 days following the expiration of the 30-day appraisal rights exercise period if the redemption of our common shares held by dissenting shareholders would jeopardize our financial stability.
Any shareholder that exercises appraisal rights is, in general, entitled to receive the amount equivalent to its shares’ book value as per the last balance sheet approved by our shareholders. If the resolution giving rise to appraisal rights is approved within more than 60 days after the date of the last shareholder-approved balance sheet of Ambev, dissenting shareholders may require that the value of their shares be calculated on the basis of an updated balance sheet (balanço especial) dated no less than 60 days before the resolution date. In this case, we must (1) immediately advance 80% of the book value of the shares to be redeemed according to the most recent balance sheet approved by our shareholders and (2) pay the remaining balance within 120 days after the date of the resolution of the shareholders’ meeting. However, if the advanced payment of 80% of the book value of the shares to be redeemed is greater than the actual appraisal rights value per share determined by the updated balance sheet, then the amount in excess advanced by the Company shall be refunded to us by the dissenting shareholders who exercised appraisal rights.
111
As a general rule, shareholders who acquire their shares after the publishing of a first meeting call notice or the relevant press release concerning the meeting will not be entitled to appraisal rights.
Preemptive Rights
Each shareholder of Ambev generally has preemptive rights to subscribe for new shares of Ambev in our capital increases (including in the issuance of stock purchase warrants or convertible bonds) in proportion to its shareholdings. A minimum 30-day period following the publication of the capital increase notice is given for the exercise of preemptive rights. Preemptive rights may be purchased and sold by shareholders. Our bylaws provide that if the Board of Directors decides to increase our share capital within the limit of the authorized capital through sales in stock exchanges, public offerings or public tender offers, no preemptive rights will apply. In addition, Brazilian law provides that the grant or the exercise of stock options pursuant to certain stock option plans, such as our Stock Option Plan, is not subject to preemptive rights.
Inspection of Corporate Records
Shareholders that own 5% or more of our outstanding share capital have the right to inspect our corporate records, including shareholders’ lists, corporate minutes, financial records and other documents, if (1) Ambev or any of its officers or directors have committed any act contrary to Brazilian law or our bylaws or (2) there are grounds to suspect that there are material irregularities in the Company. However, in either case, shareholders desiring to inspect our corporate records must obtain a court order authorizing the inspection.
Form and Transfer
Brazilian law provides that ownership of shares issued by a Brazilian corporation shall generally be evidenced only by a record of ownership maintained by either the corporation or an accredited intermediary, such as a bank, acting as a registrar for the shares. Banco Bradesco S.A. currently maintains our share ownership records.
Because our common shares are in registered book-entry form, a transfer of those shares is made under the rules of the Brazilian Corporation Law, which provides that a transfer of shares is effected by an entry made by the registrar for our shares in its books, by debiting the share account of the transferor and crediting the share account of the transferee.
Transfers of shares by a foreign investor are made in the same way and executed by that investor’s local agent on the investor’s behalf, except that, if the original investment was registered with the Central Bank pursuant to foreign investment regulations, the foreign investor should also seek, through its local agent, an amendment of the corresponding electronic registration to reflect the new ownership, if necessary.
The B3 operates a central clearing system. A holder of our common shares may choose, at its discretion, to participate in this system, and all shares elected to be transferred to this system will be deposited in custody with the stock exchange through a Brazilian institution that is duly authorized to operate by the Central Bank and maintains a clearing account with the stock exchange. Our common shares that are subject to custody with the stock exchange will be reflected in our registry of shareholders. Each participating shareholder will, in turn, be registered in our register of beneficial shareholders maintained by the stock exchange and will be treated in the same way as registered shareholders.
Disclosure of Principal Shareholders
Under Brazilian law, shareholders owning more than 5% of a company’s voting shares must publicly disclose their shareholder ownership, as well as disclose any 5% increase or decrease.
With the issuance of CVM Rule No. 568/15, the CVM has amended CVM Rule No. 358/02 dealing with disclosure requirements of significant interests in Brazilian corporations. These amendments provided for, among other things: (1) the change in the form of calculation of trades of relevant equity interests to determine when a disclosure obligation of those trades is triggered, and (2) the regulation of individual investment plans.
112
Individual investment plans for direct or indirect controlling shareholders, members of any statutory governing bodies of a corporation, as well as any persons who, due to their responsibility, function or position in a listed company, its controlling company, subsidiaries or affiliates have potential access to insider information, are now allowed, subject to certain requirements, to trade in the company’s shares during certain periods during which such trading was previously prohibited.
CVM Rule No. 568/15 amended CVM Rule No. 358/02 in order to also require publicly held corporations to disclose monthly information of trades in their own securities executed by them or their affiliates.
Other Significant Provisions of the Brazilian Corporation Law
The Brazilian Corporation Law, as applicable to us, also requires the following:
|
· |
upon a disposition of our control, the acquirer is required to launch a tender offer to purchase all minority voting shares at a price equal to at least 80% of the price per share paid for the controlling stake; |
|
· |
our delisting is subject to an administrative proceeding before the CVM, having as a condition the launching of a tender offer by the controlling shareholder or us for the acquisition of all our outstanding shares (defined as those owned by shareholders other than the controlling shareholder, officers and directors) at their fair value, as determined by an independent appraiser. Shareholders holding more than two-thirds of the free float of shares must accept the tender offer or must expressly agree with the delisting (for this purpose, the free float of shares must be considered those held by shareholders that have either accepted the delisting or the offer); |
|
· |
in addition, if a controlling shareholder or group of controlling shareholders acquires additional shares in excess of one-third of the free float of shares in any class, a mandatory tender offer to ensure share dispersion is required for all the outstanding shares in that class. The same requirement applies whenever (1) a shareholder or group of shareholders representing the same interest and holding more than 50% of the shares in any class from March 7, 2002 (when CVM Rule No. 361/02 became effective, except for public companies existing in September 5, 2000, in which case this date will prevail), acquires a further interest of 10% or more of that same class of shares within a 12-month period and (2) the CVM determines, within six months after being informed, that the acquisition restricts the liquidity of the shares; |
|
· |
upon the occurrence of a tender offer aimed at delisting a company or through which the controlling shareholders will acquire more than one-third of the free float shares, the purchase price shall be equal to the fair value of the shares considering the total number of outstanding shares; |
|
· |
members of our Board of Directors elected by noncontrolling shareholders have the right to veto the choice of the independent appraiser by the Board; |
|
· |
our controlling shareholders, the shareholders that elect members to our Board of Directors or Fiscal Council, the members of our Board of Directors and Fiscal Council, and our executive officers are required to disclose any purchase or sale of our shares to the CVM and to the B3; and |
|
· |
the chairman of any shareholders’ meeting or directors shall disregard any vote that is rendered against provisions of any shareholders’ agreement if that shareholders’ agreement has been duly filed with us, as is the case with our Shareholders’ Agreement. |
C. Material Contracts
In addition to the contracts described in other sections of this annual report, the following is a summary of the material contracts to which we are a party.
113
Shareholders’ Agreement
See “Item 7. Major Shareholders and Related Party Transactions—A. Major Shareholders—Ambev’s Major Shareholders—Ambev Shareholders’ Agreement” and “Item 7. Major Shareholders and Related Party Transactions—A. Major Shareholders—Ambev’s Major Shareholders—The 2019 Shareholders’ Agreement.”
Acquisitions, Dispositions and Joint Ventures
We have discussed the details of some material acquisitions and agreements related thereto in “Item 4. Information on the Company—A. History and Development of the Company.”
Licensing Agreements
Pepsi
See “Item 4. Information on the Company—B. Business Overview—Licenses—Pepsi.”
Licensing Agreements with ABI
See “Item 4. Information on the Company—B. Business Overview—Licenses—Licensing Agreements with ABI.”
Tax Benefits
Many states in Brazil offer tax benefits programs to attract investments to their regions. We participate in ICMS Value-added Tax Credit Programs offered by various Brazilian states which provide (1) tax credits to offset ICMS Value-Added Tax payables and (2) ICMS Value-Added Tax deferrals. In return, we are required to meet certain operational requirements including, depending on the state, production volume and employment targets, among others. All of these conditions are included in specific agreements between Ambev and the state governments. In the event that we do not meet the program’s targets, future benefits may be withdrawn. Also, the State of São Paulo has challenged, in the Brazilian Supreme Court, state laws upon which certain of the above benefits have been granted, on the basis that they constitute tax benefits created without certain approvals required under Brazilian tax laws and regulations, which would render such state laws unconstitutional. There is also a controversy regarding whether these benefits are constitutional when granted without the approval of every state of the country. Although the Brazilian Supreme Court has already declared part of the State of Pará’s tax benefits law unconstitutional, almost every state has specific legislation on this topic and even the State of Pará may still grant benefits which were not included in this decision. Accordingly, as far as the tax benefits are granted based on the state legislation, most companies apply for and use those benefits when granted. On August 8, 2017, Supplementary Law No. 160 was published authorizing the states and the Federal District to revalidate within 180 days the tax benefits allegedly created without the approvals required under Brazilian tax laws and regulations by means of an Interstate Agreement. Under the provisions of Supplementary Law No. 160, Confaz Interstate Agreement No. 190 was published on December 18, 2017, allowing the states to republish and reinstall the state tax benefits created up to August 08, 2017. The validation of such tax incentives, however, is not self-applicable and it depends on the fulfillment of certain conditions by the granting state. See “Item 5. Operating and Financial Review and Prospects—B. Liquidity and Capital Resources—Sales Tax Deferrals and Other Tax Credits” and “Item 3. Key Information—D. Risk Factors.”
Material Financing Agreements
For a discussion of our 2021 debentures, see “Item 5. Operating and Financial Review and Prospects—B. Liquidity and Capital Resources—Borrowings—Long-term Debt.”
D. Exchange Controls and other Limitations Affecting Security Holders
See “Item 3. Key Information—A. Selected Financial Data—Exchange controls.”
114
E. Taxation
The following summary contains a description of the material Brazilian and U.S. federal income tax consequences of acquiring, holding and disposing of common shares or ADSs issued by us. This discussion is not a comprehensive discussion of all the tax considerations that may be relevant to a decision to purchase, hold or dispose of our common shares or ADSs and is not applicable to all categories of investors, some of which may be subject to special rules. Each prospective purchaser is urged to consult its own tax advisor about the particular Brazilian and U.S. tax consequences to it of an investment in our common shares or ADSs.
The summary is based upon tax laws of Brazil and the U.S. and the regulations thereunder, as in effect on the date hereof, which are subject to change (possibly with retroactive effect). Although there is at present no income tax treaty between Brazil and the U.S., the tax authorities of the two countries have entered into a Tax Information Exchange Agreement and have had discussions that may culminate in a treaty. No assurance can be given, however, as to whether or when a treaty will enter into force or of how it will affect the U.S. Holders of our common shares or ADSs. This summary is also based on representations of the depositary and on the assumption that each obligation in the Deposit Agreement relating to our ADSs and the related documents will be performed in accordance with its terms.
Brazilian Tax Considerations
The following discussion summarizes the material Brazilian tax consequences of the acquisition, ownership and disposition of our common shares or ADSs by a holder that is not deemed to be domiciled in Brazil for purposes of Brazilian taxation and, in the case of a holder of common shares, which has registered its investment in such securities with the Central Bank as a U.S. dollar investment (in each case, a “Non-Brazilian Holder”).
The discussion does not purport to be a comprehensive description of all tax considerations that may be relevant to a decision to purchase our common shares or ADSs. The discussion below is based on Brazilian law as currently in effect. Any change in such law may change the consequences described below. The following discussion does not specifically address all of the Brazilian tax considerations applicable to any particular Non-Brazilian Holder, and each Non-Brazilian Holder should consult his or her own tax advisor concerning the Brazilian tax consequences of an investment in our common shares or ADSs.
Income Tax
Taxation of Dividends
Dividends paid by us to The Bank of New York Mellon in respect of the common shares underlying the respective ADSs, or to a Non-Brazilian Holder with respect to our common shares, currently will not be subject to Brazilian withholding income tax provided that they are paid out of profits generated as of January 1, 1996. Dividends paid from profits generated before January 1, 1996 may be subject to Brazilian withholding income tax at variable rates according to the tax legislation applicable to each corresponding year.
Taxation of Gains
Gains realized outside Brazil by a Non-Brazilian Holder on the disposition of assets located in Brazil, including our common shares, to a Brazilian resident or to a non-resident in Brazil, are subject to Brazilian withholding income tax.
Gains realized by a Non-Brazilian Holder on a sale or disposition of our common shares carried out on the Brazilian stock exchange, which includes the transactions carried out on the organized over-the-counter market, are:
|
· |
exempt from income tax when realized by a Non-Brazilian Holder that (1) has registered its investment in Brazil with the Central Bank under the rules of CMN Resolution No. 4,373/2014, or a 4,373 Holder, and (2) is not resident or domiciled in a tax haven jurisdiction, as defined below; or |
|
· |
in all other cases, subject to income tax at a rate of up to 25%. In addition, a withholding tax of 0.005% of the sale value shall be applicable and withheld by the intermediary institution (i.e, a broker) that receives the order directly from the Non-Brazilian Holder, which can be later offset against any income tax due on the capital gain earned by the Non-Brazilian Holder. |
115
Any other gains assessed on a sale or disposition of the shares that is not carried out on a Brazilian stock exchange are subject to withholding tax at a rate of up to 25%. Lower rates may be applicable as provided for in an applicable tax treaty entered into between Brazil and the country where the Non-Brazilian Holder is resident. If these gains are related to transactions conducted on the Brazilian non-organized over-the-counter market with intermediation, a withholding tax of 0.005% on the sale value will also apply and can be used to offset the income tax due on the capital gain.
As of January 2017, Law No. 13,259/2016 increased the income tax rates applicable to gains realized by Brazilian resident individuals on sale or disposition of shares not carried out on a Brazilian stock exchange from a flat tax rate of 15.0% to progressive rates varying from 15% up to 22.5%. The income tax rates recognized by Brazilian individuals’ capital gains would be: (1) 15% for the part of the gain that does not exceed R$5 million, (2) 17.5% for the part of the gain that exceeds R$5 million but does not exceed R$10 million, (3) 20% for the part of the gain that exceeds R$10 million but does not exceed R$30 million and (4) 22.5% for the part of the gain that exceeds R$30 million. These increased income tax rates may also affect Non-Brazilian Holders, except for 4,373 Holders that are not resident or domiciled in tax haven jurisdictions and that carry out a sale or disposition of our common shares in a stock exchange environment, including over-the-counter market, which are still exempt from income tax.
The statutory definition of a tax-haven jurisdiction for the purpose of income taxation on gains should differ depending on whether or not the investment in our common shares or ADSs is registered under CMN Resolution No. 4,373 or under Law No. 4,131. In the case of gains arising from an investment registered under Resolution No. 4,373, a country or location should be defined as a tax-haven jurisdiction when such country or location (a) does not tax income, or (b) taxes income at a rate lower than 20%. In turn, in the case of gains arising from an investment under Law No. 4,131, in addition to criteria (a) and (b) above for the definition of a tax-haven jurisdiction, a country or location should also be considered a tax-haven jurisdiction if the laws of such country or location do not allow access to information related to shareholding composition, to the ownership of investments, or to the identification of the beneficial owner of earnings that are attributed to non-residents.
On November 28, 2014, the Finance Ministry issued Ordinance No. 488 reducing to 17% the maximum income tax rate that may be imposed by a given jurisdiction for characterization of a tax haven jurisdiction for income tax purposes, as long as the jurisdiction complies with international tax transparency standards. The RFB subsequently issued Normative Instruction No. 1,530/14 providing that compliance with such standards requires: (a) signature of or conclusion of negotiation to sign a treaty or agreement allowing the exchange of information related to identification of income beneficiaries, corporate structure, ownership of goods or rights or economic transactions; and (b) commitment to the criteria defined in international anti-tax evasion forums of which Brazil is a member.
The RFB regularly issues a list of jurisdictions which are considered tax-haven jurisdictions, the “black-list”. Such list is currently set forth in Normative Instruction No. 1,037/10, as amended. Please note that the “black-list” provided for in Normative Instruction No. 1,037/10 does not seem to differ from the tax haven jurisdiction definition for the purposes of investments registered under CMN Resolution No. 4,373 or under Law No. 4,131.1
1 The countries currently included in this list, according to Article 1 of RFB Normative Instruction No. 1,037/10 are: Andorra, Anguilla, Antigua e Barbuda, Aruba, Ascension Islands, Bahamas, Bahrain, Barbados, Belize, Bermuda, British Virgin Islands, Brunei, Campione D’Italia, Channel Islands (Jersey, Guernsey, Alderney and Stark), Cayman Island, Curaçao, Cyprus, the Cook Islands, Djibouti, Dominica, United Arab Emirates, Gibraltar, Grenada, Hong Kong, Ireland, Kiribati, Lebanon, Libya, Liberia, Liechtenstein, Macau, Maldives, Man Island, Marshall Island, Mauritius Island, Monaco, Montserrat Island, Nauru, Niue Island, Norfolk Island, Panama, Pitcairn Island, American French Polynesia, Qeshm Island, American Samoa, Western Samoa, San Marino, Saint Helena Island, Santa Lucia, Federation of Saint Christopher and Nevis, Saint Martin, Saint-Pierre e Miquelon, Saint Vincent and the Grenadines, Seychelles, Solomon Island, Swaziland, Sultanate of Oman, Tonga, Tristan da Cunha, Turks and Caicos Islands, Vanuatu and Virgin Islands. In addition, in Article 2 of RFB Normative Instruction No. 1,037/10, U.S. state LLCs held by non-residents and not subject to federal income tax in the U.S. and holding companies without substantial economic activity domiciled in Denmark and Netherlands are listed as tax privileged domiciled entities, as well as: (1) Financial Investment Companies of Uruguay (Sociedades Financeiras de Inversão), (2) Holding companies domiciled in Denmark, Netherlands and Austria, which do not develop “substantial economic activities,” as defined by the single paragraph of Article 2, (3) International Trading Company (ITC) domiciled in Iceland, (4) Entidad de Tenencia de Valores Extranjeros (ETVEs) of Spain, (5) the International Trading Companies (ITC) and International Holding Companies (IHC) domiciled in Malta, (6) Limited Liability Company (LLC) of United States of America and (7) the Holding Company, Domiciliary Company, Auxiliary Company, Mixed Company and Administrative Company domiciled in Switzerland subject to Federal, Cantonal and Municipal income tax at a combined rate lower than 20%, (8) companies in the Free Trade Zone of Costa Rica, (9) companies in the International Business Center of Madeira Island in Portugal, (10) and the following special regimes provided for the Singapore legislation: (i) special rate of tax for non-resident shipowner or charterer or air transport undertaking; (ii) exemption and concessionary rate of tax for insurance and reinsurance business; (iii) concessionary rate of tax for Finance and Treasury Centre; (iv) concessionary rate of tax for trustee company; (v) concessionary rate of tax for income derived from debt securities; (vi) concessionary rate of tax for global trading company and qualifying company); (vii) concessionary rate of tax for financial sector incentive company; (viii) concessionary rate of tax for provision of processing services for financial institutions; (ix) concessionary rate of tax for shipping investment manager; (x) concessionary rate of tax for trust income to which beneficiary is entitled; (xi) concessionary rate of tax for leasing of aircraft and aircraft engines; (xii) concessionary rate of tax for aircraft investment manager; (xiii) concessionary rate of tax for container investment enterprise; (xiv) concessionary rate of tax for container investment manager; (xv) concessionary rate of tax for approved insurance brokers; (xvi) concessionary rate of tax for income derived from managing qualifying registered business trust or company; (xvii) concessionary rate of tax for ship broking and forward freight agreement trading; (xviii) concessionary rate of tax for shipping-related support services; (xix) concessionary rate of tax for income derived from managing approved venture company; and (xx) concessionary rate of tax for international growth company. Netherlands was temporarily removed from the list, in 2010, and then re-included in the list, in 2015. The effects of the inclusion of the ETVE regime in the list were suspended by RFB Declaratory Act No. 22/2010, due to a review request presented by the Spanish government to Brazilian authorities.
116
We understand that ADSs are not assets located in Brazil for the purposes of the above-mentioned taxation on gains. However, we are unable to predict how Brazilian courts would view this issue, and to date, we are not aware of any judicial or administrative precedent on this specific matter. The withdrawal of ADSs in exchange for shares is not subject to Brazilian income tax, as far as the regulatory rules in respect to the registration of the investment before the Central Bank are duly observed. The deposit of the shares in connection with the issuance of ADSs is not subject to Brazilian tax, provided that the shares are registered under Resolution No. 4,373 and the investor is not located in a tax-haven jurisdiction, considering the definition described above. There is a special taxation system applicable to Non-Brazilian Holders (provided investments are duly registered under Resolution No. 4,373 and with the CVM and other conditions are fulfilled). Upon receipt of the underlying shares, a Non-Brazilian Holder who qualifies under Resolution No. 4,373 will be entitled to register the U.S. dollar value of such shares with the Central Bank as described below.
As a general rule, the “gain realized” as a result of a transaction on a Brazilian stock exchange and the “gain realized” as a result of a transaction with shares which are registered under a Law No. 4,131 is the difference between the amount in Brazilian currency realized on the sale or exchange of the shares and their acquisition cost, without any correction for inflation. These gains will accordingly be subject to tax at a rate of up to 25%.
There can be no assurance that the current preferential treatment for holders of ADSs and Non-Brazilian Holders of shares under Resolution No. 4,373 will continue in the future or that it will not be changed in the future.
Any exercise of preemptive rights relating to the Ambev common shares or ADSs will not be subject to Brazilian taxation. Gains on the sale of preemptive rights relating to the shares will be treated differently for Brazilian tax purposes depending on (1) whether the sale is made by The Bank of New York Mellon or the investor and (2) whether the transaction takes place on a Brazilian stock exchange. Gains on sales made by the depositary on a Brazilian stock exchange are not taxed in Brazil, but gains on other sales may be subject to tax at rates of up to 25%.
117
Distributions of Interest on Shareholders’ Equity
In accordance with Law No. 9,249, dated December 26, 1995, Brazilian corporations may make payments to shareholders characterized as distributions of interest on their shareholders’ equity. Such interest is calculated by multiplying the TJLP, as determined by the Central Bank from time to time, by the sum of the determined Brazilian company’s net equity accounts.
Distributions of interest on shareholders’ equity in respect of the Ambev common shares paid to shareholders who are either Brazilian residents or non-Brazilian residents, including holders of ADSs, are subject to Brazilian withholding tax at the rate of 15% or 25% if the payee is domiciled in a tax-haven jurisdiction. In this case, of interest on shareholders’ equity, a payee’s country or location should be deemed a tax-haven jurisdiction when (a) such country or location does not tax income, (b) such country or location taxes income at a rate lower than 20%, or (c) the laws of such country or location do not allow access to information related to shareholding composition, to the ownership of investments, or to the identification of the beneficial owner of earnings that are attributed to non-residents. As explained in “—Taxation of Gains,” the RFB reduced to 17% the maximum income tax rate that may be imposed by a given jurisdiction for the purpose of characterization of a tax-haven jurisdiction, as long as the country complies with international tax transparency standards.
The amounts paid as distribution of interest on shareholders’ equity are deductible from the taxable basis of the corporate income tax and social contribution on net profits, both of which are taxes levied on our profits, as long as the payment of a distribution of interest is approved at a general meeting of shareholders of the Company. The amount of such deduction cannot exceed the greater of:
|
· |
50% of net income (after social contribution on net profits, and before taking such distribution and any deductions for corporate income tax into account) for the period in respect of which the payment is made; or |
|
· |
50% of the sum of retained earnings and profit reserves as of the initial date of the period in respect of which the payment is made. |
The distribution of interest on shareholders’ equity may be determined by the Board of Directors. No assurance can be given that the Board of Directors will not determine that future distributions of profits may be made by means of interest on shareholders’ equity instead of by means of dividends. These payments of interest on shareholders’ equity may be included, at their net value, as part of any mandatory dividend. To the extent payment of interest on shareholders’ equity is so included, the corporation may be required to distribute to shareholders an additional amount to ensure that the net amount received by them, after payment of the applicable withholding income tax, plus the amount of declared dividends is at least equal to the mandatory dividend.
There are discussions in Congress regarding possible changes to the tax treatment of interest on shareholders’ equity from time to time.
Other Relevant Brazilian Taxes
There are no Brazilian inheritance, gift or succession taxes applicable to the ownership, transfer or disposition of shares or ADSs by a Non-Brazilian Holder except for gift and inheritance taxes which may be levied by some states of Brazil. There currently are no Brazilian stamp, issue, registration or similar taxes or duties payable by holders of shares or ADSs.
Brazilian law imposes a Tax on Foreign Exchange Transactions, or “IOF/Exchange,” on the conversion of reais into foreign currency and on the conversion of foreign currency into reais. As from October 7, 2014, the general IOF/Exchange rate applicable to almost all foreign currency exchange transactions was increased from zero to 0.38%, although other rates may apply in particular operations, such as:
118
· inflow related to transactions carried out in the Brazilian financial and capital markets, including investments in our common shares by investors which register their investment under Resolution No. 4,373, zero;
· outflow related to the return of the investment mentioned under the first bulleted item above, zero; and
· outflow related to the payment of dividends and interest on shareholders’ equity in connection with the investment mentioned under the first bulleted item above, zero.
Notwithstanding these rates of the IOF/Exchange, in force as of the date hereof, the Minister of Finance is legally entitled to increase the rate of the IOF/Exchange to a maximum of 25% of the amount of the currency exchange transaction, but only on a prospective basis.
Tax on Transactions Involving Bonds and Securities, or “IOF/Bonds” may be levied on transactions involving shares, even if the transactions are effected on Brazilian stock, futures or commodities exchanges. IOF/Bonds may also be levied on transactions involving ADSs if they are considered assets located in Brazil by the Brazilian tax authorities. As mentioned in the above discussion on taxation of gains, we are unable to predict how Brazilian courts would view this issue, and to date, we are not aware of any judicial or administrative precedent on this specific matter. As from December 24, 2013, the IOF/Bonds levies at a rate of zero percent on the transfer (cessão) of shares traded in a Brazilian stock exchange environment with the specific purpose of enabling the issuance of depositary receipts to be traded outside Brazil. Previously, a rate of 1.5% was applied to the product of (a) the number of shares which are transferred, multiplied by (b) the closing price for such shares on the date prior to the date of the transfer. If no closing price was available on that date, the last available closing price was adopted. The rate of IOF/Bonds with respect to other transactions related to shares and ADSs (if applicable) is currently zero. The Minister of Finance, however, has the legal power to increase the rate to a maximum of 1.5% of the amount of the taxed transaction per each day of the investor’s holding period, but only on a prospective basis.
Tax Regime Created by Law No. 12,973 in 2014
Provisional Measure 627/13 was converted into Law No. 12,973, enacted on May 13, 2014, which revoked the so-called transitional tax regime (Regime Tributário de Transição - RTT) and introduced a new tax regime, in line with the current Brazilian accounting standards (IFRS). According to Law No. 12,973, companies, such as us, that elected to be taxed under the new regime starting on January 1, 2014, as opposed to January 1, 2015, will not be subject to taxation on dividend distributions based on 2014 profits, as established by RFB Normative Instruction No. 1,397/13, as amended by RFB Normative Instruction No. 1,492/14. Furthermore, dividends paid by us based on profits are generally not subject to withholding income tax (see “—Income Tax—Taxation of Dividends”).
United States Federal Income Tax Considerations
The following discussion is a summary of the U.S. federal income tax considerations relating to the ownership, sale or disposition of our common shares or ADSs. This summary is based on the Internal Revenue Code of 1986, as amended, or the Code, its legislative history, existing final, temporary and proposed U.S. Treasury Regulations, rulings and judicial decisions, all as currently in effect and all of which are subject to prospective and retroactive changes and differing interpretations.
This summary does not purport to address all U.S. federal income tax consequences that may be relevant to a particular holder and you are urged to consult your tax advisor regarding your specific tax situation. The summary applies only to holders who hold our common shares or ADSs as “capital assets” for U.S. federal income tax purposes (generally, property held for investment). This summary does not address the tax consequences that may be relevant to holders subject to special treatment, including, for example:
· insurance companies;
· tax-exempt organizations;
· dealers in securities or currencies;
119
· traders in securities that elect to use a mark-to-market method of accounting for their securities holdings;
· banks, mutual funds and other financial institutions;
· partnerships or other pass-through entities treated as such for U.S. federal income tax purposes;
· a person whose functional currency is not the U.S. dollar;
· certain former citizens or long-term residents of the United States;
· S corporations and small business investment companies;
· real estate investment trusts and regulated investment companies;
· holders that hold our common shares or ADSs as part of a hedge, straddle, conversion or other integrated transaction, for U.S. federal income tax purposes;
· holders that own, directly, indirectly or constructively, 10% or more of the total combined voting power of our stock; or
· holders that acquired their Ambev common shares or ADSs as compensation.
This summary assumes that we are not a passive foreign investment company, or PFIC, for U.S. federal income tax purposes. For further information, see the discussion under “—Taxation of U.S. Holders—Passive Foreign Investment Company (PFIC) Rules” below.
Further, this summary does not address the 3.8% Medicare tax on certain investment income, the alternative minimum tax consequences of holding Ambev common shares or ADSs, or the indirect consequences to holders of equity interests in entities that own such common shares or ADSs. In addition, this summary does not address the state, local, foreign or other tax consequences, if any, of holding Ambev common shares or ADSs.
You should consult your tax advisor regarding the U.S. federal, state, local and foreign income and other tax consequences of acquiring, owning and disposing of our common shares or ADSs in your particular circumstances.
For purposes of this summary, you are a “U.S. Holder” if you are a beneficial owner of Ambev common shares or ADSs and you are for U.S. federal income tax purposes:
· a citizen or resident of the United States;
· an entity treated as a corporation for U.S. federal income tax purposes created or organized in or under the laws of the United States or any state thereof, or the District of Columbia;
· an estate the income of which is subject to U.S. federal income tax regardless of its source; or
· a trust if (1) a court within the United States is able to exercise primary supervision over its administration and one or more U.S. persons have the authority to control all substantial decisions of the trust or (2) the trust has in effect a valid election to be subject to tax as a U.S. person.
If a partnership (or an entity or arrangement treated as a partnership for U.S. federal income tax purposes) holds or disposes of Ambev common shares or ADSs, the tax treatment of a partner in that partnership will generally depend upon the status of the partner and the activities of the partnership. A partner in a partnership holding or disposing of Ambev common shares or ADSs should consult its tax advisor regarding the U.S. federal income tax consequences to it of holding or disposing of our securities.
120
The discussion below assumes that the representations contained in the ADS deposit agreement are true and that the obligations in the ADS deposit agreement and any related agreements will be complied with in accordance with their terms. In general, for U.S. federal income tax purposes, U.S. Holders who own ADSs will be treated as the beneficial owners of the underlying common shares represented by those ADSs. Accordingly, the surrender of ADSs in exchange for common shares (or vice versa) will not result in the realization of gain or loss for U.S. federal income tax purposes. The rest of this discussion assumes that a holder of an ADS will be treated for U.S. federal income tax purposes as directly holding the underlying common shares.
Distributions on the Ambev Common Shares or ADSs
Subject to the discussion below under “—Passive Foreign Investment Company (PFIC) Rules,” the gross amount of distributions paid by us to a U.S. Holder (including amounts withheld to pay Brazilian withholding taxes, if any) with respect to our common shares or ADSs (including distributions of interest on shareholders’ equity) will generally be taxable to such U.S. Holder as ordinary dividend income or qualified dividend income (as further described below) to the extent that such distribution is treated as paid out of our current or accumulated earnings and profits (as determined for U.S. federal income tax purposes). Distributions in excess of our current or accumulated earnings and profits will be treated as a non-taxable return of capital reducing such U.S. Holder’s tax basis in our common shares or ADSs, as applicable. Any distribution in excess of such tax basis will be treated as capital gain and will be either long-term or short-term capital gain depending upon whether the U.S. Holder held our common shares or ADSs, as applicable, for more than one year at the time of the distribution. We do not calculate our earnings and profits under U.S. federal income tax principles. Therefore a U.S. Holder should expect that the entire amount of a distribution will generally be treated as a dividend even if the distribution would otherwise be treated as a non-taxable return of capital or as capital gain under the rules described above.
Dividends received by a U.S. Holder will generally be taxed at ordinary income tax rates. However, a non-corporate U.S. Holder will generally be taxed at the lower rate applicable to qualified dividend income, provided that (1) our common shares or ADSs are “readily tradable on an established securities market in the United States,” (2) we are not a PFIC (as discussed below) for either the taxable year in which the dividend is paid or the preceding taxable year, and (3) certain holding period and other requirements are satisfied. For purposes of clause (1) above, we expect the ADSs to be treated as readily tradable on an established securities market in the United States. Consequently, we expect dividends paid with respect to ADSs to constitute “qualified dividend income” provided that the other requirements set forth above are satisfied. The Ambev common shares, however, are not expected to be treated as readily tradable on an established securities market in the United States. U.S. Holders are urged to consult their tax advisors regarding the availability of the lower rate for any dividends paid with respect to such shares.
A U.S. Holder may be entitled, subject to a number of complex rules and limitations, to claim a U.S. foreign tax credit in respect of any Brazilian withholding taxes imposed on distributions received on our common shares or ADSs. U.S. Holders that do not elect to claim a foreign tax credit may instead be entitled to claim a deduction in respect of any such withholdings. Dividends received with respect to our common shares or ADSs will generally be treated as foreign-source income and will generally constitute “passive income” for U.S. foreign tax credit limitation purposes. The rules relating to the foreign tax credit are complex and U.S. Holders are urged to consult their tax advisors regarding the availability of the foreign tax credit under their particular circumstances.
Dividends received by a U.S. Holder generally will not be eligible for the dividends received deduction available to certain corporate U.S. Holders.
For U.S. federal income tax purposes, the amount of any cash distribution paid in Brazilian currency will equal the U.S. dollar value of the distribution, calculated by reference to the exchange rate in effect at the time the distribution is received by the depositary (in the case of ADSs) or by the U.S. Holder (in the case of Ambev common shares held directly by such U.S. Holder), regardless of whether the payment is in fact converted to U.S. dollars at that time. A U.S. Holder should not recognize any foreign currency gain or loss if such Brazilian currency is converted into U.S. dollars on the date received. If the Brazilian currency is not converted into U.S. dollars on the date of receipt, however, gain or loss may be recognized upon a subsequent sale or other disposition of the Brazilian currency. Such foreign currency gain or loss, if any, will generally be U.S.-source ordinary income or loss.
121
Sale, Exchange or Other Taxable Disposition of Ambev Common Shares or ADSs
Subject to the discussion below under “—Passive Foreign Investment Company (PFIC) Rules,” a U.S. Holder will generally recognize capital gain or loss upon the sale, exchange or other taxable disposition of our common shares or ADSs, measured by the difference between the U.S. dollar value of the amount realized and the U.S. Holder’s tax basis in those common shares or ADSs. If Brazilian tax is withheld on the sale or disposition, the amount realized by a U.S. Holder will include the gross amount of the proceeds of that sale or disposition before deduction of the Brazilian tax. Any gain or loss will be long-term capital gain or loss if our common shares or ADSs have been held for more than one year at the time of the sale, exchange or other taxable disposition. Long-term capital gains recognized by individuals are currently subject to reduced rates of taxation. The deductibility of capital losses is subject to limitations. Capital gain or loss, if any, realized by a U.S. Holder on the sale, exchange or other taxable disposition of an Ambev common share or ADS, will generally be treated as U.S.-source income or loss for U.S. foreign tax credit purposes. Consequently, in the case of a disposition of an Ambev common share that is subject to Brazilian tax imposed on the gain, or in the case of a deposit of Ambev common shares in exchange for an Ambev ADS that is not registered pursuant to Resolution No. 4,373 on which a Brazilian capital gains tax is imposed (see “—Brazilian Tax Considerations—Income Tax—Taxation of Gains”), as the case may be, the U.S. Holder may not be able to benefit from the foreign tax credit for that Brazilian tax, unless the U.S. Holder can apply (subject to applicable limitations) the credit against U.S. tax payable on other income from foreign sources in the appropriate income category. Alternatively, a U.S. Holder may be entitled to take a deduction for the Brazilian tax if such U.S. Holder elects to deduct all of its foreign income taxes. The rules relating to the foreign tax credit are complex and U.S. Holders are urged to consult their tax advisors regarding the availability of the foreign tax credit or a deduction under their particular circumstances.
Passive Foreign Investment Company (PFIC) Rules
Special U.S. federal income tax rules apply to U.S. Holders owning shares of a PFIC. In general, a foreign corporation is a PFIC if, for any taxable year in which the U.S. Holder holds stock in the foreign corporation, at least 75% of such corporation’s gross income is passive income or at least 50% of the value of such corporation’s assets (determined on the basis of a quarterly average) produce passive income or are held for the production of passive income. The determination of whether our common shares or ADSs constitute shares of a PFIC is a factual determination made annually and thus may be subject to change. Subject to certain exceptions, once a U.S. Holder’s Ambev common shares or ADSs, as applicable, are treated as shares in a PFIC, they remain shares in a PFIC. In addition, dividends received by a U.S. Holder from a PFIC will not constitute qualified dividend income.
If we are treated as a PFIC, a U.S. Holder would generally be subject to special rules with respect to (a) any gain realized on the sale or other disposition of Ambev common shares or ADSs and (b) any “excess distribution” by us to the U.S. Holder (generally, the part of the distribution during a taxable year that exceeds 125% of the average annual distributions the U.S. Holder received on those common shares or ADSs during the preceding three taxable years or, if shorter, the U.S. Holder’s holding period for such common shares or ADSs). In addition, if we are classified as a PFIC for any taxable year during which a U.S. Holder owns our common shares or ADSs and any of our non-U.S. subsidiaries is also a PFIC, such U.S. Holder would be treated as owning a proportionate amount (by value) of the shares of each such non-U.S. subsidiary classified as a PFIC for purposes of the application of these rules.
Based upon the nature of our current and projected income, assets and activities, we do not believe that we are a PFIC for U.S. federal income tax purposes for the taxable year ended December 31, 2018 and do not anticipate becoming a PFIC in the foreseeable future. However, we cannot assure you that we will not be considered a PFIC in current or future years. The determination as to whether or not we are a PFIC is a factual determination and cannot be made until the close of the applicable tax year. If we are currently a PFIC or were to become a PFIC, U.S. Holders would be subject to special rules and a variety of potentially adverse tax consequences under the Code.
If we are treated as a PFIC, certain elections may be available to mitigate the adverse U.S. federal income tax consequences of owning stock in a PFIC. In particular, a U.S. Holder may elect mark-to-market treatment for its common shares or ADSs, provided those common shares or ADSs constitute “marketable stock” as defined in U.S. Treasury Regulations. In addition, certain information reporting rules may apply if we are treated as a PFIC, such as the requirement to file IRS Form 8621 regarding distributions received on the common shares or ADSs and any gain realized on the disposition of the common shares or ADSs. U.S. Holders are urged to consult their tax advisors regarding the application of the PFIC rules to an investment in our common shares or ADSs.
122
Reporting Obligations for Certain U.S. Holders
Certain U.S. Holders that hold certain specified foreign financial assets, including stock in a foreign corporation, with values in excess of certain thresholds are required to file IRS Form 8938 with their federal income tax return. Such Form requires disclosure of information concerning such foreign assets, including the value of the assets. Failure to file the form when required is subject to penalties. An exemption from reporting applies to foreign assets held through a U.S. financial institution, generally including a non-U.S. branch or subsidiary of a U.S. institution and a U.S. branch of a non-U.S. institution. U.S. Holders are encouraged to consult their tax advisors regarding the possible application of this disclosure requirement to their investment in our common shares or ADSs.
THE PRECEDING DISCUSSION OF U.S. FEDERAL INCOME TAX CONSIDERATIONS IS FOR GENERAL INFORMATION ONLY AND IS NOT TAX ADVICE. ACCORDINGLY, EACH INVESTOR SHOULD CONSULT ITS TAX ADVISOR AS TO THE PARTICULAR TAX CONSEQUENCES OF PURCHASING, HOLDING AND DISPOSING OF AMBEV COMMON SHARES OR ADSs, INCLUDING THE APPLICABILITY AND EFFECT OF ANY STATE, LOCAL, FOREIGN OR OTHER TAX LAWS AND OF ANY PROPOSED CHANGES IN APPLICABLE LAW.
E. Dividends and Paying Agents
Not applicable.
F. Statement by Experts
Not applicable.
G. Where You Can Find More Information (Documents on Display)
We are subject to the informational reporting requirements of the Exchange Act, and file with or furnish to the SEC, as applicable, the following documents that apply to foreign private issuers:
|
· |
annual reports on Form 20-F; |
|
· |
certain other reports on Form 6-K containing the information that we make public under Brazilian law, file with the Brazilian stock exchanges or distribute to shareholders; and |
|
· |
other information. |
You may read and copy any reports or other information that we file at the SEC’s public reference rooms at 100 F Street, NE, Washington, D.C. 20549, and at the SEC’s regional offices located at Brookfield Place, 200 Vesey Street, Suite 400 New York, New York 10281-1022 and 175 W. Jackson Boulevard, Suite 900, Chicago, Illinois 60604. You may obtain information on the operation of the SEC’s public reference rooms by calling the SEC at 1-800-SEC-0330. Electronic filings made through the Electronic Data Gathering, Analysis and Retrieval System are also publicly available through the SEC’s website on the Internet at www.sec.gov. In addition, material filed by us may also be inspected at the offices of the NYSE at 20 Broad Street, New York, New York 10005.
As a foreign private issuer, we are exempt from the rules under the Exchange Act prescribing the furnishing and content of proxy statements and will not be required to file proxy statements with the SEC, and its officers, directors and principal shareholders will be exempt from the reporting and “short swing” profit recovery provisions contained in Section 16 of the Exchange Act.
123
You may obtain documents from us by requesting them in writing, at the following addresses or by telephone:
|
|
Ambev S.A. |
|
Attention: |
Investor Relations Department |
|
Telephone numbers: |
(55-11) 2122-1415 |
|
|
(55-11) 2122-1414 |
|
Email: |
ir@ambev.com.br |
You may obtain additional information about us on our website at www.ri.ambev.com.br. The information contained therein is not part of this annual report.
I. Subsidiary Information
Not applicable.
124
ITEM 11. QUANTITATIVE AND QUALITATIVE DISCLOSURES ABOUT MARKET RISK
Our activities expose us to various market risks, including changes in foreign currency exchange rates and interest rates and changes in the prices of certain commodities, including malt, aluminum, sugar and corn. Market risk is the potential loss arising from adverse changes in market rates and prices. We enter into derivatives and other financial instruments, in order to manage and reduce the impact of fluctuations in commodity prices, in foreign currency exchange rates and in interest rates. We have established policies and procedures for risk assessment and the approval, reporting and monitoring of derivative financial activities. Decisions regarding hedging are made according to our risk management policy, taking into consideration the amount and duration of the exposure, market volatility and economic trends.
These instruments are accounted for based on their characteristics. See notes 3 and 27 to our audited consolidated financial statements for a discussion of the accounting policies and information on derivative financial instruments.
In order to minimize the credit risk of its investments, we have cash allocation and investment policies, taking into consideration financial institution credit limits and ratings, not allowing credit concentration. Thus, the credit risk is monitored and minimized because the negotiations are carried out only with a select group of highly qualified counterparties. The definition of financial institutions authorized to operate as a counterparty for us is described in our policy, which establishes maximum exposure limits for each counterparty based on each counterparty’s risk rating and capitalization.
Enterprise Risk Management (ERM)
We have implemented a management strategy to promote enterprise-wide risk management (ERM), through an integrated framework that considers the impact on our business of not only market risks but also of compliance, strategic and operational risks. We believe that such integrated framework, which accounts for different kinds of business risks, enables us to improve management’s ability to evaluate risks associated with our business.
The risk management department is responsible for reviewing and following up with management the risk factors and related mitigating initiatives consistent with our corporate strategy. Market risks, such as exposure in foreign currency, interest rates, commodity prices, liquidity and credit risk arise during the normal course of our business. We analyze each of these risks both individually and on an interconnected basis, defining strategies for managing the economic impact on its performance in line with our financial risk management policy.
Commodity Risk
We use a large volume of agricultural goods to produce our products, including malt and hops for our beer and sugar, guaraná, other fruits and sweeteners for our CSDs. See “Item 4. Information on the Company—B. Business Overview—Sources and Availability of Raw Materials.” We purchase a significant portion of our malt and all of our hops outside of Brazil. We purchase the remainder of our malt and our sugar, guaraná and other fruits and sweeteners locally. Ambev also purchases substantial quantities of aluminum cans.
We produce approximately 75% of our consolidated malt needs and approximately 10% of our guaraná requirement. The remainder and all other commodities are purchased from third parties. We believe that adequate supplies of the commodities we use are available at the present time, but we cannot predict the future availability of these commodities or the prices we will have to pay for such commodities. The commodity markets have experienced and will continue to experience price fluctuations. We believe that the future price and supply of agricultural materials will be determined by, among other factors, the level of crop production, weather conditions, export demand, and government regulations and legislation affecting agriculture, and that the price of aluminum and sugar will be largely influenced by international market prices. See “Item 4. Information on the Company—B. Business Overview—Sources and Availability of Raw Materials.”
All of the hops we purchase in the international markets outside of South America are paid for in U.S. dollars. In addition, although we purchase aluminum cans and sugar in Brazil, their prices are directly influenced by the fluctuation of international commodity prices.
125
As of December 31, 2018, our derivative activities consisted of sugar, wheat, aluminum, heating oil, natural gas, corn and resin derivatives. The table below provides information about our significant commodity risk sensitive instruments as of December 31, 2018. The contract terms of these instruments have been categorized by expected maturity dates and are measured at market prices.
|
|
Maturity Schedule of Commodities Derivatives as of December 31, 2018 | |||||||
|
Derivatives Instruments |
2019 |
2020 |
2021 |
2022 |
2023 |
Thereafter |
Total |
Fair Value |
|
|
(in R$ million, except price per ton/gallon/barrel/gigajoule) | |||||||
|
Sugar Derivatives: |
|
|
|
|
|
|
|
|
|
Notional Amount |
185.7 |
44.2 |
- |
- |
- |
- |
229. 8 |
(29.9) |
|
Average Price (R$/ton) |
1,239.2 |
1,158.0 |
- |
- |
- |
- |
1,223.6 |
|
|
Wheat Derivatives: |
|
|
|
|
|
|
|
|
|
Notional Amount |
2.8 |
- |
- |
- |
- |
- |
2.8 |
0.4 |
|
Average Price (R$/ton) |
633.3 |
- |
- |
- |
- |
- |
633.3 |
|
|
Aluminum Derivatives: |
|
|
|
|
|
|
|
|
|
Notional Amount |
1,772.5 |
- |
- |
- |
- |
- |
1,772.5 |
(169.3) |
|
Average Price (R$/ton) |
6,825.5 |
- |
- |
- |
- |
- |
6,825.5 |
|
|
Heating Oil Derivatives: |
|
|
|
|
|
|
|
|
|
Notional Amount |
74.0 |
- |
- |
- |
- |
- |
74.0 |
(14.8) |
|
Average Price (R$/gallon) |
12.0 |
- |
- |
- |
- |
- |
12.0 |
|
|
Natural Gas: |
|
|
|
|
|
|
|
|
|
Notional Amount |
3.2 |
- |
- |
- |
- |
- |
3.2 |
(1.1) |
|
Average Price (R$/GJ) |
4.7 |
- |
- |
- |
- |
- |
4.2 |
|
|
Corn Derivatives: |
|
|
|
|
|
|
|
|
|
Notional Amount |
35.0 |
- |
- |
- |
- |
- |
35.0 |
(0.5) |
|
Average Price (R$/ton) |
590.7 |
- |
- |
- |
- |
- |
590.7 |
|
|
Resin Derivatives: |
|
|
|
|
|
|
|
|
|
Notional Amount |
293.8 |
- |
- |
- |
- |
- |
293.8 |
(40.5) |
|
Average Price (R$/ton) |
4,253.5 |
- |
- |
- |
- |
- |
4,253.5 |
|
Interest Rate Risk
We use interest rate swap instruments to manage interest risks associated with changing rates. The differential to be paid or received is accrued as interest rates change and is recognized in interest income or expense, respectively, over the life of the particular contracts. We are exposed to interest rate volatility with respect to our cash and cash equivalents, current investment securities and fixed and floating rate debt. Our U.S. dollar-denominated cash equivalents generally bear interest at a floating rate.
We are exposed to interest rate volatility with regard to existing issuances of fixed rate debt, existing issuances of floating rate debt, currency future and forward swaps agreements, cash and cash equivalents and current investment securities. We manage our debt portfolio in response to changes in interest rates and foreign currency rates by periodically retiring, redeeming and repurchasing debt and using derivative financial instruments.
The table below provides information about our significant interest rate sensitive instruments. For variable interest rate debt, the rate presented is the weighted average rate calculated as of December 31, 2018. The contract terms of these instruments have been categorized by expected maturity dates:
|
|
Maturity Schedule of Debt Portfolio as of December 31, 2018 | ||||||
|
Debt Instrument |
2019 |
2020 |
2021 |
2022 |
2023 |
Thereafter |
Total |
|
|
(in R$ million, except percentages) | ||||||
|
International Debt: |
|
|
|
|
|
|
|
|
Other Latin America Currency Floating Rate |
- |
- |
- |
- |
- |
- |
- |
|
Average Pay Rate |
- |
- |
- |
- |
- |
- |
- |
|
Other Latin America Currency Fixed Rate |
11.5 |
- |
212.1 |
- |
- |
- |
223.5 |
|
Average Pay Rate |
7.6% |
- |
10.1% |
- |
- |
- |
10.0% |
|
US$ Fixed Rate |
32.4 |
2.2 |
- |
7.8 |
- |
- |
42.4 |
|
Average Pay Rate |
4.6% |
2.2% |
- |
4.3% |
- |
- |
4.4% |
|
US$ Floating Rate |
538.8 |
91.2 |
- |
- |
- |
- |
630.0 |
|
Average Pay Rate |
3.3% |
5.1% |
- |
- |
- |
- |
3.6% |
|
CAD Floating Rate |
743.9 |
2.8 |
2.9 |
1.8 |
1.8 |
- |
753.2 |
|
Average Pay Rate |
2.4% |
2.8% |
2.8% |
2.8% |
2.8% |
- |
2.4% |
|
Reais Denominated Debt Floating Rate – TJLP & TR: |
|
|
|
|
|
|
|
|
Notional Amount |
75.3 |
9.7 |
10.1 |
10.8 |
11.8 |
120.0 |
237.7 |
|
TJLP & TR + Average Pay Rate |
9.1% |
9.3% |
9.3% |
9.3% |
9.3% |
9.3% |
9.1% |
|
Reais Debt - ICMS Fixed Rate: |
|
|
|
|
|
|
|
|
Notional Amount |
37.2 |
38.0 |
22.7 |
5.4 |
2.8 |
22.4 |
128.5 |
|
Average Pay Rate |
5.8% |
5.8% |
5.8% |
5.8% |
5.8% |
5.8% |
5.8% |
|
Reais Debt - Fixed Rate: |
|
|
|
|
|
|
|
|
Notional Amount |
121.5 |
56.1 |
149.6 |
43.5 |
35.7 |
1.2 |
407.6 |
|
Average Pay Rate |
7.0% |
7.5% |
8.6% |
4.0% |
4.0% |
5.6% |
7.0% |
|
Total Debt |
1,560.6 |
199.9 |
397.3 |
69.3 |
52.0 |
143.6 |
2,422.8 |
126
|
|
Maturity Schedule of Cash Instruments as of December 31, 2018 | ||||||
|
Cash Instrument |
2019 |
2020 |
2021 |
2022 |
2023 |
Thereafter |
Total |
|
|
(in R$ million, except percentages) | ||||||
|
US$-Denominated Cash and Cash Equivalents: |
|
|
|
|
|
|
|
|
Notional |
4,239.5 |
- |
- |
- |
- |
- |
4,239.5 |
|
Average Interest Rate |
2.2% |
- |
- |
- |
- |
- |
2.2% |
|
Reais-Denominated Cash and Cash Equivalents: |
|
|
|
|
|
|
|
|
Notional |
4,603.3 |
- |
- |
- |
- |
- |
4,603.3 |
|
Average Interest Rate |
6.4% |
- |
- |
- |
- |
- |
6.4% |
|
C$-Denominated Cash and Cash Equivalents: |
|
|
|
|
|
|
|
|
Notional Amount |
600.9 |
- |
- |
- |
- |
- |
600.9 |
|
Average Pay Rate |
2.1% |
- |
- |
- |
- |
- |
2.1% |
|
Other Latin American Currency investments: |
|
|
|
|
|
|
|
|
Notional Amount |
2,019.9 |
- |
- |
- |
- |
- |
2,019.9 |
|
Total |
11,463.5 |
- |
- |
- |
- |
- |
11,463.5 |
|
|
Maturity Schedule of Interest Rate Derivatives as of December 31, 2018 | |||||||
|
Derivatives Instruments |
2019 |
2020 |
2021 |
2022 |
2023 |
Thereafter |
Total |
Fair Value |
|
|
(in R$ million, except percentages) | |||||||
|
BM&F DI Futures: |
|
|
|
|
|
|
|
|
|
Notional Amount |
15.0 |
- |
- |
- |
- |
- |
15.0 |
0.1 |
|
Average Interest Rate |
6.6% |
- |
- |
- |
- |
- |
6.6% |
|
|
|
|
|
|
|
|
|
|
|
|
FIXED x CDIIRS(2): |
|
|
|
|
|
|
|
|
|
Notional Amount |
- |
- |
110.0 |
- |
- |
- |
110.0 |
20.3 |
|
Average Interest Rate |
- |
- |
6.4% |
- |
- |
- |
6.4% |
|
|
|
|
|
|
|
|
|
|
|
|
FIXED x TJLP: |
|
|
|
|
|
|
|
|
|
Notional Amount |
- |
- |
- |
- |
87.3 |
10.1 |
97.4 |
(1.1) |
|
Average Interest Rate |
- |
- |
- |
- |
7.0% |
7.0% |
7.0% |
|
|
|
|
|
|
|
|
|
|
|
|
FIXED x TR: |
|
|
|
|
|
|
|
|
|
Notional Amount |
- |
- |
- |
- |
- |
130.8 |
130.8 |
14.6 |
|
Average Interest Rate |
- |
- |
- |
- |
- |
3.7% |
3.7% |
|
(1) Negative notional amounts represent an excess of liabilities over assets at any given moment.
(2) Interest rate swap.
127
Part of the floating rate debt accrues interest at TJLP. During the period set forth below the TJLP was:
|
|
2018 |
2017 |
2016 |
|
4th Quarter |
6.98 |
7.00 |
7.50 |
|
3rd Quarter |
6.56 |
7.00 |
7.50 |
|
2nd Quarter |
6.60 |
7.00 |
7.50 |
|
1st Quarter |
6.75 |
7.50 |
7.50 |
We have not experienced, and do not expect to experience, difficulties in obtaining financing or refinancing existing debt.
Foreign Exchange Risk
We are exposed to fluctuations in foreign exchange rate movements because a significant portion of our operating expenses, in particular those related to hops, malt, sugar, aluminum and corn, are also denominated in or linked to the U.S. dollar. We enter into derivative financial instruments to manage and reduce the impact of changes in foreign currency exchange rates in respect of our U.S. dollar-denominated debt. From January 1, 2016, until December 31, 2018, the U.S. dollar depreciated 0.7% against the real, and, as of December 31, 2018, the commercial market rate for purchasing U.S. dollars was R$3.88 per US$1.00. The U.S. dollar depreciated against the real by 16.5% in 2016. In 2017, the U.S. dollar appreciated 1.5% against the real. In 2018, the U.S. dollar appreciated 17.1% against the real.
Our foreign currency exposure gives rise to market risks associated with exchange rate movements, mainly against the U.S. dollar. Foreign currency-denominated liabilities at December 31, 2018, included debt of R$1,649.1 million.
As of December 31, 2018, derivative activities consisted of foreign currency forward contracts, foreign currency swaps and future contracts. The table below provides information about our significant foreign exchange rate risk sensitive instruments as of December 31, 2018. The contract terms of these instruments have been categorized by expected maturity dates.
|
|
Maturity Schedule of Foreign Exchange Derivatives as of December 31, 2018 | |||||||
|
Derivatives Instruments(1) |
2019 |
2020 |
2021 |
2022 |
2023 |
Thereafter |
Total |
Fair Value |
|
|
(in R$ million, except Unit Price) | |||||||
|
BM&F Dollar Futures: |
|
|
|
|
|
|
|
|
|
Notional Amount |
1,834.4 |
- |
- |
- |
- |
- |
1,834.4 |
(6.5) |
|
Average Unit Price |
3.9 |
- |
- |
- |
- |
- |
3.9 |
|
|
|
|
|
|
|
|
|
|
|
|
NDF US$ x R$: |
|
|
|
|
|
|
|
|
|
Notional Amount |
2,892.2 |
- |
- |
- |
- |
- |
2.892.2 |
(23.1) |
|
Average Unit Price |
3.9 |
- |
- |
- |
- |
- |
3.9 |
|
|
|
|
|
|
|
|
|
|
|
|
FDF C$ x US$: |
|
|
|
|
|
|
|
|
|
Notional Amount |
1,040.4 |
- |
- |
- |
- |
- |
1,040.4 |
61.8 |
|
Average Unit Price |
1.3 |
- |
- |
- |
- |
- |
1.3 |
|
|
|
|
|
|
|
|
|
|
|
|
NDF C$ x INR |
|
|
|
|
|
|
|
|
|
Notional Amount |
2.2 |
- |
- |
- |
- |
- |
2.2 |
2.2 |
|
Average Unit Price |
0.0 |
- |
- |
- |
- |
- |
0.0 |
0.0 |
|
|
|
|
|
|
|
|
|
|
|
FDF C$ x EUR: |
|
|
|
|
|
|
|
|
|
Notional Amount |
152.4 |
- |
- |
- |
- |
- |
152.4 |
1.2 |
|
Average Unit Price |
1.6 |
- |
- |
- |
- |
- |
1.6 |
|
|
|
|
|
|
|
|
|
|
|
|
NDF MXN x R$: |
|
|
|
|
|
|
|
|
|
Notional Amount |
84.8 |
- |
- |
- |
- |
- |
84.8 |
1.3 |
|
Average Unit Price |
0.2 |
- |
- |
- |
- |
- |
0.2 |
|
|
|
|
|
|
|
|
|
|
|
|
NDF ARS x US$: |
|
|
|
|
|
|
|
|
|
Notional Amount |
2,546.7 |
- |
- |
- |
- |
- |
2,546.7 |
(86.3) |
|
Average Unit Price |
43.4 |
- |
- |
- |
- |
- |
43.4 |
|
|
|
|
|
|
|
|
|
|
|
|
NDF CLP x US$: |
|
|
|
|
|
|
|
|
|
Notional Amount |
544.1 |
- |
- |
- |
- |
- |
544.1 |
56.0 |
|
Average Unit Price |
631.9 |
- |
- |
- |
- |
- |
631.9 |
|
|
|
|
|
|
|
|
|
|
|
|
NDF UYU x US$: |
|
|
|
|
|
|
|
|
|
Notional Amount |
165.2 |
- |
- |
- |
- |
- |
165.2 |
(7.0) |
|
Average Unit Price |
33.9 |
- |
- |
- |
- |
- |
33.9 |
|
|
|
|
|
|
|
|
|
|
|
|
NDF BOB x US$: |
|
|
|
|
|
|
|
|
|
Notional Amount |
304.6 |
- |
- |
- |
- |
- |
304.6 |
(3.1) |
|
Average Unit Price |
7.2 |
- |
- |
- |
- |
- |
7.2 |
|
|
|
|
|
|
|
|
|
|
|
|
NDF PYG x US$: |
|
|
|
|
|
|
|
|
|
Notional Amount |
648.6 |
- |
- |
- |
- |
- |
648.6 |
9.0 |
|
Average Unit Price |
6,023.4 |
- |
- |
- |
- |
- |
6,023.4 |
|
|
|
|
|
|
|
|
|
|
|
|
BM&F Euro Futures: |
|
|
|
|
|
|
|
|
|
Notional Amount |
0.0 |
- |
- |
- |
- |
- |
0.0 |
(0.2) |
|
Average Unit Price |
0.0 |
- |
- |
- |
- |
- |
0.0 |
|
|
|
|
|
|
|
|
|
|
|
|
NDF MXN x US$: |
|
|
|
|
|
|
|
|
|
Notional Amount |
80.4 |
- |
- |
- |
- |
- |
80.4 |
27.3 |
|
Average Unit Price |
0.1 |
- |
- |
- |
- |
- |
0.1 |
|
|
|
|
|
|
|
|
|
|
|
|
NDF MXN x CLP: |
|
|
|
|
|
|
|
|
|
Notional Amount |
104.3 |
- |
- |
- |
- |
- |
104.3 |
7.7 |
|
Average Unit Price |
31.5 |
- |
- |
- |
- |
- |
31.5 |
|
(1) Negative notional amounts represent an excess of liabilities over assets at any given moment.
128
Equity Swap Risk
We established several share-based payment programs that allow our directors, officers and certain other employees to receive share-based compensation under certain conditions.
As part of these programs, our board of directors approved equity swap transactions on May 16, 2017, December 21, 2017, May 15, 2018 and December 20, 2018, respectively, pursuant to which we will receive any price variation related to the difference between the strike price and the trading price of our shares or ADRs at the maturity of the swap. Ambev will pay CDI or Libor plus a fee over the notional value of the transaction. The objective of the transaction is to neutralize the possible effects of the stock prices’ oscillation, considering our share-based payment programs as eventual share price increases would result in a positive gain on the equity swap transaction mitigating the higher cost of purchasing shares in the market to deliver to the employees and vice versa. As these derivative instruments are not characterized as hedge accounting they were not therefore designated to any hedge.
The contracts approved on December 21, 2017 may result in an exposure of up to 80 million common shares (of which all or part may be through ADRs), with a value of up to R$1.8 million. The contracts approved on December 20, 2018 may result in an exposure of up to 80 million common shares (of which all or part may be through ADRs), with a value of up to R$1.5 billion and, together with the balance of the agreements executed in the context of the approvals of May 16, 2017 and December 21, 2017 and not yet settled, may result in an exposure of up to 80 million common shares.
As of December 31, 2018, an exposure equivalent to R$1.5 billion in our shares (or ADR’s) was partially hedged, resulting in a loss in income statement of R$378.2 million.
129
|
|
Maturity Schedule of Equity Swap Derivatives as of December 31, 2018 | |||||||
|
Derivatives Instruments |
2019 |
2020 |
2021 |
2022 |
2023 |
Thereafter |
Total |
Fair Value |
|
|
(in R$ million, except Unit Price) | |||||||
|
Equity Swap: |
|
|
|
|
|
|
|
|
|
Notional Amount |
1,108.4 |
- |
- |
- |
- |
- |
1,108.4 |
(242.9) |
|
Average Unit Price (R$/Share) |
19.3 |
- |
- |
- |
- |
- |
19.3 |
|
130
ITEM 12. DESCRIPTION OF SECURITIES OTHER THAN EQUITY SECURITIES
A. Debt Securities
Not Applicable.
B. Warrants and Rights
Not Applicable.
C. Other Securities
Not Applicable.
D. American Depositary Shares
The Bank of New York Mellon, or the Depositary, is the depositary of the Ambev shares in accordance with the Deposit Agreement, dated July 9, 2013, entered into among Ambev, The Bank of New York Mellon, as depositary, and all owners from time to time of ADSs of Ambev, or the Depositary Agreement. A copy of this Depositary Agreement is filed as an exhibit to this annual report on Form 20−F.
The Depositary collects its fees for delivery and surrender of ADSs directly from investors depositing shares or surrendering ADSs for the purpose of withdrawal or from intermediaries acting for them. The Depositary collects fees for making distributions to investors by deducting those fees from the amounts distributed or by selling a portion of distributable property to pay the fees. The Depositary may collect its annual fee for depositary services by deduction from cash distributions or by directly billing investors or by charging the book-entry system accounts of participants acting for them. The Depositary may collect any of its fees by deduction from any cash distribution payable to ADS holders that are obligated to pay those fees. The Depositary may generally refuse to provide fee-attracting services until its fees for those services are paid. Pursuant to the Depositary Agreement, holders of our ADSs may have to pay to The Bank of New York Mellon, either directly or indirectly, fees or charges up to the amounts set forth in the table below.
|
Persons depositing or withdrawing shares or ADS holders must pay: |
|
For: |
|
US$5.00 (or less) per 100 ADSs (or portion of 100 ADSs) |
|
issuance of ADSs, including issuances resulting from a distribution of shares, rights or other property; and
|
|
|
|
cancellation of ADSs for the purpose of withdrawal, including if the deposit agreement terminates. |
|
US$0.02 (or less) per ADS |
|
any cash distribution to ADS holders. |
|
A fee equivalent to the fee that would be payable if securities distributed to you had been shares and the shares had been deposited for issuance of ADSs |
|
distribution of securities distributed to holders of deposited securities which are distributed by the Depositary to ADS holders. |
|
US$0.02 (or less) per ADSs per calendar year |
|
depositary services. |
|
Registration or transfer fees |
|
transfer and registration of shares on Ambev’s share registry to or from the name of the Depositary or its agent when you deposit or withdraw shares. |
|
Expenses of the Depositary |
|
cable, telex and facsimile transmissions (when expressly provided in the deposit agreement); and
converting foreign currency to U.S. dollars. |
|
Taxes and other governmental charges the Depositary or the Custodian may have to pay on any ADS or share underlying an ADS, for example, stock transfer taxes or stamp duty (which currently are inapplicable in Brazil) or withholding taxes |
|
as necessary. |
|
Any charges incurred by the Depositary or its agents for servicing the deposited securities |
|
as necessary. |
131
In performing its duties under the Deposit Agreement, the Depositary may use brokers, dealers or other service providers that are affiliates of the Depositary and that may earn or share fees or commissions.
Subject to certain terms and conditions, the Depositary has agreed to reimburse us for certain expenses it incurs that are related to establishment and maintenance expenses of the ADS program, including the standard out-of-pocket maintenance costs for the ADRs, which consist of the expenses of postage and envelopes for mailing annual and interim financial reports, printing and distributing dividend checks, electronic filing of U.S. federal tax information, mailing required tax forms, stationery, postage, facsimile, and telephone calls. There are limits on the amount of expenses for which the Depositary will reimburse us, but the amount of reimbursement available to us is not necessarily tied to the amount of fees the depositary collects from investors.
The Depositary has made payments to us in the amount of US$2.8 million during 2018. These amounts were used for general corporate purposes such as the payment of costs and expenses associated with (1) the preparation and distribution of proxy materials, (2) the preparation and distribution of marketing materials and (3) consulting and other services related to investor relations.
132
PART II
ITEM 13. DEFAULT, DIVIDENDS ARREARAGES AND DELINQUENCIES
Not Applicable.
133
ITEM 14. MATERIAL MODIFICATIONS TO THE RIGHTS OF SECURITY HOLDERS AND USE OF PROCEEDS
Not Applicable.
134
ITEM 15. CONTROLS AND PROCEDURES
A. Disclosure Controls and Procedures
The Company has carried out an evaluation, as of December 31, 2018, of the effectiveness of the design and operation of the Company’s disclosure controls and procedures under the supervision and with the participation of the Company’s management, which is responsible for the management of the internal controls, including the Chief Executive Officer and Chief Financial Officer. While there are inherent limitations to the effectiveness of any system of disclosure controls and procedures, including the possibility of human error and the circumvention or overriding of the controls and procedures, the Company’s disclosure controls and procedures are designed to provide reasonable assurance of achieving their objectives. Based upon the Company’s evaluation, as of December 31, 2018, the Chief Executive Officer and Chief Financial Officer of the Company have concluded that the disclosure controls and procedures are (1) effective at the reasonable assurance level in ensuring that information required to be disclosed in the reports that are filed or submitted under the Exchange Act, is recorded, processed, summarized and reported within the time periods specified in the Commissions’ rules and forms and (2) effective at the reasonable assurance level in ensuring that information to be disclosed in the reports that are filed or submitted under the Exchange Act is accumulated and communicated to the management of the Company, including the Chief Executive Officer and the Chief Financial Officer, to allow timely decisions regarding required disclosure.
B. Management’s Annual Report on Internal Control over Financial Reporting
Our management is responsible for establishing and maintaining effective internal control over financial reporting and for its assessment of the effectiveness of internal control over financial reporting.
Internal control over financial reporting is defined in rules 13a-15(f) and 15d-15(f) under the Exchange Act as a process designed to provide reasonable assurance regarding the reliability of financial reporting and the preparation of financial statements for external purposes in accordance with generally accepted accounting principles, and includes those policies and procedures that (1) pertain to the maintenance of records that, in reasonable detail, accurately and fairly reflect the transactions and dispositions of the assets of the Company; (2) provide reasonable assurance that transactions are recorded as necessary to permit preparation of financial statements in accordance with generally accepted accounting principles, and that receipts and expenditures of the Company are being made only in accordance with authorizations of management and directors of the Company; and (3) provide reasonable assurance regarding prevention or timely detection of unauthorized acquisition, use, or disposition of the Company’s assets that could have a material effect on the audited consolidated financial statements.
Because of its inherent limitations, internal control over financial reporting may not prevent or detect material misstatements. Therefore, effective control over financial reporting cannot, and does not, provide absolute assurance of achieving our control objectives. Also, projections of any evaluation of effectiveness to future periods are subject to the risk that controls may become inadequate because of changes in conditions, or that the degree of compliance with the policies or procedures may deteriorate. The effectiveness of our internal control over financial reporting as of December 31, 2018, is based on the criteria established in Internal Control - Integrated Framework (2013) issued by the Committee of Sponsoring Organizations (COSO) of the Treadway Commission. Based on those criteria, management has concluded that as of December 31, 2018, the Company’s internal control over financial reporting is effective.
C. Attestation Report of the Registered Public Accounting Firm
The effectiveness of our internal control over financial reporting as of December 31, 2018, has been audited by Deloitte Touche Tohmatsu Auditores Independentes, the Company’s independent registered public accounting firm. Their audit report and their report on Company’s internal control over financial reporting are included in our audited consolidated financial statements included in this Form 20-F.
D. Changes in Internal Control over Financial Reporting
There have been no changes in our internal control over financial reporting that occurred during the period covered by this annual report that has materially affected, or is reasonably likely to materially affect, our internal control over financial reporting.
135
ITEM 15T. CONTROLS AND PROCEDURES
Not applicable.
136
ITEM 16A. AUDIT COMMITTEE FINANCIAL EXPERT
We have relied on the exemption provided for under Rule 10A-3(c)(3) of the Exchange Act, pursuant to Section 301 of the Sarbanes-Oxley Act of 2002, which enables us to have the Fiscal Council perform the duties of an audit committee for the purposes of such Act, to the extent permitted by Brazilian law. In accordance with the charter of our Fiscal Council, at least one of its members has to fulfill the requirements of the Sarbanes-Oxley Act of 2002 for the purposes of qualifying as an audit committee financial expert. Accordingly, our Fiscal Council is comprised of one “audit committee financial expert” within the meaning of this Item 16A, namely José Ronaldo Vilela Rezende, who has an extensive work-related finance background and who is “independent” as set forth in Rule 10A-3(c)(3) of the Sarbanes-Oxley Act of 2002.
137
ITEM 16B. CODE OF BUSINESS CONDUCT
We have adopted a code of business conduct (as defined under the rules and regulations of the SEC) that applies to our principal executive officer, principal financial officer and principal accounting officer, among others. Our code of business conduct has been incorporated by reference to this annual report and was approved by our Board of Directors on August 30, 2013 and amended on May 16, 2017 (though Old Ambev already had a Board-approved code of business conduct since 2003). If the provisions of the code that apply to our principal executive officer, principal financial officer or principal accounting officer are amended, or if a waiver is granted, we will disclose such amendment or waiver.
138
ITEM 16C. PRINCIPAL ACCOUNTANT FEES AND SERVICES
Auditor Fees
Deloitte Touche Tohmatsu Auditores Independentes, or Deloitte, acted as our independent auditor for the fiscal years ended December 31, 2018, 2017 and 2016. The table below sets forth the total amount we were billed by Deloitte in 2018, 2017 and 2016 for services performed in those years, and breaks down the amount by category of service:
|
|
Year Ended December 31, 2018 |
Year Ended December 31, 2017 |
Year Ended December 31, 2016 |
|
|
(in R$ thousand) | ||
|
Audit fees |
4,621 |
4,306 |
4,532 |
|
Audit-related fees |
3,864 |
3,382 |
3,512 |
|
Tax fees |
1,312 |
- |
1,103 |
|
All other fees |
29 |
113 |
20 |
|
Total |
9,826 |
7,801 |
9,167 |
Audit Fees
Audit fees are fees billed for the audit of our consolidated financial statements and for the reviews of our quarterly financial statements in connection with statutory and regulatory filings or engagements (including audit of our subsidiaries for consolidated purpose).
Audit-Related Fees
Audit-related fees consisted of fees billed for assurance and related services that were reasonably related to the performance of the audit or review of our financial statements or that were traditionally performed by the external auditor.
Tax Fees
Tax fees in 2016 and 2018 were related to tax compliance services.
All Other Fees
All other services consist primarily of fees billed for certain compliance reports to be filed with local regulators and certain comfort letters issued in connection with the issuance of debt.
Independent Registered Public Accounting Firm
Our audited consolidated financial statements as of and for the years ended December 31, 2018, 2017 and 2016 have been audited by Deloitte Touche Tohmatsu Auditores Independentes, São Paulo, Brazil, independent registered public accounting firm. The offices of Deloitte Touche Tohmatsu Auditores Independentes are located at Avenida Dr. Chucri Zaidan, 1240, 4th to 12th floors, 04711-130, São Paulo, SP, Brazil. They are members of the São Paulo State Regional Board of Accountants (Conselho Regional de Contabilidade) and of the Public Company Accounting Oversight Board (PCAOB) and their registration numbers are SP 011.609/O-8 and 1045, respectively.
Pre-Approval Policies and Procedures
We have adopted pre-approval policies and procedures under which all audit and non-audit services provided by contracted external auditors must be pre-cleared by the Fiscal Council, which performs the duties of an audit committee for the purposes of the Sarbanes-Oxley Act of 2002, in accordance with Rule 10A-3(c)(3). The Fiscal Council adopts a list of services and amount limits for contracting for each external auditor under terms included in a “basic list,” which is in turn approved by the Board of Directors. Any services provided from such list are deemed “pre-approved” for purposes of the Sarbanes-Oxley Act of 2002. The Fiscal Council periodically receive from our chief financial officer a summary report on the progress of the pre-approved services rendered and the corresponding fees duly authorized. Any services which are not included in such require a prior favorable opinion of our Fiscal Council. Our policy also contains a list of services which cannot be rendered by our external auditors.
139
ITEM 16D. EXEMPTIONS FROM THE LISTING STANDARDS FOR AUDIT COMMITTEES
NYSE corporate governance standards require that a listed company have an audit committee composed of three independent members that satisfy the independence requirements of Rule 10A-3 under the Exchange Act, with a written charter that addresses certain duties.
The Fiscal Council is a permanent body which operates independently from our management and from our registered independent public accounting firm. Its principal function is to examine the financial statements of each fiscal year and provide a formal report to our shareholders. We are relying on the exemption provided for in Rule 10A-3(c)(3) and believe that our reliance on this exemption will not materially affect the ability of the Fiscal Council to act independently and to satisfy the other requirements of Rule 10A-3. In accordance with the charter of our Fiscal Council, at least one of its members has to fulfill the requirements of the Sarbanes-Oxley Act of 2002 for the purposes of qualifying as an audit committee financial expert. Accordingly, our Fiscal Council has designated one financial expert, namely José Ronaldo Vilela Rezende.
140
ITEM 16E. PURCHASES OF EQUITY SECURITIES BY THE ISSUER AND AFFILIATED PURCHASERS
As disclosed under “Major Shareholders—Share Buyback Program,” we have purchased a number of our shares during the period covered by this annual report. See “Item 11. Quantitative and Qualitative Disclosures about Market Risk—Equity Swap Risk.”
Ambev S.A. Share Repurchases
Set forth below, in tabular format, is some disclosure on the repurchases of Ambev S.A. shares for the periods indicated. Shares not purchased under publicly announced programs include those purchased from employees when no publicly announced program was in place and those bought from employees who were dismissed, in both cases, pursuant to the terms and conditions of our stock ownership plan.
|
Month |
Total Number of Shares Purchased |
Average Price Paid per Share |
Total Number of Shares Purchased as Part of Publicly Announced Plans or Programs(1) |
Maximum Number of Shares that May Be Purchased Under Publicly Announced Plans or Programs |
|
February-2019 |
0 |
0.00 |
Not Specified |
Not Specified |
|
January-2019 |
0 |
0.00 |
Not Specified |
Not Specified |
|
December-2018 |
0 |
0.00 |
Not Specified |
Not Specified |
|
November-2018 |
111,475 |
16.46 |
Not Specified |
Not Specified |
|
October-2018 |
20,866 |
17.48 |
Not Specified |
Not Specified |
|
September-2018 |
42,696 |
18.85 |
Not Specified |
Not Specified |
|
August-2018 |
98,790 |
19.30 |
Not Specified |
Not Specified |
|
July-2018 |
22,179 |
19.81 |
Not Specified |
Not Specified |
|
June-2018 |
65,587 |
20.04 |
Not Specified |
Not Specified |
|
May-2018 |
292,665 |
20.18 |
Not Specified |
Not Specified |
|
April-2018 |
350,709 |
23.64 |
Not Specified |
Not Specified |
|
March-2018 |
1,857,789 |
23.25 |
Not Specified |
Not Specified |
|
February-2018 |
291,262 |
22.09 |
Not Specified |
Not Specified |
|
January-2018 |
637,394 |
21.74 |
Not Specified |
Not Specified |
|
December-2017 |
493,724 |
20.69 |
Not Specified |
Not Specified |
|
November-2017 |
279,041 |
20.45 |
Not Specified |
Not Specified |
|
October-2017 |
78,803 |
21.01 |
Not Specified |
Not Specified |
|
September-2017 |
841,850 |
20.11 |
Not Specified |
Not Specified |
|
August-2017 |
788,027 |
19.55 |
Not Specified |
Not Specified |
|
July-2017 |
213,382 |
18.92 |
Not Specified |
Not Specified |
|
June-2017 |
262,702 |
18.39 |
Not Specified |
Not Specified |
|
May-2017 |
317,969 |
19.07 |
Not Specified |
Not Specified |
|
April-2017 |
437,084 |
17.68 |
Not Specified |
Not Specified |
|
March-2017 |
390,678 |
17.46 |
Not Specified |
Not Specified |
|
February-2017 |
36,522 |
17.11 |
Not Specified |
Not Specified |
|
January-2017 |
3,690,690 |
16.78 |
Not Specified |
Not Specified |
|
December-2016 |
170,024 |
16.49 |
Not Specified |
Not Specified |
|
November-2016 |
166,797 |
17.83 |
Not Specified |
Not Specified |
|
October-2016 |
108,375 |
18.71 |
Not Specified |
Not Specified |
|
September-2016 |
202,158 |
19.66 |
Not Specified |
Not Specified |
|
August-2016 |
351,594 |
19.53 |
Not Specified |
Not Specified |
|
July-2016 |
24,400 |
19.22 |
Not Specified |
Not Specified |
|
June-2016 |
180,981 |
18.77 |
Not Specified |
Not Specified |
|
May-2016 |
985,389 |
18.88 |
Not Specified |
Not Specified |
|
April-2016 |
369,266 |
18.80 |
Not Specified |
Not Specified |
|
March-2016 |
231,646 |
18.70 |
Not Specified |
Not Specified |
|
February-2016 |
76,999 |
17.69 |
Not Specified |
Not Specified |
|
January-2016 |
329,219 |
17.28 |
Not Specified |
Not Specified |
(1) May differ from total number of shares purchased as they do not include all shares acquired from employees under the stock ownership program.
141
ITEM 16F. CHANGE IN REGISTRANT’S CERTIFYING ACCOUNTANT
As disclosed in our current report on Form 6-K furnished on August 9, 2018, our board of directors approved the engagement of PricewaterhouseCoopers Auditores Independentes, or PwC, as our independent registered public accounting firm beginning January 1, 2019. PwC will replace Deloitte as a result of the end of the term of the services agreement with Deloitte.
Deloitte’s audit report dated March 22, 2019 on our consolidated financial statements for the fiscal year ended December 31, 2018 does not contain an adverse opinion or disclaimer of opinion, nor was it qualified or modified as to uncertainty, audit scope or accounting principles. Deloitte’s audit report dated March 16, 2018 on our consolidated financial statements for the fiscal year ended December 31, 2017 also did not contain an adverse opinion or disclaimer of opinion, nor was it qualified or modified as to uncertainty, audit scope or accounting principles.
Deloitte’s audit report dated March 22, 2019 on the effectiveness of our internal control over financial reporting as of December 31, 2018 does not contain a disclaimer of opinion nor was it modified as to audit scope or otherwise. Deloitte’s audit report dated March 16, 2018 on the effectiveness of our internal control over financial reporting as of December 31, 2017 also did not contain a disclaimer of opinion nor was it modified as to audit scope or otherwise.
During the two fiscal years preceding the rotation of Deloitte, there were no disagreements between us and Deloitte on any matters of accounting principles or practices, financial statement disclosure or auditing scope or procedure, which disagreements, if not resolved to the satisfaction of Deloitte, would have caused Deloitte to make reference to the subject matter of the disagreement in its report on our consolidated financial statements. During the two fiscal years preceding the rotation of Deloitte, there were no “reportable events” as that term is defined in Item 3.04(a)(1)(v) of Regulation S-K.
We have provided Deloitte with a copy of this Item 16F and have requested and received from Deloitte a letter addressed to the SEC stating whether or not Deloitte agrees with the above statements. A copy of the letter from Deloitte is attached as Exhibit 16.1 to this annual report.
During the two fiscal years preceding the rotation of Deloitte, neither us nor anyone acting on our behalf, consulted PwC regarding any of the matters or events set forth in Item 3.04(a)(2) of Regulation S-K.
142
ITEM 16G. CORPORATE GOVERNANCE
The principal differences between the NYSE corporate governance standards and our corporate governance practices are referred to in “Item 6. Directors, Senior Management and Employees—C. Board Practices—Differences Between the United States and Brazilian Corporate Governance Practices.”
143
ITEM 16H. MINE SAFETY DISCLOSURE
Not Applicable.
144
PART III
Our audited consolidated financial statements, together with the audit report of the Independent Registered Public Accounting Firm thereon, are filed as part of this annual report, starting on page F-1 hereto, following the signature pages.
145
ITEM 18. FINANCIAL STATEMENTS
See “Item 17—Financial Statements.”
146
ITEM 19. EXHIBITS
147
SIGNATURES
The registrant hereby certifies that it meets all of the requirements for filing on Form 20-F and that it has duly caused and authorized the undersigned to sign this annual report on its behalf.
AMBEV S.A.
By: /s/ Bernardo Pinto Paiva
Name: Bernardo Pinto Paiva
Title: Chief Executive Officer
By: /s/ Fernando Mommensohn Tennenbaum
Name: Fernando Mommensohn Tennenbaum
Title: Chief Financial Officer
Date: March 22, 2019.
REPORT OF INDEPENDENT REGISTERED PUBLIC ACCOUNTING FIRM
To the Shareholders and the Board of Directors of
Ambev S.A.
São Paulo - SP - Brazil
Opinion on internal control over financial reporting
We have audited the internal control over financial reporting of Ambev S.A. and subsidiaries (the “Company”) as of December 31, 2018, based on criteria established in the Internal Control - Integrated Framework (2013), issued by the Committee of Sponsoring Organizations of the Treadway Commission - COSO. In our opinion, the Company maintained, in all material respects, effective internal control over financial reporting as of December 31, 2018, based on criteria established in Internal Control - Integrated Framework (2013), issued by COSO.
We have also audited, in accordance with the standards of the Public Company Accounting Oversight Board - PCAOB (United States), the Company’s consolidated financial statements as of and for the year ended December 31, 2018, and our report, dated March 22, 2019, expressed an unqualified opinion on those financial statements.
Basis for opinion
The Company’s Management is responsible for maintaining effective internal control over financial reporting and for its assessment of the effectiveness of internal control over financial reporting, included in the accompanying Management’s Annual Report on Internal Control over Financial Reporting. Our responsibility is to express an opinion on the Company’s internal control over financial reporting based on our audit. We are a public accounting firm registered with the PCAOB and are required to be independent with respect to the Company in accordance with the U.S. federal securities laws and the applicable rules and regulations of the Securities and Exchange Commission - SEC and the PCAOB.
We conducted our audit in accordance with the standards of the PCAOB. Those standards require that we plan and perform the audit to obtain reasonable assurance about whether effective internal control over financial reporting was maintained in all material respects. Our audit included obtaining an understanding of internal control over financial reporting, assessing the risk that a material weakness exists, testing and evaluating the design and operating effectiveness of internal control based on the assessed risk, and performing such other procedures as we considered necessary in the circumstances. We believe that our audit provides a reasonable basis for our opinion.
Definition and limitations of internal control over financial reporting
A company’s internal control over financial reporting is a process designed to provide reasonable assurance regarding the reliability of financial reporting and the preparation of financial statements for external purposes in accordance with generally accepted accounting principles. A company’s internal control over financial reporting includes those policies and procedures that: (1) pertain to the maintenance of records that, in reasonable detail, accurately and fairly reflect the transactions and dispositions of the assets of the company; (2) provide reasonable assurance that transactions are recorded as necessary to permit preparation of financial statements in accordance with generally accepted accounting principles, and that receipts and expenditures of the company are being made only in accordance with authorizations of Management and Directors of the company; and (3) provide reasonable assurance regarding prevention or timely detection of unauthorized acquisition, use, or disposition of the company’s assets that could have a material effect on the financial statements.
Because of its inherent limitations, internal control over financial reporting may not prevent or detect misstatements. Also, projections of any evaluation of effectiveness to future periods are subject to the risk that controls may become inadequate because of changes in conditions, or that the degree of compliance with the policies or procedures may deteriorate.
São Paulo, Brazil
March 22, 2019
/s/ DELOITTE TOUCHE TOHMATSU
Auditores Independentes
F - 1
REPORT OF INDEPENDENT REGISTERED PUBLIC ACCOUNTING FIRM
To the Shareholders and the Board of Directors of
Ambev S.A.
São Paulo - SP - Brazil
Opinion on the financial statements
We have audited the accompanying consolidated balance sheets of Ambev S.A. and subsidiaries (the “Company”) as of December 31, 2018 and 2017, the related consolidated income statements, consolidated statements of comprehensive income, consolidated statements of changes in equity, and consolidated cash flow statements, for each of the three years in the period ended December 31, 2018, and the related notes (collectively referred to as the “financial statements”). In our opinion, the financial statements present fairly, in all material respects, the financial position of the Company as of December 31, 2018 and 2017, and the results of its operations and its cash flows for each of the three years in the period ended December 31, 2018, in conformity with International Financial Reporting Standards – IFRS as issued by the International Accounting Standards Board - IASB.
We have also audited, in accordance with the standards of the Public Company Accounting Oversight Board - PCAOB (United States), the Company’s internal control over financial reporting as of December 31, 2018, based on the criteria established in Internal Control - Integrated Framework (2013), issued by the Committee of Sponsoring Organizations of the Treadway Commission - COSO, and our report, dated March 22, 2019, expressed an unqualified opinion on the Company’s internal control over financial reporting.
Basis for opinion
These financial statements are the responsibility of the Company’s Management. Our responsibility is to express an opinion on the Company’s financial statements based on our audits. We are a public accounting firm registered with the PCAOB and are required to be independent with respect to the Company in accordance with the U.S. federal securities laws and the applicable rules and regulations of the Securities and Exchange Commission – SEC and the PCAOB.
We conducted our audits in accordance with the standards of the PCAOB. Those standards require that we plan and perform the audit to obtain reasonable assurance about whether the financial statements are free from material misstatement, whether due to error or fraud. Our audits included performing procedures to assess the risks of material misstatement of the financial statements, whether due to error or fraud, and performing procedures that respond to those risks. Such procedures included examining, on a test basis, evidence regarding the amounts and disclosures in the financial statements. Our audits also included evaluating the accounting principles used and significant estimates made by Management, as well as evaluating the overall presentation of the financial statements. We believe that our audits provide a reasonable basis for our opinion.
São Paulo, Brazil
March 22, 2019
/s/ DELOITTE TOUCHE TOHMATSU
Auditores Independentes
We have served as the Company’s auditor since 2015.
© 2019 Deloitte Touche Tohmatsu. All rights reserved.
F - 2
AMBEV S.A. FINANCIAL STATEMENTS
Consolidated Income Statements
Years ended December 31, 2018, 2017 and 2016
(Expressed in million of Brazilian Reais)
|
Note |
2018 |
2017 |
2016 | |
|
Net sales |
6 |
50,231.3 |
47,899.3 |
45,602.6 |
|
Cost of sales |
(19,269.6) |
(18,041.8) |
(16,678.0) | |
|
Gross profit |
30,961.7 |
29,857.5 |
28,924.6 | |
|
|
||||
|
Distribution expenses |
(6,736.5) |
(6,295.5) |
(6,085.5) | |
|
Sales and marketing expenses |
(5,729.5) |
(5,620.0) |
(5,925.0) | |
|
Administrative expenses |
(2,367.2) |
(2,623.8) |
(2,166.1) | |
|
Other operating income/(expenses) |
7 |
947.3 |
1,217.3 |
1,223.1 |
|
Exceptional items |
8 |
(86.4) |
(108.7) |
1,134.3 |
|
Income from operations |
16,989.4 |
16,426.8 |
17,105.4 | |
|
|
||||
|
Finance cost |
11 |
(4,562.2) |
(4,268.3) |
(4,597.9) |
|
Finance income |
11 |
738.8 |
774.4 |
895.9 |
|
Net finance cost |
(3,823.4) |
(3,493.9) |
(3,702.0) | |
|
|
||||
|
Share of result of joint ventures |
1.0 |
(3.1) |
(5.0) | |
|
Income before income tax |
13,167.0 |
12,929.8 |
13,398.4 | |
|
|
||||
|
Income tax and social contribution expense |
12 |
(1,789.6) |
(5,079.3) |
(315.0) |
|
Net income |
11,377.4 |
7,850.5 |
13,083.4 | |
|
|
||||
|
Attributable to: |
|
|||
|
Equity holders of Ambev |
11,024.7 |
7,332.0 |
12,546.6 | |
|
Non-controlling interests |
352.7 |
518.5 |
536.8 | |
|
|
||||
|
Basic earnings per share – common - R$ |
21 |
0.7014 |
0.4668 |
0.7993 |
|
Diluted earnings per share – common - R$ |
21 |
0.6953 |
0.4629 |
0.7929 |
The accompanying notes are an integral part of these consolidated financial statements.
F - 3
Consolidated Statements of Comprehensive Income
Years ended December 31, 2018, 2017 and 2016
(Expressed in million of Brazilian Reais)
|
2018 |
2017 |
2016 | |
|
Net income |
11,377.4 |
7,850.5 |
13,083.4 |
|
Items that will not be recycled to profit or loss: |
|||
|
Full recognition of actuarial gains/(losses) |
25.7 |
124.6 |
(129.6) |
|
Items that may be recycled subsequently to profit or loss: |
|||
|
Exchange differences on translation of foreign operations (gains/(losses) |
|||
|
Investment hedge in foreign operations |
(130.8) |
- |
23.3 |
|
Investment hedge - put option granted on subsidiary |
(85.5) |
61.7 |
707.8 |
|
Gains/losses on translation of other foreign operations |
1,982.7 |
1,890.6 |
(4,858.8) |
|
Gains/losses on translation of foreign operations |
1,766.4 |
1,952.3 |
(4,127.7) |
|
Cash flow hedge - gains/(losses) |
|||
|
Recognized in Equity (Hedge reserve) |
1,747.2 |
189.3 |
(579.3) |
|
Removed from Equity (Hedge reserve) and included in profit or loss |
(1,253.5) |
324.4 |
(494.0) |
|
Total cash flow hedge |
493.7 |
513.7 |
(1,073.3) |
|
Other comprehensive (loss)/income |
2,285.8 |
2,590.6 |
(5,330.6) |
|
Total comprehensive income |
13,663.2 |
10,441.1 |
7,752.8 |
|
Attributable to: |
|||
|
Equity holders of Ambev |
13,188.9 |
9,891.7 |
7,610.4 |
|
Non-controlling interest |
474.3 |
549.4 |
142.4 |
The accompanying notes are an integral part of these consolidated financial statements. The consolidated statements of comprehensive income are presented net of income tax. The income tax effects of these items are disclosed in note 17 - Deferred income tax and social contribution.
F - 4
Consolidated Balance Sheets
As at December 31, 2018 and December 31, 2017
(Expressed in million of Brazilian Reais)
|
Assets |
Note |
2018 |
2017 |
|
|
|
|
|
|
Property, plant and equipment |
13 |
20,097.0 |
18,822.3 |
|
Goodwill |
14 |
34,276.2 |
31,401.9 |
|
Intangible |
15 |
5,840.6 |
4,674.7 |
|
Investments |
257.1 |
238.0 | |
|
Investment securities |
16 |
147.3 |
122.0 |
|
Deferred tax assets |
17 |
2,017.5 |
2,279.3 |
|
Employee benefits |
23 |
64.3 |
58.4 |
|
Derivative financial instruments |
27 |
34.9 |
35.2 |
|
Income tax and social contributions recoverable |
3,834.4 |
2,312.7 | |
|
Other recoverable taxes |
539.8 |
225.0 | |
|
Other assets |
1,687.4 |
1,964.4 | |
|
Non-current assets |
68,796.5 |
62,133.9 | |
|
|
|||
|
|
|||
|
Investment securities |
16 |
13.4 |
11.9 |
|
Inventories |
18 |
5,401.8 |
4,319.0 |
|
Trade receivable |
19 |
4,879.3 |
4,944.8 |
|
Derivative financial instruments |
27 |
220.0 |
350.0 |
|
Income tax and social contributions recoverable |
1,285.4 |
2,770.4 | |
|
Other recoverable taxes |
863.3 |
600.2 | |
|
Other assets |
|
1,202.9 |
1,367.2 |
|
Cash and cash equivalents |
20 |
11,463.5 |
10,354.5 |
|
Current assets |
25,329.6 |
24,718.0 | |
|
|
|||
|
Total assets |
94,126.1 |
86,851.9 |
The accompanying notes are an integral part of these consolidated financial statements.
F - 5
Consolidated Balance Sheets (continued)
As at December 31, 2018 and December 31, 2017
(Expressed in million of Brazilian Reais)
|
Equity and liabilities |
Note |
2018 |
2017 |
|
|
|
|
|
|
Equity |
21 |
||
|
Issued capital |
57,710.2 |
57,614.1 | |
|
Reserves |
70,215.3 |
63,361.2 | |
|
Carrying value adjustments |
(71,584.9) |
(74,966.5) | |
|
Equity attributable to equity holders of Ambev |
56,340.6 |
46,008.8 | |
|
Non-controlling interests |
1,206.8 |
1,974.0 | |
|
Total Equity |
57,547.4 |
47,982.8 | |
|
|
|||
|
|
|||
|
Interest-bearing loans and borrowings |
22 |
862.1 |
1,231.9 |
|
Employee benefits |
23 |
2,343.7 |
2,310.7 |
|
Derivative financial instruments |
27 |
2.5 |
2.4 |
|
Deferred tax liabilities |
17 |
2,424.6 |
2,329.2 |
|
Income tax and social contribution payable |
2,227.8 |
2,418.0 | |
|
Taxes and contributions payable |
675.6 |
771.6 | |
|
Trade payables |
25 |
126.1 |
175.1 |
|
Provisions |
26 |
426.2 |
512.6 |
|
Put option granted on subsidiary and other liabilities |
2,661.8 |
429.1 | |
|
Non-current liabilities |
11,750.4 |
10,180.6 | |
|
|
|||
|
|
|||
|
Bank overdrafts |
20 |
- |
1.8 |
|
Interest-bearing loans and borrowings |
22 |
1,560.6 |
1,321.1 |
|
Wages and salaries |
851.6 |
1,047.2 | |
|
Dividends and interest on shareholders’ equity payable |
807.0 |
1,778.6 | |
|
Derivative financial instruments |
27 |
679.3 |
215.1 |
|
Income tax and social contribution payable |
1,558.6 |
1,668.4 | |
|
Taxes and contributions payable |
3,781.6 |
3,825.4 | |
|
Trade payables |
25 |
14,050.0 |
11,854.0 |
|
Provisions |
26 |
173.0 |
169.0 |
|
Put option granted on subsidiary and other liabilities |
1,366.6 |
6,807.9 | |
|
Current liabilities |
24,828.3 |
28,688.5 | |
|
|
|||
|
Total liabilities |
36,578.7 |
38,869.1 | |
|
|
|||
|
Total equity and liabilities |
94,126.1 |
86,851.9 |
The accompanying notes are an integral part of these consolidated financial statements.
F - 6
Consolidated Statements of Changes in Equity
Years ended December 31, 2018
(Expressed in million of Brazilian Reais)
|
Attributable to equity holders of Ambev |
|||||||||
|
Capital |
Capital reserves |
Net income reserves |
Retained earnings |
Carrying value adjustments |
Total |
Non-controlling interests |
Total equity | ||
|
At December 31, 2017 |
57,614.1 |
54,701.0 |
8,660.2 |
- |
(74,966.5) |
46,008.8 |
1,974.0 |
47,982.8 | |
|
Impact of the adoption of IFRS 15 (i) |
- |
- |
- |
(355.4) |
- |
(355.4) |
- |
(355.4) | |
|
At January 1 st, 2018 |
57,614.1 |
54,701.0 |
8,660.2 |
(355.4) |
(74,966.5) |
45,653.4 |
1,974.0 |
47,627.4 | |
|
Net Income |
- |
- |
- |
11,024.7 |
- |
11,024.7 |
352.7 |
11,377.4 | |
|
Comprehensive income: |
|||||||||
|
Gains/(losses) on translation of foreign operations |
- |
- |
- |
- |
1,643.5 |
1,643.5 |
122.9 |
1,766.4 | |
|
Cash flow hedges |
- |
- |
- |
- |
495.9 |
495.9 |
(2.2) |
493.7 | |
|
Actuarial gains/(losses) |
- |
- |
- |
- |
24.8 |
24.8 |
0.9 |
25.7 | |
|
Total comprehensive income |
- |
- |
- |
11,024.7 |
2,164.2 |
13,188.9 |
474.3 |
13,663.2 | |
|
Capital increase |
96.1 |
(89.9) |
- |
- |
- |
6.2 |
96.9 |
103.1 | |
|
Effect of application of IAS 29 (hyperinflation) (iii) |
- |
(8.2) |
- |
3,544.1 |
258.2 |
3,794.1 |
(2.4) |
3,791.7 | |
|
Gains/(losses) of controlling interest´s share (ii) |
- |
- |
- |
- |
1,042.5 |
1,042.5 |
(1,088.6) |
(46.1) | |
|
Tax on fictitious dividends |
- |
- |
- |
- |
(7.4) |
(7.4) |
- |
(7.4) | |
|
Dividends distributed |
- |
- |
- |
(2,515.1) |
- |
(2,515.1) |
(247.4) |
(2,762.5) | |
|
Interest on shareholder´s equity |
- |
- |
- |
(5,030.5) |
- |
(5,030.5) |
- |
(5,030.5) | |
|
Purchase of shares and result on treasury shares |
- |
12.3 |
- |
- |
- |
12.3 |
- |
12.3 | |
|
Share-based payments |
- |
166.1 |
- |
- |
- |
166.1 |
- |
166.1 | |
|
Prescribed/(complement) dividends |
- |
- |
- |
30.1 |
- |
30.1 |
- |
30.1 | |
|
Reversal effect revaluation of property, plant and equipment under the predecessor basis accounting |
- |
- |
- |
75.9 |
(75.9) |
- |
- |
- | |
|
Fiscal incentive reserve |
- |
- |
1,331.5 |
(1,331.5) |
- |
- |
- |
- | |
|
Investments reserve |
- |
- |
5,442.3 |
(5,442.3) |
- |
- |
- |
- | |
|
At December 31, 2018 |
57,710.2 |
54,781.3 |
15,434.0 |
- |
(71,584.9) |
56,340.6 |
1,206.8 |
57,547.4 | |
(i) As described in Note 3 - Summary of significant account policies.
(ii) Of these amount, R$1,035.2 refers to renegotiation of shareholders agreement from Tenedora, as described in Note 1 (b).
(iii) As described in Note 1 (b) Application of inflation accounting and Financial Reporting in Hyperinflationary Economies. These effects did not contains the impact refers of income for the period, which is reflects in the income statement as net income, by the amount of R$(291.8) attributable to equity holders of Ambev and R$(292.4) to non-controlling interests.
The accompanying notes are an integral part of these consolidated financial statements.
F - 7
Consolidated Statements of Changes in Equity (continued)
Years ended December 31, 2017
(Expressed in million of Brazilian Reais)
|
Attributable to equity holders of Ambev |
|||||||||
|
Capital |
Capital reserves |
Net income reserves |
Retained earnings |
Carrying value adjustments |
Total |
Non-controlling interests |
Total equity | ||
|
At December 31, 2016 |
57,614.1 |
54,529.9 |
9,700.1 |
- |
(77,019.1) |
44,825.0 |
1,826.3 |
46,651.3 | |
|
Net Income |
- |
- |
- |
7,332.0 |
- |
7,332.0 |
518.5 |
7,850.5 | |
|
Comprehensive income: |
|||||||||
|
Gains/(losses) on translation of foreign operations |
- |
- |
- |
- |
1,928.6 |
1,928.6 |
23.7 |
1,952.3 | |
|
Cash flow hedges |
- |
- |
- |
- |
513.4 |
513.4 |
0.3 |
513.7 | |
|
Actuarial gains/(losses) |
- |
- |
- |
- |
117.7 |
117.7 |
6.9 |
124.6 | |
|
Total comprehensive income |
- |
- |
- |
7,332.0 |
2,559.7 |
9,891.7 |
549.4 |
10,441.1 | |
|
Options granted on subsidiary |
- |
- |
- |
- |
(380.4) |
(380.4) |
- |
(380.4) | |
|
Gains/(losses) of controlling interest´s share |
- |
- |
- |
- |
(12.1) |
(12.1) |
29.5 |
17.4 | |
|
Tax on fictitious dividends |
- |
- |
- |
- |
(38.7) |
(38.7) |
- |
(38.7) | |
|
Dividends distributed |
- |
- |
- |
(3,612.8) |
- |
(3,612.8) |
(431.2) |
(4,044.0) | |
|
Interest on shareholder´s equity |
- |
- |
(3,770.1) |
(1,099.6) |
- |
(4,869.7) |
- |
(4,869.7) | |
|
Purchase of shares and result on treasury shares |
- |
13.7 |
- |
- |
- |
13.7 |
- |
13.7 | |
|
Share-based payments |
- |
157.4 |
- |
- |
- |
157.4 |
- |
157.4 | |
|
Prescribed dividends |
- |
- |
- |
34.7 |
- |
34.7 |
- |
34.7 | |
|
Reversal effect revaluation of property, plant and equipment under the predecessor basis accounting |
- |
- |
- |
75.9 |
(75.9) |
- |
- |
- | |
|
Fiscal incentive reserve |
- |
- |
1,552.3 |
(1,552.3) |
- |
- |
- |
- | |
|
Investments reserve |
- |
- |
1,177.9 |
(1,177.9) |
- |
- |
- |
- | |
|
At December 31, 2017 |
57,614.1 |
54,701.0 |
8,660.2 |
- |
(74,966.5) |
46,008.8 |
1,974.0 |
47,982.8 | |
The accompanying notes are an integral part of these consolidated financial statements.
F - 8
Consolidated Statements of Changes in Equity (continued)
Years ended December 31, 2016
(Expressed in million of Brazilian Reais)
|
Attributable to equity holders of Ambev |
|||||||||
|
Capital |
Capital reserves |
Net income reserves |
Retained earnings |
Carrying value adjustments |
Total |
Non-controlling interests |
Total equity | ||
|
At December 31, 2015 |
57,614.1 |
54,373.6 |
8,201.2 |
- |
(71,857.0) |
48,331.9 |
2,001.8 |
50,333.7 | |
|
|
|
|
|
|
|
|
|
| |
|
Net Income |
- |
- |
- |
12,546.6 |
- |
12,546.6 |
|
536.8 |
13,083.4 |
|
|
|
|
|
|
|
|
|
| |
|
Comprehensive income: |
|
|
|
|
|
|
|
|
|
|
Gains/(losses) on translation of foreign operations |
- |
- |
- |
- |
(3,728.8) |
(3,728.8) |
|
(398.9) |
(4,127.7) |
|
Cash flow hedges |
- |
- |
- |
- |
(1,076.7) |
(1,076.7) |
|
3.4 |
(1,073.3) |
|
Actuarial gain/(losses) |
- |
- |
- |
- |
(130.7) |
(130.7) |
|
1.1 |
(129.6) |
|
Total comprehensive income |
- |
- |
- |
12,546.6 |
(4,936.2) |
7,610.4 |
|
142.4 |
7,752.8 |
|
Options granted on subsidiary |
- |
- |
- |
- |
(144.1) |
(144.1) |
|
- |
(144.1) |
|
Gains/(losses) of controlling interest´s share |
- |
- |
- |
- |
(2.8) |
(2.8) |
|
37.6 |
34.8 |
|
Exchange transaction of shareholdings |
- |
- |
- |
- |
(3.1) |
(3.1) |
|
- |
(3.1) |
|
Dividends distributed |
- |
- |
- |
(5,651.8) |
- |
(5,651.8) |
|
(355.5) |
(6,007.3) |
|
Interest on shareholder´s equity |
- |
- |
(2,039.2) |
(3,454.2) |
- |
(5,493.4) |
|
- |
(5,493.4) |
|
Purchase of shares and result on treasury shares |
- |
94.8 |
- |
- |
- |
94.8 |
|
- |
94.8 |
|
Share-based payments |
- |
61.5 |
- |
- |
- |
61.5 |
|
- |
61.5 |
|
Prescribed dividends |
- |
- |
- |
21.6 |
- |
21.6 |
|
- |
21.6 |
|
Reversal effect revaluation of property, plant and equipment under the predecessor basis accounting |
- |
- |
- |
75.9 |
(75.9) |
- |
|
- |
- |
|
Fiscal incentive reserve |
- |
- |
1,819.5 |
(1,819.5) |
- |
- |
|
- |
- |
|
Investments reserve |
- |
- |
1,718.6 |
(1,718.6) |
- |
- |
|
- |
- |
|
At December 31, 2016 |
57,614.1 |
54,529.9 |
9,700.1 |
- |
(77,019.1) |
44,825.0 |
|
1,826.3 |
46,651.3 |
The accompanying notes are an integral part of these consolidated financial statements.
F - 9
Consolidated Cash Flow Statements
Years ended December 31, 2018, 2017 and 2016
(Expressed in million of Brazilian Reais)
|
Note |
2018 |
2017 |
2016 | |
|
Net income |
11,377.4 |
7,850.5 |
13,083.4 | |
|
Depreciation, amortization and impairment |
4,023.1 |
3,612.1 |
3,512.0 | |
|
Impairment losses on receivables and inventories |
125.6 |
156.3 |
196.5 | |
|
Additions/(reversals) in provisions and employee benefits |
171.7 |
168.3 |
347.1 | |
|
Net finance cost |
11 |
3,823.4 |
3,493.9 |
3,702.0 |
|
Losses/(gain) on sale of property, plant and equipment and intangible assets |
29.8 |
(49.4) |
(70.9) | |
|
Losses/(gain) on sale of operations in subsidiaries |
(80.2) |
- |
- | |
|
Losses/(gain) on sale of operations in associates |
- |
(41.7) |
- | |
|
Gains on exchange transaction of shareholdings |
- |
- |
(1,240.0) | |
|
Equity-settled share-based payment expense |
24 |
161.0 |
209.3 |
170.3 |
|
Income tax expense |
12 |
1,789.6 |
5,079.3 |
315.0 |
|
Share of result of joint ventures |
(1.0) |
3.1 |
5.0 | |
|
Other non-cash items included in the profit |
(1,239.2) |
196.3 |
(737.4) | |
|
Cash flow from operating activities before changes in working capital and use of provisions |
20,181.2 |
20,678.0 |
19,283.0 | |
|
(Increase)/decrease in trade and other receivables |
(149.2) |
(265.6) |
(578.4) | |
|
(Increase)/decrease in inventories |
(1,167.1) |
(63.8) |
(437.1) | |
|
Increase/(decrease) in trade and other payables |
869.8 |
(105.8) |
(565.1) | |
|
Cash generated from operations |
19,734.7 |
20,242.8 |
17,702.4 | |
|
Interest paid |
(621.9) |
(557.3) |
(724.9) | |
|
Interest received |
500.4 |
337.9 |
597.7 | |
|
Dividends received |
9.3 |
7.3 |
111.0 | |
|
Income tax paid |
(1,711.3) |
(2,156.6) |
(5,341.8) | |
|
Cash flow from operating activities |
17,911.2 |
17,874.1 |
12,344.4 | |
|
Proceeds from sale of property, plant and equipment and intangible assets |
102.4 |
101.9 |
133.6 | |
|
Acquisition of property, plant and equipment and intangible assets |
(3,571.0) |
(3,203.6) |
(4,132.7) | |
|
Acquisition of subsidiaries, net of cash acquired |
(133.4) |
(333.3) |
(1,824.2) | |
|
Acquisition of other investments |
(8.5) |
(1.1) |
(37.6) | |
|
Investment in short term debt securities and net proceeds/(acquisition) of debt securities |
(16.1) |
276.9 |
(37.1) | |
|
Net proceeds/(acquisition) of other assets |
(49.1) |
86.2 |
- | |
|
Cash flow from investing activities |
(3,675.7) |
(3,073.0) |
(5,898.0) | |
|
Capital increase |
6.2 |
- |
- | |
|
Proceeds/(repurchase) of treasury shares |
7.3 |
(38.6) |
0.4 | |
|
Acquisition of non-controlling interest |
(3,060.6) |
- |
- | |
|
Proceeds from borrowings |
2,304.9 |
2,904.4 |
3,792.0 | |
|
Repayment of borrowings |
(2,499.0) |
(5,441.7) |
(1,896.2) | |
|
Cash net of finance costs other than interests |
(1,153.2) |
(1,459.5) |
(3,207.8) | |
|
Payment of finance lease liabilities |
(13.1) |
(9.0) |
(2.9) | |
|
Dividends and Interest on shareholder´s equity paid |
(8,814.1) |
(8,819.8) |
(10,330.6) | |
|
Cash flow from financing activities |
(13,221.6) |
(12,864.2) |
(11,645.1) | |
|
Net increase/(decrease) in cash and cash equivalents |
1,013.9 |
1,936.9 |
(5,198.7) | |
|
Cash and cash equivalents less bank overdrafts at beginning of year (i) |
10,352.7 |
7,876.8 |
13,617.7 | |
|
Effect of exchange rate fluctuations |
96.9 |
539.0 |
(542.2) | |
|
Cash and cash equivalents less bank overdrafts at end of year (i) |
11,463.5 |
10,352.7 |
7,876.8 |
(i) Net of bank overdrafts.
The accompanying notes are an integral part of these consolidated financial statements.
F - 10
Notes to the consolidated financial statements:
|
1. |
Corporate information |
|
2. |
Statement of compliance |
|
3. |
Summary of significant accounting policies |
|
4. |
Use of estimates and judgments |
|
5. |
Segment reporting |
|
6. |
Net sales |
|
7. |
Other operating income/(expenses) |
|
8. |
Exceptional items |
|
9. |
Payroll and related benefits |
|
10. |
Additional information on operating expenses by nature |
|
11. |
Finance cost and income |
|
12. |
Income tax and social contribution |
|
13. |
Property, plant and equipment |
|
14. |
Goodwill |
|
15. |
Intangible |
|
16. |
Investment securities |
|
17. |
Deferred income tax and social contribution |
|
18. |
Inventories |
|
19. |
Trade receivables |
|
20. |
Cash and cash equivalents |
|
21. |
Changes in equity |
|
22. |
Interest-bearing loans and borrowings |
|
23. |
Employee benefits |
|
24. |
Share-based payments |
|
25. |
Trade payables |
|
26. |
Provisions |
|
27. |
Financial instruments and risks |
|
28. |
Operating leases |
|
29. |
Collateral and contractual commitments with suppliers, advances from customers and other |
|
30. |
Contingent liabilities |
|
31. |
Non - cash items |
|
32. |
Related parties |
|
33. |
Group companies |
|
34. |
Insurance |
|
35. |
Events after the reporting period |
F - 11
1. CORPORATE INFORMATION
(a) Description of business
Ambev S.A. (referred to as the “Company” or “Ambev”), headquartered in São Paulo, Brazil, has purpose directly or through the participation in other companies, produces and sells beer, draft beer, soft drinks, other non-alcoholic beverages, malt and food in general, as well as the advertising of its and third party products, the sale of promotional and advertising materials and the direct or indirect exploitation of bars, restaurants, snack bars and similar, among others.
The Company’s shares and ADR’s (American Depositary Receipts) are listed on the B3 S.A.- Brasil, Bolsa, Balcão as “ABEV3” and on the New York Stock Exchange (NYSE) as “ABEV”.
The Company’s direct controlling shareholders are Interbrew International B.V. (“IIBV”), AmBrew S.A. (“Ambrew”), both subsidiaries of Anheuser-Busch InBev N.V. (“AB InBev”) and Fundação Antonio e Helena Zerrenner Instituição Nacional de Beneficência (“Fundação Zerrenner”).
The financial statements were approved by the Board of Directors on February 27th, 2019.
(b) Major corporate events in 2018, 2017 and 2016
Application of inflation accounting and financial reporting in hyperinflationary economies
In June 2018, the Argentinean peso underwent a severe devaluation resulting in the three-year cumulative inflation of Argentina to exceed 100%, thereby triggering the requirement to transition to hyperinflation accounting as prescribed by IAS 29 Financial Reporting in Hyperinflationary Economies as of January 1st ,2018 (beginning of the reporting period in which it identifies the existence of hyperinflation).
Under IAS 29, the non-monetary assets and liabilities, the equity and the income statement of subsidiaries operating in hyperinflationary economies are restated for changes in the general purchasing power of the local currency applying a general price index.
The financial statements of an entity whose functional currency is the currency of a hyperinflationary economy, whether they are based on a historical cost approach or a current cost approach, shall be stated in terms of the measuring unit current at the end of the reporting period and conversion into Brazilian Real at the period closing exchange rate.
F - 12
Consequently, the company has applied hyperinflation accounting for its Argentinean subsidiaries in these consolidated interim financial statements applying the IAS 29 rules as follows:
|
• |
hyperinflation accounting was applied as of January1st, 2018 (under paragraph 4 of IAS 29, the standard applies to the financial statements of any entity from the beginning of the reporting period in which it identifies the existence of hyperinflation);
|
| • |
non-monetary assets and liabilities stated at historical cost (e.g. property plant and equipment, intangible assets, goodwill, etc.) and equity of subsidiaries in Argentina were restated using an inflation index. The hyperinflation impacts resulting from changes in the general purchasing power until 31 December 2017 were reported in retained earnings and the impacts of changes in the general purchasing power from January 1st, 2018 are reported through the income statement on a dedicated account for hyperinflation monetary adjustments in the finance line (see also Note 11 - Finance cost and income). Under paragraph 3 of IAS 29, there is no a general price index, but allow to be executed judgement when restatement of financial statements becomes necessary. That way, the index used was based in Resolution 539/18 issued by Argentine Federation of Professional Boards on Economic Sciences: i) from January 1st, 2017 onwards the national IPC (national consumer price index); ii) to December 31,2016 the IPIM (wholesale price index).
|
| • |
the income statement is adjusted at the end of each reporting period using the change in the general price index and is converted at the closing exchange rate of each period (rather than the year to date average rate for non hyperinflationary economies), thereby restating the year to date income statement account both for inflation index and currency conversion;
|
| • |
the prior year income statement and the first and second quarter of 2018 and balance sheet of the Argentinean subsidiaries were not restated. Under paragraph 42 (b) of IAS 21 when amounts are translated into the currency of a non-hyperinflationary economy, comparative amounts shall be those that were presented as current year amounts in the relevant prior year financial statements (i.e. not adjusted for subsequent changes in the price level or subsequent changes in exchange rates). |
F - 13
The net assets impacts of the Company on December 31, 2018 are presents as below:
|
Assets |
12/31/2018 |
|
Property, plant and equipment |
1,394.9 |
|
Goodwill |
1,686.4 |
|
Intangible |
976.3 |
|
Non-current assets |
4,057.6 |
|
Inventories |
72.8 |
|
Current assets |
72.8 |
|
Total assets |
4,130.4 |
|
Equity and liabilities |
|
|
Equity |
|
|
Reserves |
(8.2) |
|
Carrying value adjustments |
258.2 |
|
Retained earnings |
3,252.4 |
|
Equity attributable to equity holders of Ambev |
3,502.4 |
|
Non-controlling interests |
(2.4) |
|
Total Equity |
3,500.0 |
|
Deferred tax liabilities |
630.4 |
|
Non-current liabilities |
630.4 |
|
Total liabilities |
630.4 |
|
Total equity and liabilities |
4,130.4 |
The income statement of year ended 2017 of operations in Argentina were translated at an average rate of 0.193096 Argentinean pesos per Brazilian Real. The income statement of year ended December 31, 2018 of operations in Argentina was corrected by inflation index and, later translated at the December 31, 2018 closing rate of 0.102486 Argentinean pesos per Brazilian Real, in consequence of IAS 29 application.
In year ended December 31, 2018, the adoption to Hyperinflation Accounting in accordance with the IFRS rules, resulted in (i) a positive R$182.5 adjustment reported in the finance results, (ii) a negative impact on the Profit of R$292.4.
Exchange contracts for future financial flows - Equity Swap
On December 21, 2017 Ambev's Board of Directors approved the execution, by the Company or its subsidiaries, of equity swap contracts through financial institutions to be defined by the Company's management, having as underlying asset the shares issued by the Company or American Depositary Receipts (ADR’s), without losses on the liquidation, within the regulatory term, of the contracts still in force. The settlement of the approved equity swap contracts shall occur within a maximum period of 18 months from approval, such contracts may result in exposure up to 44 million common shares (of which all or part may be through ADR's), with a limit value up to R$820 million.
F - 14
On May 15, 2018 Ambev’s Board of Directors approved the conclusion of new equity swap contracts, without losses on the liquidation, within the regulatory term, of the contracts still in force. The settlement of the new approved equity swap shall occur within a maximum period of 18 months from approval, and such contracts may result in exposure up to 80 million common shares ( which all or part may be through ADR's), with a limit value up to R$1.8 million.
On December 20, 2018, the Board of Directors of Ambev approved the conclusion of new equity swap contracts, without prejudice to the liquidation, within the regulatory term, of the equity swap contracts still in force. The settlement of the new approved equity swap contracts shall occur within a maximum period of 18 months from approval, and such contracts may result in exposure up to 80 million common shares (of which all or part may be through ADRs), with a limit value up to R$1.5 billion, in addition to contracts already executed in the context of the approvals of December 21, 2017 and May 15, 2018, and which have not yet been settled, may result in an exposure up to 137,394,353 common shares (all or part of which may be through ADR's).
Addendum to the Agreement with PepsiCo
The long-term agreement with PepsiCo, under which the Company has the exclusive right to bottle, sell and distribute certain brands on PepsiCo’s portfolio of soft drinks in Brazil, including Pepsi Cola, Gatorade, H2OH! and Lipton Ice Tea, was added in October 2018 to reflect certain changes in the trade agreement between the parties. The new terms of the agreement were approved by CADE in December 2018 and became effective as of January 1st, 2019. The agreement will be in force until December 31, 2027.
Sale of subsidiary
On June 8, 2018 the Company concluded the sale of all shares of the subsidiary, Barbados Bottling Co. Limited, active in the Soft drink segment, by the amount of US$53 million, corresponding to R$179 million. An result of this transaction the Company recorded a gain of US$22 million, corresponding to R$75 million at the transaction date and to R$79 million in December 31, 2018, in the income statement as Exceptional item.
Perpetual licensing agreement with Quilmes
In September 2017, Quilmes, a subsidiary of Ambev, entered into an agreement whereby AB InBev will grant a perpetual license to Quilmes in Argentina for Budweiser and other North American brands upon the recovery of the distribution rights by AB InBev from the Chilean company Compañia Cervecerías Unidas S.A. - CCU. The agreement also foreseed the transfer of the brewery of Cerveceria Argentina Sociedad Anonima Isenbeck by AB InBev to Quilmes and the transfer of some Argentinean brands (Norte, Iguana and Baltica) and related business assets along with US$50 million by Quilmes to CCU. The transaction was closed on May 2, 2018, following the approval, on April 27, 2018, by the Argentinean antitrust authority (Comisión Nacional de Defensa de la Competencia) of the main transaction documents and verification of other usual conditions closing. The Company recorded a gain of 306 million of Argentinean pesos, corresponding to R$50 million on the transaction date and to R$30 million in December 31, 2018 in the income statement as a result of the application of the accounting practice for the exchange of assets involving transactions under common control as Exceptional item.
F - 15
Renegotiation of shareholders agreement from Tenedora
On December 1st, 2017, Ambev informed its shareholders and the general market that the E. León Jimenes, S.A. (“ELJ”), partner of Ambev in Tenedora, S.A. (“Tenedora”), which holds almost all shares of Cervecería Nacional Dominicana, S.A (“CND”), would exercise partially, as provide for in shareholders’ agreement of Tenedora, ELJ put option with relation to approximately 30% of capital stock by Tenedora. Due the partial put exercise option, the Company will pay to ELJ the amount of R$3 billion (equivalent to USD 926.5 million) and would be the holder of approximately 85% of Tenedora, and ELJ will remain with 15% interest of CND. Considering the strategic importance of alliance with the ELJ, the Board of Directors of Ambev approved this date the change of the call option term from 2019 to 2022, of the period for the call option granted by ELJ to the Company to become exercisable. The transaction was subject to certain conditions precedent that was concluded on January 18, 2018.
Adherence to the Special Tax Regularization Program - PERT 2017
During the third quarter of 2017, the Company adhere a Special Program for Tax Regularization, fixed by Provisional Measure no. 783, from May 31, 2017, extended by the Provisional Measure no. 798 (“PERT 2017 in August, 30 2017”), undertaking to pay some tax assessments that were in dispute, including debts from its subsidiaries, for a total amount of R$3.5 billion, already considering discounts according to the program, having paid the amount of approximately R$960 million in 2017 and undertaking to pay the remaining value in 145 monthly installments, with interest, starting in January, 2018, the installments owed until moment, have been paid.
Acquisition of the Cachoeiras de Macacu
In December 2016, the Company acquired Cachoeira de Macacu Bebidas Ltda. from Brasil Kirin Indústria de Bebidas Ltda., a company that owns an operating industrial plant for the production and packaging of beer and non-alcohol beverages in the State of Rio de Janeiro for R$478.6 million.
F - 16
Exchange of shareholdings
On May 12, 2016, Ambev and its controlling shareholder, AB InBev, entered into an agreement for the exchange of shareholdings (“Swap”). The execution of the Swap was conditional on the implementation of the merger of the activities of AB InBev and SABMiller Plc (“SABMiller”), which occurred on October 10, 2016. Subsequently, on December 31, 2016, after the implementation of certain preparatory corporate acts, the Swap was effected. Based on the agreement described above, Ambev transferred to AB InBev the equity interest in Keystone Global Corporation - KGC, which held shares in companies domiciled in Colombia, Peru and Ecuador. On the other hand, AB InBev transferred to Ambev its interest in Cerveceria Nacional S. de R.L., a subsidiary domiciled in Panama, which had previously been acquired as a third party.
The value attributed to the transaction is based on a fairness opinion prepared by a specialized company and duly approved by the Board of Directors of Ambev, with abstention from the vote of the directors appointed by AB InBev.
The result of the transaction above mentioned was R$1,236.8 million, of which R$1,240.0 million was recognized in the income statement on exceptional items.
Acquisition of Archibald Microbrasserie
On April, 2016, the Company, through its wholly-owned subsidiary Labatt Breweries, in Canada, acquired the company Archibald Microbrasserie, known for its local beers and seasonal specialties. Furthermore, in Brazil, acquired 66% of the company Sucos do Bem, which has a range of juices, teas and cereal bars. The acquisition amount added was approximately R$155 million.
Acquisition of Mark Anthony Group Companies
On January, 2016, the Ambev, through its wholly-owned subsidiaries, CRBS S.A. and Ambev Luxembourg, acquired companies to a range of primarily spirit-based beers and ciders from Mark Anthony Group, by R$1.4 billion.
2. STATEMENT OF COMPLIANCE
The consolidated financial statements have been prepared using the accounting basis of going concern and are being presented in accordance with International Financial Reporting Standards (“IFRS”) as issued by the International Accounting Standards Board (“IASB”) that were effective as of December 31, 2018.
F - 17
3. SUMMARY OF SIGNIFICANT ACCOUNTING POLICIES
There were no significant changes in accounting policies and calculation methods used for the financial statements as of December 31, 2018 in relation to those presented in the financial statements for the years ended December 31, 2017 and 2016, except for the polices described below:
IFRS 9 - Financial Instruments replace IAS 39 for periods beginning on after January 1st, 2018), introduces new requirements for the classification of financial assets, that depends on the entity's business model and the contractual characteristics of the cash flow of the financial instruments; defines a new expected-loss impairment model that will require more effective recognition; and introduces a substantially-reformed model for hedge accounting, with enhanced disclosures about risk management activity. The new hedge accounting model represents a significant revision of the policy and aligns the accounting treatment with the risk management activities. IFRS 9 also removes the volatility in the result caused by changes in the credit risk of liabilities determined to be measured at fair value.
The company has applied IFRS 9 Financial Instruments as of the effective date, without restatement of the comparative information for the period beginning January 1st, 2017. Consequently, the classification and measurement of the financial instruments for the comparative periods follow the requirements under IAS 39. The company performed an impact assessment and concluded that IFRS 9 Financial Instruments does not impact materially its financial position, financial performance or risk management activities.
IFRS 15 - Revenue from Contracts with Customers requires that the revenue recognition be done depict the transfer of goods or services to customers on amounts that reflect the consideration to which the Company expects to be entitled in exchange for those goods or services. The new standard for periods beginning on after January 1st, 2018 result in more and enhanced disclosures about revenue, provide guidance for transactions that were not previously addressed comprehensively (for example, service revenue and contract modifications) and improve guidance for multiple-element arrangements.
The company has applied IFRS 15 Revenue from Contracts with Customers as of the effective date (January 1st, 2018) in accordance with the modified retrospective application. Under this approach, the cumulative effect of initially applying IFRS 15 must be recognized as an adjustment to the opening balance of equity, in Retained earnings, at the date of initial application without the restatement of prior periods. On the implementation date, the adjustment to the opening balance of equity resulted in a decrease of the Retained earnings by R$355.4, to reflect the changes in accounting policies related to certain rebates granted to customers that, in accordance whit the IFRS 15, should be tied to the transaction price underlying 2017 revenue.
F - 18
(a) Basis of preparation and measurement
The financial statements are presented in million of Brazilian Real (“R$”), unless otherwise indicated, rounded to the nearest million indicated. The measurement basis used in preparing the financial statements is historical cost, net realizable value, fair value or recoverable amount.
(b) Recently issued IFRS
The reporting standards below were published and are mandatory for future annual reporting periods. Although IFRSs anticipate early adoption, in Brazil, regulators have prevented this anticipation in order to preserve aspects of comparability. Accordingly, for the period ended December 31, 2018, these standards were not applied in the preparation of these financial statements:
IFRS 16 Leases (effective from annual periods beginning on or after January 1st, 2019) replaces the current lease accounting requirements and introduces significant changes to lessee accounting as it removes the distinction between operating and finance leases under IAS 17 Leases and related interpretations, and requires a lessee to recognize a right-of-use asset and a lease liability at lease commencement date.
IFRS 16 also requires to recognize a depreciation charge related to the right-of-use assets and an interest expense on the lease liabilities, as compared to the recognition of operating lease expense or rental cost on a straight-line basis over the lease term under prior requirements. In addition, the company will amend the consolidated cash flow statement presentation, to segregate the payment of leases into a principal portion presented within financing activities and an interest component presented within operating activities.
For short-term leases and leases of low value assets, the company will continue to recognize a lease expense on a straight-line basis as permitted by IFRS 16. The company as a lessor will continue to classify leases as either finance leases or operating leases and account for those two types of leases differently.
The company has chosen the full retrospective application of IFRS 16 and, consequently, will restate the comparative information in the 2019 financial statements. In addition, the company will apply the practical expedient available on transition to IFRS 16 to not reassess whether a contract is or contains a lease. Accordingly, the definition of a lease under IAS 17 and related interpretations will continue to apply to the leases entered or modified before January 1st, 2019.
The company has assessed the estimated impact that the initial application of IFRS 16 will have on its consolidated financial statements. On transition to IFRS 16, the company estimates that it will recognize R$1,547.4 of right-of-use assets and R$1,670.1 of lease liabilities, recognizing the difference in retained earnings. When measuring lease liabilities, the company discounted lease payments using incremental borrowing rates at January 1st, 2019. The weighted average rate applied is 12.5%.
F - 19
Other Standards, Interpretations and Amendments to Standards
The other amendments to standards effective for annual periods beginning after January 1st, 2019, have not been listed above because of either their non-applicability to or their immateriality to Ambev’s consolidated financial statements.
(c) Consolidated financial statements
The financial statements of subsidiaries, joint arrangements and associates used in its consolidated financial statements are prepared for the same reporting period as Ambev, using consistent accounting policies.
All intercompany transactions, balances and unrealized gains or losses on transactions between group companies have been eliminated.
Subsidiaries
The Company controls an entity when it is exposed to or has rights to variable returns due to its involvement with the organization and is able to affect those returns through its power over the entity. In assessing control, potential voting rights are taken into account. Control is presumed to exist where the Company owns, directly or indirectly, more than one half of the voting rights (which does not always equate to economic ownership), unless it can be demonstrated that such ownership does not constitute control.
Subsidiaries are consolidated as from the date in which control is obtained to the Company, except when the predecessor basis of accounting is applied for common control transfers. Consolidation is discontinued as from the date control ceases.
Ambev uses the purchase method to account for business combinations. The consideration transferred for the acquisition of a subsidiary is the fair value of the assets transferred, the liabilities incurred and the equity interest issued by Ambev. The consideration transferred includes the fair value of any asset or liability resulting from a contingent consideration agreement, when applicable. Costs related to the acquisition are recognized in income, as incurred. Assets, liabilities and contingent liabilities acquired/assumed in a business combination are recognized initially at their fair values at the acquisition date. Ambev recognizes the non-controlling interest in the acquiree, either at fair value or at the non-controlling interest’s proportionate share of the net assets acquired. The measurement of non-controlling interest to be recognized is determined for each acquisition.
F - 20
The excess: (i) of the consideration paid; (ii) of the amount of any non-controlling interests in the acquire (when applicable); and (iii) of the fair value, at acquisition date, of any previous equity interest in the acquire, over the fair value of the net identifiable assets acquired, at the date of acquisition, is recorded as goodwill. When the consideration transferred is less than the fair value of net assets acquired, the difference is recognized directly in income.
All intercompany transactions, balances and unrealized gains and losses on transactions between group companies have been eliminated. Unrealized losses are eliminated in the same way as unrealized gains, but only to the extent that there is no evidence of impairment.
Joint arrangements
Joint arrangements are all entities over which the Company shares control with one or more parties. Joint arrangements are classified as either joint operations or joint ventures depending on the contractual rights and obligations of each investor.
Business combination between entities under common control
Business combinations between entities under common control have not been addressed by IFRS’s. The IFRS 3 is the pronouncement that shall be applied to business combinations, however it explicitly excludes business combinations between entities under common control from its scope.
i) Predecessor basis of accounting
In accordance with IAS 8, Management has adopted an accounting practice which is consistent with United States Generally Accepted Accounting Principles (USGAAP) and United Kingdom Generally Accepted Accounting Principles (UKGAAP), the predecessor basis of accounting to record the carrying amount of the asset received, as recorded by the parent company.
Under the predecessor basis of accounting, when accounting for a transfer of assets between entities under common control, the entity that receives the net assets or the equity interests (the acquirer) shall initially record the assets and liabilities transferred at their parent book value at the transfer date. If the book value of assets and liabilities transferred by the parent are different from the historical cost registered by the controlling entity of the entities under common control (the ultimate parent), the financial statements of the acquirer shall reflect the assets and liabilities transferred at the same cost of the ultimate parent, in counterpart to shareholders' equity against the carrying value adjustments.
F - 21
ii) Assets Swap
Regarding transactions between entities under common control that involve the disposal or transfer of assets from the subsidiary to its parent company, i.e. - above the level of our consolidated financial statement –, the Company assess the existence of (i) conflict of interests and (ii) economic substance and purpose. Having fulfilled these assumptions, the Company adopted as a policy the concepts of IAS 16 in order to provide adequate visibility and fair impact on the amount of the distributable results to our shareholders, specially the non-controlling interests. This policy also includes assets acquired through the swap of non-cash assets, or swap with a combination of cash and non-cash assets. The assets subject to the swap may be of equal or different nature. The cost of such asset is measured at fair value, unless (i) the swap transaction is not commercial in nature, or (ii) the fair value of the asset received (and the asset assigned) cannot be reliably measured. The acquired asset is measured through this way even if the assignor entity cannot immediately exclude the asset from its books. If the acquired asset is not measurable at fair value, its cost is determined by the book value of the assigned asset.
Whenever there is a distribution of assets that is not recorded as cash, the asset, before its distribution, is registered at fair value in the income account. This procedure is applicable to the distributions in which the assets are equal in nature and therefore treated equitably. However, similarly to IFRIC 17, in the absence of a specific accounting practice for transactions under common control, we apply this procedure in our accounting practice. Also, we apply the same procedure to sales (products, supplies, etc.) we perform to our controlling entity, where the positive result of the sale is recognized in the income account.
(d) Foreign currency translation
Functional and presentation currency
The items included in the financial statements of each subsidiary of the Company are measured using the currency of the primary economic environment in which the entity operates (“functional currency”).
The functional and presentation currency of the Company financial statements is the Brazilian Real.
Transactions and balances
Foreign currency transactions are accounted for at exchange rates prevailing at the date of the transactions. Monetary assets and liabilities denominated in foreign currencies are translated at the balance sheet date rate. Non-monetary assets and liabilities denominated in foreign currencies are translated at the foreign exchange rate prevailing at the date of the transaction. Non-monetary assets and liabilities denominated in foreign currencies that are stated at fair value are translated at exchange rates ruling at the dates the fair value was determined. Gains and losses arising from the settlement of transactions in foreign currencies and resulting from the conversion of assets and liabilities denominated in foreign currencies are recognized in the income statement.
F - 22
The foreign exchange gains and losses related to loans and cash and cash equivalents are presented in the income statement as finance cost or finance income.
Conversion of the financial statements of subsidiaries located abroad
Assets and liabilities of subsidiaries located abroad are translated at foreign exchange rates prevailing at the balance sheet date, while amounts from income statement and cash flows are translated at average exchange rates for the year and the changes in equity are translated at historical exchange rates of each transaction. The translation adjustments arising from the difference between the average exchange rates and the historical rates are recorded directly in Carrying value adjustments.
On consolidation, exchange differences arising from translation of equity in foreign operations and borrowings and other currency instruments designated as net investment hedges are recognized in Carrying value adjustments, an equity reserve, and included in Other comprehensive income.
The goodwill and fair value adjustments arising from the acquisition of a foreign entity are treated as assets and liabilities of the foreign entity and translated at the closing rate.
Net investment in a foreign operation (quasi-equity)
An entity may have a monetary item that is receivable from or payable to a foreign operation which settlement is neither planned nor likely to occur in the foreseeable future and do not include trade receivables or trade payables. Exchange differences arising shall be recognized initially in other comprehensive income and reclassified from equity to profit or loss on disposal of the net investment.
Financial reporting in hyperinflationary economies
Under IAS 29, the non-monetary assets and liabilities, the equity and the income statement of subsidiaries operating in hyperinflationary economies are restated for changes in the general purchasing power of the local currency applying a general price index. The financial statements of an entity whose functional currency is the currency of a hyperinflationary economy, whether they are based on a historical cost approach or a current cost approach, shall be stated in terms of the measuring unit current at the end of the reporting period and translated to Real at the closing rate of the period.
F - 23
Exchange rates
The most significant exchange rates used in the preparation of the Company’s financial statements are as follows:
|
Closing rate |
Average rate | ||||||||
|
Currency |
Name |
Country |
2018 |
2017 |
2016 |
|
2018 |
2017 |
2016 |
|
CAD |
Canadian Dollars |
Canada and Cuba |
2.8431 |
2.6380 |
2.4214 |
2.8092 |
2.4567 |
2.6348 | |
|
DOP |
Dominican Pesos |
Dominican republic |
0.0770 |
0.0685 |
0.0700 |
0.0734 |
0.0674 |
0.0755 | |
|
USD |
US Dollar |
Ecuador (i), Panamá and Cuba(ii) |
3.8748 |
3.3080 |
3.2591 |
3.6348 |
3.2017 |
3.4749 | |
|
GTQ |
Quetzal |
Guatemala |
0.5001 |
0.4500 |
0.4343 |
0.4837 |
0.4344 |
0.4570 | |
|
PEN |
Novo Sol |
Peru (i) |
- |
- |
0.9720 |
- |
- |
1.0269 | |
|
ARS |
Argentinean Peso |
Argentina |
0.1025 |
0.1762 |
0.2056 |
0.1371 |
0.1931 |
0.2354 | |
|
BOB |
Bolivian Peso |
Bolivia |
0.5567 |
0.4753 |
0.4683 |
0.5222 |
0.4600 |
0.4993 | |
|
PYG |
Guarani |
Paraguay |
0.0007 |
0.0006 |
0.0006 |
0.0006 |
0.0006 |
0.0006 | |
|
UYU |
Uruguayan Peso |
Uruguay |
0.1196 |
0.1151 |
0.1114 |
0.1181 |
0.1116 |
0.1166 | |
|
CLP |
Chilean Peso |
Chile |
0.0056 |
0.0054 |
0.0049 |
0.0057 |
0.0049 |
0.0051 | |
|
COP |
Colombian Peso |
Colombia (i) |
- |
- |
0.0011 |
- |
- |
0.0011 | |
|
BBD |
Barbadian Dollar |
Barbados |
1.9101 |
1.6307 |
1.6075 |
1.7918 |
1.5783 |
1.7139 | |
(i) Until December 31, 2016, due to exchange of shareholdings, according the Note 1 - Corporate information.
(ii) The functional currency of Cuba, the Cuban convertible peso (“CUC”), has a fixed parity with the dollar (“USD”) at balance sheet date.
(e) Segment reporting
Reportable segments are identified based on internal reports regularly reviewed by the chief operating decision maker of the Company for purposes of evaluating the performance of each segment and allocating resources to those segments. Accordingly, segment information is presented on geographical areas, since the risks and rates of return are affected predominantly by the fact that the Company operates in different regions. The Company’s management structure and the information reported to the chief decision are structured the same way.
The performance information by business units (Beer and Soft drink (“CSD”) and Non-alcoholic and non-carbonated (“NANC”)), is also used by the decision maker for the Company and is presented as additional information, even though it does not qualify as a reportable segment. Internally, the Company’s management uses performance indicators, such as earnings of consolidated operation before interest and taxes (EBIT) and normalized earnings of consolidated operation before interest, taxes, depreciation and amortization (normalized EBITDA) as measures of segment performance to make decisions about resource allocation and performance analysis of consolidated operation. These indicators are reconciled to the profit of the segment in the tables on Note 5 – Segment reporting.
The Company operates its business through three zones identified as reportable segments:
F - 24
▪ Latin America North, which includes our operations (a) in Brazil, where we operate two business sub units: (i) beer and (ii) CSD and NANC; and (b) in Central America Operations (“CAC”), which includes our operations in the Dominican Republic (which also serves the islands of the Caribbean: Saint Vincent, Dominica, Antigua and Barbados), Guatemala (which also serves El Salvador and Nicaragua), Cuba, Panama, Puerto Rico and Costa Rica;
▪ Latin America South, which includes our operations in Argentina, Bolivia, Chile, Paraguay, Uruguay, Ecuador, Peru and Colombia.
▪ Canada, represented by Labatt’s operations.
(f) Revenue recognition
The Company recognizes revenue when the amount of revenue can be measured reliably and it is probable that economic benefits associated with the transaction will flow to the Company, as described below.
Revenue comprises the fair value of the amount received or receivable upon selling products or rendering services in the ordinary course of business. Revenue is presented net of taxes, returns, rebates and discounts, as well as net of elimination of sales between group companies.
Goods sold
The company recognizes revenue when performance obligations are satisfied, meaning when the company transfers control of a product to a customer.
Specifically, revenue recognition follows the following five-step approach:
· Identification of the contracts with a customer
· Identification of the performance obligations in the contracts
· Determination of the transaction price
· Allocation of the transaction price to the performance obligations in the contracts
· Revenue recognition when performance obligations are satisfied, meaning when the company transfers control of a product to a customer.
Revenue from the sale of goods is measured at the amount that reflects the best estimate of the consideration expected to receive in exchange for those goods. Contracts can include significant variable elements, such as discounts, rebates, refunds, credits, price concessions, incentives, performance bonuses and penalties. Such trade incentives are treated as variable consideration. If the consideration includes a variable amount, the company estimates the amount of consideration to which it will be entitled in exchange for transferring the promised goods or services to the customer. Variable consideration is only included in the transaction price if it is highly probable that the amount of revenue recognized would not be subject to significant future reversals when the uncertainty is resolved.
F - 25
Finance income
Finance income consists of interest received or receivable on funds invested, foreign exchange gains, gains on currency hedging instruments offsetting currency losses, gains on hedging instruments that are not part of a hedge accounting relationship, gains on financial assets classified as fair value through profit or loss, as well as any gains from hedge ineffectiveness.
Interest income is recognized on an accrual basis unless collectability is in doubt.
(g) Expenses
Royalty expenses
Royalties are classified as cost of goods sold.
Finance costs
Finance costs comprise interest payable on borrowings, calculated using the effective interest rate method, foreign exchange losses, losses on currency hedging instruments offsetting currency gains, results on interest rate hedging instruments, losses on hedging instruments that are not part of a hedge accounting relationship, losses on financial assets classified as held for trading, impairment losses on financial assets classified as available for sale, as well as any losses from hedge ineffectiveness.
All interest costs incurred in connection with borrowings or financial transactions are expensed as incurred as part of finance costs, except when capitalized. Any difference between the initial amount and the maturity amount of interest bearing loans and borrowings, such as transaction costs and fair value adjustments, are recognized in the income statement over the expected life of the instrument on an effective interest rate method. The interest expense component of finance lease payments is also recognized in the income statement using the effective interest rate method.
F - 26
(h) Exceptional items
Exceptional items are those that in Management’s judgment need to be disclosed separately by virtue of their size or incidence. In determining whether an event or transaction is special, Management considers quantitative as well as qualitative factors such as the frequency or predictability of occurrence, and the potential of impact on the variation of profit or loss. These items are disclosed in the income statement or separately disclosed in the notes to the financial statements. Transactions that may give rise to exceptional items are principally restructuring activities, acquisition of subsidiaries, impairment losses, and gains or losses on disposal of assets and investments.
(i) Income tax and social contribution
Income tax and social contribution for the year comprises current tax and deferred tax. Income tax and social contribution are recognized in the income statement, unless they relate to items recognized directly in comprehensive income or other equity accounts. In these cases the tax effect is also recognized directly in comprehensive income or equity account (except interest on shareholder’s equity. See Note 3 (p)).
The current tax expense is the expectation of payment on the taxable income for the year, using tax rates enacted, or substantially enacted, at the balance sheet date, and any adjustment to tax payable in respect of previous years.
The deferred taxes are recognized using the balance sheet liability approach. This means that a deferred tax liability or asset is recognized for all taxable and tax deductible temporary differences between the tax and accounting basis of assets and liabilities. Under this method, a provision for deferred taxes is also calculated on the differences between the fair value of assets and liabilities acquired in a business combination and their tax basis. IAS 12 prescribes that no deferred tax liability on goodwill recognition, and no deferred tax asset/liability is recorded: (i) at the initial recognition of an asset or liability in a transaction other than a business combination that at the time of the transaction affects neither accounting nor taxable profit or loss; and (ii) on differences related to investments in subsidiaries to the extent that they are not reversed in the foreseeable future. The amount of deferred tax provided is based on the expectation of the realization or settlement of the temporary difference, using currently or substantially enacted tax rates.
Deferred tax assets and liabilities are offset if there is a legally enforceable right to offset current tax liabilities and assets, and they relate to income taxes levied by the same tax authority on the same taxable entity, or on different taxable entities which intend either to settle current tax liabilities and assets on a net basis, or to realize the assets and settle the liabilities simultaneously.
F - 27
The deferred tax asset is recognized only to the extent that it is likely that future taxable profits will be available. The deferred income tax asset is reduced to the extent that it is no longer probable that the future taxable benefit will occur.
(j) Property, plant and equipment
Property, plant and equipment are measured at cost less accumulated depreciation and impairment losses. The cost includes the purchase price, borrowing cost incurred during the construction period and any other costs directly attributable to bringing the asset to the location and condition necessary for it to be capable of operating in the manner intended by management (e.g. nonrefundable tax, transport and the costs of dismantling and removal and site restoration, if applicable). The cost of a self-constructed asset is determined using the same principles as for an acquired asset. The depreciation methods, residual value, as well as the useful lives are reassessed and adjusted if appropriate, annually.
Borrowing costs directly attributable to the acquisition, construction or production of qualifying assets are capitalized as part of the cost of such assets.
Land is not depreciated since it is deemed to have an indefinite life.
Property, plant and equipment, and depreciation include the effects of the predecessor basis of accounting (Note 3 (c)).
Subsequent expenditures
The Company recognizes in the carrying amount of an item of property, plant and equipment the cost of replacing a component of such an item if it is probable that the future economic benefits embodied with the item will flow to the Company and the cost of the item can be measured reliably. All other costs are expensed as incurred.
Depreciation
The depreciable amount is the cost of an asset less its residual value. Residual values, if not insignificant, are reassessed annually. Depreciation is calculated from the date the asset is available for use, using the straight-line method over the estimated useful lives of the assets.
F - 28
The estimated useful lives of major property, plant and equipment classes as follows:
|
Buildings |
25 years |
|
Plant and equipment |
15 years |
|
Fixtures |
10 years |
|
Fittings |
10 years |
|
External use assets |
2 - 5 years |
The assets residual values and useful lives are reviewed at least annually. Management uses judgment to assess and ascertain the useful lives of these assets.
Gains and losses on sale
Gains and losses on sales are determined by comparing the results with the carrying amount and are recognized in Other operating income/(expenses) in the income statement.
(k) Goodwill
Goodwill arises on the acquisition of subsidiaries, associates and joint arrangements.
Goodwill is determined as the excess (i) of the consideration paid; (ii) of the amount of any non-controlling interests in the acquire (when applicable); and (iii) of the fair value, at acquisition date, of any previous equity interest in the acquire, over the fair value of the net identifiable assets acquired at the date of acquisition. All business combinations are accounted for by applying the purchase method.
In conformity with IFRS 3 Business Combinations, goodwill is carried at cost and is not amortized, but tested for impairment at least annually, or whenever there are indications that the cash generating unit to which the goodwill has been allocated may be impaired. Impairment losses recognized on goodwill are not reversed. Gains and losses on the disposal of an entity include the carrying amount of goodwill relating to the entity sold.
Goodwill is expressed in the functional currency of the cash generating unit or joint operation to which it relates and translated to Real using the year-end exchange rate.
Regarding associates and joint ventures, goodwill is included in the carrying amount of the investment in the associate/joint ventures.
If the Company’s interest in the net fair value of the identifiable assets, liabilities and contingent liabilities recognized exceeds the cost of the business combination such excess is recognized immediately in the income statement.
F - 29
Expenditure on internally generated goodwill is expensed as incurred.
Goodwill includes the effects of the predecessor basis of accounting (Note 3 (c)).
(l) Intangible assets
Brands
When part of the consideration paid in a business combination is related to brands, these are recognized in a specific Intangible Assets account and measured at fair value at the acquisition date. Subsequently, the value of brands can be reduced in case of impairment losses. Internally generated expenditures for developing a brand are recognized as expenses.
Software
Purchased software is measured at cost less accumulated amortization.
Amortization related to software is included in cost of sales, distribution and sales expenses, marketing expenses or administrative expenses based on the activity the software supports.
Other intangible assets
Other intangible assets, acquired by the Company, are stated at acquisition cost less accumulated amortization and impairment losses.
Other intangible assets also include multi-year sponsorship rights acquired by the Company. These are initially recognized at the present value of the future payments and subsequently measured at cost less accumulated amortization and impairment losses.
Amortization
Intangible assets with definite useful lives are amortized based on the straight-line method over their estimated useful lives. Licenses, supply and distribution rights are amortized over the period in which the rights exist. Brands are considered to have an indefinite life and, therefore, are not amortized. Software and capitalized development cost related to technology are amortized over 3 to 5 years.
Items that are not amortized are tested for impairment on an annual basis.
F - 30
(m) Inventories
Inventories are initially recorded at the acquisition cost and subsequent valued at the lower of cost and net realizable value. Cost includes expenditure incurred in acquiring the inventories and bringing them to their existing location and condition. The weighted average method is used in determining the cost of inventories.
The cost of finished products and work in progress comprises raw materials, other production materials, direct labor, other direct costs, gains and losses with derivative financial instruments, and an allocation of fixed and variable overhead based on normal operating capacity. Net realizable value is the estimated selling price in the ordinary course of business, less the cost for bringing inventories to sales conditions and selling costs.
Inventories have their amount reduced on a case-by-case basis if the anticipated net realizable value declines below its carrying amount. The calculation of the net realizable value takes into consideration specific characteristics of each inventory category, such as expiration date, remaining shelf life, slow-moving indicators, amongst others.
(n) Trade receivables
Trade receivables are amounts due from customers for goods sold or services performed in the ordinary course of business. Trade receivables are recognized initially at the amount of the consideration that is unconditional unless they contain significant financing components, when they are recognized at fair value. The Company holds trade and receivables with the objective to collect the contractual cash flows and therefore measures them subsequently at amortized cost using the effective interest rate method.
The Company applies the IFRS 9 simplified approach to measuring expected credit losses whereby impairment allowances for trade receivables are measured on initial recognition on the basis of the expected 12-month credit losses. This is primarily based on past experience with credit losses, current data on overdue receivables and credit score information. Forward-looking information (such as forecast economic performance indicators) is also taken into consideration if, based on past experience, such indicators show a significant correlation with actual credit losses. Typically trade receivables which are outstanding for more than 90 days are fully written-off.
Other receivables is mainly composed by loans to customers, cash deposits on guarantees and tax receivables. These instruments are initially recognized at fair value and subsequently measured at amortized cost. Any impairment losses and foreign exchange results are directly recognized in the profit or loss.
F - 31
(o) Cash and cash equivalents
Cash and cash equivalents include all cash balances, bank deposits, and short-term highly liquid investments with insignificant risks of changes in value, and readily convertible into cash. They are stated at face value, which approximates their fair value.
For the purpose of the cash flow statement, cash and cash equivalents are presented net of bank overdrafts, when applicable.
(p) Equity
Issued capital
The Company's issued capital consists only of common shares.
Repurchase of shares
When the Company buys back its own shares, the amount paid, including any additional costs directly attributable is recognized as a deduction from equity attributable to shareholders, in “Treasury shares” line item.
Share issuance costs
Incremental costs directly attributable to the issuance of new shares or options are presented in equity as a deduction, net of tax, from the proceeds.
Dividends and Interest on shareholder’s equity
Dividends and interest on shareholder’s equity are recognized in the liability on the date that are approved on Board of Directors Meeting, except the minimum statutory dividends provided by the Company’s bylaws, that are recognized as a liability when applicable, at the end of each fiscal year.
The expense of interest attributable to capital to shareholders is recognized in income for calculation of Brazilian income and social contribution tax and after are reclassified from shareholders' equity for presentation purposes in financial statements.
(q) Interest-bearing loans and borrowings
Interest-bearing loans and borrowings are recognized initially at fair value less attributable transaction costs. Subsequent to initial recognition, interest-bearing loans and borrowings are stated at amortized cost with any difference between the initial and maturity amount being recognized in the income statement over the expected life of the instrument on an effective interest rate basis. The Company has interest-bearing loans and borrowings covered by a hedge structure (Note 22 – Interest-bearing loans and borrowings).
F - 32
Borrowing costs directly related to the acquisition, construction or production of a qualifying asset, that requires a substantial period of time to get ready for its intended use or sale, are capitalized as part of the cost of that asset when it is probable that future economic benefits associated with the item will flow to the Company and costs can be measured reliably. The other borrowing costs are recognized as finance costs in the period in which they are incurred.
(r) Employee benefits
Post-employment benefits
Post-employment benefits include pensions managed in Brazil by Instituto Ambev de Previdência Privada – IAPP, post-employment dental benefits and post-employment medical benefits managed by Fundação Zerrenner. Usually, pension plans are funded by payments made by both the Company and its employees, taking into account the recommendations of independent actuaries. Post-employment dental benefits and post-employment medical benefits are maintained by the return on Fundação Zerrenner’s plan assets. If necessary, the Company may contribute some of its profit to the Fundação Zerrenner.
The Company manages defined benefit and/or defined contribution plans and/or medical and dental assistance for employees of its companies located in Brazil and in its subsidiaries located in Dominican Republic, Barbados, Panama, Uruguai, Bolivia, Argentina and Canada.
The Company maintains funded and unfunded plans.
r.1) Defined contribution plans
A defined contribution plan is a pension plan under which the Company pays fixed contributions into a fund. The Company has no legal or constructive obligations to pay further contributions if the fund does not hold sufficient assets to pay all employees for the benefits relating to employee service in the current and prior periods.
The contributions of these plans are recognized as expense in the period they are incurred.
F - 33
r.2) Defined benefit plans
Typically, defined benefit plans define an amount of pension benefit that an employee will receive on retirement, usually dependent on one or more factors such as age, years of service and compensation.
For defined benefit plans, expenses are assessed separately for each plan using the projected credit unit method. The projected credit unit method takes into account each period of service as giving rise to an additional unit of benefit to measure each unit separately. Under this method, the cost of providing pensions is charged to the income statement during the period of service of the employee. The amounts charged to the income statement consist of current service cost, interest cost, past service costs and the effect of any settlements and curtailments. The obligations of the plan recognized in the balance sheet are measured at the present value of the estimated future cash outflows using a discount rate equivalent to the government´s bond rates with maturity terms similar to those of the obligation and the fair value of the plan assets.
Past service costs result from the introduction of a new plan or changes to an existing plan. They are recognized immediately in the income statement, at the earlier of when: (i) the settlements / curtailments occurs, or (ii) the Company recognizes related restructuring or termination costs, unless those changes are conditioned to the employee’s continued employment, for a specific period of time (the period in which the right is acquired). In such case, the past services costs are amortized using the straight-line method during the period in which the right was acquired.
Actuarial gains and losses consist of the effects of differences between the previous actuarial assumptions and what has actually occurred, and the effects of changes in actuarial assumptions. Actuarial gains and losses are fully recognized in Carrying value adjustments.
Re-measurements, comprising of actuarial gains and losses, the effect of the asset ceiling and the return on plan assets, both excluding net interest, are recognized in full in the period in which they occur in the statement of comprehensive income. Re-measurements are not reclassified to profit or loss in subsequent periods.
When the amount of the defined benefit obligation is negative (an asset), the Company recognizes those assets (prepaid expenses), to the extent of the value of the economic benefit available to the Company either from refunds or reductions in future contributions.
Other post-employment obligations
The Company and some of its subsidiaries provide post-employment medical benefits, reimbursement of medication expenses and other benefits to certain retirees. These benefits are not granted to new retirees. The expected costs of these benefits are recognized over the period of employment, using an accounting methodology similar to that for defined benefit plans, including actuarial gains and losses.
F - 34
Termination benefits
Termination benefits are recognized as an expense at the earlier of: (i) when the Company is demonstrably committed, without realistic possibility of withdrawal, to a formal detailed plan to terminate employment before the normal retirement date, and (ii) when the Company recognizes costs for a restructuring.
Bonuses
Bonuses granted to employees and managers are based on pre-defined company and individual target achievement. The estimated amount of the bonus is recognized as an expense in the period the bonus is earned.
(s) Share-based payments
Different share and share option programs allow management and other members appointed by the Board of Directors to acquire shares of the Company. The fair value of the share options is estimated at grant date, using an option pricing model that is most appropriate for the respective option. Based on the expected number of options that will be exercised, the fair value of the options granted is recognized as an expense over the vesting period with a credit to equity. When the options are exercised, equity is increased by the amount of the proceeds received.
(t) Trade payables
Trade payables are recognized initially at fair value and subsequently at amortized cost using the effective interest method.
(u) Provisions
Provisions are recognized when: (i) the Company has a present obligation (legal or constructive) as a result of past events; (ii) it is likely that a future disbursement will be required to settle the current obligation; and (iii) a reliable estimate of the amount of the obligation can be made.
Provisions, except for the mentioned on item disputes and litigation, are determined discounting the expected future cash flows, to a pre-tax rate, that reflects the current market assessments of the time value of money and, where appropriate, the risks specific to the liability.
F - 35
Restructuring
A provision for restructuring is recognized when the Company has approved a detailed restructuring plan, and the restructuring has either commenced or has been announced. Costs relating to the ongoing and future activities of the Company are not provided for, but recognized when expenses are incurred.. The provision includes the benefit commitments in connection with early retirement and redundancy schemes.
Disputes and Litigations
A provision for disputes and litigation is recognized when it is more likely than not that the Company will be required to make future payments as a result of past events. Such items may include but are not limited to, several claims, suits and actions filed by or against the Company relating to antitrusts laws, violations of distribution and license agreements, environmental matters, employment-related disputes, claims from tax authorities, and other litigation matters.
(v) Financial Instruments and hedge accounting
Classification and Measurement
The company uses financial instruments to implement its risk management strategy and policies. Derivatives are generally used to mitigate the impact of foreign currencies, interest rates, equity prices and commodity prices on the company’s performance. The Company financial risk management policy prohibits the use of derivatives when not related to the Company’s core business.
Financial assets (except for an accounts receivable without a significant financing component) or financial liability is initially measured at fair value, plus, for an item not measured at fair value through profit or loss, transaction costs which are directly attributable to their acquisition or issue. Accounts receivables without a significant financing component are initially measured at the transaction price.
In the initial recognition, a financial asset is classified: at amortized cost; fair value through other comprehensive income - debt instrument; at fair value through other comprehensive income - equity instruments; or at fair value through profit or loss.
Financial assets are not reclassified subsequent to initial recognition, unless the Group changes the business model for the management of financial assets, in which case all affected financial assets are reclassified on the first day of the post-change business model.
The classification of the Company’s financial assets is as follows:
F - 36
|
· |
Debt instruments at fair value through other comprehensive income, with gains or losses recycled to profit or loss on derecognition. Financial assets in this category are the Company’s quoted debt instruments which are held within a business model to both collect cash flows and sell.
|
|
· |
Equity instruments designated at fair value through other comprehensive income, with no recycling of gains or losses to profit or loss on derecognition. This category only includes equity instruments, which the company intends to hold for the foreseeable future and which the Company has irrevocably elected to so classify upon initial recognition or transition. These instruments are not subject to impairment test.
|
|
· |
Financial assets at fair value through profit or loss comprise derivative instruments and equity instruments which the company had not irrevocably elected, at initial recognition or transition, to classify at fair value through other comprehensive income. This category also includes debt instruments whose cash flow characteristics are not held within a business model whose objective is either to collect contractual cash flows, or to both collect contractual cash flows and sell. |
The measurement of the Company’s financial assets is as follows:
Hedge accounting
The company designates certain derivatives as hedging instruments to hedge the risk related to variability in foreign exchange rates, interest rates and commodity prices. Derivative financial instruments, although contracted to protect the exposure, but does not match all hedge accounting requirement, will be recognize at fair value through profit or loss.
Derivative financial instruments are initially recognized at fair value. Fair value is the value at which an asset can be realized and a liability settled between knowledgeable and willing parties under normal market conditions. The fair value of derivative financial instruments can be obtained from market prices or from pricing models that consider current market rates, as well as the credit quality of the counterparty.
Subsequent to the initial recognition, the derivative financial instruments are remeasured at their fair value at the date of the financial statements. Changes in the fair value of the derivative financial instrument are recognized in current income, except when these are cash flow hedge or net investment hedges, where changes in fair value are recognized in the comprehensive income.
The company enters into commodity derivatives that have similar critical terms as the hedged item. Company applies component hedging to its commodities. The hedged component is contractually specified and matches those defined in the derivative contract, therefore the hedge ratio is 1:1. Hedge effectiveness is performed on a qualitative basis. Whenever the critical terms do not match, the company uses hypothetical derivative method to assess effectiveness. Possible sources of ineffectiveness are changes in the timing of the forecast transaction, changes in the quantity of the commodity to be hedged or changes in the credit risk of either parties to the derivative contract.
F - 37
The cash flow, net investment and fair value hedge concepts are applied to all instruments that meet the hedge accounting requirements of IFRS 9 - Financial Instruments.
Cash flow hedge accounting
Cash flow hedge is applicable to protect the cash flow exposure of a recorded asset or liability, foreign currency risk and commodity price variation associated with a highly probable realization transaction, the effective portion of any (gain or loss) on the derivative financial instrument is recognized directly in the comprehensive income statement (cash flow hedge reserve) and will be reclassified from the cash flow hedge reserve to the same line and the same period in which the cash flows futures hedged. The ineffective portion of any gain or loss is recognized immediately in the current income statement.
When a hedging instrument or a hedge relationship is extinguished, but the hedged transaction is still expected to occur, the cumulative gains and losses (up to date) remain in the comprehensive income, being reclassified in accordance with the above practice, when protection transaction occurs. If there is no more probable occurrence of the protection transaction, the accumulated gains and losses recognized in the comprehensive income are reclassified immediately to current income statement.
Fair value hedge accounting
When a derivative hedges the variability in fair value of a recognized asset or liability, or a firm commitment, any resulting (gain or loss) on the hedging instrument is recognized in the profit or loss. The carrying amount of the hedged item is also adjusted for fair value changes in respect of the risk being hedged, with any gain or loss being recognized in the income statement.
Net investment hedge accounting
When a non-derivative foreign currency liability hedges a net investment in a foreign operation, exchange differences arising on the translation of the liability to the functional currency are recognized directly in other comprehensive income (translation reserves). Any ineffectiveness is recognized immediately in the profit or loss.
F - 38
When a derivative financial instrument hedges a net investment in a foreign operation, the portion of the gain or the loss on the hedging instrument that is determined to be effective is recognized directly in other comprehensive income (translation reserves), while the ineffective portion is reported in the profit or loss.
Derivatives at fair value through profit or loss
Certain derivatives financial instruments are not qualify for hedge accounting. Changes in the fair value of any of those derivatives financial instruments are recognized immediately in profit or loss.
Impairment for financial assets
Management performs in a quarterly basis the impairment test for financial assets or group of financial assets. If there is any trigger event, the impairment of financial asset or group of financial asset will be applied. An asset or group of financial assets is impaired and impairment losses are recorded only if there is evidence of impairment as a result of one or more events occurring after the initial recognition of the assets ("loss event") and that event (or events) has an impact on the estimated future cash flows of the financial asset or group of financial assets and can be estimated reliably.
(w) Impairment of non-financial assets
The carrying amounts of non-financial assets, such as property, plant and equipment, goodwill and intangible assets are reviewed, at least, at each reporting date to determine whether there is any indication of impairment. If any such indication exists, the asset’s recoverable amount is estimated.
Goodwill, intangible assets that are not yet available for use and intangibles with an indefinite useful life are tested for impairment at least annually at the business unit level (which is one level below the reportable segment) or whenever there is any indication of impairment.
An impairment loss is recognized whenever the carrying amount of an asset or the related cash-generating unit exceeds its recoverable amount. Impairment losses are recognized in the income statement. Intangible assets with an indefinite useful life are tested on a fair value approach applying multiples that reflect current market transactions to indicators that drive the profitability of the asset or the royalty stream that could be obtained from licensing the intangible asset to another party in an arm’s length transaction.
The recoverable amount of other assets is determined as the higher of their fair value less costs to sell and value in use. For an asset that does not generate largely independent cash inflows, the recoverable amount for the cash-generating unit to which the asset belongs. The recoverable amount of the cash-generating units to which the goodwill and the intangible assets with indefinite useful life belong is based at fair value net of selling expenses, using EBITDA multiples observed on the market in previous business combinations involving comparable businesses in the brewing industry. For some CGUs, these calculations are corroborated by the use of the value-in-use approach, where free cash flow of these CGUs are discounted at fair value using a discount rate before taxes that reflects current valuation models of the time value of money and the risks specific to the asset.
F - 39
Non-financial assets, except by goodwill are reviewed for possible reversal of the impairment at the reporting date. Impairment losses are reversed only to the extent that the asset’s carrying amount does not exceed the carrying amount that would have been determined, net of depreciation or amortization, if no impairment loss had been recognized.
(x) Accounting for operating leases
Leases of assets under which all the risks and rewards of ownership are substantially retained by the lessor are classified as operating leases. Payments made under operating leases are charged to the income statement on a straight-line basis over the term of the lease.
When an operating lease is terminated before the lease period has expired, any payment required to be made to the lessor by way of penalty is recognized as an expense in the period in which termination takes place.
Effective from annual periods beginning on or after January 1st, 2019, IFRS 16 replaces the existing lease accounting requirements and represents a significant change in the accounting and reporting of leases that were previously classified as operating leases, with more assets and liabilities to be reported on the balance sheet and a different recognition of lease costs and related interpretations, and requires a lessee to recognize a right-of-use asset and a lease liability at lease commencement date (Note 3 (b)).
(y) Government grants
The Company has benefits from Brazilian state tax incentive programs to promote industrial development including the deferral of payment of taxes. These State programs are to promote long-term increases in employment, industrial decentralization, as well as complement and diversify the industrial states.
In the case of these States, the tax terms are foreseen in tax law. When conditions to obtain these grants exist, they are under the Company's control. The benefits for the postponement in the payment of such taxes are recorded in the income statement, on an accrual basis.
F - 40
The interest rates and (or) terms of these loans are advantageous over the market conditions, such financing are considered as subsidized loans as determined by IAS 20. The referred subsidy consists of the gain earned when comparing the value of these operations in market to the value agreed in contract. Thereby, upon funding the subsidy calculated is recorded in Other operating income, following the treatment for the other ICMS subsidies. Management reviews annually the market conditions prevailing in the year to assess such subsidies.
Monthly, taking into account the value of the consideration, the period to maturity, the financing contract interest rate and the above mentioned discount rate, the reduction in present value adjustment is allocated to financial income, so as to bring the balance to zero by the time of settlement of each consideration.
There is no a general price index, but allow to be executed judgement when restatement of financial statements becomes necessary. That way, the index used was based in Resolution 539/18 issued by Argentine Federation of Professional Boards on Economic Sciences: i) from January 1st, 2017 onwards the national IPC (national consumer price index); ii) to December 31,2016 the IPIM (wholesale price index).
4. USE OF ESTIMATES AND JUDGMENTS
The preparation of financial statements in conformity with IFRS requires Management to make judgments, estimates and assumptions that affect the application of accounting practices and the reported amounts of assets and liabilities, income and expenses. The estimates and associated assumptions are based on past experience and various other factors that are believed to be reasonable under the circumstances, the results of which form the basis for decision making regarding the judgments about carrying amounts of assets and liabilities that are not readily evident from other sources. Actual results may differ from these estimates.
The estimates and assumptions are reviewed on a regular basis. Changes in accounting estimates may affect the period in which they are realized, or future periods.
Although each of its significant accounting policies reflects judgments, assessments or estimates, the Company believes that the following accounting practices reflect the most critical judgments, estimates and assumptions that are important to its business operations and the understanding of its results:
(i) predecessor basis of accounting (Note 3 (c));
(ii) business combinations (Note 3 (c) and (k);
(iii) impairment (Note 3 (v) and (w));
(iv) provisions (Note 3 (u));
(v) share-based payments (Note 3 (s));
(vi) employee benefits (Note 3 (r));
F - 41
(vii) current and deferred tax (Note 3 (i));
(viii) joint arrangements (Note 3 (c));
(ix) measurement of financial instruments, including derivatives (Note 3 (v)); and
(x) inflation accounting and financial reporting in hyperinflationary economies (Nota 3 (d)).
The fair values of acquired identifiable intangibles of indefinite useful life are based on an assessment of future cash flows. Impairment analyses of goodwill and indefinite-lived intangible assets are performed at least annually and whenever a triggering event occurs, in order to determine whether the carrying value exceeds the recoverable amount.
The Company uses its judgment to select a variety of methods including the net fair value of expenses approach and option valuation models and makes assumptions about the fair value of financial instruments that are mainly based on market conditions existing at each balance sheet date.
Actuarial assumptions are established to anticipate future events and are used in calculating pension and other long-term employee benefit expense and liability. These factors include assumptions with respect to interest rates, rates of increase in health care costs, rates of future compensation increases, turnover rates, and life expectancy.
The company is subject to income tax in numerous jurisdictions. Significant judgment is required in determining the worldwide provision for income tax. There are some transactions and calculations for which the ultimate tax determination is uncertain. Some subsidiaries within the Company are involved in tax audits usually in relation to prior years. These audits are ongoing in various jurisdictions at the balance sheet date and, by their nature, these can take considerable time until its conclusion.
As described in Note 1 (b) Application of inflation accounting and financial reporting in hyperinflationary economies, under paragraph 3 of IAS 29, there are no a general price index, but allow to be executed judgement when restatement of financial statements becomes necessary. That way, the index used was based in Resolution 539/18 issued by Argentine Federation of Professional Boards on Economic Sciences: i) from January 1st, 2017 onwards the national IPC (national consumer price index); ii) to December 31,2016 the IPIM (wholesale price index).
5. SEGMENT REPORTING
F - 42
(a) Reportable segments – Years ended in:
|
Latin America - north (i) |
Latin America - south (ii) |
Canada |
Consolidated | |||||||||
|
2018 |
2017 |
2016 |
2018 |
2017 |
2016 |
2018 |
2017 |
2016 |
2018 |
2017 |
2016 | |
|
Net sales |
32,628.1 |
31,086.0 |
28,927.8 |
10,753.9 |
10,769.7 |
10,212.9 |
6,849.3 |
6,043.6 |
6,461.9 |
50,231.3 |
47,899.3 |
45,602.6 |
|
Cost of sales |
(12,584.9) |
(11,935.0) |
(10,870.4) |
(4,269.7) |
(4,122.6) |
(3,685.4) |
(2,415.0) |
(1,984.2) |
(2,122.2) |
(19,269.6) |
(18,041.8) |
(16,678.0) |
|
Gross profit |
20,043.2 |
19,151.0 |
18,057.4 |
6,484.2 |
6,647.1 |
6,527.5 |
4,434.3 |
4,059.4 |
4,339.7 |
30,961.7 |
29,857.5 |
28,924.6 |
|
Distribution expenses |
(4,399.1) |
(4,193.8) |
(3,965.4) |
(1,053.1) |
(1,007.9) |
(979.6) |
(1,284.3) |
(1,093.8) |
(1,140.5) |
(6,736.5) |
(6,295.5) |
(6,085.5) |
|
Sales and marketing expenses |
(3,645.3) |
(3,655.5) |
(3,671.1) |
(1,113.9) |
(1,091.3) |
(1,317.6) |
(970.3) |
(873.2) |
(936.3) |
(5,729.5) |
(5,620.0) |
(5,925.0) |
|
Administrative expenses |
(1,696.0) |
(1,954.1) |
(1,486.3) |
(410.8) |
(384.5) |
(400.2) |
(260.4) |
(285.2) |
(279.6) |
(2,367.2) |
(2,623.8) |
(2,166.1) |
|
Other operating income/(expenses) |
985.0 |
1,170.5 |
1,283.7 |
(24.6) |
41.2 |
(39.0) |
(13.1) |
5.6 |
(21.6) |
947.3 |
1,217.3 |
1,223.1 |
|
Exceptional items |
18.7 |
(56.1) |
1,183.2 |
(88.3) |
(41.3) |
(41.5) |
(16.8) |
(11.3) |
(7.4) |
(86.4) |
(108.7) |
1,134.3 |
|
Income from operations (EBIT) |
11,306.5 |
10,462.0 |
11,401.5 |
3,793.5 |
4,163.3 |
3,749.6 |
1,889.4 |
1,801.5 |
1,954.3 |
16,989.4 |
16,426.8 |
17,105.4 |
|
Net finance cost |
(2,211.8) |
(2,693.3) |
(3,694.5) |
(1,431.4) |
(709.5) |
(439.0) |
(180.2) |
(91.1) |
431.5 |
(3,823.4) |
(3,493.9) |
(3,702.0) |
|
Share of result of joint ventures |
(2.3) |
(4.7) |
(6.8) |
- |
- |
- |
3.3 |
1.6 |
1.8 |
1.0 |
(3.1) |
(5.0) |
|
Income before income tax |
9,092.4 |
7,764.0 |
7,700.2 |
2,362.1 |
3,453.8 |
3,310.6 |
1,712.5 |
1,712.0 |
2,387.6 |
13,167.0 |
12,929.8 |
13,398.4 |
|
Income tax expense |
(299.8) |
(3,309.5) |
1,100.1 |
(866.8) |
(1,144.1) |
(814.0) |
(623.0) |
(625.7) |
(601.1) |
(1,789.6) |
(5,079.3) |
(315.0) |
|
Net income |
8,792.6 |
4,454.5 |
8,800.3 |
1,495.3 |
2,309.7 |
2,496.6 |
1,089.5 |
1,086.3 |
1,786.5 |
11,377.4 |
7,850.5 |
13,083.4 |
|
Normalized EBITDA(iii) |
14,053.2 |
13,233.9 |
12,805.0 |
4,893.7 |
4,866.6 |
4,501.7 |
2,152.0 |
2,047.1 |
2,176.4 |
21,098.9 |
20,147.6 |
19,483.1 |
|
Exceptional items |
18.7 |
(56.1) |
1,183.2 |
(88.3) |
(41.3) |
(41.5) |
(16.8) |
(11.3) |
(7.4) |
(86.4) |
(108.7) |
1,134.3 |
|
Depreciation. amortization and impairment |
(2,765.4) |
(2,715.8) |
(2,586.7) |
(1,011.9) |
(662.0) |
(710.6) |
(245.8) |
(234.3) |
(214.7) |
(4,023.1) |
(3,612.1) |
(3,512.0) |
|
Net finance costs |
(2,211.8) |
(2,693.3) |
(3,694.5) |
(1,431.4) |
(709.5) |
(439.0) |
(180.2) |
(91.1) |
431.5 |
(3,823.4) |
(3,493.9) |
(3,702.0) |
|
Share of result of joint ventures |
(2.3) |
(4.7) |
(6.8) |
- |
- |
- |
3.3 |
1.6 |
1.8 |
1.0 |
(3.1) |
(5.0) |
|
Income tax expense |
(299.8) |
(3,309.5) |
1,100.1 |
(866.8) |
(1,144.1) |
(814.0) |
(623.0) |
(625.7) |
(601.1) |
(1,789.6) |
(5,079.3) |
(315.0) |
|
Net income |
8,792.6 |
4,454.5 |
8,800.3 |
1,495.3 |
2,309.7 |
2,496.6 |
1,089.5 |
1,086.3 |
1,786.5 |
11,377.4 |
7,850.5 |
13,083.4 |
|
Normalized EBITDA margin in % |
43.1% |
42.6% |
44.3% |
45.5% |
45.2% |
44.1% |
31.4% |
33.9% |
33.7% |
42.0% |
42.1% |
42.7% |
|
Acquisition of property, plant and equipment |
2,312.3 |
1,862.0 |
2,352.0 |
1,040.8 |
1,051.2 |
1,365.5 |
217.9 |
292.8 |
317.9 |
3,571.0 |
3,206.0 |
4,035.4 |
|
2018 |
2017 |
2016 |
2018 |
2017 |
2016 |
2018 |
2017 |
2016 |
2018 |
2017 |
2016 | |
|
Segment assets |
51,373.8 |
48,811.7 |
50,935.0 |
14,447.8 |
11,558.5 |
11,149.0 |
10,924.3 |
10,204.9 |
9,245.8 |
76,745.9 |
70,575.1 |
71,329.8 |
|
Intersegment elimination |
(2,246.5) |
(3,077.7) |
(3,968.1) | |||||||||
|
Non-segmented assets |
19,626.7 |
19,354.5 |
16,479.7 | |||||||||
|
Total assets |
94,126.1 |
86,851.9 |
83,841.4 | |||||||||
|
Segment liabilities |
21,673.0 |
23,031.6 |
22,958.9 |
4,484.6 |
6,015.2 |
5,576.4 |
3,584.8 |
3,700.2 |
3,275.7 |
29,742.4 |
32,747.0 |
31,811.0 |
|
Intersegment elimination |
(2,246.4) |
(3,077.7) |
(3,968.1) | |||||||||
|
Non-segmented liabilities |
66,630.1 |
57,182.6 |
55,998.5 | |||||||||
|
Total liabilities |
94,126.1 |
86,851.9 |
83,841.4 | |||||||||
(i) Latin America – North: includes operations in Brazil and CAC (El Salvador, Guatemala, Nicaragua, Dominican Republic, Saint Vincent, Dominica, Antigua, Cuba, Barbados, Panama, Puerto Rico e Costa Rica).
(ii) Latin America – South: includes operations in Argentina, Bolivia, Chile, Paraguay and Uruguay. In addition Colombia, Ecuador and Peru, until December 31, 2016, due to exchange of shareholdings, according the Note 1 - Corporate information.
(iii) Normalized EBITDA is calculated excluding of the net income the following effects: (i) Income tax expense, (iii) Share of results of joint ventures (iii) Net finance result, (iv) Exceptional items, and (v) Depreciation, amortization and impairment of property, plant and equipment.
F - 43
(b) Additional information – by Business unit – Years ended in:
|
Latin America - north | |||||||||
|
CAC |
Brazil |
Total | |||||||
|
2018 |
2017 |
2016 |
2018 |
2017 |
2016 |
2018 |
2017 |
2016 | |
|
|
|
|
|
|
|
|
|
| |
|
Net sales |
5,813.9 |
4,733.0 |
3,973.2 |
26,814.2 |
26,353.0 |
24,954.6 |
32,628.1 |
31,086.0 |
28,927.8 |
|
Cost of sales |
(2,560.1) |
(2,045.6) |
(1,798.6) |
(10,024.8) |
(9,889.4) |
(9,071.8) |
(12,584.9) |
(11,935.0) |
(10,870.4) |
|
Gross profit |
3,253.8 |
2,687.4 |
2,174.6 |
16,789.4 |
16,463.6 |
15,882.8 |
20,043.2 |
19,151.0 |
18,057.4 |
|
Distribution expenses |
(627.6) |
(538.6) |
(409.9) |
(3,771.5) |
(3,655.2) |
(3,555.5) |
(4,399.1) |
(4,193.8) |
(3,965.4) |
|
Sales and marketing expenses |
(561.8) |
(526.4) |
(456.7) |
(3,083.5) |
(3,129.1) |
(3,214.4) |
(3,645.3) |
(3,655.5) |
(3,671.1) |
|
Administrative expenses |
(281.5) |
(265.0) |
(171.7) |
(1,414.5) |
(1,689.1) |
(1,314.6) |
(1,696.0) |
(1,954.1) |
(1,486.3) |
|
Other operating income/(expenses) |
20.0 |
77.8 |
9.6 |
965.0 |
1,092.7 |
1,274.1 |
985.0 |
1,170.5 |
1,283.7 |
|
Exceptional items |
62.4 |
(23.1) |
(13.5) |
(43.7) |
(33.0) |
1,196.7 |
18.7 |
(56.1) |
1,183.2 |
|
Income from operations (EBIT) |
1,865.3 |
1,412.1 |
1,132.4 |
9,441.2 |
9,049.9 |
10,269.1 |
11,306.5 |
10,462.0 |
11,401.5 |
|
Net finance cost |
(56.8) |
(46.5) |
(9.2) |
(2,155.0) |
(2,646.8) |
(3,685.3) |
(2,211.8) |
(2,693.3) |
(3,694.5) |
|
Share of result of joint ventures |
3.9 |
6.0 |
19.0 |
(6.2) |
(10.7) |
(25.8) |
(2.3) |
(4.7) |
(6.8) |
|
Income before income tax |
1,812.4 |
1,371.6 |
1,142.2 |
7,280.0 |
6,392.4 |
6,558.0 |
9,092.4 |
7,764.0 |
7,700.2 |
|
Income tax expense |
(473.0) |
(353.5) |
(318.8) |
173.2 |
(2,956.0) |
1,418.9 |
(299.8) |
(3,309.5) |
1,100.1 |
|
Net income |
1,339.4 |
1,018.1 |
823.4 |
7,453.2 |
3,436.4 |
7,976.9 |
8,792.6 |
4,454.5 |
8,800.3 |
|
|
|
|
|||||||
|
Normalized EBITDA(iii) |
2,290.0 |
1,842.0 |
1,483.8 |
11,763.2 |
11,391.9 |
11,321.2 |
14,053.2 |
13,233.9 |
12,805.0 |
|
Exceptional items |
62.4 |
(23.1) |
(13.5) |
(43.7) |
(33.0) |
1,196.7 |
18.7 |
(56.1) |
1,183.2 |
|
Depreciation. amortization and impairment |
(487.1) |
(406.8) |
(338.0) |
(2,278.3) |
(2,309.0) |
(2,248.7) |
(2,765.4) |
(2,715.8) |
(2,586.7) |
|
Net finance costs |
(56.8) |
(46.5) |
(9.2) |
(2,155.0) |
(2,646.8) |
(3,685.3) |
(2,211.8) |
(2,693.3) |
(3,694.5) |
|
Share of result of joint ventures |
3.9 |
6.0 |
19.0 |
(6.2) |
(10.7) |
(25.8) |
(2.3) |
(4.7) |
(6.8) |
|
Income tax expense |
(473.0) |
(353.5) |
(318.8) |
173.2 |
(2,956.0) |
1,418.9 |
(299.8) |
(3,309.5) |
1,100.1 |
|
Net income |
1,339.4 |
1,018.1 |
823.3 |
7,453.2 |
3,436.4 |
7,977.0 |
8,792.6 |
4,454.5 |
8,800.3 |
|
|
|
|
|||||||
|
Normalized EBITDA margin in % |
39.4% |
38.9% |
35.3% |
43.9% |
43.2% |
45.4% |
43.1% |
42.6% |
44.3% |
(i) Normalized EBITDA is calculated excluding of the net income the following effects: (i) Income tax expense, (iii) Share of results of joint ventures, (iii) Net finance result, (iv) Exceptional items, and (v) Depreciation, amortization and impairment of property, plant and equipment.
F - 44
|
Brazil | |||||||||
|
Beer |
Soft drink and |
Total | |||||||
|
2018 |
2017 |
2016 |
2018 |
2017 |
2016 |
2018 |
2017 |
2016 | |
|
Net sales |
23,008.5 |
22,509.3 |
21,173.1 |
3,805.7 |
3,843.7 |
3,781.5 |
26,814.2 |
26,353.0 |
24,954.6 |
|
Cost of sales |
(8,222.9) |
(7,895.1) |
(7,339.9) |
(1,801.9) |
(1,994.3) |
(1,731.9) |
(10,024.8) |
(9,889.4) |
(9,071.8) |
|
Gross profit |
14,785.6 |
14,614.2 |
13,833.2 |
2,003.8 |
1,849.4 |
2,049.6 |
16,789.4 |
16,463.6 |
15,882.8 |
|
Distribution expenses |
(3,072.9) |
(2,961.0) |
(2,891.7) |
(698.6) |
(694.2) |
(663.8) |
(3,771.5) |
(3,655.2) |
(3,555.5) |
|
Sales and marketing expenses |
(2,897.8) |
(2,953.6) |
(3,044.0) |
(185.7) |
(175.5) |
(170.4) |
(3,083.5) |
(3,129.1) |
(3,214.4) |
|
Administrative expenses |
(1,202.6) |
(1,476.3) |
(1,160.2) |
(211.9) |
(212.8) |
(154.4) |
(1,414.5) |
(1,689.1) |
(1,314.6) |
|
Other operating income/(expenses) |
740.1 |
825.0 |
969.8 |
224.9 |
267.7 |
304.3 |
965.0 |
1,092.7 |
1,274.1 |
|
Exceptional items |
(37.0) |
(28.2) |
1,014.3 |
(6.7) |
(4.8) |
182.4 |
(43.7) |
(33.0) |
1,196.7 |
|
Income from operations (EBIT) |
8,315.4 |
8,020.1 |
8,721.4 |
1,125.8 |
1,029.8 |
1,547.7 |
9,441.2 |
9,049.9 |
10,269.1 |
|
Net finance cost |
(2,155.0) |
(2,646.8) |
(3,685.3) |
- |
- |
- |
(2,155.0) |
(2,646.8) |
(3,685.3) |
|
Share of result of joint ventures |
(6.2) |
(10.7) |
(25.8) |
- |
- |
- |
(6.2) |
(10.7) |
(25.8) |
|
Income before income tax |
6,154.2 |
5,362.6 |
5,010.3 |
1,125.8 |
1,029.8 |
1,547.7 |
7,280.0 |
6,392.4 |
6,558.0 |
|
Income tax expense |
173.2 |
(2,956.0) |
1,418.9 |
- |
- |
- |
173.2 |
(2,956.0) |
1,418.9 |
|
Net income |
6,327.4 |
2,406.6 |
6,429.2 |
1,125.8 |
1,029.8 |
1,547.7 |
7,453.2 |
3,436.4 |
7,976.9 |
|
|
|
|
|||||||
|
Normalized EBITDA (i) |
10,350.0 |
10,047.3 |
9,618.6 |
1,413.2 |
1,344.6 |
1,702.6 |
11,763.2 |
11,391.9 |
11,321.2 |
|
Exceptional items |
(37.0) |
(28.2) |
1,014.3 |
(6.7) |
(4.8) |
182.4 |
(43.7) |
(33.0) |
1,196.7 |
|
Depreciation, amortization and impairment |
(1,997.6) |
(1,999.0) |
(1,911.5) |
(280.7) |
(310.0) |
(337.3) |
(2,278.3) |
(2,309.0) |
(2,248.8) |
|
Net finance costs |
(2,155.0) |
(2,646.8) |
(3,685.3) |
- |
- |
- |
(2,155.0) |
(2,646.8) |
(3,685.3) |
|
Share of result of joint ventures |
(6.2) |
(10.7) |
(25.8) |
- |
- |
- |
(6.2) |
(10.7) |
(25.8) |
|
Income tax expense |
173.2 |
(2,956.0) |
1,418.9 |
- |
- |
- |
173.2 |
(2,956.0) |
1,418.9 |
|
Net income |
6,327.4 |
2,406.6 |
6,429.2 |
1,125.8 |
1,029.8 |
1,547.7 |
7,453.2 |
3,436.4 |
7,976.9 |
|
|
|
|
|||||||
|
Normalized EBITDA margin in % |
45.0% |
44.5% |
45.4% |
37.1% |
35.8% |
45.0% |
43.9% |
43.2% |
45.4% |
(i) Normalized EBITDA is calculated
excluding of the net income the following effects: (i) Income tax expense, (iii) Share of results of joint
ventures, (iii) Net finance result, (iv) Exceptional items, and (v)
Depreciation, amortization and impairment of property, plant and
equipment.
6. NET SALES
Reconciliation between gross sales and net sales:
|
2018 |
2017 |
2016 | |
|
Gross sales and/or services |
73,628.9 |
72,411.0 |
79,551.1 |
|
Excise duty |
(15,876.6) |
(16,192.9) |
(16,345.2) |
|
Discounts |
(7,521.0) |
(8,318.8) |
(17,603.3) |
|
50,231.3 |
47,899.3 |
45,602.6 |
Services provided by distributors, such as the promotion of our brands and logistics services are considered as expense when separately identifiable.
STF decision related to the inclusion of the ICMS in the taxable basis of PIS and COFINS
Considering the judgment of (Extraordinary Appeal) RE 574,706 by the Federal Supreme Court (STF) in March 2017 with binding effects, which concluded for the possibility of excluding the ICMS from the taxable basis of PIS and COFINS and also that the companies of the group have favorable judicial decisions authorizing such exclusion, the Company recognized in the income statement the amount of R$654.6 in December 31, 2018 (R$ 241.2 in December 31, 2017).
F - 45
7. OTHER OPERATING INCOME / (EXPENSES)
|
2018 |
2017 |
2016 | |
|
Government grants/NPV of long term fiscal incentives |
820.1 |
993.7 |
1,166.5 |
|
(Additions)/reversals to provisions |
(42.0) |
(12.9) |
(132.9) |
|
Gains/(losses) on disposal of property, plant and equipment, intangible assets and operation in associates |
(29.8) |
91.1 |
70.9 |
|
Other operating income/(expenses), net |
199.0 |
145.4 |
118.6 |
|
947.3 |
1,217.3 |
1,223.1 |
Government grants are not recognized until there is reasonable assurance that the Company will meet related conditions and that the grants will be received. Government grants are systematically recognized in income during the periods in which the Company recognizes as expenses the related costs that the grants are intended to offset.
8. EXCEPTIONAL ITEMS
|
2018 |
2017 |
2016 | |
|
Result through exchange transaction of shareholdings (i) |
30.0 |
- |
1,240.0 |
|
Restructuring (ii) |
(175.5) |
(105.5) |
(79.8) |
|
Result on sale of subsidiary (iii) |
78.6 |
- |
- |
|
Acquisition of subsidiary |
(1.5) |
- |
- |
|
Effect of application of IAS 29 (hyperinflation) |
(18.0) |
- |
- |
|
Others |
- |
(3.2) |
(25.9) |
|
(86.4) |
(108.7) |
1,134.3 |
(i) As described in Note 1(b) Perpetual licensing agreement with Quilmes.
(ii) The restructuring expenses recognized refers mainly to realignment of structure and processes in the Latin America – North and Latin America – South geographical segment.
(iii) As described in Note 1(b) Sale of subsidiary.
9. PAYROLL AND RELATED BENEFITS
|
2018 |
2017 |
2016 | |
|
Wages and salaries |
3,422.0 |
3,371.2 |
3,038.9 |
|
Social security contributions |
789.3 |
741.1 |
727.2 |
|
Other personnel cost |
726.6 |
616.2 |
613.8 |
|
Increase in liabilities for defined benefit plans |
142.0 |
138.7 |
151.7 |
|
Share-based payment |
162.7 |
236.9 |
189.3 |
|
Contributions to defined contribution plans |
32.2 |
18.9 |
25.3 |
|
5,274.8 |
5,123.0 |
4,746.2 |
F - 46
The payroll expense and related benefits are presented in the income statement as below:
|
2018 |
2017 |
2016 | |
|
Cost of sales |
1,814.7 |
1,714.8 |
1,912.3 |
|
Distribution expenses |
987.7 |
791.5 |
780.8 |
|
Sales and marketing expenses |
1,239.0 |
1,096.8 |
989.8 |
|
Administrative expenses |
1,085.4 |
1,470.1 |
970.3 |
|
Net finance cost |
103.0 |
42.9 |
95.9 |
|
Exceptional items |
45.0 |
6.9 |
(2.9) |
|
5,274.8 |
5,123.0 |
4,746.2 |
10. ADDITIONAL INFORMATION ON OPERATING EXPENSES BY NATURE
Depreciation, amortization and impairment expenses are included in the following income statement accounts for the years 2018, 2017 and 2016:
|
Depreciation and impairment of property, plant and equipment |
Amortization of intangible assets | ||||||
|
2018 |
2017 |
2016 |
2018 |
2017 |
2016 | ||
|
Cost of sales |
2,681.9 |
2,364.7 |
2,283.3 |
10.3 |
6.2 |
4.3 | |
|
Distribution expenses |
225.2 |
197.6 |
200.9 |
- |
- |
- | |
|
Sales and marketing expenses |
581.4 |
532.2 |
538.0 |
117.1 |
142.3 |
222.9 | |
|
Administrative expenses |
231.8 |
231.1 |
182.5 |
175.2 |
142.0 |
95.8 | |
|
3,720.3 |
3,325.6 |
3,204.7 |
302.6 |
290.5 |
323.0 | ||
11. FINANCE COST AND INCOME
(a) Finance costs
|
2018 |
2017 |
2016 | |
|
Interest expense |
(1,281.2) |
(1,571.6) |
(1,547.3) |
|
Capitalized borrowings |
0.4 |
2.3 |
3.9 |
|
Net Interest on pension plans |
(103.0) |
(77.6) |
(105.6) |
|
Losses on hedging instruments and exclusive investment funds |
(1,266.1) |
(616.7) |
(1,575.1) |
|
Interest on provision for disputes and litigations |
(132.7) |
(225.9) |
(619.5) |
|
Exchange variation |
(756.9) |
(339.5) |
(310.4) |
|
Interest and foreign exchange rate on loans |
(8.0) |
(16.8) |
- |
|
Financial instruments at fair value through profit or loss |
(107.1) |
- |
- |
|
Tax on financial transactions |
(337.6) |
(179.7) |
(224.6) |
|
Bank guarantee expenses |
(126.3) |
(89.5) |
(87.1) |
|
Other financial results |
(264.6) |
(176.5) |
(132.2) |
|
(4,383.1) |
(3,291.5) |
(4,597.9) | |
|
|
|||
|
Non-recurring finance cost |
(179.1) |
(976.8) |
- |
|
(4,562.2) |
(4,268.3) |
(4,597.9) |
The exceptional net finance cost refers to the realization of the exchange variation of loans settled with related parties, historically recognized in shareholders' equity, in the amount of R$179.1 in December 31st, 2018 (R$835.7 in December 31st, 2017). Additionally, in 2017 the Company recorded an amount of R$141.0 related to PERT 2017 which Ambev applied for – see Note 19 - Income tax and social contribution.
F - 47
Interest expenses are presented net of the effect of interest rate derivative financial instruments which mitigate Ambev interest rate risk (Note 27 – Financial instruments and risks). The interest expense are as follows:
|
2018 |
2017 |
2016 | |
|
Financial instruments measured at amortized cost |
(597.6) |
(477.6) |
(545.6) |
|
Financial instruments at fair value through profit or loss |
(683.6) |
(1,076.2) |
(961.0) |
|
Fair value hedge - hedged items |
- |
(19.7) |
(49.3) |
|
Fair value hedge - hedging instruments |
- |
1.9 |
8.6 |
|
(1,281.2) |
(1,571.6) |
(1,547.3) |
(b) Finance income
|
2018 |
2017 |
2016 | |
|
Interest income |
454.0 |
458.8 |
513.6 |
|
Gains on derivative and exclusive investment funds |
84.9 |
73.7 |
113.5 |
|
Financial instruments at fair value through profit or loss |
- |
227.6 |
247.5 |
|
Other financial results |
17.4 |
14.3 |
21.3 |
|
556.3 |
774.4 |
895.9 | |
|
Effect of application of IAS 29 (hyperinflation) |
182.5 |
- |
- |
|
738.8 |
774.4 |
895.9 |
Interest income arises from the following financial assets:
|
2018 |
2017 |
2016 | |
|
Cash and cash equivalents |
270.7 |
233.4 |
241.5 |
|
Investment securities held for trading |
12.9 |
26.9 |
51.1 |
|
Other receivables |
170.4 |
198.5 |
221.0 |
|
454.0 |
458.8 |
513.6 |
12. INCOME TAX AND SOCIAL CONTRIBUTION
Income taxes reported in the income statement are analyzed as follows:
|
2018 |
2017 |
2016 | |
|
Income tax expense - current |
(1,833.5) |
(5,332.3) |
(413.9) |
|
|
|||
|
Deferred tax expense on temporary differences |
(246.1) |
891.9 |
(732.5) |
|
Deferred tax over taxes losses carryforwards movements in the current period |
290.0 |
(638.9) |
831.4 |
|
Total deferred tax (expense)/income |
43.9 |
253.0 |
98.9 |
|
|
|||
|
Total income tax expenses |
(1,789.6) |
(5,079.3) |
(315.0) |
F - 48
The reconciliation from the weighted nominal to the effective tax rate is summarized as follows:
|
2018 |
2017 |
2016 | |
|
Profit before tax |
13,167.0 |
12,929.8 |
13,398.4 |
|
Adjustment on taxable basis |
|
||
|
Others non-taxable income |
(400.8) |
(310.9) |
(392.0) |
|
Government grants related to sales taxes |
(1,807.3) |
(1,889.1) |
(1,528.6) |
|
Share of result of joint ventures |
(1.0) |
3.1 |
5.0 |
|
Non-deductible expenses |
305.5 |
91.1 |
539.3 |
|
Complement of income tax of foreign subsidiaries due in Brazil |
503.0 |
560.4 |
148.0 |
|
Results of intercompany transactions |
(693.4) |
(547.5) |
640.7 |
|
|
11,073.0 |
10,836.9 |
12,810.8 |
|
Aggregated weighted nominal tax rate |
29.98% |
29.22% |
30.16% |
|
Taxes payable – nominal rate |
(3,319.5) |
(3,166.6) |
(3,864.0) |
|
Adjustment on tax expense |
|
||
|
Income tax Incentives |
219.7 |
304.6 |
264.5 |
|
Deductible interest on shareholders' equity |
1,710.4 |
1,649.0 |
1,867.7 |
|
Tax savings from goodwill amortization |
72.3 |
175.2 |
142.0 |
|
Withholding income tax |
(220.0) |
(356.9) |
153.1 |
|
Recognition / write-off of deferred charges on tax losses |
(41.6) |
(178.9) |
796.7 |
|
PERT 2017 |
- |
(2,784.7) |
- |
|
Effect of application of IAS 29 (hyperinflation) |
(107.3) |
- |
- |
|
Others with reduced taxation |
(103.6) |
(721.0) |
325.0 |
|
Income tax and social contribution expense |
(1,789.6) |
(5,079.3) |
(315.0) |
|
Effective tax rate |
13.59% |
39.28% |
2.35% |
The main events that impacted the effective tax rate in the period were:
|
§ |
Government subsidy on sales taxes: Related to regional incentives, related primarily to local production, that, when reinvested are not taxed for income tax and social contribution purposes, which explains the impact in the effective tax rate. The amount above is impacted by the fluctuation in volume, price and eventual increase on State VAT (ICMS).
|
|
§ |
Complement of income tax of foreign subsidiaries due in Brazil: shows the result of the calculation of universal taxation of profits, according to the regulations of Law 12.973/14.
|
|
§ |
Results of intercompany transactions: reflect the reality of taxation in the countries in which the subsidiaries with which the loan operations are carried out are located.
|
|
§ |
Deductible interest on shareholders’ equity: under Brazilian law, companies have an option to remunerate its shareholders’ through payment of Interest on Capital (“IOC”), which is deductible for income tax purposes. |
F - 49
|
§ |
PERT 2017: amongst the contingencies covered by the Federal Tax Amnesty Program (“PERT ”), there is a litigation whose purpose was to discuss the Presumed Profit method used by CRBS (one of Ambev’s subsidiaries in Brazil) to calculate its Corporate Income Taxes (namely, “IRPJ” and “CSLL”). The total amount booked as an expense, after the conversion of the Provisional Measure 783/ into Law, was R$2,926 million (principal, fine and interests), being R$2,785 million booked as non-recurring expenses under Corporate Income Tax and R$141 million under Financial Results. |
13. PROPERTY, PLANT AND EQUIPMENT
|
2018 | |||||
|
Land and buildings |
Plant and equipment |
Fixtures and fittings |
Under construction |
Total | |
|
Acquisition cost |
|||||
|
Balance at end of previous year |
8,961.9 |
24,538.8 |
5,076.5 |
1,257.9 |
39,835.1 |
|
Effect of movements in foreign exchange |
118.6 |
(52.7) |
(110.8) |
17.2 |
(27.7) |
|
Effect of application of IAS 29 (hyperinflation) |
630.0 |
2,301.5 |
566.6 |
91.0 |
3,589.1 |
|
Acquisition through exchange transaction of shareholdings |
99.7 |
97.9 |
0.1 |
0.2 |
197.9 |
|
Acquisitions |
18.8 |
574.6 |
141.0 |
2,786.1 |
3,520.5 |
|
Disposals and write-off |
(39.2) |
(1,007.8) |
(369.6) |
- |
(1,416.6) |
|
Transfer to other asset categories |
585.0 |
1,595.7 |
386.8 |
(2,730.3) |
(162.8) |
|
Others |
- |
8.0 |
- |
- |
8.0 |
|
Balance at end |
10,374.8 |
28,056.0 |
5,690.6 |
1,422.1 |
45,543.5 |
|
Depreciation and Impairment |
|||||
|
Balance at end of previous year |
(2,585.9) |
(14,973.7) |
(3,453.2) |
- |
(21,012.8) |
|
Effect of movements in foreign exchange |
(39.7) |
(141.0) |
51.1 |
- |
(129.6) |
|
Effect of application of IAS 29 (hyperinflation) |
(110.7) |
(1,366.7) |
(431.4) |
- |
(1,908.8) |
|
Depreciation |
(327.9) |
(2,504.3) |
(708.1) |
- |
(3,540.3) |
|
Impairment losses |
(36.4) |
(160.8) |
17.2 |
- |
(180.0) |
|
Disposals and write-off |
68.8 |
945.3 |
337.6 |
- |
1,351.7 |
|
Transfer to other asset categories |
1.1 |
(33.5) |
1.7 |
- |
(30.7) |
|
Others |
- |
4.0 |
- |
- |
4.0 |
|
Balance at end |
(3,030.7) |
(18,230.7) |
(4,185.1) |
- |
(25,446.5) |
|
Carrying amount: |
|||||
|
December 31, 2017 |
6,376.0 |
9,565.1 |
1,623.3 |
1,257.9 |
18,822.3 |
|
December 31, 2018 |
7,344.1 |
9,825.3 |
1,505.5 |
1,422.1 |
20,097.0 |
F - 50
|
2017 | |||||
|
Land and buildings |
Plant and equipment |
Fixtures and fittings |
Under construction |
Total | |
|
|
|
|
|
|
|
|
Acquisition cost |
|||||
|
Balance at end of previous year |
8,330.2 |
22,764.3 |
4,584.2 |
1,740.7 |
37,419.4 |
|
Effect of movements in foreign exchange |
3.1 |
34.6 |
(27.3) |
8.3 |
18.7 |
|
Business combinations |
228.9 |
(24.7) |
- |
- |
204.2 |
|
Acquisitions |
10.2 |
626.1 |
171.8 |
2,367.4 |
3,175.5 |
|
Disposals and write-off |
(25.9) |
(555.5) |
(125.4) |
- |
(706.8) |
|
Transfer to other asset categories |
415.4 |
1,657.8 |
473.2 |
(2,857.3) |
(310.9) |
|
Others |
- |
36.2 |
- |
(1.2) |
35.0 |
|
Balance at end |
8,961.9 |
24,538.8 |
5,076.5 |
1,257.9 |
39,835.1 |
|
Depreciation and Impairment |
|||||
|
Balance at end of previous year |
(2,278.2) |
(13,075.3) |
(2,912.1) |
- |
(18,265.6) |
|
Effect of movements in foreign exchange |
(12.1) |
(104.9) |
0.3 |
- |
(116.7) |
|
Depreciation |
(299.0) |
(2,245.5) |
(655.9) |
- |
(3,200.4) |
|
Impairment losses |
- |
(125.0) |
(0.2) |
- |
(125.2) |
|
Disposals and write-off |
5.3 |
539.5 |
109.5 |
- |
654.3 |
|
Transfer to other asset categories |
(1.9) |
29.7 |
5.2 |
- |
33.0 |
|
Others |
- |
7.8 |
- |
- |
7.8 |
|
Balance at end |
(2,585.9) |
(14,973.7) |
(3,453.2) |
- |
(21,012.8) |
|
Carrying amount: |
|||||
|
December 31, 2016 |
6,052.0 |
9,689.0 |
1,672.1 |
1,740.7 |
19,153.8 |
|
December 31, 2017 |
6,376.0 |
9,565.1 |
1,623.3 |
1,257.9 |
18,822.3 |
Capitalized interests and fixed assets provided as security are not material. Effective from annual periods beginning on or after January 1st, 2019, IFRS 16 replaces the existing lease accounting requirements and represents a significant change in the accounting and reporting of leases that were previously classified as operating leases, with more assets and liabilities to be reported on the balance sheet and a different recognition of lease costs and related interpretations, and requires a lessee to recognize a right-of-use asset and a lease liability at lease commencement date (Note 3 (b)).
14. GOODWILL
|
2018 |
2017 | |
|
Balance at end of previous year |
31,401.9 |
30,511.2 |
|
Effect of movements in foreign exchange |
1,224.8 |
489.7 |
|
Effect of application of IAS 29 (hyperinflation) |
1,686.5 |
- |
|
Acquisition, (write-off) and disposal through business combinations |
(37.0) |
401.0 |
|
Balance at the end of year |
34,276.2 |
31,401.9 |
F - 51
The carrying amount of goodwill was allocated to the different cash-generating units as follows:
|
Functional currency |
2018 |
2017 | |
|
LAN: |
|||
|
Brazil |
BRL |
17,668.4 |
17,668.4 |
|
Goodwill |
102,911.0 |
102,911.0 | |
|
Non-controlling transactions (i) |
|
(85,242.6) |
(85,242.6) |
|
Dominican Republic |
DOP |
3,510.1 |
3,163.6 |
|
Cuba (ii) |
USD |
2.0 |
2.7 |
|
Panama |
PAB |
1,346.3 |
1,149.3 |
|
|
|||
|
LAS: |
|
||
|
Argentina (iii) |
ARS |
1,950.7 |
443.9 |
|
Bolivia |
BOB |
1,370.6 |
1,170.1 |
|
Chile |
CLP |
48.7 |
47.0 |
|
Paraguay |
PYG |
873.2 |
786.1 |
|
Uruguay |
UYU |
177.4 |
170.7 |
|
|
|||
|
NA: |
|
||
|
Canada |
CAD |
7,328.8 |
6,800.1 |
|
34,276.2 |
31,401.9 |
(i) It refers to the exchange of shareholdings operation occurred in 2013 as a result of the adoption of the predecessor basis of accounting.
(ii) The functional currency of Cuba, the Cuban convertible peso (CUC), has a fixed parity with the dollar (USD) at balance sheet date.
(iii)Variation refers mainly to application of inflation accounting and financial reporting in hyperinflationary economies, as described in Note 1 (b).
Annual impairment testing
The Company completed its annual impairment test for goodwill and concluded that, based on the assumptions described below, no impairment charge was warranted.
The Company cannot predict whether an event that triggers impairment will occur, when it will occur or how it will affect the value of the asset reported. The Company believes that all of its estimates are reasonable: they are consistent with the Company’s internal reporting and reflect management’s best estimates. However, inherent uncertainties exist that management may not be able to control. While a change in the estimates used could have a material impact on the calculation of the fair values and trigger an impairment charge, the Company, based on the sensitivity analysis performed is not aware of any reasonably possible change in a key assumption used that would cause a business unit’s carrying amount to exceed its recoverable amount.
Goodwill impairment testing relies on a number of critical judgments, estimates and assumptions. Goodwill, which accounted for approximately 36% of total assets as of December 31, 2018 (36% as of December 31, 2017) is tested for impairment at the cash- generating unit level (that is one level below the reporting segments), at least annually. The cash-generating unit level is the lowest level at which goodwill is monitored for internal management purposes. In a business combination occurs, goodwill is allocated as from the acquisition date, to each of business units that are expected to benefit from the synergies of the combination.
F - 52
The methodology used by the Company to determine the recoverable value of all its CGUs is the net fair value of selling expenses, using multiples of the profit before the financial result, income tax and depreciation and amortization expenses (“EBITDA”), observed in the market in previous comparable business transactions in the domestic and international brewing industry. The values used by the Company in this approach are based on external sources of information. This measurement is classified in level 2 of the fair value hierarchy, since the main source of information used by the Company to determine the recoverable value was EBITDA multiples practiced in observed transactions involving comparable businesses. As part of this multiples analysis, the Company has established that CGUs whose invested capital exceeds 7 times their EBITDA should have their recoverable value determined based on the value-in-use approach to determine if such amount exceeds their carrying amount. In the last analysis carried out by the Company, no CGU met this criterion.
However, for the UGCs Brazil and the Dominican Republic, the Company also used discounted cash flow projections to determine the recoverable amount, in order to corroborate the conclusions reached by applying the net fair value of expenses approach, the recoverable amount of these UGCs does not exceed their recoverable value. The selection of these UGCs considered quantitative and qualitative aspects, since UGC Brasil is the most representative for the Company, and for UGC Dominican Republic, the Company already had cash flow projections, used to determine the fair value of the issued in favor of ELJ (see Note 21 (d.4) for further details on the ELJ put option).
The key judgments, estimates and key assumptions used in the discounted free cash flow of these CGUs calculations are generally as follows:
|
§ |
The first year of the model is based on management's best estimate of the free cash flow outlook for the current year;
|
|
§ |
In the second to fourth years of the model, free cash flows are based on AB InBev's strategic plan as approved by key management. AB InBev's strategic plan is prepared per country and is based on external sources in respect of macro-economic assumptions, industry, inflation and foreign exchange rates, past experience and identified initiatives in terms of market share, revenue, variable and fixed cost, capital expenditure and working capital assumptions; |
F - 53
|
§ |
From the fifth to the tenth year of the model, as well as for perpetuity, the cash flows are extrapolated using expected long-term consumer price indices and the growth of the beer market, based on external sources specific from each UGC;
|
|
§ |
Projections are made in the functional currency of the business unit and discounted at the unit's weighted average cost of capital (“WACC”), considering sensitivities on this metric. |
For our cash flow analysis, the growth rate applied ranged from 1.5% to 3.6%.
The WACC applied in R$ for each CGU:
|
CGU |
2018 |
|
Dominican Republic |
12.14% |
|
Brazil |
11.20% |
Although Ambev believes that its judgments, assumptions and estimates are appropriate, actual results may differ from those estimates under different assumptions or market or macroeconomic conditions.
15. INTANGIBLE
|
2018 | |||||
|
|
Distribution |
|
|
| |
|
Brands |
contracts |
Software |
Others |
Total | |
|
Acquisition cost |
|||||
|
Balance at end of previous year |
3,514.7 |
2,333.3 |
1,144.6 |
540.7 |
7,533.3 |
|
Effect of movements in foreign exchange |
252.3 |
2.3 |
(43.3) |
12.1 |
223.4 |
|
Acquisitions |
972.5 |
59.7 |
151.5 |
104.5 |
1,288.2 |
|
Disposal |
- |
- |
4.2 |
46.6 |
50.8 |
|
Acquisitions through business combination |
(39.2) |
(28.1) |
(16.2) |
- |
(83.5) |
|
Disposals through exchange transaction of shareholdings |
0.2 |
- |
- |
- |
0.2 |
|
Transfers to other assets categories |
2.7 |
25.9 |
205.7 |
(82.1) |
152.2 |
|
Balance at end of year |
4,703.2 |
2,393.1 |
1,446.5 |
621.8 |
9,164.6 |
|
Amortization and Impairment losses (i) |
|||||
|
Balance at end of previous year |
(1.9) |
(1,894.6) |
(711.8) |
(250.3) |
(2,858.6) |
|
Effect of movements in foreign exchange |
- |
14.1 |
15.0 |
11.1 |
40.2 |
|
Effect of application of IAS 29 (hyperinflation) |
- |
(42.6) |
(108.3) |
(104.5) |
(255.4) |
|
Amortization |
- |
(114.6) |
(152.0) |
(36.0) |
(302.6) |
|
Disposal |
- |
28.0 |
16.2 |
- |
44.2 |
|
Transfers to other assets categories |
- |
(2.1) |
- |
10.3 |
8.2 |
|
Balance at end of year |
(1.9) |
(2,011.8) |
(940.9) |
(369.4) |
(3,324.0) |
|
Carrying amount: |
|||||
|
December 31, 2017 |
3,512.8 |
438.7 |
432.8 |
290.4 |
4,674.7 |
|
December 31, 2018 |
4,701.3 |
381.3 |
505.6 |
252.4 |
5,840.6 |
(i) The period of amortization of intangible assets of definite useful life is five years is calculated at the annual rate of 20% and recognized in income on a straight-line method.
F - 54
|
2017 | |||||
|
Distribution |
|||||
|
Brands |
contracts |
Software |
Others |
Total | |
|
Acquisition cost |
|||||
|
Balance at end of previous year |
4,160.8 |
2,319.4 |
888.5 |
460.7 |
7,829.4 |
|
Effect of movements in foreign exchange |
(10.5) |
7.5 |
(12.1) |
(1.2) |
(16.3) |
|
Acquisitions |
18.8 |
- |
2.9 |
8.8 |
30.5 |
|
Acquisitions through business combination |
(4.0) |
- |
- |
- |
(4.0) |
|
Transfers to other assets categories |
(650.4) |
6.4 |
265.3 |
26.4 |
(352.3) |
|
Others |
- |
- |
- |
46.0 |
46.0 |
|
Balance at end of year |
3,514.7 |
2,333.3 |
1,144.6 |
540.7 |
7,533.3 |
|
Amortization and Impairment losses(i) |
|||||
|
Balance at end of previous year |
(1.9) |
(1,760.8) |
(597.0) |
(223.8) |
(2,583.5) |
|
Effect of movements in foreign exchange |
- |
4.9 |
5.5 |
5.1 |
15.5 |
|
Amortization |
- |
(138.7) |
(118.9) |
(32.9) |
(290.5) |
|
Transfers to other assets categories |
- |
- |
(1.4) |
1.3 |
(0.1) |
|
Balance at end of year |
(1.9) |
(1,894.6) |
(711.8) |
(250.3) |
(2,858.6) |
|
Carrying amount: |
|||||
|
December 31, 2016 |
4,158.9 |
558.6 |
291.5 |
236.9 |
5,245.9 |
|
December 31, 2017 |
3,512.8 |
438.7 |
432.8 |
290.4 |
4,674.7 |
(i) The period of amortization of intangible assets of definite useful life is five years and amortization is calculated at the annual rate of 20% and recognized in income on a straight-line method.
The Company is the owner of some of the world’s leading brands in the beer industry. As a result, brands are expected to generate positive cash flows for as long as the Company owns the brands and accordingly have been assigned indefinite lives. The most representative brands that have been registered as result of fair value determination of past acquisitions are Quilmes in Argentina, Pilsen in Paraguay and Bolivia and Presidente and Presidente Light in Dominican Republic.
The carrying value of intangible assets with indefinite useful lives classified as brands was allocated to the following CGU:
|
2018 |
2017 | |
|
Argentina |
1,180.0 |
348.8 |
|
Bolivia |
664.3 |
567.1 |
|
Brazil |
4.6 |
4.6 |
|
Canada |
244.1 |
223.9 |
|
Chile |
72.0 |
69.5 |
|
Luxembourg |
339.6 |
339.6 |
|
Paraguay |
496.9 |
447.5 |
|
Dominican Republic |
1,580.0 |
1,396.6 |
|
Uruguay |
119.8 |
115.2 |
|
4,701.3 |
3,512.8 |
Intangible assets with indefinite useful lives have been tested for impairment at a cash-generating unit level basis consistent with the same approach described in Note 14 – Goodwill.
F - 55
16. INVESTMENT SECURITIES
|
2018 |
2017 | |
|
Debt held-to-maturity (i) |
147.3 |
122.0 |
|
Non-current investments securities |
147.3 |
122.0 |
|
|
||
|
Financial asset at fair value through profit or loss-held for trading |
13.4 |
11.9 |
|
Current investments securities |
13.4 |
11.9 |
|
|
||
|
Total |
160.7 |
133.9 |
(i) The balance refers substantially to Bank Deposit Certificates - CDB linked to tax incentives and don’t have an immediate convertibility in a known amount of cash.
17. DEFERRED INCOME TAX AND SOCIAL CONTRIBUTION
Deferred taxes for income tax and social contribution taxes are calculated on temporary differences between the tax bases of these taxes and the accounting calculation of the Company, among which, tax losses. The rates of these taxes in Brazil, which are expected at the realization of deferred taxes, are 25% for income tax and 9% for social contribution. For the other regions, with operational activity, expected rates, are as follow:
|
Central America and the Caribbean |
from 23% to 31% |
|
Latin America (i) |
from 14% to 30% |
|
Canada |
26% |
(i) Amendments to Argentine tax legislation approved on December 29, 2017 affected the Company beginning in October 2018 and reduced the income tax rate in the first two years from 35% to 30% and, in the following years, to 25%.
Deferred tax assets are recognized to the extent that it is probable that future taxable profit is probable, which may be offset against temporary differences recorded currently, with a special emphasis on tax losses.
F - 56
The amount of deferred income tax and social contribution by type of temporary difference is detailed as follows:
|
2018 |
2017 | ||||||
|
Assets |
Liabilities |
Net |
Assets |
Liabilities |
Net | ||
|
Investment securities |
10.0 |
- |
10.0 |
39.0 |
- |
39.0 | |
|
Intangible |
- |
(1,031.1) |
(1,031.1) |
- |
(719.5) |
(719.5) | |
|
Employee benefits |
614.8 |
- |
614.8 |
631.1 |
- |
631.1 | |
|
Trade payables |
1,807.8 |
(271.9) |
1,535.9 |
1,382.4 |
(314.2) |
1,068.2 | |
|
Trade receivable |
41.3 |
(2.3) |
39.0 |
52.3 |
- |
52.3 | |
|
Derivatives |
18.7 |
(304.2) |
(285.5) |
6.8 |
(5.8) |
1.0 | |
|
Interest-Bearing Loans and Borrowings |
2.5 |
(78.5) |
(76.0) |
|
- |
- |
- |
|
Inventories |
266.7 |
(44.8) |
221.9 |
248.7 |
(18.1) |
230.6 | |
|
Property, plant and equipment |
109.6 |
(1,386.4) |
(1,276.8) |
- |
(920.5) |
(920.5) | |
|
Withholding tax over undistributed profits and royalties |
- |
(863.8) |
(863.8) |
- |
(788.6) |
(788.6) | |
|
Investments in joint ventures |
- |
(421.6) |
(421.6) |
- |
(421.6) |
(421.6) | |
|
Loss carryforwards |
791.0 |
- |
791.0 |
501.0 |
- |
501.0 | |
|
Provisions |
363.1 |
(24.0) |
339.1 |
347.3 |
(39.7) |
307.6 | |
|
Other items |
50.6 |
(54.6) |
(4.0) |
- |
(30.5) |
(30.5) | |
|
Gross deferred tax assets / (liabilities) |
4,076.1 |
(4,483.2) |
(407.1) |
3,208.6 |
(3,258.5) |
(49.9) | |
|
Netting by taxable entity |
(2,058.6) |
2,058.6 |
- |
(929.3) |
929.3 |
- | |
|
Net deferred tax assets / (liabilities) |
2,017.5 |
(2,424.6) |
(407.1) |
2,279.3 |
(2,329.2) |
(49.9) | |
The Company only offsets the balances of deferred income tax and social contribution assets against liabilities when they are within the same entity, same nature and are expected to be realized in the same period.
At December 31, 2018 the assets and liabilities deferred taxes related to combined tax losses has an expected utilization/settlement by temporary differences as follows:
|
2018 | |||
|
Deferred taxes not related to tax losses |
to be realized until 12 months |
to be realized after 12 months |
Total |
|
Investment securities |
- |
10.0 |
10.0 |
|
Intangible |
0.6 |
(1,031.7) |
(1,031.1) |
|
Employee benefits |
61.2 |
553.6 |
614.8 |
|
Trade payables |
(208.6) |
1,744.5 |
1,535.9 |
|
Trade receivable |
35.0 |
4.0 |
39.0 |
|
Derivatives |
(302.3) |
16.8 |
(285.5) |
|
Interest-bearing loans and borrowings |
(20.6) |
(55.4) |
(76.0) |
|
Inventories |
215.0 |
6.9 |
221.9 |
|
Property, plant and equipment |
(82.8) |
(1,194.0) |
(1,276.8) |
|
Withholding tax over undistributed profits and royalties |
(72.2) |
(791.6) |
(863.8) |
|
Investments in joint ventures |
- |
(421.6) |
(421.6) |
|
Provisions |
215.8 |
123.3 |
339.1 |
|
Other items |
(1.4) |
(2.6) |
(4.0) |
|
Total |
(160.3) |
(1,037.8) |
(1,198.1) |
The majority of tax losses and negative social contribution bases on which deferred income tax and social contribution were calculated do not have a limitation period. Its use is based on the projection of the future existence of taxable profits, according to the reality of the past years and to the projections of the Company's business in the economies where it is located, in compliance, therefore, with the applicable fiscal and accounting rules.
F - 57
|
Deferred tax related to tax losses |
2018 |
|
2019 |
255.0 |
|
2020 |
69.5 |
|
2021 |
50.8 |
|
2022 |
25.6 |
|
2023 |
40.8 |
|
2024 à 2026 |
271.3 |
|
2027 à 2029 (i) |
78.0 |
|
Total |
791.0 |
(i) There is no expectation of realization that exceeds the term of 10 years.
As at December 31, 2018, the tax credit related to tax losses in the amount of R$624.3 (R$427.4 as at December 31, 2017) was not recorded as the realization is not probable.
Major part of the tax losses deferred asset amount do not have carryforward limit for utilization and the tax losses carried forward in relation to credit are equivalent to R$2,496.8 in December 31, 2018 (R$1,709.5 in December 31, 2017).
The net change in deferred income tax and social contribution is detailed as follows:
|
At December 31, 2016 |
(61.5) |
|
Full recognition of actuarial gains/(losses) |
40.2 |
|
Investment hedge in foreign operations |
(262.7) |
|
Investment hedge - put option of a subsidiary interest |
(31.8) |
|
Cash flow hedge - gains/(losses) |
(269.2) |
|
Gains/(losses) on translation of other foreign operations |
136.1 |
|
Recognized in other comprehensive income |
(387.4) |
|
Recognized in income statement |
253.0 |
|
Changes directly in balance sheet |
146.0 |
|
Recognized in deferred tax |
35.4 |
|
Recognized in other group of balance sheet |
110.6 |
|
At December 31, 2017 |
(49.9) |
|
Full recognition of actuarial gains/(losses) |
(3.5) |
|
Investment hedge in foreign operations |
34.5 |
|
Investment hedge - put option of a subsidiary interest |
44.1 |
|
Cash flow hedge - gains/(losses) |
(118.3) |
|
Gains/(losses) on translation of other foreign operations |
283.4 |
|
Recognized in other comprehensive income |
240.2 |
|
Recognized in income statement |
43.9 |
|
Changes directly in balance sheet |
(641.3) |
|
Recognized in deferred tax |
(652.1) |
|
Recognized in other group of balance sheet |
10.8 |
|
At December 31, 2018 |
(407.1) |
F - 58
18. INVENTORIES
|
2018 |
2017 | |
|
Finished goods |
1,688.0 |
1,528.4 |
|
Work in progress |
339.5 |
309.6 |
|
Raw material |
2,517.3 |
1,816.3 |
|
Consumables |
107.0 |
77.3 |
|
Spare parts and other |
597.0 |
476.9 |
|
Prepayments |
304.4 |
210.9 |
|
Impairment losses |
(151.4) |
(100.4) |
|
5,401.8 |
4,319.0 |
Write-offs/losses on inventories recognized in the income statement amounted to R$76.5 in 2018 (R$73.2 in 2017).
19. TRADE RECEIVABLES
|
2018 |
2017 | |
|
Trade receivables |
5,140.1 |
5,335.7 |
|
Bad debt provision |
(555.3) |
(521.5) |
|
Net, trade receivables |
4,584.8 |
4,814.2 |
|
Related parties (Note 33) |
294.5 |
130.6 |
|
Total current trade receivables |
4,879.3 |
4,944.8 |
The aging of our current trade receivables, net of impairment losses, is detailed as follows:
|
Net carrying amount as of December 31, |
No past due |
Past due – until 30 days |
Past due – between 31 - 60 days |
Past due – between 61 - 90 days |
Past due – between 91 - 180 days |
Past due – between 181 - 360 days |
Past due 360 days | |
|
Trade receivables |
5,140.1 |
4,170.7 |
277.8 |
71.1 |
30.3 |
58.8 |
32.8 |
498.6 |
|
Bad debt provision |
(555.3) |
(4.3) |
- |
(0.3) |
(0.4) |
(18.9) |
(32.8) |
(498.6) |
|
2018 |
4,584.8 |
4,166.4 |
277.8 |
70.8 |
29.9 |
39.9 |
- |
- |
|
Trade receivables |
5,335.7 |
4,059.7 |
472.5 |
71.4 |
91.6 |
172.1 |
42.2 |
426.2 |
|
Bad debt provision |
(521.5) |
(5.9) |
(0.1) |
(0.4) |
(0.8) |
(45.9) |
(42.2) |
(426.2) |
|
2017 |
4,814.2 |
4,053.8 |
472.4 |
71.0 |
90.8 |
126.2 |
- |
- |
Impairment losses on trade receivables recognized in the income statement in 2018 amount to R$49.8 (R$83.1 in 2017).
Company’s exposure to credit risk, currency and interest rate risks is disclosed in Note 27 -Financial instruments and risks.
F - 59
20. CASH AND CASH EQUIVALENTS
|
2018 |
2017 | |
|
Short term bank deposits (i) |
5,992.8 |
4,688.5 |
|
Current bank accounts |
4,875.7 |
5,077.1 |
|
Cash |
595.0 |
588.9 |
|
Cash and cash equivalents |
11,463.5 |
10,354.5 |
|
|
||
|
Bank overdrafts |
- |
(1.8) |
|
Cash and cash equivalents less bank overdraft |
11,463.5 |
10,352.7 |
(i) The balance refers mostly to Bank Deposit Certificates - CDB, high liquidity, which are readily convertible into known amounts of cash and which are subject to an insignificant risk of change in value.
Current account balances include guarantee deposits in the amount of R$356 million as of December 31, 2018 (R$294 million as of December 31, 2017) held by the subsidiary of Cuba, which are not freely transferable to the parent company for reasons of exchange restrictions.
21. CHANGES IN EQUITY
(a) Capital stock
|
|
2018 |
|
2017 | ||
|
Million of common shares |
Million of Real |
Million of common shares |
Million of Real | ||
|
|
|
|
|
|
|
|
Beginning balance as per statutory books |
15,717.6 |
57,614.1 |
15,717.6 |
57,614.1 | |
|
Share issued |
4.5 |
96.1 |
- |
- | |
|
15,722.1 |
57,710.2 |
15,717.6 |
57,614.1 |
(b) Capital reserves
|
Capital Reserves |
| ||||
|
Treasury shares |
Share Premium |
Others capital reserves |
Share-based Payments |
Total | |
|
At December 31, 2016 |
(908.7) |
53,662.8 |
700.9 |
1,074.9 |
54,529.9 |
|
Purchase of shares and result on treasury shares |
13.7 |
- |
- |
- |
13.7 |
|
Share-based payments |
- |
- |
- |
157.4 |
157.4 |
|
At December 31, 2017 |
(895.0) |
53,662.8 |
700.9 |
1,232.3 |
54,701.0 |
|
Capital Increase |
- |
- |
- |
(89.9) |
(89.9) |
|
Effect of application of IAS 29 (hyperinflation) (i) |
- |
- |
- |
(8.2) |
(8.2) |
|
Purchase of shares and result on treasury shares |
12.3 |
- |
- |
- |
12.3 |
|
Share-based payments |
- |
- |
- |
166.1 |
166.1 |
|
At December 31, 2018 |
(882.7) |
53,662.8 |
700.9 |
1,300.3 |
54,781.3 |
(i) As described in Note 1 (b) Application of inflation accounting and Financial Reporting in Hyperinflationary Economies.
F - 60
(b.1) Purchase of shares and result of treasury shares
The treasury shares comprise own issued shares reacquired by the Company and the result on treasury shares that refers to gains and losses related to share-based payments transactions and others.
Follows the changes of treasury shares:
|
Acquire /realization shares |
Result on Treasure Shares |
Total Treasure Shares | |||||
|
Million shares |
Million Brazilian Real |
Million shares |
Million Brazilian Real | ||||
|
At December 31, 2016 |
16.6 |
(312.7) |
(596.0) |
(908.7) | |||
|
Changes during the year |
(9.1) |
173.0 |
(159.3) |
13.7 | |||
|
At December 31, 2017 |
7.5 |
(139.7) |
(755.3) |
(895.0) | |||
|
Changes during the year |
(6.4) |
|
118.8 |
|
(106.5) |
|
12.3 |
|
At December 31, 2018 |
1.1 |
|
(20.9) |
|
(861.8) |
|
(882.7) |
(b.2) Share premium
The share premium refers to the difference between subscription price that the shareholders paid for the shares and theirs nominal value. Since this is a capital reserve, it can only be used to increase capital, offset losses, redemptions, reimbursement or repurchase shares.
(b.3) Share-based payment
Different share-based payment programs and stock purchase option plans allow the senior management from Ambev economic group acquire shares of the Company.
The share-based payment reserve recorded a charge of R$161.0 in December 31, 2018 (R$209.3 and R$170.3 in December 31, 2017 and 2016, respectively) (Note 24 – Share-based payments).
(c) Net income reserves
|
Net income reserves | ||||
|
Investments reserve |
Statutory reserve |
Fiscal incentive |
Total | |
|
|
|
|
|
|
|
At December 31, 2016 |
3,859.9 |
4.5 |
5,835.7 |
9,700.1 |
|
Interest on shareholder´s equity |
(3,770.1) |
- |
- |
(3,770.1) |
|
Fiscal incentive reserve |
- |
- |
1,552.3 |
1,552.3 |
|
Investments reserve |
1,177.9 |
- |
- |
1,177.9 |
|
At December 31, 2017 |
1,267.7 |
4.5 |
7,388.0 |
8,660.2 |
|
Interest on shareholder´s equity |
- |
- |
- |
- |
|
Fiscal incentive reserve |
- |
- |
1,331.5 |
1,331.5 |
|
Investments reserve |
5,442.3 |
- |
- |
5,442.3 |
|
At December 31, 2018 |
6,710.0 |
4.5 |
8,719.5 |
15,434.0 |
F - 61
(c.1) Investments reserve
From net income after deductions applicable, will be aimed no more than 60% (sixty per cent) of the adjusted net profit to investment reserve so that it can support future investments.
(c.2) Statutory reserve
From net income, 5% will be applied before any other allocation, to the statutory reserve, which cannot exceed 20% of capital stock. The Company is not required to supplement the statutory reserve in the year when the balance of this reserve, plus the amount of capital reserves, exceeds 30% of the capital stock.
(c.3) Tax incentives
The Company has tax incentives framed in certain state and federal industrial development programs in the form of financing, deferred payment of taxes or partial reductions of the amount due. These programs aim to promote the expansion of employment generation, regional decentralization, complement and diversify the industrial base of the States. In these states, the grace periods, enjoyment and reductions are permitted under the tax law.
(c.4) Interest on shareholders’ equity / Dividends
Brazilian companies are permitted to distribute interest attributed to shareholders’ equity calculated based on the long-term interest rate (TJLP), such interest being tax-deductible, in accordance with the applicable law and, when distributed, may be considered part of the minimum mandatory dividends.
As determined by its By-laws, the Company is required to distribute to its shareholders, as a minimum mandatory dividend in respect of each fiscal year ending on December 31, an amount not less than 40% of its net income determined under Brazilian law, as adjusted in accordance with applicable law, unless payment of such amount would be incompatible with Ambev’s financial situation. The minimum mandatory dividend includes amounts paid as interest on shareholders’ equity.
Events during the year ended 2018:
|
Event |
Approval |
Type |
Date of payment |
Year |
Type of share |
Amount per share |
Total amount |
|
Board of Directors Meeting |
05/15/2018 |
Dividends |
07/30/2018 |
2018 |
ON |
0.1600 |
2,515.1 |
|
Board of Directors Meeting |
12/03/2018 |
Interest on shareholder´s equity |
12/28/2018 |
2018 |
ON |
0.3200 |
5,030.5 |
|
7,545.6 |
F - 62
Events during the year ended 2017:
|
Event |
Approval |
Type |
Date of payment |
Year |
Type of share |
Amount per share |
Total amount |
|
|
Board of Directors Meeting |
05/16/2017 |
Dividends |
07/17/2017 |
2017 |
ON |
0.1600 |
2,513.1 |
|
|
Board of Directors Meeting |
12/01/2017 |
Interest on shareholder´s equity |
12/28/2017 |
2017 |
ON |
0.3100 |
4,869.7 |
(i) |
|
Board of Directors Meeting |
12/21/2017 |
Dividends |
02/22/2018 |
2017 |
ON |
0.0700 |
1,099.7 |
|
|
8,482.5 |
(i) R$3,770.1 of these interest on shareholder´s equity refer to the total amount approved for distribution in the period, and were accrued in investments reserves.
Events during the year ended 2016:
|
Event |
Approval |
Type |
Date of payment |
Year |
Type of share |
Amount per share |
Total amount |
|
Board of Directors Meeting |
01/15/2016 |
Interest on shareholder´s equity |
02/29/2016 |
2015 |
ON |
0.1300 |
2,039.2 |
|
Board of Directors Meeting |
06/24/2016 |
Dividends |
07/29/2016 |
2016 |
ON |
0.1300 |
2,040.8 |
|
Board of Directors Meeting |
10/19/2016 |
Dividends |
11/25/2016 |
2016 |
ON |
0.1600 |
2,511.9 |
|
Board of Directors Meeting |
12/01/2016 |
Interest on shareholder´s equity |
12/29/2016 |
2016 |
ON |
0.2200 |
3,454.2 |
|
Board of Directors Meeting |
12/22/2016 |
Dividends |
02/23/2017 |
2016 |
ON |
0.0700 |
1,099.1 |
|
11,145.2 |
F - 63
(d) Carrying value adjustments
|
Carrying value adjustments |
| |||||||
|
Translation reserves |
Cash flow hedge |
Actuarial gains/ (losses) |
Options granted on subsidiary |
Gains/(losses) of non-controlling interest´s share |
Business combination |
Accounting adjustments for transactions between shareholders |
Total | |
|
|
|
|
|
|
|
|
|
|
|
At December 31, 2016 |
(289.5) |
(144.5) |
(1,262.2) |
(2,390.9) |
2,150.7 |
156.1 |
(75,238.8) |
(77,019.1) |
|
Comprehensive income: |
||||||||
|
Gains/(losses) on translation of foreign operations |
1,928.6 |
- |
- |
- |
- |
- |
- |
1,928.6 |
|
Cash flow hedges |
- |
513.4 |
- |
- |
- |
- |
- |
513.4 |
|
Actuarial gains/(losses) |
- |
- |
117.7 |
- |
- |
- |
- |
117.7 |
|
Total Comprehensive income |
1,928.6 |
513.4 |
117.7 |
- |
- |
- |
- |
2,559.7 |
|
Options granted on subsidiary |
- |
- |
- |
(380.4) |
- |
- |
- |
(380.4) |
|
Gains/(losses) of controlling interest´s share |
- |
- |
- |
- |
(12.1) |
- |
- |
(12.1) |
|
Tax on fictitious dividends |
- |
- |
- |
- |
(38.7) |
- |
- |
(38.7) |
|
Reversal effect revaluation of property, plant and equipment under the predecessor basis accounting |
- |
- |
- |
- |
- |
- |
(75.9) |
(75.9) |
|
At December 31, 2017 |
1,639.1 |
368.9 |
(1,144.5) |
(2,771.3) |
2,099.9 |
156.1 |
(75,314.7) |
(74,966.5) |
|
Comprehensive income: |
||||||||
|
Gains/(losses) on translation of foreign operations |
1,643.5 |
- |
- |
- |
- |
- |
- |
1,643.5 |
|
Cash flow hedges |
- |
495.9 |
- |
- |
- |
- |
- |
495.9 |
|
Actuarial gains/(losses) |
- |
- |
24.8 |
- |
- |
- |
- |
24.8 |
|
Total Comprehensive income |
1,643.5 |
495.9 |
24.8 |
- |
- |
- |
- |
2,164.2 |
|
Effect of application of IAS 29 (hyperinflation) (i) |
346.4 |
(88.3) |
0.1 |
- |
- |
- |
- |
258.2 |
|
Gains/(losses) of controlling interest´s share (ii) |
460.1 |
0.8 |
3.4 |
2,651.1 |
(2,072.9) |
- |
- |
1,042.5 |
|
Tax on fictitious dividends |
- |
- |
- |
- |
(7.4) |
- |
- |
(7.4) |
|
Reversal effect revaluation of property, plant and equipment under the predecessor basis accounting |
- |
- |
- |
- |
- |
- |
(75.9) |
(75.9) |
|
At December 31, 2018 |
4,089.1 |
777.3 |
(1,116.2) |
(120.2) |
19.6 |
156.1 |
(75,390.6) |
(71,584.9) |
(i) As described in Note 1 (b) Application of inflation accounting and Financial Reporting in Hyperinflationary Economies.
(ii) Of these amount, R$1,035.2 refers to renegotiation of shareholders agreement from Tenedora, as described in Note 1 (b).
F - 64
(d.1) Translation reserves
The translation reserves comprise all foreign currency exchange differences arising from the translation of the financial statements with functional currency different from the Real.
The translation reserves also comprise the portion of the gain or loss on the foreign currency liabilities and on the derivative financial instruments determined to be effective net investment hedges.
(d.2) Cash flow hedge reserves
The hedging reserves comprise the effective portion of the cumulative net change in the fair value of cash flow hedges to the extent the hedged risk has not yet impacted profit or loss (For additional information, see Note 27 – Financial instruments and risks).
(d.3) Actuarial gains and losses
The actuarial gains and losses include expectations with regards to the future pension plans obligations. Consequently, the results of actuarial gains and losses are recognized on timely basis considering best estimate obtained by Management. Accordingly, the Company recognizes on monthly basis the results of these estimated actuarial gains and losses based on the expectations presented in the independent actuarial report.
The actuarial gain of R$158.5 in 2017 arising from the surplus reverted to the Sponsor, originating from Ambev Private Pension Institute of the defined benefits plan was fully recorded under the heading of actuarial gains and losses in equity.
(d.4) Options granted on subsidiary
As part of the shareholders agreement between the Ambev and ELJ, an option to sell (“put”) was issued by Ambev in favor of E. León Jimenes, S.A. (“ELJ”) and an option to purchase (“call”) was issued by ELJ in favor of Ambev, which may result in an acquisition by Ambev of the remaining shares of Tenedora, for a value based on EBITDA, discounted of net debt, from operations, being put exercisable at any time. As disclosed in Note 1 – Corporate information, on January 18, 2018, the ELJ exercised partially its put option related to approximately 30% of capital stock by Tenedora. Due to the partial exercise of put option, the Company became the owner of approximately 85% of Tenedora. Additionally, was approved the change of the call option term from 2019 to 2022.
On December 31, 2018 the put option held by ELJ is valued at R$2,449.3 (R$5,520.2 on December 31, 2017) and the liability categorized as “Level 3”, as the Note 27 (b) and in accordance with the IFRS 3. No value has been assigned to the call option held by the Company. The fair value of this consideration deferred was calculated by using standard valuation techniques (present value of the principal amount and future interest rates, discounted by the market rate). The criteria used are based on market information and from reliable sources and the fair value is revaluated on an annual basis.
F - 65
As part of the agreement to acquire the shares of Sucos do Bem, a put option and a call option on minority shareholders' participation determined by gross revenue of its products and exercisable from 2020 has been granted, with a few exceptions. On December 31, 2018 the put option is valued at R$136.0 (R$132.0 on December 31, 2017).
The changes in these options is presented in Note 27 – Financial instruments and risks.
(d.5) Accounting for acquisition of non-controlling interests
In transactions with non-controlling interests of the same business, even when performed at arm's length terms, that present valid economic grounds and reflect normal market conditions, will be consolidated by the applicable accounting standards as occurred within the same accounting entity.
As determined by IFRS 10, any difference between the amount paid (fair value) for the acquisition of non-controlling interests and are related to carrying amount of such non-controlling interest shall be recognized directly in controlling shareholders’ equity. The acquisition of non-controlling interest related to Old Ambev, the above mentioned adjustment was recognized in the Carrying value adjustments when applicable, due to the adoption of the predecessor basis of accounting.
(e) Earnings per share
Basic and diluted earnings per share of the stock option and deferred stock
The calculation of basic earnings per share is based on the net income attributable to equity holders of Ambev and the proportional weighted average number of shares outstanding during the year.
F - 66
Diluted earnings per share of the stock option and deferred stock is based on the net income attributable to equity holders of Ambev and the adjusting the weighted average number of shares outstanding during the year to assume conversion of all potentially dilutive shares, as follows:
|
Million shares |
2018 |
2017 |
2016 | ||
|
Common |
Common |
Common | |||
|
Issued shares at December 31, net of treasury shares (i) |
15,718.1 |
15,705.8 |
15,696.6 | ||
|
Effect of shares options |
138.1 |
132.2 |
126.5 | ||
|
Weighted average number of shares (diluted) at December 31 |
15,856.2 |
15,838.0 |
15,823.1 |
(i) Not considered treasury shares.
The tables below present the calculation of earnings per share (“EPS”):
|
2018 |
2017 |
2016 | |||
|
Common |
Common |
Common | |||
|
Income attributable to equity holders of Ambev |
11,024.7 |
7,332.0 |
12,546.6 | ||
|
Weighted average number of shares (non diluted) |
15,718.1 |
15,705.8 |
15,696.6 | ||
|
Basic EPS (i) |
0.7014 |
0.4668 |
0.7993 | ||
|
|
|||||
|
|
|||||
|
Income attributable to equity holders of Ambev |
11,024.7 |
7,332.0 |
12,546.6 | ||
|
Weighted average numbers of shares (diluted) |
15,856.2 |
15,838.1 |
15,823.2 | ||
|
Diluted EPS (i) |
0.6953 |
0.4629 |
0.7929 |
(i) Expressed in Brazilian Reais.
(f) Destinations
At December 31, 2018, the Company has done the appropriations to retained earnings, in accordance with the Brazilian Corporate law and the Company’s bylaws. The dividends payments made until December 2018 were approved at the Board of Directors’ Meeting.
Regarding the basis for dividends, the Company believes that the predecessor basis of accounting, as well as its presentation for comparative purposes, will not affect the determination of the minimum mandatory dividend. Therefore, the Company intends to adjust the calculation basis of the minimum mandatory dividend to delete any current and future impacts on net income resulting from the adoption of this accounting practice, related to the amortization/depreciation of surplus assets or even a possible impairment of goodwill, thus preserving the mandatory minimum dividends.
F - 67
|
2018 |
2017 |
2016 | |||
|
Net income, attributable to equity holders of Ambev |
11,024.7 |
7,332.0 |
12,546.6 | ||
|
Prescribed/(complement) dividends |
30.1 |
34.7 |
21.6 | ||
|
Reversal effect revaluation of property, plant and equipment under the predecessor basis accounting |
75.9 |
|
75.9 |
|
75.9 |
|
Impact of the adoption of IFRS 15 (i) |
(355.4) |
|
- |
|
- |
|
Effect of application of IAS 29 (hyperinflation) (ii) |
3,544.1 |
- |
- | ||
|
Retained earnings basis for dividends and destinations to Net income reserves |
14,319.4 |
7,442.6 |
12,644.1 | ||
|
|
|||||
|
Dividends and Interest on capital distributed and accrued to distribute based on net income for the year |
|
||||
|
Dividends and Interest on capital paid based on profit |
7,545.6 |
3,612.7 |
5,651.8 | ||
|
Dividends approved for distribution |
- |
1,099.7 |
3,454.2 | ||
|
Total of dividends and Interest on capital |
7,545.6 |
4,712.4 |
|
9,106.0 | |
|
Percentage of distributed profit |
53% |
63% |
|
72% | |
|
|
|
||||
|
Interest on capital distributed and accrued to distribute based on the investment reserve |
|
|
|||
|
Interest on capital paid based on the investment reserve |
- |
3,770.1 |
|
- | |
|
Total of Interest on capital |
- |
3,770.1 |
|
- | |
|
|
|
||||
|
Total of distributed and accrued to distribute |
7,545.6 |
|
8,482.5 |
|
9,106.0 |
|
Percentage of distributed profit |
53% |
114% |
72% |
(i) As described in Note 3 - Summary of significant account policies.
(ii) As described in Note 1 (b) Application of inflation accounting and Financial Reporting in Hyperinflationary Economies.
22. INTEREST-BEARING LOANS AND BORROWINGS
|
2018 |
2017 | |
|
Secured bank loans |
434.7 |
589.3 |
|
Unsecured bank loans |
212.3 |
413.7 |
|
Debentures and unsecured bond issues |
104.7 |
102.7 |
|
Other unsecured loans |
99.0 |
101.5 |
|
Financial leasing |
11.4 |
24.7 |
|
Non-current liabilities |
862.1 |
1,231.9 |
|
|
||
|
Secured bank loans |
1,404.8 |
879.6 |
|
Unsecured bank loans |
86.6 |
394.3 |
|
Other unsecured loans |
39.2 |
38.4 |
|
Financial leasing |
30.0 |
8.8 |
|
Current liabilities |
1,560.6 |
1,321.1 |
Additional information regarding the exposure of the Company to the risks of interest rate and foreign currency are disclosed on Note 27 – Financial instruments and risks.
F - 68
At December 31, 2018 and 2017 debts presented the following interest rates:
|
2018 |
2017 | ||||||
|
Debt instruments |
Average rate % |
Current |
Non-current |
Average rate % |
Current |
Non-current | |
|
Debt denominated in USD fixed rate |
4.40% |
32.4 |
9.9 |
3.83% |
6.4 |
16.5 | |
|
Debt denominated in US dollars floating rate |
3.59% |
538.8 |
91.2 |
2.74% |
78.3 |
476.9 | |
|
Debt denominated in CAD dollars floating rate |
2.43% |
743.9 |
9.3 |
2.00% |
685.9 |
- | |
|
Other latin american currency fixed rate |
9.96% |
11.5 |
212.1 |
9.27% |
199.1 |
- | |
|
Other latin american currency floating rate |
- |
- |
- |
2.33% |
- |
5.0 | |
|
Denominated Reais floating rate (TJLP and TR) |
9.08% |
75.3 |
162.3 |
9.22% |
165.3 |
237.0 | |
|
Reais debt - ICMS fixed rate |
5.79% |
37.2 |
91.2 |
5.57% |
38.4 |
91.5 | |
|
Reais debt - fixed rate |
7.05% |
121.5 |
286.1 |
6.63% |
147.7 |
405.0 | |
|
Total |
|
1,560.6 |
862.1 |
1,321.1 |
1,231.9 | ||
Terms and debt repayment schedule – December 31, 2018
|
Total |
Less than 1 year |
1-2 years |
2-3 years |
3-5 years |
More than 5 years | |
|
Secured bank loans |
1,839.5 |
1,404.9 |
156.8 |
54.9 |
101.7 |
121.2 |
|
Unsecured bank loans |
298.9 |
86.6 |
0.1 |
212.2 |
- |
- |
|
Debentures and unsecured bond issues |
104.7 |
- |
- |
104.7 |
- |
- |
|
Unsecured other loans |
138.2 |
39.1 |
38.0 |
22.7 |
16.0 |
22.4 |
|
Finance lease liabilities |
41.4 |
30.0 |
4.9 |
2.9 |
3.6 |
- |
|
2,422.7 |
1,560.6 |
199.8 |
397.4 |
121.3 |
143.6 |
Terms and debt repayment schedule – December 31, 2017
|
Total |
Less than 1 year |
1-2 years |
2-3 years |
3-5 years |
More than 5 years | |
|
Secured bank loans |
1,468.9 |
879.6 |
253.6 |
57.7 |
109.4 |
168.6 |
|
Unsecured bank loans |
808.0 |
394.3 |
413.7 |
- |
- |
- |
|
Debentures and unsecured bond issues |
102.7 |
- |
- |
- |
102.7 |
- |
|
Unsecured other loans |
139.9 |
38.4 |
32.0 |
24.7 |
11.6 |
33.2 |
|
Finance lease liabilities |
33.5 |
8.8 |
24.7 |
- |
- |
- |
|
2,553.0 |
1,321.1 |
724.0 |
82.4 |
223.7 |
201.8 |
Reconciliation of liabilities arising from financing activities
The table below details changes in the Company’s liabilities arising from financing activities, including both cash and non-cash changes. Liabilities arising from financing activities are those for which cash flows were, or future cash flows will be classified in the company’s consolidated statement of cash flows from financing activities.
|
|
Current liabilities |
|
Non-current liabilities |
|
December 31, 2017 |
1,321.1 |
|
1,231.9 |
|
Proceeds |
7.4 |
2,348.1 | |
|
Payments |
(2,505.0) |
(6.7) | |
|
Foreign exchange |
115.9 |
74.1 | |
|
Transfer between current and non-current |
2,627.9 |
(2,628.1) | |
|
Other movements |
(6.7) |
|
(157.2) |
|
December 31, 2018 |
1,560.6 |
862.1 |
F - 69
Contractual clauses (covenants)
As at December 31, 2018, the Company's loans had equal rights to payment without subordination clauses. Except for the credit lines due to FINAME contracted by the Company with Banco Nacional de Desenvolvimento Econômico e Social – BNDES (“BNDES”), where collateral were provided on assets acquired with the credit granted which serve as collateral; other loans and financing contracted by the Company predict only guarantees as personal collateral or are unsecured. The most loan contracts contain financial covenants including:
• financial covenants, including limitation on new indebtedness;
• going-concern;
• maintenance, in use or in good condition for the business, of the Company's assets;
• restrictions on acquisitions, mergers, sale or disposal of its assets;
• disclosure of financial statements and balance sheet; and/or
• no prohibition related to new real guarantees for loans contracted, except if: (i) expressly authorized under the aforementioned loan agreement, (ii) new loans contracted from financial institutions linked to the Brazilian government - including the BNDES or foreign governments; - or foreign governments, multilateral financial institutions (e.g. World Bank) or located in jurisdictions in which the Company operates;
These clauses apply to the extent that the events mentioned produce material adverse effects on the Company and / or its subsidiaries or the rights of its creditors, and, in the event of any of the events provided in the clauses, it may have been granted to the Company a grace period to cure such default.
Additionally, all agreements entered into with the BNDES are subject to certain “provisions applicable to agreements entered into with the BNDES” (“Provisions”). Such Provisions require the borrower, to obtain prior consent of BNDES if they, for instance, wish to: (i) raise new loans (except for loans described in the Provisions); (ii) give preference and/or priority to other debts; and/or (iii) dispose of or encumber any item of their fixed assets (except as provided for in the Provisions).
As at December 31, 2018, the Company was in compliance with all its contractual obligations for its loans and financings.
F - 70
23. EMPLOYEE BENEFITS
The Company sponsors pension plans to defined benefit to employees in Brazil and subsidiaries located in the Dominican Republic, Barbados, Panama, Uruguay, Bolivia, Argentina and Canada based on employees' salaries and length of service. The entities are governed by local regulations and practices of each individual country as well as the relationship with the Company’s pension funds and their composition.
Ambev provides post-employment benefits, including pension benefits and medical and dental care. Post-employment benefits are classified as either defined contribution or defined benefit plans.
The defined benefit plans and the other post-employment benefits are not granted to new retirees.
Defined contribution plans
These plans are funded by the participants and the sponsor, and are managed by administered pension funds. During 2018, the Company contributed R$32.2 (R$18.9 and R$25.3 during 2017 and 2016, respectively) to these funds, which were recorded as an expense. Once the contributions have been paid, the Company has no further payment obligations.
Defined benefit plans
At December 31, 2018 the net liability for defined benefit plans consists of the following:
|
2018 |
2017 |
2016 | |
|
Present value of funded obligations |
(5,161.0) |
(5,027.7) |
(4,592.1) |
|
Fair value of plan assets |
4,059.6 |
4,006.2 |
3,845.2 |
|
Present value of net funded obligations |
(1,101.4) |
(1,021.5) |
(746.9) |
|
Present value of unfunded obligations |
(790.9) |
(757.4) |
(741.3) |
|
Present value of net obligations |
(1,892.3) |
(1,778.9) |
(1,488.2) |
|
Asset ceiling |
(298.3) |
(368.4) |
(532.2) |
|
Net liability |
(2,190.6) |
(2,147.3) |
(2,020.4) |
|
Other long term employee benefits |
(88.7) |
(105.0) |
(83.8) |
|
Total employee benefits |
(2,279.3) |
(2,252.3) |
(2,104.2) |
|
Employee benefits amount in the balance sheet: |
|
||
|
Liabilities |
(2,343.6) |
(2,310.7) |
(2,137.7) |
|
Assets |
64.3 |
58.4 |
33.5 |
|
Net liabilities |
(2,279.3) |
(2,252.3) |
(2,104.2) |
F - 71
The changes in the present value of the defined benefit obligations were as follows:
|
2018 |
2017 |
2016 | |
|
Defined benefit obligation at January 1 st |
(5,785.1) |
(5,333.4) |
(5,403.0) |
|
Acquisitions through exchange transaction of shareholdings |
3.5 |
- |
(67.3) |
|
Service cost |
(42.5) |
(38.2) |
(43.1) |
|
Interest cost |
(335.7) |
(321.5) |
(320.5) |
|
Gains and (losses) on settlements or reductions in benefits |
7.0 |
3.9 |
2.2 |
|
Contributions by plan participants |
(4.4) |
(4.1) |
(5.2) |
|
Actuarial gains and (losses) - geographical assumptions |
9.9 |
77.3 |
(20.1) |
|
Actuarial gains and (losses) - financial assumptions |
(13.1) |
(140.3) |
(321.1) |
|
Experience adjustment |
106.4 |
(115.7) |
(182.8) |
|
Reclassifications |
- |
(7.5) |
11.1 |
|
Effect of exchange rate fluctuations |
(321.0) |
(306.5) |
599.6 |
|
Benefits paid |
423.1 |
400.9 |
416.8 |
|
Defined benefit obligation at December, 31 |
(5,951.9) |
(5,785.1) |
(5,333.4) |
The present value of funded obligations include R$677.9 (R$762.0 in 2017 and R$683.4 in 2016) of two health care plans for which the benefits are provided directly by Fundação Zerrenner. Fundação Zerrenner is a legally distinct entity whose main goal is to provide the Company’s current and retired employees and managers with health care and dental assistance, technical and superior education courses, maintaining facilities for assisting and helping elderly people, among other things, through direct initiatives or through financial assistance agreements with other entities.
The changes in the fair value of plan assets are as follows:
|
2018 |
2017 |
2016 | |
|
Fair value of plan assets at January 1 st |
4,006.2 |
3,845.2 |
3,781.4 |
|
Interest Income |
267.8 |
273.3 |
274.7 |
|
Administrative costs |
(3.8) |
(3.4) |
(3.7) |
|
Expected Return excluding interest income |
(168.8) |
(64.8) |
269.8 |
|
Acquisition through business combination |
- |
- |
73.5 |
|
Contributions by employer |
213.3 |
183.2 |
175.9 |
|
Contributions by plan participants |
4.7 |
4.5 |
5.6 |
|
Exchange differences |
170.6 |
166.8 |
(315.3) |
|
Curtailments, settlements and others |
(8.0) |
- |
- |
|
Benefits paid excluding costs of administration |
(422.4) |
(398.6) |
(416.7) |
|
Fair value of plan assets at December, 31 |
4,059.6 |
4,006.2 |
3,845.2 |
The real return on plan assets generated in 2018 was a gain of R$99.0 (gain of R$208.5 in 2017).
At December 31, 2018, the Company recorded R$64.3 (R$58.4 at December 31, 2017) up to the asset ceiling not exceeding the present value of future benefits.
F - 72
The changes in the asset ceiling not exceeding the present value of future benefits are as follow:
|
2018 |
2017 |
2016 | |
|
Asset ceiling impact at January 1 st |
58.4 |
33.5 |
8.6 |
|
Acquisitions through exchange transaction of shareholdings |
(4.9) |
- |
10.4 |
|
Interest income/(expenses) |
4.2 |
2.8 |
1.3 |
|
Change in asset ceiling excluding amounts included in interest income/(expenses) |
(0.6) |
8.8 |
15.8 |
|
Effect of exchange rate fluctuations |
7.2 |
0.9 |
(2.6) |
|
Others |
- |
12.4 |
- |
|
Asset ceiling impact at December 31 |
64.3 |
58.4 |
33.5 |
The income/(expense) recognized in the income statement with regard to defined benefit plans is detailed as follows:
|
2018 |
2017 |
2016 | |
|
Current service costs |
(42.5) |
(38.2) |
(43.1) |
|
Administrative costs |
(3.8) |
(3.4) |
(3.7) |
|
(Gains) losses on settlements and curtailments |
7.3 |
4.2 |
0.7 |
|
Income from operations |
(39.0) |
(37.4) |
(46.1) |
|
Financial cost |
(103.0) |
(101.3) |
(105.6) |
|
Total expense for employee benefits |
(142.0) |
(138.7) |
(151.7) |
The employee benefit revenue/(expenses) are included in the following line items in the income statement:
|
2018 |
2017 |
2016 | |
|
Cost of sales |
(19.2) |
(22.3) |
(24.5) |
|
Sales and marketing expenses |
(8.8) |
(5.0) |
(9.5) |
|
Administrative expense |
(11.0) |
(10.1) |
(10.2) |
|
Financial expenses |
(103.0) |
(101.3) |
(105.6) |
|
Exceptional items |
- |
- |
(1.9) |
|
(142.0) |
(138.7) |
(151.7) |
The assumptions used in the calculation of the obligations are as follows:
|
2018 (i) |
2017 (i) |
2016 (i) | |
|
Discount rate |
3.9% to 9.6% |
3.6% to 10.6% |
3.9% to 10.5% |
|
Inflation |
2.0% to 4.0% |
2.0% to 5.0% |
2.0% to 5.2% |
|
Future salary increases |
1.0% to 7.1% |
1.0% to 8.7% |
1.0% to 8.5% |
|
Future pension increases |
2.0% to 4.0% |
2.0% to 4.3% |
2.0% to 4.5% |
|
Medical cost trend rate |
4.5% to 7.9% p.a. reducing to 7.9% |
4.5% to 7.9% p.a. reducing to 7.9% |
3.8% to 8.2% p.a. reducing to 8.2% |
|
Dental claims trend rate |
4.0% |
4.3% |
4.5% |
|
|
|
| |
|
Life expectation for an over 65 years old male |
83 to 87 |
83 to 87 |
80 to 86 |
|
Life expectation for an over 65 years old female |
85 to 89 |
86 to 89 |
83 to 89 |
(i) Includes assumptions in Latin America – North, Latin America – South and Canada.
Through its defined benefit pension plans and post-employment medical plans, the Company is exposed to a number of risks, the most significant are detailed below:
F - 73
Asset volatility
The plans liabilities are calculated using a discount rate set with reference to high quality corporate yields; if plan assets underperform this yield, the Company’s net defined benefit obligation may increase. Most of the Company’s funded plans hold a significant proportion of equities, which are expected to outperform corporate bonds in the long-term while providing volatility and risk in the short-term. As the plans mature, the Company usually reduces the level of investment risk by investing more in assets that better match the liabilities.
Changes in bond yields
A decrease in corporate bond yields will increase plan liabilities, although this will be partially offset by an increase in the value of the plans’ bond holdings.
Inflation risk
Some of the Company’s pension obligations are linked to inflation, and higher inflation will lead to higher liabilities. The majority of the plan’s assets are either unaffected by or loosely correlated with inflation, meaning that an increase in inflation could potentially increase the Company’s net benefit obligation.
Life expectancy
The majority of the plans’ obligations are to provide benefits for the life of the member, so increases in life expectancy will result in an increase in the plans’ liabilities.
Investment strategy
In case of funded plans, the Company ensures that the investment positions are managed within an asset-liability matching (ALM) framework that has been developed to achieve long-term investments that are in line with the obligations under the pension schemes. Within this framework, the Company’s ALM objective is to match assets to the pension obligations by investing in long-term fixed interest securities with maturities that match the benefit payments as they fall due and in the appropriate currency.
F - 74
The sensitivity of the defined benefit obligation to changes in the weighted principal assumptions is:
|
2018 |
2017 |
2016 | |||||||
|
In million of Brazilian Reais |
Change in assumption |
Increase in assumption |
Decrease in assumption |
Increase in assumption |
Decrease in assumption |
Increase in assumption |
Decrease in assumption | ||
|
Medical cost trend rate |
100 bases points |
(113.8) |
98.0 |
(119.7) |
102.3 |
(104.7) |
90.2 | ||
|
Discount rate |
50 bases points |
295.8 |
(314.4) |
289.7 |
(309.2) |
292.6 |
(311.5) | ||
|
Future salary increase |
50 bases points |
(24.2) |
23.0 |
(12.9) |
12.3 |
(16.6) |
15.3 | ||
|
Longevity |
One year |
(177.8) |
174.0 |
(180.6) |
176.5 |
(175.9) |
172.9 | ||
The data presented in these tables are purely hypothetical and are based on changes in individual assumptions holding all other assumptions constant: economic conditions and changes therein always affect the other assumptions at the same time and its effects are not linear. Therefore, the above information is not necessarily a reasonable representation of future results.
The plans assets at December 31, 2018, 2017 and 2016 consist of the following:
|
2018 |
2017 |
2016 | |||||||||
|
Rated |
Unrated |
Total |
Rated |
Unrated |
Total |
Rated |
Unrated |
Total | |||
|
Government bonds |
50% |
- |
50% |
50% |
- |
50% |
41% |
- |
41% | ||
|
Corporate bonds |
7% |
- |
7% |
7% |
- |
7% |
13% |
- |
13% | ||
|
Equity instruments |
14% |
- |
14% |
14% |
- |
14% |
18% |
- |
18% | ||
|
Cash |
- |
- |
- |
- |
- |
- |
1% |
- |
1% | ||
|
Others |
29% |
- |
29% |
29% |
- |
29% |
27% |
- |
27% | ||
The overall expected rate of return is calculated by weighting the individual rates in accordance with the anticipated share in the total investment portfolio.
Ambev expects to contribute approximately R$255.8 to its defined benefit plans in 2019.
24. SHARE-BASED PAYMENTS
There are different stock option and share-based payment programs which allow the employees and senior management from the Company and its subsidiaries to acquire (through of exercise of the stock option) or receive shares of the Company. For all stock option programs, the fair value of the shares is estimated at the options grant date, using the “Hull Binomial” pricing model, adjusted to reflect the IFRS 2 requirement that assumptions about forfeiture before the end of the vesting period cannot impact the fair value of the option.
This current model of stock option, ruled by the Stock Option Plan of the Company (“Stock Option Plan”), includes two types of grants: (I) Grant 1- the beneficiary, as the case, can be allocate 30%, 40%, 60%, 70% or 100% of the amount related to the profit share he received in the year, to the immediate exercise of options, thus acquiring the corresponding shares of the Company, which transfer to third parties or the Company will only be allowed after the five-year period counted from the date of exercise of the options; and (II) Grant 2 - the beneficiary may exercise the options after a five-year grace period, for a period of five years.
F - 75
In addition, the Company has implemented a Share-Based Payment Plan (“Share-Based Plan”) under which certain employees and members of the management of the Company or its subsidiaries are eligible to receive shares of the Company including in the form of ADR’s. The shares that are subject to the Share-Based Plan are designated as "restricted shares".
Additionally, as a mean of a creating a long term incentive (wealth incentive) for certain senior employees and members of management considered as having “high potential,” the Company grants, under the Share-Based Plan, shares to be delivered in the future divided in two separate lots – Lot A and Lot B, which will be delivered to the participants of the relevant program, subject to maturation periods of five and ten years, respectively.
The weighted average fair value of the options and assumptions used in applying the Company’s option pricing model of 2018, 2017 and 2016 grants are as follows:
|
In R$, except when otherwise indicated |
2018 |
(i) |
2017 |
(i) |
2016 |
(i) |
|
Fair value of options granted |
5.62 |
6.51 |
6.21 |
|||
|
Share price |
18.04 |
19.80 |
17.18 |
|||
|
Exercise price |
18.04 |
19.80 |
17.18 |
|||
|
Expected volatility |
26.2% |
26.7% |
27.0% |
|||
|
Vesting year |
5 |
5 |
5 |
|||
|
Expected dividends |
5% |
5% |
5% |
|||
|
Risk-free interest rate |
9.6% |
(ii) |
10.1% |
(ii) |
12.4% |
(ii) |
(i) Information based on weighted average plans granted, except for the expected dividends and risk-free interest rate.
(ii) The percentages include the grants of stock options and ADR’s during the period, in which the risk-free interest rate of ADR’s are calculated in U.S. dollar.
The total number of outstanding options developed as follows:
|
Thousand options |
2018 |
2017 |
2016 | ||
|
Options outstanding at January 1st |
135,221 |
131,244 |
121,770 | ||
|
Options issued during the period |
19,899 |
20,435 |
24,806 | ||
|
Options exercised during the period |
(9,988) |
(13,548) |
(11,613) | ||
|
Options forfeited during the period |
(3,804) |
(2,910) |
(3,719) | ||
|
Options outstanding at ended year |
141,328 |
135,221 |
131,244 |
The range of exercise prices of the outstanding options is between R$0.001 (R$0.001 as of December 31, 2017 and R$0.02 as of December 31, 2016) and R$27.43 (R$26.09 as of December 31, 2017 and R$28.32 as of December 31, 2016) and the weighted average remaining contractual life is approximately 6.27 years (6.40 years as of December 31, 2017 and 5.96 years as of December 31, 2016).
F - 76
Of the 141,328 thousand outstanding options (135,221 thousand as of December 31, 2017), 55,538 thousand options are vested as at December 31, 2018 (40,150 thousand as of December 31, 2017).
The weighted average exercise price of the options is as follows:
|
In R$ per share |
2018 |
2017 |
2016 | ||
|
Options outstanding at January 1 st |
15.27 |
13.87 |
12.36 | ||
|
Options issued during the period |
18.04 |
19.82 |
17.18 | ||
|
Options forfeited during the period |
18.55 |
17.88 |
12.83 | ||
|
Options exercised during the period |
7.47 |
5.81 |
2.52 | ||
|
Options outstanding at ended period |
16.16 |
15.27 |
13.87 | ||
|
Options exercisable at ended period |
2.25 |
3.78 |
3.66 |
For the options exercised during 2018, the weighted average share price on the exercise date was R$21.83 (R$18.87 as of December 31, 2017).
To settle the exercised stock options, the Company may use treasury shares. The current limit of authorized capital is considered sufficient to meet all stock option plans if the issue of new shares is required to meet the grants awarded in the Programs.
During the period, the Company granted 426 thousand (794 thousand on December 31, 2017) deferred stocks related to the exercise of stock options granted in the previous years. These deferred stocks are valued based on the share price of the trading session immediately prior to the stock option grant, representing a fair value of approximately R$7.5 on December 31, 2018 (R$15.2 on December 31, 2017). Such deferred stock units are subject to a grace period of five years counted from the options date of exercise.
During the period, the Company granted 13.055 thousand restricted shares under the Share-Based Plan, which are valued based on the share price of the trading session immediately prior to the grant of shares, representing a fair value of approximately R$239.1 on December 31, 2018. Such restricted shares units are subject to a grace period of five years counted from the date of grant.
F - 77
The total number of shares purchased or granted, as the case may be, under the Stock Option Plan and Share-Based Plan by employees, the delivery of which will be performed in the future under certain conditions (deferred stock and restricted shares), is demonstrated below:
|
Thousand deferred shares |
2018 |
2017 |
2016 | ||
|
Deferred shares outstanding at January 1st |
16,300 |
19,260 |
19,056 | ||
|
New deferred shares during the period |
426 |
794 |
7,329 | ||
|
Deferred shares granted during the period |
(3,429) |
(2,874) |
(6,118) | ||
|
Deferred shares forfeited during the period |
(989) |
(880) |
(1,007) | ||
|
Deferred shares outstanding at ended year |
12,308 |
16,300 |
19,260 |
|
Thousand deferred shares |
2018 |
2017 |
2016 | ||
|
Restricted shares outstanding at January 1st |
- |
- |
- | ||
|
New restricted shares during the period |
13,055 |
- |
- | ||
|
Restricted shares granted during the period |
(296) |
- |
- | ||
|
Restricted shares forfeited during the period |
(103) |
- |
- | ||
|
Restricted shares outstanding at ended year |
12,656 |
- |
- |
Additionally, certain employees and manager of the Company received options to acquire AB Inbev shares, the compensation cost of which is recognized in the income statement against equity.
The transactions with share-based payments described above generated an expense of R$162.7 in the year ended December 31, 2018 (R$236.9 and R$189.3 for the year ended December 31, 2017 and 2016, respectively), recorded as administrative expenses.
25. TRADE PAYABLES
|
2018 |
2017 | |
|
Trade payables |
126.1 |
175.1 |
|
Non-current |
126.1 |
175.1 |
|
|
||
|
Trade payables |
12,774.2 |
10,418.4 |
|
Related Parties |
1,275.8 |
1,435.6 |
|
Current |
14,050.0 |
11,854.0 |
|
|
||
|
Total |
14,176.1 |
12,029.1 |
F - 78
26. PROVISIONS
(a) Provision changes
|
Balance as of December 31, 2017 |
Effect of changes in foreign exchange rates |
Additions |
Provisions used and reversed |
Balance as of December 31, 2018 | |
|
Restructuring |
8.1 |
0.7 |
- |
- |
8.8 |
|
|
|
|
| ||
|
Provision for disputes and litigations |
|
|
|
| |
|
Taxes on sales |
226.3 |
0.9 |
170.8 |
(260.2) |
137.8 |
|
Income tax |
157.0 |
5.3 |
7.6 |
(0.6) |
169.3 |
|
Labor |
129.5 |
(18.4) |
165.0 |
(157.9) |
118.2 |
|
Civil |
35.2 |
(0.3) |
53.4 |
(33.4) |
54.9 |
|
Others |
125.5 |
(10.6) |
28.1 |
(32.8) |
110.2 |
|
Total of provision for disputes and litigations |
673.5 |
(23.1) |
424.9 |
(484.9) |
590.4 |
|
|
|
|
| ||
|
Total provisions |
681.6 |
(22.4) |
424.9 |
(484.9) |
599.2 |
(b) Disbursement expectative
|
Balance as of December 31, 2018 |
1 year or less |
1-2 years |
2-5 years |
Over 5 years | |
|
Restructuring |
8.8 |
7.9 |
- |
0.9 |
- |
|
|
|
|
|
| |
|
Provision for disputes and litigations |
|
|
|
|
|
|
Taxes on sales |
137.8 |
25.7 |
100.5 |
2.8 |
8.8 |
|
Income tax |
169.3 |
33.6 |
110.7 |
25.0 |
- |
|
Labor |
118.2 |
79.9 |
18.5 |
13.0 |
6.8 |
|
Civil |
54.9 |
17.3 |
32.0 |
3.3 |
2.3 |
|
Others |
110.2 |
8.6 |
26.2 |
72.5 |
2.9 |
|
Total of provision for disputes and litigations |
590.4 |
165.1 |
287.9 |
116.6 |
20.8 |
|
Total provisions |
599.2 |
173.0 |
287.9 |
117.5 |
20.8 |
The expected settlement of provisions was based on management’s best estimate at the balance sheet date.
(c) Main lawsuits with probable likelihood of loss:
(c.1) Income and Sales taxes
In Brazil, the Company and its subsidiaries are involved in several administrative and judicial proceedings related to Income tax, ICMS, IPI, PIS and COFINS taxes. Such proceedings include, among others, tax offsets, credits and judicial injunctions exempting tax payment.
F - 79
(c.2) Labor
The Company and its subsidiaries are involved in labor proceedings with former employees or former employees of service providers. The main issues involve overtime and related effects and respective charges.
(c.3) Civil
The Company is involved in civil lawsuits considered with probable likelihood of loss. The most relevant portion of these lawsuits refers to former distributors, mainly in Brazil, which are mostly claiming damages resulting from the termination of their contracts.
The processes with possible probabilities are disclosed in Note 30 - Contingent liabilities.
27. FINANCIAL INSTRUMENTS AND RISKS
Risk factors
The Company is exposed to foreign currency, interest rate, commodity price, liquidity and credit risk in the ordinary course of business. The Company analyzes each of these risks both individually and as a whole to define strategies to manage the economic impact on Company’s performance consistent with its Financial Risk Management Policy.
The Company’s use of derivatives strictly follows its Financial Risk Management Policy approved by the Board of Directors. The purpose of the policy is to provide guidelines for the management of financial risks inherent to the capital markets in which Ambev carries out its operations. The policy comprises four main aspects: (i) capital structure, financing and liquidity, (ii) transactional risks related to the business, (iii) financial statements translation risks and (iv) credit risks of financial counterparties.
The policy establishes that all the financial assets and liabilities in each country where Ambev operates must be denominated in their respective local currencies. The policy also sets forth the procedures and controls needed for identifying, measuring and minimizing market risks, such as variations in foreign exchange rates, interest rates and commodities (mainly aluminum, wheat, corn and sugar) that may affect Ambev’s revenues, costs and/or investment amounts. The policy states that all the known risks (e.g. foreign currency and interest) shall be hedged by contracting derivative financial instruments. Existing risks not yet recorded (e.g. future contracts for the purchase of raw material or property, plant and equipment) shall be mitigated using projections for the period necessary for the Company to adapt to the new costs scenario that may vary from ten to fourteen months, also through the use of derivative financial instruments. Most of the translation risks are not hedged. Any exception to the policy must be approved by the Board of Directors.
F - 80
Derivative financial Instruments
Derivative financial instruments authorized by the Financial Risk Management Policy are futures contracts traded on exchanges, Full deliverable forwards, Non-deliverable forwards, Swaps and Options. At December 31, 2018, the Company and its subsidiaries had no target forward, swaps with currency verification or any other derivative operations representing a risk level above the nominal value of their contracts. The derivative operations are managed on a consolidated basis and classified by strategies according to their purposes, as follows:
i) Cash flow hedge derivative instruments – The highly probable forecast transactions contracted in order to minimize the Company's exposure to fluctuations of exchange rates and prices of raw materials, investments, equipment and services to be procured, protected by cash flow hedges that shall occur at various different dates during the next fourteen months. Gains and losses classified as hedging reserve in equity are recognized in the income statement in the period or periods when the forecast and hedged transaction affects the income statement.
ii) Fair value hedge derivative instruments – operations contracted with the purpose of mitigating the Company’s net indebtedness against foreign exchange and interest rate risk. Cash net positions and foreign currency debts are continually assessed for identification of new exposures.
The results of these operations, measured according to their fair value, are recognized in financial results.
iii) Net investment hedge derivative instruments – transactions entered into in order to minimize exposure of the exchange differences arising from conversion of net investment in the Company's subsidiaries located abroad for translation account balance. The effective portion of the hedge is allocated to equity and the ineffectiveness portion is recorded directly in financial results.
The following tables summarize the exposure of the Company that were identified and protected in accordance with the Company's Risk Policy. The following denominations have been applied:
Operational Hedge: Refers to the exposures arising from the core business of Ambev, such as: purchase of inputs, purchase of fixed assets and service contracts linked to foreign currency, which is protected through the use of derivatives.
F - 81
Financial Hedge: Refers to the exposures arising from cash and financing activities, such as: foreign currency cash and foreign currency debt, which is protected through the use of derivatives.
Investment hedge abroad: Refers mainly to exposures arising from cash hold in foreign currency in foreign subsidiaries whose functional currency is different from the consolidation currency.
Investment hedge - Put option granted on subsidiary: As detailed in Note 21 (d.4) the Company constituted a liability related to acquisition of Non-controlling interest in the Dominican Republic operations. This financial instrument is denominated in Dominican Pesos and is recorded in a Company which functional currency is the Real. The Company assigned this financial instrument as a hedging instrument for part of its net assets located in the Dominican Republic, in such manner the hedge result can be recorded in other comprehensive income of the group, following the result of the hedged item.
F - 82
Transactions protected by derivative financial instruments in accordance with the Financial Risk Management Policy
|
|
|
|
|
|
|
2018 | ||||||
|
|
|
|
|
|
Fair Value |
Gain / (Losses) | ||||||
|
Exposure |
Risk |
|
Notional |
Assets |
Liability |
Finance Result |
Operational Result |
Equity | ||||
|
Cost |
(11,793.2) |
11,607.3 |
184.4 |
(394.2) |
(784.4) |
1,182.8 |
1,733.6 | |||||
|
Commodity |
(2,597.0) |
2,411.1 |
14.9 |
(270.6) |
(104.1) |
78.4 |
(160.0) | |||||
|
American Dollar |
(8,774.3) |
8,774.3 |
128.4 |
(119.9) |
(681.5) |
1,080.7 |
1,796.0 | |||||
|
Euro |
(152.4) |
152.4 |
2.2 |
(1.0) |
(3.0) |
4.6 |
2.8 | |||||
|
Mexican Pesos |
(269.5) |
269.5 |
38.9 |
(2.7) |
4.2 |
19.1 |
94.8 | |||||
|
Fixed Assets |
(890.0) |
890.0 |
23.7 |
(29.3) |
21.9 |
- |
- | |||||
|
American Dollar |
(890.0) |
890.0 |
23.7 |
(29.1) |
19.3 |
- |
- | |||||
|
Euro |
- |
- |
- |
(0.2) |
2.6 |
- |
- | |||||
|
Expenses |
(314.0) |
314.0 |
11.4 |
(14.2) |
(0.4) |
17.7 |
(0.6) | |||||
|
American Dollar |
(311.8) |
311.8 |
11.4 |
(14.2) |
(0.8) |
18.5 |
- | |||||
|
Rupee |
(2.2) |
2.2 |
- |
- |
0.4 |
(0.8) |
(0.6) | |||||
|
Cash |
(15.0) |
15.0 |
0.4 |
- |
(347.4) |
- |
- | |||||
|
American Dollar |
- |
- |
0.3 |
- |
(347.3) |
- |
- | |||||
|
Interest rate |
(15.0) |
15.0 |
0.1 |
- |
(0.1) |
- |
- | |||||
|
Debts |
(1,010.6) |
338.2 |
34.9 |
(1.1) |
89.6 |
- |
- | |||||
|
American Dollar |
(672.4) |
- |
- |
- |
73.2 |
- |
- | |||||
|
Interest rate |
(338.2) |
338.2 |
34.9 |
(1.1) |
16.4 |
- |
- | |||||
|
Equity Instrument |
(1,535.4) |
1,108.4 |
0.1 |
(243.0) |
(378.2) |
- |
- | |||||
|
Stock Exchange Prices |
(1,535.4) |
1,108.4 |
0.1 |
(243.0) |
(378.2) |
- |
- | |||||
|
Foreign Investments |
- |
- |
- |
- |
4.3 |
(57.0) |
7.4 | |||||
|
American Dollar |
- |
- |
- |
- |
4.3 |
(57.0) |
7.4 | |||||
|
As of December 31, 2018 |
(15,558.2) |
14,272.9 |
254.9 |
(681.8) |
(1,394.6) |
1,143.5 |
1,740.4 | |||||
F - 83
|
|
2017 | |||||||||||
|
|
Fair Value |
Gain / (Losses) | ||||||||||
|
Exposure |
Risk |
Notional |
Assets |
Liability |
Finance Result |
Operational Result |
Equity | |||||
|
Cost |
(9,742.3) |
9,318.9 |
283.6 |
(190.0) |
(563.5) |
(200.2) |
584.8 | |||||
|
Commodity |
(2,378.7) |
1,955.3 |
166.5 |
(70.7) |
(1.5) |
103.6 |
(4.8) | |||||
|
American Dollar |
(6,879.1) |
6,879.1 |
86.3 |
(93.4) |
(556.1) |
(331.5) |
630.2 | |||||
|
Euro |
(82.9) |
82.9 |
3.5 |
(0.7) |
(4.7) |
0.4 |
6.6 | |||||
|
Mexican Pesos |
(401.6) |
401.6 |
27.3 |
(25.2) |
(1.2) |
27.3 |
(47.2) | |||||
|
Fixed Assets |
(579.5) |
579.5 |
1.9 |
(10.8) |
(1.9) |
- |
- | |||||
|
American Dollar |
(531.9) |
531.9 |
1.8 |
(10.8) |
(2.8) |
- |
- | |||||
|
Euro |
(47.6) |
47.6 |
0.1 |
- |
0.9 |
- |
- | |||||
|
Expenses |
(177.7) |
177.7 |
0.5 |
(1.8) |
(2.9) |
3.9 |
1.8 | |||||
|
American Dollar |
(169.2) |
169.2 |
0.3 |
(1.6) |
(3.1) |
3.5 |
2.4 | |||||
|
Rupee |
(8.5) |
8.5 |
0.2 |
(0.2) |
0.2 |
0.4 |
(0.6) | |||||
|
Cash |
(1,328.3) |
1,328.3 |
- |
(13.1) |
(266.0) |
- |
- | |||||
|
American Dollar |
(1,313.3) |
1,313.3 |
- |
(13.1) |
(266.0) |
- |
- | |||||
|
Interest rate |
(15.0) |
15.0 |
- |
- |
- |
- |
- | |||||
|
Debts |
(919.5) |
356.9 |
30.0 |
(1.8) |
(67.5) |
- |
- | |||||
|
American Dollar |
(562.6) |
- |
- |
- |
(76.2) |
- |
- | |||||
|
Interest rate |
(356.9) |
356.9 |
30.0 |
(1.8) |
8.7 |
- |
- | |||||
|
Equity Instrument |
(2,347.9) |
677.0 |
69.2 |
- |
67.0 |
- |
- | |||||
|
Stock Exchange Prices |
(2,347.9) |
677.0 |
69.2 |
- |
67.0 |
- |
- | |||||
|
As of December 31, 2017 |
(15,095.2) |
12,438.3 |
385.2 |
(217.5) |
(834.8) |
(196.3) |
586.6 | |||||
F - 84
I. Market risk
a.1) Foreign currency risk
The Company is exposed to foreign currency risk on borrowings, investments, purchases, dividends and/or interest expense/income whenever they are denominated in a currency other than the functional currency of the subsidiary. The main derivatives financial instruments used to manage foreign currency risk are futures contracts, swaps, options, non deliverable forwards and full deliverable forwards.
a.2) Commodity Risk
A significant portion of the Company inputs comprises commodities, which historically have experienced substantial price fluctuations. The Company therefore uses both fixed price purchasing contracts and derivative financial instruments to minimize its exposure to commodity price volatility. The Company has important exposures to the following commodities: aluminum, sugar, wheat and corn. These derivative financial instruments have been designated as cash flow hedges.
a.3) Interest rate risk
The Company applies a dynamic interest rate hedging approach whereby the target mix between fixed and floating rate debt is reviewed periodically. The purpose of the Company’s policy is to achieve an optimal balance between cost of funding and volatility of financial results, taking into account market conditions as well as the Company’s overall business strategy and this strategy is reviewed periodically.
The table below demonstrates the Company’s exposure related to debts, before and after interest rates hedging strategy.
|
2018 | |||||
|
Pre - Hedge |
|
Post - Hedge | |||
|
Interest rate |
Amount |
Interest rate |
Amount | ||
|
Brazilian Real |
9.1% |
237.6 |
|
6.8% |
516.0 |
|
American Dollar |
3.6% |
630.0 |
|
3.6% |
630.0 |
|
Canadian Dollar |
2.4% |
753.2 |
|
2.4% |
753.2 |
|
Interest rate post fixed |
|
1,620.8 |
|
|
1,899.2 |
|
|
|
|
|
| |
|
|
|
|
|
| |
|
Brazilian Real |
6.7% |
536.0 |
|
5.8% |
257.6 |
|
Dominican Peso |
9.4% |
212.1 |
|
9.4% |
212.1 |
|
American Dollar |
4.4% |
42.4 |
|
4.4% |
42.4 |
|
Guatemala´s Quetzal |
7.8% |
11.4 |
|
7.8% |
11.4 |
|
Interest rate pre-set |
|
801.9 |
|
|
523.5 |
F - 85
|
2017 | |||||
|
Pre - Hedge |
|
Post - Hedge | |||
|
Interest rate |
Amount |
Interest rate |
Amount | ||
|
Brazilian Real |
9.2% |
402.3 |
7.6% |
714.1 | |
|
American Dollar |
2.7% |
555.3 |
2.7% |
555.2 | |
|
Canadian Dollar |
2.0% |
685.9 |
2.0% |
685.9 | |
|
Barbadian Dollar |
2.3% |
5.0 |
2.3% |
5.0 | |
|
Interest rate post fixed |
1,648.5 |
1,960.2 | |||
|
Brazilian Real |
6.4% |
682.5 |
5.9% |
370.8 | |
|
Working Capital in Argentinean Peso |
31.0% |
1.8 |
31.0% |
1.8 | |
|
Dominican Peso |
9.3% |
188.8 |
9.3% |
188.8 | |
|
American Dollar |
3.8% |
22.9 |
3.8% |
22.9 | |
|
Guatemala´s Quetzal |
7.8% |
10.3 |
7.8% |
10.3 | |
|
Interest rate pre-set |
906.3 |
594.6 | |||
Sensitivity analysis
The Company mitigates risks arising from non-derivative financial assets and liabilities substantially, through derivative financial instruments. In this context, the Company has identified the main risk factors that may generate losses from these derivative financial instruments and has developed a sensitivity analysis based on three scenarios, which may impact the Company’s future results and/or cash flow, as described below:
1 – Probable scenario: Management expectations of deterioration in each transaction’s main risk factor. To measure the possible effects on the results of derivative transactions, the Company uses parametric Value at Risk – VaR. is a statistical measure developed through estimates of standard deviation and correlation between the returns of several risk factors. This model results in the loss limit expected for an asset over a certain time period and confidence interval. Under this methodology, we used the potential exposure of each financial instrument, a range of 95% and horizon of 21 days after December 31, 2018 for the calculation, which are presented in the module.
2 – Adverse scenario: 25% deterioration in each transaction’s main risk factor as compared to the level observed on December 31, 2018.
3 – Remote scenario: 50% deterioration in each transaction’s main risk factor as compared to the level observed on December 31, 2018.
F - 86
|
Transaction |
Risk |
Fair value |
Probable scenario |
Adverse scenario |
Remote |
|
Commodities hedge |
Decrease on commodities price |
(255.7) |
(335.1) |
(858.5) |
(1,461.2) |
|
Input purchase |
255.7 |
341.3 |
905.0 |
1,554.2 | |
|
Foreign exchange hedge |
Foreign currency decrease |
45.9 |
(125.0) |
(2,253.0) |
(4,552.1) |
|
Input purchase |
(45.9) |
125.0 |
2,253.0 |
4,552.1 | |
|
Costs effects |
- |
6.2 |
46.5 |
93.0 | |
|
Foreign exchange hedge |
Foreign currency decrease |
(5.6) |
(29.7) |
(228.1) |
(450.6) |
|
Capex Purchase |
5.6 |
29.7 |
228.1 |
450.6 | |
|
Fixed assets effects |
- |
- |
- |
- | |
|
Foreign exchange hedge |
Foreign currency decrease |
(2.8) |
(10.1) |
(81.2) |
(159.7) |
|
Expenses |
2.8 |
10.1 |
81.2 |
159.7 | |
|
Expenses effects |
- |
- |
- |
- | |
|
Foreign exchange hedge |
Foreign currency increase |
0.3 |
0.3 |
0.3 |
0.3 |
|
Cash |
(0.3) |
(0.3) |
(0.3) |
(0.3) | |
|
Interest Hedge |
Decrease in interest rate |
0.1 |
- |
(1.1) |
(1.3) |
|
Interest revenue |
(0.1) |
- |
1.1 |
1.3 | |
|
Cash effects |
- |
- |
- |
- | |
|
Cash |
Foreign currency decrease |
- |
12.8 |
168.1 |
336.2 |
|
Interest Hedge |
Increase in interest rate |
33.8 |
31.5 |
(92.6) |
(109.1) |
|
Interest expenses |
(33.8) |
(31.5) |
92.6 |
109.1 | |
|
Debt effects |
- |
12.8 |
168.1 |
336.2 | |
|
Equity Instrument Hedge |
Stock Exchange Price decrease |
(242.9) |
(273.7) |
(520.0) |
(797.1) |
|
Expenses |
242.9 |
285.1 |
626.7 |
1,010.6 | |
|
Equity effects |
- |
11.4 |
106.7 |
213.5 | |
|
- |
30.4 |
321.3 |
642.7 |
F - 87
As of December 31, 2018 the Notional and Fair Value amounts per instrument and maturity were as follows:
|
|
|
Notional Value | |||||
|
Exposure |
Risk |
2019 |
2020 |
2021 |
2022 |
>2022 |
Total |
|
Cost |
11,563.1 |
44.2 |
- |
- |
- |
11,607.3 | |
|
Commodity |
2,366.9 |
44.2 |
- |
- |
- |
2,411.1 | |
|
American Dollar |
8,774.3 |
- |
- |
- |
- |
8,774.3 | |
|
Euro |
152.4 |
- |
- |
- |
- |
152.4 | |
|
Mexican Peso |
269.5 |
- |
- |
- |
- |
269.5 | |
|
Fixed asset |
890.0 |
- |
- |
- |
- |
890.0 | |
|
American Dollar |
890.0 |
- |
- |
- |
- |
890.0 | |
|
Expenses |
314.0 |
- |
- |
- |
- |
314.0 | |
|
American Dollar |
311.8 |
- |
- |
- |
- |
311.8 | |
|
Rupee |
2.2 |
- |
- |
- |
- |
2.2 | |
|
Cash |
15.0 |
- |
- |
- |
- |
15.0 | |
|
Interest rate |
15.0 |
- |
- |
- |
- |
15.0 | |
|
Debt |
- |
- |
110.0 |
- |
228.2 |
338.2 | |
|
Interest rate |
- |
- |
110.0 |
- |
228.2 |
338.2 | |
|
Equity Instrument |
1,108.4 |
- |
- |
- |
- |
1,108.4 | |
|
Stock prices |
1,108.4 |
- |
- |
- |
- |
1,108.4 | |
|
13,890.5 |
44.2 |
110.0 |
- |
228.2 |
14,272.9 | ||
|
|
|
Fair Value | |||||
|
Exposure |
Risk |
2019 |
2020 |
2021 |
2022 |
>2022 |
Total |
|
Cost |
(208.4) |
(1.4) |
- |
- |
- |
(209.8) | |
|
Commodity |
(254.3) |
(1.4) |
- |
- |
- |
(255.7) | |
|
American Dollar |
8.5 |
- |
- |
- |
- |
8.5 | |
|
Euro |
1.2 |
- |
- |
- |
- |
1.2 | |
|
Mexican Peso |
36.2 |
- |
- |
- |
- |
36.2 | |
|
Fixed asset |
(5.6) |
- |
- |
- |
- |
(5.6) | |
|
American Dollar |
(5.4) |
- |
- |
- |
- |
(5.4) | |
|
Euro |
(0.2) |
- |
- |
- |
- |
(0.2) | |
|
Expenses |
(2.8) |
- |
- |
- |
- |
(2.8) | |
|
American Dollar |
(2.8) |
- |
- |
- |
- |
(2.8) | |
|
Cash |
0.4 |
- |
- |
- |
- |
0.4 | |
|
American Dollar |
0.3 |
- |
- |
- |
- |
0.3 | |
|
Interest rate |
0.1 |
- |
- |
- |
- |
0.1 | |
|
Debt |
- |
- |
20.4 |
- |
13.4 |
33.8 | |
|
Interest rate |
- |
- |
20.4 |
- |
13.4 |
33.8 | |
|
Equity Instrument |
(242.9) |
- |
- |
- |
- |
(242.9) | |
|
Stock prices |
(242.9) |
- |
- |
- |
- |
(242.9) | |
|
(459.3) |
(1.4) |
20.4 |
- |
13.4 |
(426.9) | ||
F - 88
II. Credit Risk
Concentration of credit risk on trade receivables
A substantial part of the Company’s sales is made to distributors, supermarkets and retailers, within a broad distribution network. Credit risk is reduced because of the widespread number of customers and control procedures used to monitor risk. Historically, the Company has not experienced significant losses on receivables from customers.
Concentration of credit risk on counterpart
In order to minimize the credit risk of its investments, the Company has adopted procedures for the allocation of cash and investments, taking into consideration limits and credit analysis of financial institutions, avoiding credit concentration, i.e., the credit risk is monitored and minimized to the extent that negotiations are carried out only with a select group of highly rated counterparties.
The selection process of financial institutions authorized to operate as the Company’s counterparty is set forth in our Credit Risk Policy. This Credit Risk Policy establishes maximum limits of exposure to each counterparty based on the risk rating and on each counterparty's capitalization.
In order to minimize the risk of credit with its counterparties on significant derivative transactions, the Company has adopted bilateral “trigger” clauses. According to these clauses, where the fair value of an operation exceeds a percentage of its notional value (generally between 10% and 15%), the debtor settles the difference in favor of the creditor.
As of December 31, 2018, the Company held its main short-term investments with the following financial institutions: Banco do Brasil, Bradesco, Bank Mendes Gans, Caixa Econômica Federal, Citibank, Itaú, JP Morgan Chase, Merrill Lynch, Santander e Toronto Dominion Bank. The Company had derivative agreements with the following financial institutions: Banco Bisa, Barclays, BNB, BNP Paribas, Bradesco, Citibank, Deutsche Bank, Itaú, Goldman Sachs, JP Morgan Chase, Macquarie, Merrill Lynch, Morgan Stanley, Santander, ScotiaBank e TD Securities.
The carrying amount of cash and cash equivalents, investment securities, trade receivables excluding prepaid expenses, recoverable taxes and derivative financial instruments are disclosed net of provisions for impairment and represents the maximum exposure of credit risk as of December 31, 2018. There was no concentration of credit risk with any counterparties as of December 31, 2018.
F - 89
III. Liquidity Risk
The Company believes that cash flows from operating activities, cash and cash equivalents and short-term investments, together with the derivative financial instruments and access to loan facilities are sufficient to finance capital expenditures, financial liabilities and dividend payments in the future.
IV. Equity price risk
Through the equity swap transaction approved on May 16th, 2017, December 21,2017, May 15th, 2018 and December 20th, 2018 by the Board of Directors of Ambev (see Note 1 - Corporate information), the Company, or its controlled entity, will receive the price variation related to its shares traded on the stock exchange or ADRs, neutralizing the possible effects of the stock prices’ oscillation in view of the share-based payment of the Company. As these derivative instruments are not characterized as hedge accounting they were not therefore designated to any hedge.
In December 2018, an exposure equivalent to R$1.5 billion in AmBev’s shares (or ADR’s) was partially hedged, resulting in a loss in income statement of R$378.2.
V. Capital management
Ambev is continuously optimizing its capital structure targeting to maximize shareholder value while keeping the desired financial flexibility to execute the strategic projects. Besides the statutory minimum equity funding requirements that apply to the Company’s subsidiaries in the different countries, Ambev is not subject to any externally imposed capital requirements. When analyzing its capital structure, the Company uses the same debt ratings and capital classifications as applied in the Company’s financial statements.
Financial instruments
(a) Financial instruments categories
Management of the financial instruments held by the Company is effected through operational strategies and internal controls to assure liquidity, profitability and transaction security. Financial instruments transactions are regularly reviewed for the effectiveness of the risk exposure that management intends to cover (foreign exchange, interest rate, etc.).
F - 90
The table below shows all financial instruments recognized in the financial statements, segregated by category:
|
|
2018 | |||
|
Fair value through other comprehensive income |
Amortized cost |
Fair value through profit or loss |
Total | |
|
Financial assets |
||||
|
Cash and cash equivalents |
3,778.4 |
7,685.1 |
- |
11,463.5 |
|
Trade receivables excluding prepaid expenses |
- |
6,874.3 |
- |
6,874.3 |
|
Investment securities |
- |
147.3 |
13.4 |
160.7 |
|
Financial instruments derivatives |
- |
- |
34.1 |
34.1 |
|
Derivatives hedge |
- |
- |
220.8 |
220.8 |
|
Total |
3,778.4 |
14,706.7 |
268.3 |
18,753.4 |
|
Financial liabilities |
||||
|
Trade payables and put option granted on subsidiary and other liabilities |
- |
15,535.0 |
2,669.5 |
18,204.5 |
|
Financial instruments derivatives |
- |
- |
243.4 |
243.4 |
|
Derivatives hedge |
- |
- |
438.4 |
438.4 |
|
Interest-bearning loans and borrowings |
- |
2,422.7 |
- |
2,422.7 |
|
Total |
- |
17,957.7 |
3,351.3 |
21,309.0 |
|
2017 | ||||
|
Fair value through other comprehensive income |
Amortized cost |
Fair value through profit or loss |
Total | |
|
Financial assets |
||||
|
Cash and cash equivalents |
3,081.7 |
7,272.8 |
- |
10,354.5 |
|
Trade receivables excluding prepaid expenses |
- |
7,505.0 |
- |
7,505.0 |
|
Investment securities |
- |
122.0 |
11.9 |
133.9 |
|
Financial instruments derivatives |
- |
- |
100.1 |
100.1 |
|
Derivatives hedge |
- |
- |
285.1 |
285.1 |
|
Total |
3,081.7 |
14,899.8 |
397.1 |
18,378.6 |
|
Financial liabilities |
||||
|
Trade payables and put option granted on subsidiary and other liabilities |
- |
13,502.0 |
5,764.1 |
19,266.1 |
|
Financial instruments derivatives |
- |
- |
16.1 |
16.1 |
|
Derivatives hedge |
- |
- |
201.4 |
201.4 |
|
Interest-bearning loans and borrowings |
- |
2,553.0 |
- |
2,553.0 |
|
Total |
- |
16,055.0 |
5,981.6 |
22,036.6 |
(b) Classification of financial instruments by type of fair value measurement
IFRS 13 defines fair value as the price that would be received to sell an asset or paid to transfer a liability in an orderly transaction between market participants at the measurement date.
Also pursuant to IFRS 13, financial instruments measured at fair value shall be classified within the following categories:
F - 91
Level 1 – quoted prices (unadjusted) in active markets for identical assets or liabilities that the entity can access at the measurement date valuation;
Level 2 – inputs other than quoted prices included within Level 1 that are observable for the asset or liability, either directly or indirectly; and
Level 3 – unobservable inputs for the asset or liability.
|
2018 |
2017 | ||||||||
|
Level 1 |
Level 2 |
Level 3 |
Total |
Level 1 |
Level 2 |
Level 3 |
Total | ||
|
Financial assets |
|||||||||
|
Financial asset at fair value through other comprehensive income |
3,778.4 |
- |
- |
3,778.4 |
|
3,081.8 |
- |
- |
3,081.8 |
|
Financial asset at fair value through profit or loss |
13.4 |
- |
- |
13.4 |
11.9 |
- |
- |
11.9 | |
|
Derivatives assets at fair value through profit or loss |
0.1 |
34.0 |
- |
34.1 |
0.1 |
100.0 |
- |
100.1 | |
|
Derivatives - operational hedge |
1.6 |
219.2 |
- |
220.8 |
4.8 |
280.3 |
- |
285.1 | |
|
3,793.5 |
253.2 |
- |
4,046.7 |
3,098.6 |
380.3 |
- |
3,478.9 | ||
|
Financial liabilities |
|
|
|
|
|||||
|
Financial liabilities at fair value through profit and loss (i) |
- |
- |
2,669.5 |
2,669.5 |
- |
- |
5,764.1 |
5,764.1 | |
|
Derivatives liabilities at fair value through profit or loss |
0.5 |
242.9 |
- |
243.4 |
1.7 |
14.4 |
- |
16.1 | |
|
Derivatives - operational hedge |
36.6 |
401.8 |
- |
438.4 |
58.4 |
143.0 |
- |
201.4 | |
|
37.1 |
644.7 |
2,669.5 |
3,351.3 |
60.1 |
157.4 |
5,764.1 |
5,981.6 | ||
(i) Refers to the put option granted on subsidiary as described in Note 21 d(4).
Reconciliation of changes in the categorization of Level 3
|
Financial liabilities at December 31, 2017 |
5,764.1 |
|
Acquisition of investments |
(3,568.7) |
|
Total gains and losses in the year |
474.1 |
|
Losses/(gains) recognized in net income |
340.1 |
|
Losses/(gains) recognized in equity |
134.0 |
|
Financial liabilities at December 31, 2018 (i) |
2,669.5 |
(i) The liability was recorded under “Trade payables and put option granted on subsidiary and other liabilities” on the balance sheet.
(c) Fair value of financial liabilities measured at amortized cost
The Company’s liabilities, interest-bearing loans and borrowings, trade payables excluding tax payables, are recorded at amortized cost according to the effective rate method, plus indexation and foreign exchange gains/losses, based on closing indices for each exercise.
The financial instruments recorded at amortized cost are similar to the fair value and are not material for disclosure.
F - 92
Calculation of fair value of derivatives
The Company measures derivative financial instruments by calculating their present value, through the use of market curves that impact the instrument on the computation dates. In the case of swaps, both the asset and the liability positions are estimated independently and brought to present value, where the difference between the result of the asset and liability amount generates the swaps market value. For the traded derivative financial instruments, the fair value is calculated according to the adjusted exchange-listed price.
Margins given in guarantee
In order to comply with the guarantee requirements of the derivative exchanges and/or counterparties in certain operations with derivative financial instruments, as of December 31, 2018 the Company held R$653.8 in highly liquid financial investments or in cash, classified as cash and cash equivalents and investment securities (R$606.3 on December 31, 2017).
Offsetting of financial assets and liabilities
For financial assets and liabilities subject to settlement agreements by the net or similar agreements, each agreement between the Company and the counterparty allows this type of settlement when both parties make this option. In the absence of such election, the assets and liabilities will be settled by their amounts, but each party shall have the option to settle on net, in case of default by the counterparty.
28. OPERATING LEASES
The Company primarily leases vehicles, warehouses, commercial rooms and industrial equipments.
The future disbursement schedule, already discounted to present value, is presented below, by maturity:
|
2018 |
2017 | |
|
|
|
|
|
Less than 1 year |
404.0 |
432.6 |
|
Between 1 and 5 years |
941.3 |
1.085.1 |
|
More than 5 years |
324.9 |
458.1 |
|
1,670.2 |
1,975.8 |
In 2018, the operating lease expense in the income statement amounted to R$586.8 (R$600.7 and R$483.1 in 2017 and 2016, respectively).
F - 93
On December 31, 2018, the Company reviewed the information included in this Note and identified the existence of contracts that contain operating lease commitments, substantially related to the arrangements in which the Company has control over the right-of-use asset. Accordingly, the information previously disclosed for the year ended December 31, 2017 was reviewed in accordance with the Company's assessment.
29. COLLATERAL AND CONTRACTUAL COMMITMENTS WITH SUPLLIERS, ADVANCES FROM CUSTOMERS AND OTHER
|
2018 |
2017 | |
|
Collateral given for own liabilities |
653.8 |
606.3 |
|
Other commitments |
1,338.9 |
842.7 |
|
1,992.7 |
1,449.0 | |
|
|
||
|
Commitments with suppliers |
12,078.6 |
11,096.3 |
|
12,078.6 |
11,096.3 |
The collateral provided for liabilities totaled approximately R$1,992.7 as at December 31, 2018 (R$1,449.0 as at December 31, 2017), including R$574.7 (R$551.0 as at December 31, 2017) of cash guarantees. The deposits in cash used as guarantees are presented as part of other assets. To meet the guarantees required by derivative exchanges and/or counterparties contracted in certain derivative financial instrument transactions, Ambev maintained as at December 31, 2018, R$653.8 (R$606.3 as at December 31, 2017) in highly liquid financial investments or in cash, classified as cash and cash equivalents and investment securities (Note 27 – Financial instruments and risks).
Most of the balance relates to commitments with suppliers of packaging.
Future contractual commitments as at December 31, 2018 and 2017 are as follows:
|
2018 |
2017 | |
|
Less than 1 year |
4,827.0 |
3,812.8 |
|
Between 1 and 2 years |
2,932.4 |
2,995.7 |
|
More than 2 years |
4,319.2 |
4,287.8 |
|
12,078.6 |
11,096.3 |
30. CONTINGENT LIABILITIES
The Company has contingent liabilities related to lawsuits arising from its normal course of business. Due to their nature, such legal proceedings involve certain uncertainties including, but not limited to, court and tribunals rulings, negotiations between affected parties and governmental actions, and as a consequence the Company’s management cannot estimate the likely timing of resolution of these matters at this stage.
F - 94
Contingent liabilities probable are fully recorded as liabilities (Note 26 – Provisions).
Additionally, the Company has lawsuits related to tax, civil and labor for which the likelihood of loss is classified as possible by management, and for which there are no provisions, as the composition and estimates of amounts as follows:
|
2018 |
2017 | |
|
Income tax and social contribution |
37,867.4 |
31,757.3 |
|
Value-added and excise taxes |
23,891.4 |
19,805.5 |
|
PIS and COFINS |
4,386.3 |
3,485.2 |
|
Labor |
353.4 |
287.1 |
|
Civil |
4,385.7 |
4,071.5 |
|
Others |
1,171.3 |
1,113.4 |
|
72,055.5 |
60,520.0 |
Principal lawsuits with a likelihood of possible loss:
Brazilian Federal Taxes
Goodwill InBev Holding
In December 2011, the Company received a tax assessment related to the goodwill amortization resulting from the InBev Holding Brasil S.A. merger with Ambev. The decision of the Lower Administrative Court (“CARF”) was partially favorable to Ambev. Therefore, Ambev filed a judicial proceeding to discuss the unfavorable part and requested a motion of injunction, which was granted to the company. The favorable portion to Ambev will be reexamined by the Administrative Upper House.
,
In June 2016, Ambev received a new tax assessment charging the remaining value of the goodwill amortization and filed a defense. In March 2017, Ambev was notified of the partially favorable first level administrative decision on this tax assessment and filed an appeal to CARF. In May 2018, Ambev received a partial favorable decision at the Lower Administrative Court and is currently awaiting to be notified of the decision to analyze the applicable appeals.
Ambev management estimates possible losses in December 2018 to be approximately R$9.3 billion (R$8.3 billion as of 31 December 2017), classified as possible loss, and, therefore, no provision was made in this matter. In the event Ambev is required to pay these amounts, AB Inbev will reimburse Ambev the amount proportional (70%) to the benefit received by the company pursuant to the merger protocol, as well as the related costs.
F - 95
Goodwill BAH
In October 2013, Ambev received a tax assessment related to the goodwill amortization resulting from the merger of Beverage Associates Holding Limited (“BAH”) into Ambev. The decision from the first level administrative Court was unfavorable to Ambev. After analysis of a motion to clarify presented by the Company, the unfavorable decision was confirmed and Ambev filed an appeal to the Lower Administrative Court. In November 2018, the Company received a partial favorable decision at the Lower Administrative Court and is currently waiting to be notified of the decision to analyze the applicable appeals.
In April and August 2018, Ambev received new tax assessments charging the remaining value of the goodwill amortization and filed defenses, which are currently pending analysis by the first administrative level.
At December, 2018 the possible risk amount is approximately R$2.1 billion (R$ 1.6 billion as of December 31, 2017). There was no provision made on the matter.
Goodwill CND Holdings
In November 2017, Ambev received a tax assessment related to the amortized goodwill related to the merger of CND Holdings into Ambev. Ambev filed a defense. In November 2018, Ambev received an unfavorable decision from the first administrative level and filed an appeal to the Lower Administrative Court, which is currently pending analysis.
The possible risk amount is approximately R$ 1.1 billion (R$ 1.1 billion as of December 31, 2017). There was no provision made on the matter.
Profits earned abroad
During 2005, the Company and certain of its subsidiaries received assessments from the Brazilian Federal Tax Authorities relating to profits of its foreign subsidiaries. In December 2008, the Administrative Court rendered a partially favorable decision in one of the tax assessments, and in connection with the remaining part, the Company filed an appeal to the Upper House of the Administrative Court, which was denied in full in March 2017. In September 2017, Ambev filed a judicial proceeding for this tax assessment and requested a motion of injunction, which was granted to the Company.
In 2013, 2016, 2017 and 2018, Ambev received new tax assessments related to profits of its foreign subsidiaries.
F - 96
In July and September 2018, the Upper House of the Administrative Court rendered unfavorable decisions to Ambev in two of the tax assessments. Regarding one of the cases, the Company filed a judicial proceeding and requested a motion of injunction, which was granted to the company. As to the other case, the Company is analyzing the applicable appeals.
In October 2018, the Lower Administrative Court rendered a partial favorable decision in one tax assessment. The Company is waiting to be notified of such decision in order to analyze applicable appeals. In addition, the Administrative Upper House rendered a partially favorable decision to Ambev in one of the assessments, and, with respect to another case, rendered an unfavorable decision to the company, by casting vote. Currently, Ambev is waiting to be notified of such decisions to analyze the applicable appeals.
In December, 2018 Ambev management estimates the exposure of approximately R$ 7.7 billion (R$6.1 billion at December 31, 2017) as possible losses and R$ 45.8 million as probable losses (R$44.2 million at December 31, 2017).
Utilization of tax loss on mergers
The Company and certain of its subsidiaries received tax assessments from the Brazilian Tax authorities relating to the offset of tax losses carry forward arising in the context of business combinations.
In February 2016 the Upper Administrative Court ruled unfavorably to Ambev in two cases. Ambev filed judicial proceedings to discuss the matter. In September 2016, Ambev received a favorable first level decision in one of the judicial claims. In March 2017, Ambev received an unfavorable first level decision in another case and filed an appeal to the judicial Court. Both cases are awaiting analysis by the judicial Court.
No provisions have been made for these cases as Ambev believes that there are no express legal grounds that limit the use of tax losses in cases where legal entities are extinguished (including in the case of mergers), and therefore the tax inspector’s interpretation in these tax assessments does not apply.
The Company estimates the possible exposure to losses on these assessments at approximately R$533.3 million (R$549.4 million at December 31, 2017).
Disallowance of Expenses and Deductible Losses
In 2015 and 2016, the Company received two tax assessment from the Brazilian Federal Tax Authorities related to the disallowance of alleged non-deductible expenses and the deduction of certain losses mainly associated to financial investments and loans. The Company is waiting for judgment in the first administrative level.
F - 97
The Company estimates that the possible loss exposure of this lawsuit on December 31, 2018 is approximately R$4.6 billion (R$4.4 billion as of December 31, 2017).
Disallowance of taxes paid abroad
Since 2014, Ambev has been receiving tax assessments from the Brazilian Federal Tax Authorities related to the disallowance of deductions associated with alleged unproven taxes paid abroad. In September, 2017, Ambev decided to include part of those tax assessments in the Brazilian Federal Tax Regularization Program of the Provisional Measure nº 783. In June 2018, the Company was notified of a favorable first administrative level decision cancelling four of these assessments (offsets of 2015 and 2016). In August and September 2018, the Brazilian Federal Revenue Service issued new decisions reestablishing these assessments and issued new tax assessments related to the matter.
As of 31 December 2018, Ambev management estimates the exposure of approximately R$9.5 billion (R$7.2 billion as of December 31, 2017) as possible loss.
Presumed Profit
In April 2016, Arosuco (subsidiary of Ambev) received a tax assessment regarding the use of the “Presumed Profit” Method for the calculation of income tax and the social contribution on net profit method instead of Real Profit method. In September, 2017, Arosuco was notified of the unfavorable first level administrative decision and filed Voluntary Appeal. According to Note 36 – Subsequent Events, in January 2019, the case was judged by the Lower Administrative Court, which ruled favorably to the Company by majority of votes. The Company is waiting to be notified of such decision to analyze the applicable appeals. Arosuco management estimates the amount of possible losses in relation to this assessment in December 31, 2018 to be approximately R$645.1 million (R$616.1 billion as of December 31, 2017).
PIS and COFINS
PIS/COFINS over bonus products
Since 2015, Ambev has been receiving tax assessments issued by the Brazilian federal tax authorities, relating to amounts allegedly due under Integration Programme/Social Security Financing Levy (PIS/COFINS) over bonus products granted to its customers. These cases are now being discussed at the relevant judicial and administrative Courts. According to Note 36 - Subsequent Events, in January 2019, three cases were judged by the Lower Administrative Court, which ruled favorably to the Company by majority of votes in all three cases. Ambev is waiting to be notified of such decisions to analyze the applicable appeals. Ambev management estimates the possible losses related to these assessments to be approximately R$4.0 billion (R$3.1 billion as of 31 December 2017).
F - 98
ICMS and IPI
ICMS-ST Unconditional Discounts
In 2013, 2014 and 2015, Ambev was assessed by the States of Pará and Piauí to charge the ICMS supposedly due with respect to unconditional discounts granted by Ambev The cases are being challenged at both the administrative and judicial levels of the Courts. Ambev management estimates the amount involved in these proceedings to be approximately R$623.2 million (R$599.7 million as of 31 December 2017), classified as possible loss.
ICMS tax war
Ambev, over the years, received tax assessments from the States of São Paulo, Rio de Janeiro, Minas Gerais and other States, regarding the legality of ICMS tax credits arising from transactions with companies that have tax incentives. The cases are being challenged at both the administrative and judicial levels of the Courts. Ambev management estimates the possible losses approximately R$2.1 billion (R$1.9 billion as of December 31, 2017) classified as possible loss.
ICMS-ST Trigger
Over the years, the Company received tax assessments relating to supposed ICMS differences considered due in the tax substitution system when the price of the products sold reaches levels close to or above the fixed price table basis established by certain States, in cases where tax authorities understand that the calculation basis should be based on a value-added percentage over the actual prices and not the fixed table price. The Company is challenging these assessments at administrative and judicial courts.
Among other similar cases, in 2016, the Company received three assessments issued by the State of Minas Gerais, in the original amount of R$1.4 billion. In the first quarter of 2018 these cases had unfavorable final administrative decision. The State of Minas Gerais filed tax foreclosures to charge values discussed in these three cases and the Company filed defenses in the judicial courts. In 2018, Ambev received tax assessments from the State of Rio de Janeiro in the original amount of R$0.9 billion related to this same issue. The Company presented defenses against such tax assessments and awaits judgment by the relevant administrative courts.
F - 99
Ambev management estimates the total possible loss related to this issue, in December 2018, to be approximately R$7.7 billion (R$5.8 billion as of 31 December 2017). Ambev has recorded provisions in the total amount of R$7.8 million in relation to the proceedings for which it considers the chances of loss to be probable considering specific procedural issues.
ICMS – PRODEPE
In 2015, Ambev received a tax assessment issued by the State of Pernambuco to charge ICMS differences due to the alleged non-compliance with the State tax incentive Agreement “PRODEPE” as a result of the rectification of its monthly reports. The State tax authorities understood that Ambev was not able to use the incentive due to this rectification. In 2017, Ambev had a final favorable decision in the sense that such assessment was null due to formal mistakes of the tax auditor. However, in December 2018, Ambev received a new tax assessment to discuss the same matter. There are other assessments related to this same tax incentive agreement.
Ambev estimates the possible losses related to this issue is approximately R$603.5 million Brazilian real (R$146 million as of 31 December 2017). Ambev has recorded a provisions in the total amount of R$2.9 million in relation to one of the proceedings for which it considers the chances of loss to be probable.
Manaus Free Trade Zone – IPI
Goods manufactured within the Manaus Free Trade Zone – ZFM intended for remittance elsewhere in Brazil are exempt from the IPI Excise Tax. We have been registering IPI Excise Tax presumed credits upon the acquisition of exempted inputs manufactured in the Manaus Free Trade Zone. Since 2009 we have been receiving a number of tax assessments from the RFB relating to the disallowance of such presumed IPI excise tax credits, which are under discussion before the Brazilian Supreme Court (trial expected to April 2019). Ambev management estimates the possible loss in relation to these assessments to be R$3.8 billion (R$3.2 billion as of December 31, 2017).
In addition, over the years, the Company also received tax assessments from the Brazilian Federal Tax Authorities charging federal taxes considered unduly offset with the disallowed IPI excise tax credits which are under discussion in the abovementioned proceedings. Ambev is challenging these charges at Courts. Ambev management estimates the possible losses related to these assessments to be approximately R$1.1 billion (R$900 million as of 31 December 2017).
F - 100
IPI Suspension
In 2014 and 2015, Ambev received tax assessments from the RFB relating to IPI excise tax allegedly due over remittances of manufactured goods to other related factories. The cases are being challenged at both administrative and judicial levels. Ambev estimates that the amount involved, in December 2018, is approximately R$1.6 billion (R$1.5 billion in December 2017), classified as a possible loss.
Civil
Lawsuit against Brewers Retail Inc.
On 12 December 2014, claimants in Canada brought a lawsuit against the Liquor Control Board of Ontario (“LCBO”), Brewers Retail Inc. (“The Beer Store”) and the owners of The Beer Store (Molson Coors Canada, Sleeman Breweries Ltd. and Labatt Breweries of Canada LP). The lawsuit, brought pursuant to the Ontario Class Proceedings Act in the Ontario Superior Court of Justice, seeks a declaration that LCBO and The Beer Store agreed with each to allocate sales, territories, customers or markets for the supply of beer sold in Ontario since June 1, 2000, and a declaration that the owners of The Beer Store agreed to fix. The claimants are seeking damages not exceeding R$3.6 billion (R$3,7 billion as of December 31, 2017), for all mentioned parts. Considering that The Beer Store operates according to the rules established by the Government of Ontario and that prices at The Beer Store are independently set by each brewer, the Company believes that there are strong defenses and, accordingly, has not recorded any provision in connection therewith.
Contingent assets
In accordance with IAS 37 - Provisions, Contingent Liabilities and Contingent Assets, the contingent assets not be recognized in consolidated financial statements, except when realization of income is virtually certain.
The Company and its subsidiaries are demanding the refund of the PIS and COFINS paid including the ICMS and/or ICMS-ST in their taxable basis for the period from 1990 onwards. For the period until 2009, as well as for the period in which the special regime for cold drinks was in place – i.e. from January 2009 to April 2015 (article 58-J of Law 10,833, of 2003, also known as REFRI), the amounts involved in the refund requests are still being calculated. For the period after the termination of the special regime for cold drinks and the introduction of Law 13,097, of 2015, the Company estimates that the contingent asset related to the matter is R$ 2 billion.
F - 101
31. NON-CASH ITEMS
|
2018 |
2017 |
2016 | |
|
Acquisition of investments payables |
- |
- |
208.7 |
|
Cash financing cost other than interests |
(142.2) |
42.3 |
37.7 |
|
PERT 2017 |
- |
199.7 |
- |
|
Fair value of options granted on subsidiary |
(166.8) |
221.8 |
205.1 |
|
Exchange transaction of shareholdings |
36.5 |
- |
- |
|
Effect of application of IAS 29 (hyperinflation) |
32.9 |
- |
- |
|
Others |
0.8 |
- |
- |
32. RELATED PARTIES
Policies and practices regarding the realization of transactions with related parties
The Company adopts corporate governance practices recommended and/or required by the applicable law.
Under the Company’s by laws the Board of Directors is responsible for approving any transaction or agreements between the Company and/or any of its subsidiaries (except those fully subsidiaries), directors and/or shareholders (including shareholders, direct or indirect shareholders of the Company). The Antitrust Compliance and Related Parties Committee of the Company is required to advise the Board of Directors of the Company in matters related to transactions with related parties.
Management is prohibited from interfering in any transaction in which conflict exists, even in theory, with the Company interests. It is also not permitted to interfere in decisions of any other management member, requiring documentation in the Minutes of Meeting of the Board any decision to abstain from the specific deliberation.
The Company’s guidelines with related parties follow reasonable or commutative terms, similar to those prevailing in the market or under which the Company would contract similar transactions with third parties. These are clearly disclosed in the financial statements as formalized in written contracts.
Transactions with management members:
In addition to short-term benefits (primarily salaries), the management members are entitled to participate in Stock Option Plan (Note 24 – Share-based payments).
F - 102
Total expenses related to the Company’s management members are as follows:
|
2018 |
2017 |
2016 | |
|
Short-term benefits (i) |
24.1 |
33.4 |
21.7 |
|
Share-based payments (ii) |
30.8 |
38.9 |
36.2 |
|
Total key management remuneration |
54.9 |
72.3 |
57.9 |
(i) These correspond substantially to management’s salaries and profit sharing (including performance bonuses).
(ii) These correspond to the compensation cost of stock options and restricted stocks granted to management. These amounts exclude remuneration paid to members of the Fiscal Council.
Excluding the above mentioned plan (Note 24 – Share-based payments), the Company no longer has any type of transaction with the Management members or pending balances receivable or payable in its balance sheet.
Transactions with the Company's shareholders:
a) Medical, dental and other benefits
The Fundação Antonio e Helena Zerrenner Instituição Nacional de Beneficiência (“Fundação Zerrenner) is one of Ambev’s shareholders, and at December 31, 2018 held 10.2% of its total share capital. Fundação Zerrenner is also an independent legal entity whose main goal is to provide Ambev’s employees, both active and retirees, with health care and dental assistance, technical and superior education courses, facilities for assisting elderly people, through direct initiatives or through financial assistance agreements with other entities. On December 31, 2018 and December 31, 2017, actuarial responsibilities related to the benefits provided directly by Fundação Zerrenner are fully funded by plan assets, held for that purpose, which significantly exceeds the liabilities at these dates. Ambev recognizes the assets (prepaid expenses) of this plan to the extent of amounts from economic benefit available to the Company, arising from reimbursements or future contributions reduction.
The expenses incurred by Fundação Zerrenner in providing these benefits totaled R$273.2 (R$300.1 as of December 31, 2017), of which R$238.4 and R$34.8 related to active employees and retirees respectively (R$264.3 and R$35.8 as of December 31, 2017 related to active employees and retirees respectively).
b) Leasing
The Ambev, through its subsidiary BSA (labeling), has an asset leasing agreement with Fundação Zerrenner, for R$85.0 maturing on May 31, 2020 that can be extended for a further year.
F - 103
c) Leasing – Ambev. head office
Ambev has a leasing agreement of two commercial sets with Fundação Zerrenner in the annual amount of R$3.3, maturing on January, 2020.
d) Licensing agreement
The Company maintains a licensing agreement with Anheuser-Busch, Inc., to produce, bottle, sell and distribute Budweiser products in Brazil, Canada and Argentina, and sales and distribution agreements of Budweiser products in Guatemala, in Dominican Republic, in Paraguay, in El Salvador, in Nicaragua, in Uruguay, in Chile, in Panama, in Costa Rica e in Puerto Rico. In addition, the Company produces and distributes Stella Artois products under license to ABI in Brazil and Canada and, by means of a license granted to ABI, it also distributes Brahma’s product in the United States and several countries such as the United Kingdom, Spain, Sweden, Finland and Greece. The amount recorded was R$2.0 (R$2.8 on December 31, 2017 and R$2.0 on December 31, 2016) and R$431.6 (R$369.1 on December 31, 2017 and R$374.0 on December 31, 2016) as licensing income and expense, respectively.
Ambev has licensing agreements with the Group Modelo, subsidiaries of ABI, for to import, promote and sell products Corona (Corona Extra, Corona Light, Coronita, Pacifico and Negra Modelo) in countries of the Latin America and the Canada.
Transactions with related parties
|
|
|
|
2018 | |
|
Current |
Trade receivables (i) |
Other Trade receivables (i) |
Trade payables (i) |
Other Trade payables (i) |
|
AB InBev |
16.4 |
- |
(19.7) |
- |
|
AB Procurement |
1.1 |
- |
- |
- |
|
AB Services |
43.7 |
- |
(1.7) |
- |
|
AB USA |
27.8 |
3.8 |
(265.2) |
- |
|
Cervecería Modelo |
135.1 |
- |
(583.8) |
- |
|
Inbev |
0.6 |
45.6 |
(14.3) |
- |
|
ITW International |
- |
- |
(248.9) |
(66.5) |
|
Panamá Holding |
41.1 |
- |
(15.8) |
- |
|
Others |
28.7 |
0.5 |
(126.4) |
- |
|
294.5 |
49.9 |
(1,275.8) |
(66.5) |
(i) The amount represents the trade operations (purchase and sale) and the reimbursement between the companies of the group.
F - 104
|
2017 | ||||||
|
Current |
Trade receivables (i) |
Other Trade receivables (i) |
Trade payables (i) |
Other Trade payables (i) |
Borrowings and interest payable |
Dividends payables |
|
AB InBev |
1.2 |
33.6 |
(363.0) |
(1.7) |
- |
- |
|
AB Procurement |
8.9 |
0.1 |
- |
- |
- |
- |
|
AB Services |
0.8 |
29.1 |
- |
(6.1) |
- |
- |
|
AB USA |
14.1 |
16.3 |
(375.7) |
(8.7) |
- |
- |
|
Ambrew |
- |
- |
- |
- |
- |
(89.9) |
|
Cervecería Modelo |
91.6 |
5.8 |
(589.3) |
(59.7) |
- |
- |
|
Inbev |
0.1 |
23.8 |
(33.8) |
- |
- |
- |
|
ITW International |
- |
- |
- |
(212.5) |
(48.3) |
(590.9) |
|
Panamá Holding |
- |
20.3 |
- |
(4.0) |
- |
- |
|
Others |
13.9 |
8.6 |
(73.8) |
(3.0) |
- |
- |
|
130.6 |
137.6 |
(1,435.6) |
(295.7) |
(48.3) |
(680.8) | |
(i) The amount represents the trade operations (purchase and sale) and the reimbursement between the companies of the group.
The tables below represent the transactions with related parties, recognized in the income statement:
|
|
|
|
2018 | |
|
Company |
Buying / Service fees / Rentals |
Sales |
Royalties |
Net finance cost |
|
AB Procurement |
- |
17.0 |
- |
- |
|
AB USA |
(392.1) |
47.6 |
(347.8) |
- |
|
Ambev Peru |
- |
0.1 |
- |
- |
|
Cervecería Modelo |
(960.9) |
0.3 |
(54.8) |
- |
|
Inbev |
(107.2) |
0.1 |
- |
- |
|
Others |
(148.5) |
18.8 |
(27.0) |
(8.0) |
|
(1,608.7) |
83.9 |
(429.6) |
(8.0) |
|
|
|
|
2017 | |
|
Company |
Buying / Service fees / Rentals |
Sales |
Royalties |
Net finance cost |
|
AB Procurement |
(5.8) |
20.8 |
- |
- |
|
AB USA |
(258.7) |
42.5 |
(284.5) |
- |
|
Ambev Peru |
(8.6) |
1.5 |
- |
- |
|
Cervecería Modelo |
(749.1) |
0.4 |
(45.8) |
- |
|
Inbev |
(73.6) |
- |
- |
- |
|
Others |
(91.1) |
8.1 |
(35.9) |
(16.8) |
|
(1,186.9) |
73.3 |
(366.2) |
(16.8) |
|
|
|
|
2016 | |
|
Company |
Buying / Service fees / Rentals |
Sales |
Royalties |
Net finance cost |
|
AB Package |
(32.8) |
- |
- |
- |
|
AB USA |
(206.0) |
52.3 |
(292.8) |
- |
|
Cervecería Modelo |
(596.0) |
2.0 |
(46.9) |
- |
|
InBev |
(77.0) |
- |
- |
- |
|
ITW International |
- |
- |
- |
(26.0) |
|
Modelo |
(63.0) |
- |
- |
- |
|
SAB Group |
(3.5) |
23.5 |
- |
- |
|
Others |
(45.6) |
0.3 |
(32.2) |
- |
|
(1,023.9) |
78.1 |
(371.9) |
(26.0) |
F - 105
Denomination used in the tables above:
|
Anheuser-Busch InBev N.V. (“AB InBev”) |
|
Anheuser-Busch Packaging Group Inc. (“AB Package”) |
|
Anheuser-Busch Inbev Services LLC (“AB Services”) |
|
Anheuser-Busch Inbev USA LLC (“AB USA”) |
|
Compañia Cervecera Ambev Peru S.A.C. (“Ambev Peru”) |
|
Ambrew S.A. (“Ambrew”) |
|
Cervecería Modelo de Mexico S. de R.L. de C.V. (“Cervecería Modelo”) |
|
Inbev Belgium N.V. (“Inbev”) |
|
Interbrew International B.V. (“ITW International”) |
|
Cervecería Modelo de Guadalajara S.A. (“Modelo”) |
|
Bavaria S.A. (“SAB Group”) |
33. GROUP COMPANIES
Listed below are the main group companies.
|
Argentina |
|
|
CERVECERIA Y MALTERIA QUILMES SAICA Y G Charcas 5160 – Buenos Aires |
99.75% |
|
Bolívia |
|
|
CERVECERIA BOLIVIANA NACIONAL S.A. Avenida Montes 400 e Rua Chuquisaca 121 - La Paz |
85.67% |
|
Brazil |
|
|
AMBEV S.A. Rua Dr. Renato Paes de Barros, 1.017, 3º andar, Itaim Bibi, São Paulo |
Consolidating Company |
|
AROSUCO AROMAS E SUCOS LTDA. Avenida Buriti, 5.385, Distrito Industrial - Manaus - AM |
100.00% |
|
CRBS S.A. Avenida Antarctica, 1.891, Fazenda Santa Úrsula – Jaguariúna – SP |
100.00% |
|
CERVEJARIA Z.X. Avenida Antarctica, 1.891, Fazenda Santa Ursula – Jaguariúna - SP |
100.00% |
|
| |
|
Canadá |
|
|
LABATT BREWING COMPANY LIMITED 207 Queens Quay West, Suite 299 - M5J 1A7 - Toronto |
100.00% |
F - 106
|
Chile |
|
|
CERVECERIA CHILE S.A. Avenida Presidente Eduardo Frei Montalva, 9.600 - Comuna de Quilicura - Santiago |
100.00% |
|
Spain |
|
|
JALUA SPAIN, S.L. Juan Vara Terán, 14 – Ilhas Canárias |
100.00% |
|
Luxembourg |
|
|
AMBEV LUXEMBOURG 15 Breedewues - L1259 - Sennngerberg |
100.00% |
|
Guatemala |
|
|
INDUSTRIAS DEL ATLÁNTICO, SOCIEDAD ANÓNIMA KM 122 Ruta al Atlantico – C.P 01012 Teculutan, Zacapa |
50.00% |
|
Paraguay |
|
|
CERVECERIA PARAGUAYA S.A. Ruta Villeta KM 30 - Ypané |
87.36% |
|
Dominican Republic |
|
|
CERVECERÍA NACIONAL DOMINICANA, S.A. Autopista 30 de Mayo, Distrito Nacional |
84.71% |
|
Uruguay |
|
|
LINTHAL S.A. 25 de Mayo 444, office 401 - Montevideo |
100.00% |
|
CERVECERIA Y MALTERIA PAYSSANDÚ S.A. Rambla Baltasar Brum, 2.933 – 11800 - Payssandu |
99.93% |
|
MONTHIERS SOCIEDAD ANÓNIMA Cesar Cortinas, 2.037 - Montevideo |
100.00% |
|
Panama |
|
|
Cervecería Nacional S. de R.L. Planta Pasadena, vía Ricardo J Alfaro y Simón Bolívar, ciudad de Panamá, Rep. De Panamá |
100.00% |
34. INSURANCE
The Company has a program of risk management in order to hire coverage compatible with its size and operation. Coverage was contracted for amounts considered sufficient by management to cover possible losses, considering the nature of its activity, the risks involved in their operations and the orientation of its insurance advisors.
F - 107
35. EVENTS AFTER THE REPORTING PERIOD
Arosuco (Presumed Profit)
In April 2016, Arosuco (subsidiary of Ambev) received a tax assessment regarding the use of the “ Presumed Profit” Method for the calculation of income tax and the social contribution on net profit method instead of Real Profit method. In September, 2017, Arosuco was notified of the unfavorable first level administrative decision and filed Voluntary Appeal. In January 2019, the case was judged by the Lower Administrative Court, which ruled favorably to the Company by majority of votes. The Company is waiting to be notified of such decision to analyze the applicable appeals. Arosuco management estimates the amount of possible losses in relation to this assessment in December 31, 2018 to be approximately R$645.1 million (R$616.1 billion as of December 31, 2017).
PIS / COFINS on subsidies
Since 2015, Ambev has been receiving tax assessments issued by the Brazilian federal tax authorities, relating to amounts allegedly due under Integration Programme/Social Security Financing Levy (PIS/COFINS) over bonus products granted to its customers. These cases are now being discussed at the relevant judicial and administrative Courts. In January 2019, three cases were judged by the Lower Administrative Court, which ruled favorably to the Company by majority of votes in all three cases. Ambev is waiting to be notified of such decisions to analyze the applicable appeals. Ambev management estimates the possible losses related to these assessments to be approximately R$4.0 billion (R$3.1 billion as of 31 December 2017).
F - 108