Document
Table of Contents
| | | | | |
| Summary | |
| |
| |
| |
| |
| Financial Information | |
| |
| |
| |
| |
| |
| |
| |
| |
| Property and Other Information | |
| |
| |
| |
| |
| |
| |
| |
AMH Reports Second Quarter 2023 Financial and Operating Results
Announces Second Joint Venture with Institutional Investors Advised by J.P. Morgan Asset Management
Raises Full Year 2023 Core FFO per Share and Unit Guidance
LAS VEGAS, July 27, 2023—AMH (NYSE: AMH) (the “Company”), a leading owner, operator and developer of single-family rental homes, today announced its financial and operating results for the quarter ended June 30, 2023.
Highlights
•Rents and other single-family property revenues increased 9.3% year-over-year to $395.5 million for the second quarter of 2023.
•Net income attributable to common shareholders totaled $98.0 million, or $0.27 per diluted share, for the second quarter of 2023, compared to $56.6 million, or $0.16 per diluted share, for the second quarter of 2022.
•Core Funds from Operations (“Core FFO”) attributable to common share and unit holders increased 7.6% year-over-year to $0.41 per FFO share and unit for the second quarter of 2023 and Adjusted Funds from Operations (“Adjusted FFO”) attributable to common share and unit holders increased 5.3% year-over-year to $0.36 per FFO share and unit for the second quarter of 2023.
•Core Net Operating Income (“Core NOI”) from Same-Home properties increased by 4.8% year-over-year for the second quarter of 2023.
•Achieved Same-Home Average Occupied Days Percentage of 97.0% in the second quarter of 2023, while generating 9.4% rate growth on new leases.
•Delivered a total of 634 high-quality and energy-efficient newly constructed homes from our AMH Development Program to our wholly-owned portfolio and unconsolidated joint ventures in the second quarter of 2023.
•In July 2023, entered into a $625 million second strategic joint venture with institutional investors advised by J.P. Morgan Asset Management focused on constructing and operating newly built rental homes, providing additional scale, opportunity for economic upside and continued institutional endorsement of the Company’s industry leading built-for-rental strategy.
•Raised Full Year 2023 Core FFO attributable to common share and unit holders guidance midpoint by $0.03 per share and unit to $1.64, representing anticipated full year growth of 6.5% over prior year.
“Continued robust demand and superior execution from our teams drove strong second quarter results and an increase in our full year Core FFO per share guidance by three cents at the midpoint,” said David Singelyn, AMH’s Chief Executive Officer. “We remain committed to responsible and accretive growth through our differentiated internal development program. With the addition of our new joint venture capital, we look forward to further expanding our development pipeline to create consistent and predictable shareholder value over time.”
Second Quarter 2023 Financial Results
Net income attributable to common shareholders totaled $98.0 million, or $0.27 per diluted share, for the second quarter of 2023, compared to $56.6 million, or $0.16 per diluted share, for the second quarter of 2022. This increase was primarily due to higher net gains on property sales, a larger number of occupied properties, higher rental rates and a nonrecurring noncash charge resulting from the redemption of our Series F perpetual preferred shares in the second quarter of 2022.
Rents and other single-family property revenues increased 9.3% to $395.5 million for the second quarter of 2023, compared to $361.9 million for the second quarter of 2022. Revenue growth was driven by an increase in our average occupied portfolio which grew to 56,025 homes for the second quarter of 2023, compared to 54,786 homes for the second quarter of 2022, as well as higher rental rates.
| | | | | | | | |
| Refer to “Defined Terms and Non-GAAP Reconciliations” for definitions of metrics and reconciliations to GAAP. | | 3 |
Earnings Press Release (continued)
Core NOI from our total portfolio increased 9.0% to $223.5 million for the second quarter of 2023, compared to $205.0 million for the second quarter of 2022. This growth was driven by a 9.7% increase in core revenues resulting from a larger number of occupied properties and higher rental rates, partially offset by an 11.0% increase in core property operating expenses.
For the Company’s Same-Home portfolio, core revenues increased 6.5% to $301.1 million for the second quarter of 2023, compared to $282.6 million for the second quarter of 2022, which was driven by a 7.2% increase in Average Monthly Realized Rent per property, partially offset by a 30 basis point decrease in Average Occupied Days Percentage. Core property operating expenses from Same-Home properties increased 9.9% to $108.1 million for the second quarter of 2023, compared to $98.3 million for the second quarter of 2022, primarily driven by increased property tax expense from anticipated 2023 property tax assessments and timing of prior year property tax accruals. As a result, Core NOI from Same-Home properties increased 4.8% to $193.0 million for the second quarter of 2023, compared to $184.2 million for the second quarter of 2022.
Core FFO attributable to common share and unit holders was $170.5 million, or $0.41 per FFO share and unit, for the second quarter of 2023, compared to $153.2 million, or $0.38 per FFO share and unit, for the second quarter of 2022. Adjusted FFO attributable to common share and unit holders was $148.8 million, or $0.36 per FFO share and unit, for the second quarter of 2023, compared to $136.6 million, or $0.34 per FFO share and unit, for the second quarter of 2022. These improvements were primarily attributable to a larger number of occupied properties and higher rental rates.
Year-to-Date 2023 Financial Results
Net income attributable to common shareholders totaled $215.5 million, or $0.59 per diluted share, for the six-month period ended June 30, 2023, compared to $112.5 million, or $0.32 per diluted share, for the six-month period ended June 30, 2022. This increase was primarily due to higher net gains on property sales, a larger number of occupied properties, higher rental rates and a nonrecurring noncash charge resulting from the redemption of our Series F perpetual preferred shares in the second quarter of 2022.
Rents and other single-family property revenues increased 10.5% to $793.3 million for the six-month period ended June 30, 2023, compared to $718.0 million for the six-month period ended June 30, 2022. Revenue growth was driven by an increase in our average occupied portfolio which grew to 55,885 homes for the six-month period ended June 30, 2023, compared to 54,403 homes for the six-month period ended June 30, 2022, as well as higher rental rates.
Core NOI from our total portfolio increased 10.4% to $444.4 million for the six-month period ended June 30, 2023, compared to $402.4 million for the six-month period ended June 30, 2022. This growth was driven by an 11.2% increase in core revenues resulting from a larger number of occupied properties and higher rental rates, partially offset by a 12.5% increase in core property operating expenses.
For the Company’s Same-Home portfolio, core revenues increased 7.2% to $597.5 million for the six-month period ended June 30, 2023, compared to $557.6 million for the six-month period ended June 30, 2022, which was driven by a 7.6% increase in Average Monthly Realized Rent per property, partially offset by a 20 basis point decrease in Average Occupied Days Percentage. Core property operating expenses from Same-Home properties increased 11.0% to $210.8 million for the six-month period ended June 30, 2023, compared to $190.0 million for the six-month period ended June 30, 2022, primarily driven by (i) increased property tax expense from anticipated 2023 property tax assessments and timing of prior year property tax accruals and (ii) increased property management expenses primarily attributable to lower than normal staffing levels in the first quarter of 2022 leading to a subsequent increase in personnel in the second quarter of 2022 to a more stabilized level. As a result, Core NOI from Same-Home properties increased 5.2% to $386.7 million for the six-month period ended June 30, 2023, compared to $367.6 million for the six-month period ended June 30, 2022.
| | | | | | | | |
| Refer to “Defined Terms and Non-GAAP Reconciliations” for definitions of metrics and reconciliations to GAAP. | | 4 |
Earnings Press Release (continued)
Core FFO attributable to common share and unit holders was $339.0 million, or $0.82 per FFO share and unit, for the six-month period ended June 30, 2023, compared to $303.0 million, or $0.76 per FFO share and unit, for the six-month period ended June 30, 2022. Adjusted FFO attributable to common share and unit holders was $302.3 million, or $0.73 per FFO share and unit, for the six-month period ended June 30, 2023, compared to $274.7 million, or $0.69 per FFO share and unit, for the six-month period ended June 30, 2022. These improvements were primarily attributable to a larger number of occupied properties and higher rental rates.
Portfolio
Average Occupied Days Percentage was 96.2% for the second quarter of 2023, compared to 96.3% for the first quarter of 2023.
Investments
As of June 30, 2023, the Company’s wholly-owned portfolio consisted of 58,693 homes, compared to 58,639 homes as of March 31, 2023, an increase of 54 homes during the second quarter of 2023, which included 468 newly constructed homes delivered through our AMH Development Program and one home acquired through our National Builder Program, offset by 415 homes sold to third parties. During the second quarter of 2023, we also developed an additional 166 newly constructed properties which were delivered to our unconsolidated joint ventures, aggregating to 634 total program deliveries through our AMH Development Program. As of June 30, 2023, the Company had 648 properties held for sale and 2,846 properties held in unconsolidated joint ventures.
Capital Activities, Balance Sheet and Liquidity
In May 2023, Moody’s Investor Service upgraded all the ratings for the Company, including the senior unsecured rating to Baa2 from Baa3 with a stable outlook.
As of June 30, 2023, the Company had cash and cash equivalents of $199.6 million and had total outstanding debt of $4.4 billion, excluding unamortized discounts and unamortized deferred financing costs, with a weighted-average interest rate of 4.0% and a weighted-average term to maturity of 11.9 years. The Company had no outstanding borrowings on its $1.25 billion revolving credit facility. Additionally, the Company has no debt maturities, other than recurring principal amortization, until the fourth quarter of 2024. During the second quarter of 2023, the Company generated $57.3 million of Retained Cash Flow and sold 415 properties generating $127.5 million of net proceeds.
In July 2023, the Company entered into a $625 million second strategic joint venture with institutional investors advised by J.P. Morgan Asset Management focused on constructing and operating newly built rental homes, providing additional scale, opportunity for economic upside and continued institutional endorsement of the Company’s industry leading built-for-rental strategy. The Company holds a 20% ownership interest in the joint venture, which has an evergreen term. Additionally, the Company will earn fees for development and management services provided to the joint venture and have an opportunity to earn a promoted interest after construction and initial operation of the joint venture’s properties.
Sustainability Update
The Company was recently recognized as the July 2023 RESNET HERS® Index Builder of the Month. AMH is committed to building energy efficient single-family rental homes and uses RESNET Home Energy Rating System (HERS) scores to evaluate the anticipated energy efficiency and savings of our developments. For our homes built in 2022, on average they are designed to use less than half the energy of a typical home in this country.
| | | | | | | | |
| Refer to “Defined Terms and Non-GAAP Reconciliations” for definitions of metrics and reconciliations to GAAP. | | 5 |
Earnings Press Release (continued)
2023 Guidance
Set forth below are the Company’s current expectations with respect to full year 2023 Core FFO attributable to common share and unit holders and our underlying assumptions. In reliance on the exception provided by applicable SEC rules, the Company does not provide guidance for GAAP net income, the most comparable GAAP financial measure, or a reconciliation of 2023 Core FFO guidance to GAAP net income because we are unable to reasonably predict the following items which are included in GAAP net income: (i) gain on sale and impairment of single-family properties and other, net for consolidated properties and unconsolidated joint ventures, (ii) acquisition and other transaction costs and (iii) hurricane-related charges, net. The actual amounts for any and all of these items could significantly impact our 2023 GAAP net income and, as disclosed in our historical financial results, have significantly impacted GAAP net income in prior periods.
Guidance Summary
| | | | | | | | | | | |
| Full Year 2023 |
| Previous Guidance | | Current Guidance |
| Core FFO attributable to common share and unit holders | $1.58 - $1.64 | | $1.62 - $1.66 |
| Core FFO attributable to common share and unit holders growth | 2.5% - 6.5% | | 5.2% - 7.8% |
| | | |
| Same-Home | | | |
| Core revenues growth | 5.00% - 7.00% | | 5.75% - 7.25% |
| Core property operating expenses growth | 8.75% - 10.75% | | 8.75% - 10.75% |
| Core NOI growth | 3.00% - 5.00% | | 4.00% - 5.50% |
| | | | | | | | | | | | | | | |
| Full Year 2023
(Unchanged) |
| | | |
| Investment Program | Properties | | Investment | | | | |
| Wholly owned acquisitions | — | | — | | | | |
| Wholly owned development deliveries | 1,775 - 1,925 | | $600 - $700 million | | | | |
| Wholly owned land and development pipeline | — | | $100 - $150 million | | | | |
| Pro rata share of JV and Property Enhancing Capex | — | | $100 - $150 million | | | | |
| Total capital investment (wholly owned and pro rata JV) | 1,775 - 1,925 | | $0.8 - $1.0 billion | | | | |
| Total gross capital investment (JVs at 100%) | 2,200 - 2,400 | | $1.0 - $1.2 billion | | | | |
Changes to Full Year 2023 guidance:
•$0.03 incremental Core FFO per share primarily related to increased Core NOI growth from both the Same-Home and Non-Same-Home portfolios driven by strong spring leasing results and continued demand trends into the third quarter as well as modestly favorable updates to Other income and expense, net, notably interest income on cash generated from our better than expected dispositions activity.
Additional Information
A copy of the Company’s Second Quarter 2023 Earnings Release and Supplemental Information Package and this press release are available on our website at www.amh.com, under “Investor relations.” This information has also been furnished to the SEC in a current report on Form 8-K.
Conference Call
A conference call is scheduled on Friday, July 28, 2023 at 12:00 p.m. Eastern Time to discuss the Company’s financial results for the quarter ended June 30, 2023 and to provide an update on its business. The domestic dial-in number is (877)
| | | | | | | | |
| Refer to “Defined Terms and Non-GAAP Reconciliations” for definitions of metrics and reconciliations to GAAP. | | 6 |
Earnings Press Release (continued)
451-6152 (U.S. and Canada) and the international dial-in number is (201) 389-0879 (passcode not required). A simultaneous audio webcast may be accessed by using the link at www.amh.com, under “Investor relations.” A replay of the conference call may be accessed through Friday, August 11, 2023 by calling (844) 512-2921 (U.S. and Canada) or (412) 317-6671 (international), replay passcode number 13739083#, or by using the link at www.amh.com, under “Investor relations.”
About AMH
American Homes 4 Rent (NYSE: AMH), which does business as AMH, is a leading owner, operator and developer of single-family rental homes. We’re an internally managed Maryland real estate investment trust (REIT) focused on acquiring, developing, renovating, leasing and managing homes as rental properties. Our goal is to simplify the experience of leasing a home and deliver peace of mind to households across the country.
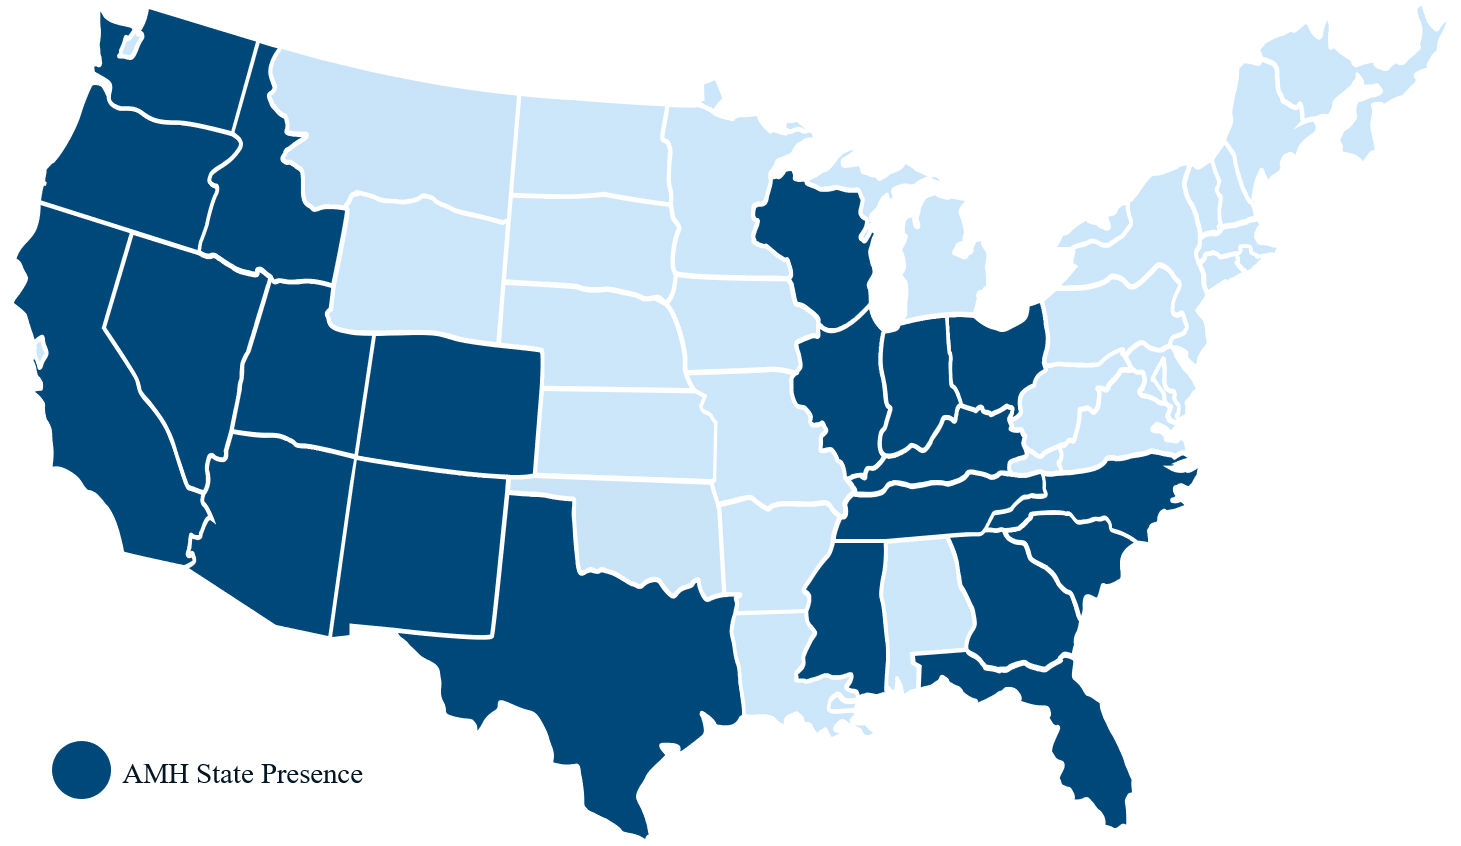
In recent years, we’ve been named one of Fortune’s 2022 Best Workplaces in Real Estate™, a 2023 Great Place to Work®, a 2023 Top U.S. Homebuilder by Builder100, one of America’s Most Responsible Companies 2023 and America’s Most Trustworthy Companies 2023 by Newsweek and Statista Inc., and a Top ESG Regional Performer by Sustainalytics. As of June 30, 2023, we owned nearly 59,000 single-family properties in the Southeast, Midwest, Southwest and Mountain West regions of the United States. Additional information about AMH is available on our website at www.amh.com.
AMH refers to one or more of American Homes 4 Rent, American Homes 4 Rent, L.P. and their subsidiaries and joint ventures. In certain states, we operate under AMH Living or American Homes 4 Rent. Please see www.amh.com/dba to learn more.
Forward-Looking Statements
This press release and the accompanying Supplemental Information Package contain “forward-looking statements.” These forward-looking statements relate to beliefs, expectations or intentions and similar statements concerning matters that are not of historical fact and are generally accompanied by words such as “estimate,” “project,” “predict,” “believe,” “expect,” “anticipate,” “intend,” “potential,” “plan,” “goal,” “outlook,” “guidance” or other words that convey the uncertainty of future events or outcomes. Examples of forward-looking statements contained in this press release include, among others, our 2023 Guidance, our belief that our acquisition and homebuilding programs will result in continued growth and the estimated timing of our development deliveries set forth in the Supplemental Information Package. The Company has based these forward-looking statements on its current expectations and assumptions about future events. While the Company’s management considers these expectations and assumptions to be reasonable, they are inherently subject to significant business, economic, competitive, regulatory and other risks, contingencies and uncertainties, most of which are difficult to predict and many of which are beyond the Company’s control and could cause actual results to differ materially from any future results, performance or achievements expressed or implied by these forward-looking statements. Investors should not place undue reliance on these forward-looking statements, which speak only as of the date of this press release. The Company undertakes no obligation to update any forward-looking statements to conform to actual results or changes in its expectations, unless required by applicable law. For a further description of the risks and uncertainties that could cause actual results to differ from those expressed in these forward-looking statements, as well as risks relating to the business of the Company in general, see the “Risk Factors” disclosed in the Company’s Annual Report on Form 10-K for the year ended December 31, 2022 and in the Company’s subsequent filings with the SEC.
| | | | | | | | |
| Refer to “Defined Terms and Non-GAAP Reconciliations” for definitions of metrics and reconciliations to GAAP. | | 7 |
Select Non-GAAP Reconciliations – Core Net Operating Income
(Amounts in thousands)
(Unaudited)
The following are reconciliations of core revenues, Same-Home core revenues, core property operating expenses, Same-Home core property operating expenses, Core NOI and Same-Home Core NOI to their respective GAAP metrics for the three and six months ended June 30, 2023 and 2022 (amounts in thousands):
| | | | | | | | | | | | | | | | | | | | | | | |
| For the Three Months Ended
Jun 30, | | For the Six Months Ended
Jun 30, |
| 2023 | | 2022 | | 2023 | | 2022 |
| Core revenues and Same-Home core revenues | | | | | | | |
| Rents and other single-family property revenues | $ | 395,548 | | | $ | 361,876 | | | $ | 793,251 | | | $ | 717,981 | |
| Tenant charge-backs | (45,814) | | | (43,137) | | | (101,209) | | | (95,409) | |
| Core revenues | 349,734 | | | 318,739 | | | 692,042 | | | 622,572 | |
| Less: Non-Same-Home core revenues | 48,672 | | | 36,165 | | | 94,550 | | | 64,996 | |
| Same-Home core revenues | $ | 301,062 | | | $ | 282,574 | | | $ | 597,492 | | | $ | 557,576 | |
| | | | | | | | | | | | | | | | | | | | | | | |
| Core property operating expenses and Same-Home core property operating expenses | | | | |
| Property operating expenses | $ | 142,553 | | | $ | 129,270 | | | $ | 289,621 | | | $ | 262,913 | |
| Property management expenses | 30,666 | | | 28,768 | | | 61,466 | | | 54,802 | |
| Noncash share-based compensation - property management | (1,132) | | | (1,132) | | | (2,198) | | | (2,131) | |
| Expenses reimbursed by tenant charge-backs | (45,814) | | | (43,137) | | | (101,209) | | | (95,409) | |
| Core property operating expenses | 126,273 | | | 113,769 | | | 247,680 | | | 220,175 | |
| Less: Non-Same-Home core property operating expenses | 18,216 | | | 15,432 | | | 36,869 | | | 30,176 | |
| Same-Home core property operating expenses | $ | 108,057 | | | $ | 98,337 | | | $ | 210,811 | | | $ | 189,999 | |
| | | | | | | | | | | | | | | | | | | | | | | |
| Core NOI and Same-Home Core NOI | | | | |
| Net income | $ | 115,414 | | | $ | 74,555 | | | $ | 253,113 | | | $ | 144,569 | |
| | | | | | | |
| | | | | | | |
| | | | | | | |
| Gain on sale and impairment of single-family properties and other, net | (62,758) | | | (32,811) | | | (147,417) | | | (54,855) | |
| Depreciation and amortization | 113,199 | | | 104,415 | | | 225,916 | | | 204,369 | |
| Acquisition and other transaction costs | 4,175 | | | 7,658 | | | 9,251 | | | 13,632 | |
| Noncash share-based compensation - property management | 1,132 | | | 1,132 | | | 2,198 | | | 2,131 | |
| Interest expense | 34,844 | | | 34,801 | | | 70,726 | | | 62,368 | |
| General and administrative expense | 19,937 | | | 18,847 | | | 37,792 | | | 36,129 | |
| Other income and expense, net | (2,482) | | | (3,627) | | | (7,217) | | | (5,946) | |
| Core NOI | 223,461 | | | 204,970 | | | 444,362 | | | 402,397 | |
| Less: Non-Same-Home Core NOI | 30,456 | | | 20,733 | | | 57,681 | | | 34,820 | |
| Same-Home Core NOI | $ | 193,005 | | | $ | 184,237 | | | $ | 386,681 | | | $ | 367,577 | |
| | | | | | | |
| | | | | | | |
| | | | | | | | |
| Refer to “Defined Terms and Non-GAAP Reconciliations” for definitions of metrics and reconciliations to GAAP. | | 8 |
Select Non-GAAP Reconciliations – Core Net Operating Income (continued)
(Amounts in thousands)
(Unaudited)
The following are reconciliations of core revenues, Same-Home core revenues, core property operating expenses, Same-Home core property operating expenses, Core NOI, Same-Home Core NOI, Unencumbered Core NOI and Encumbered Core NOI to their respective GAAP metrics for the trailing five quarters (amounts in thousands):
| | | | | | | | | | | | | | | | | | | | | | | | | | | | | |
| For the Three Months Ended |
| Jun 30,
2023 | | Mar 31,
2023 | | Dec 31,
2022 | | Sep 30,
2022 | | Jun 30,
2022 |
| | | | | | | | | |
| Core revenues and Same-Home core revenues | | | | | | | | | |
| Rents and other single-family property revenues | $ | 395,548 | | | $ | 397,703 | | | $ | 380,926 | | | $ | 391,627 | | | $ | 361,876 | |
| Tenant charge-backs | (45,814) | | | (55,395) | | | (45,183) | | | (62,014) | | | (43,137) | |
| Core revenues | 349,734 | | | 342,308 | | | 335,743 | | | 329,613 | | | 318,739 | |
| Less: Non-Same-Home core revenues | 48,672 | | | 45,878 | | | 43,703 | | | 41,665 | | | 36,165 | |
| Same-Home core revenues | $ | 301,062 | | | $ | 296,430 | | | $ | 292,040 | | | $ | 287,948 | | | $ | 282,574 | |
| | | | | | | | | | | | | | | | | | | | | | | | | | | | | |
| Core property operating expenses and Same-Home core property operating expenses | | | | | | |
| Property operating expenses | $ | 142,553 | | | $ | 147,068 | | | $ | 137,113 | | | $ | 152,065 | | | $ | 129,270 | |
| Property management expenses | 30,666 | | | 30,800 | | | 28,157 | | | 29,739 | | | 28,768 | |
| Noncash share-based compensation - property management | (1,132) | | | (1,066) | | | (715) | | | (1,015) | | | (1,132) | |
| Expenses reimbursed by tenant charge-backs | (45,814) | | | (55,395) | | | (45,183) | | | (62,014) | | | (43,137) | |
| Core property operating expenses | 126,273 | | | 121,407 | | | 119,372 | | | 118,775 | | | 113,769 | |
| Less: Non-Same-Home core property operating expenses | 18,216 | | | 18,653 | | | 18,053 | | | 17,409 | | | 15,432 | |
| Same-Home core property operating expenses | $ | 108,057 | | | $ | 102,754 | | | $ | 101,319 | | | $ | 101,366 | | | $ | 98,337 | |
| | | | | | | | | | | | | | | | | | | | | | | | | | | | | |
| Core NOI and Same-Home Core NOI |
| Net income | $ | 115,414 | | | $ | 137,699 | | | $ | 103,791 | | | $ | 61,665 | | | $ | 74,555 | |
| | | | | | | | | |
| | | | | | | | | |
| Hurricane-related charges, net | — | | | — | | | — | | | 6,133 | | | — | |
| Gain on sale and impairment of single-family properties and other, net | (62,758) | | | (84,659) | | | (57,407) | | | (24,197) | | | (32,811) | |
| Depreciation and amortization | 113,199 | | | 112,717 | | | 112,843 | | | 109,319 | | | 104,415 | |
| Acquisition and other transaction costs | 4,175 | | | 5,076 | | | 5,338 | | | 4,482 | | | 7,658 | |
| Noncash share-based compensation - property management | 1,132 | | | 1,066 | | | 715 | | | 1,015 | | | 1,132 | |
| Interest expense | 34,844 | | | 35,882 | | | 36,249 | | | 36,254 | | | 34,801 | |
| General and administrative expense | 19,937 | | | 17,855 | | | 14,942 | | | 16,986 | | | 18,847 | |
| Other income and expense, net | (2,482) | | | (4,735) | | | (100) | | | (819) | | | (3,627) | |
| Core NOI | 223,461 | | | 220,901 | | | 216,371 | | | 210,838 | | | 204,970 | |
| Less: Non-Same-Home Core NOI | 30,456 | | | 27,225 | | | 25,650 | | | 24,256 | | | 20,733 | |
| Same-Home Core NOI | $ | 193,005 | | | $ | 193,676 | | | $ | 190,721 | | | $ | 186,582 | | | $ | 184,237 | |
| | | | | | | | | |
| | | | | | | | | |
| | | | | | | | | | | | | | | | | | | | | | | | | | | | | |
| Unencumbered Core NOI and Encumbered Core NOI | | | | | | | | | |
| Core NOI | $ | 223,461 | | | $ | 220,901 | | | $ | 216,371 | | | $ | 210,838 | | | $ | 204,970 | |
| Less: Encumbered Core NOI | 64,665 | | | 64,077 | | | 63,798 | | | 62,906 | | | 61,524 | |
| Unencumbered Core NOI | $ | 158,796 | | | $ | 156,824 | | | $ | 152,573 | | | $ | 147,932 | | | $ | 143,446 | |
| | | | | | | | |
| Refer to “Defined Terms and Non-GAAP Reconciliations” for definitions of metrics and reconciliations to GAAP. | | 9 |
Fact Sheet
(Amounts in thousands, except per share and property data)
(Unaudited)
| | | | | | | | | | | | | | | | | | | | | | | |
| For the Three Months Ended
Jun 30, | | For the Six Months Ended
Jun 30, |
| 2023 | | 2022 | | 2023 | | 2022 |
| Operating Data | | | | | | | |
| Net income attributable to common shareholders | $ | 98,029 | | | $ | 56,590 | | | $ | 215,494 | | | $ | 112,529 | |
| Core revenues | $ | 349,734 | | | $ | 318,739 | | | $ | 692,042 | | | $ | 622,572 | |
| Core NOI | $ | 223,461 | | | $ | 204,970 | | | $ | 444,362 | | | $ | 402,397 | |
| Core NOI margin | 63.9 | % | | 64.3 | % | | 64.2 | % | | 64.6 | % |
| | | | | | | |
| Fully Adjusted EBITDAre | $ | 191,365 | | | $ | 178,880 | | | $ | 388,398 | | | $ | 353,290 | |
| Fully Adjusted EBITDAre Margin | 54.3 | % | | 55.5 | % | | 55.6 | % | | 56.2 | % |
| Per FFO share and unit: | | | | | | | |
| FFO attributable to common share and unit holders | $ | 0.38 | | | $ | 0.33 | | | $ | 0.77 | | | $ | 0.68 | |
| Core FFO attributable to common share and unit holders | $ | 0.41 | | | $ | 0.38 | | | $ | 0.82 | | | $ | 0.76 | |
| Adjusted FFO attributable to common share and unit holders | $ | 0.36 | | | $ | 0.34 | | | $ | 0.73 | | | $ | 0.69 | |
| | | | | | | | | | | | | | | | | | | | | | | | | | | | | |
| Jun 30,
2023 | | Mar 31,
2023 | | Dec 31,
2022 | | Sep 30,
2022 | | Jun 30,
2022 |
| Selected Balance Sheet Information - end of period | | | | | | | | | |
| Single-family properties in operation, net | $ | 10,007,290 | | | $ | 9,917,123 | | | $ | 9,938,672 | | | $ | 9,905,410 | | | $ | 9,837,281 | |
| Total assets | $ | 12,522,438 | | | $ | 12,420,013 | | | $ | 12,175,059 | | | $ | 12,098,842 | | | $ | 11,854,752 | |
| Outstanding borrowings under revolving credit facility | $ | — | | | $ | — | | | $ | 130,000 | | | $ | — | | | $ | — | |
| Total Debt | $ | 4,438,629 | | | $ | 4,444,863 | | | $ | 4,581,628 | | | $ | 4,457,326 | | | $ | 4,462,933 | |
| Total Capitalization | $ | 19,322,870 | | | $ | 17,668,693 | | | $ | 17,015,130 | | | $ | 17,969,520 | | | $ | 18,858,604 | |
| Total Debt to Total Capitalization | 23.0 | % | | 25.2 | % | | 26.9 | % | | 24.8 | % | | 23.7 | % |
| | | | | | | | | |
| Net Debt and Preferred Shares to Adjusted EBITDAre | 5.3 x | | 5.4 x | | 6.0 x | | 5.9 x | | 6.2 x |
| NYSE AMH Class A common share closing price | $ | 35.45 | | | $ | 31.45 | | | $ | 30.14 | | | $ | 32.81 | | | $ | 35.44 | |
| | | | | | | | | | | | | | | | | | | | | | | | | | | | | |
| Portfolio Data - end of period | | | | | | | | | |
| Occupied single-family properties | 56,000 | | | 56,049 | | | 55,605 | | | 55,421 | | | 55,220 | |
| Single-family properties leased, not yet occupied | 393 | | | 412 | | | 243 | | | 374 | | | 595 | |
| Single-family properties in turnover process | 1,437 | | | 1,041 | | | 1,554 | | | 1,577 | | | 1,077 | |
| Single-family properties recently renovated or developed | 215 | | | 234 | | | 464 | | | 383 | | | 385 | |
| Single-family properties newly acquired and under renovation | — | | | — | | | 12 | | | 149 | | | 483 | |
| Total single-family properties, excluding properties held for sale | 58,045 | | | 57,736 | | | 57,878 | | | 57,904 | | | 57,760 | |
| Single-family properties held for sale | 648 | | | 903 | | | 1,115 | | | 1,057 | | | 955 | |
| Total single-family properties wholly owned | 58,693 | | | 58,639 | | | 58,993 | | | 58,961 | | | 58,715 | |
| Single-family properties managed under joint ventures | 2,846 | | | 2,688 | | | 2,540 | | | 2,271 | | | 2,046 | |
| Total single-family properties wholly owned and managed | 61,539 | | | 61,327 | | | 61,533 | | | 61,232 | | | 60,761 | |
| | | | | | | | | |
Total Average Occupied Days Percentage (1) | 96.2 | % | | 96.3 | % | | 95.8 | % | | 95.7 | % | | 96.0 | % |
| | | | | | | | | |
| Same-Home Average Occupied Days Percentage (50,038 properties) | 97.0 | % | | 97.3 | % | | 96.9 | % | | 97.1 | % | | 97.3 | % |
| | | | | | | | | | | | | | | | | | | | | | | | | | | | | |
| Other Data | | | | | | | | | |
| Distributions declared per common share | $ | 0.22 | | $ | 0.22 | | $ | 0.18 | | $ | 0.18 | | $ | 0.18 |
| | | | | | | | | |
| | | | | | | | | |
Distributions declared per Series F perpetual preferred share (2) | $ | — | | $ | — | | $ | — | | $ | — | | $ | 0.14 |
| Distributions declared per Series G perpetual preferred share | $ | 0.37 | | $ | 0.37 | | $ | 0.37 | | $ | 0.37 | | $ | 0.37 |
| Distributions declared per Series H perpetual preferred share | $ | 0.39 | | $ | 0.39 | | $ | 0.39 | | $ | 0.39 | | $ | 0.39 |
(1)Calculated based on total single-family properties wholly owned, excluding properties held for sale.
(2)The 5.875% Series F perpetual preferred shares were redeemed on May 5, 2022 and the distributions for the three months ended June 30, 2022 represent the accrued and unpaid dividends paid to shareholders as part of the redemption.
| | | | | | | | |
| Refer to “Defined Terms and Non-GAAP Reconciliations” for definitions of metrics and reconciliations to GAAP. | | 10 |
Condensed Consolidated Statements of Operations
(Amounts in thousands, except share and per share data)
(Unaudited)
| | | | | | | | | | | | | | | | | | | | | | | |
| For the Three Months Ended
Jun 30, | | For the Six Months Ended
Jun 30, |
| 2023 | | 2022 | | 2023 | | 2022 |
| Rents and other single-family property revenues | $ | 395,548 | | | $ | 361,876 | | | $ | 793,251 | | | $ | 717,981 | |
| | | | | | | |
| Expenses: | | | | | | | |
| Property operating expenses | 142,553 | | | 129,270 | | | 289,621 | | | 262,913 | |
| Property management expenses | 30,666 | | | 28,768 | | | 61,466 | | | 54,802 | |
| General and administrative expense | 19,937 | | | 18,847 | | | 37,792 | | | 36,129 | |
| Interest expense | 34,844 | | | 34,801 | | | 70,726 | | | 62,368 | |
| Acquisition and other transaction costs | 4,175 | | | 7,658 | | | 9,251 | | | 13,632 | |
| Depreciation and amortization | 113,199 | | | 104,415 | | | 225,916 | | | 204,369 | |
| | | | | | | |
| Total expenses | 345,374 | | | 323,759 | | | 694,772 | | | 634,213 | |
| | | | | | | |
| Gain on sale and impairment of single-family properties and other, net | 62,758 | | | 32,811 | | | 147,417 | | | 54,855 | |
| | | | | | | |
| | | | | | | |
| Other income and expense, net | 2,482 | | | 3,627 | | | 7,217 | | | 5,946 | |
| | | | | | | |
| Net income | 115,414 | | | 74,555 | | | 253,113 | | | 144,569 | |
| | | | | | | |
| Noncontrolling interest | 13,899 | | | 8,343 | | | 30,647 | | | 16,655 | |
| Dividends on preferred shares | 3,486 | | | 4,346 | | | 6,972 | | | 10,109 | |
| Redemption of perpetual preferred shares | — | | | 5,276 | | | — | | | 5,276 | |
| | | | | | | |
| Net income attributable to common shareholders | $ | 98,029 | | | $ | 56,590 | | | $ | 215,494 | | | $ | 112,529 | |
| | | | | | | |
| Weighted-average common shares outstanding: | | | | | | | |
| Basic | 362,148,911 | | | 348,484,158 | | | 361,267,035 | | | 347,123,576 | |
| Diluted | 362,479,942 | | | 349,002,624 | | | 361,593,174 | | | 347,751,958 | |
| | | | | | | |
| Net income attributable to common shareholders per share: | | | | | | | |
| Basic | $ | 0.27 | | | $ | 0.16 | | | $ | 0.59 | | | $ | 0.32 | |
| Diluted | $ | 0.27 | | | $ | 0.16 | | | $ | 0.59 | | | $ | 0.32 | |
| | | | | | | | |
| Refer to “Defined Terms and Non-GAAP Reconciliations” for definitions of metrics and reconciliations to GAAP. | | 11 |
Funds from Operations
(Amounts in thousands, except share and per share data)
(Unaudited)
| | | | | | | | | | | | | | | | | | | | | | | |
| For the Three Months Ended
Jun 30, | | For the Six Months Ended
Jun 30, |
| 2023 | | 2022 | | 2023 | | 2022 |
| Net income attributable to common shareholders | $ | 98,029 | | | $ | 56,590 | | | $ | 215,494 | | | $ | 112,529 | |
| Adjustments: | | | | | | | |
| Noncontrolling interests in the Operating Partnership | 13,899 | | | 8,343 | | | 30,647 | | | 16,655 | |
| Gain on sale and impairment of single-family properties and other, net | (62,758) | | | (32,811) | | | (147,417) | | | (54,855) | |
| Adjustments for unconsolidated joint ventures | 1,058 | | | (199) | | | 1,568 | | | (570) | |
| Depreciation and amortization | 113,199 | | | 104,415 | | | 225,916 | | | 204,369 | |
| Less: depreciation and amortization of non-real estate assets | (4,249) | | | (3,113) | | | (8,426) | | | (6,105) | |
| FFO attributable to common share and unit holders | $ | 159,178 | | | $ | 133,225 | | | $ | 317,782 | | | $ | 272,023 | |
| Adjustments: | | | | | | | |
| Acquisition, other transaction costs and other | 4,175 | | | 7,658 | | | 9,251 | | | 13,632 | |
| Noncash share-based compensation - general and administrative | 5,982 | | | 5,932 | | | 9,725 | | | 9,962 | |
| Noncash share-based compensation - property management | 1,132 | | | 1,132 | | | 2,198 | | | 2,131 | |
| | | | | | | |
| | | | | | | |
| Redemption of perpetual preferred shares | — | | | 5,276 | | | — | | | 5,276 | |
| Core FFO attributable to common share and unit holders | $ | 170,467 | | | $ | 153,223 | | | $ | 338,956 | | | $ | 303,024 | |
| Recurring Capital Expenditures | (20,913) | | | (15,959) | | | (35,106) | | | (27,137) | |
| Leasing costs | (768) | | | (644) | | | (1,576) | | | (1,179) | |
| Adjusted FFO attributable to common share and unit holders | $ | 148,786 | | | $ | 136,620 | | | $ | 302,274 | | | $ | 274,708 | |
| | | | | | | |
| Per FFO share and unit: | | | | | | | |
| FFO attributable to common share and unit holders | $ | 0.38 | | | $ | 0.33 | | | $ | 0.77 | | | $ | 0.68 | |
| Core FFO attributable to common share and unit holders | $ | 0.41 | | | $ | 0.38 | | | $ | 0.82 | | | $ | 0.76 | |
| Adjusted FFO attributable to common share and unit holders | $ | 0.36 | | | $ | 0.34 | | | $ | 0.73 | | | $ | 0.69 | |
| | | | | | | |
| Weighted-average FFO shares and units: | | | | | | | |
| Common shares outstanding | 362,148,911 | | | 348,484,158 | | | 361,267,035 | | | 347,123,576 | |
Share-based compensation plan and forward sale equity contracts (1) | 800,106 | | | 950,033 | | | 744,772 | | | 1,056,319 | |
| Operating partnership units | 51,376,980 | | | 51,376,980 | | | 51,376,980 | | | 51,376,980 | |
| Total weighted-average FFO shares and units | 414,325,997 | | | 400,811,171 | | | 413,388,787 | | | 399,556,875 | |
(1)Reflects the effect of potentially dilutive securities issuable upon the assumed vesting/exercise of restricted stock units and stock options and the dilutive effect of forward sale equity contracts under the treasury stock method.
| | | | | | | | |
| Refer to “Defined Terms and Non-GAAP Reconciliations” for definitions of metrics and reconciliations to GAAP. | | 12 |
Core Net Operating Income – Total Portfolio
(Amounts in thousands)
(Unaudited)
| | | | | | | | | | | | | | | | | | | | | | | |
| For the Three Months Ended
Jun 30, | | For the Six Months Ended
Jun 30, |
| 2023 | | 2022 | | 2023 | | 2022 |
| Rents from single-family properties | $ | 346,872 | | | $ | 315,036 | | | $ | 687,086 | | | $ | 616,701 | |
| Fees from single-family properties | 7,400 | | | 6,904 | | | 14,840 | | | 12,991 | |
| Bad debt | (4,538) | | | (3,201) | | | (9,884) | | | (7,120) | |
| Core revenues | 349,734 | | | 318,739 | | | 692,042 | | | 622,572 | |
| | | | | | | |
| Property tax expense | 60,743 | | | 52,447 | | | 120,627 | | | 104,389 | |
HOA fees, net (1) | 6,291 | | | 6,075 | | | 12,273 | | | 11,483 | |
R&M and turnover costs, net (1) | 26,954 | | | 25,482 | | | 50,570 | | | 47,485 | |
| Insurance | 4,601 | | | 3,537 | | | 8,532 | | | 6,910 | |
Property management expenses, net (2) | 27,684 | | | 26,228 | | | 55,678 | | | 49,908 | |
| | | | | | | |
| Core property operating expenses | 126,273 | | | 113,769 | | | 247,680 | | | 220,175 | |
| | | | | | | |
| Core NOI | $ | 223,461 | | | $ | 204,970 | | | $ | 444,362 | | | $ | 402,397 | |
| Core NOI margin | 63.9 | % | | 64.3 | % | | 64.2 | % | | 64.6 | % |
| | | | | | | | | | | | | | | | | | | | | | | | | | | | | |
| For the Three Months Ended
Jun 30, 2023 |
| Same-Home Properties | | Stabilized
Properties | | Non-Stabilized Properties (3) | | Held for Sale Properties | | Total
Single-Family
Properties Wholly Owned |
| Property count | 50,038 | | | 5,039 | | | 2,968 | | | 648 | | | 58,693 | |
| Average Occupied Days Percentage | 97.0 | % | | 96.3 | % | | 80.9 | % | | 67.5 | % | | 95.9 | % |
| | | | | | | | | |
| Rents from single-family properties | $ | 298,368 | | | $ | 32,416 | | | $ | 13,442 | | | $ | 2,646 | | | $ | 346,872 | |
| Fees from single-family properties | 6,273 | | | 680 | | | 392 | | | 55 | | | 7,400 | |
| Bad debt | (3,579) | | | (395) | | | (189) | | | (375) | | | (4,538) | |
| Core revenues | 301,062 | | | 32,701 | | | 13,645 | | | 2,326 | | | 349,734 | |
| | | | | | | | | |
| Property tax expense | 52,602 | | | 5,210 | | | 2,301 | | | 630 | | | 60,743 | |
HOA fees, net (1) | 5,509 | | | 515 | | | 244 | | | 23 | | | 6,291 | |
R&M and turnover costs, net (1) | 23,067 | | | 1,969 | | | 1,657 | | | 261 | | | 26,954 | |
| Insurance | 3,960 | | | 380 | | | 208 | | | 53 | | | 4,601 | |
Property management expenses, net (2) | 22,919 | | | 2,309 | | | 2,224 | | | 232 | | | 27,684 | |
| Core property operating expenses | 108,057 | | | 10,383 | | | 6,634 | | | 1,199 | | | 126,273 | |
| | | | | | | | | |
| Core NOI | $ | 193,005 | | | $ | 22,318 | | | $ | 7,011 | | | $ | 1,127 | | | $ | 223,461 | |
| Core NOI margin | 64.1 | % | | 68.2 | % | | 51.4 | % | | 48.5 | % | | 63.9 | % |
(1)Presented net of tenant charge-backs.
(2)Presented net of tenant charge-backs and excludes noncash share-based compensation expense related to centralized and field property management employees.
(3)Includes 1,270 recently renovated or developed properties that do not meet the definition of Stabilized Property at the start of the quarter and 1,698 legacy-tenant properties which have not experienced tenant turnover under our ownership (the majority of which were acquired through bulk acquisitions, such as the ARPI merger) or properties currently out of service due to a casualty loss.
| | | | | | | | |
| Refer to “Defined Terms and Non-GAAP Reconciliations” for definitions of metrics and reconciliations to GAAP. | | 13 |
Same-Home Results – Quarterly and Year-to-Date Comparisons
(Amounts in thousands, except property and per property data)
(Unaudited)
| | | | | | | | | | | | | | | | | | | | | | | | | | | | | | | | | | | |
| For the Three Months Ended
Jun 30, | | | | For the Six Months Ended
Jun 30, | | |
| 2023 | | 2022 | | Change | | 2023 | | 2022 | | Change |
| Number of Same-Home properties | 50,038 | | | 50,038 | | | | | 50,038 | | | 50,038 | | | |
| | | | | | | | | | | |
| Average Occupied Days Percentage | 97.0 | % | | 97.3 | % | | (0.3) | % | | 97.1 | % | | 97.3 | % | | (0.2) | % |
| Average Monthly Realized Rent per property | $ | 2,048 | | | $ | 1,910 | | | 7.2 | % | | $ | 2,031 | | | $ | 1,888 | | | 7.6 | % |
| Turnover Rate | 8.4 | % | | 7.7 | % | | 0.7 | % | | 14.7 | % | | 13.8 | % | | 0.9 | % |
| Turnover Rate - TTM | 28.9 | % | | N/A | | | | 28.9 | % | | N/A | | |
| | | | | | | | | | | |
| Core NOI: | | | | | | | | | | | |
| Rents from single-family properties | $ | 298,368 | | | $ | 279,070 | | | 6.9 | % | | $ | 592,360 | | | $ | 551,662 | | | 7.4 | % |
| Fees from single-family properties | 6,273 | | | 5,726 | | | 9.6 | % | | 12,537 | | | 10,930 | | | 14.7 | % |
| Bad debt | (3,579) | | | (2,222) | | | 61.1 | % | | (7,405) | | | (5,016) | | | 47.6 | % |
| Core revenues | 301,062 | | | 282,574 | | | 6.5 | % | | 597,492 | | | 557,576 | | | 7.2 | % |
| | | | | | | | | | | |
| Property tax expense | 52,602 | | | 46,148 | | | 14.0 | % | | 104,081 | | | 91,990 | | | 13.1 | % |
HOA fees, net (1) | 5,509 | | | 5,284 | | | 4.3 | % | | 10,622 | | | 10,068 | | | 5.5 | % |
R&M and turnover costs, net (1) | 23,067 | | | 21,840 | | | 5.6 | % | | 42,661 | | | 40,102 | | | 6.4 | % |
| Insurance | 3,960 | | | 3,110 | | | 27.3 | % | | 7,365 | | | 6,101 | | | 20.7 | % |
Property management expenses, net (2) | 22,919 | | | 21,955 | | | 4.4 | % | | 46,082 | | | 41,738 | | | 10.4 | % |
| Core property operating expenses | 108,057 | | | 98,337 | | | 9.9 | % | | 210,811 | | | 189,999 | | | 11.0 | % |
| | | | | | | | | | | |
| Core NOI | $ | 193,005 | | | $ | 184,237 | | | 4.8 | % | | $ | 386,681 | | | $ | 367,577 | | | 5.2 | % |
| Core NOI margin | 64.1 | % | | 65.2 | % | | | | 64.7 | % | | 65.9 | % | | |
| | | | | | | | | | | |
| Selected Property Expenditure Details: | | | | | | | | | | | |
| Recurring Capital Expenditures | $ | 18,636 | | | $ | 14,157 | | | 31.6 | % | | $ | 31,248 | | | $ | 24,484 | | | 27.6 | % |
| | | | | | | | | | | |
| Per property: | | | | | | | | | | | |
| Average Recurring Capital Expenditures | $ | 372 | | | $ | 283 | | | 31.6 | % | | $ | 624 | | | $ | 489 | | | 27.6 | % |
Average R&M and turnover costs, net, plus Recurring Capital Expenditures | $ | 833 | | | $ | 719 | | | 15.9 | % | | $ | 1,477 | | | $ | 1,291 | | | 14.4 | % |
| | | | | | | | | | | |
| Property Enhancing Capex | $ | 14,107 | | | $ | 16,274 | | | | | $ | 27,917 | | | $ | 26,928 | | | |
(1)Presented net of tenant charge-backs.
(2)Presented net of tenant charge-backs and excludes noncash share-based compensation expense related to centralized and field property management employees.
| | | | | | | | |
| Refer to “Defined Terms and Non-GAAP Reconciliations” for definitions of metrics and reconciliations to GAAP. | | 14 |
Same-Home Results – Sequential Quarterly Results
(Amounts in thousands, except per property data)
(Unaudited)
| | | | | | | | | | | | | | | | | | | | | | | | | | | | | |
| For the Three Months Ended |
| Jun 30,
2023 | | Mar 31,
2023 | | Dec 31,
2022 | | Sep 30,
2022 | | Jun 30,
2022 |
| | | | | | | | | |
| Average Occupied Days Percentage | 97.0 | % | | 97.3 | % | | 96.9 | % | | 97.1 | % | | 97.3 | % |
| Average Monthly Realized Rent per property | $ | 2,048 | | | $ | 2,014 | | | $ | 1,991 | | | $ | 1,954 | | | $ | 1,910 | |
| | | | | | | | | |
| Average Change in Rent for Renewals | 7.0 | % | | 6.8 | % | | 7.9 | % | | 8.3 | % | | 7.5 | % |
| Average Change in Rent for Re-Leases | 9.4 | % | | 7.7 | % | | 8.3 | % | | 12.3 | % | | 13.9 | % |
| Average Blended Change in Rent | 7.7 | % | | 7.1 | % | | 8.0 | % | | 9.5 | % | | 9.3 | % |
| | | | | | | | | |
| Core NOI: | | | | | | | | | |
| Rents from single-family properties | $ | 298,368 | | | $ | 293,992 | | | $ | 289,693 | | | $ | 284,781 | | | $ | 279,070 | |
| Fees from single-family properties | 6,273 | | | 6,264 | | | 5,890 | | | 5,955 | | | 5,726 | |
| Bad debt | (3,579) | | | (3,826) | | | (3,543) | | | (2,788) | | | (2,222) | |
| Core revenues | 301,062 | | | 296,430 | | | 292,040 | | | 287,948 | | | 282,574 | |
| | | | | | | | | |
| Property tax expense | 52,602 | | | 51,479 | | | 52,278 | | | 46,159 | | | 46,148 | |
HOA fees, net (1) | 5,509 | | | 5,113 | | | 5,231 | | | 5,518 | | | 5,284 | |
R&M and turnover costs, net (1) | 23,067 | | | 19,594 | | | 19,649 | | | 24,210 | | | 21,840 | |
| Insurance | 3,960 | | | 3,405 | | | 3,140 | | | 3,137 | | | 3,110 | |
Property management expenses, net (2) | 22,919 | | | 23,163 | | | 21,021 | | | 22,342 | | | 21,955 | |
| Core property operating expenses | 108,057 | | | 102,754 | | | 101,319 | | | 101,366 | | | 98,337 | |
| | | | | | | | | |
| Core NOI | $ | 193,005 | | | $ | 193,676 | | | $ | 190,721 | | | $ | 186,582 | | | $ | 184,237 | |
| Core NOI margin | 64.1 | % | | 65.3 | % | | 65.3 | % | | 64.8 | % | | 65.2 | % |
| | | | | | | | | |
| | | | | | | | | |
| Selected Property Expenditure Details: | | | | | | | | | |
| Recurring Capital Expenditures | $ | 18,636 | | | $ | 12,612 | | | $ | 13,636 | | | $ | 19,413 | | | $ | 14,157 | |
| | | | | | | | | |
| Per property: | | | | | | | | | |
| Average Recurring Capital Expenditures | $ | 372 | | | $ | 252 | | | $ | 273 | | | $ | 388 | | | $ | 283 | |
Average R&M and turnover costs, net, plus Recurring Capital Expenditures | $ | 833 | | | $ | 644 | | | $ | 665 | | | $ | 872 | | | $ | 719 | |
| | | | | | | | | |
| Property Enhancing Capex | $ | 14,107 | | | $ | 13,810 | | | $ | 12,923 | | | $ | 16,799 | | | $ | 16,274 | |
(1)Presented net of tenant charge-backs.
(2)Presented net of tenant charge-backs and excludes noncash share-based compensation expense related to centralized and field property management employees.
| | | | | | | | |
| Refer to “Defined Terms and Non-GAAP Reconciliations” for definitions of metrics and reconciliations to GAAP. | | 15 |
Same-Home Results – Operating Metrics by Market
| | | | | | | | | | | | | | | | | | | | | | | | | | | | | | | | | | | |
| Number of Properties | | Gross Book Value per Property | | % of
2Q23 NOI | | Avg. Change in Rent for Renewals (1) | | Avg. Change in Rent for Re-Leases (1) | | Avg. Blended Change in Rent (1) |
| Atlanta, GA | 4,745 | | | $ | 200,714 | | | 8.9 | % | | 8.2 | % | | 9.4 | % | | 8.5 | % |
| Dallas-Fort Worth, TX | 3,850 | | | 171,948 | | | 6.8 | % | | 7.3 | % | | 9.2 | % | | 7.8 | % |
| Charlotte, NC | 3,640 | | | 206,367 | | | 7.6 | % | | 7.1 | % | | 11.0 | % | | 8.2 | % |
| Phoenix, AZ | 2,783 | | | 190,925 | | | 6.4 | % | | 6.7 | % | | 9.4 | % | | 7.5 | % |
| Nashville, TN | 2,773 | | | 229,869 | | | 7.0 | % | | 7.3 | % | | 8.7 | % | | 7.7 | % |
| Indianapolis, IN | 2,653 | | | 163,389 | | | 3.8 | % | | 5.4 | % | | 8.7 | % | | 6.5 | % |
| Jacksonville, FL | 2,527 | | | 194,445 | | | 4.9 | % | | 6.5 | % | | 8.3 | % | | 7.1 | % |
| Tampa, FL | 2,482 | | | 211,790 | | | 4.9 | % | | 9.1 | % | | 12.4 | % | | 10.0 | % |
| Houston, TX | 2,256 | | | 172,067 | | | 3.5 | % | | 5.5 | % | | 8.7 | % | | 6.0 | % |
| Raleigh, NC | 2,025 | | | 193,925 | | | 4.2 | % | | 6.4 | % | | 8.6 | % | | 7.1 | % |
| Columbus, OH | 1,998 | | | 183,396 | | | 4.0 | % | | 6.3 | % | | 9.4 | % | | 7.1 | % |
| Cincinnati, OH | 1,939 | | | 185,817 | | | 3.9 | % | | 6.7 | % | | 11.9 | % | | 8.1 | % |
| Orlando, FL | 1,628 | | | 194,879 | | | 3.1 | % | | 8.6 | % | | 13.2 | % | | 9.9 | % |
| Salt Lake City, UT | 1,598 | | | 274,158 | | | 4.2 | % | | 5.3 | % | | 9.6 | % | | 6.7 | % |
| Greater Chicago area, IL and IN | 1,554 | | | 189,436 | | | 2.9 | % | | 6.5 | % | | 9.6 | % | | 7.2 | % |
| Charleston, SC | 1,281 | | | 215,980 | | | 2.8 | % | | 7.0 | % | | 8.3 | % | | 7.4 | % |
| Las Vegas, NV | 1,237 | | | 215,101 | | | 2.8 | % | | 5.8 | % | | 4.2 | % | | 5.3 | % |
| San Antonio, TX | 1,114 | | | 183,827 | | | 1.7 | % | | 3.9 | % | | 3.1 | % | | 3.7 | % |
| Savannah/Hilton Head, SC | 893 | | | 187,501 | | | 1.9 | % | | 8.4 | % | | 13.6 | % | | 10.1 | % |
| Seattle, WA | 885 | | | 290,442 | | | 2.3 | % | | 8.9 | % | | 9.6 | % | | 9.1 | % |
All Other (2) | 6,177 | | | 202,167 | | | 12.4 | % | | 6.8 | % | | 9.3 | % | | 7.5 | % |
| Total/Average | 50,038 | | | $ | 199,109 | | | 100.0 | % | | 7.0 | % | | 9.4 | % | | 7.7 | % |
| | | | | | | | | | | | | | | | | | | | | | | | | | | | | | | | | | | |
| Average Occupied Days Percentage | | Average Monthly Realized Rent per Property |
| 2Q23 QTD | | 2Q22 QTD | | Change | | 2Q23 QTD | | 2Q22 QTD | | Change |
| Atlanta, GA | 97.1 | % | | 97.4 | % | | (0.3) | % | | $ | 2,066 | | | $ | 1,937 | | | 6.7 | % |
| Dallas-Fort Worth, TX | 97.2 | % | | 97.7 | % | | (0.5) | % | | 2,140 | | | 1,998 | | | 7.1 | % |
| Charlotte, NC | 97.1 | % | | 97.4 | % | | (0.3) | % | | 1,982 | | | 1,856 | | | 6.8 | % |
| Phoenix, AZ | 96.3 | % | | 97.2 | % | | (0.9) | % | | 2,004 | | | 1,854 | | | 8.1 | % |
| Nashville, TN | 96.7 | % | | 97.9 | % | | (1.2) | % | | 2,173 | | | 1,998 | | | 8.8 | % |
| Indianapolis, IN | 97.0 | % | | 96.7 | % | | 0.3 | % | | 1,733 | | | 1,648 | | | 5.2 | % |
| Jacksonville, FL | 97.2 | % | | 97.5 | % | | (0.3) | % | | 2,025 | | | 1,876 | | | 7.9 | % |
| Tampa, FL | 97.1 | % | | 98.2 | % | | (1.1) | % | | 2,197 | | | 2,001 | | | 9.8 | % |
| Houston, TX | 98.1 | % | | 97.5 | % | | 0.6 | % | | 1,927 | | | 1,830 | | | 5.3 | % |
| Raleigh, NC | 96.6 | % | | 97.1 | % | | (0.5) | % | | 1,899 | | | 1,765 | | | 7.6 | % |
| Columbus, OH | 97.1 | % | | 96.6 | % | | 0.5 | % | | 2,009 | | | 1,901 | | | 5.7 | % |
| Cincinnati, OH | 97.0 | % | | 96.8 | % | | 0.2 | % | | 1,967 | | | 1,850 | | | 6.3 | % |
| Orlando, FL | 97.0 | % | | 98.1 | % | | (1.1) | % | | 2,145 | | | 1,947 | | | 10.2 | % |
| Salt Lake City, UT | 97.0 | % | | 97.5 | % | | (0.5) | % | | 2,245 | | | 2,102 | | | 6.8 | % |
| Greater Chicago area, IL and IN | 97.7 | % | | 98.0 | % | | (0.3) | % | | 2,245 | | | 2,109 | | | 6.4 | % |
| Charleston, SC | 97.9 | % | | 95.2 | % | | 2.7 | % | | 2,103 | | | 1,973 | | | 6.6 | % |
| Las Vegas, NV | 96.1 | % | | 96.8 | % | | (0.7) | % | | 2,078 | | | 1,943 | | | 6.9 | % |
| San Antonio, TX | 95.9 | % | | 96.7 | % | | (0.8) | % | | 1,874 | | | 1,792 | | | 4.6 | % |
| Savannah/Hilton Head, SC | 98.5 | % | | 97.2 | % | | 1.3 | % | | 1,980 | | | 1,825 | | | 8.5 | % |
| Seattle, WA | 96.4 | % | | 97.3 | % | | (0.9) | % | | 2,538 | | | 2,321 | | | 9.3 | % |
All Other (2) | 97.0 | % | | 97.2 | % | | (0.2) | % | | 2,024 | | | 1,886 | | | 7.3 | % |
| Total/Average | 97.0 | % | | 97.3 | % | | (0.3) | % | | $ | 2,048 | | | $ | 1,910 | | | 7.2 | % |
(1)Reflected for the three months ended June 30, 2023.
(2)Represents 15 markets in 13 states.
| | | | | | | | |
| Refer to “Defined Terms and Non-GAAP Reconciliations” for definitions of metrics and reconciliations to GAAP. | | 16 |
Condensed Consolidated Balance Sheets
(Amounts in thousands)
| | | | | | | | | | | |
| Jun 30, 2023 | | Dec 31, 2022 |
| (Unaudited) | | |
| Assets | | | |
| Single-family properties: | | | |
| Land | $ | 2,208,667 | | | $ | 2,197,233 | |
| Buildings and improvements | 10,351,621 | | | 10,127,891 | |
| Single-family properties in operation | 12,560,288 | | | 12,325,124 | |
| Less: accumulated depreciation | (2,552,998) | | | (2,386,452) | |
| Single-family properties in operation, net | 10,007,290 | | | 9,938,672 | |
| Single-family properties under development and development land | 1,339,508 | | | 1,187,221 | |
| Single-family properties and land held for sale, net | 154,190 | | | 198,716 | |
| Total real estate assets, net | 11,500,988 | | | 11,324,609 | |
| Cash and cash equivalents | 199,601 | | | 69,155 | |
| Restricted cash | 162,169 | | | 148,805 | |
| Rent and other receivables | 45,911 | | | 47,752 | |
| Escrow deposits, prepaid expenses and other assets | 359,473 | | | 331,446 | |
| Investments in unconsolidated joint ventures | 108,351 | | | 107,347 | |
| Asset-backed securitization certificates | 25,666 | | | 25,666 | |
| Goodwill | 120,279 | | | 120,279 | |
| Total assets | $ | 12,522,438 | | | $ | 12,175,059 | |
| | | |
| Liabilities | | | |
| Revolving credit facility | $ | — | | | $ | 130,000 | |
| Asset-backed securitizations, net | 1,880,348 | | | 1,890,842 | |
| Unsecured senior notes, net | 2,497,691 | | | 2,495,156 | |
| Accounts payable and accrued expenses | 594,154 | | | 484,403 | |
| | | |
| Total liabilities | 4,972,193 | | | 5,000,401 | |
| | | |
| Commitments and contingencies | | | |
| | | |
| Equity | | | |
| Shareholders’ equity: | | | |
| Class A common shares | 3,614 | | | 3,529 | |
| Class B common shares | 6 | | | 6 | |
| Preferred shares | 92 | | | 92 | |
| Additional paid-in capital | 7,244,204 | | | 6,931,819 | |
| Accumulated deficit | (385,434) | | | (440,791) | |
| Accumulated other comprehensive income | 1,090 | | | 1,332 | |
| Total shareholders’ equity | 6,863,572 | | | 6,495,987 | |
| Noncontrolling interest | 686,673 | | | 678,671 | |
| Total equity | 7,550,245 | | | 7,174,658 | |
| | | |
| Total liabilities and equity | $ | 12,522,438 | | | $ | 12,175,059 | |
| | | | | | | | |
| Refer to “Defined Terms and Non-GAAP Reconciliations” for definitions of metrics and reconciliations to GAAP. | | 17 |
Debt Summary as of June 30, 2023
(Amounts in thousands)
(Unaudited)
| | | | | | | | | | | | | | | | | | | | | | | | | | | | | | | | | | | |
| Secured | | Unsecured | | Total Balance | | % of Total | | Interest Rate (1) | | Years to Maturity (2) |
| Floating rate debt: | | | | | | | | | | | |
Revolving credit facility (3) | $ | — | | | $ | — | | | $ | — | | | — | % | | 6.09 | % | | 2.8 |
| | | | | | | | | | | |
| Total floating rate debt | — | | | — | | | — | | | — | % | | 6.09 | % | | 2.8 |
| | | | | | | | | | | |
| Fixed rate debt: | | | | | | | | | | | |
| AMH 2014-SFR2 securitization | 464,582 | | | — | | | 464,582 | | | 10.5 | % | | 4.42 | % | | 1.3 |
| AMH 2014-SFR3 securitization | 480,082 | | | — | | | 480,082 | | | 10.8 | % | | 4.40 | % | | 1.4 |
| AMH 2015-SFR1 securitization | 505,167 | | | — | | | 505,167 | | | 11.4 | % | | 4.14 | % | | 21.8 |
| AMH 2015-SFR2 securitization | 438,798 | | | — | | | 438,798 | | | 9.9 | % | | 4.36 | % | | 22.3 |
| 2028 unsecured senior notes | — | | | 500,000 | | | 500,000 | | | 11.3 | % | | 4.08 | % | | 4.6 |
| 2029 unsecured senior notes | — | | | 400,000 | | | 400,000 | | | 9.0 | % | | 4.90 | % | | 5.6 |
| 2031 unsecured senior notes | — | | | 450,000 | | | 450,000 | | | 10.1 | % | | 2.46 | % | | 8.0 |
| 2032 unsecured senior notes | — | | | 600,000 | | | 600,000 | | | 13.4 | % | | 3.63 | % | | 8.8 |
| 2051 unsecured senior notes | — | | | 300,000 | | | 300,000 | | | 6.8 | % | | 3.38 | % | | 28.1 |
| 2052 unsecured senior notes | — | | | 300,000 | | | 300,000 | | | 6.8 | % | | 4.30 | % | | 28.8 |
| Total fixed rate debt | 1,888,629 | | | 2,550,000 | | | 4,438,629 | | | 100.0 | % | | 4.00 | % | | 11.9 |
| | | | | | | | | | | |
| Total Debt | $ | 1,888,629 | | | $ | 2,550,000 | | | 4,438,629 | | | 100.0 | % | | 4.00 | % | | 11.9 |
| | | | | | | | | | | |
| Unamortized discounts and loan costs | | | | | (60,590) | | | | | | | |
| Total debt per balance sheet | | | | | $ | 4,378,039 | | | | | | | |
| | | | | | | | | | | | | | |
Maturity Schedule by Year (2) | | Total Debt | | % of Total |
| Remaining 2023 | | $ | 10,358 | | | 0.2 | % |
| 2024 | | 949,759 | | | 21.5 | % |
| 2025 | | 10,302 | | | 0.2 | % |
| 2026 | | 10,302 | | | 0.2 | % |
| 2027 | | 10,302 | | | 0.2 | % |
| | | | |
| | | | |
| | | | |
| | | | |
| | | | |
| Thereafter | | 3,447,606 | | | 77.7 | % |
| Total | | $ | 4,438,629 | | | 100.0 | % |
(1)Interest rates are as of June 30, 2023 and reflect the effect of any hedging instruments, as applicable.
(2)Years to maturity and maturity schedule reflect all debt on a fully extended basis. The AMH 2015-SFR1 securitization and AMH 2015-SFR2 securitization have anticipated repayment dates of April 9, 2025 and October 9, 2025, respectively. If the securitizations are not repaid by this date, the duration-adjusted weighted-average interest rate will increase by a minimum of 3.00%.
(3)The Company amended its revolving credit facility in connection with the transition from the LIBOR to the Secured Overnight Financing Rate (“SOFR”) during the second quarter of 2023. The revolving credit facility bears interest at SOFR, as adjusted for the Company’s SOFR spread, plus 0.90% as of period end.
Interest Expense Reconciliation
| | | | | | | | | | | | | | | | | | | | | | | |
| For the Three Months Ended
Jun 30, | | For the Six Months Ended
Jun 30, |
| (Amounts in thousands) | 2023 | | 2022 | | 2023 | | 2022 |
| Interest expense per income statement and included in Core FFO attributable to common share and unit holders | $ | 34,844 | | | $ | 34,801 | | | $ | 70,726 | | | $ | 62,368 | |
| | | | | | | |
| | | | | | | |
| Less: amortization of discounts, loan costs and cash flow hedges | (3,065) | | | (3,049) | | | (6,108) | | | (5,502) | |
| Add: capitalized interest | 13,733 | | | 13,660 | | | 26,821 | | | 26,554 | |
| Cash interest | $ | 45,512 | | | $ | 45,412 | | | $ | 91,439 | | | $ | 83,420 | |
| | | | | | | | |
| Refer to “Defined Terms and Non-GAAP Reconciliations” for definitions of metrics and reconciliations to GAAP. | | 18 |
Capital Structure and Credit Metrics as of June 30, 2023
(Amounts in thousands, except share and per share data)
(Unaudited)
| | | | | | | | | | | | | | | | | | | | |
| Total Capitalization | | | | | | |
| | | | | | |
| Total Debt | | | | $ | 4,438,629 | | | 23.0 | % |
| | | | | | |
| Total preferred shares | | | | 230,000 | | | 1.2 | % |
| | | | | | |
| Common equity at market value: | | | | | | |
| Common shares outstanding | | 362,000,767 | | | | | |
| Operating partnership units | | 51,376,980 | | | | | |
| Total shares and units | | 413,377,747 | | | | | |
| NYSE AMH Class A common share closing price at June 30, 2023 | | $ | 35.45 | | | | | |
| Market value of common shares and operating partnership units | | | | 14,654,241 | | | 75.8 | % |
| | | | | | |
| Total Capitalization | | | | $ | 19,322,870 | | | 100.0 | % |
| | | | | | | | | | | | | | | | | | | | | | | | | | | | | | | | | | | | | | |
| Preferred Shares | | Earliest Redemption Date | | Outstanding Shares | | | | | | Annual Dividend
Per Share | | Annual Dividend
Amount |
| Series | | | | Per Share | | Total | | |
| 5.875% Series G Perpetual Preferred Shares | | 7/17/2022 | | 4,600,000 | | | $ | 25.00 | | | $ | 115,000 | | | $ | 1.469 | | | $ | 6,756 | |
| 6.250% Series H Perpetual Preferred Shares | | 9/19/2023 | | 4,600,000 | | | $ | 25.00 | | | 115,000 | | | $ | 1.563 | | | 7,188 | |
| Total preferred shares | | | | 9,200,000 | | | | | $ | 230,000 | | | | | $ | 13,944 | |
| | | | | | | | | | | | | | | | | | | | | | | |
| Credit Ratios | | | Credit Ratings | | | | |
| | | | | | | |
| Net Debt and Preferred Shares to Adjusted EBITDAre | 5.3 x | | Rating Agency | | Rating | | Outlook |
| Fixed Charge Coverage | 4.2 x | | Moody's Investor Service | | Baa2 | | Stable |
| Unencumbered Core NOI percentage | 70.7 | % | | S&P Global Ratings | | BBB | | Stable |
| | | | | | | | | | | | | | | | | |
| Unsecured Senior Notes Covenant Ratios | | Requirement | | Actual |
| | | | | |
| Ratio of Indebtedness to Total Assets | | < | 60.0 | % | | 29.9 | % |
| Ratio of Secured Debt to Total Assets | | < | 40.0 | % | | 12.7 | % |
| Ratio of Unencumbered Assets to Unsecured Debt | | > | 150.0 | % | | 455.7 | % |
| Ratio of Consolidated Income Available for Debt Service to Interest Expense | | > | 1.50 x | | 4.41 x |
| | | | | | | | | | | | | | | | | |
| Unsecured Credit Facility Covenant Ratios | | Requirement | | Actual |
| | | | | |
| Ratio of Total Indebtedness to Total Asset Value | | < | 60.0 | % | | 28.9 | % |
| Ratio of Secured Indebtedness to Total Asset Value | | < | 40.0 | % | | 11.8 | % |
| Ratio of Unsecured Indebtedness to Unencumbered Asset Value | | < | 60.0 | % | | 26.4 | % |
| Ratio of EBITDA to Fixed Charges | | > | 1.50 x | | 3.70 x |
| Ratio of Unencumbered NOI to Unsecured Interest Expense | | > | 1.75 x | | 6.32 x |
| | | | | | | | |
| Refer to “Defined Terms and Non-GAAP Reconciliations” for definitions of metrics and reconciliations to GAAP. | | 19 |
Top 20 Markets Summary as of June 30, 2023
Property Information (1)
| | | | | | | | | | | | | | | | | | | | | | | | | | | | | | | | |
| Market | | Number of
Properties | | Percentage
of Total
Properties | | Gross Book
Value per
Property | | Avg.
Sq. Ft. | | Avg. Age
(years) |
| Atlanta, GA | | 5,790 | | 10.0 | % | | $ | 219,605 | | | 2,169 | | 17.3 |
| Dallas-Fort Worth, TX | | 4,143 | | 7.1 | % | | 174,885 | | | 2,101 | | 19.0 |
| Charlotte, NC | | 4,003 | | 6.9 | % | | 215,573 | | | 2,109 | | 17.7 |
| Phoenix, AZ | | 3,380 | | 5.8 | % | | 210,510 | | | 1,840 | | 19.0 |
| Nashville, TN | | 3,257 | | 5.6 | % | | 243,004 | | | 2,113 | | 15.9 |
| Jacksonville, FL | | 2,981 | | 5.1 | % | | 212,553 | | | 1,929 | | 14.5 |
| Indianapolis, IN | | 2,870 | | 4.9 | % | | 172,818 | | | 1,927 | | 20.4 |
| Tampa, FL | | 2,806 | | 4.8 | % | | 225,765 | | | 1,943 | | 15.4 |
| Houston, TX | | 2,516 | | 4.3 | % | | 177,021 | | | 2,089 | | 17.5 |
| Raleigh, NC | | 2,181 | | 3.8 | % | | 198,446 | | | 1,889 | | 17.3 |
| Cincinnati, OH | | 2,126 | | 3.7 | % | | 195,570 | | | 1,843 | | 20.5 |
| Columbus, OH | | 2,126 | | 3.7 | % | | 191,382 | | | 1,873 | | 20.9 |
| Las Vegas, NV | | 2,017 | | 3.5 | % | | 276,595 | | | 1,924 | | 12.3 |
| Salt Lake City, UT | | 1,899 | | 3.3 | % | | 303,337 | | | 2,243 | | 16.7 |
| Orlando, FL | | 1,934 | | 3.3 | % | | 210,636 | | | 1,904 | | 18.8 |
| Greater Chicago area, IL and IN | | 1,575 | | 2.7 | % | | 189,583 | | | 1,866 | | 21.8 |
| Charleston, SC | | 1,520 | | 2.6 | % | | 227,477 | | | 1,963 | | 12.6 |
| San Antonio, TX | | 1,294 | | 2.2 | % | | 195,927 | | | 1,926 | | 14.6 |
| Seattle, WA | | 1,153 | | 2.0 | % | | 327,028 | | | 2,000 | | 13.4 |
| Savannah/Hilton Head, SC | | 1,042 | | 1.8 | % | | 208,751 | | | 1,889 | | 14.7 |
All Other (3) | | 7,432 | | 12.9 | % | | 228,820 | | | 1,907 | | 17.2 |
| Total/Average | | 58,045 | | 100.0 | % | | $ | 216,389 | | | 1,990 | | 17.3 |
Leasing Information (1)
| | | | | | | | | | | | | | | | | | | | | | | | | | | | | | | | |
| Market | | Avg. Occupied Days Percentage (2) | | Avg. Monthly Realized Rent per Property (2) | | Avg. Change in Rent for Renewals (2) | | Avg. Change in Rent for Re-Leases (2) | | Avg. Blended Change in Rent (2) |
| Atlanta, GA | | 96.3 | % | | $ | 2,079 | | | 8.1 | % | | 9.1 | % | | 8.4 | % |
| Dallas-Fort Worth, TX | | 96.8 | % | | 2,140 | | | 7.3 | % | | 9.1 | % | | 7.8 | % |
| Charlotte, NC | | 96.9 | % | | 1,993 | | | 7.0 | % | | 10.9 | % | | 8.2 | % |
| Phoenix, AZ | | 96.3 | % | | 2,005 | | | 7.2 | % | | 9.9 | % | | 8.0 | % |
| Nashville, TN | | 96.2 | % | | 2,182 | | | 7.2 | % | | 8.8 | % | | 7.6 | % |
| Jacksonville, FL | | 96.6 | % | | 2,039 | | | 6.4 | % | | 8.0 | % | | 6.9 | % |
| Indianapolis, IN | | 96.9 | % | | 1,741 | | | 5.4 | % | | 8.5 | % | | 6.4 | % |
| Tampa, FL | | 96.5 | % | | 2,215 | | | 9.0 | % | | 12.1 | % | | 9.9 | % |
| Houston, TX | | 97.5 | % | | 1,930 | | | 5.6 | % | | 8.4 | % | | 6.0 | % |
| Raleigh, NC | | 96.2 | % | | 1,905 | | | 6.5 | % | | 8.5 | % | | 7.1 | % |
| Cincinnati, OH | | 96.8 | % | | 1,970 | | | 6.7 | % | | 11.6 | % | | 8.1 | % |
| Columbus, OH | | 96.8 | % | | 2,015 | | | 6.4 | % | | 9.4 | % | | 7.2 | % |
| Las Vegas, NV | | 91.8 | % | | 2,139 | | | 5.1 | % | | 4.1 | % | | 4.8 | % |
| Salt Lake City, UT | | 96.5 | % | | 2,299 | | | 5.1 | % | | 9.1 | % | | 6.5 | % |
| Orlando, FL | | 95.8 | % | | 2,155 | | | 8.5 | % | | 13.4 | % | | 9.8 | % |
| Greater Chicago area, IL and IN | | 97.5 | % | | 2,243 | | | 6.4 | % | | 9.6 | % | | 7.1 | % |
| Charleston, SC | | 96.7 | % | | 2,120 | | | 7.0 | % | | 8.3 | % | | 7.5 | % |
| San Antonio, TX | | 94.7 | % | | 1,885 | | | 4.0 | % | | 3.2 | % | | 3.7 | % |
| Seattle, WA | | 95.6 | % | | 2,559 | | | 8.3 | % | | 8.6 | % | | 8.4 | % |
| Savannah/Hilton Head, SC | | 98.2 | % | | 2,006 | | | 8.5 | % | | 13.8 | % | | 10.0 | % |
All Other (3) | | 95.0 | % | | 2,042 | | | 6.6 | % | | 8.8 | % | | 7.3 | % |
| Total/Average | | 96.2 | % | | $ | 2,063 | | | 6.9 | % | | 9.2 | % | | 7.5 | % |
(1)Property and leasing information based on total single-family properties wholly owned, excluding properties held for sale.
(2)Reflected for the three months ended June 30, 2023.
(3)Represents 15 markets in 13 states.
| | | | | | | | |
| Refer to “Defined Terms and Non-GAAP Reconciliations” for definitions of metrics and reconciliations to GAAP. | | 20 |
Property Additions
| | | | | | | | | | | | | | | | | | | | | | | | | | |
| | 2Q23 Additions | | YTD 2Q23 Additions |
| Market | | Number of Properties | | Average
Total Investment Cost | | Number of Properties | | Average
Total Investment Cost |
| Las Vegas, NV | | 93 | | | $ | 365,149 | | | 174 | | | $ | 366,629 | |
| Boise, ID | | 65 | | | 386,483 | | | 120 | | | 379,116 | |
| Tampa, FL | | 61 | | | 356,800 | | | 89 | | | 353,979 | |
| Jacksonville, FL | | 58 | | | 312,007 | | | 91 | | | 310,529 | |
| Orlando, FL | | 52 | | | 341,633 | | | 84 | | | 346,290 | |
| Atlanta, GA | | 45 | | | 338,171 | | | 68 | | | 336,992 | |
| Charlotte, NC | | 22 | | | 389,514 | | | 59 | | | 394,324 | |
| Nashville, TN | | 21 | | | 431,704 | | | 30 | | | 414,476 | |
| Columbus, OH | | 20 | | | 383,571 | | | 20 | | | 383,571 | |
| Colorado Springs, CO | | 18 | | | 506,365 | | | 19 | | | 506,897 | |
| Seattle, WA | | 13 | | | 528,460 | | | 13 | | | 528,460 | |
| Raleigh, NC | | 1 | | | 257,993 | | | 14 | | | 240,504 | |
| | | | | | | | |
| | | | | | | | |
| | | | | | | | |
| | | | | | | | |
| | | | | | | | |
| | | | | | | | |
| | | | | | | | |
| | | | | | | | |
| | | | | | | | |
| Total/Average | | 469 | | | $ | 369,879 | | | 781 | | | $ | 364,011 | |
Property Dispositions
| | | | | | | | | | | | | | | | | | | | | | | | | | | | | | | | |
| | Jun 30, 2023 Single-Family Properties Held for Sale | | 2Q23 Dispositions | | YTD 2Q23 Dispositions |
| Market | | | Number of Properties | | Average Net Proceeds per Property | | Number of Properties | | Average Net Proceeds per Property |
| Inland Empire, CA | | 99 | | | 25 | | | $ | 452,553 | | | 49 | | | $ | 443,153 | |
| Greater Chicago area, IL and IN | | 91 | | | 12 | | | 293,054 | | | 58 | | | 239,578 | |
| Houston, TX | | 91 | | | 111 | | | 239,544 | | | 283 | | | 230,435 | |
| Dallas-Fort Worth, TX | | 57 | | | 43 | | | 301,393 | | | 121 | | | 285,781 | |
| Atlanta, GA | | 47 | | | 35 | | | 286,188 | | | 81 | | | 274,509 | |
| Bay Area, CA | | 26 | | | 9 | | | 572,101 | | | 21 | | | 526,736 | |
| Indianapolis, IN | | 26 | | | 20 | | | 224,184 | | | 53 | | | 233,851 | |
| Austin, TX | | 25 | | | 16 | | | 319,045 | | | 31 | | | 304,409 | |
| San Antonio, TX | | 23 | | | 17 | | | 246,964 | | | 31 | | | 231,257 | |
| Central Valley, CA | | 22 | | | 2 | | | 304,844 | | | 10 | | | 325,951 | |
| Charlotte, NC | | 22 | | | 13 | | | 365,878 | | | 41 | | | 305,702 | |
| Nashville, TN | | 18 | | | 8 | | | 395,126 | | | 22 | | | 333,706 | |
| Phoenix, AZ | | 17 | | | 22 | | | 344,405 | | | 61 | | | 331,802 | |
| Charleston, SC | | 17 | | | 4 | | | 241,400 | | | 11 | | | 279,384 | |
| Tampa, FL | | 11 | | | 10 | | | 372,119 | | | 21 | | | 370,343 | |
| Orlando, FL | | 9 | | | 11 | | | 344,471 | | | 25 | | | 323,621 | |
| Miami, FL | | 8 | | | 1 | | | 344,932 | | | 5 | | | 346,395 | |
| Milwaukee, WI | | 7 | | | 2 | | | 337,364 | | | 9 | | | 331,456 | |
| Greensboro, NC | | 4 | | | 1 | | | 236,290 | | | 3 | | | 255,645 | |
| Salt Lake City, UT | | 4 | | | 4 | | | 328,025 | | | 9 | | | 363,798 | |
All Other (1) | | 24 | | | 49 | | | 346,829 | | | 136 | | | 316,443 | |
| Total/Average | | 648 | | | 415 | | | $ | 307,168 | | | 1,081 | | | $ | 288,443 | |
(1)Represents 16 markets in 12 states.
| | | | | | | | |
| Refer to “Defined Terms and Non-GAAP Reconciliations” for definitions of metrics and reconciliations to GAAP. | | 21 |
AMH Development Pipeline Summary as of June 30, 2023
| | | | | | | | | | | | | | | | | | | | | | | | | | |
| | YTD 2Q23 Deliveries | | Jun 30, 2023 Lots for Future Delivery (1) |
| Market | | Number of Properties | | Average Total Investment Cost | | Average
Monthly Rent | |
| Las Vegas, NV | | 174 | | | $ | 367,000 | | | $ | 2,420 | | | 1,411 | |
| Tampa, FL | | 164 | | | 359,000 | | | 2,560 | | | 695 | |
| Jacksonville, FL | | 130 | | | 329,000 | | | 2,300 | | | 786 | |
| Boise, ID | | 120 | | | 379,000 | | | 2,280 | | | 330 | |
| Orlando, FL | | 115 | | | 358,000 | | | 2,410 | | | 1,105 | |
| Atlanta, GA | | 102 | | | 352,000 | | | 2,460 | | | 828 | |
| Charlotte, NC | | 94 | | | 388,000 | | | 2,410 | | | 439 | |
| Denver, CO | | 44 | | | 586,000 | | | 3,230 | | | 452 | |
| Salt Lake City, UT | | 38 | | | 456,000 | | | 2,640 | | | 131 | |
| Seattle, WA | | 36 | | | 507,000 | | | 3,100 | | | 256 | |
| Nashville, TN | | 30 | | | 414,000 | | | 2,470 | | | 467 | |
| Columbus, OH | | 20 | | | 384,000 | | | 2,390 | | | 580 | |
| Charleston, SC | | 19 | | | 519,000 | | | 3,350 | | | 910 | |
| Raleigh, NC | | 14 | | | 401,000 | | | 2,370 | | | 3 | |
| Phoenix, AZ | | — | | | — | | | — | | | 1,721 | |
| Total/Average | | 1,100 | | | $ | 383,000 | | | $ | 2,490 | | | 10,114 | |
| Lots optioned | | | | | | | | 3,330 | |
| Total lots owned and optioned | | | | | | | | 13,444 | |
Estimated Delivery Timing
| | | | | | | | | | | | | | | | | | | | | | | | | | | | | | | | |
| | Dec 31, 2022 Lots for Future Delivery (1) | | YTD 2Q23 Lots Added (3) | | YTD 2Q23
Deliveries | | Full Year Estimated 2023 Deliveries (4) | | Deliveries Thereafter (4) |
Wholly-owned development pipeline (2) | | 13,764 | | (112) | | 767 | | 1,775 - 1,925 | | 11,802 |
Joint venture development pipeline (2)(5) | | 743 | | 149 | | 333 | | 425 - 475 | | 442 |
| Total development pipeline | | 14,507 | | 37 | | 1,100 | | 2,200 - 2,400 | | 12,244 |
(1)Lots controlled in escrow are not included.
(2)Reflects land pipeline and delivery timeline for projects that are intended either for the Company’s wholly-owned or joint venture portfolios.
(3)Represents lots acquired and optioned, net of lots transferred to held for sale or disposed during the period.
(4)Reflects the Company’s latest development program estimates as of July 27, 2023.
(5)Represents two unconsolidated joint ventures for each of which the Company holds a 20% interest.
| | | | | | | | |
| Refer to “Defined Terms and Non-GAAP Reconciliations” for definitions of metrics and reconciliations to GAAP. | | 22 |
Lease Expirations
| | | | | | | | | | | | | | | | | | | | | | | | | | | | | | | | | | | | | | |
| | MTM | | 3Q23 | | 4Q23 | | 1Q24 | | 2Q24 | | Thereafter |
| Lease expirations | | 3,564 | | 12,833 | | 9,500 | | 12,159 | | 15,212 | | 3,125 |
Share Repurchase / ATM Share Issuance History
(Amounts in thousands, except share and per share data)
| | | | | | | | | | | | | | | | | | | | | | | | | | | | | | | | | | | | | | |
| | Share Repurchases | | ATM Share Issuances |
| Period | | Common Shares Repurchased | | Purchase Price | | Avg. Price Paid Per Share | | Common Shares Issued | | Gross Proceeds | | Avg. Issuance Price Per Share |
| 2018 | | 1,804,163 | | | $ | 34,933 | | | $ | 19.36 | | | — | | | $ | — | | | $ | — | |
| 2019 | | — | | | — | | | — | | | — | | | — | | | — | |
| 2020 | | — | | | — | | | — | | | 86,130 | | | 2,414 | | | 28.03 | |
| 2021 | | — | | | — | | | — | | | 1,749,286 | | | 72,344 | | | 41.36 | |
| 2022 | | — | | | — | | | — | | | — | | | — | | | — | |
| 1Q23 | | — | | | — | | | — | | | — | | | — | | | — | |
| 2Q23 | | — | | | — | | | — | | | — | | | — | | | — | |
| Total | | 1,804,163 | | | 34,933 | | | $ | 19.36 | | | 1,835,416 | | | 74,758 | | | $ | 40.73 | |
| | Remaining authorization: | | $ | 265,067 | | | | | Remaining authorization: (1) | | $ | 1,000,000 | | | |
(1)In June 2023, the Company entered into a new at-the-market common share offering program, replacing the previously expiring program, under which it can issue Class A common shares from time to time through various sales agents up to an aggregate gross sales offering price of $1.0 billion.
| | | | | | | | |
| Refer to “Defined Terms and Non-GAAP Reconciliations” for definitions of metrics and reconciliations to GAAP. | | 23 |
2023 Guidance
Set forth below are the Company’s current expectations with respect to full year 2023 Core FFO attributable to common share and unit holders and our underlying assumptions. In reliance on the exception provided by applicable SEC rules, the Company does not provide guidance for GAAP net income, the most comparable GAAP financial measure, or a reconciliation of 2023 Core FFO guidance to GAAP net income because we are unable to reasonably predict the following items which are included in GAAP net income: (i) gain on sale and impairment of single-family properties and other, net for consolidated properties and unconsolidated joint ventures, (ii) acquisition and other transaction costs and (iii) hurricane-related charges, net. The actual amounts for any and all of these items could significantly impact our 2023 GAAP net income and, as disclosed in our historical financial results, have significantly impacted GAAP net income in prior periods.
Guidance Summary
| | | | | | | | | | | |
| Full Year 2023 |
| Previous Guidance | | Current Guidance |
| Core FFO attributable to common share and unit holders | $1.58 - $1.64 | | $1.62 - $1.66 |
| Core FFO attributable to common share and unit holders growth | 2.5% - 6.5% | | 5.2% - 7.8% |
| | | |
| Same-Home | | | |
| Core revenues growth | 5.00% - 7.00% | | 5.75% - 7.25% |
| Core property operating expenses growth | 8.75% - 10.75% | | 8.75% - 10.75% |
| Core NOI growth | 3.00% - 5.00% | | 4.00% - 5.50% |
| | | | | | | | | | | | | | | |
| Full Year 2023
(Unchanged) |
| | | |
| Investment Program | Properties | | Investment | | | | |
| Wholly owned acquisitions | — | | — | | | | |
| Wholly owned development deliveries | 1,775 - 1,925 | | $600 - $700 million | | | | |
| Wholly owned land and development pipeline | — | | $100 - $150 million | | | | |
| Pro rata share of JV and Property Enhancing Capex | — | | $100 - $150 million | | | | |
| Total capital investment (wholly owned and pro rata JV) | 1,775 - 1,925 | | $0.8 - $1.0 billion | | | | |
| Total gross capital investment (JVs at 100%) | 2,200 - 2,400 | | $1.0 - $1.2 billion | | | | |
Changes to Full Year 2023 guidance:
•$0.03 incremental Core FFO per share primarily related to increased Core NOI growth from both the Same-Home and Non-Same-Home portfolios driven by strong spring leasing results and continued demand trends into the third quarter as well as modestly favorable updates to Other income and expense, net, notably interest income on cash generated from our better than expected dispositions activity.
| | | | | | | | |
| Refer to “Defined Terms and Non-GAAP Reconciliations” for definitions of metrics and reconciliations to GAAP. | | 24 |
Defined Terms and Non-GAAP Reconciliations
(Unaudited)
Average Blended Change in Rent
The percentage change in rent on all non-month-to-month lease renewals and re-leases during the period, compared to the annual rent of the previous expired non-month-to-month comparable long-term lease for each individual property.
Average Change in Rent for Re-Leases
The percentage change in annual rent on properties re-leased during the period, compared to the annual rent of the comparable long-term previous expired lease for each individual property.
Average Change in Rent for Renewals
The percentage change in rent on non-month-to-month comparable long-term lease renewals during the period.
Average Monthly Realized Rent
For the related period, Average Monthly Realized Rent is calculated as the lease component of rents and other single-family property revenues (i.e., rents from single-family properties) divided by the product of (a) number of properties and (b) Average Occupied Days Percentage, divided by the number of months. For properties partially owned during the period, this calculation is adjusted to reflect the number of days of ownership.
Average Occupied Days Percentage
The number of days a property is occupied in the period divided by the total number of days the property is owned during the same period after initially being placed in-service. This calculation excludes properties classified as held for sale except where presented for Total Single-Family Properties Wholly Owned in Core Net Operating Income – Total Portfolio.
Average Total Investment Cost
Reflects on a per property basis, depending on the property addition channel, (i) Estimated Total Investment Cost of traditional channel acquisitions, (ii) purchase price, including closing costs, or total internal development costs of newly constructed homes, or (iii) total purchase price, including historic pro rata investment cost of properties acquired through bulk or joint venture portfolio acquisitions.
Core Net Operating Income (“Core NOI”) and Same-Home Core NOI
Core NOI, which we also present separately for our Same-Home, unencumbered and encumbered portfolios, is a supplemental non-GAAP financial measure that we define as core revenues, which is calculated as rents and other single-family property revenues, excluding expenses reimbursed by tenant charge-backs, less core property operating expenses, which is calculated as property operating and property management expenses, excluding noncash share-based compensation expense and expenses reimbursed by tenant charge-backs.
Core NOI also excludes (1) gain or loss on early extinguishment of debt, (2) hurricane-related charges, net, which result in material charges to our single-family property portfolio, (3) gains and losses from sales or impairments of single-family properties and other, (4) depreciation and amortization, (5) acquisition and other transaction costs incurred with business combinations and the acquisition or disposition of properties as well as nonrecurring items unrelated to ongoing operations, (6) noncash share-based compensation expense, (7) interest expense, (8) general and administrative expense, and (9) other income and expense, net. We believe Core NOI provides useful information to investors about the operating performance of our single-family properties without the impact of certain operating expenses that are reimbursed through tenant charge-backs.
Defined Terms and Non-GAAP Reconciliations (continued)
(Unaudited)
Core NOI and Same-Home Core NOI should be considered only as supplements to net income or loss as a measure of our performance and should not be used as measures of our liquidity, nor are they indicative of funds available to fund our cash needs, including our ability to pay dividends or make distributions. Additionally, these metrics should not be used as substitutes for net income or loss or net cash flows from operating activities (as computed in accordance with GAAP).
Refer to Select Non-GAAP Reconciliations – Core Net Operating Income for reconciliations of core revenues, Same-Home core revenues, core property operating expenses, Same-Home core property operating expenses, Core NOI, Same-Home Core NOI, Unencumbered Core NOI and Encumbered Core NOI to their respective GAAP metrics.
Credit Ratios
We present the following selected metrics because we believe they are helpful as supplemental measures in assessing the Company’s ability to service its financing obligations and in evaluating balance sheet leverage against that of other real estate companies. The tables below reconcile these metrics, which are calculated in part based on several non-GAAP financial measures.
Net Debt and Preferred Shares to Adjusted EBITDAre
| | | | | | | | | | | | | | | | | | | | | | | | | | | | | |
| (Amounts in thousands) | Jun 30,
2023 | | Mar 31,
2023 | | Dec 31,
2022 | | Sep 30,
2022 | | Jun 30,
2022 |
| Total Debt | $ | 4,438,629 | | | $ | 4,444,863 | | | $ | 4,581,628 | | | $ | 4,457,326 | | | $ | 4,462,933 | |
| Less: cash and cash equivalents | (199,601) | | | (255,559) | | | (69,155) | | | (97,244) | | | (70,375) | |
| Less: asset-backed securitization certificates | (25,666) | | | (25,666) | | | (25,666) | | | (25,666) | | | (25,666) | |
| Less: restricted cash related to securitizations | (45,289) | | | (42,365) | | | (39,854) | | | (49,932) | | | (41,469) | |
| Net debt | $ | 4,168,073 | | | $ | 4,121,273 | | | $ | 4,446,953 | | | $ | 4,284,484 | | | $ | 4,325,423 | |
| Preferred shares at liquidation value | 230,000 | | | 230,000 | | | 230,000 | | | 230,000 | | | 230,000 | |
| Net debt and preferred shares | $ | 4,398,073 | | | $ | 4,351,273 | | | $ | 4,676,953 | | | $ | 4,514,484 | | | $ | 4,555,423 | |
| | | | | | | | | |
| Adjusted EBITDAre - TTM | $ | 827,550 | | | $ | 809,987 | | | $ | 784,076 | | | $ | 760,912 | | | $ | 733,162 | |
| | | | | | | | | |
| | | | | | | | | |
| | | | | | | | | |
| Net Debt and Preferred Shares to Adjusted EBITDAre | 5.3 x | | 5.4 x | | 6.0 x | | 5.9 x | | 6.2 x |
Fixed Charge Coverage
| | | | | |
| (Amounts in thousands) | For the Trailing Twelve Months Ended
Jun 30, 2023 |
| Interest expense per income statement | $ | 143,229 | |
| Less: amortization of discounts, loan costs and cash flow hedges | (12,279) | |
| Add: capitalized interest | 52,352 | |
| Cash interest | 183,302 | |
| Dividends on preferred shares | 13,944 | |
| Fixed charges | $ | 197,246 | |
| |
| Adjusted EBITDAre - TTM | $ | 827,550 | |
| |
| Fixed Charge Coverage | 4.2 x |
Unencumbered Core NOI Percentage
| | | | | | | | | | | | | | | | | | | | | | | | | | | | | |
| For the Three Months Ended | | For the Trailing Twelve Months Ended
Jun 30, 2023 |
| (Amounts in thousands) | Sep 30,
2022 | | Dec 31,
2022 | | Mar 31,
2023 | | Jun 30,
2023 | |
| Unencumbered Core NOI | $ | 147,932 | | | $ | 152,573 | | | $ | 156,824 | | | $ | 158,796 | | | $ | 616,125 | |
| Core NOI | 210,838 | | | 216,371 | | | 220,901 | | | 223,461 | | | 871,571 | |
| Unencumbered Core NOI Percentage | | | | | | | | | 70.7 | % |
Defined Terms and Non-GAAP Reconciliations (continued)
(Unaudited)
EBITDA / EBITDAre / Adjusted EBITDAre / Fully Adjusted EBITDAre / Adjusted EBITDAre Margin / Fully Adjusted EBITDAre Margin
EBITDA is defined as earnings before interest, taxes, depreciation and amortization. EBITDA is a non-GAAP financial measure and is used by us and others as a supplemental measure of performance. EBITDAre is a supplemental non-GAAP financial measure, which we calculate in accordance with the definition approved by the National Association of Real Estate Investment Trusts (“NAREIT”) by adjusting EBITDA for gains and losses from sales or impairments of single-family properties and adjusting for unconsolidated partnerships and joint ventures on the same basis. Adjusted EBITDAre is a supplemental non-GAAP financial measure calculated by adjusting EBITDAre for (1) acquisition and other transaction costs incurred with business combinations and the acquisition or disposition of properties as well as nonrecurring items unrelated to ongoing operations, (2) noncash share-based compensation expense, (3) hurricane-related charges, net, which result in material charges to our single-family property portfolio, and (4) gain or loss on early extinguishment of debt. Fully Adjusted EBITDAre is a supplemental non-GAAP financial measure calculated by adjusting Adjusted EBITDAre for (1) Recurring Capital Expenditures and (2) leasing costs. Adjusted EBITDAre Margin is a supplemental non-GAAP financial measure calculated as Adjusted EBITDAre divided by rents and other single-family property revenues, net of tenant charge-backs and adjusted for income from unconsolidated joint ventures. Fully Adjusted EBITDAre Margin is a supplemental non-GAAP financial measure calculated as Fully Adjusted EBITDAre divided by rents and other single-family property revenues, net of tenant charge-backs and adjusted for income from unconsolidated joint ventures. We believe these metrics provide useful information to investors because they exclude the impact of various income and expense items that are not indicative of operating performance.
Defined Terms and Non-GAAP Reconciliations (continued)
(Unaudited)
The following is a reconciliation of net income, as determined in accordance with GAAP, to EBITDA, EBITDAre, Adjusted EBITDAre, Fully Adjusted EBITDAre, Adjusted EBITDAre Margin and Fully Adjusted EBITDAre Margin for the three and six months ended June 30, 2023 and 2022 (amounts in thousands):
| | | | | | | | | | | | | | | | | | | | | | | |
| For the Three Months Ended
Jun 30, | | For the Six Months Ended
Jun 30, |
| 2023 | | 2022 | | 2023 | | 2022 |
| Net income | $ | 115,414 | | | $ | 74,555 | | | $ | 253,113 | | | $ | 144,569 | |
| Interest expense | 34,844 | | | 34,801 | | | 70,726 | | | 62,368 | |
| Depreciation and amortization | 113,199 | | | 104,415 | | | 225,916 | | | 204,369 | |
| EBITDA | $ | 263,457 | | | $ | 213,771 | | | $ | 549,755 | | | $ | 411,306 | |
| | | | | | | |
| Gain on sale and impairment of single-family properties and other, net | (62,758) | | | (32,811) | | | (147,417) | | | (54,855) | |
| Adjustments for unconsolidated joint ventures | 1,058 | | | (199) | | | 1,568 | | | (570) | |
| EBITDAre | $ | 201,757 | | | $ | 180,761 | | | $ | 403,906 | | | $ | 355,881 | |
| | | | | | | |
| Noncash share-based compensation - general and administrative | 5,982 | | | 5,932 | | | 9,725 | | | 9,962 | |
| Noncash share-based compensation - property management | 1,132 | | | 1,132 | | | 2,198 | | | 2,131 | |
| Acquisition, other transaction costs and other | 4,175 | | | 7,658 | | | 9,251 | | | 13,632 | |
| | | | | | | |
| | | | | | | |
| Adjusted EBITDAre | $ | 213,046 | | | $ | 195,483 | | | $ | 425,080 | | | $ | 381,606 | |
| | | | | | | |
| Recurring Capital Expenditures | (20,913) | | | (15,959) | | | (35,106) | | | (27,137) | |
| Leasing costs | (768) | | | (644) | | | (1,576) | | | (1,179) | |
| Fully Adjusted EBITDAre | $ | 191,365 | | | $ | 178,880 | | | $ | 388,398 | | | $ | 353,290 | |
| | | | | | | |
| Rents and other single-family property revenues | $ | 395,548 | | | $ | 361,876 | | | $ | 793,251 | | | $ | 717,981 | |
| Less: tenant charge-backs | (45,814) | | | (43,137) | | | (101,209) | | | (95,409) | |
| Adjustments for unconsolidated joint ventures - income | 2,873 | | | 3,552 | | | 6,168 | | | 6,351 | |
| Rents and other single-family property revenues, net of tenant charge-backs and adjustments for unconsolidated joint ventures | $ | 352,607 | | | $ | 322,291 | | | $ | 698,210 | | | $ | 628,923 | |
| | | | | | | |
| Adjusted EBITDAre Margin | 60.4 | % | | 60.7 | % | | 60.9 | % | | 60.7 | % |
| | | | | | | |
| Fully Adjusted EBITDAre Margin | 54.3 | % | | 55.5 | % | | 55.6 | % | | 56.2 | % |
Defined Terms and Non-GAAP Reconciliations (continued)
(Unaudited)
The following is a reconciliation of net income, as determined in accordance with GAAP, to EBITDA, EBITDAre and Adjusted EBITDAre for the following trailing twelve month periods (amounts in thousands):
| | | | | | | | | | | | | | | | | | | | | | | | | | | | | |
| For the Trailing Twelve Months Ended |
| Jun 30,
2023 | | Mar 31,
2023 | | Dec 31,
2022 | | Sep 30,
2022 | | Jun 30,
2022 |
| Net income | $ | 418,569 | | | $ | 377,710 | | | $ | 310,025 | | | $ | 267,557 | | | $ | 254,393 | |
| Interest expense | 143,229 | | | 143,186 | | | 134,871 | | | 126,885 | | | 121,728 | |
| Depreciation and amortization | 448,078 | | | 439,294 | | | 426,531 | | | 410,854 | | | 396,029 | |
| EBITDA | $ | 1,009,876 | | | $ | 960,190 | | | $ | 871,427 | | | $ | 805,296 | | | $ | 772,150 | |
| | | | | | | | | |
| Gain on sale and impairment of single-family properties and other, net | (229,021) | | | (199,074) | | | (136,459) | | | (92,347) | | | (77,722) | |
| Adjustments for unconsolidated joint ventures | 2,482 | | | 1,225 | | | 344 | | | 197 | | | 472 | |
| EBITDAre | $ | 783,337 | | | $ | 762,341 | | | $ | 735,312 | | | $ | 713,146 | | | $ | 694,900 | |
| | | | | | | | | |
| Noncash share-based compensation - general and administrative | 15,081 | | | 15,031 | | | 15,318 | | | 14,991 | | | 13,158 | |
| Noncash share-based compensation - property management | 3,928 | | | 3,928 | | | 3,861 | | | 3,872 | | | 3,537 | |
| Acquisition, other transaction costs and other | 19,071 | | | 22,554 | | | 23,452 | | | 22,770 | | | 21,567 | |
| Hurricane-related charges, net | 6,133 | | | 6,133 | | | 6,133 | | | 6,133 | | | — | |
| | | | | | | | | |
| Adjusted EBITDAre | $ | 827,550 | | | $ | 809,987 | | | $ | 784,076 | | | $ | 760,912 | | | $ | 733,162 | |
Estimated Total Investment Cost
Represents the sum of purchase price, closing costs and if applicable, estimated initial renovation costs for homes purchased through traditional broker and trustee channels.
FFO / Core FFO / Adjusted FFO attributable to common share and unit holders
FFO attributable to common share and unit holders is a non-GAAP financial measure that we calculate in accordance with the definition approved by NAREIT, which defines FFO as net income or loss calculated in accordance with GAAP, excluding gains and losses from sales or impairment of real estate, plus real estate-related depreciation and amortization (excluding amortization of deferred financing costs and depreciation of non-real estate assets), and after adjustments for unconsolidated partnerships and joint ventures to reflect FFO on the same basis.
Core FFO attributable to common share and unit holders is a non-GAAP financial measure that we use as a supplemental measure of our performance. We compute this metric by adjusting FFO attributable to common share and unit holders for (1) acquisition and other transaction costs incurred with business combinations and the acquisition or disposition of properties as well as nonrecurring items unrelated to ongoing operations, (2) noncash share-based compensation expense, (3) hurricane-related charges, net, which result in material charges to our single-family property portfolio, (4) gain or loss on early extinguishment of debt and (5) the allocation of income to our perpetual preferred shares in connection with their redemption.
Adjusted FFO attributable to common share and unit holders is a non-GAAP financial measure that we use as a supplemental measure of our performance. We compute this metric by adjusting Core FFO attributable to common share and unit holders for (1) Recurring Capital Expenditures that are necessary to help preserve the value and maintain functionality of our properties and (2) capitalized leasing costs incurred during the period. As a portion of our homes are recently developed, acquired and/or renovated, we estimate Recurring Capital Expenditures for our entire portfolio by multiplying (a) current period actual Recurring Capital Expenditures per Same-Home Property by (b) our total number of properties, excluding newly acquired non-stabilized properties and properties classified as held for sale.
Defined Terms and Non-GAAP Reconciliations (continued)
(Unaudited)
We present FFO attributable to common share and unit holders, as well as on a per FFO share and unit basis, because we consider this metric to be an important measure of the performance of real estate companies, as do many investors and analysts in evaluating the Company. We believe that FFO attributable to common share and unit holders provides useful information to investors because this metric excludes depreciation, which is included in computing net income and assumes the value of real estate diminishes predictably over time. We believe that real estate values fluctuate due to market conditions and in response to inflation. We also believe that Core FFO and Adjusted FFO attributable to common share and unit holders, as well as on a per FFO share and unit basis, provide useful information to investors because they allow investors to compare our operating performance to prior reporting periods without the effect of certain items that, by nature, are not comparable from period to period.
FFO, Core FFO and Adjusted FFO attributable to common share and unit holders are not a substitute for net income or net cash provided by operating activities, each as determined in accordance with GAAP, as a measure of our operating performance, liquidity or ability to pay dividends. These metrics also are not necessarily indicative of cash available to fund future cash needs. Because other REITs may not compute these measures in the same manner, they may not be comparable among REITs.
Refer to Funds from Operations for a reconciliation of these metrics to net income attributable to common shareholders, determined in accordance with GAAP.
The following are reconciliations of property management expenses and general administrative expense, as determined in accordance with GAAP, to property management expenses, net of tenant charge-backs and excluding noncash share-based compensation expense, and general and administrative expense, excluding noncash share-based compensation expense, as included in Core FFO attributable to common share and unit holders (amounts in thousands):
| | | | | | | | | | | | | | | | | | | | | | | |
| For the Three Months Ended
Jun 30, | | For the Six Months Ended
Jun 30, |
| 2023 | | 2022 | | 2023 | | 2022 |
| Property management expenses | $ | 30,666 | | | $ | 28,768 | | | $ | 61,466 | | | $ | 54,802 | |
| Less: tenant charge-backs | (1,850) | | | (1,408) | | | (3,590) | | | (2,763) | |
| Less: noncash share-based compensation - property management | (1,132) | | | (1,132) | | | (2,198) | | | (2,131) | |
| Property management expenses, net | $ | 27,684 | | | $ | 26,228 | | | $ | 55,678 | | | $ | 49,908 | |
| | | | | | | |
| General and administrative expense | $ | 19,937 | | | $ | 18,847 | | | $ | 37,792 | | | $ | 36,129 | |
| Less: noncash share-based compensation - general and administrative | (5,982) | | | (5,932) | | | (9,725) | | | (9,962) | |
| General and administrative expense, net | $ | 13,955 | | | $ | 12,915 | | | $ | 28,067 | | | $ | 26,167 | |
Defined Terms and Non-GAAP Reconciliations (continued)
(Unaudited)
The following is a reconciliation of net income per common share–diluted to FFO attributable to common share and unit holders, Core FFO attributable to common share and unit holders and Adjusted FFO attributable to common share and unit holders on a per share and unit basis for the three and six months ended June 30, 2023 and 2022:
| | | | | | | | | | | | | | | | | | | | | | | |
| For the Three Months Ended
Jun 30, | | For the Six Months Ended
Jun 30, |
| 2023 | | 2022 | | 2023 | | 2022 |
| Net income per common share–diluted | $ | 0.27 | | | $ | 0.16 | | | $ | 0.59 | | | $ | 0.32 | |
| Adjustments: | | | | | | | |
| Conversion from GAAP share count | (0.03) | | | (0.02) | | | (0.07) | | | (0.04) | |
| Noncontrolling interests in the Operating Partnership | 0.03 | | | 0.02 | | | 0.07 | | | 0.04 | |
| Gain on sale and impairment of single-family properties and other, net | (0.15) | | | (0.08) | | | (0.36) | | | (0.14) | |
| | | | | | | |
| Depreciation and amortization | 0.27 | | | 0.26 | | | 0.56 | | | 0.52 | |
| Less: depreciation and amortization of non-real estate assets | (0.01) | | | (0.01) | | | (0.02) | | | (0.02) | |
| FFO attributable to common share and unit holders | $ | 0.38 | | | $ | 0.33 | | | $ | 0.77 | | | $ | 0.68 | |
| Adjustments: | | | | | | | |
| Acquisition, other transaction costs and other | 0.01 | | | 0.02 | | | 0.02 | | | 0.03 | |
| Noncash share-based compensation - general and administrative | 0.02 | | | 0.02 | | | 0.02 | | | 0.03 | |
| Noncash share-based compensation - property management | — | | | — | | | 0.01 | | | 0.01 | |
| | | | | | | |
| Redemption of perpetual preferred shares | — | | | 0.01 | | | — | | | 0.01 | |
| Core FFO attributable to common share and unit holders | $ | 0.41 | | | $ | 0.38 | | | $ | 0.82 | | | $ | 0.76 | |
| Recurring Capital Expenditures | (0.05) | | | (0.04) | | | (0.09) | | | (0.07) | |
| | | | | | | |
| Adjusted FFO attributable to common share and unit holders | $ | 0.36 | | | $ | 0.34 | | | $ | 0.73 | | | $ | 0.69 | |
FFO Shares and Units
Includes weighted-average common shares and operating partnership units outstanding, as well as potentially dilutive securities.
Occupied Property
A property is classified as occupied upon commencement (i.e., start date) of a lease agreement, which can occur contemporaneously with or subsequent to execution (i.e., signature).
Property Enhancing Capex
Includes elective capital expenditures to enhance the operating profile of a property, such as investments to increase future revenues or reduce maintenance expenditures.
Recurring Capital Expenditures
For our Same-Home portfolio, Recurring Capital Expenditures includes replacement costs and other capital expenditures recorded during the period that are necessary to help preserve the value and maintain functionality of our properties. For our total portfolio, we calculate Recurring Capital Expenditures by multiplying (a) current period actual Recurring Capital Expenditures per Same-Home property by (b) our total number of properties, excluding newly acquired non-stabilized properties and properties classified as held for sale.
Defined Terms and Non-GAAP Reconciliations (continued)
(Unaudited)
Retained Cash Flow
Retained Cash Flow is a non-GAAP financial measure that we believe is helpful as a supplemental measure in assessing the Company’s liquidity. This metric is computed by reducing Adjusted FFO attributable to common share and unit holders by common distributions.
Refer to Funds from Operations for a reconciliation of Adjusted FFO attributable to common share and unit holders to net income attributable to common shareholders, determined in accordance with GAAP. The following is a reconciliation of Adjusted FFO attributable to common share and unit holders to Retained Cash Flow (amounts in thousands):
| | | | | |
| For the Three Months Ended
Jun 30, 2023 |
| Adjusted FFO attributable to common share and unit holders | $ | 148,786 | |
| Common distributions | (91,463) | |
| Retained Cash Flow | $ | 57,323 | |
Same-Home Property
A property is classified as Same-Home if it has been stabilized longer than 90 days prior to the beginning of the earliest period presented under comparison. A property is removed from Same-Home if it has been classified as held for sale or has experienced a casualty loss.
Stabilized Property
A property acquired individually (i.e., not through a bulk purchase) is classified as stabilized once it has been renovated by the Company or newly constructed and then initially leased or available for rent for a period greater than 90 days. Properties acquired through a bulk purchase are first considered non-stabilized, as an entire group, until (1) we have owned them for an adequate period of time to allow for complete on-boarding to our operating platform, and (2) a substantial portion of the properties have experienced tenant turnover at least once under our ownership, providing the opportunity for renovations and improvements to meet our property standards. After such time has passed, properties acquired through a bulk purchase are then evaluated on an individual property basis under our standard stabilization criteria.
Total Capitalization
Includes the market value of all outstanding common shares and operating partnership units (based on the NYSE AMH Class A common share closing price as of period end), the current liquidation value of preferred shares as of period end and Total Debt.
Total Debt
Includes principal balances on asset-backed securitizations, unsecured senior notes and borrowings outstanding under our revolving credit facility as of period end, and excludes unamortized discounts and unamortized deferred financing costs.
Turnover Rate
The number of tenant move-outs during the period divided by the total number of properties.
Defined Terms and Non-GAAP Reconciliations (continued)
(Unaudited)
Unsecured Senior Notes Covenant Ratios and Unsecured Credit Facility Covenant Ratios
Debt covenant compliance ratios for the unsecured senior notes show the Company’s compliance with selected covenants provided in the Indenture dated as of February 7, 2018, as supplemented by the First Supplemental Indenture dated as of February 7, 2018 for the 2028 Unsecured Senior Notes, the Second Supplemental Indenture dated as of January 23, 2019 for the 2029 Unsecured Senior Notes, the Third Supplemental Indenture dated as of July 8, 2021 for the 2031 Unsecured Senior Notes, the Fourth Supplemental Indenture dated as of July 8, 2021 for the 2051 Unsecured Senior Notes, the Fifth Supplemental Indenture dated as of April 7, 2022 for the 2032 Unsecured Senior Notes, and the Sixth Supplemental Indenture dated as of April 7, 2022 for the 2052 Unsecured Senior Notes, which have been filed as exhibits to the Company’s SEC reports. The ratios for the Unsecured Credit Facility covenants show the Company’s compliance with selected covenants provided in the Amended and Restated Credit Agreement dated as of April 15, 2021, which has been filed as an exhibit to the Company’s SEC reports.
The debt covenant compliance ratios are provided only to show the Company’s compliance with certain covenants contained in the Indenture governing its unsecured debt securities and in the Credit Agreement, as of the date reported. These ratios should not be used for any other purpose, including without limitation to evaluate the Company’s financial condition or results of operations, nor do they indicate the Company’s covenant compliance as of any other date or for any other period. The capitalized terms in the disclosure are defined in the Indenture or the Credit Agreement, and may differ materially from similar terms used elsewhere in this document and used by other companies that present information about their covenant compliance. For risks related to failure to comply with these covenants, see “Risk Factors – Risks Related to Our Business” and other risks discussed in the Company’s Annual Report on Form 10-K for the year ended December 31, 2022, and in the Company’s subsequent filings with the SEC.
| | | | | | | | |
| Executive Management |
| | |
| David P. Singelyn | | Christopher C. Lau |
| Chief Executive Officer | | Chief Financial Officer |
| | |
| Bryan Smith | | Sara H. Vogt-Lowell |
| Chief Operating Officer | | Chief Legal Officer |
| | | | | | | | |
| AMH Diversified Portfolio |
| | |
| | | | | | | | |
| Corporate Information | | Investor Relations |
| 280 Pilot Road | | (855) 794-2447 |
| Las Vegas, NV 89119 | | investors@amh.com |
| | Media Relations |
| 23975 Park Sorrento, Suite 300 | |
| Calabasas, CA 91302 | | (855) 774-4663 |
| | media@amh.com |
| (702) 847-7800 | | |
| www.amh.com | | |