UNITED STATES
SECURITIES AND EXCHANGE COMMISSION
Washington, D.C. 20549
FORM N-CSR
CERTIFIED SHAREHOLDER REPORT OF REGISTERED
MANAGEMENT INVESTMENT COMPANIES
Investment Company Act file number: 811-22747
ALPS SERIES TRUST
(Exact name of registrant as specified in charter)
1290 Broadway, Suite 1100, Denver, Colorado 80203
(Address of principal executive offices) (Zip code)
303.623.5277
(Registrant’s telephone number, including area code)
Richard C. Noyes, Esq., Secretary
ALPS Series Trust
1290 Broadway, Suite 1100
Denver, CO 80203
(Name and address of agent for service)
Date of fiscal year end: September 30
Date of reporting period: October 1, 2016 – September 30, 2017
Item 1. Reports to Stockholders.

Table of Contents
|
Shareholder Letter
|
2
|
|
Portfolio Update
|
|
|
Clarkston Partners Fund
|
5
|
|
Clarkston Fund
|
9
|
|
Clarkston Select Fund
|
13
|
|
Clarkston Founders Fund
|
17
|
|
Disclosure of Fund Expenses
|
21
|
|
Portfolios of Investments
|
|
|
Clarkston Partners Fund
|
23
|
|
Clarkston Fund
|
25
|
|
Clarkston Select Fund
|
27
|
|
Clarkston Founders Fund
|
29
|
|
Statements of Assets and Liabilities
|
31
|
|
Statements of Operations
|
34
|
|
Statements of Changes in Net Assets
|
|
|
Clarkston Partners Fund
|
36
|
|
Clarkston Fund
|
37
|
|
Clarkston Select Fund
|
38
|
|
Clarkston Founders Fund
|
39
|
|
Financial Highlights
|
40
|
|
Notes to Financial Statements
|
47
|
|
Report of Independent Registered Public Accounting Firm
|
59
|
|
Additional Information
|
60
|
|
Trustees and Officers
|
65
|
|
Clarkston Funds
|
Shareholder Letter
|
September 30, 2017 (Unaudited)
At the end of September 2017, the five-year average annual return on the Russell 3000® Index, which includes the 3000 largest U.S. companies, was 14.23%; more than 400 basis points higher than the long-term historical average for equities. The Russell 3000® Index five-year earnings growth of 6.25% has lagged price growth and therefore, valuations, by most market measures, are elevated. Opportunities in what we consider to be the high-quality universe are scarce, as most businesses are priced near or above fair value.
We find ourselves in a conundrum. Do we ignore valuations and purchase what we consider to be overvalued securities, praying that the market will charge even higher over the next several months? Our issue with this approach is that we know there is a fair chance that we may permanently impair the Funds’ capital. Or, do we acknowledge that we believe opportunities are scarce, exercise patience, let cash sit idle in the Funds’ portfolios, and wait for future opportunities. If we choose the latter, we may miss an opportunity if prices continue to rise.
Our answer is guided by the type of investor we are. We believe that investors come in two forms: those that focus on returns and those that focus on risk. Investors who focus on returns tend to perform better in rising markets. Risk-focused investors perform relatively better in falling markets. Clarkston Capital is focused on risk. Our primary goal is to protect the Funds’ capital; then and only then do we hope to grow it.
We define risk as the probability or likelihood of a permanent loss on an investment. We do not believe that risk has anything to do with short-term price volatility, and although academics try, risk cannot be measured. Rather than attempting to measure risk, we perform thorough analysis attempting to reduce it. We group risk into three categories; risk of the underlying investment, market risk, and unknown risk. This requires an understanding of the value of the underlying investment and the price at which it is purchased, which should be less than the value.
As it relates to the underlying investment, we focus on three types of risks; business, financial, and management. Business risk pertains to a company’s ability to cover costs of doing business with the cash flow it generates. We address business risk by purchasing companies that we consider to have high returns on capital and sustainable competitive advantages. Financial risk is a function of how a company finances its assets. We consider companies with too much debt to be risky investments. We address financial risk by analyzing assets, the certainty of future cash flows, and the leverage used to purchase those assets. Analyzing management risk requires both objective analysis (management history and capital allocation track record) and subjective analysis (candor and business culture). Our goal in carefully analyzing these risks is to gain comfort with our assessment of the value of the business, which serves as an anchor for making our buy and sell decisions.
Market risk is associated with market forces such as interest rates, commodity prices, geopolitical upheaval, and market sentiment. We have little faith in our abilities to make macroeconomic forecasts as it is impossible to predict the future. Still, we work hard to understand how these risks affect the businesses held in the Funds’ portfolios and the free cash flow those businesses generate. We strive to reduce market risk by utilizing normalized and conservative free cash flow and growth estimates and by assessing how worst-case scenarios affect fundamentals. However, we have found that the way to potentially reduce market risks is to make buy decisions only when there is a margin of safety, which we consider to exist when the market price of a security is below our assessment of the intrinsic value of the underlying business.
|
2
|
www.clarkstonfunds.com
|
|
Clarkston Funds
|
Shareholder Letter
|
|
September 30, 2017 (Unaudited)
Even after we have assessed the risks associated with an investment and the market, unavoidable risks always remain. These unknown risks include both miscalculations or errors we may have made in our analysis and unknowable events such as natural disasters and/or terrorist acts. Again, our first line of defense against unknown risks is a margin of safety.
Our last line of defense is holding cash. If risk is the loss of permanent capital, then we think it would be imprudent to make an investment in a business when there is a high probability of losing capital. Instead, we allow the Funds to hold cash when we cannot find a business that meets our quality criteria and is trading at a margin of safety or when we cannot justify adding capital to an existing holding because the size of its position in the portfolio is optimal based on its quality and valuation. While cash is not ideal as it provides little to no real return in the current market environment, it can serve as a valuable asset.
Cash can preserve purchasing power. In a broadly declining market, all businesses tend to lose market value. If an investor is fully invested, the investor is forced to liquidate assets in order to purchase new assets that are attractively priced because of the market decline. To raise cash, the investor must sell an asset that is now worth less than it was prior to the decline. Consequently, the investor will have less cash and will be able to buy less of a now attractively priced asset than if the investor held an asset that does not lose purchasing power; cash.
Cash is liquid and liquidity can be valuable when no one else has it. In market dislocations, some participants are forced to sell assets due to liquidity constraints. Some of them will sell at bargain prices. If an investor has immediately available liquidity, that investor may be presented with opportunities others are not because they do not have accessible cash.
We do not want to leave shareholders with the impression that we are calling a market peak, nor are we asking you to change your investment philosophy. Our intent is to explain how we think about investing and how you can expect us to act given this high-valuation environment. Our goal is to preserve the capital that you’ve invested in the Funds and hopefully grow it without taking on excessive risks. Believe us when we say we do not take this task lightly. And, if this letter strikes a chord because you too have a risk-first personality, then we ask that you remain patient. Regardless of how this unfolds, we continue to position the Funds for performance over longer periods of time.
Sincerely,
|
Jeffrey A. Hakala, CFA, CPA
|
Jerry W. Hakala, CFA |
 |
 |
The Russell 3000® Index measures the performance of the largest 3,000 U.S. companies representing approximately 98% of the investable U.S. equity market. You cannot invest directly in an index, securities in a Fund will not match those in any index, and performance of a Fund will differ. Indexes are unmanaged and are broad based. Indexes contain many more stocks than a Fund and indexes do not include cash holdings. Although reinvestment of dividend and interest payments is assumed, no expenses are netted against an index’s returns. Index performance information was furnished by sources deemed reliable and is believed to be accurate, however, no warranty or representation is made as to the accuracy thereof and the information is subject to correction.
|
Annual Report | September 30, 2017
|
3
|
|
Clarkston Funds
|
Shareholder Letter
|
|
September 30, 2017 (Unaudited)
The long-term historical average for equities is measured by the geometric average of the annual returns on investments in the S&P 500 Index for the period from 1928 through 2016. Valuation market measures are: Robert Shiller’s cyclically adjusted price-earnings (CAPE) Ratio, Wilshire 5000 Full Cap Price Index to gross domestic product (GDP) ratio, and the S&P 500 Index price to sales ratio. Robert Shiller’s cyclically adjusted price-to-earnings ratio, commonly known as CAPE, is a forecasting model for long-term future stock returns and is defined as price divided by the average of ten years of earnings (moving average), adjusted for inflation. The Wilshire 5000 Full Cap Price Index to gross domestic product (GDP) ratio is a ratio used to determine whether an overall market is undervalued or overvalued. The Wilshire 5000 Full Cap Price Index is a market-capitalization-weighted index of the market value of all stocks actively traded in the United States. GDP is the monetary value of all the finished goods and services produced within a country’s borders in a specific time period. The S&P 500 Index is an unmanaged index consisting of 500 stocks that is used as a leading indicator of large-cap U.S. equity performance. Price to sales ratio is a company’s current price divided by its total sales over a 12-month period and is used to indicate how much the market values every dollar of a company’s sales.
Earnings growth is a measure of growth in a company's net income over a specific period. Price growth is a measure of growth in a company's share price over a specific period.
Frank Russell Company (“Russell”) is the source and owner of the trademarks, service marks and copyrights related to the Russell Indexes. Russell® is a trademark of Frank Russell Company. Neither Russell nor its licensors accept any liability for any errors or omissions in the Russell Indexes or underlying data and no party may rely on any Russell Indexes and/or underlying data contained in this communication. No further distribution of Russell Data is permitted without Russell’s express written consent. Russell does not promote, sponsor or endorse the content of this communication.
Past performance does not guarantee future results. The views and information discussed in this letter are as of the date of publication, are subject to change, and may not reflect the writer’s current views. The views expressed are those of Clarkston Capital Partners, LLC, the investment adviser to the Clarkston Funds, and represent an assessment of market conditions at a specific point in time, are opinions only and should not be relied upon as investment advice regarding a particular investment or markets in general. The information provided does not constitute a recommendation to buy or sell specific securities or investment vehicles. It should not be assumed that any investment will be profitable or will equal the performance of any securities or any sectors mentioned in this letter. The subject matter contained in this letter has been derived from several sources believed to be reliable and accurate at the time of compilation. Neither the Clarkston Funds nor Clarkston Capital Partners, LLC accepts any liability for losses, either direct or consequential, caused by the use of this information.
|
4
|
www.clarkstonfunds.com
|
|
Clarkston Partners Fund
|
Portfolio Update
|
|
September 30, 2017 (Unaudited)
CLARKSTON PARTNERS FUND – MANAGEMENT’S DISCUSSION OF FUND PERFORMANCE
For the twelve months ended September 30, 2017, the Clarkston Partners Fund – Institutional Class (the “Fund”) gained 12.75%. The RussellTM 2500 Index gained 17.79% during the same period.
The Fund’s Financial Services sector holdings showed strong performance during the period due to the rise in U.S. interest rates and investor anticipation of the Trump administration’s pro-growth agenda. Driven by these macro themes, LPL Financial Holdings Inc. (LPLA) and Brown & Brown, Inc. (BRO) were positive contributors to the Fund’s performance during the period. Both businesses derive nearly all their revenue and profits domestically, and share prices likely also benefited from the prospect of U.S. corporate tax reform. Brown & Brown, Inc. benefited from the perceived “hardening” of the insurance pricing market after several major hurricanes impacted the U.S.
Negative performers in the Fund during the period included The Western Union Company (WU) and Equifax, Inc. (EFX). Perceived competition from venture capital-backed payment start-ups continued to stubbornly weigh on Western Union’s share price. We continue to educate ourselves to better understand these entrants and how they are attempting to disrupt Western Union’s business model. Western Union’s compliance network and cash-to-cash business provide strong barriers to entry, giving us confidence in our long-term outlook for the company. The early September announcement of a data breach at Equifax weighed heavily on its share price. We spent considerable time re-assessing Equifax’s valuation as we analyzed new information and the effect on the company’s future free cash flow.
The Fund’s cash balance remained elevated as the high-valuation environment caused us to exercise extreme patience. We saw some price dislocation, particularly in the shares of companies perceived to be directly or indirectly in the crosshairs of e-commerce competitors. Companies that offer price transparency, product selection, and convenience posed threats to traditional competitors. Incumbents in markets susceptible to disruption, now more than ever, need to re-affirm their value proposition to maintain market share. We spent considerable time analyzing these perceived risks and how they may affect traditional competitors in the years ahead.
During the year, we sold the Fund’s positions in Federated Investors, Inc. (FII), NOW, Inc. (DNOW), and Cable One, Inc. (CABO). The sales of Federated Investors and Cable One were largely based on valuation. The sale of DNOW was based in part on valuation but also driven by our concerns over oil and gas operator efficiency and how that might reduce the need for products distributed by DNOW. No new holdings were added to the Fund during the year.
Sectors referenced are Russell Global Sectors.
|
Annual Report | September 30, 2017
|
5
|
|
Clarkston Partners Fund
|
Portfolio Update
|
|
September 30, 2017 (Unaudited)
Top Ten Holdings (as a % of Net Assets)*
|
The Western Union Co.
|
6.02%
|
|
Willis Towers Watson PLC
|
5.75%
|
|
LPL Financial Holdings, Inc.
|
5.53%
|
|
Legg Mason, Inc.
|
5.14%
|
|
Brown & Brown, Inc.
|
4.95%
|
|
Broadridge Financial Solutions, Inc.
|
4.23%
|
|
John Wiley & Sons, Inc.
|
3.85%
|
|
C.H. Robinson Worldwide, Inc.
|
3.68%
|
|
Hillenbrand, Inc.
|
3.50%
|
|
Stericycle, Inc.
|
3.09%
|
|
Top Ten Holdings
|
45.74%
|
Sector Allocation (as a % of Net Assets)*
|
Financial Services
|
34.26%
|
|
Producer Durables
|
21.33%
|
|
Consumer Discretionary
|
6.90%
|
|
Consumer Staples
|
4.22%
|
|
Materials & Processing
|
1.79%
|
|
Technology
|
1.73%
|
|
Cash, Cash Equivalents, & Other Net Assets
|
29.77%
|
|
Total
|
100.00%
|
|
*
|
Holdings are subject to change, and may not reflect the current or future position of the portfolio.
|
|
6
|
www.clarkstonfunds.com
|
|
Clarkston Partners Fund
|
Portfolio Update
|
September 30, 2017 (Unaudited)
Performance of a Hypothetical $25,000 Initial Investment (at Inception* through September 30, 2017)
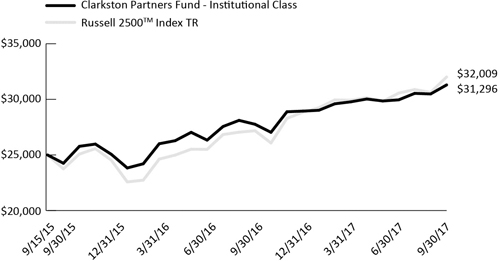
The graph shown above represents historical performance of a hypothetical investment of $25,000 in the Institutional Class. Due to differing expenses, performance of the Founders Class will vary. Past performance does not guarantee future results. All returns reflect reinvested dividends, but do not reflect the deduction of taxes that a shareholder would pay on Fund distributions or the redemption of Fund shares.
Average Annual Total Returns (as of September 30, 2017)
|
3 Month
|
6 Month
|
1 Year
|
Since Inception*
|
|
|
Clarkston Partners Fund – Founders Class
|
4.47%
|
5.18%
|
12.86%
|
11.81%
|
|
Clarkston Partners Fund – Institutional Class
|
4.48%
|
5.10%
|
12.75%
|
11.63%
|
|
Russell 2500TM Index TR
|
4.74%
|
6.98%
|
17.79%
|
12.87%
|
The performance data quoted above represents past performance. Past performance is not a guarantee of future results. Investment return and value of the Fund shares will fluctuate so that an investor’s shares, when sold or redeemed, may be worth more or less than their original cost. Performance may be lower or higher than performance data quoted. Fund performance current to the most recent month end is available by calling (844) 680-6562 or by visiting www.clarkstonfunds.com.
|
*
|
Fund’s inception date is September 15, 2015.
|
The Russell 2500TM Index TR measures the performance of the small- to mid-cap segment of the U.S. equity universe, commonly referred to as “smid” cap. The Russell 2500TM Index TR is a subset of the Russell 3000® Index. It includes approximately 2,500 of the smallest securities based on a combination of their market cap and current index membership. The Russell 2500TM Index TR is constructed to provide a comprehensive and unbiased barometer for the small- to mid-cap segment. The Russell 3000® Index measures the performance of the largest 3,000 U.S. companies representing approximately 98% of the investable U.S. equity market.
Frank Russell Company (“Russell”) is the source and owner of the trademarks, service marks and copyrights related to the Russell Indexes. Russell® is a trademark of Frank Russell Company.
|
Annual Report | September 30, 2017
|
7
|
|
Clarkston Partners Fund
|
Portfolio Update
|
September 30, 2017 (Unaudited)
Neither Russell nor its licensors accept any liability for any errors or omissions in the Russell Indexes or underlying data and no party may rely on any Russell Indexes and/or underlying data contained in this communication. No further distribution of Russell Data is permitted without Russell’s express written consent. Russell does not promote, sponsor or endorse the content of this communication.
Returns of less than 1 year are cumulative.
Indices are not actively managed and do not reflect a deduction for fees, expenses or taxes. An investor cannot invest directly in an index.
The returns shown above do not reflect the deduction of taxes a shareholder would pay on Fund distributions or redemption of Fund shares.
The total annual operating expenses and total annual operating expenses after fee waivers and/or reimbursement you may pay as an investor in the Fund’s Founders Class and Institutional Class shares (as reported in the January 28, 2017 Prospectus), are 1.02% and 0.85% and 1.16% and 1.00%, respectively. The Fund’s investment adviser has contractually agreed to limit expenses through January 31, 2018.
|
8
|
www.clarkstonfunds.com
|
|
Clarkston Fund
|
Portfolio Update
|
|
September 30, 2017 (Unaudited)
CLARKSTON FUND – MANAGEMENT’S DISCUSSION OF FUND PERFORMANCE
For the twelve months ended September 30, 2017, the Clarkston Fund – Institutional Class (the “Fund”) gained 10.13%. The Russell 1000® Index gained 18.54% during the same period.
The Fund’s Financial Services sector holdings showed strong performance during the period due to the rise in U.S. interest rates, better than expected U.S. consumer spending growth, and investor anticipation of the Trump administration’s pro-growth agenda. Driven by these macro themes, American Express Company (AXP), Charles Schwab Corporation (SCHW), Capital One Financial Corporation (COF), U.S. Bancorp (USB), and Willis Towers Watson PLC (WLTW) were positive contributors to the Fund’s performance during the period. Willis benefitted from the perceived “hardening” of the insurance pricing market after several major hurricanes impacted the U.S.
As investors’ love for “younger,” growthier technology businesses, including FAANG, grew so did their lack of appreciation of slower growing, mature technology holdings. This general distaste for “old tech” has, in our opinion, led to attractive valuations in names like International Business Machines (IBM), which is viewed as a stodgy, out-of-date technology company, despite innovations in its Cloud and Cognitive Solutions businesses.
Perceived competition from venture capital-backed payment start-ups continued to stubbornly weigh on The Western Union Company’s (WU) share price. We continue to educate ourselves to better understand these entrants and how they are attempting to disrupt Western Union’s business model. Western Union’s compliance network and cash-to-cash business provide strong barriers to entry, giving us confidence in our long-term outlook for the company. The share price of General Electric Company (GE) fell considerably over the period. GE has been undergoing significant changes in leadership amid selling off assets and re-focusing on its core industrial businesses. While we recognize that serious challenges lie ahead for GE, we believe the earnings power of the business has been vastly underappreciated.
During the year, we initiated Fund positions in Markel Corporation (MKL), AmerisourceBergen Corporation (ABC), McKesson Corporation (MCK), and Anheuser-Busch InBev SA/NV (BUD). We believed that these four businesses possessed identifiable competitive advantages in their respective industries and, therefore, increased the overall quality of the Fund’s portfolio. During the year, we sold the Fund’s positions in Pfizer, Inc. (PFE) and Deere & Co. (DE). The sale of Pfizer was based on valuation, while the sale of Deere was based on our concerns regarding the company’s financial services segment.
Sectors referenced are Russell Global Sectors.
FAANG is an acronym for five technology stocks, namely Facebook, Apple, Amazon, Netflix, and Alphabet’s Google.
|
Annual Report | September 30, 2017
|
9
|
|
Clarkston Fund
|
Portfolio Update
|
|
September 30, 2017 (Unaudited)
Top Ten Holdings (as a % of Net Assets)*
|
General Electric Co.
|
6.58%
|
|
The Western Union Co.
|
4.96%
|
|
The Procter & Gamble Co.
|
4.95%
|
|
Sysco Corp.
|
4.59%
|
|
Johnson & Johnson
|
4.42%
|
|
Microsoft Corp.
|
4.05%
|
|
American Express Co.
|
4.00%
|
|
International Business Machines Corp.
|
3.95%
|
|
Diageo PLC
|
3.82%
|
|
PepsiCo, Inc.
|
3.79%
|
|
Top Ten Holdings
|
45.11%
|
Sector Allocation (as a % of Net Assets)*
|
Financial Services
|
22.70%
|
|
Consumer Staples
|
21.53%
|
|
Producer Durables
|
14.18%
|
|
Technology
|
11.55%
|
|
Health Care
|
10.24%
|
|
Consumer Discretionary
|
3.64%
|
|
Cash, Cash Equivalents, & Other Net Assets
|
16.16%
|
|
Total
|
100.00%
|
| * |
Holdings are subject to change, and may not reflect the current or future position of the portfolio.
|
|
10
|
www.clarkstonfunds.com
|
|
Clarkston Fund
|
Portfolio Update
|
|
September 30, 2017 (Unaudited)
Performance of a Hypothetical $10,000 Initial Investment (at Inception* through September 30, 2017)

The graph shown above represents historical performance of a hypothetical investment of $10,000 in the Institutional Class. Past performance does not guarantee future results. All returns reflect reinvested dividends, but do not reflect the deduction of taxes that a shareholder would pay on Fund distributions or the redemption of Fund shares.
Average Annual Total Returns (as of September 30, 2017)
|
3 Month
|
6 Month
|
1 Year
|
Since Inception*
|
|
|
Clarkston Fund – Institutional Class
|
2.14%
|
2.78%
|
10.13%
|
10.32%
|
|
Russell 1000® Index TR
|
4.48%
|
7.68%
|
18.54%
|
16.47%
|
The performance data quoted above represents past performance. Past performance is not a guarantee of future results. Investment return and value of the Fund shares will fluctuate so that an investor’s shares, when sold or redeemed, may be worth more or less than their original cost. Performance may be lower or higher than performance data quoted. Fund performance current to the most recent month-end is available by calling (844) 680-6562 or by visiting www.clarkstonfunds.com.
|
*
|
Fund’s inception date is April 1, 2016.
|
The Russell 1000® Index TR measures the performance of the large-cap segment of the U.S. equity universe. It is a subset of the Russell 3000® Index and includes approximately 1,000 of the largest securities based on a combination of their market cap and current index membership. The Russell 1000® Index TR represents approximately 92% of the U.S. market. The Russell 1000® Index TR is constructed to provide a comprehensive and unbiased barometer for the large-cap segment and is completely reconstituted annually to ensure new and growing equities are reflected.
Frank Russell Company (“Russell”) is the source and owner of the trademarks, service marks and copyrights related to the Russell Indexes. Russell® is a trademark of Frank Russell Company. Neither Russell nor its licensors accept any liability for any errors or omissions in the Russell Indexes or underlying data and no party may rely on any Russell Indexes and/or underlying data contained in this communication. No further distribution of Russell Data is permitted without Russell’s express written consent. Russell does not promote, sponsor or endorse the content of this communication.
|
Annual Report | September 30, 2017
|
11
|
|
Clarkston Fund
|
Portfolio Update
|
|
September 30, 2017 (Unaudited)
Returns of less than 1 year are cumulative.
Indices are not actively managed and do not reflect a deduction for fees, expenses or taxes. An investor cannot invest directly in an index.
The returns shown above do not reflect the deduction of taxes a shareholder would pay on Fund distributions or redemption of Fund shares.
The total annual operating expenses and total annual operating expenses after fee waivers and/or reimbursement you may pay as an investor in the Fund’s Institutional Class shares (as reported in the January 28, 2017 Prospectus), are 1.48% and 0.70%, respectively. The Fund’s investment adviser has contractually agreed to limit expenses through January 31, 2018.
|
12
|
www.clarkstonfunds.com
|
|
Clarkston Select Fund
|
Portfolio Update
|
|
September 30, 2017 (Unaudited)
CLARKSTON SELECT FUND – MANAGEMENT’S DISCUSSION OF FUND PERFORMANCE
For the eight months ended September 30, 2017, the Clarkston Select Fund – Institutional Class (the “Fund”) gained 6.21%. The Russell 1000 Index gained 11.92% during the same period.
The Fund’s Financial Services sector holdings showed strong performance during the period due to the rise in U.S. interest rates, better than expected U.S. consumer spending growth, and investor anticipation of the Trump administration’s pro-growth agenda. Driven by these macro themes, T. Rowe Price Group (TROW), American Express Company (AXP), U.S. Bancorp (USB), and Capital One Financial Corporation (COF) were positive contributors to the Fund’s performance during the period.
As investors’ love for “younger,” growthier technology businesses, including FAANG, grew so did their lack of appreciation of slower growing, mature technology holdings. This general distaste for “old tech”, in our opinion, led to attractive valuations in names like International Business Machines (IBM), which is viewed as a stodgy, out-of-date technology company, despite innovations in its Cloud and Cognitive Solutions businesses.
Perceived competition from venture capital-backed payment start-ups continued to stubbornly weigh on The Western Union Company’s (WU) share price. We continue to educate ourselves to better understand these entrants and how they are attempting to disrupt Western Union’s business model. Western Union’s compliance network and cash-to-cash business provide strong barriers to entry, giving us confidence in our long-term outlook for the company. The share price of General Electric Company (GE) fell considerably over the period. GE has been undergoing significant changes in leadership amid selling off assets and re-focusing on its core industrial businesses. While we recognize that serious challenges lie ahead for GE, we believe the earnings power of the business has been vastly underappreciated.
During the period, we initiated Fund positions in T. Rowe Price Group (TROW) and Nielsen Holdings PLC (NLSN). We believe both companies possess strong competitive advantages with the ability to compound capital and return cash to shareholders. We exited the Fund’s positions in Willis Towers Watson PLC (WLTW) and Broadridge Financial Solutions (BR) after garnering a better understanding for both companies’ capital allocation strategies and determining they were no longer suited for the Fund.
Sectors referenced are Russell Global Sectors.
FAANG is an acronym for five technology stocks, namely Facebook, Apple, Amazon, Netflix, and Alphabet’s Google.
|
Annual Report | September 30, 2017
|
13
|
|
Clarkston Select Fund
|
Portfolio Update
|
|
September 30, 2017 (Unaudited)
Top Ten Holdings (as a % of Net Assets)*
|
General Electric Co.
|
6.16%
|
|
The Procter & Gamble Co.
|
5.40%
|
|
Sysco Corp.
|
5.04%
|
|
The Western Union Co.
|
4.89%
|
|
Microsoft Corp.
|
4.74%
|
|
International Business Machines Corp.
|
4.31%
|
|
Cisco Systems, Inc.
|
4.28%
|
|
PepsiCo, Inc.
|
4.26%
|
|
Paychex, Inc.
|
4.07%
|
|
Johnson & Johnson
|
3.53%
|
|
Top Ten Holdings
|
46.68%
|
Sector Allocation (as a % of Net Assets)*
|
Consumer Staples
|
20.84%
|
|
Producer Durables
|
20.37%
|
|
Financial Services
|
15.27%
|
|
Technology
|
13.33%
|
|
Health Care
|
6.56%
|
|
Consumer Discretionary
|
3.92%
|
|
Materials & Processing
|
2.32%
|
|
Cash, Cash Equivalents, & Other Net Assets
|
17.39%
|
|
Total
|
100.00%
|
| * |
Holdings are subject to change, and may not reflect the current or future position of the portfolio.
|
|
14
|
www.clarkstonfunds.com
|
|
Clarkston Select Fund
|
Portfolio Update
|
|
September 30, 2017 (Unaudited)
Performance of a Hypothetical $10,000 Initial Investment (at Inception* through September 30, 2017)
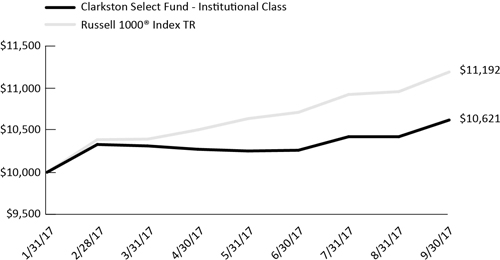
The graph shown above represents historical performance of a hypothetical investment of $10,000 in the Institutional Class. Past performance does not guarantee future results. All returns reflect reinvested dividends, but do not reflect the deduction of taxes that a shareholder would pay on Fund distributions or the redemption of Fund shares.
Average Annual Total Returns (as of September 30, 2017)
|
3 Month
|
6 Month
|
Since Inception*
|
|
|
Clarkston Select Fund – Institutional Class
|
3.50%
|
2.98%
|
6.21%
|
|
Russell 1000® Index TR
|
4.48%
|
7.68%
|
11.92%
|
The performance data quoted above represents past performance. Past performance is not a guarantee of future results. Investment return and value of the Fund shares will fluctuate so that an investor’s shares, when sold or redeemed, may be worth more or less than their original cost. Performance may be lower or higher than performance data quoted. Fund performance current to the most recent month end is available by calling (844) 680-6562 or by visiting www.clarkstonfunds.com.
|
*
|
Fund’s inception date is January 31, 2017.
|
The Russell 1000® Index TR measures the performance of the large-cap segment of the U.S. equity universe. It is a subset of the Russell 3000® Index and includes approximately 1,000 of the largest securities based on a combination of their market cap and current index membership. The Russell 1000® represents approximately 92% of the U.S. market. The Russell 1000® Index TR is constructed to provide a comprehensive and unbiased barometer for the large-cap segment and is completely reconstituted annually to ensure new and growing equities are reflected.
Frank Russell Company (“Russell”) is the source and owner of the trademarks, service marks and copyrights related to the Russell Indexes. Russell® is a trademark of Frank Russell Company. Neither Russell nor its licensors accept any liability for any errors or omissions in the Russell Indexes or underlying data and no party may rely on any Russell Indexes and/or underlying data contained in this communication. No further distribution of Russell Data is permitted without Russell’s express written consent. Russell does not promote, sponsor or endorse the content of this communication.
|
Annual Report | September 30, 2017
|
15
|
|
Clarkston Select Fund
|
Portfolio Update
|
|
September 30, 2017 (Unaudited)
Returns of less than 1 year are cumulative.
Indices are not actively managed and do not reflect a deduction for fees, expenses or taxes. An investor cannot invest directly in an index.
The returns shown above do not reflect the deduction of taxes a shareholder would pay on Fund distributions or redemption of Fund shares.
The total annual operating expenses and total annual operating expenses after fee waivers and/or reimbursement you may pay as an investor in the Fund’s Institutional Class shares (as reported in the January 28, 2017 Prospectus), are 1.28% and 0.70%, respectively. The Fund’s investment adviser has contractually agreed to limit expenses through January 31, 2018.
The Fund is new and has a limited operating history.
|
16
|
www.clarkstonfunds.com
|
|
Clarkston Founders Fund
|
Portfolio Update
|
|
September 30, 2017 (Unaudited)
CLARKSTON FOUNDERS FUND – MANAGEMENT’S DISCUSSION OF FUND PERFORMANCE
For the eight months ended September 30, 2017, the Clarkston Founders Fund – Institutional Class (the “Fund”) gained 6.40%. The Russell Midcap® Index gained 9.11% during the same period.
The Fund’s Financial Services sector holdings showed strong performance during the period due to the rise in U.S. interest rates and investor anticipation of the Trump administration’s pro-growth agenda. Driven by these macro themes, Brown & Brown, Inc. (BRO), The Charles Schwab Corporation (SCHW), and Broadridge Financial Solutions, Inc. (BR) were positive contributors to the Fund’s performance during the period. All three businesses derive much of their revenue and profits domestically, and share prices likely also benefited from the prospect of U.S. corporate tax reform. Brown & Brown, Inc. benefitted from the perceived “hardening” of the insurance pricing market after several major hurricanes impacted the U.S.
Stericycle, Inc. (SRCL), The Western Union Company (WU), and Equifax Inc. (EFX) were negatively impacted by one-off, company specific issues rather than broader trends. For example, temporary pricing challenges and a continued industrial slow down weighed on Stericycle’s performance throughout the year. Perceived competition from venture capital-backed payment start-ups continued to stubbornly weigh on Western Union’s share price. We continue to educate ourselves to better understand these entrants and how they are attempting to disrupt Western Union’s business model. Western Union’s compliance network and cash-to-cash business provide strong barriers to entry, giving us confidence in our long-term outlook for the company. The early September announcement of a data breach at Equifax weighed heavily on its share price. We spent considerable time re-assessing Equifax’s valuation as we analyzed new information and the effect on the company’s future free cash flow.
The Fund’s cash balance remained elevated as the high-valuation environment caused us to exercise extreme patience. We saw some price dislocation, particularly in the shares of companies perceived to be directly or indirectly in the crosshairs of e-commerce competitors. Companies that offer price transparency, product selection, and convenience posed threats to traditional competitors. Incumbents in markets susceptible to disruption, now more than ever, need to re-affirm their value proposition to maintain market share. We spent considerable time analyzing these perceived risks and how they may affect traditional competitors in the years ahead.
During the period, we sold the Fund’s positions in Discovery Communications, Inc. (DISCK) and Colfax Corporation (CFX). The sale of Colfax was based on valuation, while the sale of Discovery was based mainly on the uncertainty surrounding the “unbundling” of the cable environment and changing content delivery methods. New positions purchased in the Fund included LKQ Corporation (LKQ) and Nielsen Holdings Plc (NLSN). LKQ provides recycled and aftermarket auto parts to collision repair body-shops and mechanical repair shops in North America and Europe. Nielsen provides global marketing data collection and analytics services. We considered both to be high-quality businesses that offered attractive investment entry points throughout the year.
Sectors referenced are Russell Global Sectors.
|
Annual Report | September 30, 2017
|
17
|
|
Clarkston Founders Fund
|
Portfolio Update
|
|
September 30, 2017 (Unaudited)
Top Ten Holdings (as a % of Net Assets)*
|
The Western Union Co.
|
6.12%
|
|
Willis Towers Watson PLC
|
5.43%
|
|
Sysco Corp.
|
5.14%
|
|
Brown & Brown, Inc.
|
5.09%
|
|
Broadridge Financial Solutions, Inc.
|
4.69%
|
|
Legg Mason, Inc.
|
4.07%
|
|
C.H. Robinson Worldwide, Inc.
|
3.62%
|
|
Stericycle, Inc.
|
3.11%
|
|
The Charles Schwab Corp.
|
3.08%
|
|
McCormick & Co., Inc.
|
2.98%
|
|
Top Ten Holdings
|
43.33%
|
Sector Allocation (as a % of Net Assets)*
|
Financial Services
|
32.82%
|
|
Producer Durables
|
14.80%
|
|
Consumer Staples
|
8.11%
|
|
Health Care
|
4.53%
|
|
Consumer Discretionary
|
3.17%
|
|
Materials & Processing
|
2.17%
|
|
Technology
|
1.83%
|
|
Cash, Cash Equivalents, & Other Net Assets
|
32.57%
|
|
Total
|
100.00%
|
| * |
Holdings are subject to change, and may not reflect the current or future position of the portfolio.
|
|
18
|
www.clarkstonfunds.com
|
|
Clarkston Founders Fund
|
Portfolio Update
|
|
September 30, 2017 (Unaudited)
Performance of a Hypothetical $10,000 Initial Investment (at Inception* through September 30, 2017)

The graph shown above represents historical performance of a hypothetical investment of $10,000 in the Institutional Class. Past performance does not guarantee future results. All returns reflect reinvested dividends, but do not reflect the deduction of taxes that a shareholder would pay on Fund distributions or the redemption of Fund shares.
Average Annual Total Returns (as of September 30, 2017)
|
3 Month
|
6 Month
|
Since Inception*
|
|
|
Clarkston Founders Fund – Institutional Class
|
2.50%
|
3.60%
|
6.40%
|
|
Russell Midcap® Index TR
|
3.47%
|
6.27%
|
9.11%
|
The performance data quoted above represents past performance. Past performance is not a guarantee of future results. Investment return and value of the Fund shares will fluctuate so that an investor’s shares, when sold or redeemed, may be worth more or less than their original cost. Performance may be lower or higher than performance data quoted. Fund performance current to the most recent month end is available by calling (844) 680-6562 or by visiting www.clarkstonfunds.com.
|
*
|
Fund’s inception date is January 31, 2017.
|
The Russell Midcap® Index is a market capitalization weighted index that measures the performance of the mid-capitalization sector of the U.S. equity market and includes approximately 800 of the smallest issuers in the Russell 1000® Index. The Russell 1000® Index includes the 1,000 largest stocks in the Russell 3000® Index, which consists of the 3,000 largest U.S. public companies.
Frank Russell Company (“Russell”) is the source and owner of the trademarks, service marks and copyrights related to the Russell Indexes. Russell® is a trademark of Frank Russell Company. Neither Russell nor its licensors accept any liability for any errors or omissions in the Russell Indexes or underlying data and no party may rely on any Russell Indexes and/or underlying data contained in this communication. No further distribution of Russell Data is permitted without Russell’s express written consent. Russell does not promote, sponsor or endorse the content of this communication.
|
Annual Report | September 30, 2017
|
19
|
|
Clarkston Founders Fund
|
Portfolio Update
|
September 30, 2017 (Unaudited)
Returns of less than 1 year are cumulative.
Indices are not actively managed and do not reflect a deduction for fees, expenses or taxes. An investor cannot invest directly in an index.
The returns shown above do not reflect the deduction of taxes a shareholder would pay on Fund distributions or redemption of Fund shares.
The total annual operating expenses and total annual operating expenses after fee waivers and/or reimbursement you may pay as an investor in the Fund’s Institutional Class shares (as reported in the January 28, 2017 Prospectus), are 1.53% and 0.95%, respectively. The Fund’s investment adviser has contractually agreed to limit expenses through January 31, 2018.
The Fund is new and has a limited operating history.
|
20
|
www.clarkstonfunds.com
|
|
Clarkston Funds
|
Disclosure of Fund Expenses
|
|
September 30, 2017 (Unaudited)
Example. As a shareholder of the Clarkston Partners Fund, Clarkston Fund, Clarkston Select Fund, or Clarkston Founders Fund (the “Funds”), you incur two types of costs: (1) transaction costs; and (2) ongoing costs, including management fees and other Fund expenses. The following examples are intended to help you understand your ongoing costs (in dollars) of investing in a Fund and to compare these costs with the ongoing costs of investing in other mutual funds. The examples are based on an investment of $1,000 invested on April 1, 2017 and held through September 30, 2017.
Actual Expenses. The first line under each class in the following table provides information about actual account values and actual expenses. You may use the information in this line, together with the amount you invested, to estimate the expenses that you paid over the period. Simply divide your account value by $1,000 (for example, an $8,600 account value divided by $1,000 = 8.6), then multiply the result by the number in the first line under the heading “Expenses Paid During Period April 1, 2017 – September 30, 2017” to estimate the expenses you paid on your account during this period.
Hypothetical Example for Comparison Purposes. The second line under each class in the following table provides information about hypothetical account values and hypothetical expenses based on a Fund’s actual expense ratio and an assumed rate of return of 5% per year before expenses, which is not the Fund’s actual return. The hypothetical account values and expenses may not be used to estimate the actual ending account balance or expenses you paid for the period. You may use this information to compare the ongoing costs of investing in a Fund and other mutual funds. To do so, compare this 5% hypothetical example with the 5% hypothetical examples that appear in the shareholder reports of the other funds.
Please note that the expenses shown in the table are meant to highlight your ongoing Fund costs only and do not reflect any transactional costs. Therefore, the second line under each class in the table below is useful in comparing ongoing costs only and will not help you determine the relative total costs of owning different funds. In addition, if these transactional costs were included, your costs would have been higher.
|
Annual Report | September 30, 2017
|
21
|
|
Clarkston Funds
|
Disclosure of Fund Expenses
|
September 30, 2017 (Unaudited)
|
Beginning
Account Value April 1, 2017 |
Ending
Account Value September 30, 2017 |
Expense
Ratio(a) |
Expenses Paid
During Period April 1, 2017 - September 30, 2017(b) |
|
|
Clarkston Partners Fund
|
||||
|
Founders Class
|
||||
|
Actual
|
$1,000.00
|
$1,051.80
|
0.85%
|
$4.37
|
|
Hypothetical (5% return before expenses)
|
$1,000.00
|
$1,020.81
|
0.85%
|
$4.31
|
|
Institutional Class
|
||||
|
Actual
|
$1,000.00
|
$1,051.00
|
0.97%
|
$4.99
|
|
Hypothetical (5% return before expenses)
|
$1,000.00
|
$1,020.21
|
0.97%
|
$4.91
|
|
Clarkston Fund
|
||||
|
Institutional Class
|
||||
|
Actual
|
$1,000.00
|
$1,027.80
|
0.64%
|
$3.25
|
|
Hypothetical (5% return before expenses)
|
$1,000.00
|
$1,021.86
|
0.64%
|
$3.24
|
|
Clarkston Select Fund
|
||||
|
Institutional Class
|
||||
|
Actual
|
$1,000.00
|
$1,029.80
|
0.67%
|
$3.41
|
|
Hypothetical (5% return before expenses)
|
$1,000.00
|
$1,021.71
|
0.67%
|
$3.40
|
|
Clarkston Founders Fund
|
||||
|
Institutional Class
|
||||
|
Actual
|
$1,000.00
|
$1,036.00
|
0.92%
|
$4.70
|
|
Hypothetical (5% return before expenses)
|
$1,000.00
|
$1,020.46
|
0.92%
|
$4.66
|
| (a) |
Each Fund's expense ratios have been annualized based on the Fund's actual expenses for the 6 month period ending September 30, 2017.
|
| (b) |
Expenses are equal to the annualized expense ratio shown above for the applicable class, multiplied by the average account value over the period, multiplied by the number of days in the most recent fiscal half year (183), divided by 365.
|
|
22
|
www.clarkstonfunds.com
|
|
Clarkston Partners Fund
|
Portfolio of Investments
|
September 30, 2017
|
|
Shares
|
Value (Note 2)
|
||||||
|
COMMON STOCKS (70.23%)
|
||||||||
|
Consumer Discretionary (6.90%)
|
||||||||
|
John Wiley & Sons, Inc., Class A
|
550,000
|
$
|
29,425,000
|
|||||
|
Matthews International Corp., Class A
|
375,000
|
23,343,750
|
||||||
|
Total Consumer Discretionary
|
52,768,750
|
|||||||
|
Consumer Staples (4.22%)
|
||||||||
|
McCormick & Co., Inc.
|
160,000
|
16,422,400
|
||||||
|
Post Holdings, Inc.(a)
|
180,000
|
15,888,600
|
||||||
|
Total Consumer Staples
|
32,311,000
|
|||||||
|
Financial Services (34.26%)
|
||||||||
|
Broadridge Financial Solutions, Inc.
|
400,000
|
32,328,000
|
||||||
|
Brown & Brown, Inc.
|
785,000
|
37,829,150
|
||||||
|
Equifax, Inc.
|
60,000
|
6,359,400
|
||||||
|
Legg Mason, Inc.
|
1,000,000
|
39,310,000
|
||||||
|
LPL Financial Holdings, Inc.
|
820,000
|
42,287,400
|
||||||
|
Markel Corp.(a)
|
13,000
|
13,883,740
|
||||||
|
The Western Union Co.
|
2,400,000
|
46,080,000
|
||||||
|
Willis Towers Watson PLC
|
285,000
|
43,955,550
|
||||||
|
Total Financial Services
|
262,033,240
|
|||||||
|
Materials & Processing (1.79%)
|
||||||||
|
Fastenal Co.
|
300,000
|
13,674,000
|
||||||
|
Total Materials & Processing
|
13,674,000
|
|||||||
|
Producer Durables (21.33%)
|
||||||||
|
Actuant Corp., Class A
|
864,610
|
22,134,016
|
||||||
|
C.H. Robinson Worldwide, Inc.
|
370,000
|
28,157,000
|
||||||
|
Cintas Corp.
|
115,000
|
16,592,200
|
||||||
|
Graco, Inc.
|
67,000
|
8,287,230
|
||||||
|
Hillenbrand, Inc.
|
690,000
|
26,806,500
|
||||||
|
Landstar System, Inc.
|
220,000
|
21,923,000
|
||||||
|
Stericycle, Inc.(a)
|
330,000
|
23,634,600
|
||||||
|
Waters Corp.(a)
|
87,000
|
15,618,240
|
||||||
|
Total Producer Durables
|
163,152,786
|
|||||||
|
Technology (1.73%)
|
||||||||
|
IHS Markit Ltd.(a)
|
300,000
|
13,224,000
|
||||||
|
Total Technology
|
13,224,000
|
|||||||
|
TOTAL COMMON STOCKS (Cost $421,724,293)
|
537,163,776
|
|||||||
See Notes to Financial Statements.
|
Annual Report | September 30, 2017
|
23
|
|
Clarkston Partners Fund
|
Portfolio of Investments
|
September 30, 2017
|
|
Shares |
Value (Note 2)
|
||||||
|
TOTAL INVESTMENTS (70.23%) (Cost $421,724,293)
|
$
|
537,163,776
|
||||||
|
Other Assets In Excess Of Liabilities (29.77%)
|
227,702,731
|
|||||||
|
NET ASSETS (100.00%)
|
$
|
764,866,507
|
||||||
| (a) |
Non-income producing security.
|
For Fund compliance purposes, the Fund’s industry classifications refer to any one or more of the industry sub-classifications used by one or more widely recognized market indices or ratings group indices and/or as defined by Fund management. This definition may not apply for purposes of this report, which may use a different classification system or may combine industry sub-classifications for reporting ease. Industries are shown as a percent of the Fund's net assets. (Unaudited)
See Notes to Financial Statements.
|
24
|
www.clarkstonfunds.com
|
|
Clarkston Fund
|
Portfolio of Investments
|
September 30, 2017
|
|
Shares
|
Value (Note 2)
|
||||||
|
COMMON STOCKS (83.84%)
|
||||||||
|
Consumer Discretionary (3.64%)
|
||||||||
|
Wal‐Mart Stores, Inc.
|
9,300
|
$
|
726,702
|
|||||
|
The Walt Disney Co.
|
3,500
|
344,995
|
||||||
|
Total Consumer Discretionary
|
1,071,697
|
|||||||
|
Consumer Staples (21.53%)
|
||||||||
|
Anheuser‐Busch InBev SA/NV, Sponsored
|
6,200
|
739,660
|
||||||
|
Diageo PLC, Sponsored ADR
|
8,500
|
1,123,105
|
||||||
|
Mondelez International, Inc., Class A
|
13,500
|
548,910
|
||||||
|
PepsiCo, Inc.
|
10,000
|
1,114,300
|
||||||
|
The Procter & Gamble Co.
|
16,000
|
1,455,680
|
||||||
|
Sysco Corp.
|
25,000
|
1,348,750
|
||||||
|
Total Consumer Staples
|
6,330,405
|
|||||||
|
Financial Services (22.70%)
|
||||||||
|
American Express Co.
|
13,000
|
1,175,980
|
||||||
|
Capital One Financial Corp.
|
10,000
|
846,600
|
||||||
|
The Charles Schwab Corp.
|
18,000
|
787,320
|
||||||
|
Markel Corp.(a)
|
275
|
293,695
|
||||||
|
MasterCard, Inc., Class A
|
3,500
|
494,200
|
||||||
|
US Bancorp
|
11,500
|
616,285
|
||||||
|
The Western Union Co.
|
76,000
|
1,459,200
|
||||||
|
Willis Towers Watson PLC
|
6,500
|
1,002,495
|
||||||
|
Total Financial Services
|
6,675,775
|
|||||||
|
Health Care (10.24%)
|
||||||||
|
AmerisourceBergen Corp.
|
3,500
|
289,625
|
||||||
|
Anthem, Inc.
|
3,000
|
569,640
|
||||||
|
Johnson & Johnson
|
10,000
|
1,300,100
|
||||||
|
McKesson Corp.
|
2,000
|
307,220
|
||||||
|
Medtronic PLC
|
7,000
|
544,390
|
||||||
|
Total Health Care
|
3,010,975
|
|||||||
|
Producer Durables (14.18%)
|
||||||||
|
C.H. Robinson Worldwide, Inc.
|
10,000
|
761,000
|
||||||
|
Emerson Electric Co.
|
12,000
|
754,080
|
||||||
|
General Electric Co.
|
80,000
|
1,934,400
|
||||||
|
United Parcel Service, Inc., Class B
|
6,000
|
720,540
|
||||||
|
Total Producer Durables
|
4,170,020
|
|||||||
|
Technology (11.55%)
|
||||||||
|
Cisco Systems, Inc.
|
31,000
|
1,042,530
|
||||||
|
International Business Machines Corp.
|
8,000
|
1,160,640
|
||||||
See Notes to Financial Statements.
|
Annual Report | September 30, 2017
|
25
|
|
Clarkston Fund
|
Portfolio of Investments
|
September 30, 2017
|
Shares
|
Value (Note 2)
|
|||||||
|
Technology (continued)
|
||||||||
|
Microsoft Corp.
|
16,000
|
$
|
1,191,840
|
|||||
|
Total Technology
|
3,395,010
|
|||||||
|
TOTAL COMMON STOCKS (Cost $21,845,433)
|
24,653,882
|
|||||||
|
TOTAL INVESTMENTS (83.84%) (Cost $21,845,433)
|
$
|
24,653,882
|
||||||
|
Other Assets In Excess Of Liabilities (16.16%)
|
4,753,026
|
|||||||
|
NET ASSETS (100.00%)
|
$
|
29,406,908
|
||||||
|
(a)
|
Non-income producing security.
|
For Fund compliance purposes, the Fund’s industry classifications refer to any one or more of the industry sub-classifications used by one or more widely recognized market indices or ratings group indices and/or as defined by Fund management. This definition may not apply for purposes of this report, which may use a different classification system or may combine industry sub-classifications for reporting ease. Industries are shown as a percent of the Fund's net assets. (Unaudited)
See Notes to Financial Statements.
|
26
|
www.clarkstonfunds.com
|
|
Clarkston Select Fund
|
Portfolio of Investments
|
September 30, 2017
|
|
Shares
|
Value (Note 2)
|
||||||
|
COMMON STOCKS (82.61%)
|
||||||||
|
Consumer Discretionary (3.92%)
|
||||||||
|
Nielsen Holdings PLC
|
5,500
|
$
|
227,975
|
|||||
|
Wal‐Mart Stores, Inc.
|
3,000
|
234,420
|
||||||
|
Total Consumer Discretionary
|
462,395
|
|||||||
|
Consumer Staples (20.84%)
|
||||||||
|
Anheuser‐Busch InBev SA/NV, Sponsored ADR
|
3,300
|
393,690
|
||||||
|
Diageo PLC, Sponsored ADR
|
2,500
|
330,325
|
||||||
|
PepsiCo, Inc.
|
4,500
|
501,435
|
||||||
|
The Procter & Gamble Co.
|
7,000
|
636,860
|
||||||
|
Sysco Corp.
|
11,000
|
593,450
|
||||||
|
Total Consumer Staples
|
2,455,760
|
|||||||
|
Financial Services (15.27%)
|
||||||||
|
American Express Co.
|
4,000
|
361,840
|
||||||
|
Capital One Financial Corp.
|
3,800
|
321,708
|
||||||
|
T. Rowe Price Group, Inc.
|
3,000
|
271,950
|
||||||
|
US Bancorp
|
5,000
|
267,950
|
||||||
|
The Western Union Co.
|
30,000
|
576,000
|
||||||
|
Total Financial Services
|
1,799,448
|
|||||||
|
Health Care (6.56%)
|
||||||||
|
Johnson & Johnson
|
3,200
|
416,032
|
||||||
|
Pfizer, Inc.
|
10,000
|
357,000
|
||||||
|
Total Health Care
|
773,032
|
|||||||
|
Materials & Processing (2.32%)
|
||||||||
|
Fastenal Co.
|
6,000
|
273,480
|
||||||
|
Total Materials & Processing
|
273,480
|
|||||||
|
Producer Durables (20.37%)
|
||||||||
|
3M Co.
|
500
|
104,950
|
||||||
|
C.H. Robinson Worldwide, Inc.
|
5,000
|
380,500
|
||||||
|
Emerson Electric Co.
|
5,000
|
314,200
|
||||||
|
General Electric Co.
|
30,000
|
725,400
|
||||||
|
Paychex, Inc.
|
8,000
|
479,680
|
||||||
|
United Parcel Service, Inc., Class B
|
3,300
|
396,297
|
||||||
|
Total Producer Durables
|
2,401,027
|
|||||||
|
Technology (13.33%)
|
||||||||
|
Cisco Systems, Inc.
|
15,000
|
504,450
|
||||||
|
International Business Machines Corp.
|
3,500
|
507,780
|
||||||
See Notes to Financial Statements.
|
Annual Report | September 30, 2017
|
27
|
|
Clarkston Select Fund
|
Portfolio of Investments
|
September 30, 2017
|
Shares
|
Value (Note 2)
|
|||||||
|
Technology (continued)
|
||||||||
|
Microsoft Corp.
|
7,500
|
$
|
558,675
|
|||||
|
Total Technology
|
1,570,905
|
|||||||
|
TOTAL COMMON STOCKS (Cost $9,330,434)
|
9,736,047
|
|||||||
|
|
||||||||
|
TOTAL INVESTMENTS (82.61%) (Cost $9,330,434)
|
$
|
9,736,047
|
||||||
|
Other Assets In Excess Of Liabilities (17.39%)
|
2,049,163
|
|||||||
|
NET ASSETS (100.00%)
|
$
|
11,785,210
|
||||||
For Fund compliance purposes, the Fund’s industry classifications refer to any one or more of the industry sub-classifications used by one or more widely recognized market indices or ratings group indices and/or as defined by Fund management. This definition may not apply for purposes of this report, which may use a different classification system or may combine industry sub-classifications for reporting ease. Industries are shown as a percent of the Fund's net assets. (Unaudited)
See Notes to Financial Statements.
|
28
|
www.clarkstonfunds.com
|
|
Clarkston Founders Fund
|
Portfolio of Investments
|
|
September 30, 2017
|
|
|
Shares
|
Value (Note 2)
|
||||||
|
COMMON STOCKS (67.43%)
|
||||||||
|
Consumer Discretionary (3.17%)
|
||||||||
|
LKQ Corp.(a)
|
8,000
|
$
|
287,920
|
|||||
|
Nielsen Holdings PLC
|
11,500
|
476,675
|
||||||
|
Total Consumer Discretionary
|
764,595
|
|||||||
|
|
||||||||
|
Consumer Staples (8.11%)
|
||||||||
|
McCormick & Co., Inc.
|
7,000
|
718,480
|
||||||
|
Sysco Corp.
|
23,000
|
1,240,850
|
||||||
|
Total Consumer Staples
|
1,959,330
|
|||||||
|
|
||||||||
|
Financial Services (32.82%)
|
||||||||
|
Broadridge Financial Solutions, Inc.
|
14,000
|
1,131,480
|
||||||
|
Brown & Brown, Inc.
|
25,500
|
1,228,845
|
||||||
|
The Charles Schwab Corp.
|
17,000
|
743,580
|
||||||
|
Equifax, Inc.
|
2,300
|
243,777
|
||||||
|
FactSet Research Systems, Inc.
|
1,500
|
270,165
|
||||||
|
Legg Mason, Inc.
|
25,000
|
982,750
|
||||||
|
Markel Corp.(a)
|
500
|
533,990
|
||||||
|
The Western Union Co.
|
77,000
|
1,478,400
|
||||||
|
Willis Towers Watson PLC
|
8,500
|
1,310,955
|
||||||
|
Total Financial Services
|
7,923,942
|
|||||||
|
|
||||||||
|
Health Care (4.53%)
|
||||||||
|
AmerisourceBergen Corp.
|
3,000
|
248,250
|
||||||
|
DENTSPLY SIRONA, Inc.
|
8,500
|
508,385
|
||||||
|
McKesson Corp.
|
2,200
|
337,942
|
||||||
|
Total Health Care
|
1,094,577
|
|||||||
|
|
||||||||
|
Materials & Processing (2.17%)
|
||||||||
|
Fastenal Co.
|
11,500
|
524,170
|
||||||
|
Total Materials & Processing
|
524,170
|
|||||||
|
|
||||||||
|
Producer Durables (14.80%)
|
||||||||
|
C.H. Robinson Worldwide, Inc.
|
11,500
|
875,150
|
||||||
|
Cintas Corp.
|
3,000
|
432,840
|
||||||
|
Paychex, Inc.
|
11,000
|
659,560
|
||||||
|
Roper Technologies, Inc.
|
1,300
|
316,420
|
||||||
|
Stericycle, Inc.(a)
|
10,500
|
752,010
|
||||||
|
Waters Corp.(a)
|
3,000
|
538,560
|
||||||
|
Total Producer Durables
|
3,574,540
|
|||||||
|
See Notes to Financial Statements.
|
|
Annual Report | September 30, 2017
|
29
|
|
Clarkston Founders Fund
|
Portfolio of Investments
|
|
September 30, 2017
|
|
Shares
|
Value (Note 2)
|
|||||||
|
Technology (1.83%)
|
||||||||
|
IHS Markit Ltd.(a)
|
10,000
|
$
|
440,800
|
|||||
|
Total Technology
|
440,800
|
|||||||
|
TOTAL COMMON STOCKS (Cost $15,054,444)
|
16,281,954
|
|||||||
|
TOTAL INVESTMENTS (67.43%) (Cost $15,054,444)
|
$
|
16,281,954
|
||||||
|
Other Assets In Excess Of Liabilities (32.57%)
|
7,864,695
|
|||||||
|
NET ASSETS (100.00%)
|
$
|
24,146,649
|
||||||
|
(a)
|
Non-income producing security.
|
For Fund compliance purposes, the Fund’s industry classifications refer to any one or more of the industry sub-classifications used by one or more widely recognized market indices or ratings group indices and/or as defined by Fund management. This definition may not apply for purposes of this report, which may use a different classification system or may combine industry sub-classifications for reporting ease. Industries are shown as a percent of the Fund's net assets. (Unaudited)
|
See Notes to Financial Statements.
|
|
30
|
www.clarkstonfunds.com
|
|
Clarkston Funds
|
Statements of Assets and Liabilities
|
|
September 30, 2017
|
|
|
CLARKSTON PARTNERS FUND
|
CLARKSTON FUND
|
||||||
|
ASSETS:
|
||||||||
|
Investments, at value (Cost $421,724,293 and $21,845,433)
|
$
|
537,163,776
|
$
|
24,653,882
|
||||
|
Cash & Cash Equivalents
|
226,595,606
|
4,835,064
|
||||||
|
Receivable for shares sold
|
1,583,669
|
24,000
|
||||||
|
Dividends receivable
|
386,518
|
50,191
|
||||||
|
Other Assets
|
32,382
|
5,035
|
||||||
|
Total Assets
|
765,761,951
|
29,568,172
|
||||||
|
|
||||||||
|
LIABILITIES:
|
||||||||
|
Administration and transfer agency fees payable
|
62,905
|
4,555
|
||||||
|
Payable for investments purchased
|
–
|
120,825
|
||||||
|
Payable for shares redeemed
|
177,029
|
–
|
||||||
|
Payable to adviser
|
429,306
|
6,632
|
||||||
|
Payable for distribution and service fees
|
125,434
|
8,395
|
||||||
|
Payable for printing
|
9,167
|
391
|
||||||
|
Payable for professional fees
|
59,194
|
16,735
|
||||||
|
Payable to trustees
|
1,815
|
98
|
||||||
|
Payable to Chief Compliance Officer
|
3,837
|
151
|
||||||
|
Accrued expenses and other liabilities
|
26,757
|
3,482
|
||||||
|
Total Liabilities
|
895,444
|
161,264
|
||||||
|
NET ASSETS
|
$
|
764,866,507
|
$
|
29,406,908
|
||||
|
|
||||||||
|
NET ASSETS CONSIST OF:
|
||||||||
|
Paid-in capital (Note 5)
|
$
|
641,559,177
|
$
|
26,290,466
|
||||
|
Accumulated net investment income
|
1,172,608
|
306,977
|
||||||
|
Accumulated net realized gain on investments
|
6,695,239
|
1,016
|
||||||
|
Net unrealized appreciation on investments
|
115,439,483
|
2,808,449
|
||||||
|
NET ASSETS
|
$
|
764,866,507
|
$
|
29,406,908
|
||||
|
See Notes to Financial Statements.
|
|
Annual Report | September 30, 2017
|
31
|
|
Clarkston Funds
|
Statements of Assets and Liabilities
|
|
September 30, 2017
|
|
|
CLARKSTON PARTNERS FUND
|
CLARKSTON FUND
|
||||||
|
PRICING OF SHARES
|
||||||||
|
Founders Class:
|
||||||||
|
Net Asset Value, offering and redemption price per share
|
$
|
12.39
|
N/A
|
|||||
|
Net Assets
|
$
|
397,473,641
|
N/A
|
|||||
|
Shares of beneficial interest outstanding
|
32,076,305
|
N/A
|
||||||
|
Institutional Class:
|
||||||||
|
Net Asset Value, offering and redemption price per share
|
$
|
12.36
|
$
|
11.46
|
||||
|
Net Assets
|
$
|
367,392,866
|
$
|
29,406,908
|
||||
|
Shares of beneficial interest outstanding
|
29,714,792
|
2,566,479
|
||||||
|
See Notes to Financial Statements.
|
|
32
|
www.clarkstonfunds.com
|
|
Clarkston Funds
|
Statements of Assets and Liabilities
|
|
September 30, 2017
|
|
|
CLARKSTON SELECT FUND
|
CLARKSTON FOUNDERS FUND
|
||||||
|
ASSETS:
|
||||||||
|
Investments, at value (Cost $9,330,434 and $15,054,444)
|
$
|
9,736,047
|
$
|
16,281,954
|
||||
|
Cash & Cash Equivalents
|
2,020,449
|
7,643,796
|
||||||
|
Receivable for shares sold
|
25,000
|
232,975
|
||||||
|
Dividends receivable
|
14,267
|
12,967
|
||||||
|
Deferred offering cost
|
13,246
|
13,255
|
||||||
|
Other Assets
|
1,345
|
1,004
|
||||||
|
Total Assets
|
11,810,354
|
24,185,951
|
||||||
|
|
||||||||
|
LIABILITIES:
|
||||||||
|
Administration and transfer agency fees payable
|
3,472
|
4,151
|
||||||
|
Payable to adviser
|
105
|
8,490
|
||||||
|
Payable for distribution and service fees
|
3,304
|
6,680
|
||||||
|
Payable for printing
|
153
|
282
|
||||||
|
Payable for professional fees
|
15,678
|
16,384
|
||||||
|
Payable to trustees
|
73
|
79
|
||||||
|
Payable to Chief Compliance Officer
|
59
|
120
|
||||||
|
Accrued expenses and other liabilities
|
2,300
|
3,116
|
||||||
|
Total Liabilities
|
25,144
|
39,302
|
||||||
|
NET ASSETS
|
$
|
11,785,210
|
$
|
24,146,649
|
||||
|
|
||||||||
|
NET ASSETS CONSIST OF:
|
||||||||
|
Paid-in capital (Note 5)
|
$
|
11,346,901
|
$
|
22,891,107
|
||||
|
Accumulated net investment income
|
8,019
|
67,019
|
||||||
|
Accumulated net realized gain/(loss) on investments
|
24,677
|
(38,987
|
)
|
|||||
|
Net unrealized appreciation on investments
|
405,613
|
1,227,510
|
||||||
|
NET ASSETS
|
$
|
11,785,210
|
$
|
24,146,649
|
||||
|
|
||||||||
|
PRICING OF SHARES
|
||||||||
|
Institutional Class:
|
||||||||
|
Net Asset Value, offering and redemption price per share
|
$
|
10.50
|
$
|
10.64
|
||||
|
Net Assets
|
$
|
11,785,210
|
$
|
24,146,649
|
||||
|
Shares of beneficial interest outstanding
|
1,122,736
|
2,268,598
|
||||||
|
See Notes to Financial Statements.
|
|
Annual Report | September 30, 2017
|
33
|
|
Clarkston Funds
|
Statements of Operations
|
|
For the Year Ended September 30, 2017
|
|
|
CLARKSTON PARTNERS FUND
|
CLARKSTON FUND
|
||||||
|
INVESTMENT INCOME:
|
||||||||
|
Dividends
|
$
|
8,309,888
|
$
|
537,435
|
||||
|
Foreign taxes withheld
|
–
|
(4,939
|
)
|
|||||
|
Total Investment Income
|
8,309,888
|
532,496
|
||||||
|
|
||||||||
|
EXPENSES:
|
||||||||
|
Investment advisory fees (Note 6)
|
5,332,383
|
129,280
|
||||||
|
Administration fees
|
428,415
|
16,654
|
||||||
|
Shareholder service fees
|
||||||||
|
Institutional Class
|
403,952
|
25,991
|
||||||
|
Custodian fees
|
64,372
|
5,027
|
||||||
|
Legal fees
|
93,999
|
3,523
|
||||||
|
Audit and tax fees
|
17,988
|
13,487
|
||||||
|
Transfer agent fees
|
204,737
|
25,023
|
||||||
|
Trustees fees and expenses
|
82,540
|
3,217
|
||||||
|
Registration and filing fees
|
71,242
|
19,395
|
||||||
|
Printing fees
|
33,806
|
1,489
|
||||||
|
Chief Compliance Officer fees
|
40,424
|
1,578
|
||||||
|
Insurance expense
|
22,489
|
676
|
||||||
|
Offering costs
|
–
|
22,265
|
||||||
|
Other expenses
|
17,348
|
2,720
|
||||||
|
Total Expenses
|
6,813,695
|
270,325
|
||||||
|
Less fees waived by investment adviser
|
||||||||
|
Founders Class (Note 6)
|
(389,579
|
)
|
N/A
|
|||||
|
Institutional Class (Note 6)
|
(349,038
|
)
|
(101,949
|
)
|
||||
|
Total fees waived by investment adviser
|
(738,617
|
)
|
(101,949
|
)
|
||||
|
Net Expenses
|
6,075,078
|
168,376
|
||||||
|
NET INVESTMENT INCOME
|
2,234,810
|
364,120
|
||||||
|
|
||||||||
|
REALIZED AND UNREALIZED GAIN ON INVESTMENTS:
|
||||||||
|
Net realized gain/(loss) on:
|
||||||||
|
Investments
|
7,147,287
|
48,652
|
||||||
|
Net realized gain
|
7,147,287
|
48,652
|
||||||
|
Change in unrealized appreciation on:
|
||||||||
|
Investments
|
71,238,487
|
2,041,410
|
||||||
|
Net change
|
71,238,487
|
2,041,410
|
||||||
|
|
||||||||
|
NET REALIZED AND UNREALIZED GAIN ON INVESTMENTS
|
78,385,774
|
2,090,062
|
||||||
|
NET INCREASE IN NET ASSETS RESULTING FROM OPERATIONS
|
$
|
80,620,584
|
$
|
2,454,182
|
||||
|
See Notes to Financial Statements.
|
|
34
|
www.clarkstonfunds.com
|
|
Clarkston Funds
|
Statements of Operations
|
|
For the Period Ended September 30, 2017
|
|
|
CLARKSTON SELECT FUND(a)
|
CLARKSTON FOUNDERS
FUND(a) |
||||||
|
INVESTMENT INCOME:
|
||||||||
|
Dividends
|
$
|
162,017
|
$
|
166,432
|
||||
|
Foreign taxes withheld
|
(2,366
|
)
|
–
|
|||||
|
Total Investment Income
|
159,651
|
166,432
|
||||||
|
|
||||||||
|
EXPENSES:
|
||||||||
|
Investment advisory fees (Note 6)
|
32,657
|
102,826
|
||||||
|
Administration fees
|
5,076
|
9,707
|
||||||
|
Shareholder service fees
|
||||||||
|
Institutional Class
|
8,045
|
16,920
|
||||||
|
Custodian fees
|
3,333
|
3,334
|
||||||
|
Legal fees
|
835
|
1,762
|
||||||
|
Audit and tax fees
|
15,000
|
15,000
|
||||||
|
Transfer agent fees
|
16,705
|
16,716
|
||||||
|
Trustees fees and expenses
|
685
|
1,324
|
||||||
|
Registration and filing fees
|
1,407
|
2,239
|
||||||
|
Printing fees
|
490
|
1,053
|
||||||
|
Chief Compliance Officer fees
|
429
|
903
|
||||||
|
Offering costs
|
26,533
|
26,546
|
||||||
|
Other expenses
|
1,428
|
1,617
|
||||||
|
Total Expenses
|
112,623
|
199,947
|
||||||
|
Less fees waived/reimbursed by investment adviser Institutional Class (Note 6)
|
(68,518
|
)
|
(73,077
|
)
|
||||
|
Net Expenses
|
44,105
|
126,870
|
||||||
|
NET INVESTMENT INCOME
|
115,546
|
39,562
|
||||||
|
|
||||||||
|
REALIZED AND UNREALIZED GAIN ON INVESTMENTS:
|
||||||||
|
Net realized gain/(loss) on:
|
||||||||
|
Investments
|
24,677
|
(38,987
|
)
|
|||||
|
Net realized gain/(loss)
|
24,677
|
(38,987
|
)
|
|||||
|
Change in unrealized appreciation on:
|
||||||||
|
Investments
|
405,613
|
1,227,510
|
||||||
|
Net change
|
405,613
|
1,227,510
|
||||||
|
|
||||||||
|
NET REALIZED AND UNREALIZED GAIN ON INVESTMENTS
|
430,290
|
1,188,523
|
||||||
|
NET INCREASE IN NET ASSETS RESULTING FROM OPERATIONS
|
$
|
545,836
|
$
|
1,228,085
|
||||
|
(a)
|
Commenced operations on February 1, 2017.
|
|
See Notes to Financial Statements.
|
|
Annual Report | September 30, 2017
|
35
|
|
Clarkston Partners Fund
|
Statements of Changes in Net Assets
|
|
|
For the Year
Ended September 30, 2017 |
For the Year
Ended September 30, 2016 |
||||||
|
OPERATIONS:
|
||||||||
|
Net investment income
|
$
|
2,234,810
|
$
|
2,249,095
|
||||
|
Net realized gain on investments
|
7,147,287
|
3,777,861
|
||||||
|
Net change in unrealized appreciation on investments
|
71,238,487
|
48,070,769
|
||||||
|
Net increase in net assets resulting from operations
|
80,620,584
|
54,097,725
|
||||||
|
DISTRIBUTIONS TO SHAREHOLDERS:
|
||||||||
|
From net investment income:
|
||||||||
|
Founders Class
|
(1,616,473
|
)
|
(243,684
|
)
|
||||
|
Institutional Class
|
(1,336,460
|
)
|
(204,594
|
)
|
||||
|
From net realized gains on investments:
|
||||||||
|
Founders Class
|
(2,235,203
|
)
|
–
|
|||||
|
Institutional Class
|
(1,995,087
|
)
|
–
|
|||||
|
Total distributions
|
(7,183,223
|
)
|
(448,278
|
)
|
||||
|
|
||||||||
|
BENEFICIAL SHARE TRANSACTIONS (Note 5):
|
||||||||
|
Founders Class
|
||||||||
|
Shares sold
|
73,621,564
|
164,645,963
|
||||||
|
Dividends reinvested
|
122,627
|
243,684
|
||||||
|
Shares redeemed
|
(23,374,148
|
)
|
(13,965,015
|
)
|
||||
|
Net increase from beneficial share transactions
|
50,370,043
|
150,924,632
|
||||||
|
Institutional Class
|
||||||||
|
Shares sold
|
150,671,817
|
334,694,172
|
||||||
|
Dividends reinvested
|
3,265,521
|
199,826
|
||||||
|
Shares redeemed
|
(63,780,279
|
)
|
(114,871,126
|
)
|
||||
|
Net increase from beneficial share transactions
|
90,157,059
|
220,022,872
|
||||||
|
Net increase in net assets
|
213,964,463
|
424,596,951
|
||||||
|
|
||||||||
|
NET ASSETS:
|
||||||||
|
Beginning of year
|
550,902,044
|
126,305,093
|
||||||
|
End of year (including accumulated net investment income of $1,172,608 and $1,891,112)
|
$
|
764,866,507
|
$
|
550,902,044
|
||||
|
See Notes to Financial Statements.
|
|
36
|
www.clarkstonfunds.com
|
|
Clarkston Fund
|
Statements of Changes in Net Assets
|
|
|
For the Year
Ended September 30, 2017 |
For the Period Ended
September 30, 2016(a) |
||||||
|
OPERATIONS:
|
||||||||
|
Net investment income
|
$
|
364,120
|
$
|
113,393
|
||||
|
Net realized gain on investments
|
48,652
|
–
|
||||||
|
Net change in unrealized appreciation on investments
|
2,041,410
|
767,039
|
||||||
|
Net increase in net assets resulting from operations
|
2,454,182
|
880,432
|
||||||
|
DISTRIBUTIONS TO SHAREHOLDERS:
|
||||||||
|
From net investment income:
|
||||||||
|
Institutional Class
|
(206,855
|
)
|
–
|
|||||
|
From net realized gains on investments:
|
||||||||
|
Institutional Class
|
(47,636
|
)
|
–
|
|||||
|
Total distributions
|
(254,491
|
)
|
–
|
|||||
|
|
||||||||
|
BENEFICIAL SHARE TRANSACTIONS (Note 5):
|
||||||||
|
Institutional Class
|
||||||||
|
Shares sold
|
9,872,180
|
19,603,769
|
||||||
|
Dividends reinvested
|
254,490
|
–
|
||||||
|
Shares redeemed
|
(3,092,454
|
)
|
(311,200
|
)
|
||||
|
Net increase from beneficial share transactions
|
7,034,216
|
19,292,569
|
||||||
|
Net increase in net assets
|
9,233,907
|
20,173,001
|
||||||
|
|
||||||||
|
NET ASSETS:
|
||||||||
|
Beginning of period
|
20,173,001
|
–
|
||||||
|
End of period (including accumulated net investment income of $306,977 and $127,815)
|
$
|
29,406,908
|
$
|
20,173,001
|
||||
|
(a)
|
Commenced operations on April 4, 2016.
|
|
See Notes to Financial Statements.
|
|
Annual Report | September 30, 2017
|
37
|
|
Clarkston Select Fund
|
Statements of Changes in Net Assets
|
|
For the Period Ended
September 30, 2017(a) |
||||
|
OPERATIONS:
|
||||
|
Net investment income
|
$
|
115,546
|
||
|
Net realized gain on investments
|
24,677
|
|||
|
Net change in unrealized appreciation on investments
|
405,613
|
|||
|
Net increase in net assets resulting from operations
|
545,836
|
|||
|
DISTRIBUTIONS TO SHAREHOLDERS:
|
||||
|
From net investment income:
|
||||
|
Institutional Class
|
(122,180
|
)
|
||
|
Total distributions
|
(122,180
|
)
|
||
|
BENEFICIAL SHARE TRANSACTIONS (Note 5):
|
||||
|
Institutional Class
|
||||
|
Shares sold
|
12,545,640
|
|||
|
Dividends reinvested
|
122,057
|
|||
|
Shares redeemed
|
(1,306,143
|
)
|
||
|
Net increase from beneficial share transactions
|
11,361,554
|
|||
|
Net increase in net assets
|
11,785,210
|
|||
|
NET ASSETS:
|
||||
|
Beginning of period
|
–
|
|||
|
End of period (including accumulated net investment income of $8,019)
|
$
|
11,785,210
|
||
|
(a)
|
Commenced operations on February 1, 2017.
|
|
See Notes to Financial Statements.
|
|
38
|
www.clarkstonfunds.com
|
|
Clarkston Founders Fund
|
Statements of Changes in Net Assets
|
|
For the Period Ended
September 30, 2017(a) |
||||
|
OPERATIONS:
|
||||
|
Net investment income
|
$
|
39,562
|
||
|
Net realized loss on investments
|
(38,987
|
)
|
||
|
Net change in unrealized appreciation on investments
|
1,227,510
|
|||
|
Net increase in net assets resulting from operations
|
1,228,085
|
|||
|
BENEFICIAL SHARE TRANSACTIONS (Note 5):
|
||||
|
Institutional Class
|
||||
|
Shares sold
|
24,019,280
|
|||
|
Shares redeemed
|
(1,100,716
|
)
|
||
|
Net increase from beneficial share transactions
|
22,918,564
|
|||
|
Net increase in net assets
|
24,146,649
|
|||
|
NET ASSETS:
|
||||
|
Beginning of period
|
–
|
|||
|
End of period (including accumulated net investment income of $67,019)
|
$
|
24,146,649
|
||
|
(a)
|
Commenced operations on February 1, 2017.
|
|
See Notes to Financial Statements.
|
|
Annual Report | September 30, 2017
|
39
|
|
Clarkston Partners Fund – Founders Class
|
Financial Highlights
|
For a Share Outstanding Throughout the Periods Presented
|
For the Year Ended
September 30, 2017 |
For the
Year Ended September 30, 2016 |
For the Period Ended
September 30, 2015(a) |
||||||||||
|
NET ASSET VALUE, BEGINNING OF PERIOD
|
$
|
11.11
|
$
|
9.70
|
$
|
10.00
|
||||||
|
INCOME/(LOSS) FROM OPERATIONS:
|
||||||||||||
|
Net investment income(b)
|
0.05
|
0.06
|
0.00
|
(c)
|
||||||||
|
Net realized and unrealized gain/(loss) on investments
|
1.37
|
1.37
|
(0.30
|
)
|
||||||||
|
Total from investment operations
|
1.42
|
1.43
|
(0.30
|
)
|
||||||||
|
LESS DISTRIBUTIONS:
|
||||||||||||
|
From net investment income
|
(0.06
|
)
|
(0.02
|
)
|
–
|
|||||||
|
From net realized gains on investments
|
(0.08
|
)
|
–
|
–
|
||||||||
|
Total Distributions
|
(0.14
|
)
|
(0.02
|
)
|
–
|
|||||||
|
NET INCREASE/(DECREASE) IN NET ASSET VALUE
|
1.28
|
1.41
|
(0.30
|
)
|
||||||||
|
NET ASSET VALUE, END OF PERIOD
|
$
|
12.39
|
$
|
11.11
|
$
|
9.70
|
||||||
|
TOTAL RETURN(d)
|
12.86
|
%
|
14.73
|
%(e)
|
(3.00
|
%)
|
||||||
|
SUPPLEMENTAL DATA:
|
||||||||||||
|
Net assets, end of period (in 000s)
|
$
|
397,474
|
$
|
308,607
|
$
|
126,281
|
||||||
|
RATIOS TO AVERAGE NET ASSETS
|
||||||||||||
|
Operating expenses excluding reimbursement/waiver
|
0.96
|
%
|
1.02
|
%
|
1.81
|
%(f)
|
||||||
|
Operating expenses including reimbursement/waiver
|
0.85
|
%
|
0.85
|
%
|
0.85
|
%(f)
|
||||||
|
Net investment income including reimbursement/waiver
|
0.40
|
%
|
0.62
|
%
|
0.05
|
%(f)
|
||||||
|
PORTFOLIO TURNOVER RATE(g)
|
13
|
%
|
16
|
%
|
0
|
%
|
||||||
| (a) |
Commenced operations on September 16, 2015.
|
| (b) |
Per share amounts are based upon average shares outstanding.
|
| (c) |
Less than $0.005 per share.
|
| (d) |
Assumes an initial investment on the business day before the first day of the fiscal period, with all dividends and distributions reinvested in additional shares on the reinvestment date, and redemption at the net asset value calculated on the last business day of the fiscal year. Total returns are for the period indicated and have not been annualized. Total returns would have been lower had certain expenses not been waived during the period. Returns shown do not reflect the deduction of taxes that a shareholder would pay on Fund distributions or the redemption of Fund shares.
|
| (e) |
In 2016, the Fund's total return consists of a voluntary/unvoluntary reimbursement by the adviser for a realized investment loss. Excluding this item, total return would not change as the impact is less than 0.005%.
|
See Notes to Financial Statements.
|
40
|
www.clarkstonfunds.com
|
|
Clarkston Partners Fund – Founders Class
|
Financial Highlights
|
For a Share Outstanding Throughout the Periods Presented
| (f) |
Annualized.
|
| (g) |
Portfolio turnover rate for periods less than one full year have not been annualized.
|
See Notes to Financial Statements.
|
Annual Report | September 30, 2017
|
41
|
|
Clarkston Partners Fund – Institutional Class
|
Financial Highlights
|
For a Share Outstanding Throughout the Periods Presented
|
For the Year Ended
September 30, 2017 |
For the Year Ended
September 30, 2016 |
For the Period Ended
September 30, 2015(a) |
||||||||||
|
NET ASSET VALUE, BEGINNING OF PERIOD
|
$
|
11.09
|
$
|
9.70
|
$
|
10.00
|
||||||
|
INCOME/(LOSS) FROM OPERATIONS:
|
||||||||||||
|
Net investment income/(loss)(b)
|
0.03
|
0.05
|
(0.00
|
)(c)
|
||||||||
|
Net realized and unrealized gain/(loss) on investments
|
1.37
|
1.35
|
(0.30
|
)
|
||||||||
|
Total from investment operations
|
1.40
|
1.40
|
(0.30
|
)
|
||||||||
|
LESS DISTRIBUTIONS:
|
||||||||||||
|
From net investment income
|
(0.05
|
)
|
(0.01
|
)
|
–
|
|||||||
|
From net realized gains on investments
|
(0.08
|
)
|
–
|
–
|
||||||||
|
Total Distributions
|
(0.13
|
)
|
(0.01
|
)
|
–
|
|||||||
|
NET INCREASE/(DECREASE) IN NET ASSET VALUE
|
1.27
|
1.39
|
(0.30
|
)
|
||||||||
|
NET ASSET VALUE, END OF PERIOD
|
$
|
12.36
|
$
|
11.09
|
$
|
9.70
|
||||||
|
TOTAL RETURN(d)
|
12.75
|
%
|
14.47
|
%(e)
|
(3.00
|
%)
|
||||||
|
SUPPLEMENTAL DATA:
|
||||||||||||
|
Net assets, end of period (in 000s)
|
$
|
367,393
|
$
|
242,295
|
$
|
24
|
||||||
|
RATIOS TO AVERAGE NET ASSETS
|
||||||||||||
|
Operating expenses excluding reimbursement/waiver
|
1.09
|
%
|
1.16
|
%
|
1.96
|
%(f)
|
||||||
|
Operating expenses including reimbursement/waiver
|
0.98
|
%(g)
|
1.00
|
%
|
1.00
|
%(f)
|
||||||
|
Net investment income/(loss) including reimbursement/waiver
|
0.27
|
%
|
0.46
|
%
|
(0.10
|
%)(f)
|
||||||
|
PORTFOLIO TURNOVER RATE(h)
|
13
|
%
|
16
|
%
|
0
|
%
|
||||||
| (a) |
Commenced operations on September 16, 2015.
|
| (b) |
Per share amounts are based upon average shares outstanding.
|
| (c) |
Less than ($0.005) per share.
|
| (d) |
Assumes an initial investment on the business day before the first day of the fiscal period, with all dividends and distributions reinvested in additional shares on the reinvestment date, and redemption at the net asset value calculated on the last business day of the fiscal year. Total returns are for the period indicated and have not been annualized. Total returns would have been lower had certain expenses not been waived during the period. Returns shown do not reflect the deduction of taxes that a shareholder would pay on Fund distributions or the redemption of Fund shares.
|
| (e) |
In 2016, the Fund's total return consists of a voluntary/unvoluntary reimbursement by the adviser for a realized investment loss. Excluding this item, total return would not change as the impact is less than 0.005%.
|
See Notes to Financial Statements.
|
42
|
www.clarkstonfunds.com
|
|
Clarkston Partners Fund – Institutional Class
|
Financial Highlights
|
For a Share Outstanding Throughout the Periods Presented
| (f) |
Annualized.
|
| (g) |
According to the Fund's shareholder services plan with respect to the Fund's Institutional shares, any amount of fees accrued according to the plan but not paid during the Fund's fiscal year for such service activities shall be reimbursed to the Fund as soon as practical. Fees were reimbursed to the Fund during the year ended September 30, 2017, in the amount of 0.02% of average net assets of Institutional shares.
|
| (h) |
Portfolio turnover rate for periods less than one full year have not been annualized.
|
See Notes to Financial Statements.
|
Annual Report | September 30, 2017
|
43
|
|
Clarkston Fund – Institutional Class
|
Financial Highlights
|
For a Share Outstanding Throughout the Periods Presented
|
For the Year Ended
September 30, 2017 |
For the Period Ended
September 30, 2016(a) |
|||||||
|
NET ASSET VALUE, BEGINNING OF PERIOD
|
$
|
10.52
|
$
|
10.00
|
||||
|
INCOME/(LOSS) FROM OPERATIONS:
|
||||||||
|
Net investment income(b)
|
0.16
|
0.08
|
||||||
|
Net realized and unrealized gain on investments
|
0.90
|
0.44
|
||||||
|
Total from investment operations
|
1.06
|
0.52
|
||||||
|
LESS DISTRIBUTIONS:
|
||||||||
|
From net investment income
|
(0.10
|
)
|
–
|
|||||
|
From net realized gains on investments
|
(0.02
|
)
|
–
|
|||||
|
Total Distributions
|
(0.12
|
)
|
–
|
|||||
|
NET INCREASE IN NET ASSET VALUE
|
0.94
|
0.52
|
||||||
|
NET ASSET VALUE, END OF PERIOD
|
$
|
11.46
|
$
|
10.52
|
||||
|
TOTAL RETURN(c)
|
10.13
|
%
|
5.20
|
%
|
||||
|
SUPPLEMENTAL DATA:
|
||||||||
|
Net assets, end of period (in 000s)
|
$
|
29,407
|
$
|
20,173
|
||||
|
RATIOS TO AVERAGE NET ASSETS
|
||||||||
|
Operating expenses excluding reimbursement/waiver
|
1.04
|
%
|
1.48
|
%(d)
|
||||
|
Operating expenses including reimbursement/waiver
|
0.65
|
%(e)
|
0.70
|
%(d)
|
||||
|
Net investment income including reimbursement/waiver
|
1.41
|
%
|
1.36
|
%(d)
|
||||
|
PORTFOLIO TURNOVER RATE(f)
|
5
|
%
|
0
|
%
|
||||
| (a) |
Commenced operations on April 4, 2016.
|
| (b) |
Per share amounts are based upon average shares outstanding.
|
| (c) |
Assumes an initial investment on the business day before the first day of the fiscal period, with all dividends and distributions reinvested in additional shares on the reinvestment date, and redemption at the net asset value calculated on the last business day of the fiscal year. Total returns are for the period indicated and have not been annualized. Total returns would have been lower had certain expenses not been waived during the period. Returns shown do not reflect the deduction of taxes that a shareholder would pay on Fund distributions or the redemption of Fund shares.
|
| (d) |
Annualized.
|
| (e) |
According to the Fund's shareholder services plan with respect to the Fund's Institutional shares, any amount of fees accrued according to the plan but not paid during the Fund's fiscal year for such service activities shall be reimbursed to the Fund as soon as practical. Fees were reimbursed to the Fund during the year ended September 30, 2017, in the amount of 0.05% of average net assets of Institutional shares.
|
| (f) |
Portfolio turnover rate for periods less than one full year have not been annualized.
|
See Notes to Financial Statements.
|
44
|
www.clarkstonfunds.com
|
|
Clarkston Select Fund – Institutional Class
|
Financial Highlights
|
For a Share Outstanding Throughout the Period Presented
|
For the Period Ended
September 30, 2017(a) |
||||
|
NET ASSET VALUE, BEGINNING OF PERIOD
|
$
|
10.00
|
||
|
INCOME/(LOSS) FROM OPERATIONS:
|
||||
|
Net investment income(b)
|
0.12
|
|||
|
Net realized and unrealized gain on investments
|
0.50
|
|||
|
Total from investment operations
|
0.62
|
|||
|
LESS DISTRIBUTIONS:
|
||||
|
From net investment income
|
(0.12
|
)
|
||
|
Total Distributions
|
(0.12
|
)
|
||
|
NET INCREASE IN NET ASSET VALUE
|
0.50
|
|||
|
NET ASSET VALUE, END OF PERIOD
|
$
|
10.50
|
||
|
TOTAL RETURN(c)
|
6.21
|
%
|
||
|
SUPPLEMENTAL DATA:
|
||||
|
Net assets, end of period (in 000s)
|
$
|
11,785
|
||
|
RATIOS TO AVERAGE NET ASSETS
|
||||
|
Operating expenses excluding reimbursement/waiver
|
1.72
|
%(d)
|
||
|
Operating expenses including reimbursement/waiver
|
0.67
|
%(d)(e)
|
||
|
Net investment income including reimbursement/waiver
|
1.76
|
%(d)
|
||
|
PORTFOLIO TURNOVER RATE(f)
|
3
|
%
|
||
| (a) |
Commenced operations on February 1, 2017.
|
| (b) |
Per share amounts are based upon average shares outstanding.
|
| (c) |
Assumes an initial investment on the business day before the first day of the fiscal period, with all dividends and distributions reinvested in additional shares on the reinvestment date, and redemption at the net asset value calculated on the last business day of the fiscal year. Total returns are for the period indicated and have not been annualized. Total returns would have been lower had certain expenses not been waived during the period. Returns shown do not reflect the deduction of taxes that a shareholder would pay on Fund distributions or the redemption of Fund shares.
|
| (d) |
Annualized.
|
| (e) |
According to the Fund's shareholder services plan with respect to the Fund's Institutional shares, any amount of fees accrued according to the plan but not paid during the Fund's fiscal year for such service activities shall be reimbursed to the Fund as soon as practical. Fees were reimbursed to the Fund during the year ended September 30, 2017, in the amount of 0.03% of average net assets of Institutional shares.
|
| (f) |
Portfolio turnover rate for periods less than one full year have not been annualized.
|
See Notes to Financial Statements.
|
Annual Report | September 30, 2017
|
45
|
|
Clarkston Founders Fund – Institutional Class
|
Financial Highlights
|
For a Share Outstanding Throughout the Period Presented
|
For the Period Ended
September 30, 2017(a) |
||||
|
NET ASSET VALUE, BEGINNING OF PERIOD
|
$
|
10.00
|
||
|
INCOME/(LOSS) FROM OPERATIONS:
|
||||
|
Net investment income(b)
|
0.02
|
|||
|
Net realized and unrealized gain on investments
|
0.62
|
|||
|
Total from investment operations
|
0.64
|
|||
|
NET INCREASE IN NET ASSET VALUE
|
0.64
|
|||
|
NET ASSET VALUE, END OF PERIOD
|
$
|
10.64
|
||
|
TOTAL RETURN(c)
|
6.40
|
%
|
||
|
SUPPLEMENTAL DATA:
|
||||
|
Net assets, end of period (in 000s)
|
$
|
24,147
|
||
|
RATIOS TO AVERAGE NET ASSETS
|
||||
|
Operating expenses excluding reimbursement/waiver
|
1.46
|
%(d)
|
||
|
Operating expenses including reimbursement/waiver
|
0.92
|
%(d)(e)
|
||
|
Net investment income including reimbursement/waiver
|
0.29
|
%(d)
|
||
|
PORTFOLIO TURNOVER RATE(f)
|
4
|
%
|
||
| (a) |
Commenced operations on February 1, 2017.
|
| (b) |
Per share amounts are based upon average shares outstanding.
|
| (c) |
Assumes an initial investment on the business day before the first day of the fiscal period, with all dividends and distributions reinvested in additional shares on the reinvestment date, and redemption at the net asset value calculated on the last business day of the fiscal year. Total returns are for the period indicated and have not been annualized. Total returns would have been lower had certain expenses not been waived during the period. Returns shown do not reflect the deduction of taxes that a shareholder would pay on Fund distributions or the redemption of Fund shares.
|
| (d) |
Annualized.
|
| (e) |
According to the Fund's shareholder services plan with respect to the Fund's Institutional shares, any amount of fees accrued according to the plan but not paid during the Fund's fiscal year for such service activities shall be reimbursed to the Fund as soon as practical. Fees were reimbursed to the Fund during the year ended September 30, 2017, in the amount of 0.03% of average net assets of Institutional shares.
|
| (f) |
Portfolio turnover rate for periods less than one full year have not been annualized.
|
See Notes to Financial Statements.
|
46
|
www.clarkstonfunds.com
|
|
Clarkston Funds
|
Notes to Financial Statements
|
|
September 30, 2017
|
1. ORGANIZATION
ALPS Series Trust (the “Trust”), a Delaware statutory trust, is an open-end management investment company registered under the Investment Company Act of 1940, as amended (the “1940 Act”). The Trust consists of multiple separate portfolios or series. This Annual Report describes the Clarkston Partners Fund, the Clarkston Fund, the Clarkston Select Fund and the Clarkston Founders Fund (each, a “Fund” and collectively, the “Funds”). The Funds are non-diversified and the primary investment objectives are to achieve long-term capital appreciation, as well as current income for the Clarkston Select Fund. The Clarkston Partners Fund currently offers Founders Class shares and Institutional Class shares, and the Clarkston Fund, the Clarkston Select Fund and the Clarkston Founders Fund currently offer Institutional Class shares. Each share class for the Clarkston Partners Fund has identical rights to earnings, assets and voting privileges, except for class-specific expenses and exclusive rights to vote on matters affecting only individual classes. The Board of Trustees (the “Board”) may establish additional funds and classes of shares at any time in the future without shareholder approval.
2. SIGNIFICANT ACCOUNTING POLICIES
The accompanying financial statements were prepared in accordance with accounting principles generally accepted in the United States of America for investment companies (“U.S. GAAP”). The Funds are considered investment companies under U.S. GAAP and follow the accounting and reporting guidance applicable to investment companies in the Financial Accounting Standards Board Accounting Standards Codification Topic 946. The preparation of financial statements in conformity with U.S. GAAP requires management to make certain estimates and assumptions that affect the reported amounts of assets and liabilities and disclosures of contingent assets and liabilities at the date of the financial statements and the reported amounts of revenue and expenses during the period. Actual results could differ from those estimates. The following is a summary of significant accounting policies consistently followed by the Funds in preparation of their financial statements.
Investment Valuation: The Funds generally value their securities based on market prices determined at the close of regular trading on the New York Stock Exchange (“NYSE”), normally 4:00 p.m. Eastern Time, on each day the NYSE is open for trading.
Securities traded on a registered U.S. securities exchange (including exchange-traded derivatives other than futures and futures options) are valued based on the last sale price of the security reported on the principal exchange on which it is traded, prior to the time when the Funds’ assets are valued. In the case of equity securities not traded on an exchange, or if such closing prices are not otherwise available, the securities are valued at the mean of the most recent bid and ask prices on such day.
Redeemable securities issued by open-end registered investment companies are valued at the investment company’s applicable net asset value, with the exception of exchange-traded open-end investment companies, which are priced as equity securities.
When such prices or quotations are not available, or when the Fair Value Committee appointed by the Board believes that they are unreliable, securities may be priced using fair value procedures approved by the Board.
|
Annual Report | September 30, 2017
|
47
|
|
Clarkston Funds
|
Notes to Financial Statements
|
|
September 30, 2017
|
Fair Value Measurements: The Funds disclose the classification of their fair value measurements following a three-tier hierarchy based on the inputs used to measure fair value. Inputs refer broadly to the assumptions that market participants would use in pricing the asset or liability, including assumptions about risk. Inputs may be observable or unobservable. Observable inputs reflect the assumptions market participants would use in pricing the asset or liability that are developed based on market data obtained from sources independent of the reporting entity. Unobservable inputs reflect the reporting entity’s own assumptions about the assumptions market participants would use in pricing the asset or liability that are developed based on the best information available.
Various inputs are used in determining the value of the Funds’ investments as of the end of the reporting period. When inputs used fall into different levels of the fair value hierarchy, the level in the hierarchy within which the fair value measurement falls is determined based on the lowest level input that is significant to the fair value measurement in its entirety. The designated input levels are not necessarily an indication of the risk or liquidity associated with these investments. These inputs are categorized in the following hierarchy under applicable financial accounting standards:
| Level 1 – |
Unadjusted quoted prices in active markets for identical investments, unrestricted assets or liabilities that the Fund has the ability to access at the measurement date;
|
| Level 2 – |
Quoted prices which are not active, quoted prices for similar assets or liabilities in active markets or inputs other than quoted prices that are observable (either directly or indirectly); and
|
| Level 3 – |
Significant unobservable prices or inputs (including the Fund’s own assumptions in determining the fair value of investments) where there is little or no market activity for the asset or liability at the measurement date.
|
|
48
|
www.clarkstonfunds.com
|
|
Clarkston Funds
|
Notes to Financial Statements
|
|
September 30, 2017
|
The following is a summary of the inputs used to value the Funds’ investments as of September 30, 2017:
Clarkston Partners Fund
|
Investments in Securities at Value
|
Level 1 - Unadjusted
Quoted Prices |
Level 2 -
Other Significant Observable Inputs |
Level 3 -
Significant Unobservable Inputs |
Total
|
||||||||||||
|
Common Stocks
|
||||||||||||||||
|
Consumer Discretionary
|
$
|
52,768,750
|
$
|
–
|
$
|
–
|
$
|
52,768,750
|
||||||||
|
Consumer Staples
|
32,311,000
|
–
|
–
|
32,311,000
|
||||||||||||
|
Financial Services
|
262,033,240
|
–
|
–
|
262,033,240
|
||||||||||||
|
Materials & Processing
|
13,674,000
|
–
|
–
|
13,674,000
|
||||||||||||
|
Producer Durables
|
163,152,786
|
–
|
–
|
163,152,786
|
||||||||||||
|
Technology
|
13,224,000
|
–
|
–
|
13,224,000
|
||||||||||||
|
Total
|
$
|
537,163,776
|
$
|
–
|
$
|
–
|
$
|
537,163,776
|
||||||||
Clarkston Fund
|
Investments in Securities at Value
|
Level 1 - Unadjusted
Quoted Prices |
Level 2 -
Other Significant Observable Inputs |
Level 3 -
Significant Unobservable Inputs |
Total
|
||||||||||||
|
Common Stocks
|
||||||||||||||||
|
Consumer Discretionary
|
$
|
1,071,697
|
$
|
–
|
$
|
–
|
$
|
1,071,697
|
||||||||
|
Consumer Staples
|
6,330,405
|
–
|
–
|
6,330,405
|
||||||||||||
|
Financial Services
|
6,675,775
|
–
|
–
|
6,675,775
|
||||||||||||
|
Health Care
|
3,010,975
|
–
|
–
|
3,010,975
|
||||||||||||
|
Producer Durables
|
4,170,020
|
–
|
–
|
4,170,020
|
||||||||||||
|
Technology
|
3,395,010
|
–
|
–
|
3,395,010
|
||||||||||||
|
Total
|
$
|
24,653,882
|
$
|
–
|
$
|
–
|
$
|
24,653,882
|
||||||||
|
Annual Report | September 30, 2017
|
49
|
|
Clarkston Funds
|
Notes to Financial Statements
|
|
September 30, 2017
|
Clarkston Select Fund
|
Investments in Securities at Value
|
Level 1 - Unadjusted
Quoted Prices |
Level 2 -
Other Significant Observable Inputs |
Level 3 -
Significant Unobservable Inputs |
Total
|
||||||||||||
|
Common Stocks
|
||||||||||||||||
|
Consumer Discretionary
|
$
|
462,395
|
$
|
–
|
$
|
–
|
$
|
462,395
|
||||||||
|
Consumer Staples
|
2,455,760
|
–
|
–
|
2,455,760
|
||||||||||||
|
Financial Services
|
1,799,448
|
–
|
–
|
1,799,448
|
||||||||||||
|
Health Care
|
773,032
|
–
|
–
|
773,032
|
||||||||||||
|
Materials & Processing
|
273,480
|
–
|
–
|
273,480
|
||||||||||||
|
Producer Durables
|
2,401,027
|
–
|
–
|
2,401,027
|
||||||||||||
|
Technology
|
1,570,905
|
–
|
–
|
1,570,905
|
||||||||||||
|
Total
|
$
|
9,736,047
|
$
|
–
|
$
|
–
|
$
|
9,736,047
|
||||||||
Clarkston Founders Fund
|
Investments in Securities at Value
|
Level 1 - Unadjusted
Quoted Prices |
Level 2 -
Other Significant Observable Inputs |
Level 3 -
Significant Unobservable Inputs |
Total
|
||||||||||||
|
Common Stocks
|
||||||||||||||||
|
Consumer Discretionary
|
$
|
764,595
|
$
|
–
|
$
|
–
|
$
|
764,595
|
||||||||
|
Consumer Staples
|
1,959,330
|
–
|
–
|
1,959,330
|
||||||||||||
|
Financial Services
|
7,923,942
|
–
|
–
|
7,923,942
|
||||||||||||
|
Health Care
|
1,094,577
|
–
|
–
|
1,094,577
|
||||||||||||
|
Materials & Processing
|
524,170
|
–
|
–
|
524,170
|
||||||||||||
|
Producer Durables
|
3,574,540
|
–
|
–
|
3,574,540
|
||||||||||||
|
Technology
|
440,800
|
–
|
–
|
440,800
|
||||||||||||
|
Total
|
$
|
16,281,954
|
$
|
–
|
$
|
–
|
$
|
16,281,954
|
||||||||
The Funds recognize transfers between levels as of the end of the period. For the fiscal year or period ended September 30, 2017, the Funds did not have any transfers between Level 1 and Level 2 securities. There were no Level 3 securities held during the period.
Offering Costs: The Clarkston Fund, the Clarkston Select Fund, and the Clarkston Founders Fund incurred offering costs during the year or period ended September 30, 2017. These offering costs, including fees for printing initial prospectuses, legal and registration fees, are being amortized over the first twelve months from the inception date of the Fund. Amounts amortized through September 30, 2017 are expensed in on the Funds’ Statements of Operations and amounts that remain to be amortized are shown on the Funds’ Statements of Assets and Liabilities.
|
50
|
www.clarkstonfunds.com
|
|
Clarkston Funds
|
Notes to Financial Statements
|
|
September 30, 2017
|
Concentration of Credit Risk: Each Fund places its cash with a banking institution, which is insured by Federal Deposit Insurance Corporation (FDIC). The FDIC limit is $250,000. At various times throughout the year or period, the amount on deposit may exceed the FDIC limit and subject the Fund to a credit risk. The Funds do not believe that such deposits are subject to any unusual risk associated with investment activities.
Trust Expenses: Some expenses of the Trust can be directly attributed to a Fund. Expenses that cannot be directly attributed to a Fund are apportioned among all funds in the Trust based on average net assets of each fund.
Fund Expenses: Some expenses can be directly attributed to a Fund and are apportioned among the classes based on average net assets of each class.
Class Expenses: Expenses that are specific to a class of shares are charged directly to that share class. Fees provided under the shareholder service plan for a particular class of a Fund are charged to the operations of such class.
Federal Income Taxes: The Funds comply with the requirements under Subchapter M of the Internal Revenue Code of 1986, as amended, applicable to regulated investment companies and intend to distribute substantially all of their net taxable income and net capital gains, if any, each year so that they will not be subject to excise tax on undistributed income and gains. The Funds are not subject to income taxes to the extent such distributions are made.
As of and during the fiscal year or period ended September 30, 2017, the Funds did not have a liability for any unrecognized tax benefits in the accompanying financial statements. The Funds recognize interest and penalties, if any, related to tax liabilities as income tax expense in the Statements of Operations. The Funds file U.S. federal, state and local income tax returns as required. The Funds’ tax returns are subject to examination by the relevant tax authorities until expiration of the applicable statute of limitations, which is generally three years after the filing of the tax return for federal purposes and four years for most state returns. The Funds’ administrator has analyzed the Funds’ tax positions taken on federal and state income tax returns for all open tax years and has concluded that as of September 30, 2017, no provision for income tax is required in the Funds’ financial statements related to these tax positions.
Investment Transactions and Investment Income: Investment transactions are accounted for on the date the investments are purchased or sold (trade date basis) for financial reporting purposes. Realized gains and losses from investment transactions are reported on an identified cost basis. Interest income, which includes accretion of discounts and amortization of premiums, is accrued and recorded as earned. Dividend income is recognized on the ex-dividend date, or for certain foreign securities, as soon as information is available to a Fund. Withholding taxes on foreign dividends are paid (a portion of which may be reclaimable) or provided for in accordance with the applicable country’s tax rules and rates and are disclosed in the Statement of Operations. All of the realized and unrealized gains and losses and net investment income are allocated daily to each class in proportion to its average daily net assets.
Distributions to Shareholders: The Clarkston Partners Fund, Clarkston Fund and Clarkston Founders Fund normally pay dividends, if any, and distribute capital gains, if any, on an annual basis. The Clarkston Select Fund normally pays dividends, if any, on a quarterly basis and distributes capital gains, if any, on an annual basis. Income dividend distributions are derived from interest, dividends and other income the Funds receive from their investments, including short-term capital gains. Long-term capital gain distributions are derived from gains realized when a Fund sells a security it has owned for more than one year. A Fund may make additional distributions and dividends at other times if its portfolio manager or managers believe doing so may be necessary for the Fund to avoid or reduce taxes. Net investment income/(loss) and net realized gain/(loss) may differ for financial statement and tax purposes.
|
Annual Report | September 30, 2017
|
51
|
|
Clarkston Funds
|
Notes to Financial Statements
|
|
September 30, 2017
|
3. TAX BASIS INFORMATION
Tax Basis of Distributions to Shareholders: The character of distributions made during the period from net investment income or net realized gains may differ from its ultimate characterization for Federal income tax purposes. Also, due to the timing of dividend distributions, the fiscal year in which amounts are distributed may differ from the fiscal year in which the income or realized gain were recorded by the Funds. The amounts and characteristics of tax basis distributions and composition of distributable earnings/(accumulated losses) are finalized at fiscal year end.
The tax character of distributions paid during the fiscal year or period ended September 30, 2017, were as follows:
|
Ordinary Income
|
Long-Term
Capital Gains |
|||||||
|
Clarkston Partners Fund
|
$
|
7,091,111
|
$
|
92,112
|
||||
|
Clarkston Fund
|
254,491
|
–
|
||||||
|
Clarkston Select Fund
|
122,180
|
–
|
||||||
The tax character of distributions paid during the fiscal year ended September 30, 2016 were as follows:
|
Ordinary Income
|
Long-Term
Capital Gains |
|||||||
|
Clarkston Partners Fund
|
$
|
448,278
|
$
|
–
|
||||
There were no distributions paid by the Clarkston Founders Fund during the fiscal period ended September 30, 2017, or the Clarkston Fund during the fiscal period ended September 30, 2016.
Reclassifications: As of September 30, 2017, permanent differences in book and tax accounting were reclassified. The following reclassifications, which had no impact on results of operations or net assets, were recorded to reflect tax character:
|
Paid-in Capital
|
Accumulated Net Investment Income
|
Accumulated Net Realized Gains on Investments
|
||||||||||
|
Clarkston Partners Fund
|
$
|
–
|
$
|
(381
|
)
|
$
|
381
|
|||||
|
Clarkston Fund
|
(21,897
|
)
|
21,897
|
–
|
||||||||
|
Clarkston Select Fund
|
(14,653
|
)
|
14,653
|
–
|
||||||||
|
Clarkston Founders Fund
|
(27,457
|
)
|
27,457
|
–
|
||||||||
|
52
|
www.clarkstonfunds.com
|
|
Clarkston Funds
|
Notes to Financial Statements
|
|
September 30, 2017
|
These differences are primarily attributed to non-deductible organizational costs.
Unrealized Appreciation and Depreciation on Investments: As of September 30, 2017, the aggregate costs of investments, gross unrealized appreciation/(depreciation) and net unrealized appreciation for Federal tax purposes were as follows:
|
Clarkston
Partners Fund |
Clarkston Fund
|
Clarkston
Select Fund |
Clarkston
Founders Fund |
|||||||||||||
|
Gross unrealized appreciation (excess of value over tax cost)
|
$
|
118,082,828
|
$
|
3,284,206
|
$
|
635,496
|
$
|
1,389,325
|
||||||||
|
Gross unrealized depreciation (excess of tax cost over value)
|
(3,095,211
|
)
|
(475,757
|
)
|
(229,883
|
)
|
(161,815
|
)
|
||||||||
|
Net unrealized appreciation
|
$
|
114,987,617
|
$
|
2,808,449
|
$
|
405,613
|
$
|
1,227,510
|
||||||||
|
Cost of investments for income tax purposes
|
$
|
422,176,159
|
$
|
21,845,433
|
$
|
9,330,434
|
$
|
15,054,444
|
||||||||
Components of Distributable Earnings: As of September 30, 2017, components of distributable earnings were as follows:
|
Clarkston
Partners Fund |
Clarkston Fund
|
Clarkston
Select Fund |
Clarkston
Founders Fund |
|||||||||||||
|
Undistributed ordinary income
|
$
|
1,172,608
|
$
|
307,993
|
$
|
32,696
|
$
|
67,019
|
||||||||
|
Accumulated capital gains/(losses)
|
7,147,105
|
–
|
–
|
(38,987
|
)
|
|||||||||||
|
Net unrealized appreciation
|
114,987,617
|
2,808,449
|
405,613
|
1,227,510
|
||||||||||||
|
Total
|
$
|
123,307,330
|
$
|
3,116,442
|
$
|
438,309
|
$
|
1,255,542
|
||||||||
Capital Losses: As of September 30, 2017, the Funds had the following capital loss carryforwards:
|
Fund
|
Non-expiring
Short-Term |
|||
|
Clarkston Founders Fund
|
$
|
38,987
|
||
|
Annual Report | September 30, 2017
|
53
|
|
Clarkston Funds
|
Notes to Financial Statements
|
|
September 30, 2017
|
4. SECURITIES TRANSACTIONS
Purchases and sales of securities, excluding short-term securities, during the fiscal year or period ended September 30, 2017 were as follows:
|
Purchases of Securities
|
Proceeds from Sales of Securities
|
|||||||
|
Clarkston Partners Fund
|
$
|
85,511,821
|
$
|
61,238,988
|
||||
|
Clarkston Fund
|
7,569,077
|
1,030,758
|
||||||
|
Clarkston Select Fund
|
9,531,573
|
225,816
|
||||||
|
Clarkston Founders Fund
|
15,661,712
|
568,281
|
||||||
5. BENEFICIAL SHARE TRANSACTIONS
The capitalization of the Trust consists of an unlimited number of shares of beneficial interest with no par value per share. Holders of the shares of the Funds have one vote for each share held and a proportionate fraction of a vote for each fractional share. All shares issued and outstanding are fully paid and are transferable and redeemable at the option of the shareholder. Shares have no pre-emptive rights. Neither the Funds nor any of their creditors have the right to require shareholders to pay any additional amounts solely because the shareholder owns the shares.
|
54
|
www.clarkstonfunds.com
|
|
Clarkston Funds
|
Notes to Financial Statements
|
|
September 30, 2017
|
Transactions in common shares were as follows:
|
For the Year or Period Ended September 30,
2017 |
For the Year or Period Ended September 30,
2016 |
|||||||
|
Clarkston Partners Fund
|
||||||||
|
Founders Class
|
||||||||
|
Shares sold
|
6,286,064
|
16,080,830
|
||||||
|
Shares issued in reinvestment of distributions to shareholders
|
10,663
|
24,396
|
||||||
|
Shares redeemed
|
(1,999,988
|
)
|
(1,341,410
|
)
|
||||
|
Net increase in shares outstanding
|
4,296,739
|
14,763,816
|
||||||
|
Institutional Class
|
||||||||
|
Shares sold
|
13,053,266
|
32,679,127
|
||||||
|
Shares issued in reinvestment of distributions to shareholders
|
284,204
|
19,999
|
||||||
|
Shares redeemed
|
(5,461,351
|
)
|
(10,862,954
|
)
|
||||
|
Net increase in shares outstanding
|
7,876,119
|
21,836,172
|
||||||
|
Clarkston Fund(a)
|
||||||||
|
Institutional Class
|
||||||||
|
Shares sold
|
904,686
|
1,948,035
|
||||||
|
Shares issued in reinvestment of distributions to shareholders
|
23,542
|
–
|
||||||
|
Shares redeemed
|
(279,399
|
)
|
(30,385
|
)
|
||||
|
Net increase in shares outstanding
|
648,829
|
1,917,650
|
||||||
|
Clarkston Select Fund(b)
|
||||||||
|
Institutional Class
|
||||||||
|
Shares sold
|
1,237,139
|
N/A
|
||||||
|
Shares issued in reinvestment of distributions to shareholders
|
11,806
|
N/A
|
||||||
|
Shares redeemed
|
(126,209
|
)
|
N/A
|
|||||
|
Net increase in shares outstanding
|
1,122,736
|
N/A
|
||||||
|
Clarkston Founders Fund(b)
|
||||||||
|
Institutional Class
|
||||||||
|
Shares sold
|
2,374,806
|
N/A
|
||||||
|
Shares issued in reinvestment of distributions to shareholders
|
–
|
N/A
|
||||||
|
Shares redeemed
|
(106,208
|
)
|
N/A
|
|||||
|
Net increase in shares outstanding
|
2,268,598
|
N/A
|
||||||
| (a) |
Commenced operations on April 4, 2016.
|
| (b) |
Commenced operations on February 1, 2017.
|
|
Annual Report | September 30, 2017
|
55
|
|
Clarkston Funds
|
Notes to Financial Statements
|
|
September 30, 2017
|
Control is defined by the 1940 Act as the beneficial ownership, either directly or through one or more controlled companies, of more than 25% of the voting securities of a company. Approximately 80% of the outstanding shares of the Clarkston Partners Fund are held by two record shareholders: one is an omnibus account and one is a record shareholder that owns shares on behalf of its underlying beneficial owners. Approximately 80% of the outstanding shares of the Clarkston Fund are owned by one omnibus account. Approximately 85% of the outstanding shares of the Clarkston Select Fund are owned by one omnibus account. Approximately 96% of the outstanding shares of the Clarkston Founders Fund are owned by two omnibus accounts. Share transaction activities of these shareholders could have a material impact on the Funds.
6. MANAGEMENT AND RELATED PARTY TRANSACTIONS
Investment Advisory: Clarkston Capital Partners, LLC (“Clarkston” or the “Adviser”), subject to the authority of the Board, is responsible for the management of the Funds’ portfolios. The Adviser manages the investments of the Funds in accordance with the Funds’ investment objectives, policies and limitations and investment guidelines established jointly by the Adviser and the Board.
Pursuant to the Investment Advisory Agreement (the “Advisory Agreement”) with the Adviser, each Fund pays the Adviser an annual management fee that is based on the Fund’s average daily net assets. The management fee is paid on a monthly basis. The contractual management fee rates are 0.80%, 0.50%, 0.50% and 0.75% for the Clarkston Partners Fund, the Clarkston Fund, the Clarkston Select Fund and the Clarkston Founders Fund, respectively. The initial term of the Advisory Agreement is two years. The Board may extend the Advisory Agreement for additional one-year terms. The Board and shareholders of a Fund may terminate the Advisory Agreement upon 30 days’ written notice. The Adviser may terminate the Advisory Agreement upon 60 days’ notice.
Pursuant to a fee waiver letter agreement (the “Fee Waiver Agreement”), the Adviser has contractually agreed to limit the amount of each Fund’s Total Annual Fund Operating Expenses, exclusive of shareholder servicing fees, brokerage expenses, interest expenses, acquired fund fees and expenses and extraordinary expenses to an annual rate of 0.85% of the Clarkston Partners Fund’s average daily net assets for each of the Founders Class shares and the Institutional Class shares, 0.55% of the Clarkston Fund’s average daily net assets for the Institutional Class shares, 0.55% of the Clarkston Select Fund’s average daily net assets for the Institutional Class shares and 0.80% of the Clarkston Founders Fund’s average daily net assets for the Institutional Class shares. Prior to November 14, 2016, the Adviser contractually agreed to limit the amount of the Clarkston Fund Total Annual Fund Operating Expenses, exclusive of brokerage expenses, interest expenses, acquired fund fees and expenses and extraordinary expenses to an annual rate of 0.70% (inclusive of shareholder servicing fees). The Fee Waiver Agreement is in effect through January 31, 2018. The Adviser may not terminate the Fee Waiver Agreement without the approval of the Trust’s Board. The Adviser will be permitted to recover, on a class-by-class basis, expenses it has borne through the Fee Waiver Agreement to the extent that a Fund’s expenses in later periods fall below the annual rates set forth in the Fee Waiver Agreement. The Funds will not be obligated to pay any such deferred fees and expenses more than three years after the end of the fiscal year in which the fees and expenses were deferred. Fees waived or reimbursed for the fiscal year or period ended September 30, 2017 are disclosed in the Statements of Operations.
|
56
|
www.clarkstonfunds.com
|
|
Clarkston Funds
|
Notes to Financial Statements
|
|
September 30, 2017
|
As of September 30, 2017, the balances of recoupable expenses for each Fund were as follows:
|
Expiring in 2018
|
Expiring in 2019
|
Expiring in 2020
|
||||||||||
|
Clarkston Partners Fund
|
||||||||||||
|
Founders
|
50,396
|
368,096
|
389,579
|
|||||||||
|
Institutional
|
10
|
301,646
|
349,038
|
|||||||||
|
Clarkston Fund
|
||||||||||||
|
Institutional
|
–
|
64,723
|
101,949
|
|||||||||
|
Clarkston Select Fund
|
||||||||||||
|
Institutional
|
–
|
–
|
68,518
|
|||||||||
|
Clarkston Founders Fund
|
||||||||||||
|
Institutional
|
–
|
–
|
73,077
|
|||||||||
Administrator: ALPS (an affiliate of ALPS Distributors, Inc.) serves as administrator to each Fund. The Funds have agreed to pay expenses incurred in connection with its administrative activities. Pursuant to the Administration, Bookkeeping and Pricing Services Agreement with the Trust, ALPS will provide operational services to the Funds including, but not limited to, fund accounting and fund administration and generally assist in each Fund’s operations. Each Fund’s administration fee is accrued on a daily basis and paid monthly. The officers and an Interested Trustee of the Trust are employees of ALPS. Administration fees paid by the Funds for the fiscal year or period ended September 30, 2017 are disclosed in the Statements of Operations. ALPS is reimbursed by the Funds for certain out-of-pocket expenses.
Transfer Agent: ALPS serves as transfer agent for each Fund under a Transfer Agency and Services Agreement with the Trust. Under this agreement, ALPS is paid an annual fee for services performed on behalf of the Funds plus fees for open accounts and is reimbursed for certain out-of-pocket expenses.
Compliance Services: ALPS provides services as each Fund’s Chief Compliance Officer to monitor and test the policies and procedures of each Fund in conjunction with requirements under Rule 38a-1 of the 1940 Act pursuant to a Chief Compliance Officer Services Agreement with the Trust. Under this agreement, ALPS is paid an annual fee for services performed on behalf of the Funds and is reimbursed for certain out-of-pocket expenses.
Distribution: ALPS Distributors, Inc. (the “Distributor”) (an affiliate of ALPS) acts as the principal underwriter of each Fund’s shares pursuant to a Distribution Agreement with the Trust. Shares of each Fund are offered on a continuous basis through the Distributor, as agent of the Funds. The Distributor is not obligated to sell any particular amount of shares and is not entitled to any compensation for its services as the Funds’ principal underwriter pursuant to the Distribution Agreement.
Each Fund has adopted a shareholder services plan (“Shareholder Services Plan”) for its Institutional Class. Under the Shareholder Services Plan each Fund is authorized to pay banks and their affiliates and other institutions, including broker-dealers and Fund affiliates (“Participating Organizations”), an aggregate fee in an amount not to exceed on an annual basis 0.15% of the average daily net asset value of each Fund’s Institutional Class shares to Participating Organizations as compensation for providing shareholder service activities, which do not include distribution services, pursuant to an agreement with a Participating Organization.
|
Annual Report | September 30, 2017
|
57
|
|
Clarkston Funds
|
Notes to Financial Statements
|
|
September 30, 2017
|
7. TRUSTEES
As of September 30, 2017, there were four Trustees, three of whom are not “interested persons” (as defined in the 1940 Act) of the Trust (the “Independent Trustees”). Effective October 1, 2016, the Independent Trustees receive a quarterly retainer of $5,000, plus $4,000 for each regular Board or Committee meeting attended, $2,000 for each special telephonic Board or Committee meeting attended and $2,000 for each special in-person Board meeting attended. The Independent Trustees are also reimbursed for all reasonable out-of-pocket expenses relating to attendance at meetings and for meeting-related expenses. Officers of the Trust and Trustees who are interested persons of the Trust receive no salary or fees from the Trust.
8. INDEMNIFICATIONS
Under the Trust’s organizational documents, its officers and Trustees are indemnified against certain liabilities arising out of the performance of their duties to the Trust. Additionally, in the normal course of business, the Trust enters into contracts with service providers that may contain general indemnification clauses which may permit indemnification to the extent permissible under applicable law. The Trust’s maximum exposure under these arrangements is unknown, as this would involve future claims that may be made against the Trust that have not yet occurred.
9. SUBSEQUENT EVENTS
Subsequent events after the date of the Statement of Assets and Liabilities have been evaluated through the date the financial statements were issued.
Effective November 16, 2017, the Independent Trustees’ quarterly retainer will increase to $6,000 and the Audit Committee Chair will now receive a quarterly retainer of $1,250 and the Independent Chair will receive a quarterly retainer of $2,500. The Independent Trustees will continue to receive $4,000 for each regular Board or Committee meeting attended, $2,000 for each special telephonic Board or Committee meeting attended and $2,000 for each special in-person Board meeting attended. The Independent Trustees will continue to be reimbursed for all reasonable out-of-pocket expenses relating to attendance at meetings and for meeting-related expenses.
Effective November 16, 2017, the Funds’ Adviser has contractually agreed to extend their fee waiver agreement through January 31, 2019.
Management has determined that there were no other subsequent events to report through the issuance of these financial statements.
|
58
|
www.clarkstonfunds.com
|
|
Clarkston Funds
|
Report of Independent Registered Public Accounting Firm
|
To the Shareholders of Clarkston Partners Fund, Clarkston Fund, Clarkston Select Fund, and Clarkston Founders Fund and Board of Trustees of ALPS Series Trust
We have audited the accompanying statements of assets and liabilities, including the portfolios of investments, of Clarkston Partners Fund, Clarkston Fund, Clarkston Select Fund, and Clarkston Founders Fund (the “Funds”), each a series of ALPS Series Trust, as of September 30, 2017, and the related statements of operations and changes in net assets, and the financial highlights for the year then ended for Clarkston Partners Fund and Clarkston Fund, and the related statements of operations and changes in net assets, and the financial highlights for the period February 1, 2017 (commencement of operations) to September 30, 2017, for Clarkston Select Fund and Clarkston Founders Fund. These financial statements and financial highlights are the responsibility of the Funds’ management. Our responsibility is to express an opinion on these financial statements and financial highlights based on our audit. The accompanying statements of changes in net assets and financial highlights for the periods ended September 30, 2016 and prior, were audited by other auditors whose report dated December 2, 2016, expressed an unqualified opinion on those financial statements and financial highlights.
We conducted our audit in accordance with the standards of the Public Company Accounting Oversight Board (United States). Those standards require that we plan and perform the audit to obtain reasonable assurance about whether the financial statements and financial highlights are free of material misstatement. An audit includes examining, on a test basis, evidence supporting the amounts and disclosures in the financial statements. Our procedures included confirmation of securities owned as of September 30, 2017, by correspondence with the custodian and brokers. An audit also includes assessing the accounting principles used and significant estimates made by management, as well as evaluating the overall financial statement presentation. We believe that our audit provides a reasonable basis for our opinion.
In our opinion, the financial statements and financial highlights referred to above present fairly, in all material respects, the financial position of the Funds as of September 30, 2017, the results of their operations, the changes in their net assets, and the financial highlights for the year then ended for Clarkston Partners Fund and Clarkston Fund, and the results of their operations, the changes in their net assets, and the financial highlights for the period from February 1, 2017 (commencement of operations) to September 30, 2017, for Clarkston Select Fund and Clarkston Founders Fund, in conformity with accounting principles generally accepted in the United States of America.

COHEN & COMPANY, LTD.
Cleveland, Ohio
November 29, 2017
|
Annual Report | September 30, 2017
|
59
|
|
Clarkston Funds
|
Additional Information
|
|
September 30, 2017 (Unaudited)
|
1. PROXY VOTING POLICIES AND VOTING RECORD
A description of the policies and procedures that the Funds use to determine how to vote proxies relating to portfolio securities is available without charge, upon request, (i) by calling the Funds (toll-free) at 1-844-680-6562 or (ii) on the website of the Securities and Exchange Commission (the “SEC”) at http://www.sec.gov.
Information regarding how each Fund voted proxies relating to portfolio securities during the most recent 12-month period ended June 30 is available (i) without charge, upon request, by calling the Funds (toll-free) at 1-844-680-6562 or (ii) on the SEC’s website at http://www.sec.gov.
2. PORTFOLIO HOLDINGS
The Funds file their complete schedule of portfolio holdings with the SEC for the first and third quarters of each fiscal year on Form N-Q. The Funds’ Form N-Qs are available on the SEC website at http://www.sec.gov. The Funds’ Form N-Qs may be reviewed and copied at the SEC’s Public Reference Room in Washington, D.C., and information on the operation of the Public Reference Room may be obtained by calling 1-800-SEC-0330.
3. CHANGES IN ACCOUNTANTS
On June 5, 2017, KPMG LLP (KPMG) was dismissed as the independent registered public accounting firm of the Trust. In August 2017, the Audit Committee of the Board of Trustees of the Trust recommended the appointment of Cohen & Company, Ltd. (“Cohen”), as the Trust’s independent registered public accounting firm, replacing KPMG LLP, beginning with the Funds’ financial statements for the fiscal year ended September 30, 2017, and the Board of Trustees approved such appointment.
KPMG’s report on the financial statements of the Funds for each of the fiscal years or periods ended September 30, 2015 and September 30, 2016, did not contain an adverse opinion or a disclaimer of opinion and was not qualified or modified as to uncertainty, audit scope, or accounting principles. During the fiscal years or periods ended September 30, 2015 and September 30, 2016, there were no disagreements between the Funds and KPMG on any matter of accounting principles or practices, financial statement disclosure, or auditing scope or procedure, which disagreement(s), if not resolved to the satisfaction of KPMG, would have caused it to make reference to the subject matter of the disagreement(s) in connection with its reports. During the fiscal years or periods ended September 30, 2015 and September 30, 2016, there were no reportable events as defined in Item 304(a)(1)(v) of Regulation S-K promulgated by the Securities and Exchange Commission.
4. TAX DESIGNATIONS
Qualified Dividend Income
The percentage of ordinary income dividends distributed during the calendar year ended December 31, 2016 are designated as qualified dividend income (QDI) as defined in Section 1(h)(11) of the Internal Revenue Code in the following percentages:
|
60
|
www.clarkstonfunds.com
|
|
Clarkston Funds
|
Additional Information
|
|
September 30, 2017 (Unaudited)
|
|
Amount
|
|
|
Clarkston Partners Fund
|
96.22%
|
|
Clarkston Fund
|
89.45%
|
Dividends Received Deduction
For corporate shareholders, the following ordinary dividends paid during the calendar year ended December 31, 2016 qualify for the corporate dividends received deduction:
|
Amount
|
|
|
Clarkston Partners Fund
|
95.83%
|
|
Clarkston Fund
|
89.45%
|
Pursuant to Section 852(b)(3) of the Internal Revenue Code, the Clarkston Partners Fund, designated $92,112 as long-term capital gain dividends.
5. DISCLOSURE REGARDING RENEWAL AND APPROVAL OF FUND ADVISORY AGREEMENT
On August 24, 2017, the Board of Trustees (the “Board”) of ALPS Series Trust (the “Trust”) met in person to discuss, among other things, the renewal and approval of the Investment Advisory Agreement between the Trust and Clarkston Capital Partners, LLC (“Clarkston Capital”) in accordance with Section 15(c) of the 1940 Act. The Independent Trustees met with independent legal counsel during executive session and discussed the Investment Advisory Agreement and other related materials.
In approving the Investment Advisory Agreement with the Clarkston Funds, the Trustees, including all the Independent Trustees, considered the following factors with respect to the Clarkston Funds:
Investment Advisory Fee Rate: The Trustees reviewed and considered the contractual annual advisory fee paid by the Trust on behalf of each Clarkston Fund to Clarkston Capital, considering the nature, extent and quality of the advisory services to be provided by Clarkston Capital to the Clarkston Funds.
The Trustees considered the information they received comparing each Clarkston Fund’s contractual annual advisory fees and overall expenses with those of funds in the expense group and universe of funds provided by an independent provider of investment company data, (the “Independent Data Provider”) which screened retail and institutional mutual funds and excluded all others.
Each Independent Data Provider peer group consisted of the applicable Clarkston Fund and several other funds identified by FUSE using similar strategies with comparable fee structures. The Trustees also noted that Clarkston Capital had institutional accounts and clients using model delivery services for some or all fund strategies.
With respect to the Clarkston Founders Fund, the Trustees noted that the fund’s contractual advisory fee of 0.75% was equal to the peer group median, and that the fund’s total net expenses (after fee waiver and expense reimbursement) of 0.95% for the Institutional Class was substantially below the peer group average of 1.10%.
|
Annual Report | September 30, 2017
|
61
|
|
Clarkston Funds
|
Additional Information
|
|
September 30, 2017 (Unaudited)
|
With respect to the Clarkston Fund, the Trustees noted that the fund’s contractual advisory fee of 0.50% was the lowest in the peer group, and that the fund’s total net expenses (after fee waiver and expense reimbursement) of 0.70% for the Institutional Class was substantially below the peer group average of 0.90%.
With respect to the Clarkston Partners Fund, the Trustees noted that the fund’s contractual advisory fee of 0.75% was equal to the peer group median for the Founders Class and the Institutional Class, and that the fund’s total net expenses (after fee waiver and expense reimbursement) of 0.85% for the Founders Class and 1.00% for the Institutional Class were substantially below, or slightly above, the peer group average of 0.95% and 0.99%, respectively.
With respect to the Clarkston Fund, the Trustees noted that the fund’s contractual advisory fee of 0.50% was the lowest in the peer group, and that the fund’s total net expenses (after fee waiver and expense reimbursement) of 0.70% for the Institutional Class was also the lowest in the peer group.
After further consideration, the Trustees determined that the contractual annual advisory fees and total net expenses for each Fund, considering the contractual fee waivers, were fair to the fund’s shareholders.
Comparable Accounts: The Trustees also noted that Clarkston Capital had institutional and strategic accounts, and model delivery service clients, using investment strategies similar to the strategies of the Clarkston Funds, and reviewed the fee structures for, and services rendered to, such clients.
Nature, Extent and Quality of the Services under the Investment Advisory Agreement: The Trustees received and considered information regarding the nature, extent and quality of services provided to the Clarkston Funds under the Investment Advisory Agreement with Clarkston Capital. The Trustees reviewed certain background materials supplied by Clarkston Capital in its presentation, including its Form ADV.
The Trustees reviewed and considered Clarkston Capital’s investment advisory personnel, its history as an asset manager and its performance. The Trustees also reviewed the research and decision-making processes utilized by Clarkston Capital, including the methods adopted to seek to achieve compliance with the investment objectives, policies and restrictions of the Clarkston Funds.
The Trustees considered the background and experience of Clarkston Capital’s management relating to the Clarkston Funds, including reviewing the qualifications, background and responsibilities of the portfolio manager primarily responsible for the day-to-day portfolio management of the Clarkston Funds and the extent of the resources devoted to research and analysis of actual and potential investments. They considered the Trust’s experience with Clarkston Capital, including the Clarkston Capital’s responsiveness and compliance record. The Trustees also reviewed, among other things, Clarkston Capital’s Code of Ethics. The Trustees also considered Clarkston Capital’s reputation generally and its investment techniques, strategies, risk management controls and decision-making processes.
Performance: The Trustees reviewed and considered each Clarkston Fund’s performance, noting that the performance of the Clarkston Founders Fund since inception (January 2017) was slightly below median relative to the Fund’s universe; the Clarkston Fund since inception (April 2016) was in the fourth quartile of the Fund’s universe; the Clarkston Partners Fund since inception (September 2015) was slightly below median relative to the Fund’s universe for the Founders Class and the Institutional Class; and the Clarkston Select Fund since inception (January 2017) was slightly above median relative to the Fund’s universe. The Trustees also discussed the relatively short performance period for all the Clarkston Funds, especially the Clarkston Founders Fund and the Clarkston Select Fund. They discussed the significant cash allocation in each Fund’s portfolio and the impact on performance. They considered Clarkston Capital’s emphasis on strong dividend paying companies, and the adviser’s confidence that the valuations will be realized over the long term.
|
62
|
www.clarkstonfunds.com
|
|
Clarkston Funds
|
Additional Information
|
|
September 30, 2017 (Unaudited)
|
The Adviser’s Profitability: The Trustees received and considered a historical and estimated profitability analysis prepared by Clarkston Capital based on the fees to be paid under the Investment Advisory Agreement. The Trustees considered the profits, if any, realized and anticipated to be realized by Clarkston Capital relating to the operation of each Clarkston Fund. The Trustees then reviewed and discussed Clarkston Capital’s income statement to consider the financial condition, stability and profitability of Clarkston Capital. They observed that some distribution costs were included in the profit analysis, and concluded that any profits would remain reasonable even if those distribution expenses were excluded from the adviser’s expenses.
Economies of Scale: The Trustees considered whether economies of scale in the provision of services to each Clarkston Fund would be passed along to the shareholders under the Investment Advisory Agreement.
Other Benefits to the Adviser: The Trustees reviewed and considered any other incidental benefits derived or to be derived by Clarkston Capital from its relationship with each Clarkston Fund, including research and other support services.
The Board summarized its deliberations with respect to the Investment Advisory Agreement with Clarkston Capital. In evaluating Clarkston Capital and the fees charged under the Investment Advisory Agreement, the Trustees concluded that no single factor reviewed by the Trustees was identified by the Trustees to be determinative as the principal factor in whether to approve the Investment Advisory Agreement. Further, the Independent Trustees were advised by independent legal counsel throughout the process. The Trustees, including all the Independent Trustees, concluded that:
| ● |
each Clarkston Fund’s contractual advisory fee was at or below the peer group median, and in two cases the lowest in the peer group and was not unreasonable;
|
| ● |
each Clarkston Fund’s total net expenses (after fee waiver and expense reimbursement) for each class of such Fund were substantially below the peer group median (and in one case the lowest in the peer group), with exception of one class which was approximately at the peer group median, and in all cases, fair to the Clarkston Fund’s shareholders;
|
| ● |
bearing in mind the limitations of comparing different types of accounts and the different levels of service typically associated with such accounts, the fee structures applicable to Clarkston Capital’s other clients employing a comparable strategy to any Clarkston Fund were not indicative of any unreasonableness with respect to the advisory payable by such Clarkston Fund;
|
| ● |
the terms of the fee waiver/expense reimbursement letter agreement between the Trust, (on behalf of each Clarkston Fund) and Clarkston Capital, were reasonable;
|
|
Annual Report | September 30, 2017
|
63
|
|
Clarkston Funds
|
Additional Information
|
|
September 30, 2017 (Unaudited)
|
| ● |
the nature, extent and quality of services rendered by Clarkston Capital under the Investment Advisory Agreement were adequate;
|
| ● |
bearing in mind the relatively short performance history of the Clarkston Funds (especially the Clarkston Founders Fund and the Clarkston Select Fund), the performance of each Clarkston Fund, was acceptable;
|
| ● |
the estimated profitability of Clarkston Capital relating to the management of each Clarkston Fund was not unreasonable; and
|
| ● |
there were no material economies of scale or other material incidental benefits accruing to Clarkston Capital because of its relationship with each Clarkston Fund.
|
Based on the Trustees’ deliberations and their evaluation of the information described above, the Trustees, including all the Independent Trustees, concluded that Clarkston Capital’s compensation for investment advisory services is consistent with the best interests of each Clarkston Fund and its shareholders.
|
64
|
www.clarkstonfunds.com
|
|
Clarkston Funds
|
Trustees and Officers
|
September 30, 2017 (Unaudited)
INDEPENDENT TRUSTEES
|
Name,
Birth Year & Address* |
Position(s)Held with Fund
|
Term of
Office and Length of Time Served** |
Principal Occupation(s)
During Past 5 Years*** |
Number of
Funds in Fund Complex Overseen by Trustee**** |
Other
Directorships Held by Trustee During Past 5 Years*** |
|
Ward D. Armstrong
Birth year: 1954
|
Trustee and Chairman
|
Mr. Armstrong was appointed to the Board on May 27, 2016. Mr. Armstrong was appointed Chairman of the Board at the August 24, 2017 meeting of the Board of Trustees.
|
Retired; Managing Partner, NorthRock Partners, LLC (October 2013 to July 2015); Managing Director, NorthRock Partners, a Private Wealth Advisory Practice of Ameriprise Financial (February 2010 to October 2013); Senior Vice President, Ameriprise Financial, Inc. (November 1984 to May 2007); President, American Express Asset Management (2002 to 2004); and Chairman, Ameriprise Trust Company (November 1996 to May 2007).
|
9
|
Mr. Armstrong is a Director of the Heartland Group, Inc. (5 Funds).
|
|
*
|
All communications to Trustees and Officers may be directed to ALPS Series Trust c/o 1290 Broadway, Suite 1100, Denver, CO 80203.
|
|
**
|
This is the period for which the Trustee or Officer began serving the Trust. Each Trustee serves an indefinite term, until such Trustee’s successor is elected and appointed, or such Trustee resigns or is deceased. Officers are elected on an annual basis.
|
|
***
|
Except as otherwise indicated, each individual has held the office shown or other offices in the same company for the last five years.
|
|
****
|
The Fund Complex currently consists of 9 series of the Trust and any other investment companies for which Clarkston Capital Partners, LLC provides investment advisory services, currently none.
|
|
Annual Report | September 30, 2017
|
65
|
|
Clarkston Funds
|
Trustees and Officers
|
September 30, 2017 (Unaudited)
|
Name,
Birth Year & Address* |
Position(s)Held with Fund
|
Term of
Office and Length of Time Served** |
Principal Occupation(s)
During Past 5 Years*** |
Number of
Funds in Fund Complex Overseen by Trustee**** |
Other
Directorships Held by Trustee During Past 5 Years*** |
|
J. Wayne Hutchens
Birth year: 1944
|
Trustee
|
Mr. Hutchens was elected to the Board on October 30, 2012.
|
Mr. Hutchens is currently retired. From April 2006 to December 2012, he served as President and CEO of the University of Colorado (CU) Foundation and from April 2009 to December 2012, he was Executive Director of the CU Real Estate Foundation. Mr. Hutchens is also Trustee of the Denver Museum of Nature and Science (2000 to present), Director of AMG National Trust Bank (June 2012 to present) and Trustee of Children’s Hospital Colorado (May 2012 to present). Prior to these positions, Mr. Hutchens spent 29 years in the banking industry, retiring as Chairman of Chase Bank Colorado.
|
9
|
RiverNorth Opportunity fund (2013 to present).
|
|
Patrick Seese
Birth year: 1971
|
Trustee
|
Mr. Seese was elected to the Board on October 30, 2012.
|
Mr. Seese is an owner and a Managing Director of Integris Partners, a middle- market investment banking firm serving closely-held companies, financial sponsors and public companies (February 2008 to present). Prior to this, Mr. Seese was a Managing Director of Headwaters MB, a middle-market investing banking firm (December 2003 to February 2008). Prior to that, Mr. Seese worked in Credit Suisse First Boston’s Mergers and Acquisitions Group and served as Head of Corporation Development, Katy Industries, a publicly traded industrial and consumer products company and at Deloitte & Touche LLP, where he began his career in 1994.
|
9
|
None.
|
|
*
|
All communications to Trustees and Officers may be directed to ALPS Series Trust c/o 1290 Broadway, Suite 1100, Denver, CO 80203.
|
|
**
|
This is the period for which the Trustee or Officer began serving the Trust. Each Trustee serves an indefinite term, until such Trustee’s successor is elected and appointed, or such Trustee resigns or is deceased. Officers are elected on an annual basis.
|
|
***
|
Except as otherwise indicated, each individual has held the office shown or other offices in the same company for the last five years.
|
|
****
|
The Fund Complex currently consists of 9 series of the Trust and any other investment companies for which Clarkston Capital Partners, LLC provides investment advisory services, currently none.
|
|
66
|
www.clarkstonfunds.com
|
|
Clarkston Funds
|
Trustees and Officers
|
September 30, 2017 (Unaudited)
INTERESTED TRUSTEE
|
Name,
Birth Year & Address* |
Position(s) Held with Fund
|
Term of
Office and Length of Time Served** |
Principal Occupation(s)
During Past 5 Years*** |
Number of
Funds in Fund Complex Overseen by Trustee**** |
Other
Directorships Held by Trustee During Past 5 Years*** |
|
Jeremy O. May
Birth year: 1970
|
Trustee and President
|
Mr. May was elected Trustee and President on October 30, 2012. Mr. May was Chairman from October 30, 2012 to August 24, 2017.
|
Mr. May joined ALPS in 1995 and is currently President and Director of ALPS Fund Services, Inc. and ALPS Distributors, Inc., Executive Vice President and Director of ALPS Holdings, Inc. and ALPS Advisors, Inc. and Director of ALPS Portfolio Solutions Distributor, Inc. Because of his positions with these entities, Mr. May is deemed an affiliate of the Trust as defined under the 1940 Act. Mr. May is also Trustee of the Reaves Utility Income Fund and the ALPS Elevation Trust. Mr. May is also on the Board of Directors of the University of Colorado Foundation and the AV Hunter Trust.
|
9
|
Mr. May is Chairman and Trustee of the Reaves Utility Income Fund (1 fund) and ALPS Elevation Trust (2 ETFs).
|
|
*
|
All communications to Trustees and Officers may be directed to ALPS Series Trust c/o 1290 Broadway, Suite 1100, Denver, CO 80203.
|
|
**
|
This is the period for which the Trustee or Officer began serving the Trust. Each Trustee serves an indefinite term, until such Trustee’s successor is elected and appointed, or such Trustee resigns or is deceased. Officers are elected on an annual basis.
|
|
***
|
Except as otherwise indicated, each individual has held the office shown or other offices in the same company for the last five years.
|
|
****
|
The Fund Complex currently consists of 9 series of the Trust and any other investment companies for which Clarkston Capital Partners, LLC provides investment advisory services, currently none.
|
|
Annual Report | September 30, 2017
|
67
|
|
Clarkston Funds
|
Trustees and Officers
|
September 30, 2017 (Unaudited)
OFFICERS
|
Name,
Birth Year & Address* |
Position(s)
Held with Fund |
Term of
Office and Length of Time Served** |
Principal Occupation(s) During Past 5 Years***
|
|
Kimberly R. Storms
Birth year: 1972
|
Treasurer
|
Ms. Storms was elected Treasurer of the Trust on October 30, 2012.
|
Ms. Storms is Senior Vice President and Director of Fund Administration of ALPS. Because of her position with ALPS, Ms. Storms is deemed an affiliate of the Trust as defined under the 1940 Act. Ms. Storms is also Treasurer of Financial Investors Trust, Liberty All-Star Equity Fund and Liberty All- Star Growth Fund, Inc.
|
|
Richard C. Noyes
Birth year: 1970
|
Secretary
|
Mr. Noyes was elected Secretary of the Trust on November 14, 2016
|
Mr. Noyes joined ALPS in 2015 and is Senior Vice President and Director of Legal Administration of ALPS. Prior to joining ALPS, Mr. Noyes served as Assistant Vice President and Senior Counsel of Janus Capital Management LLC. Mr. Noyes is deemed an affiliate of the Trust as defined under the 1940 Act. Mr. Noyes is also Secretary of Westcore Trust.
|
|
Jennifer A. Craig
Birth year: 1973
|
Assistant Secretary
|
Ms. Craig was elected Assistant Secretary of the Trust on May 27, 2016.
|
Ms. Craig joined ALPS in 2007 and is currently Assistant Vice President and Paralegal Manager. Prior to joining ALPS, Ms. Craig was Legal Manager at Janus Capital Management LLC and served as Assistant Secretary of Janus Investment Fund, Janus Adviser Series and Janus Aspen Series. Because of her position with ALPS, Ms. Craig is deemed an affiliate of the Trust as defined under the 1940 Act. Ms. Craig is also Assistant Secretary of Clough Funds Trust, Clough Global Opportunities Fund, Clough Global Allocation Fund, Clough Global Equity Fund and Financial Investors Trust.
|
|
Alan Gattis
Birth year: 1980
|
Assistant Treasurer
|
Mr. Gattis was elected Assistant Treasurer of the Trust on August 9, 2016.
|
Mr. Gattis joined ALPS in 2011 and is currently Vice President and Fund Controller of ALPS. Prior to joining ALPS, Mr. Gattis was an Auditor at Spicer Jeffries LLP (2009 through 2011) and an Auditor at PricewaterhouseCoopers LLP (2004 - 2009). Because of his position with ALPS, Mr. Gattis is deemed an affiliate of the Trust as defined under the 1940 Act. Mr. Gattis is also Assistant Treasurer of Clough Funds Trust, Clough Global Opportunities Fund, Clough Global Allocation Fund, Clough Global Equity Fund, Griffin Institutional Access Real Estate Fund, Stadion Funds and Centaur Mutual Funds Trust.
|
|
*
|
All communications to Trustees and Officers may be directed to ALPS Series Trust c/o 1290 Broadway, Suite 1100, Denver, CO 80203.
|
|
**
|
This is the period for which the Trustee or Officer began serving the Trust. Each Trustee serves an indefinite term, until such Trustee’s successor is elected and appointed, or such Trustee resigns or is deceased. Officers are elected on an annual basis.
|
|
***
|
Except as otherwise indicated, each individual has held the office shown or other offices in the same company for the last five years.
|
|
68
|
www.clarkstonfunds.com
|
|
Clarkston Funds
|
Trustees and Officers
|
September 30, 2017 (Unaudited)
|
Name,
Birth Year & Address* |
Position(s)
Held with Fund |
Term of
Office and Length of Time Served** |
Principal Occupation(s) During Past 5 Years***
|
|
Cory J. Gossard
Birth year: 1972
|
Chief Compliance Officer (“CCO”)
|
Mr. Gossard was elected CCO of the Trust on October 20, 2017.
|
Mr. Gossard oversees all day-to-day compliance aspects of ALPS’ business within Fund CCO Services, Compliance Administration, Risk Management and Assurance Services. Mr. Gossard is deemed an affiliate of the Trust as defined under the 1940 Act. Mr. Gossard also serves as Fund CCO for the SPDR S&P 500 ETF Trust, SPDR DJIA ETF Trust, and SPDR S&P MidCap 400 ETF Trust. Prior to joining ALPS in 2014, Mr. Gossard held a series of progressively responsible roles throughout an 18-year career with Citibank.
|
|
*
|
All communications to Trustees and Officers may be directed to ALPS Series Trust c/o 1290 Broadway, Suite 1100, Denver, CO 80203.
|
|
**
|
This is the period for which the Trustee or Officer began serving the Trust. Each Trustee serves an indefinite term, until such Trustee’s successor is elected and appointed, or such Trustee resigns or is deceased. Officers are elected on an annual basis.
|
|
***
|
Except as otherwise indicated, each individual has held the office shown or other offices in the same company for the last five years.
|
Additional information about members of the Board of Trustees and officers of the Trust is available in the Statement of Additional Information and is available, without charge, upon request, by calling the Fund (toll-free) at 1-855-254-6467.
|
Annual Report | September 30, 2017
|
69
|

This material must be preceded or accompanied by a prospectus.
The Clarkston Funds are distributed by ALPS Distributors, Inc.
Table of Contents
|
Shareholder Letter
|
1
|
|
Portfolio Update
|
5
|
|
Disclosure of Fund Expenses
|
8
|
|
Portfolio of Investments
|
9
|
|
Statement of Assets and Liabilities
|
17
|
|
Statement of Operations
|
18
|
|
Statements of Changes in Net Assets
|
19
|
|
Statement of Cash Flows
|
20
|
|
Financial Highlights
|
21
|
|
Notes to Financial Statements
|
27
|
|
Report of Independent Registered Public Accounting Firm
|
37
|
|
Additional Information
|
38
|
|
Trustees and Officers
|
40
|
1-855-254-6467 | www.cogniosfunds.com
Cognios Market Neutral Large Cap Fund
|
Shareholder Letter
|
September 30, 2017 (Unaudited)
|
Dear Shareholder,
Thank you for investing in the Cognios Market Neutral Large Cap Fund (the “Fund”) and for taking the time to review our Annual Report for the year ended September 30, 2017. We value this opportunity to offer insight into the Fund’s investment strategy and to offer commentary on the Fund’s performance and overall market conditions.
The Cognios Market Neutral Large Cap Fund employs a Beta‐adjusted market neutral investment strategy that seeks to provide investors with returns that are non‐correlated to, or independent of, the returns of the global equity and fixed income markets. By attempting to hedge out all of the market Beta, the Fund’s returns over time should be essentially “pure Alpha” (i.e., Alpha is the excess return of a portfolio after considering its Beta exposure). Additionally, by hedging out the general market movements in this Beta‐adjusted market neutral fashion, we believe that the total returns of the Fund will be independent of those broad “systemic” risk factors and macro events that move the entire stock market either positively or negatively over time.
In our last letter provided in the Semi‐Annual Report for March 31, 2017, we noted that, in our view, valuation multiples for the S&P 500 Index were elevated. In the six months since that filing, our view has not changed. Earnings growth for the constituent companies of the S&P 500 Index has been more robust of late; however, the index has advanced higher at a rate greater than the earnings growth and valuation multiples are increasingly stretched as a result. There are other signs that risk is not being appreciated in the current market environment. The credit spread between the Merrill Lynch High Yield Constrained Bond Index and ten‐year U.S. Treasuries is near a multi‐year low as are various other credit spreads. The VIX, or volatility index, which is a measure of the market expectation of near term volatility based on S&P 500 index options, is under 10 and also near a multi‐year low. Generally, VIX values below 20 correspond to less stressful, even complacent, times in the market. Thus, a measure under 10 indicates extreme complacency which could prove dangerous, especially as the Federal Reserve moves to increase the Federal Funds rate, which some use as a benchmark for the risk‐free rate. As the risk‐free rate moves higher, the likelihood increases that risk will be re‐priced and cause markets to fall as a result.
Below you will find performance updates for the Fund.
During the twelve months ended September 30, 2017, the total return for the Institutional Class Shares (COGIX) was ‐4.31% and the total return for the Investor Class Shares (COGMX) was ‐4.65%. Over the same period, the HFRX Equity Market Neutral Index gained 1.52%, while the S&P 500 Index gained 18.61% on a total return basis. We are obviously disappointed by the decline of the shares over the past year and we have spent a great deal of time analyzing the causes of the decline. We select stocks, both long and short, based on ROTA/ROME®, our proprietary investment selection and portfolio construction process. With this process, the Fund’s long positions are companies that generate high Returns on Tangible Assets (“ROTA”) and trade at attractive prices relative to the overall market, while the Fund’s short positions are companies that generate low ROTA and trade at unattractive prices relative to the overall market. Our investment thesis is built on basic fundamental economics: companies that generate the most profits and cash flow from assets employed in the business are worth more than companies with lower profits and less cash flow over time. This seems intuitive and the strength of this concept is demonstrated when we analyze historical stock market returns. If we look at the constituents of the S&P 500 Index over the last fifteen years (2002‐2016) and rank the constituent companies based on ROTA each year, the two hundred fifty companies with the highest ROTA generate more Alpha than the two hundred fifty companies with the lowest ROTA in thirteen out of those fifteen years. Unfortunately, 2016 was one of the two outlier years, primarily the second half of the year, when high ROTA companies in the S&P 500 underperformed low ROTA companies. Given our investment thesis and our conviction in the investment process employed by the Fund, the market’s preference for low ROTA companies and general indifference to fair valuations were the most significant driving factors in the decline in the Fund’s shares over the last fiscal year. Thus far in 2017, the Alpha spread of high ROTA companies over low ROTA companies is positive, but the spread has been very narrow.
|
Annual Report | September 30, 2017
|
1
|
Cognios Market Neutral Large Cap Fund
|
Shareholder Letter
|
September 30, 2017 (Unaudited)
|
Over the course of twelve months ended September 30, 2017, the Fund held 147 long positions and 300 short positions. One hundred of the 147 long positions were profitable and 87 of the 300 short positions were profitable for the year. Long positions generated total profits of $15,369,322, while short positions generated total losses of $19,393,124 during the period. The long positions generated a 13.4% gain on average equity capital while the short positions generated losses of 17.0% on average equity capital. The table below displays the top five most profitable long and short positions for the twelve months ended September 30, 2017.
|
Longs
|
Shorts
|
||||||||||
|
Ticker
|
Company
|
Profits
|
Ticker
|
Company
|
Profits
|
||||||
|
MCD
|
McDonald’s Corp.
|
$
|
1,840,420
|
SWN
|
Southwestern Energy Co.
|
$
|
297,804
|
||||
|
RTN
|
Raytheon Company
|
$
|
1,677,099
|
REGN
|
Regeneron Pharmaceuticals
|
$
|
260,235
|
||||
|
GOOGL
|
Alphabet Inc.
|
$
|
1,331,105
|
AYI
|
Acuity Brands Inc.
|
$
|
254,840
|
||||
|
FISV
|
Fiserv Inc.
|
$
|
1,254,224
|
ALXN
|
Alexion Pharmaceuticals Inc.
|
$
|
252,507
|
||||
|
MMM
|
3M Company
|
$
|
1,106,902
|
AMD
|
Advanced Micro Devices Inc.
|
$
|
245,399
|
||||
The performance data is obviously important; but since the portfolio is hedged and designed to be market neutral, the independence of the performance versus the S&P 500 Index is also very important. Beta, Alpha, Correlation and R Squared are statistics that are commonly used to measure this independence. We track these measures on a monthly basis (57 data points) and the data, since inception, is presented in the tables below:
|
Beta to the S&P 500 Index
|
Annualized Alpha to the S&P 500 Index
|
|
|
COGIX
|
0.12
|
1.56%
|
|
COGMX
|
0.13
|
1.29%
|
|
Correlation of Returns to the S&P 500 Index
|
R Squared of Returns to the S&P 500 Index
|
|
|
COGIX
|
0.161
|
2.6%
|
|
COGMX
|
0.163
|
2.7%
|
As the tables above indicate, Beta, Correlation and R Squared are all low, meaning that the performance of the Fund is statistically independent of the performance of the S&P 500 Index.
|
2
|
www.cogniosfunds.com
|
Cognios Market Neutral Large Cap Fund
|
Shareholder Letter
|
September 30, 2017 (Unaudited)
|
Meanwhile, the Alpha of the Fund remains positive, even with the recent difficult performance of the Fund. We hope that this statistic continues to move higher in the future with improved performance and expect the Fund to continue generating returns independent of the S&P 500 Index.
We at Cognios look forward to future opportunities to connect with our shareholders. We strive to continuously add value to your investment experience by providing access to fund information, portfolio updates and straightforward commentary.
If you have any questions regarding the Cognios Market Neutral Large Cap Fund, please contact your account manager or financial adviser, or call one of our shareholder associates at 855‐254‐6467.
We thank you for investing with Cognios and for the trust you have placed in us.
Sincerely,
 |
 |
 |
|
Jonathan Angrist
|
Brian Machtley
|
Francisco Bido
|
Portfolio Managers
Cognios Capital, LLC
Defined Terms and Disclosures
Alpha is the excess return of a portfolio after considering its Beta exposure.
Beta is a measure of the volatility, or systematic risk, of a security or a portfolio in comparison to the market as a whole.
|
Annual Report | September 30, 2017
|
3
|
Cognios Market Neutral Large Cap Fund
|
Shareholder Letter
|
September 30, 2017 (Unaudited)
|
Correlation is a statistical measure of how two securities move in relation to each other.
Merrill Lynch High Yield Constrained Bond Index – Index that measures the performance of U.S. high yield bonds.
R Squared is the coefficient of determination and indicates how well data points fit in a model. In the example in the above table, 2.6% of the monthly movement in share price of COGIX can be explained by the movement of the S&P 500 Index.
Standard & Poor's 500 Index (S&P 500) is an index of 500 stocks seen as a leading indicator of U.S. equities and a reflection of the performance of the large cap universe, made up of companies selected by economists.
VIX - VIX is the ticker symbol for the Chicago Board Options Exchange (CBOE) Volatility Index, which shows the market's expectation of 30-day volatility. It is constructed using the implied volatilities of a wide range of S&P 500 index options.
Cognios' ROTA/ROME® investment philosophy drives the quantitative investment selection and portfolio construction process that is and will continue to be used to select long and short positions for the Fund. ROTA/ROME® favors companies with high returns on tangible assets (“ROTA”) and high earnings yields on current stock prices (“ROME”, or return on market equity).
The views and information discussed in this commentary are as of the date of publication, are subject to change, and may not reflect the writer’s current views. The views expressed are those of the Fund’s adviser only, and represent an assessment of market conditions at a specific point in time, are opinions only and should not be relied upon as investment advice regarding a particular investment or markets in general. Such information does not constitute a recommendation to buy or sell specific securities or investment vehicles. It should not be assumed that any investment will be profitable or will equal the performance of the fund(s) or any securities or any sectors mentioned in this letter. The subject matter contained in this letter has been derived from several sources believed to be reliable and accurate at the time of compilation. Neither the Fund nor the Adviser accepts any liability for losses either direct or consequential caused by the use of this information.
Not FDIC Insured – No Bank Guarantee – May Lose Value
Past performance does not guarantee future results.
ALPS Distributors, Inc. is not affiliated with Cognios Capital, LLC.
|
4
|
www.cogniosfunds.com
|
Cognios Market Neutral Large Cap Fund
|
Portfolio Update
|
September 30, 2017 (Unaudited)
|
Average Annual Total Returns (as of September 30, 2017)
|
3 Month
|
6 Month
|
1 Year
|
3 Year
|
Since Inception*
|
|
|
Cognios Market Neutral Large Cap Fund – Investor Class
|
0.43%
|
‐1.87%
|
‐4.31%
|
1.15%
|
3.13%
|
|
Cognios Market Neutral Large Cap Fund – Institutional Class
|
0.32%
|
‐2.00%
|
‐4.65%
|
0.91%
|
2.87%
|
|
S&P 500® Total Return Index(a)
|
4.48%
|
7.71%
|
18.61%
|
10.81%
|
15.12%
|
|
HFRX Equity Market Neutral Index(b)
|
2.07%
|
1.25%
|
1.52%
|
1.28%
|
1.72%
|
The performance data quoted above represents past performance. Past performance is not a guarantee of future results. Investment return and value of the Fund shares will fluctuate so that an investor’s shares, when sold or redeemed, may be worth more or less than their original cost. Performance may be lower or higher than performance data quoted. Fund performance current to the most recent month-end is available by calling 855.254.6467 or by visiting www.cogniosfunds.com.
| * |
Fund’s inception date is December 31, 2012.
|
| (a) |
The S&P 500® Total Return Index is an unmanaged index of 500 common stocks chosen for the market size, liquidity and industry group representation. It is a market-value weighted index.
|
| (b) |
The HFRX Equity Market Neutral Index is a common benchmark for long/ short market neutral hedge funds (funds traditionally only available to high net-worth accredited and institutional investors that are also “qualified clients” as defined by the SEC).
|
Returns of less than 1 year are cumulative.
Indices are not actively managed and do not reflect deduction for fees, expenses or taxes. An investor cannot invest directly into an index.
The returns shown above do not reflect the deduction of taxes a shareholder would pay on Fund distributions or redemption of Fund shares. The total annual operating expenses and total annual operating expenses after fee waivers and/or reimbursement you may pay as an investor in the Fund's Investor Class and Institutional Class shares (as reported in the January 28, 2017 Prospectus) are 4.08% and 3.84% and 3.81% and 3.56% respectively. Total Annual Fund Operating Expenses excluding Brokerage Costs, Interest, Taxes, Dividends, Litigation Expenses, Indemnification Amounts, Borrowing Costs, Brokerage Expenses and Dividend Expenses on Securities Sold Short and Extraordinary Expenses are: Investor Class 2.23% Institutional Class 1.99%, while Total Annual Operating Expenses After Fee Waiver/Expense Reimbursement excluding Brokerage Costs, Interest, Taxes, Dividends, Litigation Expenses, Indemnification Amounts, Borrowing Costs, Brokerage Expenses and Dividend Expenses on Securities Sold Short and Extraordinary Expenses are: Investor Class 1.96% Institutional Class 1.71%. The Fund’s investment adviser has contractually agreed to limit expenses through January 31, 2018.
|
Annual Report | September 30, 2017
|
5
|
Cognios Market Neutral Large Cap Fund
|
Portfolio Update
|
September 30, 2017 (Unaudited)
|
Performance of $10,000 Initial Investment (as of September 30, 2017)
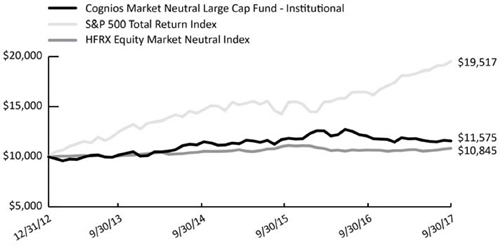
The graph shown above represents historical performance of a hypothetical investment of $10,000 in the Fund since inception. Past performance does not guarantee future results. All returns reflect reinvested dividends, but do not reflect the deduction of taxes that a shareholder would pay on Fund distributions or the redemption of Fund shares.
Sector Allocation (as a % of Net Assets)*
|
Basic Materials (Short)
|
‐1.17%
|
|
Communications ‐ Long
|
3.37%
|
|
Communications (Short)
|
‐4.08%
|
|
Consumer Cyclical ‐ Long
|
29.07%
|
|
Consumer Cyclical (Short)
|
‐5.25%
|
|
Consumer Non‐cyclical ‐ Long
|
51.07%
|
|
Consumer Non‐cyclical (Short)
|
‐21.15%
|
|
Energy (Short)
|
‐11.66%
|
|
Financials ‐ Long
|
6.65%
|
|
Financials (Short)
|
‐24.68%
|
|
Industrials ‐ Long
|
18.67%
|
|
Industrials (Short)
|
‐7.82%
|
|
Money Market Fund ‐ Long
|
0.26%
|
|
Technology ‐ Long
|
3.34%
|
|
Technology (Short)
|
‐2.89%
|
|
Utilities ‐ Long
|
12.52%
|
|
Utilities (Short)
|
‐10.27%
|
|
Cash, Cash Equivalents, & Other Net Assets
|
64.02%
|
|
TOTAL
|
100.00%
|
| * |
Holdings are subject to change, and may not reflect the current or future position of the portfolio. Table presents indicative values only.
|
|
6
|
www.cogniosfunds.com
|
Cognios Market Neutral Large Cap Fund
|
Portfolio Update
|
September 30, 2017 (Unaudited)
|
Top 10 Long Positions (as a % of Net Assets)*
|
Security
|
Ticker
|
Weight^
|
|
Michael Kors Holdings, Ltd.
|
KORS
|
1.84%
|
|
AutoZone, Inc.
|
AZO
|
1.84%
|
|
Centene Corp.
|
CNC
|
1.84%
|
|
L Brands, Inc.
|
LB
|
1.83%
|
|
Tyson Foods, Inc.
|
TSN
|
1.82%
|
|
O'Reilly Automotive, Inc.
|
ORLY
|
1.81%
|
|
WW Grainger, Inc.
|
GWW
|
1.81%
|
|
Dollar Tree, Inc.
|
DLTR
|
1.80%
|
|
CH Robinson Worldwide, Inc.
|
CHRW
|
1.78%
|
|
McCormick & Co., Inc.
|
MKC
|
1.78%
|
| * |
Holdings are subject to change, and may not reflect the current or future position of the portfolio. Table presents indicative values only.
|
| ^ |
Position Rank based on percentage of net assets
|
|
Annual Report | September 30, 2017
|
7
|
Cognios Market Neutral Large Cap Fund
|
Disclosure of Fund Expenses
|
September 30, 2017 (Unaudited)
|
Examples. As a shareholder of the Cognios Market Neutral Large Cap Fund (the “Fund”), you incur two types of costs: (1) transaction costs, (2) ongoing costs, including management fees, distribution and service (12b‐1) fees and other Fund expenses. The following examples are intended to help you understand your ongoing costs (in dollars) of investing in the Fund and to compare these costs with the ongoing costs of investing in other mutual funds. The examples are based on an investment of $1,000 invested on April 1, 2017, and held through September 30, 2017.
Actual Expenses. The first line under each class in the table below provides information about actual account values and actual expenses. You may use the information in this line, together with the amount you invested, to estimate the expenses that you paid over the period. Simply divide your account value by $1,000 (for example, an $8,600 account value divided by $1,000 = 8.6), then multiply the result by the number in the first line under the heading “Expenses Paid During Period April 1, 2017 – September 30, 2017” to estimate the expenses you paid on your account during this period.
Hypothetical Example for Comparison Purposes. The second line under each class in the table below provides information about hypothetical account values and hypothetical expenses based on the Fund’s actual expense ratio and an assumed rate of return of 5% per year before expenses, which is not the Fund’s actual return. The hypothetical account values and expenses may not be used to estimate the actual ending account balance or expenses you paid for the period. You may use this information to compare the ongoing costs of investing in the Fund and other mutual funds. To do so, compare this 5% hypothetical example with the 5% hypothetical examples that appear in the shareholder reports of the other funds.
Please note that the expenses shown in the table are meant to highlight your ongoing Fund costs only and do not reflect any transactional costs, such as redemption fees. Therefore, the second line under each class in the table below is useful in comparing ongoing costs only and will not help you determine the relative total costs of owning different funds. In addition, if these transactional costs were included, your costs would have been higher.
|
Beginning Account Value April 1, 2017
|
Ending
Account Value September 30, 2017 |
Expense
Ratio(a) |
Expenses Paid, and During
Period April 1, 2017 - September 30, 2017(b) |
|
|
Investor Class
|
||||
|
Actual
|
$1,000.00
|
$ 980.00
|
3.60%
|
$17.87
|
|
Hypothetical (5% return before expenses)
|
$1,000.00
|
$1,007.02
|
3.60%
|
$18.11
|
|
Institutional Class
|
||||
|
Actual
|
$1,000.00
|
$ 981.30
|
3.35%
|
$16.64
|
|
Hypothetical (5% return before expenses)
|
$1,000.00
|
$1,008.27
|
3.35%
|
$16.87
|
| (a) |
Annualized, based on the Fund's most recent fiscal half-year expenses. Expense ratio excluding interest expense and dividends paid on borrowed securities is 1.95% and 1.70% for Investor Class and Institutional Class, respectively.
|
| (b) |
Expenses are equal to the Fund’s annualized expense ratio, multiplied by the average account value over the period, multiplied by the number of days in the most recent fiscal half year (183), divided by 365.
|
|
8
|
www.cogniosfunds.com
|
|
Cognios Market Neutral Large Cap Fund
|
|
Portfolio of Investments
|
September 30, 2017
|
|
|
Shares
|
Value (Note 2)
|
||||||
|
COMMON STOCKS (124.69%)
|
||||||||
|
Communications (3.37%)
|
||||||||
|
AT&T, Inc.(a)
|
27,310
|
$
|
1,069,733
|
|||||
|
Facebook, Inc., Class A(a)(b)
|
5,941
|
1,015,138
|
||||||
|
Total Communications
|
2,084,871
|
|||||||
|
|
||||||||
|
Consumer Cyclical (29.07%)
|
||||||||
|
AutoZone, Inc.(b)
|
1,911
|
1,137,255
|
||||||
|
Coach, Inc.(a)
|
24,477
|
985,934
|
||||||
|
Darden Restaurants, Inc.(a)
|
12,504
|
985,065
|
||||||
|
Dollar Tree, Inc.(a)(b)
|
12,827
|
1,113,640
|
||||||
|
Foot Locker, Inc.(a)
|
28,158
|
991,725
|
||||||
|
Hanesbrands, Inc.(a)
|
41,573
|
1,024,359
|
||||||
|
L Brands, Inc.(a)
|
27,216
|
1,132,458
|
||||||
|
McDonald's Corp.(a)
|
6,414
|
1,004,945
|
||||||
|
Michael Kors Holdings, Ltd.(a)(b)
|
23,839
|
1,140,696
|
||||||
|
NIKE, Inc., Class B(a)
|
19,254
|
998,320
|
||||||
|
Nordstrom, Inc(a)
|
22,263
|
1,049,700
|
||||||
|
O'Reilly Automotive, Inc.(b)
|
5,203
|
1,120,570
|
||||||
|
Ralph Lauren Corp.(a)
|
11,513
|
1,016,483
|
||||||
|
Target Corp.(a)
|
18,503
|
1,091,862
|
||||||
|
Ulta Beauty, Inc.(b)
|
4,636
|
1,048,014
|
||||||
|
Wal‐Mart Stores, Inc.(a)
|
13,065
|
1,020,899
|
||||||
|
WW Grainger, Inc.(a)
|
6,229
|
1,119,663
|
||||||
|
Total Consumer Cyclical
|
17,981,588
|
|||||||
|
|
||||||||
|
Consumer Non‐cyclical (51.07%)
|
||||||||
|
Altria Group, Inc.(a)
|
16,209
|
1,027,975
|
||||||
|
Anthem, Inc.(a)
|
5,207
|
988,705
|
||||||
|
Biogen, Inc.(a)(b)
|
3,209
|
1,004,802
|
||||||
|
Campbell Soup Co.
|
22,192
|
1,039,029
|
||||||
|
Centene Corp.(a)(b)
|
11,732
|
1,135,306
|
||||||
|
Church & Dwight Co., Inc.(a)
|
20,361
|
986,490
|
||||||
|
Cigna Corp.(a)
|
5,598
|
1,046,490
|
||||||
|
Clorox Co.(a)
|
7,378
|
973,232
|
||||||
|
Coca‐Cola Co.
|
22,420
|
1,009,124
|
||||||
|
Conagra Brands, Inc.
|
31,214
|
1,053,160
|
||||||
|
Constellation Brands, Inc., Class A
|
5,119
|
1,020,985
|
||||||
|
Cooper Cos., Inc.(a)
|
4,347
|
1,030,717
|
||||||
|
Dr Pepper Snapple Group, Inc.
|
11,199
|
990,775
|
||||||
|
Envision Healthcare Corp.(a)(b)
|
19,637
|
882,683
|
||||||
|
Estee Lauder Cos., Inc., Class A(a)
|
9,532
|
1,027,931
|
||||||
|
General Mills, Inc.(a)
|
19,076
|
987,374
|
||||||
|
H&R Block, Inc.(a)
|
38,158
|
1,010,424
|
||||||
|
HCA Healthcare, Inc.(a)(b)
|
13,053
|
1,038,888
|
||||||
|
Hershey Co.(a)
|
9,786
|
1,068,338
|
||||||
|
See Notes to Financial Statements.
|
|
Annual Report | September 30, 2017
|
9
|
|
Cognios Market Neutral Large Cap Fund
|
|
Portfolio of Investments
|
September 30, 2017
|
|
|
Shares
|
Value (Note 2)
|
||||||
|
Consumer Non‐cyclical (continued)
|
||||||||
|
Hormel Foods Corp.(a)
|
33,381
|
$
|
1,072,865
|
|||||
|
JM Smucker Co.
|
9,729
|
1,020,864
|
||||||
|
Kellogg Co.
|
15,680
|
977,962
|
||||||
|
McCormick & Co., Inc.
|
10,709
|
1,099,172
|
||||||
|
PepsiCo, Inc.
|
8,847
|
985,821
|
||||||
|
Procter & Gamble Co.
|
11,065
|
1,006,694
|
||||||
|
Quest Diagnostics, Inc.(a)
|
9,487
|
888,363
|
||||||
|
Sysco Corp.
|
19,418
|
1,047,601
|
||||||
|
Tyson Foods, Inc., Class A
|
16,012
|
1,128,045
|
||||||
|
UnitedHealth Group, Inc.(a)
|
5,154
|
1,009,411
|
||||||
|
Varian Medical Systems, Inc.(a)(b)
|
9,794
|
979,988
|
||||||
|
Verisk Analytics, Inc.(a)(b)
|
12,617
|
1,049,608
|
||||||
|
Total Consumer Non‐cyclical
|
31,588,822
|
|||||||
|
|
||||||||
|
Financials (6.65%)
|
||||||||
|
Everest RE Group, Ltd.(a)
|
4,055
|
926,121
|
||||||
|
Intercontinental Exchange, Inc.(a)
|
15,766
|
1,083,124
|
||||||
|
Loews Corp.(a)
|
21,831
|
1,044,832
|
||||||
|
Public Storage ‐ REIT(a)
|
4,955
|
1,060,321
|
||||||
|
Total Financials
|
4,114,398
|
|||||||
|
|
||||||||
|
Industrials (18.67%)
|
||||||||
|
CH Robinson Worldwide, Inc.(a)
|
14,506
|
1,103,907
|
||||||
|
Expeditors International of Washington, Inc.(a)
|
18,122
|
1,084,783
|
||||||
|
FLIR Systems, Inc.(a)
|
26,757
|
1,041,115
|
||||||
|
General Dynamics Corp.(a)
|
5,088
|
1,045,991
|
||||||
|
Lockheed Martin Corp.(a)
|
3,359
|
1,042,264
|
||||||
|
Northrop Grumman Corp.(a)
|
3,789
|
1,090,171
|
||||||
|
Raytheon Co.(a)
|
5,627
|
1,049,886
|
||||||
|
Republic Services, Inc.(a)
|
15,642
|
1,033,310
|
||||||
|
Stericycle, Inc.(a)(b)
|
14,246
|
1,020,299
|
||||||
|
TransDigm Group, Inc.(a)
|
3,919
|
1,001,892
|
||||||
|
Waste Management, Inc.(a)
|
13,224
|
1,035,042
|
||||||
|
Total Industrials
|
11,548,660
|
|||||||
|
|
||||||||
|
Technology (3.34%)
|
||||||||
|
Akamai Technologies, Inc.(a)(b)
|
21,665
|
1,055,519
|
||||||
|
Electronic Arts, Inc.(a)(b)
|
8,549
|
1,009,295
|
||||||
|
Total Technology
|
2,064,814
|
|||||||
|
|
||||||||
|
Utilities (12.52%)
|
||||||||
|
Ameren Corp.(a)
|
17,109
|
989,585
|
||||||
|
American Electric Power Co., Inc.(a)
|
13,900
|
976,336
|
||||||
|
Consolidated Edison, Inc.(a)
|
12,162
|
981,230
|
||||||
|
Eversource Energy(a)
|
16,284
|
984,205
|
||||||
|
See Notes to Financial Statements.
|
|
10
|
www.cogniosfunds.com
|
|
Cognios Market Neutral Large Cap Fund
|
|
Portfolio of Investments
|
September 30, 2017
|
|
|
Shares
|
Value (Note 2)
|
||||||
|
Utilities (continued)
|
||||||||
|
FirstEnergy Corp.(a)
|
31,338
|
$
|
966,151
|
|||||
|
PG&E Corp.(a)
|
14,650
|
997,518
|
||||||
|
Public Service Enterprise Group, Inc.(a)
|
22,025
|
1,018,656
|
||||||
|
SCANA Corp.(a)
|
17,038
|
826,173
|
||||||
|
Total Utilities
|
7,739,854
|
|||||||
|
|
||||||||
|
TOTAL COMMON STOCKS (Cost $76,545,822)
|
77,123,007
|
|||||||
|
7-Day Yield
|
Shares
|
Value (Note 2)
|
||||||||||
|
SHORT‐TERM INVESTMENTS (0.26%)
|
||||||||||||
|
Money Market Fund (0.26%)
|
||||||||||||
|
BlackRock Liquidity Treasury Fund
|
0.66000
|
%
|
163,817
|
163,817
|
||||||||
|
TOTAL SHORT‐TERM INVESTMENTS (Cost $163,817)
|
163,817
|
|||||||||||
|
TOTAL INVESTMENTS (124.95%) (Cost $76,709,639)
|
$
|
77,286,824
|
||||||||||
|
SECURITIES SOLD SHORT (-88.97%)
|
||||||||||||
|
(Proceeds $54,216,277)
|
$
|
(55,032,982
|
)
|
|||||||||
|
Other Assets In Excess Of Liabilities (64.02%)
|
39,599,382
|
(c)
|
||||||||||
|
NET ASSETS (100.00%)
|
$
|
61,853,224
|
||||||||||
|
Shares
|
Value (Note 2)
|
|||||||
|
SCHEDULE OF SECURITIES SOLD SHORT
|
||||||||
|
COMMON STOCKS (‐88.97%)
|
||||||||
|
Basic Materials (-1.17%)
|
||||||||
|
DowDuPont, Inc.
|
(5,315
|
)
|
$
|
(367,958
|
)
|
|||
|
Newmont Mining Corp.
|
(9,434
|
)
|
(353,869
|
)
|
||||
|
Total Basic Materials
|
(721,827
|
)
|
||||||
|
Communications (-4.08%)
|
||||||||
|
CenturyLink, Inc.
|
(18,131
|
)
|
(342,676
|
)
|
||||
|
Charter Communications, Inc., Class A
|
(917
|
)
|
(333,256
|
)
|
||||
|
Comcast Corp., Class A
|
(8,877
|
)
|
(341,587
|
)
|
||||
|
Motorola Solutions, Inc.
|
(4,140
|
)
|
(351,362
|
)
|
||||
|
See Notes to Financial Statements.
|
|
Annual Report | September 30, 2017
|
11
|
|
Cognios Market Neutral Large Cap Fund
|
|
Portfolio of Investments
|
September 30, 2017
|
|
|
Shares
|
Value (Note 2)
|
||||||
|
Communications (continued)
|
||||||||
|
NetFlix, Inc.
|
(2,076
|
)
|
$
|
(376,483
|
)
|
|||
|
Symantec Corp.
|
(12,184
|
)
|
(399,757
|
)
|
||||
|
Verizon Communications, Inc.
|
(7,595
|
)
|
(375,876
|
)
|
||||
|
Total Communications
|
(2,520,997
|
)
|
||||||
|
|
||||||||
|
Consumer Cyclical (‐5.25%)
|
||||||||
|
Advance Auto Parts, Inc.
|
(3,716
|
)
|
(368,627
|
)
|
||||
|
Chipotle Mexican Grill, Inc.
|
(1,140
|
)
|
(350,926
|
)
|
||||
|
Costco Wholesale Corp.
|
(2,298
|
)
|
(377,538
|
)
|
||||
|
Hilton Worldwide Holdings, Inc.
|
(5,654
|
)
|
(392,670
|
)
|
||||
|
Mattel, Inc.
|
(22,208
|
)
|
(343,780
|
)
|
||||
|
Newell Brands, Inc.
|
(7,483
|
)
|
(319,300
|
)
|
||||
|
PulteGroup, Inc.
|
(13,973
|
)
|
(381,882
|
)
|
||||
|
PVH Corp.
|
(2,883
|
)
|
(363,431
|
)
|
||||
|
Yum! Brands, Inc.
|
(4,719
|
)
|
(347,366
|
)
|
||||
|
Total Consumer Cyclical
|
(3,245,520
|
)
|
||||||
|
|
||||||||
|
Consumer Non‐cyclical (-21.15%)
|
||||||||
|
Abbott Laboratories
|
(7,123
|
)
|
(380,083
|
)
|
||||
|
Aetna, Inc.
|
(2,308
|
)
|
(366,995
|
)
|
||||
|
Allergan PLC
|
(1,593
|
)
|
(326,485
|
)
|
||||
|
AmerisourceBergen Corp.
|
(4,564
|
)
|
(377,671
|
)
|
||||
|
Automatic Data Processing, Inc.
|
(3,403
|
)
|
(372,016
|
)
|
||||
|
Baxter International, Inc.
|
(5,867
|
)
|
(368,154
|
)
|
||||
|
Becton Dickinson & Co.
|
(1,836
|
)
|
(359,764
|
)
|
||||
|
Boston Scientific Corp.
|
(13,272
|
)
|
(387,144
|
)
|
||||
|
Brown-Forman Corp., Class B
|
(6,843
|
)
|
(371,575
|
)
|
||||
|
Cardinal Health, Inc.
|
(5,370
|
)
|
(359,360
|
)
|
||||
|
Coty, Inc., Class A
|
(21,939
|
)
|
(362,652
|
)
|
||||
|
CR Bard, Inc.
|
(1,136
|
)
|
(364,088
|
)
|
||||
|
Ecolab, Inc.
|
(2,745
|
)
|
(353,035
|
)
|
||||
|
Edwards Lifesciences Corp.
|
(3,217
|
)
|
(351,650
|
)
|
||||
|
Eli Lilly & Co.
|
(4,496
|
)
|
(384,588
|
)
|
||||
|
Gartner, Inc.
|
(3,030
|
)
|
(376,962
|
)
|
||||
|
Global Payments, Inc.
|
(3,795
|
)
|
(360,639
|
)
|
||||
|
Hologic, Inc.
|
(9,491
|
)
|
(348,225
|
)
|
||||
|
IDEXX Laboratories, Inc.
|
(2,355
|
)
|
(366,179
|
)
|
||||
|
IHS Markit, Ltd.
|
(7,786
|
)
|
(343,207
|
)
|
||||
|
Illumina, Inc.
|
(1,775
|
)
|
(353,580
|
)
|
||||
|
Incyte Corp.
|
(2,649
|
)
|
(309,244
|
)
|
||||
|
Intuitive Surgical, Inc.
|
(364
|
)
|
(380,700
|
)
|
||||
|
Kraft Heinz Co.
|
(4,519
|
)
|
(350,449
|
)
|
||||
|
Merck & Co., Inc.
|
(5,700
|
)
|
(364,971
|
)
|
||||
|
Molson Coors Brewing Co., Class B
|
(4,041
|
)
|
(329,907
|
)
|
||||
|
Mondelez International, Inc., Class A
|
(8,916
|
)
|
(362,525
|
)
|
||||
|
See Notes to Financial Statements.
|
|
12
|
www.cogniosfunds.com
|
|
Cognios Market Neutral Large Cap Fund
|
|
Portfolio of Investments
|
September 30, 2017
|
|
|
Shares
|
Value (Note 2)
|
||||||
|
Consumer Non-cyclical (continued)
|
||||||||
|
Patterson Cos., Inc.
|
(9,549
|
)
|
$
|
(369,069
|
)
|
|||
|
Perrigo Co. PLC
|
(4,633
|
)
|
(392,184
|
)
|
||||
|
Pfizer, Inc.
|
(10,732
|
)
|
(383,132
|
)
|
||||
|
Quanta Services, Inc.
|
(10,047
|
)
|
(375,456
|
)
|
||||
|
Quintiles IMS Holdings, Inc.
|
(3,799
|
)
|
(361,171
|
)
|
||||
|
ResMed, Inc.
|
(4,705
|
)
|
(362,097
|
)
|
||||
|
Stryker Corp.
|
(2,591
|
)
|
(367,974
|
)
|
||||
|
Thermo Fisher Scientific, Inc.
|
(1,955
|
)
|
(369,886
|
)
|
||||
|
Zoetis, Inc.
|
(5,805
|
)
|
(370,127
|
)
|
||||
|
Total Consumer Non-cyclical
|
(13,082,944
|
)
|
||||||
|
|
||||||||
|
Energy (-11.66%)
|
||||||||
|
Apache Corp.
|
(9,205
|
)
|
(421,589
|
)
|
||||
|
Baker Hughes, a GE Co.
|
(10,645
|
)
|
(389,820
|
)
|
||||
|
Cabot Oil & Gas Corp.
|
(13,804
|
)
|
(369,257
|
)
|
||||
|
Concho Resources, Inc.
|
(3,237
|
)
|
(426,378
|
)
|
||||
|
ConocoPhillips
|
(8,206
|
)
|
(410,710
|
)
|
||||
|
EOG Resources, Inc.
|
(4,241
|
)
|
(410,274
|
)
|
||||
|
EQT Corp.
|
(5,836
|
)
|
(380,741
|
)
|
||||
|
Exxon Mobil Corp.
|
(4,738
|
)
|
(388,421
|
)
|
||||
|
Halliburton Co.
|
(9,255
|
)
|
(426,008
|
)
|
||||
|
Kinder Morgan, Inc.
|
(18,753
|
)
|
(359,683
|
)
|
||||
|
National Oilwell Varco, Inc.
|
(11,826
|
)
|
(422,543
|
)
|
||||
|
Noble Energy, Inc.
|
(15,087
|
)
|
(427,867
|
)
|
||||
|
Occidental Petroleum Corp.
|
(6,079
|
)
|
(390,333
|
)
|
||||
|
Phillips 66
|
(4,325
|
)
|
(396,213
|
)
|
||||
|
Pioneer Natural Resources Co.
|
(2,790
|
)
|
(411,637
|
)
|
||||
|
Range Resources Corp.
|
(20,206
|
)
|
(395,431
|
)
|
||||
|
Schlumberger, Ltd.
|
(5,715
|
)
|
(398,678
|
)
|
||||
|
Technipfmc PLC
|
(13,885
|
)
|
(387,669
|
)
|
||||
|
Total Energy
|
(7,213,252
|
)
|
||||||
|
|
||||||||
|
Financials (-24.68%)
|
||||||||
|
Alexandria Real Estate Equities, Inc. -REIT
|
(2,988
|
)
|
(355,482
|
)
|
||||
|
American Express Co.
|
(4,209
|
)
|
(380,746
|
)
|
||||
|
American International Group, Inc.
|
(5,973
|
)
|
(366,682
|
)
|
||||
|
American Tower Corp. -REIT
|
(2,486
|
)
|
(339,787
|
)
|
||||
|
Apartment Investment & Management Co., Class A - REIT
|
(7,968
|
)
|
(349,477 | ) | ||||
|
AvalonBay Communities, Inc. -REIT
|
(1,921
|
)
|
(342,745
|
)
|
||||
|
BB&T Corp.
|
(7,830
|
)
|
(367,540
|
)
|
||||
|
Boston Properties, Inc. -REIT
|
(3,001
|
)
|
(368,763
|
)
|
||||
|
CBOE Holdings, Inc.
|
(3,605
|
)
|
(388,006
|
)
|
||||
|
Cincinnati Financial Corp.
|
(4,714
|
)
|
(360,951
|
)
|
||||
|
CME Group, Inc.
|
(2,883
|
)
|
(391,165
|
)
|
||||
|
See Notes to Financial Statements.
|
|
Annual Report | September 30, 2017
|
13
|
|
Cognios Market Neutral Large Cap Fund
|
|
Portfolio of Investments
|
September 30, 2017
|
|
|
Shares
|
Value (Note 2)
|
||||||
|
Financials (continued)
|
||||||||
|
Crown Castle International Corp. - REIT
|
(3,399
|
)
|
$
|
(339,832
|
)
|
|||
|
Digital Realty Trust, Inc. - REIT
|
(3,092
|
)
|
(365,876
|
)
|
||||
|
Duke Realty Corp. - REIT
|
(12,203
|
)
|
(351,690
|
)
|
||||
|
Equinix, Inc. - REIT
|
(780
|
)
|
(348,114
|
)
|
||||
|
Equity Residential - REIT
|
(5,394
|
)
|
(355,626
|
)
|
||||
|
Essex Property Trust, Inc. - REIT
|
(1,358
|
)
|
(344,973
|
)
|
||||
|
Extra Space Storage, Inc. - REIT
|
(4,634
|
)
|
(370,349
|
)
|
||||
|
Federal Realty Investment Trust - REIT
|
(2,825
|
)
|
(350,893
|
)
|
||||
|
GGP, Inc. - REIT
|
(17,163
|
)
|
(356,476
|
)
|
||||
|
Hartford Financial Services Group, Inc.
|
(6,693
|
)
|
(370,993
|
)
|
||||
|
HCP, Inc. - REIT
|
(12,053
|
)
|
(335,435
|
)
|
||||
|
Iron Mountain, Inc. - REIT
|
(9,196
|
)
|
(357,724
|
)
|
||||
|
KeyCorp
|
(20,891
|
)
|
(393,169
|
)
|
||||
|
Kimco Realty Corp. - REIT
|
(18,250
|
)
|
(356,788
|
)
|
||||
|
M&T Bank Corp.
|
(2,430
|
)
|
(391,327
|
)
|
||||
|
Macerich Co. - REIT
|
(6,777
|
)
|
(372,532
|
)
|
||||
|
Mastercard, Inc., Class A
|
(2,726
|
)
|
(384,911
|
)
|
||||
|
Mid-America Apartment Communities, Inc. - REIT
|
(3,401
|
)
|
(363,499
|
) | ||||
|
Nasdaq, Inc.
|
(4,812
|
)
|
(373,267
|
)
|
||||
|
Northern Trust Corp.
|
(4,071
|
)
|
(374,247
|
)
|
||||
|
People's United Financial, Inc.
|
(21,581
|
)
|
(391,479
|
)
|
||||
|
Prologis, Inc. - REIT
|
(5,687
|
)
|
(360,897
|
)
|
||||
|
Realty Income Corp. - REIT
|
(6,236
|
)
|
(356,637
|
)
|
||||
|
Regency Centers Corp. - REIT
|
(5,602
|
)
|
(347,548
|
)
|
||||
|
Simon Property Group, Inc. - REIT
|
(2,284
|
)
|
(367,747
|
)
|
||||
|
SL Green Realty Corp. - REIT
|
(3,734
|
)
|
(378,329
|
)
|
||||
|
UDR, Inc. - REIT
|
(9,324
|
)
|
(354,592
|
)
|
||||
|
Ventas, Inc. - REIT
|
(5,250
|
)
|
(341,933
|
)
|
||||
|
Vornado Realty Trust - REIT
|
(4,856
|
)
|
(373,329
|
)
|
||||
|
Welltower, Inc. - REIT
|
(4,934
|
)
|
(346,762
|
)
|
||||
|
Willis Towers Watson PLC
|
(2,443
|
)
|
(376,784
|
)
|
||||
|
Total Financials
|
(15,265,102
|
)
|
||||||
|
|
||||||||
|
Industrials (-7.82%)
|
||||||||
|
Ball Corp.
|
(9,033
|
)
|
(373,063
|
)
|
||||
|
Deere & Co.
|
(3,125
|
)
|
(392,469
|
)
|
||||
|
General Electric Co.
|
(14,535
|
)
|
(351,456
|
)
|
||||
|
Harris Corp.
|
(2,952
|
)
|
(388,719
|
)
|
||||
|
Kansas City Southern
|
(3,489
|
)
|
(379,185
|
)
|
||||
|
Martin Marietta Materials, Inc.
|
(1,731
|
)
|
(356,984
|
)
|
||||
|
Mettler-Toledo International, Inc.
|
(603
|
)
|
(377,575
|
)
|
||||
|
PerkinElmer, Inc.
|
(5,427
|
)
|
(374,300
|
)
|
||||
|
Stanley Black & Decker, Inc.
|
(2,522
|
)
|
(380,746
|
)
|
||||
|
United Parcel Service, Inc., Class B
|
(3,169
|
)
|
(380,565
|
)
|
||||
|
See Notes to Financial Statements.
|
|
14
|
www.cogniosfunds.com
|
|
Cognios Market Neutral Large Cap Fund
|
|
Portfolio of Investments
|
September 30, 2017
|
|
|
Shares
|
Value (Note 2)
|
||||||
|
Industrials (continued)
|
||||||||
|
United Technologies Corp.
|
(3,066
|
)
|
$
|
(355,901
|
)
|
|||
|
Vulcan Materials Co.
|
(3,017
|
)
|
(360,833
|
)
|
||||
|
Xylem, Inc.
|
(5,863
|
)
|
(367,200
|
)
|
||||
|
Total Industrials
|
(4,838,996
|
)
|
||||||
|
|
||||||||
|
Technology (-2.89%)
|
||||||||
|
Activision Blizzard, Inc.
|
(5,603
|
)
|
(361,450
|
)
|
||||
|
Broadcom, Ltd.
|
(1,426
|
)
|
(345,862
|
)
|
||||
|
DXC Technology Co.
|
(4,282
|
)
|
(367,738
|
)
|
||||
|
Fidelity National Information Services, Inc.
|
(3,921
|
)
|
(366,182
|
)
|
||||
|
Qorvo, Inc.
|
(4,929
|
)
|
(348,382
|
)
|
||||
|
Total Technology
|
(1,789,614
|
)
|
||||||
|
|
||||||||
|
Utilities (-10.27%)
|
||||||||
|
Alliant Energy Corp.
|
(8,492
|
)
|
(353,012
|
)
|
||||
|
American Water Works Co., Inc.
|
(4,491
|
)
|
(363,367
|
)
|
||||
|
CenterPoint Energy, Inc.
|
(12,264
|
)
|
(358,231
|
)
|
||||
|
CMS Energy Corp.
|
(7,498
|
)
|
(347,307
|
)
|
||||
|
Dominion Energy, Inc.
|
(4,631
|
)
|
(356,263
|
)
|
||||
|
DTE Energy Co.
|
(3,235
|
)
|
(347,310
|
)
|
||||
|
Duke Energy Corp.
|
(4,171
|
)
|
(350,030
|
)
|
||||
|
Edison International
|
(4,548
|
)
|
(350,969
|
)
|
||||
|
Entergy Corp.
|
(4,576
|
)
|
(349,423
|
)
|
||||
|
Exelon Corp.
|
(9,625
|
)
|
(362,574
|
)
|
||||
|
NextEra Energy, Inc.
|
(2,419
|
)
|
(354,505
|
)
|
||||
|
NiSource, Inc.
|
(13,494
|
)
|
(345,312
|
)
|
||||
|
Pinnacle West Capital Corp.
|
(4,050
|
)
|
(342,468
|
)
|
||||
|
PPL Corp.
|
(9,293
|
)
|
(352,669
|
)
|
||||
|
Sempra Energy
|
(3,084
|
)
|
(351,977
|
)
|
||||
|
Southern Co.
|
(7,566
|
)
|
(371,793
|
)
|
||||
|
WEC Energy Group, Inc.
|
(5,566
|
)
|
(349,434
|
)
|
||||
|
Xcel Energy, Inc.
|
(7,356
|
)
|
(348,086
|
)
|
||||
|
Total Utilities
|
(6,354,730
|
)
|
||||||
|
|
||||||||
|
TOTAL COMMON STOCKS (Proceeds $54,216,277)
|
(55,032,982
|
)
|
||||||
|
|
||||||||
|
TOTAL SECURITIES SOLD SHORT (-88.97%)
|
||||||||
|
(Proceeds $54,216,277)
|
$
|
(55,032,982
|
)
|
|||||
|
(a)
|
Security, or a portion of security, is being held as collateral for short sales. As of September 30, 2017, the aggregate market value of those securities was $37,680,117, which represents approximately 60.92% of the Fund's net assets.
|
|
(b)
|
Non-income producing security.
|
|
(c)
|
Includes segregated cash that is being held as collateral for securities sold short.
|
|
See Notes to Financial Statements.
|
|
Annual Report | September 30, 2017
|
15
|
|
Cognios Market Neutral Large Cap Fund
|
|
Portfolio of Investments
|
September 30, 2017
|
For Fund compliance purposes, the Fund’s industry classifications refer to any one or more of the industry sub-classifications used by one or more widely recognized market indices or ratings group indices and/or as defined by Fund management. This definition may not apply for purposes of this report, which may combine industry sub-classifications for reporting ease. Industries are shown as a percent of the Fund's net assets. (Unaudited)
|
See Notes to Financial Statements.
|
|
16
|
www.cogniosfunds.com
|
|
Cognios Market Neutral Large Cap Fund
|
|
Statement of Assets and Liabilities
|
September 30, 2017
|
|
ASSETS:
|
||||
|
Investments, at value (cost $76,709,639)
|
$
|
77,286,824
|
||
|
Segregated cash with brokers (Note 2)
|
206,127
|
|||
|
Deposit with broker for securities sold short (Note 2)
|
39,523,653
|
|||
|
Receivable for shares sold
|
30,772
|
|||
|
Dividends receivable
|
96,083
|
|||
|
Prepaid assets
|
7,549
|
|||
|
Total Assets
|
117,151,008
|
|||
|
|
||||
|
LIABILITIES:
|
||||
|
Securities sold short (proceeds $54,216,277)
|
55,032,982
|
|||
|
Payable for dividends on short sales
|
102,296
|
|||
|
Payable for shares redeemed
|
7,517
|
|||
|
Payable to adviser
|
90,698
|
|||
|
Payable for administration and transfer agency
|
21,100
|
|||
|
Payable for distribution and service fees
|
4,959
|
|||
|
Payable to trustees
|
135
|
|||
|
Payable to chief compliance officer
|
1,761
|
|||
|
Payable to principal financial officer
|
833
|
|||
|
Accrued expenses and other liabilities
|
35,503
|
|||
|
Total Liabilities
|
55,297,784
|
|||
|
NET ASSETS
|
$
|
61,853,224
|
||
|
|
||||
|
NET ASSETS CONSIST OF:
|
||||
|
Paid-in capital (Note 5)
|
$
|
72,811,975
|
||
|
Accumulated net investment loss
|
(675,014
|
)
|
||
|
Accumulated net realized loss
|
(10,044,217
|
)
|
||
|
Net unrealized depreciation
|
(239,520
|
)
|
||
|
NET ASSETS
|
$
|
61,853,224
|
||
|
|
||||
|
PRICING OF SHARES
|
||||
|
Investor Class:
|
||||
|
Net Asset Value, offering and redemption price per share
|
$
|
9.32
|
||
|
Net Assets
|
$
|
22,997,086
|
||
|
Shares of beneficial interest outstanding
|
2,467,423
|
|||
|
Institutional Class:
|
||||
|
Net Asset Value, offering and redemption price per share
|
$
|
9.44
|
||
|
Net Assets
|
$
|
38,856,138
|
||
|
Shares of beneficial interest outstanding
|
4,117,483
|
|||
|
See Notes to Financial Statements.
|
|
Annual Report | September 30, 2017
|
17
|
|
Cognios Market Neutral Large Cap Fund
|
|
Statement of Operations
|
For the Year Ended September 30, 2017
|
|
INVESTMENT INCOME:
|
||||
|
Dividends
|
$
|
2,668,460
|
||
|
Total Investment Income
|
2,668,460
|
|||
|
|
||||
|
EXPENSES:
|
||||
|
Investment advisory fee (Note 6)
|
1,725,602
|
|||
|
Dividend expense on securities sold short
|
1,688,001
|
|||
|
Interest expense
|
347,204
|
|||
|
Administration fee
|
148,237
|
|||
|
Distribution and service fees
|
||||
|
Investor Class
|
82,580
|
|||
|
Custodian fee
|
20,442
|
|||
|
Legal fees
|
21,198
|
|||
|
Audit fees
|
19,600
|
|||
|
Transfer agent fee
|
62,381
|
|||
|
Trustees fees and expenses
|
13,069
|
|||
|
Registration and filing fees
|
47,038
|
|||
|
Printing fees
|
14,697
|
|||
|
Chief compliance officer fee
|
20,848
|
|||
|
Principal financial officer fee
|
10,000
|
|||
|
Insurance expense
|
5,418
|
|||
|
Other expenses
|
10,591
|
|||
|
Total Expenses
|
4,236,906
|
|||
|
Less fees waived/reimbursed by investment adviser
|
||||
|
Investor Class
|
(49,859
|
)
|
||
|
Institutional Class
|
(118,298
|
)
|
||
|
Total fees waived/reimbursed by investment adviser (Note 6)
|
(168,157
|
)
|
||
|
Net Expenses
|
4,068,749
|
|||
|
NET INVESTMENT LOSS
|
(1,400,289
|
)
|
||
|
|
||||
|
REALIZED AND UNREALIZED GAIN/(LOSS) ON INVESTMENTS:
|
||||
|
Net realized gain/(loss) on:
|
||||
|
Investments
|
14,135,646
|
|||
|
Securities sold short
|
(22,476,064
|
)
|
||
|
Net realized loss
|
(8,340,418
|
)
|
||
|
Change in unrealized appreciation/(depreciation) on:
|
||||
|
Investments
|
(1,426,293
|
)
|
||
|
Securities sold short
|
4,821,275
|
|||
|
Net change
|
3,394,982
|
|||
|
|
||||
|
NET REALIZED AND UNREALIZED LOSS ON INVESTMENTS AND SECURITIES SOLD SHORT
|
(4,945,436
|
)
|
||
|
NET DECREASE IN NET ASSETS RESULTING FROM OPERATIONS
|
$
|
(6,345,725
|
)
|
|
|
See Notes to Financial Statements.
|
|
18
|
www.cogniosfunds.com
|
|
Cognios Market Neutral Large Cap Fund
|
|
Statements of Changes in Net Assets
|
|
|
For the Year
Ended September 30, 2017 |
For the Year
Ended September 30, 2016 |
||||||
|
OPERATIONS:
|
||||||||
|
Net investment loss
|
$
|
(1,400,289
|
)
|
$
|
(1,100,414
|
)
|
||
|
Net realized gain/(loss)
|
(8,340,418
|
)
|
2,060,468
|
|||||
|
Net change in unrealized appreciation/(depreciation)
|
3,394,982
|
(4,313,673
|
)
|
|||||
|
Net decrease in net assets resulting from operations
|
(6,345,725
|
)
|
(3,353,619
|
)
|
||||
|
DISTRIBUTIONS TO SHAREHOLDERS:
|
||||||||
|
From net realized gains on investments:
|
||||||||
|
Investor class
|
(651,783
|
)
|
(35,903
|
)
|
||||
|
Institutional class
|
(1,426,049
|
)
|
(58,099
|
)
|
||||
|
Total distributions
|
(2,077,832
|
)
|
(94,002
|
)
|
||||
|
|
||||||||
|
BENEFICIAL SHARE TRANSACTIONS (Note 5):
|
||||||||
|
Investor Class
|
||||||||
|
Shares sold
|
13,810,913
|
63,300,469
|
||||||
|
Dividends reinvested
|
630,723
|
35,674
|
||||||
|
Shares redeemed
|
(32,642,780
|
)
|
(24,373,872
|
)
|
||||
|
Net increase/(decrease) from beneficial share transactions
|
(18,201,144
|
)
|
38,962,271
|
|||||
|
Institutional Class
|
||||||||
|
Shares sold
|
26,032,387
|
117,037,344
|
||||||
|
Dividends reinvested
|
1,351,002
|
55,295
|
||||||
|
Shares redeemed
|
(96,184,014
|
)
|
(11,983,550
|
)
|
||||
|
Net increase/(decrease) from beneficial share transactions
|
(68,800,625
|
)
|
105,109,089
|
|||||
|
Net increase/(decrease) in net assets
|
(95,425,326
|
)
|
140,623,739
|
|||||
|
|
||||||||
|
NET ASSETS:
|
||||||||
|
Beginning of year
|
157,278,550
|
16,654,811
|
||||||
|
End of year(including accumulated net investment loss of $(675,014) and $0)
|
$
|
61,853,224
|
$
|
157,278,550
|
||||
|
See Notes to Financial Statements.
|
|
Annual Report | September 30, 2017
|
19
|
|
Cognios Market Neutral Large Cap Fund
|
|||
|
Statement of Cash Flows
|
For the Year Ended September 30, 2017
|
|
CASH FLOWS FROM OPERATING ACTIVITIES:
|
||||
|
Net decrease in net assets from operations
|
$
|
(6,345,725
|
)
|
|
|
Adjustments to reconcile net decrease in net assets from operations to net cash provided by operating activities:
|
||||
|
Purchases of investment securities
|
(326,239,002
|
)
|
||
|
Proceeds from disposition of investment securities
|
447,437,659
|
|||
|
Proceeds from securities sold short transactions
|
244,375,265
|
|||
|
Purchases to cover securities sold short transactions
|
(315,356,632
|
)
|
||
|
Net purchases of short-term investment securities
|
2,378,976
|
|||
|
Net realized loss on investments and securities sold short
|
8,340,418
|
|||
|
Net change in unrealized appreciation on investments and securities sold short
|
(3,394,982
|
)
|
||
|
(Increase) decrease in assets:
|
||||
|
Segregated cash with brokers
|
2,702,811
|
|||
|
Deposit with broker for securities sold short
|
36,581,902
|
|||
|
Dividends receivable
|
121,437
|
|||
|
Prepaid assets
|
4,846
|
|||
|
Increase (decrease) in liabilities:
|
||||
|
Payable for dividends on short sales
|
23,635
|
|||
|
Payable for administration and transfer agency
|
21,100
|
|||
|
Payable for distribution and service fees
|
(6,075
|
)
|
||
|
Payable to adviser
|
(68,502
|
)
|
||
|
Payable to trustees
|
(3,348
|
)
|
||
|
Payable to chief compliance officer
|
(1,666
|
)
|
||
|
Payable to principal financial officer
|
(1
|
)
|
||
|
Accrued expenses and other liabilities
|
(41,955
|
)
|
||
|
Net cash provided by operating activities
|
90,530,161
|
|||
|
|
||||
|
CASH FLOWS USED IN FINANCING ACTIVITIES:
|
||||
|
Proceeds from sale of shares
|
40,088,123
|
|||
|
Cost of shares redeemed
|
(130,522,177
|
)
|
||
|
Cash distributions paid
|
(96,107
|
)
|
||
|
Net cash used in financing activities
|
(90,530,161
|
)
|
||
|
|
||||
|
NET INCREASE IN CASH FOR THE PERIOD
|
–
|
|||
|
|
||||
|
CASH, BEGINNING OF PERIOD
|
$
|
–
|
||
|
CASH, END OF PERIOD
|
$
|
–
|
||
|
|
||||
|
SUPPLEMENTAL DISCLOSURE OF CASH FLOW INFORMATION:
|
||||
|
Non-cash financing activities not included herein consist of reinvestment of distributions of:
|
$
|
1,981,725
|
||
|
See Notes to Financial Statements.
|
|
20
|
www.cogniosfunds.com
|
|
Cognios Market Neutral Large Cap Fund - Investor Class
|
|
Financial Highlights
|
For a share outstanding throughout the periods presented.
|
|
For the Year
Ended September 30, 2017 |
For the Year
Ended September 30, 2016 |
For the Year
Ended September 30, 2015 |
For the Year
Ended September 30, 2014 |
For the Period Ended
September 30, 2013(a) |
||||||||||||||||
|
NET ASSET VALUE, BEGINNING OF PERIOD
|
$
|
9.93
|
$
|
9.68
|
$
|
10.77
|
$
|
9.93
|
$
|
10.00
|
||||||||||
|
INCOME/(LOSS) FROM OPERATIONS:
|
||||||||||||||||||||
|
Net investment loss(b)
|
(0.13
|
)
|
(0.15
|
)
|
(0.20
|
)
|
(0.17
|
)
|
(0.12
|
)
|
||||||||||
|
Net realized and unrealized gain/(loss) on investments
|
(0.33
|
)
|
0.45
|
0.60
|
1.35
|
0.05
|
||||||||||||||
|
Total from investment operations
|
(0.46
|
)
|
0.30
|
0.40
|
1.18
|
(0.07
|
)
|
|||||||||||||
|
LESS DISTRIBUTIONS:
|
||||||||||||||||||||
|
From net realized gains on investments
|
(0.15
|
)
|
(0.05
|
)
|
(1.49
|
)
|
(0.34
|
)
|
–
|
|||||||||||
|
Total distributions
|
(0.15
|
)
|
(0.05
|
)
|
(1.49
|
)
|
(0.34
|
)
|
–
|
|||||||||||
|
NET INCREASE/ (DECREASE) IN NET ASSET VALUE
|
(0.61
|
)
|
0.25
|
(1.09
|
)
|
0.84
|
(0.07
|
)
|
||||||||||||
|
NET ASSET VALUE, END OF PERIOD
|
$
|
9.32
|
$
|
9.93
|
$
|
9.68
|
$
|
10.77
|
$
|
9.93
|
||||||||||
|
TOTAL RETURN(c)
|
(4.65
|
%)
|
3.15
|
%
|
4.47
|
%(d)
|
12.12
|
%
|
(0.70
|
%)
|
||||||||||
|
SUPPLEMENTAL DATA:
|
||||||||||||||||||||
|
Net assets, End of Period (in 000s)
|
$
|
22,997
|
$
|
43,779
|
$
|
6,253
|
$
|
5,699
|
$
|
5,067
|
||||||||||
|
See Notes to Financial Statements.
|
|
Annual Report | September 30, 2017
|
21
|
|
Cognios Market Neutral Large Cap Fund - Investor Class
|
|
Financial Highlights (continued)
|
For a share outstanding throughout the periods presented.
|
|
For the Year Ended
September 30, 2017 |
For the Year Ended
September 30, 2016 |
For the Year Ended
September 30, 2015 |
For the Year Ended
September 30, 2014 |
For the Period Ended
September 30, 2013(a) |
||||||||||||||||
|
RATIOS TO AVERAGE NET ASSETS (including interest expense and dividend expense on securities sold short)
|
||||||||||||||||||||
|
Operating expenses excluding reimbursement/ waiver
|
3.87
|
%
|
4.07
|
%
|
6.06
|
%
|
6.16
|
%
|
6.27
|
%(e)
|
||||||||||
|
Operating expenses including reimbursement/ waiver
|
3.72
|
%
|
3.80
|
%
|
4.12
|
%(f)
|
4.26
|
%
|
4.13
|
%(e)
|
||||||||||
|
Net investment loss including reimbursement/ waiver
|
(1.42
|
%)
|
(1.53
|
%)
|
(2.06
|
%)
|
(1.71
|
%)
|
(1.69
|
%)(e)
|
||||||||||
|
RATIOS TO AVERAGE NET ASSETS (excluding interest expense and dividend expense on securities sold short)
|
||||||||||||||||||||
|
Operating expenses excluding reimbursement/ waiver
|
2.10
|
%
|
2.22
|
%
|
4.04
|
%
|
4.15
|
%
|
4.38
|
%(e)
|
||||||||||
|
Operating expenses including reimbursement/ waiver
|
1.95
|
%
|
1.95
|
%
|
2.10
|
%(f)
|
2.25
|
%
|
2.25
|
%(e)
|
||||||||||
|
Net investment income including reimbursement/ waiver
|
0.35
|
%
|
0.32
|
%
|
(0.04
|
%)
|
0.30
|
%
|
0.19
|
%(e)
|
||||||||||
|
PORTFOLIO TURNOVER RATE(g)
|
277
|
%
|
250
|
%
|
291
|
%
|
461
|
%
|
155
|
%
|
||||||||||
| (a) |
Commenced operations on January 2, 2013.
|
| (b) |
Calculated using the average shares method.
|
| (c) |
Assumes an initial investment on the business day before the first day of the fiscal period, with all dividends and distributions reinvested in additional shares on the reinvestment date, and redemption at the net asset value calculated on the last business day of the fiscal year. Total returns are for the period indicated and have not been annualized. Total returns would have been lower had certain expenses not been waived during the period. Returns shown do not reflect the deduction of taxes that a shareholder would pay on Fund distributions or the redemption of Fund shares.
|
|
See Notes to Financial Statements.
|
|
22
|
www.cogniosfunds.com
|
|
Cognios Market Neutral Large Cap Fund - Investor Class
|
|
Financial Highlights (continued)
|
For a share outstanding throughout the periods presented.
|
| (d) |
In 2015, 0.31% of the Fund's total return consists of a voluntary reimbursement by the adviser for a realized investment loss. Excluding this item, total return would have been 4.16%.
|
| (e) |
Annualized.
|
| (f) |
Contractual expense limitation changed from 2.25% to 1.95% effective April 1, 2015.
|
| (g) |
Portfolio turnover rate for periods less than one full year have not been annualized.
|
|
See Notes to Financial Statements.
|
|
Annual Report | September 30, 2017
|
23
|
|
Cognios Market Neutral Large Cap Fund - Institutional Class
|
|
Financial Highlights
|
For a share outstanding throughout the periods presented.
|
|
For the Year
Ended September 30, 2017 |
For the Year
Ended September 30, 2016 |
For the Year
Ended September 30, 2015 |
For the Year
Ended September 30, 2014 |
For the Period Ended
September 30, 2013(a) |
||||||||||||||||
|
NET ASSET VALUE, BEGINNING OF PERIOD
|
$
|
10.02
|
$
|
9.76
|
$
|
10.82
|
$
|
9.95
|
$
|
10.00
|
||||||||||
|
INCOME/(LOSS) FROM OPERATIONS:
|
||||||||||||||||||||
|
Net investment loss(b)
|
(0.11
|
)
|
(0.13
|
)
|
(0.18
|
)
|
(0.14
|
)
|
(0.10
|
)
|
||||||||||
|
Net realized and unrealized gain/(loss) on investments
|
(0.32
|
)
|
0.44
|
0.61
|
1.35
|
0.05
|
||||||||||||||
|
Total from investment operations
|
(0.43
|
)
|
0.31
|
0.43
|
1.21
|
(0.05
|
)
|
|||||||||||||
|
LESS DISTRIBUTIONS:
|
||||||||||||||||||||
|
From net realized gains on investments
|
(0.15
|
)
|
(0.05
|
)
|
(1.49
|
)
|
(0.34
|
)
|
–
|
|||||||||||
|
Total distributions
|
(0.15
|
)
|
(0.05
|
)
|
(1.49
|
)
|
(0.34
|
)
|
–
|
|||||||||||
|
NET INCREASE/ (DECREASE) IN NET ASSET VALUE
|
(0.58
|
)
|
0.26
|
(1.06
|
)
|
0.87
|
(0.05
|
)
|
||||||||||||
|
NET ASSET VALUE, END OF PERIOD
|
$
|
9.44
|
$
|
10.02
|
$
|
9.76
|
$
|
10.82
|
$
|
9.95
|
||||||||||
|
TOTAL RETURN(c)
|
(4.31
|
%)
|
3.23
|
%
|
4.77
|
%(d)
|
12.41
|
%
|
(0.50
|
%)
|
||||||||||
|
SUPPLEMENTAL DATA:
|
||||||||||||||||||||
|
Net assets, End of Period (in 000s)
|
$
|
38,856
|
$
|
113,499
|
$
|
10,402
|
$
|
8,907
|
$
|
6,128
|
||||||||||
|
See Notes to Financial Statements.
|
|
24
|
www.cogniosfunds.com
|
|
Cognios Market Neutral Large Cap Fund - Institutional Class
|
|
Financial Highlights (continued)
|
For a share outstanding throughout the periods presented.
|
|
For the Year Ended
September 30, 2017 |
For the Year Ended
September 30, 2016 |
For the Year Ended
September 30, 2015 |
For the Year Ended
September 30, 2014 |
For the Period Ended
September 30, 2013(a) |
||||||||||||||||
|
RATIOS TO AVERAGE NET ASSETS (including interest expense and dividend expense on securities sold short)
|
||||||||||||||||||||
|
Operating expenses excluding reimbursement/ waiver
|
3.62
|
%
|
3.83
|
%
|
5.81
|
%
|
5.45
|
%
|
6.02
|
%(e)
|
||||||||||
|
Operating expenses including reimbursement/ waiver
|
3.47
|
%
|
3.55
|
%
|
3.86
|
%(f)
|
4.01
|
%
|
3.88
|
%(e)
|
||||||||||
|
Net investment loss including reimbursement/ waiver
|
(1.14
|
%)
|
(1.30
|
%)
|
(1.80
|
%)
|
(1.37
|
%)
|
(1.42
|
%)(e)
|
||||||||||
|
RATIOS TO AVERAGE NET ASSETS (excluding interest expense and dividend expense on securities sold short)
|
||||||||||||||||||||
|
Operating expenses excluding reimbursement/ waiver
|
1.85
|
%
|
1.98
|
%
|
3.79
|
%
|
3.43
|
%
|
4.13
|
%(e)
|
||||||||||
|
Operating expenses including reimbursement/ waiver
|
1.70
|
%
|
1.70
|
%
|
1.84
|
%(f)
|
2.00
|
%
|
2.00
|
%(e)
|
||||||||||
|
Net investment income including reimbursement/ waiver
|
0.63
|
%
|
0.55
|
%
|
0.21
|
%
|
0.65
|
%
|
0.46
|
%(e)
|
||||||||||
|
PORTFOLIO TURNOVER RATE(g)
|
277
|
%
|
250
|
%
|
291
|
%
|
461
|
%
|
155
|
%
|
||||||||||
| (a) |
Commenced operations on January 2, 2013.
|
| (b) |
Calculated using the average shares method.
|
| (c) |
Assumes an initial investment on the business day before the first day of the fiscal period, with all dividends and distributions reinvested in additional shares on the reinvestment date, and redemption at the net asset value calculated on the last business day of the fiscal year. Total returns are for the period indicated and have not been annualized. Total returns would have been lower had certain expenses not been waived during the period. Returns shown do not reflect the deduction of taxes that a shareholder would pay on Fund distributions or the redemption of Fund shares.
|
| (d) |
In 2015, 0.33% of the Fund's total return consists of a voluntary reimbursement by the adviser for a realized investment loss. Excluding this item, total return would have been 4.44%.
|
|
See Notes to Financial Statements.
|
|
Annual Report | September 30, 2017
|
25
|
|
Cognios Market Neutral Large Cap Fund - Institutional Class
|
|
Financial Highlights (continued)
|
For a share outstanding throughout the periods presented.
|
| (e) |
Annualized.
|
| (f) |
Contractual expense limitation changed from 2.00% to 1.70% effective April 1, 2015.
|
| (g) |
Portfolio turnover rate for periods less than one full year have not been annualized.
|
|
See Notes to Financial Statements.
|
|
26
|
www.cogniosfunds.com
|
|
Cognios Market Neutral Large Cap Fund
|
|
Notes to Financial Statements
|
September 30, 2017
|
1. ORGANIZATION
ALPS Series Trust (the “Trust”), a Delaware statutory trust, is an open-end management investment company registered under the Investment Company Act of 1940, as amended (the “1940 Act”). The Trust consists of multiple separate portfolios or series. This annual report describes the Cognios Market Neutral Large Cap Fund (the “Fund”). The Fund seeks long-term growth of capital independent of stock market direction. The Fund currently offers Investor Class shares and Institutional Class shares. Each share class has identical rights to earnings, assets and voting privileges, except for class specific expenses and exclusive rights to vote on matters affecting only individual classes. The Board of Trustees (the “Board”) may establish additional funds and classes of shares at any time in the future without shareholder approval.
2. SIGNIFICANT ACCOUNTING POLICIES
The accompanying financial statements were prepared in accordance with accounting principles generally accepted in the United States of America for investment companies (“U.S. GAAP”). The Fund is considered an investment company under U.S. GAAP and follows the accounting and reporting guidance applicable to investment companies in the Financial Accounting Standards Board Accounting Standards Codification Topic 946. The preparation of financial statements in conformity with U.S. GAAP requires management to make certain estimates and assumptions that affect the reported amounts of assets and liabilities and disclosures of contingent assets and liabilities at the date of the financial statements and the reported amounts of revenue and expenses during the period. Actual results could differ from those estimates. The following is a summary of significant accounting policies consistently followed by the Fund in preparation of its financial statements.
Investment Valuation: The Fund generally values its securities based on market prices determined at the close of regular trading on the New York Stock Exchange (“NYSE”), normally 4:00 p.m. Eastern Time, on each day the NYSE is open for trading.
Securities traded on a registered U.S. securities exchange (including exchange-traded derivatives other than futures and futures options) are valued based on the last sale price of the security reported on the principal exchange on which it is traded, prior to the time when the Fund’s assets or liabilities are valued. In the case of equity securities not traded on an exchange, or if such closing prices are not otherwise available, the securities are valued at the mean of the most recent bid and ask prices on such day.
Redeemable securities issued by open-end registered investment companies are valued at the investment company’s applicable net asset value, with the exception of exchange-traded open-end investment companies, which are priced as equity securities.
When such prices or quotations are not available, or when the Fair Value Committee appointed by the Board believes that they are unreliable, securities may be priced using fair value procedures approved by the Board.
|
Annual Report | September 30, 2017
|
27
|
|
Cognios Market Neutral Large Cap Fund
|
|
Notes to Financial Statements
|
September 30, 2017
|
Fair Value Measurements: The Fund discloses the classification of its fair value measurements following a three-tier hierarchy based on the inputs used to measure fair value. Inputs refer broadly to the assumptions that market participants would use in pricing the asset or liability, including assumptions about risk. Inputs may be observable or unobservable. Observable inputs reflect the assumptions market participants would use in pricing the asset or liability that are developed based on market data obtained from sources independent of the reporting entity. Unobservable inputs reflect the reporting entity’s own assumptions about the assumptions market participants would use in pricing the asset or liability that are developed based on the best information available.
Various inputs are used in determining the value of the Fund’s investments as of the end of the reporting period. When inputs used fall into different levels of the fair value hierarchy, the level in the hierarchy within which the fair value measurement falls is determined based on the lowest level input that is significant to the fair value measurement in its entirety. The designated input levels are not necessarily an indication of the risk or liquidity associated with these investments. These inputs are categorized in the following hierarchy under applicable financial accounting standards:
| Level 1 – |
Unadjusted quoted prices in active markets for identical investments, unrestricted assets or liabilities that the Fund has the ability to access at the measurement date;
|
| Level 2 – |
Quoted prices which are not active, quoted prices for similar assets or liabilities in active markets or inputs other than quoted prices that are observable (either directly or indirectly); and
|
| Level 3 – |
Significant unobservable prices or inputs (including the Fund’s own assumptions in determining the fair value of investments) where there is little or no market activity for the asset or liability at the measurement date.
|
|
28
|
www.cogniosfunds.com
|
|
Cognios Market Neutral Large Cap Fund
|
|
Notes to Financial Statements
|
September 30, 2017
|
The following is a summary of the inputs used to value the Fund’s investments as of September 30, 2017:
|
Investments in Securities at Value
|
Level 1 - Unadjusted
Quoted Prices |
Level 2 -
Other Significant Observable Inputs |
Level 3 -
Significant Unobservable Inputs |
Total
|
||||||||||||
|
Common Stocks
|
||||||||||||||||
|
Communications
|
$
|
2,084,871
|
$
|
–
|
$
|
–
|
$
|
2,084,871
|
||||||||
|
Consumer Cyclical
|
17,981,588
|
–
|
–
|
17,981,588
|
||||||||||||
|
Consumer Non-cyclical
|
31,588,822
|
–
|
–
|
31,588,822
|
||||||||||||
|
Financials
|
4,114,398
|
–
|
–
|
4,114,398
|
||||||||||||
|
Industrials
|
11,548,660
|
–
|
–
|
11,548,660
|
||||||||||||
|
Technology
|
2,064,814
|
–
|
–
|
2,064,814
|
||||||||||||
|
Utilities
|
7,739,854
|
–
|
–
|
7,739,854
|
||||||||||||
|
Short-Term Investments
|
163,817
|
–
|
–
|
163,817
|
||||||||||||
|
Total
|
$
|
77,286,824
|
$
|
–
|
$
|
–
|
$
|
77,286,824
|
||||||||
|
Investments in Securities at Value
|
Level 1 - Unadjusted
Quoted Prices |
Level 2 -
Other Significant Observable Inputs |
Level 3 -
Significant Unobservable Inputs |
Total
|
||||||||||||
|
Other Financial Instruments
|
||||||||||||||||
|
Liabilities
|
||||||||||||||||
|
Securities Sold Short
|
||||||||||||||||
|
Basic Materials
|
$
|
(721,827
|
)
|
$
|
–
|
$
|
–
|
$
|
(721,827
|
)
|
||||||
|
Communications
|
(2,520,997
|
)
|
–
|
–
|
(2,520,997
|
)
|
||||||||||
|
Consumer Cyclical
|
(3,245,520
|
)
|
–
|
–
|
(3,245,520
|
)
|
||||||||||
|
Consumer Non-cyclical
|
(13,082,944
|
)
|
–
|
–
|
(13,082,944
|
)
|
||||||||||
|
Energy
|
(7,213,252
|
)
|
–
|
–
|
(7,213,252
|
)
|
||||||||||
|
Financials
|
(15,265,102
|
)
|
–
|
–
|
(15,265,102
|
)
|
||||||||||
|
Industrials
|
(4,838,996
|
)
|
–
|
–
|
(4,838,996
|
)
|
||||||||||
|
Technology
|
(1,789,614
|
)
|
–
|
–
|
(1,789,614
|
)
|
||||||||||
|
Utilities
|
(6,354,730
|
)
|
–
|
–
|
(6,354,730
|
)
|
||||||||||
|
Total
|
$
|
(55,032,982
|
)
|
$
|
–
|
$
|
–
|
$
|
(55,032,982
|
)
|
||||||
The Fund recognizes transfers between levels as of the end of the period. For the fiscal year ended September 30, 2017, the Fund did not have any transfers between Level 1 and Level 2 securities. There were no Level 3 securities held during the year.
Trust Expenses: Some expenses of the Trust can be directly attributed to the Fund. Expenses that cannot be directly attributed to the Fund are apportioned among all funds in the Trust based on average net assets of each fund.
|
Annual Report | September 30, 2017
|
29
|
|
Cognios Market Neutral Large Cap Fund
|
|
Notes to Financial Statements
|
September 30, 2017
|
Fund Expenses: Some expenses can be directly attributed to the Fund and are apportioned among the classes based on average net assets of each class.
Class Expenses: Expenses that are specific to a class of shares are charged directly to that share class. Fees provided under the distribution (Rule 12b-1) and/or shareholder service plans for a particular class of the Fund are charged to the operations of such class.
Federal Income Taxes: The Fund complies with the requirements under Subchapter M of the Internal Revenue Code of 1986, as amended, applicable to regulated investment companies and intends to distribute substantially all of its net taxable income and net capital gains, if any, each year so that it will not be subject to excise tax on undistributed income and gains. The Fund is not subject to income taxes to the extent such distributions are made.
As of and during the fiscal year ended September 30, 2017, the Fund did not have a liability for any unrecognized tax benefits in the accompanying financial statements. The Fund recognizes interest and penalties, if any, related to tax liabilities as income tax expense in the Statement of Operations. The Fund files U.S. federal, state and local income tax returns as required. The Fund’s tax returns are subject to examination by the relevant tax authorities until expiration of the applicable statute of limitations, which is generally three years after the filing of the tax return for federal purposes and four years for most state returns. The Fund’s administrator has analyzed the Fund’s tax positions taken on federal and state income tax returns for all open tax years and has concluded that as of September 30, 2017, no provision for income tax is required in the Fund’s financial statements related to these tax positions.
Investment Transactions and Investment Income: Investment transactions are accounted for on the date the investments are purchased or sold (trade date basis). Realized gains and losses from investment transactions are reported on an identified cost basis. Interest income, which includes accretion of discounts and amortization of premiums, is accrued and recorded as earned. Dividend income or expense is recognized on the ex-dividend date. All of the realized and unrealized gains and losses and net investment income are allocated daily to each class in proportion to its average daily net assets.
Distributions to Shareholders: The Fund normally pays dividends and distributes capital gains, if any, on an annual basis. Income dividend distributions are derived from interest and other income the Fund receives from its investments, including short term capital gains. Long term capital gain distributions are derived from gains realized when the Fund sells a security it has owned for more than one year. The Fund may make additional distributions and dividends at other times if its investment advisor believes doing so may be necessary for the Fund to avoid or reduce taxes. Net investment income/(loss) and net realized gain/(loss) may differ for financial statement and tax purposes.
Short Sales: The Fund sells securities short. To do this, Cognios Capital, LLC (the “Adviser”) will borrow and then sell (take short positions in) equity securities of U.S. companies that the Adviser believes are likely to underperform the long positions over time. To complete such a transaction, the Fund must borrow the security to deliver to the buyer. The Fund is obligated to replace the security borrowed by purchasing it in the open market at some later date. The Fund bears the risk of a loss if the market price of the security increases between the date of the short sale and the date on which the Fund replaces the borrowed security. The Fund will realize a gain if the security declines in value between those dates. A realized loss, unlimited in size on a stand alone basis, will be recognized upon the close of a short sale. There can be no assurance that securities necessary to cover a short position will be available for purchase. To mitigate leverage risk, the Fund will segregate liquid assets (which may include its long positions) at least equal to its short position exposure, marked-to-market daily. The Fund maintains collateral consisting of cash, U.S. Government securities or other liquid assets in an amount at least equal to the market value of their respective short positions. The Fund is liable for any dividends or interest payable on securities while those securities are in a short position. The Fund typically intends to hold securities sold short for the long term, therefore, they are included in the purchase and sales of investments in Note 4 and the Fund’s Portfolio Turnover Calculation in the Financial Highlights. As of September 30, 2017, the Fund held securities sold short with a market value of $55,032,982.
|
30
|
www.cogniosfunds.com
|
|
Cognios Market Neutral Large Cap Fund
|
|
Notes to Financial Statements
|
September 30, 2017
|
Credit and Counterparty Risks: The Fund is exposed to credit risk to counterparties with whom it transacts with and also bears the risk of settlement default. The Fund may lose money if the counterparty to a derivative instrument contract, securities sold short, repurchase agreement or securities lending is unable or unwilling to make timely principal and/or interest payments, or to otherwise honor its obligations. Securities are subject to varying degrees of credit risk, which are often reflected in credit ratings. Other than securities sold short, the Fund manages counterparty risk by entering into appropriate legally enforceable master netting agreements, or similar agreements which include provisions for offsetting positions, collateral, or both in the event of counterparty default or nonperformance.
3. TAX BASIS INFORMATION
Tax Basis of Distributions to Shareholders: The character of distributions made during the period from net investment income or net realized gains may differ from its ultimate characterization for federal income tax purposes. Also, due to the timing of dividend distributions, the fiscal year in which amounts are distributed may differ from the fiscal year in which the income or realized gain were recorded by the Fund. The amounts and characteristics of tax basis distributions are estimated at the time of distribution and composition of distributable earnings/(accumulated losses) are finalized at fiscal year-end.
The tax character of distributions paid by the Fund for the fiscal years ended September 30 were as follows:
|
Distributions Paid From:
|
2017
|
2016
|
||||||
|
Ordinary Income
|
$
|
1,595,948
|
$
|
94,002
|
||||
|
Capital Gains
|
481,884
|
–
|
||||||
|
Total
|
$
|
2,077,832
|
$
|
94,002
|
||||
|
Annual Report | September 30, 2017
|
31
|
|
Cognios Market Neutral Large Cap Fund
|
|
Notes to Financial Statements
|
September 30, 2017
|
Reclassifications: As of September 30, 2017, permanent differences in book and tax accounting were reclassified. The following reclassifications have been made on the Statement of Assets and Liabilities and have no impact on the net asset value of the Fund:
|
Paid-in Capital
|
Accumulated Net Investment Loss
|
Accumulated Net Realized Loss on Investments
|
||||||||||
|
|
$
|
(590,126
|
)
|
$
|
725,275
|
$
|
(135,149
|
)
|
||||
These differences were primarily attributable to the differing book and tax treatment of net operating losses and the tax classification of certain investments. Included in the amounts reclassified was a net operating loss offset to Paid-in Capital of $590,027.
Unrealized Appreciation and Depreciation on Investments and Securities Sold Short: As of September 30, 2017, the aggregate cost of investments, gross unrealized appreciation/(depreciation) and net unrealized depreciation of investments and securities sold short for Federal tax purposes were as follows:
|
Gross unrealized appreciation (excess of value over tax cost)(a)
|
$
|
5,448,884
|
||
|
Gross unrealized depreciation (excess of tax cost over value) (a)
|
(6,861,278
|
)
|
||
|
Net unrealized depreciation
|
$
|
(1,412,394
|
)
|
|
|
Cost of investments for income tax purposes
|
$
|
77,882,513
|
| (a) |
Includes appreciation/(depreciation) on securities sold short.
|
Components of Distributable Earnings: As of September 30, 2017, the components of distributable earnings on a tax basis were as follows:
|
Accumulated Capital losses
|
$
|
(8,871,343
|
)
|
|
|
Net unrealized depreciation
|
(1,412,394
|
)
|
||
|
Other cumulative effect of timing differences
|
(675,014
|
)
|
||
|
Total
|
$
|
(10,958,751
|
)
|
Capital Losses: The Fund elects to defer to the period ending September 30, 2018, capital losses recognized during the period November 1, 2016 to September 30, 2017 in the amount of $8,871,343.
The Fund elects to defer to the period ending September 30, 2018, late year ordinary losses in the amount of $674,321.
|
32
|
www.cogniosfunds.com
|
|
Cognios Market Neutral Large Cap Fund
|
|
Notes to Financial Statements
|
September 30, 2017
|
4. SECURITIES TRANSACTIONS
Purchases and sales of securities, excluding securities sold short intended to be held for less than one year and short-term securities, during the fiscal year ended September 30, 2017, were as follows:
|
Purchases of Securities
|
Proceeds from Sales of Securities
|
|||||||
|
|
$
|
641,595,634
|
$
|
691,766,587
|
||||
5. BENEFICIAL SHARE TRANSACTIONS
The capitalization of the Trust consists of an unlimited number of shares of beneficial interest with no par value per share. Holders of the shares of the Fund have one vote for each share held and a proportionate fraction of a vote for each fractional share. All shares issued and outstanding are fully paid and are transferable and redeemable at the option of the shareholder. Shares have no pre-emptive rights. Neither the Fund nor any of its creditors has the right to require shareholders to pay any additional amounts solely because the shareholder owns the shares.
Transactions in common shares were as follows:
|
For the Year
Ended September 30, 2017 |
For the Year
Ended September 30, 2016 |
|||||||
|
Investor Class
|
||||||||
|
Shares sold
|
1,444,959
|
6,180,973
|
||||||
|
Shares issued in reinvestment of distributions to shareholders
|
66,044
|
3,666
|
||||||
|
Shares redeemed
|
(3,454,438
|
)
|
(2,419,405
|
)
|
||||
|
Net increase/(decrease) in shares outstanding
|
(1,943,435
|
)
|
3,765,234
|
|||||
|
Institutional Class
|
||||||||
|
Shares sold
|
2,715,596
|
11,428,697
|
||||||
|
Shares issued in reinvestment of distributions to shareholders
|
140,000
|
5,642
|
||||||
|
Shares redeemed
|
(10,064,766
|
)
|
(1,173,940
|
)
|
||||
|
Net increase/(decrease) in shares outstanding
|
(7,209,170
|
)
|
10,260,399
|
|||||
Control is defined by the 1940 Act as the beneficial ownership, either directly or through one or more controlled companies, of more than 25% of the voting securities of a company. Approximately 66% of the shares outstanding are held within one omnibus account. Share transaction activities of these shareholders could have a material impact on the Fund.
|
Annual Report | September 30, 2017
|
33
|
|
Cognios Market Neutral Large Cap Fund
|
|
Notes to Financial Statements
|
September 30, 2017
|
6. MANAGEMENT AND RELATED PARTY TRANSACTIONS
Investment Advisory: Cognios Capital, LLC, subject to the authority of the Board, is responsible for the overall management and administration of the Fund’s business affairs. The Adviser manages the investments of the Fund in accordance with the Fund’s investment objective, policies and limitations and investment guidelines established jointly by the Adviser and the Board.
Pursuant to the Investment Advisory Agreement (the “Advisory Agreement”) with the Adviser, the Fund pays the Adviser an annual management fee of 1.50% based on the Fund’s average daily net assets. The management fee is paid on a monthly basis. The initial term of the Advisory Agreement was two years. The Board may extend the Advisory Agreement for additional one-year terms. The Board, shareholders of the Fund or the Adviser may terminate the Advisory Agreement upon 60 days’ notice.
Pursuant to a fee waiver letter agreement (the “Fee Waiver Agreement”), the Adviser has agreed contractually to reduce the fees payable to it under the Advisory Agreement (but not below zero) and/or reimburse other expenses of the Fund attributable to services provided by the Fund’s administrator and its affiliates to the extent necessary to limit the Total Annual Fund Operating Expenses of each of the Investor Class and Institutional Class shares of the Fund (exclusive of brokerage costs, interest, taxes, dividends, litigation expenses, indemnification amounts, borrowing costs, brokerage expenses and dividend expenses on securities sold short, distribution/12b-1 fees and extraordinary expenses) to 1.70% of the Fund’s average annual net assets. The Fee Waiver Agreement is in effect through January 31, 2018 and may not be terminated or modified prior to this date except with the approval of the Fund’s Board. The Adviser will be permitted to recover on a class-by-class basis expenses it has borne through the Fee Waiver Agreement to the extent that the Fund’s expenses in later periods fall below the annual rates set forth in the Fee Waiver Agreement. The Fund will not be obligated to pay any recoupable expenses more than three years after the end of the fiscal year in which the fees and expenses were waived or reimbursed. Fees waived or reimbursed for the fiscal year ended September 30, 2017 are disclosed in the Statement of Operations.
As of September 30, 2017, the balances of recoupable expenses for each class were as follows:
|
Expiring in 2018
|
Expiring in 2019
|
Expiring in 2020
|
|
|
Investor Class
|
116,046
|
71,553
|
49,859
|
|
Institutional Class
|
186,946
|
149,854
|
118,298
|
Administrator: ALPS Fund Services, Inc. (“ALPS”) (an affiliate of ALPS Distributors, Inc.) serves as administrator to the Fund. The Fund has agreed to pay expenses incurred in connection with its administrative activities. Pursuant to the Administration, Bookkeeping and Pricing Services Agreement with the Trust, ALPS will provide operational services to the Fund including, but not limited to, fund accounting and fund administration and generally assist in the Fund’s operations. The Fund’s administration fee is accrued on a daily basis and paid monthly. The officers and Interested Trustee of the Trust are employees of ALPS. Administration fees paid by the Fund for the fiscal year ended September 30, 2017 are disclosed in the Statement of Operations. ALPS is reimbursed by the Fund for certain out-of-pocket expenses.
|
34
|
www.cogniosfunds.com
|
|
Cognios Market Neutral Large Cap Fund
|
|
Notes to Financial Statements
|
September 30, 2017
|
Transfer Agent: ALPS serves as transfer agent for the Fund under a Transfer Agency and Services Agreement with the Trust. Under this agreement, ALPS is paid an annual fee for services performed on behalf of the Fund plus fees for open accounts and is reimbursed for certain out-of-pocket expenses.
Compliance Services: ALPS provides services as the Fund’s Chief Compliance Officer to monitor and test the policies and procedures of the Fund in conjunction with requirements under Rule 38a-1 of the 1940 Act pursuant to a Chief Compliance Officer Services Agreement with the Trust. Under this agreement, ALPS is paid an annual fee for services performed on behalf of the Fund and is reimbursed for certain out-of-pocket expenses.
Principal Financial Officer: ALPS receives an annual fee for providing Principal Financial Officer services to the Fund and is reimbursed for certain out-of-pocket expenses.
Distribution: ALPS Distributors, Inc. (the “Distributor”) (an affiliate of ALPS) acts as the principal underwriter of the Fund’s shares pursuant to a Distribution Agreement with the Trust. Shares of the Fund are offered on a continuous basis through the Distributor, as agent of the Fund. The Distributor is not obligated to sell any particular amount of shares and is not entitled to any compensation for its services as the Fund’s principal underwriter pursuant to the Distribution Agreement.
The Fund has adopted a Distribution and Services Plan (the “Plan”) pursuant to Rule 12b-1 of the 1940 Act for its Investor Class shares. The Plan allows the Fund to use Investor Class assets to pay fees in connection with the distribution and marketing of Investor Class shares and/or the provision of shareholder services to Investor Class shareholders. The Plan permits payment for services in connection with the administration of plans or programs that use Investor Class shares of the Fund, if any, as their funding medium and for related expenses. The Plan permits the Fund to make total payments at an annual rate of up to 0.25% of the Fund’s average daily net assets attributable to its Investor Class shares. Because these fees are paid out of the Fund’s Investor Class assets, if any, on an ongoing basis, over time they will increase the cost of an investment in the Investor Class shares, if any, and Plan fees may cost an investor more than other types of sales charges. Plan fees are shown as distribution and service fees on the Statement of Operations.
7. TRUSTEES
As of September 30, 2017, there were four Trustees, three of whom are not “interested persons” (as defined in the 1940 Act) of the Trust (the “Independent Trustees”). Effective October 1, 2016, the Independent Trustees receive a quarterly retainer of $5,000, plus $4,000 for each regular Board or Committee meeting attended, $2,000 for each special telephonic Board or Committee meeting attended and $2,000 for each special in-person Board meeting attended. The Independent Trustees are also reimbursed for all reasonable out-of-pocket expenses relating to attendance at meetings and for meeting-related expenses. Officers of the Trust and Trustees who are interested persons of the Trust receive no salary or fees from the Trust.
|
Annual Report | September 30, 2017
|
35
|
|
Cognios Market Neutral Large Cap Fund
|
|
Notes to Financial Statements
|
September 30, 2017
|
8. INDEMNIFICATIONS
Under the Trust’s organizational documents, its officers and Trustees are indemnified against certain liabilities arising out of the performance of their duties to the Trust. Additionally, in the normal course of business, the Trust enters into contracts with service providers that may contain general indemnification clauses which may permit indemnification to the extent permissible under applicable law. The Trust’s maximum exposure under these arrangements is unknown, as this would involve future claims that may be made against the Trust that have not yet occurred.
9. SUBSEQUENT EVENTS
Subsequent events after the date of the Statement of Assets and Liabilities have been evaluated through the date the financial statements were issued.
Effective November 16, 2017, the Independent Trustees’ quarterly retainer will increase to $6,000 and the Audit Committee Chair will now receive a quarterly retainer of $1,250 and the Independent Chair will receive a quarterly retainer of $2,500. The Independent Trustees will continue to receive $4,000 for each regular Board or Committee meeting attended, $2,000 for each special telephonic Board or Committee meeting attended and $2,000 for each special in-person Board meeting attended. The Independent Trustees will continue to be reimbursed for all reasonable out-of-pocket expenses relating to attendance at meetings and for meeting-related expenses.
Effective November 16, 2017, the Fund’s Adviser has contractually agreed to extend their fee waiver agreement through January 31, 2018.
Management has determined that there were no other subsequent events to report through the issuance of these financial statements.
|
36
|
www.cogniosfunds.com
|
|
Cognios Market Neutral Large Cap Fund
|
|
Report of Independent Registered
|
|
Public Accounting Firm
|
To the Shareholders of Cognios Market Neutral Large Cap Fund and
Board of Trustees of ALPS Series Trust
We have audited the accompanying statement of assets and liabilities, including the portfolio of investments, of Cognios Market Neutral Large Cap Fund (the “Fund”), a series of ALPS Series Trust, as of September 30, 2017, and the related statements of operations, changes in net assets and cash flows, and the financial highlights for the year then ended. These financial statements and financial highlights are the responsibility of the Fund’s management. Our responsibility is to express an opinion on these financial statements and financial highlights based on our audit. The accompanying statement of changes in net assets and financial highlights for the periods ended September 30, 2016 and prior, were audited by other auditors whose report dated December 2, 2016, expressed an unqualified opinion on that financial statement and financial highlights.
We conducted our audit in accordance with the standards of the Public Company Accounting Oversight Board (United States). Those standards require that we plan and perform the audit to obtain reasonable assurance about whether the financial statements and financial highlights are free of material misstatement. An audit includes examining, on a test basis, evidence supporting the amounts and disclosures in the financial statements. Our procedures included confirmation of securities owned as of September 30, 2017, by correspondence with the custodian and brokers. An audit also includes assessing the accounting principles used and significant estimates made by management, as well as evaluating the overall financial statement presentation. We believe that our audit provides a reasonable basis for our opinion.
In our opinion, the financial statements and financial highlights referred to above present fairly, in all material respects, the financial position of Cognios Market Neutral Large Cap Fund as of September 30, 2017, the results of its operations, changes in its net assets and cash flows, and the financial highlights for the year then ended, in conformity with accounting principles generally accepted in the United States of America.
COHEN & COMPANY, LTD.
Cleveland, Ohio
November 29, 2017
|
Annual Report | September 30, 2017
|
37
|
|
Cognios Market Neutral Large Cap Fund
|
|
Additional Information
|
September 30, 2017 (Unaudited)
|
1. PROXY VOTING POLICIES AND VOTING RECORD
A description of the policies and procedures that the Fund uses to determine how to vote proxies relating to portfolio securities is available without charge, upon request, (i) by calling the Fund (toll-free) at 1-855-254-6467, or (ii) on the website of the Securities and Exchange Commission (the “SEC”) at http://www.sec.gov.
Information regarding how the Fund voted proxies relating to portfolio securities during the most recent 12-month period ended June 30 is available (i) without charge, upon request, by calling the Fund (toll-free) at 1-855-254-6467 or (ii) on the SEC’s website at http://www.sec.gov.
2. PORTFOLIO HOLDINGS
The Fund files its complete schedule of portfolio holdings with the SEC for the first and third quarters of each fiscal year on Form N-Q. The Fund’s Forms N-Q are available on the SEC website at http://www.sec.gov. The Fund’s Forms N-Q may be reviewed and copied at the SEC’s Public Reference Room in Washington, D.C., and information on the operation of the Public Reference Room may be obtained by calling 1-800-SEC-0330.
3. CHANGES IN ACCOUNTANTS
On June 5, 2017, KPMG LLP (KPMG) was dismissed as the independent registered public accounting firm of the Trust. In August 2017, the Audit Committee of the Board of Trustees of the Trust recommended the appointment of Cohen & Company, Ltd. (“Cohen”), as the Trust’s independent registered public accounting firm, replacing KPMG LLP, and beginning with the Fund’s financial statements for the fiscal year ended September 30, 2017, and the Board of Trustees approved such appointment.
KPMG’s report on the financial statements of the Fund for each of the fiscal years ended September 30, 2015 and September 30, 2016, did not contain an adverse opinion or a disclaimer of opinion and was not qualified or modified as to uncertainty, audit scope, or accounting principles. During the fiscal years ended September 30, 2015 and September 30, 2016, there were no disagreements between the Fund and KPMG on any matter of accounting principles or practices, financial statement disclosure, or auditing scope or procedure, which disagreement(s), if not resolved to the satisfaction of KPMG, would have caused it to make reference to the subject matter of the disagreement(s) in connection with its reports. During the fiscal years ended September 30, 2015 and September 30, 2016, there were no reportable events as defined in Item 304(a)(1)(v) of Regulation S-K promulgated by the Securities and Exchange Commission.
|
38
|
www.cogniosfunds.com
|
|
Cognios Market Neutral Large Cap Fund
|
|
Additional Information
|
September 30, 2017 (Unaudited)
|
4. TAX DESIGNATIONS
The Fund designates the following for federal income tax purposes for the calendar year ended December 31, 2016:
Qualified Dividend Income 100%
Corporate Dividends Received Deduction 100%
In early 2017, if applicable, shareholders of record should have received this information for the distributions paid to them by the Fund during the calendar year 2016 via Form 1099. The Fund will notify shareholders in early 2018 of amounts paid to them by the Fund, if any, during the calendar year 2017.
Pursuant to Section 852(b)(3) of the Internal Revenue Code, the Cognios Market Neutral Large Cap Fund designated $481,884 as long-term capital gain dividends.
|
Annual Report | September 30, 2017
|
39
|
Cognios Market Neutral Large Cap Fund
|
Trustees and Officers
|
September 30, 2017 (Unaudited)
|
INDEPENDENT TRUSTEES
|
Name,
Birth Year & Address* |
Position(s)Held with Fund
|
Term of
Office and Length of Time Served** |
Principal Occupation(s)
During Past 5 Years*** |
Number of
Funds in Fund Complex Overseen by Trustee**** |
Other
Directorships Held by Trustee During Past 5 Years*** |
|
Ward D. Armstrong
Birth year: 1954
|
Trustee and Chairman
|
Mr. Armstrong was appointed to the Board on May 27, 2016. Mr. Armstrong was appointed Chairman of the Board at the August 24, 2017 meeting of the Board of Trustees.
|
Retired; Managing Partner, NorthRock Partners, LLC (October 2013 to July 2015); Managing Director, NorthRock Partners, a Private Wealth Advisory Practice of Ameriprise Financial (February 2010 to October 2013); Senior Vice President, Ameriprise Financial, Inc. (November 1984 to May 2007); President, American Express Asset Management (2002 to 2004); and Chairman, Ameriprise Trust Company (November 1996 to May 2007).
|
9
|
Mr. Armstrong is a Director of the Heartland Group, Inc. (5 funds).
|
|
*
|
All communications to Trustees and Officers may be directed to ALPS Series Trust c/o 1290 Broadway, Suite 1100, Denver, CO 80203.
|
|
**
|
This is the period for which the Trustee or Officer began serving the Trust. Each Trustee serves an indefinite term, until such Trustee’s successor is elected and appointed, or such Trustee resigns or is deceased. Officers are elected on an annual basis.
|
|
***
|
Except as otherwise indicated, each individual has held the office shown or other offices in the same company for the last five years.
|
|
****
|
The Fund Complex currently consists of 9 series of the Trust and any other investment companies for which Cognios Capital, LLC provides investment advisory services, currently none.
|
|
40
|
www.cogniosfunds.com
|
Cognios Market Neutral Large Cap Fund
|
Trustees and Officers
|
September 30, 2017 (Unaudited)
|
|
Name,
Birth Year & Address* |
Position(s)Held with Fund
|
Term of
Office and Length of Time Served** |
Principal Occupation(s)
During Past 5 Years*** |
Number of
Funds in Fund Complex Overseen by Trustee**** |
Other
Directorships Held by Trustee During Past 5 Years*** |
|
J. Wayne Hutchens
Birth year: 1944
|
Trustee
|
Mr. Hutchens was elected to the Board on October 30, 2012.
|
Mr. Hutchens is currently retired. From April 2006 to December 2012, he served as President and CEO of the University of Colorado (CU) Foundation and from April 2009 to December 2012, he was Executive Director of the CU Real Estate Foundation. Mr. Hutchens is also Trustee of the Denver Museum of Nature and Science (2000 to present), Director of AMG National Trust Bank (June 2012 to present) and Trustee of Children’s Hospital Colorado (May 2012 to present). Prior to these positions, Mr. Hutchens spent 29 years in the banking industry, retiring as Chairman of Chase Bank Colorado.
|
9
|
RiverNorth Opportunity Fund (2013 to present).
|
|
Patrick Seese
Birth year: 1971
|
Trustee
|
Mr. Seese was elected to the Board on October 30, 2012.
|
Mr. Seese is an owner and a Managing Director of Integris Partners, a middle- market investment banking firm serving closely-held companies, financial sponsors and public companies (February 2008 to present). Prior to this, Mr. Seese was a Managing Director of Headwaters MB, a middle-market investing banking firm (December 2003 to February 2008). Prior to that, Mr. Seese worked in Credit Suisse First Boston’s Mergers and Acquisitions Group and served as Head of Corporation Development, Katy Industries, a publicly traded industrial and consumer products company and at Deloitte & Touche LLP, where he began his career in 1994.
|
9
|
None.
|
|
*
|
All communications to Trustees and Officers may be directed to ALPS Series Trust c/o 1290 Broadway, Suite 1100, Denver, CO 80203.
|
|
**
|
This is the period for which the Trustee or Officer began serving the Trust. Each Trustee serves an indefinite term, until such Trustee’s successor is elected and appointed, or such Trustee resigns or is deceased. Officers are elected on an annual basis.
|
|
***
|
Except as otherwise indicated, each individual has held the office shown or other offices in the same company for the last five years.
|
|
****
|
The Fund Complex currently consists of 9 series of the Trust and any other investment companies for which Cognios Capital, LLC provides investment advisory services, currently none.
|
|
Annual Report | September 30, 2017
|
41
|
Cognios Market Neutral Large Cap Fund
|
Trustees and Officers
|
September 30, 2017 (Unaudited)
|
INTERESTED TRUSTEE
|
Name,
Birth Year & Address* |
Position(s) Held with Fund
|
Term of
Office and Length of Time Served** |
Principal Occupation(s)
During Past 5 Years*** |
Number of
Funds in Fund Complex Overseen by Trustee**** |
Other
Directorships Held by Trustee During Past 5 Years*** |
|
Jeremy O. May
Birth year: 1970
|
Trustee and President
|
Mr. May was elected Trustee and President on October 30, 2012. Mr. May was Chairman from October 30, 2012 to August 24, 2017.
|
Mr. May joined ALPS in 1995 and is currently President and Director of ALPS Fund Services, Inc. and ALPS Distributors, Inc., Executive Vice President and Director of ALPS Holdings, Inc. and ALPS Advisors, Inc. and Director of ALPS Portfolio Solutions Distributor, Inc. Because of his positions with these entities, Mr. May is deemed an affiliate of the Trust as defined under the 1940 Act. Mr. May is also the Trustee of the Reaves Utility Income Fund and the ALPS Elevation Trust. Mr. May is also on the Board of Directors of the University of Colorado Foundation and the AV Hunter Trust.
|
9
|
Mr. May is Chairman and Trustee of the Reaves Utility Income Fund (1 fund) and ALPS Elevation Trust (2 ETFs).
|
|
*
|
All communications to Trustees and Officers may be directed to ALPS Series Trust c/o 1290 Broadway, Suite 1100, Denver, CO 80203.
|
|
**
|
This is the period for which the Trustee or Officer began serving the Trust. Each Trustee serves an indefinite term, until such Trustee’s successor is elected and appointed, or such Trustee resigns or is deceased. Officers are elected on an annual basis.
|
|
***
|
Except as otherwise indicated, each individual has held the office shown or other offices in the same company for the last five years.
|
|
****
|
The Fund Complex currently consists of 9 series of the Trust and any other investment companies for which Cognios Capital, LLC provides investment advisory services, currently none.
|
|
42
|
www.cogniosfunds.com
|
Cognios Market Neutral Large Cap Fund
|
Trustees and Officers
|
September 30, 2017 (Unaudited)
|
OFFICERS
|
Name,
Birth Year & Address* |
Position(s)
Held with Fund |
Term of
Office and Length of Time Served** |
Principal Occupation(s) During Past 5 Years***
|
|
Kimberly R. Storms
Birth year: 1972
|
Treasurer
|
Ms. Storms was elected Treasurer of the Trust on October 30, 2012.
|
Ms. Storms is Senior Vice President and Director of Fund Administration of ALPS. Because of her position with ALPS, Ms. Storms is deemed an affiliate of the Trust as defined under the 1940 Act. Ms. Storms is also Treasurer of Financial Investors Trust, Liberty All-Star Equity Fund and Liberty All-Star Growth Fund, Inc.
|
|
Rick Noyes
Birth year: 1970
|
Secretary
|
Mr. Noyes was elected Secretary of the Trust on November 14, 2016
|
Mr. Noyes joined ALPS in 2015 and is Senior Vice President and Director of Legal Administration of ALPS. Prior to joining ALPS, Mr. Noyes served as Assistant Vice President and Senior Counsel of Janus Capital Management LLC. Mr. Noyes is deemed an affiliate of the Trust as defined under the 1940 Act. Mr. Noyes is also Secretary of Westcore Trust.
|
|
Jennifer A. Craig
Birth year: 1973
|
Assistant Secretary
|
Ms. Craig was elected Assistant Secretary of the Trust on May 27, 2016.
|
Ms. Craig joined ALPS in 2007 and is currently Assistant Vice President and Paralegal Manager. Prior to joining ALPS, Ms. Craig was Legal Manager at Janus Capital Management LLC and served as Assistant Secretary of Janus Investment Fund, Janus Adviser Series and Janus Aspen Series. Because of her position with ALPS, Ms. Craig is deemed an affiliate of the Trust as defined under the 1940 Act. Ms. Craig is also Assistant Secretary of Clough Funds Trust, Clough Global Opportunities Fund, Clough Global Allocation Fund, Clough Global Equity Fund and Financial Investors Trust.
|
|
Alan Gattis
Birth year: 1980
|
Assistant Treasurer
|
Mr. Gattis was elected Assistant Treasurer of the Trust on August 9, 2016.
|
Mr. Gattis joined ALPS in 2011 and is currently Vice President and Fund Controller of ALPS. Prior to joining ALPS, Mr. Gattis was an Auditor at Spicer Jeffries LLP (2009 through 2011) and an Auditor at PricewaterhouseCoopers LLP (2004 - 2009). Because of his position with ALPS, Mr. Gattis is deemed an affiliate of the Trust as defined under the 1940 Act. Mr. Gattis is also Assistant Treasurer of Clough Funds Trust, Clough Global Opportunities Fund, Clough Global Allocation Fund, Clough Global Equity Fund, Griffin Institutional Access Real Estate Fund, Stadion Funds and Centaur Mutual Funds Trust.
|
|
Annual Report | September 30, 2017
|
43
|
Cognios Market Neutral Large Cap Fund
|
Trustees and Officers
|
September 30, 2017 (Unaudited)
|
|
Name,
Birth Year & Address* |
Position(s)
Held with Fund |
Term of
Office and Length of Time Served** |
Principal Occupation(s) During Past 5 Years***
|
|
Cory J. Gossard
Birth year: 1972
|
Chief Compliance Officer (“CCO”)
|
Mr. Gossard was elected CCO of the Trust on October 20, 2017.
|
Mr. Gossard oversees all day-to-day compliance aspects of ALPS’ business within Fund CCO Services, Compliance Administration, Risk Management and Assurance Services. Mr. Gossard is deemed an affiliate of the Trust as defined under the 1940 Act. Mr. Gossard also serves as Fund CCO for the SPDR S&P 500 ETF Trust, SPDR DJIA ETF Trust, and SPDR S&P MidCap 400 ETF Trust. Prior to joining ALPS in 2014, Mr. Gossard held a series of progressively responsible roles throughout an 18-year career with Citibank.
|
|
*
|
All communications to Trustees and Officers may be directed to ALPS Series Trust c/o 1290 Broadway, Suite 1100, Denver, CO 80203.
|
|
**
|
This is the period for which the Trustee or Officer began serving the Trust. Each Trustee serves an indefinite term, until such Trustee’s successor is elected and appointed, or such Trustee resigns or is deceased. Officers are elected on an annual basis.
|
|
***
|
Except as otherwise indicated, each individual has held the office shown or other offices in the same company for the last five years.
|
Additional information about members of the Board of Trustees and officers of the Trust is available in the Statement of Additional Information and is available, without charge, upon request, by calling the Fund (toll-free) at 1-855-254-6467.
|
44
|
www.cogniosfunds.com
|


Table of Contents
|
Shareholder Letter
|
1
|
|
Portfolio Update
|
3
|
|
Disclosure of Fund Expenses
|
5
|
|
Portfolio of Investments
|
6
|
|
Statement of Assets and Liabilities
|
11
|
|
Statement of Operations
|
12
|
|
Statements of Changes in Net Assets
|
13
|
|
Statement of Cash Flows
|
14
|
|
Financial Highlights
|
15
|
|
Notes to Financial Statements
|
18
|
|
Report of Independent Registered Public Accounting Firm
|
26
|
|
Additional Information
|
27
|
|
Trustees and Officers
|
30
|
|
DDJ Opportunistic High Yield Fund
|
Shareholder Letter
|
September 30, 2017 (Unaudited)
Message from the President
Since my last letter written in the spring of this year, several markets have continued to produce strong performance. Performance for the market segments on which we primarily focus, namely high yield bonds and leveraged loans, has been positive with the former outperforming the latter. In addition, performance in the domestic equity market in particular has been very strong, supported by the prospects for stronger U.S. economic growth.
At DDJ, we believe that expectations for fundamental improvements in the U.S. economy, including with respect to issuers in the high yield market, remain a major factor in buoying markets at this time. These market expectations remain rooted in the belief that the U.S. will implement significant pro‐growth policies (e.g., tax reform) that we believe will likely serve as a key driver of market performance in the near to intermediate term. Furthermore, continued accommodative monetary policy from central banks globally should further contribute to ongoing fundamental improvements in the U.S. economy and elsewhere. Irrespective of such factors, however, we believe that the current fundamental state of the leveraged credit market is stable; although leverage levels on corporate balance sheets remain elevated relative to historical standards, there has been some improvement in issuer leverage, as well as interest coverage, at the margin. Furthermore, default rates outside of commodity‐related businesses remain below longer‐term averages.
Concurrent with the implementation of any pro‐growth policies that result in fundamental improvements in the U.S. economy together with modest inflationary pressures, DDJ expects that interest rates in the U.S. will continue to gradually increase. During the past twelve months, the high yield market has experienced a fair amount of spread tightening, and the positive economic effects from both fiscal and monetary policies alike have the potential to result in further, albeit a likely modest, narrowing of high yield spreads. That being said, the success of any fiscal policy initiatives promoted by the current presidential administration is at the mercy of the heightened level of polarization in Washington. For example, although we believe that tax reform will eventually pass, the initial responses to the opening tax reform proposal have been less than enthusiastic. Likewise, the ongoing investigation into Russian involvement in the U.S. election may further sidetrack or altogether hinder the GOP‐controlled Congress and the Trump administration from accomplishing their stated legislative priorities. As a result, DDJ cannot rule out downside risks (e.g., the failure of major policy initiatives, in particular tax reform, or the implementation of a protectionist agenda that adversely affects international trade) that could cause economic growth to suffer, high yield spreads to widen, and the Federal Reserve to alter its expected path with respect to measured interest rate hikes.
Although the high yield market has experienced a period of relatively low volatility in 2017, DDJ believes that there exists the possibility of volatility increasing quickly in the near‐to‐intermediate term, especially as market participants react to “noise” regarding the status, depth, and expected timeframe of critical governmental policies. Furthermore, in recent years, volatility in oil prices has negatively affected the performance of the high yield market. Any event that places renewed pressure on oil prices, such as OPEC abandoning its oil production cut targets or the U.S. continuing to increase its shale production, is likely to translate into further volatility in the high yield market. In an effort to somewhat insulate the portfolio from short‐term market dislocations caused by such volatility, DDJ maintains a significant allocation to bank loans in the Fund, which are senior in the capital structure and generally exhibit less price volatility than high yield bonds.
The Fund outperformed the BofA Merrill Lynch U.S. High Yield Non‐Financials Index for the past six and twelve months ending September 30, 2017, respectively. This outperformance was driven in part by the Fund’s income advantage relative to the index, which DDJ believes the Fund will typically exhibit as a result of its higher average coupon. Furthermore, the Fund’s persistent overweight to CCC‐rated bonds and B‐rated bonds, which are a direct result of DDJ’s investment philosophy predicated on the belief that the lower‐tier segment of the high yield market (rated B and below) offers the most attractive investment opportunities in such market, resulted in significant positive contributions over the period as CCC‐rated bonds outperformed their BB‐rated and B‐rated counterparts during the period. In addition, the Fund also benefitted from strong relative performance by its Automotive and Healthcare sector holdings, as well as its underweight to the Retail sector.
DDJ remains focused on maintaining a yield premium in the Fund relative to the broader high yield market, while at the same time investing in credits that our research demonstrates have a better fundamental profile than that of the overall high yield market. Generally speaking, the high yield bonds and leveraged loans held by the Fund display less sensitivity to movements in the overall high yield bond and loan market as a result of its focus on less followed, middle market companies; this typically is true regardless of whether the market is producing gains or losses. By adhering to our investment philosophy and process, we believe that the Fund will be well positioned to withstand short‐term price movements and accordingly outperform its benchmark with less volatility over the long term. Regardless of the state of the leveraged credit markets, DDJ will continue to apply our bottom‐up fundamental research process to identify those credits that offer the most attractive risk‐versus‐reward in an effort to outperform the broader high yield market over a full credit cycle.
Sincerely,

David J. Breazzano
President, Chief Investment Officer and Portfolio Manager
DDJ Capital Management, LLC
DDJ Capital Management, LLC
|
Annual Report | September 30, 2017
|
1
|
|
DDJ Opportunistic High Yield Fund
|
Shareholder Letter
|
||
September 30, 2017 (Unaudited)
The views and information discussed in this commentary are as of the date of publication, are subject to change, and may not reflect the writer’s current views. The views expressed are those of the Fund’s adviser only, and represent an assessment of market conditions at a specific point in time, are opinions only and should not be relied upon as investment advice regarding a particular investment or markets in general. Such information does not constitute a recommendation to buy or sell specific securities or investment vehicles. It should not be assumed that any investment will be profitable or will equal the performance of the fund(s) or any securities or any sectors mentioned in this letter. The subject matter contained in this letter has been derived from several sources believed to be reliable and accurate at the time of compilation. Neither the Fund nor the Adviser accepts any liability for losses either direct or consequential caused by the use of this information.
Credit ratings are measured on a scale that generally ranges from AAA (highest) to D (lowest). All Fund securities except for those labeled “Not Rated” and “Other” have been rated by Moody’s, S&P or Fitch, which are each a Nationally Recognized Statistical Rating Organization (“NRSRO”). All Index securities except for those labeled “Not Rated” have been rated by Moody’s or S&P. Credit ratings are subject to change. One cannot invest directly into an index.
Not FDIC Insured – No Bank Guarantee – May Lose Value
Past performance does not guarantee future results.
ALPS Distributors, Inc. is not affiliated with DDJ Capital Management, LLC.
|
2
|
www.ddjcap.com
|
|
DDJ Opportunistic High Yield Fund
|
Portfolio Update
|
|
September 30, 2017 (Unaudited)
Average Annual Total Returns (as of September 30, 2017)
|
3 Month
|
6 Month
|
1 Year
|
Since Inception*
|
|
|
DDJ Opportunistic High Yield Fund – Institutional Class
|
2.22%
|
5.45%
|
12.73%
|
8.62%
|
|
DDJ Opportunistic High Yield Fund – Class I
|
2.16%
|
5.47%
|
12.74%
|
8.60%
|
|
DDJ Opportunistic High Yield Fund – Class II
|
2.13%
|
5.36%
|
12.38%
|
8.30%
|
|
BofA ML U.S. High Yield Non‐Financial Index(a)
|
2.04%
|
4.08%
|
8.96%
|
7.21%
|
The performance data quoted above represents past performance. Past performance is not a guarantee of future results. Investment return and value of the Fund shares will fluctuate so that an investor’s shares, when sold or redeemed, may be worth more or less than their original cost. Performance may be lower or higher than performance data quoted. Fund performance current to the most recent month-end is available by calling (844) 363-4898 or by visiting www.ddjfunds.com.
| * |
Fund’s inception date is July 16, 2015.
|
|
(a)
|
The BofA Merrill Lynch U.S. High Yield Non-Financial Index is a subset of The BofA Merrill Lynch US High Yield Index but that excludes all securities of financial issuers.
|
Returns of less than 1 year are cumulative.
Indices are not actively managed and do not reflect deduction for fees, expenses or taxes. An investor cannot invest directly in an index.
The returns shown above do not reflect the deduction of taxes a shareholder would pay on Fund distributions or redemption of Fund shares.
The total annual operating expenses and total annual operating expenses after fee waivers and/or reimbursement you may pay as an investor in the Fund’s Institutional Class, Class I and Class II shares (as reported in the January 28, 2017 Prospectus) are 5.19% and 5.10%, 6.18% and 0.79% and 0.89% and 1.14% respectively. The Fund’s investment adviser has contractually agreed to limit expenses through January 31, 2018.
Performance of $10,000 Initial Investment (as of September 30, 2017)
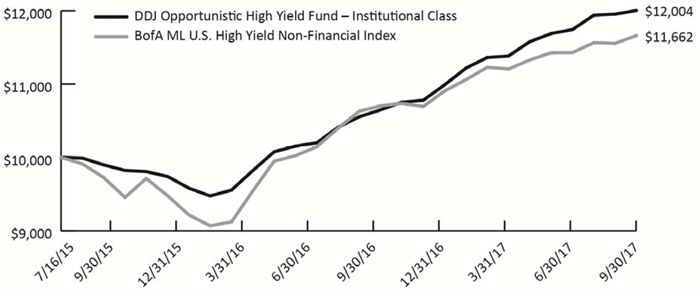
The graph shown above represents historical performance of a hypothetical investment of $10,000 in the Fund since inception. Past performance does not guarantee future results. All returns reflect reinvested dividends, but do not reflect the deduction of taxes that a shareholder would pay on Fund distributions or the redemption of Fund shares.
|
Annual Report | September 30, 2017
|
3
|
|
DDJ Opportunistic High Yield Fund
|
Portfolio Update
|
|
September 30, 2017 (Unaudited)
Top Ten Holdings (as a % of Net Assets)*
|
Cleaver‐Brooks, Inc.
|
3.96%
|
|
Foresight Energy LLC / Foresight Energy
|
3.50%
|
|
Tenet Healthcare Corp.
|
3.23%
|
|
U.S. Renal Care, Inc. ‐ Term Loan (Second Lien)
|
2.79%
|
|
Berlin Packaging LLC ‐ Initial Term Loan (Second Lien)
|
2.75%
|
|
American Tire Distributors, Inc.
|
2.74%
|
|
Century Aluminum Co.
|
2.73%
|
|
TransDigm, Inc.
|
2.68%
|
|
Alliant Holdings Intermediate LLC
|
2.64%
|
|
Fairmount Santrol, Inc. (Fairmount Minerals, Ltd.) – New Tranche B‐2 Term Loan
|
2.58%
|
|
Top Ten Holdings
|
29.60%
|
|
*
|
Holdings are subject to change, and may not reflect the current or future position of the portfolio. Tables present indicative values only.
|
Portfolio Composition (as a % of Net Assets)*
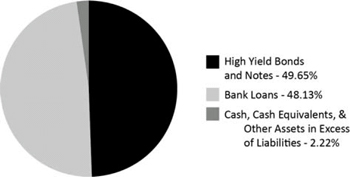
|
4
|
www.ddjcap.com
|
|
DDJ Opportunistic High Yield Fund
|
Disclosure of Fund Expenses
|
September 30, 2017 (Unaudited)
Examples. As a shareholder of the DDJ Opportunistic High Yield Fund (the “Fund”), you incur two types of costs: (1) transaction costs, including applicable redemption fees; and (2) ongoing costs, including management fees, distribution and service (12b‐1) fees and other Fund expenses. The following examples are intended to help you understand your ongoing costs (in dollars) of investing in the Fund and to compare these costs with the ongoing costs of investing in other mutual funds. The examples are based on an investment of $1,000 invested on April 1, 2017 and held through September 30, 2017.
Actual Expenses. The first line under each class in the table below provides information about actual account values and actual expenses. You may use the information in this line, together with the amount you invested, to estimate the expenses that you paid over the period. Simply divide your account value by $1,000 (for example, an $8,600 account value divided by $1,000 = 8.6), then multiply the result by the number in the first line under the heading “Expenses Paid During Period April 1, 2017 – September 30, 2017” to estimate the expenses you paid on your account during this period.
Hypothetical Example for Comparison Purposes. The second line under each class in the table below provides information about hypothetical account values and hypothetical expenses based on the Fund’s actual expense ratio and an assumed rate of return of 5% per year before expenses, which is not the Fund’s actual return. The hypothetical account values and expenses may not be used to estimate the actual ending account balance or expenses you paid for the period. You may use this information to compare the ongoing costs of investing in the Fund and other mutual funds. To do so, compare this 5% hypothetical example with the 5% hypothetical examples that appear in the shareholder reports of the other funds.
Please note that the expenses shown in the table are meant to highlight your ongoing Fund costs only and do not reflect any transactional costs, such as redemption fees. Therefore, the second line under each class in the table below is useful in comparing ongoing costs only and will not help you determine the relative total costs of owning different funds. In addition, if these transactional costs were included, your costs would have been higher.
|
Beginning Account Value April 1, 2017
|
Ending Account Value September 30, 2017
|
Expense
Ratio(a) |
Expense Paid During Period April 1, 2017 - September 30, 2017(b)
|
|
|
DDJ Opportunistic High Yield Fund
|
||||
|
Institutional Class
|
||||
|
Actual
|
$1,000.00
|
$1,054.50
|
0.79%
|
$4.07
|
|
Hypothetical (5% return before expenses)
|
$1,000.00
|
$1,021.11
|
0.79%
|
$4.00
|
|
Class I
|
||||
|
Actual
|
$1,000.00
|
$1,054.70
|
0.71%
|
$3.66
|
|
Hypothetical (5% return before expenses)
|
$1,000.00
|
$1,021.51
|
0.71%
|
$3.60
|
|
Class II
|
||||
|
Actual
|
$1,000.00
|
$1,053.60
|
0.99%
|
$5.10
|
|
Hypothetical (5% return before expenses)
|
$1,000.00
|
$1,020.10
|
0.99%
|
$5.01
|
|
(a)
|
The Fund's expense ratios have been annualized based on the Fund's most recent fiscal half-year expenses after any applicable waivers and reimbursements.
|
|
(b)
|
Expenses are equal to the Fund's annualized expense ratio multiplied by the average account value over the period, multiplied by the number of days in the most recent fiscal half year (183), divided by 365.
|
|
Annual Report | September 30, 2017
|
5
|
|
DDJ Opportunistic High Yield Fund
|
Portfolio of Investments
|
September 30, 2017
|
Rate
|
Maturity Date
|
Principal Amount
|
Value (Note 2)
|
|||||||||
|
BANK LOANS (48.13%)
|
||||||||||||
|
Basic Materials (2.12%)
|
||||||||||||
|
New Arclin U.S. Holding Corp. - Second Lien Term Loan
|
3M US L + 8.75%,
1.00% Floor |
02/14/2025
|
$
|
30,000
|
$
|
30,413
|
||||||
|
Optima Specialty Steel, Inc. - DIP Loan(a)(b)(c)(d)(e)
|
3M US L + 9.00%,
1.00% Floor |
10/31/2017
|
140,000
|
140,000
|
||||||||
|
Total Basic Materials
|
170,413
|
|||||||||||
|
Communications (5.82%)
|
||||||||||||
|
Ancestry.com Operations, Inc. - Term Loan (Second Lien)
|
3M US L + 8.25%,
1.00% Floor |
10/19/2024
|
42,000
|
42,735
|
||||||||
|
Getty Images, Inc. - Initial Term Loan(a)
|
3M US L + 3.50%,
1.25% Floor |
10/18/2019
|
178,984
|
155,371
|
||||||||
|
MH Sub I LLC (Micro Holding Corp.) - Initial Term Loan (Second Lien)(a)
|
3M US L + 7.50%,
1.00% Floor |
09/15/2025
|
90,000
|
89,625
|
||||||||
|
Ten-X LLC - Term Loan (Second Lien)(b)(c)(e)
|
3M US L + 8.00%,
1.00% Floor |
09/26/2025
|
180,000
|
180,000
|
||||||||
|
Total Communications
|
467,731
|
|||||||||||
|
Consumer Discretionary (2.25%)
|
||||||||||||
|
KUEHG Corp. (MergerSub, Inc.) - Tranche B Term Loan (Second Lien)(c)
|
3M US L + 8.25%,
1.00% Floor |
08/22/2025
|
70,000
|
70,000
|
||||||||
|
NVA Holdings, Inc. - Term Loan (Second Lien)
|
3M US L + 7.00%,
1.00% Floor |
08/14/2022
|
110,000
|
110,963
|
||||||||
|
Total Consumer Discretionary
|
180,963
|
|||||||||||
|
Consumer Staples (1.18%)
|
||||||||||||
|
PFS Holdings Corporation - Term Loan (Second Lien)(e)
|
3M US L + 7.25%,
1.00% Floor |
01/31/2022
|
110,000
|
94,985
|
||||||||
|
Total Consumer Staples
|
94,985
|
|||||||||||
|
Consumer, Cyclical (8.02%)
|
||||||||||||
|
DexKo Global, Inc. - Term B Loan (Second Lien)(b)(c)
|
3M US L + 8.25%,
1.00% Floor |
07/24/2025
|
110,000
|
110,000
|
||||||||
|
Genoa Healthcare - Initial Term Loan (Second Lien)(c)
|
3M US L + 8.00%,
1.00% Floor |
10/28/2024
|
90,000
|
92,475
|
||||||||
|
National Vision, Inc. - Initial Term Loan (Second Lien)(c)
|
3M US L + 5.75%,
1.00% Floor |
03/11/2022
|
205,000
|
200,899
|
||||||||
|
Parq Holdings, Ltd. - Closing Date Term Loan (First Lien)(b)(c)
|
3M US L + 7.50%,
1.00% Floor |
12/17/2020
|
160,317
|
160,317
|
||||||||
|
Truck Hero, Inc. - Term Loan (Second Lien)(c)
|
3M US L + 8.25%,
1.00% Floor |
04/21/2025
|
80,000
|
80,800
|
||||||||
|
Total Consumer, Cyclical
|
644,491
|
|||||||||||
See Notes to Financial Statements.
|
6
|
www.ddjcap.com
|
|
DDJ Opportunistic High Yield Fund
|
Portfolio of Investments
|
September 30, 2017
|
Rate
|
Maturity Date
|
Principal Amount
|
Value (Note 2)
|
|||||||||
|
Consumer, Non-cyclical (12.06%)
|
||||||||||||
|
Aveanna Healthcare LLC (BCPE Eagle Buyer LLC) - Term Loan (Second Lien)(c)
|
3M US L + 8.00%,
1.00% Floor |
10/31/2017
|
$
|
120,000
|
$
|
120,300
|
||||||
|
Heartland Dental LLC - Term Loan (Second Lien)
|
3M US L + 8.50%,
1.00% Floor |
07/31/2024
|
150,000
|
151,688
|
||||||||
|
Lanai Holdings II, Inc. - Initial Term Loan (First Lien)(a)
|
3M US L + 4.75%,
1.00% Floor |
08/29/2022
|
80,000
|
77,750
|
||||||||
|
Lanai Holdings III, Inc. - Initial Term Loan (Second Lien)(e)
|
3M US L + 8.50%,
1.00% Floor |
08/28/2023
|
160,000
|
157,199
|
||||||||
|
Opal Acquisition, Inc. - Term B Loan
|
3M US L + 4.00%,
1.00% Floor |
11/27/2020
|
9,974
|
9,423
|
||||||||
|
Packaging Coordinators Midco, Inc. - Term Loan (Second Lien)(b)(c)
|
3M US L + 8.75%,
1.00% Floor |
06/29/2024
|
140,000
|
139,300
|
||||||||
|
Parfums Holding Company, Inc. -Term Loan (Second Lien)
|
3M US L + 8.75%,
1.00% Floor |
06/30/2025
|
90,000
|
88,350
|
||||||||
|
U.S. Renal Care, Inc. - Term Loan (Second Lien)(a)
|
3M US L + 8.00%,
1.00% Floor |
12/29/2017
|
230,000
|
224,537
|
||||||||
|
Total Consumer, Non-cyclical
|
968,547
|
|||||||||||
|
Financials (1.01%)
|
||||||||||||
|
Focus Financial Partners, LLC - Term Loan (Second Lien)(c)
|
3M US L + 7.50%,
1.00% Floor |
10/03/2017
|
80,000
|
81,400
|
||||||||
|
Total Financials
|
81,400
|
|||||||||||
|
Health Care (0.88%)
|
||||||||||||
|
PharMerica Corp. - Term Loan (Second Lien)(a)
|
3M US L + 8.25%,
1.00% Floor |
09/26/2025
|
70,000
|
70,525
|
||||||||
|
Total Health Care
|
70,525
|
|||||||||||
|
Industrials (5.29%)
|
||||||||||||
|
Berlin Packaging LLC - Initial Term Loan (Second Lien)
|
3M US L + 6.75%,
1.00% Floor |
09/30/2022
|
220,000
|
220,962
|
||||||||
|
Engineered Machinery Holdings, Inc. - Delayed Draw Term Loan (Second Lien)(d)
|
3M US L + 7.25%,
1.00% Floor |
07/18/2025
|
7,447
|
7,503
|
||||||||
|
Engineered Machinery Holdings, Inc. - Initial Term Loan (Second Lien)
|
3M US L + 7.25%,
1.00% Floor |
07/18/2025
|
62,553
|
63,022
|
||||||||
|
Lully Finance S.A.R.L. (Lully Finance) - Initial Term B-1 Loan (Second Lien)(c)
|
3M US L + 8.50%,
1.00% Floor |
10/16/2023
|
60,000
|
57,600
|
||||||||
|
SRS Distribution, Inc. - Initial Term Loan (Second Lien)
|
3M US L + 8.75%,
1.00% Floor |
02/24/2023
|
30,000
|
30,863
|
||||||||
|
Utex Industries, Inc. - Initial Loan (Second Lien)
|
1M US L + 7.25%,
1.00% Floor |
05/20/2022
|
50,000
|
45,113
|
||||||||
|
Total Industrials
|
425,063
|
|||||||||||
|
Materials (3.95%)
|
||||||||||||
|
Avantor Performance Materials Holdings, LLC - Initial Term Loan (Second Lien)(c)
|
3M US L + 8.25%,
1.00% Floor |
03/10/2025
|
97,490
|
97,734
|
||||||||
|
Fairmount Santrol, Inc. (Fairmount Minerals, Ltd.) - New Tranche B-2 Term Loan(a)
|
3M US L + 3.50%,
1.00% Floor |
09/05/2019
|
208,434
|
207,001
|
||||||||
|
Miami Valley Steel Services, Inc. - Term Loan(b)(c)(e)
|
3M US L + 9.00%,
1.00% Floor |
01/20/2023
|
13,000
|
13,000
|
||||||||
|
Total Materials
|
317,735
|
|||||||||||
See Notes to Financial Statements.
|
Annual Report | September 30, 2017
|
7
|
|
DDJ Opportunistic High Yield Fund
|
Portfolio of Investments
|
September 30, 2017
|
Rate
|
Maturity Date
|
Principal Amount
|
Value (Note 2)
|
|||||||||
|
Technology (5.55%)
|
||||||||||||
|
Evergreen Skills Lux S.A.R.L. - Initial Term Loan (First Lien)
|
3M US L + 4.75%,
1.00% Floor |
04/28/2021
|
$
|
166,856
|
$
|
158,175
|
||||||
|
Evergreen Skills Lux S.A.R.L. - Initial Term Loan (Second Lien)
|
3M US L + 8.25%,
1.00% Floor |
04/28/2022
|
119,990
|
98,742
|
||||||||
|
Optiv, Inc. - Initial Term Loan (Second Lien)
|
3M US L + 7.25%,
1.00% Floor |
01/31/2025
|
40,000
|
37,150
|
||||||||
|
Peak 10 Holding Corp. - Initial Term Loan (Second Lien)
|
3M US L + 7.25%,
1.00% Floor |
08/01/2025
|
110,000
|
110,871
|
||||||||
|
TierPoint LLC - Initial Term Loan (Second Lien)
|
3M US L + 7.25%,
1.00% Floor |
05/05/2025
|
40,000
|
40,817
|
||||||||
|
Total Technology
|
445,755
|
|||||||||||
|
TOTAL BANK LOANS
(Cost $3,802,972) |
3,867,608
|
|||||||||||
|
HIGH YIELD BONDS AND NOTES (49.65%)
|
||||||||||||
|
Basic Materials (6.90%)
|
||||||||||||
|
Century Aluminum Co.(e)(f)
|
7.500%
|
06/01/2021
|
215,000
|
219,300
|
||||||||
|
Hexion, Inc.
|
6.625%
|
04/15/2020
|
210,000
|
189,000
|
||||||||
|
Optima Specialty Steel, Inc.(b)(c)(e)(g)(h)
|
12.000%
|
12/30/2016
|
150,000
|
146,145
|
||||||||
|
Total Basic Materials
|
554,445
|
|||||||||||
|
Communications (1.90%)
|
||||||||||||
|
Urban One, Inc.(f)
|
9.250%
|
02/15/2020
|
160,000
|
152,400
|
||||||||
|
Total Communications
|
152,400
|
|||||||||||
|
Consumer, Cyclical (2.74%)
|
||||||||||||
|
American Tire Distributors, Inc.(f)
|
10.250%
|
03/01/2022
|
210,000
|
220,038
|
||||||||
|
Total Consumer, Cyclical
|
220,038
|
|||||||||||
|
Consumer, Non-cyclical (9.61%)
|
||||||||||||
|
Opal Acquisition, Inc., Series AI
|
||||||||||||
|
7.500%
|
07/01/2024
|
204,000
|
199,919
|
|||||||||
|
10.000%
|
10/01/2024
|
166,000
|
144,213
|
|||||||||
|
Surgery Center Holdings, Inc.(f)
|
8.875%
|
04/15/2021
|
160,000
|
168,400
|
||||||||
|
Tenet Healthcare Corp.
|
6.750%
|
06/15/2023
|
270,000
|
259,538
|
||||||||
|
Total Consumer, Non-cyclical
|
772,070
|
|||||||||||
|
Diversified (1.89%)
|
||||||||||||
|
HRG Group, Inc.
|
7.750%
|
01/15/2022
|
145,000
|
152,069
|
||||||||
|
Total Diversified
|
152,069
|
|||||||||||
|
Energy (8.55%)
|
||||||||||||
|
Foresight Energy LLC / Foresight Energy(a)(f)
|
11.500%
|
04/01/2023
|
320,000
|
281,600
|
||||||||
|
Forum Energy Technologies, Inc., Series WI
|
6.250%
|
10/01/2021
|
100,000
|
100,750
|
||||||||
|
Jones Energy Holdings LLC / Jones Energy Finance Corp.
|
||||||||||||
|
6.750%
|
04/01/2022
|
20,000
|
16,450
|
|||||||||
|
9.250%
|
03/15/2023
|
20,000
|
16,700
|
|||||||||
|
Resolute Energy Corp.
|
8.500%
|
05/01/2020
|
80,000
|
81,800
|
||||||||
|
SESI LLC
|
7.125%
|
12/15/2021
|
185,000
|
189,625
|
||||||||
|
Total Energy
|
686,925
|
|||||||||||
See Notes to Financial Statements.
|
8
|
www.ddjcap.com
|
|
DDJ Opportunistic High Yield Fund
|
Portfolio of Investments
|
September 30, 2017
|
Rate
|
Maturity Date
|
Principal Amount
|
Value (Note 2)
|
|||||||||
|
Financials (2.64%)
|
||||||||||||
|
Alliant Holdings Intermediate LLC(f)
|
8.250%
|
08/01/2023
|
$
|
200,000
|
$
|
211,958
|
||||||
|
Total Financials
|
211,958
|
|||||||||||
|
Industrials (13.65%)
|
||||||||||||
|
Cleaver-Brooks, Inc.(f)
|
8.750%
|
12/15/2019
|
310,000
|
318,524
|
||||||||
|
Material Sciences Corp.(b)(c)(e)(i)
|
9.000% Cash +
5.00% PIK% |
06/22/2022
|
102,656
|
97,010
|
||||||||
|
Optimas OE Solutions Holding LLC / Optimas OE Solutions, Inc.(f)
|
8.625%
|
06/01/2021
|
190,000
|
186,200
|
||||||||
|
Real Alloy Holding, Inc.(f)
|
10.000%
|
01/15/2019
|
175,000
|
165,375
|
||||||||
|
TransDigm, Inc.
|
6.375%
|
06/15/2026
|
210,000
|
215,645
|
||||||||
|
Xerium Technologies, Inc.
|
9.500%
|
08/15/2021
|
110,000
|
114,125
|
||||||||
|
Total Industrials
|
1,096,879
|
|||||||||||
|
Utilities (1.77%)
|
||||||||||||
|
Calpine Corp.
|
5.750%
|
01/15/2025
|
150,000
|
142,313
|
||||||||
|
Total Utilities
|
142,313
|
|||||||||||
|
TOTAL HIGH YIELD BONDS AND NOTES (Cost $3,830,668)
|
3,989,097
|
|||||||||||
|
Shares
|
Value (Note 2)
|
|||||||
|
WARRANT (0.09%)
|
||||||||
|
Industrials (0.09%)
|
||||||||
|
Material Sciences Corp., Strike Price: $0.01, Expires 12/22/2036(b)(c)(e)(j)
|
5,549
|
7,436
|
||||||
|
TOTAL WARRANT (Cost $9,863)
|
7,436
|
|||||||
|
TOTAL INVESTMENTS (97.87%) (Cost $7,643,503)
|
$ |
7,864,141
|
||||||
|
Other Assets In Excess Of Liabilities (2.13%)
|
170,805
|
|||||||
|
NET ASSETS (100.00%)
|
$ |
8,034,946
|
||||||
| (a) |
All or a portion of this position has not settled as of September 30, 2017. The interest rate shown represents the stated spread over the London Interbank Offered Rate ("LIBOR" or "L") or the applicable LIBOR floor; the Fund will not accrue interest until the settlement date, at which point LIBOR will be established.
|
| (b) |
Fair valued security under the procedures approved by the Fund's Board of Trustees.
|
| (c) |
As a result of the use of significant unobservable inputs to determine fair value, these investments have been classified as Level 3 assets. See also footnote 2 to the financial statements for additional information.
|
| (d) |
A portion of this position was not funded as of September 30, 2017. The Fund had approximately $79,600 in unfunded commitments pursuant to a DIP Loan facility and a Delayed Draw Term Loan facility. The Portfolio of Investments records each of these investments as fully funded and accordingly, a corresponding payable for investments purchased has also been recorded which represents the actual unfunded amount on the balance sheet date.
|
| (e) |
Security deemed to be illiquid under the procedures approved by the Fund's Board of Trustees. As of September 30, 2017, the market value of illiquid securities was $1,055,075, representing 13.13% of the Fund's net assets.
|
| (f) |
Security exempt from registration under Rule 144A of the Securities Act of 1933. This security may be resold in transactions exempt from registration, normally to qualified institutional buyers. As of September 30, 2017, the market value of securities restricted under Rule 144A was $1,923,795, representing 23.94% of the Fund's net assets. These securities have been determined to be liquid pursuant to procedures adopted by the Board.
|
See Notes to Financial Statements.
|
Annual Report | September 30, 2017
|
9
|
|
DDJ Opportunistic High Yield Fund
|
Portfolio of Investments
|
September 30, 2017
|
(g)
|
Security deemed to be restricted as of September 30, 2017. As of September 30, 2017 the market value of restricted securities was $146,145, representing 1.82% of the Fund’s net assets. Additional information on restricted securities can be found in Note 2. Significant Accounting Policies.
|
|
(h)
|
Security is currently in default.
|
|
(i)
|
Payment in-kind.
|
|
(j)
|
Non-income producing security.
|
Investment Abbreviations:
DIP - Debtor-in-possession
LIBOR - London Interbank Offered Rate
PIK - Payment in-kind
LIBOR Rates:
1M US L - 1 Month LIBOR as of September 30, 2017 was 1.23%
3M US L - 3 Month LIBOR as of September 30, 2017 was 1.33%
For Fund compliance purposes, the Fund's industry classifications refer to any one or more of the industry sub-classifications used by one or more widely recognized market indices or ratings group indices, and/or as defined by Fund's management. This definition may not apply for purposes of this report, which may combine industry sub-classifications for reporting ease. Industries are shown as a percentage of the Fund's net assets. (Unaudited)
See Notes to Financial Statements.
|
10
|
www.ddjcap.com
|
|
DDJ Opportunistic High Yield Fund
|
Statement of Assets and Liabilities
|
September 30, 2017
|
ASSETS:
|
||||
|
Investments, at value (Cost $7,643,503)
|
$
|
7,864,141
|
||
|
Cash and cash equivalents
|
343,437
|
|||
|
Receivable for investments sold
|
465,676
|
|||
|
Interest receivable
|
105,486
|
|||
|
Receivable due from adviser
|
17,140
|
|||
|
Prepaid expenses
|
21,438
|
|||
|
Total Assets
|
8,817,318
|
|||
|
LIABILITIES:
|
||||
|
Payable for investments purchased
|
729,775
|
|||
|
Payable for administration and transfer agency fees
|
22,189
|
|||
|
Payable for distribution and services fees
|
||||
|
Class I
|
446
|
|||
|
Class II
|
136
|
|||
|
Payable for 12b-1 fees
|
||||
|
Class II
|
40
|
|||
|
Trustees' fees and expenses payable
|
44
|
|||
|
Payable for Chief Compliance Officer fees
|
1,667
|
|||
|
Payable for legal fees
|
3,572
|
|||
|
Payable for audit and tax fees
|
20,000
|
|||
|
Accrued expenses and other liabilities
|
4,503
|
|||
|
Total Liabilities
|
782,372
|
|||
|
NET ASSETS
|
$
|
8,034,946
|
||
|
NET ASSETS CONSIST OF:
|
||||
|
Paid-in capital (Note 5)
|
$
|
7,731,711
|
||
|
Accumulated net investment income
|
12,711
|
|||
|
Accumulated net realized gain
|
69,886
|
|||
|
Net unrealized appreciation
|
220,638
|
|||
|
NET ASSETS
|
$
|
8,034,946
|
||
|
PRICING OF SHARES
|
||||
|
Institutional Class:
|
||||
|
Net Asset Value, offering and redemption price per share
|
$
|
10.04
|
||
|
Net Assets
|
$
|
7,101,163
|
||
|
Shares of beneficial interest outstanding
|
706,959
|
|||
|
Class I:
|
||||
|
Net Asset Value, offering and redemption price per share
|
$
|
10.04
|
||
|
Net Assets
|
$
|
732,452
|
||
|
Shares of beneficial interest outstanding
|
72,925
|
|||
|
Class II:
|
||||
|
Net Asset Value, offering and redemption price per share
|
$
|
10.04
|
||
|
Net Assets
|
$
|
201,331
|
||
|
Shares of beneficial interest outstanding
|
20,044
|
|||
Commitments and Contingencies (Note 8)
See Notes to Financial Statements.
|
Annual Report | September 30, 2017
|
11
|
|
DDJ Opportunistic High Yield Fund
|
Statement of Operations
|
For the Year Ended September 30, 2017
|
INVESTMENT INCOME:
|
||||
|
Interest income
|
$
|
739,850
|
||
|
Total Investment Income
|
739,850
|
|||
|
EXPENSES:
|
||||
|
Investment advisory fees (Note 6)
|
54,708
|
|||
|
Administrative fees
|
157,182
|
|||
|
Distribution and service fees
|
||||
|
Class I
|
60
|
|||
|
Class II
|
16
|
|||
|
12b-1 fees
|
||||
|
Class II
|
320
|
|||
|
Transfer agent fees
|
41,062
|
|||
|
Legal fees
|
5,009
|
|||
|
Audit and tax fees
|
24,300
|
|||
|
Printing fees
|
2,620
|
|||
|
Insurance fees
|
309
|
|||
|
Custody fees
|
5,806
|
|||
|
Trustees' fees and expenses
|
1,049
|
|||
|
Chief Compliance Officer fees
|
20,000
|
|||
|
State registration fees
|
39,030
|
|||
|
Other expenses
|
9,365
|
|||
|
Total Expenses
|
360,836
|
|||
|
Less fees waived/reimbursed by investment adviser (Note 6)
|
||||
|
Institutional Class
|
(267,174
|
)
|
||
|
Class I
|
(26,613
|
)
|
||
|
Class II
|
(4,896
|
)
|
||
|
Net Expenses
|
62,153
|
|||
|
NET INVESTMENT INCOME
|
677,697
|
|||
|
REALIZED AND UNREALIZED GAIN ON INVESTMENTS:
|
||||
|
Net realized gain on:
|
||||
|
Investments
|
70,887
|
|||
|
Net realized gain
|
70,887
|
|||
|
Net change in unrealized appreciation on:
|
||||
|
Investments
|
166,494
|
|||
|
Net Change
|
166,494
|
|||
|
NET REALIZED AND UNREALIZED GAIN ON INVESTMENTS
|
237,381
|
|||
|
NET INCREASE IN NET ASSETS RESULTING FROM OPERATIONS
|
$
|
915,078
|
||
See Notes to Financial Statements.
|
12
|
www.ddjcap.com
|
|
DDJ Opportunistic High Yield Fund
|
Statements of Changes in Net Assets
|
|
For the
Year Ended September 30, 2017 |
For the
Year Ended September 30, 2016 |
|||||||
|
OPERATIONS:
|
||||||||
|
Net investment income
|
$
|
677,697
|
$
|
582,816
|
||||
|
Net realized gain
|
70,887
|
59,028
|
||||||
|
Net change in unrealized appreciation
|
166,494
|
132,770
|
||||||
|
Net increase in net assets resulting from operations
|
915,078
|
774,614
|
||||||
|
DISTRIBUTIONS TO SHAREHOLDERS:
|
||||||||
|
Dividends to shareholders from net investment income
|
||||||||
|
Institutional Class
|
(610,670
|
)
|
(527,986
|
)
|
||||
|
Class I
|
(60,815
|
)
|
(27,106
|
)
|
||||
|
Class II
|
(10,856
|
)
|
(7,007
|
)
|
||||
|
Dividends to shareholders from net realized gains
|
||||||||
|
Institutional Class
|
(71,297
|
)
|
–
|
|||||
|
Class I
|
(7,300
|
)
|
–
|
|||||
|
Class II
|
(1,192
|
)
|
–
|
|||||
|
Total distributions
|
(762,130
|
)
|
(562,099
|
)
|
||||
|
BENEFICIAL SHARE TRANSACTIONS (NOTE 5):
|
||||||||
|
Institutional Class
|
||||||||
|
Shares sold
|
80,081
|
5,150,155
|
||||||
|
Dividends reinvested
|
671,353
|
399,517
|
||||||
|
Shares redeemed
|
(1,702,459
|
)
|
(788,988
|
)
|
||||
|
Net Increase/(Decrease) from beneficial share transactions
|
(951,025
|
)
|
4,760,684
|
|||||
|
Class I
|
||||||||
|
Shares sold
|
–
|
500,000
|
||||||
|
Dividends reinvested
|
68,115
|
27,106
|
||||||
|
Net Increase from beneficial share transactions
|
68,115
|
527,106
|
||||||
|
Class II
|
||||||||
|
Shares sold
|
81,617
|
–
|
||||||
|
Dividends reinvested
|
12,048
|
7,007
|
||||||
|
Shares redeemed
|
(621
|
)
|
–
|
|||||
|
Net Increase from beneficial share transactions
|
93,044
|
7,007
|
||||||
|
Net increase/(decrease) in net assets
|
(636,918
|
)
|
5,507,312
|
|||||
|
NET ASSETS:
|
||||||||
|
Beginning of year
|
8,671,864
|
3,164,552
|
||||||
|
End of year (Including accumulated net investment income/(loss) of $12,711 and $16,355)
|
$
|
8,034,946
|
$
|
8,671,864
|
||||
See Notes to Financial Statements.
|
Annual Report | September 30, 2017
|
13
|
|
DDJ Opportunistic High Yield Fund
|
Statement of Cash Flows
|
For the Year Ended September 30, 2017
|
CASH FLOWS FROM OPERATING ACTIVITIES:
|
||||
|
Net increase in net assets resulting from operations
|
$
|
915,078
|
||
|
Adjustments to reconcile net increase in net assets resulting from operations to net cash provided by operating activities
|
||||
|
Purchase of investment securities
|
(6,592,300
|
)
|
||
|
Proceeds from disposition of investment securities
|
7,510,384
|
|||
|
Amortization of premium and accretion of discount on investments
|
(97,296
|
)
|
||
|
Net realized (gain)/loss on:
|
||||
|
Investments
|
(70,887
|
)
|
||
|
Net change in unrealized (appreciation)/depreciation on:
|
||||
|
Investments
|
(166,494
|
)
|
||
|
(Increase)/Decrease in assets:
|
||||
|
Receivable for investments sold
|
(369,935
|
)
|
||
|
Receivable due from adviser
|
11,529
|
|||
|
Interest receivable
|
47,241
|
|||
|
Prepaid expenses
|
(5,605
|
)
|
||
|
Increase/(Decrease) in liabilities:
|
||||
|
Payable for investments purchased
|
371,100
|
|||
|
Payable for 12b-1 fees
|
18
|
|||
|
Payable for distribution and service fees
|
76
|
|||
|
Payable for administration and transfer agency fees
|
771
|
|||
|
Payable for trustees' fees and expenses
|
44
|
|||
|
Payable for Chief Compliance Officer fees
|
(1,666
|
)
|
||
|
Payable for legal fees
|
539
|
|||
|
Payable for audit and tax fees
|
(3,500
|
)
|
||
|
Accrued expenses and other liabilities
|
82
|
|||
|
Net cash provided by operating activities
|
1,549,179
|
|||
|
CASH FLOWS FROM FINANCING ACTIVITIES:
|
||||
|
Proceeds from sale of shares
|
161,698
|
|||
|
Payment on shares redeemed
|
(1,703,080
|
)
|
||
|
Net cash distributions paid
|
(10,614
|
)
|
||
|
Net cash used in financing activities
|
(1,551,996
|
)
|
||
|
Net change in cash & cash equivalents
|
(2,817
|
)
|
||
|
Cash & cash equivalents, beginning of year
|
$
|
346,254
|
||
|
Cash & cash equivalents, end of year
|
$
|
343,437
|
||
|
Non-cash financing activities not included herein consist of reinvestment of distributions of:
|
$
|
751,516
|
||
See Notes to Financial Statements.
|
14
|
www.ddjcap.com
|
|
DDJ Opportunistic High Yield Fund
|
Financial Highlights
|
|
Institutional Class
|
For a Share Outstanding Throughout the Periods Presented
|
|
For the Year
Ended September 30, 2017 |
For the Year
Ended September 30, 2016 |
For the Period Ended
September 30, 2015(a) |
||||||||||
|
NET ASSET VALUE, BEGINNING OF PERIOD
|
$
|
9.84
|
$
|
9.76
|
$
|
10.00
|
||||||
|
INCOME/(LOSS) FROM INVESTMENT OPERATIONS:
|
||||||||||||
|
Net investment income(b)
|
0.87
|
0.72
|
0.08
|
|||||||||
|
Net realized and unrealized gain/(loss) on investments
|
0.33
|
0.06
|
(0.26
|
)
|
||||||||
|
Total from investment operations
|
1.20
|
0.78
|
(0.18
|
)
|
||||||||
|
LESS DISTRIBUTIONS:
|
||||||||||||
|
From net investment income
|
(0.89
|
)
|
(0.70
|
)
|
(0.06
|
)
|
||||||
|
From net realized gains
|
(0.11
|
)
|
–
|
–
|
||||||||
|
Total distributions
|
(1.00
|
)
|
(0.70
|
)
|
(0.06
|
)
|
||||||
|
NET INCREASE/(DECREASE) IN NET ASSET VALUE
|
0.20
|
0.08
|
(0.24
|
)
|
||||||||
|
NET ASSET VALUE, END OF PERIOD
|
$
|
10.04
|
$
|
9.84
|
$
|
9.76
|
||||||
|
TOTAL RETURN(c)
|
12.73
|
%
|
8.41
|
%
|
(1.77
|
)%
|
||||||
|
SUPPLEMENTAL DATA:
|
||||||||||||
|
Net assets, end of period (000s)
|
$
|
7,101
|
$
|
7,916
|
$
|
2,968
|
||||||
|
RATIOS TO AVERAGE NET ASSETS
|
||||||||||||
|
Operating expenses excluding reimbursement/waiver
|
4.61
|
%
|
5.19
|
%
|
14.66
|
%(d)
|
||||||
|
Operating expenses including reimbursement/waiver
|
0.79
|
%
|
0.79
|
%
|
0.79
|
%(d)
|
||||||
|
Net investment income – including reimbursement/waiver
|
8.67
|
%
|
7.55
|
%
|
3.71
|
%(d)
|
||||||
|
PORTFOLIO TURNOVER RATE(e)
|
86
|
%
|
72
|
%
|
4
|
%
|
||||||
| (a) |
Commenced operations on July 17, 2015.
|
| (b) |
Calculated using the average shares method.
|
| (c) |
Assumes an initial investment on the business day before the first day of the fiscal period, with all dividends and distributions reinvested in additional shares on the reinvestment date, and redemption at the net asset value calculated on the last business day of the fiscal year. Total returns are for the period indicated and have not been annualized. Total returns would have been lower had certain expenses not been waived during the period. Returns shown do not reflect the deduction of taxes that a shareholder would pay on Fund distributions or the redemption of Fund shares.
|
| (d) |
Annualized.
|
| (e) |
Portfolio turnover rate for periods less than one full year have not been annualized.
|
See Notes to Financial Statements.
|
Annual Report | September 30, 2017
|
15
|
|
DDJ Opportunistic High Yield Fund
|
Financial Highlights
|
|
Class I
|
For a Share Outstanding Throughout the Periods Presented
|
|
For the Year Ended
September 30, 2017 |
For the Year Ended
September 30, 2016 |
For the Period Ended
September 30, 2015(a) |
||||||||||
|
NET ASSET VALUE, BEGINNING OF PERIOD
|
$
|
9.84
|
$
|
9.76
|
$
|
10.00
|
||||||
|
INCOME/(LOSS) FROM INVESTMENT OPERATIONS:
|
||||||||||||
|
Net investment income(b)
|
0.86
|
0.73
|
0.07
|
|||||||||
|
Net realized and unrealized gain/(loss) on investments
|
0.33
|
0.05
|
(0.24
|
)
|
||||||||
|
Total from investment operations
|
1.19
|
0.78
|
(0.17
|
)
|
||||||||
|
LESS DISTRIBUTIONS:
|
||||||||||||
|
From net investment income
|
(0.88
|
)
|
(0.70
|
)
|
(0.07
|
)
|
||||||
|
From net realized gains
|
(0.11
|
)
|
–
|
–
|
||||||||
|
Total distributions
|
(0.99
|
)
|
(0.70
|
)
|
(0.07
|
)
|
||||||
|
NET INCREASE/(DECREASE) IN NET ASSET VALUE
|
0.20
|
0.08
|
(0.24
|
)
|
||||||||
|
NET ASSET VALUE, END OF PERIOD
|
$
|
10.04
|
$
|
9.84
|
$
|
9.76
|
||||||
|
TOTAL RETURN(c)
|
12.63
|
%
|
8.43
|
%
|
(1.76
|
)%
|
||||||
|
SUPPLEMENTAL DATA:
|
||||||||||||
|
Net assets, end of period (000s)
|
$
|
732
|
$
|
650
|
$
|
98
|
||||||
|
RATIOS TO AVERAGE NET ASSETS
|
||||||||||||
|
Operating expenses excluding reimbursement/waiver
|
4.63
|
%
|
5.10
|
%
|
14.74
|
%(d)
|
||||||
|
Operating expenses including reimbursement/waiver
|
0.80
|
%(e)
|
0.89
|
%
|
0.89
|
%(d)
|
||||||
|
Net investment income – including reimbursement/waiver
|
8.66
|
%
|
7.55
|
%
|
3.47
|
%(d)
|
||||||
|
PORTFOLIO TURNOVER RATE(f)
|
86
|
%
|
72
|
%
|
4
|
%
|
||||||
| (a) |
Commenced operations on July 17, 2015.
|
| (b) |
Calculated using the average shares method.
|
| (c) |
Assumes an initial investment on the business day before the first day of the fiscal period, with all dividends and distributions reinvested in additional shares on the reinvestment date, and redemption at the net asset value calculated on the last business day of the fiscal year. Total returns are for the period indicated and have not been annualized. Total returns would have been lower had certain expenses not been waived during the period. Returns shown do not reflect the deduction of taxes that a shareholder would pay on Fund distributions or the redemption of Fund shares.
|
| (d) |
Annualized.
|
| (e) |
According to the Fund's shareholder services plan with respect to the Fund's Class I shares, any amount of such payment not paid during the Fund's fiscal year for such services activities shall be reimbursed to the Fund as soon as practical after the end of the fiscal year. Fees were reimbursed to the Fund during the year ended September 30, 2017, for the prior fiscal year in the amount of 0.09% of average net assets of Class I shares.
|
| (f) |
Portfolio turnover rate for periods less than one full year have not been annualized.
|
See Notes to Financial Statements.
|
16
|
www.ddjcap.com
|
|
DDJ Opportunistic High Yield Fund
|
Financial Highlights
|
|
Class II
|
For a Share Outstanding Throughout the Periods Presented
|
|
|
For the Year Ended September 30, 2017 |
For the Year Ended September 30, 2016 |
For the Period Ended September 30, 2015(a) |
|||||||||
|
NET ASSET VALUE, BEGINNING OF PERIOD
|
$
|
9.83
|
$
|
9.76
|
$
|
10.00
|
||||||
|
INCOME/(LOSS) FROM INVESTMENT OPERATIONS:
|
||||||||||||
|
Net investment income(b)
|
0.84
|
0.68
|
0.07
|
|||||||||
|
Net realized and unrealized gain/(loss) on investments
|
0.32
|
0.06
|
(0.25
|
)
|
||||||||
|
Total from investment operations
|
1.16
|
0.74
|
(0.18
|
)
|
||||||||
|
LESS DISTRIBUTIONS:
|
||||||||||||
|
From net investment income
|
(0.84
|
)
|
(0.67
|
)
|
(0.06
|
)
|
||||||
|
From net realized gains
|
(0.11
|
)
|
–
|
–
|
||||||||
|
Total distributions
|
(0.95
|
)
|
(0.67
|
)
|
(0.06
|
)
|
||||||
|
NET INCREASE/(DECREASE) IN NET ASSET VALUE
|
0.21
|
0.07
|
(0.24
|
)
|
||||||||
|
NET ASSET VALUE, END OF PERIOD
|
$
|
10.04
|
$
|
9.83
|
$
|
9.76
|
||||||
|
TOTAL RETURN(c)
|
12.38
|
%
|
8.06
|
%
|
(1.80
|
)%
|
||||||
|
SUPPLEMENTAL DATA:
|
||||||||||||
|
Net assets, end of period (000s)
|
$
|
201
|
$
|
106
|
$
|
98
|
||||||
|
RATIOS TO AVERAGE NET ASSETS
|
||||||||||||
|
Operating expenses excluding reimbursement/waiver
|
4.86
|
%
|
6.18
|
%
|
14.99
|
%(d)
|
||||||
|
Operating expenses including reimbursement/waiver
|
1.05
|
%(e)
|
1.14
|
%
|
1.14
|
%(d)
|
||||||
|
Net investment income – including reimbursement/waiver
|
8.41
|
%
|
7.15
|
%
|
3.22
|
%(d)
|
||||||
|
PORTFOLIO TURNOVER RATE(f)
|
86
|
%
|
72
|
%
|
4
|
%
|
||||||
| (a) |
Commenced operations on July 17, 2015.
|
| (b) |
Calculated using the average shares method.
|
| (c) |
Assumes an initial investment on the business day before the first day of the fiscal period, with all dividends and distributions reinvested in additional shares on the reinvestment date, and redemption at the net asset value calculated on the last business day of the fiscal year. Total returns are for the period indicated and have not been annualized. Total returns would have been lower had certain expenses not been waived during the period. Returns shown do not reflect the deduction of taxes that a shareholder would pay on Fund distributions or the redemption of Fund shares.
|
| (d) |
Annualized.
|
| (e) |
According to the Fund's shareholder services plan with respect to the Fund's Class II shares, any amount of such payment not paid during the Fund's fiscal year for such services activities shall be reimbursed to the Fund as soon as practical after the end of the fiscal year. Fees were reimbursed to the Fund during the year ended September 30, 2017, for the prior fiscal year in the amount of 0.09% of average net assets of Class II shares.
|
| (f) |
Portfolio turnover rate for periods less than one full year have not been annualized.
|
See Notes to Financial Statements.
|
Annual Report | September 30, 2017
|
17
|
|
DDJ Opportunistic High Yield Fund
|
Notes to Financial Statements
|
September 30, 2017
1. ORGANIZATION
ALPS Series Trust (the “Trust”), a Delaware statutory trust, is an open‐end management investment company registered under the Investment Company Act of 1940, as amended (the “1940 Act”). The Trust consists of multiple separate portfolios or series. This annual report describes the DDJ Opportunistic High Yield Fund (the “Fund”). The Fund’s primary investment objective is overall total return consisting of a high level of current income together with long‐term capital appreciation. The Fund currently offers Class I shares, Class II shares and Institutional Class shares. Each share class has identical rights to earnings, assets and voting privileges, except for class specific expenses and exclusive rights to vote on matters affecting only individual classes. The Board of Trustees (the “Board”) may establish additional funds and classes of shares at any time in the future without shareholder approval.
2. SIGNIFICANT ACCOUNTING POLICIES
The accompanying financial statements were prepared in accordance with accounting principles generally accepted in the United States of America for investment companies (“U.S. GAAP”). The Fund is considered an investment company under U.S. GAAP and follows the accounting and reporting guidance applicable to investment companies in the Financial Accounting Standards Board Accounting Standards Codification Topic 946. The preparation of financial statements in conformity with U.S. GAAP requires management to make certain estimates and assumptions that affect the reported amounts of assets and liabilities and disclosures of contingent assets and liabilities at the date of the financial statements and the reported amounts of revenue and expenses during the period. Actual results could differ from those estimates. The following is a summary of significant accounting policies consistently followed by the Fund in preparation of its financial statements.
Investment Valuation: The Fund generally values its securities based on market prices determined at the close of regular trading on the New York Stock Exchange (“NYSE”), normally 4:00 p.m. Eastern Time, on each day the NYSE is open for trading.
For equity securities and mutual funds that are traded on an exchange, the market price is usually the closing sale or official closing price on that exchange. In the case of equity securities not traded on an exchange, or if such closing prices are not otherwise available, the securities are valued at the mean of the most recent bid and ask prices on such day.
The market price for debt obligations is generally the price supplied by an independent third‐party pricing service approved by the Board, which may use a matrix, formula or other objective method that takes into consideration quotations from dealers, market transactions in comparable investments, market indices and yield curves. If vendors are unable to supply a price, or if the price supplied is deemed to be unreliable, the market price may be determined using quotations received from one or more broker‐dealers that make a market in the security.
Loans are primarily valued by using a composite loan price from a nationally recognized loan pricing service. The methodology used by the Funds’ nationally recognized loan pricing provider for composite loan prices is to value loans at the mean of the bid and ask prices from one or more third party pricing services or dealers.
Redeemable securities issued by open‐end registered investment companies are valued at the investment company’s applicable net asset value, with the exception of exchange‐traded open‐end investment companies, which are priced as equity securities.
When such prices or quotations are not available, or when the Fair Value Committee appointed by the Board believes that they are unreliable, securities may be priced using fair value procedures approved by the Board.
Fair Value Measurements: The Fund discloses the classification of its fair value measurements following a three‐tier hierarchy based on the inputs used to measure fair value. Inputs refer broadly to the assumptions that market participants would use in pricing the asset or liability, including assumptions about risk. Inputs may be observable or unobservable. Observable inputs reflect the assumptions market participants would use in pricing the asset or liability that are developed based on market data obtained from sources independent of the reporting entity. Unobservable inputs reflect the reporting entity’s own assumptions about the assumptions market participants would use in pricing the asset or liability that are developed based on the best information available.
Various inputs are used in determining the value of the Fund’s investments as of the end of the reporting period. When inputs used fall into different levels of the fair value hierarchy, the level in the hierarchy within which the fair value measurement falls is determined based on the lowest level input that is significant to the fair value measurement in its entirety. The designated input levels are not necessarily an indication of the risk or liquidity associated with these investments. These inputs are categorized in the following hierarchy under applicable financial accounting standards:
|
18
|
www.ddjcap.com
|
|
DDJ Opportunistic High Yield Fund
|
Notes to Financial Statements
|
September 30, 2017
|
Level 1 –
|
Unadjusted quoted prices in active markets for identical investments, unrestricted assets or liabilities that the Fund has the ability to access at the measurement date;
|
|
|
Level 2 –
|
Quoted prices which are not active, quoted prices for similar assets or liabilities in active markets or inputs other than quoted prices that are observable (either directly or indirectly); and
|
|
|
Level 3 –
|
Significant unobservable prices or inputs (including the Fund’s own assumptions in determining the fair value of investments) where there is little or no market activity for the asset or liability at the measurement date.
|
The following is a summary of the inputs used to value the Fund’s investments as of September 30, 2017:
|
Investments in Securities at Value
|
Level 1 - Unadjusted
Quoted Prices |
Level 2 - Other Significant Observable Inputs |
Level 3 -
Significant Unobservable Inputs |
Total
|
||||||||||||
|
Bank Loans
|
||||||||||||||||
|
Basic Materials
|
$
|
–
|
$
|
30,413
|
$
|
140,000
|
$
|
170,413
|
||||||||
|
Communications
|
–
|
287,731
|
180,000
|
467,731
|
||||||||||||
|
Consumer Discretionary
|
–
|
110,963
|
70,000
|
180,963
|
||||||||||||
|
Consumer Staples
|
–
|
94,985
|
–
|
94,985
|
||||||||||||
|
Consumer, Cyclical
|
–
|
–
|
644,491
|
644,491
|
||||||||||||
|
Consumer, Non‐cyclical
|
–
|
708,947
|
259,600
|
968,547
|
||||||||||||
|
Financials
|
–
|
–
|
81,400
|
81,400
|
||||||||||||
|
Health Care
|
–
|
70,525
|
–
|
70,525
|
||||||||||||
|
Industrials
|
–
|
367,463
|
57,600
|
425,063
|
||||||||||||
|
Materials
|
–
|
207,001
|
110,734
|
317,735
|
||||||||||||
|
Technology
|
–
|
445,755
|
–
|
445,755
|
||||||||||||
|
High Yield Bonds And Notes
|
||||||||||||||||
|
Basic Materials
|
–
|
408,300
|
146,145
|
554,445
|
||||||||||||
|
Communications
|
–
|
152,400
|
–
|
152,400
|
||||||||||||
|
Consumer, Cyclical
|
–
|
220,038
|
–
|
220,038
|
||||||||||||
|
Consumer, Non‐cyclical
|
–
|
772,070
|
–
|
772,070
|
||||||||||||
|
Diversified
|
–
|
152,069
|
–
|
152,069
|
||||||||||||
|
Energy
|
–
|
686,925
|
–
|
686,925
|
||||||||||||
|
Financials
|
–
|
211,958
|
–
|
211,958
|
||||||||||||
|
Industrials
|
–
|
999,869
|
97,010
|
1,096,879
|
||||||||||||
|
Utilities
|
–
|
142,313
|
–
|
142,313
|
||||||||||||
|
Warrant
|
||||||||||||||||
|
Industrials
|
–
|
–
|
7,436
|
7,436
|
||||||||||||
|
TOTAL
|
$
|
–
|
$
|
6,069,725
|
$
|
1,794,416
|
$
|
7,864,141
|
||||||||
|
Annual Report | September 30, 2017
|
19
|
|
DDJ Opportunistic High Yield Fund
|
Notes to Financial Statements
|
September 30, 2017
The Fund recognizes transfers between levels as of the end of the period. For the fiscal year ended September 30, 2017, the Fund did not have any transfers between Level 1 and Level 2 securities. The following is a reconciliation of assets in which Level 3 inputs were used in determining value:
|
DDJ Opportunistic High Yield Fund
|
High Yield Bonds
|
Bank Loans
|
Warrant
|
Total
|
||||||||||||
|
Balance as of September 30, 2016
|
$
|
128,250
|
$
|
1,090,830
|
$
|
–
|
$
|
1,219,080
|
||||||||
|
Accrued discount/ premium
|
910
|
5,172
|
–
|
6,082
|
||||||||||||
|
Return of Capital
|
–
|
–
|
–
|
–
|
||||||||||||
|
Realized Gain/(Loss)
|
–
|
8,179
|
–
|
8,179
|
||||||||||||
|
Change in Unrealized Appreciation/(Depreciation)
|
21,203
|
21,573
|
(2,427
|
)
|
40,349
|
|||||||||||
|
Purchases
|
92,792
|
1,094,908
|
9,863
|
1,197,563
|
||||||||||||
|
Sales Proceeds
|
–
|
(553,600
|
)
|
–
|
(553,600
|
)
|
||||||||||
|
Transfer into Level 3
|
–
|
258,499
|
–
|
258,499
|
||||||||||||
|
Transfer out of Level 3
|
–
|
(381,736
|
)
|
–
|
(381,736
|
)
|
||||||||||
|
Balance as of September 30, 2017
|
$
|
243,155
|
$
|
1,543,825
|
$
|
7,436
|
$
|
1,794,416
|
||||||||
|
Net change in unrealized appreciation/(depreciation) included in the Statements of Operations attributable to Level 3 investments held at September 30, 2017
|
$
|
21,203
|
$
|
28,020
|
$
|
(2,427
|
)
|
$
|
46,796
|
|||||||
Information about Level 3 measurements as of September 30, 2017:
|
Asset Class
|
Market Value
|
Valuation Technique(s)
|
Unobservable Input(s)(a)
|
Value/Range
|
|||
|
Bank Loans
|
$ |
602,617
|
Market Analysis
|
Market Data of Similar Companies
|
N/A
|
||
|
Bank Loans
|
$ |
801,208
|
Third‐Party Vendor Pricing Service
|
Vendor Quotes
|
N/A
|
||
|
Bank Loans
|
$ |
140,000
|
Market Analysis, Discounted Cash Flow Analysis
|
Discount Rate, EBITDA Multiple
|
17.50%, 8.0x
|
||
|
High Yield Bonds
|
$ |
97,010
|
Market Analysis
|
Market Data of Similar Companies
|
N/A
|
||
|
High Yield Bonds
|
$ |
146,145
|
Market Analysis, Discounted Cash Flow Analysis
|
Discount Rate, EBITDA Multiple
|
17.50%, 8.0x
|
||
|
Warrant
|
$ |
7,436
|
Transaction Analysis
|
Intrinsic Value, Discount Rate
|
N/A
|
||
|
(a)
|
A change to an unobservable input may result in a significant change to the value of the investment as follows:
|
|
Unobservable Input
|
Impact to Value if Input Increases
|
Impact to Value if Input Decreases
|
|
Market Data of Similar Companies
|
Increase
|
Decrease
|
|
Vendor Quotes
|
Increase
|
Decrease
|
|
Discount Rate
|
Decrease
|
Increase
|
|
EBITDA Multiple
|
Increase
|
Decrease
|
|
Intrinsic Value
|
Increase
|
Decrease
|
Trust Expenses: Some expenses of the Trust can be directly attributed to the Fund. Expenses that cannot be directly attributed to the Fund are apportioned among all funds in the Trust based on average net assets of each fund, including Trustees’ fees and expenses.
Fund Expenses: Some expenses can be directly attributed to the Fund and are apportioned among the classes based on average net assets of each class.
Class Expenses: Expenses that are specific to a class of shares are charged directly to that share class. Fees provided under the distribution (Rule 12b‐1) and/or shareholder service plans for a particular class of the Fund are charged to the operations of such class.
Concentration of Credit Risk: The Fund places its cash with a banking institution, which is insured by Federal Deposit Insurance Corporation (FDIC). The FDIC limit is $250,000. At various times throughout the year, the amount on deposit may exceed the FDIC limit and subject the Fund to a credit risk. The Fund does not believe that such deposits are subject to any unusual risk associated with investment activities.
Federal Income Taxes: The Fund complies with the requirements under Subchapter M of the Internal Revenue Code of 1986, as amended, applicable to regulated investment companies and intends to distribute substantially all of its net taxable income and net capital gains, if any, each year so that it will not be subject to excise tax on undistributed income and gains. The Fund is not subject to income taxes to the extent such distributions are made.
|
20
|
www.ddjcap.com
|
|
DDJ Opportunistic High Yield Fund
|
Notes to Financial Statements
|
September 30, 2017
As of and during the fiscal year ended September 30, 2017, the Fund did not have a liability for any unrecognized tax benefits in the accompanying financial statements. The Fund recognizes interest and penalties, if any, related to tax liabilities as income tax expense in the Statement of Operations. The Fund files U.S. federal, state and local income tax returns as required. The Fund’s tax returns are subject to examination by the relevant tax authorities until expiration of the applicable statute of limitations, which is generally three years after the filing of the tax return for federal purposes and four years for most state returns. The Fund’s administrator has analyzed the Fund’s tax positions taken on federal and state income tax returns for all open tax years and has concluded that as of September 30, 2017, no provision for income tax is required in the Fund’s financial statements related to these tax positions.
Investment Transactions and Investment Income: Investment transactions are accounted for on the date the investments are purchased or sold (trade date basis). Realized gains and losses from investment transactions are reported on an identified cost basis. Interest income, which includes accretion of discounts and amortization of premiums, is accrued and recorded as earned. Dividend income is recognized on the ex‐dividend date, or for certain foreign securities, as soon as information is available to the Fund. All of the realized and unrealized gains and losses and net investment income are allocated daily to each class in proportion to its average daily net assets.
Distributions to Shareholders: The Fund normally pays dividends, if any, monthly, and distributes capital gains, if any, on an annual basis. Income dividend distributions are derived from interest and other income the Fund receives from its investments, including short term capital gains. Long term capital gain distributions are derived from gains realized when the Fund sells a security it has owned for more than one year. The Fund may make additional distributions and dividends at other times if its investment advisor has determined that doing so may be necessary for the Fund to avoid or reduce taxes. Net investment income/(loss) and net realized gain/(loss) may differ for financial statement and tax purposes.
Loan Assignments: The Fund invests in loan assignments. The Fund considers loan assignments to be investments in debt instruments. When the Fund purchases assignments of loans from lenders, the Fund will acquire direct rights against the borrower on the loan except that under certain circumstances such rights may be more limited than those held by the assigning lender.
Loans and debt instruments are subject to credit risk. Credit risk relates to the ability of the borrower under a senior loan to make interest and principal payments as they become due.
As of September 30, 2017, the Fund held $3,867,608, or 48.13% of the Fund’s net assets, in loan assignments.
Liquidity Risk: Liquidity risk exists when particular investments are difficult to sell. The Fund may not be able to sell these investments at the best prices or at the value the Fund places on them. In such a market, the value of such investments and the Fund’s share price may fall dramatically, even during periods of declining interest rates. Investments that are illiquid or that trade in lower volumes may be more difficult to value. The market for high yield securities in particular may be less liquid and therefore these securities may be harder to value or sell at an acceptable price, especially during times of market volatility or decline.
Restricted securities: Restricted securities are securities that may only be resold upon registration under federal securities laws or in transactions exempt from such registration. In some cases, the issuer of restricted securities has agreed to register such securities for resale, at the issuer’s expense, either upon demand by a fund or in connection with another registered offering of the securities. Many restricted securities may be resold in the secondary market in transactions exempt from registration. Such restricted securities may be determined to be liquid. The Fund will not incur any registration costs upon such resale. The Fund’s restricted securities are valued at the price provided by pricing services or dealers in the secondary market or, if no market prices are available, at the fair value price as determined by the Fund’s Advisor or pursuant to the Fund’s fair value policy, subject to oversight by the Board of Trustees. The Fund has acquired certain securities, the sale of which is restricted under applicable provisions of the Securities Act of 1933. It is possible that the fair value price may differ significantly from the amount that may ultimately be realized in the near term, and the difference could be material.
The below security is restricted from resale as of September 30, 2017:
|
Acquisition Date
|
Shares or
Principal Amount |
Amortized Cost
|
Fair Value
|
||||||||||
|
Optima Specialty Steel, Inc. 12.000% 12/30/2016 (a)
|
1/20/15
|
$
|
150,000
|
$
|
131,030
|
$
|
146,145
|
||||||
|
(a)
|
The Fund also invests in unrestricted securities of the same issuer. The fair value of restricted securities is 51.07% of the total value of securities of the same issuer.
|
Restricted securities under Rule 144a, including the aggregate value and percentage of net assets of the Fund, have been identified in the Schedule of Investments.
|
Annual Report | September 30, 2017
|
21
|
|
DDJ Opportunistic High Yield Fund
|
Notes to Financial Statements
|
September 30, 2017
3. TAX BASIS INFORMATION
Tax Basis of Distributions to Shareholders: The character of distributions made during the period from net investment income or net realized gains may differ from its ultimate characterization for federal income tax purposes. Also, due to the timing of dividend distributions, the fiscal year in which amounts are distributed may differ from the fiscal year in which the income or realized gain were recorded by the Fund. The amounts and characteristics of tax basis distributions are estimated at the time of distribution and composition of distributable earnings/(accumulated losses) are finalized at fiscal year‐end.
The tax character of distributions paid by the Fund for the fiscal years ended September 30 were as follows:
|
Distributions Paid From:
|
2017
|
2016
|
||||||
|
Ordinary Income
|
$
|
762,130
|
$
|
562,099
|
||||
|
Total
|
$
|
762,130
|
$
|
562,099
|
||||
Reclassifications: As of September 30, 2017, permanent differences in book and tax accounting were reclassified. The following reclassifications, which had no impact on results of operations or net assets, were recorded to reflect tax character:
|
|
Paid‐in Capital
|
Accumulated Net Investment Income
|
Accumulated Net Realized Gain on Investments
|
|||||||||
|
$
|
–
|
$
|
1,000
|
$
|
(1,000
|
)
|
||||||
The primary reason for the permanent difference is due to paydowns in the Fund.
Unrealized Appreciation and Depreciation on Investments: As of September 30, 2017, the aggregate costs of investments, gross unrealized appreciation/(depreciation) and net unrealized appreciation for Federal tax purposes were as follows:
|
Gross unrealized appreciation (excess of value over tax cost)
|
$
|
275,541
|
||
|
Gross unrealized depreciation (excess of tax cost over value)
|
(55,193
|
)
|
||
|
Net unrealized appreciation
|
220,348
|
|||
|
Cost of investments for income tax purposes
|
$
|
7,643,793
|
The reason for the temporary difference is due to wash sales.
Components of Distributable Earnings: At September 30, 2017, components of distributable earnings were as follows:
|
Undistributed ordinary income
|
$
|
82,887
|
||
|
Accumulated capital gains
|
–
|
|||
|
Net unrealized appreciation on investments
|
220,348
|
|||
|
Total
|
$
|
303,235
|
4. SECURITIES TRANSACTIONS
Purchases and sales of securities, excluding short‐term securities, during the fiscal year ended September 30, 2017 were as follows:
|
Purchases of Securities
|
Proceeds from Sales of Securities
|
|||||||
|
$
|
6,592,300
|
$
|
7,510,384
|
|||||
5. BENEFICIAL SHARE TRANSACTIONS
The capitalization of the Trust consists of an unlimited number of shares of beneficial interest with no par value per share. Holders of the shares of the Fund have one vote for each share held and a proportionate fraction of a vote for each fractional share. All shares issued and outstanding are fully paid and are transferable and redeemable at the option of the shareholder. Shares have no pre‐emptive rights. Neither the Fund nor any of its creditors has the right to require shareholders to pay any additional amounts solely because the shareholder owns the shares.
|
22
|
www.ddjcap.com
|
|
DDJ Opportunistic High Yield Fund
|
Notes to Financial Statements
|
September 30, 2017
Shares redeemed within 60 days of purchase may incur a 1.00% short‐term redemption fee deducted from the redemption amount. For the fiscal year ended September 30, 2017, the redemption fees charged by the Fund, if any, are presented in the Statements of Changes in Net Assets.
Transactions in common shares were as follows:
|
For the
Year Ended September 30, 2017 |
For the
Year Ended September 30, 2016 |
|||||||
|
Institutional Class
|
||||||||
|
Shares sold
|
8,001
|
538,741
|
||||||
|
Dividends reinvested
|
67,601
|
41,782
|
||||||
|
Shares redeemed
|
(172,889
|
)
|
(80,426
|
)
|
||||
|
Net increase/(decrease) in shares outstanding
|
(97,287
|
)
|
500,097
|
|||||
|
Class I
|
||||||||
|
Shares sold
|
–
|
53,192
|
||||||
|
Dividends reinvested
|
6,860
|
2,807
|
||||||
|
Net increase in shares outstanding
|
6,860
|
55,999
|
||||||
|
Class II
|
||||||||
|
Shares sold
|
8,099
|
–
|
||||||
|
Dividends reinvested
|
1,213
|
734
|
||||||
|
Shares redeemed
|
(63
|
)
|
–
|
|||||
|
Net increase in shares outstanding
|
9,249
|
734
|
||||||
Control is defined by the 1940 Act as the beneficial ownership, either directly or through one or more controlled companies, of more than 25% of the voting securities of a company. Approximately 88% of the shares outstanding are held within two affiliated accounts. Share transaction activities of these shareholders could have a material impact on the Fund.
6. MANAGEMENT AND RELATED PARTY TRANSACTIONS
Investment Advisory: DDJ Capital Management, LLC (“DDJ” or the “Adviser”), subject to the authority of the Board, is responsible for the overall management and administration of the Fund’s business affairs. The Adviser manages the investments of the Fund in accordance with the Fund’s investment objective, policies and limitations and investment guidelines established jointly by the Adviser and the Board.
Pursuant to the Investment Advisory Agreement (the “Advisory Agreement”) with the Adviser, the Fund pays the Adviser an annual management fee of 0.70% based on the Fund’s average daily net assets. The management fee is paid on a monthly basis. The Board may extend the Advisory Agreement for additional one‐year terms. The Board and shareholders of the Fund may terminate the Advisory Agreement upon 30 days’ written notice. The Adviser may terminate the Advisory Agreement upon 60 days’ written notice.
Pursuant to a fee waiver letter agreement (the “Fee Waiver Agreement”), the Adviser has contractually agreed to limit the amount of the Fund’s Total Annual Fund Operating Expenses, exclusive of Distribution and Service (12b‐1) Fees, Shareholder Servicing expenses, acquired fund fees and expenses, brokerage expenses, interest expenses, taxes and extraordinary expenses, to 0.79% of the Fund’s average daily net assets of each of the Institutional Class, Class I and Class II shares. The Fee Waiver Agreement is in effect through January 31, 2018. The Adviser will be permitted to recover, on a class‐by‐class basis, expenses it has borne through the Fee Waiver Agreement to the extent that the Fund’s expenses in later periods fall below the annual rates set forth in the Fee Waiver Agreement. The Fund will not be obligated to pay any such deferred fees and expenses more than three years after the end of the fiscal year in which the fees and expense were deferred. The Adviser may not discontinue this waiver without the approval by the Trust's Board. Fees waived or reimbursed for the fiscal year ended September 30, 2017 are disclosed in the Statement of Operations.
|
Annual Report | September 30, 2017
|
23
|
|
DDJ Opportunistic High Yield Fund
|
Notes to Financial Statements
|
September 30, 2017
As of September 30, 2017, the balance of recoupable expenses was as follows:
|
Expiring in 2018
|
Expiring in 2019
|
Expiring in 2020
|
||||||||||
|
Institutional Class
|
$
|
82,371
|
$
|
319,671
|
$
|
267,174
|
||||||
|
Class I
|
2,863
|
15,385
|
26,613
|
|||||||||
|
Class II
|
2,862
|
5,004
|
4,896
|
|||||||||
Such amounts include waived advisory fees of $4,156, $145 and $145, respectively expiring in 2018 and $50,807, $2,595 and $694, respectively expiring in 2019, and $48,952, $4,857 and $899, respectively expiring in 2020.
Administrator: ALPS Fund Services, Inc. (“ALPS”) (an affiliate of ALPS Distributors, Inc.) serves as administrator to the Fund. The Fund has agreed to pay expenses incurred in connection with its administrative activities. Pursuant to the Administration, Bookkeeping and Pricing Services Agreement with the Trust, ALPS will provide operational services to the Fund including, but not limited to, fund accounting and fund administration and generally assist in the Fund’s operations. The Fund’s administration fee is accrued on a daily basis and paid monthly. The officers and an Interested Trustee of the Trust are employees of ALPS. Administration fees paid by the Fund for the fiscal year ended September 30, 2017 are disclosed in the Statement of Operations.
ALPS is reimbursed by the Fund for certain out of pocket expenses.
Transfer Agent: ALPS serves as transfer agent for the Fund under a Transfer Agency and Services Agreement with the Trust. Under this agreement, ALPS is paid an annual fee for services performed on behalf of the Fund plus fees for open accounts and is reimbursed for certain out‐of‐pocket expenses.
Compliance Services: ALPS provides services as the Fund’s Chief Compliance Officer to monitor and test the policies and procedures of the Fund in conjunction with requirements under Rule 38a‐1 of the 1940 Act pursuant to a Chief Compliance Officer Services Agreement with the Trust. Under this agreement, ALPS is paid an annual fee for services performed on behalf of the Fund and is reimbursed for certain out‐of‐pocket expenses.
Distribution: ALPS Distributors, Inc. (the “Distributor”) (an affiliate of ALPS) acts as the principal underwriter of the Fund’s shares pursuant to a Distribution Agreement with the Trust. Shares of the Fund are offered on a continuous basis through the Distributor, as agent of the Fund. The Distributor is not obligated to sell any particular amount of shares and is not entitled to any compensation for its services as the Fund’s principal underwriter pursuant to the Distribution Agreement.
The Fund has adopted a Distribution and Services Plan (the “Plan”) pursuant to Rule 12b‐1 of the 1940 Act for its Class II shares. The Plan allows the Fund to use Class II assets to pay fees in connection with the distribution and marketing of Class II shares and/or the provision of shareholder services to Class II shareholders. The Plan permits payment for services in connection with the administration of plans or programs that use Class II shares of the Fund, if any, as their funding medium and for related expenses. The Plan permits the Fund to make total payments at an annual rate of up to 0.25% of the Fund’s average daily net assets attributable to its Class II shares. Because these fees are paid out of the Fund’s Class II assets, if any, on an ongoing basis, over time they will increase the cost of an investment in the Class II shares, if any, and Class II Plan fees may cost an investor more than other types of sales charges. Plan fees are shown as distribution and service fees on the Statement of Operations.
The Fund has adopted a shareholder services plan (“Shareholder Services Plan”) with respect to the Fund’s Class I and Class II shares. Under the Shareholder Services Plan, the Fund is authorized to pay banks and their affiliates and other institutions, including broker‐dealers and Fund affiliates (“Participating Organizations”), an aggregate fee in an amount not to exceed on an annual basis 0.10% of the average daily net asset value of the Class I shares and Class II shares, respectively, attributable to or held in the name of a Participating Organization for its clients as compensation for providing shareholder service activities, which do not include distribution services, pursuant to an agreement with a Participating Organization. Shareholder Services Plan fees are included with distribution and service fees on the Statement of Operations.
7. TRUSTEES
As of September 30, 2017, there were four Trustees, three of whom are not “interested persons” (as defined in the 1940 Act) of the Trust (the “Independent Trustees”). Effective October 1, 2016, the Independent Trustees receive a quarterly retainer of $5,000, plus $4,000 for each regular Board or Committee meeting attended, $2,000 for each special telephonic Board or Committee meeting attended and $2,000 for each special in‐person Board meeting attended. The Independent Trustees are also reimbursed for all reasonable out‐of‐pocket expenses relating to attendance at meetings and for meeting‐related expenses. Officers of the Trust and Trustees who are interested persons of the Trust receive no salary or fees from the Trust.
|
24
|
www.ddjcap.com
|
|
DDJ Opportunistic High Yield Fund
|
Notes to Financial Statements
|
September 30, 2017
8. COMMITMENTS AND CONTINGENCIES
The Fund may make commitments pursuant to bridge loan facilities. In this case, such commitment remains off balance sheet as it is more likely than not that such bridge facility will not ever fund. At September 30, 2017, the Fund has $250,000 in bridge facility commitments.
9. INDEMNIFICATIONS
Under the Trust’s organizational documents, its officers and Trustees are indemnified against certain liabilities arising out of the performance of their duties to the Trust. Additionally, in the normal course of business, the Trust enters into contracts with service providers that may contain general indemnification clauses which may permit indemnification to the extent permissible under applicable law. The Trust’s maximum exposure under these arrangements is unknown, as this would involve future claims that may be made against the Trust that have not yet occurred.
10. SUBSEQUENT EVENTS
Subsequent events after the date of the Statement of Assets and Liabilities have been evaluated through the date the financial statements were issued.
Effective November 16, 2017, the Independent Trustees’ quarterly retainer will increase to $6,000 and the Audit Committee Chair will now receive a quarterly retainer of $1,250 and the Independent Chair will receive a quarterly retainer of $2,500. The Independent Trustees will continue to receive $4,000 for each regular Board or Committee meeting attended, $2,000 for each special telephonic Board or Committee meeting attended and $2,000 for each special in‐person Board meeting attended. The Independent Trustees will continue to be reimbursed for all reasonable out‐of‐pocket expenses relating to attendance at meetings and for meeting‐related expenses.
Effective November 16, 2017, the Fund’s Adviser has contractually agreed to extend their fee waiver agreement through January 31, 2019.
Subsequent to the balance sheet date, on November 15, 2017 and pursuant to the emergence from Chapter 11 bankruptcy of Optima Specialty Steel Inc. (“Optima”, thereafter renamed Specialty Steel Works Incorporated), the Fund’s investment in (i) the Optima DIP Loan was refinanced by new senior secured notes due 2022 issued by Specialty Steel Holdco, Inc. ("Holdco"), the parent company of Specialty Steel Works Incorporated, and (ii) the Optima Unsecured 12% Notes due December 30, 2016 was restructured, in a tax‐free exchange, into shares of new common stock also issued by Holdco. The Fund and certain other accounts and funds managed by the Fund’s Adviser own in the aggregate greater than 90% of both the new senior secured notes due 2022 and the outstanding shares of the new common stock.
Management has determined that there were no other subsequent events to report through the issuance of these financial statements.
|
Annual Report | September 30, 2017
|
25
|
|
DDJ Opportunistic High Yield Fund
|
Report of Independent Registered
Public Accounting Firm |
To the Shareholders of DDJ Opportunistic High Yield Fund and
Board of Trustees of ALPS Series Trust
We have audited the accompanying statement of assets and liabilities, including the portfolio of investments, of DDJ Opportunistic High Yield Fund (the “Fund”), a series of ALPS Series Trust, as of September 30, 2017, and the related statements of operations, changes in net assets and cash flows, and the financial highlights for the year then ended. These financial statements and financial highlights are the responsibility of the Fund’s management. Our responsibility is to express an opinion on these financial statements and financial highlights based on our audit. The accompanying statement of changes in net assets and financial highlights for the periods ended September 30, 2016 and prior, were audited by other auditors whose report dated December 2, 2016, expressed an unqualified opinion on that financial statement and financial highlights.
We conducted our audit in accordance with the standards of the Public Company Accounting Oversight Board (United States). Those standards require that we plan and perform the audit to obtain reasonable assurance about whether the financial statements and financial highlights are free of material misstatement. An audit includes examining, on a test basis, evidence supporting the amounts and disclosures in the financial statements. Our procedures included confirmation of securities owned as of September 30, 2017, by correspondence with the custodian and brokers or by other appropriate auditing procedures where replies from brokers were not received. An audit also includes assessing the accounting principles used and significant estimates made by management, as well as evaluating the overall financial statement presentation. We believe that our audit provides a reasonable basis for our opinion.
In our opinion, the financial statements and financial highlights referred to above present fairly, in all material respects, the financial position of DDJ Opportunistic High Yield Fund as of September 30, 2017, the results of its operations, changes in net assets and cash flows, and the financial highlights for the year then ended, in conformity with accounting principles generally accepted in the United States of America.
|
|
|
COHEN & COMPANY, LTD.
Cleveland, Ohio
November 29, 2017
|
|
26
|
www.ddjcap.com
|
|
DDJ Opportunistic High Yield Fund
|
Additional Information
|
September 30, 2017 (Unaudited)
1. PROXY VOTING POLICIES AND VOTING RECORD
A description of the policies and procedures that the Fund uses to determine how to vote proxies relating to portfolio securities is available without charge, upon request, (i) by calling the Fund (toll‐free) at 1‐844‐363‐4898 or (ii) on the website of the Securities and Exchange Commission (the “SEC”) at http://www.sec.gov.
Information regarding how the Fund voted proxies relating to portfolio securities during the most recent 12‐month period ended June 30 is available (i) without charge, upon request, by calling the Fund (toll‐free) at 1‐844‐363‐4898 or (ii) on the SEC’s website at http://www.sec.gov.
2. PORTFOLIO HOLDINGS
The Fund files its complete schedule of portfolio holdings with the SEC for the first and third quarters of each fiscal year on Form N‐Q. The Fund’s Forms N‐Q are available on the SEC website at http://www.sec.gov. The Fund’s Forms N‐Q may be reviewed and copied at the SEC’s Public Reference Room in Washington, D.C., and information on the operation of the Public Reference Room may be obtained by calling 1‐800‐SEC‐0330.
3. CHANGES IN ACCOUNTANTS
On June 5, 2017, KPMG LLP (KPMG) was dismissed as the independent registered public accounting firm of the Trust. In August 2017, the Audit Committee of the Board of Trustees of the Trust recommended the appointment of Cohen & Company, Ltd. (“Cohen”), as the Trust’s independent registered public accounting firm, replacing KPMG LLP, and beginning with the Fund’s financial statements for the fiscal year ended September 30, 2017, and the Board of Trustees approved such appointment.
KPMG’s report on the financial statements of the Fund for each of the fiscal years ended September 30, 2015 and September 30, 2016, did not contain an adverse opinion or a disclaimer of opinion and was not qualified or modified as to uncertainty, audit scope, or accounting principles. During the fiscal years ended September 30, 2015 and September 30, 2016, there were no disagreements between the Fund and KPMG on any matter of accounting principles or practices, financial statement disclosure, or auditing scope or procedure, which disagreement(s), if not resolved to the satisfaction of KPMG, would have caused it to make reference to the subject matter of the disagreement(s) in connection with its reports. During the fiscal years ended September 30, 2015 and September 30, 2016, there were no reportable events as defined in Item 304(a)(1)(v) of Regulation S‐K promulgated by the Securities and Exchange Commission.
4. DISCLOSURE REGARDING RENEWAL AND APPROVAL OF FUND ADVISORY AGREEMENT
On May 25, 2017, the Board of Trustees (the “Board”) of ALPS Series Trust (the “Trust”) met in person to discuss, among other things, the renewal and approval of the Investment Advisory Agreement between the Trust and DDJ Capital Management, LLC (“DDJ Capital”) in accordance with Section 15(c) of the 1940 Act. The Independent Trustees met with independent legal counsel during executive session and discussed the Investment Advisory Agreement and other related materials.
In approving the Investment Advisory Agreement with DDJ Capital, the Trustees, including all of the Independent Trustees, considered the following factors with respect to the DDJ Fund:
Investment Advisory Fee Rate: The Trustees reviewed and considered the contractual annual advisory fee to be paid by the Trust on behalf of the DDJ Fund to DDJ Capital of 0.70% of the Fund’s daily average net assets, in light of the nature, extent and quality of the advisory services to be provided by DDJ Capital to the DDJ Fund.
The Trustees considered the information they received comparing the DDJ Fund’s contractual annual advisory fee and overall expenses with those of funds in the expense group and universe of funds provided by an independent provider of investment company data (“the Independent Data Provider”), which screened retail and institutional small blend mutual funds and excluded all others. The peer group consisted of the DDJ Fund and 13 other high yield bond institutional load funds identified by the Independent Data Provider. The Trustees also considered the comparative fee data provided by DDJ Capital.
The Trustees noted that DDJ Capital’s contractual advisory fee of 0.70% was below the FUSE peer group average of 0.87% and above the peer group median of 0.66%, and that the DDJ Fund’s Institutional Class total net expense of 0.89% (after fee waiver and expense reimbursement) was above the peer group average of 0.80% and the peer group median of 0.77%. The Trustees further noted that DDJ Capital’s contractual advisory fee of 0.70% was within the range of the management fees of the comparative fee data comprised of 75 managers provided by DDJ Capital (0.25% to 0.75%) and that 12 of the 75 managers charged a management fee of 0.66% or more. After further consideration, the Trustees determined that the contractual annual advisory fees and total net expenses for the DDJ Fund, taking into account the contractual fee waiver in place, were not unreasonable.
|
Annual Report | September 30, 2017
|
27
|
|
DDJ Opportunistic High Yield Fund
|
Additional Information
|
September 30, 2017 (Unaudited)
Nature, Extent and Quality of the Services under the Investment Advisory Agreement: The Trustees received and considered information regarding the nature, extent and quality of services provided to the DDJ Fund under the Investment Advisory Agreement with DDJ Capital. The Trustees reviewed certain background materials supplied by DDJ Capital in its presentation, including its Form ADV.
The Trustees reviewed and considered DDJ Capital’s investment advisory personnel, its history as an asset manager and its performance and the separately managed accounts under management by DDJ Capital, including sub‐advising a registered investment company. The Trustees also reviewed the research and decision‐making processes utilized by DDJ Capital, including the methods adopted to seek to achieve compliance with the investment objectives, policies and restrictions of the DDJ Fund.
The Trustees considered the background and experience of DDJ Capital’s management in connection with the DDJ Fund, including reviewing the qualifications, background and responsibilities of the portfolio manager primarily responsible for the day‐to‐day portfolio management of the DDJ Fund and the extent of the resources devoted to research and analysis of actual and potential investments. They considered the Trust’s experience with DDJ Capital, including DDJ Capital’s responsiveness and compliance record. The Trustees also reviewed, among other things, DDJ Capital’s Code of Ethics. The Trustees also considered DDJ Capital’s reputation generally and its investment techniques, strategies, risk management controls and decision‐making processes.
Performance: The Trustees reviewed performance information for the DDJ Fund’s Class I, Class II and Institutional Class shares for the one‐year and three‐month periods ended March 31, 2017, as well as the since‐inception performance (July 7, 2015) through March 31, 2017. The review included a comparison of the DDJ Fund’s performance to the performance of a peer group of comparable funds, as identified by a third‐party data provider. The Trustees noted in particular that for the since inception period ended March 31, 2017, the performance of the DDJ Fund’s Class I ranked sixth in its peer group, the performance of the DDJ Fund’s Class II ranked fourth in its peer group, and the performance of the DDJ Fund’s Institutional Class ranked first in its peer group. The Trustees were satisfied with the DDJ Fund’s performance.
The Adviser’s Profitability: The Trustees received and considered an estimated profitability analysis prepared by DDJ Capital based on the fees paid (and to be paid) under the Investment Advisory Agreement. The Trustees considered the profits, if any, anticipated to be realized by DDJ Capital in connection with the operation of the DDJ Fund, noting that DDJ Capital had not yet earned a profit from managing the DDJ Fund. The Trustees then reviewed and discussed DDJ Capital’s financial statements in order to analyze the financial condition and stability and profitability of DDJ Capital.
Economies of Scale: The Trustees considered whether economies of scale in the provision of services to the DDJ Fund would be passed along to the shareholders under the Investment Advisory Agreement. However, economies of scale were not anticipated at projected DDJ Fund asset levels in the near term.
Other Benefits to the Adviser: The Trustees reviewed and considered any other incidental benefits derived or to be derived by DDJ Capital from its relationship with the DDJ Fund. They noted that, because the DDJ Fund is pursuing an investment strategy that is primarily fixed income, rather than equity, soft dollars were not a material consideration.
The Board summarized its deliberations with respect to the Investment Advisory Agreement with DDJ Capital. In evaluating DDJ Capital and the fees charged under the Investment Advisory Agreement, the Trustees concluded that no single factor reviewed by the Trustees was identified by the Trustees to be determinative as the principal factor in whether to approve the Investment Advisory Agreement. Further, the Independent Trustees were advised by independent legal counsel throughout the process. The Trustees, including all of the Independent Trustees, concluded that:
|
●
|
the contractual annual advisory fees of 0.70% of the DDJ Fund’s daily average net assets to be paid to DDJ Capital under the Investment Advisory Agreement and the total net expense of 0.89% for the DDJ Fund’s Institutional Class shares, taking into account the contractual fee waiver in place, were fair to the DDJ Fund’s shareholders;
|
|
●
|
the terms of the fee waiver/expense reimbursement letter agreement between the Trust, on behalf of the DDJ Fund, and DDJ Capital, were reasonable;
|
|
●
|
the nature, extent and quality of services rendered by DDJ Capital under the Investment Advisory Agreement were adequate;
|
| ● |
the performance for the DDJ Fund was acceptable;
|
|
28
|
www.ddjcap.com
|
|
DDJ Opportunistic High Yield Fund
|
Additional Information
|
September 30, 2017 (Unaudited)
|
●
|
the estimated profitability of DDJ Capital in connection with the management of the DDJ Fund was not unreasonable; and
|
|
●
|
there were no material economies of scale or other material incidental benefits accruing to DDJ Capital in connection with its relationship with the DDJ Fund.
|
Based on the Trustees’ deliberations and their evaluation of the information described above, the Trustees, including all of the Independent Trustees, concluded that DDJ Capital’s compensation for investment advisory services is consistent with the best interests of the DDJ Fund and its shareholders.
|
Annual Report | September 30, 2017
|
29
|
|
DDJ Opportunistic High Yield Fund
|
Trustees & Officers
|
September 30, 2017 (Unaudited)
INDEPENDENT TRUSTEES
|
Name, Birth Year & Address*
|
Position(s) Held with Fund
|
Term of Office and
Length of Time Served** |
Principal Occupation(s)
During Past 5 Years*** |
Number of Funds in Fund Complex Overseen by Trustee****
|
Other Directorships Held by Trustee During Past 5 Years***
|
|
Ward D. Armstrong
Birth year: 1954
|
Trustee and Chairman
|
Mr. Armstrong was appointed to the Board on May 27, 2016. Mr. Armstrong was appointed Chairman of the Board at the August 24, 2017 meeting of the Board of Trustees.
|
Retired; Managing Partner, NorthRock Partners, LLC (October 2013 to July 2015); Managing Director, NorthRock Partners, a Private Wealth Advisory Practice of Ameriprise Financial (February 2010 to October 2013); Senior Vice President, Ameriprise Financial, Inc. (November 1984 to May 2007); President, American Express Asset Management (2002 to 2004); and Chairman, Ameriprise Trust Company (November 1996 to May 2007).
|
9
|
Mr. Armstrong is a Director of the Heartland Group, Inc. (5 funds).
|
|
J. Wayne Hutchens
Birth year: 1944
|
Trustee
|
Mr. Hutchens was elected to the Board on October 30, 2012.
|
Mr. Hutchens is currently retired. From April 2006 to December 2012, he served as President and CEO of the University of Colorado (CU) Foundation and from April 2009 to December 2012, he was Executive Director of the CU Real Estate Foundation. Mr. Hutchens is also Trustee of the Denver Museum of Nature and Science (2000 to present), Director of AMG National Trust Bank (June 2012 to present) and Trustee of Children’s Hospital Colorado (May 2012 to present). Prior to these positions, Mr. Hutchens spent 29 years in the banking industry, retiring as Chairman of Chase Bank Colorado.
|
9
|
RiverNorth Opportunity Fund (2013 to Present).
|
| * |
All communications to Trustees and Officers may be directed to ALPS Series Trust c/o 1290 Broadway, Suite 1100, Denver, CO 80203.
|
|
**
|
This is the period for which the Trustee or Officer began serving the Trust. Each Trustee serves an indefinite term, until such Trustee’s successor is elected and appointed, or such Trustee resigns or is deceased. Officers are elected on an annual basis.
|
|
***
|
Except as otherwise indicated, each individual has held the office shown or other offices in the same company for the last five years.
|
|
****
|
The Fund Complex currently consists of 9 series of the Trust and any other investment companies for which DDJ Capital Management, LLC provides investment advisory services, currently none.
|
|
30
|
www.ddjcap.com
|
|
DDJ Opportunistic High Yield Fund
|
Trustees & Officers
|
September 30, 2017 (Unaudited)
INDEPENDENT TRUSTEES (CONTINUED)
|
Name, Birth Year & Address*
|
Position(s) Held with Fund
|
Term of Office and
Length of Time Served** |
Principal Occupation(s)
During Past 5 Years*** |
Number of Funds in Fund Complex Overseen by Trustee****
|
Other Directorships Held by Trustee During Past 5 Years***
|
|
Patrick Seese Birth year: 1971
|
Trustee
|
Mr. Seese was elected to the Board on October 30, 2012..
|
Mr. Seese is an owner and a Managing Director of Integris Partners, a middle‐ market investment banking firm serving closely‐held companies, financial sponsors and public companies (February 2008 to present). Prior to this, Mr. Seese was a Managing Director of Headwaters MB, a middle‐market investing banking firm (December 2003 to February 2008). Prior to that, Mr. Seese worked in Credit Suisse First Boston’s Mergers and Acquisitions Group and served as Head of Corporation Development, Katy Industries, a publicly traded industrial and consumer products company and at Deloitte & Touche LLP, where he began his career in 1994.
|
9
|
None.
|
|
INTERESTED TRUSTEE
|
|||||
|
Jeremy O. May Birth year: 1970
|
Trustee and President
|
Mr. May was elected Trustee and President on October 30, 2012. Mr. May was Chairman from October 30, 2012 to August 24, 2017.
|
Mr. May joined ALPS in 1995 and is currently President and Director of ALPS Fund Services, Inc. and ALPS Distributors, Inc., Executive Vice President and Director of ALPS Holdings, Inc. and ALPS Advisors, Inc. and Director of ALPS Portfolio Solutions Distributor, Inc. Because of his positions with these entities, Mr. May is deemed an affiliate of the Trust as defined under the 1940 Act. Mr. May is also Trustee of the Reaves Utility Income Fund and the ALPS Elevation Trust. Mr. May is also on the Board of Directors of the University of Colorado Foundation and the AV Hunter Trust.
|
9
|
Mr. May is Chairman and Trustee of the Reaves Utility Income Fund (1 fund) and ALPS Elevation Trust (2 ETFs).
|
| * |
All communications to Trustees and Officers may be directed to ALPS Series Trust c/o 1290 Broadway, Suite 1100, Denver, CO 80203.
|
|
**
|
This is the period for which the Trustee or Officer began serving the Trust. Each Trustee serves an indefinite term, until such Trustee’s successor is elected and appointed, or such Trustee resigns or is deceased. Officers are elected on an annual basis.
|
|
***
|
Except as otherwise indicated, each individual has held the office shown or other offices in the same company for the last five years.
|
|
****
|
The Fund Complex currently consists of 9 series of the Trust and any other investment companies for which DDJ Capital Management, LLC provides investment advisory services, currently none.
|
|
Annual Report | September 30, 2017
|
31
|
|
DDJ Opportunistic High Yield Fund
|
Trustees & Officers
|
September 30, 2017 (Unaudited)
OFFICERS
|
Name, Birth Year
& Address* |
Position(s) Held with Fund
|
Term of Office and Length of Time Served**
|
Principal Occupation(s) During Past 5 Years***
|
|
Kimberly R. Storms
Birth year: 1972 |
Treasurer
|
Ms. Storms was elected Treasurer of the Trust on October 30, 2012.
|
Ms. Storms is Senior Vice President and Director of Fund Administration of ALPS. Because of her position with ALPS, Ms. Storms is deemed an affiliate of the Trust as defined under the 1940 Act. Ms. Storms is also Treasurer of Financial Investors Trust, Liberty All‐Star Equity Fund and Liberty All‐Star Growth Fund, Inc.
|
|
Rick Noyes
Birth year: 1970 |
Secretary
|
Mr. Noyes was elected Secretary of the Trust on November 14, 2016.
|
Mr. Noyes joined ALPS in 2015 and is Senior Vice President and Director of Legal Administration of ALPS. Prior to joining ALPS, Mr. Noyes served as Assistant Vice President and Senior Counsel of Janus Capital Management LLC. Mr. Noyes is deemed an affiliate of the Trust as defined under the 1940 Act. Mr. Noyes is also Secretary of Westcore Trust.
|
|
Jennifer A. Craig
Birth year: 1973 |
Assistant Secretary
|
Ms. Craig was elected Assistant Secretary of the Trust on May 27, 2016.
|
Ms. Craig joined ALPS in 2007 and is currently Assistant Vice President and Paralegal Manager. Prior to joining ALPS, Ms. Craig was Legal Manager at Janus Capital Management LLC and served as Assistant Secretary of Janus Investment Fund, Janus Adviser Series and Janus Aspen Series. Because of her position with ALPS, Ms. Craig is deemed an affiliate of the Trust as defined under the 1940 Act. Ms. Craig is also Assistant Secretary of Clough Funds Trust, Clough Global Opportunities Fund, Clough Global Allocation Fund, Clough Global Equity Fund and Financial Investors Trust.
|
|
Alan Gattis
Birth year: 1980 |
Assistant Treasurer
|
Mr. Gattis was elected Assistant Treasurer of the Trust on August 9, 2016.
|
Mr. Gattis joined ALPS in 2011 and is currently Vice President and Fund Controller of ALPS. Prior to joining ALPS, Mr. Gattis was an Auditor at Spicer Jeffries LLP (2009 through 2011) and an Auditor at PricewaterhouseCoopers LLP (2004 ‐ 2009). Because of his position with ALPS, Mr. Gattis is deemed an affiliate of the Trust as defined under the 1940 Act. Mr. Gattis is also Assistant Treasurer of Clough Funds Trust, Clough Global Opportunities Fund, Clough Global Allocation Fund, Clough Global Equity Fund, Griffin Institutional Access Real Estate Fund, Stadion Funds and Centaur Mutual Funds Trust.
|
|
Cory J. Gossard
Birth year: 1972 |
Chief Compliance Officer (“CCO”)
|
Mr. Gossard was elected CCO of the Trust on October 20, 2017.
|
Mr. Gossard oversees all day‐to‐day compliance aspects of ALPS’ business within Fund CCO Services, Compliance Administration, Risk Management and Assurance Services. Mr. Gossard is deemed an affiliate of the Trust as defined under the 1940 Act. Mr. Gossard also serves as Fund CCO for the SPDR S&P 500 ETF Trust, SPDR DJIA ETF Trust, and SPDR S&P MidCap 400 ETF Trust. Prior to joining ALPS in 2014, Mr. Gossard held a series of progressively responsible roles throughout an 18‐year career with Citibank.
|
| * |
All communications to Trustees and Officers may be directed to ALPS Series Trust c/o 1290 Broadway, Suite 1100, Denver, CO 80203.
|
|
**
|
This is the period for which the Trustee or Officer began serving the Trust. Each Trustee serves an indefinite term, until such Trustee’s successor is elected and appointed, or such Trustee resigns or is deceased. Officers are elected on an annual basis.
|
|
***
|
Except as otherwise indicated, each individual has held the office shown or other offices in the same company for the last five years.
|
Additional information about members of the Board of Trustees and officers of the Trust is available in the Statement of Additional Information and is available, without charge, upon request, by calling the Fund (toll‐free) at 1‐855‐254‐6467.
|
32
|
www.ddjcap.com
|


|
table of contents
|
|
|
Shareholder Letter
|
1
|
|
Portfolio Update
|
5
|
|
Disclosure of Fund Expenses
|
7
|
|
Consolidated Portfolio of Investments
|
8
|
|
Consolidated Statement of Assets and Liabilities
|
20
|
|
Consolidated Statement of Operations
|
21
|
|
Consolidated Statements of Changes in Net Assets
|
22
|
|
Consolidated Financial Highlights
|
23
|
|
Notes to Consolidated Financial Statements
|
27
|
|
Report of Independent Registered Public Accounting Firm
|
42
|
|
Additional Information
|
43
|
|
Trustees and Officers
|
44
|
|
Insignia Macro Fund
|
Shareholder Letter
|
|
September 30, 2017 (Unaudited)
|
Investment Objective
The Insignia Macro Fund (the “Fund”) is an actively managed, open‐end mutual fund that seeks long‐term risk‐adjusted total returns. The Fund is a combination of distinct global macro/managed futures investment strategies that are globally focused on commodities, currencies, equity indexes and fixed income. Historically, global macro/managed futures have had low correlation to equities and fixed income. Adding uncorrelated investments can potentially increase portfolio diversification in a traditional mix of equity and fixed income investments and can potentially reduce risk and improve returns.
Market Summary
For the fiscal year‐ended September 30, 2017, global capital markets climbed higher as market volatility remained subdued. Investors have become more optimistic this year as we have seen better global growth while inflation has remained low. The drivers of this optimism have resulted in market participants looking past some negative undercurrents, including escalating geopolitical tensions. The U.S. Federal Reserve (the “Fed”) is gradually shifting towards tighter monetary policy as economic data improves. In September, the Fed communicated a plan to slowly reduce the balance sheet and signaled a potential December rate hike. Other central banks including the European Central Bank (“ECB”) and the Bank of Japan (“BOJ”) continue to have accommodative monetary policy. However, given the improvement in global growth data, investors are expecting the ECB to begin tapering in 2018. Overall, global risk assets delivered positive returns during the fiscal year. We believe our managers are well positioned to take advantage of global central banks normalizing policies which could create relative opportunities going forward.
Emerging markets equities have performed very well over the fiscal year as the Chinese economy and equity market has steadied and emerging markets’ economic growth rebounded globally. Commodities saw a good amount of dispersion over the fiscal year, particularly with most industrial metals up double digits while energy experienced a more difficult environment. In currencies, the U.S. Dollar was much weaker than many investors had expected against developed and emerging currency pairs as growth forecasts have increased more in Europe and emerging markets’ relative to the U.S.
Fund Overview
The Insignia Macro Fund allocates to managers across a broad spectrum of global macro/managed futures strategies. These managers include traders who employ a quantitative approach, discretionary macro managers whose top‐down global economic analysis drives their trading themes and momentum‐based trend followers. The Fund’s primary underlying exposures are in very liquid markets including commodities, currencies, equity indexes and fixed income. The Fund’s objective is to profit from directional opportunities seeking returns that are uncorrelated to traditional long‐only and other hedged strategies. As such, the Fund is designed to complement investors’ existing investment portfolios. The Fund will typically average between 5‐15 managers with a maximum allocation to any one manager of 20%.
The Fund provides global macro/managed futures exposure through investments in Commodity Trading Advisors (CTAs). We generally invest in three sub‐strategies of managers: quantitative, discretionary macro and trend following. As of September 30, 2017, the quantitative, factor‐based managers made up 68.47% of the Fund, effectively keeping this sub‐strategy allocation steady over the fiscal year. These managers take positions not solely based on price. They may look at economic data and other factors in determining which markets and direction in which they trade.
|
Annual Report | September 30, 2017
|
1
|
|
Insignia Macro Fund
|
Shareholder Letter
|
|
September 30, 2017 (Unaudited)
|
As of September 30, 2017, the discretionary macro managers made up 31.53% of the Fund. These managers take positions based on their proprietary views of global economic activity. As of September 30, 2017, the Fund does not have an allocation to any trend following managers. Outside of equity indexes, there are very few financial securities trending today. We continue to evaluate the current environment and will look to allocate to trend following managers when the environment becomes more favorable.
Global Macro/Managed Futures Strategy Exposure
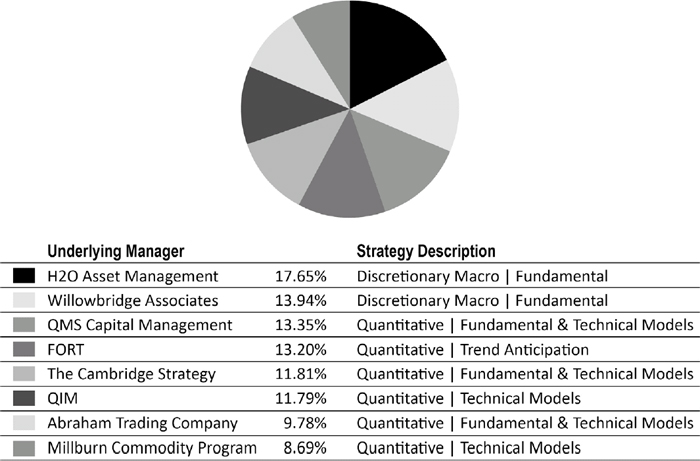
The global macro/managed futures managers selected by Meritage Capital, LLC (the “Adviser”) to gain exposure to the global macro/managed futures managers, sub strategies and programs are subject to change at any time, and any such change may alter the Fund’s access and percentage exposures to each such manager, sub-strategy and program. Although the Fund intends to pursue its global macro/managed futures strategy by investing up to 25% of its total assets in a wholly-owned subsidiary, the Fund may also make global macro/managed futures investments directly, outside of such subsidiary.
Performance Review
For the fiscal year‐ended September 30, 2017, the Insignia Macro Fund (I Shares) return was ‐3.19%. During the period, we terminated one trend following manager due to organizational and structural concerns. We did not hire any new managers and effectively concentrated the Fund’s allocations across eight managers.
Across the Fund, two of the eight current managers reported positive performance for the fiscal period. In terms of attribution, the largest detractor to the Fund’s performance was QMS Capital Management, declining ‐21.70% for the fiscal year. A large portion of this loss was attributed to a short position in U.S. and European fixed income and a long position in the U.S Dollar that was adversely impacted by hawkish commentary from the ECB during the summer. The largest positive contributor to the Fund’s performance was H2O Asset Management, returning +18.64%. Positive attribution for H2O was derived from being long European equity indexes versus U.S. equity indexes. Also noteworthy, QIM Global gained +9.20%.
|
2
|
www.insigniafunds.com
|
|
Insignia Macro Fund
|
Shareholder Letter
|
|
September 30, 2017 (Unaudited)
|
For the Fund in aggregate, losses for the period were suffered in the currency markets, primarily from positions in the U.S. and European markets. Additionally, energy commodities positions detracted from performance. Global equity indexes and base metals positions (both long and short) were additive to performance. Despite the challenging market conditions, the Fund controlled volatility well with an annualized standard deviation of 3.06%, which was roughly 1/4 the volatility seen in global equities for the fiscal year.
Market Outlook
As of September 30, 2017, the Fund’s composition remains diversified primarily across a complementary roster of quantitative and discretionary macro managers. The Fund has maintained minimal directionality, either long or short, to global equity markets. Accordingly, with muted market volatility and normalizing global central banking policy, the Fund struggled to deliver positive performance with primary detractors from select short positions in fixed income markets, long positions in currencies and long positions in commodities. Looking ahead, we anticipate balancing allocations between the Fund’s three sub‐strategies based on changing market conditions.
Global macro/managed futures strategies play a valuable diversification role in strategic asset allocations over the long‐term. As volatility returns to global markets, we believe now is an opportune time to evaluate portfolio diversification and increase allocations to these strategies. We believe the Insignia Macro Fund is well‐positioned as we look forward to the opportunities that lie ahead across the investment landscape.
We remain focused on our mission of compounding wealth through delivering positive risk‐adjusted returns. Thank you for your continuing support and for investing in the Insignia Macro Fund.
Sincerely,

Joe Wade
Chief Investment Officer
Portfolio Manager
|
Annual Report | September 30, 2017
|
3
|
|
Insignia Macro Fund
|
Shareholder Letter
|
|
September 30, 2017 (Unaudited)
|
Deleveraging is when a company or individual attempts to decrease its total financial leverage. The most direct way for an entity to deleverage is to immediately pay off any existing debt on its balance sheet. If unable to do this, the company or individual may be in a position that increases its risk of default.
Volatility is a statistical measure of the dispersion of returns for a given security or market index. Volatility can either be measured by using the standard deviation or variance between returns from that same security or market index. Commonly, the higher the volatility, the riskier the security.
Diversification does not eliminate the risk of experiencing investment losses.
The views and information discussed in this commentary are as of the date of publication, are subject to change, and may not reflect the writer’s current views. The views expressed are those of the Fund’s adviser only, and represent an assessment of market conditions at a specific point in time, are opinions only and should not be relied upon as investment advice regarding a particular investment or markets in general. Such information does not constitute a recommendation to buy or sell specific securities or investment vehicles. It should not be assumed that any investment will be profitable or will equal the performance of the fund(s) or any securities or any sectors mentioned in this letter. The subject matter contained in this letter has been derived from several sources believed to be reliable and accurate at the time of compilation. Neither the Fund nor the Adviser accepts any liability for losses either direct or consequential caused by the use of this information.
Not FDIC Insured – No Bank Guarantee – May Lose Value
Past performance does not guarantee future results.
ALPS Distributors, Inc. is not affiliated with Meritage Capital, LLC or Sage Advisory Services, Ltd.
|
4
|
www.insigniafunds.com
|
|
Insignia Macro Fund
|
Portfolio Update
|
|
September 30, 2017 (Unaudited)
|
Average Annual Total Returns (as of September 30, 2017)
|
3 Month
|
6 Month
|
1 Year
|
3 Year
|
Since Inception*
|
|
|
Insignia Macro Fund - Class A - NAV
|
-1.64%
|
-3.92%
|
-3.25%
|
-0.74%
|
0.51%
|
|
Insignia Macro Fund - Class A - LOAD
|
-7.09%
|
-9.20%
|
-8.60%
|
-2.60%
|
-0.99%
|
|
Insignia Macro Fund - Class I - NAV
|
-1.64%
|
-3.92%
|
-3.19%**
|
-0.68%
|
0.55%
|
|
HFRI Macro (Total) Index(a)
|
0.22%
|
-0.43%
|
-1.18%
|
0.50%
|
1.25%
|
|
S&P 500® Total Return Index(b)
|
4.48%
|
7.71%
|
18.61%
|
10.81%
|
10.91%
|
The performance data quoted above represents past performance. Past performance is not a guarantee of future results. Investment return and value of the Fund shares will fluctuate so that an investor’s shares, when sold or redeemed, may be worth more or less than their original cost. Performance may be lower or higher than performance data quoted. Fund performance current to the most recent month-end is available by calling (855) 674-4642 or by visiting www.insigniafunds.com.
| * |
Fund's inception date is December 31, 2013.
|
| ** |
Excludes adjustments in accordance with accounting principles generally accepted in the United States of America and as such, the net asset value and total return for shareholder transactions reported to the market may differ from the net asset value for financial reporting purposes.
|
| (a) |
The HFRI Macro (Total) Index is an equally weighted performance index. It uses the HFR database and consists only of macro funds with a minimum of US$50 million AUM or a 12-month track record and that report assets in USD. It is calculated and rebalanced monthly, and shown net of all fees and expenses. It is an index comprising of investment managers which trade a broad range of strategies in which the investment process is predicated on movements in underlying economic variables and the impact these have on equity, fixed income, hard currency and commodity markets. Managers employ a variety of techniques, both discretionary and systematic analysis, combinations of top down and bottom up theses, quantitative and fundamental approaches and long and short-term holding periods. Both index returns and index methodology are provided by Hedge Fund Research Inc. Index returns are updated periodically and are subject to change. Returns were accurate as of the publication date of this presentation.
|
| (b) |
S&P 500® Total Return Index is the Standard & Poor's composite index of 500 stocks, a widely recognized, unmanaged index of common stock prices.
|
Returns of less than 1 year are cumulative.
Indices are not actively managed and do not reflect deduction for fees, expenses or taxes. An investor cannot invest directly in an index.
The returns shown above do not reflect the deduction of taxes a shareholder would pay on Fund distributions or redemption of Fund shares.
Maximum Offering Price (MOP) for Class A shares includes the Fund’s maximum sales charge of 5.50%. Performance shown at NAV does not include these sales charges and would have been lower had it been taken into account. If you invest $1 million or more, either as a lump sum or through the Fund's accumulation or letter of intent programs, you can purchase Class A shares without an initial sales charge (Load); however, a Contingent Deferred Sales Charge (“CDSC”) of 1.00% may apply to Class A shares redeemed within the first 18 months after a purchase in excess of $1 million. The total annual operating expenses and total annual operating expenses after fee waivers and/or reimbursement you may pay as an investor in the Fund’s Class A and Class I shares (as reported in the January 28, 2017 Prospectus) are 2.21% and 1.95% and 2.01% and 1.76%, respectively. The Fund’s investment adviser has contractually agreed to limit expenses through January 31, 2018.
|
Annual Report | September 30, 2017
|
5
|
|
Insignia Macro Fund
|
Portfolio Update
|
|
September 30, 2017 (Unaudited)
|
Performance of $10,000 Initial Investment (as of September 30, 2017)
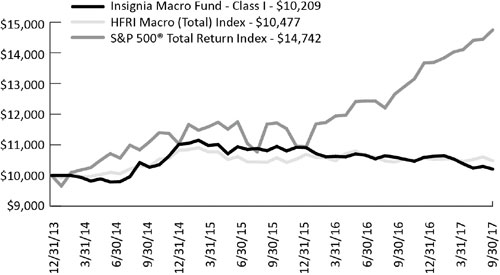
The graph shown above represents historical performance of a hypothetical investment of $10,000 in the Fund since inception. Past performance does not guarantee future results. All returns reflect reinvested dividends, but do not reflect the deduction of taxes that a shareholder would pay on Fund distributions or the redemption of Fund shares.
Asset Allocation (as a % of Net Assets)*
|
Corporate Bonds
|
44.66%
|
|
Asset-Backed Securities
|
18.26%
|
|
Mortgage-Backed Securities
|
7.16%
|
|
U.S. Treasury Notes & Bonds
|
4.11%
|
|
Government Bond
|
0.64%
|
|
Municipal Bond
|
0.13%
|
|
Other Assets in Excess of Liabilities
|
25.04%
|
|
Total
|
100.00%
|
| * |
Holdings are subject to change, and may not reflect the current or future position of the portfolio. Tables present indicative values only.
|
|
6
|
www.insigniafunds.com
|
|
Insignia Macro Fund
|
Disclosure of Fund Expenses
|
|
September 30, 2017 (Unaudited)
|
Examples. As a shareholder of the Insignia Macro Fund (the “Fund”), you incur two types of costs: (1) transaction costs, including applicable redemption fees; and (2) ongoing costs, including management fees, distribution and service (12b-1) fees and other Fund expenses. The following examples are intended to help you understand your ongoing costs (in dollars) of investing in the Fund and to compare these costs with the ongoing costs of investing in other mutual funds. The examples are based on an investment of $1,000 invested on April 1, 2017 and held through September 30, 2017.
Actual Expenses. The first line under each class in the table below provides information about actual account values and actual expenses. You may use the information in this line, together with the amount you invested, to estimate the expenses that you paid over the period. Simply divide your account value by $1,000 (for example, an $8,600 account value divided by $1,000 = 8.6), then multiply the result by the number in the first line under the heading “Expenses Paid During Period April 1, 2017 – September 30, 2017” to estimate the expenses you paid on your account during this period.
Hypothetical Example for Comparison Purposes. The second line under each class in the table below provides information about hypothetical account values and hypothetical expenses based on the Fund’s actual expense ratio and an assumed rate of return of 5% per year before expenses, which is not the Fund’s actual return. The hypothetical account values and expenses may not be used to estimate the actual ending account balance or expenses you paid for the period. You may use this information to compare the ongoing costs of investing in the Fund and other mutual funds. To do so, compare this 5% hypothetical example with the 5% hypothetical examples that appear in the shareholder reports of the other funds.
Please note that the expenses shown in the table are meant to highlight your ongoing Fund costs only and do not reflect any transactional costs, such as redemption fees. Therefore, the second line under each class in the table below is useful in comparing ongoing costs only and will not help you determine the relative total costs of owning different funds. In addition, if these transactional costs were included, your costs would have been higher.
|
Beginning
Account Value April 1, 2017 |
Ending
Account Value September 30, 2017 |
Expense
Ratio(a)(b) |
Expenses Paid,
and During Period April 1, 2017 - September 30, 2017(c) |
|
|
Class A
|
||||
|
Actual
|
$1,000.00
|
$960.80
|
2.00%
|
$9.83
|
|
Hypothetical (5% return before expenses)
|
$1,000.00
|
$1,015.04
|
2.00%
|
$10.10
|
|
Class I
|
||||
|
Actual
|
$1,000.00
|
$961.80
|
1.75%
|
$8.61
|
|
Hypothetical (5% return before expenses)
|
$1,000.00
|
$1,016.29
|
1.75%
|
$8.85
|
| (a) |
The Fund's expense ratios have been annualized based on the Fund's most recent fiscal half-year expenses.
|
| (b) |
Includes expenses of the Insignia Macro Cayman Fund (wholly-owned subsidiary).
|
| (c) |
Expenses are equal to the Fund’s annualized expense ratio, multiplied by the average account value over the period, multiplied by the number of days in the most recent fiscal half year (183), divided by 365.
|
|
Annual Report | September 30, 2017
|
7
|
|
Insignia Macro Fund
|
Consolidated Portfolio of Investments
|
|
September 30, 2017
|
|
Principal Amount
|
Value (Note 2)
|
|||||||
|
ASSET-BACKED SECURITIES (18.26%)
|
||||||||
|
Automobile (7.73%)
|
||||||||
|
CarMax Auto Owner Trust
|
||||||||
|
Series 2016-2, 1.520% 02/16/2021
|
$
|
400,000
|
$
|
399,224
|
||||
|
Series 2014-1, 1.930% 11/15/2019
|
220,000
|
220,303
|
||||||
|
Ford Credit Auto Owner Trust
|
||||||||
|
Series 2014-A, 1.900% 09/15/2019
|
445,000
|
445,916
|
||||||
|
Honda Auto Receivables Trust
|
||||||||
|
Series 2015-1, 1.050% 10/15/2018
|
185,434
|
185,326
|
||||||
|
Series 2016-4, 1.210% 12/18/2020
|
400,000
|
397,222
|
||||||
|
Series 2016-1, 1.220% 12/18/2019
|
109,785
|
109,548
|
||||||
|
Hyundai Auto Receivables Trust
|
||||||||
|
Series 2015-B A3, 1.120% 11/15/2019
|
234,931
|
234,514
|
||||||
|
Series 2017-B, 1.570% 08/17/2020
|
75,000
|
74,979
|
||||||
|
Series 2013-C, 2.100% 03/15/2019
|
233,978
|
234,077
|
||||||
|
Nissan Auto Receivables Owner Trust
|
||||||||
|
Series 2015-C, 0.870% 11/15/2018
|
11,376
|
11,374
|
||||||
|
Series 2015-A, 1.050% 10/15/2019
|
255,632
|
255,253
|
||||||
|
Series 2016-C, 1.180% 01/15/2021
|
325,000
|
322,707
|
||||||
|
Series 2016-A, 1.340% 10/15/2020
|
145,000
|
144,627
|
||||||
|
Toyota Auto Receivables Owner Trust
|
||||||||
|
Series 2016-C, 1.000% 01/15/2019
|
137,214
|
137,126
|
||||||
|
Series 2016-A, 1.030% 07/16/2018
|
31,402
|
31,397
|
||||||
|
Series 2016-D, 1.230% 10/15/2020
|
460,000
|
457,391
|
||||||
|
Total Automobile
|
3,660,984
|
|||||||
|
Credit Card (10.53%)
|
||||||||
|
American Express Credit Account Master Trust
|
||||||||
|
Series 2014-1, 1M US L + 0.37% 12/15/2021(a)
|
750,000
|
753,486
|
||||||
|
Bank of America Credit Card Trust
|
||||||||
|
Series 2015-A2, 1.360% 09/15/2020
|
150,000
|
149,938
|
||||||
|
Series 2014-A1, 1M US L + 0.38% 06/15/2021(a)
|
605,000
|
607,299
|
||||||
|
Capital One Multi-Asset Execution Trust
|
||||||||
|
Series 2016-A3, 1.340% 04/15/2022
|
330,000
|
327,660
|
||||||
|
Series 2016-A2, 1M US L + 0.63% 02/15/2024(a)
|
400,000
|
405,704
|
||||||
|
Chase Issuance Trust
|
||||||||
|
Series 2016-A2, 1.370% 06/15/2021
|
730,000
|
725,301
|
||||||
|
Citibank Credit Card Issuance Trust
|
||||||||
|
Series 2014-A8, 1.730% 04/09/2020
|
605,000
|
605,774
|
||||||
|
Series 2017-A2, 1.740% 01/19/2021
|
200,000
|
200,207
|
||||||
|
Discover Card Execution Note Trust
|
||||||||
|
Series 2014-A5, 1.390% 04/15/2020
|
500,000
|
500,002
|
||||||
|
Series 2013-A1, 1M US L + 0.30% 08/17/2020(a)
|
325,000
|
325,353
|
||||||
|
Synchrony Credit Card Master Note Trust
|
||||||||
|
Series 2015-2, 1.600% 04/15/2021
|
200,000
|
200,095
|
||||||
|
See Notes to Consolidated Financial Statements.
|
|
8
|
www.insigniafunds.com
|
|
Insignia Macro Fund
|
Consolidated Portfolio of Investments
|
|
September 30, 2017
|
|
Principal Amount
|
Value (Note 2)
|
|||||||
|
Credit Card (continued)
|
||||||||
|
World Financial Network Credit Card Master Trust
|
||||||||
|
Series 2014-C, 1.540% 08/16/2021
|
$
|
190,000
|
$
|
190,014
|
||||
|
Total Credit Card
|
4,990,833
|
|||||||
|
TOTAL ASSET-BACKED SECURITIES (Cost $8,650,954)
|
8,651,817
|
|||||||
|
CORPORATE BONDS (44.66%)
|
||||||||
|
Basic Materials (1.03%)
|
||||||||
|
The Sherwin-Williams Co., Sr. Unsec. Notes
|
||||||||
|
1.350% 12/15/2017
|
486,000
|
485,757
|
||||||
|
Communications (5.34%)
|
||||||||
|
Amazon.com, Inc., Sr. Unsec. Notes
|
||||||||
|
1.200% 11/29/2017
|
195,000
|
194,973
|
||||||
|
AT&T, Inc., Sr. Unsec. Notes
|
||||||||
|
3M US L + 0.89% 02/14/2023(a)
|
190,000
|
189,720
|
||||||
|
3M US L + 0.93% 06/30/2020(a)
|
455,000
|
461,346
|
||||||
|
Cisco Systems, Inc., Sr. Unsec. Notes
|
||||||||
|
2.125% 03/01/2019
|
270,000
|
272,115
|
||||||
|
Comcast Corp., Sr. Sec. Notes
|
||||||||
|
6.300% 11/15/2017
|
240,000
|
241,345
|
||||||
|
eBay, Inc., Sr. Unsec. Notes
|
||||||||
|
2.500% 03/09/2018
|
390,000
|
391,552
|
||||||
|
Time Warner Cable LLC, Sr. Sec. Notes
|
||||||||
|
6.750% 07/01/2018
|
365,000
|
378,015
|
||||||
|
Vodafone Group PLC, Sr. Unsec. Notes
|
||||||||
|
1.500% 02/19/2018
|
400,000
|
399,820
|
||||||
|
Total Communications
|
2,528,886
|
|||||||
|
Consumer, Cyclical (5.42%)
|
||||||||
|
CVS Health Corp., Sr. Unsec. Notes
|
||||||||
|
1.900% 07/20/2018
|
390,000
|
391,002
|
||||||
|
Ford Motor Credit Co. LLC, Sr. Unsec. Notes
|
||||||||
|
1.724% 12/06/2017
|
420,000
|
420,047
|
||||||
|
2.240% 06/15/2018
|
370,000
|
371,226
|
||||||
|
General Motors Co., Sr. Unsec. Notes
|
||||||||
|
3.500% 10/02/2018
|
190,000
|
193,126
|
||||||
|
McDonald's Corp., Sr. Unsec. Notes
|
||||||||
|
Series GMTN, 5.800% 10/15/2017
|
215,000
|
215,102
|
||||||
|
Toyota Motor Credit Corp., Sr. Unsec. Notes
|
||||||||
|
2.125% 07/18/2019
|
363,000
|
365,592
|
||||||
|
Wal-Mart Stores, Inc., Sr. Unsec. Notes
|
||||||||
|
1.125% 04/11/2018
|
211,000
|
210,726
|
||||||
|
See Notes to Consolidated Financial Statements.
|
|
Annual Report | September 30, 2017
|
9
|
|
Insignia Macro Fund
|
Consolidated Portfolio of Investments
|
|
September 30, 2017
|
|
Principal Amount
|
Value (Note 2)
|
|||||||
|
Consumer, Cyclical (continued)
|
||||||||
|
Whirlpool Corp., Sr. Unsec. Notes
|
||||||||
|
1.650% 11/01/2017
|
$
|
400,000
|
$
|
400,022
|
||||
|
Total Consumer, Cyclical
|
2,566,843
|
|||||||
|
Consumer, Non-cyclical (4.51%)
|
||||||||
|
Abbott Laboratories, Sr. Unsec. Notes
|
||||||||
|
2.350% 11/22/2019
|
362,000
|
365,090
|
||||||
|
AbbVie, Inc., Sr. Unsec. Notes
|
||||||||
|
1.800% 05/14/2018
|
395,000
|
395,605
|
||||||
|
Actavis Funding SCS, Sr. Unsec. Notes
|
||||||||
|
3M US L + 1.255% 03/12/2020(a)
|
395,000
|
402,496
|
||||||
|
Gilead Sciences, Inc., Sr. Unsec. Notes
|
||||||||
|
1.850% 09/20/2019
|
185,000
|
185,198
|
||||||
|
Kroger Co., Sr. Unsec. Notes
|
||||||||
|
2.000% 01/15/2019
|
250,000
|
250,495
|
||||||
|
Target Corp., Sr. Unsec. Notes
|
||||||||
|
6.000% 01/15/2018
|
250,000
|
253,161
|
||||||
|
Tyson Foods, Inc., Sr. Unsec. Notes
|
||||||||
|
3M US L + 0.55% 06/02/2020(a)
|
285,000
|
286,467
|
||||||
|
Total Consumer, Non-cyclical
|
2,138,512
|
|||||||
|
Energy (3.75%)
|
||||||||
|
BP Capital Markets PLC, Sr. Sec. Notes
|
||||||||
|
1.375% 05/10/2018
|
395,000
|
394,785
|
||||||
|
Chevron Corp., Sr. Unsec. Notes
|
||||||||
|
1.104% 12/05/2017
|
400,000
|
399,818
|
||||||
|
ConocoPhillips Co., Sr. Unsec. Notes
|
||||||||
|
1.050% 12/15/2017
|
445,000
|
444,684
|
||||||
|
Enbridge Energy Partners, Sr. Unsec. Notes
|
||||||||
|
Series B, 6.500% 04/15/2018
|
190,000
|
194,741
|
||||||
|
Energy Transfer LP, Sr. Unsec. Notes
|
||||||||
|
2.500% 06/15/2018
|
340,000
|
341,391
|
||||||
|
Total Energy
|
1,775,419
|
|||||||
|
Financial (16.63%)
|
||||||||
|
Air Lease Corp., Sr. Unsec. Notes
|
||||||||
|
2.125% 01/15/2018
|
195,000
|
195,226
|
||||||
|
American Express Co., Sr. Unsec. Notes
|
||||||||
|
7.000% 03/19/2018
|
350,000
|
358,668
|
||||||
|
Bank of America Corp., Sr. Unsec. Notes
|
||||||||
|
Series L, 2.650% 04/01/2019
|
385,000
|
388,571
|
||||||
|
5.650% 05/01/2018
|
195,000
|
199,479
|
||||||
|
Bank Of New York Mellon, Sr. Unsec. Notes
|
||||||||
|
Series G, 2.200% 05/15/2019
|
195,000
|
196,163
|
||||||
|
See Notes to Consolidated Financial Statements.
|
|
10
|
www.insigniafunds.com
|
|
Insignia Macro Fund
|
Consolidated Portfolio of Investments
|
|
September 30, 2017
|
|
Principal Amount
|
Value (Note 2)
|
|||||||
|
Financial (continued)
|
||||||||
|
The Bank of Nova Scotia, Sr. Unsec. Notes
|
||||||||
|
1.375% 12/18/2017
|
$
|
405,000
|
$
|
404,968
|
||||
|
Barclays Bank PLC, Sr. Unsec. Notes
|
||||||||
|
3M US L + 0.55% 08/07/2019(a)
|
180,000
|
180,360
|
||||||
|
BNP Paribas SA, Sr. Sec. Notes
|
||||||||
|
2.400% 12/12/2018
|
155,000
|
156,199
|
||||||
|
Branch Banking & Trust Co., Sr. Unsec. Notes
|
||||||||
|
3M US L + 0.45% 01/15/2020(a)
|
250,000
|
250,941
|
||||||
|
Citigroup, Inc., Sr. Unsec. Notes
|
||||||||
|
1.800% 02/05/2018
|
405,000
|
405,163
|
||||||
|
2.500% 09/26/2018
|
60,000
|
60,378
|
||||||
|
6.125% 11/21/2017
|
95,000
|
95,570
|
||||||
|
The Goldman Sachs Group, Inc., Sr. Unsec. Notes
|
||||||||
|
Series FRN, 3M US L + 1.77% 02/25/2021(a)
|
645,000
|
669,287
|
||||||
|
International Lease Finance Corp., Sr. Unsec. Notes
|
||||||||
|
3.875% 04/15/2018
|
300,000
|
303,363
|
||||||
|
Jefferies Group LLC, Sr. Unsec. Notes
|
||||||||
|
5.125% 04/13/2018
|
302,000
|
307,338
|
||||||
|
JPMorgan Chase & Co., Sr. Unsec. Notes
|
||||||||
|
3M US L + 1.48% 03/01/2021(a)
|
455,000
|
469,784
|
||||||
|
MetLife, Inc., Sr. Unsec. Notes
|
||||||||
|
1.756% 12/15/2017
|
445,000
|
445,306
|
||||||
|
Realty Income Corp., Sr. Unsec. Notes
|
||||||||
|
2.000% 01/31/2018
|
410,000
|
410,379
|
||||||
|
Royal Bank of Canada, Sr. Unsec. Notes
|
||||||||
|
1.500% 01/16/2018
|
125,000
|
124,999
|
||||||
|
Series GMTN, 1.800% 07/30/2018
|
310,000
|
310,755
|
||||||
|
Sumitomo Mitsui Financial Group, Inc., Sr. Unsec. Notes
|
||||||||
|
3M US L + 1.68% 03/09/2021(a)
|
285,000
|
294,781
|
||||||
|
UBS AG, Sr. Unsec. Notes
|
||||||||
|
5.875% 12/20/2017
|
135,000
|
136,261
|
||||||
|
US Bancorp, Sr. Unsec. Notes
|
||||||||
|
3M US L + 0.64% 01/24/2022(a)
|
525,000
|
527,504
|
||||||
|
Ventas Realty LP / Ventas Capital Corp., Sr. Unsec. Notes
|
||||||||
|
2.000% 02/15/2018
|
410,000
|
410,403
|
||||||
|
Visa, Inc., Sr. Unsec. Notes
|
||||||||
|
1.200% 12/14/2017
|
83,000
|
83,031
|
||||||
|
Wells Fargo & Co., Sr. Unsec. Notes
|
||||||||
|
2.125% 04/22/2019
|
270,000
|
271,521
|
||||||
|
5.625% 12/11/2017
|
225,000
|
226,746
|
||||||
|
Total Financial
|
7,883,144
|
|||||||
|
Industrial (3.66%)
|
||||||||
|
Eaton Corp., Sr. Unsec. Notes
|
||||||||
|
1.500% 11/02/2017
|
460,000
|
459,976
|
||||||
|
See Notes to Consolidated Financial Statements.
|
|
Annual Report | September 30, 2017
|
11
|
|
Insignia Macro Fund
|
Consolidated Portfolio of Investments
|
|
September 30, 2017
|
|
Principal Amount
|
Value (Note 2)
|
|||||||
|
Industrial (continued)
|
||||||||
|
General Electric Co., Sr. Unsec. Notes
|
||||||||
|
5.250% 12/06/2017
|
$
|
395,000
|
$
|
397,767
|
||||
|
United Parcel Service, Inc., Sr. Unsec. Notes
|
||||||||
|
5.500% 01/15/2018
|
250,000
|
252,740
|
||||||
|
United Technologies Corp., Sr. Unsec. Notes
|
||||||||
|
3M US L + 0.35% 11/01/2019(a)
|
410,000
|
412,152
|
||||||
|
Vulcan Materials Co., Sr. Unsec. Notes
|
||||||||
|
3M US L + 0.60% 06/15/2020(a)
|
210,000
|
210,211
|
||||||
|
Total Industrial
|
1,732,846
|
|||||||
|
Technology (3.57%)
|
||||||||
|
Apple, Inc., Sr. Unsec. Notes
|
||||||||
|
3M US L + 0.50% 02/09/2022(a)
|
400,000
|
405,743
|
||||||
|
Intel Corp., Sr. Unsec. Notes
|
||||||||
|
1.350% 12/15/2017
|
475,000
|
475,066
|
||||||
|
Microsoft Corp., Sr. Unsec. Notes
|
||||||||
|
0.875% 11/15/2017
|
395,000
|
394,783
|
||||||
|
Oracle Corp., Sr. Unsec. Notes
|
||||||||
|
1.200% 10/15/2017
|
415,000
|
414,952
|
||||||
|
Total Technology
|
1,690,544
|
|||||||
|
Utilities (0.75%)
|
||||||||
|
American Electric Power Co., Inc., Sr. Unsec. Notes
|
||||||||
|
Series E, 1.650% 12/15/2017
|
354,000
|
354,030
|
||||||
|
TOTAL CORPORATE BONDS (Cost $21,113,527)
|
21,155,981
|
|||||||
|
GOVERNMENT BONDS (0.64%)
|
||||||||
|
Export-Import Bank of Korea, Sr. Unsec. Notes
|
||||||||
|
1.750% 02/27/2018
|
305,000
|
304,746
|
||||||
|
TOTAL GOVERNMENT BONDS (Cost $305,054)
|
304,746
|
|||||||
|
MORTGAGE-BACKED SECURITIES (7.16%)
|
||||||||
|
Commercial (2.57%)
|
||||||||
|
CFCRE Commercial Mortgage Trust
|
||||||||
|
Series 2011-C2, 3.061% 12/15/2047
|
2,085
|
2,084
|
||||||
|
COMM Mortgage Trust
|
||||||||
|
Series 2013-CR6, 2.122% 03/10/2046
|
227,032
|
227,207
|
||||||
|
Series 2013-LC13, 3.009% 08/10/2046
|
200,000
|
202,153
|
||||||
|
See Notes to Consolidated Financial Statements.
|
|
12
|
www.insigniafunds.com
|
|
Insignia Macro Fund
|
Consolidated Portfolio of Investments
|
|
September 30, 2017
|
|
Principal Amount
|
Value (Note 2)
|
|||||||
|
Commercial (continued)
|
||||||||
|
WFRBS Commercial Mortgage Trust
|
||||||||
|
Series 2014-C22, 1.479% 09/15/2057
|
$
|
347,681
|
$
|
346,646
|
||||
|
Series 2013-C13, 1.964% 05/15/2045
|
405,000
|
405,445
|
||||||
|
Series 2013-C11, 2.029% 03/15/2045
|
36,142
|
36,127
|
||||||
|
Total Commercial
|
|
1,219,662
|
||||||
|
U.S. Government Agency (4.59%)
|
||||||||
|
Fannie Mae Connecticut Avenue Securities
|
||||||||
|
Series 2017-C05, 1M US L + 0.55% 01/25/2030(a)
|
355,402
|
355,312
|
||||||
|
Series 2014-C02, 1M US L + 0.95% 05/25/2024(a)
|
171,093
|
171,761
|
||||||
|
Series 2017-C03, 1M US L + 0.95% 10/25/2029(a)
|
460,237
|
462,559
|
||||||
|
Series 2014-C03, 1M US L + 1.20% 07/25/2024(a)
|
67,381
|
67,458
|
||||||
|
Series 2016-C06, 1M US L + 1.30% 04/25/2029(a)
|
596,566
|
603,655
|
||||||
|
Series 2016-C04, 1M US L + 1.45% 01/25/2029(a)
|
504,582
|
509,366
|
||||||
|
Total U.S. Government Agency
|
2,170,111
|
|||||||
|
TOTAL MORTGAGE-BACKED SECURITIES (Cost $3,381,929)
|
3,389,773
|
|||||||
|
MUNICIPAL BONDS (0.13%)
|
||||||||
|
Revenue Bonds (0.13%)
|
||||||||
|
Louisiana Local Government Environmental Facilities & Community Development Authority, Prefunded 10/01/17 @ 100
|
||||||||
|
4.500% 10/01/2029(b)
|
60,000
|
60,000
|
||||||
|
TOTAL MUNICIPAL BONDS (Cost $61,564)
|
60,000
|
|||||||
|
U.S. TREASURY NOTES & BONDS (4.11%)
|
||||||||
|
U.S. Treasury Note
|
||||||||
|
1.250% 11/30/2018
|
1,585,000
|
1,582,461
|
||||||
|
1.375% 09/30/2018
|
365,000
|
365,029
|
||||||
|
TOTAL U.S. TREASURY NOTES & BONDS (Cost $1,950,100)
|
1,947,490
|
|||||||
|
See Notes to Consolidated Financial Statements.
|
|
Annual Report | September 30, 2017
|
13
|
|
Insignia Macro Fund
|
Consolidated Portfolio of Investments
|
|
September 30, 2017
|
|
TOTAL INVESTMENTS (74.96%) (Cost $35,463,128)
|
$
|
35,509,807
|
||
|
Other Assets In Excess Of Liabilities (25.04%)
|
11,863,395
|
(c)
|
||
|
NET ASSETS (100.00%)
|
$
|
47,373,202
|
| (a) |
Floating or variable rate security. The reference rate is described below. The rate in effect as of September 30, 2017 is based on the reference rate plus the displayed spread as of the security’s last reset date.
|
| (b) |
Prefunded Issues are bonds which are prerefunded and collateralized by U.S. Treasury securities held in escrow and used to pay principal and interest on tax-exempt issues and to retire the bonds in full at the earliest refunding date.
|
| (c) |
Includes cash which is being held as collateral for swap contracts.
|
Investment Abbreviations:
LIBOR - London Interbank Offered Rate
LIBOR Rates:
1M US L - 1 Month LIBOR as of September 30, 2017 was 1.23%
3M US L - 3 Month LIBOR as of September 30, 2017 was 1.33%
Common Abbreviations:
GMTN - Global Medium Term Notes.
For Fund compliance purposes, the Fund's industry classifications refer to any one or more of the industry sub-classifications used by one or more widely recognized market indices or ratings group indices, and/or as defined by Fund management. This definition may not apply for purposes of this report, which may combine industry sub-classifications for reporting ease. Industries are shown as a percentage of the Fund's net assets. (Unaudited)
|
See Notes to Consolidated Financial Statements.
|
|
14
|
www.insigniafunds.com
|
|
Insignia Macro Fund
|
Consolidated Portfolio of Investments
|
September 30, 2017
TOTAL RETURN SWAP CONTRACTS
Total return swap with Deutsche Bank AG, London Branch. The swap provides exposure to the total returns on a basket of independent managers that is calculated on a daily basis with reference to a customized index that is also proprietary to Deutsche Bank. The basket is comprised of a diversified collection of global macroeconomic and managed futures trading strategies including discretionary and systematic trading programs. Under the terms of the swap, the adviser has the ability to periodically adjust the notional level of the swap, the notional allocation to each manager and the mix of trading programs. The swap was effective on March 5, 2014 and has a term of five years unless earlier terminated. Early termination may be triggered by either party. In addition, the swap provides for a 0.50% fee paid to Deutsche Bank in exchange for the return on the custom basket. (Notional Value $39,413,930) (Value $36,186,462)
|
Exposure by Manager
|
||
|
Underlying Manager
|
Exposure*
|
Strategy Description
|
|
H2O Asset Management
|
17.65%
|
Discretionary Macro | Fundamental
|
|
QMS Capital Management
|
13.35%
|
Quantitative | Fundamental & Technical Models
|
|
FORT
|
13.20%
|
Quantitative | Trend Anticipation
|
|
The Cambridge Strategy
|
11.81%
|
Quantitative | Fundamental & Technical Models
|
|
Quantitative Investment Mgmt.
|
11.79%
|
Fundamental & Technical Models
|
|
Abraham Trading Company
|
9.78%
|
Quantitative | Technical Models
|
|
Millburn Ridgefield Corporation
|
8.69%
|
Quantitative | Technical Models
|
| * |
Based on total Net Assets.
|
Custom Index Exposure by Type
|
Number of Contracts
|
Notional
Amount |
Percentage of Notional |
Expiration Date
|
||||||||||
|
Agricultural Futures
|
|||||||||||||
|
Long
|
|||||||||||||
|
Corn Future
|
75.45
|
$
|
1,326,536
|
0.11
|
% |
12/14/17
|
|||||||
|
Soybeans Future
|
31.09
|
1,486,196
|
0.12
|
% |
11/14/17
|
||||||||
|
106.54
|
2,812,732
|
0.23
|
% | ||||||||||
|
Bond Futures
|
|||||||||||||
|
Long
|
|||||||||||||
|
10 year Australian Treasury
|
|||||||||||||
|
Bond Future
|
13.42
|
13,013,784
|
1.06
|
% |
12/15/17
|
||||||||
|
10 year Italian Bond Future
|
33.45
|
4,515,057
|
0.37
|
% |
12/7/17
|
||||||||
|
10 year US Treasury
|
|||||||||||||
|
Notes Future
|
69.08
|
8,661,991
|
0.70
|
% |
12/19/17
|
||||||||
|
30 year US Treasury
|
|||||||||||||
|
Bonds Future
|
19.35
|
2,954,741
|
0.24
|
% |
12/19/17
|
||||||||
|
Long Gilt Future
|
26.63
|
3,299,087
|
0.27
|
% |
12/27/17
|
||||||||
|
161.93
|
32,444,660
|
2.64
|
% | ||||||||||
See Notes to Consolidated Financial Statements.
|
Annual Report | September 30, 2017
|
15
|
|
Insignia Macro Fund
|
Consolidated Portfolio of Investments
|
September 30, 2017
|
|
Number of Contracts
|
Notional Amount
|
Percentage of Notional
|
Expiration Date
|
|||||||||
|
|
|||||||||||||
|
Short
|
|||||||||||||
|
10 year Canadian Govt Bond Future
|
32.27
|
$
|
4,379,659
|
0.36
|
%
|
12/18/17
|
|||||||
|
10 year Japanese Goverment Bond Future
|
1.11
|
166,814,225
|
13.56
|
%
|
12/13/17
|
||||||||
|
2 year Euro‐Schatz Future
|
14.28
|
1,600,831
|
0.13
|
%
|
12/7/17
|
||||||||
|
2 year US Treasury Notes Future
|
46.13
|
9,952,873
|
0.81
|
%
|
12/29/17
|
||||||||
|
3 year Australian Treasury Bond Future
|
29.34
|
8,832,519
|
0.72
|
%
|
12/15/17
|
||||||||
|
5 year US Treasury Notes Future
|
78.67
|
9,246,355
|
0.75
|
%
|
12/29/17
|
||||||||
|
Euro‐BUND Future
|
8.49
|
1,367,710
|
0.11
|
%
|
12/7/17
|
||||||||
|
|
210.29
|
202,194,171
|
16.43
|
%
|
|||||||||
|
|
|||||||||||||
|
Energy Futures
|
|||||||||||||
|
Long
|
|||||||||||||
|
Brent Crude Monthly Future
|
28.62
|
1,624,191
|
0.13
|
%
|
11/30/17
|
||||||||
|
Gasoil Monthly Future
|
24.42
|
1,324,562
|
0.11
|
%
|
11/10/17
|
||||||||
|
Light Sweet Crude Oil (WTI) Future
|
61.71
|
3,196,801
|
0.26
|
%
|
11/20/17
|
||||||||
|
|
114.75
|
6,145,554
|
0.50
|
%
|
|||||||||
|
|
|||||||||||||
|
Short
|
|||||||||||||
|
Light Sweet Crude Oil
|
|||||||||||||
|
(WTI) Future
|
78.44
|
4,037,946
|
0.33
|
%
|
10/20/17
|
||||||||
|
|
78.44
|
4,037,946
|
0.33
|
%
|
|||||||||
|
|
|||||||||||||
|
Equity Futures
|
|||||||||||||
|
Long
|
|||||||||||||
|
DAX Index Future
|
9.16
|
2,925,588
|
0.24
|
%
|
12/15/17
|
||||||||
|
DJ EURO STOXX Banks Future
|
195.83
|
1,347,322
|
0.11
|
%
|
12/15/17
|
||||||||
|
E‐mini Dow
|
20.38
|
2,274,077
|
0.18
|
%
|
12/15/17
|
||||||||
|
Nikkei 225 Future
|
12.16
|
247,489,342
|
20.11
|
%
|
12/7/17
|
||||||||
|
Nikkei 225 Index
|
8.91
|
90,702,072
|
7.37
|
%
|
12/7/17
|
||||||||
|
Nikkei 225 Mini (JPY) Future
|
22.21
|
45,202,963
|
3.67
|
%
|
12/7/17
|
||||||||
|
OSE JPX‐Nikkei Index 400 Future
|
6.85
|
10,133,020
|
0.82
|
%
|
12/7/17
|
||||||||
|
TOPIX Future
|
24.15
|
404,715,079
|
32.89
|
%
|
12/7/17
|
||||||||
|
|
299.65
|
804,789,463
|
65.40
|
%
|
|||||||||
See Notes to Consolidated Financial Statements.
|
16
|
www.insigniafunds.com
|
|
Insignia Macro Fund
|
Consolidated Portfolio of Investments
|
September 30, 2017
|
|
Number of Contracts
|
Notional Amount
|
Percentage of Notional
|
Expiration Date
|
|||||||||
|
|
|||||||||||||
|
Short
|
|||||||||||||
|
E‐Mini S&P 500
|
11.40
|
$
|
1,431,630
|
0.12
|
%
|
12/15/17
|
|||||||
|
Hang Seng Index
|
3.41
|
4,697,956
|
0.38
|
%
|
10/30/17
|
||||||||
|
Nikkei 225 (JPY) Future
|
1.20
|
12,256,693
|
1.00
|
%
|
12/7/17
|
||||||||
|
OMXS30
|
27.78
|
4,542,723
|
0.37
|
%
|
10/20/17
|
||||||||
|
|
43.79
|
22,929,002
|
1.86
|
%
|
|||||||||
|
|
|||||||||||||
|
FX Futures
|
|||||||||||||
|
Long
|
|||||||||||||
|
AUD/USD
|
21.74
|
1,703,066
|
0.14
|
%
|
12/18/17
|
||||||||
|
EUR/CHF
|
9.41
|
1,345,778
|
0.11
|
%
|
12/18/17
|
||||||||
|
EUR/JPY
|
4.71
|
78,323,363
|
6.36
|
%
|
12/18/17
|
||||||||
|
EUR/USD
|
16.59
|
2,460,027
|
0.20
|
%
|
12/18/17
|
||||||||
|
|
52.44
|
83,832,234
|
6.81
|
%
|
|||||||||
|
|
|||||||||||||
|
Short
|
|||||||||||||
|
JPY/USD
|
14.68
|
1,635,671
|
0.13
|
%
|
12/18/17
|
||||||||
|
|
14.68
|
1,635,671
|
0.13
|
%
|
|||||||||
|
|
|||||||||||||
|
Interest Rate Futures
|
|||||||||||||
|
Long
|
|||||||||||||
|
3 month Sterling
|
18.31
|
2,271,415
|
0.18
|
%
|
6/20/18
|
||||||||
|
3 month Sterling
|
17.26
|
2,136,705
|
0.17
|
%
|
3/20/19
|
||||||||
|
3 month Sterling
|
16.73
|
2,072,341
|
0.17
|
%
|
12/19/18
|
||||||||
|
3 month Sterling
|
11.45
|
1,415,772
|
0.12
|
%
|
9/18/19
|
||||||||
|
Eurodollar
|
16.90
|
4,154,081
|
0.34
|
%
|
6/18/18
|
||||||||
|
Eurodollar
|
6.69
|
1,646,164
|
0.13
|
%
|
3/19/18
|
||||||||
|
Eurodollar
|
6.07
|
1,490,367
|
0.12
|
%
|
12/17/18
|
||||||||
|
|
93.41
|
15,186,846
|
1.23
|
%
|
|||||||||
|
|
|||||||||||||
|
Short
|
|||||||||||||
|
3 month Euro (EURIBOR)
|
9.71
|
2,433,897
|
0.20
|
%
|
9/17/18
|
||||||||
|
3 month Euro (EURIBOR)
|
7.22
|
1,809,965
|
0.15
|
%
|
6/18/18
|
||||||||
|
3 month Euro (EURIBOR)
|
5.72
|
1,435,014
|
0.12
|
%
|
3/19/18
|
||||||||
|
90 Day Bank Accepted
|
|||||||||||||
|
Bill Future
|
5.36
|
1,284,982
|
0.10
|
%
|
3/8/18
|
||||||||
|
Eurodollar
|
27.61
|
6,778,985
|
0.55
|
%
|
9/17/18
|
||||||||
|
Three Month Canadian Bankers Acceptance Future
|
5.58
|
1,370,758
|
0.11
|
%
|
3/19/18
|
||||||||
|
Three Month Euroyen Future
|
0.39
|
9,774,324
|
0.79
|
%
|
12/18/17
|
||||||||
|
|
61.59
|
24,887,924
|
2.02
|
%
|
|||||||||
See Notes to Consolidated Financial Statements.
|
Annual Report | September 30, 2017
|
17
|
|
Insignia Macro Fund
|
Consolidated Portfolio of Investments
|
September 30, 2017
|
Number of Contracts
|
Notional Amount
|
Percentage of Notional
|
Expiration Date
|
||||||||||
|
Precious Metal Futures
|
|||||||||||||
|
Long
|
|||||||||||||
|
Gold
|
10.43
|
$
|
1,342,481
|
0.11
|
%
|
12/27/17
|
|||||||
|
10.43
|
1,342,481
|
0.11
|
%
|
||||||||||
|
Total
|
1,247.96
|
$
|
1,202,238,685
|
97.69
|
%
|
||||||||
|
Unrealized Depreciation
|
||||||||||||||||
|
$
|
(3,227,468
|
)
|
||||||||||||||
Total return swap with Societe Generale Newedge UK Limited. The swap provides exposure to the total returns on a basket of independent managers that is calculated on a daily basis with reference to a customized index that is also proprietary to Societe Generale Newedge UK Limited. The basket is comprised of a diversified collection of global macroeconomic and managed futures trading strategies including discretionary and systematic trading programs. Under the terms of the swap, the adviser has the ability to periodically adjust the notional level of the swap, the notional allocation to each manager, and the mix of trading programs. The swap was effective on October 15, 2014 and may be terminated by either party with at least two business days notice to the other party. In addition, the swap provides for a 0.50% fee paid to Societe Generale Newedge UK Limited in exchange for the return on the custom basket. (Notional Value $7,544,972) (Value $6,601,246)
|
Exposure by Manager
|
||
|
Underlying Manager
|
Exposure*
|
Strategy Description
|
|
Willowbridge Associates
|
13.94%
|
Discretionary Macro | Fundamental
|
| * |
Based on total Net Assets.
|
Custom Index Exposure by Type
|
Number of Contracts
|
Notional Amount
|
Percentage of Notional
|
Expiration Date
|
||||||||||
|
Base Metals
|
|||||||||||||
|
Long
|
|||||||||||||
|
Aluminum LME
|
5.00
|
$
|
262,134
|
0.34
|
%
|
Dec‐17
|
|||||||
|
Copper LME
|
4.00
|
678,229
|
0.88
|
%
|
Dec‐17
|
||||||||
|
Nickel LME
|
3.00
|
211,753
|
0.27
|
%
|
Dec‐17
|
||||||||
|
12.00
|
1,152,116
|
1.49
|
%
|
||||||||||
|
Short
|
|||||||||||||
|
Aluminum LME
|
5.00
|
259,249
|
0.34
|
%
|
Dec‐17
|
||||||||
|
Copper LME
|
4.00
|
654,230
|
0.85
|
%
|
Dec‐17
|
||||||||
|
Nickel LME
|
3.00
|
198,901
|
0.26
|
%
|
Dec‐17
|
||||||||
|
12.00
|
1,112,380
|
1.45
|
%
|
||||||||||
See Notes to Consolidated Financial Statements.
|
18
|
www.insigniafunds.com
|
|
Insignia Macro Fund
|
Consolidated Portfolio of Investments
|
September 30, 2017
|
Number of Contracts
|
Notional Amount
|
Percentage of Notional
|
Expiration Date
|
||||||||||||
|
Interest Rates Long Term
|
|||||||||||||||
|
Short
|
|||||||||||||||
|
Euro BTP Futures
|
10.00
|
$
|
1,348,330
|
1.75
|
%
|
Dec‐17
|
|||||||||
|
10.00
|
1,348,330
|
1.75
|
%
|
||||||||||||
|
Interest Rates Medium Term
|
|||||||||||||||
|
Short
|
|||||||||||||||
|
5 Year Treasury Note
|
54.00
|
6,329,830
|
8.19
|
%
|
Dec‐17
|
||||||||||
|
ERX BOBL
|
368.00
|
11,105,430
|
14.37
|
%
|
Nov 17 ‐
Dec 17
|
||||||||||
|
422.00
|
17,435,260
|
22.56
|
%
|
||||||||||||
|
Interest Rates Short Term
|
|||||||||||||||
|
Long
|
|||||||||||||||
|
Euro Dollars
|
104.00
|
25,525,500
|
33.04
|
%
|
Jun‐19
|
||||||||||
|
104.00
|
25,525,500
|
33.04
|
%
|
||||||||||||
|
Short
|
|||||||||||||||
|
Euro Dollars
|
104.00
|
25,483,250
|
32.98
|
%
|
Jun‐20
|
||||||||||
|
104.00
|
25,483,250
|
32.98
|
%
|
||||||||||||
|
Stock Indicies
|
|||||||||||||||
|
Long
|
|||||||||||||||
|
Emini S&P
|
21.00
|
48,825
|
0.06
|
%
|
Dec‐17
|
||||||||||
|
S&P Composite
|
7.00
|
68,664
|
0.09
|
%
|
Dec‐17
|
||||||||||
|
28.00
|
117,489
|
0.15
|
%
|
||||||||||||
|
Short
|
|||||||||||||||
|
Emini S&P
|
35.00
|
4,344,490
|
5.62
|
%
|
Dec‐17
|
||||||||||
|
35.00
|
4,344,490
|
5.62
|
%
|
||||||||||||
|
U.S. Major Cross
|
|||||||||||||||
|
Short
|
|||||||||||||||
|
EUR/USD CME
|
5.00
|
738,162
|
0.96
|
%
|
Dec‐17
|
||||||||||
|
5.00
|
738,162
|
0.96
|
%
|
||||||||||||
|
Total
|
732.00
|
77,256,977
|
100.00
|
%
|
|||||||||||
|
Unrealized Depreciation
|
||||||||||||||||
| $ |
(943,726
|
) | ||||||||||||||
|
Total Net Unrealized Depreciation on Swap Contracts
|
||||||||||||||||
| $ |
(4,171,194
|
) |
See Notes to Consolidated Financial Statements.
|
Annual Report | September 30, 2017
|
19
|
|
Insignia Macro Fund
|
Consolidated Statement of Assets and Liabilities
|
September 30, 2017
|
ASSETS:
|
||||
|
Investments, at value (cost $35,463,128)
|
$
|
35,509,807
|
||
|
Cash
|
6,119,537
|
|||
|
Deposit with broker for swap contracts (Note 3)
|
7,730,781
|
|||
|
Advance receipt on swap contract
|
4,050,000
|
|||
|
Receivable for swap contract payments
|
1,487,372
|
|||
|
Receivable for shares sold
|
411
|
|||
|
Interest and dividends receivable
|
158,362
|
|||
|
Prepaid swap premiums
|
844,563
|
|||
|
Prepaid expenses and other assets
|
4,871
|
|||
|
Total Assets
|
55,905,704
|
|||
|
LIABILITIES:
|
||||
|
Payable for advance payment on swap contract
|
4,050,000
|
|||
|
Unrealized depreciation on swap contracts
|
4,171,194
|
|||
|
Payable for swap contract payments
|
17,679
|
|||
|
Payable for investments purchased
|
180,409
|
|||
|
Payable to adviser
|
46,598
|
|||
|
Professional fees payable
|
24,740
|
|||
|
Payable for administration fees
|
24,337
|
|||
|
Payable for distribution and service fees
|
84
|
|||
|
Payable to Chief Compliance Officer
|
2,228
|
|||
|
Accrued expenses and other liabilities
|
15,233
|
|||
|
Total Liabilities
|
8,532,502
|
|||
|
NET ASSETS
|
$
|
47,373,202
|
||
|
NET ASSETS CONSIST OF:
|
||||
|
Paid‐in capital (Note 7)
|
$
|
51,679,744
|
||
|
Accumulated net investment income
|
174,053
|
|||
|
Accumulated net realized loss
|
(356,080
|
)
|
||
|
Net unrealized depreciation
|
(4,124,515
|
)
|
||
|
NET ASSETS
|
$
|
47,373,202
|
||
|
PRICING OF SHARES
|
||||
|
Class A:
|
||||
|
Net Asset Value, offering and redemption price per share
|
$
|
9.57
|
||
|
Net Assets
|
$
|
407,167
|
||
|
Shares of beneficial interest outstanding
|
42,527
|
|||
|
Maximum offering price per share (NAV/0.945, based on maximum sales charge of 5.50% of the offering price)
|
$
|
10.13
|
||
|
Class I:
|
||||
|
Net Asset Value, offering and redemption price per share
|
$
|
9.58
|
||
|
Net Assets
|
$
|
46,966,035
|
||
|
Shares of beneficial interest outstanding
|
4,904,782
|
|||
See Notes to Consolidated Financial Statements.
|
20
|
www.insigniafunds.com
|
|
Insignia Macro Fund
|
Consolidated Statement of Operations
|
For the Year ended September 30, 2017
|
INVESTMENT INCOME:
|
||||
|
Interest
|
$
|
555,662
|
||
|
Foreign taxes withheld
|
(67
|
)
|
||
|
Total Investment Income
|
555,595
|
|||
|
|
||||
|
EXPENSES:
|
||||
|
Investment advisory fee (Note 8)
|
671,648
|
|||
|
Administration fee
|
193,374
|
|||
|
Distribution and service fees
|
||||
|
Class A
|
968
|
|||
|
Custodian fee
|
16,019
|
|||
|
Legal fees
|
14,919
|
|||
|
Audit and tax fees
|
26,550
|
|||
|
Transfer agent fee
|
46,273
|
|||
|
Trustees fees and expenses
|
7,030
|
|||
|
Registration fees
|
32,303
|
|||
|
Printing fees
|
3,243
|
|||
|
Chief Compliance Officer fee
|
22,089
|
|||
|
Insurance expense
|
2,871
|
|||
|
Other expenses
|
12,308
|
|||
|
Total Expenses
|
1,049,595
|
|||
|
Less fees waived/reimbursed by investment adviser
|
||||
|
Class A
|
(791
|
)
|
||
|
Class I
|
(108,036
|
)
|
||
|
Total fees waived/reimbursed by investment adviser (Note 8)
|
(108,827
|
)
|
||
|
Net Expenses
|
940,768
|
|||
|
NET INVESTMENT LOSS
|
(385,173
|
)
|
||
|
|
||||
|
REALIZED AND UNREALIZED GAIN/(LOSS) ON INVESTMENTS:
|
||||
|
Net realized gain/(loss) on:
|
||||
|
Investments
|
(61,584
|
)
|
||
|
Swap contracts
|
712,312
|
|||
|
Net realized gain
|
650,728
|
|||
|
|
||||
|
Change in unrealized appreciation/(depreciation) on:
|
||||
|
Investments
|
23,269
|
|||
|
Swap contracts
|
(1,866,025
|
)
|
||
|
Net change
|
(1,842,756
|
)
|
||
|
|
||||
|
NET REALIZED AND UNREALIZED LOSS ON INVESTMENTS
|
(1,192,028
|
)
|
||
|
NET DECREASE IN NET ASSETS RESULTING FROM OPERATIONS
|
$
|
(1,577,201
|
)
|
|
See Notes to Consolidated Financial Statements.
|
Annual Report | September 30, 2017
|
21
|
|
Insignia Macro Fund
|
Consolidated Statements of Changes in Net Assets
|
|
For the Year Ended
September 30, 2017 |
For the Year Ended
September 30, 2016 |
|||||||
|
OPERATIONS:
|
||||||||
|
Net investment loss
|
$
|
(385,173
|
)
|
$
|
(612,637
|
)
|
||
|
Net realized gain
|
650,728
|
619,980
|
||||||
|
Long‐term capital gain distributions from other investment companies
|
–
|
8,835
|
||||||
|
Net change in unrealized depreciation
|
(1,842,756
|
)
|
(1,853,298
|
)
|
||||
|
Net decrease in net assets resulting from operations
|
(1,577,201
|
)
|
(1,837,120
|
)
|
||||
|
DISTRIBUTIONS TO SHAREHOLDERS:
|
0
|
0
|
||||||
|
From net investment income
|
||||||||
|
Class A
|
(340
|
)
|
(16,366
|
)
|
||||
|
Class I
|
(86,251
|
)
|
(3,584,295
|
)
|
||||
|
Total distributions
|
(86,591
|
)
|
(3,600,661
|
)
|
||||
|
BENEFICIAL SHARE TRANSACTIONS (Note 7):
|
||||||||
|
Class A
|
||||||||
|
Shares sold
|
165,735
|
270,991
|
||||||
|
Dividends reinvested
|
340
|
16,367
|
||||||
|
Shares redeemed
|
(62,945
|
)
|
(216,343
|
)
|
||||
|
Redemption fees
|
–
|
445
|
||||||
|
Net increase from beneficial share transactions
|
103,130
|
71,460
|
||||||
|
Class I
|
||||||||
|
Shares sold
|
5,031,639
|
8,163,166
|
||||||
|
Dividends reinvested
|
5,877
|
718,228
|
||||||
|
Shares redeemed
|
(14,600,869
|
)
|
(9,543,928
|
)
|
||||
|
Redemption fees
|
5
|
32
|
||||||
|
Net decrease from beneficial share transactions
|
(9,563,348
|
)
|
(662,502
|
)
|
||||
|
Net decrease in net assets
|
(11,124,010
|
)
|
(6,028,823
|
)
|
||||
|
NET ASSETS:
|
||||||||
|
Beginning of year
|
58,497,212
|
64,526,035
|
||||||
|
End of year(including accumulated net investment income of $174,053 and $86,582)
|
$
|
47,373,202
|
$
|
58,497,212
|
||||
See Notes to Consolidated Financial Statements.
|
22
|
www.insigniafunds.com
|
|
Insignia Macro Fund - Class A
|
Consolidated Financial Highlights
|
For a share outstanding through the periods presented.
|
For the Year
Ended September 30, 2017 |
For the Year
Ended September 30, 2016 |
For the Year
Ended September 30, 2015 |
For the Period Ended
September 30, 2014(a) |
|||||||||||||
|
NET ASSET VALUE, BEGINNING OF PERIOD
|
$
|
9.90
|
$
|
10.82
|
$
|
10.42
|
$
|
10.00
|
||||||||
|
INCOME/(LOSS) FROM OPERATIONS:
|
||||||||||||||||
|
Net investment loss(b)
|
(0.09
|
)
|
(0.13
|
)
|
(0.16
|
)
|
(0.08
|
)
|
||||||||
|
Net realized and unrealized gain/(loss) on investments and swap contracts
|
(0.23
|
)
|
(0.21
|
)
|
0.61
|
0.50
|
||||||||||
|
Total from investment operations
|
(0.32
|
)
|
(0.34
|
)
|
0.45
|
0.42
|
||||||||||
|
LESS DISTRIBUTIONS:
|
||||||||||||||||
|
From investment income
|
(0.01
|
)
|
(0.60
|
)
|
(0.04
|
)
|
–
|
|||||||||
|
From net realized gain on investments
|
–
|
–
|
(0.01
|
)
|
–
|
|||||||||||
|
Total distributions
|
(0.01
|
)
|
(0.60
|
)
|
(0.05
|
)
|
–
|
|||||||||
|
REDEMPTION FEES (Note 7)
|
–
|
0.02
|
–
|
–
|
||||||||||||
|
NET INCREASE/(DECREASE) IN NET ASSET VALUE
|
(0.33
|
)
|
(0.92
|
)
|
0.40
|
0.42
|
||||||||||
|
NET ASSET VALUE, END OF PERIOD
|
$
|
9.57
|
$
|
9.90
|
$
|
10.82
|
$
|
10.42
|
||||||||
|
TOTAL RETURN(c)
|
(3.25
|
%)
|
(3.12
|
%)(d)
|
4.34
|
%
|
4.20
|
%
|
||||||||
See Notes to Consolidated Financial Statements.
|
Annual Report | September 30, 2017
|
23
|
|
Insignia Macro Fund - Class A
|
Consolidated Financial Highlights
|
For a share outstanding through the periods presented.
|
For the Year Ended
September 30, 2017 |
For the Year Ended
September 30, 2016 |
For the Year Ended
September 30, 2015 |
For the Period Ended
September 30, 2014(a) |
|||||||||||||
|
SUPPLEMENTAL DATA:
|
||||||||||||||||
|
Net assets, end of period (in 000s)
|
$
|
407
|
$
|
319
|
$
|
274
|
$
|
85
|
||||||||
|
RATIOS TO AVERAGE NET ASSETS
|
||||||||||||||||
|
Operating expenses excluding reimbursement/waiver
|
2.20
|
%
|
2.20
|
%
|
2.40
|
%
|
80.48
|
%(e)
|
||||||||
|
Operating expenses including reimbursement/waiver
|
2.00
|
%
|
2.00
|
%
|
1.96
|
%(f)
|
1.75
|
%(e)
|
||||||||
|
Net investment loss including reimbursement/waiver
|
(0.95
|
%)
|
(1.26
|
%)
|
(1.44
|
%)
|
(1.03
|
%)(e)
|
||||||||
|
PORTFOLIO TURNOVER RATE(g)
|
129
|
%
|
132
|
%
|
119
|
%
|
43
|
%
|
||||||||
| (a) |
Commenced operations on January 2, 2014.
|
| (b) |
Calculated using the average shares method.
|
| (c) |
Assumes an initial investment on the business day before the first day of the fiscal period, with all dividends and distributions reinvested in additional shares on the reinvestment date, and redemption at the net asset value calculated on the last business day of the fiscal year. Total returns are for the period indicated and have not been annualized. Total returns would have been lower had certain expenses not been waived during the period. Returns shown do not reflect the deduction of taxes that a shareholder would pay on Fund distributions or the redemption of Fund shares. Returns shown exclude any applicable sales charge.
|
| (d) |
In 2016, the Fund's total return includes a voluntary reimbursement by the adviser for a realized investment loss. Excluding this item, total return would not change as the impact is less than 0.05%.
|
| (e) |
Annualized.
|
| (f) |
Contractual expense limitation changed from 1.75% to 2.00% effective February 1, 2015.
|
| (g) |
Portfolio turnover rate for periods less than one full year have not been annualized.
|
See Notes to Consolidated Financial Statements.
|
24
|
www.insigniafunds.com
|
|
Insignia Macro Fund - Class I
|
Consolidated Financial Highlights
|
|
For a share outstanding through the periods presented.
|
|
For the Year Ended
September 30, 2017 |
For the Year Ended
September 30, 2016 |
For the Year Ended
September 30, 2015 |
For the Period Ended
September 30, 2014(a) |
|||||||||||||
|
NET ASSET VALUE, BEGINNING OF PERIOD
|
$
|
9.90
|
$
|
10.82
|
$
|
10.42
|
$
|
10.00
|
||||||||
|
INCOME/(LOSS) FROM OPERATIONS:
|
||||||||||||||||
|
Net investment loss(b)
|
(0.07
|
)
|
(0.10
|
)
|
(0.13
|
)
|
(0.06
|
)
|
||||||||
|
Net realized and unrealized gain/(loss) on investments and swap contracts
|
(0.24
|
)
|
(0.21
|
)
|
0.59
|
0.48
|
||||||||||
|
Total from investment operations
|
(0.31
|
)
|
(0.31
|
)
|
0.46
|
0.42
|
||||||||||
|
LESS DISTRIBUTIONS:
|
||||||||||||||||
|
From investment income
|
(0.01
|
)
|
(0.61
|
)
|
(0.05
|
)
|
–
|
|||||||||
|
From net realized gain on investments
|
–
|
–
|
(0.01
|
)
|
–
|
|||||||||||
|
Total distributions
|
(0.01
|
)
|
(0.61
|
)
|
(0.06
|
)
|
–
|
|||||||||
|
REDEMPTION FEES (Note 7)
|
0.00
|
(c)
|
0.00
|
(c)
|
0.00
|
(c)
|
0.00
|
(c)
|
||||||||
|
NET INCREASE/(DECREASE) IN NET ASSET VALUE
|
(0.32
|
)
|
(0.92
|
)
|
0.40
|
0.42
|
||||||||||
|
NET ASSET VALUE, END OF PERIOD
|
$
|
9.58
|
$
|
9.90
|
$
|
10.82
|
$
|
10.42
|
||||||||
|
TOTAL RETURN(d)
|
(3.09
|
%)
|
(3.06
|
%)(e)
|
4.39
|
%
|
4.20
|
%
|
||||||||
|
See Notes to Consolidated Financial Statements.
|
|
Annual Report | September 30, 2017
|
25
|
|
Insignia Macro Fund - Class I
|
Consolidated Financial Highlights
|
|
For a share outstanding through the periods presented.
|
|
For the Year Ended
September 30, 2017 |
For the Year Ended
September 30, 2016 |
For the Year Ended
September 30, 2015 |
For the Period Ended
September 30, 2014(a) |
|||||||||||||
|
SUPPLEMENTAL DATA:
|
||||||||||||||||
|
Net assets, end of period (in 000s)
|
$
|
46,966
|
$
|
58,178
|
$
|
64,252
|
$
|
24,017
|
||||||||
|
RATIOS TO AVERAGE NET ASSETS
|
||||||||||||||||
|
Operating expenses excluding reimbursement/waiver
|
1.95
|
%
|
1.94
|
%
|
2.17
|
%
|
3.62
|
%(f)
|
||||||||
|
Operating expenses including reimbursement/waiver
|
1.75
|
%
|
1.75
|
%
|
1.69
|
%(g)
|
1.50
|
%(f)
|
||||||||
|
Net investment loss including reimbursement/waiver
|
(0.72
|
%)
|
(1.01
|
%)
|
(1.18
|
%)
|
(0.85
|
%)(f)
|
||||||||
|
PORTFOLIO TURNOVER RATE(h)
|
129
|
%
|
132
|
%
|
119
|
%
|
43
|
%
|
||||||||
|
(a)
|
Commenced operations on January 2, 2014.
|
|
(b)
|
Calculated using the average shares method.
|
|
(c)
|
Less than $0.005 per share.
|
|
(d)
|
Assumes an initial investment on the business day before the first day of the fiscal period, with all dividends and distributions reinvested in additional shares on the reinvestment date, and redemption at the net asset value calculated on the last business day of the fiscal year. Total returns are for the period indicated and have not been annualized. Total returns would have been lower had certain expenses not been waived during the period. Returns shown do not reflect the deduction of taxes that a shareholder would pay on Fund distributions or the redemption of Fund shares.
|
|
(e)
|
In 2016, the Fund's total return includes a voluntary reimbursement by the adviser for a realized investment loss. Excluding this item, total return would not change as the impact is less than 0.05%.
|
|
(f)
|
Annualized.
|
|
(g)
|
Contractual expense limitation changed from 1.50% to 1.75% effective February 1, 2015.
|
|
(h)
|
Portfolio turnover rate for periods less than one full year have not been annualized.
|
|
See Notes to Consolidated Financial Statements.
|
|
26
|
www.insigniafunds.com
|
|
Insignia Macro Fund
|
Notes to Consolidated Financial Statements
|
|
September 30, 2017
|
1. ORGANIZATION
ALPS Series Trust (the “Trust”), a Delaware statutory trust, is an open‐end management investment company registered under the Investment Company Act of 1940, as amended (the “1940 Act”). The Trust consists of multiple separate portfolios or series. This annual report describes the Insignia Macro Fund (the “Fund”). The Fund’s primary investment objective is to seek long‐term risk‐adjusted total return. The Fund currently offers Class A shares and Class I shares. Each share class has identical rights to earnings, assets and voting privileges, except for class specific expenses and exclusive rights to vote on matters affecting only individual classes. The Board of Trustees (the “Board”) may establish additional funds and classes of shares at any time in the future without shareholder approval.
Basis of Consolidation: Insignia Global Macro Offshore Ltd. (the “Subsidiary”), a Cayman Islands exempted company, was incorporated on September 27, 2013 and is a wholly owned subsidiary of the Fund. The Subsidiary acts as an investment vehicle for the Fund in order to effect certain commodity‐related investments on behalf of the Fund. The Fund is the sole shareholder of the Subsidiary, and it is intended that the Fund will remain the sole shareholder and will continue to wholly own and control the Subsidiary. Under the Articles of Association of the Subsidiary, shares issued by the Subsidiary confer upon a shareholder the right to vote at general meetings of the Subsidiary and certain rights in connection with any winding‐up or repayment of capital, as well as the right to participate in the profits or assets of the Subsidiary. The Fund may invest up to 25% of its total assets in shares of the Subsidiary. As a wholly owned subsidiary of the Fund, the investments of the Subsidiary are included in the Consolidated Portfolio of Investments, Consolidated Financial Statements and Financial Highlights of the Fund. All investments held by the Subsidiary are disclosed in the accounts of the Fund. All intercompany accounts and transactions have been eliminated in consolidation. The Subsidiary will be subject to the same investment restrictions and limitations, and follow the same compliance policies and procedures, as the Fund when viewed on a consolidation basis. As of September 30, 2017, net assets of the Fund were $47,373,202, of which $7,662,434, or 16.17%, represented the Fund’s ownership of all issued shares and voting rights of the Subsidiary. The Fund and the Subsidiary are "commodity pools" under the U.S. Commodity Exchange Act, and the Adviser is a "commodity pool operator" registered with and regulated by the CFTC. In addition, the Sub‐Adviser is a "commodity trading adviser" registered and regulated by the CFTC.
2. SIGNIFICANT ACCOUNTING POLICIES
The accompanying consolidated financial statements were prepared in accordance with accounting principles generally accepted in the United States of America for investment companies (“U.S. GAAP”). The Fund is considered an investment company under U.S. GAAP and follows the accounting and reporting guidance applicable to investment companies in the Financial Accounting Standards Board Accounting Standards Codification Topic 946. The preparation of financial statements in conformity with U.S. GAAP requires management to make certain estimates and assumptions that affect the reported amounts of assets and liabilities and disclosures of contingent assets and liabilities at the date of the financial statements and the reported amounts of revenue and expenses during the period. Actual results could differ from those estimates. The following is a summary of significant accounting policies consistently followed by the Fund in preparation of its consolidated financial statements.
|
Annual Report | September 30, 2017
|
27
|
|
Insignia Macro Fund
|
Notes to Consolidated Financial Statements
|
|
September 30, 2017
|
Investment Valuation: The Fund generally values its securities based on market prices determined at the close of regular trading on the New York Stock Exchange (“NYSE”), normally 4:00 p.m. Eastern Time, on each day the NYSE is open for trading.
Over‐the‐counter swap contracts for which market quotations are readily available are valued based on quotes received from independent pricing services or dealers that make markets in such securities. Total return swap contracts are stated at fair value daily based on the underlying futures, foreign currency and options contracts constituting the contracts' stated index, taking into account fees and expenses associated with the swap agreement.
Redeemable securities issued by open‐end registered investment companies are valued at the investment company’s applicable net asset value with the exception of exchange‐traded open‐end investment companies, which are priced as equity securities.
The market price for debt obligations is generally the price supplied by an independent third‐party pricing service approved by the Board, which may use a matrix, formula or other objective method that takes into consideration quotations from dealers, market transactions in comparable investments, market indices and yield curves. If vendors are unable to supply a price, or if the price supplied is deemed to be unreliable, the market price may be determined using quotations received from one or more broker dealers that make a market in the security.
When such prices or quotations are not available, or when the fair value committee appointed by the Board believes that they are unreliable, securities may be priced using fair value procedures approved by the Board.
Fair Value Measurements: The Fund discloses the classification of its fair value measurements following a three‐tier hierarchy based on the inputs used to measure fair value. Inputs refer broadly to the assumptions that market participants would use in pricing the asset or liability, including assumptions about risk. Inputs may be observable or unobservable. Observable inputs reflect the assumptions market participants would use in pricing the asset or liability that are developed based on market data obtained from sources independent of the reporting entity. Unobservable inputs reflect the reporting entity’s own assumptions about the assumptions market participants would use in pricing the asset or liability that are developed based on the best information available.
Various inputs are used in determining the value of the Fund’s investments as of the end of the reporting period. When inputs used fall into different levels of the fair value hierarchy, the level in the hierarchy within which the fair value measurement falls is determined based on the lowest level input that is significant to the fair value measurement in its entirety. The designated input levels are not necessarily an indication of the risk or liquidity associated with these investments. These inputs are categorized in the following hierarchy under applicable financial accounting standards:
|
Level 1 –
|
Unadjusted quoted prices in active markets for identical investments, unrestricted assets or liabilities that the Fund has the ability to access at the measurement date;
|
|
28
|
www.insigniafunds.com
|
|
Insignia Macro Fund
|
Notes to Consolidated Financial Statements
|
|
September 30, 2017
|
|
Level 2 –
|
Quoted prices which are not active, quoted prices for similar assets or liabilities in active markets or inputs other than quoted prices that are observable (either directly or indirectly); and
|
|
Level 3 –
|
Significant unobservable prices or inputs (including the Fund’s own assumptions in determining the fair value of investments) where there is little or no market activity for the asset or liability at the measurement date.
|
The following is a summary of the inputs used to value the Fund’s investments as of September 30, 2017:
|
Investments in Securities at Value
|
Level 1 -
Unadjusted Quoted Prices |
Level 2 -
Other Significant Observable Inputs |
Level 3 -
Significant Unobservable Inputs |
Total
|
||||||||||||
|
Asset‐Backed Securities
|
$
|
–
|
$
|
8,651,817
|
$
|
–
|
$
|
8,651,817
|
||||||||
|
Corporate Bonds
|
||||||||||||||||
|
Basic Materials
|
–
|
485,757
|
–
|
485,757
|
||||||||||||
|
Communications
|
–
|
2,528,886
|
–
|
2,528,886
|
||||||||||||
|
Consumer, Cyclical
|
–
|
2,566,843
|
–
|
2,566,843
|
||||||||||||
|
Consumer, Non‐cyclical
|
–
|
2,138,512
|
–
|
2,138,512
|
||||||||||||
|
Energy
|
–
|
1,775,419
|
–
|
1,775,419
|
||||||||||||
|
Financial
|
–
|
7,883,144
|
–
|
7,883,144
|
||||||||||||
|
Industrial
|
–
|
1,732,846
|
–
|
1,732,846
|
||||||||||||
|
Technology
|
–
|
1,690,544
|
–
|
1,690,544
|
||||||||||||
|
Utilities
|
–
|
354,030
|
–
|
354,030
|
||||||||||||
|
Government Bonds
|
–
|
304,746
|
–
|
304,746
|
||||||||||||
|
Mortgage‐Backed Securities
|
–
|
3,389,773
|
–
|
3,389,773
|
||||||||||||
|
Municipal Bonds
|
–
|
60,000
|
–
|
60,000
|
||||||||||||
|
U.S. Treasury Notes & Bonds
|
–
|
1,947,490
|
–
|
1,947,490
|
||||||||||||
|
TOTAL
|
$
|
–
|
$
|
35,509,807
|
$
|
–
|
$
|
35,509,807
|
||||||||
| Valuation Inputs | ||||||||||||||||
|
Other Financial Instruments
|
Level 1
|
Level 2
|
Level 3
|
Total
|
||||||||||||
|
Liabilities:
|
||||||||||||||||
|
Total Return Swap Contracts
|
$
|
–
|
$
|
(4,171,194
|
)
|
$
|
–
|
$
|
(4,171,194
|
)
|
||||||
|
Total
|
$
|
–
|
$
|
(4,171,194
|
)
|
$
|
–
|
$
|
(4,171,194
|
)
|
||||||
The Fund recognizes transfers between levels as of the end of the period. For the fiscal year ended September 30, 2017, the Fund did not have any transfers between Level 1 and Level 2 securities. There were no Level 3 securities held during the period.
Trust Expenses: Some expenses of the Trust can be directly attributed to the Fund. Expenses that cannot be directly attributed to the Fund are apportioned among all funds in the Trust based on average net assets of each fund.
|
Annual Report | September 30, 2017
|
29
|
|
Insignia Macro Fund
|
Notes to Consolidated Financial Statements
|
|
September 30, 2017
|
Fund Expenses: Some expenses can be directly attributed to the Fund and are apportioned among the classes based on average net assets of each class.
Class Expenses: Expenses that are specific to a class of shares are charged directly to that share class. Fees provided under the distribution (Rule 12b‐1) and/or shareholder service plans for a particular class of the Fund are charged to the operations of such class.
Federal Income Taxes: The Fund complies with the requirements under Subchapter M of the Internal Revenue Code of 1986, as amended, applicable to regulated investment companies and intends to distribute substantially all of its net taxable income and net capital gains, if any, each year so that it will not be subject to excise tax on undistributed income and gains. The Fund is not subject to income taxes to the extent such distributions are made.
As of and during the fiscal year ended September 30, 2017, the Fund did not have a liability for any unrecognized tax benefits in the accompanying consolidated financial statements. The Funds recognize interest and penalties, if any, related to tax liabilities as income tax expense in the Consolidated Statement of Operations. The Fund files U.S. federal, state and local income tax returns as required. The Fund’s tax returns are subject to examination by the relevant tax authorities until expiration of the applicable statute of limitations, which is generally three years after the filing of the tax return for federal purposes and four years for most state returns. The Fund’s administrator has analyzed the Fund’s tax positions taken on federal and state income tax returns for all open tax years and has concluded that as of September 30, 2017, no provision for income tax is required in the Fund’s consolidated financial statements related to these tax positions. For tax purposes, the Subsidiary is an exempt Cayman Islands investment company and has received an undertaking from the Government of the Cayman Islands exempting it from all local income, profits, and capital gains taxes. No such taxes are levied in the Cayman Islands at the present time. For U.S. income tax purposes, the Subsidiary is a controlled foreign corporation ("CFC") and as such is not subject to U.S. income tax. However, as a wholly‐owned CFC, the net income and capital gain of the CFC, to the extent of its earnings and profits, will be included each year in the Fund's taxable income.
Investment Transactions and Investment Income: Investment transactions are accounted for on the date the investments are purchased or sold (trade date basis). Realized gains and losses from investment transactions are reported on an identified cost basis. Interest income, which includes accretion of discounts and amortization of premiums, is accrued and recorded as earned using the effective yield method. Dividend income is recognized on the ex‐dividend date, or for certain foreign securities, as soon as information is available to the Fund. Withholding taxes on foreign dividends have been provided for in accordance with the Fund's understanding of the applicable country's tax rules and rates. All of the realized and unrealized gains and losses and net investment income are allocated daily to each class in proportion to its average daily net assets.
Foreign Securities: The Fund may directly purchase securities of foreign issuers. Investing in securities of foreign issuers involves special risks not typically associated with investing in securities of U.S. issuers. The risks include possible re‐evaluation of currencies, the inability to repatriate foreign currency, less complete financial information about companies and possible future adverse political and economic developments. Moreover, securities of many foreign issuers and their markets may be less liquid and their prices more volatile than those of securities of comparable U.S. issuers.
|
30
|
www.insigniafunds.com
|
|
Insignia Macro Fund
|
Notes to Consolidated Financial Statements
|
|
September 30, 2017
|
Foreign currency: Investment securities and other assets and liabilities denominated in foreign currencies are translated into U.S. dollar amounts at the date of valuation. Purchases and sales of investment securities and income and expense items denominated in foreign currencies are translated into U.S. dollar amounts on the respective dates of such transactions.
The Fund does not isolate that portion of the results of operations resulting from changes in foreign exchange rates on investments from the fluctuations arising from changes in market prices of securities held. Such fluctuations are included with the net realized and unrealized gain or loss from investments.
Reported net realized foreign exchange gains or losses arise from sales of foreign currencies, currency gains or losses realized between the trade and settlement dates on securities transactions, and the difference between the amounts of dividends, interest, and foreign withholding taxes recorded on the Fund's books and the U.S. dollar equivalent of the amounts actually received or paid. Net unrealized foreign exchange gains and losses arise from changes in the fair values of assets and liabilities, other than investments in securities at fiscal period‐end, resulting from changes in exchange rates.
Foreign Exchange Transactions: The Fund may enter into foreign currency spot contracts to facilitate transactions in foreign securities or to convert foreign currency receipts into U.S. dollars. A foreign currency spot contract is an agreement between two parties to buy and sell currencies at the current market rate, for settlement generally within two business days. The U.S. dollar value of the contracts is determined using current currency exchange rates supplied by a pricing service. The contract is marked‐to‐market daily for settlements beyond one day and any change in market value is recorded as an unrealized gain or loss. When the contract is closed, the Fund records a realized gain or loss equal to the difference between the value on the open and close date. Losses may arise from changes in the value of the foreign currency, or if the counterparties do not perform under the contract’s terms. The maximum potential loss from such contracts is the aggregate face value in U.S. dollars at the time the contract was opened.
Distributions to Shareholders: The Fund normally pays dividends, if any, and distributes capital gains, if any, on an annual basis. Income dividend distributions are derived from interest and other income the Fund receives from its investments, including short term capital gains. Long term capital gain distributions are derived from gains realized when the Fund sells a security it has owned for more than one year. The Fund may make additional distributions and dividends at other times if its portfolio manager or managers believe doing so may be necessary for the Fund to avoid or reduce taxes. Net investment income/(loss) and net realized gain/(loss) may differ for financial statement and tax purposes.
3. DERIVATIVE INSTRUMENTS
The Fund’s investment objectives permit the Fund to enter into various types of derivatives contracts, including, but not limited to, total return swaps and structured notes. In doing so, the Fund will employ strategies in differing combinations to permit it to increase, decrease, or change the level or types of exposure to market factors. Central to those strategies are features inherent in derivatives that make them more attractive for this purpose than equity or debt securities; they require little or no initial cash investment, they can focus exposure on only certain selected risk factors, and they may not require the ultimate receipt or delivery of the underlying security (or securities) to the contract. This may allow the Fund to pursue its objectives more quickly and efficiently than if it were to make direct purchases or sales of securities capable of affecting a similar response to market factors.
|
Annual Report | September 30, 2017
|
31
|
|
Insignia Macro Fund
|
Notes to Consolidated Financial Statements
|
|
September 30, 2017
|
Risk of Investing in Derivatives: The Fund’s use of derivatives can result in losses due to unanticipated changes in the market risk factors and the overall market. In instances where the Fund is using derivatives to decrease, or hedge, exposures to market risk factors for securities held by the Fund, there are also risks that those derivatives may not perform as expected resulting in losses for the combined or hedged positions.
Derivatives may have little or no initial cash investment relative to their market value exposure and therefore can produce significant gains or losses in excess of their cost. This use of embedded leverage allows the Fund to increase its market value exposure relative to its net assets and can substantially increase the volatility of the Fund’s performance.
Additional associated risks from investing in derivatives also exist and potentially could have significant effects on the valuation of the derivative and the Fund. Typically, the associated risks are not the risks that the Fund is attempting to increase or decrease exposure to, per its investment objective, but are the additional risks from investing in derivatives.
Examples of these associated risks are liquidity risk, which is the risk that the Fund will not be able to sell or close out the derivative in a timely manner, and counterparty credit risk, which is the risk that the counterparty will not fulfill its obligation to the Fund. In addition, use of derivatives may increase or decrease exposure to the following risk factors:
Equity Risk: Equity risk relates to the change in value of equity securities as they relate to increases or decreases in the general market. Associated risks can be different for each type of derivative and are discussed by each derivative type in the notes that follow.
Commodity Risk: Exposure to the commodities markets may subject the Fund to greater volatility than investments in traditional securities. Prices of various commodities may also be affected by factors, such as drought, floods, weather, livestock disease, embargoes, tariffs and other regulatory developments, which are unpredictable. The prices of commodities can also fluctuate widely due to supply and demand disruptions in major producing or consuming regions.
Foreign Currency Risk: Currency trading involves significant risks, including market risk, interest rate risk, country risk, counterparty credit risk and short sale risk. Market risk results from the price movement of foreign currency values in response to shifting market supply and demand.
Interest Rate Risk: Interest rate risk is the risk that fixed income securities will decline in value because of changes in interest rates. As nominal interest rates rise, the value of fixed income securities held by the Fund are likely to decrease. Securities with longer durations tend to be more sensitive to changes in interest rates, and are usually more volatile than equity securities.
|
32
|
www.insigniafunds.com
|
|
Insignia Macro Fund
|
Notes to Consolidated Financial Statements
|
|
September 30, 2017
|
Swap Contracts: The Fund enters into swap transactions to seek to increase total return. A total return swap entered into by the Fund is a derivative contract that transfers the market risk of underlying portfolios of futures, forward currency and options contracts (considered the "index" within each total return swap contract) between counterparties. The "notional amount" of each total return swap agreement is the agreed upon amount or value of the index used for calculating the returns that the parties to a swap agreement have agreed to exchange. Risks may arise as a result of the failure of the counterparty to the swap contract to comply with the terms of the swap contract. The loss incurred by the failure of a counterparty is generally limited to the net payment to be received by the Fund and/or the termination value at the end of the contract.
The Fund considers the creditworthiness of each counterparty to a contract in evaluating potential credit risk. Additionally, risks may arise from unanticipated movements in interest rates or in the value of the underlying reference asset or index. Entering into these agreements involves, to varying degrees, market risk, liquidity risk and elements of credit, legal and documentation risk that are not directly reflected in the amounts recognized in the Consolidated Statement of Assets and Liabilities.
The Fund may pay or receive cash as collateral on these contracts which may be recorded as an asset and/or liability. The Fund must set aside liquid assets, or engage in other appropriate measures, to cover its obligations under these contracts. Swaps are marked‐to‐market daily and changes in value, including the accrual of periodic amounts of interest, are recorded daily based on the value of the index on which the total return swap is referenced, as defined within the total return swap agreement between the counterparties. The composition of the index may vary based on how the underlying portfolio of futures, forward currency and options contracts is traded. Daily changes in valuation of centrally cleared swaps, if any, are recorded as a receivable or payable for the change in value as appropriate (“variation margin”). Each day the Fund may pay or receive cash, equal to the variation margin of the centrally cleared swap. OTC swap payments received or paid at the beginning of the measurement period represent premiums paid or received upon entering into the swap agreement to compensate for differences between the stated terms of the swap agreement and prevailing market conditions (credit spreads, interest rates, and other relevant factors).
Generally, the basis of the OTC swaps is the unamortized premium received or paid. The periodic swap payments received or made by the Fund are recorded in the Consolidiated Statement of Operations as realized gains or losses, respectively. Cash settlement transfers are recorded as prepaid swap premiums on the Consolidated Assets and Liabilities and are recognized as realized gains and losses at the termination of the swap. Any upfront fees paid are recorded as assets and any upfront fees received are recorded as liabilities. When the swap is terminated, the Fund will record a realized gain or loss equal to the difference between the proceeds from (or cost of) the closing transaction and the Fund’s basis in the contract, if any. In addition, changes in notional value and any cash holding adjustments, which represent voluntary realizations by a Fund of swap value at any point in time, are also presented as net realized gain or loss on swap contracts on the consolidated statement of operations. A corresponding asset or liability for "advance receipt on swap contracts" or "advance payment on swap contracts", respectively, is recorded on the consolidated statement of assets and liabilities for the gain or loss realized on changes in notional value. Total return swaps outstanding at period end, if any, are listed after the Fund's consolidated portfolio of investments.
|
Annual Report | September 30, 2017
|
33
|
|
Insignia Macro Fund
|
Notes to Consolidated Financial Statements
|
September 30, 2017
The Fund invests in total return swaps to obtain exposure to a security or market without owning such security or investing directly in that market. Total return swaps are agreements in which there is an exchange of cash flows whereby one party commits to make payments based on the total return (coupons plus capital gains/losses) of an underlying instrument in exchange for fixed or floating rate interest payments. To the extent the total return of the instrument or index underlying the transaction exceeds or falls short of the offsetting interest rate obligation, the Fund will receive a payment from or make a payment to the counterparty. Swap agreements held at September 30, 2017 are disclosed in the Consolidated Portfolio of Investments.
The average notional value of the Fund’s swap positions for the fiscal year ended September 30, 2017 was $51,050,221.
Derivative Instruments: The following tables disclose the amounts related to the Fund’s use of derivative instruments.
The effect of derivative instruments on the Consolidated Statement of Assets and Liabilities as of September 30, 2017:
|
Derivatives Not Accounted for As Hedging Instruments
|
Consolidated Statement of Assets and Liabilities Location
|
Liability Derivatives Gross Unrealized Appreciation/
(Depreciation)
|
|||
|
Commodity Contracts (total return swap contracts)
|
Unrealized depreciation on swap contracts
|
$
|
(4,171,194
|
)
|
|
|
Total
|
$
|
(4,171,194
|
)
|
||
The effect of derivative instruments on the Consolidated Statement of Operations for the fiscal year ended September 30, 2017:
|
Derivatives Not Accounted for
As Hedging Instruments |
Consolidated Statement of Operations Location
|
Realized Gain on
Derivatives Recognized
|
Change in Unrealized
Depreciation on
Derivatives Recognized
|
||||||
|
Commodity Contracts (total return swap contracts)
|
Net realized gain/(loss) on Swap Contracts/ Change in unrealized appreciation/ (depreciation) on swap contracts
|
$
|
712,312
|
$
|
(1,866,025
|
)
|
|||
|
Total
|
$
|
712,312
|
$
|
(1,866,025
|
)
|
||||
4. OFFSETTING AGREEMENTS
Certain derivative contracts are executed under standardized netting agreements. A derivative netting arrangement creates an enforceable right of set‐off that becomes effective, and affects the realization of settlement on individual assets, liabilities and collateral amounts, only following a specified event of default or early termination. Default events may include the failure to make payments or deliver securities timely, material adverse changes in financial condition or insolvency, the breach of minimum regulatory capital requirements, or loss of license, charter or other legal authorization necessary to perform under the contract. The Fund may manage counterparty risk by entering into enforceable collateral arrangements with counterparties. These agreements mitigate counterparty credit risk by providing for a single net settlement with a counterparty of all financial transactions covered by the agreement in an event of default as defined under such agreement.
| 34 |
www.insigniafunds.com
|
|
Insignia Macro Fund
|
Notes to Consolidated Financial Statements
|
September 30, 2017
The following table presents derivative financial instruments that are subject to enforceable netting arrangements, collateral arrangements or other similar agreements as of September 30, 2017.
| Gross Amounts Not Offset in the Consolidated Statement of Assets and Liabilities | ||||||||||||||||||||||||
|
Gross Amounts of Recognized Liabilities
|
Gross Amounts Offset in the Consolidated Statement of Assets and Liabilities
|
Net Amounts Presented in the Consolidated Statement of Assets and Liabilities
|
Financial Instruments(a)
|
Cash Collateral Pledged(a)(b)
|
Net Amount Payable
|
|||||||||||||||||||
|
Liabilities
|
||||||||||||||||||||||||
|
Total Return Swap Contracts
|
$
|
4,171,194
|
$ |
–
|
$
|
4,171,194
|
$
|
–
|
$
|
(4,171,194
|
)
|
$ |
–
|
|||||||||||
|
Total
|
$
|
4,171,194
|
$ |
–
|
$
|
4,171,194
|
$
|
–
|
$
|
(4,171,194
|
)
|
$ |
–
|
|||||||||||
|
(a)
|
These amounts are limited to the derivative liability balance and, accordingly, do not include excess collateral pledged.
|
|
(b)
|
Includes cash collateral pledged and prepaid on swap premiums.
|
5. TAX BASIS INFORMATION
Tax Basis of Distributions to Shareholders: The character of distributions made during the period from net investment income or net realized gains may differ from its ultimate characterization for federal income tax purposes. Also, due to the timing of dividend distributions, the fiscal year in which amounts are distributed may differ from the fiscal year in which the income or realized gain were recorded by the Fund. The amounts and characteristics of tax basis distributions are estimated at the time of distribution and composition of distributable earnings/(accumulated losses) are finalized at fiscal year‐end.
|
Annual Report | September 30, 2017
|
35 |
|
Insignia Macro Fund
|
Notes to Consolidated Financial Statements
|
September 30, 2017
The tax characters of distributions paid by the Fund for the fiscal years ended September 30 were as follows:
|
Distributions Paid From:
|
2017
|
2016
|
||||||
|
Ordinary Income
|
$
|
86,591
|
$
|
3,600,661
|
||||
|
Total
|
$
|
86,591
|
$
|
3,600,661
|
||||
Reclassifications: As of September 30, 2017, permanent differences in book and tax accounting were reclassified. The following reclassifications have been made on the Consolidated Statement of Assets and Liabilities and have no impact on the net asset value of the Fund:
|
Paid-in Capital
|
Accumulated Net
Investment Income
|
Accumulated Net
Realized Loss on
Investments
|
|||||||||
|
$
|
225,713
|
$
|
559,235
|
$
|
(784,948
|
)
|
|||||
These reclassifications were primarily attributable to differing book and tax treatment of paydowns and income from CFC.
Unrealized Appreciation and Depreciation on Investments and Derivative Instruments: As of September 30, 2017, the aggregate cost of investments, gross unrealized appreciation / (deprecation) and net unrealized depreciation of investments and derivative instruments for Federal tax purposes were as follows:
|
Gross unrealized appreciation (excess of value over tax cost)(a)
|
$
|
40,933,942
|
||
|
Gross unrealized depreciation (excess of tax cost over value)(a)
|
(45,058,457
|
)
|
||
|
Net unrealized depreciation
|
$
|
(4,124,515
|
)
|
|
|
Cost of investments for income tax purposes
|
$
|
35,463,128
|
|
(a)
|
Includes appreciation/(depreciation) on Total Return Swap Contracts.
|
Components of Distributable Earnings: At September 30, 2017, components of distributable earnings were as follows:
|
Undistributed ordinary income
|
$
|
174,053
|
||
|
Accumulated capital losses
|
$
|
(356,080
|
)
|
|
|
Net unrealized depreciation
|
(4,124,515
|
)
|
||
|
Total
|
$
|
(4,306,542
|
)
|
Capital Losses
Capital losses as of September 30, 2017 deferred to the next tax year were as follows:
|
Non-Expiring
Short-Term |
Non-Expiring
Long-Term |
||||||
|
$
|
170,429
|
$
|
119,389
|
||||
| 36 |
www.insigniafunds.com
|
|
Insignia Macro Fund
|
Notes to Consolidated Financial Statements
|
September 30, 2017
The Fund elects to defer to the period ending September 30, 2018, capital losses recognized during the period November 1, 2016 to September 30, 2017 in the amount of $66,262.
6. SECURITIES TRANSACTIONS
Purchases and sales of securities, excluding short‐term securities, during the fiscal year ended September 30, 2017 were as follows:
| Purchases of Securities |
Proceeds From
Sales of Securities |
||||||
| $ |
41,820,400
|
$
|
48,030,266
|
||||
Purchases and sales of U.S. Government Obligations during the year ended September 30, 2017 were as follows:
| Purchases of Securities |
Proceeds From
Sales of Securities |
||||||
| $ |
9,715,175
|
$
|
11,266,651
|
||||
7. BENEFICIAL SHARE TRANSACTIONS
The capitalization of the Trust consists of an unlimited number of shares of beneficial interest with no par value per share. Holders of the shares of the Fund have one vote for each share held and a proportionate fraction of a vote for each fractional share. All shares issued and outstanding are fully paid and are transferable and redeemable at the option of the shareholder. Shares have no pre‐emptive rights. Neither the Fund nor any of its creditors has the right to require shareholders to pay any additional amounts solely because the shareholder owns the shares.
Shares redeemed within 60 days of purchase may incur a 1.00% short‐term redemption fee deducted from the redemption amount. For the fiscal year ended September 30, 2017, the redemption fees charged by the Fund are presented in the Consolidated Statements of Changes in Net Assets.
|
Annual Report | September 30, 2017
|
37 |
|
Insignia Macro Fund
|
Notes to Consolidated Financial Statements
|
September 30, 2017
Transactions in common shares were as follows:
|
For the Year
Ended September 30, 2017 |
For the Year
Ended September 30, 2016 |
|||||||
|
Class A:
|
||||||||
|
Shares sold
|
16,593
|
26,940
|
||||||
|
Shares issued in reinvestment of distributions to shareholders
|
34
|
1,600
|
||||||
|
Shares redeemed
|
(6,346
|
)
|
(21,651
|
)
|
||||
|
Net increase from share transactions
|
10,281
|
6,889
|
||||||
|
Class I:
|
||||||||
|
Shares sold
|
507,349
|
791,563
|
||||||
|
Shares issued in reinvestment of distributions to shareholders
|
589
|
70,208
|
||||||
|
Shares redeemed
|
(1,482,425
|
)
|
(922,383
|
)
|
||||
|
Net decrease from share transactions
|
(974,487
|
)
|
(60,612
|
)
|
||||
Control is defined by the 1940 Act as the beneficial ownership, either directly or through one or more controlled companies, of more than 25% of the voting securities of a company. The Fund has one unaffiliated shareholder representing approximately 72% of total Fund shares. Share transaction activities of this shareholder could have a material impact on the Fund.
8. MANAGEMENT AND RELATED PARTY TRANSACTIONS
Investment Advisory: Meritage Capital, LLC (“Meritage Capital” or the “Adviser”), subject to the authority of the Board, is responsible for the overall management and administration of the Fund’s business affairs. The Adviser has delegated a portion of the daily management of the Fund to Sage Advisory Services, Ltd. Co. (the “Sub‐Adviser”). The Adviser and the Sub‐Adviser manage the investments of the Fund in accordance with the Fund’s investment objective, policies and limitations and investment guidelines established jointly by the Adviser and the Board.
Pursuant to the Investment Advisory Agreement (the “Advisory Agreement”) with the Adviser, the Fund pays the Adviser an annual management fee of 1.25% based on the Fund’s average daily net assets during the month. Pursuant to an Investment Sub‐Advisory Agreement (the “Sub‐Advisory Agreement”), the Adviser pays the Sub‐Adviser an annual sub‐advisory management fee of 0.10% for the first $25 million, 0.18% for the subsequent $25 million and 0.10% once assets have reached over $50 million, with a minimum annual fee of $25,000. These management fees are based on the assets they manage and are paid on a quarterly basis. The Adviser is required to pay all fees due to the Sub‐Adviser out of the management fee the Adviser receives from the Fund. The initial term for both the Advisory Agreement and Sub‐Advisory Agreement was two years. The Board may extend the Advisory Agreement and/or the Sub‐Advisory Agreement for additional one‐year terms. The Board, shareholders of the Fund or the Adviser may terminate the Advisory Agreement or the Sub‐Advisory Agreement upon 60 days’ notice.
| 38 |
www.insigniafunds.com
|
|
Insignia Macro Fund
|
Notes to Consolidated Financial Statements
|
September 30, 2017
Pursuant to a fee waiver letter agreement (the “Fee Waiver Agreement”), the Adviser has contractually agreed to limit the amount of the Fund’s Total Annual Fund Operating Expenses, exclusive of Distribution and Service (12b‐1) fees, Shareholder Service Fees, Acquired Fund Fees and Expenses, brokerage expenses, interest expenses, taxes and extraordinary expenses, to 1.75% of the Fund’s average daily net assets for Class A and Class I shares. The Fee Waiver Agreement is in effect through January 31, 2018. The Adviser will be permitted to recover, on a class‐by‐class basis, expenses it has borne through the Fee Waiver Agreement to the extent that the Fund’s expenses in later periods fall below the annual rates set forth in the Fee Waiver Agreement. The Fund will not be obligated to pay any such deferred fees and expenses more than three years after the end of the fiscal year in which the fees and expense were deferred. The Adviser may not discontinue the Fee Waiver Agreement without the approval by the Fund’s Board. Fees waived or reimbursed for the fiscal year ended September 30, 2017 are disclosed in the Consolidated Statement of Operations.
As of September 30, 2017, the balances of recoupable expenses for each class were as follows:
|
Expiring in 2018
|
Expiring in 2019
|
Expiring in 2020
|
||||||||||
|
Class A
|
$
|
849
|
$
|
574
|
$
|
791
|
||||||
|
Class I
|
272,155
|
248,402
|
108,036
|
|||||||||
Administrator: ALPS Fund Services, Inc (“ALPS”) (an affiliate of ALPS Distributors, Inc.) serves as administrator to the Fund. The Fund has agreed to pay expenses incurred in connection with its administrative activities. Pursuant to the Administration, Bookkeeping and Pricing Services Agreement with the Trust, ALPS will provide operational services to the Fund including, but not limited to, fund accounting and fund administration and generally assist in the Fund’s operations. The Fund’s administration fee is accrued on a daily basis and paid monthly. The officers of the Trust and an Interested Trustee are employees of ALPS. Administration fees paid by the Fund for the fiscal year ended September 30, 2017 are disclosed in the Consolidated Statement of Operations. ALPS is reimbursed by the Fund for certain out‐of‐pocket expenses.
Transfer Agent: ALPS serves as transfer agent for the Fund under a Transfer Agency and Services Agreement with the Trust. Under this agreement, ALPS is paid an annual fee for services performed on behalf of the Fund plus fees for open accounts and is reimbursed for certain out‐of-pocket expenses.
Compliance Services: ALPS provides services as the Fund’s Chief Compliance Officer to monitor and test the policies and procedures of the Fund in conjunction with requirements under Rule 38a‐1 of the 1940 Act pursuant to a Chief Compliance Officer Services Agreement with the Trust. Under this agreement, ALPS is paid an annual fee for services performed on behalf of the Fund and is reimbursed for certain out‐of‐pocket expenses.
Distribution: ALPS Distributors, Inc. (the “Distributor”) (an affiliate of ALPS) acts as the principal underwriter of the Fund’s shares pursuant to a Distribution Agreement with the Trust. Shares of the Fund are offered on a continuous basis through the Distributor, as agent of the Fund. The Distributor is not obligated to sell any particular amount of shares and is not entitled to any compensation for its services as the Fund’s principal underwriter pursuant to the Distribution Agreement.
|
Annual Report | September 30, 2017
|
39 |
|
Insignia Macro Fund
|
Notes to Consolidated Financial Statements
|
September 30, 2017
The Fund has adopted a separate plan of distribution for Class A shares pursuant to Rule 12b‐1 under the 1940 Act (the “Plan”). The Plan allows the Fund to use Class A assets to pay fees in connection with the distribution and marketing of Class A shares and/or the provision of shareholder services to Class A shareholders. The Plan permits payment for services in connection with the administration of plans or programs that use Class A shares of the Fund as their funding medium and for related expenses. The Plan permits the Fund to make total payments at an annual rate of up to 0.25% of a Fund’s average daily net assets attributable to its Class A shares. Because these fees are paid out of the Fund’s Class A assets on an ongoing basis, over time they will increase the cost of an investment in Class A shares, and Plan fees may cost an investor more than other types of sales charges. Plan fees are shown as distribution and service fees on the Consolidated Statement of Operations.
9. TRUSTEES
As of September 30, 2017, there were four Trustees, three of whom are not “interested persons” (as defined in the 1940 Act) of the Trust (the “Independent Trustees”). Effective October 1, 2016, the Independent Trustees receive a quarterly retainer of $5,000, plus $4,000 for each regular Board or Committee meeting attended, $2,000 for each special telephonic Board or Committee meeting attended and $2,000 for each special in‐person Board meeting attended. The Independent Trustees are also reimbursed for all reasonable out‐of‐pocket expenses relating to attendance at meetings and for meeting‐related expenses. Officers of the Trust and Trustees who are interested persons of the Trust receive no salary or fees from the Trust.
10. INDEMNIFICATIONS
Under the Trust’s organizational documents, its officers and Trustees are indemnified against certain liabilities arising out of the performance of their duties to the Trust. Additionally, in the normal course of business, the Trust enters into contracts with service providers that may contain general indemnification clauses which may permit indemnification to the extent permissible under applicable law. The Trust’s maximum exposure under these arrangements is unknown, as this would involve future claims that may be made against the Trust that have not yet occurred.
11. SUBSEQUENT EVENTS
Subsequent events after the date of the Statement of Assets and Liabilities have been evaluated through the date the financial statements were issued.
Effective November 16, 2017, the Independent Trustees quarterly retainer will increase to $6,000 and the Audit Committee Chair will now receive a quarterly retainer of $1,250 and the Independent Chair will receive a quarterly retainer of $2,500. The Independent Trustees will continue to receive $4,000 for each regular Board or Committee meeting attended, $2,000 for each special telephonic Board or Committee meeting attended and $2,000 for each special in‐person Board meeting attended. The Independent Trustees will continue to be reimbursed for all reasonable out‐of‐pocket expenses relating to attendance at meetings and for meeting‐related expenses.
| 40 |
www.insigniafunds.com
|
|
Insignia Macro Fund
|
Notes to Consolidated Financial Statements
|
September 30, 2017
Effective November 16, 2017, the Fund’s Adviser has contractually agreed to extend their fee waiver agreement through January 31, 2018.
Management has determined that there were no other subsequent events to report through the issuance of these financial statements.
|
Annual Report | September 30, 2017
|
41 |
|
Insignia Macro Fund
|
Report of Independent Registered
Public Accounting Firm
|
To the Shareholders of Insignia Macro Fund and
Board of Trustees of ALPS Series Trust
We have audited the accompanying consolidated statement of assets and liabilities, including the consolidated portfolio of investments, of Insignia Macro Fund (the “Fund”), a series of ALPS Series Trust, as of September 30, 2017, and the related consolidated statements of operations and changes in net assets, and the consolidated financial highlights for the year then ended. These consolidated financial statements and consolidated financial highlights are the responsibility of the Fund’s management. Our responsibility is to express an opinion on these consolidated financial statements and consolidated financial highlights based on our audit. The accompanying consolidated statement of changes in net assets and consolidated financial highlights for the periods ended September 30, 2016 and prior, were audited by other auditors whose report dated December 2, 2016, expressed an unqualified opinion on that consolidated financial statement and consolidated financial highlights.
We conducted our audit in accordance with the standards of the Public Company Accounting Oversight Board (United States). Those standards require that we plan and perform the audit to obtain reasonable assurance about whether the consolidated financial statements and consolidated financial highlights are free of material misstatement. An audit includes examining, on a test basis, evidence supporting the amounts and disclosures in the consolidated financial statements. Our procedures included confirmation of securities owned as of September 30, 2017, by correspondence with the custodian and brokers. An audit also includes assessing the accounting principles used and significant estimates made by management, as well as evaluating the overall consolidated financial statement presentation. We believe that our audit provides a reasonable basis for our opinion.
In our opinion, the consolidated financial statements and consolidated financial highlights referred to above present fairly, in all material respects, the financial position of Insignia Macro Fund as of September 30, 2017, the results of its operations, the changes in its net assets, and the financial highlights for the year then ended, in conformity with accounting principles generally accepted in the United States of America.
COHEN & COMPANY, LTD.
Cleveland, Ohio
November 29, 2017
| 42 |
www.insigniafunds.com
|
|
Insignia Macro Fund
|
Additional Information
|
September 30, 2017 (Unaudited)
1. PROXY VOTING POLICIES AND VOTING RECORD
A description of the policies and procedures that the Fund uses to determine how to vote proxies relating to portfolio securities is available without charge, upon request, (i) by calling the Fund (toll‐free) at 1‐855‐674‐4642 or (ii) on the website of the Securities and Exchange Commission (the “SEC”) at http://www.sec.gov.
Information regarding how the Fund voted proxies relating to portfolio securities during the most recent 12‐month period ended June 30 is available (i) without charge, upon request, by calling the Fund (toll‐free) at 1‐855‐674‐4642 or (ii) on the SEC’s website at http://www.sec.gov.
2. PORTFOLIO HOLDINGS
The Fund files its complete schedule of portfolio holdings with the SEC for the first and third quarters of each fiscal year on Form N‐Q. The Fund’s Forms N‐Q are available on the SEC website at http://www.sec.gov. The Fund’s Forms N‐Q may be reviewed and copied at the SEC’s Public Reference Room in Washington, D.C., and information on the operation of the Public Reference Room may be obtained by calling 1‐800‐SEC‐0330.
3. CHANGES IN ACCOUNTANTS
On June 5, 2017, KPMG LLP (KPMG) was dismissed as the independent registered public accounting firm of the Trust. In August 2017, the Audit Committee of the Board of Trustees of the Trust recommended the appointment of Cohen & Company, Ltd. (“Cohen”), as the Trust’s independent registered public accounting firm, replacing KPMG LLP and beginning with the Fund’s financial statements for the fiscal year ended September 30, 2017, and the Board of Trustees approved such appointment.
KPMG’s report on the financial statements of the Fund for each of the fiscal years ended September 30, 2015 and September 30, 2016, did not contain an adverse opinion or a disclaimer of opinion and was not qualified or modified as to uncertainty, audit scope, or accounting principles. During the fiscal years ended September 30, 2015 and September 30, 2016, there were no disagreements between the Fund and KPMG on any matter of accounting principles or practices, financial statement disclosure, or auditing scope or procedure, which disagreement(s), if not resolved to the satisfaction of KPMG, would have caused it to make reference to the subject matter of the disagreement(s) in connection with its reports. During the fiscal years ended September 30, 2015 and September 30, 2016, there were no reportable events as defined in Item 304(a)(1)(v) of Regulation S‐K promulgated by the Securities and Exchange Commission.
|
Annual Report | September 30, 2017
|
43 |
|
Insignia Macro Fund
|
Trustees and Officers
|
September 30, 2017 (Unaudited)
INDEPENDENT TRUSTEES
|
Name,
Birth Year & Address* |
Position(s)Held with Fund
|
Term of
Office and Length of Time Served** |
Principal Occupation(s)
During Past 5 Years*** |
Number of
Funds in Fund Complex Overseen by Trustee**** |
Other
Directorships Held by Trustee During Past 5 Years*** |
|
Ward D. Armstrong
Birth year: 1954
|
Trustee and Chairman
|
Mr. Armstrong was appointed to the Board on May 27, 2016. Mr. Armstrong was appointed Chairman of the Board at the August 24, 2017 meeting of the Board of Trustees.
|
Retired; Managing Partner, NorthRock Partners, LLC (October 2013 to July 2015); Managing Director, NorthRock Partners, a Private Wealth Advisory Practice of Ameriprise Financial (February 2010 to October 2013); Senior Vice President, Ameriprise Financial, Inc. (November 1984 to May 2007); President, American Express Asset Management (2002 to 2004); and Chairman, Ameriprise Trust Company (November 1996 to May 2007).
|
9
|
Mr. Armstrong is a Director of the Heartland Group, Inc. (5 Funds).
|
|
*
|
All communications to Trustees and Officers may be directed to ALPS Series Trust c/o 1290 Broadway, Suite 1100, Denver, CO 80203.
|
|
**
|
This is the period for which the Trustee or Officer began serving the Trust. Each Trustee serves an indefinite term, until such Trustee’s successor is elected and appointed, or such Trustee resigns or is deceased. Officers are elected on an annual basis.
|
|
***
|
Except as otherwise indicated, each individual has held the office shown or other offices in the same company for the last five years.
|
|
****
|
The Fund Complex currently consists of 9 series of the Trust and any other investment companies for which Meritage Capital, LLC or Sage Advisory Services, Ltd. Co provide investment advisory services, currently none.
|
|
44
|
www.insigniafunds.com
|
|
Insignia Macro Fund
|
Trustees and Officers
|
September 30, 2017 (Unaudited)
|
Name,
Birth Year & Address* |
Position(s)Held with Fund
|
Term of
Office and Length of Time Served** |
Principal Occupation(s)
During Past 5 Years*** |
Number of
Funds in Fund Complex Overseen by Trustee**** |
Other
Directorships Held by Trustee During Past 5 Years*** |
|
J. Wayne Hutchens
Birth year: 1944
|
Trustee
|
Mr. Hutchens was elected to the Board on October 30, 2012.
|
Mr. Hutchens is currently retired. From April 2006 to December 2012, he served as President and CEO of the University of Colorado (CU) Foundation and from April 2009 to December 2012, he was Executive Director of the CU Real Estate Foundation. Mr. Hutchens is also Trustee of the Denver Museum of Nature and Science (2000 to present), Director of AMG National Trust Bank (June 2012 to present) and Trustee of Children’s Hospital Colorado (May 2012 to present). Prior to these positions, Mr. Hutchens spent 29 years in the banking industry, retiring as Chairman of Chase Bank Colorado.
|
9
|
RiverNorth Opportunity Fund (2013 to present).
|
|
Patrick Seese
Birth year: 1971
|
Trustee
|
Mr. Seese was elected to the Board on October 30, 2012.
|
Mr. Seese is an owner and a Managing Director of Integris Partners, a middle- market investment banking firm serving closely-held companies, financial sponsors and public companies (February 2008 to present). Prior to this, Mr. Seese was a Managing Director of Headwaters MB, a middle-market investing banking firm (December 2003 to February 2008). Prior to that, Mr. Seese worked in Credit Suisse First Boston’s Mergers and Acquisitions Group and served as Head of Corporation Development, Katy Industries, a publicly traded industrial and consumer products company and at Deloitte & Touche LLP, where he began his career in 1994.
|
9
|
None.
|
|
*
|
All communications to Trustees and Officers may be directed to ALPS Series Trust c/o 1290 Broadway, Suite 1100, Denver, CO 80203.
|
|
**
|
This is the period for which the Trustee or Officer began serving the Trust. Each Trustee serves an indefinite term, until such Trustee’s successor is elected and appointed, or such Trustee resigns or is deceased. Officers are elected on an annual basis.
|
|
***
|
Except as otherwise indicated, each individual has held the office shown or other offices in the same company for the last five years.
|
|
****
|
The Fund Complex currently consists of 9 series of the Trust and any other investment companies for which Meritage Capital, LLC or Sage Advisory Services, Ltd. Co provide investment advisory services, currently none.
|
|
Annual Report | September 30, 2017
|
45
|
|
Insignia Macro Fund
|
Trustees and Officers
|
September 30, 2017 (Unaudited)
INTERESTED TRUSTEE
|
Name,
Birth Year & Address* |
Position(s) Held with Fund
|
Term of
Office and Length of Time Served** |
Principal Occupation(s)
During Past 5 Years*** |
Number of
Funds in Fund Complex Overseen by Trustee**** |
Other
Directorships Held by Trustee During Past 5 Years*** |
|
Jeremy O. May
Birth year: 1970
|
Trustee and President
|
Mr. May was elected Trustee and President on October 30, 2012. Mr. May was Chairman from October 30, 2012 to August 24, 2017.
|
Mr. May joined ALPS in 1995 and is currently President and Director of ALPS Fund Services, Inc. and ALPS Distributors, Inc., Executive Vice President and Director of ALPS Holdings, Inc. and ALPS Advisors, Inc. and Director of ALPS Portfolio Solutions Distributor, Inc. Because of his positions with these entities, Mr. May is deemed an affiliate of the Trust as defined under the 1940 Act. Mr. May is also Trustee of the Reaves Utility Income Fund and the ALPS Elevation Trust. Mr. May is also on the Board of Directors of the University of Colorado Foundation and the AV Hunter Trust.
|
9
|
Mr. May is Chairman and Trustee of the Reaves Utility Income Fund (1 fund) and ALPS Elevation Trust (2 ETFs).
|
|
*
|
All communications to Trustees and Officers may be directed to ALPS Series Trust c/o 1290 Broadway, Suite 1100, Denver, CO 80203.
|
|
**
|
This is the period for which the Trustee or Officer began serving the Trust. Each Trustee serves an indefinite term, until such Trustee’s successor is elected and appointed, or such Trustee resigns or is deceased. Officers are elected on an annual basis.
|
|
***
|
Except as otherwise indicated, each individual has held the office shown or other offices in the same company for the last five years.
|
|
****
|
The Fund Complex currently consists of 9 series of the Trust and any other investment companies for which Meritage Capital, LLC or Sage Advisory Services, Ltd. Co provide investment advisory services, currently none.
|
|
46
|
www.insigniafunds.com
|
|
Insignia Macro Fund
|
Trustees and Officers
|
September 30, 2017 (Unaudited)
OFFICERS
|
Name,
Birth Year & Address* |
Position(s)
Held with Fund |
Term of
Office and Length of Time Served** |
Principal Occupation(s) During Past 5 Years***
|
|
Kimberly R. Storms
Birth year: 1972
|
Treasurer
|
Ms. Storms was elected Treasurer of the Trust on October 30, 2012.
|
Ms. Storms is Senior Vice President and Director of Fund Administration of ALPS. Because of her position with ALPS, Ms. Storms is deemed an affiliate of the Trust as defined under the 1940 Act. Ms. Storms is also Treasurer of Financial Investors Trust, Liberty All-Star Equity Fund and Liberty All- Star Growth Fund, Inc.
|
|
Richard C. Noyes
Birth year: 1970
|
Secretary
|
Mr. Noyes was elected Secretary of the Trust on November 14, 2016
|
Mr. Noyes joined ALPS in 2015 and is Senior Vice President and Director of Legal Administration of ALPS. Prior to joining ALPS, Mr. Noyes served as Assistant Vice President and Senior Counsel of Janus Capital Management LLC. Mr. Noyes is deemed an affiliate of the Trust as defined under the 1940 Act. Mr. Noyes is also Secretary of Westcore Trust.
|
|
Jennifer A. Craig
Birth year: 1973
|
Assistant Secretary
|
Ms. Craig was elected Assistant Secretary of the Trust on May 27, 2016.
|
Ms. Craig joined ALPS in 2007 and is currently Assistant Vice President and Paralegal Manager. Prior to joining ALPS, Ms. Craig was Legal Manager at Janus Capital Management LLC and served as Assistant Secretary of Janus Investment Fund, Janus Adviser Series and Janus Aspen Series. Because of her position with ALPS, Ms. Craig is deemed an affiliate of the Trust as defined under the 1940 Act. Ms. Craig is also Assistant Secretary of Clough Funds Trust, Clough Global Opportunities Fund, Clough Global Allocation Fund, Clough Global Equity Fund and Financial Investors Trust.
|
|
Alan Gattis
Birth year: 1980
|
Assistant Treasurer
|
Mr. Gattis was elected Assistant Treasurer of the Trust on August 9, 2016.
|
Mr. Gattis joined ALPS in 2011 and is currently Vice President and Fund Controller of ALPS. Prior to joining ALPS, Mr. Gattis was an Auditor at Spicer Jeffries LLP (2009 through 2011) and an Auditor at PricewaterhouseCoopers LLP (2004 - 2009). Because of his position with ALPS, Mr. Gattis is deemed an affiliate of the Trust as defined under the 1940 Act. Mr. Gattis is also Assistant Treasurer of Clough Funds Trust, Clough Global Opportunities Fund, Clough Global Allocation Fund, Clough Global Equity Fund, Griffin Institutional Access Real Estate Fund, Stadion Funds and Centaur Mutual Funds Trust.
|
|
*
|
All communications to Trustees and Officers may be directed to ALPS Series Trust c/o 1290 Broadway, Suite 1100, Denver, CO 80203.
|
|
**
|
This is the period for which the Trustee or Officer began serving the Trust. Each Trustee serves an indefinite term, until such Trustee’s successor is elected and appointed, or such Trustee resigns or is deceased. Officers are elected on an annual basis.
|
|
***
|
Except as otherwise indicated, each individual has held the office shown or other offices in the same company for the last five years.
|
|
Annual Report | September 30, 2017
|
47
|
|
Insignia Macro Fund
|
Trustees and Officers
|
September 30, 2017 (Unaudited)
|
Name,
Birth Year & Address* |
Position(s)
Held with Fund |
Term of
Office and Length of Time Served** |
Principal Occupation(s) During Past 5 Years***
|
|
Cory J. Gossard
Birth year: 1972
|
Chief Compliance Officer (“CCO”)
|
Mr. Gossard was elected CCO of the Trust on October 20, 2017.
|
Mr. Gossard oversees all day-to-day compliance aspects of ALPS’ business within Fund CCO Services, Compliance Administration, Risk Management and Assurance Services. Mr. Gossard is deemed an affiliate of the Trust as defined under the 1940 Act. Mr. Gossard also serves as Fund CCO for the SPDR S&P 500 ETF Trust, SPDR DJIA ETF Trust, and SPDR S&P MidCap 400 ETF Trust. Prior to joining ALPS in 2014, Mr. Gossard held a series of progressively responsible roles throughout an 18-year career with Citibank.
|
|
*
|
All communications to Trustees and Officers may be directed to ALPS Series Trust c/o 1290 Broadway, Suite 1100, Denver, CO 80203.
|
|
**
|
This is the period for which the Trustee or Officer began serving the Trust. Each Trustee serves an indefinite term, until such Trustee’s successor is elected and appointed, or such Trustee resigns or is deceased. Officers are elected on an annual basis.
|
|
***
|
Except as otherwise indicated, each individual has held the office shown or other offices in the same company for the last five years.
|
Additional information about members of the Board of Trustees and officers of the Trust is available in the Statement of Additional Information and is available, without charge, upon request, by calling the Fund (toll-free) at 1-855-254-6467.
|
48
|
www.insigniafunds.com
|
Item 2. Code of Ethics.
| (a) |
The registrant, as of the end of the period covered by this report, has adopted a code of ethics that applies to the registrant’s principal executive officer, principal financial officer, principal accounting officer or controller or any persons performing similar functions on behalf of the registrant.
|
|
(b)
|
Not applicable.
|
|
(c)
|
During the period covered by this report, no amendments to the provisions of the code of ethics adopted in Item 2(a) above were made.
|
|
(d)
|
During the period covered by this report, no implicit or explicit waivers to the provisions of the code of ethics adopted in Item 2(a) above were granted.
|
|
(e)
|
Not applicable.
|
|
(f)
|
The registrant’s Code of Ethics is attached as an Exhibit to this report.
|
Item 3. Audit Committee Financial Expert.
The Board of Trustees of the registrant has determined that the registrant has at least one Audit Committee Financial Expert serving on its audit committee. The Board of Trustees of the registrant has designated J. Wayne Hutchens, as the registrant’s “Audit Committee Financial Experts.” Mr. Hutchens is “independent” as defined in paragraph (a)(2) of Item 3 to Form N-CSR.
Item 4. Principal Accountant Fees and Services.
|
(a)
|
Audit Fees: For the registrant’s fiscal years ended September 30, 2017 and September 30, 2016, the aggregate fees billed for professional services rendered by the principal accountant for the audit of the registrant’s annual financial statements were $97,000 and $107,300, respectively. For the registrant’s fiscal year ended September 30, 2017, Cohen & Company, Ltd. served as principal accountant and for the registrant’s fiscal year ended September 30, 2016, KPMG LLP served as principal accountant. In 2017, the amount of $97,000 was paid to Cohen & Company, Ltd. and in 2016, the amount of $107,300 was paid to KPMG LLP.
|
|
(b)
|
Audit-Related Fees: For the registrant’s fiscal years ended September 30, 2017 and September 30, 2016, the aggregate fees billed for assurance and related services by the principal accountant that were reasonably related to the performance of the audit of the registrant’s financial statements and are not reported under paragraph (a) of this Item were $0 and $0, respectively.
|
|
(c)
|
Tax Fees: For the registrant’s fiscal years ended September 30, 2017 and September 30, 2016, the aggregate fees billed for professional services rendered by the principal accountant for tax compliance, tax advice and tax planning were $23,000 and $40,430, respectively. The fiscal year 2017 and 2016 tax fees were for services for dividend calculation, excise tax preparation and tax return preparation. The registrant’s fiscal year ended September 30, 2017, Cohen & Company, Ltd. served as principal accountant and for registrant’s fiscal year ended September 30, 2016, KPMG LLP served as principal accountant. In 2017, the amount of $23,000 was paid to Cohen & Company, Ltd. and in 2016, $40,430 was paid to KPMG LLP.
|
|
(d)
|
All Other Fees: For the registrant’s fiscal year ended September 30, 2017, $6,500 of other fees were billed to registrant by the principal accountant, KPMG LLP. For the registrant’s fiscal year ended September 30, 2016, no fees were billed to registrant by the principal accountant for services other than the services reported in paragraphs (a) through (c) of this Item.
|
| (e)(1) |
Audit Committee Pre-Approval Policies and Procedures: All services to be performed by the registrant’s principal accountant must be pre-approved by the registrant’s audit committee.
|
| (e)(2) |
No services described in paragraphs (b) through (d) of this Item were approved by the registrant’s audit committee pursuant to paragraph (c)(7)(i)(C) of Rule 2-01 of Regulation S-X.
|
|
(f)
|
Not applicable.
|
|
(g)
|
The aggregate non-audit fees billed by the registrant’s accountant for services rendered to the registrant, and rendered to the registrant’s investment adviser (not including any sub-adviser whose role is primarily portfolio management and is subcontracted with or overseen by another investment adviser), and any entity controlling, controlled by, or under common control with the adviser that provides ongoing services to the registrant, were $23,000 in fiscal year ended September 30, 2017 and $40,430 in fiscal year ended September 30, 2016. These fees consisted of tax fees billed to the registrant as described in response to paragraph (c) of this Item. The registrant’s fiscal year ended September 30, 2017, Cohen & Company, Ltd. served as principal accountant and for registrant’s fiscal year ended September 30, 2016, KPMG LLP served as principal accountant.
|
|
(h)
|
The registrant’s audit committee has considered whether the provision of non-audit services that were rendered to the registrant’s investment adviser (not including any sub-adviser whose role is primarily portfolio management and is subcontracted with or overseen by another investment adviser), and any entity controlling, controlled by, or under common control with the investment adviser that provides ongoing services to the registrant that were not pre-approved pursuant to paragraph (c)(7)(ii) of Rule 2-01 of Regulation S-X, is compatible with maintaining the principal accountant’s independence and has determined that the provision of such non-audit services is compatible with maintaining the principal accountant’s independence.
|
Item 5. Audit Committee of Listed Registrants.
Not applicable.
Item 6. Investments.
| (a) |
Schedule of Investments is included as part of the Reports to Stockholders filed under Item 1 of this Form N-CSR.
|
| (b) |
Not applicable.
|
Item 7. Disclosure of Proxy Voting Policies and Procedures for Closed-End Management Investment Companies.
Not applicable to the registrant.
Item 8. Portfolio Managers of Closed-End Management Investment Companies.
Not applicable to the registrant.
Item 9. Purchases of Equity Securities by Closed-End Management Investment Company and Affiliated Purchasers.
Not applicable to the registrant.
Item 10. Submission of Matters to Vote of Security Holders.
There have been no material changes to the procedures by which shareholders may recommend nominees to the registrant’s Board of Trustees, where those changes were implemented after the registrant last provided disclosure in response to the requirements of Item 407(c)(2)(iv) of Regulation S-K, or this Item.
Item 11. Controls and Procedures.
|
(a)
|
The registrant’s principal executive officer and principal financial officer have evaluated the registrant’s disclosure controls and procedures (as defined in Rule 30a-3(c) under the Investment Company Act of 1940, as amended) within 90 days of this report and have concluded that the registrant’s disclosure controls and procedures were effective as of that date.
|
|
(b)
|
There was no change in the registrant’s internal control over financial reporting (as defined in Rule 30a-3(d) under the Investment Company Act of 1940, as amended) during the second fiscal quarter of the period covered by this report that has materially affected, or is reasonably likely to materially affect, the registrant’s internal control over financial reporting.
|
Item 12. Exhibits.
|
(a)(1)
|
The registrant’s Code of Ethics for Principal Executive and Senior Financial Officers, which is the subject of the disclosure required by Item 2 of Form N-CSR is filed herewith as Exhibit 12(a)(1).
|
|
(a)(2)
|
The certifications required by Rule 30a-2(a) of the Investment Company Act of 1940, as amended, and Section 302 of the Sarbanes-Oxley Act of 2002 are attached hereto as Exhibit 99.Cert.
|
|
(a)(3)
|
None.
|
| (b) |
The certifications by the registrant’s principal executive officer and principal financial officer, as required by Rule 30a-2(b) of the Investment Company Act of 1940, as amended, and Section 906 of the Sarbanes-Oxley Act of 2002 are attached hereto as Exhibit 99.906Cert.
|
SIGNATURES
Pursuant to the requirements of the Securities Exchange Act of 1934 and the Investment Company Act of 1940, the registrant has duly caused this report to be signed on its behalf by the undersigned, thereunto duly authorized.
ALPS SERIES TRUST
|
By:
|
/s/ Jeremy O. May
|
|
|
Jeremy O. May
|
||
|
President (Principal Executive Officer)
|
||
|
Date:
|
December 8, 2017
|
|
Pursuant to the requirements of the Securities Exchange Act of 1934 and the Investment Company Act of 1940, this report has been signed below by the following persons on behalf of the registrant and in the capacities and on the dates indicated.
|
By:
|
/s/ Jeremy O. May
|
|
|
Jeremy O. May
|
||
|
President (Principal Executive Officer)
|
||
|
Date:
|
December 8, 2017
|
|
|
By:
|
/s/ Kimberly R. Storms
|
|
|
Kimberly R. Storms
|
||
|
Treasurer (Principal Financial Officer)
|
||
|
Date:
|
December 8, 2017
|
|