UNITED STATES
SECURITIES AND EXCHANGE COMMISSION
Washington, D.C. 20549
FORM 8-K
CURRENT REPORT
Pursuant to Section 13 or 15(d) of the Securities Exchange Act of 1934
Date of Report (date of earliest event reported): December 14, 2015
DEX MEDIA, INC.
(Exact name of registrant as specified in its charter)
Delaware
(State or other jurisdiction of incorporation)
1-35895 |
|
13-2740040 |
(Commission File Number) |
|
(IRS Employer Identification No.) |
2200 West Airfield Drive, P.O. Box 619910, DFW Airport, Texas |
|
75261 |
(Address of principal executive offices) |
|
(Zip Code) |
Registrants telephone number, including area code: (972) 453-7000
Check the appropriate box below if the Form 8-K filing is intended to simultaneously satisfy the filing obligation of the registrant under any of the following provisions:
o Written communications pursuant to Rule 425 under the Securities Act (17 CFR 230.425)
o Soliciting material pursuant to Rule 14a-12 under the Exchange Act (17 CFR 240.14a-12)
o Pre-commencement communications pursuant to Rule 14d-2(b) under the Exchange Act (17 CFR 240.14d-2(b))
o Pre-commencement communications pursuant to Rule 13e-4(c) under the Exchange Act (17 CFR 240.13e-4(c))
Item 1.01 Entry into a Material Definitive Agreement.
On December 14, 2015, Dex Media, Inc. (the Company) entered into a Second Amendment (the Second Amendment) to Forbearance Agreement (as amended by the First Amendment to Forbearance Agreement dated as of November 23, 2015, the Forbearance Agreement) by and among the Company, certain of the Companys direct and indirect subsidiaries, JPMorgan Chase Bank, N.A. (JPM) as an agent under (i) the Amended and Restated Credit Agreement, dated as of April 30, 2013, by and among Dex Media East, Inc., as borrower, the Company, Dex Media Holdings, Inc. (Holdings), JPM, as administrative agent and collateral agent, and each of the lenders from time to time party thereto; (ii) the Amended and Restated Credit Agreement, dated as of April 30, 2013, among Dex Media West, Inc., as borrower, the Company, Holdings, JPM, as administrative agent and collateral agent, and each of the lenders from time to time party thereto; and (iii) the Amended and Restated Loan Agreement, dated as of April 30, 2013, by and among SuperMedia, Inc., as borrower, the Company, JPM, as administrative agent and collateral agent, and each of the lenders from time to time party thereto; Deutsche Bank Trust Company Americas (DB) as an agent under the Fourth Amended and Restated Credit Agreement, dated as of April 30, 2013, by and among R.H. Donnelley Inc., as borrower, the Company, DB, as administrative agent and collateral agent, and each of the lenders from time to time party thereto; and each lender under the Credit Agreements executing the Forbearance Agreement.
Pursuant to the Second Amendment, the forbearance period (the Forbearance Period) under the Forbearance Agreement, which was previously set to expire at 11:59 p.m. (New York time) on December 14, 2015, was extended such that it will expire no later than 11:59 p.m. (New York time) on January 4, 2016. The Forbearance Period remains subject to early termination upon the occurrence of certain termination events previously disclosed in the Companys Current Report on Form 8-K filed on November 5, 2015.
The foregoing description of the Second Amendment is qualified in its entirety by reference to the full text of the Second Amendment, a copy of which is filed as Exhibit 10.1 to this Current Report on Form 8-K and incorporated by reference herein.
Item 7.01 Regulation FD Disclosure.
The Company entered into non-disclosure agreements with certain holders of its senior subordinated notes (the Bondholders); the Bondholders financial advisor, Ducera Partners LLC (Ducera); the Bondholders legal advisor, Akin Gump Strauss Hauer & Feld LLP (Akin and, together with Ducera, the Bondholder Advisors); the administrative agents under the Companys credit facilities (the Agents); the Agents legal advisor, Simpson Thacher & Bartlett LLP (the Agents Advisor); certain of its secured lenders (the Ad Hoc Committee); the Ad Hoc Committees financial advisor, Houlihan Lokey (HL); the Ad Hoc Committees legal advisor, Milbank, Tweed, Hadley & McCloy LLP (MB); Wachtell, Lipton, Rosen & Katz (Wachtell), counsel to one of the members of the Ad Hoc Committee; and PJT Partners LP (PJT and, together with HL, MB and Wachtell, the Ad Hoc Committee Advisors), for the purpose of engaging in discussions with the Bondholder Advisors, Bondholders, Agents, Agents Advisor Ad Hoc Committee Advisors and the Ad Hoc Committee regarding potential consensual restructuring transactions of the Company. In connection with these discussions, the Company provided the Bondholder Advisors, Bondholders, Agents, Agents Advisor Ad Hoc Committee Advisors and the Ad Hoc Committee certain confidential information, including certain confidential financial information. Pursuant to certain of the non-disclosure agreements, the Company agreed to publicly disclose this confidential information. As a result, the Company is furnishing the information set out in this Item 7.01 and in Exhibits 99.1 through 99.4 hereto.
The Company has learned that the historic U.S. federal and state income tax attributes of its consolidated group may be materially overstated and may need to be revised. Such revision may not only reduce the total amount of usable tax attributes available to the group, but also affect the allocation of such remaining attributes among the groups members. The projections dated November 16, 2015 released as part of this disclosure were prepared prior to the Company being made aware that the historic U.S. federal and state income attributes that the Company has historically disclosed may be incorrect and consequently the projections do not reflect any potential corrections. Accordingly, investors should not rely upon the Companys prior disclosures regarding its tax attributes, including the tax attributes disclosed in the projections. The Company is currently working with its advisors to recalculate the Companys tax attributes and their allocation among the groups members.
The information in this item is being furnished, not filed. Accordingly, the information in this item will not be incorporated by reference into any registration statement filed by the Company under the Securities Act of 1933, as amended, unless specifically identified therein as being incorporated by reference therein. By filing this Current Report on Form 8-K and furnishing this information, the Company makes no admission as to the materiality of any information in Item 7.01 of this report.
Non-GAAP Measures
In addition to financial results determined in accordance with generally accepted accounting principles (GAAP), certain of the confidential financial information provided to the Bondholder Advisors, Bondholders, Agents, Agents Advisor Ad Hoc Committee Advisors and the Ad Hoc Committee includes non-GAAP financial measures (as defined under Regulation G of the Securities Exchange Act of 1934, as amended). The Company believes that the use of non-GAAP financial measures provides useful information to investors to gain an overall understanding of its current financial performance. Specifically, the Company believes the non-GAAP results provide useful information to management and investors by excluding certain nonrecurring items that the Company believes are not indicative of its core operating results. In addition, non-GAAP financial measures are used by management for budgeting and forecasting as well as subsequently measuring the Companys performance, and the Company believes that non-GAAP results provide investors with financial measures that most closely align to its internal financial measurement processes. Reconciliations of such non-GAAP measures to the closest GAAP measures are included in in appendices to the exhibits in which they appear. Certain of the non-GAAP financial information provided to the Bondholder Advisors, Bondholders, Agents, Agents Advisor Ad Hoc Committee Advisors and the Ad Hoc Committee are prospective in nature, and the Company has not provided a quantitative reconciliation between such information to the most comparable measure calculated and presented in accordance with GAAP because it is not reasonably practicable to produce such reconciliation for this prospective financial information.
Forward-Looking Statements
Some statements included in this report constitute forward-looking statements within the meaning of the Private Securities Litigation Reform Act of 1995 and the federal securities laws. Statements that include the words may, will, could, should, would, believe, anticipate, forecast, estimate, expect, preliminary, intend, plan, project, outlook and similar statements of a future or
forward-looking nature identify forward-looking statements. You should not place undue reliance on these statements, as they are not guarantees of future performance. Forward-looking statements provide current expectations with respect to the Companys financial performance and future events with respect to the Companys business and industry in general. Forward-looking statements are based on certain assumptions and include any statement that does not directly relate to any historical or current fact. Forward-looking statements address matters that involve risks and uncertainties. Accordingly, there are or will be important factors that could cause the Companys actual results to differ materially from those indicated in these statements. The Company believes that these factors include, but are not limited to, the risks related to the following: the Companys ability to provide assurance for the long-term continued viability of its business; the Companys non-compliance with certain covenants under its senior secured credit facilities and senior subordinated notes; the Companys ability to comply with the forbearance agreement with respect to its senior secured credit facilities or the risk that the forbearance agreement is terminated; limitations on the Companys operating and strategic flexibility and the ability to operate the Companys business, finance its capital needs or expand business strategies under the terms of the Companys credit facilities; limited access to capital markets and increased borrowing costs resulting from the Companys leveraged capital structure and debt ratings; the Companys ability to obtain additional financing or refinance its existing indebtedness on satisfactory terms or at all; the Companys ability to accurately report its financial results due to a material weaknesses in its internal control over financial reporting; changes in the Companys credit rating; changes in the Companys operating performance; the Companys ability to implement its business transformation program as planned; the Companys ability to realize the anticipated benefits in the amounts and at the times expected from the business transformation program; the risk that the amount of costs associated with the Companys business transformation program will exceed estimates; the risk that the Companys common stock may be delisted from The Nasdaq Stock Market LLC; reduced advertising spending and increased contract cancellations by the Companys clients, which causes reduced revenue; declining use of print yellow page directories by consumers; the Companys ability to collect trade receivables from clients to whom we extend credit; credit risk associated with the Companys reliance on small and medium sized businesses as clients; the Companys ability to anticipate or respond to changes in technology and user preferences; the Companys ability to maintain agreements with major Internet search and local media companies; competition from other yellow page directory publishers and other traditional and new media including increased competition from existing and emerging digital technologies; changes in the availability and cost of paper and other raw materials used to print the Companys directories; the Companys reliance on third-party providers for printing, publishing and distribution services; the Companys ability to attract and retain qualified key personnel; the Companys ability to maintain good relations with its unionized employees; changes in labor, business, political and economic conditions; changes in governmental regulations and policies and actions of federal, state and local municipalities impacting the Companys businesses; the outcome of pending or future litigation and other claims; and other events beyond the Companys control that may result in unexpected adverse operating results.
The foregoing factors should not be construed as exhaustive and should be read together with the other cautionary statements included in the periodic and other reports the Company files with the Securities and Exchange Commission SEC, including the information in Item 1A. Risk Factors in Part I of the Companys Annual Report on Form 10-K for the fiscal year ended December 31, 2014, Item 1A. Risk Factors in Part II of the Companys Quarterly Report on Form 10-Q for the quarterly period ended June 30, 2015, Item 1A. Risk Factors in Part II of the Companys Quarterly Report on Form 10-Q for the quarterly period ended September 30, 2015, which are incorporated herein by reference. If one or more events related to these or other risks or uncertainties materialize, or if the Companys underlying assumptions prove to be incorrect, actual results may differ materially from what we anticipate. All forward-looking statements included in this report are expressly qualified in their entirety by the foregoing cautionary statements. You are cautioned not to place undue reliance on these forward-looking statements, which speak only as of the date hereof or, in the case of statements incorporated by reference, on the date of the document incorporated by reference and, other than as required by law, we undertake no obligation to publicly update or revise any forward-looking statements, whether as a result of new information, future events or otherwise.
Item 9.01. Financial Statements and Exhibits.
(d) Exhibits.
Exhibit No. |
|
Description |
10.1 |
|
Second Amendment, dated as of December 14, 2015. |
99.1 |
|
Lender Presentation, dated September 11, 2015. |
99.2 |
|
Dex Media Updated 5 Year Plan, dated November 16, 2015. |
99.3 |
|
Maps indicating in which states Dex Media East, Inc., Dex Media West, Inc., SuperMedia, Inc. and R.H. Donnelley, Inc. operate. |
99.4 |
|
Other Confidential Information provided to the Ad Hoc Committee. |
SIGNATURES
Pursuant to the requirements of the Securities Exchange Act of 1934, the Registrant has duly caused this Current Report to be signed on its behalf by the undersigned hereunto duly authorized.
|
|
Date: December 15, 2015 |
|
|
DEX MEDIA, INC. |
|
|
|
|
|
/s/ Raymond R. Ferrell |
|
Name: Raymond R. Ferrell |
|
Title: Executive Vice President - General Counsel and Corporate Secretary |
EXHIBIT INDEX
Exhibit No. |
|
Description |
10.1 |
|
Second Amendment, dated as of December 14, 2015. |
99.1 |
|
Lender Presentation, dated September 11, 2015. |
99.2 |
|
Dex Media Updated 5 Year Plan, dated November 16, 2015. |
99.3 |
|
Maps indicating in which states Dex Media East, Inc., Dex Media West, Inc., SuperMedia, Inc. and R.H. Donnelley, Inc. operate. |
99.4 |
|
Other Confidential Information provided to the Ad Hoc Committee. |
Exhibit 10.1
SECOND AMENDMENT TO FORBEARANCE AGREEMENT
This AMENDMENT NO. 2 TO FORBEARANCE AGREEMENT dated as of December 14, 2015 (this Amendment), is entered into by and among each lender under the Credit Agreements executing a counterpart hereof (the Subject Lenders), JPMorgan Chase Bank, N.A. as an Agent under the Dex East Credit Agreement, the Dex West Credit Agreement and the SuperMedia Credit Agreement and Deutsche Bank Trust Company Americas, as an Agent under the RHDI Credit Agreement, each in its capacity as an Agent, and Dex Media, Inc., Dex Media East, Inc., Dex Media Holdings, Inc., Dex Media Service LLC, Dex Media West, Inc., Dex One Digital, Inc., Dex One Service, Inc., R.H. Donnelley Inc., R.H. Donnelley APIL, Inc., R.H. Donnelley Corporation, SuperMedia Inc., SuperMedia LLC, and SuperMedia Sales Inc. (collectively, the Company and each a Company Party). The Subject Lenders, the Agents, and the Company, are hereinafter referred to collectively as the Parties. Unless otherwise defined herein, all defined terms used in this Amendment shall have the meanings ascribed to such terms in the Forbearance Agreement (as defined below).
RECITALS
WHEREAS, the Company has entered into the Forbearance Agreement, dated as of October 30, 2015, with the other Parties, as amended by that First Amendment to Forbearance Agreement dated as of November 23, 2015 (as amended, supplemented or otherwise modified and in effect from time to time, the Forbearance Agreement);
WHEREAS, Section 1(a) of the Forbearance Agreement defines the Forbearance Termination Date as the earlier of (i) 11:59 p.m. (New York time) on December 14, 2015 and (ii) the occurrence of a Termination Event;
WHEREAS, the Forbearance Agreement shall automatically terminate on and after the Forbearance Termination Date, as set forth in Section 2(b) of the Forbearance Agreement; and
WHEREAS, the Subject Lenders (which as of the date hereof collectively hold more than 50% of the aggregate outstanding principal amount of Loans under each of the Dex East Credit Agreement, the Dex West Credit Agreement, the RDHI Credit Agreement, and the SuperMedia Credit Agreement) and the other Parties desire to enter into this Amendment to extend the termination date set forth in Section 1(a) of the Forbearance Agreement upon the terms and conditions set forth herein.
NOW THEREFORE, in consideration of the premises and mutual agreements contained herein and for good and valuable consideration, the receipt and sufficiency of which are hereby acknowledged, the parties hereto agree as follows:
1. Amendment. The Parties hereto agree that the Forbearance Agreement is hereby amended effective as of the Effective Date (as defined below) as follows:
(a) The definition of Forbearance Termination Date in Section 1(a) of the Forbearance Agreement is hereby deleted and replaced in its entirety with the following:
Forbearance Termination Date means the earlier of (i) 11:59 p.m. (New York time) on January 4, 2016 and (ii) the occurrence of a Termination Event.
2. Conditions to Effectiveness. This Amendment shall become effective and be deemed effective as of the date (the date of such effectiveness being referred to as the Effective Date) upon the satisfaction (or waiver by each of the Agents and the Subject Lenders constituting Required Lenders under each of the Credit Agreements) of the following conditions:
(a) Counterparts. Receipt by the Agents of counterparts of this Amendment executed by each Company Party and the Subject Lenders constituting the Required Lenders under and as defined in each of the Credit Agreements as of the date hereof.
(b) No Default. No Default or Event of Default (each as defined under each of the Credit Agreements) other than the Specified Events of Defaults shall have occurred and be continuing.
(c) No Termination Event. No Termination Event shall have occurred and be continuing.
(d) Representations and Warranties. As of the Effective Date, the representations and warranties contained in this Amendment, the Credit Agreements and in each other Loan Document (other than with respect to the Specified Events of Default) shall be true and correct in all material respects (or in any respect to the extent such representation or warranty is qualified by materiality) on and as of the Effective Date as if made on and as of the Effective Date, except to the extent such representations and warranties specifically relate to an earlier date, in which case such representations and warranties shall have been true and correct in all material respects (or in any respect to the extent such representation or warranty is qualified by materiality) on and as of such earlier date.
3. Representations and Warranties. To induce the Agents and the Subject Lenders to enter into this Amendment, each Company Party hereby represents and warrants as of the date hereof:
(a) Duly Organized. Each Company Party is duly organized, validly existing and in good standing under the laws of the jurisdiction of its organization, and has all requisite power and authority to execute, deliver, and perform this Amendment.
(b) Authority. The execution, delivery, and performance by each Company Party of this Amendment (i) have been duly authorized by all necessary corporate or limited liability company and, if required, stockholder or member action on the part of such Company Party, (ii) does not and will not violate any applicable law or regulation applicable to such Company Party or the charter, limited liability company agreement, by-laws or other organizational documents of such Company Party or any order of any Governmental Authority, (iii) does not require any consent or approval of, registration or filing with (other than any disclosure filing), or any other action by, any Governmental Authority, except as have been made or obtained or made and are in full force.
(c) Binding Obligation. This Amendment constitutes the legal, valid, and binding obligation of each Company Party, enforceable against such Company Party in accordance with its terms, subject to applicable bankruptcy, insolvency, reorganization, moratorium, or similar laws affecting creditors rights generally and subject to general principles of equity, regardless of whether considered in a proceeding in equity or at law.
4. Payment Blockage. Each Company Party hereby acknowledges that on November 4, 2015, the Agents delivered a Blockage Notice (as defined in the Indenture) to the indenture trustee to the holders of the Subordinated Notes thereby commencing a Payment Blockage Period (as defined in the Indenture), which Payment Blockage Period remains in full force and effect.
5. Miscellaneous. Except as expressly set forth herein, the Forbearance Agreement is and shall remain unchanged and in full force and effect, and nothing contained in this Amendment shall, by implication or otherwise, limit, impair, constitute a waiver of, or otherwise affect the rights of the Agents or the Subject Lenders, or shall alter, modify, amend or in any way affect any of the terms, conditions, obligations, covenants or agreements contained in the Forbearance Agreement.
6. Survival. This Amendment shall be binding upon and inure to the benefit of and be enforceable by the successors and permitted assigns of the parties hereto.
7. Governing Law. This Amendment shall be governed by and construed in accordance with the law of the State of New York.
8. Counterparts. This Amendment may be executed by one or more of the parties on any number of separate counterparts (including by electronic transmission of signature pages hereto), and all of such counterparts taken together shall be deemed an original and to constitute one and the same instrument.
[Signature Pages Follow]
IN WITNESS WHEREOF, the parties hereto have caused this Amendment to be executed and delivered as of the date first written above.
|
COMPANY: | |
|
| |
|
DEX MEDIA, INC. | |
|
DEX ONE DIGITAL, INC. | |
|
DEX MEDIA EAST, INC. | |
|
DEX MEDIA HOLDINGS, INC. | |
|
DEX MEDIA SERVICE LLC | |
|
DEX MEDIA WEST, INC. | |
|
DEX ONE SERVICE, INC. | |
|
R.H. DONNELLEY INC. | |
|
R.H. DONNELLEY APIL, INC. | |
|
R.H. DONNELLEY CORPORATION | |
|
SUPERMEDIA INC. | |
|
SUPERMEDIA LLC | |
|
SUPERMEDIA SALES INC. | |
|
|
|
|
|
|
|
By: |
/s/ Andrew Hede |
|
Name: Andrew Hede | |
|
Title: Authorized Signatory |
|
AGENTS: | |
|
| |
|
JPMORGAN CHASE BANK, N.A. | |
|
| |
|
In its capacities as Agent under the SuperMedia Credit Agreement, the Dex East Credit Agreement and the Dex West Credit Agreement and as a Lender | |
|
|
|
|
By: |
/s/ Neil R. Boylan |
|
Name: Neil R. Boylan | |
|
Title: Managing Director | |
|
| |
|
| |
|
DEUTSCHE BANK TRUST COMPANY AMERICAS | |
|
|
|
|
By: |
/s/ Benjamin Souh |
|
Name: Benjamin Souh | |
|
Title: Vice President | |
|
|
|
|
By: |
/s/ Michael Shannon |
|
Name: Michael Shannon | |
|
Title: Vice President | |
|
| |
|
SUBJECT LENDERS |
Exhibit 99.1
September 11, 2015 Dex Media Long Term Business Plan
Forward-Looking Statements: Some statements included in this presentation constitute forward-looking statements within the meaning of the Private Securities Litigation Reform Act of 1995 and the federal securities laws. Statements that include the words may, will, could, should, would, believe, anticipate, forecast, estimate, expect, preliminary, intend, plan, project, outlook and similar statements of a future or forward-looking nature identify forward-looking statements. You should not place undue reliance on these statements, as they are not guarantees of future performance. Forward-looking statements provide current expectations with respect to our financial performance and future events with respect to our business and industry in general. Forward-looking statements are based on certain assumptions and include any statement that does not directly relate to any historical or current fact. Forward-looking statements address matters that involve risks and uncertainties, and include, without limitation, future operating and financial performance of the Company (including, without limitation, the future prospects for and stability of the industry in which the Dex Media, Inc. (the Company) operates, anticipated future revenues, EBITDA margins and free cash flow for the remainder of 2015, the implementation of the business transformation program and the ability of the Company to retain existing business and to obtain and retain new business. Accordingly, there are or will be important factors that could cause our actual results to differ materially from those indicated in these statements. We believe that these factors include, but are not limited to, the risks related to the following: our ability to provide assurance for the long-term continued viability of our business; our ability to comply with the financial covenants and other restrictive covenants in our credit facilities; limitations on our operating and strategic flexibility and the ability to operate our business, finance our capital needs or expand business strategies under the terms of our credit facilities; limited access to capital markets and increased borrowing costs resulting from our leveraged capital structure and debt ratings; our ability to obtain additional financing or refinance our existing indebtedness on satisfactory terms or at all; our ability to accurately report our financial results due to a material weakness in our internal control over financial reporting; possible changes in our credit rating; changes in our operating performance; our ability to implement our business transformation program as planned; our ability to realize the anticipated benefits in the amounts and at the times expected from the business transformation program; the risk that the amount of costs associated with our business transformation program will exceed estimates; the risk that our common stock may be delisted from The Nasdaq Stock Market LLC; reduced advertising spending and increased contract cancellations by our clients, which causes reduced revenue; declining use of print yellow page directories by consumers; our ability to collect trade receivables from clients to whom we extend credit; credit risk associated with our reliance on small and medium sized businesses as clients; our ability to anticipate or respond to changes in technology and user preferences; our ability to maintain agreements with major Internet search and local media companies; competition from other yellow page directory publishers and other traditional and new media including increased competition from existing and emerging digital technologies; changes in the availability and cost of paper and other raw materials used to print our directories; our reliance on third-party providers for printing, publishing and distribution services; our ability to attract and retain qualified key personnel; our ability to maintain good relations with our unionized employees; changes in labor, business, political and economic conditions; changes in governmental regulations and policies and actions of federal, state and local municipalities impacting our businesses; the outcome of pending or future litigation and other claims; and other events beyond our control that may result in unexpected adverse operating results. The foregoing factors should not be construed as exhaustive and should be read together with the other cautionary statements included the Companys filings made with the Securities and Exchange Commission (SEC), including those under Risk Factors therein. If one or more events related to these or other risks or uncertainties materialize, or if our underlying assumptions prove to be incorrect, actual results may differ materially from what we anticipate. All forward-looking statements included in this presentation are expressly qualified in their entirety by the foregoing cautionary statements. You are cautioned not to place undue reliance on these forward-looking statements, which speak only as of the date hereof and, other than as required by law, we undertake no obligation to publicly update or revise any forward-looking statements, whether as a result of new information, future events or otherwise. Non-GAAP Information: The Company believes that certain non-GAAP measures of financial results (including EBITDA) provide useful information to management and investors regarding certain financial and business trends relating to the Companys financial condition and results of operations. The Companys management uses these non-GAAP measures to compare the Companys performance to that of prior periods for trend analyses, for purposes of determining management incentive compensation, and for budgeting and planning purposes. These measures are used in monthly financial reports prepared for management and the Companys board of directors. The Company believes that the use of these non-GAAP financial measures provides an additional tool for investors to use in evaluating ongoing operating results and trends and in comparing the Companys financial measures with similar companies[, many of which present similar non-GAAP financial measures to investors]. Management does not consider these non-GAAP measures in isolation or as an alternative to financial measures determined in accordance with GAAP. The principal limitation of these non-GAAP financial measures is that they exclude significant expenses and income that are required by GAAP to be recorded in the Companys financial statements. In addition, they are subject to inherent limitations as they reflect the exercise of judgments by management about which expenses and income are excluded or included in determining these non-GAAP financial measures. In order to compensate for these limitations, management presents non-GAAP financial measures in connection with GAAP results. 2 Confidential and Proprietary Information of Dex Media Safe Harbor Statement
Agenda 3 Confidential and Proprietary Information of Dex Media Current Business New Digital Products Current Trends Key Metrics and Historical Financials Risk and Opportunities Tax Attributes
Current Business 4 Confidential and Proprietary Information of Dex Media
Background Strategy Review Spring / Summer 2014 Retained by Dex Media Board to assess strategy and develop plan Recognized that Dex Medias strategy was focused on a high churn, low margin, commodity business Developed new mission / cause to move into high growth, differentiated, sticky Beyond Leads segment 5 Confidential and Proprietary Information of Dex Media
What We Inherited Challenges in Dex Media organization Strategy based on Digital growth at all cost Heavy focus on SEM sales (low margin, high churn) Harvesting of / disinvestment in Print IYPs in maintenance mode (improvements paused) De-emphasis on recurring revenue products (websites, video) Heavy SEM focus led to misalignments / poor execution Management and sales rep incentives misaligned SEM campaigns not competitive No post sales service or follow up Ad Sales metric encouraged pull forward sales strategy Other significant organizational challenges: Core systems duplicative, never integrated Customer experience confusing too many touch-points Complex product set, sales calls meandering Little prospecting, no lead generation for customer acquisition Onerous capital structure 6 Confidential and Proprietary Information of Dex Media
We have a new mission that the company believes in and is excited about: Small businesses are under assault - Larger, regional & national competitors, Local On Demand Economy players, and Google/Amazon/Facebook are grabbing share from SMBs through use of sophisticated web marketing tools, especially mobile. Cause: Help SMBs fight back and thrive using todays sophisticated web and mobile marketing tools Vision For The Future 7 Confidential and Proprietary Information of Dex Media
Vision For The Future Cornerstone approach: Wedge Product DexHub and DexLnk Print, IYP, and SEM continue to have a role Several critical changes are underway Other Key Elements to Delivering on the Plan Metrics to evaluate the new strategy are being developed 8 Confidential and Proprietary Information of Dex Media
New Digital Products 9 Confidential and Proprietary Information of Dex Media
What Do SMBs Want SMBs want help managing their online presence and building deeper engagement with their customers IBISWorld, Borrell Associates, BIA/Kelsey, eMarketer; Thrive Analytics, Local Pulse Survey, January 2014. Confidential and Proprietary Information of Dex Media 10
Presence Reputation, Hosting, Website/Mobile, Social Leads YP & IYP, SEO, SEM, Display Communication CRM, Appointments, Text, Payments Product Staircase DexLeads DexLnk DexHub $ of Customer Spend Customer Sophistication At each step, our products and approach to market now reflect value we deliver to our clients with an understanding of their sophistication DIWM 11 Confidential and Proprietary Information of Dex Media
New DexHub Product IYP Print Social Video Display SEM DexHub Websites/Social DPM DexLnk SEO DexHub phased launch began in July and provides SMBs a strong platform and marketing services to manage their presence A foundational package of digital marketing products from which to build a robust marketing program Digital marketing package Marketing department support 12 Confidential and Proprietary Information of Dex Media
A comprehensive and easy way to manage your customer database and appointment scheduling through a simple user interface Customer profiles Targeted messaging Cultivate loyal relationships New DexLnk Product DexLnk CRM pilot launched in April and serves SMBs need to build engagement with their customers 13 Confidential and Proprietary Information of Dex Media
Dex Leads: Fixing Our Leads Product We are refreshing and upgrading each of our Leads products: LEADS Display SEM Print IYP SEO 14 Confidential and Proprietary Information of Dex Media
Driving Prospect Engagement (Leads) Promote solutions to SMB marketing pain points that generate interest and engagement Ramp up effort to generate quality small business leads for Marketing Consultants Increased investment Hired new direct response agency (KERN) Take advantage of improved marketing technology Focus on lead response management 15 Confidential and Proprietary Information of Dex Media Prospects Inquiries MQL (Marketing Qualified Lead) SAL (Sales Accepted Lead) SQL (Sales Qualified Lead) Closed (Won/Lost )
Differentiation: Service Changing how we do business with our clients Eliminating product-centric fulfillment silos Launching client-centric service model that services a clients complete campaign program with a consultative approach MC SPOC 2 SPOC 3 Sparkle Vendor 1 Product 2 SPOC 1 Vendor 2 Product 1 SPOC 1 SEO SEM Website Social DPM IYP Vendor 1 Vendor 2 16 Confidential and Proprietary Information of Dex Media
Utilizing experienced and entrepreneurial sales people, this channel will serve as a center of innovation Expansion Channel 17 Confidential and Proprietary Information of Dex Media
Current Trends 18 Confidential and Proprietary Information of Dex Media
Print Trends 19 > 490,000 Clients 38% Digital Pro Forma EBITDA $715 Million Free Cash Flow $370 Million Confidential and Proprietary Information of Dex Media Print as sold in Q2 2015 showed some encouraging signs NI/PI in Q2 2015 was -18.6% after averaging -23.0% in 2014 and was the best result since Q3 2013 Existing accounts increased more and decreased less, while new accounts also contributed to the improved result Q1 2015 result of -20.3% was also an improvement over 2014 Q3 appears to be tracking to a similar trend Actual Q3 trend -30.0% -25.0% -20.0% -15.0% Q1 13 Q2 13 Q3 13 Q4 13 Q1 14 Q2 14 Q3 14 Q4 14 Q1 15 Q2 15 Q3 15 Local Print As Sold - NI / PI
Digital Ad Sales 20 > 490,000 Clients 38% Digital Pro Forma EBITDA $715 Million Free Cash Flow $370 Million Confidential and Proprietary Information of Dex Media Digital ad sales July YTD were $244.1MM, an $83.3MM or 25.4% decline from the same period last year ($327.4MM) Sales handled (PI), sales performance (NI/PI), and a decline in the realization factor were the largest contributors to the decline Digital ad sales handled (PI) stabilized in Q2 after the shortfall seen in Q1 Sales performance (NI/PI) was negative at -4.4% YTD 2015 vs. 11.6% YTD 2014 The realization factor was 80% YTD 2015 compared to 86% YTD 2014 Digital Ad Sales ($ in millions) Numbers are approximate due to rounding $327.4 $(19.7) $(40.4) $(16.8) $(6.4) $244.1 $0 $50 $100 $150 $200 $250 $300 $350 YTD 2014 Ad Sales (NI) Local Sales Handled Change in Sales Performance Change in Realization Factor National Sales & Other YTD 2015 Ad Sales (NI)
July 2015 YTD Income Statement 21 Confidential and Proprietary Information of Dex Media 2015 ($ in millions) YTD July Revenue Print 611.4 $ 529.8 $ 463.0 $ 992.8 $ Digital 305.0 263.0 247.0 510.0 Total Revenue, net 916.4 $ 792.8 $ 710.0 $ 1,502.8 $ Expenses Sales 170.5 $ 141.0 $ 145.4 $ 286.4 $ Operations 148.2 124.6 120.1 244.7 Information Technology 71.7 62.5 51.7 114.2 Marketing 147.1 125.1 122.2 247.3 All other G&A 25.6 22.0 20.2 42.2 Bad Debt 9.5 8.2 14.7 22.9 Net Capitalized Spending & Other (1.0) 7.2 12.8 20.0 Total Expenses 571.6 $ 490.6 $ 487.1 $ 977.7 $ EBITDA 344.8 $ 302.2 $ 222.9 $ 525.1 $ Margin % 37.6% 38.1% 31.4% 34.9% Notes: EBITDA includes impact of ECL 2015 Actual 1H Actual 2H LTF 2015 LTF
1H 2015 22 Confidential and Proprietary Information of Dex Media First half adjusted EBITDA was $302.2MM 2015 ($ in millions) 1H 2H Variance Digital Print Total Digital Print Total Digital Print Total Revenue 263.0 $ 529.8 $ 792.8 $ 247.0 $ 463.0 $ 710.0 $ (16.0) $ (66.8) $ (82.8) $ Variable Margin 142.4 422.5 564.9 131.4 364.6 496.0 (11.0) (58.0) (69.0) % of sales 54.1% 79.8% 71.3% 53.2% 78.7% 69.9% 68.9% 86.8% 83.3% Direct Overhead Expenses 83.6 99.5 183.1 83.3 102.8 186.1 0.3 (3.3) (3.0) Indirect Overhead Expenses 26.4 53.2 79.6 30.6 56.4 87.0 (4.1) (3.3) (7.4) EBITDA 32.4 $ 269.9 $ 302.2 $ 17.5 $ 205.3 $ 222.9 $ (14.8) $ (64.5) $ (79.4) $ % of sales 12.3% 50.9% 38.1% 7.1% 44.3% 31.4% 92.8% 96.6% 95.9%
2015 1H Cost Reductions 23 Confidential and Proprietary Information of Dex Media Savings driven by business transformation initiatives ($ in millions) 1H 2015 2H 2015 2015 LTF Run Rate Comments Actual Projected Savings Headcount 44.3 $ 34.7 $ 79.0 $ 87.0 $ Some of 2015 savings will be offset by investment in sales and customer service Facility Closings 3.6 7.4 11.0 19.0 All 105 planned closures complete Print & Distribution 5.8 4.2 10.0 42.0 2015 savings represents amortized portion of savings; balance realized in 2016 Digital Vendors 6.2 3.8 10.0 12.0 New contract negotiated in early 2015 Total 59.9 $ 50.1 $ 110.0 $ 160.0 $
Key Metrics and Historical Financials 24 Confidential and Proprietary Information of Dex Media
Print and Digital Trends 25 Confidential and Proprietary Information of Dex Media Published sales equates to Print Ad Sales on a book over book view Print published sales and revenue results Digital ad sales and revenue results Sales growth is NI$/NI$ before factoring and represents the local sales channels Revenue is total company, inclusive of National and Expansion Channel ($ in millions) 2013A 2014A 2015P 2016P 2017P 2018P 2019P 2020P Published Sales, Gross Growth % -20.8% -22.0% -23.6% -21.5% -20.0% -20.0% -20.0% -20.0% Print Revenue, net 1,653 $ 1,301 $ 993 $ 775 $ 609 $ 485 $ 388 $ 311 $ Growth % -23.9% -21.3% -23.7% -21.9% -21.5% -20.3% -20.0% -19.9% ($ in millions) 2013A 2014A 2015P 2016P 2017P 2018P 2019P 2020P Local Digital Sales Growth % (NI/NI) No Factor 7.8% 14.6% -11.3% 7.7% 7.6% 8.0% 8.0% 8.0% Digital Revenue, net 526 $ 544 $ 510 $ 540 $ 619 $ 693 $ 777 $ 864 $ Growth % 18.6% 3.4% -6.2% 5.8% 14.6% 12.0% 12.1% 11.2%
Summary Income Statements 26 Confidential and Proprietary Information of Dex Media ($ in millions) 2014A 2015P 2016P 2017P 2018P 2019P 2020P FY14 v FY13 FY15 v FY14 FY16 v FY15 FY17 v FY16 FY18 v FY17 FY19 v FY18 FY20 v FY19 Net Revenue Growth % Print Revenue 1,301.3 $ 992.8 $ 775.4 $ 608.6 $ 484.9 $ 388.0 $ 310.7 $ -21.3% -23.7% -21.9% -21.5% -20.3% -20.0% -19.9% Digital Revenue 543.5 510.0 539.8 618.6 692.8 776.7 863.6 3.4% -6.2% 5.8% 14.6% 12.0% 12.1% 11.2% Total Revenue 1,844.8 $ 1,502.8 $ 1,315.2 $ 1,227.2 $ 1,177.7 $ 1,164.7 $ 1,174.4 $ -15.5% -18.5% -12.5% -6.7% -4.0% -1.1% 0.8% Expenses % of Revenue Sales 346.7 $ 286.4 $ 257.6 $ 233.3 $ 222.4 $ 215.7 $ 212.1 $ 18.8% 19.1% 19.6% 19.0% 18.9% 18.5% 18.1% Operations 288.6 244.7 220.0 216.9 215.7 217.5 218.8 15.6% 16.3% 16.7% 17.7% 18.3% 18.7% 18.6% Core Marketing 35.6 32.1 29.9 27.2 24.9 23.4 22.5 1.9% 2.1% 2.3% 2.2% 2.1% 2.0% 1.9% Distribution 73.5 51.3 43.0 39.5 36.4 33.7 31.2 4.0% 3.4% 3.3% 3.2% 3.1% 2.9% 2.7% Traffic 157.5 163.9 156.0 178.7 196.6 216.5 234.0 8.5% 10.9% 11.9% 14.6% 16.7% 18.6% 19.9% Marketing 266.6 247.3 228.9 245.4 257.9 273.6 287.7 14.5% 16.5% 17.4% 20.0% 21.9% 23.5% 24.5% Total IT/Facilities 138.6 114.2 99 99 99 99 99 7.5% 7.6% 7.5% 8.1% 8.4% 8.5% 8.4% Finance 21.2 19.6 19.2 17.2 17.2 16 16 1.1% 1.3% 1.5% 1.4% 1.5% 1.4% 1.4% Human Resources 12.9 10.1 9.7 8.5 8.5 7.5 7.5 0.7% 0.7% 0.7% 0.7% 0.7% 0.6% 0.6% Legal 8.6 9.2 7.3 7.3 7.3 7.3 7.3 0.5% 0.6% 0.6% 0.6% 0.6% 0.6% 0.6% Executive 3.5 3.3 3.3 3.3 3.3 3.3 3.3 0.2% 0.2% 0.3% 0.3% 0.3% 0.3% 0.3% Total Departmental Exp. 1,086.7 $ 934.8 $ 845.0 $ 830.9 $ 831.3 $ 839.9 $ 851.7 $ 58.9% 62.2% 64.2% 67.7% 70.6% 72.1% 72.5% Net Capitalization 20.2 40.7 17.4 10.2 7.6 6.1 3.5 1.1% 2.7% 1.3% 0.8% 0.6% 0.5% 0.3% Bad Debt 26.7 22.9 29.6 36.8 43.0 43.7 44.0 1.4% 1.5% 2.3% 3.0% 3.7% 3.8% 3.8% Other Period (4.4) (20.7) 21.9 (9.1) 0.6 4.5 1.3 -0.2% -1.4% 1.7% -0.7% 0.1% 0.4% 0.1% Total Expenses 1,129.2 $ 977.7 $ 913.9 $ 868.8 $ 882.5 $ 894.2 $ 900.5 $ 61.2% 65.1% 69.5% 70.8% 74.9% 76.8% 76.7% EBITDA (Pro Forma) 715.6 $ 525.1 $ 401.3 $ 358.4 $ 295.2 $ 270.5 $ 273.8 $ 38.8% 34.9% 30.5% 29.2% 25.1% 23.2% 23.3% ($ in millions) 2014A 2015P 2016P 2017P 2018P 2019P 2020P FY14 v FY13 FY15 v FY14 FY16 v FY15 FY17 v FY16 FY18 v FY17 FY19 v FY18 FY20 v FY19 Net Revenue Growth % Print Revenue 1,301.3 $ 992.8 $ 775.4 $ 608.6 $ 484.9 $ 388.0 $ 310.7 $ -21.3% -23.7% -21.9% -21.5% -20.3% -20.0% -19.9% Digital Revenue 543.5 510.0 539.8 618.6 692.8 776.7 863.6 3.4% -6.2% 5.8% 14.6% 12.0% 12.1% 11.2% Total Revenue 1,844.8 $ 1,502.8 $ 1,315.2 $ 1,227.2 $ 1,177.7 $ 1,164.7 $ 1,174.4 $ -15.5% -18.5% -12.5% -6.7% -4.0% -1.1% 0.8% Expenses % of Revenue Sales 346.7 $ 286.4 $ 257.6 $ 233.3 $ 222.4 $ 215.7 $ 212.1 $ 18.8% 19.1% 19.6% 19.0% 18.9% 18.5% 18.1% Operations 288.6 244.7 220.0 216.9 215.7 217.5 218.8 15.6% 16.3% 16.7% 17.7% 18.3% 18.7% 18.6% Core Marketing 35.6 32.1 29.9 27.2 24.9 23.4 22.5 1.9% 2.1% 2.3% 2.2% 2.1% 2.0% 1.9% Distribution 73.5 51.3 43.0 39.5 36.4 33.7 31.2 4.0% 3.4% 3.3% 3.2% 3.1% 2.9% 2.7% Traffic 157.5 163.9 156.0 178.7 196.6 216.5 234.0 8.5% 10.9% 11.9% 14.6% 16.7% 18.6% 19.9% Marketing 266.6 247.3 228.9 245.4 257.9 273.6 287.7 14.5% 16.5% 17.4% 20.0% 21.9% 23.5% 24.5% Total IT/Facilities 138.6 114.2 99 99 99 99 99 7.5% 7.6% 7.5% 8.1% 8.4% 8.5% 8.4% Finance 21.2 19.6 19.2 17.2 17.2 16 16 1.1% 1.3% 1.5% 1.4% 1.5% 1.4% 1.4% Human Resources 12.9 10.1 9.7 8.5 8.5 7.5 7.5 0.7% 0.7% 0.7% 0.7% 0.7% 0.6% 0.6% Legal 8.6 9.2 7.3 7.3 7.3 7.3 7.3 0.5% 0.6% 0.6% 0.6% 0.6% 0.6% 0.6% Executive 3.5 3.3 3.3 3.3 3.3 3.3 3.3 0.2% 0.2% 0.3% 0.3% 0.3% 0.3% 0.3% Total Departmental Exp. 1,086.7 $ 934.8 $ 845.0 $ 830.9 $ 831.3 $ 839.9 $ 851.7 $ 58.9% 62.2% 64.2% 67.7% 70.6% 72.1% 72.5% Net Capitalization 20.2 40.7 17.4 10.2 7.6 6.1 3.5 1.1% 2.7% 1.3% 0.8% 0.6% 0.5% 0.3% Bad Debt 26.7 22.9 29.6 36.8 43.0 43.7 44.0 1.4% 1.5% 2.3% 3.0% 3.7% 3.8% 3.8% Other Period (4.4) (20.7) 21.9 (9.1) 0.6 4.5 1.3 -0.2% -1.4% 1.7% -0.7% 0.1% 0.4% 0.1% Total Expenses 1,129.2 $ 977.7 $ 913.9 $ 868.8 $ 882.5 $ 894.2 $ 900.5 $ 61.2% 65.1% 69.5% 70.8% 74.9% 76.8% 76.7% EBITDA (Pro Forma) 715.6 $ 525.1 $ 401.3 $ 358.4 $ 295.2 $ 270.5 $ 273.8 $ 38.8% 34.9% 30.5% 29.2% 25.1% 23.2% 23.3%
Risk and Opportunities 27 Confidential and Proprietary Information of Dex Media
Print performance trend does not improve Consumers continue to defect from using the product ROI degrades for clients Targeted distribution does not maintain product profitability Digital performance trend does not improve We are not able to clearly communicate and/or deliver on product performance expectations, negatively impacting loyalty, retention and renewal Dex Media is not differentiated as the marketing department: for example, new service model does not improve onboarding, fulfillment, and ongoing service experience Expansion channel clients do not grow at expected rates after being acquired Traffic costs remain higher than anticipated Unsuccessful shifting to presence products Market demand for variable billed products maintains or increases Risks Confidential and Proprietary Information of Dex Media 28
Opportunities Confidential and Proprietary Information of Dex Media 29 Improved Print Performance Content enhancements maintain usage due to distribution enhancements Product ROI maintained for clients, improving retention and renewal Changes to pricing/bundle structures incent clients to maintain print spend longer, bringing the performance trend closer to the products natural market decline Improved Digital Performance We communicate and deliver on product performance expectations improving loyalty, retention and renewal Product simplification focuses the sales call and improves conversion and upsell New service model improves onboarding, fulfillment, and ongoing service experience, differentiating Dex Media as the marketing department Expansion channel leverages unique value proposition and differentiated service model to capture new market growth Traffic cost reduced by migrating clients to fixed SEM and Presence products
Tax Attributes 30 Confidential and Proprietary Information of Dex Media
Forecasted Pre-Transaction Attributes by Silo as of 12/31/15 31 Confidential and Proprietary Information of Dex Media Source: Company Information, Advisor Illustrative Tax Analysis 1. Forecasted tax attributes subject to change based on absolute valuation and silo-level valuations; At a 3.0x 2015E EBITDA valuation, Dex West is forecasted to begin with ~$40mm of NOLs - valuation may cause additional attributes to come into existence at the time of the debt restructuring if a repurchase premium exists on any debt as a result of that valuation; accordingly, a premium may result in the creation of additional NOLs ($ in millions) Intangibles OID NOL Total SuperMedia 12 $ 112 $ 23 $ 147 $ RHDI - 61 763 824 Dex East 118 38 31 187 Dex West (1) 160 25 22 207 Other - - 36 36 Total 290 $ 236 $ 875 $ 1,401 $ Forecasted Tax Attributes by Silo at 12/31/15 (¹)
Drivers of Post-Transaction Tax Attribute Value 32 Confidential and Proprietary Information of Dex Media Absolute valuation multiple of Dex Media, Inc. Relative silo valuation multiple, if any Discount rate Transaction timing
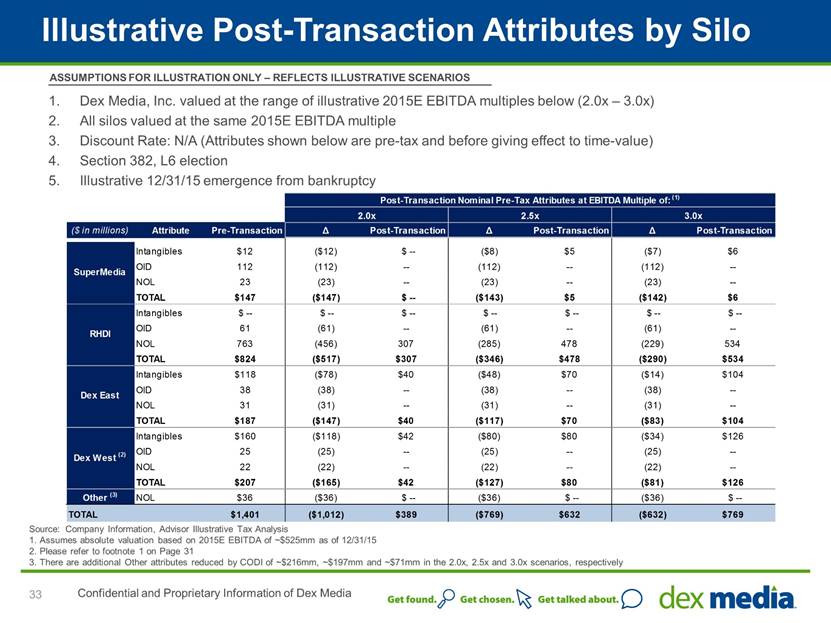
Illustrative Post-Transaction Attributes by Silo 33 Confidential and Proprietary Information of Dex Media Dex Media, Inc. valued at the range of illustrative 2015E EBITDA multiples below (2.0x 3.0x) All silos valued at the same 2015E EBITDA multiple Discount Rate: N/A (Attributes shown below are pre-tax and before giving effect to time-value) Section 382, L6 election Illustrative 12/31/15 emergence from bankruptcy ASSUMPTIONS FOR ILLUSTRATION ONLY REFLECTS ILLUSTRATIVE SCENARIOS Source: Company Information, Advisor Illustrative Tax Analysis 1. Assumes absolute valuation based on 2015E EBITDA of ~$525mm as of 12/31/15 2. Please refer to footnote 1 on Page 38 3. There are additional Other attributes reduced by CODI of ~$216mm, ~$197mm and ~$71mm in the 2.0x, 2.5x and 3.0x scenarios, respectively Post-Transaction Nominal Pre-Tax Attributes at EBITDA Multiple of: (1) 2.0x 2.5x 3.0x Attribute Pre-Transaction ? Post-Transaction ? Post-Transaction ? Post-Transaction Intangibles $12 ($12) $ -- ($8) $5 ($7) $6 OID 112 (112) -- (112) -- (112) -- NOL 23 (23) -- (23) -- (23) -- TOTAL $147 ($147) $ -- ($143) $5 ($142) $6 Intangibles $ -- $ -- $ -- $ -- $ -- $ -- $ -- OID 61 (61) -- (61) -- (61) -- NOL 763 (456) 307 (285) 478 (229) 534 TOTAL $824 ($517) $307 ($346) $478 ($290) $534 Intangibles $118 ($78) $40 ($48) $70 ($14) $104 OID 38 (38) -- (38) -- (38) -- NOL 31 (31) -- (31) -- (31) -- TOTAL $187 ($147) $40 ($117) $70 ($83) $104 Intangibles $160 ($118) $42 ($80) $80 ($34) $126 OID 25 (25) -- (25) -- (25) -- NOL 22 (22) -- (22) -- (22) -- TOTAL $207 ($165) $42 ($127) $80 ($81) $126 NOL $36 ($36) $ -- ($36) $ -- ($36) $ -- TOTAL $1,401 ($1,012) $389 ($769) $632 ($632) $769 Other (3) ($ in millions) SuperMedia RHDI Dex East Dex West (2)
Appendices 34 Confidential and Proprietary Information of Dex Media
Appendices 35 Confidential and Proprietary Information of Dex Media July Consolidated Balance Sheet ...................................................36 July YTD Free Cash Flow . 37 Silo Comparison . ....38
July Consolidated Balance Sheet 36 Confidential and Proprietary Information of Dex Media ($ in millions) Actual July '15 Assets Current assets Cash and cash equivalents 185 $ Accounts receivable, net 131 Deferred directory costs 139 Deferred tax assets - Prepaid expenses and other 18 Assets held for sale - Total current assets 473 42 Goodwill 315 Intangible assets, net 577 Pension assets 45 Other non-current assets 6 Fixed assets and capitalized software, net ($ in millions) Actual July '15 Liabilities and Shareholders' Equity (Deficit) Current liabilities Current maturities of long-term debt 98 $ 120 Affiliates payable, net - Accrued interest 26 Deferred revenue 78 Current deferred tax liabilities - Total current liabilities 322 Long-term debt 2,218 Employee benefit obligations 118 Deferred tax liabilities 28 Unrecognized tax benefits 11 Investment in subsidiaries - Other liabilities 3 Accounts payable and accrued liabilities Total Assets 1,458 $ Total Liabilities 2,700 $ Shareholders' Equity (Deficit) (1,242) 1,458 $ Total Liabilities and Shareholders' Equity (Deficit)
July 2015 YTD Free Cash Flow 37 Confidential and Proprietary Information of Dex Media Note: Free cash flow does not include any amortization or pay down of debt or debt amendment fees ($ in millions) Year-to-Date $ % Flash Adjusted Proforma EBITDA 344.7 $ 429.1 $ (84.4) $ -19.7% Non-cash EBITDA Adjustments (1.5) (11.5) 10.0 -87.0% Tax Refunds/(Payments) (6.7) (2.1) (4.6) -219.0% Late Fees 3.5 4.8 (1.3) -27.1% Merger Integration - Cash - (30.9) 30.9 -100.0% Business Transformation - Cash (45.9) - (45.9) 0.0% Pension Funding (2.3) (5.0) 2.7 54.0% Net Capitalized Spending - - - 0.0% Working Capital/Other 4.4 7.3 (2.9) -39.7% Cash from Operating Activities 296.2 $ 391.7 $ (95.5) $ -24.4% Capital Expenditures (9.8) (10.9) 1.1 10.1% Free Cash Flow (before debt service) 286.4 $ 380.8 $ (94.4) $ -24.8% Interest Payments (137.5) (154.3) 16.8 10.9% Free Cash Flow, before Restructuring 148.9 $ 226.5 $ (77.6) $ -34.3% Restructuring - Cash (2.0) - (2.0) 0.0% Free Cash Flow, after Restructuring 146.9 $ 226.5 $ (79.6) $ -35.1% Actual Prior Year Variance
Summary Silo Comparison Confidential and Proprietary Information of Dex Media 38 [1] YTD through June 2015 SPMD RHD DME DMW Total EBITDA Margins 2014 Revenue ($ MM) 926.9 $ 388.4 $ 252.4 $ 277.2 $ 1,844.8 $ EBITDA ($ MM) 352.1 $ 154.1 $ 108.7 $ 113.7 $ 715.5 $ EBITDA Margin % 38.0% 39.7% 43.1% 41.0% 38.8% 2015 (YTD) [1] Revenue ($ MM) 392.1 $ 169.8 $ 110.6 $ 120.5 $ 793.0 $ EBITDA ($ MM) 146.8 $ 72.3 $ 42.7 $ 47.0 $ 302.4 $ EBITDA Margin % 37.4% 42.6% 38.6% 39.0% 38.1% Mix of Print / Digital 2014 % Print Revenue 72.9% 66.6% 69.3% 69.1% 70.5% % Digital Revenue 27.1% 33.4% 30.7% 30.9% 29.5% 2015 (YTD) [1] % Print Revenue 68.5% 63.3% 66.6% 66.3% 66.8% % Digital Revenue 31.5% 36.7% 33.4% 33.7% 33.2%
Dex Media, Inc.
Reconciliation of Non-GAAP Measures for Slide 21 in Dex Media Long Term Business Plan
Unaudited |
|
Seven Mos. |
| |
|
|
|
| |
Net (Loss) - GAAP |
|
$ |
(125 |
) |
Add/(subtract) non-operating items: |
|
|
| |
Provision (benefit) for income taxes |
|
(2 |
) | |
Interest expense, net |
|
201 |
| |
Gain on early extinguishment of debt |
|
(1 |
) | |
Operating Income - GAAP |
|
73 |
| |
Depreciation and amortization |
|
243 |
| |
EBITDA (non-GAAP) |
|
316 |
| |
|
|
|
| |
Adjustments and pro forma items: |
|
|
| |
Business transformation costs |
|
28 |
| |
Long term incentive compensation |
|
1 |
| |
Adjusted EBITDA (non-GAAP) Per Slide 21 (EBITDA) |
|
$ |
345 |
|
|
|
|
| |
Operating Revenue - GAAP |
|
$ |
916 |
|
|
|
|
| |
Operating income margin - GAAP |
|
8.0 |
% | |
Impact of depreciation and amortization |
|
26.5 |
% | |
EBITDA margin (non-GAAP) |
|
34.5 |
% | |
Impact of adjustments and pro forma Items |
|
3.1 |
% | |
Adjusted EBITDA margin (non-GAAP) Per Slide 21 (Margin %) |
|
37.6 |
% |
Dex Media, Inc.
Reconciliation of Non-GAAP Measures for Slide 22 in Dex Media Long Term Business Plan
Unaudited |
|
Six Mos. Ended |
| |
|
|
|
| |
Net (Loss) - GAAP |
|
$ |
(101 |
) |
Add/(subtract) non-operating items: |
|
|
| |
Provision (benefit) for income taxes |
|
(2 |
) | |
Interest expense, net |
|
172 |
| |
Gain on early extinguishment of debt |
|
(1 |
) | |
Operating Income - GAAP |
|
68 |
| |
Depreciation and amortization |
|
209 |
| |
EBITDA (non-GAAP) |
|
277 |
| |
|
|
|
| |
Adjustments and pro forma items: |
|
|
| |
Business transformation costs |
|
24 |
| |
Long term incentive compensation |
|
1 |
| |
Adjusted EBITDA (non-GAAP) Per Slide 22 (EBITDA) |
|
$ |
302 |
|
|
|
|
| |
Operating Revenue - GAAP |
|
$ |
793 |
|
|
|
|
| |
Operating income margin - GAAP |
|
8.6 |
% | |
Impact of depreciation and amortization |
|
26.3 |
% | |
EBITDA margin (non-GAAP) |
|
34.9 |
% | |
Impact of adjustments and pro forma Items |
|
3.2 |
% | |
Adjusted EBITDA margin (non-GAAP) Per Slide 22 (% of Sales) |
|
38.1 |
% |
Dex Media, Inc.
Reconciliation of Non-GAAP Measures for Slide 25 in Dex Media Long Term Business Plan
|
|
|
|
(dollars in millions) |
| ||
|
|
Year Ended |
|
Year Ended |
| ||
Unaudited |
|
12/31/14 |
|
12/31/13 |
| ||
|
|
|
|
|
| ||
Operating Revenue - GAAP |
|
$ |
1,815 |
|
$ |
1,444 |
|
SuperMedia revenue excluded from GAAP revenue |
|
30 |
|
740 |
| ||
Pro Forma Operating Revenue (non-GAAP) |
|
$ |
1,845 |
|
$ |
2,184 |
|
|
|
|
|
|
| ||
Print Revenue, net per slide 25 |
|
$ |
1,301 |
|
$ |
1,653 |
|
Digital Revenue, net per slide 25 |
|
544 |
|
526 |
| ||
Miscellaneous revenue |
|
|
|
5 |
| ||
Pro Forma Operating Revenue (non-GAAP) |
|
$ |
1,845 |
|
$ |
2,184 |
|
Dex Media, Inc.
Reconciliation of Non-GAAP Measures for Slide 26 in Dex Media Long Term Business Plan
Unaudited |
|
Year Ended |
| |
|
|
|
| |
Net (Loss) - GAAP |
|
$ |
(371 |
) |
Add/(subtract) non-operating items: |
|
|
| |
Provision (benefit) for income taxes |
|
13 |
| |
Interest expense, net |
|
356 |
| |
Gain on early extinguishment of debt |
|
(2 |
) | |
Operating Income - GAAP |
|
(4 |
) | |
Depreciation and amortization |
|
643 |
| |
EBITDA (non-GAAP) |
|
639 |
| |
|
|
|
| |
Adjustments and pro forma items: |
|
|
| |
Adjustments for SuperMedia acquisition accounting |
|
21 |
| |
Merger integration costs |
|
41 |
| |
Business transformation costs |
|
43 |
| |
Employee benefit plan amendments |
|
(42 |
) | |
Long term incentive compensation |
|
10 |
| |
Asset write downs |
|
3 |
| |
Adjusted EBITDA (non-GAAP) Per Slide 26 (EBITDA Pro Forma) |
|
$ |
715 |
|
|
|
|
| |
Operating Revenue - GAAP |
|
$ |
1,815 |
|
SuperMedia revenue excluded from GAAP revenue |
|
30 |
| |
Operating Revenue - GAAP and Pro Forma Operating Revenue (non-GAAP) |
|
$ |
1,845 |
|
|
|
|
| |
Operating income margin -GAAP |
|
-0.2 |
% | |
Impact of depreciation and amortization |
|
35.4 |
% | |
EBITDA margin (non-GAAP) |
|
35.2 |
% | |
Impact of adjustments and pro forma Items |
|
3.6 |
% | |
Adjusted EBITDA margin (non-GAAP) Per Slide 26 (EBITDA Pro Forma %) |
|
38.8 |
% |
Dex Media, Inc.
EBITDA Walkforward - GAAP to Adjusted and Adjusted Pro Forma Basis (Non-GAAP)
YTD June 2015 and 2014
Reconciliation of Non-GAAP Measures for Slide 38 in Dex Media Long Term Business Plan
|
|
For the Six Months Ended June 30, 2015 |
| ||||||||||
|
|
R.H. |
|
Dex Media |
|
Dex Media |
|
Super |
|
Parent/ |
|
Dex Media |
|
|
|
Donnelley |
|
East |
|
West |
|
Media |
|
Other/Elims |
|
Consolidated |
|
|
|
(in millions) |
| ||||||||||
|
|
|
|
|
|
|
|
|
|
|
|
|
|
Revenue - Per GAAP financials |
|
170 |
|
111 |
|
120 |
|
392 |
|
|
|
793 |
|
|
|
|
|
|
|
|
|
|
|
|
|
|
|
Operating Income - Per GAAP financials |
|
27 |
|
(5 |
) |
(10 |
) |
61 |
|
(5 |
) |
68 |
|
Add Back: Depreciation and amortization |
|
39 |
|
44 |
|
53 |
|
73 |
|
|
|
209 |
|
EBITDA - Per GAAP Financials |
|
66 |
|
39 |
|
43 |
|
134 |
|
(5 |
) |
277 |
|
|
|
|
|
|
|
|
|
|
|
|
|
|
|
Adjustments: |
|
|
|
|
|
|
|
|
|
|
|
|
|
Business Transformation Costs |
|
6 |
|
4 |
|
3 |
|
12 |
|
(1 |
) |
24 |
|
Long-Term Incentive Plans |
|
|
|
|
|
|
|
1 |
|
|
|
1 |
|
Total Adjustments |
|
6 |
|
4 |
|
3 |
|
13 |
|
(1 |
) |
25 |
|
|
|
|
|
|
|
|
|
|
|
|
|
|
|
Adjusted EBITDA - Non-GAAP |
|
72 |
|
43 |
|
46 |
|
147 |
|
(6 |
) |
302 |
|
|
|
|
|
|
|
|
|
|
|
|
|
|
|
Operating income margin - GAAP |
|
15.9 |
% |
-4.5 |
% |
-8.3 |
% |
15.6 |
% |
NA |
|
8.6 |
% |
Impact of depreciation and amortization |
|
22.9 |
% |
39.6 |
% |
44.2 |
% |
18.6 |
% |
NA |
|
26.4 |
% |
EBITDA margin (non-GAAP) |
|
38.8 |
% |
35.1 |
% |
35.8 |
% |
34.2 |
% |
NA |
|
34.9 |
% |
Impact of adjustments |
|
3.8 |
% |
3.5 |
% |
3.2 |
% |
3.2 |
% |
NA |
|
3.2 |
% |
Adjusted EBITDA margin (non-GAAP) Per Slide 38 (EBITDA Pro Forma %) |
|
42.6 |
% |
38.6 |
% |
39.0 |
% |
37.4 |
% |
NA |
|
38.1 |
% |
|
|
For the Year Ended December 31, 2014 |
| ||||||||||
|
|
R.H. |
|
Dex Media |
|
Dex Media |
|
Super |
|
Parent/ |
|
Dex Media |
|
|
|
Donnelley |
|
East |
|
West |
|
Media |
|
Other/Elims |
|
Consolidated |
|
|
|
(in millions) |
| ||||||||||
|
|
|
|
|
|
|
|
|
|
|
|
|
|
Revenue - Per GAAP financials |
|
389 |
|
252 |
|
277 |
|
897 |
|
|
|
1,815 |
|
Adjustments for SuperMedia Acquisition accounting |
|
|
|
|
|
|
|
30 |
|
|
|
30 |
|
Adjusted Pro Forma Revenue - Non-GAAP |
|
389 |
|
252 |
|
277 |
|
927 |
|
|
|
1,845 |
|
|
|
|
|
|
|
|
|
|
|
|
|
|
|
Operating Income - Per GAAP financials |
|
18 |
|
(32 |
) |
(60 |
) |
94 |
|
(24 |
) |
(4 |
) |
Add Back: Depreciation and amortization |
|
117 |
|
130 |
|
160 |
|
236 |
|
|
|
643 |
|
EBITDA - Per GAAP Financials |
|
135 |
|
98 |
|
100 |
|
330 |
|
(24 |
) |
639 |
|
|
|
|
|
|
|
|
|
|
|
|
|
|
|
Adjustments: |
|
|
|
|
|
|
|
|
|
|
|
|
|
Adjustments for SuperMedia Jan-March Pro Forma |
|
|
|
|
|
|
|
21 |
|
|
|
21 |
|
Merger Integration Costs |
|
9 |
|
6 |
|
6 |
|
20 |
|
|
|
41 |
|
Business Transformation Costs |
|
8 |
|
4 |
|
6 |
|
16 |
|
9 |
|
43 |
|
Asset Writedowns |
|
|
|
|
|
|
|
3 |
|
|
|
3 |
|
Long-Term Incentive Plans |
|
2 |
|
1 |
|
1 |
|
4 |
|
2 |
|
10 |
|
Employee Benefit Plan Amendments |
|
|
|
|
|
|
|
(42 |
) |
|
|
(42 |
) |
Total Adjustments |
|
19 |
|
11 |
|
13 |
|
22 |
|
11 |
|
76 |
|
|
|
|
|
|
|
|
|
|
|
|
|
|
|
Adjusted Pro Forma EBITDA - Non-GAAP |
|
154 |
|
109 |
|
113 |
|
352 |
|
(13 |
) |
715 |
|
|
|
|
|
|
|
|
|
|
|
|
|
|
|
Operating income margin - GAAP |
|
4.6 |
% |
-12.7 |
% |
-21.7 |
% |
10.5 |
% |
NA |
|
-0.2 |
% |
Impact of depreciation and amortization |
|
30.1 |
% |
51.6 |
% |
57.8 |
% |
25.1 |
% |
NA |
|
34.8 |
% |
EBITDA margin (non-GAAP) |
|
34.7 |
% |
38.9 |
% |
36.1 |
% |
35.6 |
% |
NA |
|
34.6 |
% |
Impact of adjustments and pro forma Items |
|
5.0 |
% |
4.2 |
% |
4.9 |
% |
2.4 |
% |
NA |
|
4.2 |
% |
Adjusted EBITDA margin (non-GAAP) Per Slide 38 (EBITDA Pro Forma %) |
|
39.7 |
% |
43.1 |
% |
41.0 |
% |
38.0 |
% |
NA |
|
38.8 |
% |
Exhibit 99.2
November 16, 2015 Confidential and Proprietary Information of Dex Media Dex Media 5 Year Plan
Overview 2 Confidential and Proprietary Information of Dex Media The Company has prepared its five year plan which is outlined in this presentation This plan has not yet been reviewed or approved by the Board and remains subject to their approval and possible further modification
2016 Budget 3 Confidential and Proprietary Information of Dex Media ($ in millions) * Includes Direct Digital Print 775.4 $ 771.6 $ (3.8) $ Digital - Local 482.6 407.3 (75.3) Digital - Expansion 26.7 14.9 (11.9) National & Other 30.5 30.9 0.4 Billing Revenue - 10.7 10.7 Net Revenue 1,315.2 $ 1,235.4 $ (79.8) $ Expenses: Sales 257.7 $ 19.6% 241.5 $ 19.5% 16.2 $ Operations * 228.3 17.4% 237.1 19.2% (8.8) IT 99.0 7.5% 106.7 8.6% (7.7) Core Marketing 64.6 4.9% 68.7 5.6% (4.1) Traffic 156.0 11.9% 140.3 11.4% 15.7 Finance 19.2 1.5% 18.5 1.5% 0.7 Human Resources 9.7 0.7% 9.7 0.8% 0.1 Legal 7.2 0.6% 7.3 0.6% (0.1) Executive 3.3 0.3% 3.8 0.3% (0.4) Total Department Spending 845.0 64.3% 833.5 67.5% 11.5 Net Capitalized 16.7 1.3% (3.9) -0.3% 20.6 Bad Debt 29.6 2.3% 22.2 1.8% 7.4 Other Period Expenses 22.6 1.7% 23.2 1.9% (0.6) Total Expenses 913.9 69.5% 875.1 70.8% 38.8 EBITDA (Pro Forma) 401.3 $ 30.5% 360.3 $ 29.2% (41.0) $ Costs to Achieve 1.1 0.1% 17.9 1.8% (16.8) - Adjusted EBITDA 400.2 $ 30.4% 342.4 $ 27.7% (57.8) $ Variance Fav/(Unfav) % of Revenue 2016 Budget % of Revenue 2016 Lender Presentation Print 775.4 $ 771.6 $ (3.8) $ Digital - Local 482.6 407.3 (75.3) Digital - Expansion 26.7 14.9 (11.9) National & Other 30.5 30.9 0.4 Billing Revenue - 10.7 10.7 Net Revenue 1,315.2 $ 1,235.4 $ (79.8) $ Expenses: Sales 257.7 $ 19.6% 241.5 $ 19.5% 16.2 $ Operations * 228.3 17.4% 237.1 19.2% (8.8) IT 99.0 7.5% 106.7 8.6% (7.7) Core Marketing 64.6 4.9% 68.7 5.6% (4.1) Traffic 156.0 11.9% 140.3 11.4% 15.7 Finance 19.2 1.5% 18.5 1.5% 0.7 Human Resources 9.7 0.7% 9.7 0.8% 0.1 Legal 7.2 0.6% 7.3 0.6% (0.1) Executive 3.3 0.3% 3.8 0.3% (0.4) Total Department Spending 845.0 64.3% 833.5 67.5% 11.5 Net Capitalized 16.7 1.3% (3.9) -0.3% 20.6 Bad Debt 29.6 2.3% 22.2 1.8% 7.4 Other Period Expenses 22.6 1.7% 23.2 1.9% (0.6) Total Expenses 913.9 69.5% 875.1 70.8% 38.8 EBITDA (Pro Forma) 401.3 $ 30.5% 360.3 $ 29.2% (41.0) $ Costs to Achieve 1.1 0.1% 17.9 1.8% (16.8) - Adjusted EBITDA 400.2 $ 30.4% 342.4 $ 27.7% (57.8) $ Variance Fav/(Unfav) % of Revenue 2016 Budget % of Revenue 2016 Lender Presentation
Digital Ad Sales 4 Confidential and Proprietary Information of Dex Media DRAFT For discussion purposes only ($ in millions) 2015 2016 Q1 Q2 Q3 Q4 Q1 Q2 Q3 Q4 2015 2016 Local Digital Ad Sales actual actual actual forecast forecast forecast forecast forecast forecast forecast 2016 Budget 102.5 $ 144.2 $ 117.6 $ 131.3 $ 110.0 $ 128.0 $ 113.6 $ 133.7 $ 495.5 $ 485.3 $ Growth Rate 2016 Budget -23.3% -17.3% -23.9% -26.7% 7.4% -11.2% -3.4% 1.9% -22.8% -2.1% Local Digital Gross Revenue 2016 Budget 126.5 $ 125.2 $ 117.0 $ 111.4 $ 104.5 $ 102.8 $ 102.5 $ 102.9 $ 480.1 $ 412.7 $ Growth Rate 2016 Budget 9.8% 0.6% -6.6% -12.3% -17.4% -17.9% -12.4% -7.6% -2.4% -14.0%
Annual Income Statements 5 Confidential and Proprietary Information of Dex Media ($ in millions) Sept. 11th Lender Presentation Revised 5 Year Plan Variance Fav / (Unfav) FY15 FY16 FY17 FY18 FY19 FY20 FY15 FY16 FY17 FY18 FY19 FY20 FY15 FY16 FY17 FY18 FY19 FY20 Revenue Print 1,010.8 $ 788.0 $ 618.5 $ 492.8 $ 394.3 $ 315.8 $ 1,011.2 $ 781.8 $ 639.5 $ 518.6 $ 422.1 $ 343.5 $ 0.4 $ (6.2) $ 21.0 $ 25.8 $ 27.7 $ 27.7 $ Digital 519.2 548.6 628.7 704.0 789.3 877.6 516.8 458.8 506.4 575.1 654.7 738.1 (2.5) (89.7) (122.3) (128.9) (134.7) (139.5) Other - - - - - - 1.1 10.9 10.1 9.1 8.2 7.3 1.1 10.9 10.1 9.1 8.2 7.3 Sales Allowance (27.3) (21.4) (20.0) (19.1) (18.9) (19.1) (28.4) (16.2) (18.5) (17.6) (17.4) (17.4) (1.1) 5.2 1.5 1.5 1.6 1.7 Total Revenue, Net 1,502.8 $ 1,315.2 $ 1,227.2 $ 1,177.7 $ 1,164.7 $ 1,174.3 $ 1,500.7 $ 1,235.4 $ 1,137.5 $ 1,085.1 $ 1,067.5 $ 1,071.5 $ (2.1) $ (79.8) $ (89.7) $ (92.5) $ (97.2) $ (102.8) $ Operating Expenses Sales 286.5 $ 257.7 $ 233.1 $ 222.5 $ 215.5 $ 212.4 $ 277.6 $ 241.5 $ 223.1 $ 211.1 $ 203.8 $ 196.9 $ 8.9 $ 16.2 $ 10.0 $ 11.4 $ 11.7 $ 15.5 $ Operations 151.4 122.5 110.0 100.0 91.8 82.7 148.7 120.5 109.1 99.5 91.6 82.8 2.7 2.0 0.9 0.4 0.2 (0.1) IT 114.2 99.0 99.0 99.0 99.0 99.0 113.3 106.7 97.7 96.7 95.6 90.7 0.8 (7.7) 1.3 2.3 3.4 8.3 Core Marketing 75.3 64.6 58.2 52.6 48.1 44.4 71.7 68.7 58.3 54.2 49.7 46.0 3.6 (4.1) (0.0) (1.5) (1.5) (1.6) Traffic 163.9 156.0 178.7 196.6 216.5 234.0 162.5 140.3 139.1 142.5 152.9 168.2 1.4 15.7 39.6 54.1 63.6 65.8 Direct Digital 101.3 105.8 115.4 124.5 134.7 145.3 99.1 116.6 123.3 136.0 150.0 162.2 2.2 (10.8) (7.9) (11.5) (15.3) (16.9) Finance 19.6 19.2 17.2 17.2 16.0 16.0 19.5 18.5 17.2 17.2 16.0 16.0 0.1 0.7 0.0 0.0 0.0 0.0 Human Resources 10.2 9.7 8.5 8.5 7.5 7.5 10.4 9.7 8.9 8.9 7.9 7.9 (0.2) 0.1 (0.4) (0.4) (0.4) (0.4) Legal 9.2 7.2 7.2 7.2 7.2 7.2 10.4 7.3 8.2 8.2 8.2 8.2 (1.3) (0.1) (0.9) (0.9) (0.9) (0.9) Executive 3.3 3.3 3.3 3.3 3.3 3.3 3.8 3.8 3.1 3.1 3.1 3.1 (0.4) (0.4) 0.2 0.2 0.2 0.2 Total Dept. Spending 934.8 $ 845.0 $ 830.8 $ 831.5 $ 839.9 $ 852.0 $ 916.9 $ 833.5 $ 788.0 $ 777.4 $ 778.9 $ 782.0 $ 17.9 $ 11.5 $ 42.8 $ 54.1 $ 61.0 $ 70.0 $ Net Cap. Spending 38.1 16.7 10.5 7.5 6.1 3.1 40.0 (3.9) 7.4 (1.9) (4.6) (6.9) (1.9) 20.6 3.0 9.4 10.7 10.0 Bad Debt 23.0 29.6 36.8 43.0 43.7 44.0 20.9 22.2 22.7 21.7 21.4 21.4 2.2 7.4 14.1 21.3 22.3 22.6 Other Period Exp. (18.2) 22.6 (9.4) 0.4 4.5 1.3 (2.7) 23.2 (1.8) (0.5) (0.6) (0.2) (15.5) (0.6) (7.6) 0.9 5.1 1.5 Total Expenses 977.8 913.9 868.7 882.4 894.2 900.5 975.0 875.1 816.4 796.7 795.1 796.4 2.8 38.8 52.3 85.7 99.1 104.1 EBITDA (Pro Forma) 525.0 $ 401.3 $ 358.5 $ 295.2 $ 270.5 $ 273.8 $ 525.7 $ 360.3 $ 321.1 $ 288.4 $ 272.4 $ 275.1 $ 0.6 $ (41.0) $ (37.4) $ (6.8) $ 1.9 $ 1.3 $ % of net revenue 34.9% 30.5% 29.2% 25.1% 23.2% 23.3% 35.0% 29.2% 28.2% 26.6% 25.5% 25.7% 0.1% -1.3% -1.0% 1.5% 2.3% 2.4% Cost to Achieve 33.3 1.1 1.9 0.7 0.8 0.4 42.7 17.9 4.9 0.6 0.8 0.4 (9.4) (16.8) (3.0) 0.2 - - Adjusted EBITDA 491.7 $ 400.2 $ 356.6 $ 294.5 $ 269.7 $ 273.5 $ 482.9 $ 342.4 $ 316.2 $ 287.9 $ 271.6 $ 274.8 $ (8.7) (57.8) (40.3) (6.6) 1.9 1.3 % of net revenue 32.7% 30.4% 29.1% 25.0% 23.2% 23.3% 32.2% 27.7% 27.8% 26.5% 25.4% 25.6% -0.5% -2.7% -1.3% 1.5% 2.3% 2.4% Sept. 11th Lender Presentation Revised 5 Year Plan Variance Fav / (Unfav) FY15 FY16 FY17 FY18 FY19 FY20 FY15 FY16 FY17 FY18 FY19 FY20 FY15 FY16 FY17 FY18 FY19 FY20 Revenue Print 1,010.8 $ 788.0 $ 618.5 $ 492.8 $ 394.3 $ 315.8 $ 1,011.2 $ 781.8 $ 639.5 $ 518.6 $ 422.1 $ 343.5 $ 0.4 $ (6.2) $ 21.0 $ 25.8 $ 27.7 $ 27.7 $ Digital 519.2 548.6 628.7 704.0 789.3 877.6 516.8 458.8 506.4 575.1 654.7 738.1 (2.5) (89.7) (122.3) (128.9) (134.7) (139.5) Other - - - - - - 1.1 10.9 10.1 9.1 8.2 7.3 1.1 10.9 10.1 9.1 8.2 7.3 Sales Allowance (27.3) (21.4) (20.0) (19.1) (18.9) (19.1) (28.4) (16.2) (18.5) (17.6) (17.4) (17.4) (1.1) 5.2 1.5 1.5 1.6 1.7 Total Revenue, Net 1,502.8 $ 1,315.2 $ 1,227.2 $ 1,177.7 $ 1,164.7 $ 1,174.3 $ 1,500.7 $ 1,235.4 $ 1,137.5 $ 1,085.1 $ 1,067.5 $ 1,071.5 $ (2.1) $ (79.8) $ (89.7) $ (92.5) $ (97.2) $ (102.8) $ Operating Expenses Sales 286.5 $ 257.7 $ 233.1 $ 222.5 $ 215.5 $ 212.4 $ 277.6 $ 241.5 $ 223.1 $ 211.1 $ 203.8 $ 196.9 $ 8.9 $ 16.2 $ 10.0 $ 11.4 $ 11.7 $ 15.5 $ Operations 151.4 122.5 110.0 100.0 91.8 82.7 148.7 120.5 109.1 99.5 91.6 82.8 2.7 2.0 0.9 0.4 0.2 (0.1) IT 114.2 99.0 99.0 99.0 99.0 99.0 113.3 106.7 97.7 96.7 95.6 90.7 0.8 (7.7) 1.3 2.3 3.4 8.3 Core Marketing 75.3 64.6 58.2 52.6 48.1 44.4 71.7 68.7 58.3 54.2 49.7 46.0 3.6 (4.1) (0.0) (1.5) (1.5) (1.6) Traffic 163.9 156.0 178.7 196.6 216.5 234.0 162.5 140.3 139.1 142.5 152.9 168.2 1.4 15.7 39.6 54.1 63.6 65.8 Direct Digital 101.3 105.8 115.4 124.5 134.7 145.3 99.1 116.6 123.3 136.0 150.0 162.2 2.2 (10.8) (7.9) (11.5) (15.3) (16.9) Finance 19.6 19.2 17.2 17.2 16.0 16.0 19.5 18.5 17.2 17.2 16.0 16.0 0.1 0.7 0.0 0.0 0.0 0.0 Human Resources 10.2 9.7 8.5 8.5 7.5 7.5 10.4 9.7 8.9 8.9 7.9 7.9 (0.2) 0.1 (0.4) (0.4) (0.4) (0.4) Legal 9.2 7.2 7.2 7.2 7.2 7.2 10.4 7.3 8.2 8.2 8.2 8.2 (1.3) (0.1) (0.9) (0.9) (0.9) (0.9) Executive 3.3 3.3 3.3 3.3 3.3 3.3 3.8 3.8 3.1 3.1 3.1 3.1 (0.4) (0.4) 0.2 0.2 0.2 0.2 Total Dept. Spending 934.8 $ 845.0 $ 830.8 $ 831.5 $ 839.9 $ 852.0 $ 916.9 $ 833.5 $ 788.0 $ 777.4 $ 778.9 $ 782.0 $ 17.9 $ 11.5 $ 42.8 $ 54.1 $ 61.0 $ 70.0 $ Net Cap. Spending 38.1 16.7 10.5 7.5 6.1 3.1 40.0 (3.9) 7.4 (1.9) (4.6) (6.9) (1.9) 20.6 3.0 9.4 10.7 10.0 Bad Debt 23.0 29.6 36.8 43.0 43.7 44.0 20.9 22.2 22.7 21.7 21.4 21.4 2.2 7.4 14.1 21.3 22.3 22.6 Other Period Exp. (18.2) 22.6 (9.4) 0.4 4.5 1.3 (2.7) 23.2 (1.8) (0.5) (0.6) (0.2) (15.5) (0.6) (7.6) 0.9 5.1 1.5 Total Expenses 977.8 913.9 868.7 882.4 894.2 900.5 975.0 875.1 816.4 796.7 795.1 796.4 2.8 38.8 52.3 85.7 99.1 104.1 EBITDA (Pro Forma) 525.0 $ 401.3 $ 358.5 $ 295.2 $ 270.5 $ 273.8 $ 525.7 $ 360.3 $ 321.1 $ 288.4 $ 272.4 $ 275.1 $ 0.6 $ (41.0) $ (37.4) $ (6.8) $ 1.9 $ 1.3 $ % of net revenue 34.9% 30.5% 29.2% 25.1% 23.2% 23.3% 35.0% 29.2% 28.2% 26.6% 25.5% 25.7% 0.1% -1.3% -1.0% 1.5% 2.3% 2.4% Cost to Achieve 33.3 1.1 1.9 0.7 0.8 0.4 42.7 17.9 4.9 0.6 0.8 0.4 (9.4) (16.8) (3.0) 0.2 - - Adjusted EBITDA 491.7 $ 400.2 $ 356.6 $ 294.5 $ 269.7 $ 273.5 $ 482.9 $ 342.4 $ 316.2 $ 287.9 $ 271.6 $ 274.8 $ (8.7) (57.8) (40.3) (6.6) 1.9 1.3 % of net revenue 32.7% 30.4% 29.1% 25.0% 23.2% 23.3% 32.2% 27.7% 27.8% 26.5% 25.4% 25.6% -0.5% -2.7% -1.3% 1.5% 2.3% 2.4%
Department Spending 6 Confidential and Proprietary Information of Dex Media Represents the percentage of digital revenue ($ in millions) (1) Sept. 11th Lender Presentation Revised 5 Year Plan Variance Fav / (Unfav) FY15 FY16 FY17 FY18 FY19 FY20 FY15 FY16 FY17 FY18 FY19 FY20 FY15 FY16 FY17 FY18 FY19 FY20 Operating Expenses Sales 286.5 $ 257.7 $ 233.1 $ 222.5 $ 215.5 $ 212.4 $ 277.6 $ 241.5 $ 223.1 $ 211.1 $ 203.8 $ 196.9 $ 8.9 $ 16.2 $ 10.0 $ 11.4 $ 11.7 $ 15.5 $ Operations 151.4 122.5 110.0 100.0 91.8 82.7 148.7 120.5 109.1 99.5 91.6 82.8 2.7 2.0 0.9 0.4 0.2 (0.1) IT 114.2 99.0 99.0 99.0 99.0 99.0 113.3 106.7 97.7 96.7 95.6 90.7 0.8 (7.7) 1.3 2.3 3.4 8.3 Core Marketing 75.3 64.6 58.2 52.6 48.1 44.4 71.7 68.7 58.3 54.2 49.7 46.0 3.6 (4.1) (0.0) (1.5) (1.5) (1.6) Traffic 163.9 156.0 178.7 196.6 216.5 234.0 162.5 140.3 139.1 142.5 152.9 168.2 1.4 15.7 39.6 54.1 63.6 65.8 Direct Digital 101.3 105.8 115.4 124.5 134.7 145.3 99.1 116.6 123.3 136.0 150.0 162.2 2.2 (10.8) (7.9) (11.5) (15.3) (16.9) Finance 19.6 19.2 17.2 17.2 16.0 16.0 19.5 18.5 17.2 17.2 16.0 16.0 0.1 0.7 0.0 0.0 0.0 0.0 Human Resources 10.2 9.7 8.5 8.5 7.5 7.5 10.4 9.7 8.9 8.9 7.9 7.9 (0.2) 0.1 (0.4) (0.4) (0.4) (0.4) Legal 9.2 7.2 7.2 7.2 7.2 7.2 10.4 7.3 8.2 8.2 8.2 8.2 (1.3) (0.1) (0.9) (0.9) (0.9) (0.9) Executive 3.3 3.3 3.3 3.3 3.3 3.3 3.8 3.8 3.1 3.1 3.1 3.1 (0.4) (0.4) 0.2 0.2 0.2 0.2 Total Dept. Spending 934.8 $ 845.0 $ 830.8 $ 831.5 $ 839.9 $ 852.0 $ 916.9 $ 833.5 $ 788.0 $ 777.4 $ 778.9 $ 782.0 $ 17.9 $ 11.5 $ 42.8 $ 54.1 $ 61.0 $ 70.0 $ % of revenue Sales 19.1% 19.6% 19.0% 18.9% 18.5% 18.1% 18.5% 19.5% 19.6% 19.5% 19.1% 18.4% 0.6% 0.0% -0.6% -0.6% -0.6% -0.3% Operations 10.1% 9.3% 9.0% 8.5% 7.9% 7.0% 9.9% 9.8% 9.6% 9.2% 8.6% 7.7% 0.2% -0.4% -0.6% -0.7% -0.7% -0.7% IT 7.6% 7.5% 8.1% 8.4% 8.5% 8.4% 7.6% 8.6% 8.6% 8.9% 9.0% 8.5% 0.0% -1.1% -0.5% -0.5% -0.5% 0.0% Core Marketing 5.0% 4.9% 4.7% 4.5% 4.1% 3.8% 4.8% 5.6% 5.1% 5.0% 4.7% 4.3% 0.2% -0.6% -0.4% -0.5% -0.5% -0.5% Traffic (1) 31.6% 28.4% 28.4% 27.9% 27.4% 26.7% 31.4% 30.6% 27.5% 24.8% 23.4% 22.8% 0.1% -2.1% 1.0% 3.1% 4.1% 3.9% Direct Digital (2) 19.5% 19.3% 18.4% 17.7% 17.1% 16.6% 19.2% 25.4% 24.4% 23.6% 22.9% 22.0% 0.3% -6.1% -6.0% -6.0% -5.9% -5.4% Finance 1.3% 1.5% 1.4% 1.5% 1.4% 1.4% 1.3% 1.5% 1.5% 1.6% 1.5% 1.5% 0.0% 0.0% -0.1% -0.1% -0.1% -0.1% Human Resources 0.7% 0.7% 0.7% 0.7% 0.6% 0.6% 0.7% 0.8% 0.8% 0.8% 0.7% 0.7% 0.0% 0.0% -0.1% -0.1% -0.1% -0.1% Legal 0.6% 0.6% 0.6% 0.6% 0.6% 0.6% 0.7% 0.6% 0.7% 0.8% 0.8% 0.8% -0.1% 0.0% -0.1% -0.1% -0.1% -0.1% Executive 0.2% 0.3% 0.3% 0.3% 0.3% 0.3% 0.3% 0.3% 0.3% 0.3% 0.3% 0.3% 0.0% -0.1% 0.0% 0.0% 0.0% 0.0% Sept. 11th Lender Presentation Revised 5 Year Plan Variance Fav / (Unfav) FY15 FY16 FY17 FY18 FY19 FY20 FY15 FY16 FY17 FY18 FY19 FY20 FY15 FY16 FY17 FY18 FY19 FY20 Operating Expenses Sales 286.5 $ 257.7 $ 233.1 $ 222.5 $ 215.5 $ 212.4 $ 277.6 $ 241.5 $ 223.1 $ 211.1 $ 203.8 $ 196.9 $ 8.9 $ 16.2 $ 10.0 $ 11.4 $ 11.7 $ 15.5 $ Operations 151.4 122.5 110.0 100.0 91.8 82.7 148.7 120.5 109.1 99.5 91.6 82.8 2.7 2.0 0.9 0.4 0.2 (0.1) IT 114.2 99.0 99.0 99.0 99.0 99.0 113.3 106.7 97.7 96.7 95.6 90.7 0.8 (7.7) 1.3 2.3 3.4 8.3 Core Marketing 75.3 64.6 58.2 52.6 48.1 44.4 71.7 68.7 58.3 54.2 49.7 46.0 3.6 (4.1) (0.0) (1.5) (1.5) (1.6) Traffic 163.9 156.0 178.7 196.6 216.5 234.0 162.5 140.3 139.1 142.5 152.9 168.2 1.4 15.7 39.6 54.1 63.6 65.8 Direct Digital 101.3 105.8 115.4 124.5 134.7 145.3 99.1 116.6 123.3 136.0 150.0 162.2 2.2 (10.8) (7.9) (11.5) (15.3) (16.9) Finance 19.6 19.2 17.2 17.2 16.0 16.0 19.5 18.5 17.2 17.2 16.0 16.0 0.1 0.7 0.0 0.0 0.0 0.0 Human Resources 10.2 9.7 8.5 8.5 7.5 7.5 10.4 9.7 8.9 8.9 7.9 7.9 (0.2) 0.1 (0.4) (0.4) (0.4) (0.4) Legal 9.2 7.2 7.2 7.2 7.2 7.2 10.4 7.3 8.2 8.2 8.2 8.2 (1.3) (0.1) (0.9) (0.9) (0.9) (0.9) Executive 3.3 3.3 3.3 3.3 3.3 3.3 3.8 3.8 3.1 3.1 3.1 3.1 (0.4) (0.4) 0.2 0.2 0.2 0.2 Total Dept. Spending 934.8 $ 845.0 $ 830.8 $ 831.5 $ 839.9 $ 852.0 $ 916.9 $ 833.5 $ 788.0 $ 777.4 $ 778.9 $ 782.0 $ 17.9 $ 11.5 $ 42.8 $ 54.1 $ 61.0 $ 70.0 $ % of revenue Sales 19.1% 19.6% 19.0% 18.9% 18.5% 18.1% 18.5% 19.5% 19.6% 19.5% 19.1% 18.4% 0.6% 0.0% -0.6% -0.6% -0.6% -0.3% Operations 10.1% 9.3% 9.0% 8.5% 7.9% 7.0% 9.9% 9.8% 9.6% 9.2% 8.6% 7.7% 0.2% -0.4% -0.6% -0.7% -0.7% -0.7% IT 7.6% 7.5% 8.1% 8.4% 8.5% 8.4% 7.6% 8.6% 8.6% 8.9% 9.0% 8.5% 0.0% -1.1% -0.5% -0.5% -0.5% 0.0% Core Marketing 5.0% 4.9% 4.7% 4.5% 4.1% 3.8% 4.8% 5.6% 5.1% 5.0% 4.7% 4.3% 0.2% -0.6% -0.4% -0.5% -0.5% -0.5% Traffic (1) 31.6% 28.4% 28.4% 27.9% 27.4% 26.7% 31.4% 30.6% 27.5% 24.8% 23.4% 22.8% 0.1% -2.1% 1.0% 3.1% 4.1% 3.9% Direct Digital (2) 19.5% 19.3% 18.4% 17.7% 17.1% 16.6% 19.2% 25.4% 24.4% 23.6% 22.9% 22.0% 0.3% -6.1% -6.0% -6.0% -5.9% -5.4% Finance 1.3% 1.5% 1.4% 1.5% 1.4% 1.4% 1.3% 1.5% 1.5% 1.6% 1.5% 1.5% 0.0% 0.0% -0.1% -0.1% -0.1% -0.1% Human Resources 0.7% 0.7% 0.7% 0.7% 0.6% 0.6% 0.7% 0.8% 0.8% 0.8% 0.7% 0.7% 0.0% 0.0% -0.1% -0.1% -0.1% -0.1% Legal 0.6% 0.6% 0.6% 0.6% 0.6% 0.6% 0.7% 0.6% 0.7% 0.8% 0.8% 0.8% -0.1% 0.0% -0.1% -0.1% -0.1% -0.1% Executive 0.2% 0.3% 0.3% 0.3% 0.3% 0.3% 0.3% 0.3% 0.3% 0.3% 0.3% 0.3% 0.0% -0.1% 0.0% 0.0% 0.0% 0.0%
Appendix
Dex Media
Local Digital Gross Revenue
Reconciliation to Operating Revenue (GAAP)
Q1, Q2 and Q3 2015
(in millions)
|
|
2015 |
| |||||||
|
|
Q1 |
|
Q2 |
|
Q3 |
| |||
|
|
|
|
|
|
|
| |||
Local Digital Gross Revenue |
|
$ |
126.5 |
|
$ |
125.2 |
|
$ |
115.8 |
|
|
|
|
|
|
|
|
| |||
All Other Revenue |
|
279.0 |
|
262.3 |
|
248.0 |
| |||
|
|
|
|
|
|
|
| |||
Operating Revenue (GAAP) |
|
$ |
405.5 |
|
$ |
387.5 |
|
$ |
363.8 |
|
|
|
|
|
|
|
|
| |||
Operating Revenue (Per Form 10-Q) |
|
$ |
406 |
|
$ |
387 |
|
$ |
364 |
|
Exhibit 99.3
confidential Christopher Petrocelli Sep 08, 2015 13:04 Colorado New Mexico South Dakota Nebraska North Dakota lowa Minnesota Directory/community Directory/community Directory community Directory/community Directory/community Directory/community Directory/community Alamosa Alamogordo Aberdeen Alliance Bismarck Afgona Albert Lea - Austin Aspen Albuquerque West Glacial Lakes Fremont Dickinson Ames Barnum Boulder Albuquerque White Pages Northern Hills Grand Island Fargo - Moorhead Atlantic Bemidji Brighton Albuquerque Yellow Pages Rapid City Norfolk Grafton Boone Brainerd Canon City Artesia Sioux Falls North Platte Grand Forks Burlington Buffalo Castle Rock Belen South Dakota South Central Omaha SSW North Dakota South Central Carroll Chisholm - Hibbing Colorado Springs Clovis Yankton Omaha White Pages Wahpeton Cedar Rapids Detroit Lakes Craig - Steamboat El Paso West, Tx(1) Omaha Yellow Pages Williston Clinton - Maquoketa E. Central Minnesota Denver - Arvada Farmington ONeill Council Bluffs Fergus Falls Denver - Aurora Gallup Sidney Decorah Forest Lake Denver - Central Las Cruces Des Moines Glenwood Denver - Englewood Las Vegas Dubuque Grand Rapids Denver - Lakewood Roswell Fort Madison Jackson - Windom Denver - Northglenn Santa Fe Iowa City Lake Minnetonka Denver - South Jeff County Silver City Iowa Falls Le Sueur - St. Peter Denver White Pages Socorro Iowa Great Lakes Lit - Mont - Willmar Denver Yellow Pages Taos Marshalitown Little Falls Durango Tucumcari Mason County Minneapolis White Pages Estes Park Muscatine Minneapolis Yellow Pages Evergreen Ottumwa Minnesota Northwest Fort Collins Quad Cities Minnesota Southwest Grand County Shenandoah Morris Grand Junction Sioux City NW Suburban Area Greeley Siouxland North Owatonna Gunnison Siouxland South Park Rapids Idaho Springs Storm Lake Red Wing La Junta Waterloo Rochester Lamar Webster City Sauk Centre Limon - Burlington Western Suburbs SE St. Paul Longmont South of the River Suburbs Loveland St. Cloud Montrose - Delta St Croix Valley Northeast Colorado St. Paul White Pages Pueblo St. Paul Yellow Pages Salida SW Suburban Area Trinidad Twin Cities On-the-Go Vail - Leadvile Twin Ports Walsenburg Virginia White Bear Winona Included in New Mexico Arizona Utah Idaho Montana Wyoming Oregon Washington Directory/community Directory/community Directory/community Directory/community Directory/community Directory/community Directory/community Apache Junction Brigham City Blackfoot Billings Big Horn Basin Albany Aberdeen Casa Grande Cache Valley Boise Bozeman Casper Astoria Bainbridge Island Cochise County Ogden Idaho Falls Butte Cheyenne Baker-Union County Bellingham East Valley White Pages Park City - Heber City Lewiston Eastern Montana Evanston - Kemmerer Beaverton Centralia East Valley Yellow Pages Price - Helper Malad City Glasgow Jackson Hole Central Oregon Clark County - Vancouver Flagstaff Provo Mountain Home Great Falls Lander Clackamas County Cle Elum Globe Salt Lake City White Pages Nampa - Caldwell Helena Laramie Corvallis Colville Greater NW Valley Salt Lake City Yellow Pages Payette Lewistown Northeast Wyoming East County Greater Eastside Greater SW Valley South Central Utah Pocatello Missoula Rawlins Eugene Greater Puget Sound On-The-Go Mohave County South Valley Soda Springs Rock Springs Florence Greater Snohomish County Nogales Southern Utah Twin Falls Grants Pass Kitsap County Payson Tooele Klamath Falls Longview Phoenix Res White Pages Uintah Basin (Vernal) Medford Moses Lake Phoenix Bus White Pages Wasatch Front On-The-Go Newport - Lincoln City Okanogan Phoenix Yellow Pages Pendleton Olympia Prescott Portland White Pages Port Angeles Safford Portland Yellow Pages Port Townsend Scottsdale Roseburg Puyallup Sun City Salem Seattle White Pages Tucson - Central St. Helens Seattle Yellow Pages Tucson - East Tigard Shelton Tucson - North Tillamook South King County Tucson White Pages Spokane Tucson Yellow Pages Tacoma Valley of the Sun On-The-Go Tri-Cities Wickenburg Walla Walla Winslow Yakima Yuma confidential Christopher Petrocelli Sep 08, 2015 13:04
SuperMedia Distribution by State H1awa'i.i Alaska -Distribution in State -No Distributionn in State
confidential Christopher Petrocelli Sep 08. 2015 13:05 Expansive Footprint And Market Presence Sprint FLORIDA Beverly Hills Bonita Springs - North Naples Cape Coral - North Fort Myers Central Florida Citrus Countywide Clewiston - Moore Haven Crestview Crystal River - Homosassa Springs Dade City Ft. Walton Beach Golden Gate Golden Triangle Greater Lake Okeechobee Gull Shore Area Highlands Inverness Jackson & Holmes Counties (Marianna) Kissimmee Labelle Lake County Lake County South Lake Placid Lee County Areawide - Classified Lee County Area White Pages Lehigh Acres Madison & Jefferson Counties Marco Island Naples - Classified Naples - White Pages Ocala - Marion Countywide Peace River Valley Punta Gorda Community Punta Gorda - Port Charlotte Sanibel - Captiva Islands South Fort Myers Starke Sumter Countywide Tallahassee Tri-County Area West Volusia County Williston INDIANA Adams /Wells Counties Denver Flora / Rossville Hancock - Henry Suburban Jamestown Jasper /Newton Counties Jay County Johnson County Suburban Kosciusko Countywide LaFontaine LaGrange Countywide Marshall County Nappanee Starke/Pulaski Counties The Lakes Area Tri-State Regional Twin Lakes Regional Union City Whitley County KANSAS Barton / Stafford County Regional Belle Plaine Burlington/Osage City Central Kansas Regional Courtland / Clyde East Central Kansas Regional Junction City Northeast Kansas Regional Russell /Osborne Southeast Kansas Regional Turkey Red Regional MINNESOTA Allkin/Crosby Alexandria Benson Brooklyn Park / Maple Grove/ Osseo / Rogers Chaska/Wacon.a Cokato - Dassel - Howard Lake Glencoe Granite Falls Hastings Lake City / Plainview Lewiston Long Prairie New Richland St. James MISSOURI Central Missouri State University Golden Valley Area Harrisonville - Butler Regional Jefferson City KCI Regional King City Lebanon Regional Northwest Missouri Odessa-Lexington Regional Rolla Regional Warrensburg Regional NEBRASKA WYOMING North Platte Valley NEVADA Boulder City Henderson Las Vegas - January Las Vegas - June Las Vegas New Residents Guide Las Vegas Valley West (Rainbow West) Laughlin North Las Vegas NEW JERSEY Belle Mead - Somerville Chester - Washington Townships Hunterdon Countywide Sparta - Lake Mohawk Area Sussex Countywide Tewksbury Warren Countywide NORTH CAROLINA Ahoskie Albemarle Area Asheboro Clinton Dunn Duplin County Eden Madison Elkin - Yadkin County Fayetteville / Cumberland County Fuquay - Varina Gibsonville Greater Hickory / Unifour Area Greenville Havelock Henderson Hillsborough Jacksonville Johnston County Kernersville Kinston Maxton / Raeford / Red Springs / St. Pauls Mocksville Moore County Areawide Morehead City Mount Airy - Surry County New Bern North Wilkesboro / Wilkes County Pittsboro / Siler City Roanoke Rapids Rocky Mount Roxboro Tarboro The Outer Banks Troy Wake Forest Walkertown Washington West Jefferson Whiteville Williamston Wilson Yanceyville OHIO Ada Adamsville / Frazeysburg Bluffton Bucyrus Darke Countywide Defiance Areawide Delphos Fulton - Henry Countywide Green Springs Indian Lake Jefferson / Andover Area Lake Milton Lima Areawide Logan Countywide McConnelsville Morrow Countywide Mount Sterling Mount Vernon Newton Falls Ottawa Pataskala / Sunbury / Johnstown Preble Countywide Richland - Ashland Regional Shelby Community Shelby Countywide Stony Ridge Trumbull Countywide Union Countywide Van Wert/Paulding Warren County Areawide Wayne - Holmes Countywide OREGON Central and North Oregon Coast Columbia Gorge Sheridan /Carlton Tillamook Countywide Upper Rogue PENNSYLVANIA Bedford County Beech Creek - Mill Hall Butler Countywide Chambersburg Cranberry / Wexford Area Cumberland Countywide Elizabethtown / Columbia Gettysburg Hanover Juniata Valley Areawide Perry County Slippery Rock Southern Blair Huntingdon County Waynesboro SOUTH CAROLINA Beaufort Greenwood Regional Hampton - Estill Holly Hill Ridgeland Saluda TENNESSEE East Tennessee State University Elizabethton Erwin / Unicol County Greeneville Jonesborough Mountain City Tri-Cities / Bristol Tri-Cities / Johnson City Tri-Cities / Kingsport TEXAS Bullard Cedar Creek Lake Area Clifton Commerce / Cooper Gatesville / Hamilton Grimes County Area Groesbeck Henderson County Area Humble / Kingwood / Atascocita Kaufman Killeen / Ft. Hood Area Overton / Troup Area Palestine / Anderson County Palo Pinto County Pettus Salado Stephenville Regional Stockdale West Columbia Wise County Area VIRGINIA Abingdon Altavista Bachelors Hall / Whitmell Brookneal Charlottesville Farmville Front Royal Galax Lexington Marion Martinsville Montpelier Nottaway Lunenburg Page County (Luray) Rocky Mount - Franklin County South Boston / Volens South Hill Wythe County-Bland County WASHINGTON Lower Yakima Valley Poulsbo / Suquamish / Silverdale/Bainbridge Island Quilcene DonTech ILLINOIS Algonquln Alton Arlington Heights Ashburn Neighborhood - Chicago Aurora Austin Neighborhood - Chicago Barrington Bartlett Beardstown Belleville Belmont - Cragin Neighborhood - Chicago Bensenville Beverly Neighborhood - Chicago Big Rock Bloomingdale Blue Island Bridgeport Neighborhood - Chicago Brighton Park Neighborhood - Chicago Cairo Canton Cary Champaign Chatham Neighborhood - Chicago Chicago Consumer Chicago Heights Chicagoland Business to Business Chicago Loop Chicago White Pages Chain DLakes Cicero Clinton County Collinsville Crete Crystal Lake Danville Darien Decatur Deerfield Delevan Downers Grove Dundee Dwight East Saint Louis Edwardsville Elburn Elgin Elk Grove Village Elmhurst Englewood Neighborhood - Chicago Evanston Evergreen Park Forrest Frankfort Galena Geneva Gibson City Gilman Glen Ellyn Glenview Granite City Greenville Hampshire Harvard Harvey Hegwisch Neighborhood - Chicago Highland Park Hinsdale Homewood Hyde Park Neighborhood - Chicago Illinois Quad Cities Jefferson Park Neighborhood - Chicago Joliet Kankakee La Grange Lake Forest Lake View Neighborhood - Chicago Lansing La Salle Lemont Libertyville Lincoln Park Neighborhood - Chicago Lincoln Square Neighborhood - Chicago Logan Square Neighborhood - Chicago Lombard Marengo Maywood Mc Henry Morris Mount Vernon Naperville Nashville Norwood Park Neighborhood - Chicago Dak Park Olive Branch Drland Park Palatine Park Ridge Peoria Quincy Riverdale River Grove Rockford Rogers Park Neighborhood - Chicago Roseland Neighborhood - Chicago Schaumburg Seneca Skokie South Shore Neighborhood - Chicago Springfield Sterling Summit Tinley Park Vandalia Watseka Waukegan Wheeling Wilmington Winnetka Woodstock Yorkville Zion INDIANA Calumet City Crown Point East Chicago Gary Hammond Highland Lowell IOWA Iowa Quad Cities confidential Christopher Petrocelli Sep 08, 2015 13:05
Exhibit 99.4
Dex Media East, Inc.
2014 Ad Sales Growth
Compared to 2013
|
|
December 31, 2014 |
|
December 31, 2014 |
|
|
|
QTD |
|
YTD |
|
Print Ad Sales |
|
-19 |
% |
-19 |
% |
Digital Ad Sales |
|
11 |
% |
12 |
% |
Total Ad Sales |
|
-8 |
% |
-11 |
% |
Dex Media East, Inc.
Directly Attributable Contribution Margin
For the Three and Twelve Months Ended December 31, 2014
($ millions)
Q4 2014 |
|
|
|
Margin % |
|
Digital |
|
Margin % |
| ||
Revenue - Amortized |
|
$ |
41 |
|
|
|
$ |
19 |
|
|
|
Less: Directly Attributable Costs |
|
$ |
7 |
|
|
|
$ |
8 |
|
|
|
Directly Attributable Contribution Margin |
|
$ |
34 |
|
82.9 |
% |
$ |
11 |
|
57.9 |
% |
YTD December 2014 |
|
|
|
Margin % |
|
Digital |
|
Margin % |
| ||
Revenue - Amortized |
|
$ |
175 |
|
|
|
$ |
77 |
|
|
|
Less: Directly Attributable Costs |
|
$ |
30 |
|
|
|
$ |
32 |
|
|
|
Directly Attributable Contribution Margin |
|
$ |
145 |
|
82.9 |
% |
$ |
45 |
|
58.4 |
% |
Dex Media West, Inc.
2014 Ad Sales Growth
Compared to 2013
|
|
December 31, 2014 |
|
December 31, 2014 |
|
|
|
QTD |
|
YTD |
|
Print Ad Sales |
|
-23 |
% |
-20 |
% |
Digital Ad Sales |
|
8 |
% |
7 |
% |
Total Ad Sales |
|
-16 |
% |
-13 |
% |
Dex Media West, Inc.
Directly Attributable Contribution Margin
For the Three and Twelve Months Ended December 31, 2014
($ millions)
Q4 2014 |
|
|
|
Margin % |
|
Digital |
|
Margin % |
| ||
Revenue - Amortized |
|
$ |
45 |
|
|
|
$ |
20 |
|
|
|
Less: Directly Attributable Costs |
|
$ |
9 |
|
|
|
$ |
8 |
|
|
|
Directly Attributable Contribution Margin |
|
$ |
36 |
|
80.0 |
% |
$ |
12 |
|
60.0 |
% |
YTD December 2014 |
|
|
|
Margin % |
|
Digital |
|
Margin % |
| ||
Revenue - Amortized |
|
$ |
192 |
|
|
|
$ |
85 |
|
|
|
Less: Directly Attributable Costs |
|
$ |
34 |
|
|
|
$ |
37 |
|
|
|
Directly Attributable Contribution Margin |
|
$ |
158 |
|
82.3 |
% |
$ |
48 |
|
56.5 |
% |
R.H. Donnelley Inc.
2014 Ad Sales Growth
Compared to 2013
|
|
December 31, 2014 |
|
December 31, 2014 |
|
|
|
QTD |
|
YTD |
|
Print Ad Sales |
|
-23 |
% |
-21 |
% |
Digital Ad Sales |
|
6 |
% |
9 |
% |
Total Ad Sales |
|
-15 |
% |
-12 |
% |
R.H. Donnelley Inc.
Directly Attributable Contribution Margin
For the Three and Twelve Months Ended December 31, 2014
($ millions)
Q4 2014 |
|
|
|
Margin % |
|
Digital |
|
Margin % |
| ||
Revenue - Amortized |
|
$ |
60 |
|
|
|
$ |
32 |
|
|
|
Less: Directly Attributable Costs |
|
$ |
11 |
|
|
|
$ |
12 |
|
|
|
Directly Attributable Contribution Margin |
|
$ |
49 |
|
81.7 |
% |
$ |
20 |
|
62.5 |
% |
YTD December 2014 |
|
|
|
Margin % |
|
Digital |
|
Margin % |
| ||
Revenue - Amortized |
|
$ |
259 |
|
|
|
$ |
130 |
|
|
|
Less: Directly Attributable Costs |
|
$ |
49 |
|
|
|
$ |
53 |
|
|
|
Directly Attributable Contribution Margin |
|
$ |
211 |
|
81.5 |
% |
$ |
77 |
|
59.2 |
% |
Dex Media East, Inc.
2015 Ad Sales Growth
Compared to 2014
|
|
March 31, 2015 |
|
|
|
QTR |
|
Print Ad Sales |
|
-30 |
% |
Digital Ad Sales |
|
-22 |
% |
Total Ad Sales |
|
-28 |
% |
Dex Media East, Inc.
Directly Attributable Contribution Margin
For the Quarter Ended March 31, 2015
($ millions)
Q1 2015 |
|
|
|
Margin % |
|
Digital |
|
Margin % |
| ||
Revenue - Amortized |
|
$ |
38 |
|
|
|
$ |
19 |
|
|
|
Less: Directly Attributable Costs |
|
$ |
7 |
|
|
|
$ |
10 |
|
|
|
Directly Attributable Contribution Margin |
|
$ |
31 |
|
81.6 |
% |
$ |
9 |
|
47.4 |
% |
Dex Media West, Inc.
2015 Ad Sales Growth
Compared to 2014
|
|
March 31, 2015 |
|
|
|
QTR |
|
Print Ad Sales |
|
-23 |
% |
Digital Ad Sales |
|
-26 |
% |
Total Ad Sales |
|
-24 |
% |
Dex Media West, Inc.
Directly Attributable Contribution Margin
For the Quarter Ended March 31, 2015
($ millions)
Q1 2015 |
|
|
|
Margin % |
|
Digital |
|
Margin % |
| ||
Revenue - Amortized |
|
$ |
41 |
|
|
|
$ |
20 |
|
|
|
Less: Directly Attributable Costs |
|
$ |
7 |
|
|
|
$ |
10 |
|
|
|
Directly Attributable Contribution Margin |
|
$ |
34 |
|
82.9 |
% |
$ |
10 |
|
50.0 |
% |
R.H. Donnelley Inc.
2015 Ad Sales Growth
Compared to 2014
|
|
March 31, 2015 |
|
Print Ad Sales |
|
-24 |
% |
Digital Ad Sales |
|
-23 |
% |
Total Ad Sales |
|
-24 |
% |
R.H. Donnelley Inc.
Directly Attributable Contribution Margin
For the Quarter Ended March 31, 2015
($ millions)
Q1 2015 |
|
|
|
Margin % |
|
Digital |
|
Margin % |
| ||
Revenue - Amortized |
|
$ |
55 |
|
|
|
$ |
31 |
|
|
|
Less: Directly Attributable Costs |
|
$ |
9 |
|
|
|
$ |
14 |
|
|
|
Directly Attributable Contribution Margin |
|
$ |
46 |
|
83.6 |
% |
$ |
17 |
|
54.8 |
% |
SuperMedia, Inc.
2015 Ad Sales Growth
Compared to 2014
|
|
March 31, 2015 |
|
|
|
QTR |
|
Print Ad Sales |
|
-26 |
% |
Digital Ad Sales |
|
-35 |
% |
Total Ad Sales |
|
-29 |
% |
SuperMedia, Inc.
Directly Attributable Contribution Margin
For the Quarter Ended March 31, 2015
($ millions)
Q1 2015 |
|
|
|
Margin % |
|
Digital |
|
Margin % |
| ||
Revenue - Amortized |
|
$ |
139 |
|
|
|
$ |
62 |
|
|
|
Less: Directly Attributable Costs |
|
$ |
26 |
|
|
|
$ |
34 |
|
|
|
Directly Attributable Contribution Margin |
|
$ |
113 |
|
81.2 |
% |
$ |
28 |
|
45.2 |
% |
Dex Media East, Inc.
2015 Ad Sales Growth
Compared to 2014
|
|
June 30, 2015 |
|
June 30, 2015 |
|
|
|
QTD |
|
YTD |
|
Print Ad Sales |
|
-18 |
% |
-25 |
% |
Digital Ad Sales |
|
-10 |
% |
-15 |
% |
Total Ad Sales |
|
-15 |
% |
-22 |
% |
Dex Media East, Inc.
Directly Attributable Contribution Margin
For the Three and Six Months Ended June 30, 2015
($ millions)
Q2 2015 |
|
|
|
Margin % |
|
Digital |
|
Margin % |
| ||
Revenue - Amortized |
|
$ |
36 |
|
|
|
$ |
18 |
|
|
|
Less: Directly Attributable Costs |
|
$ |
6 |
|
|
|
$ |
9 |
|
|
|
Directly Attributable Contribution Margin |
|
$ |
30 |
|
83.3 |
% |
$ |
9 |
|
50.0 |
% |
YTD June 2015 |
|
|
|
Margin % |
|
Digital |
|
Margin % |
| ||
Revenue - Amortized |
|
$ |
74 |
|
|
|
$ |
37 |
|
|
|
Less: Directly Attributable Costs |
|
$ |
13 |
|
|
|
$ |
19 |
|
|
|
Directly Attributable Contribution Margin |
|
$ |
61 |
|
82.4 |
% |
$ |
18 |
|
48.6 |
% |
Dex Media West, Inc.
2015 Ad Sales Growth
Compared to 2014
|
|
June 30, 2015 |
|
June 30, 2015 |
|
|
|
QTD |
|
YTD |
|
Print Ad Sales |
|
-16 |
% |
-21 |
% |
Digital Ad Sales |
|
-24 |
% |
-25 |
% |
Total Ad Sales |
|
-21 |
% |
-23 |
% |
Dex Media West, Inc.
Directly Attributable Contribution Margin
For the Three and Six Months Ended June 30, 2015
($ millions)
Q2 2015 |
|
|
|
Margin % |
|
Digital |
|
Margin % |
| ||
Revenue - Amortized |
|
$ |
39 |
|
|
|
$ |
20 |
|
|
|
Less: Directly Attributable Costs |
|
$ |
7 |
|
|
|
$ |
9 |
|
|
|
Directly Attributable Contribution Margin |
|
$ |
32 |
|
82.1 |
% |
$ |
11 |
|
55.0 |
% |
YTD June 2015 |
|
|
|
Margin % |
|
Digital |
|
Margin % |
| ||
Revenue - Amortized |
|
$ |
80 |
|
|
|
$ |
40 |
|
|
|
Less: Directly Attributable Costs |
|
$ |
14 |
|
|
|
$ |
19 |
|
|
|
Directly Attributable Contribution Margin |
|
$ |
66 |
|
82.5 |
% |
$ |
21 |
|
52.5 |
% |
R.H. Donnelley Inc.
2015 Ad Sales Growth
Compared to 2014
|
|
June 30, 2015 |
|
June 30, 2015 |
|
|
|
QTD |
|
YTD |
|
Print Ad Sales |
|
-22 |
% |
-23 |
% |
Digital Ad Sales |
|
-16 |
% |
-19 |
% |
Total Ad Sales |
|
-20 |
% |
-21 |
% |
R.H. Donnelley Inc.
Directly Attributable Contribution Margin
For the Three and Six Months Ended June 30, 2015
($ millions)
Q2 2015 |
|
|
|
Margin % |
|
Digital |
|
Margin % |
| ||
Revenue - Amortized |
|
$ |
52 |
|
|
|
$ |
32 |
|
|
|
Less: Directly Attributable Costs |
|
$ |
8 |
|
|
|
$ |
14 |
|
|
|
Directly Attributable Contribution Margin |
|
$ |
44 |
|
84.6 |
% |
$ |
18 |
|
56.3 |
% |
YTD June 2015 |
|
|
|
Margin % |
|
Digital |
|
Margin % |
| ||
Revenue - Amortized |
|
$ |
108 |
|
|
|
$ |
62 |
|
|
|
Less: Directly Attributable Costs |
|
$ |
18 |
|
|
|
$ |
27 |
|
|
|
Directly Attributable Contribution Margin |
|
$ |
90 |
|
83.3 |
% |
$ |
35 |
|
56.5 |
% |
Dex Media
GAAP Operating Costs Detail
June 2015 YTD
(in millions)
|
|
SuperMedia Inc. |
|
|
|
|
|
R.H. Donnelley, |
|
|
|
Consolidated |
|
|
|
and Subsidiaries |
|
Dex East, Inc. |
|
Dex West, Inc. |
|
Inc. |
|
Dex Media Inc. |
|
Dex Media |
|
|
|
|
|
|
|
|
|
|
|
|
|
|
|
Direct Operating Costs: |
|
|
|
|
|
|
|
|
|
|
|
|
|
Sales Commissions |
|
29 |
|
8 |
|
9 |
|
12 |
|
|
|
58 |
|
Print and Distribution |
|
35 |
|
10 |
|
11 |
|
13 |
|
|
|
69 |
|
Sales Employee Related Costs |
|
24 |
|
7 |
|
6 |
|
11 |
|
|
|
48 |
|
Depreciation and Amortization |
|
67 |
|
43 |
|
52 |
|
37 |
|
|
|
199 |
|
Stewardship |
|
|
|
|
|
|
|
|
|
5 |
|
5 |
|
Other (a) |
|
24 |
|
6 |
|
7 |
|
6 |
|
|
|
43 |
|
Total Direct Operating Costs: |
|
179 |
|
74 |
|
85 |
|
79 |
|
5 |
|
422 |
|
|
|
|
|
|
|
|
|
|
|
|
|
|
|
Shared Costs |
|
152 |
|
42 |
|
45 |
|
64 |
|
|
|
303 |
|
|
|
|
|
|
|
|
|
|
|
|
|
|
|
Total Operating Costs |
|
331 |
|
116 |
|
130 |
|
143 |
|
5 |
|
725 |
|
|
|
|
|
|
|
|
|
|
|
|
|
|
|
Interest Expense, Net |
|
101 |
|
10 |
|
14 |
|
29 |
|
18 |
|
172 |
|
(a) occupancy expense, bad debt, bank fees and sales employee expense reimbursements
Dex Media
GAAP Operating Costs Detail
2014
(in millions)
|
|
SuperMedia Inc. |
|
|
|
|
|
R.H. Donnelley, |
|
|
|
Consolidated |
|
|
|
and Subsidiaries |
|
Dex East, Inc. |
|
Dex West, Inc. |
|
Inc. |
|
Dex Media Inc. |
|
Dex Media |
|
|
|
|
|
|
|
|
|
|
|
|
|
|
|
Direct Operating Costs: |
|
|
|
|
|
|
|
|
|
|
|
|
|
Sales Commissions |
|
69 |
|
17 |
|
19 |
|
26 |
|
|
|
131 |
|
Print and Distribution |
|
83 |
|
24 |
|
26 |
|
38 |
|
|
|
171 |
|
Sales Employee Related Costs |
|
27 |
|
14 |
|
18 |
|
28 |
|
|
|
87 |
|
Depreciation and Amortization |
|
218 |
|
125 |
|
154 |
|
110 |
|
|
|
607 |
|
Stewardship |
|
|
|
|
|
|
|
|
|
24 |
|
24 |
|
Other (a) |
|
50 |
|
11 |
|
14 |
|
20 |
|
|
|
95 |
|
Total Direct Operating Costs: |
|
447 |
|
191 |
|
231 |
|
222 |
|
24 |
|
1,115 |
|
|
|
|
|
|
|
|
|
|
|
|
|
|
|
Shared Costs |
|
356 |
|
93 |
|
106 |
|
149 |
|
|
|
704 |
|
|
|
|
|
|
|
|
|
|
|
|
|
|
|
Total Operating Costs |
|
803 |
|
284 |
|
337 |
|
371 |
|
24 |
|
1,819 |
|
|
|
|
|
|
|
|
|
|
|
|
|
|
|
Interest Expense, Net |
|
207 |
|
23 |
|
29 |
|
63 |
|
34 |
|
356 |
|
(a) occupancy expense, bad debt, bank fees and sales employee expense reimbursements
R.H. Donnelley Inc.
Financial Covenant Calculations
December 31, 2014
($ Millions)
|
|
1Q14 |
|
2Q14 |
|
3Q14 |
|
4Q14 |
|
|
Total |
| |||||
Consolidated EBITDA |
|
|
|
|
|
|
|
|
|
|
|
| |||||
Consolidated Net Income |
|
$ |
5.7 |
|
$ |
(11.6 |
) |
$ |
(0.8 |
) |
$ |
(69.8 |
) |
|
$ |
(76.6 |
) |
(a) Additions (without duplication) |
|
|
|
|
|
|
|
|
|
|
|
| |||||
(i) Consolidated interest expense |
|
16.2 |
|
16.1 |
|
16.1 |
|
15.1 |
|
|
63.5 |
| |||||
(ii) Consolidated income tax expense |
|
(15.8 |
) |
4.1 |
|
(5.3 |
) |
52.1 |
|
|
35.0 |
| |||||
(iii) Depreciation and amortization |
|
29.4 |
|
29.2 |
|
29.1 |
|
29.0 |
|
|
116.7 |
| |||||
(iv) Extraordinary charges or non-cash charges |
|
0.1 |
|
0.1 |
|
0.1 |
|
8.4 |
|
|
8.8 |
| |||||
(v) Non-recurring charges: |
|
|
|
|
|
|
|
|
|
|
|
| |||||
(A) Severance costs associated with restructuring (2015-2016 only) not to exceed $3.5M per year |
|
|
|
|
|
|
|
|
|
|
|
| |||||
(B) Investment and commercial banking fees and expenses |
|
|
|
|
|
|
|
|
|
|
|
| |||||
(C) Cash premiums, penalties or other payments payable in connection with the early extinguishment or repurchase of debt |
|
|
|
|
|
|
|
|
|
|
|
| |||||
(vi) Specified Charges through 12/31/13 up to $14.7M total |
|
|
|
|
|
|
|
|
|
|
|
| |||||
(b) Subtractions (without duplication) |
|
|
|
|
|
|
|
|
|
|
|
| |||||
(i) Consolidated interest income |
|
|
|
|
|
|
|
|
|
|
|
| |||||
(ii) Extraordinary gains and non-cash gains |
|
|
|
|
|
(3.3 |
) |
|
|
|
(3.3 |
) | |||||
Other Adjustments |
|
|
|
|
|
|
|
|
|
|
|
| |||||
Fresh start accounting adjustment |
|
|
|
|
|
|
|
|
|
|
|
| |||||
Consolidated EBITDA |
|
$ |
35.6 |
|
$ |
37.9 |
|
$ |
36.0 |
|
$ |
34.7 |
|
|
$ |
144.3 |
|
|
|
|
|
|
|
|
|
|
|
|
|
| |||||
|
|
1Q14 |
|
2Q14 |
|
3Q14 |
|
4Q14 |
|
|
Total |
| |||||
Consolidated Cash Interest Expense |
|
|
|
|
|
|
|
|
|
|
|
| |||||
(a) Sum of (i) and (ii): |
|
|
|
|
|
|
|
|
|
|
|
| |||||
(i) Total cash interest expense |
|
|
|
|
|
|
|
|
|
|
|
| |||||
(A) Interest expense per GAAP |
|
$ |
16.2 |
|
$ |
16.1 |
|
$ |
16.1 |
|
$ |
15.1 |
|
|
$ |
63.5 |
|
Less: |
|
|
|
|
|
|
|
|
|
|
|
| |||||
(B) Amortization of deferred financing |
|
(0.3 |
) |
(0.3 |
) |
(0.3 |
) |
(0.3 |
) |
|
(1.3 |
) | |||||
(C) Swap/cap MTM adjustments |
|
|
|
|
|
|
|
|
|
|
|
| |||||
(D) Debt FMV adjustment |
|
|
|
|
|
|
|
|
|
|
|
| |||||
Total Cash interest expense |
|
$ |
15.8 |
|
$ |
15.8 |
|
$ |
15.8 |
|
$ |
14.8 |
|
|
$ |
62.2 |
|
(ii) Dividends/Distributions per Section 6.08(a)(iv) |
|
3.0 |
|
|
|
3.2 |
|
|
|
|
6.2 |
| |||||
Less: |
|
|
|
|
|
|
|
|
|
|
|
| |||||
(b) Total cash interest income |
|
|
|
|
|
|
|
|
|
|
|
| |||||
Consolidated Cash Interest Expense |
|
$ |
18.9 |
|
$ |
15.8 |
|
$ |
18.9 |
|
$ |
14.8 |
|
|
$ |
68.4 |
|
DEBT
|
|
4Q14 |
| |
Term loan outstanding |
|
$ |
611.8 |
|
Cash (up to $25MM) |
|
$ |
(23.1 |
) |
Total Senior Secured Debt |
|
$ |
588.7 |
|
Interest Coverage |
| ||||
|
|
|
|
|
|
Actual |
|
Minimum |
|
Result |
|
2.11 x |
|
1.10 x |
|
Pass |
|
Total Leverage |
| ||||
|
| ||||
Actual |
|
Maximum |
|
Result |
|
4.08 x |
|
5.3500 x |
|
Pass |
|
R.H. Donnelley Inc.
Financial Covenant Calculations
March 31, 2015
($ Millions)
|
|
2Q14 |
|
3Q14 |
|
4Q14 |
|
1Q15 |
|
|
Total |
| |||||
Consolidated EBITDA |
|
|
|
|
|
|
|
|
|
|
|
| |||||
Consolidated Net Income |
|
$ |
(11.6 |
) |
$ |
(0.8 |
) |
$ |
(69.8 |
) |
$ |
8.4 |
|
|
$ |
(73.8 |
) |
(a) Additions (without duplication) |
|
|
|
|
|
|
|
|
|
|
|
| |||||
(i) Consolidated interest expense |
|
16.1 |
|
16.1 |
|
15.1 |
|
15.0 |
|
|
62.4 |
| |||||
(ii) Consolidated income tax expense |
|
4.1 |
|
(5.3 |
) |
52.1 |
|
(9.8 |
) |
|
41.1 |
| |||||
(iii) Depreciation and amortization |
|
29.2 |
|
29.1 |
|
29.0 |
|
20.1 |
|
|
107.4 |
| |||||
(iv) Extraordinary charges or non-cash charges |
|
0.1 |
|
0.1 |
|
8.4 |
|
(3.2 |
) |
|
5.5 |
| |||||
(v) Non-recurring charges: |
|
|
|
|
|
|
|
|
|
|
|
| |||||
(A) Severance costs associated with restructuring (2015-2016 only) not to exceed $3.5M per year |
|
|
|
|
|
|
|
|
|
|
|
| |||||
(B) Investment and commercial banking fees and expenses |
|
|
|
|
|
|
|
|
|
|
|
| |||||
(C) Cash premiums, penalties or other payments payable in connection with the early extinguishment or repurchase of debt |
|
|
|
|
|
|
|
|
|
|
|
| |||||
(vi) Specified Charges through 12/31/13 up to $14.7M total |
|
|
|
|
|
|
|
|
|
|
|
| |||||
(b) Subtractions (without duplication) |
|
|
|
|
|
|
|
|
|
|
|
| |||||
(i) Consolidated interest income |
|
|
|
|
|
|
|
|
|
|
|
| |||||
(ii) Extraordinary gains and non-cash gains |
|
|
|
(3.3 |
) |
|
|
|
|
|
(3.3 |
) | |||||
Other Adjustments |
|
|
|
|
|
|
|
|
|
|
|
| |||||
Fresh start accounting adjustment |
|
|
|
|
|
|
|
|
|
|
|
| |||||
Consolidated EBITDA |
|
$ |
37.9 |
|
$ |
36.0 |
|
$ |
34.7 |
|
$ |
30.7 |
|
|
$ |
139.3 |
|
|
|
|
|
|
|
|
|
|
|
|
|
| |||||
|
|
2Q14 |
|
3Q14 |
|
4Q14 |
|
1Q15 |
|
|
Total |
| |||||
|
|
|
|
|
|
|
|
|
|
|
|
| |||||
Consolidated Cash Interest Expense |
|
|
|
|
|
|
|
|
|
|
|
| |||||
(a) Sum of (i) and (ii): |
|
|
|
|
|
|
|
|
|
|
|
| |||||
(i) Total cash interest expense |
|
|
|
|
|
|
|
|
|
|
|
| |||||
(A) Interest expense per GAAP |
|
$ |
16.1 |
|
$ |
16.1 |
|
$ |
15.1 |
|
$ |
15.0 |
|
|
$ |
62.4 |
|
Less: |
|
|
|
|
|
|
|
|
|
|
|
| |||||
(B) Amortization of deferred financing |
|
(0.3 |
) |
(0.3 |
) |
(0.3 |
) |
(0.3 |
) |
|
(1.3 |
) | |||||
(C) Swap/cap MTM adjustments |
|
|
|
|
|
|
|
|
|
|
|
| |||||
(D) Debt FMV adjustment |
|
|
|
|
|
|
|
|
|
|
|
| |||||
Total Cash interest expense |
|
$ |
15.8 |
|
$ |
15.8 |
|
$ |
14.8 |
|
$ |
14.7 |
|
|
$ |
61.1 |
|
(ii) Dividends/Distributions per Section 6.08(a)(iv) |
|
|
|
3.2 |
|
|
|
|
|
|
3.2 |
| |||||
Less: |
|
|
|
|
|
|
|
|
|
|
|
| |||||
(b) Total cash interest income |
|
|
|
|
|
|
|
|
|
|
|
| |||||
Consolidated Cash Interest Expense |
|
$ |
15.8 |
|
$ |
18.9 |
|
$ |
14.8 |
|
$ |
14.7 |
|
|
$ |
64.3 |
|
DEBT
|
|
1Q2015 |
| |
Term loan outstanding |
|
$ |
604.9 |
|
Cash (up to $25MM) |
|
$ |
(24.2 |
) |
Total Senior Secured Debt |
|
$ |
580.7 |
|
Interest Coverage |
| ||||
|
|
|
|
|
|
Actual |
|
Minimum |
|
Result |
|
2.17 x |
|
1.10 x |
|
Pass |
|
Total Leverage |
| ||||
|
| ||||
Actual |
|
Maximum |
|
Result |
|
4.1684 x |
|
5.3125 x |
|
Pass |
|
Dex Media, Inc.
Severance Packages
Employee Level / |
|
|
|
|
|
|
|
|
Severance Package |
|
Effective Date |
|
Payout Timeline |
|
Payout terms |
|
Payout Restrictions |
Executive Vice President (EVP) and above |
|
7/6/14 |
|
Lump sum payment |
|
78 weeks of pay plus 1.5 times target bonus |
|
N/A |
Non-Bargained employees below EVP |
|
11/17/14 |
|
Lump sum payment |
|
(2 times full years of service + prorated year of service) times weekly compensation |
|
Minimum: 6 to 26 times weekly compensation (1) |
CWA Union employees Dex East |
|
7/1/14 |
|
Lump sum payment |
|
(2 times full years of service times weekly compensation w/incentive included) + prorated payment (3) |
|
Minimum: 4 times weekly compensation |
CWA Union employees Dex West |
|
9/15/12 - 3/18/16 |
|
Lump sum payment |
|
Voluntary (4): $1k for each year of employment Involuntary (5): $2k for each year of employment |
|
Voluntary (4) Involuntary (5) |
IBEW Union employees Dex West |
|
6/12/15 - 5/11/18 |
|
Lump sum payment |
|
Voluntary (4): $1k for each year of employment
|
|
Voluntary (4) Involuntary (5) |
Notes:
(1) 6 times weekly compensation is for employees below Director/Division Managers; 26 times weekly compensation is for Directors, AVPs, VPs, Divisional Managers, and Regional VPs
(2) 26 times weekly compensation is for employees below Director/Division Managers; 52 times weekly compensation is for Directors, AVPs, VPs, Divisional Managers, and Regional VPs
(3) If partial year of service is greater than 6 months = 2 times weekly compensation; if partial year is less than 6 months = 1 times weekly compensation
(4) Regular employees who are declared surplus by Company due to lack of work and accept voluntary separation
(5) Regular employees who are declared surplus by Company due to lack of work and who are involuntary separated
Entity Information
· Dex Media Inc., Parent of Dex Media, holding company
· Dex Media Holdings, Inc., holding company for Dex Media East, Inc., Dex Media West, Inc. and Dex Media Services LLC
· Dex Media Services LLC, pension services for Dex Media East Inc. and Dex Media West Inc.
· Dex Media East, Inc., operating entity, yellow pages print and digital advertising
· Dex Media West, Inc., operating entity, yellow pages print and digital advertising
· Dex One Digital, Inc., national digital advertising services
· Dex One Services, Inc., management company for Dex Media Inc.
· R.H. Donnelley, Inc., operating entity, yellow pages print and digital advertising
· R.H. Donnelley APIL, Inc., management company for R.H. Donnelley, Inc.
· R.H. Donnelley Corporation, inactive entity
· SuperMedia Inc., holding company for SuperMedia entities
· SuperMedia LLC, operating entity, yellow pages print and digital advertising
· SuperMedia UK, Ltd., disregarded entity providing digital advertising services
· SuperMedia Sales, Inc., employment services support entity
· All BRE LLCs (bankruptcy remote entity) are disregarded entities designed to protect related owner entitys intellectual property
Items on Balance Sheets of Legal Entities
Dex Media, Inc Cash, Senior subordinated notes, Investment in subs, Accounts payable and other accrued liabilities (Stewardship obligations) Intercompany payable, Taxes, Equity
Dex Media Holdings Inc- Investment in subs (DME, DMW, DM Services LLC-2%), Equity
Dex Media Services LLC Intercompany payable, Pension liability, Equity
Dex Media East, Inc Cash, Customer A/R, Deferred directory costs, Intercompany receivable, Fixed assets/Capitalized software, Intangible assets, Accounts payable and other accrued liabilities, Accrued interest, Deferred revenue, Senior secured credit facilities, Taxes, Investment in Sub (DM Services LLC-49%), Equity
Dex Media West, Inc Cash, Customer A/R, Deferred directory costs, Intercompany receivable, Fixed assets/Capitalized software, Intangible assets, Accounts payable and other accrued liabilities, Accrued interest, Deferred revenue, Senior secured credit facilities, Taxes, Investment in Sub (DM Services LLC-49%), Equity
Dex One Digital, Inc Cash, A/R, Intercompany payable, Deferred revenue, Taxes, Equity
Dex One Services, Inc- Cash, Prepaid expenses/Other current assets, Intercompany receivable, Fixed assets/Capitalized software, Accounts payable and other accrued liabilities, Employee benefits (no pension), Taxes, Equity
R.H.Donnelley, Inc- Cash, Customer A/R, Deferred directory costs, Fixed assets/Capitalized software, Intangible assets, Investment in Subs (R.H. Donnelley, APIL, Inc), Accounts payable and other accrued liabilities, Accrued interest, Deferred revenue, Intercompany payable, Senior secured credit facilities, Pension liability, Taxes, Equity
R.H.Donnelley, APIL, Inc- Intercompany receivable, Taxes, Equity
R.H.Donnelley Corporation-Inactive
SuperMedia Inc- Goodwill, Pension asset, Investment in subs (SuperMedia LLC), Intercompany interest payable (SuperMedia LLC), Intercompany note payable (SuperMedia LLC), Intercompany payable, Senior secured credit facilities, Pension liability, Taxes, Equity
SuperMedia LLC-Cash, Customer A/R, Deferred directory costs, Intercompany interest receivable (SuperMedia Inc), Intercompany note receivable (SuperMedia Inc), Prepaid expenses and other, Fixed assets/Capitalized software, Intangible assets, Investment in Subs (SuperMedia Sales, Inc), Accounts payable and other accrued liabilities, Accrued interest, Deferred revenue, Intercompany payable (SuperMedia Sales), Intercompany payable, Senior secured credit facilities, Other employee benefits (LTD, Supplemental Employee Retirement Liability), Taxes, Equity
SuperMedia UK, Ltd- Immaterial assets/liabilities
SuperMedia Sales, Inc- Fixed assets, Intercompany note receivable (SuperMedia LLC), Intercompany payable, Accounts payable and other accrued liabilities, Taxes, Equity
All BRE LLCs do not have any assets/liabilities on their books.
Note:
Accounts payable and accrued expenses can include:
Accounts payable
Accrued salaries and wages, including accrued severance
Accrued taxes
Accrued expenses
Customer refunds, advance payments and other
Dex Media
GAAP Operating Costs Detail
June 2015 YTD
(in millions)
|
|
SuperMedia Inc. |
|
|
|
|
|
R.H. Donnelley, |
|
|
|
Consolidated |
|
|
|
and Subsidiaries |
|
Dex East, Inc. |
|
Dex West, Inc. |
|
Inc. |
|
Dex Media Inc. |
|
Dex Media |
|
|
|
|
|
|
|
|
|
|
|
|
|
|
|
Direct Operating Costs: |
|
|
|
|
|
|
|
|
|
|
|
|
|
Sales Commissions |
|
29 |
|
8 |
|
9 |
|
12 |
|
|
|
58 |
|
Print and Distribution |
|
35 |
|
10 |
|
11 |
|
13 |
|
|
|
69 |
|
Sales Employee Related Costs |
|
24 |
|
7 |
|
6 |
|
11 |
|
|
|
48 |
|
Depreciation and Amortization |
|
67 |
|
43 |
|
52 |
|
37 |
|
|
|
199 |
|
Stewardship |
|
|
|
|
|
|
|
|
|
5 |
|
5 |
|
Other (a) |
|
24 |
|
6 |
|
7 |
|
6 |
|
|
|
43 |
|
Total Direct Operating Costs: |
|
179 |
|
74 |
|
85 |
|
79 |
|
5 |
|
422 |
|
|
|
|
|
|
|
|
|
|
|
|
|
|
|
Shared Costs |
|
152 |
|
42 |
|
45 |
|
64 |
|
|
|
303 |
|
|
|
|
|
|
|
|
|
|
|
|
|
|
|
Total Operating Costs |
|
331 |
|
116 |
|
130 |
|
143 |
|
5 |
|
725 |
|
|
|
|
|
|
|
|
|
|
|
|
|
|
|
Interest Expense, Net |
|
101 |
|
10 |
|
14 |
|
29 |
|
18 |
|
172 |
|
(a) occupancy expense, bad debt, bank fees and sales employee expense reimbursements
Dex Media
GAAP Operating Costs Detail
2014
(in millions)
|
|
SuperMedia Inc. |
|
|
|
|
|
R.H. Donnelley, |
|
|
|
Consolidated |
|
|
|
and Subsidiaries |
|
Dex East, Inc. |
|
Dex West, Inc. |
|
Inc. |
|
Dex Media Inc. |
|
Dex Media |
|
|
|
|
|
|
|
|
|
|
|
|
|
|
|
Direct Operating Costs: |
|
|
|
|
|
|
|
|
|
|
|
|
|
Sales Commissions |
|
69 |
|
17 |
|
19 |
|
26 |
|
|
|
131 |
|
Print and Distribution |
|
83 |
|
24 |
|
26 |
|
38 |
|
|
|
171 |
|
Sales Employee Related Costs |
|
27 |
|
14 |
|
18 |
|
28 |
|
|
|
87 |
|
Depreciation and Amortization |
|
218 |
|
125 |
|
154 |
|
110 |
|
|
|
607 |
|
Stewardship |
|
|
|
|
|
|
|
|
|
24 |
|
24 |
|
Other(a) |
|
50 |
|
11 |
|
14 |
|
20 |
|
|
|
95 |
|
Total Direct Operating Costs: |
|
447 |
|
191 |
|
231 |
|
222 |
|
24 |
|
1,115 |
|
|
|
|
|
|
|
|
|
|
|
|
|
|
|
Shared Costs |
|
356 |
|
93 |
|
106 |
|
149 |
|
|
|
704 |
|
|
|
|
|
|
|
|
|
|
|
|
|
|
|
Total Operating Costs |
|
803 |
|
284 |
|
337 |
|
371 |
|
24 |
|
1,819 |
|
|
|
|
|
|
|
|
|
|
|
|
|
|
|
Interest Expense, Net |
|
207 |
|
23 |
|
29 |
|
63 |
|
34 |
|
356 |
|
(a) occupancy expense, bad debt, bank fees and sales employee expense reimbursements
Dex Media
Intercompany Detail
Excluding Tax Sharing Agreement
As of June 30, 2015
|
|
|
|
|
|
Dex Media Holdings |
|
Shared Services Funding |
|
|
|
|
|
Stewardship Costs |
|
Parent Bond Interest |
|
Group Activity |
|
Activity |
|
Intercompany Balance |
|
|
|
|
|
|
|
|
|
|
|
|
|
Dex Media Inc. |
|
(44,607,108.00 |
) |
(25,587,436.00 |
) |
|
|
|
|
(70,194,544.00 |
) |
R.H. Donnelly, Inc. |
|
9,050,438.00 |
|
9,467,345.00 |
|
|
|
(3,700,813.00 |
) |
14,816,970.00 |
|
Dex Media Holdings Inc. |
|
|
|
|
|
(11,767.00 |
) |
|
|
(11,767.00 |
) |
Dex Media East, Inc. |
|
6,212,811.50 |
|
6,908,605.00 |
|
3,981,414.50 |
|
(4,266,805.00 |
) |
12,836,026.00 |
|
Dex Media West, Inc. |
|
6,566,116.50 |
|
9,211,486.00 |
|
3,832,790.50 |
|
(2,689,157.00 |
) |
16,921,236.00 |
|
Dex Media Service LLC |
|
|
|
|
|
(7,802,438.00 |
) |
|
|
(7,802,438 00 |
) |
Dex One Digital, Inc. |
|
|
|
|
|
|
|
(661,142.00 |
) |
(661,142.00 |
) |
SuperMedia Inc and Subsidiaries |
|
22,777,742.00 |
|
|
|
|
|
(17,001,683.00 |
) |
5,776,059.00 |
|
Eliminations/Other |
|
|
|
|
|
|
|
|
|
|
|
|
|
|
|
|
|
|
|
|
|
|
|
Dex One Service, Inc. |
|
|
|
|
|
|
|
28,319,600.00 |
|
28,319,600.00 |
|
|
|
|
|
|
|
|
|
|
|
|
|
|
|
|
|
|
|
|
|
|
|
|
|
Notes:
Stewardship, parent bond interest and pension activity will continue to increase as there is no mechanism to settle these intercompanies Shared funding activity will go up and down as various liabilities are accrued and paid throughout the year
Dex Media Inc. & Subsidiaries - Intercompany (I/C) Balance Summary
June 30, 2015
Excludes Tax Sharing Agreement
|
|
I/C Activity to be Settled with Cash |
|
I/C Activity to be Settled with Non-Cash Distribution |
|
|
| ||||||||||||||||||||
|
|
|
|
|
|
|
|
|
|
|
|
|
|
Q4 2014 |
|
|
|
|
|
|
|
|
|
Q2 2015 |
|
|
|
|
|
Q4 2014 |
|
|
|
|
|
|
|
|
|
Q2 2015 |
|
Ending Balance |
|
|
|
|
|
|
|
|
|
Ending Balance |
|
Q2 2015 |
|
|
|
Ending Balance |
|
Net |
|
Net |
|
Net |
|
Net |
|
Ending Balance |
|
to be Settled with |
|
Net |
|
Net |
|
Net |
|
Net |
|
to be Settled with |
|
Ending Balance |
|
|
|
to be Settled with |
|
I/C Activity |
|
I/C Activity |
|
I/C Activity |
|
I/C Activity |
|
to be Settled with |
|
Non-Cash |
|
I/C Activity |
|
I/C Activity |
|
I/C Activity |
|
I/C Activity |
|
Non-Cash |
|
Cash & |
|
Due From (Due To) Dex One Service, Inc. |
|
Cash |
|
Q1 |
|
Q2 |
|
Q3 |
|
Q4 |
|
Cash |
|
Distribution |
|
Q1 |
|
Q2 |
|
Q3 |
|
Q4 |
|
Distribution |
|
Non-Cash |
|
Dex Media Inc. |
|
|
|
|
|
|
|
|
|
|
|
|
|
(49,553,632 |
) |
(16,686,275 |
) |
(3,954,637 |
) |
|
|
|
|
(70,194,544 |
) |
(70,194,544 |
) |
R.H. Donnelly, Inc. |
|
(4,166,476 |
) |
4,886,093 |
|
(4,420,431 |
) |
|
|
|
|
(3,700,813 |
) |
13,080,495 |
|
5,341,372 |
|
95,916 |
|
|
|
|
|
18,517,783 |
|
14,816,969 |
|
Dex Media Holdings Inc. (120)\ |
|
|
|
|
|
|
|
|
|
|
|
|
|
(11,686 |
) |
(80 |
) |
|
|
|
|
|
|
(11,767 |
) |
(11,767 |
) |
Dex Media East, Inc. |
|
(19,259,396 |
) |
2,308,654 |
|
12,683,937 |
|
|
|
|
|
(4,266,805 |
) |
12,865,929 |
|
3,848,990 |
|
387,913 |
|
|
|
|
|
17,102,831 |
|
12,836,026 |
|
Dex Media West, Inc. |
|
2,170,477 |
|
1,827,129 |
|
(6,686,763 |
) |
|
|
|
|
(2,689,157 |
) |
14,275,279 |
|
4,022,141 |
|
1,312,973 |
|
|
|
|
|
19,610,393 |
|
16,921,235 |
|
Dex Media Service LLC |
|
|
|
|
|
|
|
|
|
|
|
|
|
(7,989,524 |
) |
(494,950 |
) |
682,036 |
|
|
|
|
|
(7,802,438 |
) |
(7,802,438 |
) |
Dex One Digital, Inc. |
|
(951,385 |
) |
(351,668 |
) |
641,910 |
|
|
|
|
|
(661,142 |
) |
|
|
|
|
|
|
|
|
|
|
|
|
(661,142 |
) |
SuperMedia Inc and Subsidiaries |
|
(33,160,804 |
) |
4,443,726 |
|
11,715,395 |
|
|
|
|
|
(17,001,683 |
) |
17,333,139 |
|
3,968,804 |
|
1,475,800 |
|
|
|
|
|
22,777,743 |
|
5,776,060 |
|
Eliminations/Other |
|
1 |
|
|
|
|
|
|
|
|
|
1 |
|
|
|
|
|
|
|
|
|
|
|
|
|
1 |
|
Total |
|
(55,367,583 |
) |
13,113,934 |
|
13,934,049 |
|
|
|
|
|
(28,319,600 |
) |
0 |
|
0 |
|
0 |
|
|
|
|
|
1 |
|
(28,319,599 |
) |
|
|
|
|
|
|
|
|
|
|
|
|
|
|
|
|
|
|
|
|
|
|
|
|
|
|
|
|
Dex One Service, Inc. - Due From (Due to) |
|
55,367,583 |
|
(13,113,934 |
) |
(13,934,049 |
) |
|
|
|
|
28,319,600 |
|
|
|
(0 |
) |
(0 |
) |
|
|
|
|
(1 |
) |
28,319,599 |
|
Dex Media Inc. Consolidated |
|
|
|
|
|
|
|
|
|
|
|
|
|
|
|
|
|
|
|
|
|
|
|
|
|
|
|
Notes:
Net Intercompany Activity to be Settled in Cash: Disbursements from the Dex One Service funding account are settled with the appropriate entities when the payment clears. This activity reflects expense accruals that will be paid in a subsequent period plus disbursements from the Dex One Service funding account that have not yet been settled with the operating companies minus cash settlements from a prior period.
Net Intercompany Activity to be Settled with Non-Cash Distribution: This activity represents certain expenses that are settled through a non-cash dividend or equity adjustment in accordance with the Shared Services Agreement.
Dex Media Inc. & Subsidiaries - Intercompany Tax Sharing Agreement Balance Summary
June 30, 2015
|
|
I/C Tax Sharing Agreement Activity |
| ||||||
|
|
|
|
|
|
|
|
Q2 2015 |
|
|
|
|
|
|
|
Net |
|
Ending Tax |
|
|
|
Q4 2014 |
|
Net |
|
I/C TSA |
|
Sharing |
|
|
|
Ending |
|
I/C TSA Activity |
|
Activity |
|
Agreement |
|
Due From (Due To) Dex One Service, Inc. |
|
Balance |
|
Q1 |
|
Q2 |
|
Balance |
|
Dex Media Inc. |
|
|
|
(19,860 |
) |
|
|
(19,860 |
) |
R.H. Donnelly, Inc. |
|
(3,158,193 |
) |
6,316,059 |
|
(4,226,013 |
) |
(1,068,147 |
) |
Dex Media Holdings Inc. (120) |
|
155,691 |
|
11,353 |
|
(144,415 |
) |
22,629 |
|
Dex Media East, Inc. |
|
6,342,020 |
|
(2,675,895 |
) |
(2,722,367 |
) |
943,759 |
|
Dex Media West, Inc. |
|
7,532,398 |
|
(4,188,506 |
) |
(2,722,419 |
) |
621,473 |
|
Dex Media Service LLC |
|
(6,791,504 |
) |
(248,544 |
) |
7,040,049 |
|
1 |
|
Dex One Digital, Inc. |
|
(11,712 |
) |
803 |
|
11,258 |
|
349 |
|
SuperMedia Inc. and Subsidiaries |
|
(3,828,019 |
) |
(6,366,625 |
) |
9,935,120 |
|
(259,524 |
) |
Eliminations/Other |
|
(1 |
) |
1 |
|
1 |
|
1 |
|
Total |
|
240,679 |
|
(7,171,213 |
) |
7,171,213 |
|
240,679 |
|
|
|
|
|
|
|
|
|
|
|
Dex One Service, Inc. - Due From (Due to) |
|
(240,679 |
) |
7,171,213 |
|
(7,171,213 |
) |
(240,679 |
) |
Dex Media Inc. Consolidated |
|
|
|
|
|
|
|
|
|
Confidential Christopher Petrocelli Sep 08, 2015 16:02 Tax Sharing Agreement (TSA) Overview To provide an overview of the TSA, the following summary is provided: There are two agreements: one amongst the Dex One group and one between SuperMedia and the Dex One group. Tax attributes, as defined, include NOLs and current year losses. Each company with current year taxable income reimburses for attributes utilized to offset its taxable income. The members of the Dex One group pay 50 cents for each dollar of Dex One group tax attribute utilized. SuperMedia pays the Dex One group members 75 cents for each dollar of tax attribute utilized. Any SuperMedia tax attributes utilized by the Dex One group members are reimbursed at 50 cents for each dollar of tax attribute utilized. Cancellation of debt income (CODI): Dex One group does not reimburse for tax attributes utilized. SuperMedia reimburses for attributes utilized to offset taxable income or utilized through tax attribute reduction fan-out. 1 Confidential and Proprietary Information of Dex Media Get found. Get chosen. Get talked about. dex media. Confidential Christopher Petrocelli Sep 08, 2015 16:02
Confidential Christopher Petrocelli Sep 08, 2015 16:02 Tax Sharing Agreement (TSA) Overview - Continued Tax attributes utilized First, the current year taxable losses of members are utilized, following consolidated return regulations. Second, NOLs are utilized. The tax attributes utilized are allocated to the members with positive taxable income based on each members share of the positive taxable income generated by all members. Parent losses The losses are utilized by all members, however, only SuperMedia reimburses for any tax attributes it utilizes. Dex One Services (DOS) Excess The Dex One group members with positive current year taxable income share proportionately the Dex One Service excess. This includes 75% reimbursement for Parent tax attributes that SuperMedia utilized; and The difference between the current year tax paid in to DOS at 100% by the Dex One group less what the Dex One members are reimbursed for current year taxable losses. DOS Funding Any funding of DOS is allocate using the Shared Services cost allocation percentages. 2 Confidential and Proprietary Information of Dex Media Get found. Get chosen. Get talked about. dex media. Confidential Christopher Petrocelli Sep 08, 2015 16:02
Confidential Christopher Petrocelli Sep 08, 2015 16:02 Tax Sharing Agreement (TSA) Summary (In thousands) RHD DME DMW SM DOD DMHI Total 2013 Tax Year Settlements, Received/(Paid) Subsequent to Merger* 10,430 8,254 4,427 (23,168) 37 20 - 2014 Tax Year Settlements, Received/(Paid) 8,942 6,351 4,921 (20,242) 4 24 - 2015 Estimated Settlement Receivable/(Payable) (2,238) 1,825 1,171 (765) 1 6 - * Full year 2013 as trued up for filing of 2013 tax returns, less Q1 2013 estimate payment (pre-merger). Confidential Christopher Petrocelli Sep 08, 2015 16:02
Federal NOLs
Dex Media, Inc.
Federal Net Operating Loss - Pre-tax
Balance as of 12/31/2014
(in millions)
Estimated Federal Net Operating Loss Balance |
|
$ |
732 |
|
Note 1: All Federal NOLs are at the R.H. Donnelley Inc. silo.
Note2 : Estimate based on 2014 provision and will be trued up based on completion of the 2014 Federal Dex Media Inc. Income Tax Return.
Dex Media
Unitary State NOL Carryforwards (Post Apportionment, Pre-Tax)
Estimated as of 12/31/14
By Silo |
|
Arizona |
|
California |
|
Colorado |
|
District of |
|
Idaho |
|
Illinois |
|
Iowa |
|
Kansas |
|
Kentucky |
|
Maine |
|
Massachusetts |
|
Michigan |
|
Minnesota |
|
Montana |
|
Nebraska |
|
New Hampshire |
|
New Mexico |
|
New York |
|
North Dakota |
|
Oregon |
|
Texas |
|
Utah |
|
Vermont |
|
West Virginia |
|
Wisconsin |
|
|
|
|
|
|
|
|
|
|
|
|
|
|
|
|
|
|
|
|
|
|
|
|
|
|
|
|
|
|
|
|
|
|
|
|
|
|
|
|
|
|
|
|
|
|
|
|
|
|
|
|
|
R.H. Donnelley, Inc. |
|
682,368 |
|
3,016,572 |
|
144,893,493 |
|
59 |
|
1,121,304 |
|
229,622,460 |
|
6,306,469 |
|
41,654,771 |
|
0 |
|
93,233 |
|
0 |
|
0 |
|
7,238,639 |
|
0 |
|
691,077 |
|
0 |
|
83,102 |
|
79,170,311 |
|
32,813 |
|
71,340 |
|
0 |
|
2,289,119 |
|
0 |
|
111,004 |
|
24,606 |
|
Dex Media East, Inc. |
|
3,179,791 |
|
3,973,984 |
|
18,548,238 |
|
332 |
|
2,330,353 |
|
0 |
|
56,546,060 |
|
2,512,559 |
|
0 |
|
140,217 |
|
0 |
|
0 |
|
166,771,749 |
|
5,215,082 |
|
1,211,240 |
|
0 |
|
460,060 |
|
0 |
|
839,392 |
|
122,685 |
|
0 |
|
4,892,362 |
|
0 |
|
633,900 |
|
1,032,705 |
|
Dex Media West, Inc. |
|
15,192,684 |
|
4,908,273 |
|
17,874,770 |
|
583 |
|
7,641,798 |
|
0 |
|
1 |
|
3,066,881 |
|
0 |
|
44,330 |
|
0 |
|
0 |
|
11,063,808 |
|
226,401 |
|
1,112,951 |
|
0 |
|
39,569 |
|
0 |
|
20,395 |
|
829,222 |
|
0 |
|
61,553,082 |
|
0 |
|
1,115,234 |
|
22,985 |
|
SuperMedia, Inc. |
|
0 |
|
0 |
|
0 |
|
167,820 |
|
0 |
|
0 |
|
0 |
|
0 |
|
0 |
|
0 |
|
0 |
|
0 |
|
0 |
|
0 |
|
0 |
|
0 |
|
0 |
|
0 |
|
0 |
|
0 |
|
0 |
|
0 |
|
0 |
|
58,839 |
|
309,502 |
|
Parent and Other |
|
1,293,427 |
|
71,832,688 |
|
40,471,374 |
|
106 |
|
920,559 |
|
0 |
|
314,424 |
|
9,468,177 |
|
0 |
|
157,246 |
|
0 |
|
0 |
|
2,362,252 |
|
0 |
|
312,209 |
|
0 |
|
142,820 |
|
0 |
|
53,154 |
|
117,360 |
|
0 |
|
2,397,832 |
|
0 |
|
196,480 |
|
39,863 |
|
|
|
|
|
|
|
|
|
|
|
|
|
|
|
|
|
|
|
|
|
|
|
|
|
|
|
|
|
|
|
|
|
|
|
|
|
|
|
|
|
|
|
|
|
|
|
|
|
|
|
|
|
Total |
|
20,348,270 |
|
83,731,517 |
|
221,787,874 |
|
168,900 |
|
12,014,014 |
|
229,622,460 |
|
63,166,955 |
|
56,702,388 |
|
0 |
|
435,026 |
|
0 |
|
0 |
|
187,436,448 |
|
5,441,483 |
|
3,327,478 |
|
0 |
|
725,551 |
|
79,170,311 |
|
945,753 |
|
1,140,607 |
|
0 |
|
71,132,394 |
|
0 |
|
2,115,457 |
|
1,429,661 |
|
Note 1: Unitary state net operating losses per silo are based on a Tax Sharing Agreement (TSA) view.
Note 2: States that track net operating loss on a pre-apportionment basis are presented with the applicable net operating loss at a post-apportionment amount as of December 31, 2014.
Dex Media
Separate Company State NOL Carryforwards (Post Apportionment, Pre-Tax)
Estimated as of 12/31/14
By Silo |
|
Alabama |
|
Connecticut |
|
Delaware |
|
Florida |
|
Georgia |
|
Indiana |
|
Louisiana |
|
Maryland |
|
Missouri |
|
Mississippi |
|
North Carolina |
|
New Jersey |
|
Ohio |
|
Oklahoma |
|
Pennsylvania |
|
Rhode Island |
|
South Carolina |
|
Tennessee |
|
Virginia |
|
|
|
|
|
|
|
|
|
|
|
|
|
|
|
|
|
|
|
|
|
|
|
|
|
|
|
|
|
|
|
|
|
|
|
|
|
|
|
|
|
R.H. Donnelley, Inc. |
|
|
|
|
|
|
|
8,159,876 |
|
|
|
5,499,761 |
|
|
|
|
|
401 |
|
|
|
603,150,439 |
|
23,884,822 |
|
|
|
|
|
23,736,823 |
|
|
|
1,134,713 |
|
22,814,092 |
|
10,995,200 |
|
Dex Media East, Inc. |
|
|
|
|
|
|
|
167,201 |
|
|
|
|
|
|
|
|
|
|
|
|
|
544,652 |
|
|
|
|
|
|
|
|
|
|
|
|
|
|
|
|
|
Dex Media West, Inc. |
|
|
|
|
|
|
|
|
|
|
|
|
|
|
|
|
|
|
|
|
|
101,230 |
|
|
|
|
|
|
|
|
|
|
|
|
|
|
|
|
|
SuperMedia, Inc. |
|
40,500 |
|
2,218 |
|
129,621 |
|
3,674,042 |
|
27,970 |
|
16,469 |
|
|
|
1,169,633 |
|
12,339 |
|
|
|
|
|
1,059,871 |
|
|
|
|
|
2,101,779 |
|
|
|
60,334 |
|
166,785 |
|
1,514,900 |
|
Parent and Other |
|
|
|
499,696 |
|
|
|
81,817 |
|
|
|
|
|
|
|
|
|
|
|
|
|
27,154,882 |
|
0 |
|
|
|
|
|
63,664 |
|
|
|
|
|
|
|
|
|
|
|
|
|
|
|
|
|
|
|
|
|
|
|
|
|
|
|
|
|
|
|
|
|
|
|
|
|
|
|
|
|
|
|
|
|
|
|
|
|
Total |
|
40,500 |
|
501,914 |
|
129,621 |
|
12,082,937 |
|
27,970 |
|
5,516,230 |
|
|
|
1,169,633 |
|
12,740 |
|
|
|
630,951,203 |
|
24,944,693 |
|
|
|
|
|
25,902,266 |
|
|
|
1,195,047 |
|
22,980,877 |
|
12,510,101 |
|
Note 1: States that track net operating loss on a pre-apportionment basis are presented with the applicable net operating loss at a post-apportionment amount as of December 31, 2014.
Summary of Illustrative Analysis of Dex Media, Inc.s Tax Attributes in the Context of Various Restructuring Scenarios(1)
EXHIBIT 1 - PRE/POST TRANSACTION INTANGIBLE ASSET BASIS REDUCTIONS
|
|
|
|
Pre-Transaction |
|
|
|
Post-Transaction |
| |||
($ in millions) |
|
Silo |
|
Asset Basis (2) |
|
Inc. / (Dec.) |
|
Asset Basis (2) |
| |||
2.00x Scenario (1) |
|
SuperMedia |
|
$ |
135 |
|
$ |
(135 |
) |
$ |
0 |
|
|
RHDI |
|
59 |
|
(12 |
) |
47 |
| ||||
|
Dex East |
|
152 |
|
(100 |
) |
52 |
| ||||
|
Dex West |
|
193 |
|
(143 |
) |
50 |
| ||||
2.25x Scenario (1) |
|
SuperMedia |
|
$ |
135 |
|
$ |
(135 |
) |
$ |
0 |
|
|
RHDI |
|
59 |
|
(9 |
) |
50 |
| ||||
|
Dex East |
|
152 |
|
(81 |
) |
71 |
| ||||
|
Dex West |
|
193 |
|
(119 |
) |
74 |
| ||||
2.50x Scenario (1) |
|
SuperMedia |
|
$ |
135 |
|
$ |
(135 |
) |
$ |
0 |
|
|
RHDI |
|
59 |
|
(7 |
) |
52 |
| ||||
|
Dex East |
|
152 |
|
(62 |
) |
90 |
| ||||
|
Dex West |
|
193 |
|
(97 |
) |
96 |
| ||||
2.75x Scenario (1) |
|
SuperMedia |
|
$ |
135 |
|
$ |
(107 |
) |
$ |
28 |
|
|
RHDI |
|
59 |
|
(4 |
) |
55 |
| ||||
|
Dex East |
|
152 |
|
(40 |
) |
112 |
| ||||
|
Dex West |
|
193 |
|
(69 |
) |
124 |
| ||||
3.00x Scenario (1) |
|
SuperMedia |
|
$ |
135 |
|
$ |
(56 |
) |
$ |
79 |
|
|
RHDI |
|
59 |
|
(1 |
) |
58 |
| ||||
|
Dex East |
|
152 |
|
(19 |
) |
133 |
| ||||
|
Dex West |
|
193 |
|
(42 |
) |
151 |
|
Notes: |
|
(1): Multiples based on 2015E EBITDA of $525mm |
|
|
(2): Only inclusive of asset basis subject to a potential CODI reduction |
(1) The valuation multiples disclosed herein were utilized solely for the basis of understanding potential tax consequences of a restructuring of Dex Media, Inc. These multiples are not intended to provide any stakeholder a valuation of Dex Media, Inc., as a potential valuation is subject to many factors not contemplated in this illustrative analysis. These valuation multiples are not explicitly or implicitly endorsed by the Management of Dex Media, Inc. or its financial, accounting, and legal advisors.
EXHIBIT 2 - PRE/POST TRANSACTION DMI STOCK BASIS REDUCTIONS
|
|
|
|
Pre-Transaction |
|
|
|
Post-Transaction |
| |||
($ in millions) |
|
Silo |
|
DMI Stock Basis (2) |
|
Inc. / (Dec.) |
|
DMI Stock Basis (2) |
| |||
2.00x Scenario (1) |
|
SuperMedia |
|
$ |
(128 |
) |
$ |
0 |
|
$ |
(128 |
) |
|
RHDI |
|
222 |
|
(61 |
) |
161 |
| ||||
|
Dex East |
|
313 |
|
(49 |
) |
264 |
| ||||
|
Dex West |
|
607 |
|
(95 |
) |
512 |
| ||||
2.25x Scenario (1) |
|
SuperMedia |
|
$ |
(65 |
) |
$ |
0 |
|
$ |
(65 |
) |
|
RHDI |
|
250 |
|
(63 |
) |
187 |
| ||||
|
Dex East |
|
333 |
|
(49 |
) |
284 |
| ||||
|
Dex West |
|
629 |
|
(94 |
) |
535 |
| ||||
2.50x Scenario (1) |
|
SuperMedia |
|
$ |
(3 |
) |
$ |
0 |
|
$ |
(3 |
) |
|
RHDI |
|
277 |
|
(65 |
) |
212 |
| ||||
|
Dex East |
|
352 |
|
(50 |
) |
302 |
| ||||
|
Dex West |
|
650 |
|
(93 |
) |
557 |
| ||||
2.75x Scenario (1) |
|
SuperMedia |
|
$ |
59 |
|
$ |
0 |
|
$ |
59 |
|
|
RHDI |
|
305 |
|
(63 |
) |
242 |
| ||||
|
Dex East |
|
372 |
|
(48 |
) |
324 |
| ||||
|
Dex West |
|
672 |
|
(86 |
) |
586 |
| ||||
3.00x Scenario (1) |
|
SuperMedia |
|
$ |
121 |
|
$ |
0 |
|
$ |
121 |
|
|
RHDI |
|
334 |
|
(61 |
) |
273 |
| ||||
|
Dex East |
|
390 |
|
(45 |
) |
345 |
| ||||
|
Dex West |
|
693 |
|
(81 |
) |
612 |
|
Notes: |
|
(1): Multiples based on 2015E EBITDA of $525mm |
|
|
(2): The assets described in this schedule are in addition to those featured in Exhibit 1 |
EXHIBIT 3 ADDITIONAL MISCELLANEOUS PRE/POST TRANSACTION BASIS REDUCTIONS
($ in millions) |
|
Metric |
|
Pre-Transaction (2) |
|
Inc. / (Dec.) |
|
Post-Transaction (2) |
| |||
2.00x Scenario (1) |
|
DMI Basis in Depreciable Prop. |
|
$ |
22 |
|
$ |
(6 |
) |
$ |
16 |
|
|
SPMD Basis in Accounts Rec. |
|
80 |
|
(19 |
) |
61 |
| ||||
|
RHDI Stock Basis in APIL |
|
543 |
|
(108 |
) |
435 |
| ||||
2.25x Scenario (1) |
|
DMI Basis in Depreciable Prop. |
|
$ |
22 |
|
$ |
(5 |
) |
$ |
17 |
|
|
SPMD Basis in Accounts Rec. |
|
80 |
|
(19 |
) |
61 |
| ||||
|
RHDI Stock Basis in APIL |
|
543 |
|
(85 |
) |
458 |
| ||||
2.50x Scenario (1) |
|
DMI Basis in Depreciable Prop. |
|
$ |
22 |
|
$ |
(5 |
) |
$ |
17 |
|
|
SPMD Basis in Accounts Rec. |
|
80 |
|
(19 |
) |
61 |
| ||||
|
RHDI Stock Basis in APIL |
|
543 |
|
(62 |
) |
481 |
| ||||
2.75x Scenario (1) |
|
DMI Basis in Depreciable Prop. |
|
$ |
22 |
|
$ |
(4 |
) |
$ |
18 |
|
|
SPMD Basis in Accounts Rec. |
|
80 |
|
|
|
80 |
| ||||
|
RHDI Stock Basis in APIL |
|
543 |
|
(35 |
) |
508 |
| ||||
3.00x Scenario (1) |
|
DMI Basis in Depreciable Prop. |
|
$ |
22 |
|
$ |
(4 |
) |
$ |
18 |
|
|
SPMD Basis in Accounts Rec. |
|
80 |
|
|
|
80 |
| ||||
|
RHDI Stock Basis in APIL |
|
543 |
|
(9 |
) |
534 |
|
Notes: |
|
(1): Multiples based on 2015E EBITDA of $525mm |
|
|
(2): The assets described in this schedule are in addition to those featured in Exhibit 1 |
EXHIBIT 4 INTANGIBLE ASSET AMORTIZATION PERIOD (DEX EAST & DEX WEST)
($ in millions) |
|
Silo |
|
Asset Amortization Period |
|
2.00x Scenario (1) |
|
Dex East |
|
2 years |
|
|
Dex West |
|
3 years |
| |
2.25x Scenario (1) |
|
Dex East |
|
2 years |
|
|
Dex West |
|
3 years |
| |
2.50x Scenario (1) |
|
Dex East |
|
2 years |
|
|
Dex West |
|
3 years |
| |
2.75x Scenario (1) |
|
Dex East |
|
2 years |
|
|
Dex West |
|
3 years |
| |
3.00x Scenario (1) |
|
Dex East |
|
2 years |
|
|
Dex West |
|
3 years |
|
Notes: |
|
(1): Multiples based on 2015E EBITDA of $525mm |
EXHIBIT 5 RBIG & 382 LIMITATION DETAIL
($ in millions) |
|
Silo |
|
One-time RBIG (2) |
|
Annual RBIG (3) |
|
382 Limitation Yr 1 |
|
382 Limitation Rem. Yrs |
| ||||
2.00x Scenario (1) |
|
SuperMedia |
|
$ |
198 |
|
$ |
19 |
|
$ |
|
|
$ |
|
|
|
RHDI |
|
60 |
|
8 |
|
|
|
|
| |||||
|
Dex East |
|
30 |
|
|
|
|
|
|
| |||||
|
Dex West |
|
45 |
|
|
|
|
|
|
| |||||
|
Consolidated |
|
NA |
|
NA |
|
368 |
|
35 |
| |||||
2.25x Scenario (1) |
|
SuperMedia |
|
$ |
198 |
|
$ |
23 |
|
$ |
|
|
$ |
|
|
|
RHDI |
|
60 |
|
10 |
|
|
|
|
| |||||
|
Dex East |
|
30 |
|
|
|
|
|
|
| |||||
|
Dex West |
|
45 |
|
|
|
|
|
|
| |||||
|
Consolidated |
|
NA |
|
NA |
|
378 |
|
45 |
| |||||
2.50x Scenario (1) |
|
SuperMedia |
|
$ |
198 |
|
$ |
27 |
|
$ |
|
|
$ |
|
|
|
RHDI |
|
60 |
|
12 |
|
|
|
|
| |||||
|
Dex East |
|
30 |
|
|
|
|
|
|
| |||||
|
Dex West |
|
45 |
|
|
|
|
|
|
| |||||
|
Consolidated |
|
NA |
|
NA |
|
388 |
|
54 |
| |||||
2.75x Scenario (1) |
|
SuperMedia |
|
$ |
198 |
|
$ |
31 |
|
$ |
|
|
$ |
|
|
|
RHDI |
|
60 |
|
14 |
|
|
|
|
| |||||
|
Dex East |
|
30 |
|
|
|
|
|
|
| |||||
|
Dex West |
|
45 |
|
|
|
|
|
|
| |||||
|
Consolidated |
|
NA |
|
NA |
|
397 |
|
64 |
| |||||
3.00x Scenario (1) |
|
SuperMedia |
|
$ |
198 |
|
$ |
36 |
|
$ |
|
|
$ |
|
|
|
RHDI |
|
60 |
|
16 |
|
|
|
|
| |||||
|
Dex East |
|
30 |
|
|
|
|
|
|
| |||||
|
Dex West |
|
45 |
|
|
|
|
|
|
| |||||
|
Consolidated |
|
NA |
|
NA |
|
407 |
|
74 |
|
Notes: |
|
(1): Multiples based on 2015E EBITDA of $525mm |
|
|
(2): Occurs in the first year following emergence |
|
|
(3): Occurs in each of the first five years following emergence |
EXHIBIT 6 AMT NOL DETAIL
($ in millions) |
|
3.0x Valuation |
|
2.75x Valuation |
|
2.5x Valuation |
|
2.25x Valuation |
|
2.0x Valuation |
| |||||
Incremental Depreciation Expense - AMTI |
|
|
|
|
|
|
|
|
|
|
| |||||
2016 |
|
$ |
14.2 |
|
$ |
12.2 |
|
$ |
11.0 |
|
$ |
10.8 |
|
$ |
10.6 |
|
2017 |
|
16.7 |
|
15.6 |
|
14.8 |
|
14.7 |
|
14.5 |
| |||||
2018 |
|
18.1 |
|
17.4 |
|
16.9 |
|
16.8 |
|
16.7 |
| |||||
2019 |
|
19.5 |
|
19.0 |
|
18.7 |
|
18.6 |
|
18.5 |
| |||||
2020 |
|
20.3 |
|
20.0 |
|
19.8 |
|
19.7 |
|
19.7 |
| |||||
Incremental Intangible Amortization Expense - AMTI |
|
|
|
|
|
|
|
|
|
|
| |||||
2016 |
|
$ |
115.0 |
|
$ |
96.5 |
|
$ |
77.5 |
|
$ |
62.3 |
|
$ |
46.3 |
|
2017 |
|
105.9 |
|
88.6 |
|
71.0 |
|
56.9 |
|
42.0 |
| |||||
2018 |
|
35.2 |
|
28.2 |
|
21.2 |
|
16.0 |
|
10.5 |
| |||||
2019 |
|
1.1 |
|
0.4 |
|
|
|
|
|
|
| |||||
2020 |
|
1.1 |
|
0.4 |
|
|
|
|
|
|
| |||||
Reduction to Deferred Directory Costs and A/R - AMTI |
|
|
|
|
|
|
|
|
|
|
| |||||
2016 |
|
$ |
(14.7 |
) |
$ |
(20.9 |
) |
$ |
(46.6 |
) |
$ |
(51.9 |
) |
$ |
(57.5 |
) |
2017 |
|
|
|
|
|
|
|
|
|
|
| |||||
2018 |
|
|
|
|
|
|
|
|
|
|
| |||||
2019 |
|
|
|
|
|
|
|
|
|
|
| |||||
2020 |
|
|
|
|
|
|
|
|
|
|
| |||||
Incremental Depreciation Expense - Taxable Income |
|
|
|
|
|
|
|
|
|
|
| |||||
2016 |
|
$ |
14.1 |
|
$ |
12.2 |
|
$ |
10.9 |
|
$ |
10.7 |
|
$ |
10.5 |
|
2017 |
|
16.6 |
|
15.5 |
|
14.8 |
|
14.6 |
|
14.4 |
| |||||
2018 |
|
18.1 |
|
17.4 |
|
16.9 |
|
16.8 |
|
16.7 |
| |||||
2019 |
|
19.5 |
|
19.0 |
|
18.7 |
|
18.6 |
|
18.5 |
| |||||
2020 |
|
20.3 |
|
20.0 |
|
19.8 |
|
19.7 |
|
19.7 |
| |||||
Incremental Intangible Amortization Expense - Taxable Income |
|
|
|
|
|
|
|
|
|
|
| |||||
2016 |
|
$ |
102.1 |
|
$ |
84.4 |
|
$ |
66.2 |
|
$ |
51.8 |
|
$ |
36.7 |
|
2017 |
|
95.0 |
|
78.4 |
|
61.5 |
|
48.1 |
|
33.9 |
| |||||
2018 |
|
35.7 |
|
28.7 |
|
21.9 |
|
16.8 |
|
11.5 |
| |||||
2019 |
|
1.1 |
|
0.4 |
|
|
|
|
|
|
| |||||
2020 |
|
1.1 |
|
0.4 |
|
|
|
|
|
|
| |||||
Reduction to Deferred Directory Costs and A/R - Taxable Income |
|
|
|
|
|
|
|
|
|
|
| |||||
2016 |
|
$ |
(6.4 |
) |
$ |
(12.6 |
) |
$ |
(38.4 |
) |
$ |
(43.7 |
) |
$ |
(49.2 |
) |
2017 |
|
|
|
|
|
|
|
|
|
|
| |||||
2018 |
|
|
|
|
|
|
|
|
|
|
| |||||
2019 |
|
|
|
|
|
|
|
|
|
|
| |||||
2020 |
|
|
|
|
|
|
|
|
|
|
| |||||
|
|
|
|
|
|
|
|
|
|
|
| |||||
Starting RHDI NOL Balance |
|
$ |
534.2 |
|
$ |
508.3 |
|
$ |
478.4 |
|
$ |
393.3 |
|
$ |
307.0 |
|
Starting AMT NOL Balance |
|
294.5 |
|
267.7 |
|
237.3 |
|
152.3 |
|
65.7 |
|
Notes: |
|
(1): Multiples based on 2015E EBITDA of $525mm |
Appendix
Q4 2014 Selected Financial Data
Dex Media East, Inc.
Reconciliation of Non-GAAP Measures Directly Attributable Contribution Margin
For the Three and Twelve Months Ended December 31, 2014
($ millions)
Q4 2014 |
|
|
|
Margin |
|
Digital |
|
Margin |
|
Total |
| |||
Revenue - Amortized |
|
$ |
41 |
|
|
|
$ |
19 |
|
|
|
$ |
60 |
|
Less: Directly Attributable Costs |
|
$ |
7 |
|
|
|
$ |
8 |
|
|
|
$ |
15 |
|
Directly Attributable Contribution Margin |
|
$ |
34 |
|
82.9 |
% |
$ |
11 |
|
57.9 |
% |
$ |
45 |
|
Reconciliation to GAAP |
|
|
| |
|
|
|
| |
Directly Attributable Contribution Margin |
|
$ |
45 |
|
|
|
|
| |
Other Costs Not Included Above in Directly Attributable Costs |
|
25 |
| |
Depreciation and amortization |
|
32 |
| |
Total costs not included above |
|
$ |
57 |
|
|
|
|
| |
GAAP Operating income (loss) |
|
$ |
(12 |
) |
|
|
|
| |
Operating income (loss) margin |
|
-20.0 |
% |
YTD December 2014 |
|
|
|
Margin |
|
Digital |
|
Margin |
|
Total |
| |||
Revenue - Amortized |
|
$ |
175 |
|
|
|
$ |
77 |
|
|
|
$ |
252 |
|
Less: Directly Attributable Costs |
|
$ |
30 |
|
|
|
$ |
32 |
|
|
|
$ |
62 |
|
Directly Attributable Contribution Margin |
|
$ |
145 |
|
82.9 |
% |
$ |
45 |
|
58.4 |
% |
$ |
190 |
|
Reconciliation to GAAP |
|
|
| |
|
|
|
| |
Directly Attributable Contribution Margin |
|
$ |
190 |
|
|
|
|
| |
Other Costs Not Included Above in Directly Attributable Costs |
|
92 |
| |
Depreciation and amortization |
|
130 |
| |
Total costs not included above |
|
$ |
222 |
|
|
|
|
| |
GAAP Operating income (loss) |
|
$ |
(32 |
) |
|
|
|
| |
Operating income (loss) margin |
|
-12.7 |
% |
Q4 2014 Selected Financial Data
Dex Media West, Inc.
Reconciliation of Non-GAAP Measures Directly Attributable Contribution Margin
For the Three and Twelve Months Ended December 31, 2014
($ millions)
Q4 2014 |
|
|
|
Margin |
|
Digital |
|
Margin |
|
Total |
| |||
Revenue - Amortized |
|
$ |
45 |
|
|
|
$ |
20 |
|
|
|
$ |
65 |
|
Less: Directly Attributable Costs |
|
$ |
9 |
|
|
|
$ |
8 |
|
|
|
$ |
17 |
|
Directly Attributable Contribution Margin |
|
$ |
36 |
|
80.0 |
% |
$ |
12 |
|
60.0 |
% |
$ |
48 |
|
Reconciliation to GAAP |
|
|
| |
|
|
|
| |
Directly Attributable Contribution Margin |
|
$ |
48 |
|
|
|
|
| |
Other Costs Not Included Above in Directly Attributable Costs |
|
30 |
| |
Depreciation and amortization |
|
40 |
| |
Total costs not included above |
|
$ |
70 |
|
|
|
|
| |
GAAP Operating income (loss) |
|
$ |
(22 |
) |
|
|
|
| |
Operating income (loss) margin |
|
-33.8 |
% |
YTD December 2014 |
|
|
|
Margin |
|
Digital |
|
Margin |
|
Total |
| |||
Revenue - Amortized |
|
$ |
192 |
|
|
|
$ |
85 |
|
|
|
$ |
277 |
|
Less: Directly Attributable Costs |
|
$ |
34 |
|
|
|
$ |
37 |
|
|
|
$ |
71 |
|
Directly Attributable Contribution Margin |
|
$ |
158 |
|
82.3 |
% |
$ |
48 |
|
56.5 |
% |
$ |
206 |
|
Reconciliation to GAAP |
|
|
| |
|
|
|
| |
Directly Attributable Contribution Margin |
|
$ |
206 |
|
|
|
|
| |
Other Costs Not Included Above in Directly Attributable Costs |
|
106 |
| |
Depreciation and amortization |
|
160 |
| |
Total costs not included above |
|
$ |
266 |
|
|
|
|
| |
GAAP Operating income (loss) |
|
$ |
(60 |
) |
|
|
|
| |
Operating income (loss) margin |
|
-21.7 |
% |
Q4 2014 Selected Financial Data
R.H. Donnelley Inc.
Reconciliation of Non-GAAP Measures Directly Attributable Contribution Margin
For the Three and Twelve Months Ended December 31, 2014
($ millions)
Q4 2014 |
|
|
|
Margin |
|
Digital |
|
Margin |
|
Total |
| |||
Revenue - Amortized |
|
$ |
60 |
|
|
|
$ |
32 |
|
|
|
$ |
92 |
|
Less: Directly Attributable Costs |
|
$ |
11 |
|
|
|
$ |
12 |
|
|
|
$ |
23 |
|
Directly Attributable Contribution Margin |
|
$ |
49 |
|
81.7 |
% |
$ |
20 |
|
62.5 |
% |
$ |
69 |
|
Reconciliation to GAAP |
|
|
| |
|
|
|
| |
Directly Attributable Contribution Margin |
|
$ |
69 |
|
|
|
|
| |
Other Costs Not Included Above in Directly Attributable Costs |
|
43 |
| |
Depreciation and amortization |
|
29 |
| |
Total costs not included above |
|
$ |
72 |
|
|
|
|
| |
GAAP Operating income (loss) |
|
$ |
(3 |
) |
|
|
|
| |
Operating income (loss) margin |
|
-3.3 |
% |
YTD December 2014 |
|
|
|
Margin |
|
Digital |
|
Margin |
|
Total |
| |||
Revenue - Amortized |
|
$ |
259 |
|
|
|
$ |
130 |
|
|
|
$ |
389 |
|
Less: Directly Attributable Costs |
|
$ |
49 |
|
|
|
$ |
53 |
|
|
|
$ |
102 |
|
Directly Attributable Contribution Margin |
|
$ |
211 |
|
81.5 |
% |
$ |
77 |
|
59.2 |
% |
$ |
288 |
|
Reconciliation to GAAP |
|
|
| |
|
|
|
| |
Directly Attributable Contribution Margin |
|
$ |
288 |
|
|
|
|
| |
Other Costs Not Included Above in Directly Attributable Costs |
|
153 |
| |
Depreciation and amortization |
|
117 |
| |
Total costs not included above |
|
$ |
270 |
|
|
|
|
| |
GAAP Operating income (loss) |
|
$ |
18 |
|
|
|
|
| |
Operating income (loss) margin |
|
4.6 |
% |
Q1 2015 Selected Financial Data
Dex Media East, Inc. |
|
Reconciliation of Non-GAAP Measures Directly Attributable Contribution Margin |
|
For the Quarter Ended March 31, 2015 |
|
($ millions) |
|
Q1 2015 |
|
|
|
Margin |
|
Digital |
|
Margin |
|
Total |
| |||
Revenue - Amortized |
|
$ |
38 |
|
|
|
$ |
19 |
|
|
|
$ |
57 |
|
Less: Directly Attributable Costs |
|
$ |
7 |
|
|
|
$ |
10 |
|
|
|
$ |
17 |
|
Directly Attributable Contribution Margin |
|
$ |
31 |
|
81.6 |
% |
$ |
9 |
|
47.4 |
% |
$ |
40 |
|
Reconciliation to GAAP |
|
|
| |
|
|
|
| |
Directly Attributable Contribution Margin |
|
$ |
40 |
|
|
|
|
| |
Other Costs Not Included Above in Directly Attributable Costs |
|
21 |
| |
Depreciation and amortization |
|
22 |
| |
Total costs not included above |
|
$ |
43 |
|
|
|
|
| |
GAAP Operating income (loss) |
|
$ |
(3 |
) |
|
|
|
| |
Operating income (loss) margin |
|
-5.3 |
% |
Q1 2015 Selected Financial Data
Dex Media West, Inc. |
|
Reconciliation of Non-GAAP Measures Directly Attributable Contribution Margin |
|
For the Quarter Ended March 31, 2015 |
|
($ millions) |
|
Q1 2015 |
|
|
|
Margin |
|
Digital |
|
Margin |
|
Total |
| |||
Revenue - Amortized |
|
$ |
41 |
|
|
|
$ |
20 |
|
|
|
$ |
61 |
|
Less: Directly Attributable Costs |
|
$ |
7 |
|
|
|
$ |
10 |
|
|
|
$ |
17 |
|
Directly Attributable Contribution Margin |
|
$ |
34 |
|
82.9 |
% |
$ |
10 |
|
50.0 |
% |
$ |
44 |
|
Reconciliation to GAAP |
|
|
| |
|
|
|
| |
Directly Attributable Contribution Margin |
|
$ |
44 |
|
|
|
|
| |
Other Costs Not Included Above in Directly Attributable Costs |
|
23 |
| |
Depreciation and amortization |
|
28 |
| |
Total costs not included above |
|
$ |
51 |
|
|
|
|
| |
GAAP Operating income (loss) |
|
$ |
(7 |
) |
|
|
|
| |
Operating income (loss) margin |
|
-11.5 |
% |
Q1 2015 Selected Financial Data
R.H. Donnelley Inc.
Reconciliation of Non-GAAP Measures Directly Attributable Contribution Margin
For the Quarter Ended March 31, 2015
($ millions)
Q1 2015 |
|
|
|
Margin |
|
Digital |
|
Margin |
|
Total |
| |||
Revenue - Amortized |
|
$ |
55 |
|
|
|
$ |
31 |
|
|
|
$ |
86 |
|
Less: Directly Attributable Costs |
|
$ |
9 |
|
|
|
$ |
14 |
|
|
|
$ |
23 |
|
Directly Attributable Contribution Margin |
|
$ |
46 |
|
83.6 |
% |
$ |
17 |
|
54.8 |
% |
$ |
63 |
|
Reconciliation to GAAP |
|
|
| |
|
|
|
| |
Directly Attributable Contribution Margin |
|
$ |
63 |
|
|
|
|
| |
Other Costs Not Included Above in Directly Attributable Costs |
|
30 |
| |
Depreciation and amortization |
|
20 |
| |
Total costs not included above |
|
$ |
50 |
|
|
|
|
| |
GAAP Operating income (loss) |
|
$ |
13 |
|
|
|
|
| |
Operating income (loss) margin |
|
15.1 |
% |
Q1 2015 Selected Financial Data
SuperMedia, Inc.
Reconciliation of Non-GAAP Measures Directly Attributable Contribution Margin
For the Quarter Ended March 31, 2015
($ millions)
Q1 2015 |
|
|
|
Margin |
|
Digital |
|
Margin |
|
Total |
| |||
Revenue - Amortized |
|
$ |
139 |
|
|
|
$ |
62 |
|
|
|
$ |
201 |
|
Less: Directly Attributable Costs |
|
$ |
26 |
|
|
|
$ |
34 |
|
|
|
$ |
60 |
|
Directly Attributable Contribution Margin |
|
$ |
113 |
|
81.2 |
% |
$ |
28 |
|
45.2 |
% |
$ |
141 |
|
Reconciliation to GAAP |
|
|
| |
Revenue per Contribution Margin |
|
$ |
201 |
|
Revenue not included in above |
|
1 |
| |
GAAP Revenue |
|
$ |
202 |
|
|
|
|
| |
Directly Attributable Contribution Margin |
|
$ |
142 |
|
|
|
|
| |
Other Costs Not Included Above in Directly Attributable Costs |
|
78 |
| |
Depreciation and amortization |
|
36 |
| |
Total costs not included above |
|
$ |
114 |
|
|
|
|
| |
GAAP Operating income (loss) |
|
$ |
28 |
|
|
|
|
| |
Operating income (loss) margin |
|
13.9 |
% |
Q2 2015 Selected Financial Data
Dex Media East, Inc.
Reconciliation of Non-GAAP Measures Directly Attributable Contribution Margin
For the Three and Six Months Ended June 30, 2015
($ millions)
Q2 2015 |
|
|
|
Margin |
|
Digital |
|
Margin |
|
Total |
| |||
Revenue - Amortized |
|
$ |
36 |
|
|
|
$ |
18 |
|
|
|
$ |
54 |
|
Less: Directly Attributable Costs |
|
$ |
6 |
|
|
|
$ |
9 |
|
|
|
$ |
15 |
|
Directly Attributable Contribution Margin |
|
$ |
30 |
|
83.3 |
% |
$ |
9 |
|
50.0 |
% |
$ |
39 |
|
Reconciliation to GAAP |
|
|
| |
|
|
|
| |
Directly Attributable Contribution Margin |
|
$ |
39 |
|
|
|
|
| |
Other Costs Not Included Above in Directly Attributable Costs |
|
19 |
| |
Depreciation and amortization |
|
22 |
| |
Total costs not included above |
|
$ |
41 |
|
|
|
|
| |
GAAP Operating income (loss) |
|
$ |
(2 |
) |
|
|
|
| |
Operating income (loss) margin |
|
-3.7 |
% |
YTD June 2015 |
|
|
|
Margin |
|
Digital |
|
Margin |
|
Total |
| |||
Revenue - Amortized |
|
$ |
74 |
|
|
|
$ |
37 |
|
|
|
$ |
111 |
|
Less: Directly Attributable Costs |
|
$ |
13 |
|
|
|
$ |
19 |
|
|
|
$ |
32 |
|
Directly Attributable Contribution Margin |
|
$ |
61 |
|
82.4 |
% |
$ |
18 |
|
48.6 |
% |
$ |
79 |
|
Reconciliation to GAAP |
|
|
| |
|
|
|
| |
Directly Attributable Contribution Margin |
|
$ |
79 |
|
|
|
|
| |
Other Costs Not Included Above in Directly Attributable Costs |
|
40 |
| |
Depreciation and amortization |
|
44 |
| |
Total costs not included above |
|
$ |
84 |
|
|
|
|
| |
GAAP Operating income (loss) |
|
$ |
(5 |
) |
|
|
|
| |
Operating income (loss) margin |
|
-4.5 |
% |
Q2 2015 Selected Financial Data
Dex Media West, Inc.
Reconciliation of Non-GAAP Measures Directly Attributable Contribution Margin
For the Three and Six Months Ended June 30, 2015
($ millions)
Q2 2015 |
|
|
|
Margin |
|
Digital |
|
Margin |
|
Total |
| |||
Revenue - Amortized |
|
$ |
39 |
|
|
|
$ |
20 |
|
|
|
$ |
59 |
|
Less: Directly Attributable Costs |
|
$ |
7 |
|
|
|
$ |
9 |
|
|
|
$ |
16 |
|
Directly Attributable Contribution Margin |
|
$ |
32 |
|
82.1 |
% |
$ |
11 |
|
55.0 |
% |
$ |
43 |
|
Reconciliation to GAAP |
|
|
| |
|
|
|
| |
Directly Attributable Contribution Margin |
|
$ |
43 |
|
|
|
|
| |
Other Costs Not Included Above in Directly Attributable Costs |
|
21 |
| |
Depreciation and amortization |
|
25 |
| |
Total costs not included above |
|
$ |
46 |
|
|
|
|
| |
GAAP Operating income (loss) |
|
$ |
(3 |
) |
|
|
|
| |
Operating income (loss) margin |
|
-5.1 |
% |
YTD June 2015 |
|
|
|
Margin |
|
Digital |
|
Margin |
|
Total |
| |||
Revenue - Amortized |
|
$ |
80 |
|
|
|
$ |
40 |
|
|
|
$ |
120 |
|
Less: Directly Attributable Costs |
|
$ |
14 |
|
|
|
$ |
19 |
|
|
|
$ |
33 |
|
Directly Attributable Contribution Margin |
|
$ |
66 |
|
82.5 |
% |
$ |
21 |
|
52.5 |
% |
$ |
87 |
|
Reconciliation to GAAP |
|
|
| |
|
|
|
| |
Directly Attributable Contribution Margin |
|
$ |
87 |
|
|
|
|
| |
Other Costs Not Included Above in Directly Attributable Costs |
|
44 |
| |
Depreciation and amortization |
|
53 |
| |
Total costs not included above |
|
$ |
97 |
|
|
|
|
| |
GAAP Operating income (loss) |
|
$ |
(10 |
) |
|
|
|
| |
Operating income (loss) margin |
|
-8.3 |
% |
Q2 2015 Selected Financial Data
R.H. Donnelley Inc.
Reconciliation of Non-GAAP Measures Directly Attributable Contribution Margin
For the Three and Six Months Ended June 30, 2015
($ millions)
Q2 2015 |
|
|
|
Margin |
|
Digital |
|
Margin |
|
Total |
| |||
Revenue - Amortized |
|
$ |
52 |
|
|
|
$ |
32 |
|
|
|
$ |
84 |
|
Less: Directly Attributable Costs |
|
$ |
8 |
|
|
|
$ |
14 |
|
|
|
$ |
22 |
|
Directly Attributable Contribution Margin |
|
$ |
44 |
|
84.6 |
% |
$ |
18 |
|
56.3 |
% |
$ |
62 |
|
Reconciliation to GAAP |
|
|
| |
|
|
|
| |
Directly Attributable Contribution Margin |
|
$ |
62 |
|
|
|
|
| |
Other Costs Not Included Above in Directly Attributable Costs |
|
29 |
| |
Depreciation and amortization |
|
19 |
| |
Total costs not included above |
|
$ |
48 |
|
|
|
|
| |
GAAP Operating income (loss) |
|
$ |
14 |
|
|
|
|
| |
Operating income (loss) margin |
|
16.7 |
% |
YTD June 2015 |
|
|
|
Margin |
|
Digital |
|
Margin |
|
Total |
| |||
Revenue - Amortized |
|
$ |
108 |
|
|
|
$ |
62 |
|
|
|
$ |
170 |
|
Less: Directly Attributable Costs |
|
$ |
18 |
|
|
|
$ |
27 |
|
|
|
$ |
45 |
|
Directly Attributable Contribution Margin |
|
$ |
90 |
|
83.3 |
% |
$ |
35 |
|
56.5 |
% |
$ |
125 |
|
Reconciliation to GAAP |
|
|
| |
|
|
|
| |
Directly Attributable Contribution Margin |
|
$ |
125 |
|
|
|
|
| |
Other Costs Not Included Above in Directly Attributable Costs |
|
59 |
| |
Depreciation and amortization |
|
39 |
| |
Total costs not included above |
|
$ |
98 |
|
|
|
|
| |
GAAP Operating income (loss) |
|
$ |
27 |
|
|
|
|
| |
Operating income (loss) margin |
|
15.9 |
% |
R.H. Donnelley Inc.
Reconciliation of Non-GAAP Measures for
Financial Covenant Calculations
December 31, 2014
($ Millions)
|
|
1Q14 |
|
2Q14 |
|
3Q14 |
|
4Q14 |
|
Total |
| |||||
Consolidated EBITDA from Financial Covenant Calculations |
|
$ |
35.6 |
|
$ |
37.9 |
|
$ |
36.0 |
|
$ |
34.7 |
|
$ |
144.3 |
|
Reconciliation to GAAP Operating Income |
|
|
|
|
|
|
|
|
|
|
| |||||
Subtract Depreciation and Amortization |
|
(29.4 |
) |
(29.2 |
) |
(29.1 |
) |
(29.0 |
) |
(116.7 |
) | |||||
Subtract Extraordinary charges or non-cash charges |
|
(0.1 |
) |
(0.1 |
) |
(0.1 |
) |
(8.4 |
) |
(8.8 |
) | |||||
Operating Income GAAP |
|
$ |
6.1 |
|
$ |
8.5 |
|
$ |
6.7 |
|
$ |
(2.6 |
) |
$ |
18.7 |
|
R.H. Donnelley Inc.
Reconciliation of Non-GAAP Measures for
Financial Covenant Calculations
March 31, 2015
($ Millions)
|
|
2Q14 |
|
3Q14 |
|
4Q14 |
|
1Q15 |
|
Total |
| |||||
Consolidated EBITDA from Financial Covenant Calculations |
|
$ |
37.9 |
|
$ |
36.0 |
|
$ |
34.7 |
|
$ |
30.7 |
|
$ |
139.3 |
|
Reconciliation to GAAP Operating Income |
|
|
|
|
|
|
|
|
|
|
| |||||
Subtract Depreciation and Amortization |
|
(29.2 |
) |
(29.1 |
) |
(29.0 |
) |
(20.1 |
) |
(107.4 |
) | |||||
Subtract Customer Late Fees in Interest |
|
|
|
|
|
|
|
(0.3 |
) |
(0.3 |
) | |||||
Subtract Extraordinary charges or non-cash charges |
|
(0.1 |
) |
(0.1 |
) |
(8.4 |
) |
3.2 |
|
(5.5 |
) | |||||
Operating Income GAAP |
|
$ |
8.5 |
|
$ |
6.7 |
|
$ |
(2.6 |
) |
$ |
13.4 |
|
$ |
26.1 |
|
,8XV]CSU MKLM$\1Z9XBA>72[I9Q'C> ""A/3(-8.+6YTJ<7HF:E%1RS1P0O+,ZQQH-S,Q MP /4FJVFZO8ZQ \VG74=S$CF-FC.0&':I*+M%)FB@!:*** "BBB@ HHHH ** M** "BBB@ IDW^HD_W3_*GTR;_42?[I_E0!P_P;_Y)_#_ -?,W_H5=W7"?!O_ M ))_#_U\S?\ H5=W0!3?5K*-V1[E RG!'H:;_;-A_P _4?ZURE]_Q_W'_71O MYU!0!V7]LV'_ #]1_K1_;-A_S]1_K7&T4 =E_;-A_P _4?ZTY-6LI'5$N4+, M< #N:XNK%A_R$;;_ *Z+_.@#N**2L^XURRM=473II2MRT#7 &.-B]3G^E &C M15.RU6TOHH'AF7=/$)DC8@.4(R#MZU3UGQ/8Z'/'#=+(\;2[8(6DVHO5FQ MT'- &Q16>FMV+/C[0BIY:2"5B%0A\[<,>YQTIXU>P-U-;?:X!- %:52X^0-G M&?K@T 7:*R7\2Z;'>QVLDX5Y7*(QX1B%#'#=,8(_.M![N",L'FB4J0"&<#!/ M04 345FP>(-.N=K0W*/"4:3S@1Y8"MM.6Z#FK3W]K$J-)
G6HY-2MH;QK>60(RH)"S\* 3@#/KP>* +=
M%4[S5+2QTR34)YE%K&N\R+\P([8QUJE:>*M,ND4M,UO(TPM_)N$, O'/X5YG79"2DKHX*D
M7&5F%%%%60%%%% !1110!J>'O$-[X:U-+VQ?VDB8_+*O]T_X]JZ76?#=AXFL
MYM=\)$95=]WIN/GB8]2H]/;\O2N&J]HVLWN@ZE'?:?*8YDZCLX[J1W%1*/5;
MFD9+:6Q1HKOM2T33_'%M+J_AG9#J:IYEYIG0D]V3_//L:X)E*L58$,#@@C!!
MIQE<4HJ:'H
MAFT>P>ZG;(+@;A ,?>([UT$\ODP228SL4MCUP*\)U+XJ>(;]YQ#+#;6\H*B)
M(P2H(Q]X\YJX0
[V"BBBM#(**** "M;PMJ\6A>)++4;B(RQ0/EE7K@@
MC(]QFLFBDU=6&G9W1[NEQI6O+
<%%%% !
M1110 5K^&_$ESX8OY+FVBAF$L1BDBF&493SS^59%%)I-68TVG='JGA/Q9=^+
M+C5HO$"VLNE0V[7$EMY.2JCLI]O?FO+92C2NT0(C+$H#V&>/TKMTE7PQ\,$D
MMW(OM>=@TBC[L*\%<]O_ *YKAJSIK5M&M1NR3W"BBBM3$* I8A0"2> !WHKO
M/ /AF.%%\4:YY4>E6VYT#Y+.PZ, .H!J92Y5
*"6M90!U.VH6MYD&6AD ]2IH CHI2".H(^HJQI]F;^Z$0;:H!9F
MQG % $4*>9/&G]Y@.?K7=J J@ 8 X KD]$DTG4+N.YTK5(9UC;YHV.'&.#QU
M_2NL% 7N+1110 4444 %%%% !1110 4444 %%%% !1110 4444 %%%% !111
M0 4444 %%%% !1110 4444 %>=_'#_DGY_Z^X_\ V:O1*\[^.'_)/S_U]Q_^
MS4 >"4444 >PZ#_R<1K'_7%O_0$KUZO(=!_Y.(UC_KBW_H"5Z]0 4444 %%%
M% !1110 4444 %%%% !1110 4444 %%%% !1110 4444 %%%% !1110 4444
M %%%% !1110 4444 %%%% !1110 4444 %%%% !2, 000"#U!I:* /FSQ=HL
MF@>)KVS="(_,+PMMP&0G(Q],X_"L:O4/C9;.+O2;GCRRDD?XY!KR^NZG*\4S
MSJL>63044459F%%)4LMM/!%'+-!+''*-R.R$!AZ@]^E*X6(Z*3(]12TP"BBB
M@ HHHH **** "BBB@ HHHH **** "BBB@ KV_3X?LG@C0H/DSY&\F/[ASSU]
M>>?QKQ%59V"J"S,< #J37N-O:2Z3X5TC3+I]UU;Q9D'79GHOX=/PKGK[(ZL-
MNR&BBBN8ZPHHI: $HHHH *U=(=+F.33YEW+)ET/]U@*RJW?#^G+(1>-)DHQ
M0=OK0!2M-%N;RV,L90$,5VL<9QUJZ?##^1D3@R\<8^6NA0K@[<<'G'K3J .-
M\2>";C7O#UOIZW,44D%QYV64E7'/'MUJ;XA:#
=_923DX[\"N/- 'TW_ ,+9\'_]!=?^_,G_
M ,31_P +9\'_ /077_OS)_\ $U\R44 ?3?\ PMGP?_T%U_[\R?\ Q-'_ MG
MP?\ ]!=?^_,G_P 37S)10!]-_P#"V?!__077_OS)_P#$T?\ "V?!_P#T%U_[
M\R?_ !-?,E% 'TW_ ,+9\'_]!=?^_,G_ ,31_P +9\'_ /077_OS)_\ $U\R
M44 ?3?\ PMGP?_T%U_[\R?\ Q-'_ MGP?\ ]!=?^_,G_P 37S)10!]-_P#"
MV?!__077_OS)_P#$T?\ "V?!_P#T%U_[\R?_ !-?,E% 'TW_ ,+9\'_]!=?^
M_,G_ ,31_P +9\'_ /077_OS)_\ $U\R44 ?3?\ PMGP?_T%U_[\R?\ Q-'_
M MGP?\ ]!=?^_,G_P 37S)10!]-_P#"V?!__077_OS)_P#$U
^*@ $,:>JLT# ('ZV!<&D4&!>!$D7O4H)@GQW6]X^=/=$1BHG#&(L'THJ\0,,DB_
M$P(0"N\KB!T2J#\9B,Z#1^Q*(%"POA&4@'P@N\026. "*E)Q!1%< 15;X((M
M%@%U!CM$"O!7@BE6D04J -[]3#"'Y2S!!&\T 0E/=L$=EJ %,'@!#*R81AZF
M@'8%P9W\EH!$0G)E#B60GQ]%)@E'/**1CWC$&4R001&@P ^.A&0CO^>O.MPO
M!7_ I", B.+A9<@:_V 19\?A9@/A8T%T% 0A> ON9OP8#JU2!L
M@1#< "NR8@X(017$ 2-4LU4- A;D@ =T@ T(P1JHV>5G?NA37"2<_N<(%Z=6>"%3RAQ"2M@Q%2@.#^$J @!G2(+%6(R\/C9L2SZLM=:#%Q2!X.
M]2)W0,*,@S>"%"A!$!EQ\'Y10(=)D.$%*B[!"^[ 6;K]88GK,\&6M3*)*,Q6
MA/63GPKXAY$: MD+4&!N$ZMY C9>Q Z?M:'NO(@\^M7A*]Y#!<%:\8CF4!@PA8,(8ZG(&NB1A#%.CP"#&,
MP 5G:.H94% "+U0B$&"(PAPJ\8@SR.$1=C #(NQPACEXP<>8\,,7O, "%F3W
M(U0P@!"02(@,-(!_#PG$"DKP!#O,P0^8J,0W.YTE+@^ $:P $;5$ !#:@"&\4 _4?8
M'@5S@$$)EL "$\R!"":H,NM)8(;^0R3B!?DF @G&X&TPS'X&9* Y%!(!"D3
M"*++"YQ !)Q #M/(B[!!CC@>;K '+ >3ZB$AA/#@2A!5#N#(;/"4Q@!H3.
M!0(A*Q)!_9!L#(J !43@"/P@[R#O!%@@$.S !%Y@"4J@")X@]J2O\!["#I#@
M!4I@!?R@"$;@"\ @X*( ^NY !5;@#%A@!0+A")(K_%1+(JI ;_W,__WA3_R@[_U#2( #$+TD]_Q?[_Y"<+Y9Z,@E)\@
M2C_YEU_ZHY_Z0Y_ZN3_ZJ[_ZO]_^^Z&?_,<_^D$%_+%_^\N?_5_?_-U?_-6?
M^Y4?\M?__-_?_L=?^L5?_*\?_@%B0( PH*-#APH,!14*),@0(<2&"Q\N
MG-@08P %S4BK.B08L:)&".6#/F08$*/'3NJ3-C2HDF# &!^C"DR)4N9#D_N
MS'@19$F9.8'>E!B3)-*107&FU)GT:$^;18E&-)J1(]:93J
P5HN^40L=$"X-/QE0WD]/&AU9UP\
ML,$:++R41?,](<$4.L"[4T<(? 82')C!)B-- ^B5N=)]EZ3 PM4#A%0=H44Q
MSG7$P_$ T$HNF9")'D-FV5HJ+%@(.C!GHM" 03AY/_!\H1Q8W<8[8,P0.:#)
M;\/)8L*!@US*[Q+-R@8&X^()"82ZS%R?W %0W94KC0 R -3 G,%0>MD0\P0*
M@;PW%4!RY!((RE-Q%C:3@V9ILTEI%=:9%:(A*5P2_8PA0/C/<'&T6[ (:Y8)
M@P $$0 M#9 %CN":@G NPM((E&ST1S%5E;'""W-"!O0
M814@9X[0"/+99P\0!(7 7YZP"%E ='M IZN*E
MC29$X258LBH'Z1J$05T9+CTZCN,\^N!,V$(P5$_>O8(X;N/+LX(V;C@P0^,7
MV4+$VD(ZOLIH,C]2#BVH\D)"FQ+[X^2.=11 ;K0IA.7E+>-H[B(=0MK=T^4+
ML3<"U,+WP4&7'.>_X<]OCA6>W$K^=LX0?0XM>YXO;VZR:5X1;%[H QW:B#X;
MAVXTAC7F2MGHI&%\^J(=F2'IG0)AB_Y@48+I-3'I3[GIHHYH(KM\,JX>D&X1
MGC[JO;'J#>;J9!%ARXCP^Y@1\Z42@+GHXLS5(+LJ"[KM&X5O-GLAGYHWJ[JSA'L,1'N
M>%XF5VWJ':81(E+I$6*T0K/MOC$C+&(AF:[JU*[FI&'NE1&Z_$X;Y"[OBDXA
M,E&Z0)+O?N[H.1+PLN'K<>'I[OY1ZRUJX1$C_H([*;"-_PE!S)Y][Q,Q'K
M$\(<#/_^\7CQ(STN\.EN)0GOY