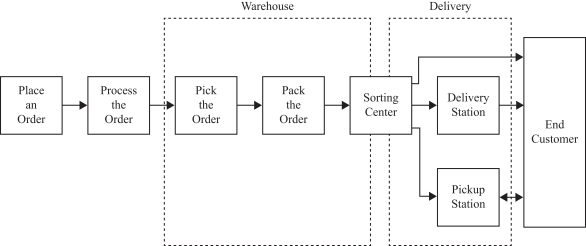
REGISTRATION STATEMENT PURSUANT TO SECTION 12(b) OR 12(g) OF THE SECURITIES EXCHANGE ACT OF 1934 |
ANNUAL REPORT PURSUANT TO SECTION 13 OR 15(d) OF THE SECURITIES EXCHANGE ACT OF 1934 For the fiscal year ended |
TRANSITION REPORT PURSUANT TO SECTION 13 OR 15(d) OF THE SECURITIES EXCHANGE ACT OF 1934 |
SHELL COMPANY REPORT PURSUANT TO SECTION 13 OR 15(d) OF THE SECURITIES EXCHANGE ACT OF 1934 |
Title of Each Class |
Trading Symbol(s) |
Name of Each Exchange On Which Registered | ||
depositary share representing two Class A ordinary shares, par value US$0.00002 per share) |
(The Nasdaq Global Select Market) | |||
US$0.00002 per share |
The Stock Exchange of Hong Kong Limited |
☒ | Accelerated filer | ☐ | ||||
Non-accelerated filer |
☐ | Emerging growth company |
† | The term “new or revised financial accounting standard” refers to any update issued by the Financial Accounting Standards Board to its Accounting Standards Codification after April 5, 2012. |
International Financial Reporting Standards as issued by the International Accounting Standards Board ☐ |
Other ☐ |
1 |
||||||
5 |
||||||
6 |
||||||
Item 1. |
6 |
|||||
Item 2. |
6 |
|||||
Item 3. |
6 |
|||||
Item 4. |
78 |
|||||
Item 4A. |
133 |
|||||
Item 5. |
133 |
|||||
Item 6. |
155 |
|||||
Item 7. |
165 |
|||||
Item 8. |
169 |
|||||
Item 9. |
171 |
|||||
Item 10. |
171 |
|||||
Item 11. |
183 |
|||||
Item 12. |
184 |
|||||
189 |
||||||
Item 13. |
189 |
|||||
Item 14. |
189 |
|||||
Item 15. |
189 |
|||||
Item 16A. |
190 |
|||||
Item 16B. |
190 |
|||||
Item 16C. |
190 |
|||||
Item 16D. |
190 |
|||||
Item 16E. |
191 |
|||||
Item 16F. |
191 |
|||||
Item 16G. |
191 |
|||||
Item 16H. |
191 |
|||||
Item 16I. |
192 |
|||||
193 |
||||||
Item 17. |
193 |
|||||
Item 18. |
193 |
|||||
Item 19. |
194 |
|||||
202 |
• | “ADSs” are to our American depositary shares, each of which represents two Class A ordinary shares; |
• | “annual active customer accounts” are to customer accounts that made at least one purchase during the twelve months ended on the respective dates, including both online retail and online marketplace; |
• | “CCASS” are to the Central Clearing and Settlement System established and operated by Hong Kong Securities Clearing Company Limited, a wholly-owned subsidiary of Hong Kong Exchange and Clearing Limited; |
• | “China” or the “PRC” are to the People’s Republic of China, excluding, for the purposes of this annual report only, Hong Kong, Macau and Taiwan; |
• | “Companies (WUMP) Ordinance” are to the Companies (Winding Up and Miscellaneous Provisions) Ordinance (Chapter 32 of the Laws of Hong Kong), as amended or supplemented from time to time; |
• | “CSRC” are to the China Securities Regulatory Commission; |
• | “HFCAA” are to the Holding Foreign Companies Accountable Act; |
• | “HK$” or “Hong Kong dollars” or “HK dollars” are to Hong Kong dollars, the lawful currency of Hong Kong; |
• | “Hong Kong” or “HK” or “Hong Kong S.A.R.” are to the Hong Kong Special Administrative Region of the PRC; |
• | “Hong Kong Listing Rules” are to the Rules Governing the Listing of Securities on The Stock Exchange of Hong Kong Limited, as amended or supplemented from time to time; |
• | “Hong Kong Share Registrar” are to Computershare Hong Kong Investor Services Limited; |
• | “Hong Kong Stock Exchange” are to The Stock Exchange of Hong Kong Limited; |
• | “JD Health” are to JD Health International Inc., a consolidated subsidiary of our company and the shares of which are listed on the Main Board of the Hong Kong Stock Exchange (Stock Code: 6618), and, except where the context otherwise requires, its subsidiaries and its consolidated variable interest entities and their subsidiaries; |
• | “JD Logistics” are to JD Logistics, Inc., a consolidated subsidiary of our company and the shares of which are listed on the Main Board of the Hong Kong Stock Exchange (Stock Code: 2618), and, except where the context otherwise requires, its subsidiaries and its consolidated variable interest entities and their subsidiaries; |
• | “Main Board” are to the stock market (excluding the option market) operated by the Hong Kong Stock Exchange which is independent from and operated in parallel with the Growth Enterprise Market, or GEM, of the Hong Kong Stock Exchange; |
• | “ordinary shares” are to our Class A and Class B ordinary shares, par value US$0.00002 per share; |
• | “PCAOB” are to the Public Company Accounting Oversight Board of the United States; |
• | “SEC” are to the United States Securities and Exchange Commission; |
• | “SFC” are to the Securities and Futures Commission of Hong Kong; |
• | “SFO” are to the Securities and Futures Ordinance (Chapter 571 of the Laws of Hong Kong), as amended or supplemented from time to time; and |
• | “we,” “us,” “our company” or “our” are to JD.com, Inc., its subsidiaries, and, in the context of describing our operations and consolidated financial information, our consolidated variable interest entities and their subsidiaries. Our consolidated variable interest entities include, among others, Beijing Jingdong 360 Degree E-Commerce Co., Ltd., Jiangsu Yuanzhou E-Commerce Co., Ltd., Xi’an Jingdong Xincheng Information Technology Co., Ltd., Jiangsu Jingdong Bangneng Investment Management Co., Ltd., and Suqian Juhe Digital Enterprise Management Co., Ltd. References to our consolidated variable interest entities may include their subsidiaries, depending on the context as appropriate. |
• | If we are unable to manage our growth or execute our strategies effectively, our business and prospects may be materially and adversely affected; |
• | We incurred net losses in the past and we may not be able to maintain profitability in the future; |
• | If we are unable to provide superior customer experience, our business and reputation may be materially and adversely affected; |
• | Uncertainties relating to the growth and profitability of the retail industry in China in general, and the online retail industry in particular, could adversely affect our revenues and business prospects; |
• | Any harm to our JD brand or reputation may materially and adversely affect our business and results of operations; |
• | If we are unable to offer products that attract purchases from new and existing customers, our business, financial condition and results of operations may be materially and adversely affected; |
• | If we are unable to manage our nationwide fulfillment infrastructure efficiently and effectively, our business prospects and results of operations may be materially and adversely affected; |
• | We face intense competition. We may not be able to maintain or may lose market share and customers if we fail to compete effectively; |
• | Our expansion into new product categories and substantial increase in the number of products may expose us to new challenges and more risks; |
• | If we fail to manage our inventory effectively, our results of operations, financial condition and liquidity may be materially and adversely affected; |
• | Our business is subject to complex and evolving Chinese and international laws and regulations regarding data privacy and cybersecurity. Failure to protect confidential information of our customers and network against security breaches could damage our reputation and brand and substantially harm our business and results of operations; |
• | The approval of the CSRC or other PRC government authorities may be required in connection with our offshore offerings under PRC law, and, if required, we cannot predict whether or for how long we will be able to obtain such approval; and |
• | The PCAOB is currently unable to inspect our auditor in relation to their audit work performed for our financial statements and the inability of the PCAOB to conduct inspections over our auditor deprives our investors with the benefits of such inspections. |
• | Our ADSs will be prohibited from trading in the United States under the HFCAA in 2024 if the PCAOB is unable to inspect or fully investigate auditors located in China, or in 2023 if proposed changes to the law are enacted. The delisting of our ADSs, or the threat of their being delisted, may materially and adversely affect the value of your investment. On December 16, 2021, the PCAOB issued a report to notify the SEC of its determination that the PCAOB is unable to inspect or investigate completely registered public accounting firms headquartered in mainland China and Hong Kong. The PCAOB identified our auditor as one of the registered public accounting firms that the PCAOB is unable to inspect or investigate completely. |
• | We are a Cayman Islands holding company with no equity ownership in our variable interest entities and we conduct certain of our operations through our variable interest entities, with which we have maintained contractual arrangements. Investors in our ADSs or Class A ordinary shares thus are not purchasing equity interest in our variable interest entities in China but instead are purchasing equity interest in a Cayman Islands holding company. If the PRC government finds that the agreements that establish the structure for operating our business do not comply with PRC laws and regulations, or if these regulations or their interpretations change in the future, we could be subject to severe penalties or be forced to relinquish our interests in those operations. Our holding company, variable interest entities and investors of our company face uncertainty about potential future actions by the PRC government that could affect the enforceability of the contractual arrangements with our variable interest entities and, consequently, significantly affect the financial performance of our variable interest entities and our company as a whole. The PRC regulatory authorities could disallow the variable interest entities structure, which would likely result in a material adverse change in our operations, and our ADSs or Class A ordinary shares may decline significantly in value. |
• | Any failure by our variable interest entities or their shareholders to perform their obligations under our contractual arrangements with them would have a material and adverse effect on our business; and |
• | The shareholders of our variable interest entities may have potential conflicts of interest with us, which may materially and adversely affect our business and financial condition. |
• | PRC government’s significant authority in regulating our operations and its oversight and control over offerings conducted overseas by, and foreign investment in, China-based issuers could significantly limit or completely hinder our ability to offer or continue to offer securities to investors. Implementation of industry-wide regulations in this nature may cause the value of such securities to significantly decline; |
• | Changes in China’s or global economic, political or social conditions or government policies could have a material and adverse effect on our business and operations; |
• | Uncertainties with respect to the PRC legal system could adversely affect us; |
• | We are subject to consumer protection laws that could require us to modify our current business practices and incur increased costs; and |
• | We may be adversely affected by the complexity, uncertainties and changes in PRC regulation of internet-related business and companies. |
• | The trading price of our ADSs and Class A ordinary shares have been and are likely to continue to be volatile, which could result in substantial losses to holders of our Class A ordinary shares and/or ADSs; |
• | We adopt different practices as to certain matters as compared with many other companies listed on the Hong Kong Stock Exchange; |
• | We cannot guarantee that any share repurchase program will be fully consummated or that any share repurchase program will enhance long-term shareholder value, and share repurchases could increase the volatility of the price of our Class A ordinary shares and/or ADSs and could diminish our cash reserves; and |
• | If securities or industry analysts do not publish research or publish inaccurate or unfavorable research about our business, the market price for our Class A ordinary shares and/or ADSs and trading volume could decline. |
• | our goals and strategies; |
• | our future business development, financial conditions and results of operations; |
• | the expected growth of the retail and online retail markets in China; |
• | our expectations regarding demand for and market acceptance of our products and services; |
• | our expectations regarding our relationships with customers, suppliers and third-party merchants; |
• | our plans to invest in our fulfillment infrastructure and technology platform as well as new business initiatives; |
• | competition in our industry; and |
• | relevant government policies and regulations relating to our industry. |
Item 1. |
Identity of Directors, Senior Management and Advisers |
Item 2. |
Offer Statistics and Expected Timetable |
Item 3. |
Key Information |
For the Year Ended December 31, |
||||||||||||||||||||||||
2017 |
2018 |
2019 |
2020 |
2021 |
||||||||||||||||||||
RMB |
RMB |
RMB |
RMB |
RMB |
US$ |
|||||||||||||||||||
(in millions, except for share, per share and per ADS data) |
||||||||||||||||||||||||
Selected Consolidated Statements of Operations Data: |
||||||||||||||||||||||||
Net Revenues (1) : |
||||||||||||||||||||||||
Net product revenues |
331,824 | 416,109 | 510,734 | 651,879 | 815,655 | 127,994 | ||||||||||||||||||
Net service revenues |
30,508 | 45,911 | 66,154 | 93,923 | 135,937 | 21,332 | ||||||||||||||||||
|
|
|
|
|
|
|
|
|
|
|
|
|||||||||||||
Total net revenues |
362,332 |
462,020 |
576,888 |
745,802 |
951,592 |
149,326 |
||||||||||||||||||
|
|
|
|
|
|
|
|
|
|
|
|
|||||||||||||
Cost of revenues |
(311,517 | ) | (396,066 | ) | (492,467 | ) | (636,694 | ) | (822,526 | ) | (129,072 | ) | ||||||||||||
Fulfillment |
(25,865 | ) | (32,010 | ) | (36,968 | ) | (48,700 | ) | (59,055 | ) | (9,267 | ) | ||||||||||||
Marketing |
(14,918 | ) | (19,237 | ) | (22,234 | ) | (27,156 | ) | (38,743 | ) | (6,080 | ) | ||||||||||||
Research and development |
(6,652 | ) | (12,144 | ) | (14,619 | ) | (16,149 | ) | (16,332 | ) | (2,563 | ) | ||||||||||||
General and administrative |
(4,215 | ) | (5,160 | ) | (5,490 | ) | (6,409 | ) | (11,562 | ) | (1,814 | ) | ||||||||||||
Impairment of goodwill and intangible assets |
— | (22 | ) | — | — | — | — | |||||||||||||||||
|
|
|
|
|
|
|
|
|
|
|
|
|||||||||||||
Gain on sale of development properties |
— | — | 3,885 | 1,649 | 767 | 120 | ||||||||||||||||||
|
|
|
|
|
|
|
|
|
|
|
|
|||||||||||||
Income/(loss) from operations (2)(3) |
(835 |
) |
(2,619 |
) |
8,995 |
12,343 |
4,141 |
650 |
||||||||||||||||
Other income/(expense): |
||||||||||||||||||||||||
Share of results of equity investees |
(1,927 | ) | (1,113 | ) | (1,738 | ) | 4,291 | (4,918 | ) | (772 | ) | |||||||||||||
Interest expense |
(964 | ) | (855 | ) | (725 | ) | (1,125 | ) | (1,213 | ) | (190 | ) | ||||||||||||
Others, net (4) |
3,847 | 2,213 | 7,161 | 35,310 | (590 | ) | (93 | ) | ||||||||||||||||
|
|
|
|
|
|
|
|
|
|
|
|
|||||||||||||
Income/(loss) before tax |
121 | (2,374 | ) | 13,693 | 50,819 | (2,580 | ) | (405 | ) | |||||||||||||||
Income tax expenses |
(140 | ) | (427 | ) | (1,803 | ) | (1,482 | ) | (1,887 | ) | (296 | ) | ||||||||||||
|
|
|
|
|
|
|
|
|
|
|
|
|||||||||||||
Net income/(loss) from continuing operations |
(19 |
) |
(2,801 |
) |
11,890 |
49,337 |
(4,467 |
) |
(701 |
) | ||||||||||||||
|
|
|
|
|
|
|
|
|
|
|
|
|||||||||||||
Net income from discontinued operations, net of tax |
7 |
— |
— |
— |
— |
— |
||||||||||||||||||
|
|
|
|
|
|
|
|
|
|
|
|
|||||||||||||
Net income/(loss) |
(12 |
) |
(2,801 |
) |
11,890 |
49,337 |
(4,467 |
) |
(701 |
) | ||||||||||||||
Net loss from continuing operations attributable to non-controlling interests shareholders |
(135 | ) | (311 | ) | (297 | ) | (75 | ) | (923 | ) | (145 | ) | ||||||||||||
Net loss from discontinued operations attributable to non-controlling interests shareholders |
(5 | ) | — | — | — | — | — | |||||||||||||||||
Net income from continuing operations attributable to mezzanine equity classified as non-controlling interests shareholders |
— | 2 | 3 | 7 | 16 | 3 | ||||||||||||||||||
Net income from discontinued operations attributable to mezzanine equity classified as non-controlling interests shareholders |
281 | — | — | — | — | — | ||||||||||||||||||
|
|
|
|
|
|
|
|
|
|
|
|
|||||||||||||
Net income/(loss) attributable to ordinary shareholders |
(153 |
) |
(2,492 |
) |
12,184 |
49,405 |
(3,560 |
) |
(559 |
) | ||||||||||||||
|
|
|
|
|
|
|
|
|
|
|
|
|||||||||||||
Including: |
||||||||||||||||||||||||
Net loss from discontinued operations attributable to ordinary shareholders |
(269 | ) | — | — | — | — | — | |||||||||||||||||
|
|
|
|
|
|
|
|
|
|
|
|
|||||||||||||
Net income/(loss) from continuing operations attributable to ordinary shareholders |
116 |
(2,492 |
) |
12,184 |
49,405 |
(3,560 |
) |
(559 |
) | |||||||||||||||
|
|
|
|
|
|
|
|
|
|
|
|
For the Year Ended December 31, |
||||||||||||||||||||||||
2017 |
2018 |
2019 |
2020 |
2021 |
||||||||||||||||||||
RMB |
RMB |
RMB |
RMB |
RMB |
US$ |
|||||||||||||||||||
(in millions, except for share, per share and per ADS data) |
||||||||||||||||||||||||
Net income/(loss) per share |
||||||||||||||||||||||||
Basic |
||||||||||||||||||||||||
Continuing operations |
0.04 | (0.87 | ) | 4.18 | 16.35 | (1.15 | ) | (0.18 | ) | |||||||||||||||
Discontinued operations |
(0.09 | ) | — | — | — | — | — | |||||||||||||||||
Net income/(loss) per share |
(0.05 | ) | (0.87 | ) | 4.18 | 16.35 | (1.15 | ) | (0.18 | ) | ||||||||||||||
Diluted |
||||||||||||||||||||||||
Continuing operations |
0.04 | (0.87 | ) | 4.11 | 15.84 | (1.15 | ) | (0.18 | ) | |||||||||||||||
Discontinued operations |
(0.09 | ) | — | — | — | — | — | |||||||||||||||||
Net income/(loss) per share |
(0.05 | ) | (0.87 | ) | 4.11 | 15.84 | (1.15 | ) | (0.18 | ) | ||||||||||||||
Net income/(loss) per ADS (5) |
||||||||||||||||||||||||
Basic |
||||||||||||||||||||||||
Continuing operations |
0.08 | (1.73 | ) | 8.37 | 32.70 | (2.29 | ) | (0.36 | ) | |||||||||||||||
Discontinued operations |
(0.19 | ) | — | — | — | — | — | |||||||||||||||||
Net income/(loss) per ADS |
(0.11 | ) | (1.73 | ) | 8.37 | 32.70 | (2.29 | ) | (0.36 | ) | ||||||||||||||
Diluted |
||||||||||||||||||||||||
Continuing operations |
0.08 | (1.73 | ) | 8.21 | 31.68 | (2.29 | ) | (0.36 | ) | |||||||||||||||
Discontinued operations |
(0.18 | ) | — | — | — | — | — | |||||||||||||||||
Net income/(loss) per ADS |
(0.11 | ) | (1.73 | ) | 8.21 | 31.68 | (2.29 | ) | (0.36 | ) | ||||||||||||||
Weighted average number of shares: |
||||||||||||||||||||||||
Basic |
2,844,826,014 | 2,877,902,678 | 2,912,637,241 | 3,021,808,985 | 3,107,436,665 | 3,107,436,665 | ||||||||||||||||||
Diluted |
2,911,461,817 | 2,877,902,678 | 2,967,321,803 | 3,109,024,030 | 3,107,436,665 | 3,107,436,665 |
(1) | Our net revenues include net product revenues and net service revenues. Product sales is further divided into sales of electronics and home appliances products and sales of general merchandise products. Net revenues from electronics and home appliances products include revenues from sales of computer, communication and consumer electronics products as well as home appliances. Net revenues from general merchandise products mainly include revenues from sales of food, beverage and fresh produce, baby and maternity products, furniture and household goods, cosmetics and other personal care items, pharmaceutical and healthcare products, books, automobile accessories, apparel and footwear, bags and jewelry. Net service revenues are further divided into revenues from online marketplace and marketing and revenues from logistics and other services. The following table breaks down our total net revenues by these categories, by amounts and as percentages of total net revenues: |
For the Year Ended December 31, |
||||||||||||||||||||||||||||||||||||||||||||
2017 |
2018 |
2019 |
2020 |
2021 |
||||||||||||||||||||||||||||||||||||||||
RMB |
% |
RMB |
% |
RMB |
% |
RMB |
% |
RMB |
US$ |
% |
||||||||||||||||||||||||||||||||||
(in millions, except for percentages) |
||||||||||||||||||||||||||||||||||||||||||||
Electronics and home appliances revenues |
236,269 | 65.2 | 280,059 | 60.6 | 328,703 | 57.0 | 400,927 | 53.8 | 492,592 | 77,298 | 51.8 | |||||||||||||||||||||||||||||||||
General merchandise revenues |
95,555 | 26.4 | 136,050 | 29.5 | 182,031 | 31.5 | 250,952 | 33.6 | 323,063 | 50,696 | 33.9 | |||||||||||||||||||||||||||||||||
|
|
|
|
|
|
|
|
|
|
|
|
|
|
|
|
|
|
|
|
|
|
|||||||||||||||||||||||
Net product revenues |
331,824 | 91.6 | 416,109 | 90.1 | 510,734 | 88.5 | 651,879 | 87.4 | 815,655 | 127,994 | 85.7 | |||||||||||||||||||||||||||||||||
|
|
|
|
|
|
|
|
|
|
|
|
|
|
|
|
|
|
|
|
|
|
|||||||||||||||||||||||
Marketplace and marketing revenues |
25,391 | 7.0 | 33,532 | 7.2 | 42,680 | 7.4 | 53,473 | 7.2 | 72,118 | 11,317 | 7.6 | |||||||||||||||||||||||||||||||||
Logistics and other service revenues |
5,117 | 1.4 | 12,379 | 2.7 | 23,474 | 4.1 | 40,450 | 5.4 | 63,819 | 10,015 | 6.7 | |||||||||||||||||||||||||||||||||
|
|
|
|
|
|
|
|
|
|
|
|
|
|
|
|
|
|
|
|
|
|
|||||||||||||||||||||||
Net service revenues |
30,508 | 8.4 | 45,911 | 9.9 | 66,154 | 11.5 | 93,923 | 12.6 | 135,937 | 21,332 | 14.3 | |||||||||||||||||||||||||||||||||
|
|
|
|
|
|
|
|
|
|
|
|
|
|
|
|
|
|
|
|
|
|
|||||||||||||||||||||||
Total net revenues |
362,332 | 100.0 | 462,020 | 100.0 | 576,888 | 100.0 | 745,802 | 100.0 | 951,592 | 149,326 | 100.0 | |||||||||||||||||||||||||||||||||
|
|
|
|
|
|
|
|
|
|
|
|
|
|
|
|
|
|
|
|
|
|
(2) | Includes share-based compensation expenses as follows: |
For the Year Ended December 31, |
||||||||||||||||||||||||
2017 |
2018 |
2019 |
2020 |
2021 |
||||||||||||||||||||
RMB |
RMB |
RMB |
RMB |
RMB |
US$ |
|||||||||||||||||||
(in millions) |
||||||||||||||||||||||||
Cost of revenues |
(28 | ) | (72 | ) | (82 | ) | (98 | ) | (102 | ) | (16 | ) | ||||||||||||
Fulfillment |
(426 | ) | (419 | ) | (440 | ) | (646 | ) | (882 | ) | (138 | ) | ||||||||||||
Marketing |
(136 | ) | (190 | ) | (259 | ) | (347 | ) | (586 | ) | (92 | ) | ||||||||||||
Research and development |
(671 | ) | (1,163 | ) | (1,340 | ) | (1,400 | ) | (1,781 | ) | (280 | ) | ||||||||||||
General and administrative |
(1,520 | ) | (1,816 | ) | (1,574 | ) | (1,665 | ) | (5,783 | ) | (907 | ) |
(3) | Includes amortization of business cooperation arrangement and intangible assets resulting from assets and business acquisitions as follows: |
For the Year Ended December 31, |
||||||||||||||||||||||||
2017 |
2018 |
2019 |
2020 |
2021 |
||||||||||||||||||||
RMB |
RMB |
RMB |
RMB |
RMB |
US$ |
|||||||||||||||||||
(in millions) |
||||||||||||||||||||||||
Fulfillment |
(164 | ) | (168 | ) | (165 | ) | (193 | ) | (220 | ) | (35 | ) | ||||||||||||
Marketing |
(1,222 | ) | (1,232 | ) | (637 | ) | (692 | ) | (854 | ) | (134 | ) | ||||||||||||
Research and development |
(84 | ) | (98 | ) | (99 | ) | (99 | ) | (104 | ) | (16 | ) | ||||||||||||
General and administrative |
(308 | ) | (308 | ) | (308 | ) | (309 | ) | (309 | ) | (48 | ) |
(4) | Interest income was included in Others, net since 2021, and the presentation of prior years was also updated to conform to current presentation. |
(5) | Each ADS represents two Class A ordinary shares. |
For the Year Ended December 31, |
||||||||||||||||||||||||
2017 |
2018 |
2019 |
2020 |
2021 |
||||||||||||||||||||
RMB |
RMB |
RMB |
RMB |
RMB |
US$ |
|||||||||||||||||||
(in millions, except for share data) |
||||||||||||||||||||||||
Selected Consolidated Balance Sheets Data: |
||||||||||||||||||||||||
Cash and cash equivalents |
25,688 | 34,262 | 36,971 | 86,085 | 70,767 | 11,105 | ||||||||||||||||||
Restricted cash |
4,110 | 3,240 | 2,941 | 4,434 | 5,926 | 930 | ||||||||||||||||||
Short-term investments |
8,588 | 2,036 | 24,603 | 60,577 | 114,564 | 17,978 | ||||||||||||||||||
Accounts receivable, net |
16,359 | 11,110 | 6,191 | 7,112 | 11,900 | 1,867 | ||||||||||||||||||
Inventories, net |
41,700 | 44,030 | 57,932 | 58,933 | 75,601 | 11,863 | ||||||||||||||||||
Property, equipment and software, net |
12,574 | 21,083 | 20,654 | 22,597 | 32,944 | 5,170 | ||||||||||||||||||
Land use rights, net |
7,051 | 10,476 | 10,892 | 11,125 | 14,328 | 2,248 | ||||||||||||||||||
Operating lease right-of-use |
— | — | 8,644 | 15,484 | 19,987 | 3,136 | ||||||||||||||||||
Investment in equity investees |
18,551 | 31,357 | 35,576 | 58,501 | 63,222 | 9,921 | ||||||||||||||||||
Investment securities |
10,028 | 15,902 | 21,417 | 39,085 | 19,088 | 2,995 | ||||||||||||||||||
Other non-current assets |
2,228 | 5,284 | 6,806 | 13,316 | 21,804 | 3,423 | ||||||||||||||||||
Total assets |
184,055 | 209,165 | 259,724 | 422,288 | 496,507 | 77,912 | ||||||||||||||||||
Accounts payable |
74,338 | 79,985 | 90,428 | 106,818 | 140,484 | 22,045 | ||||||||||||||||||
Accrued expenses and other current liabilities |
15,118 | 20,293 | 24,656 | 30,035 | 34,468 | 5,409 | ||||||||||||||||||
Non-recourse securitization debt |
17,160 | 4,398 | — | — | — | — | ||||||||||||||||||
Unsecured senior notes |
6,447 | 6,786 | 6,912 | 12,854 | 9,386 | 1,473 | ||||||||||||||||||
Long-term borrowings |
— | 3,088 | 3,139 | 2,936 | — | — | ||||||||||||||||||
Operating lease liabilities |
— | — | 8,717 | 15,763 | 20,386 | 3,199 | ||||||||||||||||||
Total liabilities |
131,666 | 132,337 | 159,099 | 200,669 | 249,723 | 39,187 | ||||||||||||||||||
Total mezzanine equity |
— | 15,961 | 15,964 | 17,133 | 1,212 | 190 | ||||||||||||||||||
Total JD.com, Inc. shareholders’ equity |
52,041 | 59,771 | 81,856 | 187,543 | 208,911 | 32,782 | ||||||||||||||||||
Number of outstanding ordinary shares |
2,852,663,429 | 2,894,296,355 | 2,924,315,263 | 3,103,499,039 | 3,110,791,649 | 3,110,791,649 |
For the Year Ended December 31, |
||||||||||||||||||||||||
2017 |
2018 |
2019 |
2020 |
2021 |
||||||||||||||||||||
RMB |
RMB |
RMB |
RMB |
RMB |
US$ |
|||||||||||||||||||
(in millions) |
||||||||||||||||||||||||
Selected Consolidated Cash Flows Data: |
||||||||||||||||||||||||
Net cash provided by continuing operating activities |
29,342 | 20,881 | 24,781 | 42,544 | 42,301 | 6,638 | ||||||||||||||||||
Net cash used in discontinued operating activities |
(2,486 | ) | — | — | — | — | — | |||||||||||||||||
|
|
|
|
|
|
|
|
|
|
|
|
|||||||||||||
Net cash provided by operating activities (6) |
26,856 | 20,881 | 24,781 | 42,544 | 42,301 | 6,638 | ||||||||||||||||||
|
|
|
|
|
|
|
|
|
|
|
|
|||||||||||||
Net cash used in continuing investing activities |
(21,944 | ) | (26,079 | ) | (25,349 | ) | (57,811 | ) | (74,248 | ) | (11,651 | ) | ||||||||||||
Net cash used in discontinued investing activities |
(17,871 | ) | — | — | — | — | — | |||||||||||||||||
|
|
|
|
|
|
|
|
|
|
|
|
|||||||||||||
Net cash used in investing activities (6) |
(39,815 | ) | (26,079 | ) | (25,349 | ) | (57,811 | ) | (74,248 | ) | (11,651 | ) | ||||||||||||
|
|
|
|
|
|
|
|
|
|
|
|
|||||||||||||
Net cash provided by continuing financing activities |
5,180 | 11,220 | 2,572 | 71,072 | 19,503 | 3,060 | ||||||||||||||||||
Net cash provided by discontinued financing activities |
14,055 | — | — | — | — | — | ||||||||||||||||||
|
|
|
|
|
|
|
|
|
|
|
|
|||||||||||||
Net cash provided by financing activities |
19,235 | 11,220 | 2,572 | 71,072 | 19,503 | 3,060 | ||||||||||||||||||
|
|
|
|
|
|
|
|
|
|
|
|
|||||||||||||
Effect of exchange rate changes on cash, cash equivalents and restricted cash |
(642 | ) | 1,682 | 406 | (5,082 | ) | (1,498 | ) | (235 | ) | ||||||||||||||
|
|
|
|
|
|
|
|
|
|
|
|
|||||||||||||
Net increase/(decrease) in cash, cash equivalents and restricted cash |
5,634 | 7,704 | 2,410 | 50,723 | (13,942 | ) | (2,188 | ) | ||||||||||||||||
Cash, cash equivalents, and restricted cash at beginning of year, including cash and cash equivalents classified within assets held for sale |
24,164 | 29,798 | 37,502 | 39,912 | 90,635 | 14,223 | ||||||||||||||||||
Less: cash, cash equivalents, and restricted cash classified within assets held for sale at beginning of year |
— | — | — | — | 116 | 18 | ||||||||||||||||||
Cash, cash equivalents, and restricted cash at beginning of year |
24,164 | 29,798 | 37,502 | 39,912 | 90,519 | 14,205 | ||||||||||||||||||
|
|
|
|
|
|
|
|
|
|
|
|
|||||||||||||
Cash, cash equivalents and restricted cash at end of year, including cash and cash equivalents classified within assets held for sale |
29,798 | 37,502 | 39,912 | 90,635 | 76,693 | 12,035 | ||||||||||||||||||
Less: cash, cash equivalents, and restricted cash classified within assets held for sale at end of year |
— | — | — | 116 | — | — | ||||||||||||||||||
|
|
|
|
|
|
|
|
|
|
|
|
|||||||||||||
Cash, cash equivalents and restricted cash of continuing operations at end of year |
29,798 | 37,502 | 39,912 | 90,519 | 76,693 | 12,035 | ||||||||||||||||||
|
|
|
|
|
|
|
|
|
|
|
|
(6) | As a result of new accounting guidance adopted on January 1, 2018, the consolidated statements of cash flows were retrospectively adjusted to include restricted cash in cash and cash equivalents when reconciling the beginning-of-period end-of-period |
For the Year Ended December 31, 2021 |
||||||||||||||||||||
Parent |
Subsidiaries |
Consolidated Variable Interest Entities |
Eliminations |
Consolidated Total |
||||||||||||||||
|
|
|
|
|
|
|
|
|
|
|||||||||||
(RMB in millions) |
||||||||||||||||||||
Net revenues |
— | 922,629 | 117,419 | (88,456 | ) | 951,592 | ||||||||||||||
Third-party revenues |
— | 892,468 | 59,124 | — | 951,592 | |||||||||||||||
Inter-company revenues |
— | 30,161 | 58,295 | (88,456 | ) | — | ||||||||||||||
Cost of revenues |
— | (794,102 | ) | (104,564 | ) | 76,140 | (822,526 | ) | ||||||||||||
Fulfillment |
— | (59,682 | ) | (4,657 | ) | 5,284 | (59,055 | ) | ||||||||||||
Marketing |
(4 | ) | (36,269 | ) | (3,108 | ) | 638 | (38,743 | ) | |||||||||||
Research and development |
— | (17,282 | ) | (5,420 | ) | 6,370 | (16,332 | ) | ||||||||||||
General and administrative |
(465 | ) | (8,764 | ) | (2,357 | ) | 24 | (11,562 | ) | |||||||||||
Gain on sale of development properties |
— | 767 | — | — | 767 | |||||||||||||||
|
|
|
|
|
|
|
|
|
|
|||||||||||
|