UNITED STATES
SECURITIES AND EXCHANGE COMMISSION
Washington, D.C. 20549
FORM N-CSR
CERTIFIED SHAREHOLDER REPORT OF REGISTERED
MANAGEMENT INVESTMENT COMPANIES
| Investment Company Act file number | 811-22680 |
| Ultimus Managers Trust |
| (Exact name of registrant as specified in charter) |
| 225 Pictoria Drive, Suite 450 Cincinnati, Ohio | 45246 |
| (Address of principal executive offices) | (Zip code) |
Karen Jacoppo-Wood
| Ultimus Fund Solutions, LLC 225 Pictoria Drive, Suite 450 Cincinnati, Ohio 45246_ |
| (Name and address of agent for service) |
| Registrant's telephone number, including area code: | (513) 587-3400 |
| Date of fiscal year end: | December 31 | |
| Date of reporting period: | June 30, 2023 |
Form N-CSR is to be used by management investment companies to file reports with the Commission not later than 10 days after the transmission to stockholders of any report that is required to be transmitted to stockholders under Rule 30e-1 under the Investment Company Act of 1940 (17 CFR 270.30e-1). The Commission may use the information provided on Form N-CSR in its regulatory, disclosure review, inspection, and policymaking roles.
A registrant is required to disclose the information specified by Form N-CSR, and the Commission will make this information public. A registrant is not required to respond to the collection of information contained in Form N-CSR unless the Form displays a currently valid Office of Management and Budget ("OMB") control number. Please direct comments concerning the accuracy of the information collection burden estimate and any suggestions for reducing the burden to the Secretary, Securities and Exchange Commission, 450 Fifth Street, NW, Washington, DC 20549-0609. The OMB has reviewed this collection of information under the clearance requirements of 44 U.S.C. § 3507.
Explanatory Note: The Registrant is filing this amendment to its Form N-CSR for the fiscal period ended June 30, 2023, originally filed with the Securities and Exchange Commission on September 7, 2023 (Accession Number 0001580642-23-004739). The sole purpose of this amendment is to an exhibit from the Funds’ former independent registered public accounting firm as required pursuant to Item 304(a) of Regulation S-K, as amended, as an exhibit to the Form N-CSR filing. Except as set forth above, this amendment does not amend, update or change any other items or disclosures found in the original Form N-CSR filing.
| Item 1. | Reports to Stockholders. |
(a).

Westwood
Salient MLP & Energy Infrastructure Fund
Westwood Salient Global Real Estate Fund
Westwood Salient Select Income Fund
Westwood Broadmark Tactical Growth Fund
Westwood Broadmark Tactical Plus Fund
| Semi-Annual Report | June 30, 2023 |
| Investment Advisor: | |
| Westwood Management Corp. | |
| WESTWOOD FUNDS |
| TABLE OF CONTENTS |
| Shareholder Letter | 1 |
| Schedules of Investments | |
| Westwood Salient MLP & Energy Infrastructure Fund | 12 |
| Westwood Salient Global Real Estate Fund | 15 |
| Westwood Salient Select Income Fund | 17 |
| Westwood Broadmark Tactical Growth Fund | 19 |
| Westwood Broadmark Tactical Plus Fund | 20 |
| Statements of Assets and Liabilities | 21 |
| Statements of Operations | 23 |
| Statements of Changes in Net Assets | 24 |
| Financial Highlights | 30 |
| Notes to Financial Statements | 40 |
| Change in Independent Registered Public Accounting Firm | 59 |
| About Your Funds’ Expenses | 60 |
| Other Information | 64 |
| Customer Privacy Notice | 65 |
| WESTWOOD FUNDS (Unaudited) |
December 31, 2022 – June 30, 2023
Dear Shareholders,
Fed Still Has Work to Do, Equities Show Resilience
Equities remained fairly resilient against the backdrop of an economy supposedly nearing the brink of recession along with the onset of a mini-banking crisis (which was really more of a liquidity event). In addition, the Federal Reserve continued to raise interest rates, increasing the federal funds rate by another 200 basis points. Most experts believe that more rate hikes are likely, as inflation and the labor market remain strong. Stocks are also digesting a largely telegraphed earnings slowdown, but, on average, have not experienced the “earnings cliff” that many had feared. Actually, as we stated in our previous letter, investors still sought opportunity in high-quality tech and other value names over the last six months. By the numbers, the Nasdaq Composite Index surged 32.3%, handily outperforming the Dow Jones Industrial Average Index, which managed to only edge 4.9% higher; the S&P 500 Index (the “S&P 500”) logged a 16.9% gain in the period.
Stocks began the period with a rally in late 2022, which continued into February 2023 amid optimism that global central banks, with the Fed leading, might soon halt interest rate hikes and even transition to rate cuts or more accommodative policies by the end of the year. Unfortunately, choppy earnings, mixed economic data and a stubbornly hawkish Fed, fueled by still-sticky inflation and a tight labor market, were factors that quelled early momentum back toward highs in the S&P 500.
Mid-March gave way to a banking “crisis” that took a toll on regional banks, related small caps and some larger names, but most major indices managed to rally back as systemic risk was unfounded. As we approached May, hopes for a fall or even winter rate cut had diminished greatly from predictions made late last year. It’s also important to note that performance in small caps would have been far stronger if not for the banking debacle. Shifting from financials, money flowed into tech names, which had their best quarter (Q1) since the second quarter of 2020. The rise of these growth/tech names led to an extremely narrow market — the top seven names in the S&P 500 accounted for much of the index gains in the first half — making it difficult for active managers to outperform. What’s particularly interesting is that growth stocks gained favor despite a longer-than-expected elevated rate environment or what could be continued increases — one of many odd correlations or de-correlations we see in today’s marketplace.
Debt Markets Volatile
American debt instruments experienced their own roller coaster ride over the last six months, as market participants jockeyed to best position themselves in a still uncertain rate and economic climate. A bond rally early in the year was followed quickly by a selloff, then a rush back into high- quality debt (U.S. Treasuries) as financial system jitters shook confidence in this fragile late-cycle expansion phase. To put this uncertainty in perspective, the yield on the two-year U.S. Treasury surged to 5.05% on March 8, only to plummet to a low of 3.76% on March 24 — volatility in the bond market remains at nearly twice its long-term levels for the fifth quarter in a row. This disconnect between the bond market and the Fed’s policy further diverged during the sudden banking crisis. Markets viewed this event as a sign of economic weakness and began pricing in bets for the Fed to cut rates to ease financial strain. However, the Fed quickly stepped in to shore up deposit issues but did not telegraph a need for rates to come down, as they believed their supportive actions were enough.
In general, investors remained concerned about recession as the yield curve (2-year versus 10-year) in Q1 became the most inverted it had been since 1981. Historically, the yield curve has been a reliable leading indicator of economic weakness and, on average, inversions during a late cycle tend to occur one year before recession. Gold, another safe-haven asset, increased to an all-time high (not inflation adjusted) of $1,990.60 per troy ounce in April, while crude oil and natural gas trended lower in the quarter. And though energy price declines have been helpful in reducing global inflation, OPEC+ decided late in the quarter to further cut production, which may hamper inflation-fighting efforts. So far, their tricks have done little to buoy energy prices.
1
| WESTWOOD FUNDS (Unaudited) |
On that topic, the Fed continues to work frantically to control inflation without completely stifling the economy, but we see more rate hikes as likely. The Federal Open Market Committee (FOMC) ended the period with rates set at a range of 5.00% to 5.25%, its highest since 2007. Debt ceiling issues dominated the headlines toward the end of the period, as earnings guidance and a potential “selective” or “soft” landing dominated the trades, and recession started to be assigned based on major industry group classification. In May 2023, the debt ceiling deal was reached. The deal suspended the debt ceiling until January 2025, averting a potential default on the national debt.
The Road Ahead
While markets seem extremely optimistic here, it’s still critical that investors remain vigilant of the headwinds that America faces and continue to approach the broad equity markets with a highly tactical approach, as upside catalysts are not abundant across all sectors. The current environment is particularly abnormal and, in many ways, unprecedented. Consumer confidence continues to slowly erode, while wages are not keeping up with inflation. On that note, there’s been a resurgence in price appreciation that is not only likely to affect consumer spending but also influence future Fed responses. Perhaps the biggest irony here is that the stock market shows little sign of recession, but Fed watchers are predicting that rates will be somewhere between 3% and 4% by year end. In fact, the CME FedWatch Tool shows a near-zero percent chance rates will be above 4.75% come mid-December. Put simply, smart money is betting on a recession and subsequent reversal in recent hawkish Fed action.
On June 14, 2023, the Federal Reserve held rates steady for the first time since March 2022, but signaled more hikes later this year. Even with the rate pause, we do not believe we will see aggressive cuts coming in 2023 unless an unforeseen crisis occurs. Let’s not forget, the Fed is still grappling with record low unemployment and 40-year highs in inflation. The reality is that a greater level of uncertainty prevails, and investors continue to scour the data seeking hard-to-find clues on where the economy and markets are headed from here. The picture is anything but clear, but we do not see systematic risk in the broad financial sector as was the case during the Great Recession.
Hikes are most certainly taking their toll on housing, consumers and the commercial real estate market, which we are watching closely. As the prime rate and mortgage rates have surged higher, consumers continue to throttle back and change their habits, which we believe will equate to a continued drag on corporate earnings into the back half of 2023. Currently, we see the risk of a recession in the U.S. growing, but it’s unlikely to “feel” as “painful” as more recent downturns.
The current market environment continues to produce dislocations with respect to valuation and increased levels of fundamental skepticism that play to our strength.
At the end of the day, the narrative the FOMC offers can either be solace or stress for both consumers and investors, but we suspect they may have an increasingly difficult task as consumers become overwhelmed with debt/costs and an increasing number of layoffs.
Thank you for your trust.
Sincerely,
The
Investment Team
The Westwood Funds
The information contained herein represents the views of the adviser at a specific point in time and is based on information believed to be reliable. No representation or warranty is made concerning the accuracy or completeness of any data compiled herein. Any statements non-factual in nature constitute only current opinion, which is subject to change. Any statements concerning financial market trends are based on current market conditions, which will fluctuate. Past performance is not indicative of future results. All information provided herein is for informational purposes only and is
2
| WESTWOOD FUNDS (Unaudited) |
not intended to be, and should not be interpreted as, an offer, solicitation, or recommendation to buy or sell or otherwise invest in any of the securities/sectors/countries that may be mentioned. Investing involves risk, including possible loss of principal. A discussion of each fund’s performance during the semiannual period ending June 30, 2023, is presented below.
Westwood Salient Global Real Estate
The performance of the Westwood Salient Global Real Estate Fund for the periods ended June 30, 2023, was as follows:
| 2023 | ||
| 6 Months | Year to Date | |
| Westwood Salient Global Real Estate Fund – Institutional Shares (KIRYX) | 1.92% | 1.92% |
| Westwood Salient Global Real Estate Fund – A Shares (KIRAX)* | 1.74% | 1.74% |
| Westwood Salient Global Real Estate Fund – C Shares (KIRCX) | 1.50% | 1.50% |
| FTSE EPRA Nareit Developed Index | 1.02% | 1.02% |
| MSCI World Index | 15.43% | 15.43% |
| * | Without sales charge |
The performance data quoted represents past performance. Past performance does not guarantee future results. The investment return and principal value of an investment will fluctuate so that an investor’s shares, when redeemed, may be worth more or less than their original cost and current performance may be lower or higher than the performance quoted. The Adviser has contractually agreed to waive fees and reimburse expenses until April 30, 2024. In the absence of current fee waivers, total return and yield would have been lower.
For the first half of 2023, the Fund’s A shares (KIRAX) returned 1.74% and its Institutional shares (KIRYX) returned 1.92%. The fund’s benchmark, the FTSE EPRA/NAREIT Developed Index (TRNGLU), returned 1.02% over the same period. Global markets remained volatile in the first half of 2023 as a result of mixed economic signals, the war in Ukraine, interest rate increases by multiple major central banks, elevated energy prices and slowing trade.
An overweight exposure to property types with favorable supply/demand imbalances, such as industrial and data centers, was the primary driver of performance in our U.S. holdings. For data centers specifically, the excitement around AI has proven to be a significant boon. The Canadian portfolio was entirely composed of industrial REITs, which benefited from the same supply/demand imbalance as the U.S. industrial REITs. The Japanese economy performed well, which was reflected in the share prices of our Japanese holdings. Unlike much of the rest of the portfolio, our Japanese REITs are diversified across sectors and thus tend to be more highly correlated with each other and with the economy. Unfortunately, the performance was dampened by the Japanese Yen, which depreciated approximately 10% over the period.
Our Hong Kong performance was primarily driven by a single security, which weakened due to a FY23 earnings miss and rising Hong Kong Interbank Offered Rate (HIBOR). Our Singapore exposure underperformed during the first half of 2023 due to concerns of a slowing macroeconomic picture for the country and investor confusion concerning a spinoff transaction that occurred with our single holding in the second quarter. Our single German position fell sharply in Q1 before stabilizing in Q2. We attribute this to an unscheduled revaluation of the REIT’s entire portfolio by management, which reduced NAV by 6.5%, coupled with higher interest rates and the risk of recession in Europe.
3
| WESTWOOD FUNDS (Unaudited) |
Westwood Salient Select Income
The performance of the Westwood Salient Select Income Fund for the periods ended June 30, 2023, was as follows:
| 2023 | ||
| 6 Months | Year to Date | |
| Westwood Salient Select Income Fund – Institutional Shares (KIFYX) | 6.58% | 6.58% |
| Westwood Salient Select Income Fund – A Shares (KIFAX)* | 6.50% | 6.50% |
| Westwood Salient Select Income Fund – C Shares (KIFCX) | 6.10% | 6.10% |
| ICE BofA Fixed Rate Preferred Securities Index | 4.63% | 4.63% |
| * | Without sales charge |
The performance data quoted represents past performance. Past performance does not guarantee future results. The investment return and principal value of an investment will fluctuate so that an investor’s shares, when redeemed, may be worth more or less than their original cost and current performance may be lower or higher than the performance quoted. The Adviser has contractually agreed to waive fees and reimburse expenses until April 30, 2024. In the absence of current fee waivers, total return and yield would have been lower.
For the first half of 2023, the Fund’s A shares (KIFAX) returned 6.50% and its Institutional shares (KIFYX) returned 6.58%. The fund’s benchmark, the ICE BofA Merrill Lynch Fixed Rate Preferred Securities Index (POP1), returned 4.63% over the same period.
Interest rates and inflation were the primary focus in the first half of 2023 with the Fed mandating three 25-bps rate hikes. As a result of this uncertainty, capital market activity for real estate remained mixed. Equity issuance was light in both Q1 and Q2; however, REITs issued a total of $24.2 billion across 35 issuances. Unfortunately, no new preferred equity was issued, making this the fifth quarter in a row with no new REIT preferred issuances. Overall, REIT fundamentals remained strong, and we believe our portfolio is well insulated from a credit perspective.
Much of the positive performance generated by our hospitality holdings can be attributed to high dividend yields within our preferred portfolio. As of June 30, 2023, the average yield of our hospitality preferred securities was greater than 8%. During the period, it was announced that one of our issuers in retail was being acquired by a larger, more creditworthy competitor, resulting in the immediate price appreciation of the target’s preferred issuances. The industrial REITs performed well in the first half of 2023 as demand for warehouse/industrial space remained elevated. Asset owners continue to possess significant pricing power with tenants having limited alternatives, especially in key markets.
The negative performance in the office sector can be attributed to two series of preferred securities issued by a single REIT. These positions suffered as a result of rising interest rates and a slowing return-to-office in many of the issuer’s primary markets. Given our bearish outlook for the sector, we reduced our office exposure to zero earlier in the year. The telecom infrastructure REITs extended their decline from 2022 into early 2023, resetting valuations closer to pre-pandemic levels. Given that industry fundamentals and outlook remain strong, we liken this movement to mean-reversion and price rationalization.
4
| WESTWOOD FUNDS (Unaudited) |
Westwood Broadmark Tactical Growth
The performance of the Westwood Broadmark Tactical Growth Fund for the periods ended June 30, 2023, was as follows:
| 2023 | ||
| 6 Months | Year to Date | |
| Westwood Broadmark Tactical Growth Fund – Institutional Shares (FTGWX) | 1.73% | 1.73% |
| Westwood Broadmark Tactical Growth Fund – A Shares (FTAGX)* | 1.56% | 1.56% |
| Westwood Broadmark Tactical Growth Fund – C Shares (FTGOX) | 1.25% | 1.25% |
| HFRX Equity Hedge Index | 2.96% | 2.96% |
| S&P 500 Index | 16.89% | 16.89% |
| * | Without sales charge |
The performance data quoted represents past performance. Past performance does not guarantee future results. The investment return and principal value of an investment will fluctuate so that an investor’s shares, when redeemed, may be worth more or less than their original cost and current performance may be lower or higher than the performance quoted.
For the six months ended June 30, 2023, Westwood Broadmark Tactical Growth Fund’s Institutional Class shares returned +1.73%, providing a positive absolute record for investors but underperforming the Fund’s primary benchmark, the HFRX Equity Hedge Index, which returned +2.96%. The Fund underperformed its secondary benchmark, the S&P 500 Index, which rose +16.89%. The Fund showed better performance compared to its primary benchmark in the second quarter 2023, however, outperforming its HFRX primary benchmark by rising +2.63% vs. the HFRX’s return of +2.14%.
Stock prices rose strongly during the first half of 2023 fueled by anticipation that the Federal Reserve was nearing the end of the tightening cycle that began in early 2022. The Fed has now raised interest rates in 11 of its last 12 meetings to a level not seen just prior to the 2007 housing market crash. Despite higher interest rates, however, the U.S. economy continued to show great resilience and GDP expanded at an annualized 2.4% in the second quarter of 2023, higher than in the previous quarterly period and far above most market expectations. In our opinion, the strength in the economy was the primary reason for the strength in stock prices.
Equity valuations continue to be at elevated levels, which is a negative in our work. The median price-earnings multiple of the S&P 500 is still well above its historical norm. On the monetary front, the inverted yield curve is still troubling. The three-month/10-year U.S. Treasury yield curve reached the most negative level since the 2008-09 financial crisis during the first half of 2023. Over the last half century, this inversion has often been a harbinger of economic weakness and recession. In our opinion, investor sentiment also became overly optimistic in the first half of the year and has reached levels that have often accompanied market pullbacks. The bright spot in the team’s work has been market momentum. The team’s volume and breadth momentum models turned positive in the first half of 2023. As a result, the Fund maintained a reasonable net positive exposure to the market during the first half 2023, which contributed to the Fund’s positive absolute return.
The Fund employed derivative instruments in the first half of 2023. Futures contracts were used to help offset potential risk and the use of futures detracted -0.82% from the Fund’s return.
As the Westwood Broadmark Tactical Growth Fund’s investment team looks ahead to the last half of 2023 and into 2024, there are several factors within its “Four Pillar Process” that the team will be watching:
| 1. | Valuation: Price earnings ratios have declined from their lofty levels of early 2022 but are still in historically overvalued territory. Indeed, the stock market’s advance during the first half of 2023 has been largely the |
5
| WESTWOOD FUNDS (Unaudited) |
result of higher valuations rather than increased earnings or profits. A decline in earnings and profits could therefore be a potential negative for equity valuations.
| 2. | Monetary factors and credit conditions: The yield curve when comparing the three-month U.S. Treasury Bill yield with the 10-year U.S. Treasury yield reached its greatest inversion since the 2008-09 financial crisis. This inversion has occurred less than 12% of the time since 1962. Historical statistics show that during the time these inversions persisted, the S&P 500 has declined at an annual rate of -1.99%. While the first half of this year has been an exception to this historical record, the Tactical Growth Fund’s portfolio management team believes this cycle may still have further to go before completion, which could be negative for equity markets as we approach 2024. |
| 3. | Sentiment: Investor sentiment became far more optimistic in the first half of 2023. Retail investors, which have not been a factor in the market in recent years, finally showed more optimism than they have in several years. This trend is negative from a contrary point of view but can persist for some time before reaching an extreme. |
| 4. | Momentum: The team’s breadth momentum model, which measures the breadth of Standard & Poor’s industry groups, improved significantly at the end of the second quarter. This was confirmed by our measures of upside and downside volume, which were also positive. The team raised market exposure and retained a generally net long market posture throughout the first half of 2023 largely due to positive market momentum. |
Westwood Salient MLP & Energy Infrastructure
The performance of the Westwood Salient MLP & Energy Infrastructure Fund for the periods ended June 30, 2023, was as follows:
| 2023 | ||
| 6 Months | Year to Date | |
| Westwood Salient MLP & Energy Infrastructure Fund – Institutional Shares (SMLPX) | 5.35% | 5.35% |
| Westwood Salient MLP & Energy Infrastructure Fund – A Shares (SMAPX)* | 5.32% | 5.32% |
| Westwood Salient MLP & Energy Infrastructure Fund – C Shares (SMFPX) | 4.95% | 4.95% |
| Westwood Salient MLP & Energy Infrastructure Fund – Ultra Shares (SMRPX) | 5.54% | 5.54% |
| Alerian Midstream Energy Select Index | 6.13% | 6.13% |
| * | Without sales charge |
The performance data quoted represents past performance. Past performance does not guarantee future results. The investment return and principal value of an investment will fluctuate so that an investor’s shares, when redeemed, may be worth more or less than their original cost and current performance may be lower or higher than the performance quoted. The Adviser has contractually agreed to waive fees and reimburse expenses until April 30, 2024. In the absence of current fee waivers, total return and yield would have been lower.
The MLP & Energy Infrastructure Fund’s (SMLPX) Institutional Class returned 5.35% for the first half, which was below the benchmark return of 6.13%. Negative first-half attribution was driven primarily by the Fund’s overweight to the renewables and liquified natural gas (LNG) sectors, which generated -31 bps and -14 bps, respectively, of attribution for the portfolio. The Fund’s underweight to Natural Gas Pipelines and natural gas liquids (NGL) Infrastructure drove positive attribution of 64 bps and 22 bps, respectively.
6
| WESTWOOD FUNDS (Unaudited) |
The first half of 2023 was quite eventful for the energy infrastructure industry. First quarter market dynamics were driven by macro-oil expectations and the fear of an impending recession. During the past two recessions, in 2009 and 2020, oil demand declined globally. Investor fear of recession later this year led to a 20%+ oil price correction peak to trough during the first quarter of the year. We would note that global demand doesn’t always decline during a U.S. recession, for example in 2001 and 1991, demand did not decline globally during those recessions. Fortunately for the energy markets, OPEC+ continued to reiterate their commitment to keeping oil prices stable and, on April second, the cartel left no doubt of its commitment as it cut production by 1.15 million barrels per day (mmbpd). The move surprised many, but frankly, we believed at the time that the data was indicating the market was 1-2 mmbpd oversupplied. The 1.15 mmbpd cut — along with Russia’s extension of its 500,000-bpd cut from early in the year and a unilateral additional 1.0 mmbpd cut from Saudi Arabia for July and August — led to a strong rebound in oil prices during the second quarter. Looking ahead, we believe that oil prices at $70 or more are very supportive of the U.S. energy industry and, at the same time, are not overly onerous for consumers.
While the first quarter was macro driven, the second quarter saw positive company level developments, which helped the group rally through quarter end. First, legislation to complete the long-delayed Mountain Valley Pipeline (MVP) was included in the debt ceiling bill (i.e., Fiscal Responsibility Act of 2023). The legislation directed the U.S. Army Corps of Engineers to issue remaining water crossing permits within 21 days of passage. With permits issued, the MVP pipeline can complete construction by year end. The second big development during the quarter happened on Mother’s Day when Oneok (OKE) agreed to acquire Magellan Midstream Partners, L.P. (MMP) for a 22% premium to the prior close. Consideration for the deal consists of $25.00 in cash and 0.667 shares of OKE for every unit of MMP owned. Frankly, this was a surprise marriage to us as MMP operates in the crude and refined products markets while OKE is one of the major players in the NGL value chain. Strategically, it makes sense in terms of diversifying OKE’s operations, and perhaps more importantly, it could provide the company with a long-sought entry into NGL exports since MMP has crude oil export facilities along the Gulf Coast that may be expandable to include NGLs. Investors frequently ask us if we believe this is the beginning of an M&A wave, and our answer has been the same as it has for about 15 years: It is very difficult to predict large-scale transactions. What we can say is that we believe that asset-level acquisitions and divestitures (A&D) will continue as companies continue to streamline their operations. We also expect to see buyouts of private equity-backed companies and/or assets to continue as well, particularly in growth basins like the Permian.
Focusing on individual securities, being overweight Equitrans Midstream (ETRN) was the largest positive alpha generator for the first half of the year, delivering 71 bps of attribution to the portfolio. ETRN is the owner of the MVP pipeline, and the stock was up nearly 50% for the year as investors became more confident that the project will be completed. Being underweight Enbridge (ENB) generated 39 bps of positive attribution while being overweight Plains GP Holdings L.P. (PAGP) generated 37 bps of positive attribution. We believe relative performance of both ENB and PAGP was driven primarily by relative valuation changes during the first half of the year.
Performance detractors during the first half of the year were the Fund’s underweight in MMP, overweight in Genesis Energy (GEL) and overweight in Williams Cos. (WMB). MMP detracted 61 bps as we reduced our position in the company before the merger announcement, as we felt the stock was fully valued. GEL missed on 1Q earnings expectations and a slowdown in its soda ash business pressured the stock during the first half of the year. We took the opportunity to top up the position on weakness during the second quarter. Finally, the third largest detractor was WMB, which traded lower with natural gas price weakness during the first half of the year.
As we look forward, we remain constructive on the energy infrastructure industry in view of the following trends: 1) dividends are growing with ample excess cash flow coverage, 2) hydrocarbon volumes are growing, and 3) capital allocation remains mostly focused on returning excess cash to investors through buybacks and potential future dividend increases.
7
| WESTWOOD FUNDS (Unaudited) |
Westwood Broadmark Tactical Plus
The performance of the Westwood Broadmark Tactical Plus Fund for the periods ended June 30, 2023, was as follows:
| 2023 | ||
| 6 Months | Year to Date | |
| Westwood Broadmark Tactical Plus Fund – Institutional Shares (SBTIX) | 1.95% | 1.95% |
| Westwood Broadmark Tactical Plus Fund – A Shares (SBTAX)* | 1.90% | 1.90% |
| Westwood Broadmark Tactical Plus Fund – C Shares (SBTCX) | 1.35% | 1.35% |
| Westwood Broadmark Tactical Plus Fund – F Shares (BTPIX) | 2.16% | 2.16% |
| HFRX Equity Hedge Index | 2.96% | 2.96% |
| S&P 500 Index | 16.89% | 16.89% |
| * | Without sales charge |
The performance data quoted represents past performance. Past performance does not guarantee future results. The investment return and principal value of an investment will fluctuate so that an investor’s shares, when redeemed, may be worth more or less than their original cost and current performance may be lower or higher than the performance quoted. The Adviser has contractually agreed to waive fees and reimburse expenses until April 30, 2024. In the absence of current fee waivers, total return and yield would have been lower.
For the six months ended June 30, 2023, Westwood Broadmark Tactical Plus Fund’s Institutional Class shares returned +1.95%, providing a positive absolute record for investors but underperforming the Fund’s primary benchmark, the HFRX Equity Hedge Index, which returned +2.96%. The Fund underperformed its secondary benchmark, the S&P 500 Index, which rose +16.89% over the same period. The Fund showed better performance compared to its primary benchmark in the second quarter 2023, outperforming its HFRX primary benchmark by rising +2.95% vs. the HFRX’s return of +2.14%.
Stock prices rose strongly during the first half of 2023 fueled by anticipation that the Federal Reserve was nearing the end of the tightening cycle that began in early 2022. The Fed has now raised interest rates in 11 of its last 12 meetings to a level not seen just prior to the 2007 housing market crash. Despite higher interest rates, however, the U.S. economy continued to show great resilience and GDP expanded at an annualized 2.4% in the second quarter of 2023, higher than in the previous quarterly period and far above most market expectations. In our opinion, the strength in the economy was the primary reason for the strength in stock prices, in our opinion.
Equity valuations continue to be at elevated levels, which is a negative in our work. The median price-earnings multiple of the S&P 500 is still well above its historical norm. On the monetary front, the inverted yield curve is still troubling. The three-month/10-year U.S. Treasury yield curve reached the most negative level since the 2008-09 financial crisis during the first half of 2023. Over the last half century, this inversion has often been a harbinger of economic weakness and recession. In our opinion, investor sentiment also became overly optimistic in the first half of the year and has reached levels that have often accompanied market pullbacks. The bright spot in the team’s work has been market momentum. The team’s volume and breadth momentum models turned positive in the first half of 2023. As a result, the Fund maintained a reasonable net positive exposure to the market during the first half 2023, which contributed to the Fund’s positive absolute return.
The Fund invests primarily in a diversified portfolio of instruments which generally include futures and options on securities, securities indices and shares of exchange-traded funds (“ETFs”). The Fund regularly used options and futures during the year in the implementation of the strategy. A meaningful portion of the Fund’s return can be attributed to these derivative instruments.
8
| WESTWOOD FUNDS (Unaudited) |
As the Westwood Broadmark Tactical Plus Fund’s investment team looks ahead to the last half of 2023 and into 2024, there are several factors within its “Four Pillar Process” that the team will be watching:
| 1. | Valuation: Price earnings ratios have declined from their lofty levels of early 2022 but are still in historically overvalued territory. Indeed, the stock market’s advance has been largely the result of higher valuations rather than increases in earnings or profits. A decline in earnings and profits could therefore be a potential negative for equity valuations. |
| 2. | Monetary factors and credit conditions: The yield curve when comparing the three-month U.S. Treasury Bill yield with the 10-year U.S. Treasury yield reached its greatest inversion since the 2008-09 financial crisis. This inversion has occurred less than 12% of the time since 1962. Historical statistics show that during the time these inversions persisted, the S&P 500 has declined at an annual rate of -1.99%. While the first half of this year has so far been an exception to this historical record, the Tactical Plus Fund’s portfolio management team believes that this cycle may still have further to go before completion, which could be negative for equity markets as we approach 2024. |
| 3. | Sentiment: Investor sentiment became far more optimistic in the first half of 2023. Retail investors, which have not been a factor in the market in recent years, finally showed more optimism than they have in several years. This trend is negative from a contrary point of view but can persist for some time before reaching an extreme. |
| 4. | Momentum: The team’s breadth momentum model, which measures the breadth of Standard & Poor’s industry groups, improved significantly at the end of the second quarter. This was confirmed by our measures of upside and downside volume, which were also positive. The team raised market exposure and retained a generally net long market posture throughout the first half of 2023 largely due to positive market momentum. |
To determine if a Fund is an appropriate investment for you, carefully consider the Fund’s investment objectives, risk factors, charges and expenses before investing. This and other information can be found in the Fund’s prospectus, which may be obtained by calling 1.877.386.3944. Read the prospectus carefully before investing or sending money.
Past performance is not predictive of future performance. Investment results and principal value will fluctuate so that shares, when redeemed, may be worth more or less than their original cost. Current performance may be higher or lower than the performance data quoted. Performance data current to the most recent month end are available by calling 1.877.386.3944.
An investor should consider the investment objectives, risks, charges and expenses of each Fund carefully before investing. The Funds’ prospectus contains this and other important information. To obtain a copy of the Funds’ prospectus, please visit the Funds’ website at www.westwoodfunds.com or call 1.877.386.3944 and a copy will be sent to you free of charge. Please read the prospectus carefully before you invest. The Funds are distributed by Ultimus Fund Distributors, LLC.
The Letter to Shareholders seeks to describe some of the Funds’ adviser’s current opinions and views of the financial markets. Although the Funds’ adviser believes it has a reasonable basis for any opinions or views expressed, actual results may differ, sometimes significantly so, from those expected or expressed. The securities held by the Funds that are discussed in the Letter to Shareholders were held during the period covered by this Report. They do not comprise the entire investment portfolios of the Funds, may be sold at any time, and may no longer be held by the Funds. For a complete list of securities held by the Funds as of June 30, 2023, see the Schedules of Investments section of this Report. The opinions of the Funds’ adviser with respect to those securities may change at any time.
Statements in the Letter to Shareholders that reflect projections or expectations for future financial or economic performance of the Funds and the market in general and statements of the Funds’ plans and objectives for future operations
9
| WESTWOOD FUNDS (Unaudited) |
are forward-looking statements. No assurance can be given that actual results or events will not differ materially from those projected, estimated, assumed, or anticipated in any such forward-looking statements. Important factors that could result in such differences, in addition to factors noted with such forward-looking statements include, without limitation, general economic conditions, such as inflation, recession, and interest rates. Past performance is not a guarantee of future results.
10
| WESTWOOD FUNDS (Unaudited) |
Definitions to add:
Alerian Midstream Energy Select Index (AMEIX) is a composite of North American midstream energy infrastructure companies that are engaged in activities involving energy commodities. The capped, float-adjusted, capitalization-weighted index is disseminated in real time on a price-return basis.
Alpha is the measure of risk-adjusted performance.
FTSE EPRA Nareit Developed Index is designed to track the performance of listed real estate companies and REITs worldwide.
HFRX Equity Hedge Index comprises private funds with strategies that maintain both long and short positions primarily in equity securities and equity derivatives.
ICE BofA Fixed Rate Preferred Securities Index consists of investment-grade, fixed and fixed-to-floating rate U.S. dollar-denominated preferred securities.
MSCI World Index is a free float-adjusted market capitalization index designed to measure equity market performance in the global developed markets.
S&P 500 Index is an unmanaged capitalization-weighted index of 500 stocks designed to measure performance of the broad domestic stock market through changes in the aggregate market value of 500 stocks representing all major industries.
11
| WESTWOOD SALIENT MLP & ENERGY INFRASTRUCTURE FUND |
| JUNE 30, 2023 (Unaudited) |
| Sector Weightings (Unaudited)† |
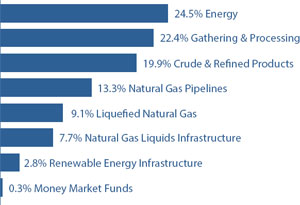
| † | Percentages are based on total investments. |
| SCHEDULE OF INVESTMENTS |
| MASTER LIMITED PARTNERSHIPS — 23.8% (a) |
| Shares | Value | |||||||
| Crude & Refined Products — 3.2% | ||||||||
| Genesis Energy LP | 2,395,071 | $ | 22,872,928 | |||||
| MPLX LP | 175,366 | 5,951,922 | ||||||
| 28,824,850 | ||||||||
| Energy — 16.2% | ||||||||
| Energy Transfer LP | 5,652,966 | 71,792,668 | ||||||
| Enterprise Products Partners LP | 2,787,651 | 73,454,604 | ||||||
| 145,247,272 | ||||||||
| Gathering & Processing — 4.4% | ||||||||
| Crestwood Equity Partners LP | 192,727 | 5,103,411 | ||||||
| Western Midstream Partners LP | 1,292,207 | 34,269,330 | ||||||
| 39,372,741 | ||||||||
| Total Master Limited Partnerships | ||||||||
| (Cost $166,026,157) | $ | 213,444,863 | ||||||
| MLP RELATED COMPANIES — 75.8% | ||||||||
| Crude & Refined Products — 16.6% | ||||||||
| Enbridge, Inc. | 1,262,000 | $ | 46,883,300 | |||||
| Gibson Energy, Inc. (b) | 2,596,191 | 41,273,152 | ||||||
| Plains GP Holdings LP - Class A (b) | 4,091,600 | 60,678,428 | ||||||
| 148,834,880 | ||||||||
| Energy — 8.3% | ||||||||
| Array Technologies, Inc. (b) | 356,454 | 8,055,860 | ||||||
| DT Midstream, Inc. | 821,531 | 40,723,291 | ||||||
| EMG Utica I Offshore Co- Investment LP (b)(c)(d)(e) | 16,000,000 | 8,960,000 | ||||||
| Enphase Energy, Inc. (b) | 49,877 | 8,353,401 | ||||||
| Excelerate Energy, Inc. - Class A | 162,739 | 3,308,484 | ||||||
| Pembina Pipeline Corp. | 51,600 | 1,622,304 | ||||||
| Shoals Technologies Group, Inc. - Class A (b) | 96,799 | 2,474,182 | ||||||
| MLP RELATED COMPANIES — continued |
| Shares | Value | |||||||
| Energy — continued | ||||||||
| Sunnova Energy International, Inc. (b) | 34,887 | $ | 638,781 | |||||
| 74,136,303 | ||||||||
| Gathering & Processing — 18.0% | ||||||||
| Antero Midstream Corp. | 1,296,645 | 15,041,082 | ||||||
| EnLink Midstream, LLC (b) | 2,616,752 | 27,737,571 | ||||||
| Hess Midstream LP - Class A | 1,090,141 | 33,445,526 | ||||||
| Targa Resources Corp. | 1,114,443 | 84,809,112 | ||||||
| 161,033,291 | ||||||||
| Liquefied Natural Gas — 9.1% | ||||||||
| Cheniere Energy, Inc. | 532,652 | 81,154,859 | ||||||
| Natural Gas Liquids Infrastructure — 7.7% | ||||||||
| Keyera Corp. | 620,796 | 14,316,365 | ||||||
| ONEOK, Inc. | 494,969 | 30,549,486 | ||||||
| Pembina Pipeline Corp. | 763,766 | 24,013,085 | ||||||
| 68,878,936 | ||||||||
| Natural Gas Pipelines — 13.3% | ||||||||
| Equitrans Midstream Corp. | 3,995,960 | 38,201,378 | ||||||
| Kinder Morgan, Inc. | 2,511,008 | 43,239,557 | ||||||
| Williams Cos., Inc. (The) | 1,155,200 | 37,694,176 | ||||||
| 119,135,111 | ||||||||
| Renewable Energy Infrastructure — 2.8% | ||||||||
| Bloom Energy Corp. - Class A (b) | 206,499 | 3,376,259 | ||||||
| First Solar, Inc. (b) | 12,000 | 2,281,080 | ||||||
| FTC Solar, Inc. (b) | 330,448 | 1,064,043 | ||||||
| Plug Power, Inc. (b) | 243,234 | 2,527,201 | ||||||
| SolarEdge Technologies, Inc. (b) | 40,487 | 10,893,027 | ||||||
| Sunrun, Inc. (b) | 256,235 | 4,576,357 | ||||||
| 24,717,967 | ||||||||
| Total MLP Related Companies | ||||||||
| (Cost $375,992,114) | $ | 677,891,347 | ||||||
| SPECIAL PURPOSE ACQUISITION COMPANIES — 0.0% (f) | ||||||||
| Renewable Energy Infrastructure — 0.0% (f) | ||||||||
| TortoiseEcofin Acquisition Corp. III - Founder Shares (b)(c)(d)(e) (Cost $315) | 104,850 | $ | 315 | |||||
The accompanying notes are an integral part of the financial statements.
12
| WESTWOOD SALIENT MLP & ENERGY INFRASTRUCTURE FUND |
| JUNE 30, 2023 (Unaudited) |
| MONEY MARKET FUNDS — 0.3% |
| First American Government Obligations Fund - Class X, 5.03% (g) (Cost $3,107,852) | 3,107,852 | $ | 3,107,852 | |||||
| Investments at Value — 99.9% | ||||||||
| (Cost $545,126,438) | $ | 894,444,377 | ||||||
| Other Assets in Excess of Liabilities — 0.1% | 799,327 | |||||||
| Net Assets — 100.0% | $ | 895,243,704 | ||||||
| (a) | The security is considered a non-income producing security as any distributions received during the last 12 months (if applicable) are treated as return of capital per Generally Accepted Accounting Principles. |
| (b) | Non-income producing security. |
| (c) | These securities are exempt from registration under the Securities Act of 1933 and are subject to legal restrictions on resale. These securities generally may be resold in transactions exempt from registration, normally to qualified institutional buyers, or to the public if the securities are subsequently registered. |
| (d) | Security determined to be illiquid under the procedures approved by the Fund’s Board of Trustees and represents 1.0% of net assets. |
| (e) | Level 3 security in accordance with fair value hierarchy. |
| (f) | Percentage rounds to less than 0.1%. |
| (g) | The rate shown is the 7-day effective yield as of June 30, 2023. |
The accompanying notes are an integral part of the financial statements.
13
| WESTWOOD SALIENT MLP & ENERGY INFRASTRUCTURE FUND |
| JUNE 30, 2023 (Unaudited) |
| SCHEDULE OF OPEN WRITTEN OPTION CONTRACTS |
| WRITTEN OPTION CONTRACTS |
| Strike | Notional | Value of | ||||||||||||||
| Price | Contracts | Value | Options | |||||||||||||
| Call Option Contracts | ||||||||||||||||
| Array Technologies, Inc., 08/18/23 | $ | 30.00 | 9 | $ | 20,340 | $ | 270 | |||||||||
| Bloom Energy Corp. - Class A, 07/21/23 | 17.00 | 1,328 | 2,171,280 | 73,040 | ||||||||||||
| Bloom Energy Corp. - Class A, 07/21/23 | 19.00 | 736 | 1,203,360 | 12,512 | ||||||||||||
| Cheniere Energy, Inc., 07/21/23 | 160.00 | 2,502 | 38,120,472 | 187,650 | ||||||||||||
| Enterprise Products Partners LP, 07/21/23 | 27.00 | 2,071 | 5,457,085 | 10,355 | ||||||||||||
| EnLink Midstream, LLC, 07/21/23 | 11.00 | 13,243 | 14,037,580 | 198,645 | ||||||||||||
| EnLink Midstream, LLC, 08/18/23 | 11.00 | 12,924 | 13,699,440 | 400,644 | ||||||||||||
| Enphase Energy, Inc., 07/21/23 | 220.00 | 125 | 2,093,500 | 3,250 | ||||||||||||
| Enphase Energy, Inc., 08/18/23 | 220.00 | 124 | 2,076,752 | 31,000 | ||||||||||||
| Equitrans Midstream Corp., 07/21/23 | 10.00 | 27,863 | 26,637,028 | 417,945 | ||||||||||||
| First Solar, Inc., 07/21/23 | 200.00 | 120 | 2,281,080 | 37,800 | ||||||||||||
| Hess Midstream LP - Class A, 07/21/23 | 30.00 | 10,901 | 33,444,268 | 1,253,615 | ||||||||||||
| Kinder Morgan, Inc., 07/21/23 | 18.00 | 417 | 718,074 | 1,668 | ||||||||||||
| MPLX LP, 07/21/23 | 35.00 | 240 | 814,560 | 2,400 | ||||||||||||
| ONEOK, Inc., 07/21/23 | 62.50 | 4,949 | 30,545,228 | 470,155 | ||||||||||||
| Plains GP Holdings, LP - Class A, 07/21/23 | 15.00 | 40,916 | 60,678,428 | 818,320 | ||||||||||||
| Plug Power, Inc., 07/21/23 | 10.00 | 1,530 | 2,732,580 | 136,170 | ||||||||||||
| Plug Power, Inc., 08/18/23 | 10.00 | 902 | 1,610,972 | 132,594 | ||||||||||||
| SolarEdge Technologies, Inc., 08/18/23 | 330.00 | 101 | 2,717,405 | 36,360 | ||||||||||||
| Shoals Technologies Group, Inc. - Class A, 07/21/23 | 25.00 | 484 | 1,237,104 | 72,600 | ||||||||||||
| Shoals Technologies Group, Inc. - Class A, 07/21/23 | 30.00 | 483 | 1,234,548 | 6,762 | ||||||||||||
| Sunrun, Inc., 07/21/23 | 25.00 | 2,562 | 4,575,732 | 17,934 | ||||||||||||
| Targa Resources Corp., 07/21/23 | 75.00 | 1,114 | 8,477,540 | 382,102 | ||||||||||||
| Targa Resources Corp., 08/18/23 | 80.00 | 1,114 | 8,477,540 | 144,820 | ||||||||||||
| Williams Cos., Inc. (The), 07/21/23 | 31.00 | 3,948 | 12,882,324 | 694,848 | ||||||||||||
| Williams Cos., Inc. (The), 07/21/23 | 32.00 | 7,604 | 24,811,852 | 760,400 | ||||||||||||
| Total Written Option Contracts | ||||||||||||||||
| (Premiums $3,554,049) | $ | 302,756,072 | $ | 6,303,859 | ||||||||||||
The accompanying notes are an integral part of the financial statements.
14
| WESTWOOD SALIENT GLOBAL REAL ESTATE FUND |
| JUNE 30, 2023 (Unaudited) |
| Sector Weightings (Unaudited)† |

| † | Percentages are based on total investments. |
| SCHEDULE OF INVESTMENTS |
| COMMON STOCKS — 96.3% |
| Shares | Value | |||||||
| Australia — 4.2% | ||||||||
| GPT Group (The) (a) | 190,000 | $ | 525,664 | |||||
| Scentre Group (a) | 154,000 | 272,308 | ||||||
| 797,972 | ||||||||
| Canada — 7.4% | ||||||||
| Dream Industrial Real Estate Investment Trust | 50,000 | 532,561 | ||||||
| Granite Real Estate Investment Trust | 14,600 | 863,835 | ||||||
| 1,396,396 | ||||||||
| Germany — 1.5% | ||||||||
| Vonovia SE (a) | 14,000 | 273,422 | ||||||
| Hong Kong — 5.5% | ||||||||
| Henderson Land Development Co., Ltd. (a) | 63,000 | 187,615 | ||||||
| Link REIT (a) | 51,600 | 287,263 | ||||||
| Sun Hung Kai Properties, Ltd. (a) | 30,000 | 379,037 | ||||||
| Swire Properties, Ltd. (a) | 76,000 | 187,253 | ||||||
| 1,041,168 | ||||||||
| Japan — 14.2% | ||||||||
| Mitsubishi Estate Co., Ltd. (a) | 50,600 | 601,220 | ||||||
| Mitsui Fudosan Co., Ltd. (a) | 38,000 | 757,488 | ||||||
| Sumitomo Realty & Development Co., Ltd. (a) | 27,000 | 669,170 | ||||||
| Tokyo Tatemono Co., Ltd. (a) | 49,500 | 637,518 | ||||||
| 2,665,396 | ||||||||
| COMMON STOCKS — continued |
| Shares | Value | |||||||
| Singapore — 4.4% | ||||||||
| CapitaLand Ascott Trust (a) | 19,042 | $ | 15,262 | |||||
| CapitaLand Investment, Ltd. (a) | 334,000 | 820,644 | ||||||
| 835,906 | ||||||||
| Spain — 3.1% | ||||||||
| Inmobiliaria Colonial Socimi S.A. (a) | 95,000 | 576,030 | ||||||
| Sweden — 1.2% | ||||||||
| Hufvudstaden AB - Class A (a) | 18,300 | 217,439 | ||||||
| United Kingdom — 2.8% | ||||||||
| Great Portland Estates plc (a) | 43,500 | 230,056 | ||||||
| Segro plc (a) | 32,700 | 298,124 | ||||||
| 528,180 | ||||||||
| United States — 52.0% | ||||||||
| Alexandria Real Estate Equities, Inc. | 5,000 | 567,450 | ||||||
| Americold Realty Trust, Inc. | 21,200 | 684,760 | ||||||
| Apple Hospitality REIT, Inc. | 13,000 | 196,430 | ||||||
| Crown Castle, Inc. | 3,308 | 376,913 | ||||||
| CubeSmart | 16,100 | 719,026 | ||||||
| Digital Realty Trust, Inc. | 5,750 | 654,752 | ||||||
| Equinix, Inc. | 900 | 705,546 | ||||||
| Federal Realty Investment Trust | 5,500 | 532,235 | ||||||
| Gaming and Leisure Properties, Inc. | 13,400 | 649,364 | ||||||
| Host Hotels & Resorts, Inc. | 18,000 | 302,940 | ||||||
| Independence Realty Trust, Inc. | 37,100 | 675,962 | ||||||
| Iron Mountain, Inc. | 11,200 | 636,384 | ||||||
| Phillips Edison & Co., Inc. | 19,500 | 664,560 | ||||||
| Prologis, Inc. | 5,200 | 637,676 | ||||||
| Ventas, Inc. | 9,400 | 444,338 | ||||||
| VICI Properties, Inc. | 19,400 | 609,742 | ||||||
| Welltower, Inc. | 9,000 | 728,010 | ||||||
| 9,786,088 | ||||||||
| Total Common Stocks | ||||||||
| (Cost $18,651,497) | $ | 18,117,997 | ||||||
The accompanying notes are an integral part of the financial statements.
15
| WESTWOOD SALIENT GLOBAL REAL ESTATE FUND |
| JUNE 30, 2023 (Unaudited) |
| MONEY MARKET FUNDS — 3.2% |
| Shares | Value | |||||||
| First American Government Obligations Fund - Class X, 5.03% (b) (Cost $611,918) | 611,918 | $ | 611,918 | |||||
| Investments at Value — 99.5% | ||||||||
| (Cost $19,263,415) | $ | 18,729,915 | ||||||
| Other Assets in Excess of Liabilities — 0.5% | 93,194 | |||||||
| Net Assets — 100.0% | $ | 18,823,109 | ||||||
| (a) | Level 2 security (Note 2). |
| (b) | The rate shown is the 7-day effective yield as of June 30, 2023. |
AB - Aktiebolag
plc - Public Limited Company
S.A. - Societe Anonyme
SE - Societe Europaea
REIT- Real Estate Investment Trust
The accompanying notes are an integral part of the financial statements.
16
| WESTWOOD SALIENT SELECT INCOME FUND |
| JUNE 30, 2023 (Unaudited) |
| Sector Weightings (Unaudited)† |
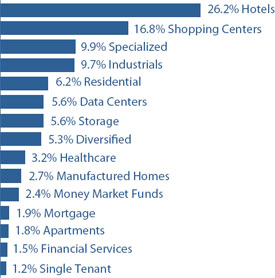
| † | Percentages are based on total investments. |
| SCHEDULE OF INVESTMENTS |
| COMMON STOCKS — 28.4% |
| Shares | Value | |||||||
| Real Estate Investment Trusts (REITs) — 28.4% | ||||||||
| Data Centers — 2.1% | ||||||||
| Digital Realty Trust, Inc. | 46,105 | $ | 5,249,977 | |||||
| Financial Services — 1.5% | ||||||||
| W.P. Carey, Inc. | 55,000 | 3,715,800 | ||||||
| Hotels — 6.5% | ||||||||
| Apple Hospitality REIT, Inc. | 400,000 | 6,044,000 | ||||||
| Gaming and Leisure Properties, Inc. | 123,100 | 5,965,426 | ||||||
| Host Hotels & Resorts, Inc. | 250,000 | 4,207,500 | ||||||
| 16,216,926 | ||||||||
| Industrial — 4.2% | ||||||||
| Americold Realty Trust, Inc. | 157,000 | 5,071,100 | ||||||
| Prologis, Inc. | 45,000 | 5,518,350 | ||||||
| 10,589,450 | ||||||||
| Manufactured Homes — 1.7% | ||||||||
| Sun Communities, Inc. | 32,000 | 4,174,720 | ||||||
| Residential — 2.0% | ||||||||
| Equity Residential | 75,000 | 4,947,750 | ||||||
| Shopping Centers — 3.4% | ||||||||
| Phillips Edison & Co., Inc. | 136,500 | 4,651,920 | ||||||
| RPT Realty | 368,903 | 3,855,036 | ||||||
| 8,506,956 | ||||||||
| COMMON STOCKS — continued |
| Shares | Value | |||||||
| Real Estate Investment Trusts (REITs) — continued | ||||||||
| Specialized — 5.0% | ||||||||
| Crown Castle, Inc. | 52,652 | $ | 5,999,169 | |||||
| Outfront Media, Inc. | 405,000 | 6,366,600 | ||||||
| 12,365,769 | ||||||||
| Storage — 2.0% | ||||||||
| CubeSmart | 110,000 | 4,912,600 | ||||||
| Total Common Stocks | ||||||||
| (Cost $69,950,305) | $ | 70,679,948 | ||||||
| PREFERRED STOCKS — 66.6% |
| Real Estate Investment Trusts (REITs) — 66.6% | ||||||||
| Apartments — 1.8% | ||||||||
| Centerspace - Series C, 6.63% | 180,400 | $ | 4,437,840 | |||||
| Data Centers — 3.4% | ||||||||
| DigitalBridge Group, Inc. - Series H, 7.13% | 240,000 | 5,071,200 | ||||||
| DigitalBridge Group, Inc. - Series I, 7.15% | 160,000 | 3,368,000 | ||||||
| 8,439,200 | ||||||||
| Diversified — 5.1% | ||||||||
| Armada Hoffler Properties, Inc. - Series A, 6.75% | 306,029 | 7,182,500 | ||||||
| CTO Realty Growth, Inc. - Series A, 6.38% | 282,333 | 5,576,077 | ||||||
| 12,758,577 | ||||||||
| Healthcare — 3.1% | ||||||||
| Global Medical REIT, Inc. - Series A, 7.50% | 311,134 | 7,831,243 | ||||||
| Hotels — 18.9% | ||||||||
| Chatham Lodging Trust - Series A, 6.63% | 190,000 | 3,610,000 | ||||||
| DiamondRock Hospitality Co. - Series A, 8.25% | 66,410 | 1,694,783 | ||||||
| Hersha Hospitality Trust - Series C, 6.88% | 260,000 | 5,057,000 | ||||||
| Hersha Hospitality Trust - Series D, 6.50% | 250,000 | 4,937,500 | ||||||
| Hersha Hospitality Trust - Series E, 6.50% | 255,000 | 4,936,800 | ||||||
| Pebblebrook Hotel Trust - Series G, 6.38% | 205,000 | 3,833,500 | ||||||
| Pebblebrook Hotel Trust - Series H, 5.70% | 100,000 | 1,740,000 | ||||||
| RLJ Lodging Trust - Series A, 7.80% | 375,000 | 9,033,750 | ||||||
| Summit Hotel Properties, Inc. - Series E, 6.25% | 283,000 | 5,872,250 | ||||||
The accompanying notes are an integral part of the financial statements.
17
| WESTWOOD SALIENT SELECT INCOME FUND |
| JUNE 30, 2023 (Unaudited) |
| PREFERRED STOCKS — continued |
| Shares | Value | |||||||
| Real Estate Investment Trusts (REITs) — continued | ||||||||
| Hotels — continued | ||||||||
| Summit Hotel Properties, Inc. - Series F, 5.88% | 158,938 | $ | 3,113,595 | |||||
| Sunstone Hotel Investors, Inc. - Series H, 6.13% | 166,508 | 3,365,127 | ||||||
| 47,194,305 | ||||||||
| Industrial — 5.1% | ||||||||
| LXP Industrial Trust - Series C, 6.50% | 190,000 | 9,429,700 | ||||||
| Plymouth Industrial REIT, Inc. - Series A, 7.50% | 135,269 | 3,388,489 | ||||||
| 12,818,189 | ||||||||
| Manufactured Homes — 1.0% | ||||||||
| UMH Properties, Inc. - Series D, 6.38% | 111,895 | 2,454,976 | ||||||
| Mortgage — 1.8% | ||||||||
| KKR Real Estate Finance Trust, Inc. - Series A, 6.50% | 250,000 | 4,500,000 | ||||||
| Residential — 4.1% | ||||||||
| American Homes 4 Rent - Series G, 5.88% | 345,000 | 8,335,200 | ||||||
| American Homes 4 Rent - Series H, 6.25% | 71,000 | 1,774,290 | ||||||
| 10,109,490 | ||||||||
| Shopping Centers — 13.0% | ||||||||
| RPT Realty - Series D, 7.25% | 180,000 | 8,820,000 | ||||||
| Saul Centers, Inc. - Series D, 6.13% | 381,000 | 8,366,760 | ||||||
| Saul Centers, Inc. - Series E, 6.00% | 125,000 | 2,693,750 | ||||||
| SITE Centers Corporation - Series A, 6.60% | 25,000 | 600,750 | ||||||
| Urstadt Biddle Properties, Inc. - Series H, 6.25% | 322,000 | 7,561,011 | ||||||
| Urstadt Biddle Properties, Inc. - Series K, 5.88% | 190,000 | 4,246,500 | ||||||
| 32,288,771 | ||||||||
| Single Tenant — 1.2% | ||||||||
| Spirit Realty Capital, Inc. - Series A, 6.00% | 130,000 | 2,902,900 | ||||||
| Specialized — 4.6% | ||||||||
| CorEnergy Infrastructure Trust, Inc. - Series A, 7.38% | 165,438 | 1,488,942 | ||||||
| EPR Properties - Series C, 5.75% | 31,000 | 654,100 | ||||||
| EPR Properties - Series E, 9.00% | 280,000 | 7,940,800 | ||||||
| EPR Properties - Series G, 5.75% | 70,246 | 1,414,052 | ||||||
| 11,497,894 | ||||||||
| PREFERRED STOCKS — continued |
| Shares | Value | |||||||
| Real Estate Investment Trusts (REITs) — continued | ||||||||
| Storage — 3.5% | ||||||||
| National Storage Affiliates Trust - Series A, 6.00% | 370,000 | $ | 8,632,100 | |||||
| Total Preferred Stocks | ||||||||
| (Cost $160,197,982) | $ | 165,865,485 | ||||||
| MONEY MARKET FUNDS — 2.4% | ||||||||
| First American Government Obligations Fund - Class X, 5.03% (a) (Cost $5,841,413) | 5,841,413 | $ | 5,841,413 | |||||
| Investments at Value — 97.4% | ||||||||
| (Cost $235,989,700) | $ | 242,386,846 | ||||||
| Other Assets in Excess of Liabilities — 2.6% | 6,571,083 | |||||||
| Net Assets — 100.0% | $ | 248,957,929 | ||||||
| (a) | The rate shown is the 7-day effective yield as of June 30, 2023. |
REIT - Real Estate Investment Trust
The accompanying notes are an integral part of the financial statements.
18
| WESTWOOD BROADMARK TACTICAL GROWTH FUND |
| JUNE 30, 2023 (Unaudited) |
| SCHEDULE OF INVESTMENTS |
| EXCHANGE-TRADED FUNDS — 50.0% |
| Shares | Value | |||||||
| SPDR® S&P 500 ETF Trust (Cost $125,448,359) | 296,452 | $ | 131,411,242 | |||||
| MONEY MARKET FUNDS — 62.3% |
| Shares | Value | |||||||
| First American Government Obligations Fund - Class X, 5.03% (a) (Cost $163,745,531) | 163,745,531 | $ | 163,745,531 | |||||
| Investments at Value — 112.3% | ||||||||
| (Cost $289,193,890) | $ | 295,156,773 | ||||||
| Liabilities in Excess of Other Assets — (12.3%) | (32,375,004 | ) | ||||||
| Net Assets — 100.0% | $ | 262,781,769 | ||||||
| (a) | The rate shown is the 7-day effective yield as of June 30, 2023. |
ETF - Exchange-Traded Funds
S&P - Standard & Poor
SPDR - Standard and Poor’s Depository Receipts
The accompanying notes are an integral part of the financial statements.
19
| WESTWOOD BROADMARK TACTICAL PLUS FUND |
| JUNE 30, 2023 (Unaudited) |
| SCHEDULE OF INVESTMENTS |
| MONEY MARKET FUNDS — 97.0% |
| Shares | Value | |||||||
| First American Government Obligations Fund - Class X, 5.03% (a) (Cost $75,811,192) | 75,811,192 | $ | 75,811,192 | |||||
| Other Assets in Excess of Liabilities — 3.0% | 2,356,032 | |||||||
| Net Assets — 100.0% | $ | 78,167,224 | ||||||
| (a) | The rate shown is the 7-day effective yield as of June 30, 2023. |
| SCHEDULE OF FUTURES CONTRACTS |
| FUTURES CONTRACTS^ |
| Value/ | ||||||||||||
| Expiration | Notional | Unrealized | ||||||||||
| Contracts | Date | Value | Appreciation* | |||||||||
| Index Futures | ||||||||||||
| E-Mini S&P® 500 Futures | 220 | 9/15/2023 | $ | 49,370,750 | $ | 1,174,371 | ||||||
| ^ | Cash has been pledged as collateral for futures contract held by the Fund. |
| * | Includes cumulative appreciation (depreciation) of futures contracts from the date that contracts were opened through June 30, 2023. Only current day variation margin is reported on the Statement of Assets and Liabilities. |
The accompanying notes are an integral part of the financial statements.
20
| WESTWOOD FUNDS |
| JUNE 30, 2023 (Unaudited) |
| STATEMENTS OF ASSETS AND LIABILITIES |
| Westwood | ||||||||||||||||||||
| Salient | Westwood | Westwood | ||||||||||||||||||
| MLP & Energy | Westwood | Westwood | Broadmark | Broadmark | ||||||||||||||||
| Infrastructure | Salient Global | Salient Select | Tactical | Tactical | ||||||||||||||||
| Fund | Real Estate Fund | Income Fund | Growth Fund | Plus Fund | ||||||||||||||||
| ASSETS | ||||||||||||||||||||
| Investments in securities: | ||||||||||||||||||||
| At cost | $ | 545,126,438 | $ | 19,263,415 | $ | 235,989,700 | $ | 289,193,890 | $ | 75,811,192 | ||||||||||
| At value (Note 2) | $ | 894,444,377 | $ | 18,729,915 | $ | 242,386,846 | $ | 295,156,773 | $ | 75,811,192 | ||||||||||
| Foreign currency at value (Cost $700,608, $—, $—, $—, $—) | 700,608 | — | — | — | — | |||||||||||||||
| Cash | — | — | — | — | 2,168,320 | |||||||||||||||
| Variation margin receivable | — | — | — | — | 466,350 | |||||||||||||||
| Receivable for capital shares sold | 285,161 | — | 738,723 | 36,070 | 2,074 | |||||||||||||||
| Receivable for investment securities sold | 6,596,526 | — | 4,217,314 | — | — | |||||||||||||||
| Due from Adviser (Note 4) | — | 9,069 | — | — | — | |||||||||||||||
| Dividends receivable | 673,325 | 94,675 | 2,109,207 | 1,081,335 | 301,069 | |||||||||||||||
| Tax reclaims receivable | — | 27,183 | — | — | — | |||||||||||||||
| Other assets | 330,762 | 28,270 | 113,080 | 94,796 | 45,180 | |||||||||||||||
| Total assets | 903,030,759 | 18,889,112 | 249,565,170 | 296,368,974 | 78,794,185 | |||||||||||||||
| LIABILITIES | ||||||||||||||||||||
| Written call options, at value (Notes 1 & 4) (premiums received $3,554,049, $—, $—, $—, $—) | 6,303,859 | — | — | — | — | |||||||||||||||
| Payable for capital shares redeemed | 506,299 | 29,984 | 45,845 | 137,348 | 556,221 | |||||||||||||||
| Payable for investment securities purchased | — | — | 204,859 | 33,084,441 | — | |||||||||||||||
| Payable to adviser, net of waivers (Note 4) | 643,549 | — | 160,860 | 231,823 | 46,275 | |||||||||||||||
| Payable to administrator (Note 4) | 31,410 | 1,630 | 8,186 | 7,418 | 2,325 | |||||||||||||||
| Accrued administrative servicing fees — Institutional Shares | 131,632 | 548 | 25,869 | 48,285 | 3,786 | |||||||||||||||
| Accrued administrative servicing fees — A Class Shares | 33,137 | 12,051 | 68,881 | 18,473 | 214 | |||||||||||||||
| Accrued administrative servicing fees — C Class Shares | 6,533 | 1,801 | 9,686 | 12,182 | 119 | |||||||||||||||
| Accrued administrative servicing fees — F Class Shares | — | — | — | — | 5,155 | |||||||||||||||
| Payable for distribution fees — A Class Shares | 56,205 | 9,862 | 62,734 | 19,086 | 1,363 | |||||||||||||||
| Payable for distribution fees — C Class Shares | 30,332 | 781 | 8,556 | 18,379 | 2,074 | |||||||||||||||
| Other accrued expenses | 44,099 | 9,346 | 11,765 | 9,770 | 9,429 | |||||||||||||||
| Total liabilities | 7,787,055 | 66,003 | 607,241 | 33,587,205 | 626,961 | |||||||||||||||
| NET ASSETS | $ | 895,243,704 | $ | 18,823,109 | $ | 248,957,929 | $ | 262,781,769 | $ | 78,167,224 | ||||||||||
| NET ASSETS CONSIST OF: | ||||||||||||||||||||
| Paid-in capital | 1,351,887,171 | 44,157,916 | 243,596,113 | 258,295,118 | 77,339,029 | |||||||||||||||
| Accumulated earnings (deficit) | (456,643,467 | ) | (25,334,807 | ) | 5,361,816 | 4,486,651 | 828,195 | |||||||||||||
| NET ASSETS | $ | 895,243,704 | $ | 18,823,109 | $ | 248,957,929 | $ | 262,781,769 | $ | 78,167,224 | ||||||||||
| NET ASSET VALUE PER SHARE: | ||||||||||||||||||||
| INSTITUTIONAL SHARES | ||||||||||||||||||||
| Net assets applicable to Institutional Shares | $ | 719,998,633 | $ | 2,168,400 | $ | 137,707,046 | $ | 233,422,968 | $ | 35,707,058 | ||||||||||
| Institutional Shares of beneficial interest outstanding | 95,820,846 | 185,606 | 7,687,100 | 8,802,935 | 3,101,969 | |||||||||||||||
| Net asset value, offering price and redemption price per share (Note 1) | $ | 7.51 | $ | 11.68 | $ | 17.91 | $ | 26.52 | $ | 11.51 | ||||||||||
| A CLASS SHARES | ||||||||||||||||||||
| Net assets applicable to A Class Shares | $ | 134,953,675 | $ | 15,606,894 | $ | 105,389,701 | $ | 22,554,110 | $ | 605,294 | ||||||||||
| A Class Shares of beneficial interest outstanding | 17,862,789 | 1,330,055 | 5,858,735 | 913,468 | 53,637 | |||||||||||||||
| Net asset value, offering price and redemption price per share (Note 1) | $ | 7.56 | $ | 11.73 | $ | 17.99 | $ | 24.69 | $ | 11.29 | ||||||||||
| Maximum sales charge | 3.00 | % | 3.00 | % | 3.00 | % | 3.00 | % | 3.00 | % | ||||||||||
| Maximum offering price per share | $ | 7.79 | $ | 12.09 | $ | 18.55 | $ | 25.45 | $ | 11.64 | ||||||||||
The accompanying notes are an integral part of the financial statements.
21
| WESTWOOD FUNDS |
| JUNE 30, 2023 (Unaudited) |
| STATEMENTS OF ASSETS AND LIABILITIES (CONTINUED) |
| Westwood | ||||||||||||||||||||
| Salient | Westwood | Westwood | ||||||||||||||||||
| MLP & Energy | Westwood | Westwood | Broadmark | Broadmark | ||||||||||||||||
| Infrastructure | Salient Global | Salient Select | Tactical | Tactical | ||||||||||||||||
| Fund | Real Estate Fund | Income Fund | Growth Fund | Plus Fund | ||||||||||||||||
| C CLASS SHARES | ||||||||||||||||||||
| Net assets applicable to C Class Shares | $ | 15,041,442 | $ | 1,047,815 | $ | 5,861,182 | $ | 6,804,691 | $ | 414,126 | ||||||||||
| C Class Shares of beneficial interest outstanding | 2,000,174 | 89,592 | 337,657 | 300,062 | 39,423 | |||||||||||||||
| Net asset value, offering price and redemption price per share (Note 1) | $ | 7.52 | $ | 11.70 | $ | 17.36 | $ | 22.68 | $ | 10.50 | ||||||||||
| F CLASS SHARES | ||||||||||||||||||||
| Net assets applicable to F Class Shares | N/A | N/A | N/A | N/A | $ | 41,440,746 | ||||||||||||||
| F Class Shares of beneficial interest outstanding | N/A | N/A | N/A | N/A | 3,513,323 | |||||||||||||||
| Net asset value, offering price and redemption price per share (Note 1) | N/A | N/A | N/A | N/A | $ | 11.80 | ||||||||||||||
| ULTRA SHARES | ||||||||||||||||||||
| Net assets applicable to Ultra Shares | $ | 25,249,954 | N/A | N/A | N/A | N/A | ||||||||||||||
| Ultra Shares of beneficial interest outstanding | 3,358,396 | N/A | N/A | N/A | N/A | |||||||||||||||
| Net asset value, offering price and redemption price per share (Note 1) | $ | 7.52 | N/A | N/A | N/A | N/A | ||||||||||||||
Amounts designated as “—” are either $0 or have been rounded to $0.
N/A — Not Applicable.
The accompanying notes are an integral part of the financial statements.
22
| WESTWOOD FUNDS |
| SIX MONTHS ENDED JUNE 30, 2023 (Unaudited) |
| STATEMENTS OF OPERATIONS |
| Westwood | ||||||||||||||||||||
| Salient | Westwood | Westwood | ||||||||||||||||||
| MLP & Energy | Westwood | Westwood | Broadmark | Broadmark | ||||||||||||||||
| Infrastructure | Salient Global | Salient Select | Tactical | Tactical | ||||||||||||||||
| Fund | Real Estate Fund | Income Fund | Growth Fund | Plus Fund | ||||||||||||||||
| INVESTMENT INCOME | ||||||||||||||||||||
| Dividend income (net of foreign withholding tax of | ||||||||||||||||||||
| $534,800, $11,037, $—, $—, and $—, respectively) | $ | 26,235,688 | $ | 375,895 | $ | 9,233,218 | $ | 4,989,014 | $ | 1,731,877 | ||||||||||
| EXPENSES | ||||||||||||||||||||
| Investment management fees (Note 4) | 4,118,534 | 84,914 | 989,554 | 1,420,612 | 532,622 | |||||||||||||||
| Administrative service plan fees - Institutional (Note 4) | 365,991 | 589 | 30,024 | 56,771 | 17,226 | |||||||||||||||
| Administrative service plan fees - A Class (Note 4) | 70,337 | 9,563 | 57,689 | 15,593 | 302 | |||||||||||||||
| Administrative service plan fees - C Class (Note 4) | 7,539 | 1,338 | 7,022 | 8,908 | 202 | |||||||||||||||
| Administrative service plan fees - F Class (Note 4) | — | — | — | — | 20,328 | |||||||||||||||
| Distribution fees - A Class (Note 4) | 175,844 | 20,105 | 128,316 | 28,802 | 754 | |||||||||||||||
| Distribution fees - C Class (Note 4) | 75,392 | 4,015 | 21,067 | 26,723 | 2,024 | |||||||||||||||
| Administration fees (Note 4) | 177,838 | 1,904 | 32,058 | 36,279 | 7,482 | |||||||||||||||
| Registration and filing fees | 101,638 | 26,304 | 32,319 | 32,319 | 31,475 | |||||||||||||||
| Legal fees | 53,649 | 1,101 | 19,019 | 14,964 | 5,769 | |||||||||||||||
| Postage and supplies | 36,269 | 3,515 | 19,885 | 14,854 | 4,362 | |||||||||||||||
| Audit and tax services fees | 29,822 | 8,983 | 10,151 | 8,939 | 8,964 | |||||||||||||||
| Trustees’ fees and expenses (Note 4) | 40,270 | 998 | 10,270 | 11,544 | 3,533 | |||||||||||||||
| Consultant fees | 17,789 | 7,905 | 19,529 | 16,421 | 4,414 | |||||||||||||||
| Transfer agent fees (Note 4) | 11,677 | 7,734 | 14,354 | 6,410 | 5,156 | |||||||||||||||
| Insurance expense | 18,524 | 385 | 4,007 | 4,858 | 1,328 | |||||||||||||||
| Custody fees | 13,201 | 3,288 | 3,116 | 2,361 | 1,266 | |||||||||||||||
| Borrowing costs (Note 2) | 20,715 | — | — | — | — | |||||||||||||||
| Compliance fees and expenses (Note 4) | 8,939 | 306 | 2,330 | 2,751 | 852 | |||||||||||||||
| Other expenses | 28,015 | 21,304 | 16,472 | 14,410 | 13,283 | |||||||||||||||
| Total expenses | 5,371,983 | 204,251 | 1,417,182 | 1,723,519 | 661,342 | |||||||||||||||
| Prior management fees recouped by the Adviser (Note 4) | — | — | 210,740 | — | — | |||||||||||||||
| Investment management fees reduced and expense reimbursements by the Adviser (Note 4) | — | (66,061 | ) | (187,893 | ) | — | (207,990 | ) | ||||||||||||
| Net expenses | 5,371,983 | 138,190 | 1,440,029 | 1,723,519 | 453,352 | |||||||||||||||
| NET INVESTMENT INCOME | 20,863,705 | 237,705 | 7,793,189 | 3,265,495 | 1,278,525 | |||||||||||||||
| REALIZED AND UNREALIZED GAINS (LOSSES) ON | ||||||||||||||||||||
| INVESTMENTS, FOREIGN CURRENCIES, OPTIONS | ||||||||||||||||||||
| AND FUTURES | ||||||||||||||||||||
| Net realized gains (losses) from investment transactions and foreign transactions | $ | 7,764,861 | $ | (621,543 | ) | $ | 1,609,103 | $ | (1,514,152 | ) | $ | 176,593 | ||||||||
| Net realized gains from options written | 5,686,869 | — | — | — | — | |||||||||||||||
| Net realized losses from futures contracts | — | — | — | (1,554,711 | ) | (1,141,412 | ) | |||||||||||||
| Net change in unrealized appreciation (depreciation) on investment transactions and foreign transactions | 15,581,160 | 743,263 | 5,360,296 | 4,779,257 | 40,727 | |||||||||||||||
| Net change in unrealized appreciation (depreciation) on written options | (2,749,810 | ) | — | — | — | — | ||||||||||||||
| Net change in unrealized appreciation (depreciation) on futures contracts | — | — | — | (628,238 | ) | 1,174,371 | ||||||||||||||
| NET REALIZED AND UNREALIZED GAINS ON INVESTMENTS, FOREIGN CURRENCIES, OPTIONS AND FUTURES | 26,283,080 | 121,720 | 6,969,399 | 1,082,156 | 250,279 | |||||||||||||||
| NET INCREASE IN NET ASSETS RESULTING FROM OPERATIONS | $ | 47,146,785 | $ | 359,425 | $ | 14,762,588 | $ | 4,347,651 | $ | 1,528,804 | ||||||||||
Amounts designated as “—” are either $0 or have been rounded to $0.
The accompanying notes are an integral part of the financial statements.
23
| WESTWOOD FUNDS |
| STATEMENTS OF CHANGES IN NET ASSETS |
| Westwood Salient MLP & | Westwood Salient | Westwood Salient | ||||||||||||||||||||||
| Energy Infrastructure Fund | Global Real Estate Fund | Select Income Fund | ||||||||||||||||||||||
| Six Months | Six Months | Six Months | ||||||||||||||||||||||
| Ended | Ended | Ended | ||||||||||||||||||||||
| June 30, | Year Ended | June 30, | Year Ended | June 30, | Year Ended | |||||||||||||||||||
| 2023 | December 31, | 2023 | December 31, | 2023 | December 31, | |||||||||||||||||||
| (Unaudited) | 2022 | (Unaudited) | 2022 | (Unaudited) | 2022 | |||||||||||||||||||
| FROM OPERATIONS | ||||||||||||||||||||||||
| Net investment income | $ | 20,863,705 | $ | 4,192,893 | $ | 237,705 | $ | 439,337 | $ | 7,793,189 | $ | 8,841,841 | ||||||||||||
| Net realized gains (losses) from investments, foreign currency transactions and written options | 13,451,730 | 3,431,642 | (621,543 | ) | (1,273,203 | ) | 1,609,103 | (2,566,542 | ) | |||||||||||||||
| Net change in unrealized appreciation (depreciation) on investments, foreign currency translations and written options | 12,831,350 | 106,655,035 | 743,263 | (5,505,436 | ) | 5,360,296 | (46,688,258 | ) | ||||||||||||||||
| Net increase (decrease) in net assets resulting from operations | 47,146,785 | 114,279,570 | 359,425 | (6,339,302 | ) | 14,762,588 | (40,412,959 | ) | ||||||||||||||||
| FROM DISTRIBUTIONS TO SHAREHOLDERS | ||||||||||||||||||||||||
| Institutional Shares | (17,241,225 | ) | — | (32,631 | ) | (65,104 | ) | (4,304,337 | ) | (4,587,481 | ) | |||||||||||||
| A Class Shares | (3,099,385 | ) | — | (201,594 | ) | (339,643 | ) | (3,314,234 | ) | (3,780,834 | ) | |||||||||||||
| C Class Shares | (278,613 | ) | — | (10,112 | ) | (18,838 | ) | (172,864 | ) | (246,967 | ) | |||||||||||||
| Investor Shares | — | — | — | (8,930 | ) | — | (226,733 | ) | ||||||||||||||||
| Ultra Shares | (659,232 | ) | — | — | — | — | — | |||||||||||||||||
| From return of capital | ||||||||||||||||||||||||
| Institutional Shares | — | (32,026,521 | ) | — | (9,386 | ) | — | (2,929,176 | ) | |||||||||||||||
| A Class Shares | — | (5,015,402 | ) | — | (50,743 | ) | — | (2,414,128 | ) | |||||||||||||||
| C Class Shares | — | (573,190 | ) | — | (2,716 | ) | — | (157,692 | ) | |||||||||||||||
| Investor Shares | — | — | — | — | — | (144,772 | ) | |||||||||||||||||
| Ultra Shares | — | (1,453,169 | ) | — | — | — | — | |||||||||||||||||
| Total distributions | (21,278,455 | ) | (39,068,282 | ) | (244,337 | ) | (495,360 | ) | (7,791,435 | ) | (14,487,783 | ) | ||||||||||||
| CAPITAL SHARE TRANSACTIONS | ||||||||||||||||||||||||
| Institutional Shares | ||||||||||||||||||||||||
| Issued | 65,822,987 | 326,083,981 | 30,896 | 473,444 | 35,539,214 | 39,575,329 | ||||||||||||||||||
| Reinvestment of dividends | 15,293,872 | 28,139,077 | 32,101 | 70,414 | 4,296,924 | 7,217,721 | ||||||||||||||||||
| Redeemed | (162,406,244 | ) | (207,307,366 | ) | (548,043 | ) | (736,257 | ) | (14,535,525 | ) | (54,098,954 | ) | ||||||||||||
| Net increase (decrease) from Institutional Shares capital share transactions | (81,289,385 | ) | 146,915,692 | (485,046 | ) | (192,399 | ) | 25,300,613 | (7,305,904 | ) | ||||||||||||||
| A Class Shares | ||||||||||||||||||||||||
| Issued | 3,129,512 | 27,097,263 | 65,248 | 1,082,573 | 4,963,765 | 5,804,611 | ||||||||||||||||||
| Shares exchanged from Investor Shares | — | 161,677,813 | — | 375,371 | — | 7,912,733 | ||||||||||||||||||
| Reinvestment of dividends | 2,971,146 | 4,811,951 | 187,814 | 364,099 | 2,825,660 | 4,946,000 | ||||||||||||||||||
| Redeemed | (25,808,238 | ) | (137,702,835 | ) | (1,072,429 | ) | (3,395,911 | ) | (9,602,432 | ) | (17,663,523 | ) | ||||||||||||
| Net increase (decrease) from A Class Shares capital share transactions | (19,707,580 | ) | 55,884,192 | (819,367 | ) | (1,573,868 | ) | (1,813,007 | ) | 999,821 | ||||||||||||||
| C Class Shares | ||||||||||||||||||||||||
| Issued | 19,581 | 1,630,960 | 81,300 | 302,955 | 812,339 | 382,301 | ||||||||||||||||||
| Reinvestment of dividends | 273,522 | 564,938 | 8,252 | 17,334 | 160,387 | 367,092 | ||||||||||||||||||
| Redeemed | (1,376,491 | ) | (6,447,136 | ) | (104,508 | ) | (440,370 | ) | (955,186 | ) | (4,470,668 | ) | ||||||||||||
| Net increase (decrease) from C Class Shares capital share transactions | (1,083,388 | ) | (4,251,238 | ) | (14,956 | ) | (120,081 | ) | 17,540 | (3,721,275 | ) | |||||||||||||
| Investor Shares | ||||||||||||||||||||||||
| Issued | N/A | N/A | N/A | 135,493 | N/A | 2,676,209 | ||||||||||||||||||
| Reinvestment of dividends | N/A | N/A | N/A | 8,318 | N/A | 365,958 | ||||||||||||||||||
| Redeemed | N/A | N/A | N/A | (342,437 | ) | N/A | (3,295,504 | ) | ||||||||||||||||
| Shares exchanged to A Class Shares | N/A | N/A | N/A | (375,371 | ) | N/A | (7,912,733 | ) | ||||||||||||||||
| Net decrease from Investor Shares capital share transactions | N/A | N/A | N/A | (573,997 | ) | N/A | (8,166,070 | ) | ||||||||||||||||
The accompanying notes are an integral part of the financial statements.
24
| WESTWOOD FUNDS |
| STATEMENTS OF CHANGES IN NET ASSETS (CONTINUED) |
| Westwood Salient MLP & | Westwood Salient | Westwood Salient | ||||||||||||||||||||||
| Energy Infrastructure Fund | Global Real Estate Fund | Select Income Fund | ||||||||||||||||||||||
| Six Months | Six Months | Six Months | ||||||||||||||||||||||
| Ended | Ended | Ended | ||||||||||||||||||||||
| June 30, | Year Ended | June 30, | Year Ended | June 30, | Year Ended | |||||||||||||||||||
| 2023 | December 31, | 2023 | December 31, | 2023 | December 31, | |||||||||||||||||||
| (Unaudited) | 2022 | (Unaudited) | 2022 | (Unaudited) | 2022 | |||||||||||||||||||
| Ultra Shares | ||||||||||||||||||||||||
| Issued | 22,257 | 1,425,412 | N/A | N/A | N/A | N/A | ||||||||||||||||||
| Reinvestment of dividends | 277,914 | 572,600 | N/A | N/A | N/A | N/A | ||||||||||||||||||
| Redeemed | (6,445,073 | ) | (4,533,909 | ) | N/A | N/A | N/A | N/A | ||||||||||||||||
| Net decrease from Ultra Shares capital share transactions | (6,144,902 | ) | (2,535,897 | ) | N/A | N/A | N/A | N/A | ||||||||||||||||
| Net increase (decrease) in net assets from capital share transactions | (108,225,255 | ) | 196,012,749 | (1,319,369 | ) | (2,460,345 | ) | 23,505,146 | (18,193,428 | ) | ||||||||||||||
| TOTAL INCREASE (DECREASE) IN NET ASSETS | (82,356,925 | ) | 271,224,037 | (1,204,281 | ) | (9,295,007 | ) | 30,476,299 | (73,094,170 | ) | ||||||||||||||
| NET ASSETS | ||||||||||||||||||||||||
| Beginning of period | $ | 977,600,629 | $ | 706,376,592 | $ | 20,027,390 | $ | 29,322,397 | $ | 218,481,630 | $ | 291,575,800 | ||||||||||||
| End of period | 895,243,704 | $ | 977,600,629 | 18,823,109 | 20,027,390 | 248,957,929 | 218,481,630 | |||||||||||||||||
Amounts designated as “—” are either $0 or have been rounded to $0.
N/A — Not Applicable.
The accompanying notes are an integral part of the financial statements.
25
| WESTWOOD FUNDS |
| STATEMENTS OF CHANGES IN NET ASSETS (CONTINUED) |
| Westwood Salient MLP & | Westwood Salient | Westwood Salient | ||||||||||||||||||||||
| Energy Infrastructure Fund | Global Real Estate Fund | Select Income Fund | ||||||||||||||||||||||
| Six Months | Six Months | Six Months | ||||||||||||||||||||||
| Ended | Ended | Ended | ||||||||||||||||||||||
| June 30, | Year Ended | June 30, | Year Ended | June 30, | Year Ended | |||||||||||||||||||
| 2023 | December 31, | 2023 | December 31, | 2023 | December 31, | |||||||||||||||||||
| (Unaudited) | 2022 | (Unaudited) | 2022 | (Unaudited) | 2022 | |||||||||||||||||||
| CAPITAL SHARES ACTIVITY | ||||||||||||||||||||||||
| Institutional Shares | ||||||||||||||||||||||||
| Sold | 8,973,531 | 44,603,290 | 2,593 | 37,995 | 1,999,905 | 1,999,336 | ||||||||||||||||||
| Issued in reinvestment of dividends to shareholders | 2,116,595 | 3,777,997 | 2,778 | 5,798 | 246,970 | 393,116 | ||||||||||||||||||
| Redeemed | (22,125,289 | ) | (28,712,439 | ) | (46,023 | ) | (59,582 | ) | (819,844 | ) | (2,798,890 | ) | ||||||||||||
| Net increase (decrease) in shares outstanding | (11,035,163 | ) | 19,668,848 | (40,652 | ) | (15,789 | ) | 1,427,031 | (406,438 | ) | ||||||||||||||
| Shares outstanding at beginning of period | 106,856,009 | 87,187,161 | 226,258 | 242,047 | 6,260,069 | 6,666,507 | ||||||||||||||||||
| Shares outstanding at end of period | 95,820,846 | 106,856,009 | 185,606 | 226,258 | 7,687,100 | 6,260,069 | ||||||||||||||||||
| A Class Shares | ||||||||||||||||||||||||
| Sold | 428,512 | 3,635,503 | 5,610 | 83,390 | 279,709 | 293,830 | ||||||||||||||||||
| Proceeds from shares issued in connection with acquisition from Plan of Reorganization (Note 8) | — | 21,251,027 | — | — | — | — | ||||||||||||||||||
| Issued in reinvestment of dividends to shareholders | 408,348 | 641,659 | 16,175 | 30,062 | — | 269,441 | ||||||||||||||||||
| Redeemed | (3,604,593 | ) | (18,980,423 | ) | (90,845 | ) | (270,148 | ) | 161,840 | (909,441 | ) | |||||||||||||
| Shares issued in connection with exchange of Investor Shares | — | — | — | 31,545 | (538,281 | ) | 448,845 | |||||||||||||||||
| Net increase (decrease) in shares outstanding | (2,767,733 | ) | 6,547,766 | (69,060 | ) | (125,151 | ) | (96,732 | ) | 102,675 | ||||||||||||||
| Shares outstanding at beginning of period | 20,630,522 | 14,082,756 | 1,399,115 | 1,524,266 | 5,955,467 | 5,852,792 | ||||||||||||||||||
| Shares outstanding at end of period | 17,862,789 | 20,630,522 | 1,330,055 | 1,399,115 | 5,858,735 | 5,955,467 | ||||||||||||||||||
| C Class Shares | ||||||||||||||||||||||||
| Sold | 2,655 | 225,461 | 6,489 | 21,373 | 46,981 | 21,541 | ||||||||||||||||||
| Issued in reinvestment of dividends to shareholders | 37,848 | 76,445 | 713 | 1,441 | 9,517 | 20,451 | ||||||||||||||||||
| Redeemed | (189,415 | ) | (878,720 | ) | (8,837 | ) | (35,931 | ) | (55,551 | ) | (241,088 | ) | ||||||||||||
| Net increase (decrease) in shares outstanding | (148,912 | ) | (576,814 | ) | (1,635 | ) | (13,117 | ) | 947 | (199,096 | ) | |||||||||||||
| Shares outstanding at beginning of period | 2,149,086 | 2,725,900 | 91,227 | 104,344 | 336,710 | 535,806 | ||||||||||||||||||
| Shares outstanding at end of period | 2,000,174 | 2,149,086 | 89,592 | 91,227 | 337,657 | 336,710 | ||||||||||||||||||
| Investor Shares | ||||||||||||||||||||||||
| Sold | N/A | N/A | — | 9,405 | — | 135,787 | ||||||||||||||||||
| Issued in reinvestment of dividends to shareholders | N/A | N/A | — | 662 | — | 19,397 | ||||||||||||||||||
| Redeemed | N/A | N/A | — | (26,474 | ) | — | (169,323 | ) | ||||||||||||||||
| Shares exchanged for A Class Shares | N/A | N/A | — | (31,415 | ) | — | (450,660 | ) | ||||||||||||||||
| Net decrease in shares outstanding | N/A | N/A | — | (47,822 | ) | — | (464,799 | ) | ||||||||||||||||
| Shares outstanding at beginning of period | N/A | N/A | — | 47,822 | — | 464,799 | ||||||||||||||||||
| Shares outstanding at end of period | N/A | N/A | — | — | — | — | ||||||||||||||||||
| Ultra Shares | ||||||||||||||||||||||||
| Sold | 3,047 | 199,506 | N/A | N/A | N/A | N/A | ||||||||||||||||||
| Issued in reinvestment of dividends to shareholders | 38,504 | 77,005 | N/A | N/A | N/A | N/A | ||||||||||||||||||
| Redeemed | (889,293 | ) | (627,149 | ) | N/A | N/A | N/A | N/A | ||||||||||||||||
| Net decrease in shares outstanding | (847,742 | ) | (350,638 | ) | N/A | N/A | N/A | N/A | ||||||||||||||||
| Shares outstanding at beginning of period | 4,206,138 | 4,556,776 | N/A | N/A | N/A | N/A | ||||||||||||||||||
| Shares outstanding at end of period | 3,358,396 | 4,206,138 | N/A | N/A | N/A | N/A | ||||||||||||||||||
Amounts designated as “—” are either $0 or have been rounded to $0.
N/A — Not Applicable.
The accompanying notes are an integral part of the financial statements.
26
| WESTWOOD FUNDS |
| STATEMENTS OF CHANGES IN NET ASSETS (CONTINUED) |
| Westwood Broadmark | Westwood Broadmark | |||||||||||||||
| Tactical Growth Fund | Tactical Plus Fund | |||||||||||||||
| Six Months | Six Months | |||||||||||||||
| Ended | Ended | |||||||||||||||
| June 30, | Year Ended | June 30, | Year Ended | |||||||||||||
| 2023 | December 31, | 2023 | December 31, | |||||||||||||
| (Unaudited) | 2022 | (Unaudited) | 2022 | |||||||||||||
| FROM OPERATIONS | ||||||||||||||||
| Net investment income (loss) | $ | 3,265,495 | $ | (773,929 | ) | $ | 1,278,525 | $ | 331,413 | |||||||
| Net realized gains (losses) from investments and futures contracts | (3,068,863 | ) | 14,378,624 | (964,819 | ) | 8,980,184 | ||||||||||
| Net change in unrealized appreciation (depreciation) on investments and futures contracts | 4,151,019 | (38,986,046 | ) | 1,215,098 | (10,522,511 | ) | ||||||||||
| Net increase (decrease) in net assets resulting from operations | 4,347,651 | (25,381,351 | ) | 1,528,804 | (1,210,914 | ) | ||||||||||
| FROM DISTRIBUTIONS TO SHAREHOLDERS | ||||||||||||||||
| From distributable earnings | ||||||||||||||||
| Institutional Shares | — | (6,735,312 | ) | — | (2,385,920 | ) | ||||||||||
| A Class Shares | — | (818,486 | ) | — | (40,913 | ) | ||||||||||
| C Class Shares | — | (259,189 | ) | — | (30,908 | ) | ||||||||||
| F Class Shares | — | — | — | (2,661,204 | ) | |||||||||||
| Total distributions | — | (7,812,987 | ) | — | (5,118,945 | ) | ||||||||||
| CAPITAL SHARE TRANSACTIONS | ||||||||||||||||
| Institutional Shares | ||||||||||||||||
| Issued | 39,235,600 | 86,724,446 | 5,131,010 | 8,068,184 | ||||||||||||
| Reinvestment of dividends | — | 6,717,078 | — | 2,385,919 | ||||||||||||
| Redeemed | (45,947,100 | ) | (129,638,672 | ) | (4,537,940 | ) | (3,820,145 | ) | ||||||||
| Net increase (decrease) from Institutional Shares capital share transactions | (6,711,500 | ) | (36,197,148 | ) | 593,070 | 6,633,958 | ||||||||||
| A Class Shares | ||||||||||||||||
| Issued | 1,340,488 | 5,969,905 | 69,813 | 70,960 | ||||||||||||
| Shares exchanged from Investor Shares | — | 7,335,253 | — | — | ||||||||||||
| Reinvestment of dividends | — | 772,858 | — | 40,913 | ||||||||||||
| Redeemed | (6,223,403 | ) | (6,388,881 | ) | (58,394 | ) | (53,076 | ) | ||||||||
| Net increase (decrease) from A Class Shares capital share transactions | (4,882,915 | ) | 7,689,135 | 11,419 | 58,797 | |||||||||||
| C Class Shares | ||||||||||||||||
| Issued | 177,008 | 2,036,277 | — | 15 | ||||||||||||
| Reinvestment of dividends | — | 254,902 | — | 30,908 | ||||||||||||
| Redeemed | (1,272,556 | ) | (2,514,488 | ) | (5,868 | ) | (123,653 | ) | ||||||||
| Net decrease from C Class Shares capital share transactions | (1,095,548 | ) | (223,309 | ) | (5,868 | ) | (92,730 | ) | ||||||||
| F Class Shares | ||||||||||||||||
| Issued | N/A | N/A | 6,414,195 | 5,280,910 | ||||||||||||
| Reinvestment of dividends | N/A | N/A | — | 2,661,204 | ||||||||||||
| Redeemed | N/A | N/A | (2,839,079 | ) | (7,164,813 | ) | ||||||||||
| Net increase from F Class Shares capital share transactions | N/A | N/A | 3,575,116 | 777,301 | ||||||||||||
| Investor Shares | ||||||||||||||||
| Issued | N/A | 22,511,744 | N/A | N/A | ||||||||||||
| Reinvestment of dividends | N/A | — | N/A | N/A | ||||||||||||
| Redeemed | N/A | (19,381,817 | ) | N/A | N/A | |||||||||||
| Shares exchanged to A Class Shares | N/A | (7,335,253 | ) | N/A | N/A | |||||||||||
| Net decrease from Investor Shares capital share transactions | N/A | (4,205,326 | ) | N/A | N/A | |||||||||||
| Net increase (decrease) in net assets from capital share transactions | (12,689,963 | ) | (32,936,648 | ) | 4,173,737 | 7,377,326 | ||||||||||
| TOTAL INCREASE (DECREASE) IN NET ASSETS | (8,342,312 | ) | (66,130,986 | ) | 5,702,541 | 1,047,467 | ||||||||||
| NET ASSETS | ||||||||||||||||
| Beginning of period | $ | 271,124,081 | $ | 337,255,067 | $ | 72,464,683 | $ | 71,417,216 | ||||||||
| End of period | $ | 262,781,769 | $ | 271,124,081 | $ | 78,167,224 | $ | 72,464,683 | ||||||||
Amounts designated as “—” are either $0 or have been rounded to $0.
N/A — Not Applicable.
The accompanying notes are an integral part of the financial statements.
27
| WESTWOOD FUNDS |
| STATEMENTS OF CHANGES IN NET ASSETS (CONTINUED) |
| Westwood Broadmark | Westwood Broadmark | |||||||||||||||
| Tactical Growth Fund | Tactical Plus Fund | |||||||||||||||
| Six Months | Six Months | |||||||||||||||
| Ended | Ended | |||||||||||||||
| June 30, | Year Ended | June 30, | Year Ended | |||||||||||||
| 2023 | December 31, | 2023 | December 31, | |||||||||||||
| (Unaudited) | 2022 | (Unaudited) | 2022 | |||||||||||||
| CAPITAL SHARES ACTIVITY | ||||||||||||||||
| Institutional Shares | ||||||||||||||||
| Sold | 1,511,017 | 3,163,746 | 456,568 | 659,284 | ||||||||||||
| Issued in reinvestment of dividends to shareholders | — | 257,656 | — | 211,143 | ||||||||||||
| Redeemed | (1,768,354 | ) | (4,698,546 | ) | (402,955 | ) | (317,193 | ) | ||||||||
| Net increase (decrease) in shares outstanding | (257,337 | ) | (1,277,144 | ) | 53,613 | 553,234 | ||||||||||
| Shares outstanding at beginning of period | 9,060,272 | 10,337,416 | 3,048,356 | 2,495,122 | ||||||||||||
| Shares outstanding at end of period | 8,802,935 | 9,060,272 | 3,101,969 | 3,048,356 | ||||||||||||
| A Class Shares | ||||||||||||||||
| Sold | 55,426 | 238,306 | 6,268 | 5,931 | ||||||||||||
| Issued in reinvestment of dividends to shareholders | — | 31,778 | — | 3,689 | ||||||||||||
| Redeemed | (257,263 | ) | (253,164 | ) | (5,318 | ) | (4,490 | ) | ||||||||
| Shares issued in connection with exchange of Investor Shares | — | 293,979 | — | — | ||||||||||||
| Net increase (decrease) in shares outstanding | (201,837 | ) | 310,899 | 950 | 5,130 | |||||||||||
| Shares outstanding at beginning of period | 1,115,305 | 804,406 | 52,687 | 47,557 | ||||||||||||
| Shares outstanding at end of period | 913,468 | 1,115,305 | 53,637 | 52,687 | ||||||||||||
| C Class Shares | ||||||||||||||||
| Sold | 7,889 | 85,819 | — | 1 | ||||||||||||
| Issued in reinvestment of dividends to shareholders | — | 11,369 | — | 2,983 | ||||||||||||
| Redeemed | (57,245 | ) | (105,134 | ) | (576 | ) | (10,994 | ) | ||||||||
| Net decrease in shares outstanding | (49,356 | ) | (7,946 | ) | (576 | ) | (8,010 | ) | ||||||||
| Shares outstanding at beginning of period | 349,418 | 357,364 | 39,999 | 48,009 | ||||||||||||
| Shares outstanding at end of period | 300,062 | 349,418 | 39,423 | 39,999 | ||||||||||||
| F Class Shares | ||||||||||||||||
| Sold | N/A | N/A | 553,772 | 435,032 | ||||||||||||
| Issued in reinvestment of dividends to shareholders | N/A | N/A | — | 230,208 | ||||||||||||
| Redeemed | N/A | N/A | (246,080 | ) | (577,435 | ) | ||||||||||
| Net increase in shares outstanding | N/A | N/A | 307,692 | 87,805 | ||||||||||||
| Shares outstanding at beginning of period | N/A | N/A | 3,205,631 | 3,117,826 | ||||||||||||
| Shares outstanding at end of period | N/A | N/A | 3,513,323 | 3,205,631 | ||||||||||||
| Investor Shares | ||||||||||||||||
| Sold | N/A | 861,114 | N/A | N/A | ||||||||||||
| Issued in reinvestment of dividends to shareholders | N/A | — | N/A | N/A | ||||||||||||
| Redeemed | N/A | (750,528 | ) | N/A | N/A | |||||||||||
| Shares exchanged for A Class Shares | N/A | (287,438 | ) | N/A | N/A | |||||||||||
| Net decrease in shares outstanding | N/A | (176,852 | ) | N/A | N/A | |||||||||||
| Shares outstanding at beginning of period | N/A | 176,852 | N/A | N/A | ||||||||||||
| Shares outstanding at end of period | N/A | — | N/A | N/A | ||||||||||||
Amounts designated as “—” are $0 or rounded to $0.
N/A — Not Applicable.
The accompanying notes are an integral part of the financial statements.
28
[This Page Intentionally Left Blank]
| WESTWOOD FUNDS |
| FINANCIAL HIGHLIGHTS |
| SELECTED PER SHARE DATA & RATIOS |
| FOR A SHARE OUTSTANDING THROUGHOUT THE PERIOD |
| Net realized | ||||||||||||||||||||||||
| Net asset value, | and unrealized | Total from | Dividends from | |||||||||||||||||||||
| beginning of | Net investment | gains (losses) on | investment | net investment | ||||||||||||||||||||
| period | income (loss)(a) | investments | operations | income | Return of capital | |||||||||||||||||||
| Westwood Salient MLP & Energy Infrastructure Fund (1) | ||||||||||||||||||||||||
| Institutional Shares (2) | ||||||||||||||||||||||||
| Six months ended June 30, 2023 (Unaudited) | $ | 7.30 | 0.17 | 0.21 | 0.38 | (0.17 | ) | — | ||||||||||||||||
| Year Ended December 31, 2022 | $ | 6.50 | 0.04 | 1.08 | 1.12 | — | (0.32 | ) | ||||||||||||||||
| Year Ended December 31, 2021 | $ | 5.50 | (0.02 | ) | 1.34 | 1.32 | — | (0.32 | ) | |||||||||||||||
| Year Ended December 31, 2020 | $ | 7.05 | 0.08 | (1.31 | ) | (1.23 | ) | — | (0.32 | ) | ||||||||||||||
| Year Ended December 31, 2019 | $ | 6.34 | 0.04 | 0.99 | 1.03 | (0.18 | ) | (0.14 | ) | |||||||||||||||
| Year Ended December 31, 2018 | $ | 8.15 | 0.07 | (1.49 | ) | (1.42 | ) | (0.07 | ) | (0.32 | ) | |||||||||||||
| A Class Shares | ||||||||||||||||||||||||
| Six months ended June 30, 2023 (Unaudited) | $ | 7.34 | 0.16 | 0.22 | 0.38 | (0.16 | ) | — | ||||||||||||||||
| Year Ended December 31, 2022 | $ | 6.53 | 0.02 | 1.09 | 1.11 | — | (0.30 | ) | ||||||||||||||||
| Year Ended December 31, 2021 | $ | 5.53 | (0.03 | ) | 1.34 | 1.31 | — | (0.31 | ) | |||||||||||||||
| Year Ended December 31, 2020 | $ | 7.07 | 0.07 | (1.31 | ) | (1.24 | ) | — | (0.30 | ) | ||||||||||||||
| Year Ended December 31, 2019 | $ | 6.36 | 0.02 | 1.00 | 1.02 | (0.17 | ) | (0.14 | ) | |||||||||||||||
| Year Ended December 31, 2018 | $ | 8.18 | 0.06 | (1.50 | ) | (1.44 | ) | (0.07 | ) | (0.31 | ) | |||||||||||||
| C Class Shares | ||||||||||||||||||||||||
| Six months ended June 30, 2023 (Unaudited) | $ | 7.30 | 0.13 | 0.23 | 0.36 | (0.14 | ) | — | ||||||||||||||||
| Year Ended December 31, 2022 | $ | 6.50 | (0.03 | ) | 1.07 | 1.04 | — | (0.24 | ) | |||||||||||||||
| Year Ended December 31, 2021 | $ | 5.50 | (0.08 | ) | 1.34 | 1.26 | — | (0.26 | ) | |||||||||||||||
| Year Ended December 31, 2020 | $ | 7.02 | 0.03 | (1.31 | ) | (1.28 | ) | — | (0.24 | ) | ||||||||||||||
| Year Ended December 31, 2019 | $ | 6.32 | (0.03 | ) (h) | 0.98 | 0.95 | (0.14 | ) | (0.11 | ) | ||||||||||||||
| Year Ended December 31, 2018 | $ | 8.13 | (0.00 | ) (h) | (1.49 | ) | (1.49 | ) | (0.06 | ) | (0.26 | ) | ||||||||||||
| Ultra Shares (2) | ||||||||||||||||||||||||
| Six months ended June 30, 2023 (Unaudited) | $ | 7.30 | 0.17 | 0.23 | 0.40 | (0.18 | ) | — | ||||||||||||||||
| Year Ended December 31, 2022 | $ | 6.51 | 0.04 | 1.08 | 1.12 | — | (0.33 | ) | ||||||||||||||||
| Year Ended December 31, 2021 | $ | 5.50 | (0.01 | ) | 1.35 | 1.34 | — | (0.33 | ) | |||||||||||||||
| Year Ended December 31, 2020 | $ | 7.05 | 0.08 | (1.31 | ) | (1.23 | ) | — | (0.32 | ) | ||||||||||||||
| Year Ended December 31, 2019 | $ | 6.34 | 0.04 | 0.99 | 1.03 | (0.18 | ) | (0.14 | ) | |||||||||||||||
| Year Ended December 31, 2018 | $ | 8.15 | 0.09 | (1.50 | ) | (1.41 | ) | (0.07 | ) | (0.33 | ) | |||||||||||||
Amounts designated as “—” are $0 or rounded to $0.
| (a) | Per share net investment income (loss) has been determined on the basis of average number of shares outstanding during the period. |
| (b) | Total return is a measure of the change in value of an investment in the Fund over the period covered. The returns shown do not reflect the deduction of taxes a shareholder would pay on Fund distributions, if any or the redemption of Fund shares. The total returns would be lower if the Adviser had not reduced investment management fees and/or reimbursed expenses (Note 4). |
| (c) | Ratio was determined after investment management fee reductions and/or reimbursed expenses (Note 4). |
| (d) | Portfolio turnover rate is calculated on the basis of the Fund as a whole without distinguishing between classes of shares issued. |
| (e) | Not annualized. |
| (f) | Annualized. |
| (g) | Net expense ratio exceeded the expense limitation during the year ended December 31, 2022 due to reorganization expenses (Note 8). |
| (h) | The amount shown for a share outstanding throughout the period may not correlate with the Statement of Operations for the period due to the timing of sales and redemptions of Fund shares in relation to income earned and/or fluctuating market value of the investments of the Fund. |
| (1) | Prior to November 18, 2022, Westwood Salient MLP & Energy Infrastructure Fund was known as Salient MLP & Energy Infrastructure Fund |
| (2) | Prior to November 18, 2022, Institutional Shares were I Share Class and Ultra Shares were R6 Share Class. |
The accompanying notes are an integral part of the financial statements.
| WESTWOOD FUNDS |
| FINANCIAL HIGHLIGHTS |
| SELECTED PER SHARE DATA & RATIOS |
| FOR A SHARE OUTSTANDING THROUGHOUT THE PERIOD |
| Total distributions | Net
asset value, end of period | Total return(b) | Net
assets, end of period (000’s) | Ratio
of total net expenses to average net assets (including tax expense/ benefit)(c) | Ratio
of total net expenses to average net assets (excluding tax expense/ benefit)(c) | Ratio
of total gross expenses to average net assets (including tax expense/ benefit) | Ratio
of net investment income (loss) to average net assets(c) | Portfolio turnover rate(d) | ||||||||||||||||||||||||||
| (0.17 | ) | $ | 7.51 | 5.35 | % (e) | $ | 719,999 | 1.12 | % (f) | 1.12 | % (f) | 1.12 | % (f) | 4.61 | % (f) | 33 | % (e) | |||||||||||||||||
| (0.32 | ) | $ | 7.30 | 17.22 | % | $ | 779,843 | 1.35 | % (g) | 1.35 | % (g) | 1.35 | % | 0.52 | % | 86 | % | |||||||||||||||||
| (0.32 | ) | $ | 6.50 | 24.11 | % | $ | 566,980 | 1.29 | % | 1.29 | % | 1.27 | % | (0.27 | )% | 248 | % | |||||||||||||||||
| (0.32 | ) | $ | 5.50 | (17.32 | )% | $ | 393,743 | 1.30 | % | 1.30 | % | 1.33 | % | 1.55 | % | 260 | % | |||||||||||||||||
| (0.32 | ) | $ | 7.05 | 16.33 | % | $ | 617,790 | 1.26 | % | 1.24 | % | 1.24 | % | 0.50 | % | 66 | % | |||||||||||||||||
| (0.39 | ) | $ | 6.34 | (18.10 | )% | $ | 730,427 | 1.17 | % | 1.23 | % | 1.17 | % | 0.95 | % | 48 | % | |||||||||||||||||
| (0.16 | ) | $ | 7.56 | 5.32 | % (e) | $ | 134,954 | 1.37 | % (f) | 1.37 | % (f) | 1.37 | % (f) | 4.34 | % (f) | 33 | % (e) | |||||||||||||||||
| (0.30 | ) | $ | 7.34 | 17.00 | % | $ | 151,353 | 1.61 | % (g) | 1.61 | % (g) | 1.61 | % | 0.23 | % | 86 | % | |||||||||||||||||
| (0.31 | ) | $ | 6.53 | 23.74 | % | $ | 92,027 | 1.50 | % | 1.50 | % | 1.50 | % | (0.42 | )% | 248 | % | |||||||||||||||||
| (0.30 | ) | $ | 5.53 | (17.43 | )% | $ | 63,681 | 1.55 | % | 1.55 | % | 1.56 | % | 1.29 | % | 260 | % | |||||||||||||||||
| (0.31 | ) | $ | 7.07 | 16.03 | % | $ | 110,549 | 1.47 | % | 1.49 | % | 1.47 | % | 0.24 | % | 66 | % | |||||||||||||||||
| (0.38 | ) | $ | 6.36 | (18.33 | )% | $ | 86,552 | 1.40 | % | 1.46 | % | 1.40 | % | 0.77 | % | 48 | % | |||||||||||||||||
| (0.14 | ) | $ | 7.52 | 4.95 | % (e) | $ | 15,041 | 2.12 | % (f) | 2.12 | % (f) | 2.12 | % (f) | 3.58 | % (f) | 33 | % (e) | |||||||||||||||||
| (0.24 | ) | $ | 7.30 | 15.98 | % | $ | 15,694 | 2.34 | % (g) | 2.34 | % (g) | 2.34 | % | (0.47 | )% | 86 | % | |||||||||||||||||
| (0.26 | ) | $ | 6.50 | 22.91 | % | $ | 17,726 | 2.29 | % | 2.29 | % | 2.26 | % | (1.26 | )% | 248 | % | |||||||||||||||||
| (0.24 | ) | $ | 5.50 | (18.16 | )% | $ | 20,468 | 2.30 | % | 2.30 | % | 2.32 | % | 0.57 | % | 260 | % | |||||||||||||||||
| (0.25 | ) | $ | 7.02 | 15.15 | % | $ | 37,346 | 2.22 | % | 2.24 | % | 2.22 | % | (0.48 | )% | 66 | % | |||||||||||||||||
| (0.32 | ) | $ | 6.32 | (18.89 | )% | $ | 44,247 | 2.15 | % | 2.21 | % | 2.15 | % | (0.01 | )% | 48 | % | |||||||||||||||||
| (0.18 | ) | $ | 7.52 | 5.54 | % (e) | $ | 25,250 | 1.02 | % (f) | 1.02 | % (f) | 1.02 | % (f) | 4.77 | % (f) | 33 | % (e) | |||||||||||||||||
| (0.33 | ) | $ | 7.30 | 17.12 | % | $ | 30,710 | 1.27 | % | 1.27 | % | 1.27 | % | 0.59 | % | 86 | % | |||||||||||||||||
| (0.33 | ) | $ | 6.51 | 24.41 | % | $ | 29,645 | 1.20 | % | 1.20 | % | 1.20 | % | (0.19 | )% | 248 | % | |||||||||||||||||
| (0.32 | ) | $ | 5.50 | (17.27 | )% | $ | 32,949 | 1.26 | % | 1.26 | % | 1.26 | % | 1.62 | % | 260 | % | |||||||||||||||||
| (0.32 | ) | $ | 7.05 | 16.42 | % | $ | 23,879 | 1.16 | % | 1.18 | % | 1.16 | % | 0.59 | % | 66 | % | |||||||||||||||||
| (0.40 | ) | $ | 6.34 | (18.04 | )% | $ | 20,907 | 1.09 | % | 1.15 | % | 1.09 | % | 1.24 | % | 48 | % | |||||||||||||||||
The accompanying notes are an integral part of the financial statements.
| WESTWOOD FUNDS |
| FINANCIAL HIGHLIGHTS |
| SELECTED PER SHARE DATA & RATIOS |
| FOR A SHARE OUTSTANDING THROUGHOUT THE PERIOD |
| Net realized | ||||||||||||||||||||||||
| Net asset value, | and unrealized | Total from | Dividends from | |||||||||||||||||||||
| beginning of | Net investment | gains (losses) on | investment | net investment | ||||||||||||||||||||
| period | income(a) | investments | operations | income | Return of capital | |||||||||||||||||||
| Westwood Salient Global Real Estate Fund (1) | ||||||||||||||||||||||||
| Institutional Shares | ||||||||||||||||||||||||
| Six months ended June 30, 2023 (Unaudited) | $ | 11.63 | 0.16 | 0.06 | 0.22 | (0.17 | ) | — | ||||||||||||||||
| Year Ended December 31, 2022 | $ | 15.22 | 0.28 | (3.56 | ) | (3.28 | ) | (0.27 | ) | (0.04 | ) | |||||||||||||
| Year Ended December 31, 2021 | $ | 12.86 | 0.18 | 2.64 | 2.82 | (0.46 | ) | — | ||||||||||||||||
| Year Ended December 31, 2020 | $ | 14.59 | 0.16 | (1.66 | ) | (1.50 | ) | (0.23 | ) | — | ||||||||||||||
| Year Ended December 31, 2019 | $ | 12.33 | 0.22 | 2.40 | 2.62 | (0.36 | ) | — | ||||||||||||||||
| Year Ended December 31, 2018 | $ | 14.68 | 0.28 | (1.72 | ) | (1.44 | ) | (0.79 | ) | (0.12 | ) | |||||||||||||
| A Class Shares | ||||||||||||||||||||||||
| Six months ended June 30, 2023 (Unaudited) | $ | 11.68 | 0.14 | 0.06 | 0.20 | (0.15 | ) | — | ||||||||||||||||
| Year Ended December 31, 2022 | $ | 15.29 | 0.23 | (3.57 | ) | (3.34 | ) | (0.24 | ) | (0.03 | ) | |||||||||||||
| Year Ended December 31, 2021 | $ | 12.92 | 0.12 | 2.65 | 2.77 | (0.40 | ) | — | ||||||||||||||||
| Year Ended December 31, 2020 | $ | 14.65 | 0.12 | (1.68 | ) | (1.56 | ) | (0.17 | ) | — | ||||||||||||||
| Year Ended December 31, 2019 | $ | 12.38 | 0.17 | 2.40 | 2.57 | (0.30 | ) | — | ||||||||||||||||
| Year Ended December 31, 2018 | $ | 14.75 | 0.23 | (1.73 | ) | (1.50 | ) | (0.76 | ) | (0.11 | ) | |||||||||||||
| C Class Shares | ||||||||||||||||||||||||
| Six months ended June 30, 2023 (Unaudited) | $ | 11.64 | 0.11 | 0.06 | 0.17 | (0.11 | ) | — | ||||||||||||||||
| Year Ended December 31, 2022 | $ | 15.25 | 0.16 | (3.56 | ) | (3.40 | ) | (0.18 | ) | (0.03 | ) | |||||||||||||
| Year Ended December 31, 2021 | $ | 12.88 | 0.03 | 2.66 | 2.69 | (0.32 | ) | — | ||||||||||||||||
| Year Ended December 31, 2020 | $ | 14.59 | 0.05 | (1.65 | ) | (1.60 | ) | (0.11 | ) | — | ||||||||||||||
| Year Ended December 31, 2019 | $ | 12.31 | 0.07 | 2.41 | 2.48 | (0.20 | ) | — | ||||||||||||||||
| Year Ended December 31, 2018 | $ | 14.73 | 0.13 | (1.73 | ) | (1.60 | ) | (0.71 | ) | (0.11 | ) | |||||||||||||
Amounts designated as “—” are $0 or rounded to $0.
| (a) | Per share net investment income has been determined on the basis of average number of shares outstanding during the period. |
| (b) | Total return is a measure of the change in value of an investment in the Fund over the period covered. The returns shown do not reflect the deduction of taxes a shareholder would pay on Fund distributions, if any or the redemption of Fund shares. The total returns would be lower if the Adviser had not reduced investment management fees and/or reimbursed expenses (Note 4). |
| (c) | Ratio was determined after investment management fee reductions and/or reimbursed expenses (Note 4). |
| (d) | Portfolio turnover rate is calculated on the basis of the Fund as a whole without distinguishing between classes of shares issued. |
| (e) | Not annualized. |
| (f) | Annualized. |
| (g) | Effective August 21, 2018, the Advisor agreed to limit expenses to 1.15%. |
| (h) | Effective August 21, 2018, the Advisor agreed to limit expenses to 1.55%. |
| (i) | Effective August 21, 2018, the Advisor agreed to limit expenses to 2.10%. |
| (1) | Prior to November 18, 2022, Westwood Salient Global Real Estate Fund was known as Salient Global Real Estate Fund. Prior to August 14, 2018 Salient Global Estate Fund was known as Salient International Real Estate Fund. |
The accompanying notes are an integral part of the financial statements.
| WESTWOOD FUNDS |
| FINANCIAL HIGHLIGHTS |
| SELECTED PER SHARE DATA & RATIOS |
| FOR A SHARE OUTSTANDING THROUGHOUT THE PERIOD |
| Total distributions | Net
asset value, end of period | Total return(b) | Net
assets, end of period (000’s) | Ratio
of total net expenses to average net assets(c) | Ratio
of total gross expenses to average net assets | Ratio
of net investment income to average net assets(c) | Portfolio turnover rate(d) | |||||||||||||||||||||||
| (0.17 | ) | $ | 11.68 | 1.92 | % (e) | $ | 2,168 | 1.10 | % (f) | 1.77 | % (f) | 2.67 | % (f) | 30 | % (e) | |||||||||||||||
| (0.31 | ) | $ | 11.63 | (21.61 | )% | $ | 2,631 | 1.14 | % | 2.09 | % | 2.17 | % | 29 | % | |||||||||||||||
| (0.46 | ) | $ | 15.22 | 22.09 | % | $ | 3,685 | 1.15 | % | 1.96 | % | 1.23 | % | 49 | % | |||||||||||||||
| (0.23 | ) | $ | 12.86 | (9.98 | )% | $ | 3,360 | 1.15 | % | 2.03 | % | 1.38 | % | 29 | % | |||||||||||||||
| (0.36 | ) | $ | 14.59 | 21.31 | % | $ | 6,793 | 1.15 | % | 1.71 | % | 1.54 | % | 21 | % | |||||||||||||||
| (0.91 | ) | $ | 12.33 | (10.51 | )% | $ | 8,600 | 1.65 | % (g) | 2.57 | % | 2.01 | % | 101 | % | |||||||||||||||
| (0.15 | ) | $ | 11.73 | 1.74 | % (e) | $ | 15,607 | 1.42 | % (f) | 2.09 | % (f) | 2.44 | % (f) | 30 | % (e) | |||||||||||||||
| (0.27 | ) | $ | 11.68 | (21.91 | )% | $ | 16,335 | 1.54 | % | 2.49 | % | 1.76 | % | 29 | % | |||||||||||||||
| (0.40 | ) | $ | 15.29 | 21.58 | % | $ | 23,312 | 1.55 | % | 2.36 | % | 0.83 | % | 49 | % | |||||||||||||||
| (0.17 | ) | $ | 12.92 | (10.36 | )% | $ | 20,341 | 1.55 | % | 2.43 | % | 1.02 | % | 29 | % | |||||||||||||||
| (0.30 | ) | $ | 14.65 | 20.82 | % | $ | 26,859 | 1.55 | % | 2.11 | % | 1.21 | % | 21 | % | |||||||||||||||
| (0.87 | ) | $ | 12.38 | (10.74 | )% | $ | 19,377 | 1.87 | % (h) | 3.04 | % | 1.66 | % | 101 | % | |||||||||||||||
| (0.11 | ) | $ | 11.70 | 1.50 | % (e) | $ | 1,048 | 2.05 | % (f) | 2.73 | % (f) | 1.83 | % (f) | 30 | % (e) | |||||||||||||||
| (0.21 | ) | $ | 11.64 | (22.33 | )% | $ | 1,061 | 2.09 | % | 3.04 | % | 1.22 | % | 29 | % | |||||||||||||||
| (0.32 | ) | $ | 15.25 | 20.95 | % | $ | 1,591 | 2.10 | % | 2.94 | % | 0.22 | % | 49 | % | |||||||||||||||
| (0.11 | ) | $ | 12.88 | (10.81 | )% | $ | 2,585 | 2.10 | % | 2.98 | % | 0.41 | % | 29 | % | |||||||||||||||
| (0.20 | ) | $ | 14.59 | 20.19 | % | $ | 4,614 | 2.10 | % | 2.67 | % | 0.51 | % | 21 | % | |||||||||||||||
| (0.82 | ) | $ | 12.31 | (11.51 | )% | $ | 11,888 | 2.51 | % (i) | 3.64 | % | 0.96 | % | 101 | % | |||||||||||||||
The accompanying notes are an integral part of the financial statements.
| WESTWOOD FUNDS |
| FINANCIAL HIGHLIGHTS |
| SELECTED PER SHARE DATA & RATIOS |
| FOR A SHARE OUTSTANDING THROUGHOUT THE PERIOD |
| Net realized | ||||||||||||||||||||||||||||||||
| and unrealized | Dividends | Distributions | ||||||||||||||||||||||||||||||
| Net asset value, | Net | gains | Total from | from net | from net | |||||||||||||||||||||||||||
| beginning of | investment | (losses) on | investment | investment | realized | Return | Total | |||||||||||||||||||||||||
| period | income(a) | investments | operations | income | capital gains | of capital | distributions | |||||||||||||||||||||||||
| Westwood Salient Select Income Fund (1) | ||||||||||||||||||||||||||||||||
| Institutional Shares | ||||||||||||||||||||||||||||||||
| Six months ended June 30, 2023 (Unaudited) | $ | 17.39 | 0.62 | 0.50 | 1.12 | (0.60 | ) | — | — | (0.60 | ) | |||||||||||||||||||||
| Year Ended December 31, 2022 | $ | 21.56 | 0.70 | (3.71 | ) | (3.01 | ) | (0.71 | ) | — | (0.45 | ) | (1.16 | ) | ||||||||||||||||||
| Year Ended December 31, 2021 | $ | 19.68 | 0.46 | 3.19 | 3.65 | (1.11 | ) | — | (0.66 | ) | (1.77 | ) | ||||||||||||||||||||
| Year Ended December 31, 2020 | $ | 21.42 | 0.49 | (1.24 | ) | (0.75 | ) | (0.46 | ) | — | (0.53 | ) | (0.99 | ) | ||||||||||||||||||
| Year Ended December 31, 2019 | $ | 19.07 | 0.57 | 2.95 | 3.52 | (0.51 | ) | — | (0.66 | ) | (1.17 | ) | ||||||||||||||||||||
| Year Ended December 31, 2018 | $ | 22.13 | 0.66 | (2.50 | ) | (1.84 | ) | (0.70 | ) | (0.51 | ) | (0.01 | ) | (1.22 | ) | |||||||||||||||||
| A Class Shares | ||||||||||||||||||||||||||||||||
| Six months ended June 30, 2023 (Unaudited) | $ | 17.45 | 0.58 | 0.53 | 1.11 | (0.57 | ) | — | — | (0.57 | ) | |||||||||||||||||||||
| Year Ended December 31, 2022 | $ | 21.63 | 0.71 | (3.80 | ) | (3.09 | ) | (0.67 | ) | — | (0.42 | ) | (1.09 | ) | ||||||||||||||||||
| Year Ended December 31, 2021 | $ | 19.74 | 0.38 | 3.14 | 3.52 | (1.02 | ) | — | (0.61 | ) | (1.63 | ) | ||||||||||||||||||||
| Year Ended December 31, 2020 | $ | 21.48 | 0.43 | (1.26 | ) | (0.83 | ) | (0.43 | ) | — | (0.48 | ) | (0.91 | ) | ||||||||||||||||||
| Year Ended December 31, 2019 | $ | 19.13 | 0.49 | 2.94 | 3.43 | (0.47 | ) | — | (0.61 | ) | (1.08 | ) | ||||||||||||||||||||
| Year Ended December 31, 2018 | $ | 22.18 | 0.56 | (2.46 | ) | (1.90 | ) | (0.66 | ) | (0.48 | ) | (0.01 | ) | (1.15 | ) | |||||||||||||||||
| C Class Shares | ||||||||||||||||||||||||||||||||
| Six months ended June 30, 2023 (Unaudited) | $ | 16.87 | 0.51 | 0.50 | 1.01 | (0.52 | ) | — | — | (0.52 | ) | |||||||||||||||||||||
| Year Ended December 31, 2022 | $ | 20.94 | 0.47 | (3.56 | ) | (3.09 | ) | (0.60 | ) | — | (0.38 | ) | (0.98 | ) | ||||||||||||||||||
| Year Ended December 31, 2021 | $ | 19.13 | 0.21 | 3.04 | 3.25 | (0.90 | ) | — | (0.54 | ) | (1.44 | ) | ||||||||||||||||||||
| Year Ended December 31, 2020 | $ | 20.84 | 0.30 | (1.20 | ) | (0.90 | ) | (0.38 | ) | — | (0.43 | ) | (0.81 | ) | ||||||||||||||||||
| Year Ended December 31, 2019 | $ | 18.56 | 0.31 | 2.91 | 3.22 | (0.41 | ) | — | (0.53 | ) | (0.94 | ) | ||||||||||||||||||||
| Year Ended December 31, 2018 | $ | 21.55 | 0.41 | (2.42 | ) | (2.01 | ) | (0.52 | ) | (0.45 | ) | (0.01 | ) | (0.98 | ) | |||||||||||||||||
Amounts designated as “—” are $0 or rounded to $0.
| (a) | Per share net investment income has been determined on the basis of average number of shares outstanding during the period. |
| (b) | Total return is a measure of the change in value of an investment in the Fund over the period covered. The returns shown do not reflect the deduction of taxes a shareholder would pay on Fund distributions, if any or the redemption of Fund shares. The total returns would be lower if the Adviser had not reduced investment management fees and/or reimbursed expenses (Note 4). |
| (c) | Ratio was determined after investment management fee reductions and/or reimbursed expenses and/or recoupments (Note 4). |
| (d) | Portfolio turnover rate is calculated on the basis of the Fund as a whole without distinguishing between classes of shares issued. |
| (e) | Not annualized. |
| (f) | Annualized. |
| (g) | Effective July 1, 2018, the Advisor agreed to limit expenses to 1.15%. |
| (h) | Effective July 1, 2018, the Advisor agreed to limit expenses to 1.55%. |
| (i) | Effective July 1, 2018, the Advisor agreed to limit expenses to 2.10%. |
| (1) | Prior to November 18, 2022, Westwood Salient Select Income Fund was known as Salient Select Income Fund. |
The accompanying notes are an integral part of the financial statements.
| WESTWOOD FUNDS |
| FINANCIAL HIGHLIGHTS |
| SELECTED PER SHARE DATA & RATIOS |
| FOR A SHARE OUTSTANDING THROUGHOUT THE PERIOD |
| Excluding
interest and dividends on short sales expense, if any | Including
interest and dividends on short sales expense, if any | |||||||||||||||||||||||||||||||||||||
| Net
asset value, end of period | Total return(b) | Net
assets, end of period (000’s) | Ratio
of total net expenses to average net assets(c) | Ratio
of total gross expenses to average net assets | Ratio
of net investment income to average net assets(c) | Ratio
of total net expenses to average net assets(c) | Ratio
of total gross expenses to average net assets | Ratio
of net investment income to average net assets(c) | Portfolio turnover rate(d) | |||||||||||||||||||||||||||||
| $ | 17.91 | 6.58 | % (e) | $ | 137,707 | 1.10 | % (f) | 1.07 | % (f) | 7.06 | % (f) | 1.10 | % (f) | 1.07 | % (f) | 7.06 | % (f) | 42 | % (e) | |||||||||||||||||||
| $ | 17.39 | (14.10 | )% | $ | 108,853 | 1.03 | % | 1.42 | % | 3.67 | % | 1.12 | % | 1.51 | % | 3.58 | % | 72 | % | |||||||||||||||||||
| $ | 21.56 | 15.44 | % | $ | 143,721 | 1.10 | % | 1.37 | % | 2.26 | % | 1.15 | % | 1.42 | % | 2.21 | % | 82 | % | |||||||||||||||||||
| $ | 19.68 | (2.75 | )% | $ | 160,526 | 1.10 | % | 1.37 | % | 2.73 | % | 1.15 | % | 1.42 | % | 2.68 | % | 55 | % | |||||||||||||||||||
| $ | 21.42 | 18.64 | % | $ | 232,707 | 1.06 | % | 1.31 | % | 2.76 | % | 1.10 | % | 1.35 | % | 2.72 | % | 49 | % | |||||||||||||||||||
| $ | 19.07 | (8.52 | )% | $ | 198,762 | 1.25 | % (g) | 1.37 | % | 3.37 | % | 1.48 | % (g) | 1.60 | % | 3.14 | % | 24 | % | |||||||||||||||||||
| $ | 17.99 | 6.50 | % (e) | $ | 105,390 | 1.40 | % (f) | 1.38 | % (f) | 6.53 | % (f) | 1.40 | % (f) | 1.38 | % (f) | 6.53 | % (f) | 42 | % (e) | |||||||||||||||||||
| $ | 17.45 | (14.45 | )% | $ | 103,950 | 1.53 | % | 1.95 | % | 3.73 | % | 1.62 | % | 2.04 | % | 3.64 | % | 72 | % | |||||||||||||||||||
| $ | 21.63 | 14.98 | % | $ | 126,620 | 1.50 | % | 1.77 | % | 1.87 | % | 1.55 | % | 1.82 | % | 1.82 | % | 82 | % | |||||||||||||||||||
| $ | 19.74 | (3.17 | )% | $ | 125,194 | 1.50 | % | 1.77 | % | 2.38 | % | 1.55 | % | 1.82 | % | 2.33 | % | 55 | % | |||||||||||||||||||
| $ | 21.48 | 18.12 | % | $ | 160,277 | 1.46 | % | 1.71 | % | 2.37 | % | 1.50 | % | 1.75 | % | 2.33 | % | 49 | % | |||||||||||||||||||
| $ | 19.13 | (8.78 | )% | $ | 122,484 | 1.60 | % (h) | 1.72 | % | 2.91 | % | 1.83 | % (h) | 1.95 | % | 2.68 | % | 24 | % | |||||||||||||||||||
| $ | 17.36 | 6.10 | % (e) | $ | 5,861 | 2.04 | % (f) | 2.03 | % (f) | 5.94 | % (f) | 2.04 | % (f) | 2.03 | % (f) | 5.94 | % (f) | 42 | % (e) | |||||||||||||||||||
| $ | 16.87 | (14.92 | )% | $ | 5,679 | 1.98 | % | 2.38 | % | 2.57 | % | 2.07 | % | 2.47 | % | 2.48 | % | 72 | % | |||||||||||||||||||
| $ | 20.94 | 14.35 | % | $ | 11,219 | 2.05 | % | 2.33 | % | 1.11 | % | 2.10 | % | 2.38 | % | 1.06 | % | 82 | % | |||||||||||||||||||
| $ | 19.13 | (3.69 | )% | $ | 29,178 | 2.05 | % | 2.32 | % | 1.75 | % | 2.10 | % | 2.37 | % | 1.70 | % | 55 | % | |||||||||||||||||||
| $ | 20.84 | 17.51 | % | $ | 51,214 | 2.03 | % | 2.28 | % | 1.58 | % | 2.07 | % | 2.32 | % | 1.54 | % | 49 | % | |||||||||||||||||||
| $ | 18.56 | (9.51 | )% | $ | 100,706 | 2.23 | % (i) | 2.35 | % | 2.23 | % | 2.46 | % (i) | 2.58 | % | 2.00 | % | 24 | % | |||||||||||||||||||
The accompanying notes are an integral part of the financial statements.
| WESTWOOD FUNDS |
| FINANCIAL HIGHLIGHTS |
| SELECTED PER SHARE DATA & RATIOS |
| FOR A SHARE OUTSTANDING THROUGHOUT THE PERIOD |
| Net realized | Distributions | |||||||||||||||||||||||
| Net asset value, | and unrealized | Total from | Dividends from | from net | ||||||||||||||||||||
| beginning of | Net investment | gains (losses) on | investment | net investment | realized capital | |||||||||||||||||||
| period | income (loss)(a) | investments | operations | income | gains | |||||||||||||||||||
| Westwood Broadmark Tactical Growth Fund (1) | ||||||||||||||||||||||||
| Institutional Shares | ||||||||||||||||||||||||
| Six months ended June 30, 2023 (Unaudited) | $ | 26.07 | 0.33 | 0.12 | 0.45 | — | — | |||||||||||||||||
| Year Ended December 31, 2022 | $ | 29.14 | (0.06 | ) | (2.24 | ) | (2.30 | ) | — | (0.77 | ) | |||||||||||||
| Year Ended December 31, 2021 | $ | 27.96 | (0.24 | ) | 2.48 | 2.24 | — | (1.06 | ) | |||||||||||||||
| Year Ended December 31, 2020 | $ | 26.81 | (0.16 | ) | 2.40 | 2.24 | (0.03 | ) | (1.06 | ) | ||||||||||||||
| Year Ended December 31, 2019 | $ | 25.43 | 0.16 | 2.53 | 2.69 | (0.14 | ) | (1.17 | ) | |||||||||||||||
| Year Ended December 31, 2018 | $ | 27.41 | 0.14 | (1.44 | ) | (1.30 | ) | (0.11 | ) | (0.57 | ) | |||||||||||||
| A Class Shares | ||||||||||||||||||||||||
| Six months ended June 30, 2023 (Unaudited) | $ | 24.31 | 0.27 | 0.11 | 0.38 | — | — | |||||||||||||||||
| Year Ended December 31, 2022 | $ | 27.34 | (0.13 | ) | (2.13 | ) | (2.26 | ) | — | (0.77 | ) | |||||||||||||
| Year Ended December 31, 2021 | $ | 26.40 | (0.34 | ) | 2.34 | 2.00 | — | (1.06 | ) | |||||||||||||||
| Year Ended December 31, 2020 | $ | 25.45 | (0.26 | ) | 2.27 | 2.01 | — | (1.06 | ) | |||||||||||||||
| Year Ended December 31, 2019 | $ | 24.24 | 0.05 | 2.39 | 2.44 | (0.06 | ) | (1.17 | ) | |||||||||||||||
| Year Ended December 31, 2018 | $ | 26.15 | (0.07 | ) (g) | (1.27 | ) | (1.34 | ) | — | (0.57 | ) | |||||||||||||
| C Class Shares | ||||||||||||||||||||||||
| Six months ended June 30, 2023 (Unaudited) | $ | 22.40 | 0.18 | 0.10 | 0.28 | — | — | |||||||||||||||||
| Year Ended December 31, 2022 | $ | 25.39 | (0.27 | ) | (1.95 | ) | (2.22 | ) | — | (0.77 | ) | |||||||||||||
| Year Ended December 31, 2021 | $ | 24.72 | (0.46 | ) | 2.19 | 1.73 | — | (1.06 | ) | |||||||||||||||
| Year Ended December 31, 2020 | $ | 24.03 | (0.39 | ) | 2.14 | 1.75 | — | (1.06 | ) | |||||||||||||||
| Year Ended December 31, 2019 | $ | 23.01 | (0.09 | ) (g) | 2.28 | 2.19 | — | (1.17 | ) | |||||||||||||||
| Year Ended December 31, 2018 | $ | 25.04 | (0.16 | ) (g) | (1.30 | ) | (1.46 | ) | — | (0.57 | ) | |||||||||||||
Amounts designated as “—” are $0 or rounded to $0.
| (a) | Per share net investment income (loss) has been determined on the basis of average number of shares outstanding during the period. |
| (b) | Total return is a measure of the change in value of an investment in the Fund over the period covered. The returns shown do not reflect the deduction of taxes a shareholder would pay on Fund distributions, if any or the redemption of Fund shares. The total returns would be lower if the Adviser had not reduced investment management fees and/or reimbursed expenses (Note 4). |
| (c) | Ratio was determined after investment management fee reductions and/or reimbursed expenses (Note 4). |
| (d) | Portfolio turnover rate is calculated on the basis of the Fund as a whole without distinguishing between classes of shares issued. |
| (e) | Not annualized. |
| (f) | Annualized. |
| (g) | The amount shown for a share outstanding throughout the period may not correlate with the Statement of Operations for the period due to the timing of sales and redemptions of Fund shares in relation to income earned and/or fluctuating market value of the investments of the Fund. |
| (1) | Prior to November 18, 2022, Westwood Broadmark Tactical Growth Fund was known as Salient Tactical Growth Fund. |
The accompanying notes are an integral part of the financial statements.
| WESTWOOD FUNDS |
| FINANCIAL HIGHLIGHTS |
| SELECTED PER SHARE DATA & RATIOS |
| FOR A SHARE OUTSTANDING THROUGHOUT THE PERIOD |
| Total distributions | Net
asset value, end of period | Total return(b) | Net
assets, end of period (000’s) | Ratio
of total net expenses to average net assets(c) | Ratio
of net investment income (loss) to average net assets(c) | Portfolio turnover rate(d) | ||||||||||||||||||||
| — | $ | 26.52 | 1.73 | % (e) | $ | 233,423 | 1.28 | % (f) | 2.59 | % (f) | 337 | % (e) | ||||||||||||||
| (0.77 | ) | $ | 26.07 | (7.90 | )% | $ | 236,181 | 1.51 | % | (0.21 | )% | 1037 | % | |||||||||||||
| (1.06 | ) | $ | 29.14 | 8.02 | % | $ | 301,241 | 1.46 | % | (0.82 | )% | 201 | % | |||||||||||||
| (1.09 | ) | $ | 27.96 | 8.40 | % | $ | 255,095 | 1.47 | % | (0.58 | )% | 626 | % | |||||||||||||
| (1.31 | ) | $ | 26.81 | 10.69 | % | $ | 250,153 | 1.43 | % | 0.62 | % | 435 | % | |||||||||||||
| (0.68 | ) | $ | 25.43 | (4.76 | )% | $ | 275,669 | 1.47 | % | 0.53 | % | 531 | % | |||||||||||||
| — | $ | 24.69 | 1.56 | % (e) | $ | 22,554 | 1.59 | % (f) | 2.23 | % (f) | 337 | % (e) | ||||||||||||||
| (0.77 | ) | $ | 24.31 | (8.27 | )% | $ | 27,117 | 1.91 | % | (0.49 | %) | 1037 | % | |||||||||||||
| (1.06 | ) | $ | 27.34 | 7.59 | % | $ | 21,995 | 1.86 | % | (1.21 | %) | 201 | % | |||||||||||||
| (1.06 | ) | $ | 26.40 | 7.95 | % | $ | 17,949 | 1.88 | % | (0.99 | %) | 626 | % | |||||||||||||
| (1.23 | ) | $ | 25.45 | 10.20 | % | $ | 17,273 | 1.85 | % | 0.21 | % | 435 | % | |||||||||||||
| (0.57 | ) | $ | 24.24 | (5.13 | )% | $ | 11,718 | 1.92 | % | (0.28 | %) | 531 | % | |||||||||||||
| — | $ | 22.68 | 1.25 | % (e) | $ | 6,805 | 2.23 | % (f) | 1.62 | % (f) | 337 | % (e) | ||||||||||||||
| (0.77 | ) | $ | 22.40 | (8.75 | )% | $ | 7,827 | 2.46 | % | (1.14 | )% | 1037 | % | |||||||||||||
| (1.06 | ) | $ | 25.39 | 7.01 | % | $ | 9,075 | 2.41 | % | (1.80 | )% | 201 | % | |||||||||||||
| (1.06 | ) | $ | 24.72 | 7.33 | % | $ | 11,830 | 2.42 | % | (1.60 | )% | 626 | % | |||||||||||||
| (1.17 | ) | $ | 24.03 | 9.67 | % | $ | 16,505 | 2.40 | % | (0.36 | )% | 435 | % | |||||||||||||
| (0.57 | ) | $ | 23.01 | (5.84 | )% | $ | 27,915 | 2.45 | % | (0.64 | )% | 531 | % | |||||||||||||
The accompanying notes are an integral part of the financial statements.
| WESTWOOD FUNDS |
| FINANCIAL HIGHLIGHTS |
| SELECTED PER SHARE DATA & RATIOS |
| FOR A SHARE OUTSTANDING THROUGHOUT THE PERIOD |
| Net realized | Distributions | |||||||||||||||||||||||
| Net asset value, | and unrealized | Total from | Dividends from | from net | ||||||||||||||||||||
| beginning of | Net investment | gains (losses) on | investment | net investment | realized capital | |||||||||||||||||||
| period | income (loss)(a) | investments | operations | income | gains | |||||||||||||||||||
| Westwood Broadmark Tactical Plus Fund (1) | ||||||||||||||||||||||||
| Institutional Shares (2) | ||||||||||||||||||||||||
| Six months ended June 30, 2023 (Unaudited) | $ | 11.29 | 0.18 | 0.04 | 0.22 | — | — | |||||||||||||||||
| Year Ended December 31, 2022 | $ | 12.37 | 0.04 | (0.28 | ) | (0.24 | ) | — | (0.84 | ) | ||||||||||||||
| Year Ended December 31, 2021 | $ | 11.65 | (0.08 | ) | 0.80 | 0.72 | — | — | ||||||||||||||||
| Year Ended December 31, 2020 | $ | 11.55 | (0.09 | ) | 0.91 | 0.82 | — | (0.72 | ) | |||||||||||||||
| Year Ended December 31, 2019 | $ | 11.41 | 0.07 | 0.76 | 0.83 | (0.12 | ) | (0.57 | ) | |||||||||||||||
| Year Ended December 31, 2018 | $ | 11.47 | 0.06 | 0.24 | 0.30 | (0.01 | ) | (0.35 | ) | |||||||||||||||
| A Class Shares | ||||||||||||||||||||||||
| Six months ended June 30, 2023 (Unaudited) | $ | 11.08 | 0.16 | 0.05 | 0.21 | — | — | |||||||||||||||||
| Year Ended December 31, 2022 | $ | 12.18 | — | (0.26 | ) | (0.26 | ) | — | (0.84 | ) | ||||||||||||||
| Year Ended December 31, 2021 | $ | 11.51 | (0.11 | ) | 0.78 | 0.67 | — | — | ||||||||||||||||
| Year Ended December 31, 2020 | $ | 11.44 | (0.12 | ) | 0.91 | 0.79 | — | (0.72 | ) | |||||||||||||||
| Year Ended December 31, 2019 | $ | 11.31 | 0.04 | 0.75 | 0.79 | (0.09 | ) | (0.57 | ) | |||||||||||||||
| Year Ended December 31, 2018 | $ | 11.40 | (0.02 | ) (h) | 0.28 | 0.26 | — | (0.35 | ) | |||||||||||||||
| C Class Shares | ||||||||||||||||||||||||
| Six months ended June 30, 2023 (Unaudited) | $ | 10.36 | 0.11 | 0.03 | 0.14 | — | — | |||||||||||||||||
| Year Ended December 31, 2022 | $ | 11.52 | (0.09 | ) | (0.23 | ) | (0.32 | ) | — | (0.84 | ) | |||||||||||||
| Year Ended December 31, 2021 | $ | 10.97 | (0.19 | ) | 0.74 | 0.55 | — | — | ||||||||||||||||
| Year Ended December 31, 2020 | $ | 11.02 | (0.20 | ) | 0.87 | 0.67 | — | (0.72 | ) | |||||||||||||||
| Year Ended December 31, 2019 | $ | 10.92 | (0.03 | ) (h) | 0.70 | 0.67 | — | (0.57 | ) | |||||||||||||||
| Year Ended December 31, 2018 | $ | 11.10 | (0.08 | ) (h) | 0.25 | 0.17 | — | (0.35 | ) | |||||||||||||||
| F Class Shares | ||||||||||||||||||||||||
| Six months ended June 30, 2023 (Unaudited) | $ | 11.55 | 0.20 | 0.05 | 0.25 | — | — | |||||||||||||||||
| Year Ended December 31, 2022 | $ | 12.65 | 0.07 | (0.27 | ) | (0.20 | ) | (0.06 | ) | (0.84 | ) | |||||||||||||
| Year Ended December 31, 2021 | $ | 11.88 | (0.05 | ) | 0.82 | 0.77 | — | — | ||||||||||||||||
| Year Ended December 31, 2020 | $ | 11.73 | (0.05 | ) | 0.92 | 0.87 | — | (0.72 | ) | |||||||||||||||
| Year Ended December 31, 2019 | $ | 11.58 | 0.11 | 0.77 | 0.88 | (0.16 | ) | (0.57 | ) | |||||||||||||||
| Year Ended December 31, 2018 | $ | 11.60 | 0.07 | 0.27 | 0.34 | (0.01 | ) | (0.35 | ) | |||||||||||||||
Amounts designated as “—” are $0 or rounded to $0.
| (a) | Per share net investment income (loss) has been determined on the basis of average number of shares outstanding during the period. |
| (b) | Total return is a measure of the change in value of an investment in the Fund over the period covered. The returns shown do not reflect the deduction of taxes a shareholder would pay on Fund distributions, if any or the redemption of Fund shares. The total returns would be lower if the Adviser had not reduced investment management fees and/or reimbursed expenses (Note 4). |
| (c) | Ratio was determined after investment management fee reductions and/or reimbursed expenses (Note 4). |
| (d) | Portfolio turnover rate is calculated on the basis of the Fund as a whole without distinguishing between classes of shares issued. |
| (e) | Not annualized. |
| (f) | Annualized. |
| (g) | Effective February 1, 2018, the annual expense limitation rate changed from 1.80% to 1.40%. |
| (h) | The amount shown for a share outstanding throughout the period may not correlate with the Statement of Operations for the period due to the timing of sales and redemptions of Fund shares in relation to income earned, class specific expenses and/or fluctuating market value of the investments of the Fund. |
| (i) | Effective February 1, 2018, the annual expense limitation rate changed from 2.05% to 1.65%. |
| (j) | Effective February 1, 2018, the annual expense limitation rate changed from 2.80% to 2.40%. |
| (k) | Effective February 1, 2018, the annual expense limitation rate changed from 1.49% to 1.09%. |
| (1) | Prior to November 18, 2022, Westwood Broadmark Tactical Plus Fund was known as Salient Tactical Plus Fund. |
| (2) | Prior to November 18, 2022, Institutional Shares were I Share Class. |
The accompanying notes are an integral part of the financial statements.
| WESTWOOD FUNDS |
| FINANCIAL HIGHLIGHTS |
| SELECTED PER SHARE DATA & RATIOS |
| FOR A SHARE OUTSTANDING THROUGHOUT THE PERIOD |
| Total distributions | Net
asset value, end of period | Total return(b) | Net
assets, end of period (000’s) | Ratio
of total net expenses to average net assets(c) | Ratio
of total gross expenses to average net assets | Ratio
of net investment income (loss) to average net assets(c) | Portfolio turnover rate(d) | |||||||||||||||||||||||
| — | $ | 11.51 | 1.95 | % (e) | $ | 35,707 | 1.35 | % (f) | 1.73 | % (f) | 3.20 | % (f) | 0 | % (e) | ||||||||||||||||
| (0.84 | ) | $ | 11.29 | (1.95 | )% | $ | 34,427 | 1.39 | % | 1.93 | % | 0.31 | % | 827 | % | |||||||||||||||
| — | $ | 12.37 | 6.18 | % | $ | 30,855 | 1.40 | % | 1.94 | % | (0.68 | )% | 62 | % | ||||||||||||||||
| (0.72 | ) | $ | 11.65 | 7.15 | % | $ | 30,308 | 1.40 | % | 1.99 | % | (0.77 | )% | 5029 | % | |||||||||||||||
| (0.69 | ) | $ | 11.55 | 7.24 | % | $ | 24,882 | 1.40 | % | 1.94 | % | 0.61 | % | 9813 | % | |||||||||||||||
| (0.36 | ) | $ | 11.41 | 2.56 | % | $ | 18,502 | 1.40 | % (g) | 2.38 | % | 0.51 | % | 5067 | % | |||||||||||||||
| — | $ | 11.29 | 1.90 | % (e) | $ | 605 | 1.60 | % (f) | 1.98 | % (f) | 2.94 | % (f) | 0 | % (e) | ||||||||||||||||
| (0.84 | ) | $ | 11.08 | (2.18 | )% | $ | 584 | 1.64 | % | 2.16 | % | 0.02 | % | 827 | % | |||||||||||||||
| — | $ | 12.18 | 5.82 | % | $ | 579 | 1.65 | % | 2.19 | % | (0.95 | )% | 62 | % | ||||||||||||||||
| (0.72 | ) | $ | 11.51 | 6.95 | % | $ | 668 | 1.65 | % | 2.23 | % | (1.04 | )% | 5029 | % | |||||||||||||||
| (0.66 | ) | $ | 11.44 | 6.96 | % | $ | 743 | 1.65 | % | 2.17 | % | 0.33 | % | 9813 | % | |||||||||||||||
| (0.35 | ) | $ | 11.31 | 2.29 | % | $ | 616 | 1.65 | % (i) | 2.72 | % | (0.15 | )% | 5067 | % | |||||||||||||||
| — | $ | 10.50 | 1.35 | % (e) | $ | 414 | 2.35 | % (f) | 2.73 | % (f) | 2.19 | % (f) | 0 | % (e) | ||||||||||||||||
| (0.84 | ) | $ | 10.36 | (2.82 | )% | $ | 414 | 2.39 | % | 2.93 | % | (0.77 | )% | 827 | % | |||||||||||||||
| — | $ | 11.52 | 5.01 | % | $ | 553 | 2.40 | % | 2.94 | % | (1.68 | )% | 62 | % | ||||||||||||||||
| (0.72 | ) | $ | 10.97 | 6.13 | % | $ | 575 | 2.40 | % | 2.99 | % | (1.77 | )% | 5029 | % | |||||||||||||||
| (0.57 | ) | $ | 11.02 | 6.15 | % | $ | 488 | 2.40 | % | 2.89 | % | (0.30 | )% | 9813 | % | |||||||||||||||
| (0.35 | ) | $ | 10.92 | 1.50 | % | $ | 629 | 2.40 | % (j) | 5.32 | % | (0.72 | )% | 5067 | % | |||||||||||||||
| — | $ | 11.80 | 2.16 | % (e) | $ | 41,441 | 1.04 | % (f) | 1.73 | % (f) | 3.51 | % (f) | 0 | % (e) | ||||||||||||||||
| (0.90 | ) | $ | 11.55 | (1.65 | )% | $ | 37,040 | 1.08 | % | 1.93 | % | 0.59 | % | 827 | % | |||||||||||||||
| — | $ | 12.65 | 6.48 | % | $ | 39,430 | 1.09 | % | 1.94 | % | (0.37 | )% | 62 | % | ||||||||||||||||
| (0.72 | ) | $ | 11.88 | 7.46 | % | $ | 38,158 | 1.09 | % | 1.99 | % | (0.46 | )% | 5029 | % | |||||||||||||||
| (0.73 | ) | $ | 11.73 | 7.54 | % | $ | 34,334 | 1.09 | % | 1.95 | % | 0.93 | % | 9813 | % | |||||||||||||||
| (0.36 | ) | $ | 11.58 | 2.91 | % | $ | 27,688 | 1.09 | % (k) | 2.24 | % | 0.63 | % | 5067 | % | |||||||||||||||
The accompanying notes are an integral part of the financial statements.
WESTWOOD FUNDS
| NOTES TO FINANCIAL STATEMENTS (Unaudited) |
1. Organization
Westwood Salient MLP & Energy Infrastructure Fund (“MLP & Energy Infrastructure Fund”), Westwood Salient Global Real Estate Fund (“Global Real Estate Fund”), Westwood Salient Select Income Fund (“Select Income Fund”), Westwood Broadmark Tactical Growth Fund (“Broadmark Tactical Growth Fund”), and Westwood Broadmark Tactical Plus Fund (“Broadmark Tactical Plus Fund”), (individually, a “Fund” and collectively, the “Funds”) are each a series of Ultimus Managers Trust (the “Trust”), an open-end investment company established as an Ohio business trust under a Declaration of Trust dated February 28, 2012. The Trust is registered under the Investment Company Act of 1940, as amended, (the “1940 Act”).
The Global Real Estate Fund, Select Income Fund, and Tactical Growth Funds (“Predecessor Forward Funds”), formerly part of Forward Funds, were the sole remaining series of Forward Funds, and were acquired by, and reorganized into, the Trust on November 18, 2022, pursuant to an Agreement and Plan of Reorganization dated June 27, 2022.
MLP & Energy Infrastructure Fund and Broadmark Tactical Plus Funds (“Predecessor Salient MF Trust”), formerly part of Salient MF Trust, were the sole remaining series of Salient MF Trust, and were reorganized into the Trust on November 18, 2022, pursuant to an Agreement and Plan of Reorganization dated June 27, 2022.
Global Real Estate Fund, Select Income Fund, Broadmark Tactical Growth Fund and Broadmark Tactical Plus Fund are open-end diversified funds. MLP & Energy Infrastructure Fund is an open-end non-diversified fund.
MLP & Energy Infrastructure Fund seeks to maximize total return (capital appreciation and income).
The investment objective of the Global Real Estate Fund seeks total return from both capital appreciation and current income.
The investment objective of Select Income Fund seeks high current income and potential for modest long-term growth of capital.
The investment objective of Broadmark Tactical Growth Fund is to produce above-average, risk-adjusted returns, in any market environment, while exhibiting less downside volatility than the S&P 500 Index.
Broadmark Tactical Plus Fund seeks to produce in any market environment above-average risk-adjusted returns and less downside volatility than the S&P 500 fund.
As of June 30, 2023, all of the Funds offer Institutional Shares, A Class Shares and C Class Shares. MLP & Infrastructure Fund has a fourth class, Ultra Shares. Broadmark Tactical Plus Fund has a fourth class, F Class Shares.
Institutional Shares are sold without any sales loads, but subject to an administrative services plan fee of up to 0.10% in MLP & Energy Infrastructure Fund, up to 0.05% of the average daily net assets attributable to Institutional Shares in Global Real Estate Fund, Select Income Fund and Tactical Growth Fund; and up to 0.10% Broadmark Tactical Plus Fund, requiring a $100,000 minimum investment and offered exclusively to certain retirement plans established for the benefit of employees of the Westwood Management Corporation (the “Adviser”) or its affiliates; defined benefit retirement plans, endowments or foundations; banks and trust companies or law firms acting as trustee or manager for trust accounts; investors who purchase through asset-based fee programs available through financial intermediaries; and insurance companies).
A Class Shares are sold with a maximum sales charge of 3.00% and a 12b-1 services plan fee up to 0.25% of the average daily net assets attributable to A Class Shares), requiring a $1,000 minimum investment. A Class Shares are
WESTWOOD FUNDS
also subject to an administrative services plan fee of up to 0.10% in MLP & Energy Infrastructure Fund and Broadmark Tactical Plus Fund; and up to 0.20% of the average daily net assets attributable to A Class Shares in Global Real Estate Fund, Select Income Fund and Tactical Growth Fund. Class A Shares purchases of $250,000 or more may be subject to a contingent deferred sales charge (“CDSC”) of 1.00% if redeemed within 18 months of purchase.
C Class Shares are sold without any sales loads, but subject to a 12b-1 services plan fee (up to 0.75% of the average daily net assets of the Global Real Estate Fund, Select Income Fund and Broadmark Tactical Growth Fund’s C Class Shares, and up to 1.00% of the average daily net assets of the MLP & Energy Infrastructure Fund’s and Broadmark Tactical Plus Fund’s C Class Shares), requiring a $1,000 minimum investment. C Class Shares are also subject to an administrative services plan fee of up to 0.25% of the average daily net assets attributable to C Class Shares in Global Real Estate Fund, Select Income Fund and Tactical Growth Fund; and up to 0.10% in MLP & Energy Infrastructure Fund and Broadmark Tactical Plus Fund. C Class Shares may be subject to a CDSC fee of 1.00% if redeemed within 12 months of purchase. C Class Shares automatically convert to A Class Shares after being held for 10 years.
Ultra Shares are sold without any sales loads and distribution and/or administrative services fees, requiring a $20,000,000 initial investment and offered exclusively to employer retirement plans; health savings accounts under section 223 of the Internal Revenue Code of 1986, as amended, if such accounts are maintained by the Fund at an omnibus level; endowments and foundations and local, city and state agencies; unaffiliated registered investment companies; collective investment trusts; banks and trust companies or law firms acting as trustee or manager for trust accounts; and insurance companies.
F Class Shares are held only by those Fund shareholders who acquired such shares as a result of the Broadmark Reorganization. Only shareholders who acquired Class F shares pursuant to the Broadmark Reorganization may purchase additional F Class shares. There is no subsequent investment minimum for F Class shares.
Each share class represents an ownership interest in the same investment portfolio of the Fund.
Westwood Management Corp., (“Westwood” or an “Adviser”) serves as investment adviser to MLP & Energy Infrastructure Fund, Global Real Estate Fund, Select Income Fund, and Broadmark Tactical Growth Fund. Salient Advisors, L.P. (“Salient Advisors”) and together with Westwood serve as investment adviser to the Broadmark Tactical Plus Fund. Salient Advisors is a wholly owned subsidiary of Westwood Holdings. Broadmark Asset Management LLC (“Sub-Adviser” or “Broadmark”) is the Sub-Adviser to Broadmark Tactical Growth Fund and Broadmark Tactical Plus Fund. Westwood Holdings is a majority owner of Broadmark.
2. Significant Accounting Policies
The following is a summary of the Funds’ significant accounting policies. The policies are in conformity with accounting principles generally accepted in the United States of America (“GAAP”). The Funds follow accounting and reporting guidance under Financial Accounting Standards Board (“FASB”) Accounting Standards Codification Topic 946, “Financial Services – Investment Companies.”
Regulatory Update – In October 2020, the Securities and Exchange Commission (the “SEC”) adopted new regulations governing the use of derivatives by registered investment companies (“Rule 18f-4”). The Funds were required to comply with Rule 18f-4 by August 19, 2022. Rule 18f-4 imposes limits on the amount of derivatives a fund can enter into, eliminates the asset segregation framework currently used by funds to comply with Section 18 of the 1940 Act, treats derivatives as senior securities and requires funds whose use of derivatives is more than a limited specified exposure amount to establish and maintain a comprehensive derivatives risk management program and appoint a derivatives risk manager. The MLP & Energy Infrastructure Fund, Broadmark Tactical Growth Fund and Broadmark Tactical Plus Fund are currently complying with Rule 18f-4.
Securities valuation – Each Fund values its portfolio securities at market value as of the close of regular trading on the New York Stock Exchange (the “NYSE”) (normally 4:00 p.m. Eastern time) on each business day the NYSE
WESTWOOD FUNDS
is open for business. The Funds value their listed securities on the basis of the security’s last sale price on the security’s primary exchange, if available, otherwise at the exchange’s most recently quoted mean price. NASDAQ-listed securities are valued at the NASDAQ Official Closing Price. Investments representing shares of other open-end investment companies, other than exchange-traded funds (“ETFs”), if any, but including money market funds, are valued at their net asset value (“NAV”) as reported by such companies. Option contracts are valued at the closing price on the exchange on which they are primarily traded; if no closing price is available at the time of valuation, the option will be valued at the mean of the closing bid and ask prices for that day. Future contracts are valued at the final settlement price, or, if a settled price is not available, at the last sale price as of the close of regular trading on the primary exchange on which they are traded. When using a quoted price and when the market is considered active, these securities will be classified as Level 1 within the fair value hierarchy (see below). In the event that market quotations are not readily available or are considered unreliable due to market or other events, the Funds value their securities and other assets at fair value as determined by the Adviser, as the Funds’ valuation designed, in accordance with procedures adopted by the Board of Trustees (the “Board”) pursuant to Rule 2a-5 under the 1940 Act. Under these procedures, the securities will be classified as Level 2 or 3 within the fair value hierarchy, depending on the inputs used. Unavailable or unreliable market quotes may be due to the following factors: a substantial bid-ask spread; infrequent sales resulting in stale prices; insufficient trading volume; small trade sizes; a temporary lapse in any reliable pricing source; and actions of the securities or futures markets, such as the suspension or limitation of trading. As a result, the prices of securities used to calculate each Fund’s NAV may differ from quoted or published prices for the same securities. Securities traded on foreign exchanges, if any, are fair valued by an independent pricing service and translated from the local currency into U.S. dollars using currency exchange rates supplied by an independent pricing service.
GAAP establishes a single authoritative definition of fair value, sets out a framework for measuring fair value, and requires additional disclosures about fair value measurements.
Various inputs are used in determining the value of each Fund’s investments. These inputs are summarized in the three broad levels listed below:
| ● | Level 1 – quoted prices in active markets for identical securities |
| ● | Level 2 – other significant observable inputs |
| ● | Level 3 – significant unobservable inputs |
Fixed income securities held by the Funds, if any, are classified as Level 2 since values are based on prices provided by an independent pricing service that utilizes various “other significant observable inputs” including bid and ask quotations, prices of similar securities, and interest rates, among other factors.
For most securities, both the latest transaction prices and adjustments are furnished by independent pricing services. The Adviser and Salient Advisor as the Funds’ valuation designee is responsible for carrying out pricing and valuation duties in accordance with the Advisor’s Valuation Procedures (the “Procedures”). The Funds value all other securities and assets for which market quotations are unavailable or unreliable at their fair value determined in good faith.
The inputs or methods used for valuing securities are not necessarily an indication of the risks associated with investing in those securities. The inputs used to measure fair value may fall into different levels of the fair value hierarchy. In such cases, for disclosure purposes, the level in the fair value hierarchy within which the fair value measurement falls in its entirety is determined based on the lowest level input that is significant to the fair value measurement.
WESTWOOD FUNDS
The following is a summary of each Fund’s investments and the inputs used to value the investments as of June 3, 2023:
| MLP & Energy Infrastructure Fund | Level 1 | Level 2 | Level 3 | Total | ||||||||||||
| Master Limited Partnerships | $ | 213,444,863 | $ | — | $ | — | $ | 213,444,863 | ||||||||
| MLP Related Companies | 668,931,347 | — | 8,960,000 | 677,891,347 | ||||||||||||
| Special Purpose Acquisition Companies | — | — | 315 | 315 | ||||||||||||
| Money Market Funds | 3,107,852 | — | — | 3,107,852 | ||||||||||||
| Total Investment Securities | $ | 885,484,062 | $ | — | $ | 8,960,315 | $ | 894,444,377 | ||||||||
| Other Financial Instruments | ||||||||||||||||
| Written Option Contracts | $ | (5,047,844 | ) | $ | (1,256,015 | ) | $ | — | $ | (6,303,859 | ) | |||||
| Total | $ | 880,436,218 | $ | (1,256,015 | ) | $ | 8,960,315 | $ | 888,140,518 | |||||||
| Global Real Estate Fund | ||||||||||||||||
| Common Stocks | $ | 11,182,484 | $ | 6,935,513 | * | $ | — | $ | 18,117,997 | |||||||
| Money Market Funds | 611,918 | — | — | 611,918 | ||||||||||||
| Total Investment Securities | $ | 11,794,402 | $ | 6,935,513 | $ | — | $ | 18,729,915 | ||||||||
| Select Income Fund | ||||||||||||||||
| Common Stocks | $ | 70,679,948 | $ | — | $ | — | $ | 70,679,948 | ||||||||
| Preferred Stocks | 165,865,485 | — | — | 165,865,485 | ||||||||||||
| Money Market Funds | 5,841,413 | — | — | 5,841,413 | ||||||||||||
| Total Investment Securities | $ | 242,386,846 | $ | — | $ | — | $ | 242,386,846 | ||||||||
| Broadmark Tactical Growth Fund | ||||||||||||||||
| Exchange-Traded Funds | $ | 131,411,242 | $ | — | $ | — | $ | 131,411,242 | ||||||||
| Money Market Funds | 163,745,531 | — | — | 163,745,531 | ||||||||||||
| Total Investment Securities | $ | 295,156,773 | $ | — | $ | — | $ | 295,156,773 | ||||||||
| Broadmark Tactical Plus Fund | ||||||||||||||||
| Money Market Funds | $ | 75,811,192 | $ | — | $ | — | $ | 75,811,192 | ||||||||
| Total Investment Securities | $ | 75,811,192 | $ | — | $ | — | $ | 75,811,192 | ||||||||
| Other Financial Instruments** | ||||||||||||||||
| Futures Contracts (liabilities) | $ | 1,174,371 | $ | — | $ | — | $ | 1,174,371 | ||||||||
| Total | $ | 76,985,563 | $ | — | $ | — | $ | 76,985,563 | ||||||||
Amounts designated as “—” are $0 or have been rounded to $0.
| * | With respect to foreign equity securities that are principally traded on a market outside the United States, the Fund utilizes an independent fair value pricing service to evaluate the effect of market fluctuations on these securities after the close of trading in that foreign market. To the extent that securities are valued using this service, they will be classified as Level 2 securities. |
| ** | Other financial instruments are derivative instruments not reflected in the Schedule of Investments such as future contracts. These instruments are valued at the unrealized appreciation (depreciation) on the instrument. |
WESTWOOD FUNDS
MLP & Energy Infrastructure Fund
| Change in | ||||||||||||||||||||||||||||||||
| Balance as of | Net | Unrealized | Transfer | Transfer | Balance as of | |||||||||||||||||||||||||||
| December 31, | Purchases/ | Realized | Appreciation | Into | Out of | June 30, | ||||||||||||||||||||||||||
| Asset Type | 2022 | Acquisitions | Net Sales | Losses | (Depreciation) | Level 3 | Level 3 | 2023 | ||||||||||||||||||||||||
| MLP Related Companies | $ | 9,092,368 | $ | — | $ | — | $ | — | $ | (132,368 | ) | $ | — | $ | — | $ | 8,960,000 | |||||||||||||||
| Special Purpose Acquisition Companies | 315 | — | — | — | — | — | — | 315 | ||||||||||||||||||||||||
| MLP & Energy Infrastructure Fund | ||||||||||||
| Impact to | ||||||||||||
| Fair Value as of | Valuation from | |||||||||||
| June 30, | Valuation | Unobservable | Input Value/ | an Increase in | ||||||||
| 2023 | Technique | Input | Range | Input | ||||||||
| MLP Related Companies | $ | 8,960,000 | Discounted Cash Flow | Discount Rate | 15% | Decrease | ||||||
| Terminal Cash Flow Growth Rate | 2% | Increase | ||||||||||
| Special Purpose Acquisition Companies | $ | 315 | Recent Transactions | Recent Transactions | $0.003 | Increase | ||||||
The restricted securities held by the MLP & Energy Infrastructure Fund at June 30, 2023 are identified below and are also presented in the Fund’s Schedule of Investments.
| % of | Acquisition | |||||||||||||
| Net Assets | Date | Shares/Units | Cost | Fair Value | ||||||||||
| EMG Utica Executed Purchase Agreement | 1.00% | 2/22/2013* | 16,000,000 | 16,000,000 | $ | 8,960,000 | ||||||||
| TortoiseEconfin Acquisition Corp III - Founder Shares | 0.00% | 7/21/2021* | 104,850 | 315 | 315 | |||||||||
| 16,000,315 | 8,960,315 | |||||||||||||
| * | Original purchase date by acquired fund prior to merger. |
Share valuation – The NAV per share of each class of each Fund is calculated daily by dividing the total value of the assets attributable to that class, less liabilities attributable to that class, by the number of shares outstanding of that class. The offering price and redemption price per share of each class of each Fund is equal to the NAV per share of such class except for A Class Shares. A Class Shares have a front-end sales charge, which is deducted from your purchased price when you buy your shares.
Investment income – Dividend income is recorded on the ex-dividend date. Non-cash dividends included in dividend income, if any, are recorded at the fair value of the security received. Interest income is accrued as earned. Withholding taxes on foreign dividends, if any, have been recorded in accordance with the Funds’ understanding of the applicable country’s tax rules and rates. The Funds may invest in real estate investment trusts (“REITs”) that pay
WESTWOOD FUNDS
distributions to their shareholders based on available funds from operations. It is common for these distributions to exceed the REIT’s taxable earnings and profits resulting in the excess portion of such distribution to be designated as return of capital. Distributions received from REITs are generally recorded as dividend income and, if necessary, are reclassified annually in accordance with tax information provided by the underlying REITs. Distributions received from each Fund’s investments in Master Limited Partnerships (“MLPs”) may be comprised of both income and return of capital. Each Fund records investment income and return of capital based on estimates made at the time such distributions are received. Such estimates are based on historical information available from each MLP and other industry sources. These estimates may subsequently be revised based on information received from MLPs after their tax reporting periods are concluded. Discounts and premiums on fixed income securities, if any, are amortized using the interest method.
Investment transactions – Investment transactions are accounted for on the trade date. Realized gains and losses on investments sold are determined on a specific identification basis.
Allocation between Classes – Investment income earned, realized capital gains and losses, and unrealized appreciation and depreciation are allocated daily to each Class of a Fund based upon its proportionate share of total net assets of that Fund. Class-specific expenses are charged directly to the Class incurring the expense. Common expenses which are not attributable to a specific Class are allocated daily to each Class of shares of a Fund based upon its proportionate share of total net assets of that Fund.
Common expenses – Common expenses of the Trust are allocated among the Funds and the other series of the Trust based on the relative net assets of each series, the number of series in the Trust, or the nature of the services performed and the relative applicability to each series.
Futures contracts – A Fund may use futures contracts for tactical hedging purposes as well as to enhance a Fund’s returns. A futures contract represents a commitment for the future purchase or sale of an asset at a specified price on a specified date. When a Fund purchases or sells a futures contract, no price is paid to or received by a Fund. Instead, a Fund is required to deposit in a segregated asset account an amount of cash or qualifying securities. This is called the “initial margin deposit.” Subsequent payments, known as “variation margin,” are made or received by a Fund each day, depending on the daily fluctuations in the fair value of the underlying asset. A Fund recognizes an unrealized gain or loss equal to the daily valuation margin. If market conditions move unexpectedly, a Fund may not achieve the anticipated benefits of the futures contracts and may realize a loss. The margin deposits for futures contracts and the variation receivable/payable are reported on the Statements of Assets and Liabilities.
Options written/purchased – The Funds may utilize longer maturity options for stock replacement when and as price and volatility relationships become more favorable for options versus underlying stocks or for tax and liquidity management purposes. The Funds are authorized to write (sell) and purchase put and call options. The risk in writing a call option is that the Funds give up the opportunity to profit if the market price of the security increases. The risk in writing a put option is that the Funds may incur a loss if the market price of the security decreases and the option is exercised. The risk in purchasing an option is that the Funds pay a premium whether or not the option is exercised. The Funds also have the additional risk of being unable to enter into a closing transaction at an acceptable price if a liquid secondary market does not exist. Option contracts also involve the risk that they may not work as intended due to unanticipated developments in market conditions or other causes.
Foreign currency translation – Securities and other assets and liabilities denominated in or expected to settle in foreign currencies are translated into U.S. dollars based on exchange rates on the following basis:
| A. | The fair values of investment securities and other assets and liabilities are translated as of the close of the NYSE each day. |
| B. | Purchases and sales of investment securities and income and expenses are translated at the rate of exchange prevailing as of 4:00 p.m. Eastern Time on the respective date of such transactions. |
WESTWOOD FUNDS
| C. | The Funds do not isolate that portion of the results of operations caused by changes in foreign exchange rates on investments from those caused by changes in market prices of securities held. Such fluctuations are included with the net realized and unrealized gains or losses on investments. |
Reported net realized foreign exchange gains or losses arise from 1) purchases and sales of foreign currencies, 2) currency gains or losses realized between the trade and settlement dates on securities transactions and 3) the difference between the amounts of dividends and foreign withholding taxes recorded on a Fund’s books and the U.S. dollar equivalent of the amounts actually received or paid. Reported net unrealized foreign exchange gains and losses arise from changes in the value of assets and liabilities other than investments in securities that result from changes in exchange rates.
The Funds may be subject to foreign taxes related to foreign income received, capital gain on the sale of securities and certain foreign currency transactions (a portion of which may be reclaimable). All foreign taxes are recorded in accordance with the applicable regulations and rates that exist in the foreign jurisdictions in which a Fund invests.
Borrowing Costs – From time to time, the Funds may have an overdrawn cash balance at the custodian due to redemptions or market movements. When this occurs, the Funds will incur borrowing costs charged by the custodian. Borrowing costs for each Fund, if any, for the six months ended June 30, 2023 can be found on the Statements of Operations.
ReFlow transactions – Certain Funds may participate in ReFlow, a program designed to provide an alternative liquidity source for mutual funds experiencing redemptions of their shares. In order to pay cash to shareholders who redeem their shares on a given day, a mutual fund typically must hold cash in its portfolio, liquidate portfolio securities, or borrow money, all of which impose certain costs on the fund. ReFlow provides participating mutual funds with another source of cash by standing ready to purchase shares from a fund equal to the amount of the fund’s net redemptions on a given day. ReFlow then generally redeems those shares when the fund experiences net sales. In return for this service, the fund will pay a fee to ReFlow at a rate determined by a daily auction with other participating mutual funds. The costs to a Fund for participating in ReFlow are generally expected to be influenced by and comparable to the cost of other sources of liquidity, such as the Fund’s short-term lending arrangements or the costs of selling portfolio securities to meet redemptions. ReFlow is prohibited from acquiring more than 2.95% of the total net assets of any Fund. The Predecessor Board had adopted certain procedures to govern the Funds’ participation in ReFlow. During the six months ended June 30, 2023, no ReFlow fees were incurred.
Estimates – The preparation of financial statements in conformity with GAAP requires management to make estimates and assumptions that affect the reported amounts of assets and liabilities and disclosure of contingent assets and liabilities as of the date of the financial statements and the reported amounts of increase (decrease) in net assets from operations during the reporting period. Actual results could differ from those estimates.
Distributions to shareholders – MLP & Energy Infrastructure Fund, Global Real Estate Fund and Select Income Fund distribute substantially all of their net income to shareholders on a quarterly basis and their net capital gains to shareholders at least annually in December. Tactical Growth Fund and Tactical Plus Fund are normally declared and paid annually in December. The amount of such dividends and distributions are determined in accordance
WESTWOOD FUNDS
with federal income tax regulations, which may differ from GAAP. Dividends and distributions to shareholders are recorded on the ex-dividend date. The character of dividends paid to shareholders of the Funds for federal income tax purposes during the periods ended June 30, 2023 and December 31, 2022 was as follows:
| Ordinary | Long-Term | Return of | Total | |||||||||||||
| Period Ended | Income | Capital Gains | Capital | Distributions | ||||||||||||
| MLP & Energy Infrastructure Fund | ||||||||||||||||
| June 30, 2023 | $ | 21,278,455 | $ | — | $ | — | $ | 21,278,455 | ||||||||
| December 31, 2022 | $ | — | $ | — | $ | 39,068,282 | $ | 39,068,282 | ||||||||
| Global Real Estate Fund | ||||||||||||||||
| June 30, 2023 | $ | 244,337 | $ | — | $ | — | $ | 244,337 | ||||||||
| December 31, 2022 | $ | 432,515 | $ | — | $ | 62,845 | $ | 495,360 | ||||||||
| Select Income Fund | ||||||||||||||||
| June 30, 2023 | $ | 7,791,435 | $ | — | $ | — | $ | 7,791,435 | ||||||||
| December 31, 2022 | $ | 8,842,015 | $ | — | $ | 5,645,768 | $ | 14,487,783 | ||||||||
| Broadmark Tactical Growth Fund | ||||||||||||||||
| June 30, 2023 | $ | — | $ | — | $ | — | $ | — | ||||||||
| December 31, 2022 | $ | — | $ | 7,812,987 | $ | — | $ | 7,812,987 | ||||||||
| Broadmark Tactical Plus Fund | ||||||||||||||||
| June 30, 2023 | $ | — | $ | — | $ | — | $ | — | ||||||||
| December 31, 2022 | $ | 1,681,010 | $ | 3,437,935 | $ | — | $ | 5,118,945 | ||||||||
Federal income tax – Each Fund has qualified and intends to continue to qualify as a regulated investment company under the Internal Revenue Code of 1986, as amended (the “Code”). Qualification generally will relieve the Funds of liability for federal income taxes to the extent 100% of their net investment income and net realized capital gains are distributed in accordance with the Code.
In order to avoid imposition of the excise tax applicable to regulated investment companies, it is also each Fund’s intention to declare as dividends in each calendar year at least 98% of its net investment income (earned during the calendar year) and 98.2% of its net realized capital gains (earned during the twelve months ended October 31) plus undistributed amounts from prior years.
The following information is computed on a tax basis for each item as of December 31, 2022:
| Broadmark | ||||||||||||
| Global Real | Select Income | Tactical Growth | ||||||||||
| Estate Fund | Fund | Fund | ||||||||||
| Federal income tax cost | $ | 22,172,355 | $ | 213,057,765 | $ | 267,664,946 | ||||||
| Gross unrealized appreciation | $ | 598,100 | $ | 24,216,153 | $ | 1,183,627 | ||||||
| Gross unrealized depreciation | (2,844,924 | ) | (23,344,807 | ) | — | |||||||
| Net unrealized appreciation (depreciation) | (2,246,824 | ) | 871,346 | 1,183,627 | ||||||||
| Capital loss carryforward | (23,203,071 | ) | (2,480,683 | ) | — | |||||||
| Post October capital loss deferral | — | — | (1,044,627 | ) | ||||||||
| Total distributable earnings (accumulated deficit) | $ | (25,449,895 | ) | $ | (1,609,337 | ) | $ | 139,000 | ||||
WESTWOOD FUNDS
Capital losses and specified gains realized after October 31, and net investment losses realized after December 31 of a Fund’s fiscal year may be deferred and treated as occurring on the first business day of the following fiscal year for tax purposes. For the year ended December 31, 2022, the Broadmark Tactical Growth Fund deferred $1,044,627 of capital losses.
The following information is computed on a tax basis for each item as of November 30, 2022. These funds have a tax year end of November 30, 2022 which is different than the fiscal year end of December 31, 2022.
| MLP & Energy | Broadmark | |||||||
| Infrastructure | Tactical Plus | |||||||
| Fund | Fund | |||||||
| Federal income tax cost | $ | 844,272,176 | $ | 74,046,942 | ||||
| Gross unrealized appreciation | $ | 224,742,483 | $ | — | ||||
| Gross unrealized depreciation | (11,061,429 | ) | — | |||||
| Net unrealized appreciation | 213,681,054 | — | ||||||
| Undistributed ordinary income | — | 1,497,772 | ||||||
| Undistributed long-term capital gains | — | 3,437,482 | ||||||
| Accumulated capital and other losses | (960,407,467 | ) | — | |||||
| Total distributable earnings (accumulated deficit) | $ | (746,726,413 | ) | $ | 4,935,254 | |||
The following information is provided on a tax basis as of June 30, 2023:
| MLP & Energy | Broadmark | Broadmark | ||||||||||||||||||
| Infrastructure | Global Real | Select Income | Tactical Growth | Tactical Plus | ||||||||||||||||
| Fund | Estate Fund | Fund | Fund | Fund | ||||||||||||||||
| Tax cost of investments | $ | 623,274,909 | $ | 20,217,236 | $ | 248,405,526 | $ | 291,585,936 | $ | 75,811,192 | ||||||||||
| Gross unrealized appreciation | 306,148,118 | 409,244 | 11,900,191 | 3,570,837 | — | |||||||||||||||
| Gross unrealized depreciation | (41,282,509 | ) | (1,896,565 | ) | (17,918,871 | ) | — | — | ||||||||||||
| Net unrealized appreciation (depreciation) on investments | $ | 264,865,609 | $ | (1,487,321 | ) | $ | (6,018,680 | ) | $ | 3,570,837 | $ | — | ||||||||
The difference between the federal income tax cost of portfolio investments and the financial statement cost of portfolio investments are due to certain timing differences in the recognition of capital gains or losses under income tax regulations and GAAP. These “book/tax” differences are temporary in nature and are primarily due to the tax deferral of losses on wash sales, constructive dividend income and partnership adjustments.
For the year ended December 31, 2022, Select Income Fund utilized long-term capital loss carryover $36,872.
As of December 31, 2022, the following Funds had short-term and long-term capital loss carryforwards for federal income tax purposes, which may be carried forward indefinitely. These capital loss carryforwards are available to
WESTWOOD FUNDS
offset net realized capital gains in the current and future years, thereby reducing future taxable gains distributions, if any.
| Capital Loss Carryovers | ||||||||||||
| Fund | Short- term | Long- term | Total | |||||||||
| Global Real Estate Fund | $ | 13,710,405 | $ | 9,492,666 | $ | 23,203,071 | ||||||
| Select Income Fund | 2,480,683 | — | 2,480,683 | |||||||||
As of the tax year ended November 30, 2022, the following Funds had short term and long term capital loss carryforwards for federal income tax purposes, which may be carried forward indefinitely. These capital loss carryforwards are available to offset net realized capital gains in the current and future years, thereby reducing future taxable gains distributions, if any.
| Capital Loss Carryovers | ||||||||||||
| Fund | Short- term | Long- term | Total | |||||||||
| MLP & Energy Infrastructure Fund | $ | 301,052,704 | $ | 659,354,763 | $ | 960,407,467 | ||||||
For MLP & Energy Infrastructure Fund, included in the $960,407,467 is short-term available carry forward losses of $133,857,047 and long-term of $54,167,702 for a total of $188,024,749 from the merged Salient Midstream & MLP Fund with an annual limitation of $4,106,607.
The Funds recognize the tax benefits or expenses of uncertain tax positions only when the position is “more likely than not” of being sustained assuming examination by tax authorities. Management has reviewed each Fund’s tax positions for the current tax year and has concluded that no provision for unrecognized tax benefits or expenses is required in these financial statements. The Funds identify their major tax jurisdiction as U.S. Federal.
The Funds recognize interest and penalties, if any, related to unrecognized tax benefits as income tax expense on the Statements of Operations. During the six months ended June 30, 2023, the Funds did not incur any interest or penalties.
3. Investment Transactions
The cost of security purchases and proceeds from sales and maturities of securities (excluding short-term debt securities having maturities one year or less) for the six months ended June 30, 2023 were as follows:
| MLP & Energy | Broadmark | Broadmark | ||||||||||||||||||
| Infrastructure | Global Real | Select Income | Tactical Growth | Tactical Plus | ||||||||||||||||
| Fund | Estate Fund | Fund | Fund | Fund | ||||||||||||||||
| Purchases of investment securities | $ | 304,548,214 | $ | 5,652,957 | $ | 114,935,331 | $ | 301,121,808 | $ | — | ||||||||||
| Proceeds from sales of investment securities | $ | 405,131,840 | $ | 6,781,631 | $ | 92,067,957 | $ | 227,578,162 | $ | — | ||||||||||
WESTWOOD FUNDS
4. Transactions with Related Parties
INVESTMENT MANAGEMENT AGREEMENT
The Funds’ investments are managed by the Adviser pursuant to terms of an Investment Management Agreement. Each Fund pays the Adviser an investment management fee, based on the average net assets of each Fund, computed and accrued daily and paid monthly, at the annual rate shown in the following table below.
Pursuant to an Expense Limitation Agreement (“ELA”) between each Fund and the Adviser, the Adviser has contractually agreed, until April 30, 2024, to reduce investment management fees and reimburse other expenses to the extent necessary to limit total annual fund operating expenses of each Fund (excluding interest, taxes, brokerage commissions, borrowing expenses such as dividend and interest expenses on securities sold short, Acquired Fund fees and expenses, costs to organize the Fund, other expenditures which are capitalized in accordance with generally accepted accounting principles, and extraordinary expenses) to an amount exceeding the following percentages of average daily net assets attributable to each respective class.
| Institutional | ||||||
| Shares | A Class | C Class | Ultra Shares | F Class | ||
| Management | Expense | Expense | Expense | Expense | Expense | |
| Fund | Fee | Limitation | Limitation | Limitation | Limitation | Limitation |
| MLP & Energy Infrastructure Fund | 0.90% | 1.25% | 1.50% | 2.25% | n/a | n/a |
| Global Real Estate Fund | 0.70%* | 1.10% | 1.50% | 2.05% | n/a | n/a |
| Select Income Fund | 0.70%* | 1.10% | 1.50% | 2.05% | n/a | n/a |
| Broadmark Tactical Growth Fund | 1.10% | n/a | n/a | n/a | n/a | n/a |
| Broadmark Tactical Plus Fund | 1.40% | 1.35% | 1.60% | 2.35% | n/a | 1.04% |
| * | Effective May 1, 2023, the management fee was reduced from 0.95% to 0.70%. Prior to May 1, 2023, the Adviser had contractually agreed to waive its management fee at an annual rate in the amount of 0.25% of each Fund’s average daily net assets. |
Under the terms of the ELA, investment management fee reductions and expense reimbursements by the Adviser are subject to repayment by the Funds for a period of three years after the date on which such fees and expenses were incurred or waived, provided that the repayments do not cause total annual fund operating expenses (exclusive of such reductions and reimbursements) to exceed (i) the expense limitation then in effect, if any, and (ii) the expense limitation in effect at the time the expenses to be repaid were incurred. The prior 0.25% contractual management fee waiver for Global Real Estate Fund and Select Income Fund is not subject to recoupment. As of June 30, 2023,
WESTWOOD FUNDS
the Adviser may seek repayment of investment management fee reductions and expense reimbursements no later than the dates below:
| MLP & | ||||||||||||||||||||
| Energy | Broadmark | Broadmark | ||||||||||||||||||
| Infrastructure | Global Real | Select Income | Tactical | Tactical Plus | ||||||||||||||||
| Fund | Estate Fund | Fund | Growth Fund | Fund | ||||||||||||||||
| December 31, 2023 | $ | — | $ | 92,869 | $ | — | $ | — | $ | 261,974 | ||||||||||
| December 31, 2024 | — | 161,957 | — | — | 508,303 | |||||||||||||||
| December 31, 2025 | — | 170,572 | 260,610 | — | 513,949 | |||||||||||||||
| June 30, 2026 | — | 49,513 | — | — | 207,990 | |||||||||||||||
| $ | — | $ | 474,911 | $ | 260,610 | $ | — | $ | 1,492,216 | |||||||||||
For the six months ended June 30, 2023, the Select Income Fund recouped $210,740 of past management fee reductions.
OTHER SERVICE PROVIDERS
Ultimus Fund Solutions, LLC (“Ultimus”) provides administration, fund accounting, compliance and transfer agency services to the Funds. The Funds pay Ultimus fees in accordance with the agreements for such services. In addition, the Funds pay out-of-pocket expenses including, but not limited to, postage, supplies, and certain costs related to the pricing of the Funds’ portfolio securities.
Under the terms of a Distribution Agreement with the Trust, Ultimus Fund Distributors, LLC (the “Distributor”) serves as the principal underwriter to the Funds. The Distributor is a wholly-owned subsidiary of Ultimus. The Distributor is compensated by the Advisor for acting as principal underwriter.
A Trustee and certain officers of the Trust are also officers of Ultimus and are not paid by the Funds for serving in such capacities.
ADMINISTRATIVE SERVICES PLAN
For the six months ended June 30, 2023, the Funds have adopted an administrative services plan (the “Plan”) that provides that the applicable class of each Fund may pay financial intermediaries for shareholder services in an amount not to exceed the rate shown in the table below based on the average daily net assets of each Fund’s share class. During the six months ended June 30, 2023, the Funds incurred the following administrative services plan fees under the Plan:
| Maximum | Expense | |||||||
| Fund/Class | Rate | Incurred | ||||||
| MLP & Energy Infrastructure Fund | ||||||||
| Institutional Class Shares | 0.10 | % | $ | 365,991 | ||||
| A Class Shares | 0.10 | % | 70,337 | |||||
| C Class Shares | 0.10 | % | 7,539 | |||||
| Global Real Estate Fund | ||||||||
| Institutional Class Shares | 0.05 | % | 589 | |||||
| A Class Shares | 0.20 | % | 9,563 | |||||
| C Class Shares | 0.25 | % | 1,338 | |||||
WESTWOOD FUNDS
| Maximum | Expense | |||||||
| Fund/Class | Rate | Incurred | ||||||
| Select Income Fund | ||||||||
| Institutional Class Shares | 0.05 | % | $ | 30,024 | ||||
| A Class Shares | 0.20 | % | 57,689 | |||||
| C Class Shares | 0.25 | % | 7,022 | |||||
| Broadmark Tactical Growth Fund | ||||||||
| Institutional Class Shares | 0.05 | % | 56,771 | |||||
| A Class Shares | 0.20 | % | 15,593 | |||||
| C Class Shares | 0.25 | % | 8,908 | |||||
| Broadmark Tactical Plus Fund | ||||||||
| Institutional Class Shares | 0.10 | % | 17,226 | |||||
| A Class Shares | 0.10 | % | 302 | |||||
| C Class Shares | 0.10 | % | 202 | |||||
| F Class Shares | 0.10 | % | 20,328 | |||||
DISTRIBUTION PLAN
The Funds have adopted a distribution plan under Rule 12b-1 of the 1940 Act (the “Plan”) for A Class Shares, C Class Shares and Investor Class Shares that allows the Funds to pay distribution and/or service fees for the sale and distribution of Fund shares, and for services provided to shareholders in an amount not to exceed 0.25% based on average daily net assets of each Fund’s A Class Shares, up to 0.75% of the average daily net assets of the Global Real Estate Fund, Select Income Fund and Broadmark Tactical Growth Fund’s C Class Shares, and 1.00% based on the average daily net assets of the MLP & Energy Infrastructure Fund’s and Broadmark Tactical Plus Fund’s C Class Shares as compensation for distribution and shareholder services. During the six months ended June 30, 2023, the Funds incurred the following distribution fees under the Plan:
| Distribution fee | ||||
| MLP & Energy Infrastructure Fund | ||||
| A Class Shares | $ | 175,844 | ||
| C Class Shares | 75,392 | |||
| Global Real Estate Fund | ||||
| A Class Shares | 20,105 | |||
| C Class Shares | 4,015 | |||
| Select Income Fund | ||||
| A Class Shares | 128,316 | |||
| C Class Shares | 21,067 | |||
| Broadmark Tactical Growth Fund | ||||
| A Class Shares | 28,802 | |||
| C Class Shares | 26,723 | |||
| Broadmark Tactical Plus Fund | ||||
| A Class Shares | 754 | |||
| C Class Shares | 2,024 |
WESTWOOD FUNDS
TRUSTEE COMPENSATION
Each member of the Board (a “Trustee”) who is not an “interested person” (as defined by the 1940 Act, as amended) of the Trust (“Independent Trustee”) receives a $1,300 annual retainer from each Fund, except for the Board Chairperson who receives a $1,700 annual retainer from each Fund and Audit Committee Chairperson who receives a $1,500 annual retainer, paid in quarterly installments. Each Independent Trustee also receives from each Fund a fee of $550 for each Board meeting attended plus reimbursement for travel and other meeting-related expenses.
PRINCIPAL HOLDERS OF FUND SHARES
As of June 30, 2023, the following shareholders owned of record 25% or more of the outstanding shares of the Funds:
| NAME OF RECORD OWNER | % Ownership | |
| MLP & Energy Infrastructure Fund | ||
| Institutional Class | ||
| Morgan Stanley Smith Barney, LLC (for the benefit of its customers) | 33% | |
| Broadmark Tactical Growth Fund | ||
| Institutional Shares | ||
| Morgan Stanley Smith Barney, LLC (for the benefit of its customers) | 45% | |
| Broadmark Tactical Plus Fund | ||
| Institutional Shares | ||
| National Financial Services, LLC (for the benefit of its customers) | 41% |
A beneficial owner of 25% or more of a Fund’s outstanding shares may be considered a controlling person of the Fund. That shareholder’s vote could have a more significant effect on matters presented at a shareholders’ meeting.
5. Derivative Transactions
The following is a summary of the fair value of derivative instruments held by MLP & Energy Infrastructure Fund and Broadmark Tactical Plus Fund as of June 30, 2023 presented on the Statements of Assets and Liabilities:
| Investments, | ||||||||
| Variation | at value for | |||||||
| margin | written call | |||||||
| Type of Derivative | receivable | options | ||||||
| MLP & Energy Infrastructure Fund | ||||||||
| Equity Risk Exposure | $ | — | $ | 6,303,859 | ||||
| Broadmark Tactical Plus Fund | ||||||||
| Futures Contracts | $ | 466,350 | $ | — | ||||
WESTWOOD FUNDS
The following is a summary of the effect of derivatives instruments for MLP Energy & Infrastructure Fund, Broadmark Tactical Growth Fund and Broadmark Tactical Plus Fund on the Statements of Operations for the six months ended June 30, 2023:
MLP & Energy Infrastructure Fund
| Change in | ||||||||||||||
| Unrealized | ||||||||||||||
| Appreciation | ||||||||||||||
| Type of Derivative | Risk | Location | Realized Gains | Location | (Depreciation) | |||||||||
| Index call options written | Equity | Net realized gains from options written | $ | 5,686,869 | Net change in unrealized appreciation (depreciation) on written options | $ | (2,749,810 | ) | ||||||
| Broadmark Tactical Growth Fund | ||||||||||||||
| Change in | ||||||||||||||
| Unrealized | ||||||||||||||
| Appreciation | ||||||||||||||
| Type of Derivative | Risk | Location | Realized Losses | Location | (Depreciation) | |||||||||
| Futures contracts sold short | Equity | Net realized losses from futures contracts | $ | (1,554,711 | ) | Net change in unrealized appreciation (depreciation) on futures contracts | $ | (628,238 | ) | |||||
| Broadmark Tactical Plus Fund | ||||||||||||||
| Change in | ||||||||||||||
| Unrealized | ||||||||||||||
| Realized Gains | Appreciation | |||||||||||||
| Type of Derivative | Risk | Location | (Losses) | Location | (Depreciation) | |||||||||
| Index put options purchased | Equity | Net realized gains (losses) from investments | $ | 138,849 | Net change in unrealized appreciation (depreciation) on investments | $ | — | |||||||
| Index call options purchased | Equity | Net realized gains (losses) from investments | $ | 37,744 | Net change in unrealized appreciation (depreciation) on written options | $ | 40,727 | |||||||
| Futures contracts purchased | Equity | Net realized losses from futures contracts | $ | (1,141,412 | ) | Net change in unrealized appreciation (depreciation) on futures contracts | $ | 1,174,371 | ||||||
Amounts designated as “—” are $0 or have been rounded to $0.
WESTWOOD FUNDS
Offsetting Assets and Liabilities:
The Funds are required to disclose the impact of offsetting assets and liabilities represented in the Statements of Assets and Liabilities to enable users of the financial statements to evaluate the effect or potential effect of netting arrangements on its financial position for recognized assets and liabilities. These recognized assets and liabilities are financial instruments and derivative instruments that are either subject to an enforceable master netting arrangement or similar agreement or meet the following right of setoff criteria: the amounts owed by the Tactical Growth Fund and Tactical Plus Fund to another party are determinable, the Fund has the right to set off the amounts owed with the amounts owed by the other party, the Tactical Growth Fund and Tactical Plus Fund intend to set off, and the Fund’s right of setoff is enforceable at law.
A Fund is subject to various netting arrangements with select counterparties (“Master Agreements”). Master Agreements govern the terms of certain transactions and reduce the counterparty risk associated with relevant transactions by specifying credit protection mechanisms and providing standardization that improves legal certainty. Since different types of transactions have different mechanics and are sometimes traded out of different legal entities of a particular counterparty organization, each type of transaction may be covered by a different Master Agreement, resulting in the need for multiple agreements with a single counterparty. As the Master Agreements are specific to unique operations of different asset types, they allow a Fund to close out and net its total exposure to a specific counterparty entity in the event of a default with respect to all the transactions governed under a single agreement with a specific counterparty entity.
Master Agreements can also help limit counterparty risk by specifying collateral posting arrangements at pre-arranged exposure levels. Under the Master Agreements, collateral is routinely transferred if the total net exposure to certain transactions (net of existing collateral already in place) governed under the relevant Master Agreement with a counterparty in a given account exceeds a specified threshold, which typically ranges from zero to $250,000 depending on the counterparty and the type of Master Agreement. United States Treasury Securities and U.S. dollar cash are generally the preferred forms of collateral. Securities and cash pledged as collateral are reflected as assets in the Statements of Assets and Liabilities as either a component of investments at value (securities) or deposits due from counterparties (cash). Cash collateral received is not typically held in a segregated account and as such is reflected as a liability in the Statements of Assets and Liabilities as deposits due to counterparties. The market value of any securities received as collateral is not reflected as a component of net asset value. A Fund’s overall exposure to counterparty risk can change substantially within a short period, as it is affected by each transaction subject to the relevant Master Agreement.
Customer account agreements and related addendums govern cleared derivatives transactions such as futures, options on futures, and cleared Over The Counter (“OTC”) derivatives. Cleared derivative transactions require posting of initial margin as determined by each relevant clearing agency which is segregated at a broker account registered with the Commodities Futures Trading Commission (“CFTC”), or the applicable regulator. In the U.S., counterparty risk is believed to be reduced as creditors of the futures broker do not have claim to Fund assets in the segregated account. Additionally, portability of exposure in the event of default further reduces risk to the Funds. Variation margin, or changes in market value, are exchanged daily, but generally may not be netted between futures and cleared OTC derivatives.
International Swaps and Derivatives Association, Inc. Master Agreements and Credit Support Annexes (“ISDA Master Agreements”) govern OTC financial derivative transactions entered into by a Fund and select counterparties. ISDA Master Agreements maintain provisions for general obligations, representations, agreements, collateral and events of default or termination. Events of termination include conditions that may entitle counterparties to elect to terminate early and cause settlement of all outstanding transactions under the applicable ISDA Master Agreement. Any election to terminate early could be material to the financial statements. In limited circumstances, the ISDA Master Agreement may contain additional provisions that add additional counterparty protection beyond coverage
WESTWOOD FUNDS
of existing daily exposure if the counterparty has a decline in credit quality below a predefined level. These amounts, if any, may be segregated with a third party custodian.
The following table provides a summary of offsetting financial liabilities and derivatives and the effect of derivative instruments on the Statements of Assets and Liabilities as of June 30, 2023:
| Gross Asset | ||||||||||||||||
| (Liability) as | ||||||||||||||||
| Presented in | Financial | |||||||||||||||
| the Statement | Instruments | Cash Collateral | ||||||||||||||
| of Assets and | (Received) | (Received) | ||||||||||||||
| Liabilities | Pledged* | Pledged | Net Amount | |||||||||||||
| Broadmark Tactical Plus Fund | ||||||||||||||||
| Variation Margin on Futures Contracts | $ | 466,350 | $ | — | $ | — | * | $ | 466,350 | |||||||
| * | Any over-collateralization of total financial instruments is not shown. Collateral amounts can be found on the Statements of Assets and Liabilities as Cash collateral for futures short, if any. |
The following is a summary of the average monthly notional value of futures contracts and options purchased and sold by the Funds for the six months ended June 30, 2023, as well as the respective notional amount outstanding as of June 30, 2023:
| Notional Value | ||||||||
| Average | outstanding at | |||||||
| Monthly | June 30, | |||||||
| Notional Value | 2023 | |||||||
| MLP & Energy Infrastructure Fund | ||||||||
| Written call options | $ | 134,993,846 | $ | 302,756,072 | ||||
| Broadmark Tactical Plus Fund | ||||||||
| Futures contracts purchased | $ | 29,209,623 | $ | 49,370,750 | ||||
| Futures contracts sold Short | 3,240,965 | — | ||||||
During the six months ended June 30, 2023, Broadmark Tactical Growth Fund did not hold any derivatives.
Certain derivative contracts are executed under either standardized netting agreements or, for exchange-traded derivatives, the relevant contracts for a particular exchange that contain enforceable netting provisions. A derivative netting arrangement creates an enforceable right of set-off that becomes effective and affects the realization of settlement on individual assets, liabilities and collateral amounts, only following a specified event of default or early termination. Default events may include the failure to make payments or deliver securities timely, material adverse changes in financial condition or insolvency, the breach of minimum regulatory capital requirements, or loss of license, charter or other legal authorization necessary to perform under the contract.
6. Investments in Money Market Funds
In order to maintain sufficient liquidity to implement investment strategies, or for temporary defensive purposes, the Funds may at times invest a significant portion of their assets in shares of money market funds. As of June 30, 2023, Broadmark Tactical Growth Fund and Broadmark Tactical Plus Fund had 62.3% and 97.0%, respectively, of the value of its net assets invested in shares of a money market fund registered under the 1940 Act. The annual report,
WESTWOOD FUNDS
along with the report of the independent registered public accounting firm is included in the money market fund’s N-CSR available at www.sec.gov. An investment in a money market fund is not insured or guaranteed by the Federal Deposit Insurance Corporation or any other governmental agency, entity or person. While investor losses in money market funds have been rare, they are possible. The Fund, as investors in money market funds, indirectly bear the fees and expenses of those funds, which are in addition to the fees and expenses of the Fund.
7. Contingencies and Commitments
The Funds indemnify the Trust’s officers and Trustees for certain liabilities that might arise from their performance of their duties to the Funds. Additionally, in the normal course of business the Funds enter into contracts that contain a variety of representations and warranties and which provide general indemnifications. The Funds’ maximum exposure under these arrangements is unknown, as this would involve future claims that may be made against the Funds that have not yet occurred. However, based on experience, the Funds expect the risk of loss to be remote.
8. Reorganization Event
On September 14, 2022, Salient Midstream & MLP Fund reorganized into Predecessor Salient MLP & Energy Infrastructure Fund, a series of Predecessor Salient MF Trust. During the reorganization, shareholders of the Salient Midstream & MLP Fund received Class A shares of Predecessor Salient MLP & Energy Infrastructure Fund equal to the aggregate net asset value of their holdings of Salient Midstream & MLP Fund, a statutory trust registered as a non-diversified, closed-end management investment company.
The reorganization was accomplished by a tax free exchange of 17,755,671 shares of Salient Midstream & MLP Fund (valued at $161,677,813) for 21,251,027 Class A shares of the Predecessor Salient MLP & Energy Infrastructure Fund. The investment portfolio of Salient Midstream & MLP Fund with a fair value of $101,405,538 and an unadjusted cost basis of $74,010,049 (cost basis of $70,627,425, adjusted for cumulative return of capital) was the principal asset acquired by the Predecessor Salient MLP & Energy Infrastructure Fund. For financial reporting purposes, assets received and shares issued by Predecessor Salient MLP & Energy Infrastructure Fund were recorded at fair value; however, the cost basis of the investments received from Salient Midstream MLP Fund was carried forward to align ongoing reporting of Predecessor MLP & Energy Infrastructure Fund’s realized and unrealized gains and losses with amounts distributable to shareholders for tax purposes. Salient Midstream MLP Fund’s net assets at that date ($161,677,813), including unadjusted unrealized appreciation of $27,395,489 (unrealized appreciation of $30,778,113, adjusted for cumulative return of capital), were combined with those of Predecessor MLP & Energy Infrastructure Fund. The aggregate net assets of Predecessor MLP & Energy Infrastructure Fund immediately before the acquisition were $967,862,476. 70% of the costs associated with the Reorganization were paid by Salient Midstream MLP Fund, and 30% of the costs associated with the Reorganization were paid by Predecessor Salient MLP & Energy Infrastructure Fund.
The MLP & Energy Infrastructure Fund incurred extraordinary legal fees during the fiscal year ended December 31, 2022 that were related to the reorganization of Salient Midstream & MLP Fund into Predecessor Salient MLP & Energy Infrastructure Fund and the reorganizations into Ultimus Manager Trust. The amount of these legal fees were $830,218.
WESTWOOD FUNDS
9. Subsequent Events
The Funds are required to recognize in the financial statements the effects of all subsequent events that provide additional evidence about conditions that existed as of the date of the Statements of Assets and Liabilities. For non-recognized subsequent events that must be disclosed to keep the financial statements from being misleading, the Funds are required to disclose the nature of the event as well as an estimate of its financial effect, or a statement that such an estimate cannot be made. Management has evaluated subsequent events through the issuance of these financial statements and has noted no such events except for the following:
In order to meet the distribution requirements under Subchapter M of the Internal Revenue Code of 1986, as amended (the “Code”), and maintain regulated investment company status, the Westwood Salient MLP & Energy Infrastructure Fund (the “Fund”) paid a “deficiency dividend,” as such term is defined by Section 860(f) of the Code, to the Fund’s shareholders totaling $5,642,944 from ordinary income on July 12, 2023.
WESTWOOD FUNDS
| CHANGE IN INDEPENDENT REGISTERED PUBLIC ACCOUNTING FIRM (Unaudited) |
On March 13, 2023, BBD LLP (“BBD”) ceased to serve as the independent registered public accounting firm of Westwood MLP & Energy Fund, Westwood Global Real Estate Fund, Westwood Select Income Fund, Westwood Broadmark Tactical Growth Fund, and Westwood Broadmark Tactical Plus Fund (the “Funds”), each a series of Ultimus Managers Trust. The Audit Committee of the Board of Trustees approved the replacement of BBD as a result of Cohen & Company, Ltd.’s (“Cohen”) acquisition of BBD’s Investment Management Group.
The report of BBD on the financial statements of the Funds as of and for the fiscal year ended December 31, 2022 did not contain an adverse opinion or a disclaimer of opinion, and were not qualified or modified as to uncertainties, audit scope or accounting principles. During the fiscal year ended December 31, 2022, and during the subsequent interim period through March 13, 2023: (i) there were no disagreements between the registrant and BBD on any matter of accounting principles or practices, financial statement disclosure, or auditing scope or procedure, which disagreements, if not resolved to the satisfaction of BBD, would have caused it to make reference to the subject matter of the disagreements in its report on the financial statements of the Funds for such year or interim period; and (ii) there were no “reportable events,” as defined in Item 304(a)(1)(v) of Regulation S-K under the Securities Exchange Act of 1934, as amended.
On April 21, 2023, the Audit Committee of the Board of Trustees also recommended and approved the appointment of Cohen as the Funds’ independent registered public accounting firm for the new fiscal year ending August 31, 2023.
During the fiscal year ended December 31, 2022, and during the subsequent interim period through March 13, 2023, neither the registrant, nor anyone acting on its behalf, consulted with Cohen on behalf of the Funds regarding the application of accounting principles to a specified transaction (either completed or proposed), the type of audit opinion that might be rendered on the Funds’ financial statements, or any matter that was either: (i) the subject of a “disagreement,” as defined in Item 304(a)(1)(iv) of Regulation S-K and the instructions thereto; or (ii) “reportable events,” as defined in Item 304(a)(1)(v) of Regulation S-K.
WESTWOOD FUNDS
| ABOUT YOUR FUNDS’ EXPENSES (Unaudited) |
We believe it is important for you to understand the impact of costs on your investment. As a shareholder of the Funds, you incur two types of costs: (1) transaction costs, possibly including sales charges (loads) and redemption fees, and (2) ongoing costs, including management fees, class-specific expenses (such as administrative services fees and/or Rule 12b-1 fees) and other operating expenses. The following examples are intended to help you understand your ongoing costs (in dollars) of investing in the Funds and to compare these costs with the ongoing costs of investing in other mutual funds.
A mutual fund’s ongoing costs are expressed as a percentage of its average net assets. This figure is known as the expense ratio. The expenses in the table below are based on an investment of $1,000 made at the beginning of the most recent period (January 1, 2023) and held until the end of the period (June 30, 2023).
The table below illustrates each Fund’s ongoing costs in two ways:
Actual fund return – This section helps you to estimate the actual expenses that you paid over the period. The “Ending Account Value” shown is derived from each Fund’s actual return, and the fourth column shows the dollar amount of operating expenses that would have been paid by an investor who started with $1,000 in the Funds. You may use the information here, together with the amount you invested, to estimate the expenses that you paid over the period.
To do so, simply divide your account value by $1,000 (for example, an $8,600 account value divided by $1,000 = 8.6), then multiply the result by the number given for the Funds under the heading “Expenses Paid During Period.”
Hypothetical 5% return – This section is intended to help you compare each Fund’s ongoing costs with those of other mutual funds. It assumes that the Funds had an annual return of 5% before expenses during the period shown, but that the expense ratio is unchanged. In this case, because the return used is not each Fund’s actual return, the results do not apply to your investment. The example is useful in making comparisons because the SEC requires all mutual funds to calculate expenses based on a 5% return. You can assess each Fund’s ongoing costs by comparing this hypothetical example with the hypothetical examples that appear in shareholder reports of other funds.
Note that expenses shown in the table are meant to highlight and help you compare ongoing costs only. The Funds do not charge transaction fees, such as purchase or redemption fees, nor do they carry a “sales load.”
The calculations assume no shares were bought or sold during the period. Your actual costs may have been higher or lower, depending on the amount of your investment and the timing of any purchases or redemptions.
More information about each Fund’s expenses can be found in this report. For additional information on operating expenses and other shareholder costs, please refer to each Fund’s prospectus.
WESTWOOD FUNDS
| Beginning | Ending | |||||||
| Account Value | Account Value | Expenses Paid | ||||||
| January 1, | June 30, | Net Expense | During the | |||||
| 2023 | 2023 | Ratio (a) | Period (b) | |||||
| MLP & Energy Infrastructure Fund | ||||||||
| Institutional Shares | ||||||||
| Based on Actual Fund Return | $1,000.00 | $1,053.50 | 1.12% | $5.70 | ||||
| Based on Hypothetical 5% Return (before expenses) | $1,000.00 | $1,019.24 | 1.12% | $5.61 | ||||
| A Class Shares | ||||||||
| Based on Actual Fund Return | $1,000.00 | $1,053.20 | 1.37% | $6.97 | ||||
| Based on Hypothetical 5% Return (before expenses) | $1,000.00 | $1,018.00 | 1.37% | $6.85 | ||||
| C Class Shares | ||||||||
| Based on Actual Fund Return | $1,000.00 | $1,049.50 | 2.12% | $10.77 | ||||
| Based on Hypothetical 5% Return (before expenses) | $1,000.00 | $1,014.28 | 2.12% | $10.59 | ||||
| Ultra Shares | ||||||||
| Based on Actual Fund Return | $1,000.00 | $1,055.40 | 1.02% | $5.20 | ||||
| Based on Hypothetical 5% Return (before expenses) | $1,000.00 | $1,019.74 | 1.02% | $5.11 | ||||
| Global Real Estate Fund | ||||||||
| Institutional Shares | ||||||||
| Based on Actual Fund Return | $1,000.00 | $1,019.20 | 1.10% | $5.51 | ||||
| Based on Hypothetical 5% Return (before expenses) | $1,000.00 | $1,019.34 | 1.10% | $5.51 | ||||
| A Class Shares | ||||||||
| Based on Actual Fund Return | $1,000.00 | $1,017.40 | 1.42% | $7.10 | ||||
| Based on Hypothetical 5% Return (before expenses) | $1,000.00 | $1,017.75 | 1.42% | $7.10 | ||||
| C Class Shares | ||||||||
| Based on Actual Fund Return | $1,000.00 | $1,015.00 | 2.05% | $10.24 | ||||
| Based on Hypothetical 5% Return (before expenses) | $1,000.00 | $1,014.63 | 2.05% | $10.24 |
WESTWOOD FUNDS
| Beginning | Ending | |||||||
| Account Value | Account Value | Expenses Paid | ||||||
| January 1, | June 30, | Net Expense | During the | |||||
| 2023 | 2023 | Ratio (a) | Period (b) | |||||
| Select Income Fund | ||||||||
| Institutional Shares | ||||||||
| Based on Actual Fund Return | $1,000.00 | $1,065.80 | 1.10% | $5.63 | ||||
| Based on Hypothetical 5% Return (before expenses) | $1,000.00 | $1,019.34 | 1.10% | $5.51 | ||||
| A Class Shares | ||||||||
| Based on Actual Fund Return | $1,000.00 | $1,065.00 | 1.40% | $7.17 | ||||
| Based on Hypothetical 5% Return (before expenses) | $1,000.00 | $1,017.85 | 1.40% | $7.00 | ||||
| C Class Shares | ||||||||
| Based on Actual Fund Return | $1,000.00 | $1,061.00 | 2.04% | $10.42 | ||||
| Based on Hypothetical 5% Return (before expenses) | $1,000.00 | $1,014.68 | 2.04% | $10.19 | ||||
| Broadmark Tactical Growth Fund | ||||||||
| Institutional Shares | ||||||||
| Based on Actual Fund Return | $1,000.00 | $1,017.30 | 1.28% | $6.40 | ||||
| Based on Hypothetical 5% Return (before expenses) | $1,000.00 | $1,018.45 | 1.28% | $6.41 | ||||
| A Class Shares | ||||||||
| Based on Actual Fund Return | $1,000.00 | $1,015.60 | 1.59% | $7.95 | ||||
| Based on Hypothetical 5% Return (before expenses) | $1,000.00 | $1,016.91 | 1.59% | $7.95 | ||||
| C Class Shares | ||||||||
| Based on Actual Fund Return | $1,000.00 | $1,012.50 | 2.23% | $11.13 | ||||
| Based on Hypothetical 5% Return (before expenses) | $1,000.00 | $1,013.74 | 2.23% | $11.13 |
WESTWOOD FUNDS
| Beginning | Ending | |||||||
| Account Value | Account Value | Expenses Paid | ||||||
| January 1, | June 30, | Net Expense | During the | |||||
| 2023 | 2023 | Ratio (a) | Period (b) | |||||
| Broadmark Tactical Plus Fund | ||||||||
| Institutional Shares | ||||||||
| Based on Actual Fund Return | $1,000.00 | $1,019.50 | 1.35% | $6.76 | ||||
| Based on Hypothetical 5% Return (before expenses) | $1,000.00 | $1,018.10 | 1.35% | $6.76 | ||||
| A Class Shares | ||||||||
| Based on Actual Fund Return | $1,000.00 | $1,019.00 | 1.60% | $8.01 | ||||
| Based on Hypothetical 5% Return (before expenses) | $1,000.00 | $1,016.86 | 1.60% | $8.00 | ||||
| C Class Shares | ||||||||
| Based on Actual Fund Return | $1,000.00 | $1,013.50 | 2.35% | $11.73 | ||||
| Based on Hypothetical 5% Return (before expenses) | $1,000.00 | $1,013.14 | 2.35% | $11.73 | ||||
| F Class Shares | ||||||||
| Based on Actual Fund Return | $1,000.00 | $1,021.60 | 1.04% | $5.21 | ||||
| Based on Hypothetical 5% Return (before expenses) | $1,000.00 | $1,019.64 | 1.04% | $5.21 |
| (a) | Annualized, based on each Fund’s most recent one-half year expenses. |
| (b) | Expenses are equal to each Fund’s annualized net expense ratio multiplied by the average account value over the period, multiplied by 181/365 (to reflect the one-half year period), for Actual and Hypothetical Return information, respectively. |
WESTWOOD FUNDS
| OTHER INFORMATION (Unaudited) |
The Trust files a complete listing of portfolio holdings for the Funds with the U.S. Securities and Exchange Commission (“SEC”) as of the end of the first and third quarters of each fiscal year as an exhibit to its report on Form N-PORT. The filings are available upon request, by calling 1-877-386-3944. Furthermore, you may obtain a copy of these filings on the SEC’s website at www.sec.gov.
A description of the policies and procedures that the Funds use to vote proxies relating to portfolio securities is available without charge upon request by calling toll-free 1-877-386-3944, or on the SEC’s website at www.sec.gov. Information regarding how the Funds voted proxies relating to portfolio securities during the period ended June 30, 2023 will be available on or about August 31, 2022 without charge upon request by calling 1-877-386-3944, or on the SEC’s website at www.sec.gov.
WESTWOOD FUNDS
| CUSTOMER PRIVACY NOTICE |
| FACTS | WHAT DOES THE WESTWOOD FUNDS® (the “Funds”) DO WITH YOUR PERSONAL INFORMATION? |
| Why? | Financial companies choose how they share your personal information. Federal law gives consumers the right to limit some but not all sharing. Federal law also requires us to tell you how we collect, share, and protect your personal information. Please read this notice carefully to understand what we do. |
| What? | The types of personal information we collect and share depend on the product or service you have with us. This information can include:
■ Social Security number
■ Assets
■ Retirement Assets
■ Transaction History
■ Checking Account Information
■ Purchase History
■ Account Balances
■ Account Transactions
■ Wire Transfer Instructions
When you are no longer our customer, we continue to share your information as described in this notice. |
| How? | All financial companies need to share your personal information to run their everyday business. In the section below, we list the reasons financial companies can share their customers’ personal information; the reasons the Fund chooses to share; and whether you can limit this sharing. |
| Reasons we can share your personal information | Does the Fund share? | Can you limit this sharing? |
For our everyday business purposes – Such as to process your transactions, maintain your account(s), respond to court orders and legal investigations, or report to credit bureaus |
Yes | No |
For our marketing purposes – to offer our products and services to you |
No | We don’t share |
| For joint marketing with other financial companies | No | We don’t share |
For our affiliates’ everyday business purposes – information about your transactions and experiences |
No | We don’t share |
For our affiliates’ everyday business purposes – information about your creditworthiness |
No | We don’t share |
| For nonaffiliates to market to you | No | We don’t share |
| Questions? | Call 1-877-FUND-WHG |
WESTWOOD FUNDS
| Who we are | |
| Who is providing this notice? | Westwood Funds® Ultimus Fund Distributors, LLC (Distributor) Ultimus Fund Solutions, LLC (Administrator) |
| What we do | |
| How does the Fund protect my personal information? | To protect your personal information from unauthorized access and use, we use security measures that comply with federal law. These measures include computer safeguards and secured files and buildings.
Our service providers are held accountable for adhering to strict policies and procedures to prevent any misuse of your nonpublic personal information. |
| How does the Fund collect my personal information? | We collect your personal information, for example, when you
■ Open an account
■ Provide account information
■ Give us your contact information
■ Make deposits or withdrawals from your account
■ Make a wire transfer
■ Tell us where to send the money
■ Tell us who receives the money
■ Show your government-issued ID
■ Show your driver’s license
We also collect your personal information from other companies. |
| Why can’t I limit all sharing? | Federal law gives you the right to limit only
■ Sharing for affiliates’ everyday business purposes – information about your creditworthiness
■ Affiliates from using your information to market to you
■ Sharing for nonaffiliates to market to you
State laws and individual companies may give you additional rights to limit sharing. |
| Definitions | |
| Affiliates | Companies related by common ownership or control. They can be financial and nonfinancial companies.
■ Westwood Management Corp., the investment adviser to the Fund, could be deemed to be an affiliate. |
| Nonaffiliates | Companies not related by common ownership or control. They can be financial and nonfinancial companies
■ The Fund does not share with nonaffiliates so they can market to you. |
| Joint marketing | A formal agreement between nonaffiliated financial companies that together market financial products or services to you.
■ The Fund does not jointly market. |
[This Page Intentionally Left Blank]
[This Page Intentionally Left Blank]
[This Page Intentionally Left Blank]
The Westwood Funds
P.O. Box 541150
Omaha, NE 68154
1-877-FUND-WHG
www.westwoodfunds.com
Adviser:
Westwood Management Corp.
200 Crescent Court, Suite 1200
Dallas, TX 75201
Distributor:
Ultimus Fund Distributors, LLC
225 Pictoria Drive
Suite 450
Cincinnati, OH 45246
Administrator:
Ultimus Fund Solutions, LLC
225 Pictoria Drive
Suite 450
Cincinnati, OH 45246
Legal Counsel:
Sullivan & Worcester LLP
1666 K Street, NW
Suite 700
Washington, DC 20006
Independent Registered Public Accounting Firm:
Cohen & Company, Ltd.
1835 Market Street, Suite 310
Philadelphia, PA 19103
This
information must be preceded or accompanied by a current
prospectus for the Funds.
Westwood-SAR-23
(b). Not applicable
Item 2. Code of Ethics.
Not required
Item 3. Audit Committee Financial Expert.
Not required
Item 4. Principal Accountant Fees and Services.
Not required
Item 5. Audit Committee of Listed Registrants.
Not applicable
Item 6. Schedule of Investments.
| (a) | Not applicable [schedule filed with Item 1] |
| (b) | Not applicable |
Item 7. Disclosure of Proxy Voting Policies and Procedures for Closed-End Management Investment Companies.
Not applicable
| Item 8. | Portfolio Managers of Closed-End Management Investment Companies. |
Not applicable
Item 9. Purchases of Equity Securities by Closed-End Management Investment Company and Affiliated Purchasers.
Not applicable
Item 10. Submission of Matters to a Vote of Security Holders.
There has been no material changes to the manner in which shareholders may recommend nominees to the Registrant’s Board of Trustees or the Nominations & Governance Committee (the “Committee”). The Registrant does not have formal procedures by which shareholders may recommend nominees to the Registrant’s Board of Trustees. While the Registrant does not have formal procedure, the Committee shall to the extent required under applicable law, when identifying potential candidates for the position of Independent Trustee, consider any such candidate recommended by a shareholder.
Item 11. Controls and Procedures.
(a) Based on their evaluation of the registrant’s disclosure controls and procedures (as defined in Rule 30a-3(c) under the Investment Company Act of 1940) as of a date within 90 days of the filing date of this report, the registrant’s principal executive officer and principal financial officer have concluded that such disclosure controls and procedures are reasonably designed and are operating effectively to ensure that material information relating to the registrant, including its consolidated subsidiaries, is made known to them by others within those entities, particularly during the period in which this report is being prepared, and that the information required in filings on Form N-CSR is recorded, processed, summarized, and reported on a timely basis.
(b) There were no changes in the registrant’s internal control over financial reporting (as defined in Rule 30a-3(d) under the Investment Company Act of 1940) that occurred during the period covered by this report that have materially affected, or are reasonably likely to materially affect, the registrant’s internal control over financial reporting.
Item 12. Disclosure of Securities Lending Activities for Closed-End Management Investment Companies.
Not applicable
| Item 13. | Exhibits. |
File the exhibits listed below as part of this Form. Letter or number the exhibits in the sequence indicated.
(a)(1) Any code of ethics, or amendment thereto, that is the subject of the disclosure required by Item 2, to the extent that the registrant intends to satisfy the Item 2 requirements through filing of an exhibit: Not required
(a)(2) A separate certification for each principal executive officer and principal financial officer of the registrant as required by Rule 30a-2(a) under the Act (17 CFR 270.30a-2(a)): Attached hereto
(1) Not Applicable
(2) Change in the registrant’s independent public accountants. Attached hereto
(b) Certifications required by Rule 30a-2(b) under the Act (17 CFR 270.30a-2(b)): Attached hereto
Exhibit 99.CERT Certifications required by Rule 30a-2(a) under the Act
Exhibit 99.906CERT Certifications required by Rule 30a-2(b) under the Act
Exhibit 99.IND PUB ACCT Change in registrant’s independent public accounting.
SIGNATURES
Pursuant to the requirements of the Securities Exchange Act of 1934 and the Investment Company Act of 1940, the registrant has duly caused this report to be signed on its behalf by the undersigned, thereunto duly authorized.
| (Registrant) | Ultimus Managers Trust | |||
| By (Signature and Title)* | /s/ Todd E. Heim | |||
| Todd E. Heim, President | ||||
| Date | February 23, 2024 | |||
| Pursuant to the requirements of the Securities Exchange Act of 1934 and the Investment Company Act of 1940, this report has been signed below by the following persons on behalf of the registrant and in the capacities and on the dates indicated. | ||||
| By (Signature and Title)* | /s/ Todd E. Heim | |||
| Todd E. Heim, Principal Executive Officer | ||||
| Date | February 23, 2024 | |||
| By (Signature and Title)* | /s/ Daniel D. Bauer | |||
| Daniel D. Bauer, Treasurer and Principal Financial Officer | ||||
| Date | February 23, 2024 | |||
* Print the name and title of each signing officer under his or her signature.