| Counterpoint Tactical Income Fund | |||||||||||||||||||||||||||||||||||
COUNTERPOINT TACTICAL INCOME FUND – FUND SUMMARY | |||||||||||||||||||||||||||||||||||
Counterpoint Tactical Income Fund Class A Shares: CPATX Class C Shares: CPCTX Class I Shares: CPITX
a series of Northern Lights Fund Trust III
Supplement dated July 16, 2018 to the Prospectus dated February 1, 2018
The following paragraph is inserted under the section entitled “Principal Investment Risks” after “Portfolio Turnover Risk” on page 3 of the Fund’s Prospectus:
This Supplement, dated July 16, 2018, and the Prospectus dated February 1, 2018, provide relevant information for all shareholders and should be retained for future reference. The Prospectus and the Statement of Additional Information have been filed with the Securities and Exchange Commission, are incorporated by reference, and can be obtained without charge by calling 1-844-273-8637. | |||||||||||||||||||||||||||||||||||
Investment Objective: | |||||||||||||||||||||||||||||||||||
The Counterpoint Tactical Income Fund (the “Fund”) seeks income and capital preservation. | |||||||||||||||||||||||||||||||||||
Fees and Expenses of the Fund: | |||||||||||||||||||||||||||||||||||
This table describes the fees and expenses that you may pay if you buy and hold shares of the Fund. You may qualify for sales charge discounts on purchases of Class A shares if you and your family invest, or agree to invest in the future, at least $25,000 in the Fund. More information about these and other discounts is available from your financial professional and in How to Purchase Shares on page 17 of the Fund’s Prospectus. | |||||||||||||||||||||||||||||||||||
Shareholder Fees (fees paid directly from your investment) | |||||||||||||||||||||||||||||||||||
| |||||||||||||||||||||||||||||||||||
Annual Fund Operating Expenses (expenses that you pay each year as a percentage of the value of your investment) | |||||||||||||||||||||||||||||||||||
| |||||||||||||||||||||||||||||||||||
Example: | |||||||||||||||||||||||||||||||||||
This Example is intended to help you compare the cost of investing in the Fund with the cost of investing in other mutual funds. | |||||||||||||||||||||||||||||||||||
The Example assumes that you invest $10,000 in the Fund for the time periods indicated and then redeem all of your shares at the end of those periods. The Example also assumes that your investment has a 5% return each year and that the Fund’s operating expenses remain the same. Although your actual costs may be higher or lower, based upon these assumptions your costs would be: | |||||||||||||||||||||||||||||||||||
| |||||||||||||||||||||||||||||||||||
Portfolio Turnover: | |||||||||||||||||||||||||||||||||||
The Fund pays transaction costs, such as commissions, when it buys and sells securities (or “turns over” its portfolio). A higher portfolio turnover may indicate higher transaction costs and may result in higher taxes when Fund shares are held in a taxable account. These costs, which are not reflected in annual fund operating expenses or in the Example, affect the Fund’s performance. During the fiscal year ending September 30, 2017, the Fund’s portfolio turnover rate was 71% of the average value of its portfolio. | |||||||||||||||||||||||||||||||||||
Principal Investment Strategies: | |||||||||||||||||||||||||||||||||||
To pursue its investment objective, the Fund invests in mutual funds, closed-end funds and passively and actively managed exchange traded funds (“ETFs”) that invest in (i) high yield instruments (also known as “junk”) (including bonds, bank loans, preferred stock, floating rate bonds and debt and municipal high yield debt); (ii) obligations issued or guaranteed by the United States Government, its agencies or instrumentalities, including U.S. treasuries (with an average duration of 1-5 years); and (iii) cash and cash equivalents (including money market funds). The Fund may also invest in these types of securities directly. The Fund’s adviser, Counterpoint Mutual Funds, LLC (the “Adviser”) uses a proprietary quantitative model that seeks to identify the trends in the market for high yield instruments. To hedge against or replicate credit and interest rate exposure, the Fund also invests directly in derivatives (including U.S. treasury futures and credit default swaps) and may borrow an amount up to 33 1/3% of its total assets (including the amount borrowed). The Fund invests in high yield instruments of any maturity or duration when the model determines that the market for high yield instruments is stable or trending upwards and either U.S. Treasuries or cash and cash equivalents when the model determines that the market for high yield instruments is trending downwards. By tactically allocating its investments among the securities described above, the Fund seeks to reduce its exposure to declines in the market for high yield instruments, thereby limiting portfolio volatility in down-trending markets (“downside volatility”) and downside loss.
Counterpoint Mutual Funds, LLC (the “Adviser”) uses a quantitative model that takes into account macro market data and other market-based inputs and metrics to seek to identify market trends. When making investment decisions for the Fund, the portfolio managers consider both the outputs of the model as well as an assessment of current market conditions, the average credit quality of the portfolio, the average duration of the portfolio and other factors. When the Fund is invested in high yield instruments, the portfolio managers consider the relative risk adjusted net returns of available high yield instruments. | |||||||||||||||||||||||||||||||||||
Principal Investment Risks: | |||||||||||||||||||||||||||||||||||
As with all mutual funds, there is the risk that you could lose money through your investment in the Fund. The Fund is not intended to be a complete investment program. Many factors affect the Fund’s net asset value (“NAV”) and performance.
• Credit Risk. The risk that the Fund could lose money if the issuer or guarantor of a fixed income security is unwilling or unable to make timely payments to meet its contractual obligations.
• Derivatives Risk. The derivative instruments in which the Fund may invest either directly or through an underlying fund, may be more volatile than other instruments. The risks associated with investments in derivatives also include liquidity, interest rate, market, credit and management risks, mispricing or improper valuation. Changes in the market value of a derivative may not correlate perfectly with the underlying asset, rate or index, and the Fund could lose more than the principal amount invested. In addition, if a derivative is being used for hedging purposes there can be no assurance given that each derivative position will achieve a perfect correlation with the security or currency against which it is being hedged, or that a particular derivative position will be available when sought by the portfolio manager.
• Fixed Income Risk. When the Fund invests in fixed income securities, the value of your investment in the Fund will fluctuate with changes in interest rates. Typically, a rise in interest rates causes a decline in the value of fixed income securities or derivatives owned by the Fund. In general, the market price of fixed income securities with longer maturities will increase or decrease more in response to changes in interest rates than shorter-term securities. Other risk factors include credit risk (the debtor may default) and prepayment risk (the debtor may pay its obligation early, reducing the amount of interest payments). These risks could affect the value of a particular investment by the Fund, possibly causing the Fund’s share price and total return to be reduced and fluctuate more than other types of investments. Recently, interest rates have been historically low. Current conditions may result in a rise in interest rates, which in turn may result in a decline in the value of the bond investments held by the Fund. As a result, for the present, interest rate risk may be heightened.
• Futures Risk. The Fund’s use of futures involves risks different from, or possibly greater than, the risks associated with investing directly in securities and other traditional investments. These risks include (i) leverage risk (ii) risk of mispricing or improper valuation; and (iii) the risk that changes in the value of the futures contract may not correlate perfectly with the underlying index. Investments in futures involve leverage, which means a small percentage of assets invested in futures can have a disproportionately large impact on the Fund. This risk could cause the Fund to lose more than the principal amount invested. Futures contracts may become mispriced or improperly valued when compared to the Adviser’s expectation and may not produce the desired investment results. Additionally, changes in the value of futures contracts may not track or correlate perfectly with the underlying index because of temporary, or even long-term, supply and demand imbalances and because futures do not pay dividends unlike the stocks upon which they are based.
• High-Yield Fixed Income Securities Risk. The fixed income securities held by the Fund that are rated below investment grade are subject to additional risk factors such as increased possibility of default, illiquidity of the security, and changes in value based on public perception of the issuer. Such securities are generally considered speculative because they present a greater risk of loss, including default, than higher quality fixed income securities.
• Interest Rate Risk. Fixed income securities are subject to the risk that the securities could lose value because of interest rate changes. For example, bonds tend to decrease in value if interest rates rise. Fixed income securities with longer maturities sometimes offer higher yields, but are subject to greater price shifts as a result of interest rate changes than fixed income securities with shorter maturities.
• Investment Companies Risk. When the Fund invests in other investment companies, it will bear additional expenses based on its pro rata share of the other investment company’s operating expenses, including the potential duplication of management fees. The risk of owning an investment company generally reflects the risks of owning the underlying investments the investment company holds. The Fund also will incur brokerage costs when it purchases and sells investment companies.
• Issuer-Specific Risk. The value of a specific security can be more volatile than the market as a whole and may perform worse than the market as a whole.
• Leveraging Risk. Using derivatives can create leverage, which can magnify the Fund’s potential for gain or loss and, therefore, amplify the effects of market volatility of the Fund’s share price.
• Liquidity Risk. Liquidity risk exists when particular investments of the Fund would be difficult to purchase or sell, possibly preventing the Fund from selling such illiquid securities at an advantageous time or price, or possibly requiring the Fund to dispose of other investments at unfavorable times or prices in order to satisfy its obligations.
• Management Risk. The Adviser’s reliance on its strategy and judgments about the attractiveness, value and potential appreciation of particular securities and the tactical allocation among the Fund’s investments may prove to be incorrect and may not produce the desired results.
• Market Risk. Overall equity and fixed income securities market risks affect the value of the Fund. Factors such as domestic economic growth and market conditions, interest rate levels, and political events affect the securities markets.
• Model Risk. Like all quantitative analysis, the Adviser’s investment model carries a risk that the mathematical model used might be based on one or more incorrect assumptions. Rapidly changing and unforeseen market dynamics could also lead to a decrease in short term effectiveness of the adviser’s algorithmic model. No assurance can be given that the Fund will be successful under all or any market conditions.
• Portfolio Turnover Risk. Increased portfolio turnover causes the Fund to incur higher brokerage costs, which may adversely affect the Fund’s performance and may produce increased taxable distributions.
• Swap Risk. Swaps are subject to tracking risk because they may not be perfect substitutes for the instruments they are intended to hedge or replace. Over the counter swaps are subject to counterparty default. Leverage inherent in derivatives will tend to magnify the Fund’s losses.
• U.S. Government Securities Risk. Treasury obligations may differ in their interest rates, maturities, times of issuance and other characteristics. Obligations of U.S. Government agencies and authorities are supported by varying degrees of credit but generally are not backed by the full faith and credit of the U.S. Government. No assurance can be given that the U.S. Government will provide financial support to its agencies and authorities if it is not obligated by law to do so. In addition, the value of U.S. Government securities may be affected by changes in the credit rating of the U.S. Government. | |||||||||||||||||||||||||||||||||||
Performance: | |||||||||||||||||||||||||||||||||||
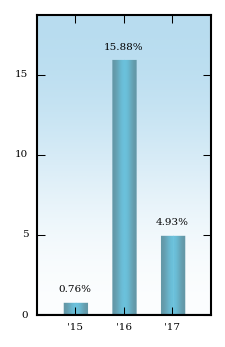
The bar chart and performance table show the variability of the Fund’s returns, over time which is some indication of the risks of investing in the Fund by comparing the Fund’s performance with a broad measure of market performance. The bar chart shows performance of the Fund’s Class I shares for each full calendar year since the Fund’s inception. The performance table compares the performance of the Fund over time to the performance of a broad-based market index. You should be aware that the Fund’s past performance (before and after taxes) may not be an indication of how the Fund will perform in the future. Although Class A and Class C shares would have similar returns to Class I shares because the classes are invested in the same portfolio of securities, the returns for Class A and Class C shares would be different from Class I shares because Class A and Class C shares have different expenses than Class I shares. Updated performance information will be available at no cost by visiting www.counterpointmutualfunds.com or by calling 1-844-273-8637. | |||||||||||||||||||||||||||||||||||
Class I Performance Bar Chart For Calendar Years Ended December 31 | |||||||||||||||||||||||||||||||||||
| |||||||||||||||||||||||||||||||||||
| |||||||||||||||||||||||||||||||||||
Performance Table Average Annual Total Returns (For periods ended December 31, 2017) | |||||||||||||||||||||||||||||||||||
| |||||||||||||||||||||||||||||||||||
After-tax returns were calculated using the historical highest individual federal marginal income tax rates and do not reflect the impact of state and local taxes. Actual after-tax returns depend on an investor’s tax situation and may differ from those shown, and after-tax returns shown are not relevant to investors who hold shares of the Fund through tax-deferred arrangements, such as 401(k) plans or individual retirement accounts. After tax returns for the share classes which are not presented will vary from the after-tax returns of Class I shares. | |||||||||||||||||||||||||||||||||||