Table of Contents
As filed with the Securities and Exchange Commission on March 18, 2014
Registration No. 333-194469
UNITED STATES
SECURITIES AND EXCHANGE COMMISSION
Washington, D.C. 20549
Amendment No. 1
to
FORM S-1
REGISTRATION STATEMENT
UNDER
THE SECURITIES ACT OF 1933
ING U.S., INC.
(Exact Name of Registrant as Specified in Its Charter)
| Delaware | 6311 | 52-1222820 | ||
| (State or Other Jurisdiction of Incorporation or Organization) |
(Primary Standard Industrial Classification Code Number) |
(I.R.S. Employer Identification Number) |
230 Park Avenue
New York, New York 10169
(212) 309-8200
(Address, including zip code, and telephone number, including area code, of registrant’s principal executive offices)
Bridget M. Healy
Executive Vice President and
Chief Legal Officer
ING U.S., Inc.
230 Park Avenue
New York, New York 10169
(212) 309-8200
(Name, address, including zip code, and telephone number, including area code, of agent for service)
Copies to:
| Robert G. DeLaMater Sullivan & Cromwell LLP 125 Broad Street New York, NY 10004 (212) 558-4000 |
Joseph A. Hall Davis Polk & Wardwell LLP 450 Lexington Avenue New York, NY 10017 (212) 450-4000 |
Approximate date of commencement of proposed sale to the public:
As soon as practicable after this registration statement becomes effective.
If any of the securities being registered on this Form are to be offered on a delayed or continuous basis pursuant to Rule 415 under the Securities Act of 1933, check the following box. ¨
If this Form is filed to register additional securities for an offering pursuant to Rule 462(b) under the Securities Act, check the following box and list the Securities Act registration statement number of the earlier effective registration statement for the same offering. ¨
If this Form is a post-effective amendment filed pursuant to Rule 462(c) under the Securities Act, check the following box and list the Securities Act registration statement number of the earlier effective registration statement for the same offering. ¨
If this Form is a post-effective amendment filed pursuant to Rule 462(d) under the Securities Act, check the following box and list the Securities Act registration statement number of the earlier effective registration statement for the same offering. ¨
Indicate by check mark whether the registrant is a large accelerated filer, an accelerated filer, a non-accelerated filer, or a smaller reporting company. See the definitions of “large accelerated filer,” “accelerated filer” and “smaller reporting company” in Rule 12b-2 of the Exchange Act.
| Large accelerated filer | ¨ | Accelerated filer | ¨ | |||
| Non-accelerated filer | x (Do not check if a smaller reporting company) | Smaller reporting company | ¨ |
CALCULATION OF REGISTRATION FEE
|
| ||||||||
| Title of Each Class of Securities to be Registered |
Amount to be |
Proposed Maximum |
Proposed Maximum Aggregate Offering Price(2) |
Amount of Registration Fee(3) | ||||
| Common stock, par value $0.01 per share |
30,475,000 |
35.02 |
$1,067,234,500.00 |
$137,459.80 | ||||
|
| ||||||||
|
| ||||||||
| (1) | Includes the number of shares of common stock that the underwriters have the option to purchase. |
| (2) | Estimated solely for the purpose of computing the amount of the registration fee pursuant to Rule 457(c) under the Securities Act of 1933, based on the average of the high and low prices of the common stock on March 14, 2014, as reported on the NYSE. |
| (3) | Of this amount, $12,880 has been previously paid. |
The registrant hereby amends this Registration Statement on such date or dates as may be necessary to delay its effective date until the registrant shall file a further amendment which specifically states that this Registration Statement shall thereafter become effective in accordance with Section 8(a) of the Securities Act of 1933, or until this Registration Statement shall become effective on such date as the Commission, acting pursuant to said Section 8(a), may determine.
Table of Contents
The information in this preliminary prospectus is not complete and may be changed. We and the Selling Stockholder may not sell these securities until the registration statement filed with the Securities and Exchange Commission is effective. This preliminary prospectus is not an offer to sell these securities and it is not soliciting offers to buy these securities in any jurisdiction where such offer or sale is not permitted.
SUBJECT TO COMPLETION, DATED MARCH 18, 2014
Preliminary Prospectus
26,500,000 Shares

Common Stock
ING Groep N.V. (“ING Group” or the “Selling Stockholder”) is offering 26,500,000 shares of the common stock of ING U.S., Inc. ING U.S., Inc. will not receive any of the proceeds from the sale of the shares sold by the Selling Stockholder. Concurrently with the completion of this offering, we expect to repurchase from ING Group an additional number of shares of our common stock having an aggregate repurchase price of $250 million, at a price per share equal to the per share proceeds, before expenses, to the Selling Stockholder, as shown in the table below. See “Summary—Share Repurchase Program and Direct Share Buyback from ING Group”.
Our common stock is listed on the New York Stock Exchange (“NYSE”) under the symbol “VOYA”. We expect to rebrand from ING U.S. to Voya Financial over time, beginning soon after this offering. See “Business—Our Brand”. The last reported sale price of our common stock on the NYSE on March 17, 2014 was $35.60 per share.
Investing in our common stock involves risk. See “Risk Factors” on page 21 to read about factors you should consider before buying shares of our common stock.
Neither the Securities and Exchange Commission nor any other regulatory body has approved or disapproved of these securities or passed upon the accuracy or adequacy of this prospectus. Any representation to the contrary is a criminal offense.
| Per Share | Total | |||||||
| Public offering price |
$ | $ | ||||||
| Underwriting discount(1) |
$ | $ | ||||||
| Proceeds, before expenses, to the Selling Stockholder |
$ | $ | ||||||
| (1) | The underwriters will receive compensation in addition to the underwriting discount. See “Underwriting”. |
To the extent that the underwriters sell more than 26,500,000 shares, the underwriters have the option to purchase up to an additional 3,975,000 shares from the Selling Stockholder at the public offering price less the underwriting discount.
The underwriters expect to deliver the shares against payment in New York, New York on , 2014.
| Morgan Stanley | Goldman, Sachs & Co. | Citigroup | BofA Merrill Lynch | |||
Prospectus dated , 2014.
Table of Contents
| Page | ||||
| ii | ||||
| iii | ||||
| 1 | ||||
| 21 | ||||
| 68 | ||||
| 68 | ||||
| 68 | ||||
| 69 | ||||
| 70 | ||||
| 71 | ||||
| Management’s Discussion and Analysis of Financial Condition and Results of Operations |
73 | |||
| 173 | ||||
| 190 | ||||
| 192 | ||||
| 241 | ||||
| 259 | ||||
| 267 | ||||
| 299 | ||||
| Beneficial Ownership of Common Stock and Selling Stockholder |
318 | |||
| 321 | ||||
| Material U.S. Federal Tax Considerations for Non-U.S. Holders of Our Common Stock |
328 | |||
| 331 | ||||
| 339 | ||||
| 339 | ||||
| 339 | ||||
| 340 | ||||
| F-1 | ||||
None of ING U.S., Inc., the Selling Stockholder, or the underwriters have authorized anyone to provide any information or to make any representations other than those contained in this prospectus or in any free writing prospectuses prepared by, or on behalf of, ING U.S., Inc. or to which ING U.S., Inc. has referred you. ING U.S., Inc., the Selling Stockholder and the underwriters take no responsibility for, and can provide no assurance as to the reliability of, any other information that others may give you. This prospectus is an offer to sell only the shares offered hereby, but only under circumstances and in jurisdictions where it is lawful to do so. The information contained in this prospectus is current only as of its date.
-i-
Table of Contents
NOTE REGARDING FORWARD-LOOKING STATEMENTS
This prospectus contains forward-looking statements. Forward-looking statements include statements relating to future developments in our business or expectations for our future financial performance and any statement not involving a historical fact. Forward-looking statements use words such as “anticipate,” “believe,” “estimate,” “expect,” “intend,” “plan,” and other words and terms of similar meaning in connection with a discussion of future operating or financial performance. Actual results, performance or events may differ materially from those projected in any forward-looking statement due to, among other things, (i) general economic conditions, particularly economic conditions in our core markets, (ii) performance of financial markets, including emerging markets, (iii) the frequency and severity of insured loss events, (iv) mortality and morbidity levels, (v) persistency and lapse levels, (vi) interest rates, (vii) currency exchange rates, (viii) general competitive factors, (ix) changes in laws and regulations and (x) changes in the policies of governments and/or regulatory authorities. Factors that may cause actual results to differ from those in any forward-looking statement also include those described under “Risk Factors,” “Management’s Discussion and Analysis of Financial Condition and Results of Operations—Trends and Uncertainties” and “Business—Closed Blocks—CBVA.”
-ii-
Table of Contents
In this prospectus, we present certain market and industry data and statistics. This information is based on third-party sources which we believe to be reliable. Market ranking information is generally based on industry surveys and therefore the reported rankings reflect the rankings only of those companies who voluntarily participate in these surveys. Accordingly, our market ranking among all competitors may be lower than the market ranking set forth in such surveys. In some cases, we have supplemented these third-party survey rankings with our own information, such as where we believe we know the market ranking of particular companies who do not participate in the surveys.
In this prospectus, the term “customers” refers to retirement plan sponsors, retirement plan participants, institutional investment clients, retail investors, corporations or professional groups offering employee benefits solutions, insurance policyholders, annuity contract holders, individuals with contractual relationships with financial advisors and holders of Individual Retirement Accounts (“IRAs”) or other individual retirement, investment or insurance products sold by us.
Market data sources used with respect to our various segments include:
Retirement
Our Retirement segment sources our market segment leadership positions within the retirement industry from market surveys conducted by LIMRA, an insurance and financial services industry organization, and industry-recognized publications such as Pensions & Investments, PlanSponsor Magazine and InvestmentNews.com. Retirement tracks market segment leadership positions by assets under management (“AUM”) or assets under administration (“AUA”), number of defined contribution plans, number of defined contribution plan participants and sales (takeover assets and contributions).
Annuities
Our Annuities segment sources our market segment leadership positions within the annuities industry primarily from LIMRA market surveys. Annuities tracks market segment leadership positions by assets under management.
Investment Management
Our Investment Management segment sources our market segment leadership positions within the investment management industry from Morningstar fund data and industry-recognized publications such as Cogent Research and Pension & Investments. Investment Management tracks market segment leadership positions by AUM; percentage of mutual funds that exceed their Morningstar category average (asset weighted, five-year basis); percentage of mutual funds that have lower volatility than their Morningstar competitor average (asset weighted, five-year basis); and survey ranking on loyalty, favorable impression and nine brand attributes by clients (plan sponsors) among defined contribution investment managers.
Individual Life
Our Individual Life segment sources our market segment leadership positions within the individual life insurance industry primarily from LIMRA market surveys. Individual Life tracks market segment leadership positions by premiums sold.
-iii-
Table of Contents
Employee Benefits
Our Employee Benefits segment sources our market segment leadership positions within the employee benefits industry from LIMRA market surveys and MyHealthguide newsletter rankings. Stop loss market rankings are derived from MyHealthguide, which does not include most managed healthcare providers in their market positions survey. The MyHealthguide survey is a recurring publication that compiles a ranking of medical stop loss providers and their most recently sourced annual premium data. Employee Benefits tracks market segment leadership positions by new premiums and in-force premiums.
-iv-
Table of Contents
This summary highlights information contained elsewhere in this prospectus and does not contain all of the information that you should consider before deciding to invest in our common stock. Before investing in our common stock, you should carefully read this entire prospectus, including our Consolidated Financial Statements and the related notes thereto and the information set forth under the sections “Risk Factors” and “Management’s Discussion and Analysis of Financial Condition and Results of Operations,” in each case included in this prospectus. Unless the context otherwise requires, we use in this prospectus the term “ING U.S., Inc.” to refer to ING U.S., Inc., and we use the terms “Company,” “we,” “us” and “our” to refer to ING U.S., Inc. together with its consolidated subsidiaries.
Our Company
We are a premier retirement, investment and insurance company serving the financial needs of approximately 13 million individual and institutional customers in the United States as of December 31, 2013. Our vision is to be America’s Retirement Company™. Our approximately 7,000 employees (as of December 31, 2013) are focused on executing our mission to make a secure financial future possible—one person, one family and one institution at a time. Through our retirement, investment management and insurance businesses, we help our customers save, grow, protect and enjoy their wealth to and through retirement. We offer our products and services through a broad group of financial intermediaries, independent producers, affiliated advisors and dedicated sales specialists throughout the United States.
Our extensive scale and breadth of product offerings are designed to help Americans achieve their retirement savings, investment income and protection goals. Our strategy is centered on preparing customers for “Retirement Readiness”—being emotionally and economically secure and ready for their retirement. We believe that the rapid aging of the U.S. population, weakening of traditional social safety nets, shifting of responsibility for retirement planning from institutions to individuals and growth in total retirement account assets will drive significant demand for our products and services going forward. We believe that we are well positioned to deliver on this Retirement Readiness need.
We believe that we help our customers achieve four essential financial goals, as they prepare for, enter and enjoy their retirement years.
| • | Save. Our products enable our customers to save for retirement by establishing investment accounts through their employers or individually. |
| • | Grow. We provide advisory programs, Individual Retirement Accounts (“IRAs”), fixed annuities, brokerage accounts, mutual funds and accumulation insurance products to help our customers achieve their financial objectives. |
| • | Protect. Our specialized retirement and insurance products, such as universal life (“UL”), indexed universal life (“IUL”), term life and stable value products, allow our customers to protect against unforeseen life events and mitigate market risk. |
| • | Enjoy. Our income products such as target date funds, guaranteed income funds, fixed annuities, IRAs, mutual funds and accumulation insurance products enable our customers to meet income needs through retirement and achieve wealth transfer objectives. |
We tailor our products to meet the unique needs of our individual and institutional customers. Our individual businesses are primarily focused on the middle and mass affluent markets; however we serve customers across the full income spectrum, especially in our Institutional Retirement Plans business, Retail and Alternative Fund businesses, and Employee Benefits segment. Similarly, our institutional businesses serve a broad range of customers, with customized offerings to the small-mid, large and mega market segments.
-1-
Table of Contents
We believe that with our leading market positions, investment expertise, and distribution reach we are well positioned to generate attractive risk-adjusted returns and earnings growth for our shareholders over time.
We operate our principal businesses through three business lines: Retirement Solutions, Investment Management and Insurance Solutions. We refer to these business lines as our “ongoing business”. In addition, we also have Closed Blocks and Corporate reporting segments. Closed Blocks consists of three businesses where we have placed our portfolios in run-off—Closed Block Variable Annuity, or CBVA, Closed Block Institutional Spread Products and Closed Block Other. Our Corporate segment includes our corporate activities and corporate-level assets and financial obligations.
The following chart presents the key products we offer across each of our businesses.
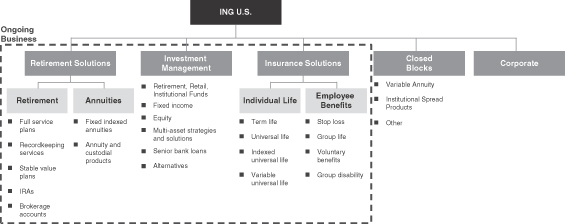
Retirement Solutions. We are a leading provider of retirement services and products in the United States, with $131.9 billion of assets under management (“AUM”) and $237.8 billion of assets under administration (“AUA”) as of December 31, 2013. We provide an extensive product range addressing both the accumulation and income distribution needs of customers, through a broad distribution footprint of nearly 2,400 affiliated representatives and thousands of non-affiliated agents and third party administrators (“TPAs”) as of December 31, 2013. Our Retirement Solutions business comprises two financial reporting segments: Retirement and Annuities.
| • | Retirement provides tax-deferred, employer-sponsored retirement savings plans and administrative services to approximately 47,000 plan sponsors covering more than 5 million plan participants in corporate, education, healthcare and government markets as of December 31, 2013. Retirement also provides IRAs, and other retail financial products as well as comprehensive financial advisory services to individual customers. We serve a broad spectrum of employers ranging from small companies to the very largest of corporations and government entities. As of the latest Pensions and Investments survey published in March 2013, we rank second in the U.S. defined contribution plan market by number of record kept plan sponsors, third by number of plan participants served, and fifth by assets under management and administration as of September 30, 2013. Retirement had $343 billion of AUM and AUA as of December 31, 2013, of which $93 billion was full service business, $247 billion was recordkeeping and stable value business and $3 billion was Individual Markets business. |
| • | Annuities provides fixed and indexed annuities, tax-qualified mutual fund custodial products and payout annuities for pre-retirement wealth accumulation and post-retirement income management sold through multiple channels, and had $26.6 billion of AUM as of December 31, 2013. |
-2-
Table of Contents
Investment Management. We are a prominent full-service asset manager with $199.3 billion of AUM and $58.5 billion of AUA as of December 31, 2013, delivering client-oriented investment solutions and advisory services. We serve both individual and institutional customers, offering them domestic and international fixed income, equity, multi-asset and alternative investment products and solutions across a range of geographies, investment styles and capitalization spectrums.
| • | As of December 31, 2013, we managed $120.3 billion in our commercial business (comprised of $75.2 billion for third-party institutions and individual investors, and $45.1 billion in separate account assets for our Retirement Solutions, Insurance Solutions and Closed Block businesses) and $79.0 billion in general account assets. We are particularly focused on growing our commercial business, in which we achieved 8.6% organic AUM growth for the year ended December 31, 2013. |
| • | We have a highly scalable business model and are among the twenty largest managers of institutional tax-exempt assets in the U.S. and ranked number one among defined contribution investment managers in client loyalty and favorability in 2011. |
| • | As of December 31, 2013, our retail mutual fund portfolio assets totaled $24.9 billion. On a five year asset weighted basis, 73% of our Investment Management managed funds (i.e., variable portfolios and mutual funds) beat their Morningstar category average and 81% had lower volatility than their Morningstar competitor average as of December 31, 2013. |
Insurance Solutions. We are one of the top providers of life insurance in the United States. Based on the LIMRA survey as of December 31, 2013, for premiums sold, our term and universal life products ranked thirteenth and twenty-fourth, respectively. The rankings reflect our recent focus on selling more capital efficient products, such as accumulation focused UL. We were also the sixth ranked provider of medical stop loss coverage in the United States based on annual premiums as reported by MyHealthguide in June 2013. Our Insurance Solutions business comprises two financial reporting segments: Individual Life and Employee Benefits.
| • | Individual Life provides wealth protection and transfer opportunities through universal, variable, whole life and term life products, distributed through independent channels to meet the needs of a broad range of customers from the middle-market through affluent market segments. As of December 31, 2013, the Individual Life distribution model is supported by independent life sales agents (over 2,200 independent general agents with access to over 96,000 producers), strategic distribution (approximately 35 independent managing directors supporting approximately 7,200 additional producers) and specialty markets (95 general agents with access to over 7,100 producers). |
| • | Employee Benefits provides stop loss, group life, voluntary employee-paid and disability products to mid-sized and large businesses. As of December 31, 2013, the Company has 58 employee benefits sales representatives, across 19 sales offices, with average industry experience of 17 years. Approximately 58.3%, 23.4% and 10.3% of Employee Benefit sales were attributed to stop loss, life and voluntary products, respectively, for the year ended December 31, 2013. |
Closed Blocks. We separated our CBVA and Closed Block Institutional Spread Products segments from our other operations and made a strategic decision to stop actively writing new retail variable annuity products with substantial guarantee features and to run-off the institutional spread products portfolio over time. Accordingly, these segments have been classified as closed blocks and are managed separately from our ongoing business.
| • | CBVA. In 2009, we decided to cease sales of retail variable annuity products with substantial guarantee features (the last policies were issued in early 2010) and placed this portfolio in run-off. Subsequently, we refined our hedge program to seek to dynamically protect regulatory and rating agency capital of the variable annuities block for adverse equity market movements. In addition, since 2010, we have increased statutory reserves considerably, added significant interest rate risk protection and have more closely aligned our policyholder behavior assumptions with experience. Our focus in managing our |
-3-
Table of Contents
| CBVA segment is on protecting regulatory and rating agency capital from equity market movements via hedging and judiciously looking for opportunities to accelerate the run-off of the block, where possible. We believe that our hedge program, combined with our statutory reserves of $3.3 billion as of December 31, 2013, related to the variable annuity block, provides adequate resources to fund a wide range of, but not all, possible market scenarios as well as a margin for adverse policyholder behavior. |
| • | Closed Block Institutional Spread Products. In 2009, we also placed the institutional spread products portfolio in run-off. As of December 31, 2013, remaining assets in the institutional spread products portfolio had an amortized cost of $2.5 billion, down from a peak of $14.3 billion in 2008. |
As of December 31, 2013, we had $510.5 billion in total AUM and AUA and total shareholders’ equity, excluding accumulated other comprehensive income/(loss) (“AOCI”) and noncontrolling interests, of $11.4 billion. In the year ended December 31, 2013, we generated $758.1 million of income (loss) before income taxes, $600.5 million of net income (loss) available to ING U.S., Inc.’s common shareholders and $1.3 billion of operating earnings before income taxes. Operating earnings before income taxes is not a financial measure recognized under U.S. generally accepted accounting principles (“U.S. GAAP”).
The following table presents the relative contributions of each of our reporting segments to our AUM and AUA, and to total operating earnings before income taxes for the year ended December 31, 2013. See “Management’s Discussion and Analysis of Financial Condition and Results of Operations—Results of Operations—Company Consolidated” for a reconciliation of operating earnings before income taxes to Income (loss) before income taxes.
| AUM and AUA (As of December 31, 2013) |
Total Operating
Earnings Before Income Taxes (Year Ended December 31, 2013) |
|||||||||||
| Business Line and Segments |
$ in millions | $ in millions | % | |||||||||
| Retirement Solutions: |
||||||||||||
| Retirement |
$ | 343,014.0 | $ | 595.8 | 47.0 | % | ||||||
| Annuities |
26,646.7 | 293.8 | 23.2 | |||||||||
| Investment Management |
257,748.8 | 178.1 | 14.0 | |||||||||
| Insurance Solutions: |
||||||||||||
| Individual Life |
15,995.6 | 254.8 | 20.1 | |||||||||
| Employee Benefits |
1,755.1 | 106.1 | 8.3 | |||||||||
| Eliminations/Other |
(183,585.9 | ) | — | — | ||||||||
| Total Ongoing Business |
$ | 461,574.3 | $ | 1,428.6 | 112.6 | % | ||||||
| Corporate |
— | (210.6 | ) | (16.6 | ) | |||||||
| Closed Blocks(1) |
48,953.5 | 50.6 | 4.0 | |||||||||
| Total ING U.S. |
$ | 510,527.8 | $ | 1,268.6 | 100.0 | % | ||||||
| (1) | Our CBVA segment is managed to focus on protecting regulatory and rating agency capital rather than achieving operating metrics and, therefore, its results of operations are not reflected within operating earnings before income taxes. |
Recent Events
Redomestication of SLDI. Effective December 20, 2013, our reinsurance subsidiary, Security Life of Denver International Limited (“SLDI”) redomesticated from the Cayman Islands to the State of Arizona. SLDI was approved as an Arizona-domiciled captive reinsurer by the Arizona Department of Insurance (“ADOI”). For additional information, See “Regulation—Insurance Regulation”.
-4-
Table of Contents
Amended and Restated Revolving Credit Agreement. On February 14, 2014, we revised the terms of our Revolving Credit Agreement (the “Revolving Credit Agreement”), dated as of April 20, 2012, by entering into an Amended and Restated Revolving Credit Agreement (the “Amended and Restated Credit Agreement”) with a syndicate of banks. The Amended and Restated Credit Agreement modifies the terms of the Revolving Credit Agreement by extending the term of the agreement to February 14, 2018, reducing the total amount of Letters of Credit (“LOCs”) that may be issued thereunder from $3.5 billion to $3.0 billion and reducing the current cost of LOC issuance fees from 200 basis points (“bps”) to 175 bps.
First Quarter of 2014
The following information constitutes forward-looking statements within the meaning of the Private Securities Litigation Reform Act of 1995. The trends discussed below may or may not be realized, because they are based on information for a partial reporting period as well as on judgments or assumptions that may prove incorrect. As a result, our results for the first quarter of 2014 may vary significantly from those which would be expected based on the discussion below. See “Risk Factors” and “Note Regarding Forward-Looking Statements” for a discussion of some of the factors that may adversely impact these or other future results.
As discussed in connection with the announcement of our financial results for the fourth quarter of 2013, our results for that quarter included certain higher-than-expected income and certain better-than-expected underwriting results which, in the aggregate, increased our operating earnings before income taxes for that quarter. The net effect of these variances from expectations was that fourth quarter 2013 operating earnings before income taxes of $304.9 million were higher than our expected run rate due to factors which, in our models, are not expected to recur at the same levels.
These items in the fourth quarter of 2013 included the following items that we do not expect to recur:
| • | A $9 million net gain from a Lehman Brothers bankruptcy settlement and losses from disposal of certain Low Income Housing Tax Credit partnerships, net of applicable amortization of DAC/VOBA and other intangibles; and |
| • | A $14 million prepayment expense that reduced earnings in our Closed Block Institutional Spread Products segment as a result of early termination of certain Federal Home Loan Bank funding agreements; for the full year 2014 we expect Closed Block Institutional Spread Products segment operating earnings before income taxes to be in the range of $7 to $12 million. |
These items in the fourth quarter of 2013 also included items subject to significant variability which deviated from our long term expectations:
| • | Prepayment fee income for the ongoing business was approximately $7 million higher than expected, prior to related amortization of DAC/VOBA and other intangibles; |
| • | Alternative investment income for the ongoing business was approximately $24 million higher than the long term expected return of 9%; |
| • | Approximately $8 million in higher underwriting income due to the group life loss ratio of 72%, when compared to the long-term expected range of 77% to 80%; and |
| • | Approximately $22 million in favorable DAC/VOBA and other intangibles unlocking. |
As it relates to expected first quarter of 2014 performance, we have not prepared any consolidated financial statements as of any date or for any period subsequent to December 31, 2013. We have limited information about January and February 2014 results, which is incomplete, and minimal to no information related to March 2014 performance. We observed that the variances from expectations we experienced during the fourth quarter of 2013
-5-
Table of Contents
do not appear to be recurring in the first quarter of 2014. In the case of prepayment fee income, we observed approximately $2 million of income through February 28, 2014, below the pro rata income we expected to realize over this period based on our average quarterly prepayment fee income expectation of approximately $15 million.
As discussed elsewhere in this prospectus, our results are subject to seasonality. In general, the first quarter of each year experiences certain seasonal items that result in lower revenues and higher expenses. During January and February, we observed seasonality effects largely consistent with the trends noted below.
Administrative expenses in the first quarter typically include the effect of higher payroll taxes and other annual expenses that are concentrated in the first quarter. These incremental expenses typically add approximately $10 to $15 million to our operating expenses in the first quarter.
Loss ratios in our group life business are generally higher in the first quarter as compared to the full year, which tends to lower operating earnings in our Employee Benefits segment.
Income on alternatives is usually lower in the first quarter as compared to the full year average, due to first quarter delays in the reporting from and the valuation cycle associated with the alternative investment limited partnerships.
Performance fees in our Investment Management business in the fourth quarter are typically higher than in other quarters based on our current contracts.
As we complete the first quarter, the effects of seasonality may vary significantly and the notable variances experienced during the fourth quarter of 2013 may yet recur, or other positive or negative developments may arise.
We continue to execute on our ROE improvement plan and to grow our businesses. We continue to expect to achieve our Operating ROC and Operating ROE goals as described elsewhere in this prospectus. In addition, we continue to believe that we remain on track, making steady progress towards our 2016 ROE and ROC goals over the course of 2014.
Share Repurchase Program and Direct Share Buyback from ING Group
Share Repurchase Program
On March 13, 2014, our Board of Directors authorized a share repurchase program (the “Share Repurchase Program”), pursuant to which we may, from time to time, purchase shares of our common stock for an aggregate repurchase price not to exceed $300 million. Share repurchases may be executed through various means, including, without limitation, open market transactions, privately negotiated transactions or tender offers. The Share Repurchase Program does not have an expiration date and does not obligate us to purchase any shares. The authorization for the Share Repurchase Program may be terminated, increased or decreased by our Board of Directors at any time.
The Direct Share Buyback from ING Group that is described and defined below under “—Direct Share Buyback”, is being made pursuant to the Share Repurchase Program. The aggregate purchase price for the shares to be acquired by us in the Direct Share Buyback will decrease the amount available for repurchase under the Share Repurchase Program.
-6-
Table of Contents
Giving effect to the Direct Share Buyback, the remaining authorization under the Share Repurchase Program would permit future repurchases by us of shares of common stock having an aggregate purchase price of up to $50 million.
Direct Share Buyback
On March 18, 2014, we entered into a Share Repurchase Agreement with ING Group (the “Share Repurchase Agreement”), pursuant to which we will acquire from ING Group, subject to certain terms and conditions, shares of our common stock having an aggregate purchase price of $250 million (the “Direct Share Buyback”). Pursuant to the Share Repurchase Agreement, the purchase price per share of common stock will be equal to the per-share proceeds, before expenses, to the Selling Stockholder shown on the cover of this prospectus.
The Direct Share Buyback and the entry into the Share Repurchase Agreement were each authorized by a special committee of our Board of Directors consisting solely of independent and disinterested directors (the “Special Committee”), which was formed for the sole purpose of considering the Direct Share Buyback. The Special Committee retained independent financial and legal advisors for purposes of its deliberations.
Pursuant to the Share Repurchase Agreement, the Direct Share Buyback will be subject to a number of conditions (unless waived by the Company with the approval of the Special Committee), including:
| • | The successful completion of this offering; |
| • | That upon the completion of this offering and the Direct Share Buyback (and without giving any effect to the exercise by the underwriters of their option to acquire additional shares), ING Group and its affiliates will beneficially own, in the aggregate, no more than 45% of the issued and outstanding shares of our common stock; |
| • | The resignation from our Board of Directors, effective as of the time of the closing of the Direct Share Buyback, of two directors who are designated as “ING Group Directors” for purposes of our Shareholder Agreement with ING Group; and |
| • | The receipt by the Special Committee of a fairness opinion, in form satisfactory to the Special Committee, from Greenhill & Co., LLC, the Special Committee’s financial advisor. |
The Direct Share Buyback will be funded from our existing cash on hand.
Although, as described above, the closing of the Direct Share Buyback is conditioned on the closing of this offering (among other conditions), the closing of this offering is not conditioned upon the closing of the Direct Share Buyback, and there can be no assurance that the Direct Share Buyback will be completed even if this offering is completed.
The Share Repurchase Agreement is filed as an exhibit to the registration statement of which this prospectus is a part.
Changes to Our Governance as a Result of this Offering and the Direct Share Buyback
Upon the completion of this offering and the Direct Share Buyback (together, the “Transactions”) , ING Group will no longer hold a majority of the outstanding shares of our common stock. Consequently, certain changes to our governance will occur following the closing of the Transactions, including:
Director Resignations and Postponement of Annual Meeting of Stockholders
As a closing condition to the Direct Share Buyback, two directors who are designated as “ING Group Directors” pursuant to our Shareholder Agreement with ING Group must tender their resignations, effective
-7-
Table of Contents
immediately upon the closing of the Direct Share Buyback. Following these resignations, seven members of our current Board of Directors will remain in office, including our Chairman and Chief Executive Officer, our three independent directors, and three ING Group Directors. As of the date of this prospectus, we have received the written resignations of each of John Boers and Dick Harryvan, to be effective no later than the closing of the Direct Share Buyback.
The Nominating and Governance Committee of our Board of Directors is currently working with an executive search firm to identify and recruit potential director candidates to replace the two ING Group Directors who are expected to resign. It is expected that the candidates ultimately selected will each qualify as “independent” for purposes of the NYSE listed company rules and the rules of the SEC relating to the independence of audit committee members, and will be nominated by our Board of Directors for election at our 2014 annual meeting of stockholders. In order to permit sufficient time for a thorough review and nomination process, our Board of Directors has decided to postpone the previously scheduled annual meeting of stockholders. Additional information about the 2014 annual meeting of stockholders and our director nominees will be included in the proxy statement that we will file with the SEC in advance of our annual meeting.
Controlled Company Exemption
Because no stockholder will continue to own more than 50% of our outstanding common stock following the completion of the Transactions, we will no longer be able to rely on the “controlled company” exemption provided by the NYSE listed company rules. Pursuant to this exemption, we have not been required to satisfy certain of the corporate governance requirements of the NYSE, including the requirement that we maintain a Board of Directors containing a majority of directors who are “independent” for purposes of the NYSE listed company rules or that our Nominating and Governance and Compensation and Benefits Committees each consist solely of independent directors. Following the Transactions, we will become subject to all of the applicable NYSE corporate governance requirements over a one-year phase-in period, following which time our Board of Directors must consist of a majority of independent directors, and our Nominating and Governance and Compensation and Benefits Committees must each consist solely of independent directors. We currently expect that we will meet such requirements well before the conclusion of the phase-in period.
Shareholder Agreement
Pursuant to our Shareholder Agreement with ING Group, certain rights held by ING Group cease to apply once it no longer beneficially owns more than 50% of our outstanding common stock and, in some cases, when it ceases to consolidate our financial results in its financial statements for purposes of International Financial Reporting Standards (“IFRS”). Following the completion of the Transactions, we expect that both of these conditions will be met, triggering certain consequences under the terms of our Shareholder Agreement, including:
| • | The number of ING Group Directors that ING Group is entitled to nominate to our Board of Directors will decrease from five to three; |
| • | The Executive Committee of our Board of Directors may act without the consent of the Executive Committee member who is an ING Group Director; |
| • | ING Group will lose certain rights in respect of changes to certain of our company policies relating to risk, capital, investment, environmental and social responsibility, and regulatory compliance; and |
| • | ING Group will lose certain rights relating to the receipt of business and financial reporting information. |
For more information on the Shareholder Agreement, see “Certain Relationships and Related Party Transactions—Continuing Relationship with ING Group—Shareholder Agreement”.
-8-
Table of Contents
Limitations on Compensation Policies and Practices
Pursuant to the “remuneration framework” between ING Group and the Dutch Central Bank (De Nederlandsche Bank, or “DNB”), until such time as ING Group ceases to hold a majority of our outstanding common stock and no longer consolidates our financial results in its financial statements under IFRS, we are subject to certain restrictions on our compensation policies and practices. See “Compensation of Executive Officers and Directors—Critical Compensation and Other Policies—Capital Requirements Directive”. Following the completion of the Transactions, we will no longer be subject to these restrictions.
Market Environment and Opportunities
The current macroeconomic backdrop and financial market uncertainty, as well as the weakening of historical safety nets provided by governments and employers, such as Social Security and defined benefit plans, are increasing the need for Americans to plan for their own long-term financial security. Our products and services are designed to help individuals achieve their retirement savings, investment income and protection goals. We believe that we are uniquely positioned to benefit from a number of significant demographic and market trends, including the following:
| • | Rapid growth in aging U.S. population. In a 2012 study, the U.S. Census Bureau estimated that the number of Americans aged 65 and older will more than double between 2012 and 2060, increasing from 43.1 million in 2012 to 92.0 million in 2060. This older segment of the population would represent just over one-in-five U.S. residents by the end of the period, up from one-in-seven at the end of 2012. |
| • | Fraying of traditional social safety nets. The U.S. Government Accountability Office has indicated that increasing life expectancy has created a risk that many retirees will outlive their retirement assets. Additionally, employer-sponsored private sector pension plans face severe funding deficits. According to a report by Mercer Consulting, a consulting and research firm, the aggregate funding deficit for pension plans sponsored by companies included on the Standard & Poor’s 1500 Index (“S&P 1500”) was $276 billion as of February 28, 2014. Americans realize that funding deficits in government and employer-sponsored pension plans leave them exposed to retirement income shortfalls. According to a 2012 LIMRA study, more than 64% of individuals aged 55 to 70 do not expect to receive enough income from Social Security and employer pensions to cover their basic living expenses through their retirement years. |
| • | Growth in the retirement savings market. The U.S. Bureau of Labor Statistics estimates that private sector participation in defined benefit plans declined from 80% of full time employees in 1985 to 19% in 2012, while employee participation in defined contribution plans increased from 41% to 51% over the same period. Between 1985 and 2011, the total number of defined contribution plans grew 38%, from 461,963 to 638,390, while over the same time period the number of defined benefit plans decreased 73%, from 170,172 to 45,256. According to Cerulli Associates, a financial services research firm, total U.S. retirement account assets are expected to grow 38% from $16 trillion in 2011 to $22 trillion by 2016. The paradigm shift in savings responsibilities from institutions to individuals will drive much of this growth into the defined contribution and IRA markets, with defined contribution plan assets expected to grow from $4.8 trillion to $5.8 trillion and IRA assets expected to grow from $5.2 trillion to $7.6 trillion between 2011 and 2016. In addition, the anticipated growth of the rollover market presents a considerable long-term opportunity: according to a 2013 LIMRA survey, assets rolled into IRAs exceeded $350 billion per year in 2011 (up 90% from 10 years prior) and are expected to reach approximately $575 billion per year by 2016. |
| • | Insufficient life insurance coverage. According to the most recent study published by LIMRA in September 2013, 58 million or approximately half of all U.S. households do not believe they have sufficient life insurance coverage. The average U.S. household with life insurance coverage only owns enough to replace 3.5 years of income, as compared to the 7- to 12-year average recommended range as sourced by LIMRA. |
-9-
Table of Contents
We believe these market trends will drive increasing demand for our Retirement Solutions, Investment Management and Insurance Solutions businesses, and highlight the value of our holistic investment advisory approach as a means to help customers realize their retirement savings and income goals.
Our Competitive Strengths
We believe that we have a number of competitive strengths which will allow us to capitalize on attractive market opportunities as we develop and grow our business in a consistent and prudent manner.
| • | Leadership positions in our ongoing business with a broad range of product offerings capable of meeting the evolving financial needs of customers throughout their lives. We have leading positions in our Retirement Solutions and Insurance Solutions businesses and a prominent Investment Management business with top-tier investment performance across an array of asset classes. Few of our competitors have the breadth and scale across savings and financial protection products that customers will need throughout their lives. |
| • | Our Retirement Solutions business ranks as the number two provider of defined contribution retirement plans in the U.S. as measured by the number of plan sponsors, and number three as measured by the number of plan participants for which we provide recordkeeping services as of September 30, 2013. We are one of the few retirement services providers in the U.S. capable of using our industry presence and scale to efficiently support small, mid, large and mega-sized employers in the 401(k), 403(b) and 457 market segments. |
| • | Our Investment Management business is a leading U.S. based asset manager, with 73% of our Investment Management managed funds (i.e., variable portfolios and mutual funds) beating their Morningstar category average and 81% having lower volatility than their Morningstar competitor average on a five-year asset-weighted basis as of December 31, 2013. |
| • | Our Insurance Solutions business provides a full range of product capabilities and was the thirteenth largest writer of term life, and the twenty-fourth largest writer of universal life based on premiums sold in the United States as of December 31, 2013. We were also the sixth largest provider of medical stop loss coverage in the United States based on annual premiums as reported by MyHealthguide on June 3, 2013. |
| • | Relationships with approximately 13 million customers as of December 31, 2013. We believe the size, scope and long-standing market presence of our businesses provide us with access to millions of individual customers, relationships with and relevance to distributors across the financial services landscape, economies of scale, and an understanding of and ability to leverage best practices across our organization. We can offer customers with whom we have built a relationship, either through their employer or directly, a suite of products that can meet most of their lifetime protection and accumulation needs. |
| • | Our institutional businesses provide us with the ability to access millions of individual customers in a cost-effective manner, and our comprehensive product suite gives us the opportunity to convert these touch points into long-term customer relationships. |
| • | Our access to individuals at critical points in their lives and our ability to offer tailored protection, retirement, investment and savings products enables us to cultivate deep, long-lasting and profitable customer relationships. Our product suite includes individual retirement accounts (“IRAs”), mutual funds and annuities which enables us to maintain a relationship with individuals entering retirement or exiting their current plan for any other reason. According to a 2011 report by LIMRA, approximately 75% of roll-over assets are captured by an institution with which the customer had a prior relationship. |
-10-
Table of Contents
| • | Extensive, multi-channel distribution network with strong producer relationships. We offer customers access to our products and services through a national, multi-channel distribution network that includes approximately 220,000 individual points of contact associated with both affiliated and unaffiliated distributors as of December 31, 2013. |
| • | Our distribution network consists of product and business specific channels, meeting the unique requirements and preferences of our customers in each of our businesses, and includes direct, institutional, intermediary, strategic and internal wholesale channels. |
| • | We cultivate long-standing, loyal relationships with our distribution partners by providing innovative products, highly responsive service and efficient technology solutions. |
| • | As a strong and preferred distribution partner, we focus on supporting our independent distribution partners and have extensive experience in channel conflict resolutions. |
| • | The strong relationships in our well-established and extensive multi-channel distribution networks are a key aspect of achieving our long term goals. |
| • | Scalable operating platform. We have developed a highly scalable business model which positions us well for future growth opportunities. Our operating platform supports both current and significantly higher volumes of business, positioning us favorably for margin expansion in the future. |
| • | Our Retirement Solutions business has operational centers of excellence that are leveraged across the Institutional Retirement Plans (full service and recordkeeping) and Individual Markets businesses to efficiently and cost effectively provide high quality services to all clients. |
| • | Our Investment Management business has developed product manufacturing capabilities that would enable the business to manage a significant amount of additional assets with limited increase in costs. |
| • | Our Insurance Solutions business has scalable operational models that provide us the capability to add new business at attractive marginal costs and to quickly increase capacity to take advantage of attractive market conditions. |
| • | Renewed financial strength. We have taken decisive actions to strengthen our balance sheet over the last four years by repositioning and reducing the risk of our investment portfolio, hedging our closed block against market-related volatility, deleveraging our capital structure and bolstering our holding company liquidity position. |
| • | Our U.S. insurance subsidiaries have maintained an estimated combined company action level risk-based capital ratio (“RBC ratio”) at or above 425% as of the end of each quarter during 2011, 2012 and 2013. |
| • | Our investment portfolio of $87.1 billion as of December 31, 2013, comprises approximately 83.5% fixed maturity securities, of which 95.9% have been assigned credit quality ratings of 1 or 2 by the National Association of Insurance Commissioners (“NAIC”). |
| • | Between December 31, 2008 and December 31, 2013, we reduced our Alt-A exposure 93.1% from $4.5 billion to $307.4 million, our subprime holdings 83.1% from $3.6 billion to $614.7 million and our commercial mortgage-backed securities (“CMBS”) exposure 63.5% from $9.4 billion to $3.4 billion based on amortized cost. As of December 31, 2013, we had no direct sovereign exposure to Greece, Ireland, Portugal, Spain or Italy (“peripheral Europe”) and no direct exposure to financial institutions based in those countries. |
| • | We decided to cease sales of retail variable annuity products with substantial guarantee features (the last policies were issued in early 2010) and placed this portfolio and the institutional spread products portfolio in run-off. Subsequently, we refined our hedge program to dynamically protect |
-11-
Table of Contents
| regulatory and rating agency capital of the variable annuities block for adverse equity market movements. In addition, since 2010, we have increased statutory reserves considerably, added significant interest rate risk protection and have more closely aligned our policyholder behavior assumptions with experience. |
| • | We enhanced our capital structure and significantly reduced financial leverage. |
| • | Stringent risk management approach. Over the past few years, we have become increasingly focused on risk management and risk control. We have established an independent risk management function with responsibility for all risk management across the organization enabling clear separation of duties between risk, finance and investment functions. |
| • | We have comprehensive risk management and control procedures at all levels of our organization that support business strategies, formulate risk appetite, implement risk related policies and monitor limits. |
| • | We adhere to a strong policy and reporting framework that guides a multi-tiered risk governance structure in the assessment and management of risk and includes a daily feedback mechanism. |
| • | We follow disciplined processes to assess, measure, report and manage risks, including product development and pricing, asset/liability management (“ALM”), capital management and risk mitigating activities such as hedging and reinsurance. |
| • | We maintain a dynamic hedge program that seeks to protect against select equity market and interest rate risks. |
| • | Highly experienced management team, supported by deep bench of talent. Our senior management team has extensive experience in the retirement, investment management and insurance sectors and is supported by a diverse group of talented executives throughout the Company. |
| • | Our 9 executive officers average over 25 years of financial services experience and are actively instilling a performance-driven, execution-oriented culture across our organization. |
| • | 6 of our 9 executive officers have joined the Company since the financial crisis of 2008-2009, and have successfully put in place a set of strategies that are helping to define our Company today, including risk management initiatives, balance sheet discipline, and product portfolio improvements. |
Summary Risk Factors
Our business is subject to numerous risks described in the section entitled “Risk Factors” and elsewhere in this prospectus. You should carefully consider these risks before making an investment. Some of these risks include:
| • | Continued difficult conditions in the global capital markets and the economy generally have affected and may continue to affect our business and results of operations; |
| • | The level of interest rates may adversely affect our profitability, particularly in the event of a continuation of the current low interest rate environment or a period of rapidly increasing interest rates; |
| • | A downgrade or a potential downgrade in our financial strength or credit ratings could result in a loss of business and adversely affect our results of operations and financial condition; |
| • | The inability of counterparties to meet their financial obligations could have an adverse effect on our results of operations; |
| • | Our investment portfolio is subject to several risks that may diminish the value of our invested assets and the investment returns credited to customers, which could reduce our sales, revenues, AUM and results of operations; |
-12-
Table of Contents
| • | We may face significant losses if mortality rates, morbidity rates, persistency rates or other underwriting assumptions differ significantly from our pricing expectations; |
| • | We expect that our ability to use beneficial U.S. tax attributes will be subject to limitations; |
| • | The performance of our CBVA segment depends on assumptions that may not be accurate; |
| • | Our Variable Annuity Hedge Program may not be effective and may be more costly than anticipated; |
| • | Our businesses and those of ING Group and its affiliates are heavily regulated and changes in regulation or the application of regulation may reduce our profitability; |
| • | ING Group’s continuing significant interest in us may result in conflicts of interest; |
| • | Our continuing relationship with ING Group, and with affiliates of ING Group, may affect our ability to operate and finance our business as we deem appropriate and changes with respect to ING Group could negatively impact us; |
| • | Our separation from ING Group could adversely affect our business and profitability due to ING Group’s strong brand and reputation; |
| • | We expect to incur incremental costs as a standalone public company; and |
| • | The ability of our insurance subsidiaries to pay dividends and other distributions to ING U.S., Inc. will depend on their earnings, surplus, tax considerations, covenants contained in financing agreements and is limited by state insurance laws. |
Our Business Strategy
Building on our core strengths, we intend to pursue strategies to deliver consistent earnings growth with attractive risk-adjusted returns while maintaining a strong balance sheet. The immediate focus of our strategy is to improve the operating return on equity (“operating ROE”) of our ongoing business. We have identified more than thirty ROE-enhancing projects across our businesses and functions intended to improve operating ROE of our ongoing business to a goal in the range of 12% to 13% by 2016. The operating return on capital (“operating ROC”) of our ongoing business increased from 7.2% in 2012 to 8.6% in 2013 and is expected to increase to a goal in the range of 10% to 11% by 2016. Operating ROE and operating ROC are non-GAAP financial measures. For additional detail on our ROC expansion goal and the calculation of operating ROE and operating ROC and reconciliations, see “Business—Operating Return on Capital Goal”. The cornerstones of our prudent ROE and ROC expansion strategy are the following:
| • | Improve the profitability of our existing franchises. We have identified and are actively pursuing several initiatives to improve profitability across our businesses. These initiatives include maintaining strict pricing discipline for new sales, re-pricing existing blocks of business that do not meet our return hurdles, allowing the run-off of unprofitable books that cannot be re-priced and adjusting policyholder crediting rates. For instance, we recently instituted price increases across certain term and universal life products, positioning them to earn double-digit returns. We are working to reduce our operating and information technology overhead by leveraging our procurement capabilities to reduce expenses, increasing our use of business process outsourcing services and employing “Six Sigma” statistical management techniques. We believe these initiatives will enhance our margins and support improved earnings and increased cash flow distributions from our operating subsidiaries to ING U.S., Inc. going forward. |
| • | Focus on capital management across all businesses. We are highly focused on effectively managing the demands for capital across our businesses. We have prioritized growth in our higher return, less capital intensive Retirement Solutions and Investment Management businesses. Our Insurance Solutions business is focused on selling capital-efficient products such as indexed products in Individual Life and Employee Benefits products. The overall objective of these policies is to realign our businesses in a manner that will maximize free cash flow generation. |
-13-
Table of Contents
| • | Leverage leading market positions, investment performance, and distribution strength to drive profitable growth in select markets. Within Retirement Solutions, we are targeting the small-mid corporate and education retirement plan markets. We will target growth in the healthcare and government markets selectively based on opportunities for economically sustainable value delivery with acceptable returns. We are also seeking to expand relationships with our large recordkeeping-only clients by offering the full breadth of ING U.S.’s capabilities, including Retirement Readiness solutions, for their plan participants. Within Investment Management, we are focused on leveraging our strong investment track record and historical performance to attract new institutional and individual customers in our third party business and to increase the share of proprietary assets under the management of Retirement Solutions. Given our scalable operating platform we believe our growth will produce margin expansion in these segments. Also, although we are deemphasizing parts of our Insurance Solutions business, it provides key capabilities, broad distribution and seasoned underwriting that complement Retirement Solutions and Investment Management in helping customers attain their financial goals. |
| • | Transcend boundaries between workplace benefits and personal financial products. We aim to deliver comprehensive solutions across our customer base by combining the capabilities of our three ongoing businesses. This combination of capabilities differentiates us from other financial services firms and allows us to capitalize on favorable demographic and social trends. For individuals, we intend to provide value-added services and increase the number of our products they consume. In Retirement Solutions, we have been seeking greater access to employees in employer-sponsored plans. We believe that such direct access will allow us to convert institutional relationships into individual ones and enable us to offer individuals entering retirement or exiting their current employer-sponsored plan for any other reason suitable products in which they can invest their retirement plan assets. In Insurance Solutions, we have been working with employer clients to offer a broader array of voluntary products to address the needs of their employees. Ultimately, we aspire to bridge the gap between workplace benefits and personal financial products in order to benefit our customers. |
| • | Protect our balance sheet by prudently managing risks. Risk management is pervasive in everything we do as a Company. The coordination of our strategic, financial and risk functions has been critical to helping us focus on risk reduction initiatives as well as determining where to invest for the future. We have substantially reduced the risk of our investment portfolio since 2008 and intend to continue managing it conservatively. On the liability side, we have significantly deleveraged our capital structure, are keenly focused on managing tail risks and have implemented a hedge program that seeks to substantially mitigate the effect of market shocks on our regulatory and rating agency capital adequacy, especially as it relates to the CBVA segment. Our hedge program is regularly evaluated and revised in light of changing market conditions and to manage the trade-offs between capital preservation, cash flow, earnings and underlying economics. |
Our Selling Stockholder
Following the Transactions, ING Group will own approximately 45% of our outstanding common stock (before any exercise of the underwriters’ option to purchase additional shares). ING Group has informed us that it will divest its remaining holdings of our common stock in line with ING Group’s restructuring plan as agreed with the European Commission (“EC”). See “—ING Group Restructuring Plan with European Commission”.
ING Group Restructuring Plan with European Commission
Prior to our initial public offering in May 2013, we were a wholly owned subsidiary of ING Group. In October 2009, ING Group submitted a restructuring plan (the “2009 Restructuring Plan”) to the EC in order to receive approval for state aid (the “Dutch State Transactions”) granted to ING Group by the Kingdom of the Netherlands (the “Dutch State”) in November 2008 and March 2009. To receive approval for this state aid, ING Group was required to divest its insurance and investment management businesses, including the Company. In
-14-
Table of Contents
this prospectus, we refer to any sale or other divestment of all or a portion of ING U.S., Inc. common stock by ING Group, including this offering, as a “Divestment Transaction.” On November 19, 2012, ING Group and the EC announced that the EC approved amendments to the 2009 Restructuring Plan (the “2012 Amended Restructuring Plan”). On November 6, 2013, ING Group announced that the EC approved amendments to the 2012 Amended Restructuring Plan (the “2013 Amended Restructuring Plan”). The 2013 Amended Restructuring Plan has not amended any commitments that are applicable or relevant to ING U.S.
The 2012 Amended Restructuring Plan requires ING Group to divest at least 25% of the Company by December 31, 2013, more than 50% of the Company by December 31, 2014, and 100% of the Company by December 31, 2016. ING Group divested 25% of the Company on May 7, 2013, in our initial public offering and an additional 4% on May 31, 2013 following the exercise by the underwriters in the initial public offering of an option to purchase additional shares. ING Group divested an additional 14% of the Company on October 29, 2013, in a registered offering. The divestment of 50% of the Company is measured in terms of a divestment of over 50% of the shares of ING U.S., Inc., the loss of ING Group’s majority of directors on ING U.S., Inc.’s board of directors and the accounting deconsolidation of the Company (in line with IFRS accounting rules). The Transactions, together with the governance changes described under “Summary—Changes to our Governance as a Result of this Offering and the Direct Share Buyback”, are intended to satisfy such requirements. In case ING Group does not satisfy its commitment to timely divest the Company as agreed with the EC, or in case of any other material non-compliance with the 2012 Amended Restructuring Plan, the Dutch State will renotify the recapitalization measure to the EC. In such a case, the EC may require additional restructuring measures or take enforcement actions against ING Group, or, at the request of ING Group and the Dutch State, could allow ING Group more time to complete the divestment. The 2012 Amended Restructuring Plan also contains provisions that could limit our business activities, including restricting our ability to make certain acquisitions or to conduct certain financing and investment activities. For additional information on the separation from ING Group and the 2012 Amended Restructuring Plan, see “Risk Factors—Risks Related to Our Separation from, and Continuing Relationship with, ING Group” and “Regulation—Dutch State Transactions and Restructuring Plan”.
-15-
Table of Contents
Our Corporate Information
Prior to our initial public offering in May 2013, we were a wholly owned subsidiary of ING Group, a global financial institution of Dutch origin offering banking, retirement, insurance and investment management services. ING Group entered the United States life insurance market in 1975 through the acquisition of Wisconsin National Life Insurance Company, followed in 1976 with its acquisition of Midwestern United Life Insurance Company and Security Life of Denver Insurance Company in 1977. ING Group significantly expanded its presence in the United States in the late 1990s and 2000s with the acquisitions of Equitable Life Insurance Company of Iowa (1997), Furman Selz, an investment advisory company (1997), ReliaStar Life Insurance Company (including Pilgrim Capital Corporation) (2000), Aetna Life Insurance and Annuity Company (including Aeltus Investment Management) (2000) and CitiStreet (2008).
ING U.S., Inc. is a holding company incorporated in Delaware on April 7, 1999. It changed its name from ING America Insurance Holdings, Inc. to ING U.S., Inc. on June 14, 2012. Our initial public offering was completed on May 7, 2013. Our principal executive office is located at 230 Park Avenue, New York, New York 10169 and our telephone number is (212) 309-8200. Our website address is ing.us. The information contained on, or that can be accessed through, our website is not part of, and is not incorporated into, this prospectus.
We operate our businesses through a number of direct and indirect subsidiaries. The following organizational chart presents the ownership and jurisdiction of incorporation of our principal subsidiaries:
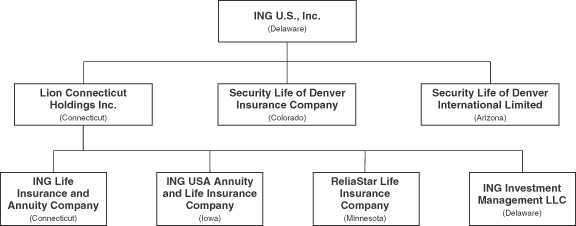
The chart above presents:
| • | ING U.S., Inc. |
| • | Our principal intermediate holding company, Lion Connecticut Holdings Inc. (“Lion Holdings”), which is the direct parent of a number of our insurance and non-insurance operating entities. |
| • | Our principal operating entities that will be the primary sources of cash distributions to ING U.S., Inc. Specifically, these entities are our principal insurance operating companies ING Life Insurance and Annuity Company (“ILIAC”), ING USA Annuity and Life Insurance Company (“ING USA”), Security Life of Denver Insurance Company (“SLD”) and ReliaStar Life Insurance Company (“RLI”)) and ING Investment Management LLC, the holding company for entities that operate our Investment Management business. |
| • | SLDI, our captive reinsurance subsidiary, which was previously domiciled in the Cayman Islands, and was redomesticated to the State of Arizona, effective December 20, 2013. |
In connection with our rebranding discussed in “Business—Our Brand” below, we intend to change our legal name to “Voya Financial, Inc.” in April 2014 by means of a short-form merger under the Delaware General Corporation Law (“DGCL”) with a wholly owned subsidiary formed for that purpose.
-16-
Table of Contents
THE OFFERING
| Common stock offered by the Selling Stockholder in this offering |
26,500,000 shares. |
| Common stock to be outstanding immediately after this offering and the Direct Share Buyback |
254,653,340 shares, assuming that 7,022,471 shares are repurchased by us from ING Group in the Direct Share Buyback (based on an assumed per share repurchase price of $35.60, the closing price per share of our common stock on March 17, 2014, as reported by the NYSE). The actual number of shares repurchased in the Direct Share Buyback will be equal to $250 million divided by the per share proceeds, before expenses, to the Selling Stockholder in this offering, as shown on the cover of this prospectus. |
| Option to purchase additional shares |
The underwriters have an option for a period of 30 days to purchase from the Selling Stockholder up to 3,975,000 additional shares of our common stock. |
| Direct Share Buyback from ING Group |
Concurrently with the completion of this offering, we expect to repurchase from ING Group shares of our common stock having an aggregate repurchase price of $250 million. See “—Share Repurchase Program and Direct Share Buyback from ING Group”. Based on an assumed per share repurchase price of $35.60 (the closing price per share of our common stock on March 17, 2014, as reported by the NYSE), we would repurchase 7,022,471 shares from ING Group in the Direct Share Buyback. The actual number of shares repurchased in the Direct Share Buyback will be equal to $250 million divided by the per share proceeds, before expenses, to the Selling Stockholder in this offering, as shown on the cover of this prospectus. |
| Voting rights |
Each share of our common stock entitles its holder to one vote on all matters to be voted on by stockholders generally. See “Description of Capital Stock—Authorized Capital Stock—Common Stock”. |
| Use of proceeds |
We will not receive any of the proceeds from the sale of shares by the Selling Stockholder in this offering. |
| Dividend policy |
We currently intend to continue to pay quarterly cash dividends on our common stock at the current amount of $0.01 per share, at the discretion of the Board of Directors. On February 6, 2014, our Board of Directors declared a dividend of $0.01 per share, which will be paid on March 31, 2014 to shareholders of record as of February 28, 2014. See “Dividend Policy”. |
| Listing |
Our common stock is listed on the NYSE. |
-17-
Table of Contents
| Ticker symbol |
“VOYA”. We expect to rebrand from ING U.S. to Voya Financial over time beginning soon after this offering. See “Business—Our Brand”. |
| Warrants |
In connection with our IPO, we issued to ING Group warrants that are exercisable for 26,050,846 shares of our common stock at an exercise price of $48.75 per share of common stock, in each case subject to adjustments. See “Description of Capital Stock—Warrants Issued to ING Group”. |
Unless otherwise indicated, all information in this prospectus assumes no exercise by the underwriters of their right to purchase up to an additional 3,975,000 shares of our common stock from the Selling Stockholder.
-18-
Table of Contents
SUMMARY CONSOLIDATED FINANCIAL DATA
Except for other supplemental data, the following summary consolidated financial data for the years ended December 31, 2013, 2012 and 2011 and as of December 31, 2013, 2012 and 2011 are derived from our audited Consolidated Financial Statements, which are included elsewhere in this prospectus.
Prospective investors should read these summary consolidated financial data together with “Management’s Discussion and Analysis of Financial Condition and Results of Operations” and our Consolidated Financial Statements and the related notes included elsewhere in this prospectus.
| As of or for the Year Ended December 31, |
||||||||||||
| ($ in millions, except for ratios) | 2013 | 2012 | 2011 | |||||||||
| Consolidated Operating Results |
||||||||||||
| Net investment income |
$ | 4,689.0 | $ | 4,697.9 | $ | 4,968.8 | ||||||
| Fee income |
3,666.3 | 3,515.4 | 3,603.6 | |||||||||
| Premiums |
1,956.3 | 1,861.1 | 1,770.0 | |||||||||
| Net realized capital gains (losses) |
(2,534.8 | ) | (1,280.8 | ) | (1,531.4 | ) | ||||||
| Total revenues |
8,758.5 | 9,615.3 | 9,718.8 | |||||||||
| Interest credited and other benefits to contract owners/policyholders |
4,497.8 | 4,861.6 | 5,742.0 | |||||||||
| Operating expenses |
2,686.7 | 3,155.0 | 3,030.8 | |||||||||
| Net amortization of deferred policy acquisition costs and value of business acquired |
442.8 | 722.3 | 387.0 | |||||||||
| Interest expense |
184.8 | 153.7 | 139.3 | |||||||||
| Total benefits and expenses |
8,000.4 | 9,009.3 | 9,441.0 | |||||||||
| Income (loss) before income taxes |
758.1 | 606.0 | 277.8 | |||||||||
| Net income (loss) |
790.6 | 611.2 | 102.8 | |||||||||
| Net income (loss) attributable to noncontrolling interest |
190.1 | 138.2 | 190.9 | |||||||||
| Net income (loss) available to ING U.S., Inc.’s common shareholders |
600.5 | 473.0 | (88.1 | ) | ||||||||
| Consolidated Financial Position |
||||||||||||
| Total investments |
$ | 87,050.8 | $ | 95,487.6 | $ | 92,819.2 | ||||||
| Assets held in separate accounts |
106,827.1 | 97,667.4 | 88,714.5 | |||||||||
| Total assets |
221,023.2 | 216,394.2 | 203,572.8 | |||||||||
| Future policy benefits and contract owner account balances |
84,006.7 | 86,055.7 | 88,358.4 | |||||||||
| Short-term debt |
— | 1,064.6 | 1,054.6 | |||||||||
| Long-term debt |
3,514.7 | 3,171.1 | 1,343.1 | |||||||||
| Liabilities related to separate accounts |
106,827.1 | 97,667.4 | 88,714.5 | |||||||||
| Total ING U.S., Inc. shareholders’ equity, excluding AOCI(1) |
11,423.1 | 10,164.2 | 9,758.9 | |||||||||
| Total ING U.S., Inc. shareholders’ equity |
13,272.2 | 13,874.9 | 12,353.9 | |||||||||
-19-
Table of Contents
| As of or for the Year
Ended December 31, |
||||||||||||
| ($ in millions, except for ratios) | 2013 | 2012 | 2011 | |||||||||
| Segment Data(2) |
||||||||||||
| Operating earnings before income taxes |
||||||||||||
| Retirement Solutions |
||||||||||||
| Retirement |
$595.8 | $ | 448.6 | $ | 441.9 | |||||||
| Annuities |
293.8 | 102.2 | 387.6 | |||||||||
| Investment Management |
178.1 | 134.5 | 87.5 | |||||||||
| Insurance Solutions |
||||||||||||
| Individual Life |
254.8 | 196.2 | 279.3 | |||||||||
| Employee Benefits |
106.1 | 109.4 | 83.3 | |||||||||
|
|
|
|
|
|
|
|||||||
| Total Ongoing Business |
|
1,428.6 |
|
990.9 | 1,279.6 | |||||||
| Corporate |
(210.6) | (182.3 | ) | (230.2 | ) | |||||||
| Closed Blocks |
||||||||||||
| Closed Block Institutional Spread Products |
35.9 | 45.7 | 83.2 | |||||||||
| Closed Block Other |
14.7 | 64.0 | (13.0 | ) | ||||||||
|
|
|
|
|
|
|
|||||||
| Total Closed Blocks(3) |
50.6 | 109.7 | 70.2 | |||||||||
|
|
|
|
|
|
|
|||||||
| Total operating earnings before income taxes |
$ | 1,268.6 | $ | 918.3 | $ | 1,119.6 | ||||||
|
|
|
|
|
|
|
|||||||
| Other Supplemental Data (unaudited) |
||||||||||||
| AUM and AUA |
$510,527.8 | $ | 461,000.6 | $ | 438,046.4 | |||||||
|
TAC(4) |
7,068.4 | 7,871.9 | 8,071.0 | |||||||||
| RBC ratio(5) |
503% | 526 | % | 488 | % | |||||||
| (1) | ING U.S., Inc. shareholders’ equity, excluding AOCI, is derived by subtracting AOCI from ING U.S., Inc. shareholders’ equity—both components of which are presented in the respective Consolidated Balance Sheets. For a description of AOCI, see the Accumulated Other Comprehensive Income (Loss) note to the Consolidated Financial Statements. We provide shareholders’ equity, excluding AOCI, because it is a common measure used by insurance analysts and investment professionals in their evaluations. |
| (2) | Operating earnings before income taxes is a non-GAAP financial measure. See “Management’s Discussion and Analysis of Financial Condition and Results of Operations—Operating Measures” for more details and “Management’s Discussion and Analysis of Financial Condition and Results of Operations—Results of Operations—Company Consolidated” for a reconciliation to Income (loss) before income taxes. |
| (3) | Our CBVA segment is managed to focus on protecting regulatory and rating agency capital rather than achieving operating metrics and, therefore, its results of operations are not reflected within operating earnings before income taxes. |
| (4) | Estimated total adjusted capital (“TAC”) of our four principal U.S. insurance subsidiaries on a combined basis. |
| (5) | Estimated combined RBC ratio for our four principal U.S. insurance subsidiaries. |
-20-
Table of Contents
You should carefully consider the following risks and other information in this prospectus, including our Consolidated Financial Statements and related notes, before you decide to purchase our common stock. Additional risks and uncertainties of which we are not presently aware or that we currently deem immaterial could also affect our business operations and financial condition. If any of these risks actually occur, our business, financial condition and results of operations could be materially affected. As a result, the trading price of our common stock could decline and you could lose part or all of your investment.
Risks Related to Our Business—General
Continued difficult conditions in the global capital markets and the economy generally have affected and may continue to affect our business and results of operations.
Our business and results of operations are materially affected by conditions in the global capital markets and the economy generally. Concerns over the slow economic recovery, the shutdown of the U.S. government, the level of U.S. national debt (including periodic debates in the U.S. Congress regarding the national debt ceiling), the European sovereign debt crisis, the ability of certain countries to remain in the euro zone, unemployment, the availability and cost of credit, the U.S. housing market, inflation levels, energy costs and geopolitical issues have contributed to increased volatility and diminished expectations for the economy and the markets. In 2011, Standard & Poor’s Ratings Services (“S&P”) lowered its long term sovereign credit rating on the United States from AAA to AA+. In addition, significant concerns regarding the sovereign debt of Greece, Ireland, Italy, Portugal and Spain, as well as certain other countries, in some cases have required countries to obtain emergency financing. The financial turmoil in Europe continues to be a long-term threat to global capital markets and remains a challenge to global financial stability. If these or other countries require additional financial support or if sovereign credit ratings decline further, yields on the sovereign debt of certain countries may increase, the cost of borrowing may increase and credit may become more limited. Additionally, the possibility of capital market volatility spreading through a highly integrated and interdependent banking system remains elevated. In the event of any default or similar event with respect to a sovereign issuer, some financial institutions may suffer significant losses for which they would require additional capital, which may not be available. These factors, combined with volatile oil prices, reduced business and consumer confidence and continued high unemployment, have negatively impacted the U.S. economy. Furthermore, the Board of Governors of the Federal Reserve System (the “Federal Reserve”) has begun to scale back programs that have in recent years fostered a historically low interest rate environment, which could generate volatility in debt and equity markets including, but not limited to, rapid increases in interest rates and associated declining values on fixed income investments. Our results of operations, investment portfolio and AUM are exposed to these risks and may be adversely affected as a result. In addition, in the event of extreme prolonged market events, such as the recent global credit crisis, we could incur significant losses.
Even in the absence of a market downturn, our insurance, annuity, retirement and investment products, as well as our investment returns and our access to and cost of financing, are sensitive to equity, fixed income, real estate and other market fluctuations and general economic and political conditions. These fluctuations and conditions could materially and adversely affect our results of operations, financial condition and liquidity, including in the following respects:
| • | We provide a number of insurance, annuity, retirement and investment products that expose us to risks associated with fluctuations in interest rates, market indices, securities prices, default rates, the value of real estate assets, currency exchange rates and credit spreads. The profitability of many of our insurance, annuity, retirement and investment products depends in part on the value of the general accounts and separate accounts supporting them, which may fluctuate substantially depending on the foregoing conditions. |
| • | Volatility or downturns in the equity markets can cause a reduction in fee income we earn from managing investment portfolios for third parties and fee income on certain annuity, retirement and |
-21-
Table of Contents
| investment products. Because these products and services generate fees related primarily to the value of AUM, a decline in the equity markets could reduce our revenues because of the reduction in the value of the investments we manage. |
| • | A change in market conditions, including prolonged periods of high or low inflation or interest rates, could cause a change in consumer sentiment and adversely affect sales and could cause the actual persistency of these products to vary from their anticipated persistency (the probability that a product will remain in force from one period to the next) and adversely affect profitability. Changing economic conditions or adverse public perception of financial institutions can influence customer behavior, which can result in, among other things, an increase or decrease in claims, lapses, withdrawals, deposits or surrenders in certain products, any of which could adversely affect profitability. |
| • | An equity market decline, decreases in prevailing interest rates, or a prolonged period of low interest rates could result in the value of guaranteed minimum benefits contained in certain of our life insurance, annuity and retirement products being higher than current account values or higher than anticipated in our pricing assumptions, requiring us to materially increase reserves for such products, and may result in a decrease in customer lapses, thereby increasing the cost to us. In addition, such a scenario could lead to increased amortization and/or unfavorable unlocking of our deferred acquisition cost (“DAC”) and value of business acquired (“VOBA”). |
| • | Reductions in employment levels of our existing employer customers may result in a reduction in underlying employee participation levels, contributions, deposits and premium income for certain of our retirement products. Participants within the retirement plans for which we provide certain services may elect to effect withdrawals from these plans, or reduce or stop their payroll deferrals to these plans, which would reduce assets under management or administration and our revenues. |
| • | We have significant investment and derivative portfolios that include, among other investments, corporate securities, asset-backed securities (“ABS”), equities and commercial mortgages. Economic conditions as well as adverse capital market and credit conditions, interest rate changes, changes in mortgage prepayment behavior or declines in the value of underlying collateral will impact the credit quality, liquidity and value of our investment and derivative portfolios, potentially resulting in higher capital charges and unrealized or realized losses and decreased investment income. The value of our investments and derivative portfolios may also be impacted by reductions in price transparency, changes in the assumptions or methodology we use to estimate fair value and changes in investor confidence or preferences, which could potentially result in higher realized or unrealized losses and have a material adverse effect on our results of operations or financial condition. Market volatility may also make it difficult to value certain of our securities if trading becomes less frequent. |
| • | Market conditions determine the availability and cost of the reinsurance protection we purchase and may result in additional expenses for reinsurance or an inability to obtain sufficient reinsurance on acceptable terms, which could adversely affect the profitability of future business and the availability of capital to support new sales. |
| • | Hedging instruments we use to manage product and other risks might not perform as intended or expected, which could result in higher realized losses and unanticipated cash needs to collateralize or settle such transactions. Adverse market conditions can limit the availability and increase the costs of hedging instruments, and such costs may not be recovered in the pricing of the underlying products being hedged. In addition, hedging counterparties may fail to perform their obligations resulting in unhedged exposures and losses on positions that are not collateralized. |
| • | Regardless of market conditions, certain investments we hold, including privately placed fixed income investments, investments in private equity funds and commercial mortgages, are relatively illiquid. If we need to sell these investments, we may have difficulty selling them in a timely manner or at a price equal to what we could otherwise realize by holding the investment to maturity. |
-22-
Table of Contents
| • | We are exposed to interest rate and equity risk based upon the discount rate and expected long-term rate of return assumptions associated with our pension and other retirement benefit obligations. Sustained declines in long-term interest rates or equity returns could have a negative effect on the funded status of these plans and/or increase our future funding costs. |
| • | Fluctuations in our operating results and our investment portfolio may impact our tax profile, our ability to optimally utilize tax attributes and our deferred income tax assets. See “—We expect that our ability to use beneficial U.S. tax attributes will be subject to limitations.” |
| • | A default by any financial institution or by a sovereign could lead to additional defaults by other market participants. The failure of a sufficiently large and influential institution could disrupt securities markets or clearance and settlement systems and lead to a chain of defaults, because the commercial and financial soundness of many financial institutions may be closely related as a result of credit, trading, clearing or other relationships. Even the perceived lack of creditworthiness of a counterparty may lead to market-wide liquidity problems and losses or defaults by us or by other institutions. This risk is sometimes referred to as “systemic risk” and may adversely affect financial intermediaries, such as clearing agencies, clearing houses, banks, securities firms and exchanges with which we interact on a daily basis. Systemic risk could have a material adverse effect on our ability to raise new funding and on our business, results of operations, financial condition, liquidity and/or business prospects. In addition, such a failure could impact future product sales as a potential result of reduced confidence in the financial services industry. |
| • | Widening credit spreads, if not offset by equal or greater declines in the risk-free interest rate, would also cause the total interest rate payable on newly issued securities to increase, and thus would have the same effect as an increase in underlying interest rates with respect to the valuation of our current portfolio. |
Continuing market turmoil has resulted in, and may continue to raise the possibility of, legislative, regulatory and governmental actions. We cannot predict whether or when such actions may occur, or what impact, if any, such actions could have on our business, results of operations and financial condition.
Adverse capital and credit market conditions may impact our ability to access liquidity and capital, as well as the cost of credit and capital.
Adverse capital market conditions may affect the availability and cost of borrowed funds, thereby impacting our ability to support or grow our businesses. We need liquidity to pay our operating expenses, interest on our debt and dividends on our capital stock, maintain our securities lending activities and replace certain maturing liabilities. Without sufficient liquidity, we will be forced to curtail our operations and our business will suffer. As a holding company with no direct operations, our principal assets are the capital stock of our subsidiaries. Payments of dividends and advances or repayment of funds to us by our insurance subsidiaries are restricted by the applicable laws and regulations of their respective jurisdictions, including laws establishing minimum solvency and liquidity thresholds.
For our insurance and other subsidiaries, the principal sources of liquidity are insurance premiums and fees, annuity deposits and cash flow from investments and assets. At the holding company level, sources of liquidity in normal markets also include a variety of short-term liquid investments and short-and long-term instruments, including credit facilities, equity securities and medium-and long-term debt.
In the event current resources do not satisfy our needs, we may have to seek additional financing. The availability of additional financing will depend on a variety of factors such as market conditions, the general availability of credit, the volume of trading activities, the overall availability of credit to the financial services industry and our credit ratings and credit capacity, as well as the possibility that customers or lenders could develop a negative perception of our long- or short-term financial prospects. Similarly, our access to funds may be limited if regulatory authorities or rating agencies take negative actions against us. If our internal sources of
-23-
Table of Contents
liquidity prove to be insufficient, there is a risk that we may not be able to successfully obtain additional financing on favorable terms, or at all. Any actions we might take to access financing may cause rating agencies to reevaluate our ratings.
Disruptions, uncertainty or volatility in the capital and credit markets, such as that experienced over the past few years, may also limit our access to capital. Such market conditions may in the future limit our ability to raise additional capital to support business growth, or to counter-balance the consequences of losses or increased regulatory reserves and rating agency capital requirements. This could force us to (1) delay raising capital, (2) reduce, cancel or postpone interest payments on our debt, (3) issue capital of different types or under different terms than we would otherwise or (4) incur a higher cost of capital than in a more stable market environment. This would have the potential to decrease both our profitability and our financial flexibility. Our results of operations, financial condition, liquidity, statutory capital and rating agency capital position could be materially and adversely affected by disruptions in the financial markets.
The level of interest rates may adversely affect our profitability, particularly in the event of a continuation of the current low interest rate environment or a period of rapidly increasing interest rates.
Changes in prevailing interest rates may negatively affect our business including the level of net interest margin we earn. In a period of changing interest rates, interest expense may increase and interest credited to policyholders may change at different rates than the interest earned on assets. Accordingly, changes in interest rates could decrease net interest margin. Changes in interest rates may negatively affect the value of our assets and our ability to realize gains or avoid losses from the sale of those assets, all of which also ultimately affect earnings. In addition, our insurance and annuity products and certain of our retirement and investment products are sensitive to inflation rate fluctuations. A sustained increase in the inflation rate in our principal markets may also negatively affect our business, financial condition and results of operation. For example, a sustained increase in the inflation rate may result in an increase in nominal market interest rates. A failure to accurately anticipate higher inflation and factor it into our product pricing assumptions may result in mispricing of our products, which could materially and adversely impact our results of operations.
During periods of declining interest rates or a prolonged period of low interest rates, life insurance and annuity products may be relatively more attractive to consumers due to minimum guarantees that are frequently mandated by regulators, resulting in increased premium payments on products with flexible premium features and a higher percentage of insurance and annuity contracts remaining in force from year-to-year than we anticipated in our pricing, potentially resulting in greater claims costs than we expected and asset liability cash flow mismatches. A decrease in interest rates or a prolonged period of low interest rates may also require additional provisions for guarantees included in life insurance and annuity contracts, as the guarantees become more valuable to policyholders. During a period of decreasing interest rates or a prolonged period of low interest rates, our investment earnings may decrease because the interest earnings on our recently purchased fixed income investments will likely have declined in parallel with market interest rates. In addition, a prolonged low interest rate period may result in higher costs for certain derivative instruments that may be used to hedge certain of our product risks. Residential mortgage-backed securities (“RMBS”) and callable fixed income securities in our investment portfolios will be more likely to be prepaid or redeemed as borrowers seek to borrow at lower interest rates. Consequently, we may be required to reinvest the proceeds in securities bearing lower interest rates. Accordingly, during periods of declining interest rates, our profitability may suffer as the result of a decrease in the spread between interest rates credited to policyholders and contract owners and returns on our investment portfolios. An extended period of declining interest rates or a prolonged period of low interest rates may also cause us to change our long-term view of the interest rates that we can earn on our investments. Such a change in our view would cause us to change the long-term interest rate that we assume in our calculation of insurance assets and liabilities under U.S. GAAP. This revision would result in increased reserves, accelerated amortization of DAC and other unfavorable consequences. In addition, certain statutory capital and reserve requirements are based on formulas or models that consider interest rates, and an extended period of low interest rates may increase the statutory capital we are required to hold and the amount of assets we must maintain to support statutory reserves.
-24-
Table of Contents
Despite an increase in long-term interest rates in 2013, interest rates remain low by historical standards. We believe a continuation of the current low interest rate environment would also negatively affect our financial performance. See “Business—Operating Return on Capital Goal.” In addition, we expect that a continuation of the current low interest rate environment would reduce our total company estimated combined RBC ratio (which includes the effect from the Closed Blocks) in an amount that could be material.
Conversely, in periods of rapidly increasing interest rates, policy loans, withdrawals from, and/or surrenders of, life insurance and annuity contracts and certain guaranteed investment contracts (“GICs”) may increase as policyholders choose to seek higher investment returns. Obtaining cash to satisfy these obligations may require us to liquidate fixed income investments at a time when market prices for those assets are depressed because of increases in interest rates. This may result in realized investment losses. Regardless of whether we realize an investment loss, such cash payments would result in a decrease in total invested assets and may decrease our net income and capitalization levels. Premature withdrawals may also cause us to accelerate amortization of DAC, which would also reduce our net income. An increase in market interest rates could also have a material adverse effect on the value of our investment portfolio by, for example, decreasing the estimated fair values of the fixed income securities within our investment portfolio. An increase in market interest rates could also create a significant collateral posting requirement associated with our interest rate hedge programs and Federal Home Loan Bank funding agreements, which could materially and adversely affect liquidity. In addition, an increase in market interest rates could require us to pay higher interest rates on debt securities we may issue in the financial markets from time to time to finance our operations, which would increase our interest expenses and reduce our results of operations. An increase in interest rates could result in decreased fee income associated with a decline in the value of variable annuity account balances invested in fixed income funds, which also might affect the value of the underlying guarantees within these variable annuities. Lastly, certain statutory reserve requirements are based on formulas or models that consider forward interest rates and an increase in forward interest rates may increase the statutory reserves we are required to hold thereby reducing statutory capital.
A downgrade or a potential downgrade in our financial strength or credit ratings could result in a loss of business and adversely affect our results of operations and financial condition.
Ratings are important to our business. Credit ratings represent the opinions of rating agencies regarding an entity’s ability to repay its indebtedness. Our credit ratings are important to our ability to raise capital through the issuance of debt and to the cost of such financing. Financial strength ratings, which are sometimes referred to as “claims-paying” ratings, represent the opinions of rating agencies regarding the financial ability of an insurance company to meet its obligations under an insurance policy. Financial strength ratings are important factors affecting public confidence in insurers, including our insurance company subsidiaries. The financial strength ratings of our insurance subsidiaries are important to our ability to sell our products and services to our customers. Ratings are not recommendations to buy our securities. Each of the rating agencies reviews its ratings periodically, and our current ratings may not be maintained in the future.
Our ratings could be downgraded at any time and without notice by any rating agency. For a description of material rating actions that have occurred from the beginning of 2011 through the date of this prospectus, see “Management’s Discussion and Analysis of Financial Condition and Results of Operations—Liquidity and Capital Resources—Ratings”.
A downgrade of the financial strength rating of one of our four principal insurance subsidiaries (ING USA, ILIAC, SLD and RLI, and collectively, the “Principal Insurance Subsidiaries”) could affect our competitive position by making it more difficult for us to market our products as potential customers may select companies with higher financial strength ratings and by leading to increased withdrawals by current customers seeking companies with higher financial strength ratings. This could lead to a decrease in AUM and result in lower fee income. Furthermore, sales of assets to meet customer withdrawal demands could also result in losses, depending on market conditions. In addition, a downgrade in either our financial strength or credit ratings could potentially, among other things, increase our borrowing costs and make it more difficult to access financing; adversely affect access to the commercial paper market or the availability of LOCs and other financial guarantees; result in
-25-
Table of Contents
additional collateral requirements, or other required payments or termination rights under derivative contracts or other agreements; and/or impair, or cause the termination of, our relationships with creditors, broker-dealers, distributors, reinsurers or trading counterparties, which could potentially negatively affect our profitability, liquidity and/or capital. In addition, we use assumptions of market participants in estimating the fair value of our liabilities, including insurance liabilities that are classified as embedded derivatives under U.S. GAAP. These assumptions include our nonperformance risk (i.e., the risk that the obligations will not be fulfilled). Therefore, changes in our credit or financial strength ratings may affect the fair value of our liabilities.
As rating agencies continue to evaluate the financial services industry, it is possible that rating agencies will heighten the level of scrutiny that they apply to financial institutions, increase the frequency and scope of their credit reviews, request additional information from the companies that they rate and potentially adjust upward the capital and other requirements employed in the rating agency models for maintenance of certain ratings levels. It is possible that the outcome of any such review of us would have additional adverse ratings consequences, which could have a material adverse effect on our results of operations, financial condition and liquidity. We may need to take actions in response to changing standards or capital requirements set by any of the rating agencies which could cause our business and operations to suffer. We cannot predict what additional actions rating agencies may take, or what actions we may take in response to the actions of rating agencies.
We receive an explicit guarantee of our liabilities under one International Swaps and Derivatives Association, Inc. (“ISDA”) master agreement from NN Group N.V. (“NN Group”), a wholly owned subsidiary of ING Group. NN Group is successor to ING Verzekeringen N.V. (“ING V”) which was previously our indirect parent. Previously, ING V also provided a guarantee of our commercial paper program which has been terminated. Also, ING Bank N.V. (“ING Bank”), an affiliate, provides certain LOC facilities to the Company. See “Certain Relationships and Related Party Transactions—Historical Related Party Transactions—Financing Arrangements—Letter of Credit Facilities”. A downgrade of ING Bank could negatively impact our ability to utilize these facilities as reinsurance collateral. Additionally, certain of our securities are guaranteed by ING Group. A downgrade of the credit ratings of ING Group could result in downgrades of these securities. For information on additional collateral requirements in case of a downgrade of our or NN Group’s ratings, see “Management’s Discussion and Analysis of Financial Condition and Results of Operations—Liquidity and Capital Resources—Potential Impact of a Ratings Downgrade”.
Because we operate in highly competitive markets, we may not be able to increase or maintain our market share, which may have an adverse effect on our results of operations.
In each of our businesses we face intense competition, including from domestic and foreign insurance companies, broker-dealers, financial advisors, asset managers and diversified financial institutions, both for the ultimate customers for our products and for distribution through independent distribution channels. We compete based on a number of factors including brand recognition, reputation, quality of service, quality of investment advice, investment performance of our products, product features, scope of distribution, price, perceived financial strength and credit ratings. A decline in our competitive position as to one or more of these factors could adversely affect our profitability. In addition, we may in the future sacrifice our competitive or market position in order to improve our profitability. Many of our competitors are large and well-established and some have greater market share or breadth of distribution, offer a broader range of products, services or features, assume a greater level of risk, or have higher claims-paying or credit ratings than we do.
In recent years, there has been substantial consolidation among companies in the financial services industry resulting in increased competition from large, well-capitalized financial services firms. Future economic turmoil may accelerate additional consolidation activity. Many of our competitors also have been able to increase their distribution systems through mergers or contractual arrangements. Furthermore, larger competitors may have lower operating costs and have an ability to absorb greater risk, while maintaining financial strength ratings, allowing them to price products more competitively. These competitive pressures could result in increased pressure on the pricing of certain of our products and services, and could harm our ability to maintain or increase
-26-
Table of Contents
profitability. In addition, if our financial strength and credit ratings are lower than our competitors, we may experience increased surrenders and/or a significant decline in sales. The competitive landscape in which we operate may be further affected by the government sponsored programs in the United States and similar governmental actions outside of the United States in response to the dislocations in financial markets. Competitors that receive governmental financing, guarantees or other assistance, or that are not subject to the same regulatory constraints, may have or obtain pricing or other competitive advantages. Due to the competitive nature of the financial services industry, there can be no assurance that we will continue to effectively compete within the industry or that competition will not have a material adverse impact on our business, results of operations and financial condition.
Our risk management policies and procedures, including hedging programs, may prove inadequate for the risks we face, which could negatively affect our business or result in losses.
We have developed risk management policies and procedures, including hedging programs that utilize derivative financial instruments, and expect to continue to do so in the future. Nonetheless, our policies and procedures to identify, monitor and manage risks may not be fully effective, particularly during extremely turbulent times. Many of our methods of managing risk and exposures are based upon observed historical market behavior or statistics based on historical models. As a result, these methods may not predict future exposures, which could be significantly greater than historical measures indicate. Other risk management methods depend on the evaluation of information regarding markets, customers, catastrophe occurrence or other matters that is publicly available or otherwise accessible to us. This information may not always be accurate, complete, up-to-date or properly evaluated. Management of operational, legal and regulatory risks requires, among other things, policies and procedures to record and verify large numbers of transactions and events. These policies and procedures may not be fully effective.
We employ various strategies, including hedging and reinsurance, with the objective of mitigating risks inherent in our business and operations. These risks include current or future changes in the fair value of our assets and liabilities, current or future changes in cash flows, the effect of interest rates, equity markets and credit spread changes, the occurrence of credit defaults, currency fluctuations and changes in mortality and longevity. We seek to control these risks by, among other things, entering into reinsurance contracts and derivative instruments, such as swaps, options, futures and forward contracts. See “—Reinsurance subjects us to the credit risk of reinsurers and may not be available, affordable or adequate to protect us against losses” for a description of risks associated with our use of reinsurance. Developing an effective strategy for dealing with these risks is complex, and no strategy can completely insulate us from such risks. Our hedging strategies also rely on assumptions and projections regarding our assets, liabilities, general market factors and the creditworthiness of our counterparties that may prove to be incorrect or prove to be inadequate. Accordingly, our hedging activities may not have the desired beneficial impact on our results of operations or financial condition. Hedging strategies involve transaction costs and other costs, and if we terminate a hedging arrangement, we may also be required to pay additional costs, such as transaction fees or breakage costs. We may incur losses on transactions after taking into account our hedging strategies. In particular, certain of our hedging strategies focus on the protection of regulatory and rating agency capital, rather than U.S. GAAP earnings. Because our regulatory capital and rating agency capital react differently to market movements than our Variable Annuity Guarantee Hedge Program target, we have executed a capital hedge overlay (“CHO”) program to generally target these differences. As U.S. GAAP accounting differs from the methods used to determine regulatory reserves and rating agency capital requirements, our hedge programs may create earnings volatility in our U.S. GAAP financial statements. Further, the nature, timing, design or execution of our hedging transactions could actually increase our risks and losses. Our hedging strategies and the derivatives that we use, or may use in the future, may not adequately mitigate or offset the hedged risk and our hedging transactions may result in losses.
Past or future misconduct by our employees, agents, intermediaries, representatives of our broker-dealer subsidiaries or employees of our vendors could result in violations of law by us or our subsidiaries, regulatory sanctions and/or serious reputational or financial harm and the precautions we take to prevent and detect this
-27-
Table of Contents
activity may not be effective in all cases. Although we employ controls and procedures designed to monitor associates’ business decisions and to prevent us from taking excessive or inappropriate risks, associates may take such risks regardless of such controls and procedures. Our compensation policies and practices are reviewed by us as part of our overall risk management program, but it is possible that such compensation policies and practices could inadvertently incentivize excessive or inappropriate risk taking. If our associates take excessive or inappropriate risks, those risks could harm our reputation and have a material adverse effect on our results of operations and financial condition.
The inability of counterparties to meet their financial obligations could have an adverse effect on our results of operations.
Third parties that owe us money, securities or other assets may not pay or perform under their obligations. These parties include the issuers or guarantors of securities we hold, customers, reinsurers, trading counterparties, securities lending and repurchase counterparties, counterparties under swaps, credit default and other derivative contracts, clearing agents, exchanges, clearing houses and other financial intermediaries. Defaults by one or more of these parties on their obligations to us due to bankruptcy, lack of liquidity, downturns in the economy or real estate values, operational failure or other factors, or even rumors about potential defaults by one or more of these parties, could have a material adverse effect on our results of operations, financial condition and liquidity.
We routinely execute a high volume of transactions such as unsecured debt instruments, derivative transactions and equity investments with counterparties and customers in the financial services industry, including brokers and dealers, commercial and investment banks, mutual and hedge funds, institutional clients, futures clearing merchants, swap dealers, insurance companies and other institutions, resulting in large periodic settlement amounts which may result in our having significant credit exposure to one or more of such counterparties or customers. Many of these transactions comprise derivative instruments with a number of counterparties in order to hedge various risks, including equity and interest rate market risk features within many of our insurance and annuity products. Our obligations under our products are not changed by our hedging activities and we are liable for our obligations even if our derivative counterparties do not pay us. As a result, we face concentration risk with respect to liabilities or amounts we expect to collect from specific counterparties and customers. A default by, or even concerns about the creditworthiness of, one or more of these counterparties or customers could have an adverse effect on our results of operations or liquidity. There is no assurance that losses on, or impairments to the carrying value of, these assets due to counterparty credit risk would not materially and adversely affect our business, results of operations or financial condition.
We are also subject to the risk that our rights against third parties may not be enforceable in all circumstances. The deterioration or perceived deterioration in the credit quality of third parties whose securities or obligations we hold could result in losses and/or adversely affect our ability to rehypothecate or otherwise use those securities or obligations for liquidity purposes. While in many cases we are permitted to require additional collateral from counterparties that experience financial difficulty, disputes may arise as to the amount of collateral we are entitled to receive and the value of pledged assets. Our credit risk may also be exacerbated when the collateral we hold cannot be realized or is liquidated at prices not sufficient to recover the full amount of the loan or derivative exposure that is due to us, which is most likely to occur during periods of illiquidity and depressed asset valuations, such as those experienced during the recent financial crisis. The termination of contracts and the foreclosure on collateral may subject us to claims for the improper exercise of rights under the contracts. Bankruptcies, downgrades and disputes with counterparties as to the valuation of collateral tend to increase in times of market stress and illiquidity.
Requirements to post collateral or make payments related to changes in market value of specified assets may adversely affect liquidity.
The amount of collateral we may be required to post under short-term financing agreements and derivative transactions may increase under certain circumstances. Pursuant to the terms of some transactions, we could be required to make payment to our counterparties related to any change in the market value of the specified
-28-
Table of Contents
collateral assets. Such requirements could have an adverse effect on liquidity. Furthermore, with respect to any such payments, we may have unsecured risk to the counterparty as these amounts may not be required to be segregated from the counterparty’s other funds, may not be held in a third-party custodial account and may not be required to be paid to us by the counterparty until the termination of the transaction. Additionally, the implementation of the Dodd-Frank Wall Street Reform and Consumer Protection Act (the “Dodd-Frank Act”) and the resultant changes in collateral requirements may increase the need for liquidity and eligible collateral assets in excess of what is already being held.
For a discussion on certain obligations we have with respect to the posting of collateral upon the occurrence of certain events, see “Management’s Discussion and Analysis of Financial Condition and Results of Operations—Liquidity and Capital Resources—Potential Impact of a Ratings Downgrade.”
Our investment portfolio is subject to several risks that may diminish the value of our invested assets and the investment returns credited to customers, which could reduce our sales, revenues, AUM and results of operations.
Fixed income securities represent a significant portion of our investment portfolio. We are subject to the risk that the issuers, or guarantors, of fixed income securities we own may default on principal and interest payments they owe us. We are also subject to the risk that the underlying collateral within ABS, including mortgage-backed securities, may default on principal and interest payments causing an adverse change in cash flows. The occurrence of a major economic downturn, acts of corporate malfeasance, widening mortgage or credit spreads, or other events that adversely affect the issuers, guarantors or underlying collateral of these securities could cause the estimated fair value of our fixed income securities portfolio and our earnings to decline and the default rate of the fixed income securities in our investment portfolio to increase. A ratings downgrade affecting issuers or guarantors of securities in our investment portfolio, or similar trends that could worsen the credit quality of such issuers, or guarantors could also have a similar effect. Similarly, a ratings downgrade affecting a security we hold could indicate the credit quality of that security has deteriorated and could increase the capital we must hold to support that security to maintain our RBC ratio. See “—A decrease in the RBC ratio (as a result of a reduction in statutory surplus and/or increase in risk-based capital (“RBC”) requirements) of our insurance subsidiaries could result in increased scrutiny by insurance regulators and rating agencies and have a material adverse effect on our business, results of operations and financial condition.” We are also subject to the risk that cash flows resulting from the payments on pools of mortgages that serve as collateral underlying the mortgage-backed securities we own may differ from our expectations in timing or size. Cash flow variability arising from an unexpected acceleration in mortgage prepayment behavior can be significant, and could cause a decline in the estimated fair value of certain “interest-only” securities within our mortgage-backed securities portfolio. Any event reducing the estimated fair value of these securities, other than on a temporary basis, could have a material adverse effect on our business, results of operations and financial condition.
We derive operating revenues from providing investment management and related services. Our revenues depend largely on the value and mix of AUM. Our investment management related revenues are derived primarily from fees based on a percentage of the value of AUM. Any decrease in the value or amount of our AUM because of market volatility or other factors negatively impacts our revenues and income. Global economic conditions, changes in the equity markets, currency exchange rates, interest rates, inflation rates, the yield curve, defaults by derivative counterparties and other factors that are difficult to predict affect the mix, market values and levels of our AUM. The funds we manage may be subject to an unanticipated large number of redemptions as a result of such events, causing the funds to sell securities they hold, possibly at a loss, or draw on any available lines of credit to obtain cash, or use securities held in the applicable fund, to settle these redemptions. We may, in our discretion, also provide financial support to a fund to enable it to maintain sufficient liquidity in such an event. Additionally, changing market conditions may cause a shift in our asset mix towards fixed-income products and a related decline in our revenue and income, as we generally derive higher fee revenues and income from equity products than from fixed-income products we manage. Any decrease in the level of our AUM resulting from price declines, interest rate volatility or uncertainty, increased redemptions or other factors could negatively impact our revenues and income.
-29-
Table of Contents
From time to time we invest our capital to seed a particular investment strategy or investment portfolio. We may also co-invest in funds or take an equity ownership interest in certain structured finance/investment vehicles that we manage for our customers. Any decrease in the value of such investments could negatively affect our revenues and income.
Our investment performance is critical to the success of our investment management and related services business, as well as to the profitability of our insurance, annuity and retirement products. Poor investment performance as compared to third-party benchmarks or competitor products could lead to a decrease in sales of investment products we manage and lead to redemptions from existing products, generally lowering the overall level of AUM and reducing the management fees we earn. We cannot assure you that past or present investment performance in the investment products we manage will be indicative of future performance. Any poor investment performance may negatively impact our revenues and income.
Some of our investments are relatively illiquid and are in asset classes that have been experiencing significant market valuation fluctuations.
We hold certain assets that may lack liquidity, such as privately placed fixed income securities, commercial mortgage loans, policy loans and limited partnership interests. These asset classes represented 28.4% of the carrying value of our total cash and invested assets as of December 31, 2013. If we require significant amounts of cash on short notice in excess of normal cash requirements or are required to post or return collateral in connection with our investment portfolio, derivatives transactions or securities lending activities, we may have difficulty selling these investments in a timely manner, be forced to sell them for less than we otherwise would have been able to realize, or both.
The reported values of our relatively illiquid types of investments do not necessarily reflect the current market price for the asset. If we were forced to sell certain of our assets in the current market, there can be no assurance that we would be able to sell them for the prices at which we have recorded them and we might be forced to sell them at significantly lower prices.
We invest a portion of our invested assets in investment funds, many of which make private equity investments. The amount and timing of income from such investment funds tends to be uneven as a result of the performance of the underlying investments, including private equity investments. The timing of distributions from the funds, which depends on particular events relating to the underlying investments, as well as the funds’ schedules for making distributions and their needs for cash, can be difficult to predict. As a result, the amount of income that we record from these investments can vary substantially from quarter to quarter. Recent equity and credit market volatility may reduce investment income for these types of investments.
Our CMO-B portfolio exposes us to market and behavior risks.
We manage a portfolio of various collateralized mortgage obligation (“CMO”) tranches in combination with financial derivatives as part of a proprietary strategy we refer to as “CMO-B,” as described under “Investments—CMO-B Portfolio”. As of December 31, 2013, our CMO-B portfolio had $3.4 billion in total assets, consisting of notional or principal securities backed by mortgages secured by single-family residential real estate, and including interest-only securities, principal-only securities, inverse-floating rate (principal) securities and inverse interest-only securities. The CMO-B portfolio is subject to a number of market and behavior risks, including interest rate risk and prepayment risk. Interest rate risk represents the potential for adverse changes in portfolio value resulting from changes in the general level of interest rates. Prepayment risk represents the potential for adverse changes in portfolio value resulting from changes in residential mortgage prepayment speed, which in turn depends on a number of factors, including conditions in both credit markets and housing markets. As of December 31, 2013, December 31, 2012 and December 31, 2011, approximately 38.3%, 33.1% and 32.8%, respectively, of the Company’s total CMO holdings were invested in those types of CMOs, such as interest-only or principal-only strips, which are subject to more prepayment and extension risk than traditional CMOs. In addition, government policy changes affecting residential housing and residential housing finance,
-30-
Table of Contents
such as government agency reform and government sponsored refinancing programs, and Federal Reserve Bank purchases of agency mortgage securities, or “QE3”, could alter prepayment behavior and result in adverse changes to portfolio values. While we actively monitor our exposure to these and other risks inherent in this strategy, we cannot assure you that our hedging and risk management strategies will be effective; any failure to manage these risks effectively could materially and adversely affect our results of operations and financial condition. In addition, although we believe our CMO-B portfolio has performed well for a number of years, and particularly well since the recent financial crisis, primarily due to persistently low levels of short-term interest rates and mortgage prepayments in an atmosphere of tightened housing-related credit availability, this portfolio may not continue to perform as well in the future. A rebound in home prices, the concern over further introduction of or changes to government policies aimed at altering payment behavior, and increased availability of housing-related credit in 2013 have combined to lower interest only (“IO”) and inverse IO valuations modestly in the twelve months ended December 31, 2013. To the extent these conditions persist in the coming quarters, we expect prepayment speeds may increase and the results of our CMO-B portfolio would likely underperform those of recent periods.
Defaults or delinquencies in our commercial mortgage loan portfolio may adversely affect our profitability.
The commercial mortgage loans we hold face both default and delinquency risk. We establish loan specific estimated impairments at the balance sheet date. These impairments are based on the excess carrying value of the loan over the present value of expected future cash flows discounted at the loan’s original effective interest rate, the estimated fair value of the loan’s collateral if the loan is in the process of foreclosure or otherwise collateral dependent, or the loan’s observable market price. We also establish valuation allowances for loan losses when, based on past experience, it is probable that a credit event has occurred and the amount of the loss can be reasonably estimated. These valuation allowances are based on loan risk characteristics, historical default rates and loss severities, real estate market fundamentals and outlook as well as other relevant factors. As of December 31, 2013, our commercial loan portfolio included $5.1 million (0.1%) of commercial loans that were 90 or more days past due, and no commercial mortgage loans were in the process of foreclosure. The performance of our commercial mortgage loan investments may fluctuate in the future. In addition, legislative proposals that would allow or require modifications to the terms of commercial mortgage loans could be enacted. We cannot predict whether these proposals will be adopted, or what impact, if any, such laws, if enacted, could have on our business or investments. An increase in the delinquency and default rate of our commercial mortgage loan portfolio could adversely impact our results of operations and financial condition.
Further, any geographic or sector concentration of our commercial mortgage loans may have adverse effects on our investment portfolios and consequently on our results of operations or financial condition. While we generally seek to mitigate the risk of sector concentration by having a broadly diversified portfolio, events or developments that have a negative effect on any particular geographic region or sector may have a greater adverse effect on the investment portfolios to the extent that the portfolios are concentrated, which could affect our results of operations and financial condition.
In addition, liability under environmental protection laws resulting from our commercial mortgage loan portfolio and real estate investments could affect our results of operations or financial condition. Under the laws of several states, contamination of a property may give rise to a lien on the property to secure recovery of the costs of cleanup. In some states, such a lien has priority over the lien of an existing mortgage against the property, which would impair our ability to foreclose on that property should the related loan be in default. In addition, under the laws of some states and under the federal Comprehensive Environmental Response, Compensation and Liability Act of 1980, we may be liable for costs of addressing releases or threatened releases of hazardous substances that require remedy at a property securing a mortgage loan held by us, regardless of whether or not the environmental damage or threat was caused by the obligor, which could harm our results of operations and financial condition. We also may face this liability after foreclosing on a property securing a mortgage loan held by us.
-31-
Table of Contents
Our operations are complex and a failure to properly perform services could have an adverse effect on our revenues and income.
Our operations include, among other things, retirement plan administration, policy administration, portfolio management, investment advice, retail and wholesale brokerage, fund administration, shareholder services, benefits processing and servicing, contract and sales and servicing, transfer agency, underwriting, distribution, custodial, trustee and other fiduciary services. In order to be competitive, we must properly perform our administrative and related responsibilities, including recordkeeping and accounting, regulatory compliance, security pricing, corporate actions, compliance with investment restrictions, daily net asset value computations, account reconciliations and required distributions to fund shareholders. Further, certain of our investment management subsidiaries may act as general partner for various investment partnerships, which may subject them to liability for the partnerships’ liabilities. If we fail to properly perform and monitor our operations, our business could suffer and our revenues and income could be adversely affected.
Our products and services are complex and are frequently sold through intermediaries, and a failure to properly perform services or the misrepresentation of our products or services could have an adverse effect on our revenues and income.
Many of our products and services are complex and are frequently sold through intermediaries. In particular, our insurance businesses are reliant on intermediaries to describe and explain their products to potential customers. The intentional or unintentional misrepresentation of our products and services in advertising materials or other external communications, or inappropriate activities by our personnel or an intermediary, could adversely affect our reputation and business prospects, as well as lead to potential regulatory actions or litigation.
Revenues, earnings and income from our investment management business operations could be adversely affected if the terms of our asset management agreements are significantly altered or the agreements are terminated.
Our revenues from our investment management business operations are dependent on fees earned under asset management and related services agreements that we have with the clients and funds we advise. Operating revenues for this segment were $607.7 million for the year ended December 31, 2013, $545.5 million for the year ended December 31, 2012 and $491.9 million for the year ended December 31, 2011, and could be adversely affected if these agreements are altered significantly or terminated. The decline in revenue that might result from alteration or termination of our asset management services agreements could have a material adverse impact on our results of operations or financial condition. Operating earnings before income taxes was $178.1 million for the year ended December 31, 2013, $134.5 million for the year ended December 31, 2012 and $87.5 million for the year ended December 31, 2011. In addition, under certain laws, most notably the Investment Company Act of 1940, as amended (the “Investment Company Act”) and the Investment Advisers Act of 1940, as amended (the “Investment Advisers Act”), advisory contracts may require approval or consent from clients or fund shareholders in the event of an assignment of the contract or a change in control of the investment adviser. Were a transaction to result in an assignment or change in control, the inability to obtain consent or approval from clients or shareholders of mutual funds or other investment funds could result in a significant reduction in advisory fees.
The valuation of many of our financial instruments includes methodologies, estimations and assumptions that are subject to differing interpretations and could result in changes to investment valuations that may materially and adversely affect our results of operations and financial condition.
The following financial instruments are carried at fair value in our financial statements: fixed income securities, equity securities, derivatives, embedded derivatives, assets and liabilities related to consolidated investment entities, and separate account assets. We have categorized these instruments into a three-level hierarchy, based on the priority of the inputs to the respective valuation technique. The fair value hierarchy gives the highest priority to quoted prices in active markets for identical assets or liabilities (Level 1) and the lowest
-32-
Table of Contents
priority to unobservable inputs (Level 3), while quoted prices in markets that are not active or valuation techniques requiring inputs that are observable for substantially the full term of the asset or liability are Level 2.
Factors considered in estimating fair values of securities, and derivatives and embedded derivatives related to our securities include coupon rate, maturity, principal paydown including prepayments, estimated duration, call provisions, sinking fund requirements, credit rating, industry sector of the issuer and quoted market prices of comparable securities. Factors considered in estimating the fair values of embedded derivatives and derivatives related to product guarantees (collectively, “guaranteed benefit derivatives”) include risk-free interest rates, long-term equity implied volatility, interest rate implied volatility, correlations among mutual funds associated with variable annuity contracts, correlations between interest rates and equity funds and actuarial assumptions such as mortality rates, lapse rates and benefit utilization, as well as the amount and timing of policyholder deposits and partial withdrawals. The impact of our risk of nonperformance is also reflected in the estimated fair value of guaranteed benefit derivatives. In many situations, inputs used to measure the fair value of an asset or liability may fall into different levels of the fair value hierarchy. In these situations, we will determine the level in which the fair value falls based upon the lowest level input that is significant to the determination of the fair value.
The determinations of fair values are made at a specific point in time, based on available market information and judgments about financial instruments, including estimates of the timing and amounts of expected future cash flows and the credit standing of the issuer or counterparty. The use of different methodologies and assumptions may have a material effect on the estimated fair value amounts.
During periods of market disruption, including periods of rapidly changing credit spreads or illiquidity, it has been and will likely continue to be difficult to value certain of our securities, such as certain mortgage-backed securities, if trading becomes less frequent and/or market data becomes less observable. There may be certain asset classes that were in active markets with significant observable data that could become illiquid in a difficult financial environment. In such cases, more securities may fall to Level 3 and thus require more subjectivity and management judgment in determining fair value. As such, valuations may include inputs and assumptions that are less observable or require greater estimation, thereby resulting in values that may differ materially from the value at which the investments may be ultimately sold. Further, rapidly changing and unprecedented credit and equity market conditions could materially impact the valuation of securities as reported within the financial statements, and the period-to-period changes in value could vary significantly. Decreases in value could have a material adverse effect on our results of operations and financial condition. As of December 31, 2013, 6.6%, 92.3% and 1.1% of our available-for-sale securities were considered to be Level 1, 2 and 3, respectively.
The determination of the amount of allowances and impairments taken on our investments is subjective and could materially and adversely impact our results of operations or financial condition. Gross unrealized losses may be realized or result in future impairments, resulting in a reduction in our net income (loss).
We evaluate investment securities held by us for impairment on a quarterly basis. This review is subjective and requires a high degree of judgment. For fixed income securities held, an impairment loss is recognized if the fair value of the debt security is less than the carrying value and we no longer have the intent to hold the debt security; if it is more likely than not that we will be required to sell the debt security before recovery of the amortized cost basis; or if a credit loss has occurred.
When we do not intend to sell a security in an unrealized loss position, potential credit related other-than-temporary impairments (“OTTI”) are considered using a variety of factors, including the length of time and extent to which the fair value has been less than cost, adverse conditions specifically related to the industry, geographic area in which the issuer conducts business, financial condition of the issuer or underlying collateral of a security, payment structure of the security, changes in credit rating of the security by the rating agencies, volatility of the fair value changes and other events that adversely affect the issuer. In addition, we take into account relevant broad market and economic data in making impairment decisions.
-33-
Table of Contents
As part of the impairment review process, we utilize a variety of assumptions and estimates to make a judgment on how fixed income securities will perform in the future. It is possible that securities in our fixed income portfolio will perform worse than our expectations. There is an ongoing risk that further declines in fair value may occur and additional OTTI may be recorded in future periods, which could materially and adversely affect our results of operations and financial condition. Furthermore, historical trends may not be indicative of future impairments or allowances.
Fixed income and equity securities classified as available-for-sale are reported at their estimated fair value. Unrealized gains or losses on available-for-sale securities are recognized as a component of other comprehensive income (loss) and are therefore excluded from net income (loss). The accumulated change in estimated fair value of these available-for-sale securities is recognized in net income (loss) when the gain or loss is realized upon the sale of the security or in the event that the decline in estimated fair value is determined to be other-than-temporary and an impairment charge to earnings is taken. Such realized losses or impairments may have a material adverse effect on our net income (loss) in a particular interim or annual period. For example, we recorded OTTI of $35.7 million, $55.1 million, and $502.7 million in net realized capital losses for the years ended December 31, 2013, 2012, and 2011, respectively.
Our participation in a securities lending program and a repurchase program subjects us to potential liquidity and other risks.
We engage in a securities lending program whereby certain securities from our portfolio are loaned to other institutions for short periods of time. Initial collateral, primarily cash, is required at a rate of 102% of the market value of the loaned securities. For certain transactions, a lending agent may be used and the agent may retain some or all of the collateral deposited by the borrower and transfer the remaining collateral to us. Collateral retained by the agent is invested in liquid assets on our behalf. The market value of the loaned securities is monitored on a daily basis with additional collateral obtained or refunded as the market value of the loaned securities fluctuates.
We also participate in a repurchase program whereby we sell fixed income securities to a third party, primarily major brokerage firms or commercial banks, with a concurrent agreement to repurchase those same securities at a determined future date. Our policy requires that, at all times during the term of the repurchase agreements, cash or other types of collateral types provided is sufficient to allow the counterparty to fund substantially all of the cost of purchasing replacement assets. The cash proceeds received under the repurchase program are typically invested in fixed income securities and cannot be returned prior to the scheduled repurchase date; however, market conditions on the repurchase date may limit our ability to enter into new agreements. The repurchase of securities or our inability to enter into new repurchase agreements would require us to return the cash collateral proceeds associated with such transactions on the repurchase or maturity date.
For both securities lending and repurchase transactions, in some cases, the maturity of the securities held as invested collateral (i.e., securities that we have purchased with cash collateral received) may exceed the term of the related securities on loan and the estimated fair value may fall below the amount of cash received as collateral and invested. If we are required to return significant amounts of cash collateral on short notice and we are forced to sell securities to meet the return obligation, we may have difficulty selling such collateral that is invested in securities in a timely manner, be forced to sell securities in a volatile or illiquid market for less than we otherwise would have been able to realize under normal market conditions, or both. In addition, under adverse capital market and economic conditions, liquidity may broadly deteriorate, which would further restrict our ability to sell securities. If we decrease the amount of our securities lending and repurchase activities over time, the amount of net investment income generated by these activities will also likely decline. See “Management’s Discussion and Analysis of Financial Condition and Results of Operations—Liquidity and Capital Resources—Securities Lending”.
-34-
Table of Contents
Differences between actual claims experience and reserving assumptions may adversely affect our results of operations or financial condition.
We establish and hold reserves to pay future policy benefits and claims. Our reserves do not represent an exact calculation of liability, but rather are actuarial or statistical estimates based on data and models that include many assumptions and projections, which are inherently uncertain and involve the exercise of significant judgment, including assumptions as to the levels and/or timing of receipt or payment of premiums, benefits, claims, expenses, interest credits, investment results (including equity market returns), retirement, mortality, morbidity and persistency. We periodically review the adequacy of reserves and the underlying assumptions. We cannot, however, determine with precision the amounts that we will pay for, or the timing of payment of, actual benefits, claims and expenses or whether the assets supporting our policy liabilities, together with future premiums, will grow to the level assumed prior to payment of benefits or claims. If actual experience differs significantly from assumptions or estimates, reserves may not be adequate. If we conclude that our reserves, together with future premiums, are insufficient to cover future policy benefits and claims, we would be required to increase our reserves and incur income statement charges for the period in which we make the determination, which could materially and adversely affect our results of operations and financial condition.
We may face significant losses if mortality rates, morbidity rates, persistency rates or other underwriting assumptions differ significantly from our pricing expectations.
We set prices for many of our insurance and annuity products based upon expected claims and payment patterns, using assumptions for mortality rates, or likelihood of death, and morbidity rates, or likelihood of sickness, of our policyholders. In addition to the potential effect of natural or man-made disasters, significant changes in mortality or morbidity could emerge gradually over time due to changes in the natural environment, the health habits of the insured population, technologies and treatments for disease or disability, the economic environment, or other factors. The long-term profitability of our insurance and annuity products depends upon how our actual mortality rates, and to a lesser extent actual morbidity rates, compare to our pricing assumptions. In addition, prolonged or severe adverse mortality or morbidity experience could result in increased reinsurance costs, and ultimately, reinsurers might not offer coverage at all. If we are unable to maintain our current level of reinsurance or purchase new reinsurance protection in amounts that we consider sufficient, we would have to accept an increase in our net risk exposures, revise our pricing to reflect higher reinsurance premiums, or otherwise modify our product offering.
Pricing of our insurance and annuity products is also based in part upon expected persistency of these products, which is the probability that a policy will remain in force from one period to the next. Persistency of our annuity products may be significantly and adversely impacted by the increasing value of guaranteed minimum benefits contained in many of our variable annuity products due to poor equity market performance or extended periods of low interest rates as well as other factors. The minimum interest rate guarantees in our fixed annuities may also be more valuable in extended periods of low interest rates. Persistency could be adversely affected generally by developments adversely affecting customer perception of us. Results may also vary based on differences between actual and expected premium deposits and withdrawals for these products. Many of our deferred annuity products also contain optional benefits that may be exercised at certain points within a contract. We set prices for such products using assumptions for the rate of election of deferred annuity living benefits and other optional benefits offered to our contract owners. The profitability of our deferred annuity products may be less than expected, depending upon how actual contract owner decisions to elect or delay the utilization of such benefits compare to our pricing assumptions. The development of a secondary market for life insurance, including stranger-owned life insurance, life settlements or “viaticals” and investor-owned life insurance, and the potential development of third-party investor strategies in the annuities business, could also adversely affect the profitability of existing business and our pricing assumptions for new business. Actual persistency that is lower than our persistency assumptions could have an adverse effect on profitability, especially in the early years of a policy, primarily because we would be required to accelerate the amortization of expenses we defer in connection with the acquisition of the policy. Actual persistency that is higher than our persistency assumptions could have an adverse effect on profitability in the later years of a block of business because the anticipated claims
-35-
Table of Contents
experience is higher in these later years. If actual persistency is significantly different from that assumed in our current reserving assumptions, our reserves for future policy benefits may prove to be inadequate. Although some of our products permit us to increase premiums or adjust other charges and credits during the life of the policy, the adjustments permitted under the terms of the policies may not be sufficient to maintain profitability. Many of our products, however, do not permit us to increase premiums or adjust charges and credits during the life of the policy or during the initial guarantee term of the policy. Even if permitted under the policy, we may not be able or willing to raise premiums or adjust other charges for regulatory or competitive reasons.
Pricing of our products is also based on long-term assumptions regarding interest rates, investment returns and operating costs. Management establishes target returns for each product based upon these factors, the other underwriting assumptions noted above and the average amount of regulatory and rating agency capital that we must hold to support in-force contracts. We monitor and manage pricing and sales to achieve target returns. Profitability from new business emerges over a period of years, depending on the nature and life of the product, and is subject to variability as actual results may differ from pricing assumptions. Our profitability depends on multiple factors, including the comparison of actual mortality, morbidity and persistency rates and policyholder behavior to our assumptions; the adequacy of investment margins; our management of market and credit risks associated with investments; our ability to maintain premiums and contract charges at a level adequate to cover mortality, benefits and contract administration expenses; the adequacy of contract charges and availability of revenue from providers of investment options offered in variable contracts to cover the cost of product features and other expenses; and management of operating costs and expenses.
Unfavorable developments in interest rates, credit spreads and policyholder behavior can result in adverse financial consequences related to our stable value products, and our hedge program and risk mitigation features may not successfully offset these consequences.
We offer stable value products primarily as a fixed rate, liquid asset allocation option for employees of our plan sponsor customers within the defined contribution funding plans offered by our Retirement business. These products are designed to provide a guaranteed annual credited rate (currently between zero and three percent) on the invested assets in addition to enabling participants the right to withdraw and transfer funds at book value.
The sensitivity of our statutory reserves and surplus established for the stable value products to changes in interest rates, credit spreads and policyholder behavior will vary depending on the magnitude of these changes, as well as on the book value of assets, the market value of assets, the guaranteed credited rates available to customers and other product features. Realization or re-measurement of these risks may result in an increase in the reserves for stable value products, and could materially and adversely affect our financial position or results of operations. In particular, in extended low interest rate environments, we bear exposure to the risk that reserves must be added to fund book value withdrawals and transfers when guaranteed annual credited rates exceed the earned rate on invested assets. In a rising interest rate environment, we are exposed to the risk of financial disintermediation through a potential increase in the level of book value withdrawals.
To the extent that our hedge program and other risk mitigating features do not operate as intended or are not fully effective, we remain exposed to the risks described above.
We may be required to accelerate the amortization of DAC, deferred sales inducements (“DSI”) and/or VOBA, any of which could adversely affect our results of operations or financial condition.
DAC represents the incremental costs related directly to the acquisition of new and renewal insurance and annuity contracts. DSI represents amounts that are credited to a policyholder’s account balance as an inducement to purchase a contract. VOBA represents the present value of estimated cash flows embedded in acquired business, plus renewal commissions and certain other costs on such acquired business. Capitalized costs associated with DAC, DSI and VOBA are amortized in proportion to actual and estimated gross profits, gross premiums or gross revenues depending on the type of contract. Management, on an ongoing basis, tests the DAC, DSI and VOBA recorded on our balance sheets to determine if these amounts are recoverable under current
-36-
Table of Contents
assumptions. In addition, management regularly reviews the estimates and assumptions underlying DAC, DSI and VOBA. The projection of estimated gross profits, gross premiums or gross revenues requires the use of certain assumptions, principally related to separate account fund returns in excess of amounts credited to policyholders, policyholder behavior such as surrender and lapse rates, interest margin, expense margin, mortality, future impairments and hedging costs. Estimating future gross profits, gross premiums or gross revenues is a complex process requiring considerable judgment and the forecasting of events well into the future. If these assumptions prove to be inaccurate, if an estimation technique used to estimate future gross profits, gross premiums or gross revenues is changed, or if significant or sustained equity market declines occur and/or persist, we could be required to accelerate the amortization of DAC, DSI and VOBA, which would result in a charge to earnings. Such adjustments could have a material adverse effect on our results of operations and financial condition.
Reinsurance subjects us to the credit risk of reinsurers and may not be available, affordable or adequate to protect us against losses.
We cede life insurance policies and annuity contracts or certain risks related to life insurance policies and annuity contracts to other insurance companies using various forms of reinsurance, including coinsurance, modified coinsurance, funds withheld, monthly renewable term and yearly renewable term. However, we remain liable to the underlying policyholders, even if the reinsurer defaults on its obligations with respect to the ceded business. If a reinsurer fails to meet its obligations under the reinsurance contract, we will be forced to cover the claims on the reinsured policies. In addition, a reinsurer insolvency may cause us to lose our reserve credits on the ceded business, in which case we would be required to establish additional statutory reserves.
In addition, if a reinsurer does not have accredited reinsurer status, or if a currently accredited reinsurer loses that status, in any state where we are licensed to do business, we are not entitled to take credit for reinsurance in that state if the reinsurer does not post sufficient qualifying collateral (either qualifying assets in a qualifying trust or qualifying LOCs). In this event, we would be required to establish additional statutory reserves. Similarly, the credit for reinsurance taken by our insurance subsidiaries under reinsurance agreements with affiliated and unaffiliated non-accredited reinsurers is, under certain conditions, dependent upon the non-accredited reinsurer’s ability to obtain and provide sufficient qualifying assets in a qualifying trust or qualifying LOCs issued by qualifying lending banks. LOCs, when available, continue to be very expensive in the current economic environment. Because of this, some of our affiliated reinsurers have established and will continue to pursue alternative sources for qualifying reinsurance collateral. If these steps are unsuccessful, or if unaffiliated non-accredited reinsurers that have reinsured business from our insurance subsidiaries are unsuccessful in obtaining sources of qualifying reinsurance collateral, our insurance subsidiaries might not be able to obtain full statutory reserve credit. Loss of reserve credit by an insurance subsidiary would require it to establish additional statutory reserves and would result in a decrease in the level of its capital, which could have a material adverse effect on our profitability, results of operations and financial condition.
We had $176.6 million and $385.0 million of unsecured unaffiliated reinsurance recoverable balances as of December 31, 2013 and 2012, respectively. These reinsurance recoverable balances are periodically assessed for uncollectability and there were no significant allowances for uncollectible reinsurance as of December 31, 2013 and December 31, 2012.
The collectability of reinsurance recoverables is subject to uncertainty arising from a number of factors, including whether the insured losses meet the qualifying conditions of the reinsurance contract, whether reinsurers or their affiliates have the financial capacity and willingness to make payments under the terms of the reinsurance contract, and the degree to which our reinsurance balances are secured by sufficient qualifying assets in qualifying trusts or qualifying LOCs issued by qualifying lender banks. Although a substantial portion of our reinsurance exposure is secured by assets held in trusts or LOCs, the inability to collect a material recovery from a reinsurer could have a material adverse effect on our profitability, results of operation and financial condition.
The premium rates and other fees that we charge are based, in part, on the assumption that reinsurance will be available at a certain cost. Some of our reinsurance contracts contain provisions that limit the reinsurer’s
-37-
Table of Contents
ability to increase rates on in-force business; however, some do not. If a reinsurer raises the rates that it charges on a block of in-force business, in some instances, we will not be able to pass the increased costs onto our customers and our profitability will be negatively impacted. Additionally, such a rate increase could result in our recapturing of the business, which may result in a need to maintain additional reserves, reduce reinsurance receivables and expose us to greater risks. If reinsurers raise the rates that they charge on new business, we may be forced to raise the premiums that we charge, which could have a negative impact on our competitive position.
A decrease in the RBC ratio (as a result of a reduction in statutory surplus and/or increase in RBC requirements) of our insurance subsidiaries could result in increased scrutiny by insurance regulators and rating agencies and have a material adverse effect on our business, results of operations and financial condition.
The NAIC has established regulations that provide minimum capitalization requirements based on RBC formulas for insurance companies. The RBC formula for life insurance companies establishes capital requirements relating to asset, insurance, interest rate and business risks, including equity, interest rate and expense recovery risks associated with variable annuities and group annuities that contain guaranteed minimum death and living benefits. Each of our insurance subsidiaries is subject to RBC standards and/or other minimum statutory capital and surplus requirements imposed under the laws of its respective jurisdiction of domicile.
In any particular year, statutory surplus amounts and RBC ratios may increase or decrease depending on a variety of factors, including the amount of statutory income or losses generated by the insurance subsidiary (which itself is sensitive to equity market and credit market conditions), the amount of additional capital such insurer must hold to support business growth, changes in equity market levels, the value and credit ratings of certain fixed-income and equity securities in its investment portfolio, the value of certain derivative instruments that do not receive hedge accounting and changes in interest rates, as well as changes to the RBC formulas and the interpretation of the NAIC’s instructions with respect to RBC calculation methodologies. Many of these factors are outside of our control. Our financial strength and credit ratings are significantly influenced by statutory surplus amounts and RBC ratios. In addition, rating agencies may implement changes to their own internal models, which differ from the RBC capital model, that have the effect of increasing or decreasing the amount of statutory capital we or our insurance subsidiaries should hold relative to the rating agencies’ expectations. In extreme scenarios of equity market declines, sustained periods of low interest rates, rapidly rising interest rates or credit spread widening, the amount of additional statutory reserves that an insurance subsidiary is required to hold for certain types of GICs and variable annuity guarantees and stable value contracts may increase at a greater than linear rate. This increase in reserves would decrease the statutory surplus available for use in calculating the subsidiary’s RBC ratios. To the extent that an insurance subsidiary’s RBC ratios are deemed to be insufficient, we may seek to take actions either to increase the capitalization of the insurer or to reduce the capitalization requirements. If we were unable to accomplish such actions, the rating agencies may view this as a reason for a ratings downgrade.
The failure of any of our insurance subsidiaries to meet its applicable RBC requirements or minimum capital and surplus requirements could subject it to further examination or corrective action imposed by insurance regulators, including limitations on its ability to write additional business, supervision by regulators or seizure or liquidation. Any corrective action imposed could have a material adverse effect on our business, results of operations and financial condition. A decline in RBC ratios, whether or not it results in a failure to meet applicable RBC requirements, may still limit the ability of an insurance subsidiary to make dividends or distributions to us, could result in a loss of customers or new business, and could be a factor in causing ratings agencies to downgrade the insurer’s financial strength ratings, each of which could have a material adverse effect on our business, results of operations and financial condition.
Our statutory reserve financings may be subject to cost increases and new financings may be subject to limited market capacity.
We have financing facilities in place for our previously written business and have remaining capacity in existing facilities to support writings through the end of 2014 or later. However certain of these facilities mature
-38-
Table of Contents
prior to the run off of the reserve liability so that we are subject to cost increases or unavailability of capacity upon the refinancing. If we are unable to refinance such facilities, or if the cost of such facilities were to significantly increase, we would be required to increase statutory reserves or incur higher operating or tax costs. For more details, see “Management’s Discussion and Analysis of Financial Condition and Results of Operations—Liquidity and Capital Resources—Credit Facilities and Subsidiary Credit Support Arrangements.”
A significant portion of our institutional funding originates from two Federal Home Loan Banks, which subjects us to liquidity risks associated with sourcing a large concentration of our funding from two counterparties.
A significant portion of our institutional funding agreements originates from the Federal Home Loan Bank of Topeka and the Federal Home Loan Bank of Des Moines (each an “FHLB”), which primarily serve as sources of funding for our Closed Block Institutional Spread Products segment. As of December 31, 2013 and 2012, we had issued $1.8 billion and $2.6 billion, respectively, of non-putable funding agreements and obtained a $265 million LOC in exchange for eligible collateral in the form of cash, mortgage backed securities and U.S. Treasury securities. Should the FHLBs choose to change their definition of eligible collateral, or if the market value of the pledged collateral decreases in value due to changes in interest rates or credit ratings, we may be required to post additional amounts of collateral in the form of cash or other eligible collateral. Additionally, we may be required to find other sources to replace this funding if we lose access to FHLB funding. This could occur if our creditworthiness falls below either of the FHLB’s requirements or if legislative or other political actions cause changes to the FHLBs’ mandate or to the eligibility of life insurance companies to be members of the FHLB system.
Any failure to protect the confidentiality of customer information could adversely affect our reputation and have a material adverse effect on our business, financial condition and results of operation.
Our businesses and relationships with customers are dependent upon our ability to maintain the confidentiality of our and our customers’ trade secrets and confidential information (including customer transactional data and personal data about our employees, our customers and the employees and customers of our customers). Pursuant to federal laws, various federal regulatory and law enforcement agencies have established rules protecting the privacy and security of personal information. In addition, most states have enacted laws, which vary significantly from jurisdiction to jurisdiction, to safeguard the privacy and security of personal information. Certain of our employees and contractors and many representatives of our broker-dealer subsidiaries have access to and routinely process personal information of customers through a variety of media, including the internet and software applications. We rely on various internal processes and controls to protect the confidentiality of customer information that is accessible to, or in the possession of, us, our employees, contractors and sales representatives. It is possible that an employee, contractor or sales representative could, intentionally or unintentionally, disclose or misappropriate confidential customer information. If we fail to maintain adequate internal controls, including any failure to implement newly-required additional controls, or if our employees, contractors or sales representatives fail to comply with our policies and procedures, misappropriation or intentional or unintentional inappropriate disclosure or misuse of customer information could occur. Such internal control inadequacies or non-compliance could materially damage our reputation, result in regulatory action or lead to civil or criminal penalties, which, in turn, could have a material adverse effect on our business, results of operations and financial condition.
Changes in accounting standards could adversely impact our reported results of operations and our reported financial condition.
Our financial statements are subject to the application of U.S. GAAP, which is periodically revised or expanded. Accordingly, from time to time we are required to adopt new or revised accounting standards issued by recognized authoritative bodies, including the Financial Accounting Standards Board (“FASB”). For example, the adoption of the provision of Accounting Standards Update (“ASU”) 2010-26, Financial Services: Insurance (Accounting Standards Codification™ (“ASC”) Topic 944): “Accounting for Costs Associated with Acquiring or
-39-
Table of Contents
Renewing Insurance Contracts” decreased our retained earnings by $1.2 billion as of January 1, 2011. It is possible that future accounting standards we are required to adopt could change the current accounting treatment that we apply to our consolidated financial statements and that such changes could have a material adverse effect on our results of operations and financial condition.
In addition, FASB is working on several projects with the International Accounting Standards Board, which could result in significant changes as U.S. GAAP converges with IFRS, including how we account for our insurance policies, annuity contracts and financial instruments and how our financial statements are presented. Furthermore, the U.S. Securities and Exchange Commission (“SEC”) is considering whether and how to incorporate IFRS into the U.S. financial reporting system. The changes to U.S. GAAP and ultimate conversion to IFRS, if undertaken, could affect the way we account for and report significant areas of our business, could impose special demands on us in the areas of governance, employee training, internal controls and disclosure and will likely affect how we manage our business.
We may be required to establish an additional valuation allowance against the deferred income tax asset if our business does not generate sufficient taxable income or if our tax planning strategies are modified. Increases in the deferred tax valuation allowance could have a material adverse effect on results of operations and financial condition.
Deferred income tax represents the tax effect of the differences between the book and tax basis of assets and liabilities. Deferred tax assets represent the tax benefit of future deductible temporary differences, operating loss carryforwards and tax credits carryforward. We periodically evaluate and test our ability to realize our deferred tax assets. Deferred tax assets are reduced by a valuation allowance if, based on the weight of evidence, it is more likely than not that some portion, or all, of the deferred tax assets will not be realized. In assessing the more likely than not criteria, we consider future taxable income as well as prudent tax planning strategies. Future facts, circumstances, tax law changes and FASB developments may result in an increase in the valuation allowance. An increase in the valuation allowance could have a material adverse effect on the Company’s results of operations and financial condition.
As of December 31, 2013, we have recognized deferred tax assets based on tax planning related to unrealized gains on investment assets. To the extent these unrealized gains decrease, the tax benefit will be reduced by increasing the tax valuation allowance. For example, if interest rates increase, the amount of the unrealized gains will, most likely, decrease, with all other things constant. The decrease in the deferred tax asset may be recorded as a tax expense in tax on continuing operations based on the intra period tax allocation rules described in ASC Topic 740, “Income Taxes”.
We expect that our ability to use beneficial U.S. tax attributes will be subject to limitations following the completion of this offering and the Direct Share Buyback.
Section 382 (“Section 382”) and Section 383 of the U.S. Internal Revenue Code of 1986, as amended (the “Internal Revenue Code”) operate as anti-abuse rules, the general purpose of which is to prevent trafficking in tax losses and credits, but which can apply without regard to whether a “loss trafficking” transaction occurs or is intended. These rules are triggered when an “ownership change”—generally defined as when the ownership of a company, or its parent, changes by more than 50% (measured by value) on a cumulative basis in any three year period—occurs (“Section 382 event”). If triggered, the amount of the taxable income for any post-change year which may be offset by a pre-change loss is subject to an annual limitation. Generally speaking, this limitation is derived by multiplying the fair market value of the stock of the taxpayer immediately before the date of the ownership change by the applicable federal long-term tax-exempt rate. In addition, to the extent that a company has a net unrealized built-in loss or deduction at the time of an ownership change, Sections 382 and 383 limit the utilization of any such loss or deduction which is realized and recognized during the five-year period following the ownership change.
Under the current base case for ING Group’s divestiture of its remaining ownership stake in the Company, including the effects of this offering, we believe that an ownership change will occur upon completion of this
-40-
Table of Contents
offering and the Direct Share Buyback. As discussed in “Summary—ING Group Restructuring Plan with European Commission,” ING Group is required, under the terms of the 2012 Amended Restructuring Plan, to fully divest its ownership of the Company by the end of 2016. Depending on the size and timing of this offering, the Direct Share Buyback, the Share Repurchase Program and of future offerings, the Company may be subject to a second Section 382 event as ING Group completes its divestment as discussed in “Summary—ING Group Restructuring Plan with European Commission”. Although we are unaware of any specific adverse impact from such an event, a second Section 382 event could impose additional limitations on the use of then existing realized and built-in losses and other tax attributes and may have a material adverse effect on the Company’s tax expense and equity position.
In addition, in November 2008, ING Group issued €10 billion of core Tier 1 securities to the Dutch State in connection with a capital infusion that would need to be taken into account for purposes of determining if an ownership change has occurred. ING Group redeemed approximately half (€5 billion) of these securities in December 2009 (and issued new shares to the public at that time); an additional 20% (€2 billion) in May 2011; 7.5% (€0.75 billion) in November 2012; and 7.5% (€0.75 billion) in November 2013. As part of the 2012 Amended Restructuring Plan, ING Group has committed to repay the remaining €1.5 billion of Core Tier I securities, plus a 50% premium in two tranches in the next two years. Based on the current repayment schedule, the two tranches are expected to be repaid in March 2014 and May 2015. The redemption by ING Group of an additional amount of these securities or other transfers of securities may, depending on the facts and circumstances, trigger an ownership change, as described above.
Under U.S. GAAP, as of December 31, 2013, our tax attributes included a valuation allowance of $2.8 billion. We are uncertain as to the ultimate financial impact of an ownership change. Using amounts available at December 31, 2013, we estimate that the deferred tax asset potentially subject to an additional tax valuation allowance is $315 million to $350 million (mainly as a result of built-in losses). Such an additional tax valuation allowance may be recorded as a tax expense in tax on continuing operations, which could change following the final Section 382 calculations. The actual impact on the valuation allowance is dependent mainly on the level of unrealized capital gains and losses at the time of the ownership change, the calculated Section 382 limitation, the estimated reversal pattern of capital losses otherwise supported by tax planning strategies, the estimated reversal pattern of unrealized capital gains comprising such strategies, the estimated reversal pattern of unrealized built-in capital losses subject to the limitation and the level of the valuation allowance otherwise held prior to the Section 382 event.
Under statutory accounting, a Section 382 event could reduce the admitted deferred tax asset by $39 million if measured as of December 31, 2013. This amount could change following the final Section 382 calculations. The reduction in the admitted deferred tax asset could adversely impact our insurance company subsidiaries’ ability to pay dividends or other distributions (directly or indirectly) to ING U.S., Inc. This in turn could negatively impact our ability to pay dividends to our stockholders and to service our debt. The actual impact is dependent mainly on the level of unrealized gains and losses at the time of the ownership change and the calculated Section 382 limitation.
Using the estimated Section 382 value of the Company based on a share price of $35.15 per share as of December 31, 2013 and other information available as of December 31, 2013, we estimate that it is unlikely that the deferred tax asset, the tax valuation allowance or the admitted deferred tax asset will change as a result of a Section 382 event.
Numerous aspects of the application of Section 382 are subject to potential challenge by the U.S. Internal Revenue Service (“IRS”). Among these are our calculation of the value of the Company at the time of an ownership change and our calculations of the losses and deductions which may be subject to the recognized built in loss rules. If the IRS were to successfully challenge these calculations, our ability to obtain tax benefits from existing and future losses and deductions could be adversely affected.
-41-
Table of Contents
We expect that the provisions of our amended and restated certificate of incorporation designed to avoid triggering the Section 382 limitation prior to the time when ING Group’s divestment of the Company would otherwise trigger the limitation will cease to be operative following this offering and the Direct Share Buyback. See “Description of Capital Stock—Ownership Limitations.”
Our business may be negatively affected by adverse publicity or increased governmental and regulatory actions with respect to us, other well-known companies or the financial services industry in general.
Governmental scrutiny with respect to matters relating to compensation and other business practices in the financial services industry has increased dramatically in the past several years and has resulted in more aggressive and intense regulatory supervision and the application and enforcement of more stringent standards. The recent financial crisis and the current political and public sentiment regarding financial institutions has resulted in a significant amount of adverse press coverage, as well as adverse statements or charges by regulators and elected officials. Press coverage and other public statements that assert some form of wrongdoing, regardless of the factual basis for the assertions being made, could result in some type of inquiry or investigation by regulators, legislators and/or law enforcement officials or in lawsuits. Responding to these inquiries, investigations and lawsuits, regardless of the ultimate outcome of the proceeding, is time-consuming and expensive and can divert the time and effort of our senior management from its business. Future legislation or regulation or governmental views on compensation may result in us altering compensation practices in ways that could adversely affect our ability to attract and retain talented employees. Adverse publicity, governmental scrutiny, pending or future investigations by regulators or law enforcement agencies and/or legal proceedings involving us or our affiliates, including ING Group, can also have a negative impact on our reputation and on the morale and performance of employees, and on business retention and new sales, which could adversely affect our businesses and results of operations.
Litigation may adversely affect our profitability and financial condition.
We are, and may be in the future, subject to legal actions in the ordinary course of insurance, investment management and other business operations. Some of these legal proceedings may be brought on behalf of a class. Plaintiffs may seek large or indeterminate amounts of damage, including compensatory, liquidated, treble and/or punitive damages. Our reserves for litigation may prove to be inadequate and insurance coverage may not be available or may be declined for certain matters. It is possible that our results of operations or cash flow in a particular interim or annual period could be materially affected by an ultimate unfavorable resolution of pending litigation depending, in part, upon the results of operations or cash flow for such period. Given the large or indeterminate amounts sometimes sought, and the inherent unpredictability of litigation, it is also possible that in certain cases an ultimate unfavorable resolution of one or more pending litigation matters could have a material adverse effect on our financial condition.
A loss of, or significant change in, key product distribution relationships could materially affect sales.
We distribute certain products under agreements with affiliated distributors and other members of the financial services industry that are not affiliated with us. We compete with other financial institutions to attract and retain commercial relationships in each of these channels, and our success in competing for sales through these distribution intermediaries depends upon factors such as the amount of sales commissions and fees we pay, the breadth of our product offerings, the strength of our brand, our perceived stability and financial strength ratings, and the marketing and services we provide to, and the strength of the relationships we maintain with, individual distributors. An interruption or significant change in certain key relationships could materially affect our ability to market our products and could have a material adverse effect on our business, operating results and financial condition. Distributors may elect to alter, reduce or terminate their distribution relationships with us, including for such reasons as changes in our distribution strategy, adverse developments in our business, adverse rating agency actions or concerns about market-related risks. Alternatively, we may terminate one or more distribution agreements due to, for example, a loss of confidence in, or a change in control of, one of the distributors, which could reduce sales.
-42-
Table of Contents
We are also at risk that key distribution partners may merge or change their business models in ways that affect how our products are sold, either in response to changing business priorities or as a result of shifts in regulatory supervision or potential changes in state and federal laws and regulations regarding standards of conduct applicable to distributors when providing investment advice to retail and other customers.
The occurrence of natural or man-made disasters may adversely affect our results of operations and financial condition.
We are exposed to various risks arising from natural disasters, including hurricanes, climate change, floods, earthquakes, tornadoes and pandemic disease, as well as man-made disasters and core infrastructure failures, including acts of terrorism, military actions, power grid and telephone/internet infrastructure failures, which may adversely affect AUM, results of operations and financial condition by causing, among other things:
| • | losses in our investment portfolio due to significant volatility in global financial markets or the failure of counterparties to perform; |
| • | changes in the rate of mortality, claims, withdrawals, lapses and surrenders of existing policies and contracts, as well as sales of new policies and contracts; and |
| • | disruption of our normal business operations due to catastrophic property damage, loss of life, or disruption of public and private infrastructure, including communications and financial services. |
There can be no assurance that our business continuation and crisis management plan or insurance coverages would be effective in mitigating any negative effects on operations or profitability in the event of a disaster, nor can we provide assurance that the business continuation and crisis management plans of the independent distributors and outside vendors on whom we rely for certain services and products would be effective in mitigating any negative effects on the provision of such services and products in the event of a disaster.
Claims resulting from a catastrophic event could also materially harm the financial condition of our reinsurers, which would increase the probability of default on reinsurance recoveries. Our ability to write new business could also be adversely affected.
In addition, the jurisdictions in which our insurance subsidiaries are admitted to transact business require life insurers doing business within the jurisdiction to participate in guaranty associations, which raise funds to pay contractual benefits owed pursuant to insurance policies issued by impaired, insolvent or failed insurers. It is possible that a catastrophic event could require extraordinary assessments on our insurance companies, which may have a material adverse effect on our business, results of operations and financial condition.
The loss of key personnel could negatively affect our financial results and impair our ability to implement our business strategy.
Our success depends in large part on our ability to attract and retain key people. Intense competition exists for key employees with demonstrated ability, and we may be unable to hire or retain such employees. Our key employees include investment professionals, such as portfolio managers, sales and distribution professionals, actuarial and finance professionals and information technology professionals. While we do not believe that the departure of any particular individual would cause a material adverse effect on our operations, the unexpected loss of several of our senior management, portfolio managers or other key employees could have a material adverse effect on our operations due to the loss of their skills, knowledge of our business, and their years of industry experience as well as the potential difficulty of promptly finding qualified replacement employees. We also rely upon the knowledge and experience of employees involved in functions that require technical expertise in order to provide for sound operational controls for our overall enterprise, including the accurate and timely preparation of required regulatory filings and U.S. GAAP and statutory financial statements and operation of internal controls. A loss of such employees could adversely impact our ability to execute key operational functions and could adversely affect our operational controls, including internal controls over financial reporting.
-43-
Table of Contents
Interruption or other operational failures in telecommunication, information technology and other operational systems, or a failure to maintain the security, integrity, confidentiality or privacy of sensitive data residing on such systems, including as a result of human error, could harm our business.
We are highly dependent on automated and information technology systems to record and process our internal transactions and transactions involving our customers, as well as to calculate reserves, value invested assets and complete certain other components of our U.S. GAAP and statutory financial statements. We could experience a failure of one of these systems, our employees or agents could fail to monitor and implement enhancements or other modifications to a system in a timely and effective manner, or our employees or agents could fail to complete all necessary data reconciliation or other conversion controls when implementing a new software system or implementing modifications to an existing system. Despite the implementation of security and back-up measures, our information technology systems may be vulnerable to physical or electronic intrusions, viruses or other attacks, programming errors and similar disruptions. We may also be subject to disruptions of any of these systems arising from events that are wholly or partially beyond our control (for example, natural disasters, acts of terrorism, epidemics, computer viruses and electrical/telecommunications outages). All of these risks are also applicable where we rely on outside vendors to provide services to us and our customers. The failure of any one of these systems for any reason, or errors made by our employees or agents, could in each case cause significant interruptions to our operations, which could harm our reputation, adversely affect our internal control over financial reporting, or have a material adverse effect on our business, results of operations and financial condition.
In addition, businesses in the United States and in other countries have increasingly become the targets of “cyberattacks”, “hacking” or similar illegal or unauthorized intrusions into computer systems and networks. Such events are often highly publicized, result in the theft of significant amounts of information, and cause extensive damage to the reputation of the targeted business, in addition to leading to significant expenses associated with investigation, remediation and customer protection measures. Although we have not yet suffered such an incident of any materiality, we could be the subject of such an attack, and, although we seek to limit our vulnerability to such events through technological and other means, it is not possible to anticipate all potential forms of cyberattack or to guarantee our ability to fully defend against all such attacks. In addition, due to the sensitive nature of much of the financial and similar personal information we maintain, we may be at particular risk for targeting.
We retain confidential information in our information technology systems, and we rely on industry standard commercial technologies to maintain the security of those systems. Anyone who is able to circumvent our security measures and penetrate our information technology systems could access, view, misappropriate, alter, or delete information in the systems, including personally identifiable customer information and proprietary business information. Information security risks also exist with respect to the use of portable electronic devices, such as laptops, which are particularly vulnerable to loss and theft. In addition, an increasing number of jurisdictions require that customers be notified if a security breach results in the disclosure of personally identifiable customer information. Any attack or other breach of the security of our information technology systems that compromises information that is subject to legislative or regulatory privacy protections, or that otherwise results in inappropriate disclosure or use of personally identifiable customer information could damage our reputation in the marketplace, deter purchases of our products, subject us to heightened regulatory scrutiny, sanctions, significant civil and criminal liability or other adverse legal consequences and require us to incur significant technical, legal and other expenses.
Third parties to whom we outsource certain of our functions are also subject to the risks outlined above, any one of which could result in our incurring substantial costs and other negative consequences, including a material adverse effect on our business, results of operations and financial condition.
If we experience difficulties arising from outsourcing relationships, our ability to conduct business may be compromised, which may have an adverse effect on our business and results of operations.
As we continue to focus on reducing the expense necessary to support our operations, we have increasingly used outsourcing strategies for certain technology and business functions. If third-party providers experience
-44-
Table of Contents
disruptions or do not perform as anticipated, or we experience problems with a transition, we may experience operational difficulties, an inability to meet obligations, including, but not limited to, policyholder obligations, increased costs and a loss of business that may have a material adverse effect on our business and results of operations. For other risks associated with our outsourcing of certain functions, see “—Interruption or other operational failures in telecommunication, information technology and other operational systems, or a failure to maintain the security, integrity, confidentiality or privacy of sensitive data residing on such systems, including as a result of human error, could harm our business.”
We may not be able to protect our intellectual property and may be subject to infringement claims.
We rely on a combination of contractual rights with third parties and copyright, trademark, patent and trade secret laws to establish and protect our intellectual property. Although we endeavor to protect our rights, third parties may infringe or misappropriate our intellectual property. We may have to litigate to enforce and protect our copyrights, trademarks, patents, trade secrets and know-how or to determine their scope, validity or enforceability. This would represent a diversion of resources that may be significant and our efforts may not prove successful. The inability to secure or protect our intellectual property assets could have a material adverse effect on our business and our ability to compete.
We may also be subject to claims by third parties for (i) patent, trademark or copyright infringement, (ii) breach of copyright, trademark or license usage rights, or (iii) misappropriation of trade secrets. Any such claims and any resulting litigation could result in significant expense and liability for damages. If we were found to have infringed or misappropriated a third-party patent or other intellectual property right, we could in some circumstances be enjoined from providing certain products or services to our customers or from utilizing and benefiting from certain methods, processes, copyrights, trademarks, trade secrets or licenses. Alternatively, we could be required to enter into costly licensing arrangements with third parties or implement a costly work around. Any of these scenarios could have a material adverse effect on our business and results of operations.
We may incur further liabilities in respect of our defined benefit retirement plans for our employees if the value of plan assets is not sufficient to cover potential obligations, including as a result of differences between results underlying actuarial assumptions and models.
We operate various defined benefit retirement plans covering a significant number of our employees. The liability recognized in our consolidated balance sheet in respect of our defined benefit plans is the present value of the defined benefit obligations at the balance sheet date, less the fair value of each plan’s assets. We determine our defined benefit plan obligations based on external actuarial models and calculations using the projected unit credit method. Inherent in these actuarial models are assumptions including discount rates, rates of increase in future salary and benefit levels, mortality rates, consumer price index and the expected return on plan assets. These assumptions are updated annually based on available market data and the expected performance of plan assets. Nevertheless, the actuarial assumptions may differ significantly from actual results due to changes in market conditions, economic and mortality trends and other assumptions. Any changes in these assumptions could have a significant impact on our present and future liabilities to and costs associated with our defined benefit retirement plans and may result in increased expenses and reduce our profitability.
When contributing to the plan, we will take into consideration the minimum and maximum amounts required by the Employee Retirement Income Security Act of 1974 (“ERISA”), the attained funding target percentage of the plan, the variable-rate premiums that may be required by the U.S. Pension Benefit Guaranty Corporation (“PBGC”), and any funding relief that might be enacted by Congress, such as the interest rate stabilization corridor rules used for discounting pension liabilities contained in the Moving Ahead for Progress in the 21st Century Act (“MAP-21”). Based on our actuarial assumptions, incorporating the provisions of MAP-21 reduced the required contributions to the plan in 2013. However, reduced funding levels in the near term could lead to increased PBGC variable-rate premiums and/or increases in plan funding in following years.
-45-
Table of Contents
Although our retail variable annuity products are now managed within our CBVA segment, we continue to offer variable annuity products and other products with similar features in our ongoing business.
In 2009, we decided to cease sales of retail variable annuities with substantial guarantee features and now manage that business within our CBVA segment. However, we continue to offer variable annuity products in our ongoing business as well as products that have some of the features of variable annuities such as guaranteed benefits. For example, certain of the deferred annuities sold by our Retirement segment are on group and individual variable annuity policy forms, since these product types allow customers to allocate their retirement savings to a variety of different investment options. These products may contain guaranteed death benefit features, but they do not offer guaranteed living benefit features of the type found within the CBVA segment.
The Retirement segment has recently introduced an optional guaranteed retirement income portfolio (“GRIP”) feature that, if elected by an employee of one of our plan sponsor customers, provides guaranteed lifetime withdrawal benefits (“GLWB”) to such employees. The GLWB is offered through a multi-insurer model, whereby we and two unaffiliated insurers provide GLWB coverage to participating employees. In contrast to the retail guaranteed minimum withdrawal benefits for life (“GMWBL”) provisions formerly offered by the CBVA segment, the GLWB provisions within GRIP do not offer rollup benefits; furthermore, we reprice the GLWB amount purchased by contributions to the GRIP feature on a quarterly basis. In addition, the investment elections available to participating employees have substantially less flexibility than the elections offered to retail customers of the CBVA segment. We also have the right to cease accepting new contributions to the GRIP feature, subject to providing 180 days advance notice to the plan sponsor.
Our Annuities segment also offers optional guaranteed withdrawal benefit provisions on its indexed annuity products.
To the extent that these risk-control provisions do not mitigate the risks of the GLWB and to the extent that we continue to offer variable annuity products and products with similar features in our ongoing business, the risks described below under “—Risks Related to Our CBVA Segment” will impact our ongoing business.
Risks Related to Our CBVA Segment
Although we no longer actively market retail variable annuities, our business, results of operations, financial condition and liquidity will continue to be affected by our CBVA segment for the foreseeable future.
Our CBVA segment consists of retail variable annuity insurance policies sold primarily from 2001 to early 2010, when the block entered run-off. This segment represented 16.7% of our total AUM as of December 31, 2013, income (loss) before income taxes was ($1,209.3) million, ($692.3) million, and ($564.5) million for the years ended December 31, 2013, 2012, and 2011, respectively. Revenues for the segment were ($726.2) million, ($70.0) million and $794.9 million for the years ended December 31, 2013, 2012, and 2011, respectively. See “Business—Closed Blocks—CBVA.” These products offered long-term savings vehicles in which customers (policyholders) made deposits that were invested, largely at the customer’s direction, in a variety of U.S. and international equity, fixed income, real estate and other investment options. In addition, these products provided customers with the option to purchase living benefit riders, including GMWBL, guaranteed minimum income benefits (“GMIB”), guaranteed minimum accumulation benefits (“GMAB”) and guaranteed minimum withdrawal benefits (“GMWB”). All retail variable annuity products include guaranteed minimum death benefits (“GMDB”). In 2009, we decided to cease sales of retail variable annuity products with substantial guarantee features. In early 2010, we ceased all new sales of these products with substantial guarantees, although we continue to accept new deposits in accordance with, and subject to the limitations of, the provisions of existing contracts.
Market movements and actuarial assumption changes (including, with respect to policyholder behavior and mortality) can result in material adverse impacts to our results of operations, financial condition and liquidity. Because policyholders have various contractual rights to defer withdrawals, annuitization and/or maturity of their contracts, the nature and period of contract maturity is subject to policyholder behavior and is therefore
-46-
Table of Contents
indeterminate. Future market movements and changes in actuarial assumptions can result in significant earnings and liquidity impacts, as well as increases in regulatory reserve and capital requirements for the CBVA segment. The latter may necessitate additional capital contributions into the business and/or adversely impact dividend capacity.
Our CBVA segment is subject to market risks.
Our CBVA segment is subject to a number of market risks, primarily associated with U.S. and other global equity market values and interest rates. For example, declining equity market values, increasing equity market volatility, declining interest rates or a prolonged period of low interest rates can result in an increase in the valuation of future policy benefits, reducing our net income. Declining market values for bonds and equities also reduce the account balances of our variable annuity contracts, and since we collect fees and risk charges based on these account balances, our net income may be further reduced.
Declining interest rates, a prolonged period of low interest rates, increased equity market volatility or declining equity market values may also subject us to increased hedging costs. Market events can cause an increase in the amount of statutory reserves that our insurance subsidiaries are required to hold for variable annuity guarantees, lowering their statutory surplus, which would adversely impact their ability to pay dividends to us. An increase in interest rates could result in decreased fee income associated with a decline in the value of variable annuity account balances invested in fixed income funds, which also might affect the value of the underlying guarantees within these variable annuities.
The performance of our CBVA segment depends on assumptions that may not be accurate.
Our CBVA segment is subject to risks associated with the future behavior of policyholders and future claims payment patterns, using assumptions for mortality experience, lapse rates, GMIB annuitization rates, and GMWB/GMWBL withdrawal rates. We are required to make assumptions about these behaviors and patterns, which may not reflect the actual behaviors and patterns we experience in the future.
In particular, we have only minimal experience on policyholder behavior for our GMIB and GMWBL products and, as a result, future experience could lead to significant changes in our assumptions. Our GMIB contracts have a ten-year waiting period before annuitization is available, with most of these GMIB contracts issued during the period 2004 to 2006. These contracts first become eligible to annuitize during the period from 2014 through 2016, but contain significant incentives to delay annuitization beyond the first eligibility date. As a result, to date we have only a statistically small sample of experience used to set annuitization rates. Therefore, we anticipate that observable experience data will become statistically credible later this decade, when a large volume of GMIB benefits begin to reach their maximum benefit over the four-year period from 2019 to 2022. It is possible, however, that policyholders may choose to annuitize soon after the first annuitization date, rather than delay annuitization to receive increased guarantee benefits, in which case we may have increasingly statistically credible experience as early as the period from 2014 through 2016.
Similarly, most of our GMWBL contracts are still in the first four to six policy years, so our assumptions for withdrawal from contracts with GMWBL benefits may change as experience emerges. In addition, like our GMIB contracts, many of our GMWBL contracts contain significant incentives to delay withdrawal. We expect customer decisions on annuitization and withdrawal will be influenced by customers’ financial plans and needs as well as by interest rate and market conditions over time and by the availability and features of competing products. If emerging experience deviates from our assumptions on either GMIB annuitization or GMWBL withdrawal, we could experience gains or losses and a significant decrease or increase to reserve and capital requirements.
We also make estimates of expected lapse of these products, which is the probability that a policy will not remain in force from one period to the next. Lapse rates of our annuity products may be significantly impacted by the value of guaranteed minimum benefits relative to the value of the underlying separate accounts (account
-47-
Table of Contents
value or account balance). In general, policies with guarantees that are “in the money” (i.e., where the notional benefit amount is in excess of the account value) are assumed to be less likely to lapse. Conversely, “out of the money” guarantees are assumed to be more likely to lapse as the policyholder has less incentive to retain the policy. Lapse rates could also be adversely affected generally by developments that affect customer perception of us.
We make estimates of expected election rates of living benefits for these products and of the rate of election of certain optional benefits that may be exercised. The profitability of our deferred annuity products depends upon actual contract owner decisions to elect or delay the utilization of such benefits. The development of a secondary market for third-party investor strategies in the annuities business could also adversely affect the profitability of existing business by reducing lapse rates of in-the-money contracts in excess of current expectations or by causing living benefits to be elected at points in time that are more unfavorable than our current expectations. Actual lapse rates that are lower than our lapse rate assumptions could have an adverse effect on profitability in the later years of a block of business because the anticipated claims experience may be higher than expected in these later years. If actual lapse rates are significantly different from those assumed in our current reserving assumptions, our reserves for future policy benefits may prove to be inadequate.
Our variable annuity lapse rate experience has varied significantly over the period from 2006 to the present, reflecting among other factors, both pre-and post-financial crisis experience. During the early years of this period, our variable annuity policyholder lapse rate experience was higher than our current best estimate of policyholder lapse behavior would have indicated; in the later part of this period, after mid-2009, it was lower. Management’s current best estimate of variable annuity policyholder lapse behavior incorporates actual experience over the entire period, as we believe that over the duration of the CBVA policies we will experience the full range of policyholder behavior and market conditions. If our future experience were to approximate our lapse experience from later in the period, we would likely need to increase reserves by an amount that could be material.
We make estimates regarding mortality, which refers to the ceasing of life contingent benefit payments due to the death of the annuitant. Mortality is also the incidence of death amongst policyholders triggering the payment of Guaranteed Minimum Death Benefits. We use a combination of actual and industry experience when setting our mortality assumptions. If actual mortality rates differ adversely from those assumed in our current reserving assumptions, our reserves for future policy benefits may prove to be inadequate.
We review overall policyholder experience annually (including lapse, annuitization, withdrawal and mortality), or more frequently if necessary. As customer experience continues to materialize, we may adjust our assumptions. The magnitude of any required changes could be material and adverse to the results of operations or financial condition of the Company. We increased reserves in the fourth quarter of 2011 after a comprehensive review of our assumptions relating to lapses, mortality, annuitization of income benefits and utilization of withdrawal benefits. The review in 2011 included an analysis of a larger body of actual experience than was previously available, including a longer period with low equity markets and interest rates, which we believe provided greater insight into anticipated policyholder behavior for contracts that are in the money. This resulted in an increase of U.S. GAAP reserves of $741 million and gross U.S. statutory reserves of $2,776 million in the fourth quarter of 2011. It is possible that future assumption changes could produce reserve changes of this magnitude or even greater. Any such increase to reserves could require us to make material additional capital contributions to one or more of our insurance company subsidiaries or could otherwise be material and adverse to the results of operations or financial condition of the Company.
During the third quarters of 2013 and 2012 we conducted periodic reviews of actuarial assumptions, including policyholder behavior assumptions. As a result of the 2013 review, we incurred a loss of $185.3 million, which included $117.9 million of unfavorable mortality assumption changes and $85.5 million of unfavorable policyholder behavior assumption changes. As a result of the 2012 review, we recorded a loss of $151.7 million, of which $114.6 million was driven primarily by an update to lapse rates on variable annuity contracts with lifetime living benefit guarantees and $37.1 million was related to changes in cash flow projections and volatility assumptions on certain products. These changes in lapse assumptions, taken together
-48-
Table of Contents
with the update to lapse assumptions we made in late 2011, moved our assumptions to be in line with lapse experience over the study period of 2006 to present. Although we believe it is appropriate to consider actual experience over that entire period in setting our assumptions, this recent change also causes our assumption to move considerably closer to our actual lapse experience for the period from mid-2009 to present. However, as described in the previous paragraph, future reserve increases in connection with experience updates could be material and adverse to the results of operations or financial condition of the Company. Any such increase to reserves could require us to make material additional capital contributions to one or more of our insurance company subsidiaries or could otherwise be material and adverse to the results of operations or financial condition of the Company. We will continue to monitor the emergence of experience. We review our assumptions at least annually, and, if necessary, update our assumptions more frequently as additional information becomes available. If adjustments to policyholder behavior assumptions (e.g., lapse, annuitization and withdrawal) are necessary, which is ordinary course for interest-sensitive long-dated liabilities, we anticipate that the financial impact of such a change will likely be in a range, either up or down, that is generally consistent with the impact experienced in the past two years.
Our Variable Annuity Hedge Program currently focuses on the protection of regulatory and rating agency capital from market movements and less on the U.S. GAAP earnings impact of this block, which could result in materially lower or more volatile U.S. GAAP earnings.
Our Variable Annuity Hedge Program currently focuses on the protection of regulatory and rating agency capital from equity market movements and less on the U.S. GAAP earnings impact of this block. U.S. GAAP accounting differs from the methods used to determine regulatory and rating agency capital measures. Therefore our Variable Annuity Hedge Program may create earnings volatility in our U.S. GAAP financial statements, or produce lower U.S. GAAP income or even U.S. GAAP losses compared to what our unhedged results would have been. In general, in any given period rising equity market values can produce losses in our Variable Annuity Hedge Program that substantially exceed the benefit we derive from the associated decrease in valuation of the future policy benefits associated with CBVA products on a U.S. GAAP basis, and the impact of declining equity markets can produce gains in our Variable Annuity Hedge Program that substantially exceed the loss we derive from the associated increase in valuation of the future policy benefits on a U.S. GAAP basis. We recorded net gains (losses) related to incurred guaranteed benefits and guaranteed benefit hedging, including the CHO program, but excluding the effect of nonperformance risk, of ($1,674.3) million, ($1,209.3) million, and ($2,192.2) million for the years ended December 31, 2013, 2012, and 2011, respectively. See “Management’s Discussion and Analysis of Financial Condition and Results of Operations—Results of Operations—Company Consolidated.”
As stated above, the primary focus of the hedge program is to protect regulatory and rating agency capital from equity market movements. Hedge ineffectiveness, along with other aspects not directly hedged (including unexpected policyholder experience), may cause losses of regulatory or rating agency capital. Regulatory and rating agency capital requirements may move disproportionately (i.e., they may change by different amounts as market conditions and other factors change), and, therefore, this could also cause our hedge program to not realize its key objective of protecting both regulatory and rating agency capital from equity market movements.
Our Variable Annuity Hedge Program may not be effective and may be more costly than anticipated.
We periodically re-evaluate our Variable Annuity Hedge Program to respond to changing market conditions and balance the trade-offs among several important factors, including regulatory reserves, rating agency capital, underlying economics, earnings and other factors. While our Variable Annuity Hedge Program is intended to balance numerous critical metrics, we are subject to the risk that our strategies and other management decisions may prove ineffective or that unexpected policyholder experience, alone or in combination with unfavorable market events, may produce losses or unanticipated cash needs beyond the scope of the risk management strategies employed. The Variable Annuity Hedge Program assumes that hedge positions can be rebalanced during a market shock and that the performance of the derivative contracts reasonably matches the performance of the contract owners’ variable fund returns. In addition, our Variable Annuity Hedge Program does not hedge certain non-market risks inherent in this segment, including business, credit, insurance and operational risks; any
-49-
Table of Contents
of these risks could cause us to experience unanticipated losses or cash needs. For example, hedging counterparties may fail to perform their obligations resulting in unhedged exposures and losses on positions that are not collateralized. Finally, the cost of the Variable Annuity Hedge Program itself may be greater than anticipated as adverse market conditions can limit the availability and increase the costs of the hedging instruments we employ, and such costs may not be recovered in the pricing of the underlying products being hedged. For example, the cost of hedging guaranteed minimum benefits increases as market volatilities increase and/or interest rates decrease, resulting in a reduction to net income.
Risks Related to Regulation
Our businesses and those of ING Group and its affiliates are heavily regulated and changes in regulation or the application of regulation may reduce our profitability.
We are subject to detailed insurance, asset management and other financial services laws and government regulation. In addition to the insurance, asset management and other regulations and laws specific to the industries in which we operate, regulatory agencies have broad administrative power over many aspects of our business, which may include ethical issues, money laundering, privacy, recordkeeping and marketing and sales practices. Also, bank regulators and other supervisory authorities in the United States and elsewhere continue to scrutinize payment processing and other transactions under regulations governing such matters as money-laundering, prohibited transactions with countries subject to sanctions, and bribery or other anti-corruption measures. The financial market dislocations we have experienced have produced, and are expected to continue to produce, extensive changes in existing laws and regulations applicable to our businesses.
Compliance with applicable laws and regulations is time consuming and personnel-intensive, and changes in laws and regulations may materially increase the cost of compliance and other expenses of doing business. There are a number of risks that may arise where applicable regulations may be unclear, subject to multiple interpretations or under development or where regulations may conflict with one another, where regulators revise their previous guidance or courts overturn previous rulings, which could result in our failure to meet applicable standards. Regulators and other authorities have the power to bring administrative or judicial proceedings against us, which could result, among other things, in suspension or revocation of our licenses, cease and desist orders, fines, civil penalties, criminal penalties or other disciplinary action which could materially harm our results of operations and financial condition. If we fail to address, or appear to fail to address, appropriately any of these matters, our reputation could be harmed and we could be subject to additional legal risk, which could increase the size and number of claims and damages asserted against us or subject us to enforcement actions, fines and penalties. See “Regulation” for further discussion of the impact of regulations on our businesses.
The Patient Protection and Affordable Care Act, signed into law on March 23, 2010, and the Health Care and Education Reconciliation Act of 2010, signed into law on March 30, 2010 (together, the “Health Care Act”) significantly impacts how employers provide health care to employees and how individuals obtain health care insurance. There is uncertainty surrounding the impact of the Health Care Act on insurers which may create risks to products we offer, including Stop Loss Insurance sold to employers offering self-insured health plans. In addition, should the Treasury Department issue guidance concluding that insurers offering Stop Loss Insurance are considered health care providers, we may face adverse tax or other financial consequences.
As long as we remain affiliated with ING Group, we may be subject to laws, regulations, disclosures and restrictions to which we would not be subject as a standalone enterprise. These restrictions could be extensive and include limitations on the activities we may conduct and the way in which we organize and operate our businesses. Various jurisdictions in which ING Group and its subsidiaries operate, including the United States, apply prudential and other regulations to the holding companies and affiliates of financial institutions. If the applicable laws and regulations in any of these jurisdictions, or the application or interpretation of such laws and regulations by applicable regulators and other authorities, were to change, or if ING Group or one of its subsidiaries (other than the Company) were to change the nature of the regulated activities they conduct, we could in the future become subject to restrictions to which we are not currently subject, and to which we would
-50-
Table of Contents
not be subject as a standalone enterprise. This could require us to incur material compliance, reporting or other costs or to forego certain types of material revenues or we could otherwise be confronted with consequences that are material and adverse to us. We do not have any control over the activities conducted by ING Group or its subsidiaries (other than the Company). As one source of potential change in the regulations applied to ING Group and its subsidiaries, we expect that in November 2014 the European Central Bank will assume responsibility for part of the prudential supervision of ING Bank and its holding company ING Group. Supervision over ING Bank and ING Group is currently exercised by the DNB. It is uncertain if and how this new supervisory structure will impact the Company.
In addition, the 2012 Amended Restructuring Plan contains provisions that could limit our business activities, including restricting our ability to make certain acquisitions or to conduct certain financing and investment activities. See “Regulation—Dutch State Transactions and Restructuring Plan”.
If ING Group or one of its subsidiaries (other than the Company) were to change the nature of the regulated activities it conducts, we could in the future become subject to restrictions to which we are not currently subject, and to which we would not otherwise be subject as a standalone enterprise.
As long as we remain affiliated with ING Group, we may be subject to laws, regulations, disclosures and restrictions to which we would not be subject as a standalone enterprise. These restrictions could be extensive and include limitations on the activities we may conduct and the way in which we organize and operate our businesses. For instance, ING Group’s wholly owned subsidiary, ING Bank, may from time to time consider whether to establish a branch office in the United States. If ING Bank were to establish a U.S. branch, ING Group, ING Bank and we would be subject to supervision and regulation by the Federal Reserve under various laws, including the Bank Holding Company Act of 1956, as amended (“BHCA”), and the International Banking Act of 1978. If ING Bank were to establish a U.S. branch, the BHCA could impose restrictions on our non-financial activities until we are no longer deemed controlled by ING Group for BHCA purposes. As a result, we could be required to incur material compliance, reporting or other costs or to forego certain types of material revenues or could otherwise be confronted with consequences that are material and adverse to us.
Moreover, if ING Bank were to establish a U.S. branch while we remained affiliated with ING Group, several regulatory developments could materially impact our operations, including rules under the Dodd-Frank Act issued by U.S. regulators with respect to the “Volcker Rule” and heightened supervisory requirements and prudential standards. Under the final rules adopted by U.S. regulators on December 10, 2013, we would be subject to the Volcker Rule as an affiliate of a company that is treated as a bank holding company. The Volcker Rule significantly restricts the ability of U.S. bank holding companies and their affiliates to conduct proprietary trading in securities and derivatives as well as certain activities related to hedge funds and private equity funds. However, the rules provide an exemption for a regulated insurance company trading solely for its general account if, among other requirements, it is acting in compliance with insurance company investment laws and regulations. Although the full potential impact of the Volcker Rule on our operations will not be known with certainty until fully implemented, we would likely experience significant additional compliance and operational costs if we were to become subject to the Volcker Rule.
The BHCA, however, would provide ING Group, ING Bank and us a two-year period in which to comply with the BHCA activity restrictions, with the possibility of our obtaining up to three one-year extensions. Further, the Federal Reserve would have discretion to extend the Volcker Rule conformance period and application of any heightened supervisory requirements and prudential standards with respect to the Company until past December 31, 2016 (the date by which ING Group is required to fully divest the Company under the terms of its restructuring plan with the EC). There is no guarantee, however, that the Federal Reserve would grant these requests.
Our insurance businesses are heavily regulated, and changes in regulation in the United States, enforcement actions and regulatory investigations may reduce profitability.
Our insurance operations are subject to comprehensive regulation and supervision throughout the United States. State insurance laws regulate most aspects of our insurance businesses, and our insurance subsidiaries are
-51-
Table of Contents
regulated by the insurance departments of the states in which they are domiciled and the states in which they are licensed. The primary purpose of state regulation is to protect policyholders, and not necessarily to protect creditors and investors. See “Regulation—Insurance Regulation”.
State insurance guaranty associations have the right to assess insurance companies doing business in their state in order to help pay the obligations of insolvent insurance companies to policyholders and claimants. Because the amount and timing of an assessment is beyond our control, liabilities we have currently established for these potential assessments may not be adequate.
State insurance regulators, the NAIC and other regulatory agencies regularly reexamine existing laws and regulations applicable to insurance companies and their products and their affiliated transactions. Changes in these laws and regulations, or in interpretations thereof, are often made for the benefit of the consumer at the expense of the insurer and could materially and adversely affect our business, results of operations or financial condition. We currently use our special purpose life reinsurance captive insurance company subsidiaries domiciled in Missouri (referred to in this prospectus as “captive reinsurance subsidiaries”) primarily to reinsure term life insurance, universal life insurance with secondary guarantees, and stable value annuity business. We also use our captive reinsurance subsidiary domiciled in Arizona (referred to in this prospectus as “our Arizona captive”) primarily to reinsure life insurance and annuity business from our insurance subsidiaries. In October 2011, the NAIC established a subgroup to study insurers’ use of captive reinsurance companies and special purpose vehicles to transfer insurance risk in relation to existing state laws and regulations, and to establish appropriate regulatory requirements to address concerns identified in the study. Additionally, in June 2013, the New York State Department of Financial Services (the “NYDFS”) released a report critical of certain captive reinsurance structures and calling, in part, for other state regulators to adopt a moratorium on approving such structures pending further review by state and federal regulators. Also, in December 2013, the United States Treasury Department’s Federal Insurance Office (“FIO”) issued a report on how to modernize and improve the system of insurance regulation in the United States, recommending, in part, that states develop a uniform and transparent solvency oversight regime for the transfer of risk to reinsurance captives and adopt a uniform capital requirement for reinsurance captives, including a prohibition on transactions that do not constitute legitimate risk transfer. In March 2014, the Missouri Department of Insurance, Division of Insurance Company Regulation (the “Missouri Division”) notified us that it is performing a review of special purpose life reinsurance captive insurance company transactions that have occurred in Missouri’s captive program and, as part of that review, the Missouri Division has requested information from us regarding our captive reinsurance subsidiaries. We cannot predict what actions and regulatory changes will result from the NAIC study, the NYDFS report, the FIO report or the Missouri Division review. Any regulatory action that prohibits or limits our use of or materially increases our cost of using captive reinsurance companies, either retroactively or prospectively, could have a material adverse effect on our financial condition or results of operations. For more detail, see “Management’s Discussion and Analysis of Financial Condition and Results of Operations—Liquidity and Capital Resources—Statutory Capital and Risk-Based Capital of Principal Insurance Subsidiaries—Captive Reinsurance Subsidiaries”.
Insurance regulators have implemented, or begun to implement significant changes in the way in which insurers must determine statutory reserves and capital, particularly for products with contractual guarantees such as variable annuities and universal life policies, and are considering further potentially significant changes in these requirements. The NAIC is currently working on comprehensive reforms related to life insurance reserves and the accounting for such reserves. The timing and extent of further changes to statutory reserves and reporting requirements are uncertain.
In addition, state insurance regulators are becoming more active in adopting and enforcing suitability standards with respect to sales of fixed, indexed and variable annuities. In particular, the NAIC has adopted a revised Suitability in Annuity Transactions Model Regulation (“SAT”), which will, if enacted by the states, place new responsibilities upon issuing insurance companies with respect to the suitability of annuity sales, including responsibilities for training agents. Several states have already enacted laws based on the SAT.
In addition to the foregoing risks, the financial services industry is the focus of increased regulatory scrutiny as various state and federal governmental agencies and self-regulatory organizations conduct inquiries and
-52-
Table of Contents
investigations into the products and practices of the financial services industries. See the Note for Commitments and Contingencies in our Consolidated Financial Statements for the year ended December 31, 2013 for a description of certain regulatory inquiries affecting the Company. It is possible that future regulatory inquiries or investigations involving the insurance industry generally, or the Company specifically, could materially and adversely affect our business, results of operations or financial condition.
In some cases, this regulatory scrutiny has led to legislation and regulation, or proposed legislation and regulation that could significantly affect the financial services industry, or has resulted in regulatory penalties, settlements and litigation. New laws, regulations and other regulatory actions aimed at the business practices under scrutiny could materially and adversely affect our business, results of operations or financial condition. The adoption of new laws and regulations, enforcement actions, or litigation, whether or not involving us, could influence the manner in which we distribute our products, result in negative coverage of the industry by the media, cause significant harm to our reputation and materially and adversely affect our business, results of operations or financial condition.
Our products are subject to extensive regulation and failure to meet any of the complex product requirements may reduce profitability.
Our insurance, annuity, retirement and investment products are subject to a complex and extensive array of state and federal tax, securities, insurance and employee benefit plan laws and regulations, which are administered and enforced by a number of different governmental and self-regulatory authorities, including state insurance regulators, state securities administrators, state banking authorities, the SEC, FINRA, the Department of Labor (“DOL”), the IRS and the Office of the Comptroller of the Currency (“OCC”).
For example, U.S. federal income tax law imposes requirements relating to insurance and annuity product design, administration and investments that are conditions for beneficial tax treatment of such products under the Internal Revenue Code. Additionally, state and federal securities and insurance laws impose requirements relating to insurance and annuity product design, offering and distribution and administration. Failure to administer product features in accordance with contract provisions or applicable law, or to meet any of these complex tax, securities, or insurance requirements could subject us to administrative penalties imposed by a particular governmental or self-regulatory authority, unanticipated costs associated with remedying such failure or other claims, harm to our reputation, interruption of our operations or adversely impact profitability.
The Dodd-Frank Act, its implementing regulations and other financial regulatory reform initiatives could have adverse consequences for the financial services industry, including us, and/or materially affect our results of operations, financial condition or liquidity.
On July 21, 2010, the Dodd-Frank Act was signed into law. It effects comprehensive changes to the regulation of financial services in the United States. The Dodd-Frank Act directs existing and newly-created government agencies and bodies to perform studies and promulgate a multitude of regulations implementing the law, a process that is underway and is expected to continue over the next few years. While some studies have already been completed and the rule-making process is well underway, there continues to be significant uncertainty regarding the results of ongoing studies and the ultimate requirements of regulations that have not yet been adopted. We cannot predict with certainty how the Dodd-Frank Act and such regulations will affect the financial markets generally, or impact our business, ratings, results of operations, financial condition or liquidity. Key aspects we have identified to date of the Dodd-Frank Act’s potential impact on us include:
| • | If designated by the Financial Stability Oversight Council (“FSOC”) as a nonbank financial company subject to supervision by the Federal Reserve, we would become subject to a comprehensive system of prudential regulation, including, among other matters, minimum capital requirements, liquidity standards, credit exposure requirements, overall risk management requirements, management interlock prohibitions, a requirement to maintain a plan for rapid and orderly dissolution in the event of severe financial distress, stress testing, additional fees and assessments and restrictions on proprietary trading and certain investments. The exact scope and consequences of these standards are subject to ongoing |
-53-
Table of Contents
| rulemaking activity by various federal banking regulators and therefore are currently unclear. However, this comprehensive system of prudential regulation, if applied to us, would significantly impact the manner in which we operate and could materially and adversely impact the profitability of one or more of our business lines or the level of capital required to support our activities. In designating non-bank financial companies for heightened prudential regulation by the Federal Reserve, the FSOC considers, among other matters, their size and potential impact on the financial stability of the United States. |
| • | Title II of the Dodd-Frank Act provides that a financial company, such as us, may be subject to a special orderly liquidation process outside the federal bankruptcy code, administered by the Federal Deposit Insurance Corporation as receiver, upon a determination that it is in default or in danger of default and presents a systemic risk to U.S. financial stability. We cannot predict how rating agencies, or creditors of us or our subsidiaries, will evaluate this potential or whether it will impact our financing or hedging costs. |
| • | Title VII of the Dodd-Frank Act creates a new framework for regulation of the over-the-counter (“OTC”) derivatives markets. New margin and capital requirements on market participants that will be contained in final regulations to be adopted by the SEC and the U.S. Commodity Futures Trading Commission (“CFTC”) could substantially increase the cost of hedging and related operations, affect the profitability of our products or their attractiveness to our customers, or cause us to alter our hedging strategy or change the composition of the risks we do not hedge. |
| • | Pursuant to requirements of the Dodd-Frank Act, the SEC and CFTC are currently considering whether stable value contracts should be regulated as “swap” derivative contracts. In the event that stable value contracts become subject to such regulation, certain aspects of our business could be adversely impacted, including issuance of stable value contracts and management of assets pursuant to stable value mandates. |
| • | The Dodd-Frank Act establishes a Federal Insurance Office within the United States Department of the Treasury (“Treasury Department”) to be headed by a director appointed by the Secretary of the Treasury. While not having a general supervisory or regulatory authority over the business of insurance, the director of this office performs various functions with respect to insurance, including participating in the FSOC’s decisions regarding insurers to be designated for stricter regulation by the Federal Reserve. The Dodd-Frank Act also required the director of FIO to conduct a study on how to modernize and improve the system of insurance regulation in the United States, including by increasing national uniformity by federal involvement or effective action by the states. The director issued that report in December 2013, recommending, in part, increased federal involvement in certain areas of insurance regulation to improve uniformity, and setting out recommendations in areas of near-term reform for the states, including prudential and marketplace oversight. The report also recommended, in part, that states develop a uniform and transparent solvency oversight regime for the transfer of risk to reinsurance captives, and adopt a uniform capital requirement for reinsurance captives, including a prohibition on transactions that do not constitute legitimate risk transfer. FIO has an ongoing charge to monitor all aspects of the insurance industry and will monitor state regulatory developments, including those called for in its report and present options for federal involvement if deemed necessary. |
| • | Under the Dodd-Frank Act, various federal regulators have adopted the Volcker Rule, which places limitations and restrictions on the ability of certain deposit institutions and regulated banking entities, as well as their affiliates, to engage in certain proprietary trading or sponsor and invest in private funds. In the event that one of our affiliates becomes a depository institution or otherwise becomes subject to the Volcker Rule, our investment activities could be restricted. |
| • | The Dodd-Frank Act also includes various securities law reforms that may affect our business practices. See “—Changes in U.S. federal and state securities laws and regulations may affect our operations and our profitability” below. |
-54-
Table of Contents
Although the full impact of the Dodd-Frank Act cannot be determined until the various studies mandated by the law are conducted and implementing regulations are adopted, many of the legislation’s requirements could have profound and/or adverse consequences for the financial services industry, including for us. The Dodd-Frank Act could make it more expensive for us to conduct business, require us to make changes to our business model or satisfy increased capital requirements, subject us to greater regulatory scrutiny or to potential increases in whistleblower claims in light of the increased awards available to whistleblowers under the Act and have a material adverse effect on our results of operations or financial condition.
See “Regulation” for further discussion of the impact of the Dodd-Frank Act on our businesses.
In addition to the Dodd-Frank Act, regulators and lawmakers in non-U.S. jurisdictions are engaged in addressing the causes of the recent financial crisis and means of avoiding such crises in the future. Although currently we are not directly subject to non-U.S. regulation, we may be significantly affected by foreign regulatory actions, due to our being affiliated with ING Group. We are unable to predict how any such regulations could affect the way ING Group conducts its business and manages capital, or to what extent any resulting changes in the way ING Group conducts its business or manages capital could affect our business, our relationship with ING Group or our results of operations, financial condition and liquidity. For a further discussion of foreign regulation and its potential effect on us while we are affiliated with ING Group, including the impact of the Solvency II Directive, see “Regulation—International and National Regulatory Initiatives that May Affect Us as a Consequence of our Affiliation with ING Group”.
Changes in U.S. federal and state securities laws and regulations may affect our operations and our profitability.
U.S. federal and state securities laws apply to sales of our mutual funds and to our variable annuity and variable life insurance products (which are considered to be both insurance products and securities) as well as to sales of third-party investment products. As a result, some of our subsidiaries and the products they offer are subject to regulation under these federal and state securities laws. Our insurance subsidiaries’ separate accounts are registered as investment companies under the Investment Company Act. Some variable annuity contracts and variable life insurance policies issued by our insurance subsidiaries also are registered under the Securities Act of 1933, as amended (the “Securities Act”). Other subsidiaries are registered as broker-dealers under the Securities Exchange Act of 1934, as amended (the “Exchange Act”), are members of, and subject to, regulation by FINRA, and are also registered as broker-dealers in various states, as applicable. In addition, some of our subsidiaries are registered as investment advisers under the Investment Advisers Act.
Securities laws and regulations are primarily intended to ensure the integrity of the financial markets and to protect investors in the securities markets or investment advisory or brokerage clients. These laws and regulations generally grant supervisory agencies broad administrative powers, including the power to limit or restrict the conduct of business for failure to comply with those laws and regulations. A number of changes have recently been proposed to the laws and regulations that govern the conduct of our variable insurance products business and our distributors that could have a material adverse effect on our results of operations and financial condition. For example, the Dodd-Frank Act authorizes the SEC to establish a standard of conduct applicable to brokers and dealers when providing personalized investment advice to retail customers. This standard of conduct would be to act in the best interest of the customer without regard to the financial or other interest of the broker or dealer providing the advice. The SEC and FINRA have also recently announced that they will be making the marketing and recommendation of IRA rollovers an examination priority in 2014; accordingly, sales of rollover IRA products, particularly by ING U.S.-affiliated broker-dealer firms, could be affected by this heightened regulatory scrutiny. Further, proposals have been made that the SEC establish a self-regulatory organization with respect to registered investment advisers, which could increase the level of regulatory oversight over them. Changes to these laws or regulations that restrict the conduct of our business could have an adverse effect on our results of operations and financial condition.
-55-
Table of Contents
Changes to federal regulations could adversely affect our distribution model by restricting our ability to provide customers with advice.
The prohibited transaction rules of ERISA and the Internal Revenue Code generally restrict providing investment advice to ERISA plans and participants and IRAs if the investment recommendation results in fees paid to the individual advisor, his or her firm or their affiliates that vary according to the investment recommendation chosen. In March 2010, the DOL issued proposed regulations that provide limited relief from these investment advice restrictions. The DOL issued final rules in October of 2011 and did not provide additional relief regarding these restrictions. As a result, the ability of certain of our investment advisory subsidiaries and their advisory representatives to provide investment advice to ERISA plans and participants, and with respect to IRAs, will likely be significantly restricted. Also, the fee and revenue arrangements of certain advisory programs may be required to be revenue neutral, resulting in potential lost revenues for these investment advisers and their affiliates.
Other proposed regulatory initiatives under ERISA may negatively impact our broker-dealer subsidiaries. In particular, the DOL issued a proposed regulation in October 2010 that would, if adopted as proposed, significantly broaden the circumstances under which a person or entity providing investment advice with respect to ERISA plans or IRAs would be deemed a fiduciary under ERISA or the Internal Revenue Code. Although the DOL has withdrawn this proposal, it has indicated its intent to re-propose the regulation in a modified form in 2014. If adopted as proposed, the investment related information and support that our advisors and employees could provide to plan sponsors, participants and IRA holders on a non-fiduciary basis could be substantially limited beyond what is allowed under current law. This could have a material impact on the level and type of services we can provide as well as the nature and amount of compensation and fees we and our advisors and employees may receive for investment-related services. In addition, the proposed regulations may make it easier for the DOL in enforcement actions, and for plaintiffs’ attorneys in ERISA litigation, to attempt to extend fiduciary status to advisors who would not be deemed fiduciaries under current regulations. See “Regulation—Employee Retirement Income Security Act Considerations”.
Finally, the DOL has issued a number of regulations recently, and may issue additional similar regulations, that increase the level of disclosure that must be provided to plan sponsors and participants. These ERISA disclosure requirements will likely increase the regulatory and compliance burden upon us, resulting in increased costs.
Changes in U.S. pension laws and regulations may affect our results of operations and our profitability.
Congress from time to time considers pension reform legislation that could decrease the attractiveness of certain of our retirement products and services to retirement plan sponsors and administrators or have an unfavorable effect on our ability to earn revenues from these products and services. In this regard, the Pension Protection Act of 2006 made significant changes in employer pension funding obligations associated with defined benefit pension plans that are likely to increase sponsors’ costs of maintaining these plans and imposed certain requirements on defined contribution plans. Over time, these changes could negatively impact our sales of defined benefit or defined contribution plan products and services and cause sponsors to discontinue existing plans for which we provide insurance, asset management, administrative, or other services. Certain tax-favored savings initiatives that have been proposed could hinder sales and persistency of our products and services that support employment based retirement plans.
The Preservation of Access to Care for Medicare Beneficiaries and Pension Relief Act of 2010 also includes certain provisions for defined benefit pension plan funding relief. These provisions may impact the likelihood of corporate plan sponsors terminating their plans and/or engaging in transactions to partially or fully transfer pension obligations to an insurance company. As part of our retirement services segment, we offer general account and separate account group annuity products that enable a plan sponsor to transfer these risks, often in connection with the termination of defined benefit pension plans. Consequently, this legislation could indirectly affect the mix of our business, with fewer closeouts and more non-guaranteed funding products, and adversely impact our results of operations.
-56-
Table of Contents
We may not be able to mitigate the reserve strain associated with Regulation XXX and NAIC Actuarial Guideline 38, potentially resulting in a negative impact on our capital position or in a need to increase prices and/or reduce sales of term or universal life products.
The NAIC Model Regulation entitled “Valuation of Life Insurance Policies,” commonly known as “Regulation XXX” or “XXX,” requires insurers to establish additional statutory reserves for certain term life insurance policies with long-term premium guarantees and for certain universal life policies with secondary guarantees. In addition, NAIC Actuarial Guideline 38 (“AG38”) clarifies the application of XXX with respect to certain universal life insurance policies with secondary guarantees. Many of our newly issued term insurance products and an increasing number of our universal life insurance products are affected by XXX and AG38, respectively. The application of both XXX and AG38 involves numerous interpretations. At times, there may be differences of opinion between management and state insurance departments regarding the application of these and other actuarial standards. Such differences of opinion may lead to a state insurance regulator requiring greater reserves to support insurance liabilities than management estimated.
We have implemented reinsurance and capital management actions to mitigate the capital impact of XXX and AG38, including the use of LOCs and the implementation of other transactions that provide acceptable collateral to support the reinsurance of the liabilities to wholly owned reinsurance captives or to third party reinsurers. These arrangements are subject to review and approval by state insurance regulators and review by rating agencies. In October 2011, the NAIC established a subgroup to study the use of captives and special purpose vehicles to transfer insurance risk in relation to existing state laws and regulations, and to establish appropriate regulatory requirements to address concerns identified in the study. Additionally, in June 2013, the NYDFS released a report critical of certain captive reinsurance structures and calling, in part, for other state regulators to adopt a moratorium on approving such structures pending further review by state and federal regulators. Also, in December 2013, FIO issued a report on how to modernize and improve the system of insurance regulation in the United States, recommending, in part, that states develop a uniform and transparent solvency oversight regime for the transfer of risk to reinsurance captives and adopt a uniform capital requirement for reinsurance captives, including a prohibition on transactions that do not constitute legitimate risk transfer. See “—Our insurance businesses are heavily regulated, and changes in regulation in the United States, enforcement actions and regulatory investigations may reduce profitability” above and “Management’s Discussion and Analysis of Financial Condition and Results of Operations—Liquidity and Capital Resources—Statutory Capital and Risk-Based Capital of Principal Insurance Subsidiaries—Captive Reinsurance Subsidiaries”. Rating agencies may include a portion of these LOCs or other collateral in their calculation of leverage calculations, which could increase their assessment of our leverage ratios and potentially impact our ratings. We cannot provide assurance that we will be able to continue to use captive reinsurance companies or that there will not be regulatory or rating agency challenges to the reinsurance and capital management actions we have taken to date or that acceptable collateral obtained through such transactions will continue to be available or available on a cost-effective basis. The result of those potential challenges, as well as the inability to obtain acceptable collateral, could require us to increase statutory reserves, incur higher operating and/or tax costs or reduce sales.
Certain of the reserve financing facilities we have put in place will mature prior to the run off of the liabilities they support. As a result, we cannot provide assurance that we will be able to continue to implement actions either to mitigate the impact of XXX and AG38 on future sales of term and universal life insurance products or maintain collateral support related to our captives or existing third party reinsurance arrangements to which one of our captive reinsurance subsidiaries is a party. If we are unable to continue to implement those actions or maintain existing collateral support, we may be required to increase statutory reserves or incur higher operating costs than we currently anticipate. Because term and universal life insurance are particularly price-sensitive products, any increase in premiums charged on these products to compensate us for the increased statutory reserve requirements or higher costs of reinsurance may result in a significant loss of volume and materially and adversely affect our life insurance business.
-57-
Table of Contents
Changes in tax laws and interpretations of existing tax law could increase our tax costs, impact the ability of our insurance company subsidiaries to make distributions to ING U.S., Inc. or make our insurance, annuity and investment products less attractive to customers.
Changes in tax laws could increase our taxes and our effective tax rates. For example, the Obama Administration has proposed modifying the dividends received deduction for life insurance company separate accounts, and such a modification could significantly reduce the dividends received deduction that we are able to claim for dividends received in separate accounts. As such, the dividend received deduction is a significant component of the difference between our actual tax expense and the expected tax expense determined using the federal statutory income tax rate of 35%. Also, interpretation and enforcement of existing tax law could change and could be applied to us as part of an IRS examination and increase our tax costs. In the course of such examinations, we have also entered into agreements with the IRS to resolve issues related to tax accounting matters, such as whether certain derivative transactions qualify for hedge treatment, the proper treatment of valid tax hedge gains and losses and “other than temporary impairment” losses. These agreements may be superseded by future enacted laws, regulations or public guidance that increases our taxes and our effective tax rates. Further, changes in tax rates could affect the amount of our deferred tax assets and deferred tax liabilities. One such change relates to the current debate over corporate tax reform and corporate tax rates. A reduction in the top federal tax rate would result in lower statutory deferred tax assets. Such a reduction in the statutory deferred tax asset may impact the ability of the affected insurance subsidiaries to make distributions to us and consequently could negatively impact our ability to pay dividends to our stockholders and to service our debt.
Changes in tax laws could make some of our insurance, annuity and investment products less attractive to customers. Current U.S. federal income tax law permits tax-deferred accumulation of income earned under life insurance and annuity products, and permits exclusion from taxation of death benefits paid under life insurance contracts. Changes in tax laws that restrict these tax benefits could make some of our products less attractive to customers. Reductions in individual income tax rates or estate tax rates could also make some of our products less advantageous to customers. Changes in federal tax laws that reduce the amount an individual can contribute on a pre-tax basis to an employer-provided, tax-deferred product (either directly by reducing current limits or indirectly by changing the tax treatment of such contributions from exclusions to deductions) or changes that would limit an individual’s aggregate amount of tax-deferred savings could make our retirement products less attractive to consumers.
The American Taxpayer Relief Act of 2012 made permanent the current marginal income tax rates for individuals, as well as the estate tax threshold and applicable rate. The Bipartisan Budget Act signed into law in December 2013 provided a short-term compromise on spending levels, which was recently extended until March 2015. Congress may pursue the reduction or elimination of tax preferences associated with our industry and products yet this year or in 2015 if it pursues comprehensive tax reform premised on the notion of reducing corporate and personal rates by broadening the taxable income base and reducing tax preferences. We also believe that states that stand to lose tax revenue of their own will exert pressure on the federal government not to enact additional measures as part of comprehensive tax reform that would negatively impact them. Such a situation may result in more pressure on raising revenue from tax preferences associated with our Company and products.
Risks Related to Our Separation from, and Continuing Relationship with, ING Group
ING Group’s continuing significant interest in us may result in conflicts of interest.
Upon the completion of this offering, ING Group will own approximately 45% of our outstanding common stock (approximately 43% if the underwriters’ option to purchase additional shares is exercised in full), in each case assuming that 7,022,471 shares are repurchased from ING Group in the Direct Share Buyback (based on an assumed per share repurchase price of $35.60, the closing price per share of our common stock on March 17, 2014, as reported by the NYSE). The actual number of shares repurchased in the Direct Share Buyback will be equal to $250 million divided by the per share proceeds, before expenses, to the Selling Stockholder in this
-58-
Table of Contents
offering, as shown on the cover of this prospectus. ING Group is currently required pursuant to the 2012 Amended Restructuring Plan to divest all of its global insurance and investment management business. See “Summary—ING Group Restructuring Plan with European Commission”. It is thus expected that ING Group will sell its remaining ownership interest in ING U.S., Inc. through one or more additional public offerings of our stock or, possibly, through one or more privately negotiated sales of our stock.
From the time of our IPO until the time of this offering, we have elected to be treated as a “controlled company” for purposes of the NYSE corporate governance rules, and accordingly, we have not been subject to the requirement that a majority of our directors be “independent” as defined under such rules and that we have a compensation and benefits committee and a nominating and governance committee that meet the required director independence requirements. Following the completion of this offering and the Direct Share Buyback, we will become subject to these requirements following a phase-in period provided for under the NYSE listed company rules. ING Group, however, will continue to maintain significant influence over our governance while it maintains a substantial shareholding.
In addition, under the provisions of a shareholder agreement that we entered into with ING Group concurrently with the completion of our initial public offering, ING Group has consent rights with respect to certain corporate and business activities that we may undertake, including during periods where ING Group holds less than a majority of our common stock. See “Certain Relationships and Related Party Transactions—Continuing Relationship with ING Group—Shareholder Agreement”.
Because ING Group’s interests may differ from those of other stockholders, actions ING Group takes or omits to take with respect to us, including those corporate or business actions requiring its prior affirmative written consent or vote described above, may not be as favorable to other stockholders as they are to ING Group.
Conflicts of interest may arise between us and ING Group in a number of areas relating to our past and ongoing relationships. As a majority stockholder, ING Group has had the ability to determine the entire membership of our Board of Directors, and following this offering, ING Group will continue to have the right to nominate three of our directors under the terms of the Shareholder Agreement. In addition, following this offering, ING Group will continue to retain a substantial minority of our common stock and will continue to exercise significant influence over matters voted upon by our stockholders, including the election of our Board of Directors. Four of our current directors are also officers or employees of ING Group or ING Group affiliates. As a condition to the Direct Share Buyback, two of the current directors who were nominated by ING Group will be required to resign from our Board of Directors. Three of such directors will remain on our Board of Directors following this offering. Because of their current or former positions with ING Group, certain of our directors and a number of our officers own substantial amounts of ING Group stock and options to purchase ING Group stock. Ownership interests of our directors or officers in ING Group shares, or service of certain of our directors as officers of ING Group, may create, or may create the appearance of, conflicts of interest when a director is faced with a decision that could have different implications for the two companies. These potential conflicts could arise, for example, over matters such as the desirability of an acquisition opportunity, employee retention or recruiting, capital management or our dividend policy.
Our continuing relationship with ING Group, and with affiliates of ING Group, may affect our ability to operate and finance our business as we deem appropriate and changes with respect to ING Group could negatively impact us.
From the time of our IPO until the time of this offering, ING Group has owned a majority of our common stock and we have been a consolidated subsidiary of ING Group for purposes of its financial reporting. Following the completion of this offering and the Direct Share Buyback, ING Group will continue to own a substantial minority of our common stock. Circumstances affecting ING Group may have an impact on us and we cannot be certain how further changes in circumstances affecting ING Group may impact us.
-59-
Table of Contents
In November 2008, the Dutch State purchased non-voting core Tier 1 securities from ING Group for a total consideration of €10 billion and in the first quarter of 2009 ING Group entered into an Alt-A Back-up Facility with the Dutch State (see “Certain Relationships and Related Party Transactions—Alt-A Back-up Facility”).
In 2009, ING Group was required to submit a restructuring plan to the EC to obtain EC approval for the Dutch State Transactions under the EC state aid rules. On October 26, 2009, ING Group announced its 2009 Restructuring Plan, pursuant to which ING Group is required to divest its insurance and investment management businesses, including the Company. On November 19, 2012, ING Group and the EC announced that the EC approved the 2012 Amended Restructuring Plan. The 2012 Amended Restructuring Plan requires ING Group to divest at least 25% of the Company by December 31, 2013, more than 50% of the Company by December 31, 2014, and 100% of the Company by December 31, 2016. ING Group divested 25% of the Company on May 7, 2013, in our initial public offering and an additional 4% on May 31, 2013 following the exercise by the underwriters in the initial public offering of an option to purchase additional shares. ING Group divested an additional 14% of the Company on October 29, 2013, in a registered offering. The divestment of 50% of the Company is measured in terms of a divestment of over 50% of the shares of ING U.S., Inc., the loss of ING Group’s majority of directors on ING U.S., Inc.’s board of directors and the accounting deconsolidation of the Company (in line with IFRS accounting rules). This offering and the Direct Share Buyback, together with the governance changes described under “Summary—Changes to our Governance as a Result of this Offering and the Direct Share Buyback”, are intended to satisfy such requirements. In case ING Group does not satisfy its commitment to timely divest the Company as agreed with the EC, or in case of any other material non-compliance with the 2012 Amended Restructuring Plan, the Dutch State will renotify the recapitalization measure to the EC. In such a case, the EC may require additional restructuring measures or take enforcement action against ING Group, or, at the request of ING Group and the Dutch State, could allow ING Group more time to complete the divestment.
The 2012 Amended Restructuring Plan also contains provisions that could limit our business activities, including restricting our ability to make certain acquisitions or to conduct certain financing and investment activities. See “Regulation—Dutch State Transactions and Restructuring Plan”.
We cannot accurately predict whether any restrictions and limitations imposed on ING Group on account of the Dutch State Transactions, or the implementation of the 2012 Amended Restructuring Plan (or any further amendment thereof), will have a negative effect on our businesses and financial flexibility or result in conflicts between the interests of ING Group and our interests. In addition, it is difficult for us to predict whether any changes to, or termination of, the Dutch State Transactions could occur as a result of the 2012 Amended Restructuring Plan (or any further amendment thereof) and whether any effect on our business would result from that. We also note that we cannot predict the possible effect of ING Group not satisfying its commitment to divest the Company as agreed with the EC, for instance, by having a remaining ownership interest in the Company and its subsidiaries beyond any deadline agreed with the EC.
Our separation from ING Group could adversely affect our business and profitability due to ING Group’s strong brand and reputation.
Prior to our initial public offering, as a wholly owned subsidiary of ING Group, we marketed our products and services using the “ING” brand name and logo. We believe the association with ING Group provided us with preferred status among our customers, vendors and other persons due to ING Group’s globally recognized brand, perceived high quality products and services and strong capital base and financial strength.
Our new status as a separate, publicly traded company could adversely affect our ability to attract and retain customers, which could result in reduced sales of our products. In connection with our initial public offering, we entered into a licensing agreement, pursuant to which we have a license to use certain trademarks (including the “ING” name and logo) for a limited period of time following the completion of our initial public offering. See “Certain Relationships and Related Party Transactions—Continuing Relationship with ING Group—Transitional
-60-
Table of Contents
Intellectual Property License Agreement”. Based on current expectations, ING U.S., Inc. will change its legal name to Voya Financial, Inc. in April 2014; and in May 2014 our Investment Management and Employee Benefits businesses will begin using the Voya Financial brand. In September 2014, our remaining businesses will begin using the Voya Financial brand and all remaining ING U.S. legal entities that currently have names incorporating the “ING” brand will change their names to reflect the Voya brand. We anticipate that the process of changing all marketing materials, operating materials and legal entity names containing the word “ING” or “Lion” to our new brand name will take approximately 24 months and will cost between $40 million and $50 million, excluding incremental advertising expenses. Some of our existing policyholders, contract owners and other customers may choose to stop doing business with us, which could increase the rate of surrenders and withdrawals in our policies and contracts. In addition, other potential policyholders and contract owners may decide not to purchase our products because we no longer will be a part of ING Group.
Our separation from ING Group could prompt some third parties to re-price, modify or terminate their distribution or vendor relationships with us. Our ability to attract and retain highly qualified independent sales intermediaries and dedicated sales specialists for our products may also be negatively affected. We may be required to lower the prices of our products, increase our sales commissions and fees, change long-term selling and marketing agreements and take other action to maintain our relationship with our sales intermediaries and distribution partners, all of which could have an adverse effect on our financial condition and results of operations. We cannot accurately predict the effect that our separation from ING Group will have on our business, sales intermediaries, customers or employees.
The terms of our arrangements with ING Group may be more favorable than we will be able to obtain from an unaffiliated third-party. We may be unable to replace the services ING Group provides us in a timely manner or on comparable terms.
While ING Group has been our sole or majority shareholder, we have benefited from certain contractual arrangements between ING Group and ING Bank and various third party vendors. These contractual arrangements permit ING Group affiliates such as the Company to make use of the software licenses and related services provided thereunder. There is no assurance that, once we are no longer entitled to benefit from these arrangements, we will be able to obtain these services at the same levels or obtain the same benefits through new, independent relationships with third party vendors. Likewise, we may not be able to replace these services and arrangements in a timely manner or on terms and conditions, including cost, as favorable as those we have previously received as a subsidiary of ING Group.
In addition, as described in “Certain Relationships and Related Party Transactions—Historical Related Party Transactions—Financing Arrangements—Guarantees,” certain of our indebtedness and other obligations continue to benefit from guarantees provided by ING Group or NN Group. As this indebtedness and these obligations mature or are terminated, to the extent we replace them with new indebtedness or other obligations, we do not expect such new indebtedness or other obligations to be guaranteed by ING Group or NN Group. Therefore, such new indebtedness or other obligations may be on terms that are less favorable to us than the indebtedness or other obligations being replaced.
Our certificate of incorporation limits certain liabilities and obligations of our directors to us or you.
Our amended and restated certificate of incorporation provides that none of our directors will be personally liable to us or our stockholders for monetary damages for breach of fiduciary duty, except for liability for breach of a director’s duty of loyalty, acts or omissions by a director not in good faith or which involve intentional misconduct or a knowing violation of law, dividend payments or stock repurchases that are unlawful under Delaware law or any transaction in which a director has derived an improper personal benefit. See “Description of Capital Stock—Limitation of Liability and Indemnification of Directors and Officers”.
-61-
Table of Contents
Our amended and restated certificate of incorporation also provides that certain of our directors, who have also served or may serve as directors, officers, employees or agents of ING Group, are relieved of the obligation to refer potential business opportunities to the Company or to notify the Company of potential business opportunities of which they become aware, and they may instead refer such opportunities to ING Group, subject to certain limited exceptions. See “Description of Capital Stock—Potential Business Opportunities”.
We expect to incur incremental costs as a standalone public company.
We have needed to replicate or replace certain functions, systems and infrastructure to which we no longer have the same access after our initial public offering. We have also needed to make infrastructure investments in order to operate without the same access to ING Group’s existing operational and administrative infrastructure. These initiatives may be costly to implement. Due to the scope and complexity of the underlying projects relative to these efforts, the amount of total costs could be materially higher than our estimate, and the timing of the incurrence of these costs may be subject to change.
Until our initial public offering, ING Group performed or supported many important corporate functions for our operations, including investor relations, advertising and brand management, corporate audit, certain risk management functions, corporate insurance, corporate governance and other services. Our Consolidated Financial Statements reflect charges for these services. There is no assurance that these services will be sustained at the same levels as when we were receiving such services from ING Group prior to our initial public offering or that we will obtain the same benefits. Now that we operate these functions independently, if we do not have our own adequate systems and business functions in place, or are unable to obtain them from other providers, we may not be able to operate our business effectively or at comparable costs and our profitability may decline. In addition, our business has benefited from ING Group’s purchasing power when procuring goods and services. As a standalone company, we may be unable to obtain such goods and services at comparable prices or on terms as favorable as those obtained prior to our initial public offering, which could decrease our overall profitability.
As a standalone public company, we expend additional time and resources to comply with rules and regulations that did not previously apply to us.
As a standalone public company, the various rules and regulations of the SEC, as well as the rules of the NYSE, require us to implement and maintain additional corporate governance practices and adhere to a variety of reporting requirements. Compliance with these public company obligations increases our legal and financial compliance costs and could place additional demands on our finance and accounting staff and on our financial, accounting and information systems.
In particular, as a public company, our management will be required to conduct an annual evaluation of our internal controls over financial reporting and include a report of management on our internal controls in our Annual Reports on Form 10-K. In addition, we will be required to have our independent registered public accounting firm attest to the effectiveness of our internal controls over financial reporting pursuant to Auditing Standard No. 5. Under current rules, we will be subject to these requirements beginning with our Annual Report on Form 10-K for the year ending December 31, 2014. If we are unable to conclude that we have effective internal controls over financial reporting, or if our registered public accounting firm is unable to provide us with an attestation and an unqualified report as to the effectiveness of our internal controls over financial reporting, investors could lose confidence in the reliability of our financial statements, which could result in a decrease in the value of our common stock.
-62-
Table of Contents
Our historical consolidated financial data are not necessarily representative of the results we would have achieved as a standalone company and may not be a reliable indicator of our future results.
Our historical consolidated financial data included in this prospectus do not necessarily reflect the financial condition, results of operations or cash flows we would have achieved as a standalone company during the periods presented or those we will achieve in the future. For example, we have adjusted our capital structure to more closely align with peer U.S. public companies. As a result, financial metrics that are influenced by our capital structure, such as interest expense and return on equity, are not necessarily indicative for historical periods of the performance we may achieve as a standalone company following our initial public offering. In addition, significant increases may occur in our cost structure as a result of our initial public offering, including costs related to public company reporting, investor relations and compliance with the Sarbanes-Oxley Act of 2002. Also, as described in “—Our separation from ING Group could adversely affect our business and profitability due to ING Group’s strong brand and reputation,” we anticipate incurring substantial expenses in connection with rebranding our Company.
As a result of these matters, among others, it may be difficult for investors to compare our future results to historical results or to evaluate our relative performance or trends in our business.
Risks Related to This Offering and Ownership of Our Common Stock
In addition to the risks included in this section, see “—We expect that our ability to use beneficial U.S. tax attributes will be subject to limitations” relating to provisions of our amended and restated certificate of incorporation that limit the amount of our common stock that an investor can acquire.
The price of our common stock may be volatile and may be affected by market conditions beyond our control.
Some factors that may cause the market price of our common stock to fluctuate, in addition to the other risks mentioned in this section of the prospectus, are:
| • | our operating and financial performance and prospects; |
| • | our announcements or our competitors’ announcements regarding new products or services, enhancements, significant contracts, acquisitions or strategic investments; |
| • | changes in earnings estimates or recommendations by securities analysts who cover our common stock; |
| • | fluctuations in our quarterly financial results or the quarterly financial results of companies perceived to be similar to us; |
| • | changes in our capital structure, such as future issuances of securities, sales of large blocks of common stock by our stockholders, including ING Group, or the incurrence of additional debt; |
| • | departure of key personnel; |
| • | reputational issues; |
| • | changes in general economic and market conditions; |
| • | changes in industry conditions or perceptions or changes in the market outlook for the insurance industry; and |
| • | changes in applicable laws, rules or regulations, regulatory actions affecting us and other dynamics. |
The stock market has experienced extreme price and volume fluctuations in recent years. The market prices of securities of insurance and financial services companies have experienced fluctuations that often have been unrelated or disproportionate to the operating results of these companies. These market fluctuations could result in extreme volatility in the price of shares of our common stock, which could cause a decline in the value of your investment. You should also be aware that price volatility may be greater if the public float and trading volume of shares of our common stock is low.
-63-
Table of Contents
Future sales of a substantial number of shares of our common stock may depress the price of our shares.
If our stockholders sell a large number of shares of our common stock, or if we issue a large number of shares of our common stock in connection with future acquisitions, financings, or other circumstances, the market price of shares of our common stock could decline significantly. Moreover, the perception in the public market that our stockholders might sell shares of our common stock could depress the market price of those shares. In addition, sales of a substantial number of shares of our common stock by ING Group pursuant to the 2012 Amended Restructuring Plan could adversely affect the market price of our common stock.
All the shares sold in this offering will be freely tradable without restriction, except for shares acquired by any of our affiliates, including ING Group. Immediately after this offering, the public market for our common stock will include the 26,500,000 shares of common stock that are being sold in this offering (or 30,475,000 shares if the underwriters exercise their option to purchase additional shares in full); the 74,971,003 shares of common stock sold in our initial public offering; and the 37,950,000 shares of common stock sold in a registered offering on October 29, 2013. In addition, we have registered shares of common stock that are reserved for issuance under our employee benefit plans. The shares under our employee benefit plans can be sold in the public market upon issuance, subject to restrictions under the securities laws applicable to resales by affiliates. In addition, we have entered into a registration rights agreement with ING Group pursuant to which we are obligated to register ING Group’s shares of our common stock for public resale upon request by ING Group. See “Description of Capital Stock—Registration Rights Agreement”.
We, ING Group and our directors and executive officers have entered into lock-up arrangements under which we and they have agreed that we and they will not sell, directly or indirectly, any common stock for a period of 90 days from the date of this prospectus (subject to certain exceptions) without the prior written consent of Morgan Stanley & Co. LLC, Goldman, Sachs & Co., Citigroup Global Markets Inc. and Merrill Lynch, Pierce, Fenner & Smith Incorporated. See “Underwriting”.
Provisions in our amended and restated certificate of incorporation and bylaws, of Delaware corporate and of state insurance laws, may prevent or delay an acquisition of us, which could decrease the trading price of our common stock.
State laws, provisions of ING U.S.’s certificate of incorporation and by-laws may delay, deter, prevent or render more difficult a takeover attempt that our stockholders might consider in their best interests. For example, such laws or provisions may prevent our stockholders from receiving the benefit from any premium to the market price of our common stock offered by a bidder in a takeover context. Even in the absence of a takeover attempt, the existence of these provisions may adversely affect the prevailing market price of our common stock if they are viewed as discouraging takeover attempts in the future.
The insurance laws and regulations of the various states in which our insurance subsidiaries are organized may delay or impede a business combination involving the Company. State insurance laws prohibit an entity from acquiring control of an insurance company without the prior approval of the domestic insurance regulator. Under most states’ statutes, an entity is presumed to have control of an insurance company if it owns, directly or indirectly, 10% or more of the voting stock of that insurance company or its parent company. These regulatory restrictions may delay, deter or prevent a potential merger or sale of our company, even if our Board of Directors decides that it is in the best interests of stockholders for us to merge or be sold. These restrictions also may delay sales by us or acquisitions by third parties of our insurance subsidiaries. In addition, the Investment Company Act would require approval by the contract owners of our variable contracts in order to effectuate a change of control of any affiliated investment adviser to a mutual fund underlying our variable contracts. Further, FINRA approval would be necessary for a change of control of any FINRA registered broker-dealer that is a direct or indirect subsidiary of the Company.
Section 203 of the DGCL may affect the ability of an “interested stockholder” to engage in certain business combinations, including mergers, consolidations or acquisitions of additional shares, for a period of three years
-64-
Table of Contents
following the time that the stockholder becomes an “interested stockholder.” An “interested stockholder” is defined to include persons owning directly or indirectly 15% or more of the outstanding voting stock of a corporation.
Our amended and restated certificate of incorporation and our amended and restated by-laws include provisions that may have anti-takeover effects and may delay, deter or prevent a takeover attempt that our stockholders might consider in their best interests. For example, our amended and restated certificate of incorporation and by-laws prohibit stockholders from calling special meetings of our stockholders and, from and after such time as ING Group ceases to beneficially own at least 50% of our outstanding common stock, from taking action by written consent. See “Description of Capital Stock—Certain Anti-Takeover Provisions of our Amended and Restated Certificate of Incorporation, our Amended and Restated Bylaws and Applicable Law”.
Our amended and restated certificate of incorporation also includes provisions designed to preserve the benefit of certain tax attributes of the Company, which limit the amount of our common stock that an investor can acquire. See “Description of Capital Stock—Ownership Limitations”.
The completion of the Direct Share Buyback is subject to conditions and there can be no assurance that the Direct Share Buyback will occur.
The completion of this offering is not conditioned upon the closing of the Direct Share Buyback. Accordingly, the possibility exists that this offering will be completed and the Direct Share Buyback will not have been completed, for example due to the failure to satisfy or waive one or more closing conditions to the Direct Share Buyback. In such circumstances, the shares of common stock that would otherwise have been repurchased by us in the Direct Share Buyback would remain owned by ING Group, which would increase ING Group’s proportionate share of our outstanding common stock above what it would have been had the Direct Share Buyback been completed. In addition, in such a circumstance the number of shares of our common stock outstanding immediately following this offering would be higher than it would be if the Direct Share Buyback were to have been completed. Finally, to the extent we sought to repurchase our common stock through other means, we might face higher repurchase costs.
Risks Related to Our Holding Company Structure
As holding companies, ING U.S., Inc. and Lion Holdings depend on the ability of their subsidiaries to transfer funds to them to meet their obligations.
ING U.S., Inc. is the holding company for all our operations, and dividends, returns of capital and interest income on intercompany indebtedness from ING U.S., Inc.’s subsidiaries are the principal sources of funds available to ING U.S., Inc. to pay principal and interest on its outstanding indebtedness, to pay corporate operating expenses, to pay any stockholder dividends and to meet its other obligations. These subsidiaries are legally distinct from ING U.S., Inc. and, except in the case of Lion Holdings, which is the guarantor of certain of our outstanding indebtedness, have no obligation to pay amounts due on the debt of ING U.S., Inc. or to make funds available to ING U.S., Inc. for such payments. The ability of our subsidiaries to pay dividends or other distributions to ING U.S., Inc. in the future will depend on their earnings, tax considerations, covenants contained in any financing or other agreements and applicable regulatory restrictions. In addition, such payments may be limited as a result of claims against our subsidiaries by their creditors, including suppliers, vendors, lessors and employees. The ability of our insurance subsidiaries to pay dividends and make other distributions to ING U.S., Inc. will further depend on their ability to meet applicable regulatory standards and receive regulatory approvals, as discussed below under “—The ability of our insurance subsidiaries to pay dividends and other distributions to ING U.S., Inc. and Lion Holdings is further limited by state insurance laws, and our insurance subsidiaries may not generate sufficient statutory earnings or have sufficient statutory surplus to enable them to pay ordinary dividends.”
-65-
Table of Contents
Lion Holdings is wholly owned by ING U.S., Inc. and is also a holding company, and accordingly its ability to make payments under its guarantees of our indebtedness is subject to restrictions and limitations similar to ING U.S., Inc. Neither ING U.S., Inc., nor Lion Holdings, has significant sources of cash flow other than from our subsidiaries that do not guarantee such indebtedness.
If the ability of our insurance or non-insurance subsidiaries to pay dividends or make other distributions or payments to ING U.S., Inc. and Lion Holdings is materially restricted by regulatory requirements, other cash needs, bankruptcy or insolvency, or our need to maintain the financial strength ratings of our insurance subsidiaries, or is limited due to operating results or other factors, we may be required to raise cash through the incurrence of debt, the issuance of equity or the sale of assets. However, there is no assurance that we would be able to raise cash by these means. This could materially and adversely affect the ability of ING U.S., Inc. and Lion Holdings to pay their obligations.
The ability of our insurance subsidiaries to pay dividends and other distributions to ING U.S., Inc. and Lion Holdings is further limited by state insurance laws, and our insurance subsidiaries may not generate sufficient statutory earnings or have sufficient statutory surplus to enable them to pay ordinary dividends.
The payment of dividends and other distributions to ING U.S., Inc. and Lion Holdings by our insurance subsidiaries is regulated by state insurance laws and regulations.
The jurisdictions in which our insurance subsidiaries are domiciled impose certain restrictions on the ability to pay dividends to their respective parents. These restrictions are based, in part, on the prior year’s statutory income and surplus. In general, dividends up to specified levels are considered ordinary and may be paid without prior regulatory approval. Dividends in larger amounts, or extraordinary dividends, are subject to approval by the insurance commissioner of the relevant state of domicile. Under the insurance laws applicable to our insurance subsidiaries domiciled in Colorado, Connecticut, Indiana, Iowa and Minnesota, an extraordinary dividend or distribution is defined as a dividend or distribution that, together with other dividends and distributions made within the preceding twelve months, exceeds the greater of (1) 10% of the insurer’s policyholder surplus as of the preceding December 31 or (2) the insurer’s net gain from operations for the twelve-month period ended the preceding December 31, in each case determined in accordance with statutory accounting principles. New York has similar restrictions, except that New York’s statutory definition of extraordinary dividend or distribution is an aggregate amount in any calendar year that exceeds the lesser of (1) 10% of policyholder’s surplus as of the preceding December 31 or (2) the insurer’s net gain from operations for the twelve-month period ended the preceding December 31, not including realized capital gains. In addition, under the insurance laws of the states of domicile of our Principal Insurance Subsidiaries, no dividend or other distribution exceeding an amount equal to an insurance company’s earned surplus may be paid without the domiciliary insurance regulator’s prior approval. From time to time, the NAIC and various state insurance regulators have considered, and may in the future consider, proposals to further limit dividend payments that an insurance company may make without regulatory approval. No assurance is given that more stringent restrictions will not be adopted from time to time by jurisdictions in which our insurance subsidiaries are domiciled, and such restrictions could have the effect, under certain circumstances, of significantly reducing dividends or other amounts payable to ING U.S., Inc. or Lion Holdings by our insurance subsidiaries without prior approval by regulatory authorities. In addition, in the future, we may become subject to debt instruments or other agreements that limit the ability of our insurance subsidiaries to pay dividends or make other distributions. The ability of our insurance subsidiaries to pay dividends or make other distributions is also limited by our need to maintain the financial strength ratings assigned to such subsidiaries by the rating agencies. These ratings depend to a large extent on the capitalization levels of our insurance subsidiaries.
Prior to our initial public offering, our Principal Insurance Subsidiaries domiciled in Colorado, Iowa and Minnesota each had negative earned surplus accounts, and therefore had no ordinary dividend capacity. In order to obtain dividends or distributions from these insurance companies, we historically obtained approval from the insurance companies’ respective state regulators, which could be granted or withheld in the regulators’
-66-
Table of Contents
discretion, for extraordinary dividends or distributions. On May 8, 2013, following the completion of our IPO and payment of $1,434.0 million of extraordinary distributions, these insurance companies each reset, on a one-time basis, their respective negative unassigned funds account as of December 31, 2012 (as reported in their respective 2012 statutory annual statements) to zero (with an offsetting reduction in gross paid-in capital and contributed surplus). These resets were made pursuant to permitted practices in accordance with statutory accounting practices granted by their respective domiciliary insurance regulators. A detailed description of the permitted practices is included in “Regulation—Insurance Regulation—Insurance Holding Company Regulation”.
This reset allows our Principal Insurance Subsidiaries domiciled in Colorado, Iowa and Minnesota to build up ordinary dividend capacity to the extent their operating results subsequent to December 31, 2012 generate positive earned surplus. Under applicable domiciliary insurance regulations, our Principal Insurance Subsidiaries must deduct any extraordinary distributions or dividends paid in the preceding twelve months in calculating dividend capacity. We expect that these insurance subsidiaries will have ordinary dividend capacity only after twelve months have passed since the date the extraordinary distributions described above were paid. ILIAC had ordinary dividend capacity before such date and paid an ordinary dividend of $90 million to Lion Holdings in December 2013.
Our Principal Insurance Subsidiaries, however, may not succeed in building up sufficient positive earned surplus within those timeframes or at all. If our Principal Insurance Subsidiaries do not succeed in building up sufficient positive earned surplus to have ordinary dividend capacity, then we may seek extraordinary dividends or distributions (for which prior approval of their respective domiciliary insurance regulators would be required, and can be granted or withheld in the discretion of the regulators). There can be no assurance that our Principal Insurance Subsidiaries will receive approval for extraordinary distribution payments in the future.
The payment of dividends by our captive reinsurance subsidiaries is regulated by their respective governing licensing orders and restrictions in their respective insurance securitization agreements. Generally, our captive reinsurance subsidiaries may not declare or pay dividends in any form to their parent companies other than in accordance with their respective insurance securitization transaction agreements and their respective governing licensing orders, and in no event may the dividends decrease the capital of the captive below the minimum capital requirement applicable to it, and, after giving effect to the dividends, the assets of the captive paying the dividend must be sufficient to satisfy its domiciliary insurance regulator that it can meet its obligations. Likewise, our Arizona captive may not declare or pay dividends in any form to us other than in accordance with its annual capital and dividend plan as approved by the ADOI, which includes a minimum capital requirement.
-67-
Table of Contents
We will not receive any of the proceeds from the sale of shares in this offering.
We currently intend to continue to pay quarterly cash dividends on our common stock at the current amount of $0.01 per share, although any declaration of dividends will be at the discretion of the Board of Directors and will depend on our financial condition, earnings, cash needs, regulatory constraints, capital requirements (including requirements of our subsidiaries) and any other factors that the Board of Directors deems relevant in making such a determination. In addition, we have issued junior subordinated debt securities that limit our ability to pay dividends on or repurchase our common stock in certain circumstances. Therefore, there can be no assurance that we will pay any dividends in the future to holders of our common stock, or as to the amount of any such dividends.
Delaware law requires that dividends be paid only out of “surplus,” which is defined as the fair market value of our net assets, minus our stated capital; or out of the current or the immediately preceding year’s earnings. We are a holding company, and we have no direct operations. All of our business operations are conducted through our subsidiaries. The states in which our insurance subsidiaries are domiciled impose certain restrictions on our insurance subsidiaries’ ability to pay dividends to us. These restrictions are based in part on the prior year’s statutory income and surplus. Such restrictions, or any future restrictions adopted by the states in which our insurance subsidiaries are domiciled, could have the effect, under certain circumstances, of significantly reducing dividends or other amounts payable to us by our subsidiaries without affirmative approval of state regulatory authorities. For more details, see “Risk Factors—Risks Related to our Holding Company Structure.”
On February 6, 2014, our Board of Directors declared a dividend on our common stock of $0.01 per share, which will be paid on March 31, 2014 to shareholders of record as of February 28, 2014. Dividends of the same amount per share were paid on December 30, 2013 and October 1, 2013. No other dividend has been declared since May 2, 2013.
PRICE RANGE OF ING U.S., INC. COMMON STOCK
ING U.S., Inc. common stock is listed on the NYSE under the symbol “VOYA”. From May 2, 2013 (the initial listing date of ING U.S. common stock) to June 28, 2013, the high and low reported prices for ING U.S., Inc. common stock on the NYSE were $29.06 and $19.20 per share, respectively; from July 1, 2013 to September 30, 2013, the high and low reported prices for ING U.S., Inc. common stock on the NYSE were $32.70 and $26.97 per share, respectively; from October 1, 2013 to December 31, 2013, the high and low reported prices for ING U.S., Inc. common stock on the NYSE were $36.08 and $28.64, respectively; and from January 1, 2014 to March 17, 2014, the high and low reported prices for ING U.S., Inc. common stock on the NYSE were $37.31 and $32.70, respectively.
-68-
Table of Contents
The following table presents our capitalization as of December 31, 2013, on an actual basis and on a pro forma basis, giving effect to the Direct Share Buyback as if it had occurred on December 31, 2013. Pro forma amounts assume that 7,022,471 shares are repurchased from ING Group in the Direct Share Buyback (based on an assumed per share repurchase price of $35.60, the closing price per share of our common stock on March 17, 2014, as reported by the NYSE), and that such repurchased shares are held as treasury stock. The actual number of shares repurchased in the Direct Share Buyback will be equal to $250 million divided by the per share proceeds, before expenses, to the Selling Stockholder in this offering, as shown on the cover of this prospectus.
You should read this table together with the sections entitled “Selected Consolidated Financial Data”, “Management’s Discussion and Analysis of Financial Condition and Results of Operations” and our Consolidated Financial Statements and related notes included elsewhere in this prospectus.
| As of December 31, 2013 | ||||||||
| ($ in millions) | Actual | Pro Forma | ||||||
| Short-term debt: |
||||||||
| Short-term debt |
$ | — | $ | — | ||||
| Current portion of long-term debt |
— | — | ||||||
|
|
|
|
|
|||||
| Total short-term debt |
$ | — | $ | — | ||||
|
|
|
|
|
|||||
| Long-term debt: |
||||||||
| Long-term debt, capital leases and notes payable, net of current portion |
$ | 3,514.7 | $ | 3,514.7 | ||||
|
|
|
|
|
|||||
| Total long-term debt |
$ | 3,514.7 | $ | 3,514.7 | ||||
|
|
|
|
|
|||||
| Shareholders’ equity: |
||||||||
| Common stock, par value $0.01 per share; 900,000,000 shares authorized; 261,754,931 shares issued, 261,675,811 shares outstanding, actual; 261,754,931 issued, 254,653,340 outstanding, pro forma |
$ | 2.6 | $ | 2.6 | ||||
| Treasury stock, at cost (79,120 actual; 7,101,591, pro forma) |
|
— |
|
(250 | ) | |||
| Additional paid-in capital |
23,563.7 | 23,563.7 | ||||||
| Retained earnings (deficit): |
||||||||
| Appropriated-consolidated investment entities |
18.4 | 18.4 | ||||||
| Unappropriated |
(12,161.6 | ) | (12,161.6 | ) | ||||
|
|
|
|
|
|||||
| Total shareholders’ equity (excluding AOCI and non-controlling interest) |
$ | 11,423.1 | $ | 11,173.1 | ||||
|
|
|
|
|
|||||
| Total capitalization (total debt plus shareholders’ equity excluding items noted above) |
$ | 14,937.8 | $ |
14,687.8 |
| |||
|
|
|
|
|
|||||
-69-
Table of Contents
SELECTED CONSOLIDATED UNAUDITED
QUARTERLY FINANCIAL DATA
The following selected unaudited consolidated financial data for each of the quarters in the years ended December 31, 2013, 2012 and 2011 have been derived from the unaudited Consolidated Financial Statements of the Company and, in the opinion of the management of the Company, reflect all adjustments, consisting only of normal recurring adjustments, necessary for the fair presentation of such date for the respective interim periods. The results of operations for these periods are not necessarily indicative of the results that might be expected for any future period.
| Three Months Ended | ||||||||||||||||
| ($ in millions, except for share amounts) | March 31 | June 30 | September 30 | December 31 | ||||||||||||
| (unaudited) | ||||||||||||||||
| 2013 |
||||||||||||||||
| Total revenues |
$ | 1,818.6 | $ | 2,140.6 | $ | 2,435.3 | $ | 2,364.0 | ||||||||
| Total benefits and expenses |
2,032.9 | 2,215.8 | 2,015.3 | 1,736.4 | ||||||||||||
| Income (loss) before income taxes |
(214.3 | ) | (75.2 | ) | 420.0 | 627.6 | ||||||||||
| Net income (loss) |
(225.5 | ) | (85.3 | ) | 447.7 | 653.7 | ||||||||||
| Less: Net income (loss) attributable to noncontrolling interests |
(13.5 | ) | (3.1 | ) | 101.1 | 105.6 | ||||||||||
| Net income (loss) available to ING U.S., Inc.’s common shareholders |
(212.0 | ) | (82.2 | ) | 346.6 | 548.1 | ||||||||||
| Net income (loss) available to ING U.S., Inc.’s common shareholders per common share: |
||||||||||||||||
| Basic |
(0.92 | ) | (0.33 | ) | 1.33 | 2.10 | ||||||||||
| Diluted |
(0.92 | ) | (0.33 | ) | 1.32 | 2.08 | ||||||||||
| 2012 |
||||||||||||||||
| Total revenues |
$ | 1,485.3 | $ | 3,361.9 | $ | 2,564.3 | $ | 2,203.8 | ||||||||
| Total benefits and expenses |
1,998.2 | 2,508.8 | 2,190.4 | 2,311.9 | ||||||||||||
| Income (loss) before income taxes |
(512.9 | ) | 853.1 | 373.9 | (108.1 | ) | ||||||||||
| Net income (loss) |
(520.8 | ) | 852.1 | 386.8 | (106.9 | ) | ||||||||||
| Less: Net income (loss) attributable to noncontrolling interests |
(15.6 | ) | 217.7 | 20.3 | (84.2 | ) | ||||||||||
| Net income (loss) available to ING U.S., Inc.’s common shareholder |
(505.2 | ) | 634.4 | 366.5 | (22.7 | ) | ||||||||||
| Net income (loss) available to ING U.S., Inc.’s common shareholders per common share: |
||||||||||||||||
| Basic |
(2.20 | ) | 2.76 | 1.59 | (0.10 | ) | ||||||||||
| Diluted |
(2.20 | ) | 2.76 | 1.59 | (0.10 | ) | ||||||||||
| 2011 |
||||||||||||||||
| Total revenues |
$ | 2,246.2 | $ | 2,989.4 | $ | 3,622.6 | $ | 860.6 | ||||||||
| Total benefits and expenses |
2,083.7 | 2,296.7 | 2,767.4 | 2,293.2 | ||||||||||||
| Income (loss) before income taxes |
162.5 | 692.7 | 855.2 | (1,432.6 | ) | |||||||||||
| Net income (loss) |
243.4 | 549.5 | 1,032.6 | (1,722.7 | ) | |||||||||||
| Less: Income attributable to noncontrolling interests |
(51.3 | ) | 183.0 | (8.7 | ) | 67.9 | ||||||||||
| Net income (loss) available to ING U.S., Inc.’s common shareholder |
294.7 | 366.5 | 1,041.3 | (1,790.6 | ) | |||||||||||
| Net income (loss) available to ING U.S., Inc.’s common shareholders per common share: |
||||||||||||||||
| Basic |
1.28 | 1.59 | 4.53 | (7.78 | ) | |||||||||||
| Diluted |
1.28 | 1.59 | 4.53 | (7.78 | ) | |||||||||||
-70-
Table of Contents
SELECTED CONSOLIDATED FINANCIAL DATA
The following selected consolidated financial data for the years ended December 31, 2013, 2012, 2011 and 2010 and as of December 31, 2013, 2012 and 2011 are derived from our audited Consolidated Financial Statements, which are included elsewhere in this prospectus. The selected consolidated financial data for the year ended December 31, 2009 and as of December 31, 2010 are derived from our audited Consolidated Financial Statements, which are not included in this prospectus. The selected unaudited consolidated financial data as of December 31, 2009 is derived from our unaudited Consolidated Financial Statements for such dates, which are not included in this prospectus.
Prospective investors should read these selected consolidated financial data together with “Management’s Discussion and Analysis of Financial Condition and Results of Operations” and our Consolidated Financial Statements and the related notes included elsewhere in this prospectus.
| Year Ended December 31, | ||||||||||||||||||||
| ($ in millions, except for share data) | 2013 | 2012 | 2011 | 2010 | 2009 | |||||||||||||||
| Consolidated Operating Results |
||||||||||||||||||||
| Net investment income |
$ | 4,689.0 | $ | 4,697.9 | $ | 4,968.8 | $ | 4,987.0 | $ | 5,568.6 | ||||||||||
| Fee income |
3,666.3 | 3,515.4 | 3,603.6 | 3,516.5 | 3,325.1 | |||||||||||||||
| Premiums |
1,956.3 | 1,861.1 | 1,770.0 | 1,707.5 | 1,985.5 | |||||||||||||||
| Net realized capital gains (losses) |
(2,534.8 | ) | (1,280.8 | ) | (1,531.4 | ) | (1,678.0 | ) | (2,178.7 | ) | ||||||||||
| Total revenues |
8,758.5 | 9,615.3 | 9,718.8 | 9,274.2 | 9,364.2 | |||||||||||||||
| Interest credited and other benefits to contract owners/policyholders |
4,497.8 | 4,861.6 | 5,742.0 | 5,027.3 | 5,629.9 | |||||||||||||||
| Operating expenses |
2,686.7 | 3,155.0 | 3,030.8 | 3,033.5 | 3,352.2 | |||||||||||||||
| Net amortization of deferred policy acquisition costs and value of business acquired |
442.8 | 722.3 | 387.0 | 746.6 | 1,052.3 | |||||||||||||||
| Interest expense |
184.8 | 153.7 | 139.3 | 332.5 | 385.5 | |||||||||||||||
| Total benefits and expenses |
8,000.4 | 9,009.3 | 9,441.0 | 9,236.4 | 10,472.8 | |||||||||||||||
| Income (loss) before income taxes |
758.1 | 606.0 | 277.8 | 37.8 | (1,108.6 | ) | ||||||||||||||
| Net income (loss) |
790.6 | 611.2 | 102.8 | (133.2 | ) | (810.6 | ) | |||||||||||||
| Net income (loss) attributable to noncontrolling interest |
190.1 | 138.2 | 190.9 | (10.3 | ) | (207.4 | ) | |||||||||||||
| Net income (loss) available to ING U.S., Inc.’s common shareholders |
600.5 | 473.0 | (88.1 | ) | (122.9 | ) | (603.2 | ) | ||||||||||||
| Earnings Per Share(1) |
||||||||||||||||||||
| Net income (loss) available to ING U.S., Inc.’s common shareholders per common share: |
||||||||||||||||||||
| Basic |
$ | 2.40 | $ | 2.06 | $ | (0.38 | ) | $ | (0.53 | ) | $ | (2.62 | ) | |||||||
| Diluted |
$ | 2.38 | $ | 2.06 | $ | (0.38 | ) | $ | (0.53 | ) | $ | (2.62 | ) | |||||||
| Common shares outstanding (in millions) |
261.7 | 230.0 | 230.0 | 230.0 | 230.0 | |||||||||||||||
-71-
Table of Contents
| ($ in millions) | As of December 31, | |||||||||||||||||||
| 2013 | 2012 | 2011 | 2010 | 2009 | ||||||||||||||||
| (Unaudited) | ||||||||||||||||||||
| Consolidated Financial Position |
||||||||||||||||||||
| Total investments |
$ | 87,050.8 | $ | 95,487.6 | $ | 92,819.2 | $ | 86,886.1 | $ | 83,128.8 | ||||||||||
| Assets held in separate accounts |
106,827.1 | 97,667.4 | 88,714.5 | 95,588.1 | 88,849.4 | |||||||||||||||
| Total assets |
221,023.2 | 216,394.2 | 203,572.8 | 204,376.5 | 194,621.2 | |||||||||||||||
| Future policy benefits and contract owner account balances |
84,006.7 | 86,055.7 | 88,358.4 | 83,642.8 | 84,402.0 | |||||||||||||||
| Short-term debt |
— | 1,064.6 | 1,054.6 | 5,464.6 | 4,811.6 | |||||||||||||||
| Long-term debt |
3,514.7 | 3,171.1 | 1,343.1 | 2,784.0 | 7,001.3 | |||||||||||||||
| Liabilities related to separate accounts |
106,827.1 | 97,667.4 | 88,714.5 | 95,588.1 | 88,849.4 | |||||||||||||||
| Total ING U.S., Inc. shareholders’ equity, excluding AOCI(2) |
11,423.1 | 10,164.2 | 9,758.9 | 5,857.5 | 2,310.0 | |||||||||||||||
| Total ING U.S., Inc. shareholders’ equity |
13,272.2 | 13,874.9 | 12,353.9 | 6,830.8 | 967.1 | |||||||||||||||
| (1) | Shares outstanding and per-share amounts give retroactive effect to the 2,295.248835-to-1 stock split effected on April 11, 2013. |
| (2) | Shareholders’ equity, excluding AOCI, is derived by subtracting AOCI from ING U.S., Inc. shareholders’ equity—both components of which are presented in the respective Consolidated Balance Sheets. For a description of AOCI, see the Accumulated Other Comprehensive Income (Loss) note to the Consolidated Financial Statements. We provide shareholders’ equity, excluding AOCI, because it is a common measure used by insurance analysts and investment professionals in their evaluations. |
-72-
Table of Contents
MANAGEMENT’S DISCUSSION AND ANALYSIS OF FINANCIAL CONDITION AND
RESULTS OF OPERATIONS
For the purposes of this discussion, the “Company,” “we,” “our,” “us” and “ING U.S., Inc.” refer to ING U.S., Inc. and its subsidiaries. As of the date of this prospectus, ING Group is our majority shareholder.
The following discussion and analysis of our financial condition and results of operations should be read in conjunction with the Consolidated Financial Statements included elsewhere in this prospectus. In addition to historical data, this discussion contains forward-looking statements about our business, operations and financial performance based on current expectations that involve risks, uncertainties and assumptions. Actual results may differ materially from those discussed in the forward-looking statements as a result of various factors. See “Note Regarding Forward-Looking Statements.”
Overview
We provide our principal products and services in three ongoing businesses—Retirement Solutions, Investment Management and Insurance Solutions—and report our results for these ongoing businesses through five segments.
The Retirement Solutions business provides its products and services through two segments: Retirement and Annuities:
| • | Our Retirement segment provides tax-deferred, employer-sponsored retirement savings plans and administrative services in corporate, education, healthcare and government markets. Our Retirement segment also provides rollover IRAs and other retail financial products as well as comprehensive financial advisory services to individual customers. Our retirement products and services are distributed through multiple intermediary channels, including TPAs, independent and national wirehouse affiliated brokers and registered investment advisors, in addition to independent sales agents and consulting firms. We also have a direct sales team for large defined contribution plans and stable value business, as well as a team of affiliated brokers who sell our products both in person and via telephone. |
| • | Our Annuities segment provides fixed and indexed annuities, tax-qualified mutual fund custodial products and payout annuities for pre-retirement wealth accumulation and post-retirement income management. Annuity products are primarily distributed by independent marketing organizations, independent broker-dealers, banks, independent insurance agents, pension professionals and affiliated broker-dealers. |
The Investment Management business provides its products and services through a single segment, also called Investment Management:
| • | Our Investment Management business provides investment products and retirement solutions to both individual and institutional customers by offering domestic and international fixed income, equity, multi-asset and alternative products and solutions across a range of asset classes, geographies, market sectors, investment styles and capitalization spectrums. Investment Management products and services are primarily marketed to institutional clients, including public, corporate and union retirement plans, endowments and foundations and insurance companies, as well as individual investors and the general accounts of our insurance company subsidiaries. Investment Management products and services are distributed through a combination of our direct sales force, consultant channel and intermediary partners (such as banks, broker-dealers and independent financial advisers). |
-73-
Table of Contents
The Insurance Solutions business provides its products and services through two segments: Individual Life and Employee Benefits:
| • | Our Individual Life segment provides wealth protection and transfer opportunities through universal, variable, whole life and term life products. Our customers range across a variety of age groups and income levels. We distribute our product offering through three main channels: our independent sales channel, our strategic distribution channel and our specialty markets channel. Our independent sales channel consists of a large network of independent general agents and marketing companies who interact with the majority of licensed independent life insurance agents in the United States. Our strategic distribution channel encompasses a network of independent managing directors who support a large team of producers who engage with our broker-dealers to sell a range of products including our branded life, annuity and mutual funds. Finally, our specialty markets channel focuses on alternative distribution and consists of a large team of producers, in addition to banks, life insurance quote agencies and internet direct marketers. |
| • | Our Employee Benefits segment provides stop loss, group life, voluntary employee-paid and disability products to mid-sized and large businesses. We reinsure substantially all of our new disability sales to a third party. To distribute our products, we utilize brokers, consultants and third-party administrators. In the voluntary market, policies are marketed to employees at the worksite through enrollment firms, technology partners and brokers. |
In addition to our ongoing business, we also have Closed Blocks and Corporate reporting segments. Corporate includes our corporate operations and corporate level assets and financial obligations. The Corporate segment includes investment income on assets backing surplus in excess of amounts held at the segment level, financing and interest expenses, other items not allocated to segments, such as certain expenses and liabilities of employee benefit plans and intercompany eliminations.
Closed Blocks consists of three separate reporting segments that include run-off and legacy business lines that are no longer being actively marketed or sold, but are managed to protect regulatory and rating agency capital from equity market movements. The CBVA segment consists of variable annuity contracts that were designed to offer long-term savings products in which individual contract owners made deposits that are maintained in separate accounts. These products included options for policyholders to purchase living benefit riders. In 2009, we separated our CBVA segment from our other operations, placing it in run-off, and made a strategic decision to stop actively writing new retail variable annuity products with substantial guarantee features (the last policies were issued in 2010 and the block shifted to run-off). The Closed Block Institutional Spread Products segment historically issued GICs and funding agreements and invested amounts raised to earn a spread. While the business in the Closed Block Institutional Spread Products segment is being managed in active run-off, we continue to issue liabilities from time to time to replace liabilities that are maturing. The Closed Block Other segment consists primarily of retained and run-off activity related to divestments, including our group reinsurance and individual reinsurance businesses, three broker dealers and Life Insurance Company of Georgia. Closed Block Other also includes certain reimbursed expenses related to ING Group’s Latin America business, which was sold in December 2011. Accordingly, these segments have been classified as closed blocks and are managed separately from our ongoing business.
Trends and Uncertainties
Throughout this Management’s Discussion and Analysis (“MD&A”), we discuss a number of trends and uncertainties that we believe may materially affect our future liquidity, financial condition or results of operations. Where these trends or uncertainties are specific to a particular aspect of our business, we often include such a discussion under the relevant caption of this MD&A, as part of our broader analysis of that area of our business. In addition, the following factors represent some of the key general trends and uncertainties that have influenced the development of our business and our historical financial performance and that we believe will continue to influence our business and financial performance in the future.
-74-
Table of Contents
Market Conditions
While extraordinary monetary accommodation has suppressed volatility in rate, credit and domestic equity markets, we are cognizant of the potential for an increase in volatility upon the normalization of monetary policy. In the short to medium-term, this potential for increased volatility, coupled with prevailing low interest rates, can pressure sales and reduce demand as consumers hesitate to make financial decisions. In addition, this environment could make it difficult to manufacture products that are consistently both attractive to customers and profitable. Financial performance can be affected adversely by market volatility as fees driven by AUM fluctuate, hedging costs increase and revenue declines due to reduced sales and increased outflows. In the long-term, however, we believe the recent financial crisis and resultant lingering uncertainty will motivate individuals to seek solutions combining elements of capital preservation, income and growth. Thus, as a company with strong retirement, investment management and insurance capabilities, we believe current market conditions may ultimately enhance the attractiveness of our broad portfolio of products and services. We will need to continue to monitor the behavior of our customers, as evidenced by mortality rates, morbidity rates, annuitization rates and lapse rates, which adjusts in response to changes in market conditions in order to ensure that our products and services remain attractive as well as profitable.
Interest Rate Environment
Yields across domestic fixed income classes moved notably higher in 2013; however, interest rates remain low by historical standards. The prolonged low interest rate environment has affected and may continue to affect the demand for our products in various ways. In the short- to medium-term, we may experience lower sales and reduced demand as the low interest rate environment makes it difficult to manufacture products that are consistently both attractive to customers and profitable.
Our financial performance may also be affected adversely by the current low interest rate environment. The interest rate environment has historically influenced our business and financial performance, and we believe it will continue to do so in the future for several reasons, including the following:
| • | Our general account investment portfolio, which was approximately $85 billion as of December 31, 2013, consists predominantly of fixed income investments and currently has an average yield of approximately 5.0%. In the near term and absent further material change in yields available on fixed income investments, we expect the yield we earn on new investments will be lower than the yields we earn on maturing investments, which were generally purchased in environments where interest rates were higher than current levels. We currently anticipate that proceeds that are reinvested in fixed income investments during 2014 will earn an average yield in the range of 4.25% to 4.50%. If interest rates were to rise, we expect the yield on our new money investments would also rise and gradually converge toward the yield of those maturing assets. In addition, while less material to financial results than new money investment rates, movements in prevailing interest rates also influence the prices of fixed income investments that we sell on the secondary market rather than holding until maturity or repayment, with rising interest rates generally leading to lower prices in the secondary market, and falling interest rates generally leading to higher prices. |
| • | Certain of our products pay guaranteed minimum rates. For example, fixed accounts and a portion of the stable value accounts included within defined contribution retirement plans, UL policies and individual fixed annuities include guaranteed minimum credited rates. We are required to pay these guaranteed minimum rates even if earnings on our investment portfolio decline, with the resulting investment margin compression negatively impacting earnings. In addition, we expect more policyholders to hold policies (lower lapses) with comparatively high guaranteed rates longer in a low interest rate environment. Conversely, a rise in average yield on our investment portfolio would positively impact earnings if the average interest rate we pay on our products does not rise correspondingly. Similarly, we expect policyholders would be less likely to hold policies (higher lapses) with existing guarantees as interest rates rise. |
-75-
Table of Contents
| • | Our CBVA segment provides certain guaranteed minimum benefits. A prolonged low interest rate environment may subject us to increased hedging costs or an increase in the amount of statutory reserves that our insurance subsidiaries are required to hold for these variable annuity guarantees, lowering their statutory surplus, which would adversely affect their ability to pay dividends to us. A prolonged low interest rate environment may also affect the perceived value of guaranteed minimum income benefits, which in turn may lead to a higher rate of annuitization of those products over time. For additional information on the CBVA segment’s sensitivity to interest rates, see “Business—Closed Block—CBVA” and “—Quantative and Qualitative Disclosures About Market Risk.” |
In the long-term, however, we believe the recent financial crisis and resultant lingering uncertainty will motivate individuals to seek solutions combining elements of capital preservation, income and growth. Thus, as a company with strong retirement, investment management and insurance capabilities, we believe current market conditions may ultimately enhance the attractiveness of our broad portfolio of products and services. We will need to continue to monitor the behavior of our customers, as evidenced by annuitization rates and lapse rates, which adjusts in response to changes in market conditions, in order to ensure that our products and services remain attractive as well as profitable.
The Impact of our CBVA Segment on U.S. GAAP Earnings
Our ongoing management of our CBVA segment is focused on preserving our current capitalization status through careful risk management and hedging. Because U.S. GAAP accounting differs from the methods used to determine regulatory and rating agency capital measures, our hedge programs may create earnings volatility in our U.S. GAAP financial statements.
Governmental and Public Policy Impact on Demand for Our Products
The demand for our products is influenced by a dynamic combination of governmental and public policy factors. We anticipate that legislative and other governmental activity—and our ability to flexibly respond to changes resulting from such activity—will be crucial to our long-term financial performance. In particular, the demand for our products is influenced by the following factors:
| • | Availability and quality of public retirement solutions: The lack of comprehensive or sufficient government-sponsored retirement solutions has been a significant driver of the popularity of private sector retirement products. We believe that concerns regarding Social Security and the reduced enrollment in defined benefit retirement plans may further increase the demand for private sector retirement solutions. The impact of any legislative actions or new government programs relating to retirement solutions on our business and financial performance will depend substantially on the level of private sector involvement and our ability to participate in any such programs. We believe we are well positioned to take advantage of any future developments involving participation in any such programs by private sector providers. |
| • | Tax-advantaged status: Many of the retirement savings, accumulation and protection products we sell qualify for tax-advantaged status. Changes in U.S. tax laws that alter the tax benefits of certain investment vehicles could have a material effect on demand for our products. |
Aging of the U.S. Population
We believe that the aging of the U.S. population will affect both the demand for our products and the levels of our AUM and AUA. As the “baby boomer” generation prepares for retirement, we believe that demand for retirement savings, growth and income products will grow. The impact of this growth may be offset to some extent by asset outflows as an increasing percentage of the population begins withdrawing assets to convert their savings into income.
-76-
Table of Contents
Competition
Our ongoing business operates in highly competitive markets. We face a variety of large and small industry participants, including diversified financial institutions, investment managers and insurance companies. These companies compete in one form or another for the growing pool of retirement assets driven by a number of exogenous factors such as the continued aging of the U.S. population and the reduction in safety nets provided by governments and corporations. In many segments, product differentiation is difficult as product development and life cycles have shortened. In addition, we have experienced pressure on fees as product unbundling and lower cost alternatives have emerged. As a result, scale and the ability to provide value-added services and build long-term relationships are important factors to compete effectively. We believe that our leading presence in the retirement market and resulting relationships with millions of participants, diverse range of capabilities (as a provider of retirement, investment management and insurance products and services) and broad distribution network uniquely position us to effectively serve consumers’ increasing demand for retirement savings, income and protection solutions.
Seasonality
Our ongoing business results can vary from quarter to quarter as a result of seasonal factors. For example, the first quarters of each year typically have elevated operating expenses, reflecting higher payroll taxes and certain other annual expenses that are concentrated in the first quarter. These incremental expenses typically add approximately $10 to $15 million to our operating expenses in the first quarter. The first quarters also tend to have lower investment income from carried interest income from Investment Management and a higher Group Life loss ratio in Employee Benefits. In addition, the fourth quarters tend to have higher levels of performance fees in Investment Management.
Operating Measures
This management’s discussion and analysis includes discussion of operating earnings before income taxes and operating revenues, each of which is a measure that is not determined in accordance with U.S. GAAP, because our management uses these measures to manage our businesses and allocate our resources. We also discuss these measures generally because we believe that they provide our investors with useful information regarding our financial performance. In particular, these measures facilitate a comparison of period-to-period results without the effect of the volatility created by certain changes in the financial markets that affect our financial results as reported under U.S. GAAP. Other companies may use similarly titled non-U.S. GAAP financial measures that are calculated differently from the way we calculate such measures, and accordingly, our non-U.S. GAAP financial measures may not be comparable to similar measures used by other companies.
We also discuss certain operating measures, described below, as well as operating earnings before income taxes and operating revenue which provide useful information about our businesses and the operational factors underlying our financial performance. See “Note 20. Segments” for a description of the adjustments made to reconcile Income (loss) before income taxes to Operating earnings before income taxes and the adjustments made to reconcile Total revenues to Operating revenues.
Operating Earnings before Income Taxes
Operating earnings before income taxes is an internal measure we use to evaluate segment performance. Operating earnings before income taxes does not replace Net income (loss) as the U.S. GAAP measure of the consolidated results of operations and consists of operating revenues less operating benefits and expenses. Each segment’s Operating earnings before income taxes is calculated by adjusting Income (loss) before income taxes for the following items:
| • | Net investment gains (losses), net of related amortization of DAC, VOBA, sales inducements and unearned revenue. Net investment gains (losses) include gains (losses) on the sale of securities, |
-77-
Table of Contents
| impairments, changes in the fair value of investments using the fair value option (“FVO”) unrelated to the implied loan-backed security income recognition for certain mortgage-backed obligations and changes in the fair value of derivative instruments, excluding realized gains (losses) associated with swap settlements and accrued interest; |
| • | Net guaranteed benefit hedging gains (losses), which include changes in the fair value of derivatives related to guaranteed benefits, net of related reserve increases (decreases) and net of related amortization of DAC, VOBA and sales inducements, less the estimated cost of these benefits. The estimated cost, which is reflected in operating results, reflects the expected cost of these benefits if markets perform in line with our long-term expectations and includes the cost of hedging. All other derivative and reserve changes related to guaranteed benefits are excluded from operating results, including the impacts related to changes in our nonperformance spread; |
| • | Income (loss) related to business exited through reinsurance or divestment; |
| • | Income (loss) attributable to noncontrolling interests; |
| • | Income (loss) related to early extinguishment of debt; |
| • | Impairment of goodwill, value of management contract rights and value of customer relationships acquired; |
| • | Immediate recognition of net actuarial gains (losses) related to our pension and other postretirement benefit obligations and gains (losses) from plan amendments and curtailments; and |
| • | Other items, including restructuring expenses (severance, lease write-offs, etc.), integration expenses related to our acquisition of CitiStreet and certain third-party expenses and deal incentives related to the divestment of ING U.S., Inc. by ING Group. |
Our CBVA segment is managed to focus on protecting regulatory and rating agency capital rather than achieving operating metrics and, therefore, its results of operations are not reflected within operating earnings before income taxes. When we present the adjustments to Income (loss) before income taxes on a consolidated basis, each adjustment excludes the relative portions attributable to our CBVA segment.
The most directly comparable U.S. GAAP measure to Operating earnings before income taxes is Income (loss) before income taxes. For a reconciliation of Operating earnings before income taxes to Income (loss) before income taxes, see “—Results of Operations—Company Consolidated” below.
Operating Revenues
Operating revenues is a measure of our segment revenues. We calculate operating revenues by adjusting each segment’s revenue for the following items:
| • | Net realized investment gains (losses) and related charges and adjustments, which include gains (losses) on the sale of securities, impairments, changes in the fair value of investments using the FVO unrelated to the implied loan-backed security income recognition for certain mortgage-backed obligations and changes in the fair value of derivative instruments, excluding realized gains (losses) associated with swap settlements and accrued interest. These items are net of related amortization of unearned revenue; |
| • | Gain (loss) on change in fair value of derivatives related to guaranteed benefits, which include changes in the fair value of derivatives related to guaranteed benefits, less the estimated cost of these benefits. The estimated cost, which is reflected in operating results, reflects the expected cost of these benefits if markets perform in line with our long-term expectations and includes the cost of hedging. All other derivative and reserve changes related to guaranteed benefits are excluded from operating revenues, including the impacts related to changes in our nonperformance spread; |
-78-
Table of Contents
| • | Revenues related to businesses exited through reinsurance or divestment; |
| • | Revenues attributable to noncontrolling interests; |
| • | Other adjustments to operating revenues primarily reflect fee income earned by our broker dealers for sales of non-proprietary products, which are reflected net of commission expense in our segments’ operating revenues as well as other items where the income is passed on to third parties. |
Operating revenues also excludes the revenues of our CBVA segment, since this segment is managed to focus on protecting regulatory and rating agency capital rather than achieving operating metrics. When we present the adjustments to Total revenues on a consolidated basis, each adjustment excludes the relative portions attributable to our CBVA segment.
The most directly comparable U.S. GAAP measure to Operating revenues is Total revenues. For a reconciliation of Operating revenue to Total revenues, see “—Results of Operations—Company Consolidated” below.
AUM and AUA
A substantial portion of our fees, other charges and margins are based on AUM. AUM represents on-balance sheet assets supporting customer account values/liabilities and surplus as well as off-balance sheet institutional/mutual funds. Customer account values reflect the amount of policyholder equity that has accumulated within retirement, annuity and UL products. AUM includes general account assets managed by our Investment Management segment in which we bear the investment risk, separate account assets in which the contract owner bears the investment risk and institutional/mutual funds, which are excluded from our balance sheet. AUM-based revenues increase or decrease with a rise or fall in the amount of AUM, whether caused by changes in capital markets or by net flows.
AUM is principally affected by net deposits (i.e., new deposits, less surrenders and other outflows) and investment performance (i.e., interest credited to contract owner accounts for assets that earn a fixed return or market performance for assets that earn a variable return). Separate account AUM and institutional/mutual fund AUM include assets managed by our Investment Management segment, as well as assets managed by third-party investment managers. Our Investment Management segment reflects the revenues earned for managing affiliated assets for our other segments (based on arm’s length agreements) as well as assets managed for third parties. Our consolidated AUM includes eliminations of AUM managed by our Investment Management segment that is also reflected in other segments’ AUM and adjustments for AUM not reflected in any segments.
AUA represents accumulated assets on contracts pursuant to which we either provide administrative services or product guarantees for assets managed by third parties. These contracts are not insurance contracts and the assets are excluded from the Consolidated Financial Statements. Fees earned on AUA can be based on the number of participants, asset levels and/or the level of services or product guarantees that are provided.
Sales Statistics
In our discussion of our segment results under “Results of Operations—Segment by Segment,” we sometimes refer to sales activity for various products. The term “sales” is used differently for different products, as described more fully below. These sales statistics do not correspond to revenues under U.S. GAAP and are used by us as operating measures underlying our financial performance.
Net flows are deposits less redemptions (including benefits and other product charges).
Sales for Individual Life products are based on a calculation of weighted average annual premiums (“WAP”). Sales for Employee Benefits products are based on a calculation of annual premiums, which represents regular premiums on new policies, plus a portion of new single premiums.
-79-
Table of Contents
WAP is defined as the amount of premium for a policy’s first year that is eligible for the highest first year commission rate, plus a varying portion of any premium in excess of this base amount, depending on the product. WAP is a key measure of recent sales performance of our products and is an indicator of the general growth or decline in certain lines of business. WAP is not equal to premium revenue under U.S. GAAP. Renewal premiums on existing policies are included in U.S. GAAP premium revenue in addition to first year premiums and thus changes in persistency of existing in-force business can potentially offset growth from current year sales.
Total gross premiums and deposits are defined as premium revenue and deposits for policies written and assumed. This measure provides information as to growth and persistency trends related to premium and deposits.
Other Measures
Total annualized in-force premiums are defined as a full year of premium at the rate in effect at the end of the period. This measure provides information as to the growth and persistency trends in premium revenue.
Interest adjusted loss ratios are defined as the ratio of benefits expense to premium revenue exclusive of the discount component in the change in benefit reserve. This measure reports the loss ratio related to mortality on life products and morbidity on health products.
In-force face amount is defined as the total life insurance coverage in effect as of the end of the period presented for business written and assumed. This measure provides information as to changes in policy growth and persistency with respect to death benefit coverage.
In-force policy count is defined as the number of policies written and assumed with coverage in effect as of the end of the period. This measure provides information as to policy growth and persistency.
New business policy count (paid) is defined as the number of policies issued during the period for which initial premiums have been paid by the policyholder. This measure provides information as to policy growth from sales during the period.
-80-
Table of Contents
Results of Operations—Company Consolidated
The following table summarizes the consolidated financial information for the periods indicated:
| Years Ended December 31, | ||||||||||||
| ($ in millions) | 2013 | 2012 | 2011 | |||||||||
| Revenues: |
||||||||||||
| Net investment income |
$ | 4,689.0 | $ | 4,697.9 | $ | 4,968.8 | ||||||
| Fee income |
3,666.3 | 3,515.4 | 3,603.6 | |||||||||
| Premiums |
1,956.3 | 1,861.1 | 1,770.0 | |||||||||
| Net realized capital gains (losses) |
(2,534.8 | ) | (1,280.8 | ) | (1,531.4 | ) | ||||||
| Other revenue |
433.0 | 378.5 | 428.2 | |||||||||
| Income (loss) related to consolidated investment entities: |
||||||||||||
| Net investment income |
545.2 | 556.6 | 528.4 | |||||||||
| Changes in fair value related to collateralized loan obligations |
3.5 | (113.4 | ) | (48.8 | ) | |||||||
|
|
|
|
|
|
|
|||||||
| Total revenues |
8,758.5 | 9,615.3 | 9,718.8 | |||||||||
|
|
|
|
|
|
|
|||||||
| Benefits and expenses: |
||||||||||||
| Interest credited and other benefits to contract owners/policyholders |
4,497.8 | 4,861.6 | 5,742.0 | |||||||||
| Operating expenses |
2,686.7 | 3,155.0 | 3,030.8 | |||||||||
| Net amortization of deferred policy acquisition costs and value of business acquired |
442.8 | 722.3 | 387.0 | |||||||||
| Interest expense |
184.8 | 153.7 | 139.3 | |||||||||
| Operating expenses related to consolidated investment entities: |
||||||||||||
| Interest expense |
180.6 | 106.4 | 68.4 | |||||||||
| Other expense |
7.7 | 10.3 | 73.5 | |||||||||
|
|
|
|
|
|
|
|||||||
| Total benefits and expenses |
8,000.4 | 9,009.3 | 9,441.0 | |||||||||
|
|
|
|
|
|
|
|||||||
| Income (loss) before income taxes |
758.1 | 606.0 | 277.8 | |||||||||
| Income tax expense (benefit) |
(32.5 | ) | (5.2 | ) | 175.0 | |||||||
|
|
|
|
|
|
|
|||||||
| Net income (loss) |
790.6 | 611.2 | 102.8 | |||||||||
| Less: Net income (loss) attributable to noncontrolling interest |
190.1 | 138.2 | 190.9 | |||||||||
|
|
|
|
|
|
|
|||||||
| Net income (loss) available to our common shareholders |
$ | 600.5 | $ | 473.0 | $ | (88.1 | ) | |||||
|
|
|
|
|
|
|
|||||||
-81-
Table of Contents
The following table summarizes AUM and AUA as of the dates indicated:
| As of December 31, | ||||||||||||
| ($ in millions) | 2013 | 2012 | 2011 | |||||||||
| AUM and AUA |
||||||||||||
| Retirement Solutions: |
||||||||||||
| Retirement |
$ | 343,014.0 | $ | 304,146.7 | $ | 287,843.7 | ||||||
| Annuities |
26,646.7 | 26,101.1 | 27,690.2 | |||||||||
| Investment Management |
257,748.8 | 236,446.8 | 225,114.0 | |||||||||
| Insurance Solutions: |
||||||||||||
| Individual Life |
15,995.6 | 15,322.5 | 14,769.8 | |||||||||
| Employee Benefits |
1,755.1 | 1,759.5 | 1,741.2 | |||||||||
| Eliminations/Other |
(183,585.9 | ) | (170,346.5 | ) | (167,939.3 | ) | ||||||
|
|
|
|
|
|
|
|||||||
| Total Ongoing Businesses |
461,574.3 | 413,430.1 | 389,219.6 | |||||||||
| Closed Blocks: |
||||||||||||
| Closed Block Variable Annuity |
45,699.0 | 43,198.4 | 42,645.5 | |||||||||
| Closed Block Institutional Spread Products |
2,711.6 | 3,805.6 | 5,581.7 | |||||||||
| Closed Block Other |
542.9 | 566.5 | 599.6 | |||||||||
|
|
|
|
|
|
|
|||||||
| Total Closed Blocks |
48,953.5 | 47,570.5 | 48,826.8 | |||||||||
|
|
|
|
|
|
|
|||||||
| Total AUM and AUA |
$ | 510,527.8 | $ | 461,000.6 | $ | 438,046.4 | ||||||
|
|
|
|
|
|
|
|||||||
| AUM |
$ | 274,341.9 | $ | 247,325.1 | $ | 229,680.4 | ||||||
| AUA |
236,185.9 | 213,675.5 | 208,366.0 | |||||||||
|
|
|
|
|
|
|
|||||||
| Total AUM and AUA |
$ | 510,527.8 | $ | 461,000.6 | $ | 438,046.4 | ||||||
|
|
|
|
|
|
|
|||||||
-82-
Table of Contents
The following table summarizes the relative contributions of each segment to Operating earnings before income taxes for the periods indicated, and a reconciliation of Operating earnings before income taxes to Income (loss) before income taxes:
| Years Ended December 31, | ||||||||||||
| ($ in millions) | 2013 | 2012 | 2011 | |||||||||
| Retirement Solutions: |
||||||||||||
| Retirement |
$ | 595.8 | $ | 448.6 | $ | 441.9 | ||||||
| Annuities |
293.8 | 102.2 | 387.6 | |||||||||
| Investment Management |
178.1 | 134.5 | 87.5 | |||||||||
| Insurance Solutions: |
||||||||||||
| Individual Life |
254.8 | 196.2 | 279.3 | |||||||||
| Employee Benefits |
106.1 | 109.4 | 83.3 | |||||||||
|
|
|
|
|
|
|
|||||||
| Total Ongoing Business |
1,428.6 | 990.9 | 1,279.6 | |||||||||
| Corporate |
(210.6 | ) | (182.3 | ) | (230.2 | ) | ||||||
| Closed Blocks: |
||||||||||||
| Closed Block Institutional Spread Products |
35.9 | 45.7 | 83.2 | |||||||||
| Closed Block Other |
14.7 | 64.0 | (13.0 | ) | ||||||||
|
|
|
|
|
|
|
|||||||
| Total Closed Blocks(1) |
50.6 | 109.7 | 70.2 | |||||||||
|
|
|
|
|
|
|
|||||||
| Total operating earnings before income taxes |
1,268.6 | 918.3 | 1,119.6 | |||||||||
| Adjustments: |
||||||||||||
| Closed Block Variable Annuity |
(1,209.3 | ) | (692.3 | ) | (564.5 | ) | ||||||
| Net investment gains (losses) and related charges and adjustments |
212.1 | 455.5 | 71.8 | |||||||||
| Net guaranteed benefit hedging gains (losses) and related charges and adjustments |
19.4 | 97.2 | (269.4 | ) | ||||||||
| Loss related to businesses exited through reinsurance or divestment |
(59.8 | ) | (45.8 | ) | (35.1 | ) | ||||||
| Income (loss) attributable to noncontrolling interests |
190.1 | 138.2 | 190.9 | |||||||||
| Immediate recognition of net actuarial gains (losses) related to pension and other postretirement benefit obligations and gains (losses) from plan amendments and curtailments |
405.2 | (165.0 | ) | (157.8 | ) | |||||||
| Other adjustments to operating earnings |
(68.2 | ) | (100.1 | ) | (77.7 | ) | ||||||
|
|
|
|
|
|
|
|||||||
| Income (loss) before income taxes |
$ | 758.1 | $ | 606.0 | $ | 277.8 | ||||||
|
|
|
|
|
|
|
|||||||
| (1) | Our CBVA segment is managed to focus on protecting regulatory and rating agency capital rather than achieving operating metrics and, therefore, its results of operations are not reflected within Operating earnings before income taxes. |
-83-
Table of Contents
The following table summarizes the relative contributions of each segment to Operating revenues for the periods indicated and a reconciliation of Operating revenues to Total revenues:
| Years Ended December 31, | ||||||||||||
| ($ in millions) | 2013 | 2012 | 2011 | |||||||||
| Retirement Solutions: |
||||||||||||
| Retirement |
$ | 2,399.4 | $ | 2,271.9 | $ | 2,225.4 | ||||||
| Annuities |
1,244.6 | 1,307.0 | 1,401.4 | |||||||||
| Investment Management |
607.7 | 545.5 | 491.9 | |||||||||
| Insurance Solutions: |
||||||||||||
| Individual Life |
2,791.9 | 2,793.9 | 2,785.0 | |||||||||
| Employee Benefits |
1,262.5 | 1,251.2 | 1,246.2 | |||||||||
|
|
|
|
|
|
|
|||||||
| Total Ongoing Business |
8,306.1 | 8,169.5 | 8,149.9 | |||||||||
| Corporate |
87.4 | 65.9 | (13.7 | ) | ||||||||
| Closed Blocks: |
||||||||||||
| Closed Block Institutional Spread Products |
109.1 | 127.2 | 188.1 | |||||||||
| Closed Block Other |
27.7 | 43.8 | 52.2 | |||||||||
|
|
|
|
|
|
|
|||||||
| Total Closed Blocks(1) |
136.8 | 171.0 | 240.3 | |||||||||
|
|
|
|
|
|
|
|||||||
| Total operating revenues |
8,530.3 | 8,406.4 | 8,376.5 | |||||||||
| Adjustments: |
||||||||||||
| Closed Block Variable Annuity |
(726.2 | ) | (70.0 | ) | 794.9 | |||||||
| Net realized investment gains (losses) and related charges and adjustments |
157.4 | 603.4 | 219.2 | |||||||||
| Gain (loss) on change in fair value of derivatives related to guaranteed benefits |
104.0 | 83.1 | (399.0 | ) | ||||||||
| Revenues related to businesses exited through reinsurance or divestment |
(76.2 | ) | 64.6 | 116.1 | ||||||||
| Revenues (loss) attributable to noncontrolling interests |
411.2 | 313.8 | 399.1 | |||||||||
| Other adjustments to operating revenues |
358.0 | 214.0 | 212.0 | |||||||||
|
|
|
|
|
|
|
|||||||
| Total revenues |
$ | 8,758.5 | $ | 9,615.3 | $ | 9,718.8 | ||||||
|
|
|
|
|
|
|
|||||||
| (1) | Our CBVA segment is managed to focus on protecting regulatory and rating agency capital rather than achieving operating metrics and, therefore, its results of operations are not reflected within Operating revenues. |
We believe the following tables will help investors better understand the components of the reconciliation between Operating earnings before income taxes and Income (loss) before income taxes related to Net investment gains (losses) and Net guaranteed benefits hedging gains (losses) and related charges and adjustments.
-84-
Table of Contents
The following table summarizes the adjustment to Income (loss) before taxes related to Total investment gains (losses) and the related Net amortization of DAC/VOBA and other intangibles for the periods indicated:
| Years Ended December 31, | ||||||||||||
| ($ in millions) | 2013 | 2012 | 2011 | |||||||||
| Other-than-temporary impairments |
$ | (35.7 | ) | $ | (55.1 | ) | $ | (502.7 | ) | |||
| CMO-B fair value adjustments(1) |
(87.3 | ) | 221.1 | 326.5 | ||||||||
| Gains (losses) on the sale of securities |
116.0 | 436.2 | 568.4 | |||||||||
| Other, including changes in the fair value of derivatives |
170.9 | 10.7 | (119.3 | ) | ||||||||
|
|
|
|
|
|
|
|||||||
| Total investment gains (losses) |
163.9 | 612.9 | 272.9 | |||||||||
| Net amortization of DAC/VOBA and other intangibles on above |
60.8 | (130.8 | ) | (137.6 | ) | |||||||
|
|
|
|
|
|
|
|||||||
| Net investment gains (losses), including Closed Block Variable Annuity |
224.7 | 482.1 | 135.3 | |||||||||
|
|
|
|
|
|
|
|||||||
| Less: Closed Block Variable Annuity net investment gains (losses) and related charges and adjustments |
12.6 | 26.6 | 63.5 | |||||||||
|
|
|
|
|
|
|
|||||||
| Net investment gains (losses) |
$ | 212.1 | $ | 455.5 | $ | 71.8 | ||||||
|
|
|
|
|
|
|
|||||||
| (1) | For a description of our CMO-B portfolio, see “—Investments—CMO-B Portfolio.” |
The following table summarizes the adjustment to Income (loss) before taxes related to Guaranteed benefit hedging gains (losses) net of DAC/VOBA and other intangibles amortization for the periods indicated. This table excludes CBVA.
| Years Ended December 31, | ||||||||||||
| ($ in millions) | 2013 | 2012 | 2011 | |||||||||
| Gain (loss), excluding nonperformance risk |
$ | 113.0 | $ | 188.2 | $ | (377.9 | ) | |||||
| Gain (loss) due to nonperformance risk |
(55.8 | ) | (114.2 | ) | (21.3 | ) | ||||||
|
|
|
|
|
|
|
|||||||
| Net gain (loss) prior to related amortization of DAC/VOBA and sales inducements |
57.2 | 74.0 | (399.2 | ) | ||||||||
| Net amortization of DAC/VOBA and sales inducements |
(37.8 | ) | 23.2 | 129.8 | ||||||||
|
|
|
|
|
|
|
|||||||
| Net guaranteed benefit hedging gains (losses) and related charges and adjustments |
$ | 19.4 | $ | 97.2 | $ | (269.4 | ) | |||||
|
|
|
|
|
|
|
|||||||
Notable Items
We believe the following tables will help investors identify more easily some of the larger causes of changes in our Operating earnings before income taxes during the periods discussed. The tables highlight notable items that are included in Operating earnings before income taxes from the following categories: (1) large gains or losses that are not indicative of performance in the period; (2) significant gains (losses) resulting from transactions to change our capital structure; and (3) items that typically recur but can be volatile from period-to-period (e.g., DAC/VOBA and other intangibles unlocking). In addition, we included the historic Interest expense because Interest expense has changed significantly over the period given the change in debt. There may be other items not included in the following table that caused increases (decreases) in Operating earnings before taxes for the periods presented. See the descriptions within the “Results of Operations” section for a more comprehensive discussion of the causes of changes in Operating earnings before income taxes.
Each quarter, we update our DAC/VOBA and other intangibles based on actual historical gross profits and projections of estimated gross profits. Also, generally during the third quarter, we complete our annual review of assumptions, including projection model inputs, in each of our segments (except for Investment Management, for which assumption reviews are not relevant). As a result of these reviews, we typically make a number of changes to our assumptions. The unlocking related to these quarterly updates and the third quarter annual assumption reviews is included in DAC/VOBA and other intangibles unlocking.
-85-
Table of Contents
During 2013, the Company received distributions of cash and securities in conjunction with a Lehman Brothers bankruptcy settlement (“Lehman Recovery”). In 2008, Lehman Brothers acted as a prime broker for assets held in partnership owned by the Company. In 2008, these partnership assets were written down to the then-assumed realizable value. The amount of the current distribution in excess of the book value of these assets of $135.2 million is being recognized as Net investment income within Operating earnings before income taxes, which excludes $9.0 million in Net investment income for the CBVA segment.
During 2013, the Company disposed of certain Low Income Housing Tax Credit partnerships (“LIHTC”) as a means of exiting this asset class and as a result recognized losses in Net investment income of $31.6 million.
Collectively the Lehman Recovery and LIHTC losses, net of DAC/VOBA and other intangibles impacts, are referred to as “Net gain from Lehman Recovery/LIHTC.”
During 2012, the Company entered into an agreement to sell certain general account private equity limited partnership holdings (“sale of certain alternative investments”), which resulted in a loss, which was recognized in investment income. See “-Investments—Sale of Certain Alternative Investments” for further description.
| Years Ended December 31, | ||||||||||||
| ($ in millions) | 2013 | 2012 | 2011 | |||||||||
| Interest expense (including interest rate swap settlements) |
$ | (179.7 | ) | $ | (127.8 | ) | $ | (185.7 | ) | |||
| DAC/VOBA and other intangibles unlocking(1)(2) |
133.2 | (77.0 | ) | 303.8 | ||||||||
| Net gain from Lehman Recovery/LIHTC |
87.0 | — | — | |||||||||
| Loss on sale of alternative investments(3) |
— | (92.0 | ) | — | ||||||||
| Reserve increase related to use of SSDMF |
— | — | (68.9 | ) | ||||||||
| (1) | Unlocking related to the Net gain from Lehman Recovery/LIHTC is excluded from DAC/VOBA and other intangibles unlocking for the year ended December 31, 2013 (and included in Net gain from Lehman Recovery/LIHTC). |
| (2) | Includes the impacts of the annual review of assumptions. |
| (3) | See “-Investments—Sale of Certain Alternative Investments” for a description. |
-86-
Table of Contents
The following table summarizes the net impact to Operating earnings before income taxes of the Net gain from Lehman Recovery/LIHTC and the related amortization and unlocking of DAC/VOBA and other intangibles by segment:
| Year Ended December 31, 2013 | ||||||||||||||||
| ($ in millions) | Net investment income (loss) |
DAC/VOBA and other intangibles amortization(1) |
DAC/VOBA and other intangibles unlocking(1) |
Net gain from Lehman Recovery/ LIHTC |
||||||||||||
| Retirement |
$ | 15.2 | $ | (7.0 | ) | $ | 4.7 | $ | 12.9 | |||||||
| Annuities |
20.3 | (11.4 | ) | 4.6 | 13.5 | |||||||||||
| Investment Management |
13.2 | — | — | 13.2 | ||||||||||||
| Individual Life |
47.2 | (25.1 | ) | 17.6 | 39.7 | |||||||||||
| Employee Benefits |
4.3 | — | — | 4.3 | ||||||||||||
| Corporate |
3.2 | — | — | 3.2 | ||||||||||||
| Closed Block Institutional Spread Products |
(0.4 | ) | — | — | (0.4 | ) | ||||||||||
| Closed Block Other |
0.6 | — | — | 0.6 | ||||||||||||
|
|
|
|
|
|
|
|
|
|||||||||
| Net gain included in segment Operating earnings before income taxes(2) |
$ | 103.6 | $ | (43.5 | ) | $ | 26.9 | $ | 87.0 | |||||||
|
|
|
|
|
|
|
|
|
|||||||||
| (1) | DAC/VOBA and other intangibles amortization and DAC/VOBA and other intangibles unlocking are included in Fee income, Interest credited and other benefits to contract owners/policyholders and Net amortization of DAC/VOBA (See “—Unlocking of DAC/VOBA and other Contract Owner/Policyholder Intangibles” section). |
| (2) | Amount excludes net gain for the CBVA segment of $9.0 million for the year ended December 31, 2013. |
The following table summarizes the impact to Operating earnings before income taxes of the net loss on the sale of certain alternative investments in the prior period (see “—Investments—Sale of Certain Alternative Investments” for further description by segment):
| ($ in millions) | Year Ended December 31, 2012 |
|||
| Retirement |
$ | (48.1 | ) | |
| Annuities |
(18.0 | ) | ||
| Investment Management |
2.2 | |||
| Individual Life |
(13.1 | ) | ||
| Employee Benefits |
(5.1 | ) | ||
| Closed Block Institutional Spread Products |
(8.0 | ) | ||
| Closed Block Other |
(1.9 | ) | ||
|
|
|
|||
| Net loss included in segment Operating earnings before income taxes(1) |
$ | (92.0 | ) | |
|
|
|
|||
| (1) | Amount excludes net gain for the CBVA segment of $0.1 million for the year ended December 31, 2012. |
Terminology Definitions
Net realized capital gains (losses), net realized investment gains (losses) and related charges and adjustments and net guaranteed benefit hedging losses and related charges and adjustments include changes in the fair value of derivatives. Increases in the fair value of derivative assets or decreases in the fair value of derivative liabilities result in “gains.” Decreases in the fair value of derivative assets or increases in the fair value of derivative liabilities result in “losses.”
-87-
Table of Contents
In addition, we have certain products that contain guarantees that are embedded derivatives related to guaranteed benefits, while other products contain such guarantees that are considered derivatives (collectively “guaranteed benefit derivatives”).
Year Ended December 31, 2013 Compared to Year Ended December 31, 2012
Net Income (Loss)
Net investment income decreased $8.9 million from $4,697.9 million to $4,689.0 million primarily as a result of portfolio restructuring in the prior period, the impact of the continued low interest rate environment on reinvestment rates, and lower average volumes in our Annuities and Closed Block Institutional Spread Products segments. Partially offsetting the overall decline is higher prepayment fee income, net investment income from Lehman Recovery/LIHTC in the current period, a loss on sale of certain alternative investments in the prior period and an increase in assets in our Retirement segment.
The decline in the volumes of our Annuities segment is a result of the continuing run-off of MYGAs. Our Closed Block Institutional Spreads Products business experienced a decline as a result of a decrease in block size.
Fee income increased $150.9 million from $3,515.4 million to $3,666.3 million primarily due to an increase in fees in our Retirement, CBVA and Investment Management segments associated with higher AUM.
Premiums increased $95.2 million from $1,861.1 million to $1,956.3 million primarily due to higher premiums associated with the annuitization of life contingent contracts in our CBVA segment, which are offset by a reserve increase in the corresponding Interest credited and other benefits to contract owners/policyholders.
Net realized capital losses increased $1,254.0 million from $1,280.8 million to $2,534.8 million primarily due to changes in fair value of derivatives from the CBVA segment liability hedge and CHO program, lower net realized investment gains, and changes in fair value of guaranteed benefit derivatives due to nonperformance risk in our CBVA segment. Lower gains on guaranteed benefit derivative hedging, excluding nonperformance risk, in our Retirement Solutions business were mostly offset by changes in the fair value of guaranteed benefit derivatives related to nonperformance risk. In addition, losses resulting from market value changes in the derivative associated with business reinsured are entirely offset by the corresponding Interest credited and other benefits to contract owners/policyholders. The increased losses, discussed in further detail below, were partially offset by changes in fair value of guaranteed benefit derivatives, excluding nonperformance risk in our CBVA segment.
Changes in fair value of derivatives from the CBVA segment liability hedge and CHO program resulted in an increase in losses of $1,683.9 million, from a loss of $1,801.5 million to a loss of $3,485.4 million, primarily as a result of rising interest rates and higher equity market growth. The hedge program in the CBVA segment focuses on protecting regulatory and rating agency capital from equity market movements rather than mitigating earnings volatility. Lower net realized investment gains of $449.0 million, as a result of net realized gains of $163.9 million in the current period compared to gains of $612.9 million in the prior period, were primarily driven by changes in fair value adjustments on our CMO-B portfolio and lower gains on the sale of securities, partially offset by derivative mark to market adjustments as a result of rising interest rates. Changes in the fair value of guaranteed benefit derivatives due to nonperformance risk in our CBVA segment resulted in an increase in Net realized capital losses of $50.9 million, from a loss of $443.6 million to a loss of $494.5 million. Lower gains on guaranteed benefit derivative hedging, excluding nonperformance risk in our Retirement Solutions business were primarily driven by changes in the fair value of derivatives associated with the Stable Value hedge program put in place during the prior period, in addition to reductions in expected future guaranteed interest rates on certain Stabilizer contracts in the prior period. These were partially offset by higher gains resulting from rising interest rates and equity market movements and changes in the fair value of guaranteed benefit derivatives related to nonperformance risk.
-88-
Table of Contents
Higher losses in the current period are partially offset by gains from changes in fair value of guaranteed benefit derivatives in our CBVA segment. Gains on guaranteed benefit derivatives, excluding nonperformance risk in our CBVA segment increased $923.6 million, from $833.9 million to $1,757.5 million, driven by higher equity market growth, rising interest rates and favorable changes in volatility in the current period compared to the prior period.
Other revenue increased $54.5 million from $378.5 million to $433.0 million primarily due to higher income earned by our Retirement segment’s broker dealers for sales on non-proprietary products, which is partially offset by the corresponding higher broker-dealer expenses within Operating expenses. Changes in market value adjustments related to retirement plan sponsors upon surrender and an increase in production and performance related fees earned by our Investment Management segment also contributed to the increase.
Interest credited and other benefits to contract owners/policyholders decreased $363.8 million from $4,861.6 million to $4,497.8 million primarily due to a decrease in reserves in our CBVA segment and a decline in the funds withheld reserve with business reinsured resulting from market value changes in the related assets, the latter of which is entirely offset by a corresponding amount recorded in Net realized capital gains (losses). A decline in guaranteed benefit reserves in our CBVA segment driven by more favorable fund returns in the current period compared to the prior period is partially offset by an increase in reserves associated with the annuitization of life contingent contracts in our CBVA segment, which corresponds to the increase in Premiums described above. In addition, decreases in interest credited in our Annuities segment due to declining reserves for MYGAs and lower crediting rates, favorable reserve changes and intangible unlocking in our Individual Life segment, and declining contract owner account balances for the Closed Block Institutional Spread Products segment contributed to the decrease.
Operating expenses decreased $468.3 million from $3,155.0 million to $2,686.7 million primarily due to lower pension expenses in the current period related to the immediate recognition of actuarial gains, compared to losses in the prior period, largely due to changes in equity markets and interest rates as well as a curtailment in the third quarter of 2012. Additionally, lower LOC costs in the current period for our CBVA segment and for our Individual Life segment, lower sales related expenses in our Individual Life segment in the current period, and lower costs in the current period related to the divestment of the Company by ING Group all contributed to a decrease in Operating expenses. These decreases were offset by higher expenses in our Closed Block Other segment as a result of a reimbursement of expenses by ING Group during the prior period, higher broker-dealer and other asset-based expenses in our Retirement segment, higher commission expenses in our CBVA segment associated with higher AUM, an increase in variable expenses in our Investment Management segment and higher variable compensation costs in the current period compared to the prior period.
Net amortization of DAC/VOBA decreased $279.5 million from $722.3 million to $442.8 million. The decrease is primarily driven by favorable unlocking in the current period compared to the prior period as a result of prospective assumption changes in our Retirement and Annuities segments, as well as lower amortization associated with a decline in net realized investment gains in the current period compared to the prior period.
Interest expense increased $31.1 million from $153.7 million to $184.8 million primarily due to additional interest and debt issuance costs associated as a result of changes in debt structure. See a description of the changes in debt structure under “Liquidity and Capital Resources—Debt Securities.”
Income (loss) before income taxes increased $152.1 million from $606.0 million to $758.1 million driven primarily by the immediate recognition of actuarial gains on pensions in the current period compared to losses in the prior period, Net gain from Lehman Recovery/LIHTC in the current period and the loss on the sale of certain alternative investments in the prior period, lower amortization of DAC/VOBA, and higher Fee income. This was partially offset by higher losses related to the incurred guaranteed benefits and guarantee hedge program in our CBVA segment and changes in the fair value of guaranteed benefit derivatives due to nonperformance risk, a decline in net investment gains and lower investment income on the CMO-B and alternative investment portfolios as a result of portfolio restructuring in the prior period.
-89-
Table of Contents
Income tax benefit increased $27.3 million from $5.2 million to $32.5 million. The low effective tax rate is because the tax expense (benefit) on Income (loss) before income taxes is mostly offset by increases/decreases in valuation allowances. Tax capital gains (losses) are generally not offset by changes in valuation allowances, which resulted in an $88.9 million increase in the income tax benefit. This increase in the tax benefit for capital gains (losses) was partially offset by a decrease in the benefit and valuation allowance from tax credits of $62.9 million.
Operating Earnings before Income Taxes
Operating earnings before income taxes increased $350.3 million from $918.3 million to $1,268.6 million as a result of several factors. Higher Fee income in our Retirement and Investment Management segments and improved margins in our Annuities segment related to MYGA run-off contributed to the increase. In addition, higher Net investment income was due to the Net gain from Lehman Recovery/LIHTC in the current period and the loss on the sale of certain alternative investments in the prior period was offset by lower investment income in our Retirement Solutions and Insurance Solutions businesses as a result of portfolio restructuring in the prior period. DAC/VOBA and other intangibles unlocking improved to $133.2 million in the current period compared to $(77.0) million in the prior period, largely as a result of favorable prospective assumption changes of $84.8 million in the current period. Offsetting these increases was higher Interest expense in our Corporate segment.
Adjustments from Income (Loss) before Income Taxes to Operating Earnings before Income Taxes
Closed Block Variable Annuity is discussed in “Results of Operations—Segment by Segment—CBVA.”
Net investment gains decreased $243.4 million from $455.5 million to $212.1 million primarily driven by changes in fair value adjustments on our CMO-B portfolio and lower gains on the sale of securities, as well as derivative mark to market adjustments. Higher gains on derivative mark to market adjustments were primarily due to rising interest rates, resulting in favorable changes to the fair value of derivatives that are hedging the Company’s exposure to various market risks within the investment portfolio.
Net guaranteed benefit hedging gains (losses) and related charges and adjustments decreased $77.8 million from $97.2 million to $19.4 million. Lower gains on guaranteed benefit derivative hedging, net amortization of DAC/VOBA, and other intangibles, were primarily driven by changes in the fair value of derivatives associated with the Stable Value hedge program put in place during the prior period, in addition to reductions in expected future guaranteed interest rates on certain Stabilizer contracts in the prior period. These were partially offset by higher gains resulting from rising interest rates and equity market movements and changes in the fair value of guaranteed benefit derivatives related to nonperformance risk.
Loss related to businesses exited through reinsurance or divestment increased $14.0 million from $45.8 million to $59.8 million primarily due to higher costs associated with the business transferred from us to Hannover Re.
Immediate recognition of net actuarial gains (losses) related to pension and other postretirement benefit obligations and gains (losses) from plan adjustments and curtailments increased $570.2 million. We immediately recognize actuarial gains and losses. A net actuarial gain of $405.2 million was recorded in 2013, driven primarily due to strong investment returns in the assets of the pension plan and an increase in the discount rate used to value benefit obligations. A net actuarial loss of $165.0 million was recorded in 2012, driven primarily by the net impact of a decrease in the discount rate and a curtailment.
Other adjustments to operating earnings changed $31.9 million from $(100.1) million to $(68.2) million primarily due to lower costs in the current period related to the divestment of the Company by ING Group and integration expenses in the prior period related to our acquisition of Citistreet.
-90-
Table of Contents
Year Ended December 31, 2012 Compared to Year Ended December 31, 2011
Net Income (Loss)
Net investment income decreased $270.9 million from $4,968.8 million to $4,697.9 million partially due to a $91.9 million loss on the sale of certain alternative investments (see table above). Further decreases were due to lower investment income resulting from investment portfolio changes to improve capital, such as the sale of CMO-B assets, a decline in average assets in our Closed Block Institutional Spread Products segment and due to lapses in MYGAs. The decline in the assets of the Closed Block Institutional Spread Products is due to the continued run-off of this business. Certain MYGAs, mostly sold in 2002, have reached the end of their current guarantee period in 2012. Most of these MYGAs have high crediting rates and the supporting assets generate returns below the targets set when the contracts were issued, negatively impacting returns in our Annuities segment. During the year ended December 31, 2012, approximately $3.0 billion of the MYGAs reached the end of their current guarantee period, and approximately 66% of those policies up for renewal lapsed. The high lapse rate was expected as renewal crediting rates offered are lower than the credited rates during the initial term. The run-off of these MYGA contracts enhanced the results of our Annuities segment during 2012. These decreases were partially offset by an increase in assets in our Retirement segment driven by positive net flows, including customer transfers from variable separate accounts as well as improved performance of funds and partnership income from our Investment Management segment.
Fee income decreased $88.2 million from $3,603.6 million to $3,515.4 million primarily due to a decline in average AUM in the CBVA segment as well as higher unearned revenue amortization in our Individual Life segment in 2011 related to the emergence of gross profits for a particular block.
Premiums increased $91.1 million from $1,770.0 million to $1,861.1 million primarily due to growth in renewal premiums in our Life Insurance Solutions segment.
Net realized capital losses decreased $250.6 million from $1,531.4 million to $1,280.8 million primarily due to higher net realized investments gains as well as favorable derivative results in our Retirement Solutions business, offset by changes in fair value of guaranteed benefit derivatives due to nonperformance risk and higher losses on derivatives from the CBVA segment liability hedges and CHO program. Higher net realized investment gains were primarily due to a $447.6 million reduction in OTTI in 2012 compared to 2011. The favorable derivative results in our Retirement Solutions business were driven by $566.1 million in higher gains on guaranteed benefit derivatives, excluding nonperformance risk. The gains in 2012 on guaranteed benefit derivatives were mostly due to a reduction in expected future guaranteed interest rates on certain Stabilizer contracts, compared to losses in 2011 due to declining interest rates.
Partially offsetting these favorable items were changes in fair value of guaranteed benefit derivatives due to nonperformance risk, changes in fair value of derivatives from the CBVA segment liability hedges, and losses on the CHO program. Changes in the fair value of guaranteed benefit derivatives in the Retirement, Annuities and CBVA segments due to nonperformance risk resulted in a decrease in income of $1,053.5 million (from a gain of $495.7 million in 2011 to a loss of $557.8 million in 2012). The changes in derivative gains (losses) from the CBVA segment liability hedges reduced income by $2,526.3 million. This decrease was driven by significant gains in 2011 due primarily to interest rate decreases during that period compared to significant losses in 2012 due primarily to the equity market increase during that period. In addition, an increase in losses on the CHO program (from a loss of $129.9 million in 2011 to a loss of $351.0 million in 2012) resulted in a decrease to income of $221.1 million. The higher losses in 2012 were the result of the equity market increase in 2012 and higher notional amounts for hedging the associated underlying risk, as a result of assumption changes made in late 2011. The hedge program in the CBVA segment focuses on protecting regulatory and rating agency capital rather than mitigating earnings volatility and, as a result, the losses in 2012 are more than offset by a $2,969.4 million in gains (from a loss of $2,135.5 million to a gain of $833.9 million in 2012) from changes in fair value of guaranteed benefit derivatives, excluding nonperformance risk.
-91-
Table of Contents
Other revenue decreased $49.7 million from $428.2 million to $378.5 million due to changes in market value adjustment related to plan sponsors upon surrender, lower surrender fees on the CBVA segment as that business runs off and a reduction in the deferred gain amortization on the divested group reinsurance business. Partially offsetting these decreases is an increase in service fees earned by our Investment Management segment.
Interest credited and other benefits to contract owners/policyholders decreased $880.4 million from $5,742.0 million to $4,861.6 million primarily due to an increase in reserves in the CBVA segment due to updating lapse and other policyholder behavior assumptions in the fourth quarter of 2011, and a reduction in interest credited due to declining contract owner account balances for the Closed Block Institutional Spread Products segment and declining reserves for MYGAs. A reduction in average crediting rates across several product lines as well as favorable claim results in our Employee Benefits segment also contributed to the decrease. These reductions were partially offset by reserve changes and claim experience in our Individual Life segment due to a combination of growth in the business and adverse mortality results, net of reinsurance and reserve changes. Growth in general account assets in our Retirement segment also contributed to the increase.
Operating expenses increased $124.2 million from $3,030.8 million to $3,155.0 million primarily due to higher LOC costs related to the contingent capital LOC for our CBVA segment and for our Individual Life segment, a reduction in incentive compensation expense in 2011 that did not recur in 2012 and an increase in expenses due to growth in the business. Partially offsetting these increases were lower expenses in our Retirement business due to a reduction in recordkeeping cases, as well as a $22.0 million reimbursement of expenses by ING Group in 2012. These expenses were paid in 2011 by ING U.S., Inc. on behalf of ING Group’s Latin America business. In 2011, operating expenses included $24.6 million of previously unreimbursed expenses.
Net amortization of DAC/VOBA increased $335.3 million from $387.0 million to $722.3 million. The increase is primarily related to favorable unlocking in 2011 and unfavorable unlocking in 2012, primarily in our Annuities segment, due to prospective assumption changes related to investment margins in 2011 and decreased projected margins on MYGA policies in 2012, respectively.
Income before income taxes increased $328.2 million from $277.8 million to $606.0 million primarily due to an improvement in net realized investment gains as well as favorable results from hedging activity in our Retirement Solutions business, higher assets and margins in our Retirement segment, improved fund performance in our Investment Management segment, and favorable claim results in our Employee Benefit segment. Offsetting these increases were losses on guaranteed benefit derivatives due to nonperformance risk and higher losses on derivatives from the CBVA segment liability hedges and CHO program, and the $91.9 million loss on the sale of certain alternative investments. Adverse mortality and reserve changes in our Individual Life segment and unfavorable changes in DAC/VOBA and other intangibles unlocking also contributed to the decrease.
Income tax benefit for the year ended December 31, 2012 was $5.2 million. We anticipate an effective tax rate of approximately 0%, as the tax expense (benefit) on Net income (loss) before income taxes should be offset by increases/decreases in valuation allowances. The Income tax expense (benefit) for 2011 was $175.0 million, which is higher than the tax at the statutory rate, primarily as a result of an increase in the valuation allowances of $175.0 million, the tax impact of non-deductible expenses of $32.0 million, offset by the $74.0 million impact of the dividends received deduction and $67.0 million of favorable impact from noncontrolling interests. The increase in the valuation allowance was due primarily to continued tax losses, the benefit of which is uncertain.
Operating Earnings before Income Taxes
Operating earnings before income taxes decreased $201.3 million from $1,119.6 million to $918.3 million primarily due to unfavorable DAC/VOBA and other intangibles unlocking in 2012 of $77.0 million compared to favorable unlocking in 2011 of $303.8 million, the $92.0 million loss in 2012 related to the sale of certain
-92-
Table of Contents
alternative investments, and adverse mortality and reserve changes in our Individual Life segment. These decreases were partially offset by the favorable impacts to income from an increase in assets and margins in our Retirement segment, improved investment margins in our Annuities segment and favorable claim results in our Employee Benefits segment.
Adjustments from Income (Loss) before Income Taxes to Operating Earnings before Income Taxes
CBVA is discussed in “Results of Operations—Segment by Segment—CBVA.”
Net investment gains increased $383.7 million from $71.8 million to $455.5 million, primarily due to a $447.6 million reduction in OTTI, partially offset by a reduction in gains on CMO-B fair value adjustments and gains on sales of securities.
Net guaranteed benefit hedging gains (losses) and related charges and adjustments changed by $366.6 million from a loss of $269.4 million to a gain of $97.2 million. Excluding nonperformance risk, we incurred a $377.9 million loss in 2011 primarily due to the decrease in interest rates during 2011, compared to a gain of $188.2 million in 2012, primarily due to a reduction in expected future guaranteed interest rates in certain Stabilizer contracts in our Retirement segment. This favorable impact was partially offset by a decrease in the fair value of guaranteed benefits related to nonperformance risk from a $21.3 million loss in 2011 to a $114.2 million loss in 2012. DAC/VOBA amortization related to the respective gain (loss) accounted for the remaining $106.6 million change.
Losses related to businesses exited through reinsurance or divestment increased $10.7 million from $35.1 million to $45.8 million primarily due to a reduction in the amortization of a deferred gain on the group reinsurance business that was divested at the end of 2009, partially offset by higher LOC costs in 2012 on the individual reinsurance business that was divested in prior years but where we remained responsible for a portion of the LOC costs.
Losses related to the immediate recognition of net actuarial gains (losses) related to pension and other postretirement benefit obligations and losses from plan adjustments and curtailments increased $7.2 million from $157.8 million to $165.0 million. The loss in both years is primarily due to a remeasurement loss, which resulted from the revaluation of our Retirement Plan’s assets and obligations. The remeasurement loss in both years is due primarily to a decrease in the discount rate of plan liabilities which resulted from the declining interest rate environment.
Other adjustments to operating earnings changed $22.4 million from $(77.7) million to $(100.1) million due to increased expenses related to the divestment of the Company by ING Group.
Results of Operations—Ongoing Business
We consider the Retirement, Annuities, Investment Management, Individual Life, and Employee Benefits segments as our ongoing businesses. The following table summarizes Operating earnings before income taxes of our ongoing businesses for the periods indicated:
| Years Ended December 31, | ||||||||||||
| ($ in millions) | 2013 | 2012 | 2011 | |||||||||
| Operating earnings before income taxes |
$ | 1,428.6 | $ | 990.9 | $ | 1,279.6 | ||||||
|
|
|
|
|
|
|
|||||||
-93-
Table of Contents
The following table summarizes certain notable items that resulted in volatility in Operating earnings before income taxes:
| Years Ended December 31, | ||||||||||||
| ($ in millions) | 2013 | 2012 | 2011 | |||||||||
| DAC/VOBA and other intangibles unlocking(1)(2) |
$ | 133.2 | $ | (77.0 | ) | $ | 303.8 | |||||
| Loss on sale of alternative investments |
— | (82.1 | ) | — | ||||||||
| Net gain from Lehman Recovery/LIHTC |
83.6 | — | — | |||||||||
| (1) | Unlocking related to the Net gain from Lehman Recovery/LIHTC is excluded from DAC/VOBA and other intangibles unlocking for the year ended December 31, 2013 (and included in Net gain from Lehman Recovery/LIHTC). |
| (2) | Includes the impacts of the annual review of assumptions. See “—Unlocking of DAC/VOBA and other Contract Owner/Policyholder Intangibles” for further description. |
Ongoing Business—Year Ended December 31, 2013 Compared to Year Ended December 31, 2012
Operating earnings before income taxes increased $437.7 million from $990.9 million to $1,428.6 million as a result of several factors. Higher Fee income in our Retirement and Investment Management segments and improved margins in our Annuities segment related to MYGA run-off contributed to the increase. In addition, higher Net investment income due to the Net gain from Lehman Recovery/LIHTC in the current period and the loss on the sale of certain alternative investments in the prior period was offset by lower investment income in our Retirement Solutions and Insurance Solutions businesses as a result of portfolio restructuring in the prior period. DAC/VOBA and other intangibles unlocking improved to $133.2 million in the current period compared to $(77.0) million in the prior period, largely as a result of favorable prospective assumption changes of $84.8 million in the current period.
Ongoing Business—Year Ended December 31, 2012 Compared to Year Ended December 31, 2011
Operating earnings before income taxes decreased $288.7 million from $1,279.6 million to $990.9 million primarily due to unfavorable DAC/VOBA and other intangibles unlocking in 2012 of $77.0 million compared to favorable unlocking in 2011 of $303.8 million, the $82.1 million loss in 2012 related to the sale of certain alternative investments, and adverse mortality and reserve changes in our Individual Life segment. These decreases were partially offset by the favorable impacts to income from an increase in assets and margins in our Retirement segment, improved investment margins in our Annuities segment and favorable claim results in our Employee Benefits segment. See “Results of Operations—Segment by Segment.”
-94-
Table of Contents
Results of Operations—Segment by Segment
Retirement Solutions—Retirement
The following table summarizes Operating earnings before income taxes of our Retirement segment for the periods indicated:
| Years Ended December 31, | ||||||||||||
| ($ in millions) | 2013 | 2012 | 2011 | |||||||||
| Operating revenues: |
||||||||||||
| Net investment income and net realized gains (losses) |
$ | 1,569.6 | $ | 1,499.9 | $ | 1,435.9 | ||||||
| Fee income |
759.9 | 715.0 | 713.5 | |||||||||
| Premiums |
5.7 | 4.9 | 8.1 | |||||||||
| Other revenue |
64.2 | 52.1 | 67.9 | |||||||||
|
|
|
|
|
|
|
|||||||
| Total operating revenues |
2,399.4 | 2,271.9 | 2,225.4 | |||||||||
|
|
|
|
|
|
|
|||||||
| Operating benefits and expenses: |
||||||||||||
| Interest credited and other benefits to contract owners/policyholders |
848.4 | 842.2 | 826.2 | |||||||||
| Operating expenses |
839.9 | 824.9 | 844.5 | |||||||||
| Net amortization of DAC/VOBA |
115.3 | 155.0 | 111.1 | |||||||||
| Interest expense |
— | 1.2 | 1.7 | |||||||||
|
|
|
|
|
|
|
|||||||
| Total operating benefits and expenses |
1,803.6 | 1,823.3 | 1,783.5 | |||||||||
|
|
|
|
|
|
|
|||||||
| Operating earnings before income taxes |
$ | 595.8 | $ | 448.6 | $ | 441.9 | ||||||
|
|
|
|
|
|
|
|||||||
The following table summarizes certain notable items that represented the volatility in Operating earnings before income taxes for the periods indicated:
| Years Ended December 31, | ||||||||||||
| ($ in millions) | 2013 | 2012 | 2011 | |||||||||
| DAC/VOBA and other intangibles unlocking(1)(2) |
$ | 45.6 | $ | 5.8 | $ | 44.2 | ||||||
| Net gain from Lehman Recovery/LIHTC |
12.9 | — | — | |||||||||
| Loss on sale of alternative investments |
— | (48.1 | ) | — | ||||||||
| (1) | Unlocking related to the Net gain from Lehman Recovery/LIHTC is excluded from DAC/VOBA and other intangibles unlocking for the year ended December 31, 2013 (and included in Net gain from Lehman Recovery/LIHTC). |
| (2) | Includes the impacts of the annual review of assumptions. See “—Unlocking of DAC/VOBA and other Contract Owner/Policyholder Intangibles” for further description. |
-95-
Table of Contents
The following tables summarize AUM and AUA for our Retirement segment as of the dates indicated:
| As of December 31, | ||||||||||||
| ($ in millions) | 2013 | 2012 | 2011 | |||||||||
| Corporate market |
$ | 40,123.7 | $ | 33,265.9 | $ | 29,134.4 | ||||||
| Tax exempt market |
53,200.5 | 46,986.1 | 42,691.3 | |||||||||
|
|
|
|
|
|
|
|||||||
| Total full service plans |
93,324.2 | 80,252.0 | 71,825.7 | |||||||||
| Stable value(1) |
8,914.3 | 7,792.1 | 5,560.9 | |||||||||
| Individual market |
2,998.4 | 2,427.1 | 2,091.1 | |||||||||
|
|
|
|
|
|
|
|||||||
| Total AUM |
105,236.9 | 90,471.2 | 79,477.7 | |||||||||
| AUA |
237,777.1 | 213,675.5 | 208,366.0 | |||||||||
|
|
|
|
|
|
|
|||||||
| Total AUM and AUA |
$ | 343,014.0 | $ | 304,146.7 | $ | 287,843.7 | ||||||
|
|
|
|
|
|
|
|||||||
| (1) | Consists of assets where we are the investment manager. |
| As of December 31, | ||||||||||||
| ($ in millions) | 2013 | 2012 | 2011 | |||||||||
| General Account |
$ | 28,169.2 | $ | 27,222.6 | $ | 25,528.3 | ||||||
| Separate Account |
57,654.0 | 49,425.4 | 42,920.8 | |||||||||
| Mutual Fund/Institutional Funds |
19,413.7 | 13,823.2 | 11,028.6 | |||||||||
| AUA |
237,777.1 | 213,675.5 | 208,366.0 | |||||||||
|
|
|
|
|
|
|
|||||||
| Total AUM and AUA |
$ | 343,014.0 | $ | 304,146.7 | $ | 287,843.7 | ||||||
|
|
|
|
|
|
|
|||||||
The following table summarizes a rollforward of AUM for our Retirement segment for the periods indicated:
| Years Ended December 31, | ||||||||||||
| ($ in millions) | 2013 | 2012 | 2011 | |||||||||
| Balance as of beginning of period |
$ | 90,471.2 | $ | 79,477.7 | $ | 76,537.8 | ||||||
| Deposits |
14,856.0 | 14,457.0 | 13,162.1 | |||||||||
| Surrenders, benefits and product charges |
(12,397.5 | ) | (10,991.4 | ) | (10,160.4 | ) | ||||||
|
|
|
|
|
|
|
|||||||
| Net flows |
2,458.5 | 3,465.6 | 3,001.7 | |||||||||
| Interest credited and investment performance |
12,307.2 | 7,527.9 | (61.8 | ) | ||||||||
|
|
|
|
|
|
|
|||||||
| Balance as of end of period |
$ | 105,236.9 | $ | 90,471.2 | $ | 79,477.7 | ||||||
|
|
|
|
|
|
|
|||||||
Retirement—Year Ended December 31, 2013 Compared to Year Ended December 31, 2012
Operating revenues
Net investment income and net realized gains (losses) increased $69.7 million from $1,499.9 million to $1,569.6 million primarily due to $15.2 million of net investment income from Lehman Recovery/LIHTC in the current period compared to a $48.1 million loss on the sale of certain alternative investments in the prior period. In addition, there was a favorable variance due to higher prepayment fee income as well as higher investment income due to increases in general account assets. General account assets increased from $27.2 billion to $28.2 billion primarily as a result of participants transferring funds from variable investment options into fixed investment options. The increases were partially offset by lower Net investment income and net realized gains (losses) primarily due to lower investment yields on the CMO-B portfolio and lower alternative investment income as a result of portfolio restructuring in the prior period, coupled with lower reinvestment rates.
Fee income increased $44.9 million from $715.0 million to $759.9 million primarily due to increases in full service plan fees, recordkeeping advisory fees and change order fees for the recordkeeping business. The increase
-96-
Table of Contents
in fees related to full service retirement plans was driven by net increases in separate account and institutional/mutual fund AUM. These increases were partially offset by a decrease in other recordkeeping fees primarily due to terminated contracts.
Other revenue increased $12.1 million from $52.1 million to $64.2 million primarily due to an increase in broker-dealer revenue and changes in market value adjustments related to plan sponsors upon surrender.
Operating benefits and expenses
Interest credited and other benefits to contract owners/policyholders increased $6.2 million from $842.2 million to $848.4 million primarily due to an increase in general account liabilities, which corresponds to the increase in general account assets as described above. This increase was mostly offset by a decrease in the average credited rates due to actions taken in 2012 and January 2013 to reflect the continuing low interest rate environment. Lower amortization of sales inducements also partially offset the increase.
Operating expenses increased $15.0 million from $824.9 million to $839.9 million due to an increase in general expenses and higher commission expense due to an increase in AUM, partially offset by lower expenses for the recordkeeping business.
Net amortization of DAC/VOBA decreased $39.7 million from $155.0 million to $115.3 million primarily due to changes in unlocking of DAC/VOBA. The favorable DAC unlocking in the current period was $44.5 million higher than the prior period favorable unlocking largely due to the impact of the prospective assumption changes.
Operating earnings before income taxes
Operating earnings before income taxes increased $147.2 million from $448.6 million to $595.8 million primarily due to higher Fee income related to full service retirement plans, an increase in Net investment income as a result of the loss related to the sale of certain alternative investments in the prior period along with a Net gain from Lehman Recovery/LIHTC in the current period, and favorable changes in DAC/VOBA unlocking. These were partially offset by a decline in Net investment income as a result of portfolio restructuring in the prior period.
Retirement—Year Ended December 31, 2012 Compared to Year Ended December 31, 2011
Operating revenues
Net investment income and net realized gains (losses) increased $64.0 million from $1,435.9 million to $1,499.9 million primarily due to an increase growth of general account assets. General account assets increased from $25.5 billion to $27.2 billion in 2012 compared to 2011. The volatility in the equity market during the second half of 2011 resulted in participants transferring funds from variable investment options into the fixed investment option, which contributed to an increase in average general account assets. The increase was partially offset by a $48.1 million loss on the sale of certain alternative investments. We also reduced the fair value of our investments in LIHTC, which had an unfavorable impact of $4.6 million.
Other revenue decreased $15.8 million from $67.9 million to $52.1 million primarily due to changes in market value adjustments related to plan sponsors upon surrender.
Operating benefits and expenses
Interest credited and other benefits to contract owners/policyholders increased $16.0 million from $826.2 million to $842.2 million primarily due to an increase in general account liabilities, which corresponded to the increase in general account assets as described above. The increase was partially offset by a decrease in average credited rates on general account liabilities due to actions taken in January, April and July 2012 to reflect the low interest rate environment.
-97-
Table of Contents
Operating expenses decreased $19.6 million from $844.5 million to $824.9 million primarily driven by expenses of the recordkeeping business.
Net amortization of DAC/VOBA increased $43.9 million from $111.1 million to $155.0 million primarily as a result of lower favorable DAC unlocking in 2012. The 2012 results include a favorable impact of DAC/VOBA and other intangibles of $5.8 million compared to a favorable impact of $44.2 million in 2011. Favorable unlocking in 2011 was driven by future assumption changes and greater than expected net flows into fixed investment option funds.
Operating earnings before income taxes
Operating earnings before income taxes was slightly higher for 2012. Higher net investment income and lower operating expenses partially offset by higher Interest credited and other benefits to contract owners/policyholders and net amortization of DAC/VOBA contributed to the results.
Retirement Solutions-Annuities
The following table summarizes Operating earnings before income taxes of the Annuities segment for the periods indicated:
| Years Ended December 31, | ||||||||||||
| ($ in millions) | 2013 | 2012 | 2011 | |||||||||
| Operating revenues: |
||||||||||||
| Net investment income and net realized gains (losses) |
$ | 1,149.9 | $ | 1,223.3 | $ | 1,321.9 | ||||||
| Fee income |
45.1 | 35.5 | 29.8 | |||||||||
| Premiums |
36.4 | 35.9 | 34.1 | |||||||||
| Other revenue |
13.2 | 12.3 | 15.6 | |||||||||
|
|
|
|
|
|
|
|||||||
| Total operating revenues |
1,244.6 | 1,307.0 | 1,401.4 | |||||||||
|
|
|
|
|
|
|
|||||||
| Operating benefits and expenses: |
||||||||||||
| Interest credited and other benefits to contract owners/policyholders |
730.9 | 854.1 | 978.0 | |||||||||
| Operating expenses |
127.0 | 124.7 | 126.7 | |||||||||
| Net amortization of DAC/VOBA |
92.9 | 225.5 | (91.5 | ) | ||||||||
| Interest expense |
— | 0.5 | 0.6 | |||||||||
|
|
|
|
|
|
|
|||||||
| Total operating benefits and expenses |
950.8 | 1,204.8 | 1,013.8 | |||||||||
|
|
|
|
|
|
|
|||||||
| Operating earnings before income taxes |
$ | 293.8 | $ | 102.2 | $ | 387.6 | ||||||
|
|
|
|
|
|
|
|||||||
The following table summarizes certain notable items that resulted in volatility in Operating earnings before income taxes:
| Years Ended December 31, | ||||||||||||
| ($ in millions) | 2013 | 2012 | 2011 | |||||||||
| DAC/VOBA and other intangibles unlocking(1)(2) |
$ | 83.3 | $ | (86.2 | ) | $ | 266.0 | |||||
| Net gain from Lehman Recovery/LIHTC |
13.5 | — | — | |||||||||
| Loss on sale of alternative investments |
— | (18.0 | ) | — | ||||||||
| (1) | Unlocking related to the Net gain from Lehman Recovery/LIHTC is excluded from DAC/VOBA and other intangibles unlocking for the year ended December 31, 2013 (and included in Net gain from Lehman Recovery/LIHTC). |
| (2) | Includes the impacts of the annual review of assumptions. See “—Unlocking of DAC/VOBA and other Contract Owner/Policyholder Intangibles” for further description. |
-98-
Table of Contents
The following table summarizes AUM for our Annuities segment as of the dates indicated:
| As of December 31, | ||||||||||||
| ($ in millions) | 2013 | 2012 | 2011 | |||||||||
| AUM: |
||||||||||||
| General account |
$ | 22,432.2 | $ | 22,915.8 | $ | 25,198.5 | ||||||
| Separate account |
829.6 | 751.7 | 730.4 | |||||||||
| Mutual funds |
3,384.9 | 2,433.6 | 1,761.3 | |||||||||
|
|
|
|
|
|
|
|||||||
| Total AUM |
$ | 26,646.7 | $ | 26,101.1 | $ | 27,690.2 | ||||||
|
|
|
|
|
|
|
|||||||
The following table summarizes a rollforward of AUM for our Annuities segment for the periods indicated:
| Years Ended December 31, | ||||||||||||
| ($ in millions) | 2013 | 2012 | 2011 | |||||||||
| Balance at beginning of period |
$ | 26,101.1 | $ | 27,690.2 | $ | 27,849.3 | ||||||
| Deposits |
2,632.0 | 2,353.8 | 2,716.8 | |||||||||
| Surrenders, benefits and product charges |
(3,528.9 | ) | (5,086.1 | ) | (3,935.1 | ) | ||||||
|
|
|
|
|
|
|
|||||||
| Net flows |
(896.9 | ) | (2,732.3 | ) | (1,218.3 | ) | ||||||
| Interest credited and investment performance |
1,442.5 | 1,143.2 | 1,059.2 | |||||||||
|
|
|
|
|
|
|
|||||||
| Balance as of end of period |
$ | 26,646.7 | $ | 26,101.1 | $ | 27,690.2 | ||||||
|
|
|
|
|
|
|
|||||||
Annuities—Year Ended December 31, 2013 Compared to Year Ended December 31, 2012
Operating revenues
Net investment income and net realized gains (losses) decreased $73.4 million from $1,223.3 million to $1,149.9 million primarily due to lower general account assets and lower investment income on the CMO-B portfolio. General account assets decreased as a result of MYGAs lapsing at the end of their initial terms, largely due to lower renewal crediting rates, which reflect the lower interest rate environment compared to the crediting rates during their initial term. In addition, investment income on the CMO-B portfolio was lower due to market conditions in the current period and portfolio restructuring in the prior period. These decreases were partially offset by $20.3 million of net investment income from Lehman Recovery/LIHTC, higher prepayment fee income and higher income on alternative investments, as the prior period included a loss on the sale of certain alternative assets.
Fee income increased $9.6 million from $35.5 million to $45.1 million due to growth in assets of mutual fund custodial products, which are sold by the annuity distribution force as an alternative retirement product. Average assets of the mutual fund custodial product increased 38% from $2.1 billion in 2012 to $2.9 billion in 2013 due to positive net flows and market performance.
Operating benefits and expenses
Interest credited and other benefits to contract owners/policyholders decreased $123.2 million from $854.1 million to $730.9 million primarily due to lower option costs of FIAs, a decrease in average crediting rates on MYGA renewals and lower average account values due to the continuing run-off of MYGAs. Favorable mortality on annuities with life contingencies also contributed to the decrease.
Net amortization of DAC/VOBA decreased $132.6 million from $225.5 million to $92.9 million primarily due to favorable changes in unlocking of DAC/VOBA due to prospective assumption changes compared to unfavorable unlocking in the prior period. Favorable unlocking in the current period was primarily as a result of
-99-
Table of Contents
updated margin projections for fixed rate annuities. In the prior period, unlocking was primarily due to a decrease in the projected margins on MYGA policies. Partially offsetting the decrease was higher amortization due to higher gross profits in the current period.
Operating earnings before income taxes
Operating earnings before taxes increased $191.6 million from $102.2 million to $293.8 million as a result of several factors including improved margins related to MYGA run-off, favorable changes in DAC/VOBA and other intangibles unlocking, a Net gain from Lehman Recovery/LIHTC and the loss on the sale of certain alternative investments in the prior period. Partially offsetting these increases was a decline in investment income on the CMO-B portfolio.
Annuities—Year Ended December 31, 2012 Compared to Year Ended December 31, 2011
Operating revenues
Net investment income and net realized gains (losses) decreased $98.6 million from $1,321.9 million to $1,223.3 million primarily due to lower general account assets and the $18.0 million loss on sale of certain alternative investments. General account assets decreased as a result of MYGAs lapsing at the end of their initial terms, largely due to crediting rates that were lower than the crediting rates during their initial term.
Fee income increased $5.7 million from $29.8 million to $35.5 million due to growth in assets of mutual fund products which are sold by the annuity distribution force as an alternative retirement product. The balance of assets increased from $1.8 billion to $2.4 billion.
Operating benefits and expenses
Interest credited and other benefits to contract owners/policyholders decreased $123.9 million from $978.0 million to $854.1 million. The decrease was primarily due to lapses of MYGAs which resulted in a decrease to average account values, crediting MYGAs. Lower option costs of FIAs also contributed to the decrease. This decline in Interest credited and other benefits to contract owners/policyholders was partially offset by higher amortization on sales inducements.
Net amortization of DAC/VOBA increased $317.0 million from $(91.5) million to $225.5 million primarily due to changes in unlocking of DAC/VOBA that were partially offset by a lower amortization rate of DAC/VOBA. The unfavorable unlocking of DAC/VOBA in 2012 was primarily due to a decrease in projected margins on the MYGA policies. The favorable unlocking of DAC/VOBA in 2011 resulted primarily from prospective assumption changes related to investment margins on FIAs, or anticipated earned investment income less credited interest. Excluding unlocking, the decrease in DAC/VOBA amortization was due to a decrease in the amortization rate partially offset by higher amortization due to higher gross profits in 2012.
Operating earnings before income taxes
Operating earnings before income taxes decreased $285.4 million from $387.6 million to $102.2 million primarily driven by changes in DAC/VOBA and other intangibles unlocking and a decline in net investment income, which were partially offset by lower Interest credited and other benefits to contract owners/policyholders.
-100-
Table of Contents
Investment Management
The following table summarizes Operating earnings before income taxes of our Investment Management segment for the periods indicated:
| Years Ended December 31, | ||||||||||||
| ($ in millions) | 2013 | 2012 | 2011 | |||||||||
| Operating revenues: |
||||||||||||
| Net investment income and net realized gains (losses) |
$ | 37.0 | $ | 41.6 | $ | 8.8 | ||||||
| Fee income |
530.8 | 474.7 | 469.3 | |||||||||
| Other revenue |
39.9 | 29.2 | 13.8 | |||||||||
|
|
|
|
|
|
|
|||||||
| Total operating revenues |
607.7 | 545.5 | 491.9 | |||||||||
|
|
|
|
|
|
|
|||||||
| Operating benefits and expenses: |
||||||||||||
| Operating expenses |
429.6 | 411.0 | 404.4 | |||||||||
|
|
|
|
|
|
|
|||||||
| Total operating benefits and expenses |
429.6 | 411.0 | 404.4 | |||||||||
|
|
|
|
|
|
|
|||||||
| Operating earnings before income taxes |
$ | 178.1 | $ | 134.5 | $ | 87.5 | ||||||
|
|
|
|
|
|
|
|||||||
Our Investment Management operating segment revenues include the following intersegment revenues, primarily consisting of asset-based management and administration fees.
| Years Ended December 31, | ||||||||||||
| ($ in millions) | 2013 | 2012 | 2011 | |||||||||
| Investment Management intersegment revenues |
$ | 157.8 | $ | 157.6 | $ | 164.1 | ||||||
|
|
|
|
|
|
|
|||||||
The following table summarizes certain notable items that resulted in volatility in Operating earnings before income taxes for the periods indicated:
| Years Ended December 31, | ||||||||||||
| ($ in millions) | 2013 | 2012 | 2011 | |||||||||
| Net gain from Lehman Recovery |
$ | 13.2 | $ | — | $ | — | ||||||
| Gain on sale of certain alternative investments |
— | 2.2 | — | |||||||||
The following table summarizes AUM and AUA for our Investment Management segment as of the dates indicated:
| As of December 31, | ||||||||||||
| ($ in millions) | 2013 | 2012 | 2011 | |||||||||
| AUM: |
||||||||||||
| Institutional/retail |
||||||||||||
| Investment Management sourced |
$ | 66,362.2 | $ | 54,061.9 | $ | 49,391.5 | ||||||
| Affiliate sourced(1) |
53,935.0 | 47,284.6 | 37,851.8 | |||||||||
| General account |
78,988.8 | 80,404.8 | 78,878.3 | |||||||||
|
|
|
|
|
|
|
|||||||
| Total AUM |
199,286.0 | 181,751.3 | 166,121.6 | |||||||||
| AUA: |
||||||||||||
| Affiliated sourced(2) |
58,462.8 | 54,695.5 | 58,992.4 | |||||||||
|
|
|
|
|
|
|
|||||||
| Total AUM and AUA |
$ | 257,748.8 | $ | 236,446.8 | $ | 225,114.0 | ||||||
|
|
|
|
|
|
|
|||||||
| (1) | Affiliated sourced AUM includes assets sourced by other segments and also reported as AUM by such other segments. |
| (2) | Affiliated sourced AUA includes assets sourced by other segments and also reported as AUA or AUM by such other segments. |
-101-
Table of Contents
The following table summarizes net flows for our Investment Management segment for the periods indicated:
| Years Ended December 31, | ||||||||||||
| ($ in millions) | 2013 | 2012 | 2011 | |||||||||
| Net Flows |
||||||||||||
| Investment Management sourced |
$ | 7,777.7 | $ | 3,939.8 | $ | 2,398.8 | ||||||
| Affiliated sourced |
978.7 | 5,905.7 | 3,303.5 | |||||||||
|
|
|
|
|
|
|
|||||||
| Total |
$ | 8,756.4 | $ | 9,845.5 | $ | 5,702.3 | ||||||
|
|
|
|
|
|
|
|||||||
Investment Management—Year Ended December 31, 2013 Compared to Year Ended December 31, 2012
Operating revenues
Net investment income and net realized gains (losses) decreased $4.6 million from $41.6 million to $37.0 million primarily due to lower alternative investment income as well as a gain on the sale of certain alternative investments in the prior period. In addition, we recognized an accumulation of $13.3 million of carried interest in the prior period, mostly offset by $13.2 million of net investment income from the Lehman Recovery.
Fee income increased $56.1 million from $474.7 million to $530.8 million primarily due to an increase in AUM resulting in higher management and administrative fees earned. The increase in AUM is predominantly driven by positive net flows including sub-advisor replacements and improved equity markets.
Other revenue increased $10.7 million from $29.2 million to $39.9 million primarily due to an increase in performance and production related revenues.
Operating benefits and expenses
Operating expenses increased $18.6 million from $411.0 million to $429.6 million primarily as a result of higher variable expenses associated with higher AUM and higher Operating earnings.
Operating earnings before income taxes
Operating earnings before income taxes increased $43.6 million from $134.5 million to $178.1 million primarily due to higher Fee income due to an increase in affiliate sourced AUM and Investment Management sourced AUM and an increase in Other revenue. The increases were partially offset by lower Net investment income and higher variable expenses associated with higher AUM and higher Operating earnings.
Investment Management—Year Ended December 31, 2012 Compared to Year Ended December 31, 2011
Operating revenues
Net investment income and net realized gains (losses) increased $32.8 million from $8.8 million to $41.6 million primarily due to higher alternative investment income, partnership income and improved performance of funds, as well as recognizing an accumulation of $13.3 million of carried interest in 2012.
Fee income increased $5.4 million from $469.3 million to $474.7 million primarily due to an increase in affiliate sourced AUM resulting in higher management and administrative fees earned.
Other revenue increased $15.4 million from $13.8 million to $29.2 million primarily due to an increase in service fees earned as part of services provided in connection with the sale by ING Group of its ING Direct U.S. business. Additionally, lower underwriting fees related to a launch of a new product in 2011 which did not repeat in 2012 contributed to the increase. Partially offsetting these increases were lower levels of mortgage and private placement production fees.
-102-
Table of Contents
Operating benefits and expenses
Operating expenses increased $6.6 million from $404.4 million to $411.0 million primarily as a result of higher variable compensation costs and increases in variable administrative costs related to higher AUM.
Operating earnings before income taxes
The overall increase in operating earnings of $47.0 million was primarily driven by higher alternative investment income, partnership income and improved performance of funds, as well as recognizing an accumulation of carried interest. In addition, service fees increased Other revenues and were partially offset by higher variable compensation costs.
Insurance Solutions—Individual Life
The following table summarizes Operating earnings before income taxes of our Individual Life segment for the periods indicated:
| Years Ended December 31, | ||||||||||||
| ($ in millions) | 2013 | 2012 | 2011 | |||||||||
| Operating revenues: |
||||||||||||
| Net investment income and net realized gains (losses) |
$ | 915.5 | $ | 913.8 | $ | 950.0 | ||||||
| Fee income |
1,113.7 | 1,115.7 | 1,139.2 | |||||||||
| Premiums |
737.9 | 737.8 | 660.9 | |||||||||
| Other revenue |
24.8 | 26.6 | 34.9 | |||||||||
|
|
|
|
|
|
|
|||||||
| Total operating revenues |
2,791.9 | 2,793.9 | 2,785.0 | |||||||||
|
|
|
|
|
|
|
|||||||
| Operating benefits and expenses: |
||||||||||||
| Interest credited and other benefits to contract owners/policyholders |
2,001.5 | 2,034.4 | 1,855.1 | |||||||||
| Operating expenses |
358.3 | 390.5 | 332.8 | |||||||||
| Net amortization of DAC/VOBA |
176.2 | 162.3 | 298.9 | |||||||||
| Interest expense |
1.1 | 10.5 | 18.9 | |||||||||
|
|
|
|
|
|
|
|||||||
| Total operating benefits and expenses |
2,537.1 | 2,597.7 | 2,505.7 | |||||||||
|
|
|
|
|
|
|
|||||||
| Operating earnings before income taxes |
$ | 254.8 | $ | 196.2 | $ | 279.3 | ||||||
|
|
|
|
|
|
|
|||||||
The following table summarizes certain notable items that resulted in volatility in Operating earnings before income taxes for the periods indicated:
| Years Ended December 31, | ||||||||||||
| ($ in millions) | 2013 | 2012 | 2011 | |||||||||
| DAC/VOBA and other intangibles unlocking(1)(2) |
$ | 4.8 | $ | 3.4 | $ | (6.4 | ) | |||||
| Net gain from Lehman Recovery/LIHTC |
39.7 | — | — | |||||||||
| Loss on sale of alternative investments |
— | (13.1 | ) | — | ||||||||
| (1) | Unlocking related to the Net gain from Lehman Recovery/LIHTC is excluded from DAC/VOBA and other intangibles unlocking for the year ended December 31, 2013 (and included in Net gain from Lehman Recovery/LIHTC). |
| (2) | Includes the impacts of the annual review of assumptions. See “—Unlocking of DAC/VOBA and other Contract Owner/Policyholder Intangibles” for further description. |
-103-
Table of Contents
The following table summarizes sales, gross premiums, in-force and policy count for our Individual Life segment for the periods indicated:
| Years Ended December 31, | ||||||||||||
| ($ in millions) | 2013 | 2012 | 2011 | |||||||||
| Sales by Product Line: |
||||||||||||
| Universal life: |
||||||||||||
| Guaranteed |
$ | 0.6 | $ | 72.7 | $ | 68.1 | ||||||
| Accumulation |
12.7 | 25.3 | 28.7 | |||||||||
| Indexed |
27.6 | 33.5 | 28.3 | |||||||||
|
|
|
|
|
|
|
|||||||
| Total universal life |
40.9 | 131.5 | 125.1 | |||||||||
| Variable life |
8.6 | 6.3 | 12.3 | |||||||||
| Whole life |
0.2 | — | — | |||||||||
| Term |
50.1 | 116.3 | 155.5 | |||||||||
|
|
|
|
|
|
|
|||||||
| Total sales by product line |
$ | 99.8 | $ | 254.1 | $ | 292.9 | ||||||
|
|
|
|
|
|
|
|||||||
| Total gross premiums |
$ | 1,997.1 | $ | 2,324.6 | $ | 2,140.7 | ||||||
| End of period: |
||||||||||||
| In-force face amount |
$ | 604,990.2 | $ | 607,975.5 | $ | 567,718.1 | ||||||
| In-force policy count |
1,332,148 | 1,352,844 | 1,313,057 | |||||||||
| New business policy count (paid) |
53,237 | 119,936 | 156,650 | |||||||||
Individual Life—Year Ended December 31, 2013 Compared to Year Ended December 31, 2012
Operating revenues
Net investment income and net realized gains (losses) increased $1.7 million from $913.8 million to $915.5 million primarily due to $47.2 million of net investment income from Lehman Recovery/LIHTC in the current period compared to a $13.1 million loss on the sale of certain alternative investments in the prior period and higher alternative investment income in the prior period. Mostly offsetting these were lower investment income on the CMO-B investment portfolio, as a result of portfolio restructuring in the prior period and lower yields on commercial mortgages.
Fee income decreased $2.0 million from $1,115.7 million to $1,113.7 million primarily due to lower net contractual charges resulting from a reduction of secondary guarantee product sales. This was partially offset by favorable unlocking of intangibles resulting from prospective assumption changes and an increase in cost of insurance fees on the aging in-force block.
Operating benefits and expenses
Interest credited and other benefits to contract owners/policyholders decreased $32.9 million from $2,034.4 million to $2,001.5 million primarily due to lower benefit costs resulting from lower guarantee and term product sales, improved UL mortality and favorable first quarter 2013 incurred but not recorded (“IBNR”) development. In addition, favorable intangible unlocking, resulting from prospective assumption changes, contributed to the decrease in the current period. These decreases were partially offset by higher gross claims on the term block.
Operating expenses decreased $32.2 million from $390.5 million to $358.3 million primarily due to lower sales related expenses partially offset by increased credit facility fees supporting reinsurance transactions.
Net amortization of DAC/VOBA increased $13.9 million from $162.3 million to $176.2 million primarily due to changes in unlocking of DAC/VOBA, excluding other intangibles unlocking. The favorable DAC
-104-
Table of Contents
unlocking in the current period was $22.5 million lower than the prior period favorable unlocking largely due to the impact of the prospective assumption changes. This unlocking impact was more than offset by unlocking recorded in Fee income and Interest credited and other benefits to contract owners/policyholders as discussed above. In addition, there was increased amortization related to the Lehman Recovery. Partially offsetting these items was lower amortization related to lower gross profits on UL products and lower term sales.
Interest Expense decreased $9.4 million from $10.5 million to $1.1 million primarily due to the repayment of certain surplus notes in 2012.
Operating earnings before income taxes
Operating earnings before income taxes increased $58.6 million from $196.2 million to $254.8 million as a result of several factors including lower benefit costs resulting from lower guarantee and term product sales, favorable IBNR development and lower Operating expenses. Partially offsetting these favorable variances was lower investment income due to lower CMO-B income and lower investment yields, lower net contractual charges resulting from a reduction of secondary guarantee product sales and higher gross claims on the term block. In addition, the year-over-year results were impacted by the Net gain from Lehman Recovery/LIHTC in the current period, loss on sale of certain alternative investments in the prior period and the impact of prospective assumption changes.
Individual Life—Year Ended December 31, 2012 Compared to Year Ended December 31, 2011
Operating revenues
Net investment income and net realized gains (losses) decreased $36.2 million from $950.0 million to $913.8 million primarily due to a $13.1 million loss on the sale of certain alternative investments and lower investment income on the CMO-B and alternative asset portfolios due to asset sales in the second and third quarters of 2012. Partially offsetting these impacts were higher prepayment fee income and higher yields on certain fixed income investments.
Fee income decreased $23.5 million from $1,139.2 million to $1,115.7 million primarily related to the emergence of gross profits for a particular block that caused accelerated unearned revenue amortization in 2011. The gross profits caused accelerated amortization of unearned revenue, an increase in interest credited and other benefits and higher DAC/VOBA amortization with an immaterial net impact to Operating earnings. Growth in net contractual charges and cost of insurance fees due to higher UL sales offset the decrease to Fee income.
Premiums increased $76.9 million from $660.9 million to $737.8 million due to continued growth in renewal premiums for term life business partially offset by lower first year premiums as a result of term sales declining 25%.
Operating benefits and expenses
Interest credited and other benefits to contract owners/policyholders increased $179.3 million from $1,855.1 million to $2,034.4 million primarily due to favorable reserve changes in 2011 as a result of annual assumption changes that did not repeat in 2012, the emergence of gross profits for a particular block that caused an increase as discussed above and an increase in reserves in 2012 related to the guaranteed UL block. In addition, there was unfavorable mortality net of reinsurance in 2012, with the UL block experiencing a higher number of gross claims and reinsurance recoveries on the term block providing less benefit.
Operating expenses increased $57.7 million from $332.8 million to $390.5 million primarily due to increased credit facility fees supporting reinsurance transactions. The higher credit facility fees are the results of higher rates and general growth in credit facilities supporting the reinsured block. Partially offsetting this increase was lower sales related expenses.
-105-
Table of Contents
Net Amortization of DAC/VOBA decreased $136.6 million from $298.9 million to $162.3 million primarily due to unfavorable unlocking in 2011 as a result of annual assumption changes that did not repeat in 2012. This impact was partially offset by items explained in Interest credited and other benefits to contract owners/policyholders described above. In addition, 2012 amortization on UL products was lower due to lower gross profits and the emergence of gross profits for a particular block that caused accelerated amortization in 2011, offset by higher unearned revenue liability amortization as discussed in Fee Income above. These impacts are partially offset by higher amortization on term products resulting from the continued growth of this block of business.
Operating earnings before income taxes
Operating earnings before income taxes decreased due to unfavorable mortality results net of reinsurance, lower investment income on alternative investments and CMO-Bs, increased credit facility costs and favorable reserve changes in 2011 that did not repeat in 2012. Partially offsetting these items were lower DAC/VOBA amortization resulting from lower gross profits on universal life products, higher term life renewal premiums and higher net contractual charges and cost of insurance fees due to higher UL sales.
Insurance Solutions—Employee Benefits
The following table summarizes Operating earnings before income taxes of the Employee Benefits segment for the periods indicated:
| Years Ended December 31, | ||||||||||||
| ($ in millions) | 2013 | 2012 | 2011 | |||||||||
| Operating revenues: |
||||||||||||
| Net investment income and net realized gains (losses) |
$ | 117.6 | $ | 114.3 | $ | 124.3 | ||||||
| Fee income |
63.0 | 62.5 | 61.8 | |||||||||
| Premiums |
1,085.9 | 1,078.1 | 1,063.4 | |||||||||
| Other revenue |
(4.0 | ) | (3.7 | ) | (3.3 | ) | ||||||
|
|
|
|
|
|
|
|||||||
| Total operating revenues |
1,262.5 | 1,251.2 | 1,246.2 | |||||||||
|
|
|
|
|
|
|
|||||||
| Operating benefits and expenses: |
||||||||||||
| Interest credited and other benefits to contract owners/policyholders |
903.4 | 892.1 | 917.7 | |||||||||
| Operating expenses |
236.1 | 236.2 | 229.3 | |||||||||
| Net amortization of DAC/VOBA |
16.9 | 13.5 | 15.9 | |||||||||
|
|
|
|
|
|
|
|||||||
| Total operating benefits and expenses |
1,156.4 | 1,141.8 | 1,162.9 | |||||||||
|
|
|
|
|
|
|
|||||||
| Operating earnings before income taxes |
$ | 106.1 | $ | 109.4 | $ | 83.3 | ||||||
|
|
|
|
|
|
|
|||||||
The following table summarizes certain notable items that resulted in volatility Operating earnings before income taxes for the periods indicated:
| Years Ended December 31, | ||||||||||||
| ($ in millions) | 2013 | 2012 | 2011 | |||||||||
| DAC/VOBA and other intangibles unlocking |
$ | (0.5 | ) | $ | — | $ | — | |||||
| Net gain from Lehman Recovery/LIHTC |
4.3 | — | — | |||||||||
| Loss on sale of alternative investments |
— | (5.1 | ) | — | ||||||||
-106-
Table of Contents
The following table summarizes sales, gross premiums and in-force for our Employee Benefits segment for the periods indicated:
| Years Ended December 31, | ||||||||||||
| ($ in millions) | 2013 | 2012 | 2011 | |||||||||
| Sales by Product Line: |
||||||||||||
| Group life |
$ | 58.3 | $ | 47.9 | $ | 36.8 | ||||||
| Group stop loss |
153.4 | 151.6 | 140.9 | |||||||||
| Other group products |
24.1 | 31.1 | 19.8 | |||||||||
|
|
|
|
|
|
|
|||||||
| Total group products |
235.8 | 230.6 | 197.5 | |||||||||
| Voluntary products |
27.2 | 24.5 | 28.0 | |||||||||
|
|
|
|
|
|
|
|||||||
| Total sales by product line |
$ | 263.0 | $ | 255.1 | $ | 225.5 | ||||||
|
|
|
|
|
|
|
|||||||
| Total gross premiums and deposits |
$ | 1,261.5 | $ | 1,252.1 | $ | 1,244.6 | ||||||
| Total annualized in-force premiums |
1,294.6 | 1,286.6 | 1,259.5 | |||||||||
| Loss Ratios: |
||||||||||||
| Group life (interest adjusted) |
78.7 | % | 76.9 | % | 77.5 | % | ||||||
| Group stop loss |
75.3 | % | 72.9 | % | 82.9 | % | ||||||
Employee Benefits—Year Ended December 31, 2013 Compared to Year Ended December 31, 2012
Operating revenues
Net investment income and net realized gains (losses) increased $3.3 million from $114.3 million to $117.6 million primarily due to $4.3 million of net investment income from Lehman Recovery/LIHTC in the current period and a loss on the sale of certain alternative investments in the prior period. Excluding the impact of these asset sales, Net investment income and net realized gains (losses) decreased due to lower investment income on the CMO-B investment portfolio, as a result of portfolio restructuring in the prior period.
Premiums increased $7.8 million from $1,078.1 million to $1,085.9 million primarily due to higher group life premiums resulting from higher sales and favorable persistency and a new voluntary product introduced in 2013. This was partially offset by lower group stop loss premiums.
Operating benefits and expenses
Interest credited and other benefits to contract owners/policyholders increased $11.3 million from $892.1 million to $903.4 million primarily due to higher group life claims, partially offset by improved retained disability results. The current period loss ratios were lower than or within expected ranges although higher than the prior period.
Net amortization of DAC/VOBA increased $3.4 million from $13.5 million to $16.9 million primarily due to increased amortization resulting from terminated cases and higher gross profits on the UL block.
Operating earnings before income taxes
Operating earnings before income taxes decreased $3.3 million from $109.4 million to $106.1 million primarily due to higher group life claims and higher DAC/VOBA amortization. Partially offsetting these items was higher group life premiums and higher investment income, resulting from the Net gain from Lehman Recovery/LIHTC in the current period and a loss on the sale of certain alternative investments in the prior period.
-107-
Table of Contents
Employee Benefits—Year Ended December 31, 2012 Compared to Year Ended December 31, 2011
Operating revenues
Net investment income and net realized gains (losses) decreased $10.0 million from $124.3 million to $114.3 million primarily due to the $5.1 million loss on the sale of certain alternative investments, lower investment income on alternative investments and lower yields on fixed income investments.
Premiums increased $14.7 million from $1,063.4 million to $1,078.1 million primarily due to higher stop loss premiums resulting from higher sales and in-force blocks. Annualized in-force stop loss premiums increased 5.0% over 2011. These increases were partially offset by lower group life premiums due to a decline in the in-force block driven by low persistency in 2011 adversely impacting 2012.
Operating benefits and expenses
Interest credited and other benefits to contract owners/policyholders decreased $25.6 million from $917.7 million to $892.1 million primarily due to favorable claims experience and higher reinsurance recoveries in our stop loss block. This decrease was partially offset by lower favorable experience with the run-off block of retained disability products.
Operating expenses increased $6.9 million from $229.3 million to $236.2 million primarily due to an increase in administrative expenses and higher premium taxes and guarantee assessments related to an increase in sales.
Operating earnings before income taxes
Growth of the in-force stop loss business and improved loss ratios on stop loss and group life businesses contributed to improved operating earnings, partially offset by lower favorable experience with the run-off block of retained disability products and lower alternative investment income.
Corporate
The following table summarizes Operating earnings before income taxes of our Corporate segment for the periods indicated:
| Years Ended December 31, | ||||||||||||
| ($ in millions) | 2013 | 2012 | 2011 | |||||||||
| Interest expense (including interest rate swap settlements) |
$ | (179.7 | ) | $ | (127.8 | ) | $ | (185.7 | ) | |||
| Closed Block Variable Annuity contingent capital LOC |
(18.4 | ) | (56.7 | ) | — | |||||||
| Amortization of intangibles |
(35.0 | ) | (35.0 | ) | (34.4 | ) | ||||||
| Reserve increase related to the use of SSDMF |
— | — | (68.9 | ) | ||||||||
| Other |
22.5 | 37.2 | 58.8 | |||||||||
|
|
|
|
|
|
|
|||||||
| Operating earnings before income taxes |
$ | (210.6 | ) | $ | (182.3 | ) | $ | (230.2 | ) | |||
|
|
|
|
|
|
|
|||||||
Our Corporate segment operating results include investment income on assets backing surplus in excess of amounts held at the operating segment level, financing and interest expenses, amortization of intangibles and other items not allocated to operating segments.
Corporate—Year Ended December 31, 2013 Compared to Year Ended December 31, 2012
Operating earnings before income taxes decreased $28.3 million from $(182.3) million to $(210.6) million primarily due to an increase in interest expense and operating expenses, offset by a decrease in LOC expenses. Interest expense increased over the period partially due to additional interest and debt issuance costs as a result of
-108-
Table of Contents
a change in debt structure. See a description of the change in debt structure under “Liquidity and Capital Resources—Debt Securities.” The increase in Operating expenses, primarily resulting from higher variable compensation costs in the current period compared to the prior period, was offset by lower LOC expenses in the current period due to the termination of the contingent capital letter of credit facility supporting our CBVA segment.
Corporate—Year Ended December 31, 2012 Compared to Year Ended December 31, 2011
Operating earnings before income taxes increased $47.9 million from $(230.2) million to $(182.3) million primarily driven by the 2011 charge of $68.9 million, net of associated DAC, to increase reserves in connection with our use of the Social Security Death Master File (“SSDMF”) as described below. In addition, interest costs decreased $57.9 million as a result of several factors. Lower swap interest expenses as well as a reduction in interest costs due to a $2.7 billion and a $1.3 billion debt-to-equity conversion in the second quarter and fourth quarter of 2011, respectively, were only partially offset by additional interest expense and debt issuance costs associated with the $5.0 billion revolving credit facility entered into in the second quarter of 2012 and the $850.0 million unsecured Senior Notes entered into in the third quarter of 2012. Lower interest costs were mostly offset by increased expenses, primarily driven by $56.7 million in letter of credit costs in 2012 related to the $1.5 billion contingent capital letter of credit facility issued at the end of 2011 to support our Closed Block Variable Annuity segment, as well as lower compensation expenses during 2011, which resulted primarily from payments in 2011 related to 2010 performance which were less than estimated in 2010.
Closed Blocks
The following table summarizes Operating earnings before income taxes of our Closed Blocks for the periods indicated:
| Years Ended December 31, | ||||||||||||
| ($ in millions) | 2013 | 2012 | 2011 | |||||||||
| Closed Block Institutional Spread Products |
$ | 35.9 | $ | 45.7 | $ | 83.2 | ||||||
| Closed Block Other |
14.7 | 64.0 | (13.0 | ) | ||||||||
|
|
|
|
|
|
|
|||||||
| Operating earnings before income taxes |
$ | 50.6 | $ | 109.7 | $ | 70.2 | ||||||
|
|
|
|
|
|
|
|||||||
The following table presents Operating earnings before income taxes of our Closed Block Institutional Spread Products segment for the periods indicated:
| Years Ended December 31, | ||||||||||||
| ($ in millions) | 2013 | 2012 | 2011 | |||||||||
| Operating revenues: |
||||||||||||
| Net investment income and net realized gains (losses) |
$ | 107.9 | $ | 126.3 | $ | 188.8 | ||||||
| Fee income |
— | 0.1 | 0.1 | |||||||||
| Premiums |
2.4 | 2.3 | 2.3 | |||||||||
| Other revenue |
(1.2 | ) | (1.5 | ) | (3.1 | ) | ||||||
|
|
|
|
|
|
|
|||||||
| Total operating revenues |
109.1 | 127.2 | 188.1 | |||||||||
|
|
|
|
|
|
|
|||||||
| Operating benefits and expenses: |
||||||||||||
| Interest credited and other benefits to contract owners/policyholders |
62.7 | 67.5 | 89.0 | |||||||||
| Operating expenses |
10.1 | 11.5 | 11.3 | |||||||||
| Net amortization of DAC/VOBA |
0.4 | 0.6 | 0.6 | |||||||||
| Interest expense |
— | 1.9 | 4.0 | |||||||||
|
|
|
|
|
|
|
|||||||
| Total operating benefits and expenses |
73.2 | 81.5 | 104.9 | |||||||||
|
|
|
|
|
|
|
|||||||
| Operating earnings before income taxes |
$ | 35.9 | $ | 45.7 | $ | 83.2 | ||||||
|
|
|
|
|
|
|
|||||||
-109-
Table of Contents
The following table presents Operating earnings before income taxes of our Closed Block Other segment for the periods indicated:
| Years Ended December 31, | ||||||||||||
| ($ in millions) | 2013 | 2012 | 2011 | |||||||||
| Operating revenues: |
||||||||||||
| Net investment income and net realized gains (losses) |
$ | 24.6 | $ | 35.0 | $ | 39.0 | ||||||
| Fee income |
— | 0.1 | 5.7 | |||||||||
| Premiums |
2.3 | 5.1 | 4.3 | |||||||||
| Other revenue |
0.8 | 3.6 | 3.2 | |||||||||
|
|
|
|
|
|
|
|||||||
| Total operating revenues |
27.7 | 43.8 | 52.2 | |||||||||
|
|
|
|
|
|
|
|||||||
| Operating benefits and expenses: |
||||||||||||
| Interest credited and other benefits to contract owners/policyholders |
(0.7 | ) | (3.8 | ) | 29.0 | |||||||
| Operating expenses |
13.7 | (16.4 | ) | 36.1 | ||||||||
| Interest expense |
— | — | 0.1 | |||||||||
|
|
|
|
|
|
|
|||||||
| Total operating benefits and expenses |
13.0 | (20.2 | ) | 65.2 | ||||||||
|
|
|
|
|
|
|
|||||||
| Operating earnings before income taxes |
$ | 14.7 | $ | 64.0 | $ | (13.0 | ) | |||||
|
|
|
|
|
|
|
|||||||
Closed Blocks—Year Ended December 31, 2013 Compared to Year Ended December 31, 2012
Closed Block Institutional Spread Products
Operating earnings before income taxes decreased $9.8 million from $45.7 million to $35.9 million primarily as a result of lower earnings resulting from a decrease in block size and a prepayment fee on early termination of certain FHLB funding agreements offset by a loss on sale of certain alternative investments in the prior period. The average block size based on AUM declined approximately 24% from $4.7 billion in 2012 to $3.6 billion in 2013. As a result, both Net investment income and Interest credited and other benefits to contract owners/policyholders decreased.
Closed Block Other
Operating earnings before income taxes decreased $49.3 million from $64.0 million to $14.7 million primarily as a result of lower operating expenses in the prior period due to a $22.0 million reimbursement of expenses from ING Group during the prior period as well as a contingency accrual in the current period. In addition, reserve changes for the group reinsurance business and a reduction in revenue resulting from the continuing run-off of this segment contributed to the decrease.
Closed Blocks—Year Ended December 31, 2012 Compared to Year Ended December 31, 2011
Closed Block Institutional Spread Products
Operating earnings before income taxes decreased $37.5 million from $83.2 million to $45.7 million as a result of decrease in the average size of the block and the $8.0 million loss on the sale of certain alternative investments, partially offset by reductions in contract interest crediting costs, including net prepayment fees paid on contracts terminated in 2011 and 2012. The average block size based on AUM declined approximately 25.4% from $6.3 billion in 2011 to $4.7 billion in 2012. Interest credited and other benefits to contract owners/policyholders decreased $21.5 million primarily due to the decrease in the block size, as well as declines in overall contract costs due to lower average interest crediting rates.
-110-
Table of Contents
Closed Block Other
Operating earnings before income taxes increased $77.0 million from $(13.0) million to $64.0 million as a result of several factors. Favorable reserve development in the retained portion of the group reinsurance business was partially offset by a reduction in net investment income. In addition to the impact from the group reinsurance business, a $52.5 million decline in operating expenses resulted primarily from the elimination of certain Corporate functions that supported ING Group’s Latin America business, as well as a $22.0 million reimbursement of expenses by ING Group. These expenses were paid in 2011 by ING U.S., Inc. on behalf of ING Group’s Latin American business. In 2011, operating expenses included $24.6 million of previously unreimbursed Latin America expenses. The continuing run-off of this segment contributed to a decline in fee income and a corresponding decrease in operating expenses.
Closed Block Variable Annuity
The following table presents Income (loss) before income taxes of our CBVA segment for the periods indicated:
| Years Ended December 31, | ||||||||||||
| ($ in millions) | 2013 | 2012 | 2011 | |||||||||
| Revenues: |
||||||||||||
| Net investment income |
$ | 97.6 | $ | 52.7 | $ | 85.8 | ||||||
| Fee income |
1,287.1 | 1,235.9 | 1,280.7 | |||||||||
| Premiums |
79.2 | — | — | |||||||||
| Net realized capital gains (losses) |
(2,208.6 | ) | (1,382.8 | ) | (609.7 | ) | ||||||
| Other revenue |
18.5 | 24.2 | 38.1 | |||||||||
|
|
|
|
|
|
|
|||||||
| Total revenues |
(726.2 | ) | (70.0 | ) | 794.9 | |||||||
|
|
|
|
|
|
|
|||||||
| Benefits and expenses: |
||||||||||||
| Interest credited and other benefits to contract owners/policyholders |
(51.9 | ) | 113.6 | 882.9 | ||||||||
| Operating expenses and interest expense |
467.6 | 450.4 | 421.2 | |||||||||
| Net amortization of DAC/VOBA |
67.4 | 58.3 | 55.3 | |||||||||
|
|
|
|
|
|
|
|||||||
| Total benefits and expenses |
483.1 | 622.3 | 1,359.4 | |||||||||
|
|
|
|
|
|
|
|||||||
| Income (loss) before income taxes |
$ | (1,209.3 | ) | $ | (692.3 | ) | $ | (564.5 | ) | |||
|
|
|
|
|
|
|
|||||||
The following table presents certain notable items that result in volatility in Income (loss) before income taxes for the periods indicated:
| Years Ended December 31, | ||||||||||||
| ($ in millions) | 2013 | 2012 | 2011 | |||||||||
| Net gains (losses) related to incurred guaranteed benefits and guarantee hedge program, excluding nonperformance risk |
$ | (1,429.5 | ) | $ | (858.3 | ) | $ | (2,062.3 | ) | |||
| Gain (losses) related to CHO program |
(244.8 | ) | (351.0 | ) | (129.9 | ) | ||||||
| Gain (loss) due to nonperformance risk |
(494.5 | ) | (443.6 | ) | 517.0 | |||||||
| Net investment gains (losses) |
12.6 | 26.6 | 63.5 | |||||||||
| DAC/VOBA and other intangibles unlocking and loss recognition |
(4.7 | ) | 1.8 | 21.1 | ||||||||
-111-
Table of Contents
The following table presents AUM for our CBVA segment as of the dates indicated:
| Years Ended December 31, | ||||||||||||
| ($ in millions) | 2013 | 2012 | 2011 | |||||||||
| AUM |
||||||||||||
| General account |
$ | 1,429.1 | $ | 1,237.6 | $ | 1,069.4 | ||||||
| Separate account |
44,269.9 | 41,960.8 | 41,576.1 | |||||||||
|
|
|
|
|
|
|
|||||||
| Total AUM |
$ | 45,699.0 | $ | 43,198.4 | $ | 42,645.5 | ||||||
|
|
|
|
|
|
|
|||||||
The following table presents a rollforward of AUM for our CBVA segment for the periods indicated:
| Years Ended December 31, | ||||||||||||
| ($ in millions) | 2013 | 2012 | 2011 | |||||||||
| Balance as of beginning of period |
$ | 43,198.4 | $ | 42,645.5 | $ | 47,978.0 | ||||||
| Deposits |
661.0 | 500.5 | 543.3 | |||||||||
| Surrenders, benefits and product charges |
(4,579.9 | ) | (4,019.3 | ) | (4,332.9 | ) | ||||||
|
|
|
|
|
|
|
|||||||
| Net flows |
(3,918.9 | ) | (3,518.8 | ) | (3,789.6 | ) | ||||||
| Interest credited and investment performance |
6,419.5 | 4,071.7 | (1,542.9 | ) | ||||||||
|
|
|
|
|
|
|
|||||||
| Balance as of end of period |
$ | 45,699.0 | $ | 43,198.4 | $ | 42,645.5 | ||||||
|
|
|
|
|
|
|
|||||||
Closed Block Variable Annuity—Year Ended December 31, 2013 Compared to Year Ended December 31, 2012
Loss before income taxes increased $517.0 million from $692.3 million to $1,209.3 million. Annual assumption changes implemented during the current period resulted in a loss of $185.3 million, which included $117.9 million of unfavorable mortality assumption changes and $85.5 million of unfavorable policyholder behavior assumption changes. The prior period result included a loss of $151.7 million due to annual assumption changes, which consisted of $114.6 million driven primarily by an update to lapse rates on variable annuity contracts with lifetime living benefit guarantees and $37.1 million related to changes in cash flow projections and volatility assumptions on certain products.
Net losses related to the incurred guaranteed benefits and our guarantee hedge and CHO program increased to $1,674.3 million in the current period compared to $1,209.3 million in the prior period. The $465.0 million increased loss was primarily due to higher equity market returns, as our guarantee hedges backing reserves are more sensitive to changes in equity markets than those reserves, as well as higher unfavorable impacts of assumption changes in the current period compared to the prior period, as described above. The focus in managing our CBVA segment is on protecting regulatory and rating agency capital, and our hedging program is primarily designed to mitigate the impacts of market scenarios on capital resources, rather than mitigating earnings volatility. The current period result also included a loss of $494.5 million due to changes in the fair value of guaranteed benefit derivative related to nonperformance risk, compared to a loss of $443.6 million in the prior period.
Closed Blocks Variable Annuity—Year Ended December 31, 2012 Compared to Year Ended December 31, 2011
Loss before income taxes increased $127.8 million from $564.5 million to $692.3 million as a result of several factors. Changes in fair value of guaranteed benefit derivatives related to nonperformance risk combined with higher losses on our CHO program were more than offset by a decrease in net losses related to the incurred guaranteed benefits and our Variable Annuity Guarantee Hedge Program. The change in the fair value of guaranteed benefit derivatives related to nonperformance risk changed by ($960.6) million, from a gain of
-112-
Table of Contents
$517.0 million to a loss of ($443.6) million. The net gain (loss) of our incurred guaranteed benefits and the results of our Variable Annuity Guarantee Hedge Program will vary from period-to-period primarily because our Variable Annuity Guarantee Hedge Program is set based on market consistent valuation techniques for equity risks and for certain interest rate risks, rather than mitigating earnings volatility. Losses resulting from our incurred guaranteed benefits and Variable Annuity Guarantee Hedge Program decreased $1,204.0 million due to lower impacts of policyholder behavior and other assumption changes in 2012 compared to 2011, the impact of favorable fund returns relative to overall equity market returns in 2012, and a current year decrease in volatility. The 2012 impact of policyholder behavior assumption changes was a decrease in income of $151.7 million, which consisted of $114.6 million driven primarily by an update to lapse rates on variable annuity contracts with lifetime living benefit guarantees and $37.1 million related to changes in cash flow projections and volatility assumptions on certain products. The prior year impacts of policyholder assumption changes decreased income by $741.2 million.
Losses on our CHO program, designed to protect regulatory and rating agency capital, increased by $221.1 million, from $129.9 million to $351.0 million. This was primarily due to an increase in equity markets in 2012, compared to equity markets that were essentially flat in the prior period. In addition, we increased the notional position of our CHO program in 2012, partly as a result of assumption changes made in late 2011. A decline in net investment income due primarily to lower yields on assets backing reserves and lower realized gains on investments contributed to the decrease, in addition to lower fee income and surrender fees from the continued run-off of the business and higher LOC costs.
Alternative Investment Income
Investment income on certain alternative investments can be volatile due to changes in market conditions. The following table presents the amount of investment income (loss) on certain alternative investments that is included on segment Operating earnings before income taxes and the average level of assets in each segment, prior to intercompany eliminations. These alternative investments are carried at fair value, which is estimated based on the NAV of these funds. The investment income on alternative investments shown below for the periods stated excludes the net investment income from Lehman Recovery/LIHTC in the current periods and net loss on the sale of certain alternative investments during the prior periods.
While investment income on these assets can be volatile, based on current plans, we expect to earn 8% to 9% on these assets over the long term.
-113-
Table of Contents
The following table summarizes the investment income for the years ended December 31, 2013, 2012 and 2011, respectively, and the average assets of alternative investments as of the dates indicated:
| Years Ended December 31, | ||||||||||||
| ($ in millions) | 2013 | 2012 | 2011 | |||||||||
| Retirement |
||||||||||||
| Alternative investment income |
$ | 36.4 | $ | 43.2 | $ | 42.6 | ||||||
| Average alternative investment |
262.0 | 523.1 | 726.8 | |||||||||
| Annuities |
||||||||||||
| Alternative investment income |
25.6 | 25.8 | 22.6 | |||||||||
| Average alternative investment |
177.6 | 284.4 | 315.5 | |||||||||
| Investment Management |
||||||||||||
| Alternative investment income |
23.8 | 41.6 | 9.0 | |||||||||
| Average alternative investment |
124.0 | 107.5 | 98.1 | |||||||||
| Individual Life |
||||||||||||
| Alternative investment income |
20.2 | 12.1 | 19.5 | |||||||||
| Average alternative investment |
131.0 | 197.5 | 244.8 | |||||||||
| Employee Benefits |
||||||||||||
| Alternative investment income |
3.9 | 4.5 | 6.8 | |||||||||
| Average alternative investment |
24.7 | 54.2 | 78.3 | |||||||||
|
|
|
|
|
|
|
|||||||
| Total Ongoing Business |
||||||||||||
| Alternative investment income |
109.9 | 127.2 | 100.5 | |||||||||
| Average alternative investment |
719.3 | 1,166.7 | 1,463.5 | |||||||||
|
|
|
|
|
|
|
|||||||
| Corporate |
||||||||||||
| Alternative investment income |
9.0 | 23.4 | 15.0 | |||||||||
| Average alternative investment |
97.8 | 95.5 | 84.6 | |||||||||
| Closed Blocks(1) |
||||||||||||
| Alternative investment income |
9.7 | 11.6 | 10.7 | |||||||||
| Average alternative investment |
58.1 | 88.4 | 97.9 | |||||||||
|
|
|
|
|
|
|
|||||||
| Total ING US |
||||||||||||
| Alternative investment income |
$ | 128.6 | $ | 162.2 | $ | 126.2 | ||||||
|
|
|
|
|
|
|
|||||||
| Average alternative investment |
$ | 875.2 | $ | 1,350.6 | $ | 1,646.0 | ||||||
|
|
|
|
|
|
|
|||||||
| (1) | Our Closed Block Variable Annuity segment is managed to focus on protecting regulatory and rating agency capital rather than achieving operating metrics and, therefore, its results of operations are not reflected within investment income. |
Unlocking of DAC/VOBA and other Contract Owner/Policyholder Intangibles
Changes in Operating earnings before income taxes and net income (loss) are influenced by increases and decreases in amortization of DAC, VOBA, DSI, and URR. The DAC asset represents policy acquisition costs that have been capitalized and are subject to amortization and interest. Capitalized costs are direct incremental costs of contract acquisition, as well as certain costs related directly to acquisition activities. Such costs consist principally of certain commissions, underwriting, sales and contract issuance and processing expenses directly related to the successful acquisition of new and renewal business. The VOBA asset represents the outstanding value of in-force business acquired and is subject to amortization and interest. The value is based on the present value of estimated net cash flows embedded in the insurance contracts at the time of the acquisition and increased for subsequent deferrable expenses on purchased policies. We amortize VOBA over the estimated life of the contracts using the same methodology and assumptions employed to amortize DAC. The DSI asset represents benefits paid to contract owners for a specified period that are incremental to the amounts we credit on similar
-114-
Table of Contents
contracts without sales inducements and are higher than the contracts’ expected ongoing crediting rates for periods after the inducement. We defer sales inducements and amortize them over the life of the contracts using the same methodology and assumptions employed to amortize DAC. (The amortization of sales inducements is included in Interest credited and other benefits to contract owners/policyholders). In addition, a URR liability is recorded related to UL and variable universal life (“VUL”) products and represents policy charges for services to be provided in future periods. These policy charges are deferred as unearned revenue and amortized over the expected life of the contracts in proportion to the estimated gross profits in a manner consistent with DAC for these products. The change in URR is included in Fee income.
Generally, we amortize DAC/VOBA, DSI, and URR related to UL and VUL contracts, variable deferred annuity contracts and fixed deferred annuity contracts over the estimated lives of the contracts in relation to the emergence of estimated gross profits. For variable deferred annuity contracts within the CBVA segment, we amortize DAC, VOBA and DSI in relation to the emergence of estimated gross revenue. Assumptions as to mortality, persistency, interest crediting rates, returns associated with separate account performance, impact of hedge performance, expenses to administer the business and certain economic variables, such as inflation, are based on our experience and our overall short-term and long-term future expectations for returns available in the capital markets. At each valuation date, actual historical gross profits are reflected and estimated gross profits and related assumptions, are evaluated for continued reasonableness. Adjustments to estimated gross profits require that amortization rates be revised retroactively to the date of the contract issuance, which is referred to as unlocking. As a result of this process, the cumulative balances of DAC, VOBA, DSI, and URR are adjusted with an offsetting benefit or charge to income to reflect changes in the period of the revision. An unlocking event that results in a benefit (“favorable unlocking”) generally occurs as a result of actual experience or future expectations being favorable compared to previous estimates. An unlocking event that results in a charge (“unfavorable unlocking”) generally occurs as a result of actual experience or future expectations being unfavorable compared to previous estimates. When unlocking, we unlock assumptions for each of the appropriate intangibles and refer to the unlocking as “DAC/VOBA and other intangible” unlocking. As a result of unlocking, the amortization schedules for future periods are also adjusted.
We also review the estimated gross profits for each of these blocks of business to determine the recoverability of DAC, VOBA and DSI balances each period. These assets are deemed to be unrecoverable if the estimated gross profits do not exceed these balances and a write-down is recorded that is referred to as loss recognition. There was no loss recognition for the years ended December 31, 2013, 2012 and 2011.
During the third quarter of 2013, we completed our annual review of assumptions, including projection model inputs, in each of our segments (except for Investment Management, for which assumption reviews are not relevant). As a result of this review, we made a number of changes to our assumptions, resulting in a net favorable impact of $84.8 million to Operating earnings before income taxes in the current period, compared to a net unfavorable impact of $32.0 million in the third quarter of 2012. In addition, during the fourth quarter of 2013, there was an additional $21.1 million of favorable DAC unlocking in our Annuities segment related to refinements of projected gross profits. The unlocking related to these assumption reviews is included in DAC/VOBA and other intangibles unlocking.
The following table summarizes the amount of DAC/VOBA and other intangibles unlocking that is included in segment Operating earnings before income taxes for the periods indicated:
| Years Ended December 31, | ||||||||||||
| ($ in millions) | 2013 | 2012 | 2011 | |||||||||
| Retirement |
$ | 45.6 | $ | 5.8 | $ | 44.2 | ||||||
| Annuities |
83.3 | (86.2 | ) | 266.0 | ||||||||
| Individual Life |
4.8 | 3.4 | (6.4 | ) | ||||||||
| Employee Benefits |
(0.5 | ) | — | — | ||||||||
|
|
|
|
|
|
|
|||||||
| Total DAC/VOBA and other intangibles unlocking(1)(2) |
$ | 133.2 | $ | (77.0 | ) | $ | 303.8 | |||||
|
|
|
|
|
|
|
|||||||
-115-
Table of Contents
| (1) | Unlocking related to the Net gain from Lehman Recovery/LIHTC is excluded from DAC/VOBA and other intangibles unlocking for the year ended December 31, 2013 (and included in Net gain from Lehman Recovery/LIHTC). |
| (2) | Includes the impacts of the annual review of assumptions. |
Liquidity and Capital Resources
Liquidity is our ability to generate sufficient cash flows to meet the cash requirements of operating, investing and financing activities. Capital refers to our long-term financial resources available to support the business operations and contribute to future growth. Our ability to generate and maintain sufficient liquidity and capital depends on the profitability of the businesses, timing of cash flows on investments and products, general economic conditions and access to the capital markets and the alternate sources of liquidity and capital described herein.
Consolidated Sources and Uses of Liquidity and Capital
Our principal available sources of liquidity are premiums, deposits, fee income, investment income, proceeds from the maturity and sale of investments, proceeds from debt issuance and borrowing facilities, repurchase agreements and securities lending. Primary uses of these funds are payments of policyholder benefits commissions and operating expenses, interest credits, investment purchases and contract maturities, withdrawals and surrenders.
Parent Company Sources and Uses of Liquidity
In evaluating liquidity it is important to distinguish the cash flow needs of ING U.S., Inc. from the cash flow needs of the Company as a whole. ING U.S., Inc. is largely dependent on cash flows from its operating subsidiaries to meet its obligations. The principal sources of funds available to ING U.S., Inc. include dividends and returns of capital from its operating subsidiaries, as well as cash and short-term investments. These sources of funds are currently supplemented by ING U.S., Inc.’s access to the $750.0 million revolving credit sublimit of its Amended and Restated Revolving Credit Agreement and reciprocal borrowing facilities maintained with its subsidiaries as well as other alternate sources of liquidity described below either directly or indirectly through its insurance subsidiaries.
ING U.S., Inc.’s primary sources and uses of cash for the years ended December 31, 2013, 2012 and 2011 are summarized in the following table:
| Years Ended December 31, | ||||||||||||
| ($ in millions) | 2013 | 2012 | 2011 | |||||||||
| Beginning cash balance |
$ | 357.5 | $ | 1.3 | $ | 3.0 | ||||||
| Sources: |
||||||||||||
| Proceeds from borrowings from ING V |
— | — | 263.0 | |||||||||
| Dividends and returns of capital from subsidiaries |
1,434.0 | 813.0 | 200.0 | |||||||||
| Repayment of loans to subsidiaries, net of new issuances |
— | 102.3 | 870.2 | |||||||||
| Proceeds from credit facility borrowings, net of repayments |
— | 1,350.0 | — | |||||||||
| Proceeds from 2022 Notes offering |
— | 849.5 | — | |||||||||
| Proceeds from 2018 Notes offering |
998.2 | — | — | |||||||||
| Proceeds from 2053 Notes offering |
750.0 | — | — | |||||||||
| Proceeds from 2043 Notes offering |
398.6 | — | — | |||||||||
| Proceeds from Initial Public Offering |
571.6 | — | — | |||||||||
| Amounts received from subsidiaries under tax sharing arrangements, net |
348.2 | 56.4 | 205.7 | |||||||||
| Other, net |
4.8 | 62.3 | 2.8 | |||||||||
|
|
|
|
|
|
|
|||||||
| Total sources |
4,505.4 | 3,233.5 | 1,541.7 | |||||||||
|
|
|
|
|
|
|
|||||||
-116-
Table of Contents
| Years Ended December 31, | ||||||||||||
| ($ in millions) | 2013 | 2012 | 2011 | |||||||||
| Uses: |
||||||||||||
| Payments under interest rate swap contracts, net of new issuance |
$ | — | $ | — | $ | 410.4 | ||||||
| Payment of interest expense |
90.6 | 33.4 | 52.6 | |||||||||
| Capital provided to subsidiaries |
2,062.0 | 400.0 | 377.0 | |||||||||
| Repayments of loans from subsidiaries, net of new issuances |
319.1 | 2,037.3 | 40.8 | |||||||||
| Repayment of commercial paper, net of issuances |
192.0 | 362.6 | 649.0 | |||||||||
| Repayment of credit facility borrowings |
1,350.0 | — | — | |||||||||
| New issuances of loans to subsidiaries, net of repayments |
134.3 | — | — | |||||||||
| Payment of income taxes, net |
43.0 | 5.2 | 13.6 | |||||||||
| Debt issuance costs |
26.5 | 38.8 | — | |||||||||
| Payment of dividends |
5.2 | — | — | |||||||||
|
|
|
|
|
|
|
|||||||
| Total uses |
4,222.7 | 2,877.3 | 1,543.4 | |||||||||
|
|
|
|
|
|
|
|||||||
| Net increase (decrease) in cash and cash equivalents |
282.7 | 356.2 | (1.7 | ) | ||||||||
|
|
|
|
|
|
|
|||||||
| Ending cash balance |
$ | 640.2 | $ | 357.5 | $ | 1.3 | ||||||
|
|
|
|
|
|
|
|||||||
Liquidity
We manage liquidity through access to substantial investment portfolios as well as a variety of other sources of liquidity including committed credit facilities, securities lending and repurchase agreements. Our ALM process takes into account the expected maturity of investments and expected benefit payments as well as the specific nature and risk profile of the liabilities, including variable products with guarantees. As part of our liquidity management process, we model different scenarios to determine whether existing assets are adequate to meet projected cash flows. Key variables in the modeling process include interest rates, equity market movements, quantity and type of interest and equity market hedges, anticipated contract owner behavior, market value of general account assets, variable separate account performance and implications of rating agency actions.
Restrictions on Dividends and Returns of Capital from Subsidiaries
Our business is conducted through operating subsidiaries. U.S. insurance laws and regulations regulate the payment of dividends and other distributions by our U.S. insurance subsidiaries to their respective parents. Dividends in excess of prescribed limits established by the applicable state regulations are considered to be extraordinary transactions and require explicit regulatory approval. In addition, under the insurance laws of the states of domicile of our Principal Insurance Subsidiaries, no dividend or other distribution exceeding an amount equal to an insurance company’s earned surplus may be paid without the domiciliary insurance regulator’s prior approval. For a summary of applicable laws and regulations governing dividends, see “Note 12. Insurance Subsidiaries—Insurance Subsidiaries Dividend Restrictions.”
-117-
Table of Contents
The following table summarizes dividends permitted to be paid by our Principal Insurance Subsidiaries to ING U.S., Inc. or Lion Holdings without the need for insurance regulatory approval for the periods presented:
| Dividends Permitted without Approval |
||||||||||||
| ($ in millions) | 2014 | 2013 | 2012 | |||||||||
| Subsidiary Name (State of domicile): |
||||||||||||
| ING USA Annuity and Life Insurance Company (IA) |
$ | 216.3 | (3) | $ | — | $ | — | |||||
| ING Life Insurance and Annuity Company (CT) |
371.4 | (4) | 264.1 | (1) | 190.0 | (2) | ||||||
| Security Life of Denver Insurance Company (CO) |
32.5 | (3) | — | — | ||||||||
| ReliaStar Life Insurance Company (MN) |
194.0 | (3) | — | — | ||||||||
| (1) | $264.1 million could have been paid without approval after June 26, 2013. $174.0 million was paid on May 8, 2013 as an extraordinary distribution. $90.0 million was paid as an ordinary dividend on December 9, 2013. |
| (2) | $190.0 million was paid as part of the June 26, 2012 distribution of $800.0 million. |
| (3) | These can be paid as ordinary dividends after May 8, 2014. |
| (4) | $281.4 million can be paid as ordinary dividends after May 8, 2014. $90.0 million can be paid as ordinary dividends after December 9, 2014. |
The following table summarizes dividends and return of capital distributions paid by each of the Company’s Principal Insurance Subsidiaries to ING U.S., Inc. or Lion Holdings for the periods indicated:
| Dividends Paid | Return of Capital Distributions |
|||||||||||||||
| Years Ended December 31, |
Years Ended December 31, |
|||||||||||||||
| ($ in millions) | 2013 | 2012 | 2013 | 2012 | ||||||||||||
| Subsidiary Name (State of domicile): |
||||||||||||||||
| ING USA Annuity and Life Insurance Company (IA)(1) |
$ | — | $ | — | $ | 230.0 | $ | 250.0 | ||||||||
| ING Life Insurance and Annuity Company (CT)(2) |
264.0 | 190.0 | — | 150.0 | ||||||||||||
| Security Life of Denver Insurance Company (CO)(3) |
— | — | 447.0 | 80.0 | ||||||||||||
| ReliaStar Life Insurance Company (MN)(4) |
— | 130.0 | 583.0 | — | ||||||||||||
| (1) | Iowa Insurance Division approved ING USA’s 2013 and 2012 return of capital distributions. |
| (2) | Connecticut Insurance Department approved ILIAC’s $174.0 million extraordinary dividend as part of the May 8, 2013 extraordinary distribution. In December 2013, ILIAC paid a $90.0 million ordinary dividend. In 2012, ILIAC paid $340.0 million in distributions, which included a $190.0 million ordinary dividend. |
| (3) | Colorado Insurance Division approved SLD’s 2013 and 2012 return of capital distributions. |
| (4) | Minnesota Insurance Division approved RLI’s 2013 distribution and 2012 dividend. |
In March and April 2013, in response to requests made in 2012 and refreshed in 2013, our insurance subsidiaries domiciled in Colorado, Connecticut, Iowa and Minnesota received approvals or notices of non-objection, as the case may be, from their respective domiciliary insurance regulators to make extraordinary distributions to ING U.S., Inc. or Lion Holdings, a wholly owned subsidiary of ING U.S., Inc., in the aggregate amount of $1,434.0 million, contingent upon completion of the IPO and the use of the extraordinary distribution funds solely for Company operations. The approved distributions of $1,434.0 million were made on May 8, 2013.
In addition, on May 8, 2013, our Principal Insurance Subsidiaries domiciled in Colorado, Iowa and Minnesota each reset, on a one-time basis, their respective negative unassigned funds account as of December 31, 2012 (as reported in their respective 2012 statutory annual statements) to zero (with an offsetting reduction in gross paid-in capital and contributed surplus). These resets were made pursuant to permitted practices in accordance with statutory accounting practices granted by their respective domiciliary insurance regulators.
-118-
Table of Contents
These permitted practices have no impact on total capital and surplus of these insurance subsidiaries and were recorded in their second quarter statutory financial statements. See “Regulation—Insurance Regulation—Insurance Holding Company Regulation—Dividend Payment Restrictions”.
In June 2012, our Principal Insurance Subsidiaries domiciled in Colorado, Connecticut, Iowa and Minnesota received regulatory approvals or notices of non-objection from their respective domiciliary insurance regulators to make distributions to ING U.S., Inc. or Lion Holdings in the aggregate amount of $800.0 million. Such distributions were made on June 26, 2012. These domiciliary state regulatory actions were taken by the relevant domiciliary state insurance regulators in response to requests that stated the intended use of the proceeds was to provide $500.0 million to our captive reinsurance subsidiary, SLDI, and retain the balance at ING U.S., Inc. for general corporate purposes. On June 26, 2012, ING U.S., Inc. made a capital contribution to SLDI in the amount of $400.0 million. Additionally, ING U.S., Inc. repaid $100.0 million of intercompany loans from a subsidiary of SLDI and, on June 28, 2012 the proceeds of this loan repayment were used by such subsidiary to pay a dividend to SLDI.
Effective December 20, 2013, SLDI redomesticated from the Cayman Islands to the State of Arizona. SLDI may not declare or pay dividends other than in accordance with its annual capital and dividend plan as approved by the ADOI, which includes a minimum capital requirement. SLDI did not declare or pay a dividend for the years ended December 31, 2013 and 2012.
We may receive dividends from or contribute capital to our wholly owned non-life insurance subsidiaries such as broker-dealers, investment management entities and intermediate holding companies. For the years ended December 31, 2013 and 2012, dividends net of capital contributions received by ING U.S., Inc. and Lion Holdings from non-life subsidiaries were $100.0 million and $93.0 million, respectively.
Description of Certain Indebtedness
We borrow funds to provide liquidity, invest in the growth of the business and for general corporate purposes. Our ability to access these borrowings depends on a variety of factors including, but not limited to, the credit rating of ING U.S., Inc. and of its insurance company subsidiaries and general macroeconomic conditions.
The following table summarizes our borrowing activities for the year ended December 31, 2013:
| ($ in millions) | Beginning Balance |
Issuance | Maturities and Repayment |
Other Changes |
Ending Balance |
|||||||||||||||
| Short-Term Debt: |
||||||||||||||||||||
| Commercial paper |
$ | 192.0 | $ | 474.9 | $ | (666.9 | ) | $ | — | $ | — | |||||||||
| Current portion of long-term debt |
872.6 | — | (873.0 | ) | 0.4 | — | ||||||||||||||
|
|
|
|
|
|
|
|
|
|
|
|||||||||||
| Total short-term debt |
$ | 1,064.6 | $ | 474.9 | $ | (1,539.9 | ) | $ | 0.4 | $ | — | |||||||||
|
|
|
|
|
|
|
|
|
|
|
|||||||||||
| Long-Term Debt: |
||||||||||||||||||||
| Debt securities |
$ | 1,500.4 | $ | 2,146.8 | $ | (138.7 | ) | $ | 1.3 | $ | 3,509.8 | |||||||||
| Borrowings from ING V |
500.0 | — | (500.0 | ) | — | — | ||||||||||||||
| Windsor property loan |
4.9 | — | — | — | 4.9 | |||||||||||||||
| Syndicated Bank Term Loans |
1,350.0 | — | (1,350.0 | ) | — | — | ||||||||||||||
| Surplus notes |
688.4 | — | (688.4 | ) | — | — | ||||||||||||||
|
|
|
|
|
|
|
|
|
|
|
|||||||||||
| Subtotal |
$ | 4,043.7 | $ | 2,146.8 | $ | (2,677.1 | ) | $ | 1.3 | $ | 3,514.7 | |||||||||
|
|
|
|
|
|
|
|
|
|
|
|||||||||||
| Less: Current portion of long-term debt |
872.6 | — | (873.0 | ) | 0.4 | — | ||||||||||||||
|
|
|
|
|
|
|
|
|
|
|
|||||||||||
| Total long-term debt |
$ | 3,171.1 | $ | 2,146.8 | $ | (1,804.1 | ) | $ | 0.9 | $ | 3,514.7 | |||||||||
|
|
|
|
|
|
|
|
|
|
|
|||||||||||
-119-
Table of Contents
The following table summarizes our borrowing activities for the year ended December 31, 2012:
| ($ in millions) | Beginning Balance |
Issuance | Maturities and Repayment |
Other Changes |
Ending Balance |
|||||||||||||||
| Short-Term Debt: |
||||||||||||||||||||
| Commercial paper |
$ | 554.6 | $ | 18,700.9 | $ | (19,063.5 | ) | $ | — | $ | 192.0 | |||||||||
| Current portion of long-term debt |
500.0 | 300.0 | (150.0 | ) | 222.6 | 872.6 | ||||||||||||||
|
|
|
|
|
|
|
|
|
|
|
|||||||||||
| Total short-term debt |
$ | 1,054.6 | $ | 19,000.9 | $ | (19,213.5 | ) | $ | 222.6 | $ | 1,064.6 | |||||||||
|
|
|
|
|
|
|
|
|
|
|
|||||||||||
| Long-Term Debt: |
||||||||||||||||||||
| Debt securities |
$ | 649.8 | $ | 849.5 | $ | — | $ | 1.1 | $ | 1,500.4 | ||||||||||
| Borrowings from ING V |
500.0 | — | — | — | 500.0 | |||||||||||||||
| Windsor property loan |
4.9 | — | — | — | 4.9 | |||||||||||||||
| Bank Revolver Loan |
— | 500.0 | (500.0 | ) | — | — | ||||||||||||||
| Syndicated Bank Term Loans |
— | 1,500.0 | (150.0 | ) | — | 1,350.0 | ||||||||||||||
| Surplus notes |
688.4 | — | — | — | 688.4 | |||||||||||||||
|
|
|
|
|
|
|
|
|
|
|
|||||||||||
| Subtotal |
$ | 1,843.1 | $ | 2,849.5 | $ | (650.0 | ) | $ | 1.1 | $ | 4,043.7 | |||||||||
|
|
|
|
|
|
|
|
|
|
|
|||||||||||
| Less: Current portion of long-term debt |
500.0 | 300.0 | (150.0 | ) | 222.6 | 872.6 | ||||||||||||||
|
|
|
|
|
|
|
|
|
|
|
|||||||||||
| Total long-term debt |
$ | 1,343.1 | $ | 2,549.5 | $ | (500.0 | ) | $ | (221.5 | ) | $ | 3,171.1 | ||||||||
|
|
|
|
|
|
|
|
|
|
|
|||||||||||
Commercial Paper
ING U.S., Inc. had a commercial paper program with an authorized capacity of $3.0 billion. Our commercial paper borrowings were generally used to fund the working capital needs of our subsidiaries and provide short-term liquidity to us. We reduced the balance of commercial paper outstanding under the commercial paper program to zero prior to the completion of the IPO. Outstanding commercial paper borrowings were $192.0 million at December 31, 2012. The issuances under this program benefited from a full and irrevocable guarantee provided by ING V. We paid ING V 10 bps on the outstanding balance of the commercial paper program as a fee for this guarantee. On October 3, 2013, we terminated the commercial paper program along with the guarantee provided by ING V.
Debt Securities
Senior Notes. On July 13, 2012, ING U.S., Inc. issued $850.0 million of unsecured 5.5% Senior Notes due 2022 (the “2022 Notes”), a private placement with registration rights. The 2022 Notes are guaranteed by Lion Holdings. Interest is paid semi-annually, in arrears, on each January 15 and July 15, commencing on January 15, 2013. ING Financial Markets, LLC, an affiliate, served as Joint Book Running Manager for the 2022 Notes and was paid $0.3 million for its services. We used the proceeds of the 2022 Notes to repay $500.0 million of the direct borrowings under the Revolving Credit Agreement. The remaining proceeds of the 2022 Notes were used for general corporate purposes, including the retirement of a portion of our outstanding commercial paper. As a result of the issuance of the 2022 Notes, the revolving credit borrowings sublimit of the Revolving Credit Agreement of the Senior Unsecured Credit Facility was reduced by 50% of the issuance to $1.075 billion consistent with the terms of that agreement.
On February 11, 2013, ING U.S., Inc. issued $1.0 billion of unsecured 2.9% Senior Notes due 2018 (the “2018 Notes”), a private placement with registration rights. The 2018 Notes are guaranteed by Lion Holdings. Interest is paid semi-annually, in arrears, on each February 15 and August 15, commencing on August 15, 2013. ING Financial Markets, LLC, an affiliate, served as Joint Book Running Manager for the 2018 Notes and was paid $0.3 million for its services. We used the proceeds of the 2018 Notes to repay $850.0 million of the borrowings under the Term Loan portion of our Senior Unsecured Credit Facility. We used the remaining proceeds of the 2018 Notes for general corporate purposes. As a result of the issuance of the 2018 Notes, the
-120-
Table of Contents
revolving credit borrowings sublimit of the Revolving Credit Agreement of the Senior Unsecured Credit Facility was further reduced by 50% of the issuance to the minimum of $750.0 million.
On July 26, 2013, ING U.S., Inc. issued $400.0 million of unsecured 5.7% Senior Notes due 2043 (the “2043 Notes”), a private placement with registration rights. The 2043 Notes are guaranteed by Lion Holdings. Interest is paid semiannually on each January 15 and July 15, commencing on January 15, 2014. ING Financial Markets, LLC, an affiliate, served as Senior Co-Manager for the 2043 Notes and was paid an immaterial amount for its services. We used the proceeds of the 2043 Notes for general corporate purposes, including the repayment of certain borrowings.
Junior Subordinated Notes. On May 16, 2013, ING U.S., Inc. issued $750.0 million of 5.65% Fixed-to-Floating Rate Junior Subordinated Notes due 2053 (the “2053 Notes”) in a private placement with registration rights. The 2053 Notes are guaranteed on an unsecured, junior subordinated basis by Lion Holdings. Interest is paid semi-annually, in arrears, on each May 15 and November 15, commencing November 15, 2013 and ending on May 15, 2023. The 2053 Notes will bear interest at a fixed rate of 5.65% prior to May 15, 2023. From May 15, 2023, the 2053 Notes will bear interest at an annual rate equal to three-month LIBOR plus 3.58% payable quarterly, in arrears, on February 15, May 15, August 15 and November 15. So long as no event of default with respect to the 2053 Notes has occurred and is continuing, we have the right on one or more occasions, to defer the payment of interest on the 2053 Notes for one or more consecutive interest periods for up to five years. During the deferral period, interest will continue to accrue at the then-applicable rate and deferred interest will bear additional interest at the then-applicable rate. ING Financial Markets, LLC, an affiliate, served as a Senior Co-Manager on the 2053 Notes and was paid $0.2 million for its services.
At any time following notice of our plan to defer interest and during the period interest is deferred, we and our subsidiaries generally, with certain exceptions, may not make payments on or redeem or purchase any shares of our common stock or any of the debt securities or guarantees that rank in liquidation on a parity with or are junior to the 2053 Notes.
We may elect to redeem the 2053 Notes (i) in whole at any time or in part on or after May 15, 2023 at a redemption price equal to the principal amount plus accrued and unpaid interest. If the notes are not redeemed in whole, $25.0 million of aggregate principal (excluding the principal amount of the 2053 Notes held by us or our affiliates) must remain outstanding after giving effect to the redemption; or (ii) in whole, but not in part, at any time prior to May 15, 2023 within 90 days after the occurrence of a “tax event” or “rating agency event”, as defined in the 2053 Notes offering memorandum, at a redemption price equal to the principal amount, or, if greater, a “make-whole redemption price,” as defined in the 2053 Notes offering memorandum, plus, in each case accrued and unpaid interest.
On May 21, 2013, we used the proceeds of the 2053 Notes for the repayment of the remaining outstanding borrowings of $392.5 million under the Term Loan portion of the Company’s Senior Unsecured Credit Facility. The remaining proceeds were used to partially repay borrowings with ING V.
Registration Rights Agreement. Under the Registration Rights Agreements associated with the 2022 Notes, the 2018 Notes, the 2053 Notes and the 2043 Notes, ING U.S., Inc. and Lion Holdings agreed to use reasonable best efforts to cause a registration statement to be filed with the SEC that, upon effectiveness, would permit holders of these notes to exchange them for new notes containing identical terms except for the restrictions on transfer contained in the original notes. The offer to exchange the 2022 Notes, the 2018 Notes and the 2053 Notes was completed on August 14, 2013. The offer to exchange the 2043 Notes was completed on December 23, 2013.
Aetna Notes. As of December 31, 2013 and 2012, Lion Holdings had outstanding $163.0 million par amount of 7.25% Debentures due August 15, 2023, $235.1 million par amount of 7.63% Debentures due August 15, 2026 and $108.0 million par amount of 6.97% Debentures due August 15, 2036 (collectively, the “Aetna Notes”), all of which were issued by a predecessor of Lion Holdings and assumed in connection with our acquisition of
-121-
Table of Contents
Aetna’s life insurance and related businesses. An additional portion of the Aetna Notes, which carried an ING Group guarantee, were also held as of December 31, 2012 and were repaid at maturity. In addition, Equitable of Iowa Capital Trust II, a limited purpose trust, has outstanding $13.0 million par amount of 8.42% Series B Capital Securities due April 1, 2027 (the “ING USA Notes”). ING Group guarantees the Aetna Notes. The ING USA Notes benefit from a guarantee by ING U.S., Inc.
Concurrent with the completion of our IPO, we entered into a shareholder agreement with ING Group that governs certain aspects of our continuing relationship. We agreed to reduce the aggregate outstanding principal amount of Aetna Notes to:
| • | no more than $400.0 million as of December 31, 2015; |
| • | no more than $300.0 million as of December 31, 2016; |
| • | no more than $200.0 million as of December 31, 2017; |
| • | no more than $100.0 million as of December 31, 2018; |
| • | and zero as of December 31, 2019. |
The reduction in principal amount of Aetna Notes can be accomplished, at our option, through redemptions, repurchases or other means, but will also be deemed to have been reduced to the extent we post collateral with a third-party collateral agent, for the benefit of ING Group, which may consist of cash collateral; certain investment-grade debt instruments; an LOC meeting certain requirements; or senior debt obligations of ING Group or a wholly owned subsidiary of ING Group (other than the Company or its subsidiaries).
If we fail to reduce the outstanding principal amount of the Aetna Notes, we agreed to pay a quarterly fee (ranging from 0.5% per quarter for 2016 to 1.25% per quarter for 2019) to ING Group based on the outstanding principal amount of Aetna Notes which exceed the limits set forth above. As of December 31, 2013, the outstanding par amount of Aetna Notes guaranteed by ING Group was $506.1 million.
Surplus Notes
Two of our captive reinsurance subsidiaries issued surplus notes in order to finance insurance reserves assumed. On January 3, 2013, Whisperingwind II, LLC (“Whisperingwind II”) repaid the $359.3 million surplus note. On April 26, 2013, a final return of remaining capital in Whisperingwind II was paid to its parent, ReliaStar Life Insurance Company, and the subsidiary was dissolved.
On April 16, 2013, Whisperingwind III, LLC (“Whisperingwind III”) obtained a LOC of $305.0 million to replace its surplus note. Upon receiving regulatory approval, on April 19, 2013, Whisperingwind III repaid its $329.1 million surplus note. This surplus note was replaced with letters of credit. See “—Credit Facilities and Subsidiary Credit Support Arrangements” below. Also, see “Note 16. Financing Agreements—Surplus Notes”.
On January 15, 2014, Langhorne I, LLC (“Langhorne I”), a wholly owned reinsurance subsidiary of the Company, entered into a Transaction Agreement that allows for it to issue up to $500.0 million of surplus notes to a third party in exchange for a trust note used to support an affiliated reinsurance transaction. See “Credit Facilities and Subsidiary Credit Support Arrangements” section below.
Senior Unsecured Credit Facility
On April 20, 2012, ING U.S., Inc. entered into a $5.0 billion unsecured Senior Credit Facility (“Senior Unsecured Credit Facility”) with a syndicate of banks, replacing financing that was either internally funded or guaranteed by ING V. The Senior Unsecured Credit Facility is guaranteed by Lion Holdings, a wholly owned subsidiary of ING U.S., Inc. As part of the Senior Unsecured Credit Facility, ING U.S., Inc. entered into a $3.5 billion committed Revolving Credit Agreement and a $1.5 billion syndicated Term Loan Agreement (“Term Loan Agreement”).
-122-
Table of Contents
Revolving Credit Agreement. The Revolving Credit Agreement, while primarily an LOC facility, also includes a revolving credit sublimit of up to $1.5 billion of the $3.5 billion total, which may be directly borrowed by ING U.S., Inc. This $1.5 billion direct borrowings sublimit is reduced by 50% of the face amount of any debt securities issued by us, provided, that the sublimit may not be reduced below $750.0 million as a result. The cost of borrowings and LOC under the Revolving Credit Agreement vary depending on ING U.S., Inc.’s credit rating. The terms of the Senior Unsecured Credit Facility require ING U.S., Inc. to maintain liquidity of $500.0 million at all times. In order to meet this requirement in the future, ING U.S., Inc. could be required to forgo otherwise available draws under the Revolving Credit Agreement.
Immediately following the closing of the Revolving Credit Agreement, ING U.S., Inc. drew $500.0 million of direct borrowings to replace internally funded financing. In addition, $1.4 billion of LOCs were issued to replace $1.4 billion of LOCs issued under a pre-existing $2.5 billion syndicated LOC facility. As of December 31, 2013, $2.1 billion of LOCs were outstanding under the Revolving Credit Agreement.
On July 17, 2012, as a result of the issuance of the 2022 Notes, the direct borrowing sublimit under the Revolving Credit Agreement was reduced to $1.075 billion consistent with the requirement described above. On February 11, 2013, as a result of the issuance of the 2018 Notes, the revolving credit borrowings sublimit of the Revolving Credit Agreement was reduced by 50% of the issuance to a minimum of $750.0 million.
Term Loan Agreement. The proceeds of the Term Loan Agreement were used to replace financing that was internally funded. ING U.S., Inc. pays interest at a variable rate based on its credit rating and was required to make principal payments totaling 20% of the original borrowing amount over the first 12 months and 30% over the second twelve months with all remaining amounts due by April 20, 2014.
During February 2013, we made payments totaling $850.0 million on the Syndicated Bank Term Loan from the proceeds of the 2018 Notes. On May 21, 2013, we used the proceeds of the 2053 Notes for the repayment of the final outstanding borrowings of $392.5 million under the Term Loan Agreement. This action, together with the satisfaction of certain other requirements, caused the requirement to maintain liquidity of $500.0 million at all times to terminate.
Amended and Restated Credit Agreement. On February 14, 2014, the Company revised the terms of its Revolving Credit Agreement by entering into the Amended and Restated Revolving Credit Agreement (the “Amended and Restated Credit Agreement”) with a syndicate of banks. The Amended and Restated Credit Agreement modifies the original agreement by 1) extending the term of the agreement to February 14, 2018; 2) reducing the total amount of LOCs that may be issued from $3.5 billion to $3.0 billion and 3) reducing the current cost of LOC issuance fees from 200 bps to 175 bps. ING Bank, an affiliate, acted as Joint Lead Arranger, Joint Book Manager and Documentation Agent and received $0.7 million for its services and participation in the syndicate.
Credit Facilities and Subsidiary Credit Support Arrangements
We use credit facilities primarily to provide collateral required under our affiliated reinsurance transactions as well as certain third-party reinsurance arrangements to which our Arizona captive is a party. We also issue guarantees and enter into financing arrangements in connection with our affiliated reinsurance transactions. These arrangements are primarily designed to facilitate the financing of statutory reserve requirements. Regulation XXX and AG38 require insurers to hold significantly higher levels of reserves on term products and UL insurance products with secondary guarantees, respectively, than are generally thought to be sufficient. By reinsuring business to our captive reinsurance subsidiaries and our Arizona captive, we are able to use alternative sources of collateral to fund the statutory reserve requirements and are generally able to secure longer term financing on a more capital efficient basis.
Effective January 1, 2009, we entered into a master asset purchase agreement (the “MPA”) with Scottish Re Group Limited, Scottish Holdings, Inc., Scottish Re (U.S.), Inc. (“SRUS”), Scottish Re Life (Bermuda) Limited (“Scottish Bermuda”) and Scottish Re (Dublin) Limited (collectively, “Scottish Re”) and Hannover Re. Pursuant
-123-
Table of Contents
to the MPA, we recaptured individual life reinsurance business which had previously been reinsured to Scottish Re and immediately ceded 100% of such business to Hannover Re on a modified coinsurance, funds withheld and coinsurance basis, which resulted in no gain or loss. We will remain obligated to maintain collateral for the statutory reserve requirements associated with Statutory Regulations XXX and AG38 on the business transferred from us to Hannover Re for the duration of such reserve requirements or until the underlying reinsurance contracts are novated to Hannover Re or Hannover Re puts into place its own collateral for such reserve requirements. Hannover Re reimburses us for a portion of our fees for these credit facilities. We refer to this block as the Hannover Re block and its results are reported as part of the Closed Block Other segment.
Pursuant to the MPA, Hannover Re has the option to put into place its own collateral (“Buyers Facility”) therefore, effective October 1, 2013 on a 32% quota share basis, we recaptured a portion of the business from Hannover Re (Ireland) Limited (“HLRI”) and retroceded the recaptured business to Hannover Life Reassurance Company of America (“HLRUS”). As a result, our collateral requirement was reduced to $2.3 billion as of December 31, 2013.
We also utilize LOCs to provide credit for reinsurance on portions of the Closed Block Variable Annuity segment liabilities reinsured to our Arizona captive in order to meet statutory reserve requirements at those times when the assets and other capital backing the reinsurance liabilities may be less than the statutory reserve requirement. As of December 31, 2013, there was no LOC requirement and the actual amount of the LOCs outstanding was $1.2 billion.
In addition to the $5.8 billion of Individual Life, Hannover Re block and CBVA credit facilities utilized, $491.0 million of LOCs were outstanding to support miscellaneous requirements. In total, $6.3 billion of credit facilities were utilized as of December 31, 2013. As of December 31, 2013, the capacity of our unsecured and uncommitted credit facilities totaled $17.0 million and the capacity of our unsecured and committed credit facilities totaled $9.0 billion. We also have approximately $275.0 million in secured facilities.
Total fees associated with credit facilities for the years ended December 31, 2013, 2012 and 2011 were $149.3 million, $223.2 million and $103.4 million, respectively.
-124-
Table of Contents
The following table summarizes our credit facilities, their dates of expiration, capacity and utilization as of December 31, 2013:
| ($ in millions) | ||||||||||||||||||||||
| Obligor / Applicant |
Liability Supported |
Secured/ Unsecured |
Committed/ Uncommitted |
Expiration | Capacity | Utilization | Unused Commitment |
|||||||||||||||
| ING U.S., Inc.(1)(2) |
Unsecured | Committed | 4/20/2015 | $ | 3,500.0 | $ | 2,103.9 | $ | 1,396.1 | |||||||||||||
| Individual Life |
685.0 | |||||||||||||||||||||
| CBVA |
1,200.0 | |||||||||||||||||||||
| Retirement Solutions |
145.0 | |||||||||||||||||||||
| Other |
73.9 | |||||||||||||||||||||
| ING U.S., Inc. / SLDI, Roaring River LLC(1)(3) |
Individual Life | Unsecured | Uncommitted | 2/28/2013 | 15.0 | 15.0 | — | |||||||||||||||
| ING U.S., Inc. / SLDI |
Hannover Re block | Unsecured | Committed | 11/9/2021 | 750.0 | 750.0 | — | |||||||||||||||
|
SLDI(1) |
Hannover Re block | Unsecured | Committed | 10/29/2020 | 1,125.0 | 569.6 | 555.4 | |||||||||||||||
| ING U.S., Inc. / SLDI |
Hannover Re block | Unsecured | Committed | 12/27/2022 | 750.0 | 750.0 | — | |||||||||||||||
| ING U.S., Inc. / SLDI |
Hannover Re block | Unsecured | Committed | 12/29/2023 | 250.0 | 250.0 | — | |||||||||||||||
| ReliaStar Life Insurance Company |
Institutional Spread Products | Secured | Committed | Conditional | 265.0 | 265.0 | — | |||||||||||||||
| ING U.S., Inc. / SLDI |
Individual Life | Unsecured | Committed | 12/31/2025 | 475.0 | 475.0 | — | |||||||||||||||
| ING U.S., Inc. |
Other | Unsecured | Uncommitted | |
Various dates |
|
2.0 | 2.0 | — | |||||||||||||
| ING U.S., Inc. |
Other | Secured | Uncommitted | |
Various dates |
|
10.0 | 4.7 | — | |||||||||||||
| ING U.S., Inc. / Roaring River III LLC |
Individual Life | Unsecured | Committed | 6/30/2022 | 1,151.2 | 581.0 | 570.2 | |||||||||||||||
| ING U.S., Inc. / Roaring River II LLC |
Individual Life | Unsecured | Committed | 12/31/2021 | 995.0 | 573.0 | 422.0 | |||||||||||||||
|
|
|
|
|
|
|
|||||||||||||||||
| Total |
$ | 9,288.2 | $ | 6,339.2 | $ | 2,943.7 | ||||||||||||||||
|
|
|
|
|
|
|
|||||||||||||||||
| (1) | Refer to “Note 18. Related Party Transactions” for more information. |
| (2) | On February 14, 2014, the term of the facility was extended to February 14, 2018 and the total amount of LOCs that may be issued was reduced from $3.5 billion to $3.0 billion. |
| (3) | Facilities matured as of the date stated above. Each LOC issued prior to the facility expiring remains outstanding until its stated expiry date. On January 14, 2014, the letter of credit was cancelled and the corresponding guarantee obligation of ING V was extinguished. |
Effective October 30, 2013, SLDI completed a $1.125 billion letter of credit facility which replaced the $825.0 million letter of credit facility maturing December 31, 2013 and the $300.0 million letter of credit facility which matured June 30, 2013. The new facility provides $1.125 billion of capacity on a committed basis until October 29, 2020 and supports the Individual Reinsurance business.
Effective December 31, 2013, SLDI and ING U.S., Inc. completed a $250.0 million letter of credit facility with a third-party bank which matures December 29, 2023 and also supports the Individual Reinsurance business.
Effective January 1, 2014, the reinsurance agreements with Whisperingwind III were novated to Roaring River IV, LLC (“Roaring River IV”), a wholly owned reinsurance subsidiary of the Company, which completed a transaction with a third-party bank to provide up to $565.0 million of AG38 reserve financing through a trust note which matures December 31, 2028. The initial amount of the trust note issued on January 1, 2014 is $297.0 million. The trust note replaces $330.0 million of letters of credit associated with the Whisperingwind III reinsurance agreements which were cancelled in January 2014.
-125-
Table of Contents
Effective January 15, 2014, Langhorne I, a wholly owned reinsurance subsidiary of the Company, completed a financing arrangement with a third-party trust to provide up to $500.0 million of trust note collateral funding. The financing arrangement is designed to manage reserve and capital requirements in connection with the stable value business and matures on January 15, 2019. No trust notes were being utilized as of financing arrangement inception.
Effective January 24, 2014, SLDI entered into a letter of credit facility agreement with a third-party bank providing up to $150.0 million of committed capacity until January 24, 2018 which supports reserves on an affiliated reinsurance agreement in connection with a portion of its deferred annuity business.
The following tables summarize our existing financing facilities for each of our Individual Life, Hannover Re and CBVA blocks of business as of December 31, 2013. While these tables present the current financing for each block, these financing facilities will expire prior to the runoff of the reserve liabilities they support. In addition, these liabilities will change over the life of each block. As a result, the existing financing will be periodically extended or replaced and increased as each block grows toward the peak reserve requirement noted below.
Individual Life
| ($ in millions) | ||||||||||||||||||||
| Obligor / Applicant |
Financing Structure |
Reserve Type |
Expiration | Capacity | Utilization | |||||||||||||||
| ING U.S., Inc. |
Credit Facility | XXX | 04/20/15 | $ | 685.0 | $ | 685.0 | |||||||||||||
| ING U.S., Inc. (1)(2) |
Credit Facility | Other | 02/28/13 | 15.0 | 15.0 | |||||||||||||||
| ING U.S., Inc./Roaring River III LLC |
Trust Note | XXX | 06/30/22 | 1,151.2 | 581.0 | |||||||||||||||
| ING U.S., Inc. / SLDI |
LOC Facility | AG38 | 12/31/25 | 475.0 | 475.0 | |||||||||||||||
| ING U.S., Inc. / Roaring River II LLC |
LOC Facility | XXX | 12/31/21 | 995.0 | 573.0 | |||||||||||||||
|
|
|
|
|
|||||||||||||||||
| Total |
$ | 3,321.2 | $ | 2,329.0 | ||||||||||||||||
|
|
|
|
|
|||||||||||||||||
| (1) | LOC issued prior to the facility expiring remains outstanding until its stated expiry date of June 30, 2026. |
| (2) | On January 14, 2014, the LOC was cancelled and the corresponding guarantee obligation of ING V was extinguished. |
The peak financing requirement for the Individual Life liabilities above is expected to reach approximately $3.3 billion during the period 2017—2020.
Hannover Re block
| ($ in millions) | ||||||||||||||||||||
| Obligor / Applicant |
Financing Structure |
Reserve Type |
Expiration | Capacity | Utilization | |||||||||||||||
| ING U.S., Inc. / SLDI |
|
Collateral Note |
|
|
XXX/ AG38 |
|
11/09/2021 | $ | 750.0 | $ | 750.0 | |||||||||
| ING U.S., Inc. / SLDI |
|
Collateral Note |
|
|
XXX/ AG38 |
|
12/27/2022 | 750.0 | 750.0 | |||||||||||
| SLDI |
|
LOC Facility |
|
|
XXX/ AG38 |
|
10/29/2020 | 1,125.0 | 569.0 | |||||||||||
| ING U.S., Inc. / SLDI |
|
LOC Facility |
|
|
XXX/ AG38 |
|
12/29/2023 | 250.0 | 250.0 | |||||||||||
|
|
|
|
|
|||||||||||||||||
| Total |
$ | 2,875.0 | $ | 2,319.0 | ||||||||||||||||
|
|
|
|
|
|||||||||||||||||
The peak financing requirement for the Hannover Re block is expected to reach approximately $2.6 billion in 2016.
-126-
Table of Contents
Closed Block Variable Annuity
| ($ in millions) | ||||||||||||||
| Obligor / Applicant |
Financing Structure |
Product | Expiration | Capacity | Utilization | |||||||||
| ING U.S., Inc. / SLDI | Credit Facility | GMWBL/GMIB | 04/20/2015 | $1,200.0 | $1,200.0 | |||||||||
|
|
|
|
|
|||||||||||
| Total |
$ | 1,200.0 | $ | 1,200.0 | ||||||||||
|
|
|
|
|
|||||||||||
Contingent Capital Letter of Credit
SLDI was the sole obligor under a $1.5 billion contingent capital LOC facility with ING Bank, under which $1.5 billion of LOCs were issued to support SLDI’s reinsurance obligations to ING USA for certain minimum guarantees included in its CBVA products. The agreement had no recourse to ING U.S., Inc.
On May 8, 2013, ING U.S., Inc. made a capital contribution to SLDI in the amount of $1.8 billion. Immediately thereafter, SLDI deposited the contributed capital as cash collateral into a funds withheld trust account to support its reinsurance obligation to ING USA related to variable annuity cessions from ING USA to SLDI. Following the deposit by SLDI of the contributed capital into the funds withheld trust account, the $1.5 billion contingent capital LOCs issued under the contingent capital LOC facility were cancelled and on May 14, 2013, the $1.5 billion contingent capital LOC facility was terminated.
Reinsurance Subsidiaries—ING U.S., Inc. Credit Support
As of December 31, 2013, ING U.S., Inc. supported the reinsurance obligations of its reinsurance subsidiaries with $15.0 million in LOCs issued by ING Bank of which $15.0 million was guaranteed by ING V. No fees are paid by the Company to ING V with respect to this guarantee. Subsequently on January 14, 2014, the letter of credit was cancelled and the corresponding guarantee obligation of ING V was extinguished.
ING U.S., Inc. also maintains credit facilities with third-party banks to support the reinsurance obligations of our captive reinsurance subsidiaries. As of December 31, 2013, such facilities provided for up to $2.1 billion of capacity, of which $1.2 billion was utilized.
In addition to providing credit facilities, we also provide credit support to our captive reinsurance subsidiaries through surplus maintenance agreements, pursuant to which we agree to cause these subsidiaries to maintain particular levels of capital or surplus and which we entered into in connection with particular reinsurance transactions. These agreements are effective for the duration of the in-force policies subject to the related reinsurance transactions and the maximum potential obligations are not specified or applicable. Since these obligations are not subject to limitations, it is not possible to determine the maximum potential amount due under these agreements.
In connection with certain reinsurance transactions involving a third-party trust (the “Master Trust”), ING U.S., Inc. and SLDI are parties to reimbursement agreements with third-party banks that lend securities to the Master Trust. SLDI has reimbursement obligations to the banks under these agreements, in an aggregate amount of up to $1.5 billion as of December 31, 2013, which obligations are guaranteed by ING U.S., Inc. ING U.S., Inc. also provides an indemnification to the third-party banks with respect to any defaults by the Master Trust under the securities lending agreements under which these banks lend securities to the Master Trust, up to $1.5 billion. These agreements and the related indemnification were entered into to facilitate collateral requirements supporting reinsurance and are effective for the duration that the collateral remains outstanding.
ING U.S., Inc. provided a separate indemnification to ING Bank with respect to any defaults by the Master Trust under a similar securities lending agreement between the Master Trust and ING Bank, up to $825.0 million. This agreement and the related indemnification were entered into to facilitate collateral requirements supporting
-127-
Table of Contents
reinsurance agreements and are effective for the duration that the collateral remains outstanding. This agreement was to expire on December 31, 2013. Effective October 30, 2013, SLDI completed a $1.125 billion letter of credit facility which replaced this facility. The new facility does not involve an ING U.S., Inc. guarantee.
ING U.S., Inc. has also entered into a corporate guarantee agreement with a third-party ceding insurer where it guarantees the reinsurance obligations of our subsidiary, SLD, assumed under a reinsurance agreement with the third-party cedent. SLD retrocedes the business to Hannover Life Reassurance Company of America (“Hannover US”) who is the claim paying party. The current amount of reserves outstanding as of December 31, 2013 is $25.0 million. The maximum potential obligation is not specified or applicable. Since these obligations are not subject to limitations, it is not possible to determine the maximum potential amount due under these guarantees.
On September 6, 2012, ING U.S., Inc. as borrowing party and its subsidiary, Roaring River III, LLC (“Roaring River III”), as borrower, entered into a reimbursement agreement with a third-party bank providing for $390.0 million of initial funding in the form of a putable variable funding trust note due 2022 where ING U.S., Inc. guarantees the reimbursement obligations of Roaring River III. Roaring River III has entered into a reinsurance agreement with an affiliated ceding company and by entering into the reimbursement agreement, Roaring River III provides collateral for reinsurance in the form of the trust note. To support additional growth in reserves on the policies reinsured, the trust note notional amount may be increased to approximately $1.2 billion prior to maturity. As of December 31, 2013 the amount of the trust note was $581.0 million.
Reinsurance Subsidiaries—Other Credit Support
RLI and SLD, indirect and direct subsidiaries of ING U.S., Inc., respectively, guarantee a reinsurance contract entered into by SLDI with respect to SLDI’s reinsurance of $250.0 million of the principal and interest of a bond insured by an unrelated insurance company. The bond payments are supported by the insurer’s closed block. Surplus from the closed block, in the form of dividends, is used to pay the bond principal and interest.
In order to collateralize obligations under this treaty, RLI provided a LOC of $265.0 million issued by the FHLB of Des Moines to the unrelated insurer which is secured by assets pledged by RLI to FHLB. As of December 31, 2013 and 2012, the LOC is collateralized by assets with a market value of approximately $294.1 million and $336.5 million, respectively.
Other Subsidiaries—ING U.S., Inc. Credit Support
ING U.S., Inc. guarantees the obligations of Lion Holdings under the $13.0 million par amount ING USA Notes maturing in 2027 as well as $506.1 million combined par amount of Aetna Notes. For more information see “Debt Securities” above. From time to time, ING U.S., Inc. may also have outstanding guarantees of various obligations of its subsidiaries.
We did not recognize any asset or liability as of December 31, 2013 in relation to intercompany indemnifications and support agreements. As of December 31, 2013, no circumstances existed in which we were required to currently perform under these indemnifications and support agreements.
ING Group Credit Support
As described above, certain of our indebtedness benefits from a guarantee provided by ING Group or NN Group (as successor to ING V). As of December 31, 2013, the indebtedness for which ING Group or NN Group provide guarantees included:
| • | $15.0 million in LOC issued by ING Bank and used to support the reinsurance obligations of certain of our captive reinsurance subsidiaries; |
| • | $506.1 million aggregate par amount of Aetna Notes issued by Lion Holdings. |
On January 14, 2014, the $15.0 million LOC was cancelled and the corresponding guarantee obligation of ING V was extinguished.
-128-
Table of Contents
Securities Lending
We engage in securities lending for cash or cash equivalents, on a direct basis, or through an agent, whereby certain securities from our portfolio are loaned to other institutions for short periods of time. Initial collateral, primarily cash, is required at a rate of 102% of the market value of the loaned securities. For certain transactions, a lending agent may be used and the agent may retain some or all of the collateral deposited by the borrower and transfer the remaining collateral to us. Collateral retained by the agent is invested in liquid assets on our behalf. The market value of the loaned securities is monitored on a daily basis with additional collateral obtained or refunded as the market value of the loaned securities fluctuates. As of December 31, 2013 and 2012, the fair value of loaned securities was $435.4 million and $601.8 million, respectively, and is included in Securities pledged on the Consolidated Balance Sheets. As of December 31, 2013 and 2012, collateral retained by the lending agent and invested in liquid assets on our behalf was $451.0 million and $619.5 million, respectively, and is recorded in Short-term investments under securities loan agreement, including collateral delivered on the Consolidated Balance Sheets. Cash collateral received by us is included in Cash and cash equivalents or Invested assets to the extent it is reinvested. As of December 31, 2013 and 2012, liabilities to return collateral of $451.0 million and $619.5 million, respectively, are included in Payables under securities loan agreement, including collateral held on the Consolidated Balance Sheets.
Repurchase Agreements
We engage in dollar repurchase agreements with mortgage-backed securities (“dollar rolls”) and repurchase agreements with other collateral types to increase our return on investments and improve liquidity. Such arrangements meet the requirements to be accounted for as financing arrangements. We enter into dollar roll transactions by selling existing MBS and concurrently entering into an agreement to repurchase similar securities within a short time frame at a lower price. Under repurchase agreements, we borrow cash from a counterparty at an agreed upon interest rate for an agreed upon time frame and pledge collateral in the form of securities. At the end of the agreement, the counterparty returns the collateral to us, and we, in turn, repay the loan amount along with the additional agreed upon interest. We require that at all times during the term of the dollar roll and repurchase agreements that cash or other collateral types obtained is sufficient to allow us to fund substantially all of the cost of purchasing replacement assets. Cash received is invested in short-term investments, with the offsetting obligation to repay the loan included as a liability on the Consolidated Balance Sheets. As per the terms of the agreements, the market value of the loaned securities is monitored with additional collateral obtained or refunded as the market value of the loaned securities fluctuates due to changes in interest rates, spreads and other risk factors.
The carrying value of the securities pledged in dollar rolls and repurchase agreement transactions and the related repurchase obligation are included in Securities pledged and Short-term debt, respectively, on the Consolidated Balance Sheets. As of December 31, 2013 and 2012, we did not have any securities pledged in dollar rolls and repurchase agreement transactions.
We also enter into reverse repurchase agreements. These transactions involve a purchase of securities and an agreement to sell substantially the same securities as those purchased. We require that, at all times during the term of the reverse repurchase agreements, cash or other collateral types provided is sufficient to allow the counterparty to fund substantially all of the cost of purchasing the replacement assets. As of December 31, 2013 and 2012, we did not have any securities pledged under reverse repurchase agreements.
The primary risk associated with short-term collateralized borrowings is that the counterparty will be unable to perform under the terms of the contract. Our exposure is limited to the excess of the net replacement cost of the securities over the value of the short-term investments. We believe the counterparties to the dollar rolls, repurchase and reverse repurchase agreements are financially responsible and that the counterparty risk is minimal.
FHLB
We are currently a member of the FHLB of Des Moines and the FHLB of Topeka and are required to maintain a collateral deposit to back any advances, funding agreements issued or LOCs issued by the FHLB. We
-129-
Table of Contents
have the ability to obtain funding from the FHLBs based on a percentage of the value of our assets and are subject to the availability of eligible collateral. The limits across all programs are 15% of the general and separate accounts of ING USA, potentially up to 40% of the general account of SLD based on credit approval from FHLB of Topeka and 20% of the general and separate accounts of RLI. Furthermore, collateral is pledged based on the outstanding balances of FHLB advances, funding agreements and LOCs. The amount varies based on the type, rating and maturity of the collateral posted to the FHLB. Generally, mortgage securities are pledged to the FHLBs. Market value fluctuations resulting from changes in interest rates, spreads and other risk factors for each type of assets are monitored and additional collateral is either pledged or released as needed.
Our borrowing capacity under these credit facilities does not have an expiration date as long as we maintain a satisfactory level of creditworthiness based on the FHLBs’ credit assessment. At December 31, 2013 and 2012, we had $1.8 billion and $2.6 billion in non-putable funding agreements, respectively, which are included in Contract owner account balances on the Consolidated Balance Sheets. At December 31, 2013 and 2012, we had $265.0 million, respectively, of LOCs issued by the FHLB. At December 31, 2013 and 2012, we had assets with a market value of approximately $2.0 billion and $3.1 billion, respectively, which collateralized the FHLB funding agreements. At December 31, 2013 and 2012, we had assets with a market value of approximately $294.1 million and $336.5 million, respectively, which collateralized the FHLB LOCs. Assets pledged to the FHLB are included in Fixed maturities, available-for-sale, on the Consolidated Balance Sheets. See “Liquidity and Capital Resources-Description of Certain Indebtedness” above for further discussion.
Borrowings from Parent
For information related to these arrangements, see “Certain Relationships and Related Party Transactions” and “Note 18. Related Party Transactions.”
Borrowings from Subsidiaries
We maintain revolving reciprocal loan agreements with a number of our life and non-life insurance subsidiaries that are used to fund short-term cash requirements that arise in the ordinary course of business. Under these agreements, either party may borrow up to the maximum allowable under the agreement for a term not more than 270 days. For life insurance subsidiaries, the amounts that either party may borrow from the other under the agreement vary and are equal to 2%-5% of the insurance subsidiary’s statutory net admitted assets (excluding separate accounts) as of the previous year end depending on the state of domicile. As of December 31, 2013, the aggregate amount that may be borrowed or lent under agreements with life insurance subsidiaries was $2.5 billion. Each agreement with a life insurance subsidiary has received all necessary approvals from the appropriate state insurance regulatory authorities. For non-life insurance subsidiaries, the maximum allowable under the agreement is based on the assets of the subsidiaries and their particular cash requirements. As of December 31, 2013, no amounts were borrowed from subsidiaries. As of that same date, we lent $211.3 million to subsidiaries.
Collateral—Derivative Contracts
Under the terms of our OTC Derivative ISDA agreements, we may receive from, or deliver to, counterparties collateral to assure that all terms of the ISDA agreements will be met with regard to the Credit Support Annex (“CSA”). The terms of the CSA call for us to pay interest on any cash received equal to the Federal Funds rate. To the extent cash collateral is received and delivered, it is included in Payables under securities loan agreements, including collateral held and Short-term investments under securities loan agreements, including collateral delivered, respectively, on the Consolidated Balance Sheets and is reinvested in short-term investments. Collateral held is used in accordance with the CSA to satisfy any obligations. Investment grade bonds owned by us are the source of noncash collateral posted, which is reported in Securities pledged on the Consolidated Balance Sheets. As of December 31, 2013, we held $214.7 million and $18.8 million of net cash collateral related to OTC derivative contracts and cleared derivative contracts, respectively. As of
-130-
Table of Contents
December 31, 2012, we held $890.3 million of net cash collateral related to OTC derivative contracts. In addition, as of December 31, 2013 and December 31, 2012, we delivered securities as collateral of $1.0 billion.
Ratings
Our access to funding and our related cost of borrowing, requirements for derivatives collateral posting and the attractiveness of certain of our products to customers are affected by our credit ratings and insurance financial strength ratings, which are periodically reviewed by the rating agencies. Financial strength ratings and credit ratings are important factors affecting public confidence in an insurer and its competitive position in marketing products. The credit ratings are also important for the ability to raise capital through the issuance of debt and for the cost of such financing.
A downgrade in our credit ratings or the credit or financial strength ratings of our rated subsidiaries could potentially, among other things, limit our ability to market products, reduce our competitiveness, increase the number or value of policy surrenders and withdrawals, increase our borrowing costs and potentially make it more difficult to borrow funds, adversely affect the availability of financial guarantees or LOCs, cause additional collateral requirements or other required payments under certain agreements, allow counterparties to terminate derivative agreements and/or hurt our relationships with creditors, distributors or trading counterparties thereby potentially negatively affecting our profitability, liquidity and/or capital. In addition, we consider nonperformance risk in determining the fair value of our liabilities. Therefore, changes in our credit or financial strength ratings may affect the fair value of our liabilities.
Additionally, ratings of certain of our securities guaranteed by ING Group could be influenced by ING Group’s ratings. A downgrade of the credit ratings of ING Group could result in downgrades of these securities.
Financial strength ratings represent the opinions of rating agencies regarding the financial ability of an insurance company to meet its obligations under an insurance policy. Credit ratings represent the opinions of rating agencies regarding an entity’s ability to repay its indebtedness. These ratings are not a recommendation to buy or hold any of our securities and they may be revised or revoked at any time at the sole discretion of the rating organization.
-131-
Table of Contents
The financial strength and credit ratings of ING U.S., Inc. and its principal subsidiaries as of the date of this prospectus are summarized in the following table. In parentheses, following the initial occurrence in the table of each rating, is an indication of that rating’s relative rank within the agency’s rating categories. That ranking refers only to the generic or major rating category and not to the modifiers appended to the rating by the rating agencies to denote relative position within such generic or major category. For each rating, the relative position of the rating within the relevant rating agency’s ratings scale is presented, with “1” representing the highest rating in the scale.
| Company |
A.M. Best |
Fitch, Inc. |
Moody’s Investors |
Standard & Poor’s | ||||
| ING U.S., Inc. (Long-term Issuer Credit) | bbb (4 of 10) | BBB (4 of 11) | Baa3 (LT Issuer Domestic) (4 of 9) Baa2 (Senior Unsecured Foreign) (4 of 9) |
BBB-(4 of 11) | ||||
| ING U.S., Inc. (Senior Unsecured Debt)(1) |
bbb (4 of 10) | BBB-(4 of 9) | Baa3 (4 of 9) | BBB- (4 of 9) | ||||
| ING U.S., Inc. (Junior Subordinated Debt)(2) |
bb+ (5 of 10) | BB (5 of 9) | Ba1(hyb) (5 of 9) | BB (5 of 9) | ||||
| ING Life Insurance and Annuity Company |
||||||||
| Financial Strength Rating |
A (3 of 16) | A- (3 of 9) | A3 (3 of 9) | A- (3 of 9) | ||||
| ING USA Annuity & Life Insurance |
||||||||
| Financial Strength Rating |
A (3 of 16) | A- (3 of 9) | A3 (3 of 9) | A- (3 of 9) | ||||
| Short-term Issuer Credit Rating |
NR | NR | P-2 (2 of 4) | A-2 (2 of 8) | ||||
| ReliaStar Life Insurance Company |
||||||||
| Financial Strength Rating |
A (3 of 16) | A- (3 of 9) | A3 (3 of 9) | A- (3 of 9) | ||||
| Short-term Issuer Credit Rating |
NR | NR | NR | A-2 (2 of 8) | ||||
| Security Life of Denver Insurance Company |
||||||||
| Financial Strength Rating |
A (3 of 16) | A- (3 of 9) | A3 (3 of 9) | A- (3 of 9) | ||||
| Short-term Issuer Credit Rating |
NR | NR | P-2 (2 of 4) | A-2 (2 of 8) | ||||
| Midwestern United Life Insurance Company |
||||||||
| Financial Strength Rating |
A- (4 of 16) | NR | NR | A- (3 of 9) | ||||
| Lion Connecticut Holdings Inc. |
||||||||
| Long-term Issuer Credit Rating |
NR | NR | Baa3 (LT Issuer) (4 of 9) | BBB- (4 of 11) |
| (1) | $850.0 million of our 2022 Notes, $1.0 billion of our 2018 Notes and $400.0 million of our 2043 Notes. |
| (2) | $750.0 million of our 2053 Notes. |
| Rating Agency |
Financial Strength |
Long-term Credit Rating Scale |
Senior Unsecured Debt Credit Rating Scale |
Short-term Credit Rating Scale |
||||||||||
| A.M. Best(1) |
“A++” to “S” | “aaa” to “rs” | “aaa” to “d” | “AMB-1+” to “d” | ||||||||||
|
Fitch(2) |
“AAA” to “C” | “AAA” to “D” | “AAA” to “C” | “F1” to “D” | ||||||||||
| Moody’s(3) |
“Aaa” to “C” | “Aaa” to “C” | “Aaa” to “C” | |
“Prime-1” to “Not Prime” |
| ||||||||
| S&P(4) |
“AAA” to “R” | “AAA” to “D” | “AAA” to “D” | “A-1” to “D” | ||||||||||
| (1) | A.M. Best’s financial strength rating is an independent opinion of an insurer’s financial strength and ability to meet its ongoing insurance policy and contract obligations. It is based on a comprehensive quantitative and qualitative evaluation of a company’s balance sheet strength, operating performance and business profile. A.M. Best’s long-term credit ratings reflect its assessment of the ability of an obligor to pay interest |
-132-
Table of Contents
| and principal in accordance with the terms of the obligation. Ratings from “aa” to “ccc” may be enhanced with a “+” (plus) or “–” (minus) to indicate whether credit quality is near the top or bottom of a category. A.M. Best’s short-term credit rating is an opinion to the ability of the rated entity to meet its senior financial commitments on obligations maturing in generally less than one year. |
| (2) | Fitch’s financial strength ratings provide an assessment of the financial strength of an insurance organization. The IFS Rating is assigned to the insurance company’s policyholder obligations, including assumed reinsurance obligations and contract holder obligations, such as guaranteed investment contracts. Within long-term and short-term ratings, a “+” or a “–” may be appended to a rating to denote relative status within major rating categories. |
| (3) | Moody’s financial strength ratings are opinions of the ability of insurance companies to repay punctually senior policyholder claims and obligations. Moody’s appends numerical modifiers 1, 2, and 3 to each generic rating classification from Aa through Caa. The modifier 1 indicates that the obligation ranks in the higher end of its generic rating category; the modifier 2 indicates a mid-range ranking; and the modifier 3 indicates a ranking in the lower end of that generic rating category. Moody’s long-term credit ratings are opinions of the relative credit risk of fixed-income obligations with an original maturity of one year or more. They address the possibility that a financial obligation will not be honored as promised. Moody’s short-term ratings are opinions of the ability of issuers to honor short-term financial obligations. |
| (4) | S&P’s insurer financial strength rating is a forward-looking opinion about the financial security characteristics of an insurance organization with respect to its ability to pay under its insurance policies and contracts in accordance with their terms. A “+” or “–” indicates relative strength within a category. An S&P credit rating is an assessment of default risk, but may incorporate an assessment of relative seniority or ultimate recovery in the event of default. Short-term issuer credit ratings reflect the obligor’s creditworthiness over a short-term time horizon. |
Our ratings by A.M. Best, Fitch, Moody’s and S&P reflect a broader view of how the financial services industry is being challenged by the current economic environment, but also are based on the rating agencies’ specific views of our financial strength. In making their ratings decisions, the agencies consider past and expected future capital and earnings, asset quality and risk, profitability and risk of existing liabilities and current products, market share and product distribution capabilities and direct or implied support from parent companies, including implications of the 2009 Restructuring Plan and the 2012 Amended Restructuring Plan, among other factors.
Rating agencies use an “outlook” statement for both industry sectors and individual companies. For an industry sector, a stable outlook generally implies that over the next 12 to 18 months the rating agency expects ratings to remain unchanged among companies in the sector. For a particular company, an outlook generally indicates a medium- or long-term trend in credit fundamentals, which if continued, may lead to a rating change.
Ratings actions affirmation and outlook changes by A.M. Best, Fitch, Moody’s and S&P from December 31, 2012 through December 31, 2013 and subsequently through the date of this prospectus are as follows:
| • | On March 14, 2014, S&P affirmed the ratings of ING U.S., Inc. and its subsidiaries and revised the rating outlook to Positive from Stable. |
| • | On March 6, 2014, Fitch affirmed the ratings of ING U.S., Inc. and its subsidiaries and revised the rating outlook to Positive from Stable. |
| • | On October 17, 2013, Moody’s withdrew the Prime-2 program rating for commercial paper issuances of ING U.S., Inc. ING U.S., Inc. formally terminated its commercial paper program effective October 3, 2013. |
| • | On October 16, 2013, Fitch Ratings withdrew the F2 Short-term rating for commercial paper issuances of ING U.S., Inc. ING U.S., Inc. formally terminated its commercial paper program effective October 3, 2013. |
| • | On July 26, 2013, ING U.S., Inc. issued $400.0 million of 2043 Notes which were assigned a BBB- rating from S&P, a bbb rating from A.M. Best, a Baa3 rating from Moody’s and a BBB- rating from Fitch. All ratings were assigned with a Stable outlook. |
-133-
Table of Contents
| • | On July 8, 2013, Fitch affirmed the ratings of ING U.S., Inc. and its subsidiaries. |
| • | On June 14, 2013, A.M. Best affirmed the ratings of ING U.S., Inc. and its subsidiaries. |
| • | On May 16, 2013, ING U.S., Inc. issued $750.0 million of 2053 Notes which were assigned a BB junior subordinated rating from S&P, a bb+ rating from A.M. Best, a Ba1(hyb) rating from Moody’s and a BB rating from Fitch. All ratings were assigned with a stable outlook. |
| • | On May 14, 2013, Moody’s affirmed the ratings of ING U.S., Inc. and its subsidiaries. |
| • | On May 14, 2013, S&P affirmed the ratings of ING U.S., Inc. and its subsidiaries under its revised insurance criteria. |
| • | On May 6, 2013, following our announcement that we completed our recent IPO, Moody’s commented that the completion of the IPO is credit positive for ING U.S., Inc. |
| • | On May 2, 2013, S&P stated that ING U.S., Inc.’s announcement that it priced its IPO will not affect the ratings or outlook on ING U.S., Inc. or any of its rated insurance subsidiaries. |
| • | On February 7, 2013, Fitch assigned a BBB- rating to our $1.0 billion 2018 Notes. On January 7, 2013, Fitch affirmed the BBB issuer default rating and the BBB- senior debt rating of ING U.S., Inc. as well as the A- insurer financial strength rating of its operating subsidiaries. Furthermore, Fitch removed all ratings from Ratings Watch Evolving and assigned a Stable outlook to the ratings. |
| • | On February 7, 2013, A.M. Best assigned a “bbb” debt rating to our $1.0 billion 2018 Notes with a Stable outlook. |
| • | On February 7, 2013 Moody’s assigned a Baa3 senior debt rating to our $1.0 billion 2018 Notes with a Stable outlook. |
| • | On February 6, 2013, S&P assigned a BBB- senior unsecured debt rating to our $1.0 billion 2018 Notes. |
Potential Impact of a Ratings Downgrade
Our ability to borrow funds and the terms under which we borrow are sensitive to our short- and long-term issuer credit ratings. A downgrade of either or both of these credit ratings could increase our cost of borrowing. Additionally, a downgrade of either or both of these credit ratings could decrease the total amount of new debt that we are able to issue in the future or increase the costs associated with an issuance.
Certain of our credit facility agreements contain provisions that are linked to the credit or financial strength ratings of certain legal entities, including NN Group (as successor to our former indirect parent ING V). If financial strength ratings were downgraded in the future, these provisions might be triggered and counterparties to the credit facility agreements could demand collateralization which could negatively impact overall liquidity.
Based on the amount of credit outstanding as of December 31, 2013, a one-notch downgrade of the credit ratings of ING U.S., Inc. by S&P or Moody’s would not have resulted in an additional increase in our collateral requirements. Based on the amount of credit outstanding as of December 31, 2012, a one-notch downgrade of the credit ratings of ING U.S., Inc. by S&P or Moody’s would have resulted in an estimated increase in our collateral requirements by approximately $1.2 billion. A two notch downgrade of the credit ratings of ING U.S., Inc. would not have resulted in an additional increase in our collateral requirements beyond that resulting from a one notch downgrade. The nature of the collateral that we may be required to post is principally in the form of cash and U.S. Treasury securities. Alternative forms of collateral, such as LOC, may also be used.
Based on the amount of credit outstanding as of December 31, 2013 and 2012, a one notch downgrade of the credit ratings of NN Group would not result in an increase in our estimated collateral requirements. A two-notch downgrade of the credit ratings of NN Group by S&P would have resulted in an estimated increase in our collateral requirements by approximately $15.0 million and $30.1 million, respectively. On January 14, 2014, the letter of credit was cancelled and the corresponding guarantee obligation of ING V was extinguished. As a result, as of January 14, 2014, we have no collateral requirements due to a two-notch downgrade of the credit ratings of NN Group by S&P.
-134-
Table of Contents
Certain of our reinsurance agreements contain provisions that are linked to the financial strength ratings of the individual legal entity that entered into the reinsurance agreement. If the insurance subsidiaries’ financial strength ratings were downgraded in the future, the terms in our reinsurance agreements might be triggered and counterparties to the credit facility agreements could demand collateralization which could negatively impact overall liquidity. Based on the amount of credit outstanding as of December 31, 2013 and 2012, a one-notch downgrade of our insurance subsidiaries would have resulted in an estimated increase in our collateral requirements by approximately $25.0 million and $24.6 million, respectively. The nature of the collateral that we may be required to post is principally in the form of cash, highly rated securities or LOC.
Certain of our derivative agreements contain provisions that are linked to the financial strength ratings of the individual legal entity that entered into the derivative agreement. If insurance subsidiaries’ financial strength ratings were downgraded in the future, the terms in our derivative agreements might be triggered and counterparties to the derivative agreements could demand immediate further collateralization which could negatively impact overall liquidity. Based on the market value of our derivatives as of December 31, 2013 and 2012, a one-notch downgrade of our insurance subsidiaries would have resulted in an estimated increase in our derivative collateral requirements by approximately $111.0 million and $125.0 million, respectively. The nature of the collateral that we may be required to post is principally in the form of cash and U.S. Treasury securities.
Based on the market value of our derivatives as of December 31, 2013 and 2012, a two-notch downgrade of our insurance subsidiaries would have resulted in an estimated increase in the derivative collateral requirements required by a one-notch downgrade by an additional $1.3 million and $2.5 million, respectively.
The amount of collateral that would be required to be posted is also dependent on the fair value of our derivative positions. For additional information on our derivative positions, see “Note 3. Derivative Financial Instruments.”
Reinsurance
We have reinsurance treaties covering a portion of the mortality risks and guaranteed death and living benefits under our life insurance and annuity contracts. We remain liable to the extent our reinsurers do not meet their obligations under the reinsurance agreements.
We reinsure our business through a diversified group of well capitalized, highly rated reinsurers. We monitor trends in arbitration and any litigation outcomes with our reinsurers. Collectability of reinsurance balances are evaluated by monitoring ratings and evaluating the financial strength of its reinsurers. Large reinsurance recoverable balances with offshore or other non-accredited reinsurers are secured through various forms of collateral, including secured trusts, funds withheld accounts and irrevocable LOCs.
We utilize indemnity reinsurance agreements to reduce our exposure to losses from unhedged GMDBs in our annuity insurance business. Reinsurance permits recovery of a portion of losses from reinsurers, although it does not discharge our primary liability as direct insurer of the risks. We evaluate the financial strength of potential reinsurers and continually monitor the financial strength and credit ratings of our reinsurers.
The S&P financial strength rating of our reinsurers with the two largest reinsurance recoverable balances are all AA- rated or better. These reinsurers are Lincoln National Life Insurance Company, Lincoln Life & Annuity Company of New York and Hannover US and Hannover Re (Ireland) Plc (collectively, “Hannover Re”). Only those reinsurance recoverable balances where recovery is deemed probable are recognized as assets on our consolidated balance sheets.
We have a significant concentration of reinsurance arising from the divestment of a block of individual life business via a reinsurance transaction prior to our acquisition of ILIAC (formerly Aetna Life Insurance and Annuity Company) in 2000. In 1998, we entered into an indemnity reinsurance agreement with a subsidiary of
-135-
Table of Contents
Lincoln National Corporation (“Lincoln”). The Lincoln subsidiary established a trust to secure its obligations to us under the reinsurance transaction. Of the reinsurance recoverable on the Consolidated Balance Sheets, $2.0 billion and $2.1 billion at December 31, 2013 and 2012, respectively, is related to the reinsurance recoverable from the subsidiary of Lincoln under this reinsurance agreement.
On December 31, 2004, we reinsured the individual life reinsurance business (and sold certain systems and operating assets used in the individual life reinsurance business) to Scottish Re on a 100% coinsurance basis (the “2004 Transaction”) through our wholly owned subsidiaries, SLD and SLDI. As part of the 2004 Transaction, we paid a ceding commission and transferred assets backing reserves and miscellaneous other liabilities on the individual life reinsurance to Scottish Re. The ceding commission (net of taxes), along with other reserve assets, was placed in trust for our benefit to secure Scottish Re’s obligations as reinsurers of the acquired business.
On November 19, 2008, an existing reinsurance agreement between SRUS and Ballantyne Re, concerning a portion of the business that was originally ceded to Scottish Re as part of the 2004 Transaction, was novated with the result that we were substituted for SRUS as the ceding company to Ballantyne Re and made the sole beneficiary of trust assets connected with the Ballantyne Re facility. The trust assets support the reserve requirements of the business transferred from SLD to Ballantyne Re. As of December 31, 2013, trust assets supporting reserves of $266.2 million had a market value of $911.9 million.
Effective January 1, 2009, we entered into the MPA with Scottish Re and Hannover Re such that Hannover Re acquired the individual life reinsurance business from Scottish Re. Effective October 1, 2013, on a 32% quota share basis, we recaptured a portion of the business from HLRI and retroceded the recaptured business to HLRUS. See “—Liquidity and Capital Resources-Credit Facilities and Subsidiary Credit Support Arrangements” above for further discussion. Of the Reinsurance recoverable on the Consolidated Balance Sheets, $2.4 billion and $2.7 billion as of December 31, 2013 and 2012, respectively, is related to the reinsurance recoverable from Hannover Re under this reinsurance agreement.
Statutory Capital and Risk-Based Capital of Principal Insurance Subsidiaries
Each of our wholly owned Principal Insurance Subsidiaries is subject to minimum RBC requirements established by the insurance departments of their applicable state of domicile. The formulas for determining the amount of RBC specify various weighting factors that are applied to financial balances or various levels of activity based on the perceived degree of risk. Regulatory compliance is determined by a ratio of TAC, as defined by the NAIC, to RBC requirements, as defined by the NAIC. Each of our United States insurance subsidiaries exceeded the minimum RBC requirements that would require regulatory or corrective action for all periods presented herein. The Company’s estimated RBC ratio on a combined basis was 503% as of December 31, 2013.
Our wholly owned insurance subsidiaries are required to prepare statutory financial statements in accordance with statutory accounting practices prescribed or permitted by the insurance department of the state of domicile of the respective insurance subsidiary. Statutory accounting practices primarily differ from U.S. GAAP by charging policy acquisition costs to expense as incurred, establishing future policy benefit liabilities using different actuarial assumptions as well as valuing investments and certain assets and accounting for deferred taxes on a different basis. Certain assets that are not admitted under statutory accounting principles are charged directly to surplus. Depending on the regulations of the insurance department of the state of domicile, the entire amount or a portion of an asset balance can be non-admitted depending on specific rules regarding admissibility. The most significant non-admitted assets are typically deferred tax assets.
-136-
Table of Contents
The following table summarizes the statutory capital and surplus of our Principal Insurance Subsidiaries as of the dates indicated:
| As of December 31, | ||||||||
| ($ in millions) | 2013 | 2012 | ||||||
| Subsidiary Name (State of domicile): |
||||||||
| ING USA Annuity and Life Insurance Company (IA) |
$ | 1,941.6 | $ | 2,174.1 | ||||
| ING Life Insurance and Annuity Company (CT) |
2,010.8 | 1,921.8 | ||||||
| Security Life of Denver Insurance Company (CO) |
1,034.0 | 1,459.9 | ||||||
| ReliaStar Life Insurance Company (MN) |
1,942.5 | 2,278.6 | ||||||
We monitor the ratio of our insurance subsidiaries’ TAC to company action level risk-based capital (“CAL”). A ratio in excess of 125% indicates that the insurance subsidiary is not required to take any corrective actions to increase capital levels at the direction of the applicable state of domicile.
The following table summarizes the ratio of TAC to CAL on a combined basis for our Principal Insurance Subsidiaries as of the dates indicated below:
| ($ in millions) | ||||||||||||||||||||||
| As of December 31, 2013 | As of December 31, 2012 | |||||||||||||||||||||
| CAL | TAC | Ratio | CAL | TAC | Ratio | |||||||||||||||||
| $1,406.3 | $ | 7,068.4 | 503 | % | $ | 1,497.4 | $ | 7,871.9 | 526 | % | ||||||||||||
|
|
|
|
|
|
|
|
|
|
|
|
||||||||||||
Statutory reserves established for variable annuity contracts and riders are sensitive to changes in the equity markets and are affected by the level of account values relative to the level of any guarantees, product design and reinsurance arrangements. As a result, the relationship between reserve changes and equity market performance is non-linear during any given reporting period. Market conditions greatly influence the ultimate capital required due to its effect on the valuation of reserves and derivative assets hedging these reserves.
The sensitivity of our insurance subsidiaries’ statutory reserves and surplus established for variable annuity contracts and certain minimum interest rate guarantees to changes in the interest rates, credit spreads and equity markets will vary depending on the magnitude of the decline. The sensitivity will be affected by the level of account values, the level of guaranteed amounts and product design. Should statutory reserves increase, this could result in future reductions in our insurance subsidiaries’ surplus, which may also impact RBC. Adverse changes in interest rates and the continued widening of credit spreads may result in an increase in the reserves for product guarantees which adversely impact statutory surplus, which may also impact RBC.
RBC is also affected by the product mix of the in force book of business (i.e., the amount of business without guarantees is not subject to the same level of reserves as the business with guarantees). RBC is an important factor in the determination of the credit and financial strength ratings of ING U.S., Inc. and our insurance subsidiaries.
In June 2012, in conjunction with a limited scope examination of ING USA’s AG43 variable annuity reserves, we agreed with the Iowa Insurance Division that by December 31, 2012 we would implement a revised prudent margin (i.e., provision for adverse deviation) to the assumed mortality for our block of GMIB and GMWBL liabilities ceded from ING USA to SLDI. This revision did not alter our best estimate mortality assumption used in our U.S. GAAP financial statements. This revised prudent margin increased our gross AG43 reserves before ceded reinsurance. As of December 31, 2012, the impact of this implementation to ING USA’s gross AG43 reserves was an increase of $174.7 million and the related reserve ceded to SLDI was increased by $188.0 million. Thus, the net reserve impact to statutory reserves at ING USA was $13.0 million favorable and SLDI was required to increase collateral in support of ceded reserves (i.e., qualifying assets in trust or approved letters of credit) in the amount of $188.0 million.
-137-
Table of Contents
Captive Reinsurance Subsidiaries
Our captive reinsurance subsidiaries provide reinsurance to the Company’s insurance subsidiaries in order to facilitate the financing of statutory reserves including those associated with Regulation XXX or AG38. A portion of this reinsurance was, until January 1, 2014, also provided by a special purpose life reinsurance captive insurance subsidiary domiciled in South Carolina and was novated to one of the captive reinsurance subsidiaries on that date. Each of the captive reinsurance subsidiaries in operation as of December 31, 2013 is a wholly owned direct or indirect subsidiary of one of the Principal Insurance Subsidiaries. Each of the captive reinsurance subsidiaries is subject to specific minimum capital requirements set forth in the insurance statutes of the State of Missouri, its state of domicile, and is required to prepare statutory financial statements in accordance with statutory accounting practices prescribed in the insurance statutes or permitted by the Insurance Department of the State of Missouri, its state of domicile. There are no prescribed practices material to the captive reinsurance subsidiaries, except that certain of these subsidiaries have included the value of letters of credit, surplus notes and trust notes as admitted assets supporting the statutory reserves ceded to such subsidiaries. The effect of these prescribed practices was to increase statutory capital and surplus by $1,612.0 million and $1,339.0 million as of December 31, 2013 and 2012, respectively. The aggregate statutory capital and surplus, including the aforementioned prescribed practices, was $616.6 million and $596.6 million as of December 31, 2013 and 2012, respectively.
Our Arizona captive, SLDI, provides reinsurance to the Company’s insurance subsidiaries in order to facilitate the financing of statutory reserves associated with Regulation XXX or AG38, including those associated with the Hannover Re block, and to fund certain statutory annuity reserve requirements. On December 20, 2013, SLDI redomesticated from the Cayman Islands to the State of Arizona. Arizona state insurance statutes and regulations require SLDI to file financial statements with the ADOI and allow the filing of such financial statements on a U.S. GAAP basis modified for certain prescribed practices outlined in the Arizona insurance statutes that are applicable to all U.S. GAAP filers. These prescribed practices had no impact on SLDI’s Shareholder’s equity as of December 31, 2013. In addition, SLDI has obtained approval from the ADOI for certain permitted practices, including taking reinsurance credit for certain ceded reserves related to the Hannover Re block, where the assets backing the liabilities consist of investment securities held by SLD for the benefit of SLDI. SLDI has recorded a receivable for these assets. The effect of the permitted practice was to increase SLDI’s Shareholder’s equity by $490.6 million as of December 31, 2013, but has no effect on our consolidated Total shareholders’ equity. In the unlikely event that the permitted practice is suspended in the future, the Company has various alternatives which could be executed to allow the reinsurance credit for these ceded reserves.
The captive reinsurance subsidiaries may not declare or pay any dividends other than in accordance with their respective insurance reserve financing transaction agreements and their respective governing licensing orders. Likewise, SLDI may not declare or pay dividends other than in accordance with its annual capital and dividend plan as approved by the ADOI, which includes a minimum capital requirement. SLDI does not expect to make any dividend payments during calendar year 2014.
Uncertainties associated with our continued use of affiliated captive reinsurance subsidiaries and our Arizona captive are primarily related to potential regulatory changes. In October 2011, the NAIC established a subgroup to study insurers’ use of captives and special purpose vehicles to transfer insurance risk in relation to existing state laws and regulations, and to establish appropriate regulatory requirements to address concerns identified in the study. In June 2013, the NYDFS released a report critical of certain captive reinsurance structures and calling, in part, for other state regulators to adopt a moratorium on approving such structures pending further review by state and federal regulators. In December 2013, the FIO issued a report on how to modernize and improve the system of insurance regulation in the United States, recommending, in part, that states develop a uniform capital requirement for reinsurance captives, including a prohibition on transactions that do not constitute a legitimate risk transfer. In March 2014, the Missouri Division notified us that it is performing a review of special purpose life reinsurance captive insurance company transactions that have occurred in Missouri’s captive program and, as part of that review, the Missouri Division has requested information from us regarding our captive reinsurance subsidiaries. We are currently unable to predict what actions and regulatory changes will result from the NAIC study, the NYDFS report, the FIO report or the Missouri Division review.
-138-
Table of Contents
Although we do not believe it to be likely, a potential outcome of the NAIC study, the NYDFS report and the FIO report is that we will be prohibited from continuing our use of captive reinsurance subsidiaries, retroactively or prospectively. The expected effect of such a prohibition would depend on the specific changes to state regulations that are adopted, including whether the Principles-Based Reserving (“PBR”) framework adopted by the NAIC in December 2012 is ultimately effective and whether current captive reinsurance companies would be allowed to continue in existence or, if not, the method and timing of their dissolution, as well as the cost and availability of alternative financing, see “Regulation—Financial Regulation—Recent Actions by the NAIC.” Given the uncertainty around these matters, we are unable to estimate the expected effects on our consolidated operations and financial position of the discontinuance of the use of captive reinsurance subsidiaries and our Arizona captive to finance statutory reserves subject to Regulations XXX and AG38 and statutory reserves associated with our reinsured annuity business. If we were to discontinue our use of captive reinsurance subsidiaries and our Arizona captive on a retroactive basis, the reasonably likely impacts would include early termination fees payable with respect to certain financing structures, increased costs related to alternative financing, such as third-party reinsurance, an increase in statutory reserves and diminished capital position. On a prospective basis, discontinuing the use of captive reinsurance subsidiaries could impact the types, amounts and pricing of products we offer and could result in potential reductions in or discontinuance of new term or UL insurance sales, all of which would adversely impact our consolidated results of operations and financial condition. In addition, we cannot be certain that affordable alternative financing would be available.
Pension and Postretirement Plans
MAP-21 was adopted by ING U.S., Inc. in 2012 and fully enacted for all pension plans in 2013. It contained the pension stabilization language which provides temporary funding relief to pension plans as a result of the financial crisis. The effect of this legislation was to reduce required contributions over the short term.
For additional information on our pension and postretirement plan arrangements, see “Note 13. Employee Benefit Arrangements.”
Off-Balance Sheet Arrangements
Through the normal course of investment operations, we commit to either purchase or sell securities, commercial mortgage loans, or money market instruments, at a specified future date and at a specified price or yield. The inability of counterparties to honor these commitments may result in either a higher or lower replacement cost. Also, there is likely to be a change in the value of the securities underlying the commitments.
At December 31, 2013 and 2012, we had off-balance sheet commitments to purchase investments equal to their fair value of $1.2 billion and $890.1 million, respectively, of which $321.3 million and $254.9 million, respectively, relates to consolidated investment entities.
Aggregate Contractual Obligations
As of December 31, 2013, we had certain contractual obligations due over a period of time as summarized in the following table. The estimated payments reflected in this table are based on our estimates and assumptions about these obligations. Because these estimates and assumptions are necessarily subjective, the actual cash outflows in future periods will vary, possibly materially, from those presented in the table.
| ($ in millions) |
Total | Less than 1 Year |
1-3 Years | 3-5 Years | More than 5 Years |
|||||||||||||||
| Contractual Obligations |
||||||||||||||||||||
| Purchase obligations(1) |
$ | 1,222.9 | $ | 1,174.1 | $ | 48.8 | $ | — | $ | — | ||||||||||
| Reserves for insurance obligations(2)(3) |
105,796.1 | 8,164.2 | 13,095.6 | 11,806.7 | 72,729.6 | |||||||||||||||
| Retirement and other plans(4) |
1,607.1 | 159.8 | 294.5 | 299.3 | 853.5 | |||||||||||||||
| Short-term and long-term debt obligations(5) |
7,366.6 | 178.6 | 358.6 | 1,344.6 | 5,484.8 | |||||||||||||||
| Operating leases(6) |
215.8 | 32.7 | 63.5 | 45.0 | 74.6 | |||||||||||||||
| Securities lending and repurchase agreements(7) |
451.0 | 451.0 | — | — | — | |||||||||||||||
|
|
|
|
|
|
|
|
|
|
|
|||||||||||
| Total |
$ | 116,659.5 | $ | 10,160.4 | $ | 13,861.0 | $ | 13,495.6 | $ | 79,142.5 | ||||||||||
|
|
|
|
|
|
|
|
|
|
|
|||||||||||
-139-
Table of Contents
| (1) | Purchase obligations consist primarily of outstanding commitments under alternative investments that may occur any time within the terms of the partnership and private loans. The exact timing, however, of funding these commitments related to partnerships and private loans cannot be estimated. Therefore, the amount of the commitments related to partnerships and private loans is included in the category “Less than 1 Year.” |
| (2) | Reserves for insurance obligations consist of amounts required to meet our future obligations for future policy benefits and contract owner account balances. Amounts presented in the table represent estimated cash payments under such contracts, including significant assumptions related to the receipt of future premiums, mortality, morbidity, lapse, renewal, retirement, disability and annuitization comparable with actual experience. These assumptions also include market growth and interest crediting consistent with assumptions used in amortizing DAC. All estimated cash payments are undiscounted for the time value of money. Accordingly, the sum of cash flows presented for all years of $105.8 billion significantly exceeds the sum of Future policy benefits and Contract owner account balances of $84.0 billion recorded on our Consolidated Balance Sheets as of December 31, 2013. Estimated cash payments are also presented gross of reinsurance. Due to the significance of the assumptions used, the amounts presented could materially differ from actual results. |
| (3) | Contractual obligations related to certain closed blocks, with reserves in the amount of $5.4 billion, have been excluded from the table because the blocks were divested through reinsurance contracts and collateral is provided by third parties that is accessible by us. Although we are not relieved of legal liability to the contract holder for these closed blocks, third-party collateral of $6.5 billion has been provided for the payment of the related insurance obligations. The sufficiency of collateral held for any individual block may vary. |
| (4) | Includes estimated benefit payments under our qualified and non-qualified pension plans, estimated benefit payments under our postretirement benefit plan, and estimated payments of deferred compensation based on participant elections and an average retirement age. |
| (5) | The estimated payments due by period for long-term debt reflects the contractual maturities of principal, as disclosed in Financing Agreements in our Consolidated Financial Statements, as well as estimated future interest payments. The payment of principal and estimated future interest for short-term debt are reflected in estimated payments due in less than one year. See “Note 16. Financing Agreements” for additional information concerning the short-term and long-term debt. |
| (6) | Operating leases consist primarily of outstanding commitments for office space, equipment and automobiles. |
| (7) | Payables under securities loan agreements including collateral held represents the liability to return collateral received from counterparties under securities lending agreements. Securities lending agreements include provisions which permit us to call back securities with minimal notice and accordingly, the payable is classified as having a term of less than 1 year. |
Critical Accounting Judgments and Estimates
General
The preparation of financial statements in conformity with U.S. GAAP requires us to make estimates and assumptions that affect the reported amounts of assets and liabilities and disclosure of contingent assets and liabilities at the date of the Consolidated Financial Statements and the reported amounts of revenues and expenses during the reporting period. Critical estimates and assumptions are evaluated on an on-going basis based on historical developments, market conditions, industry trends and other information that is reasonable under the circumstances. There can be no assurance that actual results will conform to estimates and assumptions and that reported results of operations will not be materially affected by the need to make future accounting adjustments to reflect changes in these estimates and assumptions from time to time.
We have identified the following accounting, judgments and estimates as critical in that they involve a higher degree of judgment and are subject to a significant degree of variability:
Reserves for future policy benefits, DAC/VOBA and other intangibles, valuation of investments and derivatives, impairments, income taxes, contingencies and employee benefit plans.
-140-
Table of Contents
In developing these accounting estimates, we make subjective and complex judgments that are inherently uncertain and subject to material changes as facts and circumstances develop. Although variability is inherent in these estimates, we believe the amounts provided are appropriate based upon the facts available upon preparation of the Consolidated Financial Statements.
The above critical accounting estimates are described in “Note 1. Business, Basis of Presentation and Significant Accounting Policies.”
Reserves for Future Policy Benefits
The determination of future policy benefit reserves is dependent on actuarial assumptions. The principal assumptions used to establish liabilities for future policy benefits are based on our experience and periodically reviewed against industry standards. These assumptions include mortality, morbidity, policy lapse, contract renewal, payment of subsequent premiums or deposits by the contract owner, retirement, investment returns, inflation, benefit utilization and expenses. The assumptions used require considerable judgments. Changes in, or deviations from, the assumptions used can significantly affect our reserve levels and related results of operations.
Mortality is the incidence of death amongst policyholders triggering the payment of underlying insurance coverage by the insurer. In addition, mortality also refers to the ceasing of payments on life-contingent annuities due to the death of the annuitant. We utilize a combination of actual and industry experience when setting our mortality assumptions. A lapse rate is the percentage of in-force policies surrendered by the policyholder or canceled by us due to non-payment of premiums. For certain of our variable products, the lapse rate assumption varies according to the current account value relative to guarantees associated with the product and applicable surrender charges. In general, policies with guarantees that are considered “in the money” or where the benefit is in excess of the account value, are assumed to be less likely to lapse or surrender. Conversely, “out of the money” guarantees may be assumed to be more likely to lapse or surrender as the policyholder has less incentive to retain the policy.
See “Note 6. Reserves for Future Policy Benefits and Contract Owner Account Balances” and “Note 7. Guaranteed Benefit Features” for further information on our reserves for future policy benefits and product guarantees.
Insurance and Other Reserves
Reserves for traditional life insurance contracts (term insurance, participating and non-participating whole life insurance and traditional group life insurance) and accident and health insurance represent the present value of future benefits to be paid to or on behalf of contract owners and related expenses, less the present value of future net premiums. Assumptions as to interest rates, mortality, expenses and persistency are based upon our estimates of anticipated experience at the period the policy is sold or acquired, including a provision for adverse deviation. Interest rates used to calculate the present value of these reserves ranged from 2.5% to 8.3%.
Reserves for payout contracts with life contingencies are equal to the present value of expected future payments. Assumptions as to interest rates, mortality, and expenses are based on our estimates of experience at the period the policy is sold or acquired, including a provision for adverse deviation. Such assumptions generally vary by annuity plan type, year of issue, and policy duration. Interest rates used to calculate the present value of future benefits ranged from 3.0% to 8.3%.
Although assumptions are “locked-in” upon the issuance of traditional life insurance contracts, certain accident and health insurance contracts and payout contracts with life contingencies, significant changes in experience or assumptions may require us to provide for expected future losses on a product by establishing premium deficiency reserves. Premium deficiency reserves are determined based on best estimate assumptions that exist at the time the premium deficiency reserve is established and do not include a provision for adverse deviation.
-141-
Table of Contents
Product Guarantees
The assumptions used to establish the liabilities for our product guarantees require considerable judgment and are established as management’s best estimate of future outcomes. We periodically review these assumptions and, if necessary, update them based on additional information that becomes available. Changes in, or deviations from, the assumptions used can significantly affect our reserve levels and related results of operations.
GMDB and GMIB: Reserves for annuity GMDB and GMIB are determined by estimating the value of expected benefits in excess of the projected account balance and recognizing the excess ratably over the accumulation period based on total expected assessments. Expected experience is based on a range of scenarios. Assumptions used, such as the long-term equity market return, lapse rate and mortality, are consistent with assumptions used in estimating gross revenues for the purpose of amortizing DAC. In addition, the reserve for the GMIB incorporates assumptions for the likelihood and timing of the potential annuitizations that may be elected by the contract owner. In general, we assume that GMIB annuitization rates will be higher for policies with more valuable (more “in the money”) guarantees.
GMAB, GMWB, GMWBL, FIA, Stabilizer and MCG: We also issue certain products that contain embedded derivatives and are measured at estimated fair value separately from the host contract. These embedded derivatives include annuity GMAB, GMWB, GMWBL, FIAs and Stabilizer. The managed custody guarantee product (“MCG”) is a stand-alone derivative and is measured in its entirety at estimated fair value. Changes in estimated fair value of these derivatives are reported in Other net realized capital gains (losses) in the Consolidated Statements of Operations.
At inception of the GMAB, GMWB and GMWBL contracts, we project a fee to be attributed to the embedded derivative portion of the guarantee equal to the present value of projected future guaranteed benefits. The estimated fair value of the GMAB, GMWB and GMWBL contracts is determined based on the present value of projected future guaranteed benefits, minus the present value of projected attributed fees. A risk neutral valuation methodology is used under which the cash flows from the guarantees are projected under multiple capital market scenarios using observable risk free rates. The projection of future guaranteed benefits and future attributed fees require the use of assumptions for capital markets (e.g., implied volatilities, correlation among indices, risk-free swap curve, etc.) and policyholder behavior (e.g., lapse, benefit utilization, mortality, etc.).
The estimated fair value of the FIA contracts is based on the present value of the excess of interest payments to the contract owners over the growth in the minimum guaranteed contract value. The excess interest payments are determined as the excess of projected index driven benefits over the projected guaranteed benefits. The projection horizon is over the anticipated life of the related contracts which takes into account best estimate actuarial assumptions, such as partial withdrawals, full surrenders, deaths, annuitizations and maturities.
The estimated fair value of the Stabilizer and MCG contracts is determined based on the present value of projected future claims minus the present value of future guaranteed premiums. At inception of the contract, we project a guaranteed premium to be equal to the present value of the projected future claims. The income associated with the contracts is projected using actuarial and capital market assumptions, including benefits and related contract charges, over the anticipated life of the related contracts. The cash flow estimates are projected under multiple capital market scenarios using observable risk-free rates and other best estimate assumptions.
The GMAB, GMWB, GMWBL, FIA and Stabilizer embedded derivative liabilities and the stand-alone derivative for MCG include a risk margin to capture uncertainties related to policyholder behavior assumptions. The margin represents additional compensation a market participant would require to assume these risks.
The discount rate used to determine the fair value of our GMAB, GMWB, GMWBL, FIA and Stabilizer embedded derivative liabilities and the stand-alone derivative for MCG includes an adjustment to reflect the risk that these obligations will not be fulfilled (“nonperformance risk”). Through the second quarter of 2012, our nonperformance risk adjustment was based on the CDS spreads of ING V, a subsidiary of ING Group and,
-142-
Table of Contents
previously, our indirect parent, and applied to the risk-free swap curve in our valuation models. As a result of the availability of our own market observable data following our issuance of the 2022 Notes in the third quarter of 2012, we changed the estimate of nonperformance risk as of the beginning of the third quarter of 2012 to incorporate a blend of observable, similarly rated peer holding company CDS spreads, adjusted to reflect the credit quality of our individual insurance subsidiary that issued the guarantee as well as an adjustment to reflect the priority of policyholder claims. The impact of the nonperformance risk adjustment on the fair value of these liabilities was a reduction of approximately $377 million and $924 million as of December 31, 2013 and 2012, respectively.
UL and VUL: Reserves for UL and VUL secondary guarantees and paid-up guarantees are calculated by estimating the expected value of death benefits payable and recognizing those benefits ratably over the accumulation period based on total expected assessments. The reserve for such products recognizes the portion of contract assessments received in early years used to compensate us for benefits provided in later years. Assumptions used, such as the interest rate, lapse rate and mortality, are consistent with assumptions used in estimating gross profits for purposes of amortizing DAC.
Assumptions and Periodic Review
We have only minimal experience on policyholder behavior for our GMIB and GMWBL products and, as a result, future experience could lead to significant changes in our assumptions. Our GMIB contracts have a ten-year waiting period before annuitization is available, with most of these GMIB contracts issued during the period 2004 to 2006. These contracts first become eligible to annuitize during the period 2014 to 2016, but contain significant incentives to delay annuitization beyond the first eligibility date. As a result, to date we have only a statistically small sample of experience used to set annuitization rates. Therefore, we anticipate that observable experience data will become statistically credible later this decade, when a large volume of GMIB benefits begin to reach their maximum benefit over the four-year period from 2019 to 2022. It is possible, however, that policyholders may choose to annuitize soon after the first annuitization date, rather than delay annuitization to receive increased guarantee benefits, in which case we may have statistically credible experience as early as the period from 2014 to 2016.
Similarly, most of our GMWBL contracts are still in the first four to six policy years, so our assumptions for withdrawal from contracts with GMWBL benefits may change as experience emerges. In addition, like our GMIB contracts, many of our GMWBL contracts contain significant incentives to delay withdrawal. We expect customer decisions on annuitization and withdrawal will be influenced by customers’ financial plans and needs as well as by interest rate and market conditions over time and by the availability and features of competing products. If emerging experience deviates from our assumptions on either GMIB annuitization or GMWBL withdrawal, such could have a significant effect on our reserve levels and related results of operation.
We also make estimates of expected lapse of these products, which is the probability that a policy will not remain in force from one period to the next. Lapse rates of our annuity products may be significantly impacted by the value of guaranteed minimum benefits relative to the value of the underlying separate accounts (account value or account balance). In general, policies with guarantees that are “in the money” (i.e., where the notional benefit amount is in excess of the account value) are assumed to be less likely to lapse. Conversely, “out of the money” guarantees are assumed to be more likely to lapse as the policyholder has less incentive to retain the policy.
Lapse rates would also be adversely affected generally by developments that affect customer perception of us. Our lapse rate experience of these products has varied significantly over the period from 2006 to the present, reflecting among other factors, both pre- and post-financial crisis experience. During the early years of this period, our lapse rate experience was higher than our current best estimate of policyholder lapse behavior would have indicated; in the later part of this period, after mid-2009, it was lower. Management’s best estimate of lapse behavior incorporates actual experience over the entire period, as we believe that, over the duration of the policies, we will experience the full range of policyholder behavior and market conditions.
-143-
Table of Contents
We review overall policyholder experience at least annually (including lapse, annuitization, withdrawal and mortality), and update these assumptions when deemed necessary based on additional information that becomes available. If actual lapse rates are significantly different from those assumed, such could have a significant effect on our reserve levels and related results of operation. During 2013 and 2012, we conducted our annual review of assumptions, including projection model inputs.
We conducted our annual review of assumptions related to our CBVA contracts. Annual assumption changes implemented during 2013 resulted in a loss of $185.3 million, which included $117.9 million of unfavorable mortality assumption changes and $85.5 million of unfavorable policyholder behavior assumption changes. The unlocking related to these assumption reviews is included in DAC/VOBA and other intangibles unlocking. The 2012 result included a loss of $151.7 million due to annual assumption changes, including $114.6 million driven primarily by an update to lapse rates on variable annuity contracts with lifetime living benefit guarantees and $37.1 million related to changes in cash flow projections and volatility assumptions on certain products.
We increased CBVA reserves in the fourth quarter of 2011 after a comprehensive review of our assumptions relating to lapses, mortality, annuitization of income benefits and utilization of withdrawal benefits. The review in 2011 included an analysis of a larger body of actual experience than was previously available, including a longer period with low equity markets and interest rates, which we believe provided greater insight into anticipated policyholder behavior for contracts that are in the money. This resulted in an increase in U.S. GAAP reserves of $741 million and gross U.S. statutory reserves of $2.8 billion in the fourth quarter of 2011.
See “—Quantitative and Qualitative Disclosures About Market Risk” for additional information regarding the specific hedging strategies and reinsurance we utilize to mitigate risk for the product guarantees, as well as sensitivities of the embedded derivative liabilities and the stand-alone derivative to changes in certain capital markets assumptions.
Deferred Policy Acquisition Costs, Value of Business Acquired and Other Intangibles
DAC represents policy acquisition costs that have been capitalized and are subject to amortization and interest. Capitalized costs are incremental, direct costs of contract acquisition and certain costs related directly to successful acquisition activities. Such costs consist principally of commissions, underwriting, sales and contract issuance and processing expenses directly related to the successful acquisition of new and renewal business. Indirect or unsuccessful acquisition costs, maintenance, product development and overhead expenses are charged to expense as incurred. VOBA represents the outstanding value of in force business acquired and is subject to amortization and interest. The value is based on the present value of estimated net cash flows embedded in the insurance contracts at the time of the acquisition and increased for subsequent deferrable expenses on purchased policies.
DSI represents benefits paid to contract owners for a specified period that are incremental to the amounts we credit on similar contracts without sales inducements and are higher than the contract’s expected ongoing crediting rates for periods after the inducement. URR relates to UL and VUL products and represents policy charges for benefits or services to be provided in future periods.
Collectively, we refer to DAC, VOBA, DSI and URR as “DAC/VOBA and other intangibles.” See “Note 5. Deferred Policy Acquisition Costs and Value of Business Acquired” for additional information on the DAC/ VOBA and other intangibles.
Amortization Methodologies
We amortize DAC and VOBA related to certain traditional life insurance contracts and certain accident and health insurance contracts over the premium payment period in proportion to the present value of expected gross premiums. Assumptions as to mortality, morbidity, persistency and interest rates, which include provisions for adverse deviation, are consistent with the assumptions used to calculate reserves for future policy benefits. These assumptions are “locked-in” at issue and not revised unless the DAC or VOBA balance is deemed to be
-144-
Table of Contents
unrecoverable from future expected profits. Recoverability testing is performed for current issue year products to determine if gross premiums are sufficient to cover DAC or VOBA estimated benefits and expenses. In subsequent periods, the recoverability of DAC and VOBA is determined by assessing whether future gross profits are sufficient to amortize DAC or VOBA, as well as provide for expected future benefits and maintenance costs. If a premium deficiency is deemed to be present, charges will be applied against the DAC and VOBA balances before an additional reserve is established. Absent such a premium deficiency, variability in amortization after policy issuance or acquisition relates only to variability in premium volumes.
We amortize DAC and VOBA related to UL and VUL contracts and fixed and variable deferred annuity contracts over the estimated lives of the contracts in relation to the emergence of estimated gross profits. Assumptions as to mortality, persistency, interest crediting rates, fee income, returns associated with separate account performance, impact of hedge performance, expenses to administer the business and certain economic variables, such as inflation, are based on our experience and overall capital markets. At each valuation date, estimated gross profits are updated with actual gross profits, and the assumptions underlying future estimated gross profits are evaluated for continued reasonableness. Adjustments to estimated gross profits require that amortization rates be revised retroactively to the date of the contract issuance (“unlocking”). If the update of assumptions causes estimated gross profits to increase, DAC and VOBA amortization will decrease, resulting in a current period increase to earnings. The opposite result occurs when the assumption update causes estimated gross profits to decrease. For variable deferred annuity contracts within CBVA, we amortize DAC and VOBA in relation to the emergence of estimated gross revenue. We defer sales inducements and amortize the DSI over the life of the policy using the same methodology and assumptions used to amortize DAC. URR is amortized over the expected life of the related contracts in proportion to estimated gross profits in a manner consistent with DAC for these products.
For UL and VUL contracts and fixed and variable deferred annuity contracts, recoverability testing is performed for current issue year products to determine if gross profits are sufficient to cover DAC/VOBA and other intangibles estimated benefits and expenses. In subsequent periods, we perform testing to assess the recoverability of DAC/VOBA and other intangibles on an annual basis, or more frequently if circumstances indicate a potential loss recognition issue exists. If DAC/VOBA or other intangibles are not deemed recoverable from future gross profits, changes will be applied against the DAC/VOBA or other intangible balances before an additional reserve is established.
Assumptions and Periodic Review
Changes in assumptions can have a significant impact on DAC/VOBA and other intangible balances, amortization rates and results of operations. Assumptions are management’s best estimate of future outcome. Several assumptions are considered significant and require significant judgment in the estimation of gross profits associated with our variable products. We periodically review these assumptions against actual experience and, based on additional information that becomes available, update our assumptions.
| • | One significant assumption is the assumed return associated with the variable account performance, which has historically had a greater impact on variable annuity than VUL products. To reflect the volatility in the equity markets, this assumption involves a combination of near-term expectations and long-term assumptions regarding market performance. The overall return on the variable account is dependent on multiple factors, including the relative mix of the underlying sub-accounts among bond funds and equity funds, as well as equity sector weightings. Our practice assumes that near-term and long-term increases or decreases in equity markets revert to the long-term appreciation in equity markets. We monitor market events and only change the assumption when sustained deviations are expected. This methodology incorporates a 9% long-term equity return assumption, a 14% cap and a five-year look-forward period. |
| • | Another significant assumption used in the estimation of gross profits for certain products is mortality. We utilize a combination of actual and industry experience when setting our mortality assumptions, and are consistent with the assumptions used to calculate reserves for future policy benefits. |
-145-
Table of Contents
| • | Assumptions related to interest rate spreads and credit losses also impact estimated gross profits for all applicable products with credited rates. These assumptions are based on the current investment portfolio yields and credit quality, estimated future crediting rates, capital markets and estimates of future interest rates and defaults. |
| • | Other significant assumptions include estimated policyholder behavior assumptions, such as surrender, lapse and annuitization rates. We use a combination of actual and industry experience when setting and updating our policyholder behavior assumptions and such assumptions require considerable judgment. Estimated gross profits for our variable annuity contracts are particularly sensitive to these assumptions. |
We include the impact of the change in value of the embedded derivative associated with the FIA contracts in gross profits for purposes of determining DAC amortization. When performing loss recognition testing on the GMAB, GMWB and GMWBL contracts, we include the change in value of the associated embedded derivatives in gross profits. In addition, we utilize a hedge program to mitigate the exposure of our CBVA segment to adverse capital market results and economic downturns and seek to ensure that the required assets are available to satisfy future death and living benefit guarantees. In general, our variable annuity hedge program generates gains and losses that mitigate our exposure to these guarantees. As our hedging program does not explicitly hedge the U.S. GAAP liability, we typically experience “breakage”, or a difference between the change in the U.S. GAAP liability and the change in the corresponding derivative instrument. We include the impact of our hedging activities supporting our death and living benefit guarantees in gross profits when performing loss recognition testing.
During the third quarter of 2013 and 2012, we conducted our annual review of assumptions, including projection model inputs. As a result, in the third quarter of 2013, we made a number of changes that resulted in net favorable unlocking of DAC/VOBA and other intangibles in our Ongoing business segments of $94.4 million, of which $84.8 million was included in Operating earnings before income taxes. In addition, favorable unlocking from gross profit refinements of $21.1 million was recorded in the fourth quarter of 2013, all of which was included in Operating earnings before income taxes. In the third quarter of 2012, changes in assumptions resulted in net unfavorable unlocking of DAC/VOBA and other intangibles in our Ongoing business segments of $32.0 million, all of which was included in Operating earnings before income taxes.
Sensitivity
We perform sensitivity analyses to assess the impact that certain assumptions have on DAC/VOBA and other intangibles, as well as certain reserves. The following table presents the estimated instantaneous net impact to Income (loss) before income taxes of various assumption changes on our DAC/VOBA and other intangible balances and the impact on related reserves for future policy benefits and reinsurance. The effects presented are not representative of the aggregate impacts that could result if a combination of such changes to equity markets, interest rates and other assumptions occurred. (Assumptions regarding shifts in market factors may be overly simplistic and not indicative of actual market behavior in stress scenarios.)
| ($ millions) | As of December 31, 2013 |
|||
| Decrease in long-term rate of return assumption by 100 basis points |
$ | (209.1 | ) | |
| A change to the long-term interest rate assumption of -50 basis points |
(72.9 | ) | ||
| A change to the long-term interest rate assumption of +50 basis points |
52.5 | |||
| An assumed increase in future mortality by 1% |
(19.0 | ) | ||
| A one-time, 10% decrease in equity market values |
(309.6 | ) | ||
-146-
Table of Contents
Lower assumed equity rates of return, lower assumed interest rates, increases in assumed future mortality and decreases in equity market values generally decrease DAC/VOBA and other intangibles and increase Future policy benefits, thus decreasing Income before income taxes.
Higher assumed interest rates generally increase DAC/VOBA and other intangibles and decrease Future policy benefit, thus increasing Income before income taxes.
Valuation of Investments and Derivatives
Our investment portfolio consists of public and private fixed maturity securities, commercial mortgage and other loans, equity securities, short-term investments, other invested assets and derivative financial instruments. Fixed maturity and equity securities are primarily classified as available-for-sale and are carried at fair value. We enter into interest rate, equity market, credit default and currency contracts, including swaps, futures, forwards, caps, floors and options, to reduce and manage various risks associated with changes in value, yield, price, cash flow or exchange rates of assets or liabilities held or intended to be held, or to assume or reduce credit exposure associated with a referenced asset, index or pool. We also utilize options and futures on equity indices to reduce and manage risks associated with our annuity products.
See “Note 2. Investments (excluding Consolidated Investment Entities)” and “Note 3. Derivative Financial Instruments” for further information.
Investments
We measure the fair value of our financial assets and liabilities based on assumptions used by market participants, which may include inherent risk, restrictions on the sale or use of an asset or nonperformance risk, including our own credit risk. The estimate of fair value is the price that would be received to sell an asset or transfer a liability in an orderly transaction between market participants (“exit price”) in the principal market, or the most advantageous market in the absence of a principal market, for that asset or liability. We use a number of valuation sources to determine the fair values of our financial assets and liabilities, including quoted market prices, third-party commercial pricing services, third-party brokers and industry-standard, vendor-provided software that models the value based on market observable inputs, and other internal modeling techniques based on projected cash flows.
We categorize our financial instruments into a three-level hierarchy based on the priority of the inputs to the valuation technique. The fair value hierarchy gives the highest priority to quoted prices in active markets for identical assets or liabilities (Level 1) and the lowest priority to unobservable inputs (Level 3). If the inputs used to measure fair value fall within different levels of the hierarchy, the category level is based on the lowest priority level input that is significant to the fair value measurement of the instrument.
When available, the estimated fair value of securities is based on quoted prices in active markets that are readily and regularly obtainable. When quoted prices in active markets are not available, the determination of estimated fair value is based on market standard valuation methodologies, including discounted cash flows, matrix pricing or other similar techniques. Inputs to these methodologies include, but are not limited to, market observable inputs such as benchmark yields, credit quality, issuer spreads, bids, offers and cash flow characteristics of the security. For privately placed bonds, we also consider such factors as the net worth of the borrower, value of the collateral, the capital structure of the borrower, the presence of guarantees and the borrower’s ability to compete in its relevant market. Valuations are reviewed and validated monthly by an internal valuation committee using price variance reports, comparisons to internal pricing models, back testing of recent trades and monitoring of trading volumes, as appropriate.
The valuation of financial assets and liabilities involves considerable judgment, is subject to considerable variability, is established using management’s best estimate and is revised as additional information becomes
-147-
Table of Contents
available. As such, changes in, or deviations from the assumptions used in such valuations can significantly affect our results of operations. Financial markets are subject to significant movements in valuation and liquidity which can impact our ability to liquidate and the selling price that can be realized for our securities.
Derivatives
Derivatives are carried at fair value, which is determined by using observable key financial data, such as yield curves, exchange rates, S&P 500 prices, LIBOR, and Overnight Index Swap Rates (“OIS”) or through values established by third-party sources, such as brokers. Valuations for our futures contracts are based on unadjusted quoted prices from an active exchange. Counterparty credit risk is considered and incorporated in our valuation process through counterparty credit rating requirements and monitoring of overall exposure. Our own credit risk is also considered and incorporated in our valuation process.
We have certain CDS and options that are priced using models that primarily use market observable inputs, but contain inputs that are not observable to market participants.
We also have investments in certain fixed maturities and have issued certain annuity products that contain embedded derivatives whose fair value is at least partially determined by, among other things, levels of or changes in domestic and/or foreign interest rates (short-term or long-term), exchange rates, prepayment rates, equity markets or credit ratings/spreads. The fair values of these embedded derivatives are determined using prices or valuation techniques that require inputs that are both unobservable and significant to the overall fair value measurement. For additional information regarding the valuation of and significant assumptions associated with embedded derivatives and stand-alone derivatives associated with certain annuity contracts, see “Note 6. Reserves for Future Policy Benefits.”
In addition, we have entered into a coinsurance with funds withheld reinsurance arrangement that contains an embedded derivative. The fair value of the embedded derivative is based on the change in the fair value of the underlying assets held in the trust using the valuation methods and assumptions described for our investments held.
The valuation of derivatives involves considerable judgment, is subject to considerable variability, is established using management’s best estimate and is revised as additional information becomes available. As such, changes in, or deviations from these assumptions used in such valuations can have a significant effect on the results of operations.
For additional information regarding the fair value of our investments and derivatives, see “Note 4. Fair Value Measurements (excluding Consolidated Investment Entities).”
Impairments
We evaluate our available-for-sale general account investments quarterly to determine whether there has been an other-than-temporary decline in fair value below the amortized cost basis. This evaluation process entails considerable judgment and estimation. Factors considered in this analysis include, but are not limited to, the length of time and the extent to which the fair value has been less than amortized cost, the issuer’s financial condition and near-term prospects, future economic conditions and market forecasts, interest rate changes and changes in ratings of the security. An extended and severe unrealized loss position on a fixed maturity may not have any impact on: (a) the ability of the issuer to service all scheduled interest and principal payments and (b) the evaluation of recoverability of all contractual cash flows or the ability to recover an amount at least equal to its amortized cost based on the present value of the expected future cash flows to be collected. In contrast, for certain equity securities, we give greater weight and consideration to a decline in market value and the likelihood such market value decline will recover.
-148-
Table of Contents
When assessing our intent to sell a security or if it is more likely than not we will be required to sell a security before recovery of its amortized cost basis, we evaluate facts and circumstances such as, but not limited to, decisions to rebalance the investment portfolio and sales of investments to meet cash flow or capital needs.
We use the following methodology and significant inputs to determine the amount of the OTTI credit loss:
| • | When determining collectability and the period over which the value is expected to recover for U.S. and foreign corporate securities, foreign government securities and state and political subdivision securities, we apply the same considerations utilized in our overall impairment evaluation process, which incorporates information regarding the specific security, the industry and geographic area in which the issuer operates, and overall macroeconomic conditions. Projected future cash flows are estimated using assumptions derived from our best estimates of likely scenario-based outcomes, after giving consideration to a variety of variables that include, but are not limited to: general payment terms of the security; the likelihood that the issuer can service the scheduled interest and principal payments; the quality and amount of any credit enhancements; the security’s position within the capital structure of the issuer; possible corporate restructurings or asset sales by the issuer; and changes to the rating of the security or the issuer by rating agencies. |
| • | Additional considerations are made when assessing the unique features that apply to certain structured securities, such as subprime, Alt-A, non-agency, RMBS, CMBS and ABS. These additional factors for structured securities include, but are not limited to: the quality of underlying collateral; expected prepayment speeds; loan-to-value (“LTV”) ratio; debt service coverage (“DSC”) ratios; current and forecasted loss severity; consideration of the payment terms of the underlying assets backing a particular security; and the payment priority within the tranche structure of the security. |
| • | When determining the amount of the credit loss for U.S. and foreign corporate securities, foreign government securities and state and political subdivision securities, we consider the estimated fair value as the recovery value when available information does not indicate that another value is more appropriate. When information is identified that indicates a recovery value other than estimated fair value, we consider in the determination of recovery value the same considerations utilized in its overall impairment evaluation process, which incorporates available information and our best estimate of scenario-based outcomes regarding the specific security and issuer; possible corporate restructurings or asset sales by the issuer; the quality and amount of any credit enhancements; the security’s position within the capital structure of the issuer; fundamentals of the industry and geographic area in which the security issuer operates and the overall macroeconomic conditions. |
| • | We perform a discounted cash flow analysis comparing the current amortized cost of a security to the present value of future cash flows expected to be received, including estimated defaults and prepayments. The discount rate is generally the effective interest rate of the fixed maturity prior to impairment. |
Mortgage loans on real estate are all commercial mortgage loans. If a mortgage loan is determined to be impaired (i.e., when it is probable that we will be unable to collect all amounts due according to the contractual terms of the loan agreement), the carrying value of the mortgage loan is reduced to the lower of either the present value of expected cash flows from the loan, based on the original purchase yield or the fair value of the collateral. For those mortgages that are determined to require foreclosure, the carrying value is reduced to the fair value of the underlying collateral, net of estimated costs to obtain and sell at the point of foreclosure.
Impairment analysis of the investment portfolio involves considerable judgment, is subject to considerable variability, is established using management’s best estimate and is revised as additional information becomes available. As such, changes in, or deviations from the assumptions used in such analysis can have a significant effect on the results of operations.
For additional information regarding the evaluation process for impairments, see “Note 2. Investments (excluding Consolidated Investment Entities).”
-149-
Table of Contents
Income Taxes
Valuation Allowances
We use certain assumptions and estimates in determining the income taxes payable or refundable for the current year, the deferred income tax liabilities and assets for items recognized differently in our financial statements from amounts shown on our income tax returns, and the federal income tax expense. Determining these amounts requires analysis and interpretation of current tax laws and regulations, including the loss limitation rules associated with change in control. We exercise considerable judgment in evaluating the amount and timing of recognition of the resulting income tax liabilities and assets. These judgments and estimates are reevaluated on a periodic basis as regulatory and business factors change.
We evaluate and test the recoverability of deferred tax assets. Deferred tax assets represent the tax benefit of future deductible temporary differences and operating loss and tax credit carryforwards. Deferred tax assets are reduced by a valuation allowance if, based on the weight of evidence, it is more likely than not that some portion, or all, of the deferred tax assets will not be realized. Considerable judgment and the use of estimates are required in determining whether a valuation allowance is necessary, and if so, the amount of such valuation allowance. In evaluating the need for a valuation allowance, we consider many factors, including:
| • | The nature and character of the deferred tax assets and liabilities; |
| • | The nature and character of income by life and non-life subgroups; |
| • | The recent cumulative book income (loss) position after adjustment for permanent differences; |
| • | Taxable income in prior carryback years; |
| • | Projected future taxable income, exclusive of reversing temporary differences and carryforwards; |
| • | Projected future reversals of existing temporary differences; |
| • | The length of time carryforwards can be utilized; |
| • | Prudent and feasible tax planning strategies we would employ to avoid a tax benefit from expiring unused; and |
| • | Tax rules that would impact the utilization of the deferred tax assets. |
We have assessed whether it is more likely than not that the deferred tax assets will be realized in the future. In making this assessment, we considered the available sources of income and positive and negative evidence regarding our ability to generate sufficient taxable income to realize our deferred tax assets, which include net operating loss carryforwards (“NOLs”), capital loss carryforwards and tax credit carryforwards.
Positive evidence includes a recent history of earnings, projected earnings attributable to our ongoing insurance and investment businesses, plans or the ability to sell certain assets and streams of revenues, plans to reduce future projected losses by reduction of sales of certain products and predictable patterns of loss and income recognition. Negative evidence includes a history of operating losses in certain life businesses, large losses in the non-life business and the potential unpredictability of certain components of future projected taxable income.
We use judgment in considering the relative impact of negative and positive evidence. The weight given to the potential effect of negative and positive evidence is commensurate with the extent to which it can be objectively verified. The more negative evidence that exists (a) the more positive evidence is necessary and (b) the more difficult it is to support a conclusion that a valuation allowance is not needed for some portion of or the entire deferred tax asset.
The negative evidence at December 31, 2013 that outweighed the positive evidence included the following:
| • | In recent periods we have experienced pre-tax losses and volatility in earnings; |
| • | The 2012 taxable income reported in our federal tax return was positive but included several transactions not deemed likely to repeat in the same magnitude; |
-150-
Table of Contents
| • | Our net operating loss carry forwards begin to significantly expire in 2023; and |
| • | There continues to be uncertainty and volatility related to our CBVA results. |
In recent periods, certain of our negative evidence has been improving and additional negative evidence could become positive in the future. For example, following its redomestication, SLDI will be required to join in the ING U.S., Inc. consolidated federal income tax return as an actual U.S. company (rather than as an electing foreign insurance company under Section 953(d) of tax code), thereby avoiding certain restrictions that can apply to such foreign entities. Also, the trend in operating earnings has been improving. In future periods, we will continue to evaluate our ability to reduce our valuation allowance against deferred tax assets. If evidence in future periods changes such that it is more likely than not that part or all of the net deferred tax asset will be realized, we will reduce the valuation allowance at that time. Examples of factors that could affect our assessment are:
| • | A strong positive trend in our financial performance over consecutive quarters; |
| • | Taxable income reported in our federal tax return; |
| • | Significant forecasted taxable income; |
| • | Reduction in the uncertainty and volatility related to our CBVA results; and |
| • | A sustained average period of positive cumulative income after adjustments for permanent differences and noncontrolling interests. |
We will continue to evaluate our cumulative income/loss position and our income trend. If we determine that it is appropriate to reduce a valuation allowance in the future, it would result in an income tax benefit. At this time, we are unable to estimate if or when such a reduction may occur.
As of December 31, 2013, we have recognized $728.5 million deferred tax assets based on tax planning related to unrealized gains on investment assets. This tax planning strategy supports recognition of deferred tax assets, which have been provided on deductible temporary differences. Future changes, such as interest rate movements or an ownership change under Section 382 of the Internal Revenue Code (discussed below), can adversely impact this tax planning strategy. To the extent unrealized gains decrease or to the extent loss utilization is limited, the tax benefit will be reduced by increasing the tax valuation allowance.
The deferred tax valuation allowance was $2.8 billion and $3.0 billion as of December 31, 2013 and 2012, respectively. Pursuant to U.S. GAAP, we do not specifically identify the valuation allowance with individual categories. However, as of December 31, 2013, we estimate that approximately $1.0 billion, $31 million, $264 million, $190 million and $1.1 billion were related to federal net operating losses, non-life realized capital losses, non-life subgroup deferred amounts, life subgroup deferred amounts and SLDI related deferred amounts, respectively. The remaining balance was attributable to various items including state taxes, and other deferred tax assets. We also estimated that the deferred tax asset associated with life subgroup deferred amounts, as of December 31, 2013, was approximately $575 million, excluding the valuation allowance. As of December 31, 2012, we estimated that $1.0 billion, $43 million, $280 million, $640 million and $742 million of the valuation allowance were related to federal net operating losses, non-life realized capital losses, non-life subgroup deferred amounts, life subgroup deferred amounts and SLDI related deferred amounts, respectively. The remaining balance was attributable to various items including state taxes, and other deferred tax assets. We also estimated that the deferred tax asset associated with life subgroup deferred amounts, as of December 31, 2012, was approximately $640 million, excluding the valuation allowance.
-151-
Table of Contents
As of December 31, 2013, we had approximately $2.9 billion of federal NOLs and $88 million of capital loss carryforwards, which expire as follows (the deferred tax asset and offsetting valuation allowances, if any, are also presented). The life ordinary loss is an SLDI-related loss which is subject to certain restrictions.
| ($ in millions) | ||||||||||||||||||||
| Expiration | Life Ordinary Loss |
Non-Life Ordinary Losses |
Life Capital Losses |
Non-Life Capital Losses |
Total Carryforward |
|||||||||||||||
| 2014 |
$ | — | $ | — | $ | — | $ | (41.0 | ) | $ | (41.0 | ) | ||||||||
| 2015 |
— | — | — | (7.6 | ) | (7.6 | ) | |||||||||||||
| 2016 |
— | — | — | (0.1 | ) | (0.1 | ) | |||||||||||||
| 2017 |
— | (3.2 | ) | — | (30.6 | ) | (33.8 | ) | ||||||||||||
| 2018 |
— | (5.3 | ) | — | (9.0 | ) | (14.3 | ) | ||||||||||||
| 2019 |
— | (8.2 | ) | — | — | (8.2 | ) | |||||||||||||
| 2020 |
— | (24.9 | ) | — | — | (24.9 | ) | |||||||||||||
| 2021 |
— | (36.4 | ) | — | — | (36.4 | ) | |||||||||||||
| 2022 |
— | (7.2 | ) | — | — | (7.2 | ) | |||||||||||||
| 2023 |
— | (89.4 | ) | — | — | (89.4 | ) | |||||||||||||
| 2024 |
— | — | — | — | — | |||||||||||||||
| 2025 |
— | (510.1 | ) | — | — | (510.1 | ) | |||||||||||||
| 2026 |
— | (355.0 | ) | — | — | (355.0 | ) | |||||||||||||
| 2027 |
— | (168.4 | ) | — | — | (168.4 | ) | |||||||||||||
| 2028 |
(331.1 | ) | (214.2 | ) | — | — | (545.3 | ) | ||||||||||||
| 2029 |
— | (411.5 | ) | — | — | (411.5 | ) | |||||||||||||
| 2030 |
— | (379.2 | ) | — | — | (379.2 | ) | |||||||||||||
| 2031 |
— | (59.4 | ) | — | — | (59.4 | ) | |||||||||||||
| 2032 |
— | (131.8 | ) | — | — | (131.8 | ) | |||||||||||||
| 2033 |
— | (136.2 | ) | — | — | (136.2 | ) | |||||||||||||
|
|
|
|
|
|
|
|
|
|
|
|||||||||||
| Total losses |
$ | (331.1 | ) | $ | (2,540.4 | ) | $ | — | $ | (88.3 | ) | $ | (2,959.8 | ) | ||||||
|
|
|
|
|
|
|
|
|
|
|
|||||||||||
| Gross deferred tax asset |
$ | 115.9 | $ | 889.1 | $ | — | $ | 30.9 | $ | 1,035.9 | ||||||||||
| Valuation allowance |
115.9 | 889.1 | — | 30.9 | 1,035.9 | |||||||||||||||
|
|
|
|
|
|
|
|
|
|
|
|||||||||||
| Deferred tax asset on losses |
$ | — | $ | — | $ | — | $ | — | $ | — | ||||||||||
|
|
|
|
|
|
|
|
|
|
|
|||||||||||
The current level of and assumptions related to the valuation allowances have implications for our future tax provisions. First, to the extent we have future U.S. GAAP losses before income taxes, additional valuation allowances will most likely be provided to offset the majority of the deferred tax assets created. Second, to the extent we have future U.S. GAAP income before income taxes, valuation allowances will most likely be released in the near term to offset the majority of the deferred tax liabilities created. Third, to the extent income is sustained for a period of time in the future, we may be able to consider future taxable income to support deferred tax assets. This may result in a release of significant valuation allowances. These changes in the valuation allowance could have a significant impact on earnings in the future.
Section 382 imposes limitations on a corporation’s ability to use its NOLs when we undergo an ownership change (see “Risk Factors—Risks Related to Our Business—General—We expect that our ability to use beneficial U.S. tax attributes will be subject to limitations following the completion of this offering and the Direct Share Buyback”). As of December 31, 2013 and 2012, we did not record a valuation allowance giving specific consideration to a Section 382 ownership change event because the ultimate divestiture by ING Group of its interest in the Company has not occurred. Following the completion of this offering and the Direct Share Buyback, however, we believe that a Section 382 ownership change event will have occurred. If such an event does in fact occur, or if ING Group were to otherwise divest its interest in the Company in a manner such that Section 382 does apply, additional valuation allowances may be required. We are uncertain as to the ultimate financial impact of a reduction of the deferred tax asset resulting from an ownership change.
-152-
Table of Contents
Also, should we have a Section 382 ownership change, using information available as of December 31, 2013, we estimate that the deferred tax asset that would potentially be subject to an additional valuation allowance was approximately $315 million to $350 million (mainly as a result of built-in losses), which could change following the final Section 382 calculations. Under statutory accounting, a Section 382 event could reduce the admitted deferred tax asset by approximately $39 million if measured as of December 31, 2013.
However, using the estimated Section 382 value of the Company based on the share price of $35.15 per share as of December 31, 2013, we estimate that it is unlikely that the deferred tax asset, the tax valuation allowance or the admitted deferred tax asset will change as a result of the Section 382 event. This estimate may change because the computation is dependent on several factors and because numerous aspects of the application of Section 382 are subject to potential challenge by the U.S. Internal Revenue Service. The actual impact on the valuation allowance is dependent mainly on the level of the unrealized capital gains and losses at the time of the ownership change, the calculated Section 382 limitation, the estimated reversal pattern of the capital losses supported by tax planning strategies, the estimated reversal pattern of the unrealized capital gains comprising the tax planning strategies and the estimated reversal pattern of the unrealized capital. The actual impact may be materially different from this estimate. The amounts described above are based solely on data and assumptions as of December 31, 2013.
Tax Contingencies
In establishing unrecognized tax benefits, we determine whether a tax position is more likely than not to be sustained under examination by the appropriate taxing authority. We also consider positions which have been reviewed and agreed to as part of an examination by the appropriate taxing authority. Tax positions that do not meet the more likely than not standard are not recognized. Tax positions that meet this standard are recognized in our Consolidated Financial Statements. We measure the tax position as the largest amount of benefit that is greater than 50% likely of being realized upon ultimate resolution with a taxing authority that has full knowledge of all relevant information.
Changes in Law
Certain changes or future events, such as changes in tax legislation, geographic mix of earnings, completion of tax audits, planning opportunities and expectations about future outcomes could have an impact on our estimates of valuation allowances, deferred taxes, tax provisions, and effective tax rates.
For example, a reduction in the corporate tax rate would most likely result in a tax expense based on the fact that, as of December 31, 2013, we have a deferred tax asset. Conversely, an increase in the corporate tax rate would most likely result in an additional tax benefit.
Contingencies
A loss contingency is an existing condition, situation or set of circumstances involving uncertainty as to possible loss that will ultimately be resolved when one or more future events occur or fail to occur. Examples of loss contingencies include pending or threatened adverse litigation, threat of expropriation of assets and actual or possible claims and assessments. Amounts related to loss contingencies involve considerable judgments and are accrued if it is probable that a loss has been incurred and the amount can be reasonably estimated. Reserves are established reflecting management’s best estimate, reviewed on a quarterly basis and revised as additional information becomes available. When a loss contingency is reasonably possible, but not probable, disclosure is made of our best estimate of possible loss, or the range of possible loss, or a statement is made that such an estimate cannot be made.
We are involved in threatened or pending lawsuits/arbitrations arising from the normal conduct of business. Due to the climate in insurance and business litigation/arbitration, suits against us sometimes include claims for substantial compensatory, consequential or punitive damages and other types of relief. Moreover, certain claims are asserted as class actions, purporting to represent a group of similarly situated individuals. It is not always possible to accurately estimate the outcome of such lawsuits/arbitrations. Therefore, changes to such estimates could be material. As facts and circumstances change, our estimates are revised accordingly. Our reserves reflect management’s best estimate of the ultimate resolution.
-153-
Table of Contents
Employee Benefits Plans
We sponsor defined benefit pension and other postretirement benefit plans covering eligible employees, sales representatives, and other individuals. The net periodic benefit cost and projected benefit obligations are calculated based on assumptions such as the discount rate, rate of return on plan assets, rate of future compensation increases and health care cost trend rates. These assumptions require considerable judgment, are subject to considerable variability and are established using our best estimate. Actual results could vary significantly from assumptions based on changes such as economic and market conditions, demographics of participants in the plans and amendments to benefits provided under the plans. Differences between the expected return and the actual return on plan assets and all other actuarial changes, which could be significant, are immediately recognized in the Consolidated Statements of Operations.
Beginning January 1, 2012, the ING U.S. Retirement Plan (the “Retirement Plan”) began using a cash balance pension formula instead of a final average pay (“FAP”) formula, allowing all eligible employees to participate in the Retirement Plan. Participants will earn an annual credit equal to 4% of eligible compensation. The accrued vested cash balance benefit is portable; participants can take it when they leave the Company’s employ. For participants in the Retirement Plan as of December 31, 2011, there was a two-year transition period from the Retirement Plan’s current FAP formula to the cash balance pension formula. The impact of the change in the Retirement Plan was recognized upon Board approval on November 10, 2011, resulting in an $83.6 million decrease to the benefit obligation.
Sensitivity
The discount rate and expected rate of return assumptions relating to our defined benefit pension and other postretirement benefit plans have historically had the most significant effect on our net periodic benefit costs and the projected and accumulated projected benefit obligations associated with these plans.
The discount rate is based upon current market information provided by plan actuaries. The discount rate modeling process involves selecting a portfolio of high quality, non-callable bonds that will match the cash flows of the Retirement Plan. The weighted average discount rate in 2013 for the net periodic benefit cost and benefit obligation was 4.05% and 4.95%, respectively.
As of December 31, 2013, the sensitivities of the effect of an increase or decrease in the discount rate are as presented below:
| ($ in millions) | Increase (Decrease)
in Net Periodic Benefit Cost-Pension Plans(1) |
Increase (Decrease) in Net Periodic Benefit Cost-Other Postretirement Benefits(1) |
||||||
| Increase in discount rate by 100 basis points |
$ | (263.6 | ) | $ | (2.2 | ) | ||
| Decrease in discount rate by 100 basis points |
304.2 | 2.5 | ||||||
| (1) | Represents the estimate of actuarial gains (losses) which would be recognized immediately through operating expenses. |
| ($ in millions) | Increase (Decrease)
in Pension Benefit Obligation |
Increase (Decrease)
in Accumulated Postretirement Benefit Obligation |
||||||
| Increase in discount rate by 100 basis points |
$ | (263.6 | ) | $ | (2.2 | ) | ||
| Decrease in discount rate by 100 basis points |
304.2 | 2.5 | ||||||
-154-
Table of Contents
The expected rate of return considers the asset allocation, historical returns on the types of assets held and current economic environment. Based on these factors, we expect that the assets will earn an average percentage per year over the long term. This estimation is based on an active return on a compound basis, with a reduction for administrative expenses and manager fees paid to non-affiliated companies from the assets. For estimation purposes, we assume the long-term asset mix will be consistent with the current mix. Changes on the asset mix could impact the amount of recorded pension income or expense, the funded status of the Retirement Plan and the need for future cash contributions.
The expected rate of return for 2013 was 7.5% (net of expenses) for the Retirement Plan. The expected rate of return assumption is only applicable to this plan as assets are not held by any of the other pension and other postretirement plans.
As of December 31, 2013, the effect of an increase or decrease in the actual rate of return on the net periodic benefit cost is presented in the table below:
| ($ in millions) | Increase (Decrease) in Net Periodic Benefit Cost-Pension Plans(1) |
|||
| Increase in actual rate of return by 100 basis points |
$ | (13.5 | ) | |
| Decrease in actual rate of return by 100 basis points |
13.5 | |||
| (1) | Represents the estimate of actuarial gains (losses) which would be recognized immediately through operating expenses. |
For more information related to our employee benefit plans, see “Note 13. Employee Benefit Arrangements.”
Impact of New Accounting Pronouncements
For information regarding the impact of new accounting pronouncements, see “Note 1. Business, Basis of Presentation and Significant Accounting Policies.”
| Quantitative | and Qualitative Disclosures About Market Risk |
Market risk is the risk that our consolidated financial position and results of operations will be affected by fluctuations in the value of financial instruments. We have significant holdings in financial instruments and are naturally exposed to a variety of market risks. The main market risks we are exposed to include credit risk, interest rate risk and equity market price risk. We do not have material market risk exposure to “trading” activities in our Consolidated Financial Statements.
Risk Management
As a financial services company active in Retirement, Investment Management and Insurance, taking measured risks is part of our business. As part of our effort to ensure measured risk taking, we have integrated risk management in our daily business activities and strategic planning.
We place a high priority on risk management and risk control. We have comprehensive risk management and control procedures in place at all levels and have established a dedicated risk management function with responsibility for the formulation of our risk appetite, strategies, policies and limits. The risk management function is also responsible for monitoring our overall market risk exposures and provides review, oversight and support functions on risk-related issues.
-155-
Table of Contents
Our risk appetite is aligned with how our businesses are managed and anticipates future regulatory developments. In particular, our risk appetite is aligned with regulatory capital requirements applicable to our regulated insurance subsidiaries as well as metrics that are aligned with various ratings agency models.
Our risk governance and control systems enable us to identify, control, monitor and aggregate risks and provide assurance that risks are being measured, monitored and reported adequately and effectively. To promote measured risk taking, we have integrated risk management with our business activities and strategic planning through a strategy to manage risk in accordance with the following three principles:
| 1. | Management of the businesses has primary responsibility for the day-to-day management of risk and forms the first line of defense. |
| 2. | The risk management function, both at the corporate and the business level, has the primary responsibility to align risk taking with strategic planning through risk tolerance and limit setting and forms the second line of defense. Risk managers in the businesses have direct reporting lines to the Chief Risk Officer (“CRO”). |
| 3. | The internal audit function provides an ongoing independent (i.e., outside of the risk organization) and objective assessment of the effectiveness of internal controls, including financial and operational risk management and forms the third line of defense. |
Our risk management is organized along a functional line comprising two levels within the organization: the corporate and business levels. The CRO heads the functional line, and each of the businesses has a similar function that reports to the CRO. This layered, functional approach is designed to promote consistent application of guidelines and procedures, regular reporting and appropriate communication vertically through the risk management function, as well as to provide ongoing support for the business. The scope, roles, responsibilities and authorities of the risk management function at different levels are described in an Insurance Risk Management Governance Framework to which all businesses must adhere.
Our Risk Committee discusses and approves all risk policies and reviews and approves risks associated with our activities. This includes volatility (affecting earnings and value), exposure (required capital and market risk) and insurance risks. Each business has an Asset-Liability Committee that reviews business specific risks and is governed by the Risk Committee.
We have implemented several limit structures to manage risk. Examples include, but are not limited to, the following:
| • | At-risk limits on sensitivities of earnings and regulatory capital to the capital markets provide the fundamental framework to manage capital markets risks including the risk of asset / liability mismatch; |
| • | Duration and convexity mismatch limits; |
| • | Credit risk concentration limits; |
| • | Mortality concentration limits; |
| • | Catastrophe and mortality exposure retention limits for our insurance risk; and |
| • | Investment and derivative guidelines. |
We manage our risk appetite based on two key risk metrics:
| • | Regulatory and Rating Agency Capital Sensitivities: the potential reduction, under a moderate capital markets stress scenario, of the excess of available statutory capital above the minimum required under the NAIC regulatory RBC methodology and of our targeted rating agency capital position; and |
| • | Earnings Sensitivities: the potential reduction in results of operations under a moderate capital markets stress scenario. Maintaining a consistent level of earnings helps us to finance our operations, support our capital requirements and provide funds to pay dividends to stockholders. |
-156-
Table of Contents
Our risk metrics cover the most important aspects in terms of performance measures where risk can materialize and are representative of the regulatory constraints to which our business is subject. The sensitivities for earnings and statutory capital are important metrics since they provide insight into the level of risk we take under ‘moderate stress’ scenarios. They also are the basis for internal risk management.
We are also subject to cash flow stress testing pursuant to regulatory requirements. This analysis measures the effect of changes in interest rate assumptions on asset and liability cash flows. The analysis includes the effects of:
| • | the timing and amount of redemptions and prepayments in our asset portfolio; |
| • | our derivative portfolio; |
| • | death benefits and other claims payable under the terms of our insurance products; |
| • | lapses and surrenders in our insurance products; |
| • | minimum interest guarantees in our insurance products; and |
| • | book value guarantees in our insurance products. |
We evaluate any shortfalls that our cash flow testing reveals and if needed increase statutory reserves or adjust portfolio management strategies.
Derivatives are financial instruments whose values are derived from interest rates, foreign currency exchange rates, financial indices, or other prices of securities or commodities. Derivatives include swaps, futures, options and forward contracts. Under U.S. insurance statutes, our insurance subsidiaries may use derivatives to hedge market values or cash flows of assets or liabilities; to replicate cash market instruments; and for certain limited income generating activities. Our insurance subsidiaries are generally prohibited from using derivatives for speculative purposes. References below to hedging and hedge programs refer to our process of reducing exposure to various risks. This does not mean that the process necessarily results in hedge accounting treatment for the respective derivative instruments. To qualify for hedge accounting treatment, a derivative must be highly effective in mitigating the designated risk of the hedged item and meet other specific requirements. Effectiveness of the hedge is assessed at inception and throughout the life of the hedging relationship. Even if a derivative qualifies for hedge accounting treatment, there may be an element of ineffectiveness of the hedge. The ineffective portion of a hedging relationship subject to hedge accounting is recognized in Net realized capital gains (losses) in the Consolidated Statements of Operations.
Market Risk Related to Interest Rates
We define interest rate risk as the risk of an economic loss due to adverse changes in interest rates. This risk arises from our holdings in interest sensitive assets and liabilities, primarily as a result of investing life insurance premiums, fixed annuity and guaranteed investment contract deposits received in interest-sensitive assets and carrying these funds as interest-sensitive liabilities. We are also subject to interest rate risk on our variable annuity business, stable value contracts and secondary guarantee universal life contracts. A sustained decline in interest rates or a prolonged period of low interest rates may subject us to higher cost of guaranteed benefits and increased hedging costs on those products that are being hedged. In a rising interest rate environment, we are exposed to the risk of financial disintermediation through a potential increase in the level of book value withdrawals on certain stable value contracts. Conversely, a steady increase in interest rates would tend to improve financial results due to reduced hedging costs, lower costs of guaranteed benefits and improvement to fixed margins.
We use product design, pricing and ALM strategies to reduce the adverse effects of interest rate movement. Product design and pricing strategies can include the use of surrender charges, withdrawal restrictions and the ability to reset credited interest rates. ALM strategies can include the use of derivatives and duration and
-157-
Table of Contents
convexity mismatch limits. See “Risk Factors—Risks Related to Our Business—General—The level of interest rates may adversely affect our profitability, particularly in the event of a continuation of the current low interest rate environment or a period of rapidly increasing interest rates”.
Derivatives strategies include the following:
| • | Guaranteed Minimum Contract Value Guarantees. For certain liability contracts, we provide the contract holder a guaranteed minimum contract value. These contracts include certain fixed annuities and other insurance liabilities. We purchase interest rate floors, swaps and swaptions to reduce risk associated with these liability guarantees. |
| • | Book Value Guarantees in Stable Value Contracts. For certain stable value contracts, the contract holder and participants may surrender the contract for the account value even if the market value of the asset portfolio is in an unrealized loss position. We purchase derivatives including interest rate caps, swaps and swaptions to reduce the risk associated with this type of guarantee. |
| • | Interest Risk Related to Variable Annuity Guaranteed Living Benefits. For Variable Annuity contracts with Guaranteed Living benefits, the contract holder may elect to receive income benefits over the remainder of their lifetime. We use derivatives such as interest rate swaps to hedge a portion of the interest rate risk associated with this type of guarantee. |
| • | Other Market Value and Cash Flow Hedges. We also use derivatives in general to hedge present or future changes in cash flows or market value changes in our assets and liabilities. We use derivatives such as interest rate swaps to specifically hedge interest rate risks associated with our CMO-B portfolio, see “Management’s Discussion and Analysis of Financial Condition and Results of Operations-Investments—CMO-B Portfolio.” |
-158-
Table of Contents
We assess interest rate exposures for financial assets, liabilities and derivatives using hypothetical test scenarios that assume either increasing or decreasing 100 basis point parallel shifts in the yield curve, reflecting changes in either credit spreads or risk-free rates. The following tables summarize the net estimated potential change in fair value from hypothetical 100 basis point upward and downward shifts in interest rates as of December 31, 2013 and 2012. While the test scenarios are for illustrative purposes only and do not reflect our expectations regarding future interest rates or the performance of fixed-income markets, they are a near-term, reasonably possible hypothetical change that illustrates the potential impact of such events. These tests do not measure the change in value that could result from non-parallel shifts in the yield curve. As a result, the actual change in fair value from a 100 basis point change in interest rates could be different from that indicated by these calculations.
| As of December 31, 2013 | ||||||||||||||||
| Hypothetical Change in Fair Value(2) |
||||||||||||||||
| ($ in millions) | Notional | Fair Value(1) | + 100 Basis Points Yield Curve Shift |
—100 Basis Points Yield Curve Shift |
||||||||||||
| Financial assets with interest rate risk: |
||||||||||||||||
| Fixed maturity securities, including securities pledged |
$ | — | $ | 72,718.8 | $ | (4,665.0 | ) | $ | 4,959.1 | |||||||
| Commercial mortgage and other loans |
— | 9,404.7 | (422.4 | ) | 426.7 | |||||||||||
| Derivatives: |
||||||||||||||||
| Interest rate swaps, caps, forwards |
64,781.5 | (327.5 | ) | (296.4 | ) | 524.9 | ||||||||||
| Financial liabilities with interest rate risk: |
||||||||||||||||
| Investment contracts: |
||||||||||||||||
| Funding agreements without fixed maturities and deferred annuities(3) |
— | 53,713.8 | (3,259.1 | ) | 4,071.3 | |||||||||||
| Funding agreements with fixed maturities and GICs |
— | 2,663.9 | (95.0 | ) | 96.2 | |||||||||||
| Supplementary contracts and immediate annuities |
— | 3,567.3 | (191.7 | ) | 217.0 | |||||||||||
| Long-term debt |
— | 3,717.8 | (256.8 | ) | 288.7 | |||||||||||
| Embedded derivatives on reinsurance |
— | 79.0 | (69.1 | ) | 71.6 | |||||||||||
| Guaranteed benefit derivatives(3): |
||||||||||||||||
| FIA |
— | 1,736.7 | (97.3 | ) | 101.7 | |||||||||||
| GMAB / GMWB / GMWBL |
— | 908.9 | (621.4 | ) | 820.5 | |||||||||||
| Stabilizer and MCGs |
— | — | 2.0 | 55.0 | ||||||||||||
| (1) | Separate account assets and liabilities which are interest sensitive are not included herein as any interest rate risk is borne by the holder of separate account. |
| (2) | (Decreases) in assets or (decreases) in liabilities are presented in parentheses. Increases in assets or increases in liabilities are presented without parentheses. |
| (3) | Certain amounts included in Funding agreements without fixed maturities and deferred annuities section are also reflected within the Guaranteed benefit derivatives section of the tables above. |
-159-
Table of Contents
| As of December 31, 2012 | ||||||||||||||||
| Hypothetical Change in Fair Value(2) |
||||||||||||||||
| ($ in millions) | Notional | Fair Value(1) | + 100 Basis Points Yield Curve Shift |
—100 Basis Points Yield Curve Shift |
||||||||||||
| Financial assets with interest rate risk: |
||||||||||||||||
| Fixed maturity securities, including securities pledged |
$ | — | $ | 75,287.1 | $ | (4,884.4 | ) | $ | 4,724.7 | |||||||
| Commercial mortgage and other loans |
— | 8,954.8 | (349.2 | ) | 291.9 | |||||||||||
| Derivatives: |
||||||||||||||||
| Interest rate swaps, caps, forwards |
71,010.3 | 635.1 | (1,013.3 | ) | 1,283.0 | |||||||||||
| Financial liabilities with interest rate risk: |
||||||||||||||||
| Investment contracts: |
||||||||||||||||
| Funding agreements without fixed maturities and deferred annuities(3) |
— | 56,851.0 | (4,233.3 | ) | 5,237.7 | |||||||||||
| Funding agreements with fixed maturities and GICs |
— | 3,671.0 | (156.1 | ) | 162.4 | |||||||||||
| Supplementary contracts and immediate annuities |
— | 3,482.3 | (193.4 | ) | 221.3 | |||||||||||
| Long-term debt |
— | 3,386.2 | (131.9 | ) | 146.2 | |||||||||||
| Embedded derivatives on reinsurance |
— | 169.5 | (82.2 | ) | 80.4 | |||||||||||
| Guaranteed benefit derivatives(3): |
||||||||||||||||
| FIA |
— | 1,434.3 | (85.0 | ) | 85.0 | |||||||||||
| GMAB / GMWB / GMWBL |
— | 2,035.4 | (835.0 | ) | 1,050.0 | |||||||||||
| Stabilizer and MCGs |
— | 102.0 | (86.0 | ) | 130.0 | |||||||||||
| (1) | Separate account assets and liabilities which are interest sensitive are not included herein as any interest rate risk is borne by the holder of separate account. |
| (2) | (Decreases) in assets or (decreases) in liabilities are presented in parentheses. Increases in assets or increases in liabilities are presented without parentheses. |
| (3) | Certain amounts included in Funding agreements without fixed maturities and deferred annuities section are also reflected within the Guaranteed benefit derivatives section of the tables above. |
For certain liability contracts, we provide the contractholder a guaranteed minimum interest rate (“GMIR”). These contracts include fixed annuities and other insurance liabilities. We are required to pay these guaranteed minimum rates even if earnings on our investment portfolio decline, with a resulting investment margin compression negatively impacting earnings. Credited rates are set either quarterly or annually. See “Note 7. Guaranteed Benefits.”
-160-
Table of Contents
The following table summarizes detail on the differences between the interest rate being credited to contractholders as of December 31, 2013, and the respective GMIRs:
| Account Value (1) | ||||||||||||||||||||||||||||
| ($ in millions) | Excess of crediting rate over GMIR | |||||||||||||||||||||||||||
| At GMIR | Up to .50% Above GMIR |
0.51% - 1.00% Above GMIR |
1.01% - 1.50% Above GMIR |
1.51% - 2.00% Above GMIR |
More than 2.00% Above GMIR |
Total | ||||||||||||||||||||||
| Guaranteed minimum interest rate: |
||||||||||||||||||||||||||||
| Up to 1.00% |
$ | 1,075.9 | $ | 967.8 | $ | 744.7 | $ | 627.6 | $ | 279.0 | $ | 208.4 | $ | 3,903.4 | ||||||||||||||
| 1.01% - 2.00% |
1,497.7 | 950.7 | 548.2 | 361.8 | 142.5 | 823.4 | 4,324.3 | |||||||||||||||||||||
| 2.01% - 3.00% |
19,014.2 | 841.4 | 404.8 | 494.8 | 132.1 | 103.1 | 20,990.4 | |||||||||||||||||||||
| 3.01% - 4.00% |
11,761.2 | 1,109.2 | 1,043.1 | 2.3 | 0.6 | — | 13,916.4 | |||||||||||||||||||||
| 4.01% and Above |
3,054.2 | 117.5 | 0.4 | 0.7 | — | 1.4 | 3,174.2 | |||||||||||||||||||||
| Renewable beyond 12 months |
2,323.3 | — | — | — | — | — | 2,323.3 | |||||||||||||||||||||
|
|
|
|
|
|
|
|
|
|
|
|
|
|
|
|||||||||||||||
| Total discretionary rate setting products |
$ | 38,726.5 | $ | 3,986.6 | $ | 2,741.2 | $ | 1,487.2 | $ | 554.2 | $ | 1,136.3 | $ | 48,632.0 | ||||||||||||||
|
|
|
|
|
|
|
|
|
|
|
|
|
|
|
|||||||||||||||
| Percentage of Total |
79.6 | % | 8.2 | % | 5.7 | % | 3.1 | % | 1.1 | % | 2.3 | % | 100.0 | % | ||||||||||||||
| (1) | Includes only the account values for investment spread products with GMIRs and discretionary crediting rates, net of policy loans. In addition, excludes the following: Stabilizer products, which is a fee based product and the account value of FIA products for which the crediting rate is based on market indexed strategies. |
| (2) | Represents MYGAs contracts with renewal dates after December 31, 2014 on which we are required to credit interest above the contractual GMIR for at least the next year. |
Market Risk Related to Equity Market Prices
Our variable products, FIA products and general account equity securities are significantly influenced by global equity markets. Increases or decreases in equity markets impact certain assets and liabilities related to our variable products and our earnings derived from those products. Our variable products include variable annuity contracts and variable life insurance.
We assess equity risk exposures for financial assets, liabilities and derivatives using hypothetical test scenarios that assume either an increase or decrease of 10% in all equity market benchmark levels. The following tables summarize the net estimated potential change in fair value from an instantaneous increase and decrease in all equity market benchmark levels of 10% as of December 31, 2013 and 2012. In calculating these amounts, we exclude separate account equity securities related to products for which the investment risk is borne primarily by the separate account contract holder rather than by us. While the test scenarios are for illustrative purposes only and do not reflect our expectations regarding the future performance of equity markets, they are near-term, reasonably possible hypothetical changes that illustrate the potential impact of such events. These scenarios consider only the direct effect on fair value of declines in equity benchmark market levels and not changes in asset-based fees recognized as revenue, changes in our estimates of total gross profits used as a basis for amortizing DAC/VOBA, other intangibles and other costs, or changes in any other assumptions such as market volatility or mortality, utilization or persistency rates in variable contracts that could also impact the fair value of our living benefits features. In addition, these scenarios do not reflect the effect of basis risk, such as potential differences in the performance of the investment funds underlying the variable annuity products relative to the equity market benchmark we use as a basis for developing our hedging strategy. The impact of basis risk could result in larger differences between the change in fair value of the equity-based derivatives and the related living benefit features, in comparison to the hypothetical test scenarios.
-161-
Table of Contents
| As of December 31, 2013 | ||||||||||||||||
| Hypothetical Change in Fair Value(1) |
||||||||||||||||
| ($ in millions) | Notional | Fair Value |
+10% Equity Shock |
-10% Equity Shock |
||||||||||||
| Financial assets with equity market risk: |
||||||||||||||||
| Equity securities, available for sale |
$ | — | $ | 314.4 | $ | 22.9 | $ | (22.9 | ) | |||||||
| Limited liability partnerships/corporations |
— | 236.4 | 14.2 | (14.2 | ) | |||||||||||
| Derivatives: |
||||||||||||||||
| Equity futures and total return swaps(2) |
8,262.9 | (44.4 | ) | (711.8 | ) | 711.8 | ||||||||||
| Equity options |
3,463.0 | 164.2 | 73.4 | (98.6 | ) | |||||||||||
| Financial liabilities with equity market risk: |
||||||||||||||||
| Guaranteed benefit derivatives: |
||||||||||||||||
| FIA |
— | 1,736.7 | 96.6 | (175.2 | ) | |||||||||||
| GMAB / GMWB/ GMWBL |
— | 908.9 | (171.6 | ) | 250.0 | |||||||||||
| (1) | (Decreases) in assets or (decreases) in liabilities are presented in parentheses. Increases in assets or increases in liabilities are presented without parentheses. |
| (2) | Primarily related to CBVA hedging programs. |
| As of December 31, 2012 | ||||||||||||||||
| Hypothetical Change in Fair Value(1) |
||||||||||||||||
| ($ in millions) | Notional | Fair Value |
+10% Equity Shock |
-10% Equity Shock |
||||||||||||
| Financial assets with equity market risk: |
||||||||||||||||
| Equity securities, available for sale |
$ | — | $ | 340.1 | $ | 33.0 | $ | (33.0 | ) | |||||||
| Limited liability partnerships/corporations |
— | 465.1 | 27.9 | (27.9 | ) | |||||||||||
| Derivatives: |
||||||||||||||||
| Equity futures and total return swaps(2) |
11,766.6 | (200.0 | ) | (1,176.7 | ) | 1,176.7 | ||||||||||
| Equity options |
3,123.8 | 68.3 | 40.2 | (19.7 | ) | |||||||||||
| Financial liabilities with equity market risk: |
||||||||||||||||
| Guaranteed benefit derivatives: |
||||||||||||||||
| FIA |
— | 1,434.3 | 108.0 | (158.0 | ) | |||||||||||
| GMAB / GMWB/ GMWBL |
— | 2,035.4 | (296.0 | ) | 373.0 | |||||||||||
| (1) | (Decreases) in assets or (decreases) in liabilities are presented in parentheses. Increases in assets or increases in liabilities are presented without parentheses. |
| (2) | Primarily related to CBVA hedging programs. |
Market Risk Related to Closed Block Variable Annuity
NAR
The NAR for GMDB, GMAB and GMWB is equal to the guaranteed value of these benefits in excess of the account values in each case as of the date indicated. The NAR assumes utilization of benefits by all customers as of the date indicated.
The NAR for GMIB and GMWBL is equal to the excess of the present value of the minimum guaranteed annuity payments available to the contract owner over the current account value. It assumes that all policyholders exercise their benefit immediately, even if they have not yet attained the first exercise date shown in their
-162-
Table of Contents
contracts, and that there are no future lapses. The NAR assumes utilization of benefits by all customers as of the date indicated. This hypothetical immediate exercise of the benefit means that the customers give up any future increase in the guaranteed benefit that might accrue if they were to delay exercise to a later date. The discount rates used in the GMIB NAR methodology grade from current U.S. Treasury rates to long-term best estimates over ten years. The GMWBL NAR methodology uses current swap rates. The discounting for GMWBL and GMIB NAR was developed to be consistent with the methodology for the establishment of U.S. GAAP reserves.
For GMIB products, in general, the policyholder has the right to elect income payment, beginning (for certain products) on the tenth anniversary year of product commencement, receive lump sum payment of the then current cash value, or remain in the variable sub-account. For GMIB products, if the policyholder makes the election to annuitize, the policyholder is entitled to receive the guaranteed benefit amount over an annuitization period. A small percentage of the products were first eligible to elect annuitizations beginning in 2010 and 2011. The remainder of the products become eligible to elect annuitization from 2012 to 2020, with the majority of first eligibility dates in the period from 2014 through 2016. Many of these contracts contain significant incentives to delay annuitization past first eligibility.
Because policyholders have various contractual rights and significant incentives to defer their annuitization election, the period over which annuitization election will take place is subject to policyholder behavior and therefore indeterminate. In addition, upon annuitization the contract holder surrenders access to the account value and the account value is transferred to the Company’s general account where it is invested and the additional investment proceeds are used towards payment of the guaranteed benefit payment.
Similarly, most of our GMWBL contracts are still in the first four to six policy years, so our assumptions for withdrawal from contracts with GMWBL benefits may change as experience emerges. In addition, like our GMIB contracts, many of our GMWBL contracts contain significant incentives to delay withdrawal. We expect customer decisions on annuitization and withdrawal will be influenced by customers’ financial plans and needs as well as by interest rate and market conditions over time and by the availability and features of competing products. If emerging experience deviates from our assumptions on either GMIB annuitization or GMWBL withdrawal, we could experience gains or losses and a significant decrease or increase to reserve and capital requirements.
The account values and NAR, both gross and net of reinsurance (“retained NAR”), of contract owners by type of minimum guaranteed benefit for retail variable annuity contracts are summarized below as of December 31, 2013.
| As of December 31, 2013 | ||||||||||||||||||||
| ($ in millions, unless otherwise indicated) | Account Value(1) |
Gross NAR | Retained NAR | % Contracts
NAR In-the-Money(2) |
% NAR In-the-Money(3) |
|||||||||||||||
| GMDB |
$ | 44,740 | $ | 5,702 | $ | 5,074 | 40 | % | 26 | % | ||||||||||
|
|
|
|
|
|
|
|
|
|
|
|||||||||||
| Living Benefit |
||||||||||||||||||||
| GMIB |
$ | 15,909 | $ | 1,682 | $ | 1,682 | 62 | % | 15 | % | ||||||||||
| GMWBL |
16,537 | 452 | 452 | 24 | % | 12 | % | |||||||||||||
| GMAB/GMWB |
943 | 20 | 20 | 12 | % | 18 | % | |||||||||||||
|
|
|
|
|
|
|
|
|
|
|
|||||||||||
| Living Benefit Total |
$ | 33,389 | $ | 2,154 | $ | 2,154 | 44 | %(4) | 14 | %(5) | ||||||||||
|
|
|
|
|
|
|
|
|
|
|
|||||||||||
| (1) | Account value excludes $959.0 million of Payout, Policy Loan and life insurance business which is included in consolidated account values. |
| (2) | Percentage of contracts that have a NAR greater than zero. |
| (3) | For contracts with a NAR greater than zero, % NAR In-the-Money is defined as NAR/(NAR + Account Value). |
| (4) | Total Living Benefit % Contracts NAR In-the-Money as of December 31, 2012 was 72%. |
| (5) | Total Living Benefit % NAR In-the-Money as of December 31, 2012 was 20%. |
-163-
Table of Contents
As of the date indicated above, compared to $2.2 billion of NAR, we held gross statutory reserves before reinsurance of $2.4 billion for living benefit guarantees; of this amount, $2.3 billion was ceded to SLDI, supported by assets in trust. However, NAR and statutory reserves are not directly comparable measures. Our U.S. GAAP reserves for living benefit guarantees were $2.0 billion as of December 31, 2013.
For a discussion of our U.S. GAAP reserves calculation methodology, see “Note 1. Business, Basis of Presentation and Significant Accounting Policies—Future Policy Benefits and Contract Owner Accounts.”
Variable Annuity Hedge Program
Variable Annuity Guarantee Hedge Program
We primarily mitigate CBVA market risk exposures through hedging. Market risk arises primarily from the minimum guarantees within the CBVA products, whose economic costs are primarily dependent on future equity market returns, interest rate levels, equity volatility levels and policyholder behavior. The Variable Annuity Guarantee Hedge Program is used to mitigate our exposure to equity market and interest rate changes and seeks to ensure that the required assets are available to satisfy future death benefit and living benefit obligations. While the Variable Annuity Guarantee Hedge Program does not explicitly hedge statutory or U.S. GAAP reserves, as markets move up or down, in aggregate the returns generated by the Variable Annuity Guarantee Hedge Program will significantly offset the statutory and U.S. GAAP reserve changes due to market movements.
The objective of the Variable Annuity Guarantee Hedge Program is to offset changes in equity market returns for most minimum guaranteed death benefits and all guaranteed living benefits, while also providing interest rate protection for certain minimum guaranteed living benefits. We hedge the equity market exposure using a hedge target set using market consistent valuation techniques for all guaranteed living benefits and most death benefits. We also hedge a portion of the interest rate risk in our GMWB/GMAB/GMWBL blocks using a market consistent valuation hedge target. We do not hedge interest rate risks for our GMIB or GMDB primarily because doing so would result in volatility in our regulatory reserves and rating agency capital that exceeds our tolerances and, secondarily, because doing so would produce additional volatility in our U.S. GAAP financial statements. These hedge targets may change over time with market movements, changes in regulatory and rating agency capital, available collateral and our risk tolerance. For example, during 2013, we reduced the amount of interest rate hedging for the GMWB/GMAB/GMWBL blocks to refine the impact of interest rate movements on regulatory and rating agency capital.
Equity index futures on various equity indices are used to mitigate the risk of the change in value of the policyholder-directed separate account funds underlying the CBVA contracts with minimum guarantees. A dynamic trading program is utilized to seek replication of the performance of targeted fund groups (i.e. the fund groups that can be covered by indices where liquid futures markets exist).
Total return swaps are also used to mitigate the risk of the change in value of certain policyholder directed separate account funds. These include fund classes such as emerging markets and real estate. They may also be used instead of futures of more liquid indices where it may be deemed advantageous. This hedging strategy is employed at our discretion based on current risk exposures and related transaction costs.
Interest rate swaps are used to match a portion of the hedge targets on GMWB/GMAB/GMWBL as described above.
Variance swaps and equity options are used to mitigate the impact of changes in equity volatility on the economic liabilities associated with certain minimum guaranteed living benefits. This program began in the second quarter of 2012.
Foreign exchange forwards are used to mitigate the impact of policyholder-directed investments in international funds with exposure to fluctuations in exchange rates of certain foreign currencies. Rebalancing is performed based on pre-determined notional exposures to the specific currencies.
-164-
Table of Contents
Variable Annuity Capital Hedge Overlay Program
CBVA guaranteed benefits are hedged based on their economic or fair value; however, the statutory reserves and rating agency required assets are not based on a market value. When equity markets decrease, the statutory reserve and rating agency required assets for the CBVA guaranteed benefits can increase more quickly than the value of the derivatives held under the Variable Annuity Guarantee Hedge Program. This causes regulatory reserves to increase and rating agency capital to decrease. The CHO program is intended to mitigate equity risk to the regulatory and rating agency capital of the Company. The hedge is executed through the purchase and sale of equity index derivatives and is designed to limit the uncovered reserve and rating agency capital increases in an immediate down equity market scenario to an amount we believe prudent for a company of our size and scale. This amount will change over time with market movements, changes in regulatory and rating agency capital, available collateral and our risk tolerance.
The following table summarizes the estimated net impacts to funding our regulatory reserves to our CBVA segment, after giving effect to our CHO program and the Variable Annuity Guarantee Hedge Program for various shocks in equity markets and interest rates. This reflects the hedging we had in place as well as any collateral (in the form of LOC) or change in underlying asset values that would be used to achieve credit for reinsurance for the segment of liabilities reinsured to our Arizona captive at the close of business on December 31, 2013 in light of our determination of risk tolerance and available collateral at that time, which, as noted above, we assess periodically.
| As of December 31, 2013 | ||||||||||||||||||||||||||||||||
| ($ in millions) | Equity Market (S&P 500) | Interest Rates | ||||||||||||||||||||||||||||||
| -25% | -15% | -5% | +5% | +15% | +25% | -1% | +1% | |||||||||||||||||||||||||
| Decrease/(increase) in regulatory reserves |
$ | (3,800 | ) | $ | (2,150 | ) | $ | (550 | ) | $ | 600 | $ | 1,300 | $ | 1,800 | $ | (800 | ) | $ | 50 | ||||||||||||
| Hedge gain/(loss) immediate impact |
2,700 | 1,350 | 350 | (400 | ) | (1,050 | ) | (1,500 | ) | 550 | (450 | ) | ||||||||||||||||||||
| Increase/(decrease) in Market Value of Assets |
— | — | — | — | — | — | 300 | (300 | ) | |||||||||||||||||||||||
| Increase/(decrease) in LOCs |
1,100 | 800 | 250 | — | — | — | — | 650 | ||||||||||||||||||||||||
|
|
|
|
|
|
|
|
|
|
|
|
|
|
|
|
|
|||||||||||||||||
| Net impact |
$ | — | $ | — | $ | 50 | $ | 200 | $ | 250 | $ | 300 | $ | 50 | $ | (50 | ) | |||||||||||||||
The foregoing sensitivities illustrate the estimated impact of the indicated shocks beginning on the first market trading day following December 31, 2013 and give effect to rebalancing over the course of the shock event. The estimates of equity market shocks reflect a shock to all equity markets, domestic and global, of the same magnitude. The estimates of interest rate shocks reflect a shock to rates at all durations (a “parallel” shift in the yield curve). Decrease / (increase) in regulatory reserves includes statutory reserves for policyholder account balances, AG43 reserves and additional cash flow testing reserves related to the CBVA segment. Hedge Gain / (Loss) includes both the Variable Annuity Guarantee Hedge Program and the CHO program and assumes that hedge positions can be rebalanced during the market shock and that the performance of the derivative contracts reasonably matches the performance of the contract owners’ variable fund returns. Increase / (decrease) in LOCs indicates the change in the amount of LOCs used to provide credit for reinsurance at those times when the assets backing the reinsurance liabilities may be less than the statutory reserve requirement. As of December 31, 2013 the amount of available LOCs was approximately $1.2 billion. Increase / (decrease) in Market Value of Assets is the estimated potential change in market value of assets supporting the segment of liabilities reinsured to our Arizona captive from 100 basis point upward and downward shifts in interest rates.
Results of an actual shock to equity markets or interest rates will differ from the above illustration for reasons such as variance in market volatility versus what is assumed, “basis risk” (differences in the performance of the derivative contracts versus the contract owner variable fund returns), equity shocks not occurring uniformly across all equity markets, combined effects of interest rates and equities, additional impacts from rebalancing of hedges and/or the effects of time and changes in assumptions or methodology that affect reserves or hedge targets. Additionally, estimated net impact sensitivities vary over time as the market and closed book of
-165-
Table of Contents
business evolve or if assumptions or methodologies that affect reserves or hedge targets are refined. In February 2014, we purchased equity indexed options in our CHO program and refined the impact of equity movements on regulatory and rating agency capital to up-market scenarios as a result.
As stated above, the primary focus of the hedge program is to protect regulatory and rating agency capital from equity market movements. Hedge ineffectiveness, along with other aspects not directly hedged (including unexpected policyholder behavior), may cause losses of regulatory or rating agency capital. Regulatory and rating agency capital requirements may move disproportionately (i.e., they may change by different amounts as market conditions and other factors change), and, therefore, could also cause our hedge program to not realize its key objective of protecting both regulatory and rating agency capital from equity market movements.
For ING USA, a wholly-owned subsidiary of the Company, our guarantee and overlay equity hedges resulted in a loss of approximately $2.5 billion for the year ended December 31, 2013, which was offset by the equity market decrease in AG43 reserves in excess of reserves for cash surrender value of approximately $3.4 billion for the year ended December 31, 2013. Changes in statutory reserves due to equity and equity hedges for ING USA include the effects of non-affiliated reinsurance for variable annuity policies, but exclude the effect of the affiliated reinsurance transaction associated with the GMIB and GMWBL riders. Substantially all of the CBVA business was written by ING USA. In addition to equity hedge results and change in reserves due to the impact of equity market movements, statutory income includes fee income, investment income and other income offset by benefit payments, operating expenses and other costs as well as impacts to reserves and hedges due to effects of time and other market factors.
As U.S. GAAP accounting differs from the methods used to determine regulatory reserves and rating agency capital requirements, our hedge programs may result in immediate impacts that may be lower or higher than the regulatory impacts illustrated above. The following table summarizes the estimated net impacts to U.S. GAAP earnings pre-tax in our CBVA segment, which is the sum of the increase or decrease in U.S. GAAP reserves and the hedge gain or loss from our CHO program and the Variable Annuity Guarantee Hedge Program for various shocks in both equity markets and interest rates. This reflects the hedging we had in place at the close of business on December 31, 2013 in light of our determination of risk tolerance at that time, which, as noted above, we assess periodically.
| As of December 31, 2013 | ||||||||||||||||||||||||||||||||
| ($ in millions) | Equity Market (S&P 500) | Interest Rates | ||||||||||||||||||||||||||||||
| -25% | -15% | -5% | +5% | +15% | +25% | -1% | +1% | |||||||||||||||||||||||||
| Total estimated earnings sensitivity |
$ | 850 | $ | 350 | $ | 100 | $ | (150 | ) | $ | (450 | ) | $ | (650 | ) | $ | (300 | ) | $ | 150 | ||||||||||||
The foregoing sensitivities illustrate the impact of the indicated shocks on the first market trading day following December 31, 2013 and give effect to dynamic rebalancing over the course of the shock events. The estimates of equity market shocks reflect a shock to all equity markets, domestic and global, of the same magnitude. The estimates of interest rate shocks reflect a shock to rates at all durations (a “parallel” shift in the yield curve). We regularly monitor and refine our hedge program targets in line with our primary goal of protecting regulatory and rating agency capital. It is possible that further changes to our hedge program will be made and those changes may either increase or decrease earnings sensitivity. Liabilities are based on U.S. GAAP reserves and embedded derivatives, with the latter excluding the effects of nonperformance risk. DAC is amortized on gross revenues, which will not be volatile, however, volatility could be driven by loss recognition. Hedge Gain / (Loss) impacting the above estimated earnings sensitivity includes both the Variable Annuity Guarantee Hedge Program and the CHO program and assumes that hedge positions can be rebalanced during the market shock and that the performance of the derivative contracts reasonably matches the performance of the contract owners’ variable fund returns.
Actual results will differ from the estimates above for reasons such as variance in market volatility versus what is assumed, “basis risk” (differences in the performance of the derivative contracts versus the contract owner variable fund returns), changes in non-performance spreads, equity shocks not occurring uniformly across
-166-
Table of Contents
all equity markets, combined effects of interest rates and equities, additional impacts from rebalancing of hedges, and/or the effects of time and changes in assumptions or methodology that affect reserves or hedge targets. Additionally, estimated net impact sensitivities vary over time as the market and closed block of business evolves, or if changes in assumptions or methodologies that affect reserves or hedge targets are refined. As the closed block of business evolves, actual net impacts are realized, or if changes are made to the target of the hedge program, the sensitivities may vary over time. Additionally, actual results will differ from the above due to issues such as basis risk, market volatility, changes in implied volatility, combined effects of interest rates and equities, rebalancing of hedges in the future, or the effects of time and other variations from the assumptions in the above table. In February 2014, we purchased equity indexed options in our CHO program and refined the impact of equity movements on regulatory and rating agency capital to up-market scenarios as a result.
Hedging of FIA Benefits
We mitigate FIA market risk exposures through a combination of capital market hedging, product design and capital management. For the FIA book of business, these risks stem from the minimum guaranteed contract value offered and the additional interest credits (Equity Participation or Interest Rate Participation) based on exposure to various stock market indices or the 3-month LIBOR. The minimum guarantees, interest rate and equity market exposures, are strongly dependent on capital markets and, to a lesser degree, policyholder behavior.
We mitigate this exposure in two ways. The primary way we hedge FIA equity exposure is to purchase OTC equity index call options from broker-dealer derivative counterparties who generally have a minimum credit rating of A3 from Moody’s and A- from S&P. The second way to hedge FIA equity exposure is by purchasing exchange traded equity index futures contracts.
Additionally, the credited rate mechanism for certain FIA contracts exposes us to changes in interest rate benchmarks. We mitigate this exposure by purchasing OTC interest rate swaptions from broker-dealer derivative counterparties who generally have a minimum credit rate of A3 from Moody’s and A- from S&P. For each broker-dealer counterparty, our derivative exposure to that counterparty is aggregated with any fixed income exposure to the same counterparty and is maintained within applicable limits.
These hedge programs are limited to the current policy term of the liabilities, based on current participation rates. Future returns, which may be reflected in FIA credited rates beyond the current policy term, are not hedged.
While the FIA hedge program does not explicitly hedge statutory or U.S. GAAP income volatility, the FIA hedge program tends to mitigate the statutory and U.S. GAAP reserve changes associated with movements in the equity market and 3-month LIBOR. This is due to the fact that a key component in the calculation of statutory and U.S. GAAP reserves is the market valuation of the current term embedded derivative. The risk management of the current term embedded derivative is the goal of the FIA hedging program. Due to the alignment of the embedded derivative reserve component with hedging of this same embedded derivative, there should be a match between changes in this component of the reserve and changes in the assets backing this component of the reserve. However, there may be an interim mismatch due to the fact that the hedges that are put in place are only intended to cover exposures expected to remain until the end of an indexing term (e.g. account value decrements during an indexing term associated with expected lapses and mortality are not hedged).
Call options are used to hedge against an increase in various equity indices. An increase in various equity indices may result in increased payments to contract holders of FIA contracts. The call options offset this increased expense.
Futures contracts are also used to hedge against an increase in certain equity indices. An increase in certain equity indices may result in increased payments to contract holders of fixed indexed annuity contracts. The futures contracts offset this increased expense.
-167-
Table of Contents
Interest rate swaptions are used to hedge against an increase in the interest rate benchmark (currently the 3-month LIBOR). An increase in the interest rate benchmark may result in increased payments to contract holders of FIA contracts. The interest rate swaptions offset this increased expense.
Market Risk Related to Credit Risk
Credit risk is primarily embedded in the general account portfolio. The carrying value of our fixed maturity and equity portfolio totaled $73.0 billion and $75.6 billion as of December 31, 2013 and 2012, respectively. Our credit risk materializes primarily as impairment losses. We are exposed to occasional cyclical economic downturns, during which impairment losses may be significantly higher than the long-term historical average. This is offset by years where we expect the actual impairment losses to be substantially lower than the long-term average.
Credit risk in the portfolio can also materialize as increased capital requirements as assets migrate into lower credit qualities over time. The effect of rating migration on our capital requirements is also dependent on the economic cycle and increased asset impairment levels may go hand in hand with increased asset related capital requirements.
We manage the risk of default and rating migration by applying disciplined credit evaluation and underwriting standards and prudently limiting allocations to lower quality, higher risk investments. In addition, we diversify our exposure by issuer and country, using rating based issuer and country limits. We also set investment constraints that limit our exposure by industry segment. To limit the impact that credit risk can have on earnings and capital adequacy levels, we have portfolio-level credit risk constraints in place. Limit compliance is monitored on a daily or, in some cases, monthly basis. Limit violations are reported to senior management and we are actively involved in decisions around curing such limit violations.
We also have credit risk related to the ability of our derivatives and reinsurance counterparties to honor their obligations to pay the contract amounts under various agreements. In order to minimize the risk of credit loss on such contracts, we diversify our exposures among several counterparties and limit the amount of exposure to each based on credit rating. For most counterparties, including the largest reinsurance counterparties, we have collateral agreements in place that would substantially limit our credit losses in case of a counterparty default. We also generally limit our selection of counterparties that we do new transactions with to those with an “A” credit rating or above. When exceptions are made to that principle, we ensure that we obtain collateral to mitigate our risk of loss. For derivatives counterparty risk exposures (which includes reverse repurchase and securities lending transactions), we measure and monitor our risks on a market value basis daily.
-168-
Table of Contents
We also have credit risk related to the ability of reinsurance counterparties to honor their obligations to pay the contract amounts under various agreements. To minimize the risk of credit loss on such contracts, we diversify our exposures among many reinsurers and limit the amount of exposure to each based on credit rating. In addition, most of our largest reinsurance counterparties are required under the various agreements to collateralize their obligations to us which would substantially limit our credit losses in case of a counterparty default. We also generally limit our selection of counterparties which we do new transactions to those with an “A” credit rating or above. When exceptions are made to that principle, we ensure that we obtain collateral to mitigate our risk of loss. The following table summarizes our reinsurance recoverable balances, collateral received and credit and financial strength ratings for our 10 largest reinsurance recoverable balances as of December 31, 2013:
| ($ in millions) | Financial Strength Rating |
Credit Rating | ||||||||||||||||||||||
| Parent Company/Principal Reinsurers |
Reinsurance Recoverable |
% Collateralized(1) |
S&P | Moody’s | S&P | Moody’s | ||||||||||||||||||
| Hannover RE Group |
$ | 2,411 | 100 | % | AA- | NR | ||||||||||||||||||
| Hannover Life Reassurance Co of America |
AA- | NR | ||||||||||||||||||||||
| Hannover Re (Ireland) plc |
AA- | NR | ||||||||||||||||||||||
| Lincoln National Corp |
2,037 | 98 | % | A- | Baa1 | |||||||||||||||||||
| Lincoln Life & Annuity Company of New York |
AA- | A1 | ||||||||||||||||||||||
| Lincoln National Life Insurance Co |
AA- | A1 | ||||||||||||||||||||||
| Prudential Plc (U.K.) |
567 | 70 | % | A+ | A2 | |||||||||||||||||||
| Jackson National Life Insurance Co |
AA | A1 | ||||||||||||||||||||||
| Reinsurance Group of America Inc |
384 | 47 | % | A- | Baa1 | |||||||||||||||||||
| RGA Reinsurance Company |
AA- | A1 | ||||||||||||||||||||||
| Scottish Re Group Ltd |
291 | 92 | % | NR | NR | |||||||||||||||||||
| Ballantyne Re Plc |
NR | NR | ||||||||||||||||||||||
| Scottish Re (US) Inc |
NR | NR | ||||||||||||||||||||||
| Scottish Re Life (Bermuda) Ltd |
NR | NR | ||||||||||||||||||||||
| Scottish Re Life Corp |
NR | NR | ||||||||||||||||||||||
| Swiss Re Ltd |
247 | 0 | % | AA- | Aa3 | |||||||||||||||||||
| Swiss Re Life & Health America Inc |
AA- | Aa3 | ||||||||||||||||||||||
| Westport Insurance Corp |
AA- | A1 | ||||||||||||||||||||||
| Assurant Inc |
170 | 6 | % | BBB+ | Baa2 | |||||||||||||||||||
| Union Security Insurance Co |
A- | A3 | ||||||||||||||||||||||
| Union Security Life Insurance Co of New York |
NR | NR | ||||||||||||||||||||||
| Aegon N.V. |
126 | 2 | % | A- | A3 | |||||||||||||||||||
| Transamerica Financial Life Insurance Co |
AA- | A1 | ||||||||||||||||||||||
| Transamerica Life Insurance Co |
AA- | A1 | ||||||||||||||||||||||
| SCOR SE |
76 | 12 | % | A+ | A1 | |||||||||||||||||||
| SCOR Global Life Re Insurance Company TX |
A+ | NR | ||||||||||||||||||||||
| SCOR Global Life Reinsurance Co. of America Inc. |
A+ | A1 | ||||||||||||||||||||||
| SCOR Global Life SE |
A+ | A1 | ||||||||||||||||||||||
| SCOR Rueckversicherung (Deutschland) AG |
NR | NR | ||||||||||||||||||||||
| Munich Re Group |
45 | 0 | % | AA- | Aa3 | |||||||||||||||||||
| Munich American Reassurance Co. |
AA- | NR | ||||||||||||||||||||||
| (1) | Collateral includes letters of credit, assets held in trust and funds withheld. |
-169-
Table of Contents
In the normal course of business, certain reinsurance recoverable are subject to reviews by the reinsurers. We are not aware of any material disputes arising from these reviews or other communications with the counterparties, and, therefore, as of December 31, 2013, no allowance for uncollectible amounts was recorded.
We also have credit risk related to the ability of our derivatives counterparties to honor their obligations to pay the contract amounts under various agreements. In order to minimize the risk of credit loss on such contracts, we diversify our exposures among several counterparties and limit the amount of exposure to each based on credit rating. For most counterparties, including the largest reinsurance counterparties, we have collateral agreements in place that would substantially limit our credit losses in case of a counterparty default. We also generally limit our selection of counterparties that we do new transactions with to those with an “A” credit rating or above. When exceptions are made to that principle, we ensure that we obtain collateral to mitigate our risk of loss. For derivatives counterparty risk exposures (which includes reverse repurchase and securities lending transactions), we measure and monitor our risks on a market value basis daily.
The following tables summarize the outstanding notional amount of derivatives by contract type as of December 31, 2013 and 2012:
| As of December 31, 2013 | ||||||||||||
| Derivative Notional Amounts | ||||||||||||
| ($ in millions) | Exchange Traded |
Over
The Counter (OTC) |
Total Notional |
|||||||||
| Type of Contract |
||||||||||||
| Credit Contracts |
$ | — | $ | 3,221.0 | $ | 3,221.0 | ||||||
| Equity Contracts |
7,212.4 | 4,513.5 | 11,725.9 | |||||||||
| Foreign Exchange Contracts |
— | 1,456.4 | 1,456.4 | |||||||||
| Interest Rate Contracts |
— | 64,781.5 | 64,781.5 | |||||||||
|
|
|
|
|
|
|
|||||||
| Total |
$ | 7,212.4 | $ | 73,972.4 | $ | 81,184.8 | ||||||
|
|
|
|
|
|
|
|||||||
| As of December 31, 2012 | ||||||||||||
| Derivative Notional Amounts | ||||||||||||
| ($ in millions) | Exchange Traded |
Over
The Counter (OTC) |
Total Notional |
|||||||||
| Type of Contract |
||||||||||||
| Credit Contracts |
$ | — | $ | 3,106.0 | $ | 3,106.0 | ||||||
| Equity Contracts |
10,923.4 | 3,967.0 | 14,890.4 | |||||||||
| Foreign Exchange Contracts |
— | 1,985.8 | 1,985.8 | |||||||||
| Interest Rate Contracts |
— | 71,010.3 | 71,010.3 | |||||||||
|
|
|
|
|
|
|
|||||||
| Total |
$ | 10,923.4 | $ | 80,069.1 | $ | 90,992.5 | ||||||
|
|
|
|
|
|
|
|||||||
-170-
Table of Contents
The following table summarizes our exposure by counterparty, including notional amount, fair value and the net exposure as of December 31, 2013, demonstrating that we do not have a concentration of credit risk with our OTC derivative counterparties:
| As of December 31, 2013 | ||||||||||||||||
| Concentration of OTC Derivative Counterparty | ||||||||||||||||
| ($ in millions, unless otherwise specified) | Notional Amount |
Asset Fair Value |
Liability Fair Value |
OTC Derivative Exposure(1) |
||||||||||||
| OTC Derivative Counterparty |
||||||||||||||||
| BNP Paribas |
$ | 11,974.6 | $ | 199.7 | $ | 298.0 | $ | 28.9 | ||||||||
| Credit Suisse International |
8,089.5 | 134.4 | 222.0 | 1.3 | ||||||||||||
| Citibank NA |
4,107.2 | 72.9 | 85.3 | 13.2 | ||||||||||||
| Goldman Sachs International |
11,899.1 | 230.0 | 233.6 | 59.7 | ||||||||||||
| Deutsche Bank AG |
4,256.0 | 43.6 | 55.8 | 4.3 | ||||||||||||
| JP Morgan Chase Bank |
2,795.2 | 62.9 | 120.3 | 4.1 | ||||||||||||
| Wells Fargo |
5,772.9 | 79.5 | 35.8 | 1.1 | ||||||||||||
| Morgan Stanley Capital Services LLC |
4,083.1 | 60.2 | 28.8 | 13.3 | ||||||||||||
| Barclays Bank |
1,831.3 | 39.1 | 61.6 | 1.3 | ||||||||||||
| Bank of America, NA |
1,852.9 | 9.0 | 27.2 | 1.8 | ||||||||||||
| UBS AG |
365.7 | 15.4 | 1.8 | 13.4 | ||||||||||||
| ING Capital Markets |
518.9 | 11.4 | 0.9 | 3.1 | ||||||||||||
| HSBC Bank |
1,005.4 | 19.6 | 13.9 | 11.1 | ||||||||||||
| Societe Generale |
480.6 | 26.3 | 0.2 | 13.4 | ||||||||||||
| The Royal Bank of Canada |
61.9 | 1.8 | — | 0.9 | ||||||||||||
| All Other OTC Counterparties |
14,830.7 | 141.5 | 145.7 | 0.4 | ||||||||||||
|
|
|
|
|
|
|
|
|
|||||||||
| Total |
$ | 73,925.0 | $ | 1,147.3 | $ | 1,330.9 | $ | 171.3 | ||||||||
|
|
|
|
|
|
|
|
|
|||||||||
| (1) | Represents net exposure after offsetting derivative assets and liabilities of the same counterparty under enforceable netting agreements and netting of collateral received and posted on a counterparty basis under CSAs. |
The following table summarizes the maturities of our derivatives portfolio and associated notional and fair value as of December 31, 2013:
| As of December 31, 2013 | ||||||||||||||||
| Volume of Derivative Activities | ||||||||||||||||
| ($ in millions) | Notional Amount |
Asset Fair Value |
Liability Fair Value |
Net Fair Value |
||||||||||||
| By Maturity |
||||||||||||||||
| OTC Contracts: |
||||||||||||||||
| Within 1 Year |
$ | 14,837.5 | $ | 123.7 | $ | 24.7 | $ | 99.0 | ||||||||
| 1 Year to 5 Years |
26,101.0 | 424.4 | 529.7 | (105.3 | ) | |||||||||||
| 5 Years to 10 Years |
24,536.5 | 453.5 | 277.7 | 175.8 | ||||||||||||
| 10 Years and longer |
8,497.4 | 145.7 | 498.8 | (353.1 | ) | |||||||||||
|
|
|
|
|
|
|
|
|
|||||||||
| Total OTC Contracts |
73,972.4 | 1,147.3 | 1,330.9 | (183.6 | ) | |||||||||||
| Exchange Traded Contracts |
7,212.4 | 2.0 | 20.9 | (18.9 | ) | |||||||||||
|
|
|
|
|
|
|
|
|
|||||||||
| Total Derivatives |
$ | 81,184.8 | $ | 1,149.3 | $ | 1,351.8 | $ | (202.5 | ) | |||||||
|
|
|
|
|
|
|
|
|
|||||||||
-171-
Table of Contents
During 2013, net cash settlements under OTC contracts were $296.4 million received and net cash settlements for exchange traded derivatives were $2.4 billion paid. Net realized losses on derivatives for the year ended December 31, 2013, were $971.4 million and $2.2 billion for OTC contracts and exchange traded contracts, respectively.
We use credit derivatives to reduce our exposure to credit-related events as well as taking credit risks. For every subsidiary or internal portfolio, the net notional amount of credit risk taken using credit derivatives is limited to the amount of U.S. Treasury security investments in the same portfolio. We also place a limit on the amount of earnings volatility that these instruments can cause.
-172-
Table of Contents
Investments for our general account are managed by our wholly owned asset manager, ING Investment Management LLC, pursuant to investment advisory agreements with affiliates. In addition, our internal treasury group manages our holding company liquidity investments, primarily money market funds.
Investment Strategy
Our investment strategy seeks to achieve sustainable risk-adjusted returns by focusing on principal preservation, disciplined matching of asset characteristics with liability requirements and the diversification of risks. Investment activities are undertaken according to investment policy statements that contain internally established guidelines and risk tolerances and in all cases are required to comply with applicable laws and insurance regulations. Risk tolerances are established for credit risk, credit spread risk, market risk, liquidity risk and concentration risk across issuers, sectors and asset types that seek to mitigate the impact of cash flow variability arising from these risks.
Segmented portfolios are established for groups of products with similar liability characteristics. Our investment portfolio consists largely of high quality fixed maturities and short-term investments, investments in commercial mortgage loans, alternative investments and other instruments, including a small amount of equity holdings. Fixed maturities include publicly issued corporate bonds, government bonds, privately placed notes and bonds, ABS, traditional MBS and various CMO tranches managed in combination with financial derivatives as part of a proprietary strategy known as CMO-B.
We use derivatives for hedging purposes to reduce our exposure to the cash flow variability of assets and liabilities, interest rate risk, credit risk and market risk. In addition, we use credit derivatives to replicate exposure to individual securities or pools of securities as a means of achieving credit exposure similar to bonds of the underlying issuer(s) more efficiently.
See “Note 2. Investments (excluding Consolidated Investment Entities).”
Portfolio Composition
The following table summarizes the investment portfolio as of the dates indicated:
| December 31, 2013 | December 31, 2012 | |||||||||||||||
| ($ in millions) | Carrying Value |
% | Carrying Value |
% | ||||||||||||
| Fixed maturities, available-for-sale, excluding securities pledged |
$ | 68,317.8 | 78.4 | % | $ | 70,910.3 | 74.2 | % | ||||||||
| Fixed maturities, at fair value using the fair value option |
2,935.3 | 3.4 | % | 2,771.3 | 2.8 | % | ||||||||||
| Equity securities, available-for-sale |
314.4 | 0.4 | % | 340.1 | 0.4 | % | ||||||||||
| Short-term investments(1) |
1,048.1 | 1.2 | % | 5,991.2 | 6.3 | % | ||||||||||
| Mortgage loans on real estate |
9,312.2 | 10.7 | % | 8,662.3 | 9.1 | % | ||||||||||
| Policy loans |
2,147.0 | 2.5 | % | 2,200.3 | 2.3 | % | ||||||||||
| Limited partnerships/corporations |
236.4 | 0.3 | % | 465.1 | 0.5 | % | ||||||||||
| Derivatives |
1,149.3 | 1.3 | % | 2,374.5 | 2.5 | % | ||||||||||
| Other investments |
124.6 | 0.1 | % | 167.0 | 0.2 | % | ||||||||||
| Securities pledged(2) |
1,465.7 | 1.7 | % | 1,605.5 | 1.7 | % | ||||||||||
|
|
|
|
|
|
|
|
|
|||||||||
| Total investments |
$ | 87,050.8 | 100.0 | % | $ | 95,487.6 | 100.0 | % | ||||||||
|
|
|
|
|
|
|
|
|
|||||||||
| (1) | Short-term investments include investments with remaining maturities of one year or less, but greater than 3 months, at the time of purchase. |
| (2) | See “Management’s Discussion and Analysis of Financial Condition and Results of Operations—Liquidity and Capital Resources” for information regarding securities pledged. |
-173-
Table of Contents
Fixed Maturities
Total fixed maturities by market sector, including securities pledged, were as summarized below as of the dates indicated:
| December 31, 2013 | ||||||||||||||||
| ($ in millions) | Amortized Cost | % of Total | Fair Value | % of Total | ||||||||||||
| Fixed maturities: |
||||||||||||||||
| U.S. Treasuries |
$ | 5,094.0 | 7.3 | % | $ | 5,181.2 | 7.1 | % | ||||||||
| U.S. Government agencies and authorities |
598.0 | 0.9 | % | 618.9 | 0.9 | % | ||||||||||
| State, municipalities and political subdivisions |
272.0 | 0.4 | % | 281.1 | 0.4 | % | ||||||||||
| U.S. corporate securities |
36,010.3 | 51.9 | % | 37,478.6 | 51.5 | % | ||||||||||
| Foreign securities(1) |
15,661.4 | 22.6 | % | 16,356.5 | 22.5 | % | ||||||||||
| Residential mortgage-backed securities |
6,480.3 | 9.3 | % | 7,123.7 | 9.8 | % | ||||||||||
| Commercial mortgage-backed securities |
3,427.9 | 4.9 | % | 3,752.1 | 5.2 | % | ||||||||||
| Other asset-backed securities |
1,883.1 | 2.7 | % | 1,926.7 | 2.6 | % | ||||||||||
|
|
|
|
|
|
|
|
|
|||||||||
| Total fixed maturities, including securities pledged |
$ | 69,427.0 | 100.0 | % | $ | 72,718.8 | 100.0 | % | ||||||||
|
|
|
|
|
|
|
|
|
|||||||||
| (1) | Primarily U.S. dollar denominated. |
| December 31, 2012 | ||||||||||||||||
| ($ in millions) | Amortized Cost | % of Total | Fair Value | % of Total | ||||||||||||
| Fixed maturities: |
||||||||||||||||
| U.S. Treasuries |
$ | 5,194.3 | 7.7 | % | $ | 5,883.7 | 7.7 | % | ||||||||
| U.S. Government agencies and authorities |
645.4 | 1.0 | % | 724.2 | 1.0 | % | ||||||||||
| State, municipalities and political subdivisions |
320.2 | 0.5 | % | 352.8 | 0.5 | % | ||||||||||
| U.S. corporate securities |
32,986.1 | 49.1 | % | 37,163.9 | 49.4 | % | ||||||||||
| Foreign securities(1) |
14,391.2 | 21.4 | % | 15,984.5 | 21.2 | % | ||||||||||
| Residential mortgage-backed securities |
6,684.2 | 9.9 | % | 7,667.0 | 10.2 | % | ||||||||||
| Commercial mortgage-backed securities |
4,438.9 | 6.6 | % | 4,946.4 | 6.6 | % | ||||||||||
| Other asset-backed securities |
2,536.4 | 3.8 | % | 2,564.6 | 3.4 | % | ||||||||||
|
|
|
|
|
|
|
|
|
|||||||||
| Total fixed maturities, including securities pledged |
$ | 67,196.7 | 100.0 | % | $ | 75,287.1 | 100.0 | % | ||||||||
|
|
|
|
|
|
|
|
|
|||||||||
| (1) | Primarily U.S. dollar denominated. |
As of December 31, 2013, the average duration of our fixed maturities portfolio, including securities pledged, is between 6.5 to 7 years.
-174-
Table of Contents
Fixed Maturities Credit Quality—Ratings
The Securities Valuation Office (“SVO”) of the NAIC evaluates the fixed maturity security investments of insurers for regulatory reporting and capital assessment purposes and assigns securities to one of six credit quality categories called “NAIC designations.” An internally developed rating is used as permitted by the NAIC if no rating is available. These designations are generally similar to the credit quality designations of the NAIC acceptable rating organizations (“ARO”) for marketable fixed maturity securities, called rating agency designations except for certain structured securities as described below. NAIC designations of “1,” highest quality and “2,” high quality, include fixed maturity securities generally considered investment grade by such rating organizations. NAIC designations 3 through 6 include fixed maturity securities generally considered below investment grade by such rating organizations.
The NAIC adopted revised designation methodologies for non-agency RMBS, including RMBS backed by subprime mortgage loans reported within ABS and for CMBS. The NAIC’s objective with the revised designation methodologies for these structured securities was to increase the accuracy in assessing expected losses and to use the improved assessment to determine a more appropriate capital requirement for such structured securities. The NAIC designations for structured securities, including subprime and Alt-A RMBS, are based upon a comparison of the bond’s amortized cost to the NAIC’s loss expectation for each security. Securities where modeling results in no expected loss in all scenarios are considered to have the highest designation of NAIC 1. A large percentage of our RMBS securities carry a NAIC 1 designation while the ARO rating indicates below investment grade. This is primarily due to the credit and intent impairments recorded by us that reduced the amortized cost on these securities to a level resulting in no expected loss in all scenarios, which corresponds to a NAIC 1 designation. The revised methodology reduces regulatory reliance on rating agencies and allows for greater regulatory input into the assumptions used to estimate expected losses from such structured securities. In the tables below, we present the rating of structured securities based on ratings from the revised NAIC rating methodologies described above (which may not correspond to rating agency designations.) All NAIC designations (e.g., NAIC 1-6) are based on the revised NAIC methodologies.
As a result of time lags between the funding of investments, the finalization of legal documents and the completion of the SVO filing process, the fixed maturity portfolio generally includes securities that have not yet been rated by the SVO as of each balance sheet date, such as private placements. Pending receipt of SVO ratings, the categorization of these securities by NAIC designation is based on the expected ratings indicated by internal analysis.
Information about certain of our fixed maturity securities holdings by the NAIC designation is set forth in the following tables. Corresponding rating agency designation does not directly translate into NAIC designation, but represents our best estimate of comparable ratings from rating agencies, including Moody’s, S&P and Fitch. If no rating is available from a rating agency, then an internally developed rating is used.
The fixed maturities in our portfolio are generally rated by external rating agencies and, if not externally rated, are rated by us on a basis similar to that used by the rating agencies. Ratings are derived from three ARO ratings and are applied as follows based on the number of agency ratings received:
| • | when three ratings are received then the middle rating is applied; |
| • | when two ratings are received then the lower rating is applied; |
| • | when a single rating is received, the ARO rating is applied; and |
| • | when ratings are unavailable then an internal rating is applied. |
-175-
Table of Contents
The following tables summarize credit quality of fixed maturities, including securities pledged, using NAIC designations as of the dates indicated:
| ($ in millions) | December 31, 2013 | |||||||||||||||||||||||||||
| NAIC Quality Designation | 1 | 2 | 3 | 4 | 5 | 6 | Total Fair Value |
|||||||||||||||||||||
| U.S. Treasuries |
$ | 5,181.2 | $ | — | $ | — | $ | — | $ | — | $ | — | $ | 5,181.2 | ||||||||||||||
| U.S. Government agencies and authorities |
618.9 | — | — | — | — | — | 618.9 | |||||||||||||||||||||
| State, municipalities and political subdivisions |
276.4 | 3.8 | 0.9 | — | — | — | 281.1 | |||||||||||||||||||||
| U.S. corporate securities |
18,095.0 | 17,651.6 | 1,452.3 | 250.2 | 5.7 | 23.8 | 37,478.6 | |||||||||||||||||||||
| Foreign securities(1) |
4,757.3 | 10,712.7 | 846.6 | 31.0 | — | 8.9 | 16,356.5 | |||||||||||||||||||||
| Residential mortgage-backed securities |
6,741.7 | 76.4 | 79.9 | 24.8 | 50.7 | 150.2 | 7,123.7 | |||||||||||||||||||||
| Commercial mortgage-backed securities |
3,734.1 | — | 9.4 | 8.6 | — | — | 3,752.1 | |||||||||||||||||||||
| Other asset-backed securities |
1,764.8 | 110.9 | 26.7 | 14.9 | 5.3 | 4.1 | 1,926.7 | |||||||||||||||||||||
|
|
|
|
|
|
|
|
|
|
|
|
|
|
|
|||||||||||||||
| Total fixed maturities |
$ | 41,169.4 | $ | 28,555.4 | $ | 2,415.8 | $ | 329.5 | $ | 61.7 | $ | 187.0 | $ | 72,718.8 | ||||||||||||||
|
|
|
|
|
|
|
|
|
|
|
|
|
|
|
|||||||||||||||
| % of Fair Value |
56.5 | % | 39.3 | % | 3.3 | % | 0.5 | % | 0.1 | % | 0.3 | % | 100.0 | % | ||||||||||||||
|
|
|
|
|
|
|
|
|
|
|
|
|
|
|
|||||||||||||||
| (1) | Primarily U.S. dollar denominated. |
| ($ in millions) | December 31, 2012 | |||||||||||||||||||||||||||
| NAIC Quality Designation | 1 | 2 | 3 | 4 | 5 | 6 | Total Fair Value |
|||||||||||||||||||||
| U.S. Treasuries |
$ | 5,883.7 | $ | — | $ | — | $ | — | $ | — | $ | — | $ | 5,883.7 | ||||||||||||||
| U.S. Government agencies and authorities |
724.2 | — | — | — | — | — | 724.2 | |||||||||||||||||||||
| State, municipalities and political subdivisions |
347.5 | 4.3 | 1.0 | — | — | — | 352.8 | |||||||||||||||||||||
| U.S. corporate securities |
17,106.9 | 18,289.5 | 1,369.1 | 344.2 | 36.3 | 17.9 | 37,163.9 | |||||||||||||||||||||
| Foreign securities(1) |
4,429.5 | 10,533.9 | 875.1 | 40.8 | 105.2 | — | 15,984.5 | |||||||||||||||||||||
| Residential mortgage-backed securities |
6,700.3 | 207.4 | 252.2 | 230.3 | 85.8 | 191.0 | 7,667.0 | |||||||||||||||||||||
| Commercial mortgage-backed securities |
4,860.9 | 67.7 | 11.8 | 6.0 | — | — | 4,946.4 | |||||||||||||||||||||
| Other asset-backed securities |
2,144.7 | 142.3 | 161.5 | 78.5 | 27.5 | 10.1 | 2,564.6 | |||||||||||||||||||||
|
|
|
|
|
|
|
|
|
|
|
|
|
|
|
|||||||||||||||
| Total fixed maturities |
$ | 42,197.7 | $ | 29,245.1 | $ | 2,670.7 | $ | 699.8 | $ | 254.8 | $ | 219.0 | $ | 75,287.1 | ||||||||||||||
|
|
|
|
|
|
|
|
|
|
|
|
|
|
|
|||||||||||||||
| % of Fair Value |
56.0 | % | 39.0 | % | 3.5 | % | 0.9 | % | 0.3 | % | 0.3 | % | 100.0 | % | ||||||||||||||
|
|
|
|
|
|
|
|
|
|
|
|
|
|
|
|||||||||||||||
| (1) | Primarily U.S. dollar denominated. |
-176-
Table of Contents
As of December 31, 2013 and 2012, the weighted average quality rating of our fixed maturities portfolio was A, respectively. The following tables summarize credit quality of fixed maturities, including securities pledged, using ARO ratings as of the dates indicated:
| ($ in millions) | December 31, 2013 | |||||||||||||||||||||||||||
| ARO Quality Ratings | AAA | AA | A | BBB | BB | B and Below |
Total Fair Value |
|||||||||||||||||||||
| U.S. Treasuries |
$ | 5,181.2 | $ | — | $ | — | $ | — | $ | — | $ | — | $ | 5,181.2 | ||||||||||||||
| U.S. Government agencies and authorities |
613.2 | 2.9 | 2.8 | — | — | — | 618.9 | |||||||||||||||||||||
| State, municipalities and political subdivisions |
59.2 | 182.8 | 34.3 | 3.9 | 0.9 | — | 281.1 | |||||||||||||||||||||
| U.S. corporate securities |
796.9 | 2,031.7 | 15,424.1 | 17,435.3 | 1,510.5 | 280.1 | 37,478.6 | |||||||||||||||||||||
| Foreign securities(1) |
93.1 | 1,331.6 | 3,781.7 | 10,446.0 | 659.2 | 44.9 | 16,356.5 | |||||||||||||||||||||
| Residential mortgage-backed securities |
5,801.9 | 35.5 | 45.9 | 144.7 | 98.2 | 997.5 | 7,123.7 | |||||||||||||||||||||
| Commercial mortgage-backed securities |
1,552.3 | 727.5 | 426.9 | 476.0 | 350.8 | 218.6 | 3,752.1 | |||||||||||||||||||||
| Other asset-backed securities |
1,232.9 | 30.1 | 77.9 | 55.6 | 56.5 | 473.7 | 1,926.7 | |||||||||||||||||||||
|
|
|
|
|
|
|
|
|
|
|
|
|
|
|
|||||||||||||||
| Total fixed maturities |
$ | 15,330.7 | $ | 4,342.1 | $ | 19,793.6 | $ | 28,561.5 | $ | 2,676.1 | $ | 2,014.8 | $ | 72,718.8 | ||||||||||||||
|
|
|
|
|
|
|
|
|
|
|
|
|
|
|
|||||||||||||||
| % of Fair Value |
21.0 | % | 6.0 | % | 27.2 | % | 39.3 | % | 3.7 | % | 2.8 | % | 100.0 | % | ||||||||||||||
|
|
|
|
|
|
|
|
|
|
|
|
|
|
|
|||||||||||||||
| (1) | Primarily U.S. dollar denominated. |
| ($ in millions) | December 31, 2012 | |||||||||||||||||||||||||||
| ARO Quality Ratings | AAA | AA | A | BBB | BB | B and Below |
Total Fair Value |
|||||||||||||||||||||
| U.S. Treasuries |
$ | 5,883.7 | $ | — | $ | — | $ | — | $ | — | $ | — | $ | 5,883.7 | ||||||||||||||
| U.S. Government agencies and authorities |
718.2 | 2.9 | 3.1 | — | — | — | 724.2 | |||||||||||||||||||||
| State, municipalities and political subdivisions |
107.1 | 202.9 | 37.5 | 4.3 | 1.0 | — | 352.8 | |||||||||||||||||||||
| U.S. corporate securities |
753.3 | 1,909.8 | 14,920.7 | 17,801.5 | 1,419.5 | 359.1 | 37,163.9 | |||||||||||||||||||||
| Foreign securities(1) |
75.3 | 1,014.1 | 3,602.9 | 10,500.8 | 728.0 | 63.4 | 15,984.5 | |||||||||||||||||||||
| Residential mortgage-backed securities |
5,843.5 | 61.3 | 166.2 | 172.4 | 121.6 | 1,302.0 | 7,667.0 | |||||||||||||||||||||
| Commercial mortgage-backed securities |
1,882.2 | 851.7 | 555.1 | 881.0 | 483.7 | 292.7 | 4,946.4 | |||||||||||||||||||||
| Other asset-backed securities |
1,489.2 | 24.4 | 129.1 | 85.1 | 111.3 | 725.5 | 2,564.6 | |||||||||||||||||||||
|
|
|
|
|
|
|
|
|
|
|
|
|
|
|
|||||||||||||||
| Total fixed maturities |
$ | 16,752.5 | $ | 4,067.1 | $ | 19,414.6 | $ | 29,445.1 | $ | 2,865.1 | $ | 2,742.7 | $ | 75,287.1 | ||||||||||||||
|
|
|
|
|
|
|
|
|
|
|
|
|
|
|
|||||||||||||||
| % of Fair Value |
22.3 | % | 5.4 | % | 25.8 | % | 39.1 | % | 3.8 | % | 3.6 | % | 100.0 | % | ||||||||||||||
|
|
|
|
|
|
|
|
|
|
|
|
|
|
|
|||||||||||||||
| (1) | Primarily U.S. dollar denominated. |
Fixed maturities rated BB and below may have speculative characteristics and changes in economic conditions or other circumstances that are more likely to lead to a weakened capacity of the issuer to make principal and interest payments than is the case with higher rated fixed maturities.
-177-
Table of Contents
Unrealized Capital Losses
Gross unrealized losses on fixed maturities, including securities pledged, increased $843.8 million from $292.7 million to $1,136.5 million for the year ended December 31, 2013. The increase in gross unrealized losses was primarily due to increasing interest rates. Gross unrealized losses on fixed maturities, including securities pledged, decreased $624.8 million from $917.5 million to $292.7 million for the year ended December 31, 2012. The decrease in gross unrealized losses was primarily due to decreasing interest rates and tightening credit spreads.
As of December 31, 2013, we held two fixed maturities with unrealized capital losses in excess of $10.0 million. The unrealized capital losses on these fixed maturities equaled $22.0 million, or 1.9% of the total unrealized losses. As of December 31, 2012 we held one fixed maturity with unrealized capital losses in excess of $10.0 million. The unrealized capital losses on this fixed maturity equaled $13.6 million, or 4.7% of the total unrealized losses. See “Note 2. Investments (excluding Consolidated Investment Entities)” for further information on unrealized capital losses.
CMO-B Portfolio
As part of our broadly diversified investment portfolio, we have a core holding in a proprietary mortgage derivatives strategy known as CMO-B, which invests in a variety of CMO securities in combination with interest rate derivatives in targeting a specific type of exposure to the U.S. residential mortgage market. Because of their relative complexity and generally small natural buyer base, we believe certain types of CMO securities are consistently priced below their intrinsic value, thereby providing a source of potential return for investors in this strategy.
The CMO securities that are part of our CMO-B portfolio are either notional or principal securities, backed by the interest and principal components, respectively, of mortgages secured by single-family residential real estate. There are many variations of these two types of securities including interest only and principal only securities, as well as inverse-floating rate (principal) securities and inverse interest only securities, all of which are part of our CMO-B portfolio. This strategy has been in place for nearly two decades and thus far has been a significant source of investment income while exhibiting relatively low volatility and correlation compared to the other asset types in the investment portfolio, although we cannot predict whether favorable returns will continue in future periods.
To protect against the potential for credit loss associated with financially troubled borrowers, investments in our CMO-B portfolio are primarily in CMO securities backed by one of the government sponsored entities: the Federal National Mortgage Association (“Fannie Mae”), the Federal Home Loan Mortgage Corporation (“Freddie Mac”) or Government National Mortgage Association (“Ginnie Mae”).
Because the timing of the receipt of the underlying cash flow is highly dependent on the level and direction of interest rates, our CMO-B portfolio also has exposure to both interest rate and convexity risk. The exposure to interest rate risk-the potential for changes in value that results from changes in the general level of interest rates-is managed to a defined target duration using interest rate swaps. The exposure to convexity risk-the potential for changes in value that result from changes in duration caused by changes in interest rates-is dynamically hedged using interest rate swaps and at times, interest rate swaptions.
Prepayment risk represents the potential for adverse changes in portfolio value resulting from changes in residential mortgage prepayment speed (actual and projected), which in turn depends on a number of factors, including conditions in both credit markets and housing markets. Changes in the prepayment behavior of homeowners represent both a risk and potential source of return for our CMO-B portfolio. As a result, we seek to invest in securities that are broadly diversified by collateral type to take advantage of the uncorrelated prepayment experiences of homeowners with unique characteristics that influence their ability or desire to prepay their mortgage. We choose collateral types and individual securities based on an in-depth quantitative analysis of prepayment incentives across all available borrower types.
-178-
Table of Contents
The following table summarizes fixed maturities balances held in the CMO-B portfolio by NAIC rating as of the dates indicated:
| ($ in millions) | December 31, 2013 | December 31, 2012 | ||||||||||||||||||||||
| NAIC Designation |
Amortized Cost | Fair Value | % Fair Value | Amortized Cost | Fair Value | % Fair Value | ||||||||||||||||||
| 1 |
$ | 2,609.1 | $ | 3,138.1 | 93.0 | % | $ | 2,526.4 | $ | 3,323.1 | 91.0 | % | ||||||||||||
| 2 |
6.8 | 10.6 | 0.3 | % | 5.1 | 6.9 | 0.2 | % | ||||||||||||||||
| 3 |
2.9 | 6.1 | 0.2 | % | 11.6 | 25.0 | 0.7 | % | ||||||||||||||||
| 4 |
11.1 | 20.1 | 0.6 | % | 32.4 | 46.0 | 1.3 | % | ||||||||||||||||
| 5 |
35.9 | 50.7 | 1.5 | % | 40.1 | 59.6 | 1.6 | % | ||||||||||||||||
| 6 |
88.9 | 150.2 | 4.4 | % | 108.9 | 188.6 | 5.2 | % | ||||||||||||||||
|
|
|
|
|
|
|
|
|
|
|
|
|
|||||||||||||
| $ | 2,754.7 | $ | 3,375.8 | 100.0 | % | $ | 2,724.5 | $ | 3,649.2 | 100.0 | % | |||||||||||||
|
|
|
|
|
|
|
|
|
|
|
|
|
|||||||||||||
For CMO securities where we elected the FVO, amortized cost represents the market values. For details on the NAIC designation methodology, please see “-Fixed Maturities Credit Quality-Ratings” above.
The following table summarizes the notional amounts and fair values of interest rate derivatives used in our CMO-B portfolio as of the dates indicated:
| December 31, 2013 | December 31, 2012 | |||||||||||||||||||||||
| ($ in millions) | Notional Amount |
Assets Fair Value |
Liability Fair Value |
Notional Amount |
Assets Fair Value |
Liability Fair Value |
||||||||||||||||||
| Derivatives non-qualifying for hedge accounting: |
||||||||||||||||||||||||
| Interest Rate Contracts |
$ | 26,358.1 | $ | 526.1 | $ | 568.2 | $ | 34,634.2 | $ | 773.1 | $ | 1,005.8 | ||||||||||||
The following table summarizes our CMO-B fixed maturity securities balances and tranche type as of the dates indicated:
| ($ in millions) | December 31, 2013 | December 31, 2012 | ||||||||||||||||||||||
| Tranche Type |
Amortized Cost |
Fair Value | % Fair Value | Amortized Cost |
Fair Value | % Fair Value | ||||||||||||||||||
| Inverse Floater |
$ | 840.1 | $ | 1,172.7 | 34.8 | % | $ | 1,008.6 | $ | 1,518.6 | 41.7 | % | ||||||||||||
| Interest Only (IO) |
312.5 | 349.2 | 10.3 | % | 225.5 | 264.4 | 7.2 | % | ||||||||||||||||
| Inverse IO |
1,149.5 | 1,398.2 | 41.4 | % | 1,196.7 | 1,565.6 | 42.9 | % | ||||||||||||||||
| Principal Only (PO) |
401.6 | 403.1 | 11.9 | % | 205.4 | 211.2 | 5.8 | % | ||||||||||||||||
| Floater |
45.2 | 45.9 | 1.4 | % | 77.4 | 78.2 | 2.1 | % | ||||||||||||||||
| Other |
5.8 | 6.7 | 0.2 | % | 10.9 | 11.2 | 0.3 | % | ||||||||||||||||
|
|
|
|
|
|
|
|
|
|
|
|
|
|||||||||||||
| Total |
$ | 2,754.7 | $ | 3,375.8 | 100.0 | % | $ | 2,724.5 | $ | 3,649.2 | 100.0 | % | ||||||||||||
|
|
|
|
|
|
|
|
|
|
|
|
|
|||||||||||||
Generally, a continued increase in valuations, as well as muted prepayments despite low interest rates, have led to a very strong performance for our CMO-B portfolio in recent years. Based on fundamental prepayment analysis, we have been able to increase the allocation to notional securities in a manner that was diversified by borrower and mortgage characteristics without unduly increasing portfolio risk because the underlying drivers of prepayment behavior across collateral type are varied.
A rebound in home prices and an anticipated increased availability of housing-related credit in 2013 have lowered IO and Inverse IO valuations modestly in the year ended December 31, 2013. To the extent these conditions persist in the coming quarters, we expect prepayment speeds will increase and the results of our CMO-B portfolio will likely underperform those of recent periods.
-179-
Table of Contents
The following table summarizes returns for our CMO-B portfolio for the periods indicated:
| Years Ended December 31, | ||||||||||||
| ($ in millions) | 2013 | 2012 | 2011 | |||||||||
| Net investment income (loss) |
$ | 791.6 | $ | 1,059.3 | $ | 1,158.5 | ||||||
| Net realized capital gains (losses)(1) |
(555.9 | ) | (185.8 | ) | (294.9 | ) | ||||||
|
|
|
|
|
|
|
|||||||
| Total income (pre-tax) |
$ | 235.7 | $ | 873.5 | $ | 863.6 | ||||||
|
|
|
|
|
|
|
|||||||
| (1) | Net realized capital gains (losses) also include derivatives interest settlements, mark to market adjustments and realized gains (losses) on standalone derivatives contracts that are in the CMO-B portfolio. |
In defining operating earnings before income taxes and non-operating earnings for our CMO-B portfolio, certain recharacterizations are recognized. As indicated in footnote (1) above, derivatives activity including net coupon settlement on interest rate swaps is included as Net realized capital gains (losses). Since these swaps are hedging securities whose coupon payments are reflected as net investment income (loss) (operating earnings), it is appropriate to represent the net swap coupons as operating income before income taxes rather than non-operating income. Also included in Net realized capital gains (losses) is the premium amortization and the change in fair value for securities designated under the FVO, whereas the coupon for these securities is included in net investment income (loss). In order to present the economics of these fair value securities in a similar manner to those of an available for sale security, the premium amortization is reclassified from Net realized capital gains (losses) (or non-operating income) to operating income.
After adjusting for the two items referenced immediately above, the following table summarizes operating income before income taxes and non-operating income for our CMO-B portfolio for the periods indicated:
| Years Ended December 31, | ||||||||||||
| ($ in millions) | 2013 | 2012 | 2011 | |||||||||
| Operating income before income taxes |
$ | 324.1 | $ | 498.0 | $ | 517.7 | ||||||
|
|
|
|
|
|
|
|||||||
| Realized gains/losses including OTTI |
(1.1 | ) | 154.4 | 19.4 | ||||||||
| Fair value adjustments |
(87.3 | ) | 221.1 | 326.5 | ||||||||
|
|
|
|
|
|
|
|||||||
| Non-operating income |
$ | (88.4 | ) | $ | 375.5 | $ | 345.9 | |||||
|
|
|
|
|
|
|
|||||||
| Income before income taxes |
$ | 235.7 | $ | 873.5 | $ | 863.6 | ||||||
|
|
|
|
|
|
|
|||||||
For the year ended December 31, 2012, we sold approximately $509.0 million of IO and Inverse IO securities within the CMO-B strategy primarily to release required capital and improve the capital efficiency of the strategy going forward for certain portfolios and recognized a pre-tax gain of $129.3 million.
Subprime and Alt-A Mortgage Exposure
The performance of pre-2008 vintage subprime and Alt-A mortgage collateral has exhibited sustained signs of recovery, after struggling through a multiyear correction in nationwide home values. While collateral losses continue to be realized, serious delinquencies and other measures of performance, like prepayments and severities, have displayed sustained periods of improvement. Reflecting these fundamental improvements, related bond prices and sector liquidity increased substantially since the credit crisis. Despite these improvements, the sector remains susceptible to various market risks. For example, in the third quarter of 2013, the upward momentum in bond prices and market liquidity was disrupted, at least in part, by the pick-up in interest rate volatility. As this volatility dissipated, prices and liquidity recovered into the end of the year, supported by strength in the US economy and, more specifically, the housing market. In managing our risk exposure to subprime and Alt-A mortgages, we take into account collateral performance and structural characteristics associated with our various positions.
-180-
Table of Contents
We do not originate or purchase subprime or Alt-A whole-loan mortgages. Subprime lending is the origination of loans to customers with weaker credit profiles. We define Alt-A mortgages to include the following: residential mortgage loans to customers who have strong credit profiles but lack some element(s), such as documentation to substantiate income; residential mortgage loans to borrowers that would otherwise be classified as prime but whose loan structure provides repayment options to the borrower that increase the risk of default; and any securities backed by residential mortgage collateral not clearly identifiable as prime or subprime.
We have exposure to RMBS, CMBS and ABS. Our exposure to subprime mortgage-backed securities is primarily in the form of ABS structures collateralized by subprime residential mortgages and the majority of these holdings were included in Other ABS under “Fixed Maturities” above. As of December 31, 2013, the fair value, amortized cost, and gross unrealized losses related to our exposure to subprime mortgage-backed securities were $623.4 million, $614.7 million and $35.5 million, respectively, representing 0.9% of total fixed maturities, including securities pledged, based on fair value. As of December 31, 2012, the fair value, amortized cost, and gross unrealized losses related to our exposure to subprime mortgage-backed securities were $967.3 million, $998.0 million and $89.1 million, respectively, representing 1.3% of total fixed maturities, including securities pledged, based on fair value.
The following tables summarize our exposure to subprime mortgage-backed securities by credit quality using NAIC designations, ARO ratings and vintage year as of the dates indicated:
| % of Total Subprime Mortgage-backed Securities | ||||||||||||||||||||
| NAIC Designation | ARO Ratings | Vintage | ||||||||||||||||||
| December 31, 2013 |
||||||||||||||||||||
| 1 | 76.2 | % | AAA | 0.3 | % | 2007 | 29.2 | % | ||||||||||||
| 2 | 16.0 | % | AA | 1.2 | % | 2006 | 24.0 | % | ||||||||||||
| 3 | 4.3 | % | A | 5.4 | % | 2005 and prior | 46.8 | % | ||||||||||||
|
|
|
|||||||||||||||||||
| 4 | 2.4 | % | BBB | 7.2 | % | 100.0 | % | |||||||||||||
|
|
|
|||||||||||||||||||
| 5 | 0.8 | % | BB and below | 85.9 | % | |||||||||||||||
|
|
|
|||||||||||||||||||
| 6 | 0.3 | % | 100.0 | % | ||||||||||||||||
|
|
|
|
|
|||||||||||||||||
| 100.0 | % | |||||||||||||||||||
|
|
|
|||||||||||||||||||
| December 31, 2012 |
||||||||||||||||||||
| 1 | 60.3 | % | AAA | 1.1 | % | 2007 | 29.1 | % | ||||||||||||
| 2 | 11.9 | % | AA | 1.0 | % | 2006 | 36.8 | % | ||||||||||||
| 3 | 16.7 | % | A | 5.4 | % | 2005 and prior | 34.1 | % | ||||||||||||
|
|
|
|||||||||||||||||||
| 4 | 8.1 | % | BBB | 6.0 | % | 100.0 | % | |||||||||||||
|
|
|
|||||||||||||||||||
| 5 | 2.8 | % | BB and below | 86.5 | % | |||||||||||||||
|
|
|
|||||||||||||||||||
| 6 | 0.2 | % | 100.0 | % | ||||||||||||||||
|
|
|
|
|
|||||||||||||||||
| 100.0 | % | |||||||||||||||||||
|
|
|
|||||||||||||||||||
Our exposure to Alt-A mortgages is included in the “RMBS” line item in the “Fixed Maturities” table under “Fixed Maturities” above. As of December 31, 2013, the fair value, amortized cost and gross unrealized losses related to our exposure to Alt-A RMBS totaled $353.5 million, $307.4 million and $10.4 million, respectively, representing 0.5% of total fixed maturities, including securities pledged, based on fair value. As of December 31, 2012, the fair value, amortized cost and gross unrealized losses related to our exposure to Alt-A RMBS totaled $411.3 million, $389.2 million and $47.9 million, respectively, representing 0.5% of total fixed maturities, including securities pledged, based on fair value.
-181-
Table of Contents
The following tables summarize our exposure to Alt-A RMBS by credit quality using NAIC designations, ARO ratings and vintage year as of the dates indicated:
| % of Total Alt-A Mortgage-backed Securities | ||||||||||||||||||||
| NAIC Designation | ARO Ratings | Vintage | ||||||||||||||||||
| December 31, 2013 |
||||||||||||||||||||
| 1 | 77.4 | % | AAA | 0.1 | % | 2007 | 21.9 | % | ||||||||||||
| 2 | 10.8 | % | AA | — | % | 2006 | 26.5 | % | ||||||||||||
| 3 | 6.7 | % | A | 1.5 | % | 2005 and prior | 51.6 | % | ||||||||||||
|
|
|
|||||||||||||||||||
| 4 | 4.3 | % | BBB | 3.9 | % | 100.0 | % | |||||||||||||
|
|
|
|||||||||||||||||||
| 5 | — | % | BB and below | 94.5 | % | |||||||||||||||
|
|
|
|||||||||||||||||||
| 6 | 0.8 | % | 100.0 | % | ||||||||||||||||
|
|
|
|
|
|||||||||||||||||
| 100.0 | % | |||||||||||||||||||
|
|
|
|||||||||||||||||||
| December 31, 2012 |
||||||||||||||||||||
| 1 | 34.1 | % | AAA | 0.2 | % | 2007 | 20.4 | % | ||||||||||||
| 2 | 11.9 | % | AA | 1.2 | % | 2006 | 25.9 | % | ||||||||||||
| 3 | 18.8 | % | A | 1.5 | % | 2005 and prior | 53.7 | % | ||||||||||||
|
|
|
|||||||||||||||||||
| 4 | 26.9 | % | BBB | 4.1 | % | 100.0 | % | |||||||||||||
|
|
|
|||||||||||||||||||
| 5 | 7.5 | % | BB and below | 93.0 | % | |||||||||||||||
|
|
|
|||||||||||||||||||
| 6 | 0.8 | % | 100.0 | % | ||||||||||||||||
|
|
|
|
|
|||||||||||||||||
| 100.0 | % | |||||||||||||||||||
|
|
|
|||||||||||||||||||
Commercial Mortgage-Backed and Other Asset-backed Securities
CMBS investments represent pools of commercial mortgages that are broadly diversified across property types and geographical areas. Delinquency rates on commercial mortgages increased over the course of 2009 through mid-2012. Since then, the steep pace of increases observed in the early years following the credit crisis has ceased, and, for most of 2013, the percentage of delinquent loans has declined. Other performance metrics like vacancies, property values and rent levels have also shown improvements, although these metrics differ by dimensions such as geographic location and property type. These improvements have been helped by some of the same macro-economic factors that we discussed in regards to our subprime and alt-a mortgage exposure. In addition, a robust environment for property refinancing has been supportive of improving credit performance metrics. The new issue market for CMBS has been a primary contributor to the refinance environment. It has continued its recovery from the credit crisis with higher total new issuances in 2013, the fifth straight year of higher new issuances. Total new issuance volume in 2013 was at its highest level since 2007.
For consumer Other ABS, delinquency and loss rates have been maintained at levels considered low by historical standards and indicative of high credit quality. Relative strength in various credit metrics across multiple types of asset-backed loans have been observed on a sustained basis.
-182-
Table of Contents
The following tables summarize our exposure to CMBS holdings by credit quality using NAIC designations, ARO ratings and vintage year as of the dates indicated:
| % of Total CMBS | ||||||||||||||||||||
| NAIC Designation | ARO Ratings | Vintage | ||||||||||||||||||
| December 31, 2013 |
||||||||||||||||||||
| 1 | 99.5 | % | AAA | 41.4 | % | 2013 | 5.3 | % | ||||||||||||
| 2 | — | % | AA | 19.4 | % | 2012 | 0.2 | % | ||||||||||||
| 3 | 0.3 | % | A | 11.4 | % | 2011 | — | % | ||||||||||||
| 4 | 0.2 | % | BBB | 12.7 | % | 2010 | — | % | ||||||||||||
| 5 | — | % | BB and below | 15.1 | % | 2009 | — | % | ||||||||||||
|
|
|
|||||||||||||||||||
| 6 | — | % | 100.0 | % | 2008 | 0.3 | % | |||||||||||||
|
|
|
|
|
|||||||||||||||||
| 100.0 | % | 2007 and prior | 94.2 | % | ||||||||||||||||
|
|
|
|
|
|||||||||||||||||
| 100.0 | % | |||||||||||||||||||
|
|
|
|||||||||||||||||||
| December 31, 2012 |
||||||||||||||||||||
| 1 | 98.3 | % | AAA | 38.1 | % | 2012 | — | % | ||||||||||||
| 2 | 1.4 | % | AA | 17.2 | % | 2011 | — | % | ||||||||||||
| 3 | 0.2 | % | A | 11.2 | % | 2010 | — | % | ||||||||||||
| 4 | 0.1 | % | BBB | 17.8 | % | 2009 | — | % | ||||||||||||
| 5 | — | % | BB and below | 15.7 | % | 2008 | 0.3 | % | ||||||||||||
|
|
|
|||||||||||||||||||
| 6 | — | % | 100.0 | % | 2007 | 37.4 | % | |||||||||||||
|
|
|
|
|
|||||||||||||||||
| 100.0 | % | 2006 and prior | 62.3 | % | ||||||||||||||||
|
|
|
|
|
|||||||||||||||||
| 100.0 | % | |||||||||||||||||||
|
|
|
|||||||||||||||||||
As of December 31, 2013 the fair value, amortized cost and gross unrealized losses of our Other ABS, excluding subprime exposure, totaled $1.3 billion, $1.3 billion and $3.0 million, respectively. As of December 31, 2012, the fair value, amortized cost and gross unrealized losses of our Other ABS, excluding subprime exposure, totaled $1.6 billion, $1.6 billion and $1.8 million, respectively.
As of December 31, 2013, Other ABS was broadly diversified both by type and issuer with credit card receivables, nonconsolidated collateralized loan obligations and automobile receivables, comprising 42.5%, 3.2% and 34.1%, respectively, of total Other ABS, excluding subprime exposure. As of December 31, 2012, Other ABS was broadly diversified both by type and issuer with credit card receivables, nonconsolidated collateralized loan obligations and automobile receivables, comprising 40.5%, 4.1% and 33.3%, respectively, of total Other ABS, excluding subprime exposure.
-183-
Table of Contents
The following tables summarize our exposure to Other ABS holdings, excluding subprime exposure, by credit quality using NAIC designations, ARO ratings and vintage year as of the dates indicated:
| % of Total Other ABS |
||||||||||||||||||
| NAIC Designation |
ARO Ratings |
Vintage |
||||||||||||||||
| December 31, 2013 |
||||||||||||||||||
| 1 |
98.9 | % | AAA | 93.8 | % | 2013 | 13.8 | % | ||||||||||
| 2 |
0.9 | % | AA | 1.7 | % | 2012 | 17.7 | % | ||||||||||
| 3 |
— | % | A | 3.4 | % | 2011 | 8.9 | % | ||||||||||
| 4 |
— | % | BBB | 0.9 | % | 2010 | 3.9 | % | ||||||||||
| 5 |
— | % | BB and below | 0.2 | % | 2009 | 2.3 | % | ||||||||||
|
|
|
|||||||||||||||||
| 6 |
0.2 | % | 100.0 | % | 2008 | 6.4 | % | |||||||||||
|
|
|
|
|
|||||||||||||||
| 100.0 | % | 2007 and prior | 47.0 | % | ||||||||||||||
|
|
|
|
|
|||||||||||||||
| 100.0 | % | |||||||||||||||||
|
|
|
|||||||||||||||||
| December 31, 2012 |
||||||||||||||||||
| 1 |
97.7 | % | AAA | 91.9 | % | 2012 | 24.6 | % | ||||||||||
| 2 |
1.7 | % | AA | 0.9 | % | 2011 | 14.9 | % | ||||||||||
| 3 |
0.1 | % | A | 4.9 | % | 2010 | 5.8 | % | ||||||||||
| 4 |
— | % | BBB | 1.7 | % | 2009 | 2.1 | % | ||||||||||
| 5 |
— | % | BB and below | 0.6 | % | 2008 | 5.9 | % | ||||||||||
|
|
|
|||||||||||||||||
| 6 |
0.5 | % | 100.0 | % | 2007 | 18.4 | % | |||||||||||
|
|
|
|
|
|||||||||||||||
| 100.0 | % | 2006 and prior | 28.3 | % | ||||||||||||||
|
|
|
|
|
|||||||||||||||
| 100.0 | % | |||||||||||||||||
|
|
|
|||||||||||||||||
Troubled Debt Restructuring
Although our portfolio of commercial loans and private placements is high quality, a small number of these contracts have been granted modifications, certain of which are considered to be troubled debt restructurings. As of December 31, 2013, there were 21 troubled debt restructurings in the commercial loan portfolio with a carrying value of $86.6 million, representing less than 1.0% of our total commercial mortgage loan portfolio. Twenty of the commercial loan troubled debt restructurings consist of a portfolio of cross-defaulted, cross-collateralized individual loans, which are owned by the same sponsor and are comprised of industrial properties. See “Note 2. Investments (excluding Consolidated Investment Entities)” for further information on troubled debt restructuring.
As of December 31, 2013 and 2012, we did not have any commercial mortgage loans or private placements modified in a troubled debt restructuring with a subsequent payment default.
Mortgage Loans on Real Estate
We rate all commercial mortgages to quantify the level of risk. We place those loans with higher risk on a watch list and closely monitor these loans for collateral deficiency or other credit events that may lead to a potential loss of principal and/or interest. If we determine the value of any mortgage loan to be OTTI (i.e., when it is probable that we will be unable to collect on all amounts due according to the contractual terms of the loan agreement), the carrying value of the mortgage loan is reduced to either the present value of expected cash flows from the loan, discounted at the loan’s effective interest rate, or fair value of the collateral. For those mortgages that are determined to require foreclosure, the carrying value is reduced to the fair value of the underlying collateral, net of estimated costs to obtain and sell at the point of foreclosure. The carrying value of the impaired loans is reduced by establishing an other-than-temporary write-down recorded in Net realized capital gains (losses) in the Consolidated Statements of Operations.
-184-
Table of Contents
LTV and DSC ratios are measures commonly used to assess the risk and quality of commercial mortgage loans. The LTV ratio, calculated at time of origination, is expressed as a percentage of the amount of the loan relative to the value of the underlying property. An LTV ratio in excess of 100% indicates the unpaid loan amount exceeds the value of the underlying collateral. The DSC ratio, based upon the most recently received financial statements, is expressed as a percentage of the amount of a property’s net income (loss) to its debt service payments. A DSC ratio of less than 1.0 indicates that property’s operations do not generate sufficient income to cover debt payments. These ratios are utilized as part of the review process described above.
As of December 31, 2013, our mortgage loans on real estate portfolio had a weighted average DSC of 2.0 times, and a weighted average LTV ratio of 59.0%. See “Note 2. Investments (excluding Consolidated Investment Entities)” for further information on mortgage loans on real estate.
Other-Than-Temporary Impairments
We evaluate available-for-sale fixed maturities and equity securities for impairment on a regular basis. The assessment of whether impairments have occurred is based on a case-by-case evaluation of the underlying reasons for the decline in estimated fair value. See “Note 1. Business, Basis of Presentation and Significant Accounting Policies” for a policy used to evaluate whether the investments are other-than-temporarily impaired.
During the year ended December 31, 2013, we recorded $21.2 million of credit related OTTI of which the primary contributor being $7.5 million of write-downs recorded in the RMBS sector on securities collateralized by Alt-A residential mortgages. See “Note 2. Investments (excluding Consolidated Investment Entities)” for further information on OTTI.
Derivatives
We use derivatives for a variety of hedging purposes as further described below. We also have embedded derivatives within fixed maturities instruments and certain annuity products with guarantees. See “Note 1. Business, Basis of Presentation and Significant Accounting Policies” for further information.
Closed Block Variable Annuity Hedging
Refer to “Management’s Discussion and Analysis of Financial Condition and Results of Operations—Quantitative and Qualitative Disclosures About Market Risk” of this prospectus for further information.
Invested Asset and Credit Hedging
Interest rate caps and interest rate swaps are used to manage the interest rate risk in our fixed maturities portfolio. Interest rate swaps include forward starting swaps, which are used for anticipated purchases of fixed maturities. They represent contracts that require the exchange of cash flows at regular interim periods, typically monthly or quarterly.
Foreign exchange swaps are used to reduce the risk of a change in the value, yield or cash flow with respect to invested assets. Foreign exchange swaps represent contracts that require the exchange of foreign currency cash flows for U.S. dollar cash flows at regular interim periods, typically quarterly or semiannually.
Certain forwards are acquired to hedge certain CMO assets held by us against movements in interest rates, particularly mortgage rates. On the settlement date, we will either receive a payment (interest rate decreases on purchased forwards or interest rate rises on sold forwards) or will be required to make a payment (interest rate rises on purchased forwards or interest rate decreases on sold forwards).
CDS are used to reduce the credit loss exposure with respect to certain assets that we own, or to assume credit exposure on certain assets that we do not own. Payments are made to or received from the counterparty at
-185-
Table of Contents
specified intervals and amounts for the purchase or sale of credit protection. In the event of a default on the underlying credit exposure, we will either receive an additional payment (purchased credit protection) or will be required to make an additional payment (sold credit protection) equal to par minus recovery value of the swap contract.
Sale of Certain Alternative Investments
On June 4, 2012, certain insurance company subsidiaries of ours entered into an agreement to sell certain general account private equity limited partnership investment interest holdings (“sale of certain alternative investments”) with a carrying value of $812.2 million as of March 31, 2012 included in Assets related to consolidated investment entities. These assets were sold to a group of private equity funds that are managed by Pomona Management LLC, also a subsidiary of ours. The transaction resulted in a net pre-tax loss of $91.9 million in the second quarter of 2012. The transaction closed in two tranches with the first tranche having closed on June 29, 2012 and the second tranche closed on October 29, 2012. As of June 30, 2012, the fair value of the alternative investments in the second tranche was reduced to $412.5 million, which represented the sale price of the remaining alternative investments involved in this transaction. We sold these assets as part of our periodic portfolio and capital management review.
European Exposures
We closely monitor our exposures to European sovereign debt in general, with a primary focus on the sovereign debt of Greece, Ireland, Italy, Portugal and Spain (which we refer to as “peripheral Europe”), as these countries have applied for support from the European Financial Stability Facility or received support from the European Central Bank via government bond purchases in the secondary market.
The financial turmoil in Europe continues to be a potential threat to global capital markets and remains a challenge to global financial stability. Additionally, the possibility of capital market volatility spreading through a highly integrated and interdependent banking system remains. Despite signs of continuous improvement in the region, it is our view that the risk among European sovereigns and financial institutions still warrants scrutiny, in addition to our customary surveillance and risk monitoring, given how highly correlated these sectors of the region have become.
We quantify and allocate our exposure to the region, as described in the table below, by attempting to identify all aspects of the region or country risk to which we are exposed. Among the factors we consider are the nationality of the issuer, the nationality of the issuer’s ultimate parent, the corporate and economic relationship between the issuer and its parent, as well as the political, legal and economic environment in which each functions. By undertaking this assessment, we believe that we develop a more accurate assessment of the actual geographic risk, with a more integrated understanding of all contributing factors to the full risk profile of the issuer.
In the normal course of our ongoing risk and portfolio management process, we closely monitor compliance with a credit limit hierarchy designed to minimize overly concentrated risk exposures by geography, sector and issuer. This framework takes into account various factors such as internal and external ratings, capital efficiency and liquidity and is overseen by a combination of Investment and Corporate Risk Management, as well as insurance portfolio managers focused specifically on managing the investment risk embedded in our portfolio.
As of December 31, 2013, we had $830.5 million of exposure to peripheral Europe, which consisted of a broadly diversified portfolio of credit-related investments primarily in the industrial and utility sectors. We had no fixed maturities or equity securities exposure to European sovereigns based in peripheral Europe. Peripheral European exposure included non-sovereign exposure in Ireland of $309.5 million, Italy of $268.1 million, Portugal of $10.1 million, and Spain of $242.8 million. We had no exposure to Greece. As of December 31, 2013, we had no exposure to derivative assets within the financial institutions based in peripheral Europe. For
-186-
Table of Contents
purposes of calculating the derivative assets exposure, we have aggregated exposure to single name and portfolio product CDS, as well as all non-CDS derivative exposure for which it either has counterparty or direct credit exposure to a company whose country of risk is in scope.
Among the remaining $7,752.1 million of total non-peripheral European exposure, we had a portfolio of credit-related assets similarly diversified by country and sector across developed and developing Europe. As of December 31, 2013 our sovereign exposure was $280.0 million, which consisted of fixed maturities. We also had $921.2 million in net exposure to non-peripheral financial institutions with a concentration in Switzerland of $163.2 million, and the United Kingdom of $332.3 million. The balance of $6,550.9 million was invested across non-peripheral, non-financial institutions.
In addition to aggregate concentration to the Netherlands of $1,258.2 million and the United Kingdom of $3,138.7 million, we had significant non-peripheral European total country exposures in Belgium of $376.6 million, France of $586.0 million, Germany of $638.9 million, and Switzerland of $696.0 million. We place additional scrutiny on our financial exposure in the United Kingdom, France and Switzerland given our concern for the potential for volatility to spread through the European banking system. We believe the primary risk results from market value fluctuations resulting from spread volatility and the secondary risk is default risk, should the European crisis worsen or fail to be resolved.
The following table summarizes our European exposures at fair value and amortized cost as of December 31, 2013:
| Fixed Maturities and Equity Securities | Derivative Assets | |||||||||||||||||||||||||||||||||||||||||||||||
| ($ in millions) | Sovereign | Financial Institutions |
Non-Financial Institutions |
Total (Fair Value) |
Total (Amortized Cost) |
Loan and Receivables Sovereign (Amortized Cost) |
Sovereign | Financial Institutions |
Non-Financial Institutions |
Less: Margin & Collateral |
Total (Fair Value) |
Net Non- US Funded(1) |
||||||||||||||||||||||||||||||||||||
| Ireland |
$ | — | $ | — | $ | 308.3 | $ | 308.3 | $ | 294.5 | $ | — | $ | — | $ | — | $ | 1.2 | $ | — | $ | 1.2 | $ | 309.5 | ||||||||||||||||||||||||
| Italy |
— | — | 268.1 | 268.1 | 253.5 | — | — | — | — | — | — | 268.1 | ||||||||||||||||||||||||||||||||||||
| Portugal |
— | — | 10.1 | 10.1 | 7.7 | — | — | — | — | — | — | 10.1 | ||||||||||||||||||||||||||||||||||||
| Spain |
— | — | 242.8 | 242.8 | 230.3 | — | — | — | — | — | — | 242.8 | ||||||||||||||||||||||||||||||||||||
|
|
|
|
|
|
|
|
|
|
|
|
|
|
|
|
|
|
|
|
|
|
|
|
|
|||||||||||||||||||||||||
| Total Peripheral Europe |
$ | — | $ | — | $ | 829.3 | $ | 829.3 | $ | 786.0 | $ | — | $ | — | $ | — | $ | 1.2 | $ | — | $ | 1.2 | $ | 830.5 | ||||||||||||||||||||||||
|
|
|
|
|
|
|
|
|
|
|
|
|
|
|
|
|
|
|
|
|
|
|
|
|
|||||||||||||||||||||||||
| Austria |
$ | — | $ | — | $ | 15.8 | $ | 15.8 | $ | 15.0 | $ | — | $ | — | $ | — | $ | — | $ | — | $ | — | $ | 15.8 | ||||||||||||||||||||||||
| Belgium |
36.1 | — | 340.5 | 376.6 | 331.6 | — | — | — | — | — | — | 376.6 | ||||||||||||||||||||||||||||||||||||
| Bulgaria |
5.8 | — | — | 5.8 | 5.6 | — | — | — | — | — | — | 5.8 | ||||||||||||||||||||||||||||||||||||
| Croatia |
27.4 | — | — | 27.4 | 25.6 | — | — | — | — | — | — | 27.4 | ||||||||||||||||||||||||||||||||||||
| Czech Republic |
— | — | 9.9 | 9.9 | 10.1 | — | — | — | — | — | — | 9.9 | ||||||||||||||||||||||||||||||||||||
| Denmark |
— | 10.6 | 121.5 | 132.1 | 124.0 | — | — | — | — | — | — | 132.1 | ||||||||||||||||||||||||||||||||||||
| Finland |
— | — | 41.9 | 41.9 | 40.0 | — | — | — | — | — | — | 41.9 | ||||||||||||||||||||||||||||||||||||
| France |
— | 124.0 | 448.6 | 572.6 | 542.0 | — | — | 26.2 | — | 12.8 | 13.4 | 586.0 | ||||||||||||||||||||||||||||||||||||
| Germany |
— | 52.7 | 586.2 | 638.9 | 603.0 | — | — | — | — | — | — | 638.9 | ||||||||||||||||||||||||||||||||||||
| Hungary |
6.2 | — | — | 6.2 | 5.9 | — | — | — | — | — | — | 6.2 | ||||||||||||||||||||||||||||||||||||
| Kazakhstan |
57.6 | — | 6.7 | 64.3 | 60.7 | — | — | — | — | — | — | 64.3 | ||||||||||||||||||||||||||||||||||||
| Latvia |
4.9 | — | — | 4.9 | 4.6 | — | — | — | — | — | — | 4.9 | ||||||||||||||||||||||||||||||||||||
| Lithuania |
33.1 | — | — | 33.1 | 30.5 | — | — | — | — | — | — | 33.1 | ||||||||||||||||||||||||||||||||||||
| Luxembourg |
— | — | 24.7 | 24.7 | 23.4 | — | — | — | — | — | — | 24.7 | ||||||||||||||||||||||||||||||||||||
| Netherlands |
— | 179.2 | 1,079.0 | 1,258.2 | 1,185.0 | — | — | — | — | — | — | 1,258.2 | ||||||||||||||||||||||||||||||||||||
| Norway |
— | 3.4 | 275.8 | 279.2 | 281.5 | — | — | — | — | — | — | 279.2 | ||||||||||||||||||||||||||||||||||||
| Russian Federation |
82.6 | — | 95.6 | 178.2 | 167.7 | — | — | — | — | — | — | 178.2 | ||||||||||||||||||||||||||||||||||||
| Slovakia |
5.2 | — | — | 5.2 | 5.0 | — | — | — | — | — | — | 5.2 | ||||||||||||||||||||||||||||||||||||
| Sweden |
— | 42.4 | 124.5 | 166.9 | 153.6 | — | — | — | — | — | — | 166.9 | ||||||||||||||||||||||||||||||||||||
| Switzerland |
— | 148.8 | 531.6 | 680.4 | 637.1 | — | — | 14.7 | 1.2 | 0.3 | 15.6 | 696.0 | ||||||||||||||||||||||||||||||||||||
| Turkey |
21.1 | — | 41.0 | 62.1 | 65.5 | — | — | — | — | — | — | 62.1 | ||||||||||||||||||||||||||||||||||||
| United Kingdom |
— | 332.3 | 2,806.4 | 3,138.7 | 3,004.8 | — | — | — | — | — | — | 3,138.7 | ||||||||||||||||||||||||||||||||||||
|
|
|
|
|
|
|
|
|
|
|
|
|
|
|
|
|
|
|
|
|
|
|
|
|
|||||||||||||||||||||||||
| Total Non-Peripheral Europe |
280.0 | 893.4 | 6,549.7 | 7,723.1 | 7,322.2 | — | — | 40.9 | 1.2 | 13.1 | 29.0 | 7,752.1 | ||||||||||||||||||||||||||||||||||||
|
|
|
|
|
|
|
|
|
|
|
|
|
|
|
|
|
|
|
|
|
|
|
|
|
|||||||||||||||||||||||||
| Total |
$ | 280.0 | $ | 893.4 | $ | 7,379.0 | $ | 8,552.4 | $ | 8,108.2 | $ | — | $ | — | $ | 40.9 | $ | 2.4 | $ | 13.1 | $ | 30.2 | $ | 8,582.6 | ||||||||||||||||||||||||
|
|
|
|
|
|
|
|
|
|
|
|
|
|
|
|
|
|
|
|
|
|
|
|
|
|||||||||||||||||||||||||
| (1) | Represents: (i) fixed maturities and equity securities at fair value, including securities pledged; (ii) loan and receivables sovereign at amortized cost; and (iii) derivative assets at fair value including securities pledged. |
-187-
Table of Contents
Consolidated Investment Entities
We provide investment management services to, and have transactions with, various collateralized debt structures and securitizations (primarily consolidated investment entities (“CLO entities”)), private equity funds and single strategy hedge funds, insurance entities and other investment entities in the normal course of business. In certain instances, we serve as the investment manager, making day-to-day investment decisions concerning the assets of these entities. These entities are considered to be either variable interest entities (“VIEs”) or voting interest entities (“VOEs”) and we evaluate our involvement with each entity to determine whether consolidation is required.
Certain investment entities are consolidated under consolidation guidance. We consolidate certain entities under the VIE guidance when it is determined that we are the primary beneficiary. We consolidate certain entities under the VOE guidance when we act as the controlling general partner and the limited partners have no substantive rights to impact ongoing governance and operating activities.
We have no right to the benefits from, nor do we bear the risks associated with, these investments beyond our direct equity and debt investments in and management fees generated from these investment products. Such direct investments amounted to approximately $654.0 million and $600.0 million as of December 31, 2013 and 2012, respectively. If we were to liquidate, the assets held by consolidated investment entities would not be available to our general creditors.
Fair Value Measurement
Upon consolidation of CLO entities, we elected to apply the FVO for financial assets and financial liabilities held by these entities to measure these assets (primarily corporate loans) and liabilities (debt obligations issued by CLO entities) at fair value. We have elected the FVO to more closely align the accounting with the economics of the transactions and allow us to more effectively reflect changes in the fair value of CLO assets with a commensurate change in the fair value of CLO liabilities.
Investments held by consolidated private equity funds and single strategy hedge funds are reported in our Consolidated Financial Statements. Changes in the fair value of consolidated investment entities are recorded as a separate line item within Income related to Consolidated Investment Entities in our Consolidated Financial Statements.
The methodology for measuring the fair value and fair value hierarchy classification of financial assets and liabilities of consolidated investment entities is consistent with the methodology and fair value hierarchy rules that we apply to our investment portfolio. See the Fair Value Measurement section of “Note 1. Business, Basis of Presentation and Significant Policies.”
Nonconsolidated VIEs
We also hold variable interest in certain CLO entities that we do not consolidate because we have determined that we are not the primary beneficiary. With these CLO entities, we serve as the investment manager and receive investment management fees and contingent performance fees. Generally, we do not hold any interest in the nonconsolidated CLO entities but if we do, such ownership has been deemed to be insignificant. We have not provided and are not obligated to provide any financial or other support to these entities.
We manage or hold investments in certain private equity funds and single strategy hedge funds. These funds are managed as a portfolio of investments that use advanced investment strategies such as leverage, long, short and derivative positions in both domestic and international markets with the goal of generating high returns. With these entities, we serve as the investment manager and are entitled to receive investment management fees and contingent performance fees that are generally expected to be insignificant. We do not hold any equity interest in these fund VIEs and have not provided and are not obligated to provide any financial or other support to these funds.
-188-
Table of Contents
In addition, we do not consolidate funds, in which our involvement takes the form of a limited partner interest and is restricted to a role of a passive investor, as a limited partner’s interest does not provide us with any substantive kick-out or participating rights, which would overcome the presumption of control by the general partner. See “Note 19. Consolidated Investment Entities” for more information.
Securitizations
We invest in various tranches of securitization entities, including RMBS, CMBS and ABS. Certain RMBS investments represent agency pass-through securities and close-to-the-index tranches issued by Fannie Mae, Freddie Mac, or a similar government sponsored entity. Investments that we hold in non-agency RMBS and CMBS also include interest-only, principal-only, and inverse floating securities. We are not obligated to provide any financial or other support to these entities. The RMBS, CMBS and ABS entities are thinly capitalized by design and considered VIEs. Our involvement with these entities is limited to that of a passive investor. These investments are accounted for as investments available-for-sale as described in “Note 4. Fair Value Measurements (excluding Consolidated Investment Entities)” and unrealized capital gains (losses) on these securities are recorded directly in AOCI, except for certain RMBS which are accounted for under the FVO, whose change in fair value is reflected in Other net realized gains (losses) in the Consolidated Statements of Operations. Our maximum exposure to loss on these structured investments is limited to the amount of our investment. See “Note 2. Investments (excluding Consolidated Investment Entities)” for details regarding the carrying amounts and classifications of these assets.
-189-
Table of Contents
ORGANIZATIONAL HISTORY AND STRUCTURE
Our History
Prior to our initial public offering in May 2013, we were a wholly owned subsidiary of ING Group, a global financial institution of Dutch origin, with operations in more than 40 countries and more than 95,000 employees.
ING Group entered the United States life insurance market in 1975 through the acquisition of Wisconsin National Life Insurance Company, followed in 1976 with its acquisition of Midwestern United Life Insurance Company and Security Life of Denver Insurance Company in 1977. ING Group significantly expanded its presence in the United States in the late 1990s and 2000s with the acquisitions of Equitable Life Insurance Company of Iowa (1997), Furman Selz, an investment advisory company (1997), ReliaStar Life Insurance Company (including Pilgrim Capital Corporation) (2000), Aetna Life Insurance and Annuity Company (including Aeltus Investment Management) (2000) and CitiStreet (2008).
Plan of Divestment from ING Group
Prior to our initial public offering in May 2013, we were a wholly owned subsidiary of ING Group. In October 2009, ING Group submitted a restructuring plan to the EC in order to receive approval for state aid granted to ING Group by the Dutch State in November 2008 and March 2009. To receive approval for this state aid, ING Group was required to divest its insurance and investment management businesses, including the Company. On November 19, 2012 ING Group and the EC announced that the EC approved the 2012 Amended Restructuring Plan. The 2012 Amended Restructuring Plan requires ING Group to divest at least 25% of the Company by December 31, 2013, more than 50% of the Company by December 31, 2014, and 100% of the Company by December 31, 2016. ING Group divested 25% of the Company on May 7, 2013, in our initial public offering and an additional 4% on May 31, 2013 following the exercise by the underwriters in the initial public offering of an option to purchase additional shares. ING Group divested an additional 14% of the Company on October 29, 2013, in a registered offering. The divestment of 50% of the Company is measured in terms of a divestment of over 50% of the shares of ING U.S., Inc., the loss of ING Group’s majority of directors on ING U.S., Inc.’s board of directors and the accounting deconsolidation of the Company (in line with IFRS accounting rules). This offering and the Direct Share Buyback, together with the governance changes described under “Summary—Changes to our Governance as a Result of this Offering and the Direct Share Buyback”, are intended to satisfy such requirements. In case ING Group does not satisfy its commitment to timely divest the Company as agreed with the EC, or in case of any other material non-compliance with the 2012 Amended Restructuring Plan, the Dutch State will renotify the recapitalization measure to the EC. In such a case, the EC may require additional restructuring measures or take enforcement actions against ING Group, or, at the request of ING Group and the Dutch State, could allow ING Group more time to complete the divestment. In the event ING Group is no longer required or is allowed more time to divest the Company, ING Group may delay its divestiture. For additional information on the separation from ING Group, see “Risk Factors—Risks Related to Our Separation from, and Continuing Relationship with, ING Group”.
-190-
Table of Contents
Our Organizational Structure
We are a holding company incorporated in Delaware in April 1999. We operate our businesses through a number of direct and indirect subsidiaries. The following organizational chart presents the ownership and jurisdiction of incorporation of our principal subsidiaries:
The chart above presents:
| • | ING U.S., Inc. |
| • | Our principal intermediate holding company, Lion Holdings, which is the direct parent of a number of our insurance and non-insurance operating entities. |
| • | Our principal operating entities that will be the primary sources of cash distributions to ING U.S., Inc. Specifically, these entities are our principal insurance operating companies (ILIAC, ING USA, SLD and RLI) and ING Investment Management LLC, the holding company for entities that operate our Investment Management business. |
| • | SLDI, our Arizona captive which was previously domiciled in the Cayman Islands, and was redomesticated to the State of Arizona, effective December 20, 2013. |
In connection with our rebranding discussed in “—Our Brand” below, we intend to change our legal name to “Voya Financial, Inc.” in April 2014 by means of a short-form merger under the DGCL with a wholly owned subsidiary formed for that purpose.
Other ING Operations in the United States
ING Group has certain operations in the United States that do not form part of the Company, including ING Corporate and Institutional Clients (ING Group’s wholesale banking operations in the U.S.) and certain limited operations of its European and Asian investment management business.
-191-
Table of Contents
We are a premier retirement, investment and insurance company serving the financial needs of approximately 13 million individual and institutional customers in the United States as of December 31, 2013. Our vision is to be America’s Retirement Company™. Our approximately 7,000 employees (as of December 31, 2013) are focused on executing our mission to make a secure financial future possible—one person, one family and one institution at a time. Through our retirement, investment management and insurance businesses, we help our customers save, grow, protect and enjoy their wealth to and through retirement. We offer our products and services through a broad group of financial intermediaries, independent producers, affiliated advisors and dedicated sales specialists throughout the United States.
Our extensive scale and breadth of product offerings are designed to help Americans achieve their retirement savings, investment income and protection goals. Our strategy is centered on preparing customers for “Retirement Readiness”—being emotionally and economically secure and ready for their retirement. We believe that the rapid aging of the U.S. population, weakening of traditional social safety nets, shifting of responsibility for retirement planning from institutions to individuals and growth in total retirement account assets will drive significant demand for our products and services going forward. We believe that we are well positioned to deliver on this Retirement Readiness need.
We believe that we help our customers achieve four essential financial goals, as they prepare for, enter and enjoy their retirement years.
| • | Save. Our products enable our customers to save for retirement by establishing investment accounts through their employers or individually. |
| • | Grow. We provide advisory programs, IRAs, fixed annuities, brokerage accounts, mutual funds and accumulation insurance products to help our customers achieve their financial objectives. |
| • | Protect. Our specialized retirement and insurance products, such as UL, IUL, term life and stable value products, allow our customers to protect against unforeseen life events and mitigate market risk. |
| • | Enjoy. Our income products such as target date funds, guaranteed income funds, fixed annuities, IRAs, mutual funds and accumulation insurance products enable our customers to meet income needs through retirement and achieve wealth transfer objectives. |
We tailor our products to meet the unique needs of our individual and institutional customers. Our individual businesses are primarily focused on the middle and mass affluent markets; however we serve customers across the full income spectrum, especially in our Institutional Retirement Plans business, Retail and Alternative Fund businesses, and Employee Benefits segment. Similarly, our institutional businesses serve a broad range of customers, with customized offerings to the small-mid, large and mega market segments.
We believe that with our leading market positions, investment expertise, and distribution reach we are well positioned to generate attractive risk-adjusted returns and earnings growth for our shareholders over time.
We operate our principal businesses through three business lines: Retirement Solutions, Investment Management and Insurance Solutions. We refer to these business lines as our “ongoing business”. In addition, we also have Closed Blocks and Corporate reporting segments. Closed Blocks consists of three businesses where we have placed our portfolios in run-off—CBVA, Closed Block Institutional Spread Products and Closed Block Other. Our Corporate segment includes our corporate activities and corporate-level assets and financial obligations.
-192-
Table of Contents
The following table presents a summary of our key individual and institutional markets, how we define those markets, and the key products sold in such markets.
Individual Markets
| Market |
Household Income Range | Investable Asset Range |
Typical Customer Products | |||
| Mass Market |
$50,000-$100,000 | <$100,000 | Term Life Insurance Mutual Funds IRAs Annuities | |||
| Middle Market & Mass Affluent |
$100,000-$250,000 | $100,000- $1,000,000 |
Term Life Insurance Universal Life Insurance Mutual Funds IRAs Financial Advisory Annuities | |||
| Affluent & Wealth Management Market |
$250,000-$500,000 | $1,000,000- $10,000,000 |
Term Life Insurance Universal Life Insurance Mutual Funds Separately Managed Accounts Alternatives Funds IRAs Financial Advisory Annuities | |||
| Institutional Markets
|
||||||
| Market |
Employee Size | Asset Range | Typical Customer Products | |||
| Small-Mid |
26-3,000 | $5 million- $150 million |
Full Service Retirement Plans Retirement Recordkeeping Employee Benefits Investment Management Stable Value | |||
| Large |
3,000-5,000 | $150 million- $500 million |
Full Service Retirement Plans Retirement Recordkeeping Employee Benefits Investment Management Stable Value | |||
| Mega |
>5,000 | >$500 million |
Full Service Retirement Plans Retirement Recordkeeping Employee Benefits Investment Management Stable Value | |||
-193-
Table of Contents
We operate our ongoing business through three business lines which encompass five reporting segments:
Retirement Solutions. We are a leading provider of retirement services and products in the United States, with $131.9 billion of AUM and $237.8 billion of AUA as of December 31, 2013. We provide an extensive product range addressing both the accumulation and income distribution needs of customers, through a broad distribution footprint of nearly 2,400 affiliated representatives and thousands of non-affiliated agents and TPAs as of December 31, 2013. Our Retirement Solutions business comprises two financial reporting segments: Retirement and Annuities.
| • | Retirement provides tax-deferred, employer-sponsored retirement savings plans and administrative services to approximately 47,000 plan sponsors covering more than 5 million plan participants in corporate, education, healthcare and government markets as of December 31, 2013. Retirement also provides IRAs, and other retail financial products as well as comprehensive financial advisory services to individual customers. We serve a broad spectrum of employers ranging from small companies to the very largest of corporations and government entities. As of the latest Pensions and Investments survey published in March 2013, we rank second in the U.S. defined contribution plan market by number of record kept plan sponsors, third by number of plan participants served, and fifth by assets under management and administration as of September 30, 2013. Retirement had $343 billion of AUM and AUA as of December 31, 2013, of which $93 billion was full service business, $247 billion was recordkeeping and stable value business and $3 billion was Individual Markets business. |
| • | Annuities provides fixed and indexed annuities, tax-qualified mutual fund custodial products and payout annuities for pre-retirement wealth accumulation and post-retirement income management sold through multiple channels, and had $26.6 billion of AUM as of December 31, 2013. |
Investment Management. We are a prominent full-service asset manager with approximately $199.3 billion of AUM and $58.5 billion of AUA as of December 31, 2013, delivering client-oriented investment solutions and advisory services. We serve both individual and institutional customers, offering them domestic and international fixed income, equity, multi-asset and alternative investment products and solutions across a range of geographies, investment styles and capitalization spectrums.
| • | As of December 31, 2013, we managed $120.3 billion in our commercial business (comprised of $75.2 billion for third-party institutions and individual investors, and $45.1 billion in separate account assets for our Retirement Solutions, Insurance Solutions and Closed Block businesses) and $79.0 billion in general account assets. We are particularly focused on growing our commercial business, in which we achieved 8.6% organic AUM growth for the year ended December 31, 2013. |
| • | We have a highly scalable business model and are among the twenty largest managers of institutional tax-exempt assets in the U.S. and ranked number one among defined contribution investment managers in client loyalty and favorability in 2011. |
| • | As of December 31, 2013, our retail mutual fund portfolio assets totaled $24.9 billion. On a five year asset weighted basis, 73% of our Investment Management managed funds (i.e., variable portfolios and mutual funds) beat their Morningstar category average and 81% had lower volatility than their Morningstar competitor average as of December 31, 2013. |
Insurance Solutions. We are one of the top providers of life insurance in the United States. Based on the LIMRA survey as of December 31, 2013, for premiums sold, our term and universal life products ranked thirteenth and twenty-fourth, respectively. The rankings reflect our recent focus on selling more capital efficient products, such as accumulation focused UL. We were also the sixth ranked provider of medical stop loss coverage in the United States based on annual premiums as reported by MyHealthguide in June 2013. Our Insurance Solutions business comprises two financial reporting segments: Individual Life and Employee Benefits.
| • | Individual Life provides wealth protection and transfer opportunities through universal, variable, whole life and term life products, distributed through independent channels to meet the needs of a broad range of customers from the middle-market through affluent market segments. As of December 31, 2013, the |
-194-
Table of Contents
| Individual Life distribution model is supported by independent life sales agents (over 2,200 independent general agents with access to over 96,000 producers), strategic distribution (approximately 35 independent managing directors supporting approximately 7,200 additional producers) and specialty markets (95 general agents with access to over 7,100 producers). |
| • | Employee Benefits provides stop loss, group life, voluntary employee-paid and disability products to mid-sized and large businesses. As of December 31, 2013, the Company has 58 employee benefits sales representatives, across 19 sales offices, with average industry experience of 17 years. Approximately 58.3%, 23.4% and 10.3% of the Employee Benefit sales were attributed to stop loss, life and voluntary products, respectively, for the year ended December 31, 2013. |
Closed Blocks. We separated our CBVA and Closed Block Institutional Spread Products segments from our other operations and made a strategic decision to stop actively writing new retail variable annuity products with substantial guarantee features and to run-off the institutional spread products portfolio over time. Accordingly, these segments have been classified as closed blocks and are managed separately from our ongoing business.
| • | CBVA. In 2009, we decided to cease sales of retail variable annuity products with substantial guarantee features (the last policies were issued in early 2010) and placed this portfolio in run-off. Subsequently, we refined our hedge program to seek to dynamically protect regulatory and rating agency capital of the variable annuities block for adverse equity market movements. In addition, since 2010, we have increased statutory reserves considerably, added significant interest rate risk protection and have more closely aligned our policyholder behavior assumptions with experience. Our focus in managing our CBVA segment is on protecting regulatory and rating agency capital from equity market movements via hedging and judiciously looking for opportunities to accelerate the run-off of the block, where possible. We believe that our hedge program, combined with our statutory reserves of $3.3 billion as of December 31, 2013, related to the variable annuity block, provides adequate resources to fund a wide range of, but not all, possible market scenarios as well as a margin for adverse policyholder behavior. |
| • | Closed Block Institutional Spread Products. In 2009, we also placed the institutional spread products portfolio in run-off. As of December 31, 2013, remaining assets in the institutional spread products portfolio had an amortized cost of $2.5 billion, down from a peak of $14.3 billion in 2008. |
As of December 31, 2013, we had $510.5 billion in total AUM and AUA and total shareholders’ equity, excluding AOCI and noncontrolling interests, of $11.4 billion. In the year ended December 31, 2013, we generated $758.1 million of income (loss) before income taxes, $600.5 million of net income (loss) available to ING U.S., Inc.’s common shareholders and $1.3 billion of operating earnings before income taxes. Operating earnings before income taxes is a non-GAAP financial measure. For a reconciliation of operating earnings before income taxes to income (loss) before income taxes, see “Management’s Discussion and Analysis of Financial Condition and Results of Operations—Results of Operations—Company Consolidated”.
Market Environment and Opportunities
The current macroeconomic backdrop and financial market uncertainty, as well as the weakening of historical safety nets provided by governments and employers, such as Social Security and defined benefit plans, are increasing the need for Americans to plan for their own long-term financial security. Our products and services are designed to help individuals achieve their retirement savings, investment income and protection goals. We believe that we are uniquely positioned to benefit from a number of significant demographic and market trends, including the following:
| • | Rapid growth in aging U.S. population. In a 2012 study, the U.S. Census Bureau estimated that the number of Americans aged 65 and older will more than double between 2012 and 2060, increasing from 43.1 million in 2012 to 92.0 million in 2060. This older segment of the population would represent just over one-in-five U.S. residents by the end of the period, up from one-in-seven at the end of 2012. |
-195-
Table of Contents
| • | Fraying of traditional social safety nets. The U.S. Government Accountability Office has indicated that increasing life expectancy has created a risk that many retirees will outlive their retirement assets. Additionally, employer-sponsored private sector pension plans face severe funding deficits. According to a report by Mercer Consulting, a consulting and research firm, the aggregate funding deficit for pension plans sponsored by companies included on the S&P 1500 was $276 billion as of February 28, 2014. Americans realize that funding deficits in government and employer-sponsored pension plans leave them exposed to retirement income shortfalls. According to a 2012 LIMRA study, more than 64% of individuals aged 55 to 70 do not expect to receive enough income from Social Security and employer pensions to cover their basic living expenses through their retirement years. |
| • | Growth in the retirement savings market. The U.S. Bureau of Labor Statistics estimates that private sector participation in defined benefit plans declined from 80% of full time employees in 1985 to 19% in 2012, while employee participation in defined contribution plans increased from 41% to 51% over the same period. Between 1985 and 2011, the total number of defined contribution plans grew 38%, from 461,963 to 638,390, while over the same time period the number of defined benefit plans decreased 73%, from 170,172 to 45,256. According to Cerulli Associates, a financial services research firm, total U.S. retirement account assets are expected to grow 38% from $16 trillion in 2011 to $22 trillion by 2016. The paradigm shift in savings responsibilities from institutions to individuals will drive much of this growth into the defined contribution and IRA markets, with defined contribution plan assets expected to grow from $4.8 trillion to $5.8 trillion and IRA assets expected to grow from $5.2 trillion to $7.6 trillion between 2011 and 2016. In addition, the anticipated growth of the rollover market presents a considerable long-term opportunity: according to a 2013 LIMRA survey, assets rolled into IRAs exceeded $350 billion per year in 2011 (up 90% from 10 years prior) and are expected to reach approximately $575 billion per year by 2016. |
| • | Insufficient life insurance coverage. According to the most recent study published by LIMRA in September 2013, 58 million or approximately half of all U.S. households do not believe they have sufficient life insurance coverage. The average U.S. household with life insurance coverage only owns enough to replace 3.5 years of income, as compared to the 7- to 12- year average recommended range as sourced by LIMRA. |
We believe these market trends will drive increasing demand for our Retirement Solutions, Investment Management and Insurance Solutions businesses, and highlight the value of our holistic investment advisory approach as a means to help customers realize their retirement savings and income goals.
Our Competitive Strengths
We believe that we have a number of competitive strengths which will allow us to capitalize on attractive market opportunities as we develop and grow our business in a consistent and prudent manner.
| • | Leadership positions in our ongoing business with a broad range of product offerings capable of meeting the evolving financial needs of customers throughout their lives. We have leading positions in our Retirement Solutions and Insurance Solutions businesses and a prominent Investment Management business with top-tier investment performance across an array of asset classes. Few of our competitors have the breadth and scale across savings and financial protection products that customers will need throughout their lives. |
| • | Our Retirement Solutions business ranks as the number two provider of defined contribution retirement plans in the U.S. as measured by the number of plan sponsors, and number three as measured by the number of plan participants for which we provide recordkeeping services as of September 30, 2013. We are one of the few retirement services providers in the U.S. capable of using our industry presence and scale to efficiently support small, mid, large and mega-sized employers in the 401(k), 403(b) and 457 market segments. |
-196-
Table of Contents
| • | Our Investment Management business is a leading U.S. based asset manager, with 73% of our Investment Management managed funds (i.e., variable portfolios and mutual funds) beating their Morningstar category average and 81% having lower volatility than their Morningstar competitor average on a five-year asset-weighted basis as of December 31, 2013. |
| • | Our Insurance Solutions business provides a full range of product capabilities and was the thirteenth largest writer of term life, and the twenty-fourth largest writer of universal life based on premiums sold in the United States as of December 31, 2013. We are also the sixth largest provider of medical stop loss coverage in the United States based on annual premiums as reported by MyHealthguide on June 3, 2013. |
| • | Relationships with approximately 13 million customers as of December 31, 2013. We believe the size, scope and long-standing market presence of our businesses provide us with access to millions of individual customers, relationships with and relevance to distributors across the financial services landscape, economies of scale, and an understanding of and ability to leverage best practices across our organization. We can offer customers with whom we have built a relationship, either through their employer or directly, a suite of products that can meet most of their lifetime protection and accumulation needs. |
| • | Our institutional businesses provide us with the ability to access millions of individual customers in a cost-effective manner, and our comprehensive product suite gives us the opportunity to convert these touch points into long-term customer relationships. |
| • | Our access to individuals at critical points in their lives and our ability to offer tailored protection, retirement, investment and savings products enables us to cultivate deep, long-lasting and profitable customer relationships. Our product suite includes IRAs, mutual funds and annuities which enables us to maintain a relationship with individuals entering retirement or exiting their current plan for any other reason. According to a 2011 report by LIMRA, approximately 75% of roll-over assets are captured by an institution with which the customer had a prior relationship. |
| • | Extensive, multi-channel distribution network with strong producer relationships. We offer customers access to our products and services through a national, multi-channel distribution network that includes approximately 220,000 individual points of contact associated with both affiliated and unaffiliated distributors as of December 31, 2013. |
| • | Our distribution network consists of product and business specific channels, meeting the unique requirements and preferences of our customers in each of our businesses, and includes direct, institutional, intermediary, strategic and internal wholesale channels. |
| • | We cultivate long-standing, loyal relationships with our distribution partners by providing innovative products, highly responsive service and efficient technology solutions. |
| • | As a strong and preferred distribution partner, we focus on supporting our independent distribution partners and have extensive experience in channel conflict resolutions. |
| • | The strong relationships in our well-established and extensive multi-channel distribution networks are a key aspect of achieving our long term goals. |
| • | Scalable operating platform. We have developed a highly scalable business model which positions us well for future growth opportunities. Our operating platform supports both current and significantly higher volumes of business, positioning us favorably for margin expansion in the future. |
| • | Our Retirement Solutions business has operational centers of excellence that are leveraged across the Institutional Retirement Plans (full service and recordkeeping) and Individual Markets businesses to efficiently and cost effectively provide high quality services to all clients. |
| • | Our Investment Management business has developed product manufacturing capabilities that would enable the business to manage a significant amount of additional assets with limited increase in costs. |
-197-
Table of Contents
| • | Our Insurance Solutions business has scalable operational models that provide us the capability to add new business at attractive marginal costs and to quickly increase capacity to take advantage of attractive market conditions. |
| • | Renewed financial strength. We have taken decisive actions to strengthen our balance sheet over the last four years by repositioning and reducing the risk of our investment portfolio, hedging our closed block against market-related volatility, deleveraging our capital structure and bolstering our holding company liquidity position. |
| • | Our U.S. insurance subsidiaries have maintained an estimated combined RBC ratio at or above 425% as of the end of each quarter during 2011, 2012 and 2013. |
| • | Our investment portfolio of $87.1 billion as of December 31, 2013, comprises approximately 83.5% fixed maturity securities, of which 95.9% have been assigned credit quality ratings of 1 or 2 by the NAIC. |
| • | Between December 31, 2008 and December 31, 2013, we reduced our Alt-A exposure 93.1% from $4.5 billion to $307.4 million, our subprime holdings 83.1% from $3.6 billion to $614.7 million and our CMBS exposure 63.5% from $9.4 billion to $3.4 billion based on amortized cost. As of December 31, 2013, we had no direct sovereign exposure to Greece, Ireland, Portugal, Spain or Italy (peripheral Europe) and no direct exposure to financial institutions based in those countries. |
| • | We decided to cease sales of retail variable annuity products with substantial guarantee features (the last policies were issued in early 2010) and placed this portfolio and the institutional spread products portfolio in run-off. Subsequently, we refined our hedge program to dynamically protect regulatory and rating agency capital of the variable annuities block for adverse equity market movements. In addition, since 2010, we have increased statutory reserves considerably, added significant interest rate risk protection and have more closely aligned our policyholder behavior assumptions with experience. |
| • | We enhanced our capital structure and significantly reduced financial leverage. |
| • | Stringent risk management approach. Over the past few years, we have become increasingly focused on risk management and risk control. We have established an independent risk management function with responsibility for all risk management across the organization enabling clear separation of duties between risk, finance and investment functions. |
| • | We have comprehensive risk management and control procedures at all levels of our organization that support business strategies, formulate risk appetite, implement risk related policies and monitor limits. |
| • | We adhere to a strong policy and reporting framework that guides a multi-tiered risk governance structure in the assessment and management of risk and includes a daily feedback mechanism. |
| • | We follow disciplined processes to assess, measure, report and manage risks, including product development and pricing, ALM, capital management and risk mitigating activities such as hedging and reinsurance. |
| • | We maintain a dynamic hedge program that seeks to protect against select equity market and interest rate risks. |
| • | Highly experienced management team, supported by deep bench of talent. Our senior management team has extensive experience in the retirement, investment management and insurance sectors and is supported by a diverse group of talented executives throughout the Company. |
| • | Our 9 executive officers average over 25 years of financial services experience and are actively instilling a performance-driven, execution-oriented culture across our organization. |
| • | 6 of our 9 executive officers have joined the Company since the financial crisis of 2008-2009, and have successfully put in place a set of strategies that are helping to define our Company today, including risk management initiatives, balance sheet discipline, and product portfolio improvements. |
-198-
Table of Contents
Our Business Strategy
Building on our core strengths, we intend to pursue strategies to deliver consistent earnings growth with attractive risk-adjusted returns while maintaining a strong balance sheet. The immediate focus of our strategy is to improve the operating ROE of our ongoing business. We have identified more than thirty ROE-enhancing projects across our businesses and functions intended to improve operating ROE of our ongoing business to a goal in the range of 12% to 13% by 2016. The operating ROC of our ongoing business increased from 7.2% in 2012 to 8.6% in 2013 and is expected to increase to a goal in the range of 10% to 11% by 2016. Operating ROE and operating ROC are non-GAAP financial measures. For additional detail on our ROC expansion goal and the calculation of operating ROE and operating ROC and reconciliations, see “—Operating Return on Capital Goal”. The cornerstones of our prudent ROE and ROC expansion strategy are the following:
| • | Improve the profitability of our existing franchises. We have identified and are actively pursuing several initiatives to improve profitability across our businesses. These initiatives include maintaining strict pricing discipline for new sales, re-pricing existing blocks of business that do not meet our return hurdles, allowing the run-off of unprofitable books that cannot be re-priced and adjusting policyholder crediting rates. For instance, we recently instituted price increases across certain term and universal life products, positioning them to earn double-digit returns. We are working to reduce our operating and information technology overhead by leveraging our procurement capabilities to reduce expenses, increasing our use of business process outsourcing services and employing “Six Sigma” statistical management techniques. We believe these initiatives will enhance our margins and support improved earnings and increased cash flow distributions from our operating subsidiaries to ING U.S., Inc. going forward. |
| • | Focus on capital management across all businesses. We are highly focused on effectively managing the demands for capital across our businesses. We have prioritized growth in our higher return, less capital intensive Retirement Solutions and Investment Management businesses. Our Insurance Solutions business is focused on selling capital-efficient products such as indexed products in Individual Life and Employee Benefits products. The overall objective of these policies is to realign our businesses in a manner that will maximize free cash flow generation. |
| • | Leverage leading market positions, investment performance, and distribution strength to drive profitable growth in select markets. Within Retirement Solutions, we are targeting the small-mid corporate and education retirement plan markets. We will target growth in the healthcare and government markets selectively based on opportunities for economically sustainable value delivery with acceptable returns. We are also seeking to expand relationships with our large recordkeeping-only clients by offering the full breadth of ING U.S.’s capabilities, including Retirement Readiness solutions, for their plan participants. Within Investment Management, we are focused on leveraging our strong investment track record and historical performance to attract new institutional and individual customers in our third party business and to increase the share of proprietary assets under the management of Retirement Solutions. Given our scalable operating platform we believe our growth will produce margin expansion in these segments. Also, although we are deemphasizing parts of our Insurance Solutions business, it provides key capabilities, broad distribution and seasoned underwriting that complement Retirement Solutions and Investment Management in helping customers attain their financial goals. |
| • | Transcend boundaries between workplace benefits and personal financial products. We aim to deliver comprehensive solutions across our customer base by combining the capabilities of our three ongoing businesses. This combination of capabilities differentiates us from other financial services firms and allows us to capitalize on favorable demographic and social trends. For individuals, we intend to provide value-added services and increase the number of our products they consume. In Retirement Solutions, we have been seeking greater access to employees in employer-sponsored plans. We believe that such direct access will allow us to convert institutional relationships into individual ones and enable us to offer individuals entering retirement or exiting their current employer-sponsored plan for any other reason suitable products in which they can invest their retirement plan assets. In Insurance Solutions, we have been working with employer clients to offer a broader array of voluntary |
-199-
Table of Contents
| products to address the needs of their employees. Ultimately, we aspire to bridge the gap between workplace benefits and personal financial products in order to benefit our customers. |
| • | Protect our balance sheet by prudently managing risks. Risk management is pervasive in everything we do as a Company. The coordination of our strategic, financial and risk functions has been critical to helping us focus on risk reduction initiatives as well as determining where to invest for the future. We have substantially reduced the risk of our investment portfolio since 2008 and intend to continue managing it conservatively. On the liability side, we have significantly deleveraged our capital structure, are keenly focused on managing tail risks and have implemented a hedge program designed to substantially mitigate the effect of market shocks on our regulatory and rating agency capital adequacy, especially as it relates to the CBVA segment. Our hedge program is regularly evaluated and revised in light of changing market conditions and to manage the trade-offs between capital preservation, cash flow, earnings and underlying economics. |
Our Brand
Our company’s leadership and reputation in the financial services industry is built from the strong heritage of our brand. Through a history of acquisitions, including the Aetna, ReliaStar, Equitable of Iowa, Security Life of Denver brands, we have consistently integrated and branded our operations to achieve outstanding customer awareness, brand attributes, and brand affiliation. Since 2001, we largely consolidated our operations under the globally recognized ING brand. According to industry branding surveys, brand awareness for ING in the U.S. has grown dramatically, increasing from 11% in 2001 to 76% in 2013.
The ING U.S. brand is associated with retirement, investment and insurance products and solutions that deliver financial security, and as we become a standalone company, we plan to leverage our high brand awareness and brand strength to create a new brand that supports our mission of making a secure financial future possible for all of our customers.
We plan to invest substantial resources to develop and build awareness of our new brand, based on our vision to be America’s Retirement Company™. We believe that strong brand recognition is the first step in reestablishing ourselves with all of our stakeholders as a standalone company.
We have developed detailed plans for executing both the operational and legal entity rebranding efforts. On April 11, 2013, we announced plans to rebrand as “Voya Financial”, and in January 2014, we announced additional details regarding the operational and legal work associated with the rebranding. Based on current expectations, ING U.S., Inc. will change its legal name to Voya Financial, Inc. in April 2014; and in May 2014 our Investment Management and Employee Benefits businesses will begin using the Voya Financial brand. In September 2014, our remaining businesses will begin using the Voya Financial brand and all remaining ING U.S. legal entities that currently have names incorporating the “ING” brand will change their names to reflect the Voya brand. We anticipate that the process of changing all marketing materials, operating materials and legal entity names containing the word “ING” or “Lion” to our new brand name will take approximately 24 months and will cost between $40 million and $50 million, excluding incremental advertising expenses.
Operating Return on Equity
We measure our performance using various financial and operational metrics such as new business internal rate of return, customer satisfaction and employee engagement. We focus in particular on ongoing business operating ROE and ongoing business operating ROC as key financial metrics for our stakeholders because these metrics indicate how effectively we use our capital resources.
We have described below our ongoing business operating ROC, which measures how effectively we use both debt and equity capital resources, for the years ended December 31, 2013, 2012 and 2011, as well as our goal to increase our ongoing business operating ROC from a baseline of 7.2% in 2012 prior to our IPO to a 2016 range of 10% to 11%.
-200-
Table of Contents
We believe that ongoing business operating ROE, which measures how effectively we use equity capital resources, is a useful measure for equity investors and we currently have disclosed and continue to disclose our ongoing business operating ROE on a periodic basis. We have not set forth our operating ROE for any historical period in this registration statement, as we believe our recapitalization activities leading up to our IPO limit the comparability of actual historical ongoing business operating ROE for most historical periods with our future operating ROE now that we have completed our IPO-related recapitalization activities.
Nevertheless, in order to assist investors with understanding how our future ongoing business operating ROC goals would translate into ongoing business operating ROE, we calculate that, if we achieve our goal of increasing our 2016 ongoing business operating ROC to a range of 10% to 11%, our 2016 ongoing business operating ROE would be in the range of 12% to 13%. In order to translate anticipated ongoing business operating ROC into ongoing business operating ROE for this period, we divided projected operating earnings after income taxes of our ongoing business by the projected average capital of our ongoing business, after adjusting for projected interest expense and projected financial leverage of the ongoing business. Given that we do not classify any of the results of the CBVA segment as operating earnings, we do not focus on total Company operating ROE as a performance indicator.
In calculating our ongoing business operating ROE goals:
| • | We assumed our ongoing businesses will have a financial leverage-to-capital ratio of approximately 25% in each year; |
| • | We assumed that we will not retain capital in our ongoing businesses in excess of our target statutory capital levels; |
| • | We assumed a weighted average pre-tax interest rate of 5.5% on financial leverage for all periods prior to the third quarter of 2013, when the Company completed its recapitalization initiatives, and the actual weighted average pre-tax interest rate for all periods starting with the third quarter of 2013; |
| • | We assumed an effective tax rate of 35%; and |
| • | We assumed no favorable or unfavorable unlocking of DAC/VOBA and other intangibles. |
Ongoing business operating ROE is a non-GAAP financial measure. Other companies may use a similar non-GAAP financial measure that is calculated differently from the way we calculate it. Accordingly, our ongoing business operating ROE may not be comparable to a similar measure used by other companies.
Operating Return on Capital Goal
For our ongoing business segments we focus on operating ROC, which is a measure of our operating results relative to the capital we have deployed in each segment. We have established specific operating ROC goals for each business segment within our ongoing business and for the ongoing business as a whole, which we intend to meet by the end of 2016. We do not allocate debt at the segment level and, as such, do not have ROE goals for each segment.
Our goal is to operate our ongoing business to deliver an attractive operating ROC. We believe that the presentation of our ongoing business operating ROC enhances the understanding of our results of operations by highlighting our underlying profitability relative to capital. We believe that delivering an attractive operating ROC should increase our enterprise valuation, improve our access to the capital markets, lower our cost of capital and help attract and retain talent.
Ongoing business operating ROC is a non-GAAP financial measure. Other companies may use a similar non-GAAP financial measure that is calculated differently from the way we calculate it. Accordingly, our ongoing business operating ROC may not be comparable to a similar measure used by other companies. We
-201-
Table of Contents
calculate ongoing business operating ROC by dividing operating earnings before interest and after income taxes, by average capital. When we calculate our ongoing business operating ROC, we use the following methodology:
| • | Operating earnings before interest and after income taxes for our ongoing business is calculated by aggregating the operating earnings before income taxes for each segment included within our ongoing business, in each case assuming an effective tax rate of 35%. Because interest expense related to financial leverage is recorded in our Corporate segment, no adjustment for interest expense is required with respect to operating earnings before income taxes for our ongoing business. |
| • | With respect to historical periods, we exclude favorable or unfavorable unlocking of DAC/VOBA and other intangibles. With respect to future periods, we assume no favorable or unfavorable unlocking of DAC/VOBA and other intangibles. |
| • | Average capital for our ongoing business is calculated by determining total Company average capital, allocating that average capital to each of our segments, and then aggregating segment average capital for each of the segments included within our ongoing business. |
| • | Total Company average capital is equal to the average ING U.S., Inc. shareholders’ equity, excluding AOCI, plus total Company average financial leverage. |
| • | Total Company financial leverage is calculated as the sum of consolidated short-term debt and long-term debt, plus, with respect to periods prior to the completion of our recapitalization program, loans from certain subsidiaries, and, in all periods, excluding operating leverage. We define operating leverage as self-liquidating forms of financing, such as securities lending, reverse repurchase and captive reinsurance reserve financing arrangements. For a reconciliation of financial leverage to total long-term and short-term debt, see “—Calculations and Reconciliations.” |
| • | Total Company average capital is allocated to each of our segments in proportion to each segment’s target statutory capital, plus an allocation of the differences between statutory capital and total ING U.S., Inc. shareholders’ equity on a U.S. GAAP basis (excluding AOCI), based on each segment’s portion of these differences. Statutory surplus in excess of target statutory capital and certain corporate assets and liabilities, such as certain deferred tax assets and liabilities for unfunded pension plans, are allocated to the Corporate segment. |
| • | Certain recapitalization steps we have completed to date have reduced the capital for the ongoing business and increased the CBVA capital. We did not adjust our baseline operating ROC for 2012 to make any reduction in average capital for our ongoing business. |
With respect to calculating total Company operating ROC, we assumed that we will return to shareholders capital in excess of our target statutory capital levels. Maintaining a financial leverage-to-capital ratio in line with our targeted level of approximately 25%, we expect to generate over $1.7 billion of excess capital, after funding new business strain and holding company expenses, during the period of 2013 through 2016 that could be available for redeployment, including for return to shareholders.
For purposes of measuring our progress towards our ongoing business operating ROC goal, when calculating our ongoing business operating ROC for 2013, 2012 and 2011, we adjusted our operating earnings before interest and after income taxes for those periods to exclude net earnings effects associated with investment portfolio restructurings implemented in 2012, and the net gain from Lehman Recovery/LIHTC in 2013, because we believe that such effects are not reflective of the performance of our ongoing business.
We believe that excluding these items provides a more meaningful measure for assessing our business performance against our long-term operating ROC goal for our ongoing business. We refer to our operating earnings before interest and after income taxes, as adjusted for these items, as “adjusted operating earnings before interest and after income taxes.” For a reconciliation of this to operating earnings before income taxes, see
-202-
Table of Contents
“—Calculations and Reconciliations.” Other significant items may occur in the future which could impact the comparability of our reported ongoing business operating ROC for future periods to our long term objectives described below.
Our goal is to increase our ongoing business operating ROC from a baseline of 7.2% in 2012, to a 2016 range of 10% to 11%. During this period, our plan is to improve operating ROC by between 70 basis points and 100 basis points each year. During 2013, we increased the ongoing business operating ROC to 8.6%, an increase of approximately 140 basis points over 2012 (including positive items that may not recur in future periods). These long-term goals are premised on a number of significant assumptions and are, by their nature, subject to significant uncertainties and contingencies, many of which are outside of our control and further described below.
As part of our efforts to reach our ongoing business operating ROC goal, for four of the segments included in our ongoing business we have set segment-level 2016 operating ROC goals. For our Investment Management segment, which is also included in our ongoing business, we have set a 2016 operating margin goal that we seek to achieve. We calculate operating margin in our Investment Management segment by dividing operating earnings before interest and income taxes by total operating revenues. These goals are:
| • | Retirement: 2016 operating ROC goal in the range of 10% to 11%; |
| • | Annuities: 2016 operating ROC goal in the range of 7% to 9%; |
| • | Investment Management: 2016 operating margin goal in the range of 30% to 34%; |
| • | Individual Life: 2016 operating ROC goal in the range of 6% to 8%; and |
| • | Employee Benefits: 2016 operating ROC goal in the range of 18% to 22%.(1) |
| (1) | Without the annually renewable reinsurance transaction in our Employee Benefits segment, which lowers the required capital for the segment, the operating ROC goal is in the range of 11% to 13%. |
In late 2011, we established a process to identify and track over thirty strategic initiatives across all our businesses and functions to help us reach our ongoing business operating ROC. For management purposes, we categorize each such initiative as a margin, growth or capital initiative. Within margin initiatives, we further specify the planned attributions from cost savings, re-pricing actions and the run-off of unprofitable blocks of business. Concurrently with our cost rationalization efforts, we plan to continue to make necessary investments in our businesses to help facilitate our ability to best serve our customers, including our planned efforts to rebrand our company, the anticipated cost of which is not included in the calculation of our operating ROC goal. See “—Our Brand.” We detail each of these initiative categories below and their target attribution range to the overall ongoing business operating ROC goal.
Margin Initiatives. Our plan calls for margin initiatives to be the greatest contributor to our ongoing business operating ROC goal, generating 230 basis points to 270 basis points improvement over the period from 2013 through 2016. During 2013, margin initiatives delivered approximately 112 basis points of ROC improvement (including positive items that may not recur in future periods). The largest initiatives over the plan period include: (a) enterprise-wide cost rationalization efforts where our goal is to reduce 2016 annual operating expenses by a minimum of $100 million pre-tax as compared to 2012; (b) reducing expense and commission structures in Individual Life given anticipated lower future sales volumes; (c) crediting rate reductions in our Retirement and Individual Life segments; (d) run-off of the MYGA business in our Annuities segment; (e) cost rationalization efforts in our Retirement segment (in addition to the enterprise-wide efforts described above) which include cost reductions in discretionary expenditures and measures to increase efficiencies in staffing; (f) margin and pricing improvement efforts in our Retirement segment, through improved assumption setting
and risk management and growth of the return on capital of its large/mega recordkeeping and full service plans; and (g) loss ratio improvement efforts for stop loss policies written by our Employee Benefits segment, driven by improving underwriting, claims processing and product features.
-203-
Table of Contents
Growth Initiatives. Our plan calls for growth initiatives to generate 170 basis points to 200 basis points improvement to our ongoing business operating ROC over the period from 2013 through 2016. During 2013, growth initiatives delivered approximately 39 basis points of ROC improvement. The largest initiatives over the plan period include: (a) the strategy of our Retirement segment to capitalize on our deep institutional relationships to enhance the presence of our Individual Markets business (particularly in the rollover market); (b) efforts by our Investment Management business to actively grow our third party institutional and retail business given our competitive investment performance in attractive asset classes; (c) within Investment Management, continued earnings growth in our alternatives asset class; and (d) efforts by our Annuities segment to increase sales of our Select Advantage mutual fund given its low capital requirements.
Capital Initiatives. Capital initiatives are anticipated to make additional incremental contributions to our ongoing business operating ROC over the period from 2014 to 2016. During 2013, capital initiatives delivered approximately 40 basis points of ROC improvement. Capital optimization efforts are being implemented across our ongoing business that we believe will add incremental improvement to the ongoing business operating ROC. Many of our margin initiatives are intended to enhance both margin and capital efficiencies, such as the focused run-off of our unprofitable businesses and emphasis on less capital intensive product categories, and have been described above. Capital-specific initiatives include various reinsurance transactions and a shift in our product mix towards less capital intensive, fee-based products. Our operating ROC goal for our ongoing business assumes we operate at our target capitalization level, which is currently a 425% RBC ratio for our four Principal U.S. insurance company subsidiaries on a combined basis.
Impact of continued low interest rate environment. At the time we formed our goals, we estimated the contribution of each initiative category described above without reflecting the impact of a low interest rate environment. However, our ongoing business operating ROE goal of 12% to 13%, our ongoing business operating ROC goal of 10% to 11%, and our segment ROC and margin targets do reflect the negative effect of a low interest rate environment, which we expected would negatively impact our ongoing business operating ROC by 110 basis points to 130 basis points over the period from 2013 through 2016. This negative effect reflects expected lower investment income due to lower portfolio yields compared to 2012 levels in Retirement and Insurance Solutions, and expected lower net margin (investment income less credited interest) compared to 2012 levels in Annuities. In calculating the impact of a low interest rate environment, we utilized the forward interest curve as of July 31, 2012, which reflected modestly increasing rates over time, and included the impact of DAC/VOBA and other intangibles and taxes. If interest rates observed over the second half of 2012 were to have persisted over 2013, and continued to persist over the entire period of 2014 through 2016, our results would experience a more negative impact. If the interest rate curve in effect on December 31, 2013 were to be realized, we expect that the negative impact of low interest rates described above would be reduced significantly. See “Risk Factors—The level of interest rates may adversely affect our profitability, particularly in the event of a continuation of the current low interest rate environment or a period of rapidly increasing interest rates.” During 2013, we experienced approximately 44 basis points of ROC decrease due to the negative effects of the low interest rate environment.
In setting the operating ROC goal described above, we have made significant assumptions with respect to, among other things:
| • | general conditions of the markets in which our businesses operate; |
| • | movements of interest rates, particularly given the current sustained low interest rate environment; |
| • | movements of equity markets; |
| • | investment yields; |
| • | the effectiveness of our enterprise-wide and segment-specific cost rationalization efforts; |
| • | mortality rates, morbidity rates, persistency rates and other underwriting assumptions; |
-204-
Table of Contents
| • | our ability to maintain financial leverage commensurate with our current credit ratings and a long-term financial leverage to capital ratio of 25%; |
| • | the absence of any change in our credit ratings due to our proposed strategic actions; |
| • | benefit costs, particularly in healthcare; and |
| • | the continuation of current compensation practices. |
While these long-term goals are presented with numerical specificity and we believe such goals to be reasonable as of the date of this prospectus, given the uncertainties surrounding such assumptions, there are significant risks that these assumptions may not be realized and thus the goals may not be achieved. Accordingly, our actual results are likely to differ from these goals and the differences may be material and adverse, particularly if actual events adversely differ from one or more of our key assumptions. The goals and their underlying assumptions are forward-looking statements. We strongly caution investors not to place undue reliance on any of these assumptions or goals. Except as may be required by applicable securities laws, we are not under any obligation (and expressly disclaim any obligation) to update or alter any assumptions, goals, projections or other related statements that we may make. See “Note Regarding Forward-Looking Statements” and “Risk Factors” for additional information regarding these forward-looking statements.
-205-
Table of Contents
Calculations and Reconciliations
The tables below present operating ROC for each of our segments, for our ongoing business and for the total Company, for the periods indicated.
| Year Ended December 31, 2013 | ||||||||||||||||||||||||||||||||||||
| ($ in millions, unless otherwise indicated) | Retirement Solutions | Investment Management |
Insurance Solutions | Total Ongoing Business |
Closed Block Variable Annuity |
Corporate & Other Closed Blocks |
Total Company |
|||||||||||||||||||||||||||||
| Retirement | Annuities | Individual Life |
Employee Benefits |
|||||||||||||||||||||||||||||||||
| Average Capital(1) |
$ | 3,915 | $ | 1,762 | $ | 303 | $ | 2,804 | $ | 354 | $ | 9,137 | $ | 4,092 | $ | 1,226 | $ | 14,455 | ||||||||||||||||||
| Adjusted operating earnings before interest and after income taxes(2) |
349.2 | 128.0 | 107.2 | 136.7 | 66.5 | 787.6 | — | 10.6 | 798.2 | |||||||||||||||||||||||||||
| Adjusted Operating Return on Capital |
8.9 | % | 7.3 | % | 35.4 | % | 4.9 | % | 18.8 | % | 8.6 | % | 0.0 | % | N/M | 5.5 | % | |||||||||||||||||||
| Year Ended December 31, 2012 | ||||||||||||||||||||||||||||||||||||
| ($ in millions, unless otherwise indicated) | Retirement Solutions | Investment Management |
Insurance Solutions | Total Ongoing Business |
Closed Block Variable Annuity |
Corporate & Other Closed Blocks |
Total Company |
|||||||||||||||||||||||||||||
| Retirement | Annuities | Individual Life |
Employee Benefits |
|||||||||||||||||||||||||||||||||
| Average Capital(1) |
$ | 4,308 | $ | 2,210 | $ | 289 | $ | 2,702 | $ | 421 | $ | 9,930 | $ | 3,357 | $ | 599 | $ | 13,886 | ||||||||||||||||||
| Adjusted operating earnings before interest and after income taxes(2) |
308.1 | 129.7 | 86.0 | 115.7 | 71.0 | 710.5 | — | 39.6 | 750.1 | |||||||||||||||||||||||||||
| Adjusted Operating Return on Capital |
7.2 | % | 5.9 | % | 29.8 | % | 4.3 | % | 16.9 | % | 7.2 | % | 0.0 | % | 6.6 | % | 5.4 | % | ||||||||||||||||||
| Year Ended December 31, 2011 | ||||||||||||||||||||||||||||||||||||
| Retirement Solutions | Investment Management |
Insurance Solutions | Total Ongoing Business |
Closed Block Variable Annuity |
Corporate & Other Closed Blocks |
Total Company |
||||||||||||||||||||||||||||||
| Retirement | Annuities | Individual Life |
Employee Benefits |
|||||||||||||||||||||||||||||||||
| Average Capital(1) |
$ | 4,210 | $ | 2,380 | $ | 306 | $ | 2,359 | $ | 410 | $ | 9,665 | $ | 3,231 | $ | 693 | $ | 13,589 | ||||||||||||||||||
| Adjusted operating earnings before interest and after income taxes(2) |
258.5 | 79.0 | 56.9 | 185.7 | 54.1 | 634.3 | — | 61.5 | 695.8 | |||||||||||||||||||||||||||
| Adjusted Operating Return on Capital |
6.1 | % | 3.3 | % | 18.6 | % | 7.9 | % | 13.2 | % | 6.6 | % | 0.0 | % | 8.9 | % | 5.1 | % | ||||||||||||||||||
| (1) | For segment average capital amounts, we allocate total Company average capital to each of our segments in proportion to each segment’s target statutory capital, plus an allocation of the differences between statutory capital and Total ING U.S., Inc. shareholders’ equity on a U.S. GAAP basis (excluding AOCI), based on each segment’s portion of these differences. Total Company average capital is calculated as follows: |
| As of December 31, | ||||||||||||
| ($ in millions, unless otherwise indicated) | 2013 | 2012 | 2011 | |||||||||
| ING U.S., Inc. Shareholders’ Equity |
$ | 13,272.2 | $ | 13,874.9 | $ | 12,353.9 | ||||||
| AOCI |
1,849.1 | 3,710.7 | 2,595.0 | |||||||||
|
|
|
|
|
|
|
|||||||
| ING U.S., Inc. Shareholders’ Equity, excluding AOCI |
11,423.1 | 10,164.2 | 9,758.9 | |||||||||
| Financial Leverage(a) |
3,514.7 | 3,808.3 | 4,041.3 | |||||||||
|
|
|
|
|
|
|
|||||||
| Total Capital |
$ | 14,937.8 | $ | 13,972.5 | $ | 13,800.2 | ||||||
|
|
|
|
|
|
|
|||||||
| Financial Leverage to Total Capital |
23.5 | % | 27.3 | % | 29.3 | % | ||||||
| Average Capital (average for period) |
$ | 14,455.2 | $ | 13,886.4 | $ | 13,588.7 | ||||||
-206-
Table of Contents
| (a) | Financial leverage is defined as short-term debt, long-term debt and loans from certain subsidiaries, excluding operating leverage. We define operating leverage as self-liquidating forms of financing, including securities lending, reverse repurchase and captive reinsurance reserve financing arrangements. The following table presents a reconciliation of financial leverage to total debt: |
| As of December 31, | ||||||||||||
| ($ in millions, unless otherwise indicated) | 2013 | 2012 | 2011 | |||||||||
| Short-term Debt |
$ | — | $ | 1,064.6 | $ | 1,054.6 | ||||||
| Long-term Debt |
3,514.7 | 3,171.1 | 1,343.1 | |||||||||
|
|
|
|
|
|
|
|||||||
| Total Debt |
3,514.7 | 4,235.7 | 2,397.7 | |||||||||
| Less: operating leverage |
— | (688.4 | ) | (688.4 | ) | |||||||
| Plus: loans from subsidiaries |
— | 261.0 | 2,332.0 | |||||||||
|
|
|
|
|
|
|
|||||||
| Financial Leverage |
$ | 3,514.7 | $ | 3,808.3 | $ | 4,041.3 | ||||||
|
|
|
|
|
|
|
|||||||
| (2) | Adjusted Operating earnings before interest and after income taxes is calculated as follows: |
| Year Ended December 31, 2013 | ||||||||||||||||||||||||||||||||||||
| ($ in millions) | Retirement Solutions | Investment Management |
Insurance Solutions | Total Ongoing Business |
Closed Block Variable Annuity |
Corporate & Other Closed Blocks |
Total Company |
|||||||||||||||||||||||||||||
| Retirement | Annuities | Individual Life |
Employee Benefits |
|||||||||||||||||||||||||||||||||
| Operating earnings before income taxes |
$ | 595.8 | $ | 293.8 | $ | 178.1 | $ | 254.8 | $ | 106.1 | $ | 1,428.6 | — | $ | (160.0 | ) | $ | 1,268.6 | ||||||||||||||||||
| Less: |
||||||||||||||||||||||||||||||||||||
| Interest Expense |
— | — | — | — | — | — | — | (179.7 | ) | (179.7 | ) | |||||||||||||||||||||||||
| DAC/VOBA and other intangibles unlocking(b) |
45.6 | 83.3 | — | 4.8 | (0.5 | ) | 133.2 | — | — | 133.2 | ||||||||||||||||||||||||||
| Net gain from Lehman Recovery/LIHTC(c) |
12.9 | 13.5 | 13.2 | 39.7 | 4.3 | 83.6 | — | 3.4 | 87.0 | |||||||||||||||||||||||||||
|
|
|
|
|
|
|
|
|
|
|
|
|
|
|
|
|
|
|
|||||||||||||||||||
| Adjusted operating earnings before interest |
537.3 | 197.0 | 164.9 | 210.3 | 102.3 | 1,211.8 | — | 16.3 | 1,228.1 | |||||||||||||||||||||||||||
| Income tax expense(d) |
188.1 | 69.0 | 57.7 | 73.6 | 35.8 | 424.2 | — | 5.7 | 429.9 | |||||||||||||||||||||||||||
|
|
|
|
|
|
|
|
|
|
|
|
|
|
|
|
|
|
|
|||||||||||||||||||
| Adjusted operating earnings before interest and after income taxes |
$ | 349.2 | $ | 128.0 | $ | 107.2 | $ | 136.7 | $ | 66.5 | $ | 787.6 | — | $ | 10.6 | $ | 798.2 | |||||||||||||||||||
|
|
|
|
|
|
|
|
|
|
|
|
|
|
|
|
|
|
|
|||||||||||||||||||
| Year Ended December 31, 2012 | ||||||||||||||||||||||||||||||||||||
| ($ in millions) | Retirement Solutions | Investment Management |
Insurance Solutions | Total Ongoing Business |
Closed Block Variable Annuity |
Corporate & Other Closed Blocks |
Total Company |
|||||||||||||||||||||||||||||
| Retirement | Annuities | Individual Life |
Employee Benefits |
|||||||||||||||||||||||||||||||||
| Operating earnings before income taxes |
$ | 448.6 | $ | 102.2 | $ | 134.5 | $ | 196.2 | $ | 109.4 | $ | 990.9 | — | $ | (72.6 | ) | $ | 918.3 | ||||||||||||||||||
| Less: |
||||||||||||||||||||||||||||||||||||
| Interest Expense |
— | — | — | — | — | — | — | (127.8 | ) | (127.8 | ) | |||||||||||||||||||||||||
| DAC/VOBA and other intangibles unlocking |
5.8 | (86.2 | ) | — | 3.4 | — | (77.0 | ) | — | — | (77.0 | ) | ||||||||||||||||||||||||
| Impact of investment portfolio restructuring(a) |
(31.2 | ) | (11.2 | ) | 2.2 | 14.8 | 0.1 | (25.3 | ) | — | (5.8 | ) | (31.1 | ) | ||||||||||||||||||||||
|
|
|
|
|
|
|
|
|
|
|
|
|
|
|
|
|
|
|
|||||||||||||||||||
| Adjusted operating earnings before interest |
474.0 | 199.6 | 132.3 | 178.0 | 109.3 | 1,093.2 | — | 61.0 | 1,154.2 | |||||||||||||||||||||||||||
| Income tax expense(d) |
165.9 | 69.9 | 46.3 | 62.3 | 38.3 | 382.7 | — | 21.4 | 404.1 | |||||||||||||||||||||||||||
|
|
|
|
|
|
|
|
|
|
|
|
|
|
|
|
|
|
|
|||||||||||||||||||
| Adjusted operating earnings before interest and after income taxes |
$ | 308.1 | $ | 129.7 | $ | 86.0 | $ | 115.7 | $ | 71.0 | $ | 710.5 | — | $ | 39.6 | $ | 750.1 | |||||||||||||||||||
|
|
|
|
|
|
|
|
|
|
|
|
|
|
|
|
|
|
|
|||||||||||||||||||
-207-
Table of Contents
| Year Ended December 31, 2011 | ||||||||||||||||||||||||||||||||||||
| ($ in millions) | Retirement Solutions | Investment Management |
Insurance Solutions | Total Ongoing Business |
Closed Block Variable Annuity |
Corporate & Other Closed Blocks |
Total Company |
|||||||||||||||||||||||||||||
| Retirement | Annuities | Individual Life |
Employee Benefits |
|||||||||||||||||||||||||||||||||
| Operating earnings before income taxes |
$ | 441.9 | $ | 387.6 | $ | 87.5 | $ | 279.3 | $ | 83.3 | $ | 1,279.6 | — | $ | (160.0 | ) | $ | 1,119.6 | ||||||||||||||||||
| Less: |
||||||||||||||||||||||||||||||||||||
| Interest Expense |
— | — | — | — | — | — | — | (185.7 | ) | (185.7 | ) | |||||||||||||||||||||||||
| DAC/VOBA and other intangibles unlocking |
44.2 | 266.0 | — | (6.4 | ) | — | 303.8 | — | — | 303.8 | ||||||||||||||||||||||||||
| Reserve increase related to use of SSDMF(e) |
— | — | — | — | — | — | — | (68.9 | ) | (68.9 | ) | |||||||||||||||||||||||||
|
|
|
|
|
|
|
|
|
|
|
|
|
|
|
|
|
|
|
|||||||||||||||||||
| Adjusted operating earnings before interest |
397.7 | 121.6 | 87.5 | 285.7 | 83.3 | 975.8 | — | 94.6 | 1,070.4 | |||||||||||||||||||||||||||
| Income tax expense(d) |
139.2 | 42.5 | 30.6 | 100.0 | 29.2 | 341.5 | — | 33.1 | 374.6 | |||||||||||||||||||||||||||
|
|
|
|
|
|
|
|
|
|
|
|
|
|
|
|
|
|
|
|||||||||||||||||||
| Adjusted operating earnings before interest and after income taxes |
$ | 258.5 | $ | 79.1 | $ | 56.9 | $ | 185.7 | $ | 54.1 | $ | 634.3 | — | $ | 61.5 | $ | 695.8 | |||||||||||||||||||
|
|
|
|
|
|
|
|
|
|
|
|
|
|
|
|
|
|
|
|||||||||||||||||||
| (a) | Includes the net loss included in operating earnings from the sale of certain alternative investments and investment income associated with assets disposed of during the portfolio restructuring effected during 2012. |
| (b) | DAC/VOBA and other intangibles unlocking excludes unlocking on net investment income from Lehman Recovery/LIHTC, as described below. |
| (c) | Includes the net gain included in operating earnings from a distribution of cash and securities in conjunction with a Lehman Brothers bankruptcy settlement and the losses as a result of the decision to dispose of LIHTC partnerships as a means of exiting this asset class. Collectively, these items, net of DAC/VOBA and other intangibles impacts, are referred to as “Net gain from Lehman Recovery/LIHTC”. |
| (d) | Based on an assumed effective tax rate of 35%. |
| (e) | Adjustment to exclude an item that we believe is not reflective of performance in the period. See the Note for Commitments and Contingencies in our Consolidated Financial Statements. |
Retirement Solutions
Our Retirement Solutions business provides its products and services through two financial reporting segments: Retirement and Annuities. Retirement is focused on meeting the needs of individuals in preparing for and sustaining a secure retirement through employer-sponsored plans and services, as well as through individual account rollover plans and comprehensive financial product offerings and advisory services. Our Annuities segment provides fixed, indexed and payout annuities and mutual fund custodial accounts for pre-retirement wealth accumulation and post-retirement income management, sold through multiple channels.
Retirement
Our Retirement segment is well positioned in the marketplace, with our industry-leading Institutional Retirement Plans business and our growing Individual Markets business. The two businesses combined had $343.0 billion of AUM and AUA as of December 31, 2013, of which $60.8 billion were in proprietary assets.
Our Institutional Retirement Plans business offers tax-deferred employer-sponsored retirement savings plan and administrative services to small-mid corporations, large corporations, public and private school systems, higher education institutions, state and local governments, hospitals and healthcare facilities and not-for-profit organizations. This broad-based institutional business crosses many sectors of the economy, which provides diversification that helps insulate us from downturns in particular industries. In the defined contribution market, we provide services to approximately 47,000 plan sponsors covering more than 5 million plan participants in corporate, education, healthcare and government markets as of December 31, 2013. As of the latest Pensions and Investments survey published in March 2013, we rank second in the U.S. defined contribution plan market by number of record kept plan sponsors, third by number of plan participants served, and fifth by assets under management and administration as of September 30, 2013.
-208-
Table of Contents
Our Individual Markets business, which focuses on the rapidly expanding retiree market as well as on individuals and plan participants, offers retail financial products and comprehensive advice services to help individuals manage their retirement savings and income needs. While AUM and AUA for our Individual Markets business were $3.0 billion as of December 31, 2013, it is a key area of future growth for our Retirement segment.
Our Retirement segment earns revenue principally from asset and participant-based advisory and record-keeping fees. Retirement generated operating earnings before income taxes of $595.8 million for the year ended December 31, 2013. Our Investment Management business also earns arm’s-length market-based fees from the management of the general account and mutual fund assets supporting Institutional Retirement Plans and Individual Markets rollover products. Distribution of Investment Management products and services using the Retirement segment continues to present a growth opportunity for our Retirement and Investment Management segments that we are actively pursuing.
We will continue to focus on growing our retirement platform by driving increases in our full-service Institutional Retirement Plans business, particularly in the small-mid corporate and education markets, and by further developing our Individual Markets business with a particular focus on aggressively cross-selling products and services to our Institutional Retirement Plan participants. We will also continue to place a strong emphasis on capital and cost management, with a focus on optimizing our distribution platform and achieving a diversified retirement product mix. In addition, we continue to promote targeted plan monitoring and relationship building to further improve client retention. We believe these initiatives will increase segment revenues and profitability.
An important element of our Retirement strategy is to leverage the extensive customer base to which we have access through our Institutional Retirement Plans business in order to grow our Individual Markets and Investment Management businesses. This opportunity is especially attractive in light of the significant portion of our Institutional Retirement Plans business for which we provide recordkeeping-only services, with such plans encompassing nearly 3 million plan participants as of December 31, 2013. We are therefore focused on building long-term relationships with our plan participants, especially when initiated through service touch points such as plan enrollments and rollovers, which will go beyond their participation in our Institutional Retirement Plans and enable us to offer them individual retirement and investment management solutions both during and after the term of their plan participation.
Institutional Retirement Plans
Products and Services. We offer tax-deferred Institutional Retirement Plans (across all U.S. tax sectors for tax-advantaged retirement savings) to employers of all sizes, principally focusing on for-profit businesses, public and private K-12 education entities and higher education institutions. Within these markets, we offer two distinct product sets: full service and recordkeeping only.
Full-service retirement products provide recordkeeping, plan administration, tailored participant education and communication services, trustee services and institutional and retail investments. These include a wide variety of investment and administrative products for defined contribution plans across all U.S. tax sectors for tax-advantaged retirement savings, as well as defined benefit pension plans, nonqualified executive benefit plans and employer stock option plans. Plan sponsors may select from a variety of investment structures and products, such as general account, separate account, mutual funds, stable value or collective investment trusts and a variety of underlying asset types (including their own employer stock) to best meet the needs of their employees. A broad selection of funds is available for our products in all asset categories from over 100 fund companies, including the ING family of mutual funds managed by our Investment Management business. Our full-service retirement plan offerings are also supported by award-winning participant communications and education programs, as well as investment advisory services offered through our Individual Markets business or through third parties (e.g., Morningstar) to help prepare individuals for retirement through customer-focused personalized and objective investment advice.
-209-
Table of Contents
Recordkeeping service products provide administration support for plan sponsors seeking integrated record-keeping services for defined contribution, defined benefit and non-qualified plans. Our plan sponsor base spans the entire range of corporate plan sponsors as well as state and local governments. Our recordkeeping retirement plan offerings are also supported by award-winning participant communications and education programs, as well as investment advisory services offered through our Individual Markets business.
Our stable value products are offered with a particular focus on cross-selling products utilizing proprietary investment management to our largest institutional recordkeeping plans. Our product offering includes both separate account GICs and synthetic GICs managed by either proprietary or outside investment managers.
As a top five provider by assets under management and administration in the United States, our defined contribution leadership position comes from decades of experience, organic growth and strategic acquisitions that have allowed us to increase our size, scale and reputation. We are one of only a few defined contribution providers that offer products, services and support to the full spectrum of businesses, ranging from small to mega-sized plans.
The following chart presents our Institutional Retirement Plans product/service models and corresponding AUM and AUA, key markets in which we compete, primary defined contribution plan tax codes and core products offered for each market segment.
| Product/Service Model |
AUM/AUA (as of December 31, 2013) |
Key Market Segments/Product Lines |
Primary Defined Contribution Plan Tax Code |
Core Products* | ||||
| Full Service Plans | $93.3 Billion | Small-Mid Corporate K-12 Education Higher Education Healthcare Non-Profits Government (local and state) |
401(k) 403(b) 403(b) 403(b) 403(b) 457 |
ING MAP Select, ING Framewor(k) ING Custom Choice II Retirement Choice II Retirement Plus II Retirement Master II Custom Choice II, Custom Choice Blend | ||||
| Recordkeeping and Stable Value |
$246.7 Billion | Small-Mid Corporate Large Corporate Government (local and state) |
401(k) 401(k) 457 |
** ** ** | ||||
| Stable Value (Sold across all market segments with a strong focus on Large Corporate) |
401(k) 403(b) 457 |
Separate Account and Synthetic GICs | ||||||
| * | Core products actively being sold today. |
| ** | Offerings include administration services and investment options such as mutual funds, commingled trusts and separate accounts. |
For plans in the full service small-mid corporate segment, our core products are:
| • | ING MAP Select, a group funding agreement/group annuity contract offered to fund qualified retirement plans. The product contains over 300 funds from well known fund families (larger plans are offered the ability to offer most funds whose trades are cleared through the National Securities Clearing Corporation) as well as our general account and various stable value options. |
| • | ING Framewor(k), a mutual fund program offered to fund qualified retirement plans. The product contains over 300 funds from well-known fund families (larger plans are offered the ability to offer most funds whose trades are cleared through the National Securities Clearing Corporation) as well as our general account and various stable value options. |
For plans in the full service education, healthcare, non-profits and government segments, we offer a variety of customized products, including the following:
| • | Retirement Choice II, a retail mutual fund product which provides flexible funding vehicles and is designed to provide a diversified menu of mutual funds in addition to a guaranteed option (available through a group fixed annuity contract or stable value product). |
-210-
Table of Contents
| • | Retirement Plus II, Retirement Master II and Custom Choice II, registered group annuity products featuring variable investment options held in a variable annuity separate account and a fixed investment option held in the general account. |
| • | Custom Choice Blend, a combination product that can be used to support retail mutual funds through our subsidiary, ING National Trust, and/or an unregistered group annuity product featuring variable investment options held in a variable annuity separate account and a fixed investment option held in a general account. |
Markets and Distribution
Our Institutional Retirement Plans business can be categorized into two markets: Corporate and Tax Exempt. A brief description of each, including sub segments and strengths are as follows:
Corporate Markets:
| • | Small-Mid Corporate Market. In this growth market we offer full service solutions to defined contribution plans of small-mid corporate segment (e.g., typically less than 3,000 employees). Our comprehensive product offering (including flexible investment choices), highly competitive fiduciary solutions, dedicated and proactive service teams and product and service innovations leveraged from our expertise in the Large Corporate market make us one of a small group of providers who can service small-mid corporate plans as they continue to grow. Our industry leadership in this market is evidenced by our sales results for the nine months ended September 30, 2013 for plans with less than 500 participants, which places us as the number three provider among other leading life insurance company competitors in the United States. |
| • | Large Corporate Market. In this market we offer recordkeeping services to defined contribution plans of large to mega-sized corporations. Our solutions and capabilities support the most complex retirement plans with a special focus on strategic relationship management and participant retirement readiness. We are dedicated to providing engaging education, technology-based tools and award winning print materials to help plan participants achieve a secure and dignified retirement. |
Tax Exempt Markets:
| • | Education Market. We offer comprehensive full service offerings to both public and private K-12 educational entities as well as public and private higher education institutions, which we believe are attractive growth segments. In the United States, we rank third in the K-12 education market and fourth in higher education by assets as of September 30, 2013. Our innovative solutions to reduce administrative burden, deep technical and regulatory expertise and strong on-site service teams continue to support our position as one of the top providers in this market. |
| • | Healthcare Market. In this market we service hospitals and healthcare organizations by offering full service solutions for a variety of plan tax codes. Like the education market, we have strong administrative solutions for healthcare plan sponsors as well as award-winning participant communications and retirement tools in order to better prepare plan participants for retirement. |
| • | Government Market. We provide both full service and recordkeeping only offerings to small and large governmental entities (e.g., state and local government). For large governmental sponsors, we offer highly complex recordkeeping solutions that are tailored for each client. We also offer a broad range of proprietary, non-proprietary and stable value investments. Our flexibility and expertise help make us the third ranked provider in this market in the United States based on assets under management and administration as of September 30, 2013. |
-211-
Table of Contents
Products for Institutional Retirement Plans are distributed nationally through multiple unaffiliated channels or via affiliated distribution including direct sales teams. We offer localized support to these groups and their clients during and after the sales process, a broad selection of investment options and flexibility of choice and top-tier fiduciary solutions to help their clients meet or exceed plan guidelines and responsibilities.
Unaffiliated Distribution:
| • | Independent Representatives. We are working with over 7,000 sales agents who primarily sell fixed annuity products from multiple vendors in the education market. Activities by these representatives are centered on increasing participant enrollments and deferral amounts in our existing plans. |
| • | Independent Producers. Over 12,000 wirehouse and independent producers (as of December 31, 2013) are the primary distributors of our small-mid corporate market products, but they also distribute products to the education, healthcare and government markets. These producers typically present their clients (i.e., employers seeking a defined contribution plan for their employees) with plan options from multiple vendors for comparison. |
| • | Third-party Administrators (TPAs). As of December 31, 2013, over 1,300 TPAs are selling and/or service partners for our small-mid corporate markets business, working with a variety of vendors. While TPAs typically focus on providing plan services only (such as administration and compliance testing), some also initiate and complete the sales process. TPAs also play a vital role as the connecting point between our wholesale team and unaffiliated producers who seek references for determining which providers they should recommend to their clients. |
Affiliated Distribution:
| • | Affiliated Representatives. ING Financial Partners, our retail broker-dealer, is one of the top ten broker-dealers in the United States as determined by total number of licensed representatives. As of December 31, 2013, we had nearly 2,400 affiliated representatives. These representatives support sales of products for the Retirement segment as well as other segments, with a subset that are primarily focused on driving new and existing sales in education, healthcare and government market plans (full service) through increasing enrollments for existing plans, educating existing participants and selling new plans. |
| • | Direct Sold by Field Force. While we typically rely on third-party distribution partners for the majority of sales for our Institutional Retirement Plans business, our wholesale team also interacts directly with plan sponsors in the education, healthcare and government markets. Typically, our field force interacts with a consultant hired by the plan sponsor. In order to present our offerings to these large clients, we work with numerous consultants at over 55 different consulting firms as of December 31, 2013. |
| • | Direct Sold by Large Corporate Market or Stable Value Sales Teams. We have dedicated sales teams that work directly with large plan corporate market and stable value clients. The stable value investment only business can occur in either recordkeeping only plans or within other vendors’ plans. In the large corporate market and for our stable value products, the majority of our direct interaction occurs with more than 20 different consulting firms as of December 31, 2013, who provide services to our large clients. Some of these firms are also utilized in the Tax Exempt Market. |
-212-
Table of Contents
Competition. Our Institutional Retirement Plans business competes with other large, well-established insurance companies, asset managers, record keepers and diversified financial institutions. Competition varies in all market segments as very few institutions are able to compete across all markets as we do. The following chart presents the current competitive landscape in the markets where we offer our Institutional Retirement Plans and stable value products:
| Market Segment |
Competitive Landscape |
Select Competitors | ||
| Small-Mid Corporate |
Dominated by insurance based providers, primarily with third-party administration relationships | John Hancock Principal | ||
| K-12 Education |
Dominated by a small number of insurance based providers | AXA VALIC | ||
| Higher Education |
403(b) providers, asset managers and some insurance-based providers | TIAA-CREF Fidelity | ||
| Healthcare /Other Non-Profits |
403(b) providers, asset managers and some insurance-based providers | TIAA-CREF Fidelity | ||
| Government |
Primarily insurance-based providers but also asset managers and 457 providers | Nationwide Great West | ||
| Recordkeeping |
Asset managers, business consulting services, payroll firms and insurance based providers | Fidelity AON Hewitt | ||
| Product Offering |
Competitive Landscape |
Select Competitors | ||
| Stable Value |
Insurance companies and banks | Prudential MetLife | ||
Our full-service Institutional Retirement Plans business competes primarily based on pricing, the breadth of our service and investment offerings, technical/regulatory expertise, industry experience, local enrollment and financial planning support, investment performance and our ability to offer industry tailored product features to meet the retirement income needs of our clients. Regarding the large plan recordkeeping only business, we have seen consolidation among industry providers in recent years seeking to increase scale, improve cost efficiencies and enter new market segments. However, the market remains competitive with few dominant players. As a result, we emphasize our strong sponsor relationships, flexible value-added services, technical and regulatory expertise, and participant retirement readiness suite of products and services to compete in this segment of the institutional market. Finally, we have seen new insurance company competitors enter the stable value space because demand from participant and plan sponsors remains strong for these products. Our long standing experience in the retirement market underscored by strong stable value expertise allows us to effectively compete against existing and new providers.
Seasonality. We typically experience seasonality in our Retirement segment results.
| • | The first quarters tend to have the highest level of recurring deposits in Corporate Markets as participant contributions increase from the receipt of annual bonus award payments or annual lump sum matches and profit sharing contributions made by many employers. However, Corporate Market withdrawals also tend to increase in the first quarters as departing sponsors change providers at the start of a new year. |
| • | The fourth quarters tend to have the highest level of single/transfer deposits due to new Corporate Market plan sales as sponsors transfer from other providers when contracts expire at the fiscal or calendar year-end. However, recurring deposits in the Corporate Market may be lower as higher paid participants scale back or halt their contributions upon reaching the annual maximums allowed for the year. Finally, Corporate Market withdrawals tend to increase in the fourth quarter, like the first quarter, due to departing sponsors. |
-213-
Table of Contents
Individual Markets
Products and Services
Our Individual Markets business offers simple, easy-to-understand products, along with holistic advice and guidance delivered through affiliated brokers and by online capabilities. Our current investment solutions include advisory programs, mutual fund custodial IRAs, fixed annuities and brokerage accounts.
The primary focus of our Retirement segment is to serve over five million defined contribution plan participants (as of December 31, 2013). We also seek to capitalize on our access to these individuals through our Institutional Retirement Plans business by developing long-term relationships and providing individual retail solutions. We believe that our ability to offer a seamless and integrated approach to an individual customer’s entire financial picture, while saving for or living in retirement, presents a compelling reason for our Institutional Retirement Plans participants to use us as their principal investment and retirement plan provider. Through our broad range of advisory programs, our financial advisers have access to a wide set of solutions for our customers for building investment portfolios, including stocks, bonds and mutual funds, as well as managed accounts. These experienced advisers work with customers to select a program to meet their financial needs that takes into consideration each individual’s time horizon, goals and attitudes towards risk.
Markets and Advisory Services
Individual Markets advisory services and product solutions are primarily sold through our affiliated distribution group of nearly 2,400 representatives as well as online via websites. The affiliated representatives help provide cohesiveness between our Institutional Retirement Plans and Individual Markets businesses and they are grouped into two primary categories: affiliated field-based representatives and home office phone-based representatives. Affiliated field-based representatives are registered sales and investment advisory representatives in our retail broker dealer that drive both fee-based and commissioned sales. They provide face-to-face interaction with individuals who either participate within or are external to our Institutional Retirement Plans business and who seek financial advice and retail investment products (e.g., rollover products) as well as retirement and financial planning solutions. Home office phone-based representatives primarily focus on our unique growth opportunity of assisting participants in our large recordkeeping plans. They offer the same broad suite of products and services as the affiliated field-based representatives, but are highly trained in providing financial advice that helps customers transition through life stage and job-related changes.
In an effort to develop a path for either of these categories of affiliated representatives to offer holistic retirement planning solutions to participants in our Institutional Retirement Plans, we partner with our institutional clients to engage participants and offer retirement and personalized financial planning providing the appropriate solutions to their employees. Our program is designed to engage, educate, advise and motivate employees to take action that will better prepare them for retirement.
Competition
Our Individual Markets advisory services and product solutions compete for rollover and other asset consolidation opportunities against asset managers, banks, wirehouses and other broker-dealers who also offer individual retirement products, all of which currently have more market share than insurance based providers in this space. Primary competitors to our Individual Markets business are Fidelity, Vanguard, Morgan Stanley Smith Barney, Bank of America Merrill Lynch, TIAA-CREF and Ameriprise.
Our Individual Markets advisory services and product solutions compete based on our consultative approach, simplicity of design and a fund and investment selection process that includes proprietary and non-proprietary investment options. The advisory services and product solutions are primarily targeted towards existing participants, which allows us to benefit from our extensive relationships with large corporate and tax-exempt plan sponsors, our small and mid corporate market plan sponsors and other qualified plan segments in healthcare, higher education and K-12 education.
-214-
Table of Contents
Underwriting and Pricing
We price our institutional and individual retirement products based on long-term assumptions that include investment returns, mortality, persistency and operating costs. We establish target returns for each product based upon these factors and the expected amount of regulatory and rating agency capital that we must hold to support these contracts over their projected lifetime. We monitor and manage pricing and sales mix to achieve target returns. It may take new business several years before it is profitable, depending on the nature and life of the product, and is subject to variability as actual results may differ from pricing assumptions. We seek to mitigate investment risk by actively managing market and credit risks associated with investments and through asset/liability matching portfolio management.
Annuities
The Annuities segment provides fixed and indexed annuities, tax-qualified mutual fund custodial products and payout annuities for pre-retirement wealth accumulation and post retirement income management, sold through multiple channels. Revenues are generated from fees and from margins based on the difference between income earned on the investments supporting the liability and interest credited to customers. Our Annuities segment generated operating earnings before income taxes of $293.8 million for the year ended December 31, 2013. As of December 31, 2012, we were ranked fifth in AUM of FIAs according to LIMRA’s U.S. Individual Annuity Yearbook 2012.
We intend to achieve our risk-adjusted return objectives in Annuities through a disciplined approach, balancing profitability with growth, with a focus on preserving margins and the avoidance of expansion in low interest rate environments. As a result, we expect to opportunistically grow our FIA business when margins are attractive and to reduce growth but maintain distribution access when margins are less attractive. Our mutual fund custodial products business is not sensitive to interest rate conditions and, as such, is focused on growth. While we still offer traditional fixed annuities, we are prepared to allow the business to decline in volume due to low margins and less attractive returns. We intend to meet our risk management objectives by continuing to hedge market risks associated with the crediting strategies selected by clients on many of our FIA contracts. See “Management’s Discussion and Analysis of Financial Condition and Results of Operations—Quantitative and Qualitative Disclosures About Market Risk—Risk Management.”
Products and Services
Our Annuities segment product offerings include immediate and deferred fixed annuities designed to address customer needs for tax-advantaged savings and retirement income and their wealth-protection concerns. New sales comprise primarily FIAs and tax-qualified mutual fund custodial accounts.
Fixed Indexed Annuities (FIA). FIAs are marketed principally based on underlying interest-crediting guarantee features coupled with the potential for increased returns based on the performance of market indices. For an FIA, the principal amount of the annuity is guaranteed to be no less than a minimum value based on non-forfeiture regulations that vary by state. Interest on FIAs is credited based on allocations selected by a customer in one or more of the strategies we offer and upon policy parameters that we set. The strategies include a fixed interest rate option, as well as several options based upon performance of various external financial market indices. Such indices may include equity indices, such as the S&P 500, or an interest rate benchmark, such as the change in LIBOR. The parameters (such as “caps,” “participation rates,” and “spreads”) are periodically declared by us for both initial and following periods. Our existing FIAs contain death benefits as required by non-forfeiture regulations. Some FIAs allow the purchase of optional guaranteed withdrawal benefit riders at an additional cost. These living benefits guarantee a minimum annual withdrawal amount for life. The amount of the guaranteed annual withdrawal may vary by age at first withdrawal. We have used multiple designs with varying parameters over time and all form designs and parameters make up the existing block of in-force policies.
Annual Reset and Multi-Year Guarantee Annuities (MYGAs). Our in-force block includes Annual Reset and MYGA products, which provide guaranteed minimum rates of up to 4.5% and with crediting rate terms from one
-215-
Table of Contents
year to 10 years. These products are running off, with net outflows of $1.2 billion in 2013, compared to $2.8 billion in 2012. The net outflows in 2012 were high due to a large block of MYGAs, which reached the end of their current guarantee period in 2012. The run-off of these Annual Reset and MYGA contracts is expected to continue to enhance the margin of our Annuities segment in future periods.
Although not currently a significant portion of new sales, we also offer other fixed annuities with a guaranteed interest rate or a periodic annuity payment schedule suitable for clients seeking a stable return.
Mutual Fund Custodial Products. Our Annuities segment also offers tax-qualified mutual fund custodial products, which provide flexible investment options across mutual fund families on a no-load basis. We charge a recordkeeping fee based on the amount of assets invested in the account, and we are paid asset-based fees by the managers of the mutual funds within the account. This product is designed to be a streamlined, simple rollover solution providing continued tax deferral on retirement assets. No minimum guarantees are offered for this product.
The following chart presents the key in-force annuity and mutual fund custodial products within this segment, along with data on AUM for each product, excluding payout annuities:
| ($ in billions) | AUM | |||
| Annuity Product |
As of December 31, 2013 | |||
| Fixed Indexed Annuities (FIA) |
$ | 12.6 | ||
| Multi-Year Guarantee Annuities (MYGA) & other Fixed Annuities |
$ | 7.3 | ||
| Mutual Funds Custodial Products |
$ | 3.4 | ||
Markets and Distribution
Our target markets for annuities include individual retirees and pre-retirees seeking to accumulate or receive distributions of assets for retirement. Annuity products are primarily distributed by independent marketing organizations, independent broker-dealers, banks, independent insurance agents, pension professionals and affiliated broker-dealers. The following chart presents our Annuities distribution, by channel.
| ($ in millions) | Sales | % of Sales | ||||||
| Channel |
Year Ended December 31, 2013 |
Year Ended December 31, 2013 |
||||||
| Independent Insurance Agents / |
||||||||
| Independent Marketing Organizations |
$ | 740.7 | 30.2 | % | ||||
| Independent Broker-Dealers |
$ | 801.6 | 32.7 | % | ||||
| Affiliated Broker-Dealers |
$ | 506.4 | 20.6 | % | ||||
| Banks and Other Financial Institutions |
$ | 405.0 | 16.5 | % | ||||
Our mutual fund custodial products are distributed nationally, primarily through relationships with independent brokers, financial planners and agents. New sales are obtained from a “rollover” from an existing retirement account. The resulting custodial account is established as an IRA to maintain tax-deferred status for our customer.
On December 9, 2013, we announced a strategic alliance with The Allstate Corporation that will enable Allstate to offer a full suite of our fixed annuity product offerings to Allstate customers. The fixed annuity products are issued by ING USA and ILIAC.
Competition
Our Annuities segment faces competition from traditional insurance carriers, as well as banks, mutual fund companies and other investment managers such as Allianz, Aviva, American Equity, AXA, Lincoln and Great
-216-
Table of Contents
American. Principal competitive factors for fixed annuities are initial crediting rates, reputation for renewal crediting action, product features, brand recognition, customer service, cost, distribution capabilities and financial strength ratings of the provider. Competition may affect, among other matters, both business growth and the pricing of our products and services.
Mutual fund custodial products compete with brokerage accounts and other financial service and asset allocation offerings.
Underwriting and Pricing
We generally do not underwrite individual lives in our Annuities segment. Instead, we price our products based upon our expected investment returns and our expectations for mortality, longevity and persistency for the group of our contract holders as a whole, taking into account our historical experience. We price annuities by analyzing longevity and persistency risk, volatility of expected earnings on our AUM and the expected time to retirement. Our product pricing models take into account many additional factors as applicable, including, among other things capital requirements, hedging costs and operating expenses.
Our custodial mutual fund account is a fee-based, recordkeeping product, for which the recordkeeping fees, combined with estimated mutual fund revenue sharing, are priced to cover acquisition and operating costs over the life of the account. These custodial mutual fund products do not generate investment margins, do not expose us to significant mortality risk and no hedging is required.
Investment Management
We offer domestic and international fixed income, equity, multi-asset and alternatives products and solutions across market sectors, investment styles and capitalization spectrums through our actively managed, full-service investment management business. Multiple investment platforms are backed by a fully integrated business support infrastructure that lowers expense and creates operating efficiencies and business leverage and scalability at low marginal cost. As of December 31, 2013, our Investment Management business managed $75.2 billion for third-party institutions and individual investors, $45.1 billion in separate account assets for our Retirement Solutions and Insurance Solutions businesses and our Closed Block segments and $79.0 billion in general account assets.
We are committed to investing responsibly and delivering research-driven, risk-adjusted, client-oriented investment strategies and solutions and advisory services across asset classes, geographies and investment styles. We serve a variety of institutional clients, including public, corporate and Taft-Hartley Act defined-benefit and defined-contribution retirement plans, endowments and foundations, and insurance companies through our institutional distribution channel and through affiliates. We also serve individual investors by offering our mutual funds and separately managed accounts through an intermediary-focused distribution platform or through affiliate and third-party retirement platforms.
Investment Management’s primary source of revenue is management fees collected on the assets we manage. These fees typically are based upon a percentage of AUM. In certain investment management fee arrangements, we may also receive performance-based incentive fees when the return on AUM exceeds certain benchmark returns or other performance targets. In addition, and to a lesser extent, Investment Management collects administrative fees on outside managed assets that are administered by our mutual fund platform, and distributed primarily by our Retirement Solutions business. Investment Management also receives fees as the exclusive investment manager of our general account, which is managed on an arm’s-length pricing basis. Investment Management generated operating earnings before income taxes of $178.1 million for the year ended December 31, 2013.
We are driving Investment Management profitability by leveraging continued strong investment performance across all asset classes to accelerate growth in AUM (through both greater sales and lower
-217-
Table of Contents
redemptions) and taking advantage of a rebuilt sales force to increase productivity levels. We are also increasing scale in our primary capabilities and our share of proprietary funds in affiliate products, principally through leveraging our access to approximately 47,000 defined contribution plan sponsors and more than 5 million plan participants through our U.S. Retirement business as of December 31, 2013. Historically our proprietary share of AUM has been materially less than the industry average; in addition, we have lacked access to the majority of our retirement plan customers due to sponsor restrictions. We are focused on improving coordination between our Investment Management and Retirement Solutions businesses to capitalize on Retirement Solutions’ leading market position and Investment Management’s broad investment capabilities and strong investment track records. To that end we have established dedicated retirement resources within our Investment Management intermediary-focused distribution team to work with Retirement Solutions and have enhanced our Multi-Asset Strategies and Solutions investment platform (described below) to increase focus on retirement products such as our target date and target risk portfolios, which we believe will capture an increased proportion of retirement flows going forward.
We are also growing our third-party affiliated and non-affiliated investment management business through continued strength of investment performance as well as a number of key strategic initiatives, including: improved distribution productivity; increased focus on client “solutions” and income and outcome oriented products such as target date funds; pursuit of investment only mandates on non-affiliate retirement platforms; replacement of sub-advised ING Mutual Funds where Investment Management now offers stronger investment performance; sub-advisory mandates for Investment Management investment capabilities on others platforms; leveraging partnerships with financial intermediaries and consultants; long-term expansion of our international investment capabilities, and opportunistic launching of capital markets products such as CLOs and Closed End Mutual Funds.
Products and Services
Investment Management delivers products and services that are manufactured by traditional and specialty investment platforms. The traditional platforms are fixed income, equities and multi-asset strategies and solutions (“MASS”). The specialty investment platforms are senior bank loans and alternatives.
Fixed Income. Investment Management’s fixed income platform manages assets for our general account, as well as for domestic and international institutional and retail investors. As of December 31, 2013, there were $113.6 billion in AUM on the entire platform, of which $79.0 billion were general account assets. Through the fixed income platform clients have access to money market funds, investment-grade corporate debt, government bonds, RMBS, CMBS, ABS, high yield bonds, private and syndicated debt instruments, commercial mortgages and preferred securities. Each sector within the platform is managed by seasoned investment professionals supported by significant credit, quantitative and macro research and risk management capabilities.
Equities. The equities platform is a multi-cap and multi-style research-driven platform comprising both fundamental and quantitative equity strategies for institutional and retail investors. As of December 31, 2013, there were $58.9 billion in AUM on the platform covering both domestic and international markets. Our fundamental equity capabilities are bottom-up, research driven and cover growth, value and core strategies in the large, mid and small cap spaces. Our quantitative equity capabilities are used to create quantitative and enhanced indexed strategies, support other fundamental equity analysis and create extension products.
MASS. Investment Management’s MASS platform offers a variety of investment products and strategies that combine multiple asset classes with asset allocation techniques. The objective of the MASS platform is to develop customized solutions that meet the specific, and often unique, goals of investors with products that change dynamically over time in response to changing markets and client needs. Utilizing core capabilities in asset allocation, manager selection, asset/liability modeling, risk management and financial engineering, the MASS team has developed a suite of target date and target risk funds that are distributed through our Retirement Solutions business and to institutional and retail investors. These funds can incorporate multi-manager funds. The MASS team also provides pension risk management, strategic and tactical asset allocation, liability-driven investing solutions and investment strategies that hedge out specific market exposures (e.g., portable alpha) for clients.
-218-
Table of Contents
Senior Bank Loans. Investment Management’s senior bank loan group is a large experienced manager of below-investment grade floating-rate loans, actively managing diversified portfolios of loans made by major banks around the world to non-investment grade corporate borrowers. Senior in the capital structure, these loans have a first lien on the borrower’s assets, typically giving them stronger credit fundamentals than unsecured corporate bonds. The platform offers institutional, retail and structured products (e.g., CLOs), including on-shore and off-shore vehicles with assets of $18.8 billion as of December 31, 2013.
Alternatives. Investment Management’s primary alternatives platform is Pomona Capital. Pomona Capital specializes in investing in private equity funds in three ways: by purchasing secondary interests in existing partnerships; by investing in new partnerships; and by co-investing alongside buyout funds in individual companies. As of December 31, 2013, Pomona Capital managed assets totaling $7.5 billion. See “Investments—Sale of Certain Alternative Investments.” In addition, Investment Management offers select alternative and hedge funds leveraging our core debt and equity investment capabilities.
The following chart presents asset and net flow data as of December 31, 2013, broken out by Investment Management’s five investment platforms as well as by major business segment:
| AUM | Net Flows | |||||||
| As of December 31, 2013 |
Year Ended December 31, 2013 |
|||||||
| $ in billions | $ in millions | |||||||
| Investment Platform |
||||||||
| Fixed Income |
$ | 113.7 | $ | (100.1 | ) | |||
| Equities |
58.9 | 2,107.2 | ||||||
| Senior Bank Loans |
18.8 | 5,803.8 | ||||||
| Alternatives |
7.9 | 945.5 | ||||||
|
|
|
|
|
|||||
| Total |
$ | 199.3 | $ | 8,756.4 | ||||
|
|
|
|
|
|||||
|
MASS(1) |
$ | 27.2 | $ | (464.2 | ) | |||
| Client Segment |
||||||||
| Retail |
$ | 65.4 | $ | (2,245.3 | ) | |||
| Institutional |
54.9 | 8,950.2 | ||||||
| General Account |
79.0 | N/A | ||||||
| Mutual Fund Manager Re-assignments(2) |
N/A | 2,051.5 | ||||||
|
|
|
|
|
|||||
| Total |
$ | 199.3 | $ | 8,756.4 | ||||
|
|
|
|
|
|||||
| ING U.S. affiliate sourced, excluding CBVA(3) |
$ | 31.2 | $ | 3,345.0 | ||||
|
CBVA(3) |
$ | 22.7 | $ | (2,366.3 | ) | |||
| (1) | $23.3 billion of MASS AUM are included in the fixed income and equity platforms presented above. The balance of MASS, $3.9 billion, is managed by third parties and we retain only a modest fee on these assets. |
| (2) | Represents the re-assignment of mutual fund management contracts to ING Investment Management from external managers. The AUM related to the re-assignments are included in the retail segment above. |
| (3) | Assets sourced from ING U.S., including CBVA, are also included in the retail and institutional markets segments above. |
Markets and Distribution
We serve our institutional clients through a dedicated sales and service platform consisting of direct- and consultant-focused sales professionals. We serve individual investors through an intermediary-focused distribution platform, consisting of business development and wholesale forces which partner with banks, broker-dealers and independent financial advisers, as well as our affiliate and third-party retirement platforms.
-219-
Table of Contents
With the exception of Pomona Capital, the different products and strategies associated with our investment platforms are distributed and serviced by these Retail and Institutional client-focused segments as follows:
| • | Retail segment: Open- and closed-end funds through affiliate and third-party distribution platforms, including wirehouses, brokerage firms, and independent and regional broker-dealers. As of December 31, 2013, total AUM from these channels was $65.4 billion. |
| • | Institutional segment: Individual and pooled accounts, targeting defined benefit, defined contribution recordkeeping and retirement plans, Taft Hartley and endowments and foundations. As of December 31, 2013, Investment Management had approximately 250 institutional clients, representing $54.9 billion of AUM primarily in separately managed accounts, collective investment trusts and structured vehicles. |
Investment Management manages a variety of variable portfolios and mutual funds which are sold through our Retirement Solutions and Insurance Solutions businesses. As of December 31, 2013, total AUM from these channels was $53.9 billion with the majority of the assets gathered through our Retirement segment.
Competition
Investment Management competes with a wide array of asset managers and institutions in the highly fragmented U.S. investment management industry. In our key market segments, Investment Management competes on, among other things, the basis of investment performance, investment philosophy and process, product features and structure and client service. Our principal competitors in the Investment Management business include insurance-owned asset managers such as Principal Global Investors (Principal Financial Group), Prudential and Ameriprise, bank-owned asset managers such as J.P. Morgan Asset Management, as well as “pure-play” asset managers including PIMCO, Invesco, Wellington, Legg Mason, T. Rowe Price, Franklin Templeton and Fidelity.
Seasonality
We typically experience seasonality in our Investment Management segment results.
| • | In the first quarters, limited carried interest is generally recorded from investments in private equity. |
| • | In the fourth quarters, our performance fees recorded based on current contracts tend to be higher than other quarters. This could change in the future with new business contracts or over/under performance of these contracts against the hurdle rate in any given quarter. |
Insurance Solutions
Our Insurance Solutions business comprises two financial reporting segments: Individual Life and Employee Benefits. Our strategy is based on a broad and effective distribution model, fueled by a manufacturing capability that provides a stream of competitive product solutions, all supported by an efficient operations and underwriting model.
Individual Life
Our Individual Life segment has a broad independent distribution footprint and manufactures a wide range of competitive products, from low-cost term life insurance designed to serve the middle market to fixed, indexed and variable universal life insurance products targeted to more affluent markets. We have re-priced certain products and will continue to monitor changes to the product portfolio to align with market conditions. As of December 31, 2013, we were the thirteenth largest writer of term life in the United States. As of December 31, 2013, we were also the twenty-fourth largest writer of universal life in the United States based on premiums sold or written. Our strong market positions have allowed us to properly scale our business to achieve greater
-220-
Table of Contents
profitability. Our larger term operation is a crucial part of achieving this scale and can be adjusted through pricing changes as necessary. As of December 31, 2013, Individual Life’s in-force book comprised over 1.3 million policies and gross premiums of almost $2.0 billion.
The Individual Life segment generates revenue on its products from premiums, investment income, expense load, mortality charges and other policy charges, along with some asset-based fees. Profits are driven by the spread between investment income earned and interest credited to policyholders, plus the difference between premiums and mortality charges collected and benefits and expenses paid. Our Individual Life segment generated operating earnings before income taxes of $254.8 million for the year ended December 31, 2013.
We intend to achieve our earnings growth in our Individual Life segment by focusing on growing our earnings drivers. Our earnings drivers include growing our in-force block of business by adding new businesses and entering new markets that meet our profit and capital requirements, combined with effectively managing our in-force block to meet our profitability objectives. This also includes focusing on improving our investment margins, growing our mortality profits and fully exploiting our technological capability in order to continue to reduce the new business unit costs and underwriting expense. In addition, we will further our financial objectives by continuing to utilize reinsurance to actively manage our risk and capital profile with the goal of controlling exposure to losses, reducing volatility and protecting capital. We aim to maximize earnings and capital efficiency in part by relieving the reserve strain for certain of our term and universal life products by means of reinsurance arrangements and other financing transactions. In addition, we have completed the introduction of re-priced offerings for term and universal life products, both of which are high capital consuming products. We expect these actions to slow the sale of the high-capital products while we simultaneously grow sales in the low capital, cash accumulation and current assumption type products.
Products and Services
Our Individual Life segment currently offers products that include term life, UL, IUL and variable universal life insurance. These offerings are designed to address customer needs for death benefit protection, tax-advantaged wealth transfer and accumulation, premium financing, business planning, executive benefits and supplemental retirement income. We believe that our combination of product solutions is well-suited for the middle-market through the mass-affluent and makes us a full service provider to our independent distribution partners.
UL. Accumulation-focused universal life products feature the opportunity to build tax-deferred cash value that can be accessed by consumers via loans and withdrawals for future needs. This money grows income tax-deferred, meaning no federal or state income taxes apply while it accumulates. The compounding tax-deferred interest can be an attractive feature to policyholders. These products help policyholders meet longer-range goals like college funding, supplemental retirement income and leaving a legacy for heirs. Other features include flexible premium payments that can change to meet policyholders’ evolving financial needs.
IUL. For customers looking for an opportunity for a higher return in a low rate environment, we offer IUL products, which, along with death benefit protection, provide customers the opportunity for growth through potentially stronger surrender values than traditional UL products. These IUL products link to both fixed and indexed crediting strategies and offer protection from downside risk through a minimum interest guarantee, helping customers who seek solutions that would be advantageous for providing supplemental retirement income, payment of college costs or executive benefits. One of the IUL products we offer provides up to a lifetime death benefit guarantee coupled with significant long term surrender value potential through the ability to earn an index credit linked, in part, to any increases in the S&P 500. As discussed above, in October 2012, we announced the suspension of sales of this product for No-Lapse Guarantee UL products. In October 2013, we introduced a re-priced Index Universal Life-Guaranteed Death Benefit (“IUL-GDB”) which focuses on providing a death benefit for the customer wanting a guarantee but also wanting cash value for future flexibility. We also have a unique global IUL product that links to multiple international indices, such as the S&P 500, Hang Seng Index or Euro Stoxx 50. Indexed products are the fastest growing new product segment and are a major focus of our product and distribution effort as they are less capital intensive and provide attractive returns.
-221-
Table of Contents
Variable Universal Life. For customers seeking greater growth potential and more control over their investments, we offer an individual variable universal life insurance product designed to provide long-term cash accumulation potential with the ability to add optional riders that provide guarantees and more flexibility. We offer customers the ability to choose from individual variable investment options, which range from conservative to aggressive stock and bond investments managed by respected investment management firms in the industry or from diverse asset allocation solutions designed to match a customer’s risk tolerance.
No-Lapse Guarantee UL. No-lapse guarantee universal life products utilize a secondary guarantee to continue to offer a lifetime death benefit guarantee even if the account value has turned negative. Cash accumulation is minimized in these products. We suspended sale of these products in 2012.
Term Life. Term life insurance provides basic, economical life insurance for consumers and we market term life insurance primarily on competitive pricing and service models. Our term products, basic life and return-of-premium offer flexible coverage for periods spanning ten to thirty years. Our term model provides us with added scale for expense coverage and opportunity for mortality profit.
The following chart presents data on our in-force face amount and total gross premiums and deposits received for the key life insurance products that we offer:
| ($ in millions) | In-Force Face Amount |
Total gross premiums and deposits |
||||||
| Individual Life Product |
As of December 31, 2013 |
Year Ended December 31, 2013 |
||||||
| Term Life |
$ | 498,212 | $ | 901.2 | ||||
| Universal Life |
$ | 78,581 | $ | 888.2 | ||||
| Variable Universal Life |
$ | 28,198 | $ | 207.6 | ||||
Markets and Distribution
Our Individual Life segment has a broad, multi-channel independent distribution reach that is designed to allow us to penetrate markets that range from the middle-market through affluent market. Our distribution organization boasts a comprehensive sales support, sales technology, marketing support and illustration system. We also offer an Internet-based sales solution that is based on educational selling at INGForLife.com. We offer service solutions to meet the diverse and changing requirements of our customers and distribution partners. The success of our customer service programs is measured through our employee, customer and distributor satisfaction scores, which rank at the top among our benchmark competitors based on the 2012 Life Producer Net Promoter rankings.
We primarily use three different channels to market and sell our Individual Life products. Our largest channel works through over 2,200 independent general agents and has the breadth to engage with the vast majority of licensed independent life insurance agents in the United States. Through this channel, we have access to over 96,000 independent producers as of December 31, 2013. We also use a strategic distribution channel, with approximately 35 independent managing directors supporting approximately 7,200 producers (as of December 31, 2013) who engage with our broker-dealer. These producers, while independent, use our brand and sell a wide range of our products, including life, annuity and mutual funds. Finally, we employ a specialty markets channel to focus on alternative distribution. This includes life insurance quote agencies, internet direct marketers, and other forms of non-traditional distribution.
The following table presents a breakdown of Individual Life sales by distribution channel.
| ($ in millions) | Sales | % of Sales | ||||||
| Channel |
Year Ended December 31, 2013 |
Year Ended December 31, 2013 |
||||||
| Independent Life Sales |
$ | 62.6 | 62.7 | % | ||||
| Strategic Distribution |
$ | 21.7 | 21.8 | % | ||||
| Specialty/Alternative Markets |
$ | 15.4 | 15.5 | % | ||||
-222-
Table of Contents
The goal of our Individual Life distribution model is to be a full-service provider of life insurance products with a broad footprint, offering customers multiple ways to purchase products from our diverse portfolio. Achieving this goal has allowed us to penetrate affluent markets with our non-term portfolio, while building scale through policy count with sales of term and lower face non-term products in the middle market.
Competition
The Individual Life segment competes with large, well-established life insurance companies in a mature market, where price and service are key drivers. Primary competitors include Lincoln, MetLife, Prudential, American General, Principal Financial Group, John Hancock, Transamerica and Pacific Life. Individual Life primarily competes based on service and distribution channel relationships, price, brand recognition, financial strength ratings of our insurance subsidiaries and financial stability. We have strong capabilities to monitor competition and we utilize advanced models to benchmark our product offerings against others in the industry.
Factors that could influence our ability to competitively price products while achieving targeted returns include the cost and availability of statutory reserve financing required for certain term and universal life insurance policies, internal capital funding requirements and an extended low interest rate environment.
Underwriting and Pricing
We set prices for many of our insurance products based upon expected mortality over the life of the product. We base the pricing of our life insurance products in part upon expected persistency of these products, which is the probability that a policy will remain in force from one period to the next. We base premiums and policy charges for individual life insurance on expected death benefits, surrender benefits, expenses and required reserves. We use assumptions for mortality, interest, expenses, policy persistency and premium payment pattern in pricing policies. In addition, certain of our insurance products that include guaranteed returns or crediting rates underwrite equity market or interest rate risks. We seek to maintain a spread between the return on our general account invested assets and the interest we credit on our policyholder accounts. Our underwriting and risk management functions adhere to prescribed underwriting guidelines, while maintaining a competitive suite of products priced consistent with our mortality assessment. We generally manage mortality risks by enforcing strict underwriting standards and maintaining sufficient scale so that the incidence of risk occurrence is likely to match statistical modeling.
With respect to our universal life secondary guarantee business, we seek to mitigate risk by pricing conservatively to recognize the interest rate risk and are willing to forgo sales in order to maintain our profit and risk profile.
Reinsurance
In general, our reinsurance strategy is designed to limit our mortality risk and volatility. We partner with highly rated, well regarded reinsurers and set up pools to share our excess mortality risk.
As of January 1, 2013, we revised the amount of risk we retain on a life for new business issued after January 1, 2013. For term business, we continue to retain the first $3 million of risk and the excess risk is shared among a pool of reinsurers. For most of our universal life product portfolio, we retain the first $5 million of risk and reinsure the 100% of the excess over $5 million among a pool of reinsurers. Our maximum overall retained risk on any one life is $5 million.
-223-
Table of Contents
Prior to January 1, 2013, for term business, we retained the first $3 million of risk and the excess risk was shared among a pool of reinsurers. For most of our universal life product portfolio, we retained the first $5 million of risk and reinsured a portion of the excess over $5 million into a pool until we reached our limit of $10 million of risk. 100% of the excess over $10 million then went into the pool. Our maximum overall retained risk on any one life was $10 million. The following table presents our top five exposures as of December 31, 2013:
| Exposure | ||||
| Reinsurer |
shown as a percentage
of Total Reinsurance(1) |
|||
| Swiss Re |
28.8 | % | ||
| Reinsurance Group of America |
22.3 | % | ||
| SCOR |
22.0 | % | ||
| Gen Re |
9.0 | % | ||
| Munich |
6.6 | % | ||
| 1) | “Total Reinsurance” equals net amount at risk (“NAR”) proportions of policies that have been placed with reinsurers (as of December 31, 2013). |
Currently, reinsurance for new business is on a monthly renewable term basis, which only transfers mortality risk and limits our counterparty risk exposure. See “Management’s Discussion and Analysis of Financial Condition and Results of Operations—Quantitative and Qualitative Disclosures About Market Risk—Risk Management”.
Seasonality
We typically experience seasonality in our Individual Life segment results.
| • | The fourth quarters tend to have the highest level of universal life insurance sales. This seasonal pattern is also typical for the industry. |
Employee Benefits
Our Employee Benefits segment provides group insurance products to mid-size and large corporate employers and professional associations. In addition, our Employee Benefits segment serves the voluntary worksite market by providing individual and payroll-deduction products to employees of our clients. Our Employee Benefits segment is among the largest writers of medical stop loss coverage in the United States, currently ranking sixth on a premium basis with over $550.0 million of in-force premiums. We also hold top-20 positions in the group life and Voluntary Benefits (“VB”) markets on a premium basis. As of December 31, 2013, Employee Benefits total in-force premiums were $1.3 billion.
The Employee Benefits segment generates revenue from premiums, investment income, mortality and morbidity income and policy and other charges. Profits are driven by the spread between investment income and credited rates to policyholders on voluntary universal life and whole life products, along with the difference between premiums and mortality charges collected and benefits and expenses paid for group life, stop loss and voluntary health benefits. Our Employee Benefits segment generated operating earnings before income taxes of $106.1 million for the year ended December 31, 2013.
The Employee Benefits segment offers attractive growth opportunities with much less capital strain. For example, we believe there are significant opportunities through expansion in the VB market as employers shift benefits costs to their employees. We have a number of new products and initiatives that we believe will help us drive growth in this market. In addition to the VB marketplace, we believe similar growth exists in the affinity marketplace. While expanding these lines, we also intend to continue to focus on profitability in our well
-224-
Table of Contents
established group life and stop loss product lines, by adding profitable new business to our in-force block, improving our persistency by retaining more of our best performing groups, and managing our loss ratios to below 80%, particularly on stop loss policies.
Products and Services
Our Employee Benefits segment offers stop loss insurance, group life, VB and group disability products. These offerings are designed to meet the financial needs of both employers and employees by helping employers attract and retain employees and control costs, as well as provide ease of administration and valuable protection for employees.
Stop Loss. Our stop loss insurance provides coverage for mid-sized to large employers that self-insure their medical claims. These employers provide a health plan to their employees and generally pay all plan-related claims and administrative expenses. Our stop loss product helps these employers contain their health expenses by reimbursing specified claim amounts above certain deductibles and by reimbursing claims that exceed a specified limit. We offer this product via two types of protection—individual stop loss insurance and aggregate stop loss insurance. The primary difference between these two types is a varying deductible; both coverages are re-priced and renewable annually.
Group Life. Group life products span basic and supplemental term life insurance as well as accidental death and dismemberment for mid-sized to large employers and affinity groups. These products offer employees guaranteed issue coverage, convenient payroll deduction, affordable rates and conversion options.
Voluntary Benefits. Our voluntary benefits business involves the sale of universal life insurance, whole life insurance, critical illness, accident insurance and short-term disability income through the workplace. This product lineup is 100% employee-paid through payroll deduction. New products have been introduced that focus on group-like structures that address the cost-shifting trend.
Group Disability. Group disability includes group long term disability, short term disability, telephonic short term disability, voluntary long term disability and voluntary short term disability products for mid-sized to large employers. This product offering is typically packaged for sale with group life products, especially in the middle-market.
The following chart presents the key employee benefits products we offer, along with data on annual premiums for each product:
| ($ in millions) | Annualized In-Force Premiums | |||
| Employee Benefits Products |
Year Ended December 31, 2013 | |||
| Medical Stop Loss |
$ | 563.4 | ||
| Group Life |
$ | 487.7 | ||
| Voluntary Benefits |
$ | 157.0 | ||
| Disability |
$ | 86.5 | ||
Markets and Distribution
Our Employee Benefits segment works primarily with national and regional benefits consultants, brokers, TPAs, enrollment firms and technology partners. Our tenured distribution organization provides local sales and account management support to offer customized solutions to mid-sized to large employers backed by a national accounts team. We offer innovative and flexible solutions to meet the varying and changing needs of our customers and distribution partners. We have many years of experience providing unique stop loss solutions and products for our customers. In addition, we are an experienced multi-line employee benefits insurance carrier (group life, disability, stop loss and elective benefits).
-225-
Table of Contents
We primarily use three distribution channels to market and sell our employee benefits products. Our largest channel works through hundreds of brokers and consultant firms nationwide and markets our entire product portfolio. Our Voluntary sales team focuses on marketing elective benefits to complement an employer’s overall benefit package. Our Affinity sales team specializes in working with TPAs to market to members of association and affinity groups. ING Employee Benefits breadth of distribution gives us access to and the products to meet the needs of employers and their employees.
Our Employee Benefits segment primarily targets mid-sized and large corporate employers and professional associations. In addition, we market medical stop loss coverage to employer sponsors of self-funded employee health benefits plans.
Employee Benefits products are marketed to employers and professional associations through major brokerage operations, benefits consulting firms and direct sales. In the VB market, policies are marketed to employees at the worksite through enrollment firms, technology partners and brokers. When combined with distribution channels used by our Individual Life segment, we are able to provide complete access to our products through worksite-based sales.
The following chart presents our Employee Benefits distribution, by channel.
| ($ in millions) | Sales | % of Sales | ||||||
| Channel |
Year
Ended December 31, 2013 |
Year
Ended December 31, 2013 |
||||||
| Brokerage (Commissions Paid) |
$ | 170.2 | 64.7 | % | ||||
| Benefits Consulting Firms (Fee Based Consulting) |
$ | 72.7 | 27.7 | % | ||||
| Worksite Sales |
$ | 20.0 | 7.6 | % | ||||
Competition
The group insurance market is mature and, due to the large number of participants in this segment, price and service are key competitive drivers. Our principal competitors include MetLife, Prudential and Minnesota Life in Group Life, Houston Casualty, Symetra and Sun Life in Stop Loss, and Unum, Allstate and Transamerica in VB.
For group life insurance products, rate guarantees have become the industry norm, with rate guarantee duration periods trending upward in general. Technology is also a competitive driver, as employers and employees expect technology solutions to streamline their administrative costs.
Underwriting and Pricing
Group insurance and disability pricing reflects the employer group’s claims experience and the risk characteristics of each employer group. The employer’s group claims experience is reviewed at time of policy issuance and periodically thereafter, resulting in ongoing pricing adjustments. The key pricing and underwriting criteria are morbidity and mortality assumptions, the employer group’s demographic composition, the industry, geographic location, regional and national economic trends, plan design and prior claims experience.
Medical stop loss insurance pricing reflects the risk characteristics and claims experience for each employer group. The product is annually renewable and the underwriting information is reviewed annually as a result. The key pricing and underwriting criteria are medical cost trends, morbidity assumptions, the employer group’s demographic composition, the industry, geographic location, plan design and prior claims experience. Pricing in the medical stop loss insurance market is generally cyclical.
Reinsurance
Our Employee Benefits reinsurance strategy seeks to limit our exposure to any one individual which will help limit and control risk.
-226-
Table of Contents
Group Life, which includes Accidental Death and Dismemberment, cedes the excess over $750,000 of each coverage to a pool of reinsurers. Group Long Term Disability cedes substantially all of the risk including the claims servicing, to a TPA and reinsurer. Excess Medical Stop Loss has a reinsurance program in place that limits our exposure (after an overall $5 million aggregate deductible that we must meet before reinsurance coverage begins) to any one specific claim to $1.25 million and there is an aggregate stop loss unit that limits our exposure to $2.0 million over the Policyholders Aggregate Excess Retention. See “Management’s Discussion and Analysis of Financial Condition and Results of Operations—Quantitative and Qualitative Disclosures About Market Risk—Risk Management”. We also use an annually renewable reinsurance transaction which lowers required capital of the Employee Benefits segment.
Seasonality
We typically experience seasonality in our Employee Benefits segment results.
| • | The first quarters tend to have the highest Group Life loss ratio. There are a number of factors that might contribute to this, such as delayed claims filings during the end of calendar year holiday season. Sales for Group Life and Stop Loss also tend to be the highest in the first quarter, as most of our contracts have January start dates in alignment with the start of the fiscal year of those clients. |
| • | The third quarters tend to have the second highest Group Life and Stop Loss sales, as a large number of our contracts have July start dates in alignment with the start of the fiscal year of those clients. |
Closed Blocks
We separated our CBVA and Closed Block Institutional Spread Products segments from our other operations, placing them in run-off, and made a strategic decision to stop actively writing new retail variable annuity products with substantial guarantee features and to run-off the institutional spread products portfolio over time. Accordingly, these segments have been classified as closed blocks and are managed separately from our ongoing business.
Our Closed Blocks unit also includes Closed Block Other, which comprises various other lines of business that have been exited through reinsurance agreements or which have also been placed in run-off and separated from our other operations.
We continue to focus on the controlled run-off of our Closed Block segments and look for opportunities to accelerate this run-off, where possible.
CBVA
Our CBVA segment consists of retail variable annuity insurance policies with substantial guarantee features sold primarily from 2001 to early 2010, when the block entered run-off. These policies are long-term savings vehicles in which customers (policyholders) made deposits that are primarily maintained in separate accounts established by the Company and registered with the SEC as unit investment trusts. The deposits were invested, largely at the customer’s direction, in a variety of U.S. and international equity, fixed income, real estate and other investment options.
Many of these policies include living benefit riders, including GMWBL, GMIB, GMAB and GMWB. All deferred variable annuity contracts included GMDB.
The recent financial crisis resulted in substantial market volatility, low interest rates and depressed equity market levels. Our variable annuity profitability declined markedly in 2009 and 2010 under these adverse market conditions, as customer account values fell below guaranteed levels and therefore our liabilities with respect to the underlying guarantees increased. Moreover, significant reduction in earnings from reduced mutual fund fees and increased hedging costs exacerbated the decline in profitability.
-227-
Table of Contents
We have taken numerous actions since the financial crisis to strengthen our balance sheet, increase transparency and improve the risk profile of the block, including the following:
| • | in 2009, we decided to cease sales of retail variable annuity products with substantial guarantee features. The products were fully closed to new sales in early 2010 and the management of the block shifted to run-off; |
| • | in 2010, we also refined our CHO program to dynamically protect regulatory and rating agency capital levels in down equity market scenarios; |
| • | in early 2011, we began hedging the interest rate risk of our GMWBL book of business; and |
| • | in late 2011, we refined our policyholder behavior assumptions to more closely align with experience resulting in U.S. GAAP and gross U.S. statutory reserve increases of $741 million and $2,776 million in the fourth quarter of 2011, respectively. |
U.S. GAAP accounting differs from the methods used to determine regulatory and rating agency capital measures. Therefore our hedge programs may create material earnings volatility for U.S. GAAP financial statements.
Our risk management program is focused on balancing key factors including regulatory reserves, rating agency capital, RBC, liquidity, earnings, and economic value. There is significant operational scale (approximately 455,000 variable policy holders and $45.7 billion in AUM in our CBVA segment as of December 31, 2013) which ensures ongoing hedging, financial reporting and information technology maintenance expense efficiencies.
The block continues to generate revenue from asset-based fees. On a U.S. GAAP basis, we continue to amortize capitalized acquisition costs over gross revenues and we incur operating costs and benefit expenses in support of the segment.
Our focus in managing our CBVA segment is on protecting regulatory and rating agency capital from equity market movements via hedging and judiciously looking for opportunities to accelerate the run-off of the block, where possible.
Nature of Liabilities
Substantially all of our CBVA segment products were issued by one of our operating subsidiaries, ING USA.
Each of our CBVA segment deferred variable annuity products include some combination of the following features which the customer elected when purchasing the product:
Guaranteed Minimum Death Benefits (GMDB).
| • | Standard. Guarantees that, upon the death of the individual specified in the policy, the death benefit will be no less than the premiums paid by the customer, adjusted for withdrawals. |
| • | Ratchet. Guarantees that, upon the death of the individual specified in the policy, the death benefit will be no less than the greater of (1) Standard or (2) the maximum policy anniversary (or quarterly) value of the variable annuity, adjusted for withdrawals. |
| • | Rollup. Guarantees that, upon the death of the individual specified in the policy, the death benefit will be no less than the aggregate premiums paid by the contract owner, with interest at the contractual rate per annum, adjusted for withdrawals. The Rollup may be subject to a maximum cap on the total benefit. |
-228-
Table of Contents
| • | Combo. Guarantees that, upon the death of the individual specified in the policy, the death benefit will be no less than the greater of (1) Ratchet or (2) Rollup. |
Guaranteed Minimum Living Benefits
| • | Guaranteed Minimum Income Benefit (GMIB). Guarantees a minimum income payout, exercisable only on a contract anniversary on or after a specified date, in most cases 10 years after purchase of the GMIB rider. The income payout is determined based on contractually established annuity factors multiplied by the benefit base. The benefit base equals the premium paid at the time of product issue and may increase over time based on a number of factors, including a rollup percentage (mainly 7% or 6% depending on the version of the benefit) and ratchet frequency subject to maximum caps which vary by product version (200%, 250% or 300% of initial premium). |
| • | Guaranteed Minimum Withdrawal Benefit and Guaranteed Minimum Withdrawal Benefit for Life (GMWB/GMWBL) Guarantees an annual withdrawal amount for a specified period of time (GMWB) or life (GMWBL) that is calculated as a percentage of the benefit base that equals premium paid at the time of product issue and may increase over time based on a number of factors, including a rollup percentage (mainly 7%, 6% or 0%, depending on versions of the benefit) and ratchet frequency (primarily annually or quarterly, depending on versions). The percentage used to determine the guaranteed annual withdrawal amount may vary by age at first withdrawal and depends on versions of the benefit. A joint life-time withdrawal benefit option was available to include coverage for spouses. Most versions of the withdrawal benefit included reset and/or step-up features that may increase the guaranteed withdrawal amount in certain conditions. Earlier versions of the withdrawal benefit guarantee that annual withdrawals of up to 7.0% of eligible premiums may be made until eligible premiums previously paid by the contract owner are returned, regardless of account value performance. Asset allocation requirements apply at all times where withdrawals are guaranteed for life. |
| • | Guaranteed Minimum Accumulation Benefit (GMAB). Guarantees that the account value will be at least 100% of the eligible premiums paid by the customer after 10 years, adjusted for withdrawals. We offered an alternative design that guaranteed the account value to be at least 200% of the eligible premiums paid by contract owners after 20 years. |
Reserves for Future Policy Benefits
We establish and carry actuarially-determined reserves that are calculated to meet our future obligations. The principal assumptions used to establish liabilities for future policy benefits are based on our experience and periodically reviewed against industry standards. These assumptions include mortality, policy lapse, investment returns, inflation, benefit utilization and expenses. Changes in, or deviations from, the assumptions used can significantly affect our reserve levels and related future operations.
The determination of future policy benefit reserves is dependent on actuarial assumptions set by us in determining policyholder behavior, as described above.
Reserves for variable annuity GMDB and GMIB are determined by estimating the value of expected benefits in excess of the projected account balance and recognizing the excess ratably over the accumulation period based on total expected assessments. Expected assessments are based on a range of scenarios. The reserve for the GMIB guarantee incorporates an assumption for the percentage of the contracts that will annuitize. In general, we assume that GMIB annuitization rates will be higher for policies with more valuable (more “in the money”) guarantees. We periodically evaluate estimates used and adjust the additional liability balance, with a related charge or credit to benefit expense, if actual experience or other evidence suggests that earlier assumptions should be revised. Changes in reserves for GMDB and GMIB are reported in Policyholder benefits in the Consolidated Statements of Operations.
-229-
Table of Contents
Variable annuity GMAB, GMWB, and GMWBL are considered embedded derivatives, which are measured at estimated fair value separately from the host annuity contract, along with attributed fees collected or payments made, reported in Other net realized capital gains (losses) in the Consolidated Statements of Operations.
At inception of the GMAB, GMWB, and GMWBL contracts, we project fees to be attributed to the embedded derivative portion of the guarantee equal to the present value of projected future guaranteed benefits. Any excess or deficient fee is attributed to the host contract and reported in Fee income in the Consolidated Statements of Operations.
The estimated fair value of the GMAB, GMWB, and GMWBL contracts is determined based on the present value of projected future guaranteed benefits, minus the present value of projected attributed fees. A risk neutral valuation methodology is used under which the cash flows from the guarantees are projected under multiple capital market scenarios using observable risk free rates. The projection of future guaranteed benefits and future attributed fees require the use of assumptions for capital markets (e.g. implied volatilities, correlation among indices, risk-free swap curve, etc.) and policyholder behavior (e.g. lapse, benefit utilization, mortality, etc.). The projection also includes adjustments for nonperformance risk and margins for non-capital market risks, or policyholder behavior assumptions. Risk margins are established to capture uncertainties related to policyholder behavior assumptions. The margin represents additional compensation a market participant would require in order to assume these risks.
The table below presents the policy count and account value by type of deferred variable annuity benefits.
| ($ in millions, unless otherwise specified) | As of December 31, 2013 | |||||||||||
| Policy Count | Account Value(1) | |||||||||||
| $ | % | |||||||||||
| Guaranteed Minimum Death Benefits: |
443,386 | $ | 44,740 | |||||||||
| Standard |
193,888 | 20,676 | 46 | % | ||||||||
| Ratchet |
100,296 | 8,384 | 19 | % | ||||||||
| Rollup |
30,018 | 2,398 | 5 | % | ||||||||
| Combo |
119,184 | 13,282 | 30 | % | ||||||||
| Guaranteed Living Benefits: |
443,386 | 44,740 | ||||||||||
| GMIB |
163,343 | 15,909 | 36 | % | ||||||||
| GMWBL |
123,276 | 16,537 | 37 | % | ||||||||
| GMAB/GMWB |
10,312 | 943 | 2 | % | ||||||||
| No Living Benefit |
146,455 | 11,351 | 25 | % | ||||||||
| (1) | Account value excludes $959 million of Payout, Policy Loan and Life Insurance business which is included in consolidated account values. |
Capital Management Considerations
The focus of the management of the CBVA segment is on regulatory reserve and capital requirements. As of December 31, 2013 we held regulatory reserves, net of third-party reinsurance, of $3.3 billion supporting variable annuity guarantees, of which included $2.4 billion supporting living benefit guarantees.
Both market movements and changes in actuarial assumptions (including policyholder behavior and mortality) can result in significant changes to the regulatory reserve and rating agency capital requirements of this segment. The section below on “Variable Annuity Hedge Program and Reinsurance” describes the Variable Annuity CHO program, which is designed to mitigate the effect of adverse equity market movements on our regulatory capital and rating agency capital positions. Additionally, the section on “CBVA Risks and Risk Management” discusses the risk of adverse developments in policyholder behavior and its potential impact on the regulatory reserves and rating agency capital position.
-230-
Table of Contents
We believe that our hedge program combined with our statutory reserves related to the variable annuity block, provides adequate resources to fund a wide range of, but not all, possible market scenarios as well as a margin for adverse policyholder behavior.
NAR
The NAR for the GMDB, GMAB and GMWB benefits is equal to the guaranteed value of these benefits in excess of the account values in each case as of the date indicated. The NAR assumes utilization of benefits by all customers as of the date indicated.
The NAR for the GMIB and GMWBL benefits is equal to the excess of the present value of the minimum guaranteed annuity payments available to the contract owner over the current account value. It assumes that all policyholders exercise their benefit immediately, even if they have not yet attained the first exercise date shown in their contracts, and that there are no future lapses. The NAR assumes utilization of benefits by all customers as of the date indicated. This hypothetical immediate exercise of the benefit means that the customers give up any future increase in the guaranteed benefit that might accrue if they were to delay exercise to a later date. The discount rates used in the GMIB NAR methodology grade from current U.S. Treasury rates to long-term best estimates over ten years. The GMWBL NAR methodology uses current swap rates. The discounting for GMWBL and GMIB NAR was developed to be consistent with the methodology for the establishment of U.S. GAAP reserves.
For GMIB products in general, the policyholder has the right to elect income payment, beginning (for certain products) on the tenth anniversary year of product commencement, receive lump sum payment of the then current cash value, or remain in the variable sub-account. For GMIB products, if the policyholder makes the election to annuitize, the policyholder is entitled to receive the guaranteed benefit amount over an annuitization period. A small percentage of the products were first eligible to elect annuitizations beginning in 2010 and 2011. The remainder of the products become eligible to elect annuitization from 2012 to 2020, with the majority of first eligibility dates in the period from 2014 to 2016. Many of these contracts contain significant incentives to delay annuitization past first eligibility.
Because policyholders have various contractual rights and significant incentives to defer their annuitization election, the period over which annuitization election will take place is subject to policyholder behavior and therefore indeterminate. In addition, upon annuitization the contract holder surrenders access to the account value and the account value is transferred to the Company’s general account where it is invested and the additional investment proceeds are used towards payment of the guaranteed benefit payment.
Similarly, most of our GMWBL contracts are still in the first four to six policy years, so our assumptions for withdrawal from contracts with GMWBL benefits may change as experience emerges. In addition, like our GMIB contracts, many of our GMWBL contracts contain significant incentives to delay withdrawal. We expect customer decisions on annuitization and withdrawal will be influenced by customers’ financial plans and needs as well as by interest rate and market conditions over time and by the availability and features of competing products. If emerging experience deviates from our assumptions on either GMIB annuitization or GMWBL withdrawal, we could experience gains or losses and a significant decrease or increase to reserve and capital requirements.
-231-
Table of Contents
The account values and NAR, both gross and net of reinsurance (“retained NAR”), of contract owners by type of minimum guaranteed benefit for retail variable annuity contracts are summarized below as of December 31, 2013:
| ($ in millions) | As of December 31, 2013 | |||||||||||||||||||
| Account Value(1) | Gross NAR |
Retained NAR | % Contracts NAR In-the-Money(2) |
%
NAR In-the-Money(3) |
||||||||||||||||
| GMDB |
$44,740 | $ | 5,702 | $ | 5,074 | 40% | 26% | |||||||||||||
|
|
|
|
|
|
|
|
|
|
|
|||||||||||
| Living Benefit |
||||||||||||||||||||
| GMIB |
$15,909 | $ | 1,682 | $ | 1,682 | 62% | 15% | |||||||||||||
| GMWBL |
16,537 | 452 | 452 | 24% | 12% | |||||||||||||||
| GMAB/GMWB |
943 | 20 | 20 | 12% | 18% | |||||||||||||||
|
|
|
|
|
|
|
|
|
|
|
|||||||||||
| Living Benefit Total |
$33,389 | $ | 2,154 | $ | 2,154 | 44% | (4) | 14% | (5) | |||||||||||
|
|
|
|
|
|
|
|
|
|
|
|||||||||||
| (1) | Account value excludes $959.0 million of Payout, Policy Loan and Life Insurance business which is included in consolidated account values. |
| (2) | Percentage of contracts that have a NAR greater than zero. |
| (3) | For contracts with a NAR greater than zero, % NAR In-the-Money is defined as NAR/(NAR + Account Value). |
| (4) | Total Living Benefit % Contracts NAR In-the-Money as of December 31, 2012 was 72%. |
| (5) | Total Living Benefit % NAR In-the-Money as of December 31, 2012 was 20%. |
As of the date indicated above, compared to $2.2 billion of NAR, we held gross statutory reserves before reinsurance of $2.4 billion for living benefit guarantees; of this amount, $2.3 billion was ceded to SLDI, supported by assets in trust. However, NAR and statutory reserves are not directly comparable measures. Our U.S. GAAP reserves for living benefit guarantees were $2.0 billion as of December 31, 2013. For a discussion of our U.S. GAAP reserves calculation methodology, see the Note for Business and Basis of Presentation and Significant Accounting Policies—Future Policy Benefits and Contract Owner Accounts in our Consolidated Financial Statements.
Variable Annuity Hedge Program and Reinsurance
Variable Annuity Guarantee Hedge Program. We primarily mitigate CBVA market risk exposures through hedging. Market risk arises primarily from the minimum guarantees within the CBVA products, whose economic costs are primarily dependent on future equity market returns, interest rate levels, equity volatility levels and policyholder behavior. The Variable Annuity Guarantee Hedge Program is used to mitigate our exposure to equity market and interest rate changes and seeks to ensure that the required assets are available to satisfy future death benefit and living benefit obligations. While the Variable Annuity Guarantee Hedge Program does not explicitly hedge statutory or U.S. GAAP reserves, as markets move up or down, in aggregate the returns generated by the Variable Annuity Guarantee Hedge Program will significantly offset the statutory and U.S. GAAP reserve changes due to market movements.
The objective of the Variable Annuity Guarantee Hedge Program is to offset changes in equity market returns for most minimum guaranteed death benefits and all guaranteed living benefits, while also providing interest rate protection for certain minimum guaranteed living benefits. We hedge the equity market exposure using a hedge target set using market consistent valuation techniques for all guaranteed living benefits and most death benefits. We also hedge a portion of the interest rate risk in our GMWB/GMAB/GMWBL blocks using a market consistent valuation hedge target. We do not hedge interest rate risks for our GMIB or GMDB primarily because doing so would result in volatility in our regulatory reserves and rating agency capital that exceeds our tolerances and, secondarily, because doing so would produce additional volatility in U.S. GAAP financial statements. These hedge targets may change over time with market movements, changes in regulatory and rating agency capital, available collateral and our risk tolerance. For example, during 2013, we reduced the amount of
-232-
Table of Contents
interest rate hedging for the GMWB/GMAB/GMWBL blocks to refine the impact of interest rate movements on regulatory and rating agency capital.
Equity index futures on various equity indices are used to mitigate the risk of the change in value of the policyholder-directed separate account funds underlying the variable annuity contracts with minimum guarantees. A dynamic trading program is utilized to seek replication of the performance of targeted fund groups (i.e., the fund groups that can be covered by indices where liquid futures markets exist).
Total return swaps are also used to mitigate the risk of the change in value of certain policyholder-directed separate account funds. These include fund classes such as emerging markets and real estate. They may also be used instead of futures of more liquid indices where it may be deemed advantageous. This hedging strategy is employed at our discretion based on current risk exposures and related transaction costs.
Interest rate swaps are used to match a portion of the hedge targets on GMWB/GMAB/GMWBL as described above.
Variance swaps and equity options are used to mitigate the impact of changes in equity volatility on the economic liabilities associated with certain minimum guaranteed living benefits. This program began in the second quarter of 2012.
Foreign exchange forwards are used to mitigate the impact of policyholder-directed investments in international funds with exposure to fluctuations in exchange rates of certain foreign currencies. Rebalancing is performed based on pre-determined notional exposures to the specific currencies.
Variable Annuity Capital Hedge Overlay Program. CBVA guaranteed benefits are hedged based on their economic or fair value; however, the statutory reserves and rating agency required assets are not based on a market value. When equity markets decrease, the statutory reserve and rating agency required assets for the CBVA guaranteed benefits can increase more quickly than the value of the derivatives held under the Variable Annuity Guarantee Hedge Program. This causes regulatory reserves to increase and rating agency capital to decrease. The CHO program is intended to mitigate equity risk to the regulatory and rating agency capital of the Company. The hedge is executed through the purchase and sale of equity index derivatives and is designed to limit the uncovered reserve and rating agency capital increases in an immediate down equity market scenario to an amount we believe prudent for a company of our size and scale. This amount will change over time with market movements, changes in regulatory and rating agency capital, available collateral and our risk tolerance.
The following table summarizes the estimated net impacts to funding our regulatory reserves to our CBVA segment, after giving effect to our CHO program and the Variable Annuity Guarantee Hedge Program for various shocks in equity markets and interest rates. This reflects the hedging we had in place as well as any collateral (in the form of LOC) or change in underlying asset values that would be used to achieve credit for reinsurance for the segment of liabilities reinsured to our Arizona captive at the close of business on December 31, 2013 in light of our determination of risk tolerance and available collateral at that time, which, as noted above, we assess periodically.
| As of December 31, 2013 | ||||||||||||||||||||||||||||||||
| ($ in millions) | Equity Market (S&P 500) | Interest Rates | ||||||||||||||||||||||||||||||
| -25% | -15% | -5% | +5% | +15% | +25% | -1% | +1% | |||||||||||||||||||||||||
| Decrease/(increase) in regulatory reserve |
$ | (3,800 | ) | $ | (2,150 | ) | $ | (550 | ) | $ | 600 | $ | 1,300 | $ | 1,800 | $ | (800 | ) | $ | 50 | ||||||||||||
| Hedge gain/(loss), immediate impact |
2,700 | 1,350 | 350 | (400 | ) | (1,050 | ) | (1,500 | ) | 550 | (450 | ) | ||||||||||||||||||||
| Increase/(decrease) in Market Value of Assets |
— | — | — | — | — | — | 300 | (300 | ) | |||||||||||||||||||||||
| Increase/(decrease) in LOCs |
1,100 | 800 | 250 | — | — | — | — | 650 | ||||||||||||||||||||||||
|
|
|
|
|
|
|
|
|
|
|
|
|
|
|
|
|
|||||||||||||||||
| Net impact |
$ | — | $ | — | $ | 50 | $ | 200 | $ | 250 | $ | 300 | $ | 50 | $ | (50 | ) | |||||||||||||||
|
|
|
|
|
|
|
|
|
|
|
|
|
|
|
|
|
|||||||||||||||||
The foregoing sensitivities illustrate the estimated impact of the indicated shocks beginning on the first market trading day following December 31, 2013 and give effect to rebalancing over the course of the shock
-233-
Table of Contents
event. The estimates of equity market shocks reflect a shock to all equity markets, domestic and global, of the same magnitude. The estimates of interest rate shocks reflect a shock to rates at all durations (a “parallel” shift in the yield curve). Decrease / (increase) in regulatory reserves includes statutory reserves for policyholder account balances, AG43 reserves and additional cash flow testing reserves related to the CBVA segment. Hedge Gain / (Loss) includes both the Variable Annuity Guarantee Hedge Program and the CHO program and assumes that hedge positions can be rebalanced during the market shock and that the performance of the derivative contracts reasonably matches the performance of the contract owners’ variable fund returns. Increase / (decrease) in LOCs indicates the change in the amount of LOCs used to provide credit for reinsurance at those times when the assets backing the reinsurance liabilities may be less than the statutory reserve requirement. As of December 31, 2013 the amount of available LOCs was approximately $1.2 billion. Increase / (decrease) in Market Value of Assets is the estimated potential change in market value of assets supporting the segment of liabilities reinsured to our Arizona captive from 100 basis point upward and downward shifts in interest rates.
Results of an actual shock to equity markets or interest rates will differ from the above illustration for reasons such as variance in market volatility versus what is assumed, ‘basis risk’ (differences in the performance of the derivative contracts versus the contract owner variable fund returns), equity shocks not occurring uniformly across all equity markets, combined effects of interest rates and equities, additional impacts from rebalancing of hedges and/or the effects of time and changes in assumptions or methodology that affect reserves or hedge targets. Additionally, estimated net impact sensitivities vary over time as the market and closed book of business evolve or if assumptions or methodologies that affect reserves or hedge targets are refined. In February 2014, we purchased equity indexed options in our CHO program and refined the impact of equity movements on regulatory and rating agency capital to up-market scenarios as a result.
As stated above, the primary focus of the hedge program is to protect regulatory and rating agency capital from equity market movements. Hedge ineffectiveness, along with other aspects not directly hedged (including unexpected policyholder behavior), may cause losses of regulatory or rating agency capital. Regulatory and rating agency capital requirements may move disproportionately (i.e., they may change by different amounts as market conditions and other factors change), and, therefore, this could also cause our hedge program to not realize its key objective of protecting both regulatory and rating agency capital from equity market movements.
For ING USA, our guarantee and overlay equity hedges resulted in a loss of approximately $2.5 billion for the year ended December 31, 2013, which was offset by the equity market decrease in AG43 reserves in excess of reserves for cash surrender value of approximately $3.4 billion for the year ended December 31, 2013. Changes in statutory reserves due to equity and equity hedges for ING USA include the effects of non-affiliated reinsurance for variable annuity policies, but exclude the effect of the affiliated reinsurance transaction associated with the GMIB and GMWBL riders. Substantially all of the CBVA business was written by ING USA. In addition to equity hedge results and change in reserves due to the impact of equity market movements, statutory income includes fee income, investment income and other income offset by benefit payments, operating expenses and other costs as well as impacts to reserves and hedges due to effects of time and other market factors.
As U.S. GAAP accounting differs from the methods used to determine regulatory reserves and rating agency capital requirements, our hedge programs may result in immediate impacts that may be lower or higher than the regulatory impacts illustrated above. The following table summarizes the estimated net impacts to U.S. GAAP earnings pre-tax in our CBVA segment, which is the sum of the increase or decrease in U.S. GAAP reserves and the hedge gain or loss from our CHO program and the Variable Annuity Guarantee Hedge Program for various shocks in both equity markets and interest rates. This reflects the hedging we had in place at the close of business on December 31, 2013 in light of our determination of risk tolerance at that time, which, as noted above, we assess periodically.
| As of December 31, 2013 | ||||||||||||||||||||||||||||||||
| ($ in millions) | Equity Market (S&P 500) | Interest Rates | ||||||||||||||||||||||||||||||
|
|
|
|
|
|||||||||||||||||||||||||||||
| -25% | -15% | -5% | +5% | +15% | +25% | -1% | +1% | |||||||||||||||||||||||||
| Total estimated earnings sensitivity |
$ | 850 | $ | 350 | $ | 100 | $ | (150 | ) | $ | (450 | ) | $ | (650 | ) | $ | (300 | ) | $ | 150 | ||||||||||||
-234-
Table of Contents
The foregoing sensitivities illustrate the impact of the indicated shocks on the first market trading day following December 31, 2013 and give effect to dynamic rebalancing over the course of the shock events. The estimates of equity market shocks reflect a shock to all equity markets, domestic and global, of the same magnitude. The estimates of interest rate shocks reflect a shock to rates at all durations (a “parallel” shift in the yield curve). We regularly monitor and refine our hedge program targets in line with our primary goal of protecting regulatory and rating agency capital. It is possible that further changes to our hedge program will be made and those changes may either increase or decrease earnings sensitivity. Liabilities are based on U.S. GAAP reserves and embedded derivatives, with the latter excluding the effects of nonperformance risk. DAC is amortized on gross revenues, which will not be volatile, however, volatility could be driven by loss recognition. Hedge Gain / (Loss) impacting the above estimated earnings sensitivity includes both the Variable Annuity Guarantee Hedge Program and the CHO program and assumes that hedge positions can be rebalanced during the market shock and that the performance of the derivative contracts closely matches the performance of the contract owners’ variable fund returns.
Actual results will differ from the estimates above for reasons such as variance in market volatility versus what is assumed, ‘basis risk’ (differences in the performance of the derivative contracts versus the contract owner variable fund returns), changes in non-performance spreads, equity shocks not occurring uniformly across all equity markets, combined effects of interest rates and equities, additional impacts from rebalancing of hedges, and/or the effects of time and changes in assumptions or methodology that affect reserves or hedge targets. Additionally, estimated net impact sensitivities vary over time as the market and closed block of business evolves, or if changes in assumptions or methodologies that affect reserves or hedge targets are refined. As the closed block of business evolves, actual net impacts are realized, or if changes are made to the target of the hedge program, the sensitivities may vary over time. Additionally, actual results will differ from the above due to issues such as basis risk, market volatility, changes in implied volatility, combined effects of interest rates and equities, rebalancing of hedges in the future, or the effects of time and other variations from the assumptions in the above table. In February 2014, we purchased equity indexed options in our CHO program and refined the impact of equity movements on regulatory and rating agency capital to up-market scenarios as a result.
In addition to equity market and interest rate changes, movements in other market variables that are not explicitly hedged can also cause U.S. GAAP earnings volatility. This includes changes in implied equity market volatility (implied from the market prices of equity options) that affects the valuation of our fair value liabilities. We do not fully hedge for equity implied volatility given that such hedging introduces volatility in our regulatory reserves and rating agency capital which are not as sensitive to this market variable. As of December 31, 2013, the U.S. GAAP sensitivity (exclusive of our nonperformance spread) of the GMAB / GMWB and GMWBL liabilities to a 1 percentage point move in implied volatility was approximately $55 million.
Hedging instruments
| • | Guarantee Hedge. In order to mitigate equity risk associated with non-reinsured GMDBs and non-reinsured guaranteed living benefits, we enter into futures positions and total return swaps on various public market equity indices chosen to closely replicate contract owner variable fund returns. We also mitigate most of the foreign currency risk arising from its international fund exposure using forward contracts. We use market consistent valuation techniques to establish our derivative positions and to rebalance the derivative positions in response to market fluctuations. We also administer a hedge program that mitigates not only equity risk, but also the interest rate risk associated with our GMWB, GMWBL and GMAB riders. This component of the hedge primarily involves entering into interest rate swaps. In the second quarter of 2012, we entered into equity variance swaps and equity options to cover the volatility risks associated with the GMWB and GMAB riders. |
| • | Capital Hedge Overlay. The Variable Annuity CHO program is an overlay to the Variable Annuity Guarantee Hedge Program that mitigates the impact of potential declines in equity markets and their impact on regulatory reserves and rating agency capital. The program’s hedge strategy primarily involves using equity derivatives. |
-235-
Table of Contents
The following table presents notional and fair value for hedging instruments:
| ($ in millions) | Notional Amount | Fair Value | ||||||||||||||||||||||
| As of December 31, 2013 |
As of December 31, 2012 |
As of December 31, 2011 |
As of December 31, 2013 |
As of December 31, 2012 |
As of December 31, 2011 |
|||||||||||||||||||
| Variable Annuity Hedge Program: |
||||||||||||||||||||||||
| Equity Futures(3) |
$ | 6,641.3 | $ | 9,976.0 | $ | 11,068.4 | $ | (20.9 | ) | $ | (216.0 | ) | $ | 26.8 | ||||||||||
| Total Return Swaps |
1,048.7 | 841.4 | 773.6 | (8.5 | ) | 0.1 | (16.9 | ) | ||||||||||||||||
| Variance Swaps |
1.8 | 1.8 | — | (17.0 | ) | (8.4 | ) | — | ||||||||||||||||
| Currency Forwards(1) |
698.2 | 1,267.6 | 1,032.3 | (0.5 | ) | 8.2 | 2.4 | |||||||||||||||||
| Interest Rate Swaps(1)(2) |
12,874.0 | 19,799.0 | 19,352.0 | (449.1 | ) | 936.1 | 1,154.7 | |||||||||||||||||
| Put Options(1) |
605.0 | 351.3 | 63.7 | 14.2 | 26.8 | — | ||||||||||||||||||
|
|
|
|
|
|
|
|
|
|
|
|
|
|||||||||||||
| Total |
$ | 21,869.1 | $ | 32,237.0 | $ | 32,290.0 | $ | (481.8 | ) | $ | 746.7 | $ | 1,167.0 | |||||||||||
|
|
|
|
|
|
|
|
|
|
|
|
|
|||||||||||||
| (1) | Offsetting contracts have not been netted, therefore total notional of all outstanding contracts is shown. |
| (2) | Total notional shown is a combination of pay-fix and pay-float contracts. |
| (3) | Fair Value equals last day’s cash settlement. |
Reinsurance. For contracts issued prior to January 1, 2000, most contracts with enhanced death benefit guarantees were reinsured to third-party reinsurers to mitigate the risk produced by such guaranteed death benefits. For contracts issued on or after January 1, 2000, the Company instituted a Variable Annuity Guarantee Hedge Program in lieu of reinsurance. We utilized indemnity reinsurance agreements prior to January 1, 2000 to reduce our exposure to large losses from GMDBs in our CBVA segment. Reinsurance permits recovery of a portion of losses from reinsurers, although it does not discharge our primary liability as direct insurer of the risks. We evaluate the financial strength of potential reinsurers and continually monitor the financial strength and credit ratings of our reinsurers.
CBVA and Risk Management
The amounts ultimately due to policyholders under GMDB and guaranteed minimum living benefits, and the reserves required to support these liabilities, are driven by a variety of factors, including equity market performance, interest rate conditions, policyholder behavior, including exercise of various contract options, and policyholder mortality. We actively monitor each of these factors and implement a variety of risk management and financial management techniques to optimize the value of the block. Such techniques include hedging, use of affiliate reinsurance, external reinsurance, and experience studies. See the Consolidated Financial Statements for more information on the reinsurance arrangements.
Market Risk Related to Equity Market Price and Interest Rates. Our variable annuity products are significantly influenced by the United States and other global equity markets. Increases or decreases in equity markets impact certain assets and liabilities related to our variable annuity products and our earnings derived from those products. A decrease in the equity markets may cause a decrease in the account values, thereby increasing the possibility that we may be required to pay amounts to contract owners due to guaranteed death and living benefits. An increase in the value of the equity markets may increase account values for these contracts, thereby decreasing our risk associated with guaranteed death and living benefits.
We are also subject to interest rate risk in our CBVA segment, as a sustained decline in interest rates or a prolonged period of low interest rates may subject us to higher cost of guaranteed benefits and increased hedging costs.
In addition, in scenarios of equity market declines, sustained periods of low interest rates, rapidly rising interest rates or credit spread widening, the amount of additional statutory reserves that an insurance subsidiary is required to hold for variable annuity guarantees may increase. This increase in reserves would decrease the statutory surplus available for use in calculating its RBC ratios. In addition, collateral posting requirements for the hedge program could also pressure liquidity.
-236-
Table of Contents
Periods of significant and sustained downturns in equity markets, increased equity volatility, reduced interest rates or a prolonged period of low interest rates could result in an increase in the valuation of the future policy benefit or account balance liabilities associated with such products, resulting in a reduction to net income (loss). Although a certain portion of our guaranteed benefits are reinsured or covered under our Variable Annuity Guarantee Hedge Program, for those guarantees not covered by these programs, we are exposed to the risk of increased costs and/or liabilities for benefits guaranteed in excess of account values during periods of adverse economic market conditions. Our risk management program is constantly re-evaluated to respond to changing market conditions and achieve the optimal balance and trade-offs among several important factors, including regulatory reserves, rating agency capital, RBC, earnings and other factors. A certain portion of these strategies could focus our emphasis on the protection of regulatory and rating agency capital, RBC, liquidity, earnings and other factors and less on the earnings impact of guarantees, resulting in materially lower or more volatile U.S. GAAP earnings in periods of changing equity market levels. While we believe that our risk management program is effective in balancing numerous critical metrics, we are subject to the risk that our strategies and other management procedures prove ineffective or that unexpected policyholder experience, combined with unfavorable market events, produces losses beyond the scope of the risk management strategies employed, which may have a material adverse effect on our results of operations, financial condition and cash flows. We are also subject to the risk that the cost of hedging these guaranteed minimum benefits increases as implied volatilities increase and/or interest rates decrease, resulting in adverse impact to net income (loss).
Risk Related to Hedging. Our risk management program attempts to balance a number of important factors including regulatory reserves, rating agency capital, RBC, underlying economics, earnings and other factors. As discussed above, to reduce the risk associated with guaranteed living benefits, non-reinsured GMDB and fees related to these benefits, we enter derivative contracts on various public market indices chosen to closely replicate contract owner variable fund returns.
The Company’s risk management program is constantly re-evaluated to respond to changing market conditions and manage trade-offs among capital preservation, earnings and underlying economics.
Hedging instruments we use to manage risks might not perform as intended or expected, which could result in higher realized losses and unanticipated cash needs to collateralize or settle such transactions. Adverse market conditions can limit the availability and increase the costs of hedging instruments, and such costs may not be recovered in the pricing of the underlying products being hedged. In addition, hedging counterparties may fail to perform their obligations resulting in unhedged exposures and losses on positions that are not collateralized.
Risk Related to Policyholder Behavior Assumptions. Our CBVA segment is subject to risks associated with the future behavior of policyholders and future claims payment patterns, using assumptions for mortality experience, lapse rates, GMIB annuitization rates, and GMWB/GMWBL withdrawal rates. We are required to make assumptions about these behaviors and patterns, which may not reflect the actual behaviors and patterns we experience in the future.
In particular, we have only minimal experience on policyholder behavior for our GMIB and GMWBL products, and, as a result, future experience could lead to significant changes in our assumptions. Our GMIB contracts have a ten-year waiting period before annuitization is available, with most of these GMIB contracts issued during the period 2004 to 2006. Those contracts first become eligible to annuitize during the period from 2014 through 2016, but contain significant incentives to delay annuitization beyond the first eligibility date. As a result, to date we have only a statistically small sample of experience used to set annuitization rates. Therefore, we anticipate that observable experience data will become statistically credible later this decade, when a large volume of GMIB benefits begin to reach their maximum benefit over a four-year period from 2019 to 2022. It is possible, however, that more policyholders than we anticipate will choose to annuitize soon after the first eligibility date, rather than delay annuitization to receive increased guarantee benefits, in which case we may have increasingly statistically credible experience as early as the period from 2014 through 2016.
-237-
Table of Contents
Similarly, most of our GMWBL contracts are still in the first four to six policy years, so our assumptions for withdrawal from contracts with GMWBL benefits may change as experience emerges. In addition, like our GMIB contracts, many of our GMWBL contracts contain significant incentives to delay withdrawal. We expect customer decisions on annuitization and withdrawal will be influenced by customers’ financial plans and needs as well as by interest rate and market conditions over time and by the availability and features of competing products. If emerging experience deviates from our assumptions on either GMIB annuitization or GMWBL withdrawal, we could experience gains or losses and a significant decrease or increase to reserve and capital requirements.
We also make estimates of expected lapse of these products, which is the probability that a policy will not remain in force from one period to the next. Lapse rates of our annuity products may be significantly impacted by the value of guaranteed minimum benefits relative to the value of the underlying separate accounts (account value or account balance). In general, policies with guarantees that are “in the money” (i.e., where the notional benefit amount is in excess of the account value) are assumed to be less likely to lapse. Conversely, “out of the money” guarantees are assumed to be more likely to lapse as the policyholder has less incentive to retain the policy. Lapse rates could also be adversely affected generally by developments that affect customer perception of us.
We make estimates of expected election rates of living benefits for these products and of the rate of election of certain optional benefits that may be exercised. The profitability of our deferred annuity products depends upon actual contract owner decisions to elect or delay the utilization of such benefits. The development of a secondary market for third-party investor strategies in the annuities business could also adversely affect the profitability of existing business by reducing lapse rates of in-the-money contracts in excess of current expectations or by causing living benefits to be elected at points in time that are more unfavorable than our current expectations. Actual lapse rates that are lower than our lapse rate assumptions could have an adverse effect on profitability in the later years of a block of business because the anticipated claims experience may be higher than expected in these later years. If actual lapse rates are significantly different from those assumed in our current reserving assumptions, our reserves for future policy benefits may prove to be inadequate.
Our variable annuity lapse rate experience has varied significantly over the period from 2006 to the present, reflecting among other factors, both pre- and post-financial crisis experience. During the early years of this period, our variable annuity policyholder lapse rate experience was higher than our current best estimate of policyholder lapse behavior would have indicated; in the later part of this period, after mid-2009, it was lower. Management’s current best estimate of variable annuity policyholder lapse behavior incorporates actual experience over the entire period, as we believe that over the duration of the CBVA policies we will experience the full range of policyholder behavior and market conditions. If our future experience were to approximate our lapse experience from later in the period, we would likely need to increase reserves, by an amount that could be material.
We make estimates regarding mortality, which refers to the ceasing of life contingent benefit payments due to the death of the annuitant. Mortality is also the incidence of death amongst policyholders triggering the payment of Guaranteed Minimum Death Benefits. We use a combination of actual and industry experience when setting our mortality assumptions. If actual mortality rates differ from those assumed in our current reserving assumptions, our reserves for future policy benefits may be materially different.
We review overall policyholder experience annually (including lapse, annuitization, withdrawal and mortality), or more frequently if necessary. As customer experience continues to materialize, we may adjust our assumptions. The magnitude of any required changes could be material and adverse to the results of operations or financial condition of the Company. We increased reserves in the fourth quarter of 2011 after a comprehensive review of our assumptions relating to lapses, mortality, annuitization of income benefits and utilization of withdrawal benefits. The review in 2011 included an analysis of a larger body of actual experience than was previously available, including a longer period with low equity markets and interest rates, which we believe provided greater insight into anticipated policyholder behavior for contracts that are in the money. This resulted
-238-
Table of Contents
in an increase of U.S. GAAP reserves of $741 million and gross U.S. statutory reserves of $2,776 million in the fourth quarter of 2011. It is possible that future assumption changes could produce reserve changes of this magnitude or even greater. Any such increase to reserves could require us to make material additional capital contributions to one or more of our insurance company subsidiaries or could otherwise be material and adverse to the results of operations or financial condition of the Company.
During the third quarters of 2013 and 2012 we conducted a periodic review of actuarial assumptions, including policyholder behavior assumptions. As a result of the 2013 review we incurred a loss of $185.3 million, which included $117.9 million of unfavorable mortality assumption changes and $85.5 million of unfavorable policyholder behavior assumption changes. As a result of the 2012 review, we recorded a loss of $151.7 million, of which $114.6 million was driven primarily by an update to lapse rates on variable annuity contracts with lifetime living benefit guarantees and $37.1 million was related to changes in cash flow projections and volatility assumptions on certain products. These changes in lapse assumptions, taken together with the update to lapse assumptions we made in late 2011, moved our assumptions to be in line with lapse experience over the study period of 2006 to present. Although we believe it is appropriate to consider actual experience over that entire period in setting our assumptions, this recent change also causes our assumption to move considerably closer to our actual lapse experience for the period from mid-2009 to present. However, as described in the previous paragraph, future reserve increases in connection with experience updates could be material and adverse to the results of operations or financial condition of the Company. Any such increase to reserves could require us to make material additional capital contributions to one or more of our insurance company subsidiaries or could otherwise be material and adverse to the results of operations or financial condition of the Company. We will continue to monitor the emergence of experience. We review our assumptions at least annually, and, if necessary, update our assumptions more frequently as additional information becomes available. If adjustments to policyholder behavior assumptions (e.g., lapse, annuitization and withdrawal) are necessary, which is ordinary course for interest-sensitive long dated liabilities, we anticipate that the financial impact of such a change will likely be in a range, either up or down, that is generally consistent with the impact experienced in the past two years.
Other Risks. Despite the closure of new product sales, some new policy amounts continue to be deposited as additional premium to existing contracts. Benefit designs do limit the attractiveness of additional premium, but in some cases these additional premiums may increase the guarantee available to the policyholder. The volume of additional premiums has diminished since we ceased new product sales in 2010.
Closed Block Institutional Spread Products
Prior to 2009, we operated a spread lending business, which we call Closed Block Institutional Spread Products. However, following the financial crisis in 2008, investor appetite for uncollateralized liabilities not rated “AAA” and collateralized funding became constrained causing funding spreads on new liabilities to widen. We shifted the focus of the business strategy from growing assets and earnings to running off the business over time. As of December 31, 2013, remaining assets in the institutional spread products portfolio had an amortized cost of $2.5 billion, down from a peak of $14.3 billion in 2008. We continue to reduce the block by allowing the assets and liabilities to mature or by finding opportunities to sell assets at prices deemed attractive. New liability contracts may be issued from time to time or be terminated early in order to better match the run-off of the asset portfolio. In addition, our Closed Block Institutional Spread Products segment wrote super senior credit default swap (“CDS”) contracts of which, as of December 31, 2013, approximately $1 billion of notional amount remained outstanding. As the business is in run-off, it is actively managed to limit liquidity risk and capital requirements.
Closed Block Other
The third financial reporting segment making up our Closed Block business is Closed Block Other, which includes continuing obligations and assets connected with the group reinsurance and individual reinsurance businesses we sold between 2004 and 2009. Effective January 2009, we sold our group reinsurance business,
-239-
Table of Contents
ING Reinsurance U.S., to RGA. The transaction was accounted for as a reinsurance transaction. To effect this sale, we entered into coinsurance agreements with various subsidiaries of RGA. See the Note for Reinsurance in our Consolidated Financial Statements for more information on these reinsurance arrangements. Between 2004 and 2009, we entered into several reinsurance transactions with Scottish Re and Hannover Re pursuant to which we ceded all liabilities related to our individual life reinsurance block. The reinsurance arrangements with respect to both the group and life individual reinsurance businesses are described more fully in “Management’s Discussion and Analysis of Financial Condition and Results of Operations—Liquidity and Capital Resources—Reinsurance” above.
Employees
As of December 31, 2013, we had approximately 7,000 employees, with most working in one of our 10 major sites in 9 states. On June 14, 2012, we announced that we entered into a seven-year agreement with Cognizant pursuant to which Cognizant will provide business processing and operations services related to our retirement, life insurance and annuities businesses (the “Cognizant transaction”). Under the terms of the agreement with Cognizant, on August 16, 2012, more than 1,000 of our employees became Cognizant employees and Cognizant gave such individuals comparable responsibilities to their former roles with us. Cognizant also purchased and subleased some of our existing facilities to provide business and workplace continuity for our customers and former employees.
Properties
As of December 31, 2013, we owned or leased 84 locations totaling approximately 2.3 million square feet, of which approximately 0.9 million square feet was owned properties and approximately 1.4 million square feet was leased properties throughout the United States.
Litigation and Regulatory Matters
See “Note 17. Commitments and Contingencies” included in this prospectus for information regarding our litigation and regulatory matters and our assessment of contingencies related to litigation and regulatory matters.
-240-
Table of Contents
Our operations and businesses are subject to a significant number of Federal and state laws, regulations, administrative determinations and similar legal constraints. Such laws and regulations are generally designed to protect our policyholders, contract owners and other customers and not our stockholders or holders of our other securities. Many of the laws and regulations to which we are subject are regularly re-examined and existing or future laws and regulations may become more restrictive or otherwise adversely affect our operations. The recent financial market disruptions have produced, and are likely to continue to produce, extensive changes in existing laws and regulations applicable to our businesses, including the Dodd-Frank Act discussed below.
Following is a description of certain legal and regulatory frameworks to which we or our subsidiaries are or may be subject.
Dutch State Transactions and Restructuring Plan
In November 2009, the 2009 Restructuring Plan received formal EC approval and the separation of insurance and banking operations and other components of the 2009 Restructuring Plan were approved by ING Group’s shareholders. On January 28, 2010, ING announced the filing of its appeal with the General Court of the European Union against specific elements of the EC’s decision regarding the 2009 Restructuring Plan.
On March 2, 2012, the General Court handed down its judgment in relation to ING Group’s appeal and annulled part of the EC’s state aid decision. Subsequently, the EC filed an appeal against the General Court’s judgment before the Court of Justice of the European Union. In parallel, the EC adopted a decision on May 11, 2012 that re-approved the state aid granted to ING Group as compatible with the internal market on the basis of ING Group’s 2009 Restructuring Plan. On the same date, the EC adopted an interim decision which opened an investigation concerning certain amendments and elements of the 2009 Restructuring Plan (the “Investigation”). On November 19, 2012, ING Group and the EC announced that the EC approved the 2012 Amended Restructuring Plan. On November 6, 2013, ING Group announced that the EC approved the 2013 Amended Restructuring Plan. The 2013 Amended Restructuring Plan has not amended any commitments that are applicable or relevant to ING U.S. The deadline as agreed with the EC in the 2012 Amended Restructuring Plan requires ING Group to divest at least 25% of the Company by December 31, 2013, more than 50% of the Company by December 31, 2014, and 100% of the Company by December 31, 2016. ING Group divested 25% of the Company on May 7, 2013, in our initial public offering and an additional 4% on May 31, 2013 following the exercise by the underwriters in the initial public offering of an option to purchase additional shares. ING Group divested an additional 14% of the Company on October 29, 2013, in a registered offering. The divestment of 50% of the Company is measured in terms of a divestment of over 50% of the shares of ING U.S., Inc., the loss of ING Group’s majority of directors on ING U.S., Inc.’s board of directors and the accounting deconsolidation of the Company (in line with IFRS accounting rules). This offering and the Direct Share Buyback, together with the governance changes described under “Summary—Changes to our Governance as a Result of this Offering and the Direct Share Buyback”, are intended to satisfy such requirements. The Investigation has been finalized by the EC and ING Group’s appeal against the EC’s May 11, 2012 decision has been withdrawn. In case ING Group does not satisfy its commitment to timely divest the Company as agreed with the EC, or in case of any other material non-compliance with the 2012 Amended Restructuring Plan, the Dutch State will renotify the recapitalization measure to the EC. In such a case the EC may require additional restructuring measures or take enforcement actions against ING Group, or, at the request of ING Group and the Dutch State, could allow ING Group more time to complete the divestment. For principal legal reasons, the EC will continue with its appeal against the General Court ruling of March 2012. However, the outcome of this appeal will not affect the EC approval of the 2012 Amended Restructuring Plan. It is expected that a judgment will be rendered in April 2014.
In addition to these divestment requirements, the 2012 Amended Restructuring Plan also places certain conditions and restrictions on ING Group’s business and operations, which could also apply to our business and operations. We may be subject to all or a portion of these requirements while we are controlled by ING Group and possibly as long as ING Group has a sufficient interest in our common stock.
-241-
Table of Contents
The 2012 Amended Restructuring Plan requires ING Group to refrain from acquisitions of financial institutions and, if it would delay ING Group’s repayment of state aid, from acquisitions of any other businesses. As a result, we may be prevented from making any such acquisitions for so long as ING Group continues to hold a sufficient interest in our common stock. In certain cases, the EC may grant its approval for an acquisition that would otherwise be prohibited by the 2012 Amended Restructuring Plan, in particular if such acquisition is essential in order to safeguard financial stability or competition in relevant markets. This acquisition ban will apply until the earlier of November 18, 2015, and the date on which ING Group has divested more than 50% of its insurance and investment management operations in each of Asia, the United States and Europe. The divestment of 50% of ING Group’s insurance and investment management operations is measured in terms of a divestment of over 50% of the shares in these operations, the loss of ING Group’s majority of directors on the boards of these operations and the accounting deconsolidation of the operations in line with IFRS accounting rules.
The 2012 Amended Restructuring Plan also places limitations on ING Group’s ability to call or buy back Tier 2 capital and Tier 1 hybrid debt instruments until the earlier of November 18, 2014 or the date on which ING Group has fully repaid the Core Tier 1 securities to the Dutch State (including the relevant accrued interest on Core Tier 1 coupons and exit premium fees), and contains provisions regarding its exposure to RMBS and CMBS securities. To the extent that these limitations and provisions apply to us, we may be restricted in our ability to acquire RMBS or CMBS, or to redeem any external hybrid debt instruments we may issue in the future.
For purposes of the 2012 Amended Restructuring Plan, the manner in which we conduct our CBVA and Institutional Spread Products businesses is subject to certain conditions and restrictions, which include a prohibition on underwriting new policies. Pursuant to the 2012 Amended Restructuring Plan, ING Group must also explore the possibility of terminating existing policies and adjusting the terms of policies to make them more favorable to the insurer. Moreover, ING Group must manage such run-off businesses in a manner that minimizes exposure to risk, including through a conservative hedging policy, which may limit ING Group’s ability to allocate capital and may require it to further separate businesses or business units. These requirements may place limitations on our ability to operate these businesses in the manner we believe to be the most economically advantageous, and could affect our ability to pursue new business that we believe would be profitable. The aforementioned conditions and restrictions with respect to the CBVA and Institutional Spread Products Business will apply for as long ING Group has control over ING U.S., Inc. Pursuant to the 2012 Amended Restructuring Plan, this means that these conditions and restrictions cease to apply when ING Group (i) has divested more than 50% of our common stock (ii) has deconsolidated our operations (in line with IFRS accounting rules) and (iii) has lost its majority of directors on ING U.S. Inc.’s board of directors.
In operating our business, we have to abide by these requirements of the EC, including any future decisions, guidance or interpretation of the EC, that may be applicable to ING U.S., Inc. possibly for as long as ING Group has a sufficient interest in our common stock. These requirements, in turn, may limit our ability to take advantage of market conditions and growth opportunities, and we may be unable to undertake certain acquisitions, engage in particular lines of business or conduct certain financing activities. We may also be required to divest certain assets and be restricted in our ability to operate run-off businesses, and may be adversely affected in our ability to maintain or grow market share.
Regulation Affecting ING U.S., Inc.
We are a holding company for all of our business operations, which we conduct through our subsidiaries. We, as an insurance holding company, are not licensed as an insurer, investment advisor, broker-dealer, or other regulated entity. However, because we own regulated insurers, we are subject to regulation as an insurance holding company.
Insurance Regulation
Our U.S. insurance subsidiaries are subject to comprehensive regulation and supervision under U.S. state and federal laws. Each U.S. state, the District of Columbia and U.S. territories and possessions have insurance laws that apply to companies licensed to carry on an insurance business in the jurisdiction. The primary regulator of an insurance company, however, is located in its state of domicile. Each of our U.S. insurance subsidiaries is licensed and regulated in each state where it conducts insurance business.
-242-
Table of Contents
State insurance regulators have broad administrative powers with respect to all aspects of the insurance business including: licensing to transact business, licensing agents, admittance of assets to statutory surplus, regulating premium rates for certain insurance products, approving policy forms, regulating unfair trade and claims practices, establishing reserve requirements and solvency standards, establishing credit for reinsurance requirements, fixing maximum interest rates on life insurance policy loans and minimum accumulation or surrender values and other matters. State insurance laws and regulations include numerous provisions governing the marketplace conduct of insurers, including provisions governing the form and content of disclosures to consumers, product illustrations, advertising, product replacement, suitability, sales and underwriting practices, complaint handling and claims handling. State regulators enforce these provisions through periodic market conduct examinations. State insurance laws and regulations regulating inter-party transactions, the payment of dividends, the types, amounts and valuations of permitted investments and change of control transactions are discussed in greater detail below.
Our Principal Insurance Subsidiaries are domiciled in Colorado, Connecticut, Iowa and Minnesota. Our other U.S. insurance subsidiaries are domiciled in Indiana and New York. Our insurance subsidiaries domiciled in Colorado, Connecticut, Indiana, Iowa, Minnesota and New York are collectively referred to as “our insurance subsidiaries” in this prospectus for purposes of discussions of U.S. insurance regulatory matters. In addition, we have special purpose life reinsurance captive insurance company subsidiaries domiciled in Missouri that provide reinsurance to our U.S. insurance subsidiaries in order to facilitate the financing of statutory reserve requirements associated with Regulation XXX or AG38 and to fund statutory Stable Value reserves in excess of the economic reserve level. Our special purpose life reinsurance captive insurance company subsidiaries domiciled in Missouri are collectively referred to as “captive reinsurance subsidiaries” in this prospectus. We also have a special purpose life reinsurance captive insurance company domiciled in South Carolina that provided reinsurance to our U.S. insurance subsidiaries in order to facilitate the financing of statutory reserve requirements associated with Regulation XXX or AG38. For more information on our use of captive reinsurance structures, see “Management’s Discussion and Analysis of Financial Condition and Results of Operations—Liquidity and Capital Resources—Credit Facilities and Subsidiary Credit Support Arrangements”. We also have a captive reinsurance subsidiary domiciled in Arizona that primarily provides reinsurance to our insurance subsidiaries. Our captive reinsurance subsidiary domiciled in Arizona is referred to as “our Arizona captive” in this prospectus.
State insurance laws and regulations require our insurance subsidiaries to file financial statements with state insurance regulators everywhere they are licensed and the operations of our insurance subsidiaries and accounts are subject to examination by those regulators at any time. Our insurance subsidiaries prepare statutory financial statements in accordance with accounting practices and procedures prescribed or permitted by these regulators. The NAIC has approved a series of uniform statutory accounting principles (“SAP”) that have been adopted, in some cases with minor modifications, by all state insurance regulators.
As a basis of accounting, SAP was developed to monitor and regulate the solvency of insurance companies. In developing SAP, insurance regulators were primarily concerned with assuring an insurer’s ability to pay all its current and future obligations to policyholders. As a result, statutory accounting focuses on conservatively valuing the assets and liabilities of insurers, generally in accordance with standards specified by the insurer’s domiciliary state. The values for assets, liabilities and equity reflected in financial statements prepared in accordance with U.S. GAAP are usually different from those reflected in financial statements prepared under SAP.
Effective with the annual reporting period ended December 31, 2010, the NAIC adopted revisions to the Annual Financial Reporting Model Regulation, or the Model Audit Rule, related to auditor independence, corporate governance and internal control over financial reporting. The adopted revisions require that we file reports with state insurance regulators regarding our assessment of internal control over financial reporting.
State insurance laws and regulations governing our captive reinsurance subsidiaries require such entities to file financial statements with the Missouri Insurance Department, including statutory financial statements. State
-243-
Table of Contents
insurance laws and regulations governing our Arizona captive require that entity to file financial statements with the ADOI and permit the filing of such financial statements on either a statutory basis or a U.S. GAAP basis. The ADOI has agreed to permit our Arizona captive to prepare its financial statements on a U.S. GAAP basis, modified for certain prescribed practices outlined in the Arizona insurance statutes. In addition, our Arizona captive obtained approval from the ADOI for certain permitted practices, including taking reinsurance credit for certain ceded reserves where the trust assets backing the liabilities are held by one of our wholly-owned insurance companies. Our Arizona captive has recorded a receivable for these assets held in trust by its affiliate.
State insurance regulators conduct periodic financial examinations of the books, records, accounts and business practices of insurers domiciled in their states, generally every three to five years. Financial examinations are generally carried out in cooperation with the insurance regulators of other states under guidelines promulgated by the NAIC. State and federal insurance and securities regulatory authorities and other state law enforcement agencies and attorneys general also from time to time make inquiries and conduct examinations or investigations regarding the compliance by our company, as well as other companies in our industry, with, among other things, insurance laws and securities laws.
Our captive reinsurance subsidiaries and our Arizona captive are subject to periodic financial examinations by their respective domiciliary state insurance regulators.
State insurance regulators, the NAIC and other regulatory agencies are also investigating the use of affiliated captive reinsurers and offshore entities to reinsure insurance risks. In October 2011, the NAIC established a subgroup to study insurers’ use of captives and special purpose vehicles to transfer insurance risk in relation to existing state laws and regulations, and to establish appropriate regulatory requirements to address concerns identified in the study. Additionally, in June 2013, the NYDFS released a report critical of certain captive reinsurance structures and calling, in part, for other state regulators to adopt a moratorium on approving such structures pending further review by state and federal regulators. Also, in December 2013, the FIO issued a report on how to modernize and improve the system of insurance regulation in the United States, recommending, in part, that states develop a uniform and transparent solvency oversight regime for the transfer of risk to reinsurance captives and adopt a uniform capital requirement for reinsurance captives, including a prohibition on transactions that do not constitute legitimate risk transfer. In March 2014, the Missouri Division notified us that it is performing a review of special purpose life reinsurance captive insurance company transactions that have occurred in Missouri’s captive program and, as part of that review, the Missouri Division has requested information from us regarding our captive reinsurance subsidiaries. We cannot predict what actions and regulatory changes will result from the NAIC study, the NYDFS report, the FIO report or the Missouri Division review and what impact such changes will have on our financial condition and results of operation. Like many life insurance companies, we utilize captive reinsurers to satisfy certain reserve requirements related to certain of our policies. If state insurance regulators determine to restrict our use of captive reinsurers, it could require us to increase statutory reserves, incur higher operating and/or tax costs or reduce sales.
Insurance Holding Company Regulation
ING U.S., Inc. and our insurance subsidiaries are subject to the insurance holding companies laws of the states in which such insurance subsidiaries are domiciled. These laws generally require each insurance company directly or indirectly owned by the holding company to register with the insurance regulator in the insurance company’s state of domicile and to furnish annually financial and other information about the operations of companies within the holding company system. Generally, all transactions affecting the insurers in the holding company system must be fair and reasonable and, if material, require prior notice and approval or non-disapproval by the state’s insurance regulator. Our captive reinsurance subsidiaries and our Arizona captive are not subject to insurance holding company laws.
Change of Control. State insurance holding company regulations generally provide that no person, corporation or other entity may acquire control of an insurance company, or a controlling interest in any parent company of an insurance company, without the prior approval of such insurance company’s domiciliary state insurance regulator. Under the laws of each of the domiciliary states of our insurance subsidiaries, any person acquiring, directly or indirectly, 10% or more of the voting securities of an insurance company is presumed to
-244-
Table of Contents
have acquired “control” of the company. This statutory presumption of control may be rebutted by a showing that control does not exist in fact. The state insurance regulators, however, may find that “control” exists in circumstances in which a person owns or controls less than 10% of voting securities.
To obtain approval of any change in control, the proposed acquirer must file with the applicable insurance regulator an application disclosing, among other information, its background, financial condition, the financial condition of its affiliates, the source and amount of funds by which it will effect the acquisition, the criteria used in determining the nature and amount of consideration to be paid for the acquisition, proposed changes in the management and operations of the insurance company and other related matters. In considering an application to acquire control of an insurer, the insurance commissioner generally will consider such factors as the experience, competence and financial strength of the applicant, the integrity of the applicant’s Board of Directors and executive officers, the acquirer’s plans for the management and operation of the insurer and any anti-competitive results that may arise from the acquisition.
In addition, many state insurance laws require prior notification of state insurance regulators of a change in control of a non-domiciliary insurance company doing business in that state. While these pre-notification statutes do not authorize the state insurance regulators to disapprove the change in control, they authorize regulatory action in the affected state if particular conditions exist such as undue market concentration. Any future transactions that would constitute a change in control of our insurance subsidiaries may require prior notification in those states that have adopted pre-acquisition notification laws.
Any purchaser of shares of common stock representing 10% or more of the voting power of our capital stock will be presumed to have acquired control of our insurance subsidiaries unless, following application by that purchaser in each insurance subsidiary’s state of domicile, the relevant insurance commissioner determines otherwise.
The licensing orders governing our captive reinsurance subsidiaries provide that any change of control requires the approval of such company’s domiciliary state insurance regulator. For our Arizona captive, a change of control requires the approval of the ADOI. Although our captive reinsurance subsidiaries and our Arizona captive are not subject to insurance holding company laws, their domiciliary state insurance regulators may use all or a part of the holding company law framework described above in determining whether to approve a proposed change of control.
The laws and regulations regarding change of control transactions may discourage potential acquisition proposals and may delay, deter or prevent a change of control involving us, including through unsolicited transactions that some of our stockholders might consider to be desirable.
Recent Actions by the NAIC. The NAIC recently adopted significant changes to the insurance holding company act and regulations (the “NAIC Amendments”). The NAIC Amendments are designed to respond to perceived gaps in the regulation of insurance holding company systems in the United States. One of the major changes is a requirement that an insurance holding company system’s ultimate controlling person submit annually to its lead state insurance regulator an “enterprise risk report” that identifies activities, circumstances or events involving one or more affiliates of an insurer that, if not remedied properly, are likely to have a material adverse effect upon the financial condition or liquidity of the insurer or its insurance holding company system as a whole. Other changes include requiring a controlling person to submit prior notice to its domiciliary insurance regulator of a divestiture of control, detailed minimum requirements for cost sharing and management agreements between an insurer and its affiliates and expansion of the agreements between an insurer and its affiliates to be filed with its domiciliary insurance regulator. The NAIC Amendments must be adopted by the individual state legislatures and insurance regulators in order to be effective. Each of Indiana, Connecticut and New York adopted its version of the NAIC Amendments. We cannot predict whether the NAIC Amendments will be adopted in whole or in part by other states or the impact, if any, these changes will have on our business, financial condition or results of operations.
-245-
Table of Contents
In addition, the NAIC has proposed a “Solvency Modernization Initiative”. The Solvency Modernization Initiative focuses on the entire U.S. financial regulatory system and all aspects of financial regulation affecting insurance companies. Though broad in scope, the NAIC has stated that the Solvency Modernization Initiative will focus on: (1) capital requirements; (2) corporate governance and risk management; (3) group supervision; (4) statutory accounting and financial reporting; and (5) reinsurance. We cannot predict the effect of these initiatives on us at this time.
Dividend Payment Restrictions. As a holding company with no significant business operations of our own, we will depend on dividends and other distributions from our subsidiaries as the principal source of cash to meet our obligations, including the payment of interest on, and repayment of principal of, our outstanding debt obligations. The states in which our insurance subsidiaries are domiciled impose certain restrictions on such subsidiaries’ ability to pay dividends to us. These restrictions are based in part on the prior year’s statutory income and surplus. In general, dividends up to specified levels are considered ordinary and may be paid without prior approval. Dividends in larger amounts, or extraordinary dividends, are subject to approval by the insurance commissioner of the state of domicile of the insurance subsidiary proposing to pay the dividend.
Under the insurance laws applicable to our insurance subsidiaries domiciled in Colorado, Connecticut, Indiana, Iowa and Minnesota, an extraordinary dividend or distribution is defined as a dividend or distribution that, together with other dividends and distributions made within the preceding twelve months, exceeds the greater of (1) 10% of the insurer’s policyholder surplus as of the preceding December 31 or (2) the insurer’s net gain from operations for the twelve-month period ended the preceding December 31, in each case determined in accordance with statutory accounting principles. New York has similar restrictions, except that New York’s statutory definition of extraordinary dividend or distribution is an aggregate amount in any calendar year that exceeds the lesser of (1) 10% of policyholder’s surplus as of the preceding December 31 or (2) the insurer’s net gain from operations for the twelve-month period ended the preceding December 31, not including realized capital gains. In addition, under the insurance laws of the states of domicile of our Principal Insurance Subsidiaries, no dividend or other distribution exceeding an amount equal to an insurance company’s earned surplus may be paid without the domiciliary insurance regulator’s prior approval.
Indiana law also requires the Indiana Department of Insurance to review, at least one (1) time each year, the ordinary shareholder dividends paid by each domestic insurer to determine whether dividends paid by the insurer meet certain standards, including whether the dividends paid by the insurer are reasonable in relation to the adequacy of the level of policyholder surplus of the insurer remaining after the payment of dividends. The Indiana Department of Insurance is also required to issue an order to a domestic insurer to limit the payment of ordinary shareholder dividends by the insurer if the Department determines that the policyholder surplus of the insurer does not meet certain standards, including that such surplus is not reasonable in relation to the outstanding liabilities of the insurer.
Our captive reinsurance subsidiaries may not declare or pay dividends in any form to us other than in accordance with their respective insurance securitization transaction agreements and their respective governing licensing orders. Likewise, our Arizona captive may not declare or pay dividends in any form to us other than in accordance with its annual capital and dividend plan as approved by the ADOI which includes a minimum capital requirement. In addition, in no event may the dividends decrease the capital of the captive below the minimum capital requirement applicable to it, and, after giving effect to the dividends, the assets of the captive paying the dividend must be sufficient to satisfy its domiciliary insurance regulator that it can meet its obligations. Approval by a captive’s domiciliary insurance regulator of an ongoing plan for the payment of dividends or other distribution is conditioned upon the retention, at the time of each payment, of capital or surplus equal to or in excess of amounts specified by, or determined in accordance with formulas approved for the captive by its domiciliary insurance regulator.
As of December 31, 2011, each of our Principal Insurance Subsidiaries domiciled in Colorado, Iowa and Minnesota had negative earned surplus and did not have capacity to make ordinary dividend payments to ING
-246-
Table of Contents
U.S., Inc. or Lion Holdings without regulatory approval. Our Connecticut-domiciled insurance company, ILIAC, had positive earned surplus as of December 31, 2011 and could have paid a maximum amount of $190.0 million of ordinary dividends to Lion Holdings without regulatory approval in 2012; however, ILIAC’s 2012 distribution request of $340.0 million exceeded its year-end 2011 earned surplus and therefore required domiciliary insurance regulatory approval. In the second quarter of 2012, our Principal Insurance Subsidiaries domiciled in Colorado, Connecticut, Iowa and Minnesota received approvals or notices of non-objection, as the case may be, from their respective domiciliary insurance regulators to make extraordinary distributions to ING U.S., Inc. or Lion Holdings in the aggregate amount of $800.0 million (including the $190.0 million ordinary dividend capacity of ILIAC) in response to requests submitted earlier that year. The approved distributions of $800.0 million were made on June 26, 2012.
In addition to the extraordinary distributions paid by our Principal Insurance Subsidiaries in 2012, in March and April of 2013 our Principal Insurance Subsidiaries received approvals or notices of non-objection, as the case may be, from their respective domiciliary regulators to make extraordinary distributions in the aggregate amount of $1,434.0 million to ING U.S., Inc. or Lion Holdings and paid such approved distributions on May 8, 2013 in connection with our IPO recapitalization activities.
The following table presents the extraordinary distributions paid by our Principal Insurance Subsidiaries in 2013 and 2012:
| ($ in millions) Insurance Subsidiary |
State of Domicile |
Extraordinary Distributions Paid in 2013 |
Extraordinary Distributions Paid in 2012 |
|||||||
| ING USA Annuity and Life Insurance Company |
Iowa | $ | 230.0 | $ | 250.0 | |||||
| Security Life of Denver Insurance Company |
Colorado | $ | 447.0 | $ | 80.0 | |||||
| ReliaStar Life Insurance Company |
Minnesota | $ | 583.0 | $ | 130.0 | |||||
| ING Life Insurance and Annuity Company |
Connecticut | $ | 174.0 | $ | 340.0 | (1) | ||||
| (1) | Included $190 million of ordinary dividend capacity that ILIAC could have paid without regulatory approval in 2012. |
Prior to our IPO, our Principal Insurance Subsidiaries domiciled in Colorado, Iowa and Minnesota each had negative earned surplus accounts, and therefore had no ordinary dividend capacity. In order to obtain dividends or distributions from these insurance companies, we historically obtained approval from the insurance companies’ respective state regulators, which could be granted or withheld at the regulators’ discretion, for extraordinary dividends or distributions. On May 8, 2013, following the completion of our IPO and payment of $1,434.0 million of extraordinary distributions, these insurance companies each reset, on a one-time basis, their respective negative unassigned funds account as of December 31, 2012 (as reported in their respective 2012 statutory annual statements) to zero (with an offsetting reduction in gross paid-in capital and contributed surplus). These resets were made pursuant to permitted practices in accordance with statutory accounting practices granted by their respective domiciliary insurance regulators.
This reset allows our Principal Insurance Subsidiaries domiciled in Colorado, Iowa and Minnesota to more readily build up ordinary dividend capacity to the extent their operating results subsequent to December 31, 2012 generate positive earned surplus. Under applicable domiciliary insurance regulations, our Principal Insurance Subsidiaries must deduct any extraordinary distributions or dividends paid in the preceding twelve months in calculating dividend capacity. We expect that these insurance subsidiaries will have ordinary dividend capacity only after twelve months have passed since the date the extraordinary distributions described above were paid. ILIAC had ordinary dividend capacity before such date and paid an ordinary dividend of $90.0 million in December 2013.
Our Principal Insurance Subsidiaries, however, may not succeed in building up sufficient positive earned surplus within those timeframes or at all. If our Principal Insurance Subsidiaries do not succeed in building up sufficient positive earned surplus to have ordinary dividend capacity, then we may seek extraordinary dividends or distributions (for which prior approval of their respective domiciliary insurance regulators would be required,
-247-
Table of Contents
and can be granted or withheld in the discretion of the regulators). There can be no assurance that our Principal Insurance Subsidiaries will receive approval for extraordinary distribution payments in the future.
See “Management’s Discussion and Analysis of Financial Condition and Results of Operations—Liquidity and Capital Resources—Restrictions on Dividends and Returns of Capital from Subsidiaries” for a discussion of dividends and distributions from our insurance subsidiaries.
Financial Regulation
Policy and Contract Reserve Sufficiency Analysis. Under the laws and regulations of their states of domicile, our insurance subsidiaries are required to conduct annual analyses of the sufficiency of their life and annuity statutory reserves. Other jurisdictions in which these subsidiaries are licensed may have certain reserve requirements that differ from those of their domiciliary jurisdictions. In each case, a qualified actuary must submit an opinion that states that the aggregate statutory reserves, when considered in light of the assets held with respect to such reserves, are sufficient to meet the insurer’s contractual obligations and related expenses. If such an opinion cannot be rendered, the affected insurer must set up additional statutory reserves by moving funds from available statutory surplus. Our insurance subsidiaries submit these opinions annually to applicable insurance regulatory authorities.
Recent actions by the NAIC. The NAIC has begun a process of redefining the reserve methodology for certain of our insurance liabilities under a framework known as Principles-Based Reserving (“PBR”). Under PBR, an insurer’s reserves are still required to be conservative, since a primary focus of SAP is the protection of policyholders, however, greater credence is given to the insurer’s realized past experience and anticipated future experience as well as to current economic conditions. An important part of the PBR framework was the adoption of AG43 as of December 31, 2009 for variable annuity guaranteed benefits. Another significant development was the adoption of the new VM, which defines PBR for life insurance policies. The full NAIC membership adopted the new VM in December 2012. The model law that enables the new VM will become effective on the January 1st after it has been adopted by at least 42 of the 55 jurisdictions that make up the NAIC, with the further proviso that the 42 adopting jurisdictions must also account for 75% of the premium by U.S. life insurance companies (measured as of 2008). The new VM is expected to become effective no earlier than January 1, 2015, and we anticipate that its provisions will require us to make changes to certain of our term and universal life insurance policies, in particular, those policies with guaranteed features and may result in more volatility in our financial results given the greater weight it places on current economic conditions.
The NAIC adopted revisions to AG38, specifically regarding reserving for certain universal life secondary guarantee products. Reserves on in-force business as of December 31, 2012 are now subject to a floor calculation based on assumptions consistent with a new PBR framework developed by the NAIC. Reserves on business written after December 31, 2012 will be calculated using a modified formulaic approach. After completing our analysis of these revisions on our statutory reserves, we increased reserves as of December 31, 2012 by less than $10 million. Since we are not currently selling universal life policies with secondary guarantees, we do not anticipate that this impact will be substantially higher in the future.
Surplus and Capital Requirements. Insurance regulators have the discretionary authority, in connection with the ongoing licensing of our insurance subsidiaries, to limit or prohibit the ability of an insurer to issue new policies if, in the regulators’ judgment, the insurer is not maintaining a minimum amount of surplus or is in hazardous financial condition. Insurance regulators may also limit the ability of an insurer to issue new life insurance policies and annuity contracts above an amount based upon the face amount and premiums of policies of a similar type issued in the prior year. We do not currently believe that the current or anticipated levels of statutory surplus of our insurance subsidiaries present a material risk that any such regulator would limit the amount of new policies that our Principal Insurance Subsidiaries may issue.
-248-
Table of Contents
Risk-Based Capital. The NAIC has adopted RBC requirements for life, health and property and casualty insurance companies. The requirements provide a method for analyzing the minimum amount of adjusted capital (statutory capital and surplus plus other adjustments) appropriate for an insurance company to support its overall business operations, taking into account the risk characteristics of the company’s assets, liabilities and certain off-balance sheet items. State insurance regulators use the RBC requirements as an early warning tool to identify possibly inadequately capitalized insurers. An insurance company found to have insufficient statutory capital based on its RBC ratio may be subject to varying levels of additional regulatory oversight depending on the level of capital inadequacy. As of December 31, 2013, the RBC of each of our insurance subsidiaries exceeded statutory minimum RBC levels that would require any regulatory or corrective action.
IRIS Tests. The NAIC has developed a set of financial relationships or tests known as the Insurance Regulatory Information System (“IRIS”) to assist state regulators in monitoring the financial condition of U.S. insurance companies and identifying companies requiring special attention or action. For IRIS ratio purposes, our Principal Insurance Subsidiaries submit data to the NAIC on an annual basis. The NAIC analyzes this data using prescribed financial data ratios. A ratio falling outside the prescribed “usual range” is not considered a failing result. Rather, unusual values are viewed as part of the regulatory early monitoring system. In many cases, it is not unusual for financially sound companies to have one or more ratios that fall outside the usual range.
Regulators typically investigate or monitor an insurance company if its IRIS ratios fall outside the prescribed usual range for four or more of the ratios, but each state has the right to inquire about any ratios falling outside the usual range. The inquiries made by state insurance regulators into an insurance company’s IRIS ratios can take various forms.
Management does not anticipate regulatory action as a result of the 2013 IRIS ratio results. In all instances in prior years, regulators have been satisfied upon follow-up that no regulatory action was required. It is possible that similar results may not occur in the future.
Insurance Guaranty Associations. Each state has insurance guaranty association laws that require insurance companies doing business in the state to participate in various types of guaranty associations or other similar arrangements. The laws are designed to protect policyholders from losses under insurance policies issued by insurance companies that become impaired or insolvent. Typically, these associations levy assessments, up to prescribed limits, on member insurers on the basis of the member insurer’s proportionate share of the business in the relevant jurisdiction in the lines of business in which the impaired or insolvent insurer is engaged. Some jurisdictions permit member insurers to recover assessments that they paid through full or partial premium tax offsets, usually over a period of years.
Marketing and Sales
State insurance regulators are becoming more active in adopting and enforcing suitability standards with respect to sales of fixed, indexed and variable annuities. In particular, the NAIC has adopted a revised SAT, which will, if enacted by the states, place new responsibilities upon issuing insurance companies with respect to the suitability of annuity sales, including responsibilities for training agents. Several states have already enacted laws based on the SAT.
Securities Regulation Affecting Insurance Operations
Certain of our insurance subsidiaries sell variable life insurance and variable annuities that are registered with and regulated by the SEC as securities under the Securities Act. These products are issued through separate accounts that are registered as investment companies under the Investment Company Act, and are regulated by state law. Each separate account is generally divided into sub-accounts, each of which invests in an underlying mutual fund which is itself a registered investment company under the Investment Company Act. Our mutual funds, and in certain states, our variable life insurance and variable annuity products, are subject to filing and other requirements
-249-
Table of Contents
under state securities laws. Federal and state securities laws and regulations are primarily intended to protect investors and generally grant broad rulemaking and enforcement powers to regulatory agencies.
Federal Initiatives Affecting Insurance Operations
The U.S. federal government generally does not directly regulate the insurance business. However, the Dodd-Frank Act established the FSOC, which is authorized to subject non-bank financial companies deemed systemically significant to stricter prudential standards and other requirements and to subject such companies to a special orderly liquidation process outside the federal Bankruptcy Code, administered by the Federal Deposit Insurance Corporation. In April 2012, FSOC adopted final rules for evaluating whether a non-bank financial company should be designated as systemically significant. As of December 31, 2013, FSOC has designated three non-bank financial companies as systemically significant. Insurance company subsidiaries of systemically significant companies would remain subject to liquidation and rehabilitation proceedings under state law, although the FSOC is authorized to direct that such a proceeding be commenced against the insurer under state law. Systemically significant companies are also required to prepare resolution plans, so-called “living wills,” that set out how they could most efficiently be liquidated if they endangered the U.S. financial system or the broader economy. Insurance companies that are found to be systemically significant are permitted, in some circumstances, to submit abbreviated versions of such plans. Proposed rules regarding heightened prudential standards for systemically significant companies would impose new capital, liquidity, counterparty credit exposure and governance standards, and they would also subject such companies to restrictions on their activities and management if they appear to be at risk of liquidation. There are not exceptions for insurance companies in these proposed regulations. FSOC’s potential recommendation of measures to address systemic financial risk could affect our insurance operations as could a determination that we or our counterparties are systemically significant.
The Dodd-Frank Act also established FIO within the Treasury Department. While not having a general supervisory or regulatory authority over the business of insurance, the director of this office performs various functions with respect to insurance, including serving as a non-voting member of the FSOC, making recommendations to the FSOC regarding insurers to be designated for more stringent regulation and representing the U.S. in the negotiation of international insurance agreements with foreign insurance regulators. The Dodd-Frank Act also required the director of FIO to conduct a study on how to modernize and improve the system of insurance regulation in the United States, including by increasing national uniformity through either federal involvement or effective action by the states. The director issued that report in December 2013, recommending, in part, increased federal involvement in certain areas of insurance regulation to improve uniformity, and setting out recommendations in areas of near-term reform for the states, including prudential and marketplace oversight. The report also recommended, in part, that states develop a uniform and transparent solvency oversight regime for the transfer of risk to reinsurance captives, and adopt a uniform capital requirement for reinsurance captives, including a prohibition on transactions that do not constitute legitimate risk transfer. FIO has an ongoing charge to monitor all aspects of the insurance industry and will monitor state regulatory developments, including those called for in its report and present options for federal involvement if deemed necessary.
Federal legislation and administrative policies in several areas can significantly and adversely affect insurance companies. These areas include federal health care regulation, pension regulation, financial services regulation, federal tax laws relating to life insurance companies and their products and the USA PATRIOT Act of 2001 (the “Patriot Act”) requiring, among other things, the establishment of anti-money laundering monitoring programs.
In this regard, from time to time, federal measures are proposed which may significantly affect the insurance business, including measures that would limit antitrust immunity, change the tax treatment of insurance products relative to other financial products, simplify tax-advantaged or tax-exempt savings and retirement vehicles, restructure the corporate income tax provisions, or modify or eliminate the estate tax as well as proposals related to an optional federal charter for insurance companies. In addition, various forms of direct federal regulation of insurance have been proposed in recent years.
-250-
Table of Contents
Regulation of Investment and Retirement Products and Services
Our investment, asset management and retirement products and services are subject to federal and state tax, securities, fiduciary (including ERISA), insurance and other laws and regulations. The SEC, FINRA, the CFTC, state securities commissions, state banking and insurance departments and the DOL and the Treasury Department are the principal regulators that regulate these products and services. The Dodd-Frank Act may also impact our investment, asset management, retirement and securities operations. See “—Financial Reform Legislation and Initiatives—Dodd-Frank Wall Street Reform and Consumer Protection Act” below.
Federal and state securities laws and regulations are primarily intended to protect investors in the securities markets and generally grant regulatory agencies broad enforcement and rulemaking powers, including the power to limit or restrict the conduct of business in the event of non-compliance with such laws and regulations. Federal and state securities regulatory authorities and FINRA from time to time make inquiries and conduct examinations regarding compliance by us and our subsidiaries with securities and other laws and regulations.
Securities Regulation with Respect to Certain Insurance and Investment Products and Services
Our variable life insurance, variable annuity and mutual fund products are generally “securities” within the meaning of, and registered under, the federal securities laws, and are subject to regulation by the SEC and FINRA. Our mutual funds, and in certain states our variable life insurance and variable annuity products, are also “securities” within the meaning of state securities laws. As securities, these products are subject to filing and certain other requirements. Sales activities with respect to these products are generally subject to state securities regulation, which may affect investment advice, sales and related activities for these products.
Some of our subsidiaries issue certain fixed and indexed annuities supported by the company’s general account and/or variable annuity contracts and variable life insurance policies through the company’s separate accounts. These subsidiaries and their activities in offering and selling variable insurance and annuity products are subject to extensive regulation under the federal securities laws administered by the SEC. Some of our separate accounts, as well as mutual funds that we sponsor, are registered as investment companies under the Investment Company Act, and the units or shares, as applicable, of certain of these investment companies are qualified for sale in some or all states, the District of Columbia and Puerto Rico. Each registered separate account is generally divided into sub-accounts, each of which invests in an underlying mutual fund, which is itself a registered investment company under the Investment Company Act. In addition, the variable annuity contracts and variable life insurance policies issued by the separate accounts and certain fixed and indexed annuities supported by some of our subsidiaries’ general accounts, as well as mutual funds we sponsor, are registered with the SEC under the Securities Act. Certain variable contract separate accounts sponsored by our subsidiaries are exempt from registration, but may be subject to other provisions of the federal securities laws.
Broker-Dealers and Investment Advisers
Our securities operations, principally conducted by a number of SEC-registered broker-dealers, are subject to federal and state securities, commodities and related laws, and are regulated principally by the SEC, the CFTC, state securities authorities, FINRA, the Municipal Securities Rulemaking Board and similar authorities. Agents and employees registered or associated with any of our broker-dealer subsidiaries are subject to the Exchange Act and to regulation and examination by the SEC, FINRA and state securities commissioners. The SEC and other governmental agencies and self-regulatory organizations, as well as state securities commissions in the United States, have the power to conduct administrative proceedings that can result in censure, fines, cease-and-desist orders or suspension, termination or limitation of the activities of the regulated entity or its employees.
Broker-dealers are subject to regulations that cover many aspects of the securities business, including, among other things, sales methods and trading practices, the suitability of investments for individual customers, the use and safekeeping of customers’ funds and securities, capital adequacy, recordkeeping, financial reporting
-251-
Table of Contents
and the conduct of directors, officers and employees. The federal securities laws may also require, upon a change in control, re-approval by shareholders in registered investment companies of the investment advisory contracts governing management of those investment companies, including mutual funds included in annuity products. Investment advisory clients may also need to approve, or consent to, investment advisory agreements upon a change in control. In addition, broker-dealers are required to make certain monthly and annual filings with FINRA, including monthly FOCUS reports (which include, among other things, financial results and net capital calculations) and annual audited financial statements prepared in accordance with U.S. GAAP.
Pursuant to the Dodd-Frank Act, the SEC is authorized to establish a standard of conduct applicable to brokers and dealers whereby they would be required to act in the best interest of the customer without regard to the financial or other interest of the broker or dealer when providing personalized investment advice to retail and other customers. A January 2011 SEC study acknowledges that the offering of proprietary products would not be a per se violation of any such standard of care and that broker-dealers selling proprietary or a limited range of products could be permitted to make certain disclosures about their limited product offerings and obtain customer consents or acknowledgements. The SEC has indicated it may propose rules creating a uniform fiduciary standard of conduct applicable to broker-dealers and investment advisers which, if adopted, may affect the distribution of our products. See “—Financial Reform Legislation and Initiatives—Dodd-Frank Wall Street Reform and Consumer Protection Act” below for more information on the Dodd-Frank Act. The SEC and FINRA have also recently announced that they will be making the marketing and recommendation of IRA rollovers an examination priority in 2014; accordingly, sales of ING U.S. rollover IRA products, particularly by our affiliated broker-dealer firms, could be affected by this heightened regulatory scrutiny.
As registered broker-dealers and members of various self-regulatory organizations, our registered broker-dealer subsidiaries are subject to the SEC’s Uniform Net Capital Rule, which specifies the minimum level of net capital a broker-dealer is required to maintain and requires a minimum part of its assets to be kept in relatively liquid form. These net capital requirements are designed to measure the financial soundness and liquidity of broker-dealers. The uniform net capital rule imposes certain requirements that may have the effect of preventing a broker-dealer from distributing or withdrawing capital and may require that prior notice to the regulators be provided prior to making capital withdrawals. Certain of our broker-dealers are also subject to the net capital requirements of the CFTC and the various securities and commodities exchanges of which they are members. Compliance with net capital requirements could limit operations that require the intensive use of capital, such as trading activities and underwriting, and may limit the ability of our broker-dealer subsidiaries to pay dividends to us.
Some of our subsidiaries are registered as investment advisers under the Investment Advisers Act and provide advice to registered investment companies, including mutual funds used in our annuity products, as well as an array of other institutional and retail clients. The Investment Advisers Act and Investment Company Act may require that fund shareholders be asked to approve new investment advisory contracts with respect to those registered investment companies upon a change in control of a fund’s adviser. Likewise, the Investment Advisers Act may require that other clients consent to the continuance of the advisory contract upon a change in control of the adviser. Further, proposals have been made that the SEC establish a self-regulatory organization with respect to registered investment advisers, which could increase the level of regulatory oversight over such investment advisers.
The commodity futures and commodity options industry in the United States is subject to regulation under the Commodity Exchange Act of 1936, as amended (the “Commodity Exchange Act”). The CFTC is charged with the administration of the Commodity Exchange Act and the regulations adopted under that Act. Some of our subsidiaries are registered with the CFTC as commodity pool operators and commodity trading advisors. Our futures business is also regulated by the National Futures Association.
Employee Retirement Income Security Act Considerations
ERISA is a comprehensive federal statute that applies to U.S. employee benefit plans sponsored by private employers and labor unions. Plans subject to ERISA include pension and profit sharing plans and welfare plans,
-252-
Table of Contents
including health, life and disability plans. Among other things, ERISA imposes reporting and disclosure obligations, prescribes standards of conduct that apply to plan fiduciaries and prohibits transactions known as “prohibited transactions,” such as conflict-of-interest transactions, self-dealing and certain transactions between a benefit plan and a party in interest. ERISA also provides for a scheme of civil and criminal penalties and enforcement. Our insurance, investment management and retirement businesses provide services to employee benefit plans subject to ERISA, including limited services under specific contract where we may act as an ERISA fiduciary. We are also subject to ERISA’s prohibited transaction rules for transactions with ERISA plans, which may affect our ability to, or the terms upon which we may, enter into transactions with those plans, even in businesses unrelated to those giving rise to party in interest status. The applicable provisions of ERISA and the Internal Revenue Code are subject to enforcement by the DOL, the IRS and the PBGC.
In the fourth quarter of 2011, the DOL withdrew proposed regulations that would more broadly define the circumstances under which a person is considered to be a fiduciary by reason of giving investment advice to an employee benefit plan or a plan’s participants. In early July 2013, the DOL announced that it would re-propose these regulations, under the revised general topic of conflicts of interest under ERISA pertaining to investment advice. The new proposed regulation is estimated for release in August 2014. We cannot predict with any certainty what will be contained in the re-proposed regulations, but they could alter the way our products and services are marketed and sold to ERISA plans and their plan participants and to purchasers of individual retirement accounts and individual retirement annuities. The SEC also has indicated that it may propose rules creating a uniform standard of conduct applicable to broker-dealers and investment advisers, which, if adopted may affect the distribution of our products. Should the SEC rules, if adopted, not align with any reissued and finalized DOL regulations related to conflicts of interest in the provision of investment advice, the distribution of our products could be further complicated.
The DOL has also issued a number of regulations recently, and may issue similar additional regulations, that increase the level of disclosure that must be provided to plan sponsors and participants. These ERISA disclosure requirements will likely increase the regulatory and compliance burden on us, resulting in increased costs.
Trust Activities Regulation
ING National Trust (“INT”), our wholly owned subsidiary, is a national banking association chartered exclusively with trust powers by the OCC. INT is not permitted to, and does not, accept deposits (other than incidental to its trust activities). INT is subject to regulation, supervision and examination by the OCC and its exercise of fiduciary powers must comply with Part 9 of the OCC’s regulations, which governs the fiduciary activities of federally-chartered banks and trust companies and, among other things, imposes certain review and recordkeeping obligations and certain restrictions on self-dealing and conflict of interest transactions. On September 16, 2013, Lion Holdings and INT entered into an agreement with an unaffiliated third party related to a block of personal trust accounts for which INT is currently the trustee. Pursuant to the Agreement, the counterparty (i) has been engaged to provide services for managing these accounts on behalf of INT as trustee; (ii) is actively seeking consent of interested parties to replace INT as the trustee on these accounts and (iii) upon the satisfaction of certain business and regulatory conditions, will purchase the INT entity itself. The transactions contemplated by the Purchase and Assumption Agreement are expected to be consummated prior to or during 2015.
ING Investment Trust Co., our wholly owned subsidiary, is a limited purpose trust company chartered with the Connecticut Department of Banking. ING Investment Trust Co. is not permitted to, and does not, accept deposits (other than incidental to its trust activities). ING Investment Trust Co.’s activities are primarily to serve as trustee for and manage various collective and common trust funds. ING Investment Trust Co. is subject to regulation, supervision and examination by the Connecticut Banking Commissioner and is subject to state fiduciary duty laws. In addition, the collective trust funds managed by ING Investment Trust Co. are generally subject to ERISA.
-253-
Table of Contents
Financial Reform Legislation and Initiatives
Dodd-Frank Wall Street Reform and Consumer Protection Act
On July 21, 2010, President Obama signed into law the Dodd-Frank Act, which effects comprehensive changes to the regulation of financial services in the United States. The Dodd-Frank Act directs existing and newly-created government agencies and bodies to conduct certain studies and promulgate a multitude of regulations implementing the law, a process that is underway and is expected to continue over the next few years. While some studies have already been completed and the rule-making process is well underway, there continues to be significant uncertainty regarding the results of ongoing studies and the ultimate requirements of those regulations that have not yet been adopted. We cannot predict with certainty how the Dodd-Frank Act and such regulations will affect the financial markets generally, or impact our business, ratings, results of operations, cash flows or financial condition.
The Dodd-Frank Act created a new agency, the FSOC, which is authorized to subject nonbank financial companies to the supervision of the Federal Reserve if the FSOC determines that material financial distress at the company or the scope of the company’s activities could pose risks to the financial stability of the United States. If we were designated by the FSOC as a systemically significant nonbank financial company subject to supervision by the Federal Reserve, we would become subject to a comprehensive system of prudential regulation, including, among other matters, minimum capital requirements, liquidity standards, credit exposure requirements, maintenance of resolution plans, stress testing, management interlock prohibitions, additional fees and assessments and restrictions on proprietary trading and other investments (including restrictions similar to the so-called “Volcker Rule” on our proprietary trading activity or our ability to sponsor or invest in certain types of investment funds). The exact scope and consequences of these standards and requirements are subject to ongoing rulemaking activity by various federal banking regulators and therefore are currently unclear. However, this comprehensive system of prudential regulation, if applied to the Company, would significantly impact the manner in which we operate and could materially and adversely impact the profitability of one or more of our business lines or the level of capital required to support our activities.
In addition, the Dodd-Frank Act contains numerous other provisions, some of which may have an impact on us. These include:
| • | The FSOC may recommend that state insurance regulators or other regulators apply new or heightened standards and safeguards for activities or practices we and other insurers or other financial services companies engage in if the FSOC determines that those activities or practices could create or increase the risk that significant liquidity, credit or other problems spread among financial companies. We cannot predict whether any such recommendations will be made or their effect on our business, results of operations, cash flows or financial condition. |
| • | The Dodd-Frank Act creates a new framework for regulating OTC derivatives, which may increase the costs of hedging and other permitted derivatives trading activity undertaken by us. Under the new regulatory regime and subject to certain exceptions, certain standardized OTC derivatives must be cleared through a centralized clearinghouse and executed on a centralized exchange commencing in 2013. It establishes new regulatory authority for the SEC and the CFTC over derivatives and parties to derivative transactions including “swap dealers,” “security-based swap dealers,” “major swap participants,” “major security-based swap participants” as well as end users of derivatives. In addition to mandatory central clearing of certain derivatives, such market participants may be subject to significant regulatory requirements including registration, reporting and recordkeeping, capital and margin and trade execution requirements. However, the transition to central clearing and the new regulatory regime governing derivatives presents potentially significant business and operational risk for us which could materially and adversely impact both the cost and our ability to effectively hedge various risks, including equity and interest rate market risk features within many of our insurance and annuity products. |
-254-
Table of Contents
| • | The CFTC and SEC jointly adopted final rules, which (subject to certain exceptions) became effective on October 12, 2012, to further define the terms “swap” and “security-based swap,” which clarify that certain products (i) issued by entities subject to supervision by the insurance commissioner (or similar official or agency) of any state or by the United States or an agency or instrumentality thereof (the “Provider Test”) and (ii) regulated as insurance or otherwise enumerated by rule are excluded from the definition of a “swap” and “security-based swap.” In addition, any insurance contracts which might otherwise be included within the definition of “swap” or “security-based swap” which were issued on or before the effective date of the rules will be grandfathered and thereby excluded from the definitions, as long as the issuer satisfies the Provider Test. However, the rulemaking does not extend the exemption to certain products issued by insurance companies including GICs, synthetic GICs, funding agreements, structured settlements and deposit administration contracts which the CFTC and SEC determined should be considered in a facts and circumstances analysis. As a result, there remains some uncertainty regarding the applicability of the definitions of “swap” and “security-based swap” to some products offered by us. We do not believe our products come within the definition of “swap” or “security-based swap.” However, if any products issued by us meet the criteria for either definition they would be subject to regulation under the Dodd-Frank Act, including clearing of certain standardized transactions through a centralized clearinghouse, execution of certain standardized trades on a centralized exchange and related reporting requirements. The legislation also requires the SEC and CFTC to conduct a study to determine whether stable value contracts fall within the definition of swap contracts, and if so, to determine whether an exemption to their regulation is appropriate. The SEC and CFTC are considering the study in light of the adoption of the rules described above. Stable value contracts are exempt from the legislation’s swap provisions, pending the effective date of any such regulatory action. |
| • | The Dodd-Frank Act established FIO within the Treasury Department to be headed by a director appointed by the Secretary of the Treasury. See “—Insurance Regulation—Federal Initiatives Affecting Insurance Operations” above. |
| • | The Dodd-Frank Act established the Consumer Financial Protection Bureau (the “CFPB”) as an independent agency within the Federal Reserve to regulate consumer financial products and services offered primarily for personal, family or household purposes, with rule-making and enforcement authority over unfair, deceptive or abusive acts and practices. However, the legislation does not give the CFPB jurisdiction over insurance products or services, or over persons regulated by a state insurance regulator, subject to exceptions for certain non-insurance consumer financial products or services. In addition, broker-dealers and investment advisers are not subject to the CFPB’s jurisdiction when acting in their registered capacity. Employee benefit plans and other retirement products are generally excluded from the CFPB’s jurisdiction; however, certain types of employee benefit plans and retirement products may become subject to the CFPB’s jurisdiction upon a joint written request by the DOL and the Treasury Department. We believe we offer a very limited number of products subject to regulation by the CFPB, although it is possible that the CFPB will assert jurisdiction more expansively than anticipated. |
| • | The Dodd-Frank Act includes various securities law reforms that may affect our business practices and the liabilities and/or exposures associated therewith. See “—Broker-Dealers and Investment Advisers” above. |
Until final regulations are promulgated pursuant to the Dodd-Frank Act, the full impact of the Dodd-Frank Act on our businesses, products, results of operation and financial condition will remain unclear.
International and National Regulatory Initiatives that May Affect Us as a Consequence of our Affiliation with ING Group
The causes of the recent financial crisis are being actively reviewed by lawmakers around the world, who are exploring steps to avoid similar problems in the future. In many respects, this work is being led by the Financial Stability Board (“FSB”), which consists of representatives of national financial authorities of the Group
-255-
Table of Contents
of Twenty (“G20”) nations. The FSB, along with the G20, have issued a series of papers and recommendations intended to produce significant changes in how financial companies, particularly companies that are members of large and complex financial groups, should be regulated. These proposals address such issues as financial group supervision, capital and solvency standards, systemic risk, corporate governance including executive compensation, and a host of related issues associated with responses to the financial crisis. The FSB, for example, has proposed to designate certain companies as systemically significant, similar to the approach the FSOC may take in connection with systemically significant banks and non-bank financial companies under the Dodd-Frank Act. Legislators and regulatory authorities in a number of jurisdictions in which ING Group operates have already begun introducing legislative and regulatory changes consistent with G20 and FSB recommendations as well as their own initiatives in a number of policy areas. On January 19, 2011, the EC presented a draft directive to amend the Solvency II Directive, referred to as the “Omnibus II Directive”. The Solvency II Directive and the Omnibus II Directive will effect a full revision of the European insurance industry’s solvency framework and prudential regime (in particular, minimum capital and solvency requirements, governance requirements, risk management and public reporting standards) and will impose, among other things, group-level supervision mechanisms. It is not certain when the Solvency II Directive rules will be finalized, nor what those final rules will contain. In addition, despite the announcement that the Solvency II Directive will become effective on January 1, 2016, there remains uncertainty as to when the rules will become effective given previous changes to the proposed effectiveness date. Accordingly, the future effect of the Solvency II Directive on our business, solvency margins and capital requirements is uncertain.
Regulation by Dutch Authorities
The DNB is the supervisor of ING Group which, from the time of our IPO until the time of this offering, has been the majority shareholder of the Company. DNB supervises and assesses the financial situation of ING Group as a whole and thus includes the operations of the Company and its subsidiaries. The ongoing divestment of the Company by ING Group, including this offering, continues to be subject to the oversight of the DNB. This supervision of compliance with regulatory requirements includes the topics of capital adequacy, risk concentration and intra group contracts and positions as well as rules regarding the operations of ING Group. Furthermore DNB also plans and coordinates supervisory activities with the relevant supervisory authorities of ING Group subsidiaries. On November 4, 2013, a regulation concerning the establishment of a Single Supervisory Mechanism (“SSM”) became effective. As a result of the effectiveness of the SSM, the European Central Bank (“ECB”) will assume responsibility for part of the prudential supervision of ING Bank and ING Group as of November 4, 2014. Under the SSM regulations, the ECB has a mandate to participate in supplementary supervision of a financial conglomerate in relation to the banks included in a conglomerate such as ING Group, and to assume the tasks of a coordinator where the ECB is appointed as the coordinator for a financial conglomerate. At this point in time, it is uncertain if and how the new supervisory structure or ECB mandate may impact ING Group or the Company.
In addition to the various US and international regulatory initiatives, the Dutch authorities have launched a number of Dutch regulatory initiatives, including but not limited to the Dutch Intervention Act and legislation with regard to variable remuneration at financial institutions that have received state support.
The Intervention Act grants new powers to the DNB and the Minister of Finance to intervene in situations where an institution, including a financial group such as ING Group, faces financial difficulties or where there is a serious and immediate risk to the stability of the financial system caused by an institution in difficulty. The Act has entered into force with retroactive effect on January 20, 2012.
For information on certain requirements established by the European Union with respect to compensation disclosures and practices in financial services companies that may affect the Company, please see “Compensation of Executive Officers and Directors—Critical Compensation and Other Policies—Capital Requirements Directive III”.
-256-
Table of Contents
We are unable to predict how any regulations resulting from such initiatives and proposals could affect the way ING Group conducts its business and manages capital, or to what extent any changes in the way ING Group conducts its business as a result thereof could affect us, as an affiliate of ING Group, our relationship with ING Group or our results of operations, financial condition and liquidity. The possibility of inconsistent and conflicting regulation of ING Group and the Company also exists as lawmakers and regulators in multiple jurisdictions simultaneously pursue these initiatives.
Other Laws and Regulations
USA Patriot Act
The Patriot Act contains anti-money laundering and financial transparency laws applicable to broker-dealers and other financial services companies, including insurance companies. The Patriot Act seeks to promote cooperation among financial institutions, regulators and law enforcement entities in identifying parties that may be involved in terrorism or money laundering. Anti-money laundering laws outside of the United States contain provisions that may be different, conflicting or more rigorous. Internal practices, procedures and controls are required to meet the increased obligations of financial institutions to identify their customers, watch for and report suspicious transactions, respond to requests for information by regulatory authorities and law enforcement agencies and share information with other financial institutions.
We are also required to follow certain economic and trade sanctions programs administered by the Office of Foreign Asset Control that prohibit or restrict transactions with suspected countries, their governments and, in certain circumstances, their nationals. We are also subject to regulations governing bribery and other anti-corruption measures.
Privacy Laws and Regulation
U.S. federal and state laws and regulations require financial institutions, including insurance companies, to protect the security and confidentiality of personal information and to notify consumers about their policies and practices relating to their collection and disclosure of consumer information and the protection of the security and confidentiality of that information. The disclosure and security of protected health information is also governed by federal and state laws. In particular, regulations promulgated by the U.S. Department of Health and Human Services regulate the disclosure and use of protected health information by health insurers and others (including life insurers), the physical and procedural safeguards employed to protect the security of that information and the electronic transmission of such information. Federal and state laws require notice to affected individuals, law enforcement, regulators and others if there is a breach of the security of certain personal information, including social security numbers, and require holders of certain personal information to protect the security of the data. Federal regulations require financial institutions to implement effective programs to detect, prevent and mitigate identity theft. Federal and state laws and regulations regulate the ability of financial institutions to make telemarketing calls and to send unsolicited e-mail or fax messages to consumers and customers. Federal laws and regulations also regulate the permissible uses of certain types of personal information, including consumer report information. Federal and state governments and regulatory bodies may consider additional or more detailed regulation regarding these subjects.
Environmental Considerations
Our ownership and operation of real property and properties within our commercial mortgage loan portfolio is subject to federal, state and local environmental laws and regulations. Risks of hidden environmental liabilities and the costs of any required clean-up are inherent in owning and operating real property. Under the laws of certain states, contamination of a property may give rise to a lien on the property to secure recovery of the costs of clean-up, which could adversely affect the valuation of, and increase the liabilities associated with, the commercial mortgage loans we hold. In several states, this lien has priority over the lien of an existing mortgage against such property. In addition, we may be liable, in certain circumstances, as an “owner” or “operator,” for
-257-
Table of Contents
costs of cleaning-up releases or threatened releases of hazardous substances at a property mortgaged to us under the federal Comprehensive Environmental Response, Compensation and Liability Act of 1980 and the laws of certain states. Application of various other federal and state environmental laws could also result in the imposition of liability on us for costs associated with environmental hazards.
We routinely conduct environmental assessments prior to closing any new commercial mortgage loans or to taking title to real estate. Although unexpected environmental liabilities can always arise, we seek to minimize this risk by undertaking these environmental assessments and complying with our internal environmental policies and procedures.
Health Care Reform Legislation
The Health Care Act may lead to fundamental changes in the way that employers, including us, provide health care benefits, other benefits and other forms of compensation to their employees and former employees. Among other changes, and subject to various effective dates, the Health Care Act generally restricts certain limits on benefits, mandates coverage for certain kinds of care, extends the required coverage of dependent children through age 26, eliminates pre-existing condition exclusions or limitations, requires cost reporting and, in some cases, requires premium rebates to participants under certain circumstances, limits coverage waiting periods, establishes penalties on employers who fail to offer sufficient coverage to their full-time employees and requires employers under certain circumstances to provide employees with vouchers to purchase their own health care coverage. We cannot predict the impact of the Health Care Act, and any regulations or guidance related to the Health Care Act, on us as an employer and on the benefit plans we sponsor for employees or retirees and their dependents, or whether those benefits will remain competitive or effective in meeting their business objectives. Our costs to provide such benefits and our tax liabilities in connection with benefits or compensation cannot be predicted.
The Health Care Act also significantly impacts how employers provide health care to employees and how individuals obtain health care insurance. There is significant uncertainty surrounding the impact of the Health Care Act on insurers which may create risks to products we offer, including Stop Loss Insurance sold to employers offering self-insured health plans. In addition, should the Treasury Department issue guidance concluding that insurers offering Stop Loss Insurance are considered health care providers, we may face adverse tax or other financial consequences.
U.S. Supreme Court Decision regarding Defense of Marriage Act
Before June 26, 2013, pursuant to Section 3 of the Defense of Marriage Act (“DOMA”), same-sex marriages were not recognized for purposes of federal law. On that date, the United States Supreme Court held in United States v. Windsor that Section 3 of DOMA is unconstitutional. The Windsor decision affects over 1,000 federal laws and regulations, many of which touch upon our services and procedures. While the IRS and DOL have issued guidance indicating that they will regard individuals to be married if they have entered into a same-sex marriage that is valid under the laws of the state where such marriage is celebrated, the appropriate legal and regulatory authorities need to provide further guidance regarding the open questions created by the Windsor decision. Although we recognize that certain changes will be required, we cannot predict with certainty how new regulations will impact our business, results of operations, cash flows or financial condition. The Windsor decision also creates potential inconsistencies in the application of federal and state tax laws, including how tax withholding is computed. Future guidance from the Internal Revenue Service and state tax authorities may resolve these inconsistencies, and it is possible that significant changes will be required to our tax reporting and withholding systems as a result.
-258-
Table of Contents
Management of the Company is led by the Office of the CEO (the “OCEO”) and the Executive Committee. The OCEO, our highest management body, is composed of the Chief Executive Officer, the Chief Operating Officer and the Chief Financial Officer and is responsible for setting the leadership tone and providing overall strategic and financial guidelines for the Company. The Executive Committee, composed of the members of the OCEO as well as the remainder of our executive officers, set forth below, is tasked with setting corporate strategy, managing overall operating performance, building a cohesive culture and establishing our organizational structure.
Our Executive Officers
The following table presents information regarding our executive officers.
| Name |
Age | Position | ||||
| Rodney O. Martin, Jr* |
61 | Chief Executive Officer | ||||
| Alain M. Karaoglan* |
51 | Executive Vice President and Chief Operating Officer | ||||
| Ewout L. Steenbergen* |
44 | Executive Vice President and Chief Financial Officer | ||||
| Mary E. (“Maliz”) Beams |
57 | Chief Executive Officer, Retirement Solutions | ||||
| Jeffrey T. Becker |
48 | Chief Executive Officer, Investment Management | ||||
| Bridget M. Healy |
59 | Executive Vice President and Chief Legal Officer | ||||
| Chetlur S. Ragavan |
59 | Executive Vice President and Chief Risk Officer | ||||
| Kevin D. Silva |
60 | Executive Vice President and Chief Human Resources Officer | ||||
| Michael S. Smith |
50 | Chief Executive Officer, Insurance Solutions and Closed Block Variable Annuities | ||||
| * | Designates a member of the OCEO. |
Set forth below is biographical information about each of the executive officers named in the table above.
Rodney O. Martin, Jr. has served as chief executive officer and a member of the Board of Directors of ING U.S., Inc. since April 2011. Mr. Martin also assumed the role of chairman of the Board of Directors upon completion of our initial public offering in May 2013, and also serves as chairman of the Board’s Executive Committee (see “—Executive Committee”). Mr. Martin is responsible for the overall strategy and performance of ING U.S., Inc. Mr. Martin began his insurance career as an agent with Connecticut Mutual Life Insurance Company, where, from February 1975 to August 1995, he served in various marketing and management positions. Mr. Martin ultimately advanced to become president of Connecticut Mutual Insurance Services. In 1995, Mr. Martin joined the American General Life Companies as president and chief executive officer where he ran the U.S. life insurance businesses until they were acquired by American International Group, Inc. (“AIG”), in 2001. At AIG, Mr. Martin held positions of increasing responsibility, from chief operating officer of AIG Worldwide Life Insurance, chairman and chief executive officer of American Life Insurance Company, chairman of American International Assurance, and most recently, chairman of AIG’s International Life and Retirement Services businesses until November 2010. Mr. Martin received his bachelor’s degree in business administration from Alfred University in Alfred, N.Y., and is also a Life Underwriter Training Council Fellow. Mr. Martin serves on the Board of Directors of ACLI and has served on the Board of Directors of LIMRA.
Alain M. Karaoglan has served as executive vice president and chief operating officer since September 2012, and from April 2011 to September 2012 served as executive vice president, finance and strategy. Mr. Karaoglan provides oversight to our Investment Management business, as well as Strategy and Corporate Development, Investor Relations, Brand Marketing, Operations, and Information Technology. Mr. Karaoglan also served as a member of the Board of Directors from April 2011 to April 2013. Prior to joining us, Mr. Karaoglan was senior vice president, Divestiture, for AIG from June of 2009 to April 2011. Prior to AIG, from September 2007 to April 2009, Mr. Karaoglan was managing director, Equity Research, for Banc of America Securities LLC. From October of 2000 to June 2007, he was managing director, North American Equity
-259-
Table of Contents
Research, at Deutsche Bank Securities Inc. Previously, from August 1997 to October 2000, he was an equity research analyst at Donaldson Lufkin & Jenrette after being in investment banking for approximately 10 years (1988-1997) at First Boston Corporation and, as a managing director at Bear Stearns, where he advised companies in corporate finance and merger and acquisitions transactions. Mr. Karaoglan received bachelor’s degrees, both magna cum laude, in business administration and economics from Pepperdine University and received his M.B.A. from Dartmouth College’s Tuck School of Business.
Ewout L. Steenbergen has served as executive vice president and chief financial officer of the Company since January 2010. Mr. Steenbergen also served as a member of the Board of Directors from January 2010 to April 2013. Mr. Steenbergen is responsible for strategic finance, capital management, treasury, actuarial, tax, insurance investments, controller functions, financial reporting, procurement and expense management for the Company. Mr. Steenbergen has been employed by ING Group-affiliated companies since 1993. Immediately prior to his current position, he served as chief financial officer and chief risk officer for ING Asia Pacific. Mr. Steenbergen has held a number of management roles for ING Group including serving as regional general manager in Hong Kong, China, and as chief executive officer of RVS, an ING Group company based in the Netherlands that provides a broad range of life insurance, property and casualty insurance, and pension products. He has also served as head of corporate strategy for ING Group, chief executive officer of ING Insurance Czech Republic and Slovakia, and director of Retirement and Employee Benefits at Nationale-Nederlanden, ING Group’s life insurance company in the Netherlands. Prior to joining ING Group, Mr. Steenbergen was a consultant at the actuarial firm, Ten Pas (now part of Mercer) from 1990 to 1993. He holds a master’s degree in actuarial science from the University of Amsterdam (Netherlands) and a master’s degree in business administration from the University of Rochester.
Mary E. (“Maliz”) Beams has served as chief executive officer of our Retirement segment since June 2011, with responsibility broadened to cover the entire Retirement Solutions business since August 2012. Ms. Beams joined ING in 2011 with 30 years of experience in the financial services industry, spanning institutional, high net-worth and retail markets across asset management, retirement and banking sectors and has run both international and domestic businesses. Prior to joining the Company, Ms. Beams served as president and chief executive officer of TIAA-CREF’s Individual and Institutional Services LLC (2004-2010). In addition to TIAA-CREF, Ms. Beams was a partner at Zurich Scudder Investments heading the offshore and U.S. mutual fund direct businesses (1997-2003). She was also a managing director of Fleet Financial (1993-1997), American Express (1988-1993) and Citibank (1984-1988). Ms. Beams received a B.A. in English from Boston College and an M.B.A. in finance and marketing from Columbia University. Ms. Beams is currently a board member of the Employee Benefits Research Institute (EBRI), The Insured Retirement Institute (IRI) and LIMRA-LOMA Secure Retirement Institute and is a member of the CEO Task Force for Retirement Services.
Jeffrey T. Becker has served as chief executive officer of our Investment Management business since October 2009. Mr. Becker has been employed by the Company and its predecessor since 1998, serving in increasingly responsible positions, including vice chairman, chief operating officer and chief financial officer of the Investment Management business. Prior to joining the Company, Mr. Becker was chief credit officer for Aetna’s Real Estate Investment Group. Prior to joining Aetna in 1994, Mr. Becker was a senior manager in Arthur Andersen’s financial consulting practice. Mr. Becker earned a B.A. in economics from Colgate University and an M.B.A. in finance from New York University’s Stern School of Business.
Bridget M. Healy has served as executive vice president and chief legal officer of the Company since July 2007 and prior to 2012, also served in the same capacity for ING Group’s non-banking operations in the Americas. In this role, Ms. Healy is responsible for the law, government affairs, compliance and corporate responsibility functions for the Company. Ms. Healy joined ING U.S., Inc. from The Travelers Companies, Inc., where she was senior vice president and group general counsel from 2005 to 2007. Prior to Travelers, from 1995 to 2003 she served in positions of increasing responsibility at Becton, Dickinson and Company, ultimately serving as its general counsel and corporate secretary from 2000-2003. In addition, she previously was a partner in the law firm of Stroock & Stroock & Lavan from 1992 to 1995 and practiced law in the United States and in Europe with Davis Polk & Wardwell LLP from 1982 to 1991. Ms. Healy received her J.D., magna cum laude,
-260-
Table of Contents
from the Georgetown University Law Center and is a graduate of Brown University, with an honors degree in International Relations and French Studies. Ms. Healy is the past Chairman of the Life Insurance Council of New York (LICONY).
Chetlur S. Ragavan has served as executive vice president and chief risk officer of the Company since January 2014. Prior to assuming this role, Mr. Ragavan served as the chief risk officer of Investment Management since April 2008. In this role, Mr. Ragavan was responsible for an integrated, company-wide platform that covers investment, operational and business risk management. Prior to joining the Company, Mr. Ragavan served as Managing Director, co-head of the Portfolio Analytics Group for Blackrock Solutions following its merger with Merrill Lynch Investment Managers in October 2006. He began his career at Merrill Lynch in 1980 and has held a number of senior investment and risk management positions within its various subsidiaries. Mr. Ragavan has a B.B.A. in management science from Madurai University and an M.B.A. in finance from the University of Madras, both in India. He also holds an M.S. in computer science from the New Jersey Institute of Technology and holds the Chartered Financial Analyst® designation.
Kevin D. Silva has served as executive vice president and chief human resources officer of the Company since February 2012. Prior to his current position, from 2009 to 2012, he served as chief human resources officer at Argo Group International, a global, publicly traded specialty insurance company. Prior to joining Argo, Mr. Silva spent more than 13 years (1996-2009) at MBIA Insurance Corporation where he served as chief administrative officer responsible for the human resources, communications, corporate administration, governmental relations, information resources, facilities, telecommunications, and records-management functions. Mr. Silva has also served in senior human resources leadership roles with Merrill Lynch (1993-1995), MasterCard International (1989-1993), and Pepsi Cola Company (1979-1989). Mr. Silva earned a bachelor’s degree in Communications from St. John’s University and a master’s degree in Psychology from New York University.
Michael S. Smith has served as Chief Executive Officer of our Insurance Solutions and Closed Block Variable Annuity business since January 2014. Prior to assuming this role, Mr. Smith served as the executive vice president and chief risk officer of the Company since May 2012. In this role, Mr. Smith was responsible for overseeing the enterprise-wide and business-level risk monitoring and management program for the Company. In addition to his risk management role, he provided management oversight of our CBVA segment. Mr. Smith joined the Company in May 2009 first as chief financial officer and chief insurance risk officer of the annuity business and subsequently as chief executive officer of Annuity Manufacturing. Prior to joining the Company, from 1988 to 2009, Mr. Smith was employed by Lincoln Financial Group (“LNC”) where he held several positions, including head of Profitability and Risk Management for Retirement Solutions at LNC, chief actuarial officer for Lincoln National Life, chief administrative officer and chief financial officer for Lincoln Financial Distributors, Inc., chief financial officer and chief risk officer for LNC’s Life and Annuity division and head of customer support for LNC’s Employer Markets division. Mr. Smith holds bachelor’s degrees in Economics and Russian Studies from the University of Michigan. He attained Fellowship in the Society of Actuaries in 1990 and is also a Member of the American Academy of Actuaries. He also attained his CFA Charter holder designation in 2003.
-261-
Table of Contents
Our Directors
The Board of Directors is responsible for the oversight of management of the Company. The following table presents information regarding the current members of our Board of Directors.
| Name |
Age | Position | ||||
| Rodney O. Martin, Jr. |
61 | Chairman of the Board of Directors | ||||
| Johannes (“John”) M.M. Boers |
61 | Director | ||||
| Patrick G. Flynn |
53 | Director | ||||
| J. Barry Griswell |
64 | Director | ||||
| Dirk (“Dick”) H. Harryvan |
60 | Director | ||||
| Frederick S. Hubbell |
62 | Director | ||||
| Hendricus (“Henny”) A. Koemans |
59 | Director | ||||
| Willem (“Wilfred”) F. Nagel |
57 | Director | ||||
| David Zwiener |
59 | Director | ||||
Set forth below is biographical information about each of the directors named in the table above, to the extent not provided above under “—Our Executive Officers.”
Johannes (“John”) M.M. Boers was appointed a director of ING U.S., Inc. in April 2013. Mr. Boers has been employed by ING Group for over 25 years in increasingly responsible positions. He is currently the Head of Corporate Operational Risk Management at ING/NN Group. Prior to his current position, Mr. Boers was Head of ING Insurance Investments from 2012 to 2013. Previous to that, Mr. Boers was Chief Financial Officer and Chief Risk Officer of ING Life India from 2009 to 2012 and Chief Financial Officer and Chief Risk Officer of ING Group’s Dutch insurance operation, Nationale-Nederlanden, from 2004 to 2009. From 2002 to 2004, he was the Chief Financial Officer and Chief Risk Officer for ING Americas and from 1999 to 2002 he was ING Group’s Chief Auditor. Prior to joining ING Group, Mr. Boers served for 10 years as an officer in the Royal Dutch Army. Mr. Boers graduated from the Dutch Royal Military Academy and is a member of the Royal Dutch Institute of Certified Accountants.
Patrick G. Flynn was appointed a director of ING U.S., Inc. in 2011. He has been a member of the Executive Board and chief financial officer of ING Group since April 2009. He also serves on the Management Boards of ING Bank, NN Group (successor to ING V and ING Insurance Topholding N.V.) and ING Insurance Eurasia N.V. Prior to joining ING Group, he was employed by HSBC from 1989 to 2009 serving as chief financial officer for HSBC’s banking and insurance operations in South America from 2002 to 2006 and rising to chief financial officer of HSBC’s global Insurance business based in London. From 1984 to 1989 he was employed by KPMG in Dublin, Ireland. Mr. Flynn holds a bachelor’s degree in Business Studies from Trinity College Dublin. Mr. Flynn is a fellow of the Institute of Chartered Accountants, Ireland, and a member of the Association of Corporate Treasurers (UK).
J. Barry Griswell was appointed a director of ING U.S., Inc. in May 2013 and serves as Chairman of our Compensation and Benefits Committee (see “—Compensation and Benefits Committee”). Mr. Griswell is the retired Chairman and Chief Executive Officer of Principal Financial Group, positions he held from 2002 to 2009 and 2000-2008, respectively. He remained a non-executive member of Principal Financial Group’s Board of Directors until 2010. Prior to joining Principal Financial Group in 1988, Mr. Griswell served as President and Chief Executive Officer of MetLife Marketing Corporation, a subsidiary of Metropolitan Life Insurance Company. In 2011, Mr. Griswell joined the board of directors of Och-Ziff Capital Management Group, where he serves as Chair of the Compensation Committee, and since 2004 he has been a member of the board of directors of Herman Miller, Inc., where he currently is Chair of the Compensation Committee and a member of the Executive Committee. From 2010 to 2013, Mr. Griswell served as a director of National Financial Partners Corp. From his retirement in 2008 from Principal Financial Group until July 1, 2013, Mr. Griswell has served as the head of the Community Foundation of Greater Des Moines, first as President and, from July 2011 until July 2013, as Chief Executive Officer. Mr. Griswell has held leadership positions with several industry trade
-262-
Table of Contents
associations, including ACLI, LIMRA, the Life Underwriting Training Council and LL Global. Mr. Griswell is the co-author of The Adversity Paradox: An Unconventional Guide to Achieving Uncommon Business Success (2009). Mr. Griswell received a B.A. from Berry College and an M.B.A. from Stetson University.
Dirk (“Dick”) H. Harryvan (alternate spelling, “Harrijvan”) was appointed a director of ING U.S., Inc. in April 2013. Mr. Harryvan serves as chairman of our Finance Committee (see “—Finance Committee”). Mr. Harryvan retired from ING Group in 2009 after 30 years of service in increasingly responsible positions. From 1993 to 2009, he was with ING Bank, and, from 2006 to 2009, was Chief Executive Officer of ING Direct and a member of ING Group’s Executive Board. Prior to ING Bank, Mr. Harryvan held several positions with ING-affiliated insurance companies in Canada and the U.S. Mr. Harryvan is currently a member of the Supervisory Board of ING Direct Germany as well as the Dutch Automobile Association. He also serves as Co-Chairman of the International Academy of Retail Banking and is a member of the Advisory Board of the Official Monetary Financial Institutions Forum. He was previously a director of ING Direct USA and ING Direct Canada. Mr. Harryvan holds a master’s degree in Business Economics from Erasmus University (The Netherlands) and also completed the Insurance Executive Management program at Columbia University. He is a Fellow of the Life Management Institute and a Chartered Property and Casualty Underwriter.
Frederick S. Hubbell was appointed a director of ING U.S., Inc. in 2012. Mr. Hubbell serves as our Lead Director (see below “—Lead Director”) and Chairman of our Nominating and Governance Committee (see “—Nominating and Governance Committee”). During 2012 prior to his appointment to the ING U.S. Board of Directors, Mr. Hubbell was an independent advisor to ING Group for approximately nine months in its consideration of potential Divestment Transactions. He served as a member of the Executive Board of ING Group from 2000 to 2006 and was Chairman of Insurance and Asset Management Americas for ING Group from 2004 to 2006. Mr. Hubbell was a member of the Executive Committee of Financial Services International for ING Group from 1999 to 2000 and served as President and Chief Executive Officer of the United States Life and Annuities Operations for ING Group from 1997 to 1999. He became President and Chief Executive Officer of Equitable Life Insurance Company of Iowa in 1989 and Chairman in 1993, and served in both roles until ING Group’s acquisition of Equitable in 1997. Mr. Hubbell was Chairman of Younkers, a retail department store business from 1985 to 1992. He was head of strategic planning of Equitable Life Insurance Company of Iowa from 1983 to 1985. Mr. Hubbell began his career as a lawyer in the United States at Dewey, Ballantine, Bushby, Palmer & Wood LLP from 1976 to 1978 and also practiced at Hughes Hubbard and Reed LLP from 1978 to 1981, and was a partner at Mumford, Schrage, Merriman and Zurek from 1981 to 1983. Mr. Hubbell received his B.A. from University of North Carolina, Chapel Hill in 1973 and his J.D. from University of Iowa in 1976. He serves on the Board of Directors of The Macerich Company, the Board of Directors of the Community Foundation of Greater Des Moines, and the Board of Trustees of Simpson College.
Hendricus (“Henny”) A. Koemans was appointed a director of ING U.S., Inc. in October 2013. He has been employed by ING Group since 1996 in various positions, most recently as Director of Public & Government Affairs since 2010. He served as Head of Tax ING Group from 2002 to 2011. Prior to joining ING Group, Mr. Koemans was employed by the Ministry of Finance in the Netherlands from 1987 to 1996. Mr. Koemans holds a tax law degree from the University of Leiden.
Willem F. Nagel was appointed a director of ING U.S., Inc. in 2011. He has been a member of the Executive Board and chief risk officer of ING Group since May 2012. He also serves as chief risk officer on the Management Boards of ING Bank and ING Insurance Eurasia N.V. and is a member of the management board of NN Group. He has been employed by ING Group since 1991 in various positions, most recently as chief executive officer of ING Bank Turkey since January 2010 and CEO of ING Wholesale Bank Asia from 2005 to January 2010. From 1981 to 1991, he was employed by ABN Amro Bank, most recently as head of Aerospace and Structured Finance. Mr. Nagel holds a master’s degree in Economics from VU University Amsterdam.
David Zwiener was appointed a director of ING U.S., Inc. in May 2013 and serves as chairman of our Audit Committee (see “—Audit Committee). Since 2010, Mr. Zwiener has been a Principal in Dowling Capital
-263-
Table of Contents
Partners. Prior to joining Dowling Capital Partners, Mr. Zwiener was Chief Financial Officer of Wachovia Corporation. From 2007 to 2008, he was Managing Director and Co-Head of the Financial Institutions Group at The Carlyle Group. From 1995 to 2007, Mr. Zwiener served in increasingly responsible positions at The Hartford, rising to President and Chief Operating Officer—Property & Casualty. Mr. Zwiener is currently a director of Partner Re, Ltd. where he serves as chairman of that company’s audit committee, and he is a trustee of the New Britain Museum of American Art. He previously served as a director of CNO Financial Group (2010-2011), The Hartford (1997-2007) and Sheridan Healthcare, Inc. (1998-2004). Mr. Zwiener received an A.B. degree from Duke University and an M.B.A. from the Kellogg School of Management at Northwestern University.
Board of Directors
Our Board of Directors consists of nine members and has the following standing committees: Audit, Compensation and Benefits, Nominating and Governance, Finance, and Executive Committees. As discussed under “Certain Relationships and Related Party Transactions—Continuing Relationship with ING Group—Shareholder Agreement—Board of Directors and ING Group Rights with Respect to Director Nomination.” ING Group has the right to nominate certain of our directors (“ING Group Directors”).
Our Board of Directors has determined that Messrs. Griswell, Hubbell and Zwiener are independent under the NYSE listing rules (an “independent director”). In considering their independence, the board of directors considered the relationships between each of Messrs. Griswell, Hubbell and Zwiener, on the one hand, and the Company and ING Group, on the other hand, described in their respective biographical information, above. The ING Group Directors are Messrs. Boers, Flynn, Harryvan, Koemans, and Nagel.
Following the completion of this offering, when ING Group will cease to own more than 50% of our shares, the number of ING Group Directors that we will be required to include in any slate of director candidates recommended to our stockholders in connection with a meeting of stockholders will be reduced from five to three. In addition, as described below, it is a condition to the closing of the Direct Share Buyback that two ING Group Directors will tender their resignations, effective immediately upon the closing of the Direct Share Buyback. As of the date of this prospectus, we have received the written resignations of each of Messrs. Boers and Harryvan, to be effective no later than the closing of the Direct Share Buyback.
Resignation of Certain ING Group Directors and Postponement of Annual Meeting of Shareholders
As a closing condition to the Direct Share Buyback, two directors who are designated as “ING Group Directors” must tender their resignation, effective immediately upon the closing of the Direct Share Buyback. Following these resignations, seven members of our current Board of Directors will remain in office, including our Chairman and Chief Executive Officer, our three independent directors, and three ING Group Directors.
The Nominating and Governance Committee of our Board of Directors is currently working with an executive search firm to identify and recruit potential director candidates to replace the two ING Group Directors who are expected to resign. It is expected that the candidates ultimately selected will each qualify as “independent” for purposes of the NYSE listed company rules and the rules of the SEC relating to the independence of audit committee members and will be nominated by our Board of Directors for election at our 2014 annual meeting of stockholders. In order to permit sufficient time for a thorough review and nomination process, our Board of Directors has decided to postpone the previously scheduled annual meeting of stockholders, and has withdrawn the previously announced record date set for such meeting. Additional information about the 2014 annual meeting of stockholders and our director nominees will be included in the proxy statement that we will file with the SEC in advance of the annual meeting.
Audit Committee
The Audit Committee’s primary function is to assist the Board of Directors in fulfilling its oversight responsibilities of the financial reports and other financial information filed with the SEC or provided by us to regulators; our risk and capital profile and policies; our independent auditors’ qualifications and independence; and the performance of our independent auditors and our internal audit function.
-264-
Table of Contents
Pursuant to the phase-in provisions of the NYSE listing requirements and Rule 10A-3 promulgated by the SEC under the Exchange Act, our Audit Committee is composed of a majority of directors who are “independent” under the NYSE listing rules and Rule 10A-3. We are required to have an audit committee composed solely of such independent directors no later than May 1, 2014.
The Audit Committee currently consists of Mr. Zwiener, who serves as chairman, and Messrs. Boers, Griswell, Harryvan and Hubbell, all of whom are “financially literate” as such term is defined in the NYSE listing rules.
Compensation and Benefits Committee
The Compensation and Benefits Committee is responsible for annually reviewing and approving the corporate goals and objectives relevant to the compensation of the Chief Executive Officer and evaluating his or her performance in light of these goals; determining the compensation of our executive officers and other appropriate officers, and administering our incentive and equity-based compensation plans.
The Compensation and Benefits Committee consists of Mr. Griswell, who serves as chairman, and Messrs. Hubbell and Nagel. Mr. Nagel serves as an ING Group Director. Following the completion of this offering and the Direct Share Buyback, when ING Group ceases to own more than 50% of our shares, the Compensation and Benefits Committee will transition to consist solely of independent directors in accordance with the phase-in provisions of the NYSE listing rules.
Nominating and Governance Committee
The Nominating and Governance Committee is responsible for identifying and recommending candidates for election to our Board of Directors and each committee of our Board of Directors, reviewing and reporting to the Board of Directors on compensation of directors and Board committee members, developing, recommending and monitoring corporate governance principles applicable to the Board of Directors and the Company as a whole.
The Nominating and Governance Committee consists of Mr. Hubbell, who serves as chairman, and Messrs. Boers and Griswell. Mr. Boers serves as an ING Group Director. Following the completion of this offering and the Direct Share Buyback, when ING Group ceases to own more than 50% of our shares, the Nominating and Governance Committee will transition to consist solely of independent directors in accordance with the phase-in provisions of the NYSE listing rules.
Finance Committee
The Finance Committee is responsible for reviewing our financial affairs based upon periodic reports and recommendations of our management; monitoring our financial structure and long-term financial plan and recommending appropriate action to our board of directors with respect to financial policies, allocation of capital to our businesses and methods of financing our businesses; monitoring our capital needs and financing arrangements, our ability to access capital markets and management’s financing plans; and reviewing and approving or recommending for approval certain issuances of securities, investments, dispositions and other transactions above certain amounts.
The Finance Committee consists of Mr. Harryvan, who serves as chairman, and Messrs. Flynn, Nagel and Zwiener.
Executive Committee of the Board
The Executive Committee of the Board is responsible for taking action where required in exigent circumstances where it is impracticable to convene, or obtain the unanimous written consent of, the full Board of Directors.
The Executive Committee of the Board consists of Mr. Martin, who serves as chairman, Mr. Zwiener and Mr. Boers, as alternate for a former director (as provided for in our Shareholder Agreement).
-265-
Table of Contents
Lead Director
The Shareholder Agreement provides that until the date ING Group first ceases to beneficially own more than 20% of our outstanding common stock, if at any time the chairman of the board of directors is not an independent director, our board will designate a “lead director” who is an independent director. Our Board of Directors has appointed Mr. Hubbell as the lead director. Mr. Hubbell presides over meetings of the directors when the Chairman of our Board is absent, that are held by non-management directors without any management directors present and that are held by independent directors.
The lead director has, among other things, the authority to:
| • | call meetings of the independent directors; |
| • | consult on and approve meeting agendas and schedules of our Board of Directors; |
| • | together with the chair of the Compensation and Benefits Committee, coordinate the evaluation of the performance of the CEO by our non-management directors; |
| • | serve as a liaison between the non-management members of our Board of Directors and the Chairman or the board, as a contact person to facilitate communications by our employees, shareholders (including ING Group) and others with the non-management directors; and |
| • | review the quality, quantity, appropriateness and timeliness of information provided to our Board of Directors. |
In addition, the lead director is a member and the chairperson of any independent committee designated to review and approve related party transactions. See “Certain Relationships and Related Party Transactions—Related Party Transaction Approval Policy.”
Codes of Ethics and Conduct
Our Board of Directors adopted a code of ethics and a code of conduct as such terms are used in Item 406 of Regulation S-K and the NYSE listing rules.
“Controlled Company” Exemption
Until the time of this offering, ING Group has owned a majority of our stock, and we have elected to be a “controlled company” for purposes of the NYSE listing rules. Pursuant to the “controlled company” exemption, we have not been required to satisfy certain of the corporate governance rules of the NYSE, including the requirement that we maintain a Board of Directors containing a majority of directors who are “independent” for purposes of the NYSE listed company rules or that our Nominating and Governance and Compensation and Benefits committees each consist solely of independent directors. Following the completion of this offering and the Direct Share Buyback, we will cease to be a “controlled company,” and will no longer have the benefit of the controlled company exemption. Accordingly, we will become subject to all of the applicable NYSE corporate governance rules over a one-year phase-in period, following which time our Board of Directors must consist of a majority of independent directors, and our Nominating and Governance and Compensation and Benefits committees must each consist solely of independent directors. We currently expect that we will meet such requirements well before the conclusion of the phase-in period.
Compensation Committee Interlocks and Insider Participation
There are no interlocking relationships between any member of our Compensation Committee and any of our executive officers that require disclosure under the applicable rules promulgated under the federal securities laws.
-266-
Table of Contents
COMPENSATION OF EXECUTIVE OFFICERS AND DIRECTORS
Compensation Discussion and Analysis
Introduction
This Compensation Discussion and Analysis (“CD&A”) provides a review of the compensation arrangements of our named executive officers. The following individuals were our named executive officers as of December 31, 2013:
| Name |
Position | |
| Rodney O. Martin, Jr. |
Chairman and Chief Executive Officer | |
| Alain M. Karaoglan |
Executive Vice President and Chief Operating Officer | |
| Ewout L. Steenbergen |
Executive Vice President and Chief Financial Officer | |
| Maliz E. Beams |
Chief Executive Officer, Retirement Solutions | |
| Jeffrey T. Becker |
Chief Executive Officer, Investment Management |
Throughout this CD&A, we refer to the five executives above as our “named executive officers” or “NEOs,” and to Mr. Martin as our “Chief Executive Officer” or “CEO”.
Compensation Philosophy and Objectives
Before our IPO in May 2013, we were a wholly owned subsidiary of ING Group, and as a result the compensation packages of our named executive officers, while guided by U.S. compensation surveys and practices, were governed primarily by the compensation philosophy and objectives of ING Group, including the requirements imposed by the European Commission and the Kingdom of the Netherlands on the compensation practices of financial institutions. See “—Critical Compensation and Other Policies—Capital Requirements Directive”.
Since the IPO, we have been developing the compensation philosophy and objectives we intend to pursue as a standalone public company. Because, until the time of this offering, ING Group has continued to hold a majority of our common stock, our initial approach has been similar in several respects to the principles historically followed by ING Group with respect to our management team, although we have begun to implement changes that we believe are more consistent with the compensation practices of the U.S. companies that we consider to be our peers. This includes an increasing emphasis on variable compensation elements, an effort to gradually move the level of our NEOs’ total compensation opportunities to approximate median levels when compared with our peers, and performance-based compensation more directly tied to business and individual performance results. We anticipate that it will take several years before we have fully implemented our intended approach to executive compensation, and in the meantime our practices are likely to retain a number of elements in common with the practices of ING Group, including, during periods in which we have been subject to such requirements, our required adherence to certain limitations on compensation ratios, limitations on performance-based equity compensation, and mandatory deferrals (in the form of time-vested equity awards) of a portion of annual incentive compensation amounts, in each case as mandated by regulations implemented by the European Commission and national banking regulators in the Netherlands. See “Critical Compensation and Other Policies—Capital Requirements Directive”. In this CD&A, we refer to these limitations as the “CRD Limitations”.
Together with the Board of Directors, the Compensation and Benefits Committee (which we sometime refer to in this CD&A as the “Committee”) is responsible for determining our compensation philosophy in a manner consistent with applicable laws and regulations, and which we believe is appropriately reflective of best practices in the area of executive compensation.
Our executive compensation philosophy reflects the following principles:
| • | Compensation programs should attract, retain and motivate executive talent in a manner that ensures that our investors receive an appropriate return on their investment in the Company. |
-267-
Table of Contents
| • | NEO target levels for each element of compensation and for overall total direct compensation (base salary, annual cash and deferred equity-based incentives and long-term equity-based incentives) should be competitive with the compensation packages provided to similarly situated executives with comparable responsibilities at companies that compete with the Company for executive talent. |
| • | Compensation packages should facilitate long-term equity growth by aligning the interests of executives with the interests of our investors through emphasizing long-term equity-based compensation and by encouraging executive stock ownership. |
| • | Performance-based compensation should be a meaningful portion of total compensation and actual amounts earned should reward corporate, business unit and individual performance, within the boundaries of prudent risk management and all applicable regulatory considerations. |
Our executive compensation plans and policies are designed to:
| • | Ensure that competitive levels of compensation are paid when business targets are met. |
| • | Establish focused performance metrics that will reward executives for the most critical business objectives that drive long-term sustainable growth. |
| • | Encourage long-term share ownership. |
| • | Establish an appropriate approach to governance that reflects the needs of all stakeholders and include the Company’s right to claw back compensation in certain circumstances. |
Elements of Compensation
The following table presents the principal elements of the compensation programs that applied to our named executive officers for 2013 and the objective each element was designed to achieve. The elements of compensation (described below) were designed to provide a variety of fixed and at-risk compensation related to the achievement of the Company’s short-term and long-term objectives.
Compensation Elements
| Compensation Element |
Objective/Purpose | |
| Base salary |
Compensates NEOs for the day-to-day services performed for the Company. Attracts and retains talented executives with competitive compensation levels. | |
| Annual cash and deferred equity-based incentive compensation | Motivates executives to achieve performance goals selected for their potential to increase long-term stockholder value.
Promotes differentiation of pay based on business and individual performance and rewards executives for attaining annual objectives. | |
| Long-term equity-based incentive compensation | Emphasizes equity-based compensation and creates a culture focused on long-term value creation. | |
| Retirement, deferral and health and welfare programs | Addresses retirement needs of executives with competitive retirement programs. Aligns with philosophy of attracting and retaining talented individuals. | |
| Perquisites and other benefits |
We provide perquisites and other benefits similar to those provided by peer companies. Also aligns with philosophy of attracting and retaining talented individuals. | |
-268-
Table of Contents
Review and Assessment of Compensation Policies
In 2013, following our IPO, the Company reviewed its executive compensation policies and practices in light of our emergence as a newly public U.S. company. The Compensation and Benefits Committee helped lead this assessment.
During 2013, the Committee retained Pay Governance LLC, to serve as its executive compensation consultant. Among other services, Pay Governance assisted and advised the Committee in connection with its review of executive compensation policies and practices.
Comparison Group
As part of its review, in 2013 the Committee established a comparison group of peer companies, with the assistance and advice of the Company’s management and Pay Governance. The Committee used this comparison group, in part, to evaluate the Company’s compensation policies and practices, and as a means by which to measure the compensation packages of its executives. In establishing the comparison group, the Committee considered numerous factors, including whether potential member companies competed with us in the same competitive labor market or in similar lines of business, the potential member company’s market capitalization (with a view to having the market capitalization of most comparison group companies be within 50% and 300% of the market capitalization of the Company), and various other factors, including the revenues, workforce size and assets under management or assets under administration of potential member companies.
For 2013, the comparison group of companies considered by the Committee (which we refer to in this CD&A as the “Comparison Group”) included the following companies:
| • Ameriprise Financial Inc
• Eaton Vance Corp
• Genworth Financial Inc
• Hartford Financial Services Group
• Invesco Ltd.
• Legg Mason, Inc.
• Lincoln National Corp
• Manulife Financial Corp |
• Metlife Inc
• T Rowe Price Group Inc
• Principal Financial Group Inc
• Prudential Financial Inc
• Sun Life Financial Inc
• Torchmark Corp
• Unum Group |
-269-
Table of Contents
Surveys and Competitive Data
As part of its 2013 compensation review, the Committee also considered compensation data provided by a number of surveys and sources to determine the relative competitiveness of compensation programs as well as competitive levels of pay. These surveys included a diversified study of executive compensation in the insurance industry prepared by Towers Watson (which we refer to as the “Towers Watson Survey”) and a survey of investment management companies prepared by McLagan. For purposes of the McLagan survey, we used the following group of investment and asset management companies (which we refer to in this CD&A as the “IM Comparison Group”):
| • AEGON USA, LLC
• American Century Investments
• Babson Capital Management LLC
• Columbia Management Investment Advisers, LLC
• Conning Holdings Corp.
• Delaware Investments
• Eaton Vance Investment Managers
• Janus Capital Group
• Jennison Associates, LLC |
• Loomis, Sayles & Company, L.P.
• MFS Investment Management
• Morgan Stanley Investment Management
• New York Life Investment Management LLC
• Nuveen Investments
• Old Mutual Asset Management
• Oppenheimer Funds, Inc.
• Principal Global Investors
• Putnam Investments
• Trust Company of the West |
2013 Compensation
Base Salary
Base salary is an essential element of each NEO’s compensation package. With the exception of Mr. Becker, our NEOs’ base salaries for 2013 were established prior to our IPO, having been recommended by our Board of Directors and then approved by the ING Group Supervisory Board. Although Mr. Becker’s base salary for 2013 was initially determined in the same manner, as described below, this amount was reviewed and increased following our IPO.
In the case of Mr. Martin, base salary for 2013 was set forth in his employment agreement. The base salary for our other NEOs was established after considering several factors, including the NEO’s experience, the NEO’s 2012 performance, the NEO’s 2012 base salary and the competitiveness of that base salary as compared to internal peers and similarly situated executives at companies that compete with us for executive talent. In the case of Mr. Karaoglan, Mr. Steenbergen, and Ms. Beams, this included consideration of executive compensation paid by certain companies included in the Comparison Group, and a review of the Towers Watson Survey. Following our IPO, our Compensation and Benefits Committee reviewed each NEO’s base salary and, in the case of Mr. Becker, increased base salary for 2013. This increase was made after review of Mr. Becker’s total incentive opportunity as compared to similarly situated executives in the IM Comparison Group, with a view to increasing Mr. Becker’s total target compensation to be closer to the median for such group.
Further information regarding the salary of Mr. Steenbergen, a citizen of the Netherlands, who was on a long-term international assignment with the Company in the U.S. from January 1, 2010 until his transition to local employee status (his “localization”) on April 1, 2013, is provided below under “—Expatriate Arrangements and Localization of Mr. Steenbergen”.
-270-
Table of Contents
The annual base salaries earned by the NEOs in 2013 were as follows: Mr. Martin—$1,000,000; Mr. Karaoglan—$700,000; Mr. Steenbergen—$605,768 (which amount includes $54,739 in tax equalization and also includes other amounts paid in respect of Mr. Steenbergen’s expatriate status prior to April 1, 2013); Ms. Beams—$679,167 (increased to $700,000 annually on March 16, 2013); and Mr. Becker—$422,538 (increased to $575,000 annually on November 15, 2013). Mr. Martin’s base salary was unchanged from his 2012 base salary. Mr. Karaoglan’s base salary for 2013 increased from $650,000 in 2012; Ms. Beams’ base salary increased from $600,000 in 2012; and Mr. Becker’s base salary increased from $400,000 in 2012. On April 1, 2013, in connection with his localization, Mr. Steenbergen’s base salary was established at $550,000 annually on April 1, 2013. This amount was an increase over Mr. Steenbergen’s base salary prior to April 1, 2013, excluding the effect of amounts Mr. Steenbergen was paid prior to April 1, 2013 in respect of his expatriate status.
Annual Cash and Deferred Equity-Based Incentive Compensation
Our annual incentive plan is designed to reward participants based on critical financial results and for their annual contributions to those results. Individual incentive awards are based on an annual evaluation of business performance and each NEO’s individual performance.
The annual incentive compensation payment with respect to 2013 was paid in March 2014. In this CD&A, references to 2013 annual incentive compensation awards are to the annual incentive compensation amounts that were paid to NEOs in March 2014, which were designed to recognize individual, Company and business unit performance during 2013. As described in more detail below, an NEO’s annual incentive award is determined after taking into account the performance of the Company under several financial measures and based on a qualitative assessment of individual performance and other factors considered relevant by the Compensation and Benefits Committee.
Mandatory Deferral of 2013 Annual Incentive Compensation. Because we have continued to be majority-owned by ING Group, our NEOs have been subject to an ING Group mandatory annual incentive award deferral plan under which portions of 2013 annual incentive amounts in excess of $132,651 were automatically deferred, with deferral amounts calculated based on a sliding scale ranging from 10% of the first $265,302 of annual incentive amounts to a maximum marginal deferral of 50% for annual incentive amounts in excess of $633,255. Amounts that were deferred were converted into restricted stock units (“RSUs”) granted under, and subject to the payment and other terms and conditions of, the ING U.S., Inc. 2013 Omnibus Employee Incentive Plan (the “Omnibus Plan”). The RSUs generally vest over four years from the date of grant, with 50% vesting on the second anniversary, 25% vesting on the third anniversary and 25% vesting on the fourth anniversary of the date of grant. Because of the rules of the Securities and Exchange Commission governing the presentation of executive compensation in registration statements, the amounts listed in the tables below under “—Compensation of Named Executive Officers” do not include deferred amounts of 2013 annual incentive compensation, because such amounts were paid through equity grants made after the end of the 2013 calendar year. Such tables do, however, reflect the portion of 2013 annual incentive compensation paid in cash (even though such amounts were also paid after the end of the 2013 calendar year), along with the deferred portion of 2012 annual incentive compensation, which was paid in the form of ING Group equity grants in March 2013 (and subsequently converted to ING U.S. equity grants at the time of our IPO in May 2013). In order to more clearly present the annual incentive compensation paid to our NEOs for 2013, a supplemental table is presented below under “—Annual Incentive Compensation Outcomes” which includes all annual incentive compensation paid to our NEOs for 2013, including cash and equity amounts, and which excludes amounts paid in the form of equity awards in respect of 2012 performance.
Determination of 2013 Annual Incentive Compensation. The Compensation and Benefits Committee determined 2013 annual incentive compensation for our NEOs by applying a multi-step process. First, the target annual incentive opportunity and maximum award was determined for each NEO, expressed as a percentage of their base salaries. Second, a preliminary payout amount for each NEO was established, based on the target opportunity amount and on company financial performance under three financial measures: ongoing business adjusted operating income before tax, ongoing business adjusted return on capital, and distributable earnings
-271-
Table of Contents
before holding company expense. Third, based on a qualitative assessment of each NEO’s performance on an individualized basis, the individual payout was determined. Each of these steps is described in more detail below:
Step 1: Establishment of Annual Incentive Compensation Target Opportunity and Maximum Award. Mr. Martin’s, Mr. Karaoglan’s and Mr. Steenbergen’s 2013 target and maximum annual incentive opportunities were determined under the terms of their respective employment agreements and offer letters. The 2013 target and maximum award opportunity for Ms. Beams was, in terms of percentage amounts of base salary, adjusted downwards from the amount provided in Ms. Beams’ offer letter. This adjustment was made as part of an increase to Ms. Beams’ base salary and total target compensation opportunity implemented for 2013, and established Ms. Beams’ target annual incentive amount at 100% of base salary, which is the same percentage amount as applies to Messrs. Martin, Karaoglan and Steenbergen. In each of the foregoing cases, the target and maximum annual incentive opportunities were determined prior to our IPO, however, following our IPO, the Compensation and Benefits Committee has become responsible for reviewing and approving the annual target and maximum incentive opportunity for each of our NEOs. The target and maximum annual incentive opportunities for Mr. Becker were determined by our Compensation and Benefits Committee in November 2013, in connection with a review of Mr. Becker’s overall compensation package.
The NEOs’ 2013 target and maximum annual incentive opportunities were reviewed by the Compensation and Benefits Committee with reference to the Towers Watson Survey and to the compensation amounts publicly disclosed by the Comparison Group (with respect to Messrs. Martin, Karaoglan, and Steenbergen, and Ms. Beams) and the IM Comparison Group (with respect to Mr. Becker). The target and maximum annual incentive amounts were considered as one element of our NEOs’ overall total direct compensation opportunity, and, based in part on this review, total direct compensation opportunities were set at or below median total target compensation as reflected in the comparative data.
Target incentive award opportunities for the NEOs in 2013, as a percentage of base salary, were as follows: Mr. Martin—100%; Mr. Karaoglan—100%; Mr. Steenbergen—100%; Ms. Beams—100%; and Mr. Becker—250%. Mr. Becker’s target incentive award was based on a percentage of his new base salary, as it was adjusted on November 15, 2013, rather than the base salary actually paid for 2013. The maximum 2013 incentive opportunity was capped at two times the target award opportunity for all NEOs except for Mr. Becker, whose maximum incentive opportunity was capped at three times the target award opportunity, reflecting market practice among the IM Comparison Group, as reflected in the survey of such companies conducted by McLagan.
The target incentive award opportunities of each of Messrs. Martin and Karaoglan were unchanged from their 2012 target annual incentive award opportunities. Ms. Beams’ target incentive award opportunity was decreased from 125% to 100%, in connection with an increase to Ms. Beams’ base salary in 2013, as described above. Mr. Steenbergen’s target incentive award opportunity was increased from 40% to 100% in connection with Mr. Steenbergen’s localization and Mr. Becker’s target incentive award opportunity was increased from 200% to 250% in November 2013, in connection with the increases to Mr. Becker’s overall compensation package.
Step 2: Establishment of Preliminary Annual Incentive Compensation Amounts. Preliminary annual incentive amounts were determined based on company performance in 2013 against target performance levels set by during the first quarter of 2013, based on business forecasts and projections. Because in 2013 these targets were set during the period prior to our IPO when we were still wholly owned by ING Group, these targets were set by our board of directors in consultation with, and subject to the approval of, ING Group. Achievement against these targets was assessed by our Compensation and Benefits Committee during the first quarter of 2014, following the availability of Company financial information for 2013.
For 2013 annual incentive awards, preliminary annual compensation amounts were based on the target annual incentive compensation amounts for each of our NEOs, and on the following three financial measures:
Ongoing Business Adjusted Operating Earnings Before Tax: Ongoing Business Adjusted Operating Earnings Before Tax is a measure which indicates the financial performance of our ongoing business, without the effect of period-to-period volatility that can be caused by DAC/VOBA and other intangibles
-272-
Table of Contents
unlocking and certain other notable items that we do not believe are indicative of its continuing performance. Ongoing Business Adjusted Operating Income is a non-GAAP financial measure. See “Business—Return on Operating Return on Capital Goal—Calculations and Reconciliations”.
Ongoing Business Adjusted Operating Return on Capital: Ongoing Business Adjusted Operating Return on Capital is a measure of how effectively we deploy capital in our ongoing business. Ongoing Business Adjusted Operating Return on Capital is a non-GAAP financial measure. See “Business—Return on Operating Return on Capital Goal—Calculations and Reconciliations”.
Distributable Earnings Before Holding Company Expense: Distributable Earnings Before Holding Company Expense is a measure of how effectively we are generating capital and managing the capital structure of our business.
| Measure |
Weight | Minimum Performance for Payout |
Performance for Target Payout |
Performance for Maximum Payout |
Actual Performance, as Reported(1) |
Performance, As Adjusted for Compensation Purposes(2) |
Payout as Percentage of Target |
|||||||||||||||||||||
| Ongoing Business Adjusted Operating Earnings Before Tax |
35 | % | $ | 909 million | $ | 1,136 million | $ | 1,363 million | $ | 1,212 million | $1,165 million | 113 | % | |||||||||||||||
| Ongoing Business Adjusted Operating Return on Capital |
35 | % | 6.5 | % | 8.1 | % | 9.7 | % | 8.6 | % | 8.3 | % | 105 | % | ||||||||||||||
| Distributable Earnings Before Holding Company Expense(3) |
30 | % | 80 | % | 100 | % | 120 | % | N/A | 127 | % | 150 | % | |||||||||||||||
|
|
|
|||||||||||||||||||||||||||
| Total |
100 | % | 120 | % | ||||||||||||||||||||||||
| (1) | Actual performance amounts as reported in the Company’s press release announcing 2013 financial results. |
| (2) | Performance amounts reflecting adjustments to the reported amounts, which were determined by the Compensation and Benefits Committee to be not reflective of the ongoing performance of our business. |
| (3) | Expressed as a percentage of plan amounts. |
Step 3: Individual assessment and determination of individual ICP award. Following determination of the preliminary annual incentive amounts, the Compensation and Benefits Committee qualitatively assessed each NEO’s performance based on performance objectives that included individualized qualitative performance goals and business line or functional area performance. In the case of NEOs other than Mr. Martin, the views of Mr. Martin with respect to such performance were considered by the Compensation and Benefits Committee as part of this assessment. The results of this assessment were as follows:
Mr. Martin significantly exceeded his goals and objectives that were set at the beginning of 2013. In assessing the performance of Mr. Martin, the Committee considered the Company results that were achieved under Mr. Martin’s leadership, in addition to a number of his other notable accomplishments in 2013. Key corporate and individual factors considered included the following:
| • | Mr. Martin delivered solid financial results for the Company, which met or exceeded our targets, with Net Income available to shareholders driven by strong Ongoing Business Operating Earnings. Further, the Closed Block Variable Annuity performance was actively and effectively managed so as to protect regulatory and rating agency capital. |
| • | Ongoing Business Adjusted Operating Return on Equity for the year was increased to 10.3% during 2013, well on track to meet the year-end 2016 target of 12% to 13%. |
| • | Under Mr. Martin’s leadership, the Company achieved significant transformational objectives in 2013. Notably: |
| • | Our IPO was completed in May and a secondary offering of shares was completed in October, reducing ING Group’s ownership stake to approximately 57%. |
-273-
Table of Contents
| • | We had strong stock performance in 2013, with our stock price increasing approximately 80% between our initial public offering and the end of the year. |
| • | ING U.S. completed its recapitalization plan, which included a $600 million primary equity offering in May; three debt offerings (with an aggregate principal amount of $2.15 billion); and the restoration of ordinary dividend capacity in our four principal insurance operating subsidiaries. |
| • | We introduced our new brand, Voya Financial, to employees, customers, clients, distribution partners and investors, and developed detailed plans for full operational rebranding in 2014. |
Mr. Karaoglan significantly exceeded his key business objectives established for 2013. The Committee considered the following factors in assessing Mr. Karaoglan’s performance, in his capacity as a member of the OCEO:
| • | Mr. Karaoglan significantly contributed to the financial results of the Company, which met or exceeded our targets with Net Income available to shareholders driven by strong Ongoing Business Operating Earnings. The Closed Block Variable Annuity performance was actively and effectively managed so as to protect regulatory and rating agency capital. |
| • | Ongoing Business Adjusted Operating Return on Equity for the year was increased to 10.3% during 2013, well on track to meet the year-end 2016 target of 12% to 13%. |
| • | Mr. Karaoglan significantly contributed to the achievement of key transformational objectives for the Company during 2013. He was one of the key drivers in the development of compelling investment narratives, based on capital and value creation, and prepared the Company to be publicly traded. As a result of his efforts, we completed our IPO in May and a secondary offering of shares in October, thus reducing ING Group’s ownership stake to approximately 57%. |
Further,
| • | We had strong stock performance in 2013, with our stock price increasing approximately 80% between our initial public offering and the end of the year. |
| • | The businesses and functions led by Mr. Karaoglan achieved meaningful business and strategic targets in 2013. |
| • | Investment Management realized profitability and margin levels that were at historic highs, all while concurrently undergoing significant cultural change. |
| • | The functions met or exceeded key targets and also underwent significant leadership changes, began a significant cultural transformation and launched Continuous Improvement so as to enable employees to improve the ways in which they work and thereby deliver tangible economic benefits. |
| • | Mr. Karaoglan also successfully led the efforts to develop and began to implement our plans to operationally rebrand, while maintaining our existing strong brand presence and awareness. |
Mr. Steenbergen significantly exceeded our key business objectives for 2013. The Committee considered the following factors in assessing Mr. Steenbergen’s performance, in his capacity as a member of the OCEO:
| • | Mr. Steenbergen significantly contributed to the financial results of the Company, which met or exceeded our targets, with Net Income available to shareholders driven by strong Ongoing Business Operating Earnings. Capital generation during 2013 significantly exceeded our plan. Further, the Closed Block Variable Annuity performance was actively and effectively managed so as to protect regulatory and rating agency capital. |
| • | Ongoing Business Adjusted Operating Return on Equity for the year was increased to 10.3% during 2013, well on track to meet the year-end 2016 target of 12% to 13%.Mr. Steenbergen helped to direct the achievement of significant transformational objectives for the Company during 2013. He |
274
Table of Contents
| significantly contributed to the development and communication of the ING U.S. story with key investors, regulators, research analysts and rating agencies. As a result of his efforts, we were able to complete our IPO in May and a secondary offering in October, thereby reducing ING Group’s ownership to approximately 57%. |
| • | We had strong stock performance in 2013, with our stock price increasing approximately 80% between our initial public offering and the end of the year. |
| • | Mr. Steenbergen led the achievement of meaningful business and strategic targets during 2013, which included significant capital management projects, the establishment of a high quality U.S. GAAP reporting function next to simultaneous IFRS reporting and insurance statutory reporting, the redomestication of SLDI, and the completion of the ING U.S. recapitalization plan, which included a $600 million primary equity offering in May; three debt offerings (with an aggregate principal amount of $2.15 billion); and the restoration of ordinary dividend capacity in our four principal insurance operating subsidiaries. |
Ms. Beams met or exceeded her key business objectives for 2013. The Committee considered the following factors in assessing Ms. Beams’ performance, in her capacity as Chief Executive Officer of our Retirement Solutions businesses:
| • | Under the leadership of Ms. Beams, the Retirement business outperformed our targets on key metrics (including adjusted operating earnings, adjusted operating return on capital and distributable earnings). These results were driven by increases in profitable sales, margin and capital efficiency efforts as well as recordkeeping change orders. Recordkeeping retention, however, was somewhat below our targets, although with minimal impact to 2013 earnings. |
| • | Ms. Beams led the Annuities business to outperform on all key metrics (including adjusted operating earnings, adjusted operating return on capital and distributable earnings), except with respect to the lapse rate of one product which was slightly below our target. |
| • | Ms. Beams also notably contributed to the achievement of key strategic objectives for the Company during 2013, including continued rollout of our Retirement Readiness strategy and integrating cross-organizational capabilities. |
Mr. Becker exceeded his key business objectives for 2013. The Committee considered the following factors in assessing Mr. Becker’s performance, in his capacity as Chief Executive Officer of our Investment Management businesses:
| • | Under Mr. Becker’s leadership, Investment Management exceeded its targets and made important strategic advances. These included driving enhanced coordination and cross business development with Retirement and Insurance; leveraging the rebuilt and repositioned retirement, retail, and institutional distribution organizations to achieve industry-level productivity; focusing and prioritizing of products and strategies to achieve scale; significant margin expansion, retention and engagement with staff with a focus on investment talent; and driving profitable growth and distributable earnings consistent with growth objectives. |
| • | Mr. Becker also led Investment Management to significant asset growth during 2013. The Institutional and Retail Intermediary businesses had solid year-over-year growth in sales across products, with a series of notable wins. The business continued to grow it’s capabilities in the area of 529 College Savings Plans and Defined Contribution Investment Only mandates. |
Following this assessment, the Compensation and Benefits Committee considered the total 2013 compensation package being proposed for each NEO, including long-term incentive amounts and the amount of 2013 annual incentive amounts that would be subject to mandatory deferral as described above. Following this review and assessment, the Compensation and Benefits Committee adjusted the annual compensation amount payable to each NEO to between 100% and 167% of the preliminary payout determined pursuant to Step 2, above.
275
Table of Contents
Annual Incentive Compensation Outcomes
The following table presents, for each NEO, the results of the foregoing annual incentive award determination, the target annual incentive compensation for 2013 and the amount of the award paid in the form of cash and deferred equity (for a discussion of incentive deferral requirements, see—Mandatory Deferral of 2013 Annual Incentive Compensation). The cash component of 2013 incentive compensation awards was paid in March 2014, and the equity grants were made at the same time. As discussed above, due to SEC rules, the “—Summary Compensation Table”, below, and the related tables, do not include the value of the equity grants made in 2014 in respect of 2013 annual incentive compensation, but do include the grant date fair value (as determined under FASB ASC Topic 718) of the deferred portion of 2012 annual incentive compensation granted to our NEOs in March 2013 under the ING Group LSPP (as defined below) and subsequently converted to RSUs under the Omnibus Plan as of the date of our IPO.
| Name |
2013 Target Annual Incentive |
2013 Preliminary Annual Incentive Amount Based on Financial Measures Described Above |
2013 Actual Incentive Award | |||||||||||||||||
| Cash Payment |
Deferred Equity(1) |
Total Annual Incentive Payment |
||||||||||||||||||
| Rodney O. Martin, Jr. |
$ | 1,000,000 | $ | 1,200,000 | $ | 1,185,711 | $ | 814,289 | $ | 2,000,000 | ||||||||||
| Alain M. Karaoglan |
$ | 700,000 | $ | 840,000 | $ | 885,711 | $ | 514,289 | $ | 1,400,000 | ||||||||||
| Ewout L. Steenbergen |
$ | 550,000 | $ | 660,000 | $ | 735,711 | $ | 364,289 | $ | 1,100,000 | ||||||||||
| Maliz E. Beams |
$ | 700,000 | $ | 840,000 | $ | 745,711 | $ | 374,289 | $ | 1,120,000 | ||||||||||
| Jeffrey T. Becker |
$ | 1,437,500 | $ | 1,725,000 | $ | 1,048,211 | $ | 676,789 | $ | 1,725,000 | ||||||||||
| (1) | The portion of the annual incentive award that was automatically deferred and converted into grants of RSUs under the Omnibus Plan vest over four years from the date of grant, with 50% vesting on the second anniversary, 25% vesting on the third anniversary and 25% vesting on the fourth anniversary of the date of grant. |
Long-Term Equity-Based Incentive Compensation
Equity compensation is an important element of executive compensation, because it helps to align executive pay with the performance of our stock, and in turn the interests of our stockholders. We currently seek to achieve this objective through the payment of a portion of our NEO’s compensation in the form of time-vested equity awards. The size of each award is generally based on each NEO’s individual performance during the year preceding the grant date.
We have historically made grants of equity-based awards in March, in respect of prior-year performance. In March 2013 we had not yet completed our IPO and were not yet a publicly traded company, and we therefore followed our historical practice of granting equity-based awards in the form of plan shares of ING Group. In 2013, these plan shares were awarded under the ING Group Long-Term Sustainable Performance Plan (“LSPP”). Upon the closing of our IPO in May 2013, 2013 awards granted to our NEOs under the LSPP were converted to ING U.S. awards granted under the Omnibus Plan, at a conversion ratio based on our IPO price of $19.50 per share and ING Group shares valued based upon an average market price over the five trading-day period immediately before our IPO. For equity awards granted in 2014 and subsequent years, we intend to make grants on the date of the first scheduled meeting of our Compensation and Benefits Committee following the publication of our financial results for the preceding year. If such grants are subject to a further approval requirement, as is the case for awards made in 2014 that are subject to the approval of the ING Group Supervisory Board (see “—Approval of Compensation Arrangements by Supervisory Board of ING Group”), then the grant date would be the date of such subsequent approval, although the determination of the price basis for such awards would be the date of the earlier Committee meeting.
Upon conversion of their 2013 LSPP awards to ING U.S. awards, our NEOs received time-vested RSUs issued under the Omnibus Plan that vest over a four-year period, with the first 50% vesting on the second anniversary of the original LSPP grant, and an additional 25% vesting on each of the third and fourth such
-276-
Table of Contents
anniversary. The number of LSPP awards granted to our NEOs in 2013 was based initially on a target award amount, expressed as a percentage of base salary, which was either set forth in their individual employment agreements, or was determined by our board of directors and approved by ING Group, based on reviews of market competitiveness and on individual performance.
The NEOs’ long-term equity awards granted in 2013 were considered for adjustment, either upwards or downwards, from 2012 levels, based on an assessment of individual performance during 2012. Mr. Martin, Mr. Karaoglan, Mr. Steenbergen, Ms. Beams and Mr. Becker received long-term incentive awards in 2013 in the following amounts: Mr. Martin—$1,220,000; Mr. Karaoglan—$825,500; Mr. Steenbergen—$308,238; Ms. Beams—$1,170,000; and Mr. Becker—$600,000. Although these amounts were granted in respect of 2012 performance, because of the rules of the Securities and Exchange Commission governing the presentation of executive compensation in registration statements, such amounts appear in the “—Summary Compensation Table” and other tables below under “—Executive Compensation” as compensation for 2013, because such awards were granted during 2013.
Our equity-based awards granted under the Omnibus Plan are calculated and communicated to our NEOs based on various internal factors and qualifications, and are similar to award measurements used by companies that compete with us for executive talent. These internally communicated amounts do not necessarily reflect the “grant date fair value” of these awards (computed in accordance with FASB ASC Topic 718) which are required to be included in the “—Summary Compensation Table”, below.
For each of our NEOs other than Mr. Martin, target long-term equity awards with respect to 2013 performance were set or reviewed by the Compensation and Benefits Committee during 2013, with reference to the Towers Watson Survey and to the compensation amounts publicly disclosed by the Comparison Group (with respect to Messrs. Karaoglan, and Steenbergen, and Ms. Beams) and the IM Comparison Group (with respect to Mr. Becker). The target long-term equity incentive amounts were considered as one element of our NEOs’ overall total direct compensation opportunity, and, based in part on this review, total direct compensation opportunities were set at or below median total target compensation as reflected in the comparative data. Our NEO target long-term equity incentive amounts for 2013, expressed as a percentage of base salary, were 200% for each of Messrs. Karaoglan and Steenbergen, and for Ms. Beams, and 250% for Mr. Becker. Mr. Martin did not have a specific long-term equity incentive target for 2013.
In 2014, long-term incentive awards to our NEOs were made on the basis of an evaluation of individual performance during 2013, which evaluations are described above under “Step 3” of Annual Incentive Compensation determination process. Based on those evaluations, Mr. Martin, Mr. Karaoglan, Mr. Steenbergen, Ms. Beams and Mr. Becker each received long-term incentive awards in 2014 in the following amounts: Mr. Martin—$4,000,000; Mr. Karaoglan—$1,712,000; Mr. Steenbergen—$1,188,000; Ms. Beams—$1,120,000; and Mr. Becker—$1,437,500. Although these amounts were granted in respect of 2013 performance, because of the rules of the Securities and Exchange Commission governing the presentation of executive compensation in registration statements, such amounts do not appear in the “—Summary Compensation Table” and other tables below under “—Executive Compensation” as compensation for 2013, because such awards were granted during 2014.
Long-term incentive awards were granted to our NEOs in the form of time-vested RSUs issued under the Omnibus Plan that vest over a four-year period, with the first 50% vesting on the second anniversary of the grant date, and an additional 25% vesting on each of the third and fourth such anniversary.
ING Group Equity Awards in Prior Years
Prior to our IPO, all long-term equity-based awards granted to our NEOs and other U.S. employees were granted in plan shares of ING Group. In addition to pre-IPO grants that were made under the LSPP, we previously granted long-term equity-based awards under two other ING Group plans: options were granted under the ING Group Standard Share Option Plan (the “GSOP”) and performance shares and options were granted
-277-
Table of Contents
under the ING Group Long-Term Equity Ownership Plan (the “LEO Plan”). Beginning in March 2011, we granted equity-based awards under the LSPP in the form of performance shares and deferred shares. The Company also granted restricted American Depositary Share (“ADS”) units of ING Group and restricted performance units under the ING America Insurance Holdings, Inc. Equity Compensation Plan (the “Equity Plan”). Some of the NEOs continue to have outstanding awards under the GSOP, the LEO Plan, the LSPP and the Equity Plan, as set forth in the table entitled “—Outstanding Equity Awards Table at 2013 Year End”.
Approval of Compensation Arrangements by Supervisory Board of ING Group
Pursuant to the requirements of the Capital Requirements Directive (“CRD”) of the European Commission, and the related implementing legislation and instruments of the Kingdom of the Netherlands, as a majority-owned subsidiary of ING Group, we are currently required to submit all compensation of “identified staff” for purposes of CRD (which includes all of our NEOs) to the approval of the Supervisory Board of ING Group (“Supervisory Board”). This arrangement, which is also formalized in our Shareholder Agreement with ING Group, is expected to continue to apply until we are no longer subject to CRD.
During the period between our IPO and December 31, 2013, the only such submission to the Supervisory Board relating to the compensation of our NEOs was in respect of changes to the compensation package of Mr. Becker. Such changes were approved by our Compensation and Benefits Committee in October 2013 and subsequently approved by the Supervisory Board. In addition, all annual incentive compensation amounts and long-term equity-based incentive compensation paid or awarded to our NEOs in 2014 in respect of 2013 performance is also subject to Supervisory Board approval.
Health and Insurance Plans
Our NEOs are currently eligible to participate in Company-sponsored benefit programs, offered on the same terms and conditions as those made generally available to all full-time and part-time employees. Basic health, life insurance, disability benefits and similar programs are provided to give employees access to healthcare and income protection for themselves and their family members. The NEOs also have access to a supplemental long-term disability program, facilitated by the Company, generally available to a broad group of highly paid Company employees on an elective basis. The cost of participating in the supplemental disability program is borne entirely by each NEO. Mr. Steenbergen became eligible to participate in these programs in connection with his localization in 2013. See “—Expatriate Arrangements and Localization of Mr. Steenbergen” for more information relating to Mr. Steenbergen’s health and welfare benefits before his localization.
Tax-qualified and Non-qualified Retirement and Other Deferred Compensation Plans
Our NEOs generally are eligible for the same retirement benefits as full-time and part-time employees under the Company’s broad-based, tax-qualified retirement plans. As described further in the narrative description preceding the table entitled “—Pension Benefits in 2013”, below, the Company sponsors the Retirement Plan, a tax-qualified, noncontributory, cash balance formula, defined benefit pension plan for eligible employees. See the narrative below under “Pension Benefits”.
The Company also sponsors the ING U.S. Savings Plan and ESOP (the “401(k) Plan”), a tax-qualified defined contribution plan with an employee stock ownership plan feature. Under the 401(k) Plan, the Company will match 100% of a participant’s contribution up to six percent of eligible compensation.
In addition to the tax-qualified retirement benefits described above, the Company also maintains the ING U.S. Supplemental Executive Retirement Plan (the “SERP”) and the ING U.S. 409A Deferred Compensation Savings Plan (the “DCSP”). The SERP and the DCSP permit our NEOs (including Mr. Steenbergen who became eligible to participate in the DCSP in connection with his localization) and certain other employees whose participation in our tax-qualified plans is limited due to compensation and contribution limits imposed under the Internal Revenue Code (the “Code”), to receive the benefits on a non-qualified basis that they otherwise would
-278-
Table of Contents
have been eligible to receive under the Retirement Plan and the 401(k) Plan if it were not for the compensation and contribution limits set under the Internal Revenue Code. For purposes of determining benefits under the SERP and the DCSP, eligible compensation is limited to three times the Internal Revenue Code compensation limit, which was $255,000 for 2013.
See the narrative description preceding the table entitled “—Pension Benefits in 2013” for more detail of the Retirement Plan and the SERP. See the narrative description preceding the table entitled “—Nonqualified Deferred Compensation Plans Table for 2013” for more detail of the DCSP.
Also, see “—Expatriate Arrangements and Localization of Mr. Steenbergen” for more information relating to Mr. Steenbergen’s retirement benefits.
Perquisites and Other Benefits
During 2013, we provided the NEOs with Company-selected independent advisors to assist them with financial planning, tax and legal issues. In addition, certain of our NEOs have personal use of a company car and driver (principally for commuting purposes), and in certain cases the Company provided travel-related perquisites, including for spousal travel. In addition, our NEOs occasionally have personal use of tickets held by the Company at sporting or entertainment events, at no incremental cost to the Company. See “—All Other Compensation Table for 2013”, below, for additional information concerning perquisites. In addition, see “—Expatriate Arrangements and Localization of Mr. Steenbergen” for more information relating to Mr. Steenbergen’s pre-localization perquisites.
Deal Incentive Awards
Prior to our IPO, we granted certain one-time incentive award opportunities (“Deal Incentive Awards”) to each of the NEOs and to certain other employees to encourage the achievement of ING Group’s and the Company’s goal of successfully executing an initial public offering of the Company’s common stock. The terms and conditions of the Deal Incentive Awards are set forth in award letters or, in the case of Messrs. Martin and Karaoglan, set forth in their respective employment agreement or offer letter. With the exception of the deal incentive awards of Messrs. Martin and Karaoglan, the Deal Incentive Awards were payable in the form of RSUs issued under the Omnibus Plan, one half of which vested during 2013, upon the closing of our IPO and the subsequent expiration of the associated underwriters’ lock-up period applicable to our common stock. The second half of the deal incentive RSUs vested in January 2014.
The Deal Incentive Awards of Mr. Martin and Mr. Karaoglan included a cash payment of $2,000,000 and $666,667, respectively, which became payable upon the completion of our IPO in May 2013, and an equity component consisting of RSUs which vest ratably as ING Group continues to sell its holdings of our common stock. The first such vesting occurred in October 2013. See the narrative descriptions under “—Compensation of Named Executive Officers—Grants of Plan-Based Awards—Deal Incentive Awards” and “—Employment Agreements” for a description of the material terms of the Deal Incentive Awards.
Expatriate Arrangements and Localization of Mr. Steenbergen
Mr. Steenbergen is a citizen of the Netherlands who served in the United States from January 1, 2010 through March 31, 2013 pursuant to a long-term international assignment from ING Group. On April 1, 2013, Mr. Steenbergen was localized and became an employee of the Company. With respect to Mr. Steenbergen’s service as an expatriate, the Company followed the ING Group International Assignments Long-Term Assignment Policy (the “LTAP”), which provides executives on long-term international assignments with additional benefits to ensure they have approximately the same relative spending power in the host country as they would have had in their home country. Under the LTAP, the Company operates a “net pay policy”, to which tax equalization applies. This is designed to ensure that assignees pay no more or less tax than would have been payable if they had remained solely in their home country. Also under the LTAP, Mr. Steenbergen received
-279-
Table of Contents
benefits to compensate him for certain expenses and cost differentials attributable to his expatriate status, as well as amounts to cover the taxes on those benefits. These benefits are described in more detail in the footnotes to the “—Summary Compensation Table” and “—All Other Compensation for 2013” table. Mr. Steenbergen’s expatriate benefits applied only until April 1, 2013, when Mr. Steenbergen was localized.
For the first three months of 2013, Mr. Steenbergen participated in ING Group health care and insurance programs that are generally available to all expatriates on assignment with the Company. He also participated in the ING Directors’ Pension Scheme during that time, the Dutch tax-qualified, contributory defined benefit pension plan in which similarly situated employees of ING Group are eligible to participate. Upon Mr. Steenbergen’s localization on April 1, 2013, his compensation and benefits were aligned with practices for local U.S. employees. See “—Employment Agreements—Employment Agreement of Mr. Steenbergen”.
Critical Compensation and Other Policies
Tax Deductibility of Compensation
Under Section 162(m) of the Internal Revenue Code, a public company generally may not deduct compensation in excess of $1 million paid to its chief executive officer and the three other most highly compensated executive officers (other than the chief financial officer). Until the expiration of the post-IPO transition period provided by the rules and regulations of the Internal Revenue Code, compensation awarded under a pre-IPO plan or arrangement is generally exempt from the deduction limits of Section 162(m), unless such plan or arrangement is materially amended or certain other events occur.
For compensation that is not otherwise exempt from Section 162(m), amounts paid to the aforementioned officers will only be exempt from the deduction limit to the extent that it complies with the conditions set forth in Section 162(m) and the related Treasury regulations, including that such compensation be based on the satisfaction of performance conditions and be submitted for the approval of our stockholders. Currently, we are subject to the CRD Limitations that prohibit us from granting equity incentive awards, including under the Omnibus Plan, that are subject to performance conditions. Nevertheless, our Compensation and Benefits Committee will seek to minimize the impact of Section 162(m), while maintaining overall NEO compensation packages that it deems to be in the interests of the Company and adhering to the requirements of the CRD Limitations for as long as they are applicable to us. See “—Capital Requirements Directive”. The Company reserves the right to pay in the future compensation that is not exempt from the deduction limit, when it deems such compensation to be in the interests of the Company.
Under Section 162(m)(6) of the Internal Revenue Code, which was introduced as part of the 2010 Affordable Care Act, certain health insurance providers cannot deduct compensation for any employees in excess of $500,000. The Company has determined that it is not subject to Section 162(m)(6) for calendar years 2010 through 2013. The Department of the Treasury issued proposed regulations under Section 162(m)(6) in 2013, but those regulations have not been finalized. The Company is continuing to monitor this issue and will determine whether the Section 162(m)(6) limitations will apply in the future based on that guidance. To the extent that the Company is subject to any of these limits on deductibility of compensation, the Company reserves the right to approve non-deductible compensation.
Compensation Recoupment Policies
Certain elements of our NEOs’ compensation packages are subject to recoupment or being “clawed back” or “held back” under certain circumstances. Under both the CRD policies described below (which became applicable to the Company on January 1, 2012) and the terms of the LSPP (pursuant to which both performance plan shares and deferred plan shares of ING Group have been granted), ING Group has the right to claw back awards previously settled with or paid to our NEOs, or hold back awards previously made to our NEOs that have not yet vested if (i) activities conducted under the responsibility of the NEO, including fraud or malfeasance, led to a material restatement of ING Group’s or the Company’s annual accounts or resulted in significant
-280-
Table of Contents
reputational harm to ING Group or any of its subsidiaries or affiliates, (ii) the Company undergoes significant adverse changes in its economic and regulatory capital base or (iii) the Company or one of its business lines suffers a significant failure in risk management. Grants of Company RSUs to the NEOs made pursuant to the Omnibus Plan are subject to similar clawback provisions in respect of the Company.
Capital Requirements Directive
The European Commission’s CRD affects compensation disclosures and practices in financial services companies, which all EU member states are required to implement and enforce. One objective of CRD is to ensure that the total compensation and mix of fixed to variable compensation paid to key “Identified Staff” are consistent with CRD, as implemented by each EU nation and in alignment with the companies’ risk management practices and policies. Other objectives of CRD include the incorporation of recoupment or “clawback” provisions into compensation programs in which our NEOs participate, and the maintenance of an adequate capital base by the institutions subject to CRD. These policies provide for the Company to make adjustments to reduce current or prior year variable compensation based on significant changes in the Company’s risk profile. In the Netherlands, the Dutch National Bank oversees the implementation of and compliance with CRD.
CRD has already been widely implemented across ING Group’s Europe-based financial services businesses. Under ING Group’s agreement with the DNB, since January 1, 2012 the CRD requirements have applied to certain Company employees, referred to as “Control Function” employees and “Identified Staff”. Control Function employees include the heads of the corporate audit services, finance, human resources, compliance, risk management and legal departments and individuals they supervise, in each case, who may have a material impact on the Company’s risk profile. Identified Staff, who may also be Control Function employees, include employees who may have a material impact on the Company’s risk profile. Performance metrics for Control Function employees generally may not be directly linked to financial objectives related to their departments and variable-to-fixed pay may not exceed certain ratios.
Under CRD as it applied for 2013 compensation, the compensation packages of Identified Staff were subject to specified parameters, including that (i) variable-to-fixed pay may not exceed certain ratios, and (ii) variable pay must be composed of at least 50% long-term incentives for Identified Staff (other than those in Investment Management) and must be composed of at least 30% long-term incentives for those Identified Staff in Investment Management.
For 2013, the Company had approximately 40 “Identified Staff”, including all of the NEOs, whose total compensation packages were required to conform with CRD.
Relationship of Compensation Policies and Practices to Risk Management
The Company adheres to compensation policies and practices that are designed to support a strong risk management culture. We have reviewed the Company’s compensation programs, policies and practices for employees and have determined that those programs, policies and practices are not reasonably likely to have a material adverse effect on the Company.
-281-
Table of Contents
Compensation of Named Executive Officers
Summary Compensation Table
The following table presents the cash and other compensation for our NEOs for 2013, 2012 and 2011.
Summary Compensation Table
| Name and Principal Position |
Year | Salary(1) | Bonus(2) | Stock Awards(3) |
Non-Equity Incentive Plan Compensation(4) |
Change in Pension Value and Nonqualified Deferred Compensation Earnings(5) |
All
Other Compensation(6) |
Total | ||||||||||||||||||||||||
| Rodney O. Martin, Jr., CEO |
2013 | $ | 1,000,000 | $ | — | $ | 7,598,688 | (7) | $ | 3,185,711 | $ | 29,903 | $ | 67,868 | $ | 11,882,170 | ||||||||||||||||
|
|
2012 2011 |
|
$ $ |
1,000,000 746,212 |
|
$ $ |
— — |
|
$ $ |
923,129 — |
|
$ $ |
816,116 585,536 |
|
$ $ |
30,209 — |
|
$ $ |
58,780 84,231 |
|
$ $ |
2,828,234 1,415,979 |
| |||||||||
| Alain M. Karaoglan, EVP & COO |
2013 | $ | 700,000 | $ | — | $ | 2,961,939 | (7) | $ | 1,552,378 | $ | 23,828 | $ | 62,395 | $ | 5,300,540 | ||||||||||||||||
|
|
2012 2011 |
|
$ $ |
650,000 452,292 |
|
$ $ |
— — |
|
$ $ |
923,129 381,980 |
|
$ $ |
593,866 585,536 |
|
$ $ |
28,809 — |
|
$ $ |
59,529 28,188 |
|
$ $ |
2,255,333 1,447,996 |
| |||||||||
| Ewout L. Steenbergen, EVP & CFO |
2013 | $ | 605,768 | $ | — | $ | 1,081,229 | $ | 735,711 | $ | 94,001 | $ | 637,818 | $ | 3,154,527 | |||||||||||||||||
|
|
2012 2011 |
|
$ $ |
498,861 438,139 |
|
$ $ |
— 164,128 |
|
$ $ |
314,575 235,236 |
|
$ $ |
281,032 267,933 |
|
$ $ |
820,688 172,514 |
|
$ $ |
680,376 796,113 |
|
$ $ |
2,595,532 2,074,063 |
| |||||||||
| Maliz E. Beams, CEO, Retirement Solutions |
2013 | $ | 679,167 | $ | — | $ | 2,852,755 | $ | 745,711 | $ | 27,493 | $ | 64,881 | $ | 4,370,007 | |||||||||||||||||
| 2012 | $ | 600,000 | $ | — | $ | 772,227 | $ | 766,116 | $ | 29,628 | $ | 57,723 | $ | 2,225,694 | ||||||||||||||||||
| Jeffrey T. Becker, CEO Investment Management |
2013 | $ | 422,538 | $ | — | $ | 1,596,793 | $ | 1,048,211 | $ | 0 | $ | 62,168 | $ | 3,129,710 | |||||||||||||||||
|
|
2012 2011 |
|
$ $ |
391,667 350,000 |
|
$ $ |
216,690 198,367 |
|
$ $ |
856,429 959,285 |
|
$ $ |
681,116 695,536 |
|
$ $ |
293,510 235,762 |
|
$ $ |
58,809 51,975 |
|
$ $ |
2,498,221 2,490,925 |
| |||||||||
| (1) | Amounts in this column represent salary that was actually paid to each NEO during the listed calendar year. Mr. Steenbergen’s salary comprises three elements: (i) his net pay under the LTAP for periods prior to April 1, 2013; (ii) tax equalization payments for periods prior to April 1, 2013 (amounting to $54,739, $163,787 and $149,780 in 2013, 2012 and 2011, respectively); and (iii) regular base salary for periods after Mr. Steenbergen’s localization on April 1, 2013. See “—2013 Compensation—Expatriate Arrangements and Localization of Mr. Steenbergen,” above. |
| (2) | Amounts in this column reflect the portions of a cash retention award that became vested and were paid in September 2011 and (in the case of Mr. Becker) September 2012. |
| (3) | Amounts in this column include the grant date fair value calculated in accordance with FASB ASC Topic 718 of: (i) for 2013, time-vested awards granted to the NEOs under the LSPP and Equity Plan and subsequently converted to RSUs under the Omnibus Plan at the time of our IPO, including a component representing the portion of each NEO’s annual incentive that was subject to automatic deferment, and in each case in respect of 2012 performance; (ii) for 2012 and 2011, time-vested awards granted to the NEOs under the LSPP and the Equity Plan and subsequently converted to RSUs under the Omnibus Plan at the time of our IPO, including a component representing the portion of each NEO’s annual incentive that was subject to automatic deferment, and in respect of 2011 and 2010 performance, respectively; and (iii) Deal Incentive Awards that were awarded in the form of time-vested RSUs. |
| (4) | Amounts in this column include, for Mr. Martin and Mr. Karaoglan, $2,000,000 and $666,667, respectively, reflecting the cash portion of their Deal Incentive Awards that became payable upon the completion of our IPO in May 2013. Amounts in this column for all NEOs include the cash portion of the annual incentive awarded for prior-year performance. An additional portion of each award made for 2013 performance (and granted in 2014) has been deferred in the form of time-vested RSUs issued under the Omnibus Plan, which vest between 2015 and 2017. Pursuant to SEC rules, the value of such RSUs is not included in this table because they were not awarded during the 2013 calendar year. |
| (5) | Amounts in this column represent the net changes in actuarial present value under the Retirement Plan and the SERP (and, with respect to Mr. Steenbergen, the Directors’ Pension Plan). See the “—Pension Benefits in 2013” table below for more detail. Approximately 82% ($693,405) of the change in the present value of the accumulated pension benefit of Mr. Steenbergen from December 31, 2011 to December 31, 2012 is due solely to the change in the discount rate from 5.50% to 3.70%. |
| (6) | Amounts in this column for Mr. Steenbergen include a market value payment of $400,000 pursuant to terms of Mr. Steenbergen’s localization in April 2013 and certain amounts payable prior to his localization in accordance with the LTAP. See “—2013 Compensation—Expatriate Arrangements and Localization of Mr. Steenbergen,” above. All amounts in this column are described in more detail in the table below entitled “—All Other Compensation Table for 2013”. |
| (7) | This amount includes the effect of revaluing the Deal Incentive Awards granted to Messrs. Martin and Karaoglan in July 2013, upon the extension of the latest vesting date applicable to such awards, in order to reflect the terms of the 2012 Restructuring Plan of ING Group. See “Summary—ING Group Restructuring Plan with European Commission”. Deal Incentive Awards for all other NEOs have been valued at the price to the public in our IPO, because no change was made to the terms of such awards. If valued at the date of the IPO, the grant date fair value of stock awards to Messrs. Martin and Karaoglan during 2013 would have been lower by $2,159,998 and $719,999, for aggregate grant date fair values of $5,438,690 and $2,241,940, respectively. As of December 31, 2013, 40,448 and 13,483 of the RSUs awarded to Mr. Martin and Mr. Karaoglan, respectively, in respect of Deal Incentive Awards, having a grant date fair value of $1,214,653 and $404,894, had vested. |
-282-
Table of Contents
All Other Compensation Table for 2013
| Name |
401(k) Employer Match(1) |
DCSP Employer Match(2) |
Financial Tax Services(3) |
Gross- Ups(4) |
Other(5) | Total | ||||||||||||||||||
| Rodney O. Martin, Jr. |
$ | 15,600 | $ | 30,600 | $ | 15,968 | $ | 2,585 | $ | 3,114 | $ | 67,868 | ||||||||||||
| Alain M. Karaoglan |
$ | 15,600 | $ | 30,600 | $ | 15,968 | $ | — | $ | 227 | $ | 62,395 | ||||||||||||
| Ewout L. Steenbergen |
$ | 15,300 | $ | 9,450 | $ | — | $ | 85,897 | $ | 527,171 | $ | 637,818 | ||||||||||||
| Maliz E. Beams |
$ | 9,200 | $ | 36,700 | $ | 15,968 | $ | — | $ | 3,013 | $ | 64,881 | ||||||||||||
| Jeffrey T. Becker |
$ | 15,600 | $ | 30,600 | $ | 15,968 | $ | — | $ | — | $ | 62,168 | ||||||||||||
| (1) | See the narrative under “—Retirement and Other Deferred Compensation Plans” for a description of the material terms of the 401(k) Plan. For Messrs. Martin, Karaoglan and Becker, this amount includes $300 correction payment with respect to the prior year. |
| (2) | See the narrative under “—Retirement and Other Deferred Compensation Plans” for a description of the material terms of the DCSP. |
| (3) | Amounts in this column represent the amounts actually paid by the Company, on behalf of each NEO, to the Company-selected financial advisor in 2013. |
| (4) | The Company provided tax gross-ups to Mr. Steenbergen in accordance with the LTAP for periods prior to Mr. Steenbergen’s localization on April 1, 2013. These include reimbursements for taxes associated with his housing allowance ($45,878); his home leave allowance ($14,815); tuition and other educational expenses for his children ($24,437); and long-term incentive vesting ($768). |
| (5) | The amount in this column for Mr. Steenbergen includes (i) a market value allowance of $400,000 paid in connection with Mr. Steenbergen’s localization in April 2013, (ii) a tax protection payment pursuant to the LTAP of $32,665 in respect of the exercise of options during 2013 and (iii) the sum of the expatriate benefits provided to Mr. Steenbergen under the LTAP prior to his localization. These include a housing allowance ($45,000), tuition and other educational and related expenses for his children ($24,300), and home leave allowance covering the cost of travel for Mr. Steenbergen and his family to travel to the Netherlands ($16,699). For more detail, see the narrative description under “—2013 Compensation—Expatriate Arrangements and Localization of Mr. Steenbergen,” above. |
Amounts in this column also include the following perquisites: (i) for Mr. Martin, Mr. Karaoglan and Mr. Steenbergen, the expense to the Company associated with the respective NEO’s personal use of a Company car and driver, the amount of which has been calculated based on an allocation of the total cost associated with the car and driver between business and personal usage, based on total miles driven; and (ii) for Mr. Martin and Ms. Beams, incremental expenses associated with travel perquisites, including for spousal travel. Personal usage of the car and driver was principally for commuting purposes. In addition, during 2013, several of our NEOs had personal use of tickets held by the Company to sporting and entertainment events, at no incremental expense to the Company.
-283-
Table of Contents
Grants of Plan-Based Awards
The table below presents individual grants of awards made to each NEO during 2013.
Grants of Plan-Based Awards Table for 2013
| Name |
Grant Type |
Grant Date(1) |
Estimated Future Payouts Under Non-Equity Incentive Plan Awards |
Estimated Future Payouts Under Equity Incentive Plan Awards |
Number of Other Stock Awards |
Grant Date Fair Value of Stock Awards(2) |
||||||||||||||||||||||||||||
| Threshold | Target | Maximum | Threshold Number of Shares |
Target Number of Shares |
Maximum Number of Shares |
|||||||||||||||||||||||||||||
| Rodney O. Martin, Jr. |
Omnibus Plan—Converted LSPP Long-Term Incentive Shares | 5/7/2013 | — | 56,482 | 56,482 | $ | 1,048,588 | |||||||||||||||||||||||||||
| Omnibus Plan—Converted LSPP Deferred Shares (Mandatory Deferral of portion of Annual ICP Award) | 5/7/2013 | — | 21,013 | 21,013 | $ | 390,106 | ||||||||||||||||||||||||||||
| Deal Incentive Award(3) | 7/25/2013 | 205,128 | 205,128 | $ | 6,159,994 | |||||||||||||||||||||||||||||
| Annual Incentive Plan | $ | 1,000,000 | $ | 2,000,000 | ||||||||||||||||||||||||||||||
| Alain M. Karaoglan |
Omnibus Plan—Converted LSPP Long-Term Incentive Shares | 5/7/2013 | — | 38,218 | 38,218 | $ | 709,517 | |||||||||||||||||||||||||||
| Omnibus Plan—Converted LSPP Deferred Shares (Mandatory Deferral of portion of Annual ICP Award) | 5/7/2013 | — | 10,724 | 10,724 | $ | 199,091 | ||||||||||||||||||||||||||||
| Deal Incentive Award(3) | 7/25/2013 | 68,376 | 68,376 | $ | 2,053,331 | |||||||||||||||||||||||||||||
| Annual Incentive Plan | $ | 700,000 | $ | 1,400,000 | ||||||||||||||||||||||||||||||
| Ewout L. Steenbergen |
Omnibus Plan—Converted LSPP Long-Term Incentive Shares | 5/7/2013 | — | 14,270 | 14,270 | $ | 264,922 | |||||||||||||||||||||||||||
| Omnibus Plan—Converted LSPP Deferred Shares (Mandatory Deferral of portion of Annual ICP Award) | 5/7/2013 | — | 878 | 878 | $ | 16,300 | ||||||||||||||||||||||||||||
| Deal Incentive Award(3) | 5/7/2013 | 41,026 | 41,026 | $ | 800,007 | |||||||||||||||||||||||||||||
| Annual Incentive Plan | $ | 550,000 | $ | 1,100,000 | ||||||||||||||||||||||||||||||
| Maliz E. Beams |
Omnibus Plan—Converted LSPP Long-Term Incentive Shares | 5/7/2013 | — | 54,167 | 54,167 | $ | 1,005,610 | |||||||||||||||||||||||||||
| Omnibus Plan—Converted LSPP Deferred Shares (Mandatory Deferral of portion of Annual ICP Award) | 5/7/2013 | — | 18,699 | 18,699 | $ | 347,147 | ||||||||||||||||||||||||||||
| Deal Incentive Award(3) | 5/7/2013 | 76,923 | 76,923 | $ | 1,499,999 | |||||||||||||||||||||||||||||
| Annual Incentive Plan | $ | 700,000 | $ | 1,400,000 | ||||||||||||||||||||||||||||||
-284-
Table of Contents
| Name |
Grant Type |
Grant Date(1) |
Estimated Future Payouts Under Non-Equity Incentive Plan Awards |
Estimated Future Payouts Under Equity Incentive Plan Awards |
Number of Other Stock Awards |
Grant Date Fair Value of Stock Awards(2) |
||||||||||||||||||||||||||||||
| Threshold | Target | Maximum | Threshold Number of Shares |
Target Number of Shares |
Maximum Number of Shares |
|||||||||||||||||||||||||||||||
| Jeffery T. Becker |
Omnibus Plan—Converted LSPP Long-Term Incentive Shares(4) | 5/7/2013 | — | 13,899 | 13,899 | $ | 257,849 | |||||||||||||||||||||||||||||
| Omnibus Plan—Converted LSPP Deferred Shares (Mandatory Deferral of portion of Annual ICP Award) | 5/7/2013 | — | 14,763 | 14,763 | $ | 274,075 | ||||||||||||||||||||||||||||||
| Converted ADS Units(4) | 5/7/2013 | — | — | 14,126 | $ | 264,863 | ||||||||||||||||||||||||||||||
| Deal Incentive Award(3) | 5/7/2013 | — | 41,026 | 41,026 | $ | 800,007 | ||||||||||||||||||||||||||||||
| Annual Incentive Plan | $ | 1,437,500 | $ | 2,875,000 | ||||||||||||||||||||||||||||||||
| (1) | Grant date is based upon the date of grant of converted awards under the Omnibus Plan, not that of the original award that was subject to conversion. For Messrs. Martin and Karaoglan, the grant date of their respective Deal Incentive Awards is the date upon which such awards were revalued for accounting purposes in July 2013, upon the extension of the latest vesting date applicable to such awards, in order to reflect the terms of the 2012 Restructuring Plan of ING Group. See “Summary—ING Group Restructuring Plan with European Commission”. Deal Incentive Awards for all other NEOs have a grant date of May 7, 2013, the date we completed our IPO. |
| (2) | Amounts in this column represent the grant date fair value calculated in accordance with FASB ASC Topic 718. |
| (3) | See “—Deal Incentive Awards”, above. For Deal Incentive Awards granted to Messrs. Martin and Karaoglan, the grant date and the grant date fair value provided in the table reflects the revaluation of such Deal Incentive Awards for accounting purposes in July 2013, upon the extension of the latest vesting date applicable to the Deal Incentive Awards held by Messrs. Martin and Karaoglan, in order to reflect the terms of the 2012 Restructuring Plan of ING Group. See “Summary—ING Group Restructuring Plan with European Commission”. Deal Incentive Awards for all other NEOs have a grant date of May 7, 2013, the date we completed our IPO and have been valued at the price to the public in our IPO, because no change was subsequently made to the terms of such awards. If valued at the date of the IPO, the grant date fair value of the Deal Incentive Awards of Messrs. Martin and Karaoglan would have been $3,999,996 and $1,333,332, respectively. As of December 31, 2013, 40,448 and 13,483 of the RSUs awarded to Mr. Martin and Mr. Karaoglan, respectively, in respect of Deal Incentive Awards, having a grant date fair value of $1,214,653 and $404,894, had vested. |
| (4) | Fifty percent of Mr. Becker’s long-term incentive award was comprised of awards granted under the LSPP and subsequently converted to Omnibus Plan RSUs, and the remaining 50% was granted in the form of restricted ADS units granted under the Equity Plan and subsequently converted to Omnibus Plan RSUs. |
-285-
Table of Contents
Outstanding Equity Awards at Year End
The table below provides information concerning unexercised options and stock and stock-based awards that have not vested for each NEO outstanding as of December 31, 2013.
Outstanding Equity Awards Table at 2013 Year End
| Option Awards | Stock Awards | |||||||||||||||||||||||||||||||
| Name |
Number of Securities Underlying Unexercised Options Exercisable |
Number of Securities Underlying Unexercised Options Unexercisable |
Equity Incentive Plan Awards: Number of Securities Underlying Unexercised Unearned Options |
Option Exercise Price |
Option Expiration Date |
Number of Shares or Units of Stock That Have Not Vested |
Market Value of Shares or Units of Stock That Have Not Vested(1) |
Equity Incentive Plan Awards: Number of Unearned Shares, Units or Other Rights That Have Not Vested |
Equity Incentive Plan Awards: Market or Payout Value of Unearned Shares, Units or Other Rights That Have Not Vested(1) |
|||||||||||||||||||||||
| Rodney O. Martin, Jr. |
||||||||||||||||||||||||||||||||
| 56,396 | (2) | $ | 790,108 | |||||||||||||||||||||||||||||
| 14,061 | (3) | $ | 196,995 | |||||||||||||||||||||||||||||
| 56,482 | (4) | $ | 1,985,342 | |||||||||||||||||||||||||||||
| 21,013 | (4) | $ | 738,607 | |||||||||||||||||||||||||||||
| 164,680 | (5) | $ | 5,788,502 | |||||||||||||||||||||||||||||
| Alain M. Karaoglan |
||||||||||||||||||||||||||||||||
| 18,038 | (6) | $ | 252,712 | |||||||||||||||||||||||||||||
| 56,396 | (2) | $ | 790,108 | |||||||||||||||||||||||||||||
| 14,061 | (3) | $ | 196,995 | |||||||||||||||||||||||||||||
| 38,218 | (4) | $ | 1,343,363 | |||||||||||||||||||||||||||||
| 10,724 | (4) | $ | 376,949 | |||||||||||||||||||||||||||||
| 54,893 | (5) | $ | 1,929,489 | |||||||||||||||||||||||||||||
| Ewout L. Steenbergen |
||||||||||||||||||||||||||||||||
| 2,051 | (7) | € | 14.37 | 3/15/2014 | ||||||||||||||||||||||||||||
| 5,730 | € | 17.88 | 3/30/2015 | |||||||||||||||||||||||||||||
| 4,860 | € | 25.16 | 3/23/2016 | |||||||||||||||||||||||||||||
| 8,339 | € | 24.72 | 3/22/2017 | |||||||||||||||||||||||||||||
| 11,447 | € | 16.66 | 3/13/2018 | |||||||||||||||||||||||||||||
| 13,918 | € | 7.35 | 3/17/2020 | |||||||||||||||||||||||||||||
| 5,732 | (8) | $ | 80,305 | |||||||||||||||||||||||||||||
| 487 | (9) | $ | 6,823 | |||||||||||||||||||||||||||||
| 21,691 | (2) | $ | 303,891 | |||||||||||||||||||||||||||||
| 2,319 | (3) | $ | 32,489 | |||||||||||||||||||||||||||||
| 14,270 | (4) | $ | 501,591 | |||||||||||||||||||||||||||||
| 878 | (4) | $ | 30,862 | |||||||||||||||||||||||||||||
| 20,513 | (10) | $ | 721,032 | |||||||||||||||||||||||||||||
| Maliz E. Beams |
||||||||||||||||||||||||||||||||
| 20,813 | (6) | $ | 291,590 | |||||||||||||||||||||||||||||
| 54,227 | (2) | $ | 759,720 | |||||||||||||||||||||||||||||
| 4,712 | (3) | $ | 66,015 | |||||||||||||||||||||||||||||
| 54,167 | (4) | $ | 1,903,970 | |||||||||||||||||||||||||||||
| 18,699 | (4) | $ | 657,270 | |||||||||||||||||||||||||||||
| 38,462 | (10) | $ | 1,351,939 | |||||||||||||||||||||||||||||
-286-
Table of Contents
| Option Awards | Stock Awards | |||||||||||||||||||||||||||||||
| Name |
Number of Securities Underlying Unexercised Options Exercisable |
Number of Securities Underlying Unexercised Options Unexercisable |
Equity Incentive Plan Awards: Number of Securities Underlying Unexercised Unearned Options |
Option Exercise Price |
Option Expiration Date |
Number of Shares or Units of Stock That Have Not Vested |
Market Value of Shares or Units of Stock That Have Not Vested(1) |
Equity Incentive Plan Awards: Number of Unearned Shares, Units or Other Rights That Have Not Vested |
Equity Incentive Plan Awards: Market or Payout Value of Unearned Shares, Units or Other Rights That Have Not Vested(1) |
|||||||||||||||||||||||
| Jeffrey T. Becker |
||||||||||||||||||||||||||||||||
| 7,814 | (7) | € | 14.37 | 3/15/2014 | ||||||||||||||||||||||||||||
| 10,816 | € | 17.88 | 3/30/2015 | |||||||||||||||||||||||||||||
| 8,479 | € | 25.16 | 3/23/2016 | |||||||||||||||||||||||||||||
| 7,124 | € | 24.72 | 3/22/2017 | |||||||||||||||||||||||||||||
| 13,829 | € | 16.66 | 3/13/2018 | |||||||||||||||||||||||||||||
| 6,939 | (8) | $ | 97,215 | |||||||||||||||||||||||||||||
| 9,068 | (9) | $ | 127,043 | |||||||||||||||||||||||||||||
| 27,479 | (11) | $ | 384,981 | |||||||||||||||||||||||||||||
| 21,691 | (2) | $ | 303,891 | |||||||||||||||||||||||||||||
| 22,014 | (3) | $ | 308,416 | |||||||||||||||||||||||||||||
| 32,380 | (12) | $ | 453,644 | |||||||||||||||||||||||||||||
| 13,889 | (4) | $ | 488,198 | |||||||||||||||||||||||||||||
| 14,763 | (4) | $ | 518,919 | |||||||||||||||||||||||||||||
| 14,126 | (13) | $ | 496,529 | |||||||||||||||||||||||||||||
| 20,513 | (10) | $ | 721,032 | |||||||||||||||||||||||||||||
| (1) | The market value of ING U.S., Inc. equity awards was determined by multiplying $35.15, the closing price of a share of ING U.S., Inc. common stock, as reported by the NYSE, on December 31, 2013, by the number of shares or units; and the market value of ING Group equity awards was determined by multiplying $14.01, the closing price per ADS of ING Group ADS, as reported by the NYSE on December 31, 2013, by the number of shares or units. |
| (2) | Represents performance shares of ING Group. One half of such shares are scheduled to vest on March 28, 2014 and the remaining shares are scheduled to vest on March 28, 2015, based on the achievement of performance metrics that are determined prior to each vesting cycle. |
| (3) | Represents deferred shares of ING Group. One-half of such shares are scheduled to vest on March 28, 2014 and the remaining shares are scheduled to vest on March 28, 2015. |
| (4) | Represents RSUs of ING U.S., Inc. One-half of such RSUs are scheduled to vest on March 27, 2015 and the remaining half is scheduled to vest in equal amounts on March 27, 2016 and March 27, 2017. |
| (5) | Represents RSUs of ING U.S., Inc. awarded as deal incentive awards, which vest proportionately to the continued sell-down by ING Group of ING U.S., Inc., common stock. |
| (6) | Represents performance shares of ING Group that are scheduled to vest on September 7, 2014, based on the achievement of performance metrics that are determined prior to each vesting cycle. |
| (7) | Option expires on March 15, 2014. |
| (8) | Represents performance shares of ING Group that vested on March 30, 2014, based on the achievement of performance metrics that are determined prior to each vesting cycle. |
| (9) | Represents deferred shares of ING Group that vested on March 30, 2014. |
| (10) | Represents RSUs of ING U.S., Inc. awarded as deal incentive awards, and which vested on January 22, 2014. |
| (11) | Represents ADS of ING Group issued under the Equity Plan that vested on January 1, 2014. |
| (12) | Represents ADS of ING Group issued under the Equity Plan that are scheduled to vest on January 1, 2015. |
| (13) | Represents RSUs of ING U.S., Inc. that are scheduled to vest on January 1, 2016. |
Equity-based awards of ING Group granted in 2012 and 2011 were made under the LSPP and the Equity Plan and awards made in years before 2011 were made under the GSOP, the LEO Plan and the Equity Plan. All options shown on the table above are options to acquire ordinary shares of ING Group and were issued under the GSOP and LEO plans.
-287-
Table of Contents
Option Exercises and Stock Vested in 2013
The following table provides information regarding all of the RSUs, deferred shares and performance shares held by the NEOs that vested during 2013 and options that were exercised by NEOs during 2013. This table includes vesting of both ING U.S. equity awards and ING Group equity awards. All option exercises were in respect of ING Group equity awards.
Option Exercises and Stock Vested Table for 2013
| Option Awards | Stock Awards | |||||||||||||||
| Name |
Number of Shares Acquired on Exercise |
Value Realized
on Exercise |
Number of Shares Acquired on Vesting |
Value Realized on Vesting |
||||||||||||
| Rodney O. Martin |
28,197 | $ | 304,921 | (1) | ||||||||||||
| 7,030 | $ | 50,681 | (2) | |||||||||||||
| 40,448 | $ | 1,399,905 | (3) | |||||||||||||
| Alain M. Karaoglan |
28,197 | $ | 304,921 | (1) | ||||||||||||
| 7,030 | $ | 50,681 | (2) | |||||||||||||
| 18,038 | $ | 300,943 | (4) | |||||||||||||
| 13,483 | $ | 466,647 | (3) | |||||||||||||
| Ewout L. Steenbergen |
5,459 | $ | 57,727 | (5) | ||||||||||||
| 10,845 | $ | 117,280 | (1) | |||||||||||||
| 1,159 | $ | 8,355 | (2) | |||||||||||||
| 5,730 | $ | 61,250 | (4) | |||||||||||||
| 485 | $ | 3,456 | (6) | |||||||||||||
| 15,239 | $ | 108,596 | (7) | |||||||||||||
| 15,289 | $ | 84,145 | (8) | |||||||||||||
| 20,513 | $ | 709,955 | (3) | |||||||||||||
| Maliz E. Beams |
27,113 | $ | 293,499 | (1) | ||||||||||||
| 2,356 | $ | 16,985 | (2) | |||||||||||||
| 20,813 | $ | 347,246 | (4) | |||||||||||||
| 38,461 | $ | 1,331,135 | (3) | |||||||||||||
| Jeffrey T. Becker |
33,716 | $ | 317,942 | (9) | ||||||||||||
| 10,343 | $ | 109,379 | (5) | |||||||||||||
| 10,845 | $ | 117,280 | (1) | |||||||||||||
| 11,006 | $ | 79,345 | (2) | |||||||||||||
| 6,937 | $ | 74,155 | (4) | |||||||||||||
| 9,066 | $ | 64,606 | (6) | |||||||||||||
| 21,635 | $ | 154,175 | (7) | |||||||||||||
| 9,996 | $ | 90,608 | (8) | |||||||||||||
| 26,374 | $ | 77,180 | (8) | |||||||||||||
| 20,513 | $ | 709,955 | (3) | |||||||||||||
| (1) | Represents vesting of a portion of an ING Group performance share award granted under the LSPP during 2012. |
| (2) | Represents vesting of a portion of an ING Group deferred share award granted under the LSPP during 2012 in respect of the deferred portion of annual incentive awards. |
| (3) | Represents vesting of a portion of an ING U.S. deal incentive RSU award granted under the Omnibus Plan. |
| (4) | Represents vesting of a portion of an ING Group performance share award granted under the LSPP during 2011. |
| (5) | Represents vesting of a portion of an ING Group performance share award granted under the LEO Plan during 2010. |
-288-
Table of Contents
| (6) | Represents vesting of a portion of an ING Group deferred share award granted under the LSPP during 2011. |
| (7) | Represents vesting of a portion of an ING Group deferred share award granted under the LEO Plan during 2010. |
| (8) | Represents exercise of an option to acquire ING Group ordinary shares. |
| (9) | Represents vesting of a portion of ING Group equity awards granted under the Equity Plan during 2010. |
Pension Benefits
As described above under “—2013 Compensation—Tax-qualified and Non-qualified Retirement and Other Deferred Compensation Plans,” the Company maintains tax-qualified and nonqualified defined benefit (pension) plans that provide retirement benefits for employees whose length of service allows them to vest in and receive these benefits. During 2013, regular full-time and part-time employees of the Company who were hired before January 1, 2009 and completed one year of service were covered by the Retirement Plan. Certain highly compensated employees who participate in the Retirement Plan whose benefits cannot be paid from the Retirement Plan as a result of tax limitations and who are designated by the Company are also eligible to participate in the SERP.
The benefit under the Retirement Plan for employees who participated prior to January 1, 2009 is currently calculated using a final average pay pension formula based on the employee’s average compensation for the highest five consecutive whole calendar years of benefit service earned during a period ranging from 10 to 20 years preceding the date of retirement. Eligible compensation generally includes base salary, annual incentive award and commissions, if applicable. The SERP benefit is equal to the difference between (a) the participant’s retirement benefit before taking into account the tax limitations on eligible compensation and other compensation deferrals and (b) the participant’s actual retirement benefit paid from the Retirement Plan. Pension benefits under the Retirement Plan and SERP are generally payable in the form of a monthly annuity, though certain benefits under the Retirement Plan may be received as a lump-sum or partial lump-sum payment.
A participant’s retirement benefits under the Retirement Plan and the SERP vest in full upon completion of three years of vesting service, when the participant reaches age 65 or if the participant dies while in active service with the Company. Participants may begin receiving full retirement benefits at age 65 and may be eligible for reduced benefits if retiring at an earlier age with a minimum of three years of vesting service. As of December 31, 2013, Messrs. Martin and Karaoglan, and Ms. Beams, were each eligible for early retirement under the Retirement Plan. Benefits under the SERP may be forfeited at the discretion of the Company if the participant engages in unauthorized competition with the Company, is discharged for cause, or performs acts of willful malfeasance or gross negligence in a matter of material importance to the Company. The Retirement Plan and the SERP were closed to new participants effective January 1, 2009.
Beginning January 1, 2012, all ING U.S. employees transitioned to a new cash balance pension formula under the Retirement Plan. A similar change to the SERP was also made. The cash balance pension formula credits 4% of eligible compensation to a hypothetical account in the Retirement Plan and SERP, as applicable, each month. Account balances receive a monthly interest credit based on a 30-year Treasury bond rate published by the IRS in the preceding August of each year (for 2013 that rate was 2.77%). Participants in the Retirement Plan and SERP prior to January 1, 2012, including Mr. Becker, transitioned to the new cash balance pension formula during the two-year period ending December 31, 2013. Benefits that accrued during the transition period have been determined based on the prior final average pay pension formula or the new cash balance pension formula, whichever is greater. Pension benefits that accrue after the transition period will be solely based on the new cash balance pension formula. Because they began employment after December 31, 2008, the benefits of Messrs. Martin and Karaoglan, and Ms. Beams, will be determined based solely on the new cash balance pension formula.
Prior to April 1, 2013, Mr. Steenbergen participated in the ING Group Directors’ Pension Scheme (the “Directors’ Pension Plan”), to which a percentage of his base salary was automatically contributed. The benefit
-289-
Table of Contents
under the Directors’ Pension Plan is calculated based on the participant’s years of service and fixed annual salary (adjusted annually). Members of the Directors’ Pension Plan may begin receiving full retirement benefits at age 65 and may be eligible for reduced benefits if retiring at an earlier age. Beginning April 1, 2013, in connection with his localization, pension benefits for Mr. Steenbergen were determined based solely on the new cash balance pension formula under the Retirement Plan.
The following table presents the accumulated benefits under the Company pension plans in which each NEO participates.
Pension Benefits in 2013
| Name |
Plan Name | Number Years
Credit Service |
Present Value
of Accumulated Benefit |
Payments
During 2013 |
||||||||||
| Rodney O. Martin, Jr. |
Retirement Plan | 2 | $ | 20,074 | $ | 0 | ||||||||
| SERP | 2 | $ | 40,041 | $ | 0 | |||||||||
| Alain M. Karaoglan |
Retirement Plan | 2 | $ | 17,566 | $ | 0 | ||||||||
| SERP | 2 | $ | 35,071 | $ | 0 | |||||||||
| Ewout L. Steenbergen |
Retirement Plan | 1 | $ | 7,891 | $ | 0 | ||||||||
| SERP | 1 | $ | 4,731 | $ | 0 | |||||||||
| Directors’ Plan | 18.75 | $ | 1,691,885 | $ | 0 | |||||||||
| Maliz E. Beams |
Retirement Plan | 2 | $ | 19,072 | $ | 0 | ||||||||
| SERP | 2 | $ | 38,049 | $ | 0 | |||||||||
| Jeffrey T. Becker |
Retirement Plan | 19.42 | $ | 322,360 | $ | 0 | ||||||||
| SERP | 19.42 | $ | 660,431 | $ | 0 | |||||||||
Assumptions for the “—Pension Benefits in 2013” table include:
The present value of accumulated benefits under the Retirement Plan and SERP shown in the “—Pension Benefits in 2013” table is calculated using the same actuarial assumptions used by the Company for GAAP financial reporting purposes, and assuming benefits commence as of age 65 under both plans. Those assumptions are:
| • | The discount rate is 4.95%. |
| • | The RP-2000 Mortality Table with generational projection using Scale AA for males and females after commencement at age 65. No mortality assumed before age 65. |
| • | The interest crediting rate on cash balance accounts is 3.5%, except AFS cash balance benefits have a minimum of 5.0%. |
| • | The cost of living adjustment under prior AFS benefits is 2.2%. |
Assumptions for the ING Group Directors’ Plan include:
| • | The discount rate is 3.668% and general inflation is 2.00%. The long-term rate of return on plan assets is not applicable but would be equal to the discount rate under IAS19 reporting. |
| • | Mortality is based on the AG Generational Table 2012-2062 with ING Group mortality experience rates derived from the Towers Watson 2012 experience mortality model. |
| • | Retirement age is equal to the normal pension age, 65. Payment is assumed to be in the form of a life-long annuity. |
| • | A discretionary cost-of-living indexation beginning January 1, 2015 is excluded. |
-290-
Table of Contents
Nonqualified Deferred Compensation Plans
The Company maintains the DCSP, a nonqualified deferred compensation plan that allows employees to contribute to deferred compensation accounts amounts above the 401(k) annual limit and provides certain company matching contributions on the deferred amounts. The Company also previously maintained an additional nonqualified deferred compensation plan for the purpose of holding certain deferred amounts paid to employees of our Investment Management business in 2010, including Mr. Becker. All amounts in such additional plan vested and were paid out during 2013.
ING U.S. 409A Deferred Compensation Savings Plan
Eligible employees who meet certain compensation thresholds may elect to participate in the DCSP. Participating employees may elect to defer up to 50% of their salary, up to 50% of their sales-based commission compensation, up to 100% of their short-term variable compensation (excluding sales-based commissions) and up to 100% of their long-term variable compensation and may also elect to defer compensation they would have contributed to their 401(k) Plan accounts were it not for the compensation and contribution limits under the Internal Revenue Code. The Company provides a 6% matching contribution on certain amounts elected to be deferred under the DCSP to enable company-matched contributions on deferrals that are in excess of the 401(k) contribution limits. The aggregate company match under the 401(k) plan and DCSP for 2013 was limited to $45,900.
The table below presents, for each NEO, 2013 information with respect to nonqualified deferred compensation plans.
Nonqualified Deferred Compensation Plans Table for 2013
| Name |
Executive Contributions in 2013(1) |
Registrant Contributions in 2013(1) |
Aggregate Earnings in 2013(2) |
Aggregate Withdrawals/ Distributions |
Aggregate Balance at 2013 Year End |
|||||||||||||||
| Rodney O. Martin, Jr. |
$ | 93,667 | $ | 30,600 | $ | 94,255 | $ | 0 | $ | 416,540 | ||||||||||
| Alain M. Karaoglan |
$ | 62,332 | $ | 30,600 | $ | 6,380 | $ | 0 | $ | 245,028 | ||||||||||
| Ewout L. Steenbergen |
$ | 9,450 | $ | 9,450 | $ | 72 | $ | 0 | $ | 18,972 | ||||||||||
| Maliz E. Beams |
$ | 58,695 | $ | 36,700 | $ | 4,160 | $ | 0 | $ | 173,731 | ||||||||||
| Jeffrey T. Becker |
$ | 125,337 | $ | 30,600 | $ | 139,395 | $ | 309,872 | $ | 2,537,959 | ||||||||||
| (1) | Amounts reported in this column that are reported in the “Summary Compensation Table” (for 2013, unless otherwise noted) are: Mr. Martin—$93,667 base salary; Mr. Karaoglan—$62,332 base salary; Mr. Steenbergen—$9,450 base salary; Ms. Beams—$58,695 base salary; and Mr. Becker—$84,470 base salary and $40,867 non-equity incentive plan compensation from 2012. |
| (2) | Amounts in this column reflect the interest earned on notional investments, which investments are elected by the participant. The participant has the ability to change his or her investment election only during open periods. |
Potential Payments upon a Termination or Change in Control
ING U.S. Severance Pay Plan
The ING Americas Severance Pay Plan (the “Severance Plan”) provides for the payment of severance benefits to eligible employees in the event of a qualifying termination of employment. Examples of qualifying termination events include an employee’s job elimination as a result of a reduction in workforce, an acquisition, a merger, divestiture or restructuring, outsourcing or position elimination. Other examples of qualifying termination events are significant pay reductions due to an employer-requested job change, the transfer of an employee’s job function more than 50 miles from the employee’s current work location, an employee’s job being filled while the employee is on an approved leave and the expiration of an employee’s expatriation assignment.
-291-
Table of Contents
Employees whose employment terminates for reasons other than a qualifying termination, including those who resign or are terminated for unsatisfactory performance, violation of laws or Company policies or similar reasons are not eligible for payments under the Severance Plan. Under the Severance Plan, eligible employees who do not sign a waiver and release agreement in connection with their employment termination receive two weeks of eligible pay. Employees who sign a waiver and release receive a benefit equal to the greatest of six weeks of eligible pay, two weeks of eligible pay per year of service (up to 52 weeks of eligible pay), or two weeks of eligible pay per $10,000 of eligible pay (up to 52 weeks of eligible pay). Outplacement and support services may be provided to eligible employees at the discretion of the Company. Mr. Martin has an employment agreement that provides for a lump-sum severance payment equal to annual salary in the event of an involuntary separation without “Cause” or for “Good Reason,” as defined in the employment agreements. Pursuant to Mr. Steenbergen’s localization arrangements, if he is involuntarily terminated without “Cause” (as defined in his offer letter), prior to April 15, 2014, in addition to severance under the ING U.S. Severance Plan, he will be paid a market value allowance of $400,000 on April 14, 2014. Currently, there are no other employment agreements that provide payments due to termination of employment. Mr. Karaoglan, Mr. Steenbergen, Ms. Beams and Mr. Becker are eligible to participate in the ING U.S. Severance Plan that is generally available to all full-time and part-time employees.
Employment Agreements
As discussed above under “—Critical Compensation and Other Policies”, notwithstanding the target opportunities discussed below, the compensation paid to Identified Staff remains subject to CRD Limitations as long as ING Group continues to consolidate our financial results with its financial results under IFRS.
Employment Agreement of Mr. Martin
The Company has an employment agreement with Mr. Martin, who serves as Chief Executive Officer of the Company and Chairman of its Board of Directors. The employment agreement is dated as of March 25, 2011, as amended and restated as of November 7, 2012, and as further amended and restated as of July 25, 2013. The term of the employment agreement is April 4, 2011 to December 31, 2014 and can be extended by mutual agreement.
Under the terms of his employment agreement, Mr. Martin receives an annual base salary of $1 million and has the opportunity for certain incentive payments. Mr. Martin is eligible to participate in the annual incentive payment program, or “ICP”, under which he may receive an award subject to his achievement of pre-established performance goals during each year ending during his employment. The amounts awarded under the ICP are determined by the Compensation and Benefits Committee and have a target of 100% of base salary with an opportunity to earn up to 200% of his base salary, a certain portion of which is subject to deferral. Mr. Martin’s target annual incentive award has subsequently been adjusted to 175% of base salary.
In addition to his base salary and ICP opportunity, Mr. Martin received a Deal Incentive Award in the amount of $6 million upon completion of our IPO, consisting of $2 million in cash and $4 million in Company RSUs, issued under the Omnibus Plan, based on the IPO price. The cash component of the award was paid after the completion of the IPO. The RSUs will vest as follows, provided that Mr. Martin is still employed by the Company on the applicable vesting date: (i) prior to December 31, 2016, if the Company completes one or more additional public offerings, a number of shares underlying the RSUs shall vest equal to (I) the total number of shares underlying the original RSU award multiplied by (II) the percentage of Company shares held by ING Group after the IPO that are sold in an additional public offering, and (ii) on December 31, 2016, if all of the shares underlying the original RSU award have not yet vested, and ING Group owns less than 50% of the amount of Company shares that it held prior to the IPO (the “Pre-IPO Shares”), then 50% of the unvested RSUs shall vest (but no RSUs will vest if ING Group continues to own 50% or more of the Pre-IPO Shares). If the number of shares underlying the RSU award that have vested pursuant to the above is less than the “Minimum RSA Shares,” determined as (I) the number of shares underlying the RSU award multiplied by (II) a fraction, the numerator of which is the amount by which the percentage of the Pre-IPO Shares no longer owned by ING Group as of December 31, 2016 exceeds 33.33% and the denominator of which is 66.67%, then an additional
-292-
Table of Contents
number of shares underlying the RSU award shall vest such that the total number of shares that have vested is not less than the Minimum RSA Shares. All unvested shares underlying the RSU award that have not vested as of December 31, 2016 shall be forfeited. In the event of Mr. Martin’s termination without cause, termination for good reason, death or disability prior to a relevant payment or vesting date, any unpaid portion of the Deal Incentive Award will immediately vest and be paid, unless applicable law or regulation requires payment in a different form or at a different time. Except as provided in his employment agreement, Mr. Martin’s RSUs will be subject to the terms of the Omnibus Plan and to the terms of his award agreement under it.
During his employment, Mr. Martin is eligible to receive long-term equity-based incentive awards. With respect to the 2011 and 2012 performance years, he was eligible, in ING Group’s sole discretion, to receive up to a maximum aggregate amount of $2,000,000 in long-term incentive awards (his “Long-Term Incentive”). Beginning with fiscal year 2013 performance, Mr. Martin is eligible to receive an annual long-term incentive award, as determined in its discretion by the Compensation and Benefits Committee. For 2014, Mr. Martin’s target long-term incentive opportunity has been established at 550% of base salary. Mr. Martin is entitled to participate in each of the Company’s employee benefit and welfare plans, including plans providing retirement benefits or medical, dental, hospitalization, life or disability insurance, on a basis that is at least as favorable as that provided to other senior executives of the Company.
Mr. Martin’s employment agreement contains various provisions governing termination. If the Company terminates Mr. Martin’s employment for cause (which includes willful failure to perform substantially under the agreement, after demand for substantial performance has been given by the Board of Directors that specifically identifies how he has not substantially performed his responsibilities, engagement in illegal conduct or in gross negligence or willful misconduct, in any case, that is materially and demonstrably injurious to either ING Group or the Company and material breach of non-compete, non-solicitation and other restrictive covenants in the employment agreement) or if Mr. Martin terminates his employment other than for good reason (which includes a reduction in salary or incentive award opportunities, failure to pay compensation or other amounts due under the agreement, failure to elect and maintain Mr. Martin in the positions contemplated by the employment agreement, any material reduction or other materially adverse action related to his authority, responsibilities or duties, or relocation of his principal office more than 50 miles from the New York City metropolitan area) the Company will pay his unpaid salary through the end of his employment, his salary for any accrued but unused paid time off, any accrued expense reimbursements and other cash entitlements and any unpaid but vested ICP award for a year ending before the end of his employment (collectively, his “Accrued Compensation”). In addition, the Company will pay any benefits to which he is entitled under any plan, contract or arrangement other than those described in the employment agreement, (including any unpaid deferred compensation and other cash compensation accrued by him through the end of his employment) (collectively, the “Other Benefits”).
If the Company terminates Mr. Martin’s employment without cause or if he terminates his employment for good reason, the Company will pay his Accrued Compensation, the Other Benefits, a pro rata ICP award (based on actual performance through the termination date, multiplied by the number of days of employment before termination divided by 365), and a lump-sum severance payment equal to his salary and any unpaid portion of his Deal Incentive Award. The Company’s obligation to make the specified payments and benefits in the event of a termination by the Company without cause or by Mr. Martin for good reason is conditioned upon Mr. Martin’s execution and delivery, without subsequent revocation, of an agreement releasing ING Group from all other liability.
Employment Agreement of Mr. Karaoglan
Mr. Karaoglan serves as the Executive Vice President and Chief Operating Officer of the Company, reporting to the CEO. Certain terms and conditions of his employment are set forth in an offer letter dated April 5, 2011, as amended as of July 25, 2013. Mr. Karaoglan is employed at will, and the Company may change the terms of or terminate his employment at any time.
Under the terms of his offer letter, Mr. Karaoglan received an annual base salary of $650,000 and has the opportunity for certain incentive payments. Mr. Karaoglan is eligible to receive an annual incentive award with a
-293-
Table of Contents
target bonus opportunity of 100% of his base salary with the opportunity to earn up to 200% of his base salary, a certain portion of which is subject to deferral. The offer letter also states that Mr. Karaoglan is eligible to participate in the LSPP, under which he may receive a long-term incentive award of ING Group restricted stock and/or performance shares with a target value of 100% of his salary (following our IPO, awards to employees of the Company are made in the form of ING U.S., Inc. equity grants pursuant to the Omnibus Plan, rather than the LSPP). Mr. Karaoglan’s base salary has subsequently been increased to $700,000, his target annual incentive award has subsequently been increased to 160% of base salary, and his target long-term incentive award has subsequently been increased to 320% of base salary.
In addition to his base salary, annual incentive award opportunity and long-term incentive award opportunity, Mr. Karaoglan received a Deal Incentive Award in the amount of $2 million upon completion of our IPO, consisting of $666,667 in cash and $1,333,333 in RSUs based on the IPO price. The cash component of the award was paid after the completion of the IPO. The RSUs vest pursuant to the same terms and conditions as those described above for the vesting of the Deal Incentive Award of Mr. Martin, under “—Employment Agreement of Mr. Martin.” All unvested shares underlying the restricted share award that have not vested as of December 31, 2016 shall be forfeited. If Mr. Karaoglan’s employment is terminated without cause (which includes willful failure to perform substantially under the agreement, after demand for substantial performance has been given by the Company that specifically identifies how he has not substantially performed his responsibilities, and engagement in illegal conduct or in gross negligence or willful misconduct, in any case, that is materially and demonstrably injurious to the Company) or for good reason (which includes a reduction in salary or ICP award opportunity, more than 50% of his responsibilities change and are not replaced with other responsibilities of generally similar significance or relocation of his principal office more than 50 miles from the New York City metropolitan area), death or disability following an IPO but prior to a relevant vesting or payment date, his Deal Incentive Award will immediately vest and be paid, unless applicable law or regulation requires payment in a different form or at a different time. Except as provided in his offer letter, Mr. Karaoglan’s restricted stock award will be subject to the terms of the equity plan for executive officers of the Company in effect at the time of the IPO and to the terms of his award agreement under it.
Employment Agreement of Mr. Steenbergen
Mr. Steenbergen serves as Executive Vice President and Chief Financial Officer of the Company. Prior to Mr. Steenbergen’s localization and the execution of his offer letter, dated March 28, 2013, Mr. Steenbergen was party to an employment agreement with ING Group, as Director of the Retail Division of ING Nederland. This agreement was originally entered into on May 19, 2004 and was amended effective January 1, 2006. See “—Expatriate Arrangements and Localization of Mr. Steenbergen” for more information regarding the terms of Mr. Steenbergen’s offer letter.
The terms of Mr. Steenbergen’s localization and his employment as a local employee of the Company are set forth in an offer letter dated March 28, 2013. Mr. Steenbergen is employed at will, and the Company may change the terms of or terminate his employment at any time. Under the terms of his offer letter, Mr. Steenbergen, beginning April 1, 2013, received a base salary of $550,000 and had a target annual incentive opportunity of 100% of his base salary, and a long-term incentive opportunity of 200% of his base salary. Mr. Steenbergen’s base salary has subsequently been increased to $625,000, his target annual incentive award has subsequently been increased to 163% of base salary, and his target long-term incentive award opportunity has been changed to 190% of base salary. To support his transition to a local, market competitive compensation package, Mr. Steenbergen receives a market value allowance of $400,000 for each twelve-month period beginning April 15, 2013 and 2014, respectively. If, however, Mr. Steenbergen is terminated for “cause” (as defined in his offer letter) prior to the payment of his market value allowance in 2014, Mr. Steenbergen will not receive such payment. In addition, if Mr. Steenbergen voluntarily leaves employment with the Company prior to April 15, 2015, he is required to repay a prorated amount of the market value allowance already paid. Following his localization, Mr. Steenbergen is now eligible to participate in Company-sponsored health and insurance programs, offered on the same terms and conditions as those made generally available to all full-time and part-time employees, as well as the DCSP and the Retirement Plan.
-294-
Table of Contents
Mr. Steenbergen was awarded a Deal Incentive Award with an original value of $650,000, subject to the terms and conditions described above under “—Compensation of Named Executive Officers—Grants of Plan Based Awards—Deal Incentive Awards,” which, in connection with his localization, was increased to $800,000.
Employment Agreement of Ms. Beams
Ms. Beams serves as the Chief Executive Officer, Retirement Solutions, of the Company, reporting to the CEO. Certain terms and conditions of her employment are set forth in an offer letter dated May 27, 2011. Ms. Beams is employed at will, and the Company may change the terms of or terminate her employment at any time.
Under the terms of her offer letter, Ms. Beams received an annual base salary of $600,000 and has the opportunity for certain incentive payments. Ms. Beams is eligible to receive an annual incentive award with a target bonus opportunity of 125% of her base salary, a certain portion of which is subject to deferral. The offer letter also states that Ms. Beams is eligible to participate in the LSPP, under which she may receive a long-term incentive award of ING Group restricted stock and/or performance shares with a target value of 125% of her base salary (following our IPO, awards to employees of the Company are made in the form of ING U.S., Inc. equity grants pursuant to the Omnibus Plan, rather than the LSPP). Ms. Beams’ base salary has subsequently been increased to $700,000 and her target long-term incentive award has subsequently been increased to 250% of base salary.
In addition to her base salary, annual incentive award opportunity and long-term incentive award opportunity, Ms. Beams received a Deal Incentive Award with an aggregate value of $1.5 million, subject to the terms and conditions described under “—Compensation of Named Executive Officers—Grants of Plan Based Awards—Deal Incentive Awards”.
Employment Agreement of Mr. Becker
Mr. Becker serves as the Chief Executive Officer of Investment Management. Certain terms and conditions of his employment are set forth in an offer letter from Aetna Life & Casualty, dated July 25, 1994. Under the terms of his offer letter, Mr. Becker is entitled to an annual base salary of $82,500, which may be reviewed and adjusted. Mr. Becker is employed at will, and the Company may change the terms of or terminate his employment at any time. Mr. Becker’s base salary has subsequently been increased to $575,000.
Mr. Becker is party to a letter agreement pursuant to which he received a Deal Incentive Award of $800,000, subject to the terms and conditions described above under “—Compensation of Named Executive Officers—Grants of Plan Based Awards—Deal Incentive Awards”.
-295-
Table of Contents
Potential Payments upon Termination or Change of Control Table(1)
The following table sets forth, for each NEO, an estimate of potential payments the NEO would have received at, following, or in connection with a termination of employment under the circumstances enumerated below on December 31, 2013.
| Name |
Termination Trigger |
Severance(2) | Continued Benefits Health and Welfare Continuation |
Equity Vesting(3) |
Other
Benefits(4) |
Total | ||||||||||||||||
| Rodney O. Martin, Jr. |
Involuntary termination without cause / for good reason |
$ | 1,000,000 | $ | — | $ | 9,098,332 | $ | 8,500 | $ | 10,106,832 | |||||||||||
| Voluntary Termination | $ | — | $ | — | $ | — | $ | — | $ | — | ||||||||||||
| Retirement | $ | — | $ | — | $ | — | $ | — | $ | — | ||||||||||||
| Death | $ | — | $ | — | $ | 9,489,294 | $ | — | $ | 9,489,294 | ||||||||||||
| Disability | $ | — | $ | — | $ | 9,489,294 | $ | — | $ | 9,489,294 | ||||||||||||
| Involuntary termination following Change in Control |
$ | 1,000,000 | $ | — | $ | 9,489,294 | $ | 8,500 | $ | 10,497,794 | ||||||||||||
| Alain M. Karaoglan |
Involuntary termination without cause / for good reason |
$ | 700,000 | $ | 6,978 | $ | 4,485,767 | $ | 8,500 | $ | 5,201,245 | |||||||||||
| Voluntary Termination | $ | — | $ | — | $ | — | $ | — | $ | — | ||||||||||||
| Retirement | $ | — | $ | — | $ | — | $ | — | $ | — | ||||||||||||
| Death | $ | — | $ | — | $ | 4,876,728 | $ | — | $ | 4,876,728 | ||||||||||||
| Disability | $ | — | $ | — | $ | 4,876,728 | $ | — | $ | 4,876,728 | ||||||||||||
| Involuntary termination following Change in Control |
$ | 700,000 | $ | 6,978 | $ | 4,876,728 | $ | 8,500 | $ | 5,592,206 | ||||||||||||
| Ewout L. Steenbergen |
Involuntary termination without cause / for good reason |
$ | 550,000 | $ | 6,670 | $ | 1,515,465 | $ | 8,500 | $ | 2,080,635 | |||||||||||
| Voluntary Termination | $ | — | $ | — | $ | — | $ | — | $ | — | ||||||||||||
| Retirement | $ | — | $ | — | $ | — | $ | — | $ | — | ||||||||||||
| Death | $ | — | $ | — | $ | 1,665,838 | $ | — | $ | 1,665,838 | ||||||||||||
| Disability | $ | — | $ | — | $ | 1,665,838 | $ | — | $ | 1,665,838 | ||||||||||||
| Involuntary termination following Change in Control |
$ | 550,000 | $ | 6,670 | $ | 1,665,838 | $ | 8,500 | $ | 2,231,008 | ||||||||||||
| Maliz E. Beams |
Involuntary termination without cause / for good reason |
$ | 700,000 | $ | 9,949 | $ | 4,642,972 | $ | 8,500 | $ | 5,361,421 | |||||||||||
| Voluntary Termination | $ | — | $ | — | $ | — | $ | — | $ | — | ||||||||||||
| Retirement | $ | — | $ | — | $ | — | $ | — | $ | — | ||||||||||||
| Death | $ | — | $ | — | $ | 5,018,891 | $ | — | $ | 5,018,891 | ||||||||||||
| Disability | $ | — | $ | — | $ | 5,018,891 | $ | — | $ | 5,018,891 | ||||||||||||
| Involuntary termination following Change in Control |
$ | 700,000 | $ | 9,949 | $ | 5,018,891 | $ | 8,500 | $ | 5,737,340 | ||||||||||||
| Jeffrey T. Becker |
Involuntary termination without cause / for good reason |
$ | 575,000 | $ | 10,005 | $ | 3,041,728 | $ | 8,500 | $ | 3,635,233 | |||||||||||
| Voluntary Termination | $ | — | $ | — | $ | — | $ | — | $ | — | ||||||||||||
| Retirement | $ | — | $ | — | $ | — | $ | — | $ | — | ||||||||||||
| Death | $ | — | $ | — | $ | 3,762,158 | $ | — | $ | 3,762,158 | ||||||||||||
| Disability | $ | — | $ | — | $ | 3,762,158 | $ | — | $ | 3,762,158 | ||||||||||||
| Involuntary termination following Change in Control |
$ | 575,000 | $ | 10,005 | $ | 3,762,158 | $ | 8,500 | $ | 4,355,663 | ||||||||||||
| (1) | There are no change in control provisions that would affect the level of benefits payable from the pension plans. The ING U.S. Severance Plan determines benefits under a formula that takes into account service and salary. The Plan’s maximum severance benefit is equal to 52 weeks of eligible pay. |
| (2) | Under the terms of his employment agreement, cash severance payments to Mr. Martin would be made in a lump sum by the Company. Under the terms of the Severance Plan and subject to the executive’s execution of a release, cash severance payments to Mr. Karaoglan, Mr. Steenbergen, Ms. Beams and Mr. Becker would be made by the Company in substantially equal, semi-monthly payments as the same time as the regular payroll, for the duration of the severance period. |
-296-
Table of Contents
| (3) | The equity valuations were determined using the closing market prices on December 31, 2013 and the interim payout percentages for performance shares as of this same date. The following table details the equity valuations determined using the ING U.S., Inc. closing share price and ING Group closing ADS price, in each case on December 31, 2013. |
| Deal Incentive Awards (ING U.S., Inc.) |
Performance Shares (ING Group) |
Deferred Equity (ING U.S., Inc. and ING Group) |
Restricted ADS (ING Group) |
|||||||||||||||||
| Name |
Total Value | Prorated Value | ||||||||||||||||||
| Rodney O. Martin, Jr. |
$ | 5,788,502 | $ | 781,895 | $ | 390,934 | $ | 2,918,896 | $ | 0 | ||||||||||
| Alain M. Karaoglan |
$ | 1,929,489 | $ | 1,031,981 | $ | 641,019 | $ | 1,915,258 | $ | 0 | ||||||||||
| Ewout L. Steenbergen |
$ | 721,032 | $ | 380,203 | $ | 229,830 | $ | 564,604 | $ | 0 | ||||||||||
| Maliz E. Beams |
$ | 1,351,939 | $ | 1,040,383 | $ | 664,464 | $ | 2,626,569 | $ | 0 | ||||||||||
| Jeffrey T. Becker |
$ | 721,032 | $ | 396,937 | $ | 246,564 | $ | 1,312,328 | $ | 1,331,861 | (a) | |||||||||
| (a) | Prorated value of $761,803 |
| (4) | The executive outplacement services program for executives with a salary of $275,000 or more provides services for up to 12 months at a fixed cost of $8,500 per participant. All NEOs would be eligible. |
Non-Employee Director Compensation
Each of our directors that is neither our employee nor an employee of ING Group (each, a “non-employee director”) currently receives the following compensation for their service on our Board of Directors and its committees. For service periods of less than one year, amounts are prorated.
| Element of Compensation |
Annual Compensation Amount | |
| Annual Cash Fees | $100,000 cash payment | |
| Annual Equity Grant | $110,000, in the form of time-vested RSUs | |
| Committee Membership Fees | $5,000 cash payment | |
| Committee Chair Fees | $20,000 cash payment (Audit Committee) $15,000 cash payment (Compensation and Benefits Committee) $10,000 cash payment (all other committees) | |
| Lead Director Fees | $25,000 cash payment |
Director Summary Compensation Table
The chart below indicates the elements and total value of cash compensation and of RSUs granted to each non-employee director for services performed in 2013. Pursuant to SEC rules, this table includes equity awards granted during 2013, and excludes equity awards granted in 2014 in respect of 2013 service. Cash amounts, however, reflect amounts paid in respect of 2013 service, even if paid during 2014.
| Director |
Fees Earned or Paid in Cash |
Stock Awards(1) |
All
Other Compensation(2) |
Total | ||||||||||||
| J. Barry Griswell |
$ | 79,999 | $ | 73,534 | $ | 5,000 | $ | 158,533 | ||||||||
| Dirk Harryvan |
$ | 79,780 | $ | 73,534 | $ | — | $ | 153,314 | ||||||||
| Frederick S. Hubbell |
$ | 136,593 | $ | 123,532 | $ | — | $ | 260,125 | ||||||||
| David Zweiner |
$ | 88,304 | $ | 73,534 | $ | 5,000 | $ | 166,838 | ||||||||
| (1) | For Mr. Hubbell, this amount includes, in addition to the annual equity grant referenced above, a Deal Incentive Award of 2,564 RSUs, 50% of which vested on October 23, 2013 and 50% of which vested on January 22, 2014, and is subject to a required holding period. |
| (2) | Consists of matching charitable contributions. |
-297-
Table of Contents
Director Equity Awards
The following table sets forth outstanding equity awards held by each non-employee director as of December 31, 2013.
| Director |
Number of RSUs Outstanding | |
| J. Barry Griswell | 2,733 | |
| Dirk Harryvan | 2,733 | |
| Frederick S. Hubbell | 5,297(1) | |
| David Zweiner | 2,733 |
| (1) | Includes RSUs held in respect of Mr. Hubbell’s Deal Incentive Award, which had fully vested by January 22, 2014, but is subject to a required holding period. |
Compensation Committee Interlocks and Insider Participation
There are no interlocking relationships between any member of our Compensation and Benefits Committee and any of our executive officers that require disclosure under the applicable rules promulgated under the federal securities laws.
During 2013, Willem F. Nagel, who is currently an officer of ING Group, the parent of the Company, and Frederick S. Hubbell, who was previously an officer of ING Group, each served on the Compensation and Benefits Committee.
-298-
Table of Contents
CERTAIN RELATIONSHIPS AND RELATED PARTY TRANSACTIONS
Continuing Relationship with ING Group
Prior to the completion of our initial public offering in May 2013, we were an indirect wholly owned subsidiary of ING Group. Until the completion of this offering and the Direct Share Buyback, we continue to be part of ING Group’s consolidated business operations, and as a result, ING Group has significant control over our business, including pursuant to the agreements described below. Following the completion of this offering, ING Group will continue to own a significant minority of our common stock and will continue to exercise significant influence over matters voted upon by our stockholders, including the election of members of our Board of Directors.
Share Repurchase Agreement and Direct Share Buyback
On March 18, 2014, we entered into the Share Repurchase Agreement with ING Group, pursuant to which we will acquire from ING Group shares of our common stock having an aggregate purchase price of $250 million. Pursuant to the Share Repurchase Agreement, the purchase price per share of common stock in the Direct Share Buyback will be equal to the per share proceeds, before expenses, to the Selling Stockholder shown on the cover of this prospectus.
The Direct Share Buyback and the entry into the Share Repurchase Agreement were each authorized by a special committee of our Board of Directors consisting solely of independent and disinterested directors, which was formed for the purpose of considering the Direct Share Buyback. The Special Committee retained independent financial and legal advisors for purposes of its deliberations.
Pursuant to the Share Repurchase Agreement, the Direct Share Buyback will be subject to a number of conditions (unless waived by the Company with the approval of the Special Committee), including:
| • | The completion of this offering; |
| • | That upon the completion of this offering and the Direct Share Buyback (and without giving any effect to the exercise by the underwriters of their option to acquire additional shares), ING Group and its affiliates will beneficially own, in the aggregate, no more than 45% of the issued and outstanding shares of our common stock; |
| • | The resignation from our Board of Directors, effective as of the time of completion of the Direct Share Buyback, of two directors who are designated as ING Group Directors for purposes of our Shareholder Agreement with ING Group; and |
| • | The receipt by the Special Committee of a fairness opinion from Greenhill & Co., LLC, the Special Committee’s financial advisor. |
The Direct Share Buyback will be funded from our existing cash on hand.
Although, as described above, the closing of the Direct Share Buyback is conditioned on the closing of this offering (among other conditions), the closing of this offering is not conditioned upon the closing of the Direct Share Buyback, and there can be no assurance that the Direct Share Buyback will be completed even if this offering is completed.
Pursuant to the Share Repurchase Agreement, ING Group has agreed to reimburse one half of the reasonable out-of-pocket costs, fees and expenses incurred by the Special Committee, including the fees and expenses of legal and financial advisors to the Special Committee, in connection with the Share Repurchase Agreement and Direct Share Buyback.
The Share Repurchase Agreement is filed as an exhibit to the registration statement of which this prospectus is a part.
-299-
Table of Contents
Shareholder Agreement
In connection with our initial public offering, we entered into the Shareholder Agreement with ING Group that governs certain aspects of our continuing relationship. In particular, the Shareholder Agreement addresses the composition of our board of directors and its committees, other corporate governance matters, ING Group approval and consent rights with respect to certain business and corporate actions we may take, mutual rights that we and ING Group will have with respect to business and financial information and financial accounting matters and ING Group rights with respect to subsequent sales of our common stock. The Shareholder Agreement has been filed as an exhibit to our Annual Report on Form 10-K for the year ended December 31, 2013.
Board of Directors and ING Group Rights with Respect to Director Nomination
The Shareholder Agreement entitles ING Group, in connection with any election of directors by our stockholders, to have our Board of Directors include in the candidates it nominates for election (the “Company Slate”) a minimum number of directors designated by ING Group. The number of Group Directors that ING Group is entitled to have included on the Company Slate is based on its beneficial ownership of our common stock, as follows:
| • | Until and including the date on which ING Group first ceases to beneficially own more than 50% of our outstanding common stock (which is referred to as the “Majority Holder Date”), ING Group will be entitled to nominate five ING Group Directors, who shall comprise a majority of our directors; |
| • | Following the Majority Holder Date, and until and including the date on which ING Group first ceases to beneficially own at least 35% of our outstanding common stock (which is referred to as the “First Threshold Date”), ING Group will be entitled to nominate three ING Group Directors (two, if there shall be at such time fewer than eight directors on our board of directors); and |
| • | Following the First Threshold Date, and until and including the date on which ING Group first ceases to beneficially own at least 20% of our outstanding common stock (which is referred to as the “Third Threshold Date”), ING Group will be entitled to nominate two ING Group Directors (one, if there shall be at such time fewer than eight directors on our board of directors). |
Following the Third Threshold Date, ING Group will have no further right to nominate ING Group Directors. We expect that the Majority Holder Date will be the date of completion of this offering and the Direct Share Buyback.
The Shareholder Agreement also provides that, until the Majority Holder Date, our Board of Directors will consist of nine members, one of whom will be our CEO and three of whom will be “Independent Directors”, as defined by NYSE listing rules and Rule 10A-3 under the Exchange Act. On and after the first anniversary of the Majority Holder Date, our Board of Directors may reduce the number of directors to no fewer than seven members.
The Shareholder Agreement requires that, until the Third Threshold Date, if at any time the chairman of our board of directors is not an Independent Director, our Board of Directors will designate a “lead director” who is an Independent Director and who has the responsibilities described under “Management—Board of Directors—Lead Director”. In addition, the Shareholder Agreement includes provisions relating to the membership and conduct of our board and management committees, including providing that:
| • | until the First Threshold Date, an ING Group Director shall serve on the Executive Committee of the board (see “Management—Board of Directors—Executive Committee of the Board”); |
| • | until the Majority Holder Date, our Executive Committee may not act without the consent of a majority of the Executive Committee, which majority must include the member who is an ING Group Director; |
| • | until the first anniversary of the effectiveness of the registration statement relating to our initial public offering, ING Group may at its option have included on our audit committee an ING Group Director |
-300-
Table of Contents
| who is not an Independent Director; and afterwards may include on our Audit Committee an ING Group Director who is an Independent Director; |
| • | at any time during which the board of directors includes an ING Group Director who is also an Independent Director, at least one member of the Audit Committee shall be an ING Group Director; |
| • | until the Third Threshold Date, ING Group is entitled to have observers present at meetings of our Management Risk Committee and Management Investment Committee and to receive all materials, reports and other communications from such committees; and |
| • | our board committees shall have the membership and responsibilities described under “Management—Board of Directors”. |
Consent Rights
The Shareholder Agreement provides that, until such time as ING Group ceases to beneficially own at least 30% of our outstanding common stock, the prior consent of ING Group will be required before we may take any of the following actions, whether directly or indirectly through a subsidiary:
| • | any merger, consolidation or similar transaction (or any amendment to or termination of an agreement to enter into such a transaction) involving us or any of our subsidiaries, on the one hand, and any other person, on the other hand; other than (A) an acquisition of 100% of the capital stock of such other person or (B) disposition of 100% of the capital stock of one of our subsidiaries, in each case (x) involving consideration not exceeding $1 billion and (y) where none of (1) the book value of the assets or liabilities or (2) the sum of the assets under management and assets under administration of such Person exceeds $5 billion; |
| • | any acquisition or disposition of securities, assets or liabilities (including through reinsurance transactions) involving consideration or book value greater than $1 billion, other than transactions involving assets invested in our consolidated general account and approved in accordance with our established policies and procedures to monitor invested assets; |
| • | any change in our authorized capital stock or the creation of any class or series of our capital stock; |
| • | any issuance or acquisition of capital stock, except: |
| • | issuances of equity awards to directors or employees pursuant to an equity compensation plan; |
| • | issuances or acquisitions of capital stock of one of our subsidiaries to or by one of our wholly-owned subsidiaries; and |
| • | issuances or acquisitions of capital stock that our board of directors determines are necessary to maintain adequate capitalization or comply with a debt instrument or a legal or regulatory requirement; |
| • | any issuance or acquisition of debt securities involving an aggregate principal amount exceeding $1 billion, except for short term funding instruments and certain capital management facilities, which include certain intercompany debt and certain financial instruments that we use as operating leverage (e.g., to finance reserves or to collateralize reinsurance obligations); |
| • | any other incurrence of a debt obligation having a principal amount greater than $1 billion, except for certain capital management facilities, which include intercompany debt and certain financial instruments that we use as operating leverage (e.g., to finance reserves or to collateralize reinsurance obligations); |
| • | entry into or termination of any joint venture or cooperation arrangements involving assets having a value exceeding $1 billion; |
| • | listing or delisting of any securities on a securities exchange, other than the listing or delisting of debt securities on the NYSE or any other securities exchange located solely in the United States; |
-301-
Table of Contents
| • | any amendments to the charter (or equivalent authorizing document) of the management risk committee or the management investment committee that affects (A) the obligations of such committees to report their activities (or those of their respective subcommittees) to our board of directors or (B) the scope of authority of such committees; |
| • | the amendment (or approval or recommendation of the amendment) of our certificate of incorporation or by-laws; or |
| • | any filing or petition under bankruptcy laws, admission of insolvency or similar actions by us or any of our subsidiaries, or our dissolution or winding-up. |
Information Rights, Disclosure and Financial Accounting
The Shareholder Agreement requires us, as long as ING Group is required under IFRS to consolidate our financial results with its financial results, and in any case for all financial periods commencing prior to the Majority Holder Date, to continue to provide ING Group with (A) information and data relating to our and our subsidiaries’ business and financial results and (B) access to our personnel, data and systems, in each case in the same manner as it did immediately prior to the completion of the IPO. In addition, during this period, we will be required to maintain accounting principles, systems and reporting formats that are consistent with ING Group’s financial accounting practices in effect as of the completion of the IPO, and in good faith to consider any changes to such principles, systems or reporting formats requested by ING Group. Furthermore, the Shareholder Agreement requires us during this time to maintain appropriate disclosure controls and procedures and internal control over financial reporting, and to provide quarterly certifications from our relevant officers and employees regarding such matters in accordance with ING Group’s internal standards, and to inform ING Group promptly of any events or developments that might reasonably be expected to materially affect our financial results. We expect that the provisions described in this paragraph will cease to apply for periods following the completion of this offering and the Direct Share Buyback.
Following the time at which the provisions of the immediately preceding paragraph cease to apply, and until the later of (A) ING Group being no longer required under IFRS (x) to account in its financial statements for its holdings in us under an equity method or (y) to consolidate our financial results with its financial results and (B) the Third Threshold Date, unless ING Group shall earlier provide written notice to us that it is opting-out of these provisions, we will be obligated to provide ING Group with (i) information and data relating to our and our subsidiaries’ business and financial results and (ii) access to our personnel, data and systems, in each case to the extent that such information, data or access is required for ING Group to meet its legal, financial or regulatory obligations or requirements (as determined by ING Group in its reasonable judgment).
The Shareholder Agreement provides that, until the Third Threshold Date, ING Group will have certain access and cooperation rights with respect to the independent public registered accounting firm responsible for the audit of our financial statements and to our internal audit function, and subject to applicable law and SEC and stock exchange rules, ING Group’s approval shall be required before we may engage a different independent public registered accounting firm.
The Shareholder Agreement also provides that, until the Third Threshold Date, we shall consult and coordinate with ING Group with respect to public disclosures and filings, including in connection with our quarterly and annual financial results. Among other requirements, we will, to the extent practicable, provide ING Group with a copy of any public release at least two business days prior to publication and consider in good faith incorporating any comments provided by ING Group. In addition, we and ING Group will have mutual rights with respect to any information and access each may require in connection with regulatory or supervisory reporting obligations or inquiries.
Rights with Respect to Policies and Conduct
The Shareholder Agreement provides that, until the Majority Holder Date, our Board of Directors shall, when determining to implement, amend or rescind any of our or our subsidiaries’ policies relating to risk, capital,
-302-
Table of Contents
investment, environmental and social responsibility or regulatory compliance (each, a “Critical Policy”), take into account our status as a consolidated subsidiary of ING Group, and the interests of ING Group with respect to such policies.
In addition, during any period in which ING Group is deemed to control us for U.S., European Commission or Dutch regulatory purposes, and in any case at all times prior to the Third Threshold Date, we:
| • | may not adopt or implement any policies or procedures, and at ING Group’s reasonable request, must refrain from taking any actions, that would cause ING Group to violate any applicable laws to which ING Group is subject; |
| • | must, prior to implementing, amending or rescinding any Critical Policy, consult with ING Group and, to the extent consistent with its fiduciary duties, our Board of Directors must take into account the interests of ING Group with respect thereto; and |
| • | must maintain and observe the policies of ING Group to the extent necessary for ING Group to comply with its legal or regulatory obligations; |
provided that nothing in the foregoing shall require us to take any action (including adopting or implementing any policy) or refrain from taking any action where such action or inaction would cause us to violate any applicable law.
Non-Solicitation
We and ING Group have agreed that, until the earlier of two years after the date of the Shareholder Agreement and the Third Threshold Date, neither we nor they shall solicit any then-current employee of the other party with respect to employment.
Provisions Relating to Specific Regulatory Requirements
Pursuant to the Shareholder Agreement, during any period in which we are deemed to be under the control of ING Group and at all times prior to the Third Threshold Date, we will, upon request from ING Group, promptly provide any information, records or documents requested or demanded by any governmental or regulatory authority with jurisdiction over ING Group or necessary for ING Group in connection with any filing, report or response to such entities and will, upon reasonable notice, provide access to such entities to our offices, employees and management, where and as required under applicable law.
The Shareholder Agreement requires us, until the date on which ING Group is no longer required under IFRS to consolidate our financial results with its financial results, to maintain remuneration practices and policies which comply with the CRD III requirements, including subjecting the compensation arrangements of all employees covered by the CRD III requirements to the approval of the Supervisory Board of ING Group.
The Shareholder Agreement also requires us to fully cooperate with the requirements of the 2012 Amended Restructuring Plan or any other future requirements imposed by the European Commission as a consequence of state aid received by ING Group.
Subsequent Equity Sales—ING Group Right of First Offer
Until the Third Threshold Date, the Shareholder Agreement provides ING Group (or a designated subsidiary of ING Group) with a right of first offer with respect to any issuances of our common stock or securities convertible or exchangeable for our common stock. In circumstances in which the right of first offer is applicable, we will be required to provide ING Group with at least ten business days’ notice of any such planned issuance, along with an estimated price range within which we expect to issue the common stock or other
-303-
Table of Contents
securities. If ING Group wishes to exercise its right of first offer, it will be entitled to purchase (and must enter into an irrevocable purchase commitment, subject only to any required regulatory approvals), at the same price as other purchasers of the issuance, a portion of the common stock or other securities we issue, in proportion to its then-current holdings of our outstanding common stock. ING Group’s commitment to purchase, and our ability to consummate the offering, will be contingent on the offering price being within the estimated price range we will have provided to ING Group. The right of first offer will not apply to issuances we make as consideration for mergers, acquisitions or exchange offers, in connection with equity-based compensation awards, or in connection with certain transactions approved by ING Group pursuant to its consent rights set forth in the Shareholder Agreement (unless otherwise provided in such consent).
Provisions Relating to Indemnification and Liability Insurance
The Shareholder Agreement provides that, until at least the day after the last date on which any director (including any member of the Supervisory Board or the Executive Board of ING Group), officer, employee or certain designated agents of ING Group or any of its subsidiaries (a “Group Individual”) is a director, officer or employee of the Company, we must indemnify (including advancement of expenses) each such director, officer and employee to the greatest extent permitted under Section 145 of the DGCL and other applicable laws. Such indemnification must continue as to any Group Individual who becomes entitled to indemnification notwithstanding any subsequent change in our indemnification policies or that such Group Individual ceases to be a director, officer or employee of the Company.
The Shareholder Agreement also requires that we renew annually our insurance coverage with respect to director and officer and other fiduciary liability and liabilities under U.S. federal and state securities laws covering directors, officers and employees of the Company, Group Individuals, the Company, ING Group and respective Subsidiaries of the Company and ING Group. Such coverage generally is required to be renewed annually on substantially the same terms in order to cover any claims made on or prior to the sixth anniversary of the last date on which any Group Individual is a director, officer or employee of the Company, with certain exceptions and potential extensions. The Shareholder Agreement also provides a process for adjustments to these coverages and requires the Company and ING Group to share the cost of these coverages and to cooperate in handling renewals and claims.
Provisions with respect to certain obligations of the Company guaranteed by ING Group or its subsidiaries
Aetna Notes
ING Group guarantees approximately $506.1 million par value of various debentures of Lion Holdings that were assumed by Lion Holdings in connection with the Company’s acquisition of Aetna’s life insurance and related businesses in 2000 (the “Aetna Notes”). The Aetna Notes mature between 2023 and 2036.
The Company agreed in the Shareholder Agreement that it will reduce the aggregate outstanding principal amount of Aetna Notes to:
| • | no more than $400.0 million as of December 31, 2015; |
| • | no more than $300.0 million as of December 31, 2016; |
| • | no more than $200.0 million as of December 31, 2017; |
| • | no more than $100.0 million as of December 31, 2018; and |
| • | zero as of December 31, 2019. |
The reduction in principal amount of Aetna Notes may be accomplished, at the Company’s option, through redemptions, repurchases or other means, but will also be deemed to have been reduced to the extent the Company shall have posted collateral with a third-party collateral agent, for the benefit of ING Group, which may consist of:
| • | cash collateral; |
-304-
Table of Contents
| • | certain investment-grade debt instruments; |
| • | a letter of credit meeting certain requirements; or |
| • | senior debt obligations of ING Group or a wholly owned subsidiary of ING Group (other than the Company or its subsidiaries). |
If collateral is posted in lieu of reducing the outstanding principal amount of Aetna Notes, the amount of such collateral shall be deemed to reduce the outstanding principal amount of Aetna Notes dollar-for-dollar, except that collateral consisting of certain investment grade debt instruments shall be subject to a “haircut”, calculated based on the applicable collateral margin that would be applied from time to time by the U.S. Federal Reserve System to such collateral if it were to be pledged as security for discount window advances.
If the Company fails to reduce the outstanding principal amount of the Aetna Notes as set forth above, the Company will pay a fee to ING Group, payable each quarter, equal to the Quarterly Fee Rate multiplied by the amount by which, as of the end of the immediately preceding fiscal quarter of the Company, the outstanding principal amount of Aetna Notes exceeded the limits set forth above. The “Quarterly Fee Rate” (i) for 2016, is 0.5% per quarter; (ii) for 2017, is 0.75% per quarter; (iii) for 2018, is 1.0% per quarter; and (iv) for 2019 and subsequent years, is 1.25% per quarter.
Other ING Group Guarantees
In addition to the specific provisions set forth above with respect to the Aetna Notes, the Shareholder Agreement also provides that, to the extent that ING Group or any of its subsidiaries (other than the Company or any of its subsidiaries) shall at any time make any payments with respect to any Company obligations that are the subject of a guarantee by ING Group or its subsidiaries (see “—Historical Related Party Transactions—Financing Arrangements—Guarantees”), the Company shall immediately reimburse ING Group or its subsidiary for the full amount of such payments and for all reasonable expenses incurred by ING Group or the subsidiary in connection with making such payments.
Term
The Shareholder Agreement terminates upon ING Group ceasing to beneficially own at least 7.5% of our outstanding common stock, except for certain provisions including those relating to confidentiality, dispute resolution, provisions with respect to guaranteed obligations and the obligation to maintain certain insurance coverage. See “—Provisions Relating to Indemnification and Liability Insurance.”
Transitional Intellectual Property License Agreement
In connection with our initial public offering, we entered into a transitional intellectual property license agreement with ING Group (the “IP Agreement”). Pursuant to the IP Agreement, ING Group granted us and our subsidiaries a limited, non-exclusive, fully paid-up, royalty-free, non-transferable license to use certain trademarks including the name “ING” and the ING “Lion”, with respect to each of our and our subsidiaries’ businesses, in the countries in which such business provides products or services prior to the closing of our IPO (the “Territory”) in the fields of insurance, retirement and investment management (excluding the field of banking, subject to limited exceptions). The license is sublicensable in certain circumstances in the ordinary course of business in the Territory. The license term shall be for a thirty-month transition period, subject to the possibility of extension in accordance with the IP Agreement. Under the IP Agreement, we are required to use commercially reasonable efforts to transition to our new brand and to cease using ING Group trademarks as soon as commercially reasonably practicable.
In addition, during the thirty-month transition period (the “Transition Period”), we and our subsidiaries shall make all relevant filings necessary to change our name to eliminate the name “ING” from all registrations and certificates. See “Business—Our Brand”.
-305-
Table of Contents
Under the IP Agreement, we and our subsidiaries will have the continued and exclusive right to use certain domain names during the Transition Period. For the twelve-month period following the expiration of the Transition Period, certain domain names will be redirected to a uniform resource locator designated by us. Upon the expiration of such twelve-month period, certain domain names will be directed to a webpage that will provide one link to a uniform resource locator designated by us and another link to a uniform resource locator designated by ING Group. At the end of the Transition Period, we and our subsidiaries will be required to transfer registration of all ING U.S. domain names to ING Group.
The IP Agreement requires us to defend, indemnify and hold ING Group and its affiliates and their respective directors, officers, employees, shareholders, agents, attorneys, representatives, successors and assigns harmless from and against losses (without limitation or cap of any kind) in connection with any third party claim in connection with (i) breach of the Joinder Agreement (as defined below) based on any act or omission by us or our affiliates, (ii) an act or omission by us or our affiliates that creates liability for ING Group or its affiliates under certain co-existence agreements, (iii) breach of the IP Agreement or (iv) the assertion that we or our subsidiaries have acted on behalf of or have the authority to bind ING Group or its affiliates.
The IP Agreement requires ING Group to defend, indemnify and hold us and our affiliates and our respective directors, officers, employees, shareholders, agents, attorneys, representatives, successors and assigns harmless from and against losses (without limitation or cap of any kind) in connection with (i) an act or omission by ING Group or its affiliates that creates liability for us or our affiliates under certain co-existence agreements, or (ii) breach of the IP Agreement.
The IP Agreement will expire, together with all licenses and sublicenses granted under the IP Agreement, upon the expiration of the Transition Period. Upon expiration or termination of the IP Agreement, we agree not to use the licensed trademarks such as “ING” or the ING “Lion” or any mark confusingly similar thereto.
The IP Agreement has been filed as an exhibit to the registration statement of which this prospectus forms a part.
Joinder Agreement
Concurrently with the entry into the IP Agreement, we entered into a joinder agreement (the “Joinder Agreement”) with ING Group that will become effective once we cease to be an “affiliate” of ING Group as defined in the Co-Existence Agreement, dated February 17, 2012, among ING Group, ING Direct N.V., ING Direct Bancorp, ING Bank, fsb and Capital One Financial Corporation. Pursuant to the Joinder Agreement, we are joining the co-existence agreement, as if we remained an affiliate of ING Group.
Equity Administration Agreement
In connection with our initial public offering, we entered into an equity administration agreement with ING Group that sets forth certain of our responsibilities and the responsibilities of ING Group with respect to the administration of certain employee equity compensation plans, programs and arrangements (the “Equity Administration Agreement”). Pursuant to the terms of the Equity Administration Agreement, ING Group agreed to continue to facilitate the exercise of options and the vesting and delivery of performance shares and restricted shares for purposes of all outstanding ING Group equity compensation awards held by our employees. The Equity Administration Agreement also provides that we will cooperate and negotiate with ING Group where necessary to administer compensation plans, programs and arrangements in accordance with the intent of the Equity Administration Agreement.
The Equity Administration Agreement further obligates us and ING Group to promptly provide to the other party all information that the other may reasonably request to enable the requesting party to administer efficiently
-306-
Table of Contents
and accurately each of the ING Group’s stock option or stock incentive plans maintained before the IPO, timely respond to audit requests and to determine the scope of, as well as fulfill, its obligations under the Equity Administration Agreement.
The Equity Administration Agreement provides that we will promptly reimburse ING Group for the cost of any liabilities satisfied by ING Group that are, or that have been made pursuant to the Equity Administration Agreement, our responsibility and that ING Group shall promptly reimburse us for the cost of any liabilities satisfied by us that are, or that have been made pursuant to the Equity Administration Agreement, the responsibility of ING Group.
The Equity Administration Agreement has been filed as an exhibit to the registration statement of which this prospectus forms a part.
Master Claim Agreement
In 2012, we entered into an agreement with ING Group and ING Insurance Eurasia N.V. to allocate responsibility among the parties with respect to any litigation against a party (or its subsidiaries) when the party that is named as a defendant in the litigation contends that the litigation in question should be the responsibility of one or more of the other parties.
The Master Claim Agreement has been filed as an exhibit to the registration statement of which this prospectus forms a part.
Historical Related Party Transactions
Financing Arrangements
We previously entered into several intercompany lending and guarantee arrangements with ING Group, ING (succeeded by NN Group), a wholly owned subsidiary of ING Group and our previous indirect parent, and with ING Bank, a wholly owned subsidiary of ING Group. While we have taken a number of steps to replace certain of these arrangements with standalone financing in connection with our initial public offering, we expect to retain direct financing and guarantee arrangements with ING Group, ING V and ING Bank for some period of time.
Guarantees
ING V or ING Group has guaranteed the obligations of the Company and its subsidiaries under various debt instruments and derivative contracts. Additionally, in some circumstances, ING Bank, ING Group, or another subsidiary of ING Group has provided a guarantee of another party’s obligation to the Company. Certain of these guarantees are described below. Unless otherwise stated, figures are presented as of December 31, 2013.
| • | ING Group guarantees approximately $506.1 million par amount of Aetna Notes. See “—Continuing Relationship with ING Group—Shareholder Agreement—Provisions with respect to certain obligations of the Company guaranteed by ING Group or its subsidiaries—Aetna Notes”. |
| • | ING V was the guarantor for the Company’s $3.0 billion commercial paper facility. This facility, along with the ING V guarantee, was terminated in October 2013 and had no amounts outstanding for some time before such termination. Prior to such termination, in connection with this guarantee, the Company paid ING V 10 basis points on the outstanding balance of the commercial paper program, or approximately $20,000, $0.5 million and $1.1 million during 2013, 2012 and 2011, respectively. ING Capital Markets LLC, a wholly owned subsidiary of ING Bank, acted as a dealer on the facility. |
| • | ING V provided a guarantee to Deutsche Bank AG of the Company’s obligations under a $350.0 million LOC facility issued by Deutsche Bank AG used to support the reinsurance obligation of Whisperingwind I, a captive reinsurer of the Company. As a result of a third-party transaction that |
-307-
Table of Contents
| closed on September 6, 2012, this LOC facility, and thus the ING V guarantee, were terminated. See “Management’s Discussion and Analysis of Financial Condition and Results of Operations—Liquidity and Capital Resources—Reinsurance Subsidiaries—ING U.S., Inc. Credit Support”. |
| • | ING V provided a guarantee to ING Bank of the Company’s obligations with respect to the $30.1 million in LOCs outstanding as of December 31, 2012 under a bi-lateral credit facility between the Company and ING Bank. In January 2013, $15.1 million in LOCs were cancelled. In January 2014, the remaining $15.0 million LOC was cancelled, and thus the ING V guarantee was terminated. No fees were paid by the Company to ING V with respect to this guarantee. |
| • | ING V was previously the guarantor of the obligations of Lion Custom Investments LLC, a wholly owned subsidiary of the Company, under its ISDA master agreements with various unaffiliated counterparties. No fees were paid with respect to these guarantees. These guarantees were all terminated on or before May 14, 2013. |
| • | ING Financial Products Company (“FPC”), a wholly owned subsidiary of ING U.S., Inc., has sold protection under certain credit default swap derivative contracts that were previously supported by a guarantee provided by ING V and now NN Group. Between September and December 2013, the guarantee provided by ING V on $1.0 billion notional of sold protection was replaced with guarantees provided by ING U.S., Inc. The Company purchased protection under one credit default swap derivative contract that is still supported by the NN Group guarantee. The maximum potential exposure to NN Group under the guaranteed swap is limited to swap premiums to be paid, or approximately $43.5 million. The swap guaranteed by NN Group, is scheduled to terminate in or prior to 2018. No fees have been or are paid with respect to these guarantees. |
Letter of Credit Facilities
From time to time, we have entered into LOC facilities with ING Bank to provide for statutorily required reserves at our captive reinsurance subsidiaries. The terms of these LOC facilities, including fee provisions, are consistent with terms that would be entered into between arm’s-length unaffiliated parties.
On April 20, 2012, the Company entered into a Senior Unsecured Credit Facility, comprised of a Revolving Credit Agreement and a Term Loan Agreement, with a syndicate of banks, including ING Bank, which replaced financing that was either internally funded or guaranteed by ING V. (See “Management’s Discussion and Analysis of Financial Condition and Results of Operations—Liquidity and Capital Resources—Senior Unsecured Credit Facility”.) ING Bank committed up to $250.0 million in financing as a member of the syndicate which entered into the Senior Unsecured Credit Facility. ING Bank acted as Joint Lead Arranger, Joint Book Manager, and Documentation Agent for these transactions. For these services, ING Bank received various fees totaling $3.3 million. On April 20, 2012 the Company replaced $1.4 billion of LOCs issued under the $2.5 billion Syndicated LOC Facility entered into on May 4, 2010 (described below), with LOCs issued under the Revolving Credit Agreement. (See “Management’s Discussion and Analysis of Financial Condition and Results of Operations—Liquidity and Capital Resources—Senior Unsecured Credit Facility—Amended and Restated Credit Agreement”.) The Revolving Credit Agreement was amended and restated as of February 14, 2014 and ING Bank remains a lender under the amended and restated Revolving Credit Agreement and has committed up to $150 million as a syndicate member. ING Bank acted as Joint Lead Arranger, Joint Book Manager and Documentation Agent for the amended and restated Revolving Credit Agreement and received various fees of approximately $0.7 million related to its participation in the amended and restated Revolving Credit Agreement.
In June 2010, we consolidated and expanded two existing LOC facilities into a single bi-lateral LOC facility with ING Bank in an amount of approximately $2.3 billion. In May and December of 2011, this facility was amended to reduce the available credit to $1.6 billion and permit the issuance or increase of new LOCs until February 28, 2012. As of December 31, 2012, $30.1 million of LOCs issued under this facility remained outstanding. In January 2013, $15.1 million in LOCs were cancelled. The remaining $15.0 million LOC and, accordingly, the facility itself, was cancelled in January 2014.
-308-
Table of Contents
In July 2011, we entered into a bi-lateral LOC facility with ING Bank in the amount of $625.0 million, in connection with reinsurance treaties entered into by SLDI, and subsequently retroceded to Hannover Life (Ireland) Plc. See “Management’s Discussion and Analysis of Financial Condition and Results of Operations—Liquidity and Capital Resources—Credit Facilities and Subsidiary Credit Support Arrangements”. As part of this transaction, SLDI also assigned all cash flows related to the underlying business to ING Bank. This facility was originally to have expired on June 30, 2012. Effective October 4, 2012, the facility was reduced to $300.0 million and extended until June 30, 2013. Effective October 30, 2013, this facility and the outstanding LOCs thereunder were consolidated with the September 2008 LOC facility described below into a single $1.125 billion LOC facility with ING Bank (also described below).
In May 2010, we entered into a syndicated Letter of Credit facility of approximately $2.5 billion. Subsequently, in April 2012, this facility was replaced with the Revolving Credit Agreement described above, in an aggregate principal amount of $3.5 billion. Under the terms of the Amended and Restated Credit Agreement that was entered into in February 2014, an aggregate amount of up to $3.0 billion is available for issuances of LOCs. ING Bank was the lead or co-lead arranger for both the May 2010 and April 2012 syndicated facilities.
In September 2008, SLDI entered into a bi-lateral LOC facility with ING Bank in the amount of $825.0 million. This LOC facility was used to support the borrowing of securities from ING Bank that were used by the Master Trust as collateral for the reinsurance of business written by SLD. The Company provided a limited guarantee in favor of ING Bank on the return of securities to the extent that SLD drew on the collateral while receiving reinsurance payments when contractually due. Effective October 30, 2013, this facility and the outstanding LOCs thereunder were consolidated with the July 2011 facility described above into a single $1.125 billion LOC facility. As a result of the October 30, 2013 transaction, the Master Trust returned the securities and the guarantee provided by the Company was extinguished. The new facility provides $1.125 billion of capacity until 2020 and no parental or third party guarantees are provided.
In December 2011, SLDI entered into a contingent capital LOC facility with ING Bank in the amount of $1.5 billion. The contingent capital LOC was used to support the reinsurance obligations of SLDI to another of our wholly owned subsidiaries, ING USA, related to variable annuity cessions from ING USA to SLDI. On May 8, 2013, ING U.S., Inc. made a capital contribution to SLDI in the amount of $1.8 billion. Immediately thereafter, SLDI deposited the contributed capital as cash collateral into a funds withheld trust account to support its reinsurance obligation to ING USA related to variable annuity cessions from ING USA to SLDI. Following the deposit by SLDI of the contributed capital into the funds withheld trust account, the $1.5 billion contingent capital LOCs issued under the contingent capital LOC facility were cancelled and, on May 14, 2013, the $1.5 billion contingent capital LOC facility was terminated.
Intercompany Loans
In 2007, the Company entered into a $500.0 million par floating rate loan agreement with ING V under which the Company paid a variable rate of interest based on the three month LIBOR. Effective April 13, 2012, the term of the loan was extended until April 29, 2016. The Company had debt of $500.0 million as of December 31, 2012 and 2011, related to this loan agreement. As of May 31, 2013, the Company paid off $350 million of this loan and, on July 5, 2013, the Company paid off all remaining borrowings on this loan.
As of December 31, 2013, LOCs issued by ING Bank under the Revolving Credit Agreement were $150.3 million. As part of its participation in the Senior Unsecured Credit Facility described above, ING Bank funded $35.7 million of the total $500.0 million direct borrowings drawn from the Term Loan Agreement portion of the facility. In July 2012, all direct borrowing under the Term Loan Agreement were repaid and no direct borrowings remain thereunder.
The Company in the past borrowed funds from time to time from ING V under a facility loan agreement. The Company had debt of $3.7 billion as of December 31, 2010 related to this agreement. During 2011, the Company borrowed an additional $263.0 million under this facility, and ING V subsequently contributed all
-309-
Table of Contents
borrowings under the facility to the Company. The contributed debt, which had a book value and fair value of $4.0 billion, was immediately extinguished as a result of this contribution.
On April 9, 2009, the Company sold a funding agreement in the amount of $600.0 million to the Columbine Funding Trust (“CFT”), a special purpose Delaware business trust. CFT, in turn, issued a trust note to ING Bank, which was collateralized by all of the cash flows from the funding agreement and otherwise matched the terms of the funding agreement. The Company was not a party to the trust note. The funding agreement was scheduled to mature in April 2012; however it was terminated in May 2011 with an early termination fee of $8.6 million paid to ING Bank.
Securities Offerings
ING Financial Markets LLC (“ING Financial Markets”), a non-subsidiary affiliate of ING U.S., Inc., served as a Joint Book Running Manager in both the 2018 Notes and 2022 Notes offerings and as a Senior Co-Manager in the 2043 Notes and 2053 Notes offerings and received $0.3 million, $0.3 million, $0.02 million and $0.2 million, respectively, for its services, on terms no more favorable than those received by any of the non-affiliated bookrunners.
ING Financial Markets was one of the participating underwriters of our initial public offering and follow-on offering and received $1.3 million and $0.5 million, respectively, in commission from the Company on that portion of the offered shares sold by the Company, on terms no more favorable than those received by any of the non-affiliated underwriters.
Derivative and Swap Agreements
The Company is or has been party to several derivative contracts with NN Group and ING Bank and one or more of ING Bank’s subsidiaries. Each of the transactions entered into pursuant to these contracts was entered into as a result of a competitive bid, which included unaffiliated counterparties. The Company is exposed to various risks relating to its ongoing business operations, including but not limited to interest rate risk, foreign currency risk, and equity market risk. To manage these risks, the Company uses various strategies, including derivatives contracts, certain of which are with related parties, including interest rate swaps, equity options and currency forwards.
As of December 31, 2013, 2012 and 2011, the outstanding notional amounts of derivative contracts with NN Group, ING Bank and one or more of ING Bank’s subsidiaries were approximately $518.9 million (consisting of interest rate swaps of $328.8 million and equity options of $190.1 million), $2.1 billion (consisting of interest rate swaps of $1.9 billion and equity options of $265.7 million) and $1.4 billion (consisting of interest rate swaps of $1.0 billion and equity options of $384.6 million), respectively.
As of December 31, 2013, 2012 and 2011 the market values for these contracts were $10.5 million, $15.6 million and $7.9 million, respectively. For the years ended December 31, 2013, 2012 and 2011, the Company recorded net realized capital gains (losses) of $1.7 million, $20.1 million and $376.4 million, respectively, in respect of derivative contracts with ING Bank and NN Group.
Alt-A Back-up Facility
On January 26, 2009, ING Group, for itself and on behalf of certain subsidiaries, including the Company, reached an agreement with the Dutch State on an Illiquid Asset Back Up Facility (the “Alt-A Back-up Facility”) regarding Alt-A RMBS owned by subsidiaries, including the Company. Pursuant to this transaction, the Company transferred all risks and rewards on 80% of a $4.5 billion par Alt-A RMBS portfolio to ING Support Holding, B.V. (“ING Support Holding”), a wholly owned subsidiary of ING Group by means of the granting of a participation interest to ING Support Holding. ING Group and ING Support Holding entered into a back-to-back
-310-
Table of Contents
arrangement with the Dutch State on this 80%. As a result of this first transaction, the Company retained 20% of the exposure for any results on the $4.5 billion Alt-A RMBS portfolio.
The purchase price for the participation payable by the Dutch State was set at 90% of the par value of the 80% interest in the securities as of that date. This purchase price was payable in installments, was recognized as a loan granted to the Dutch State with a value of $3.3 billion, and was recorded as Loan—Dutch State Obligation on the Consolidated Balance Sheets (referred to as the Dutch State loan obligation in this prospectus). Under the transaction, other fees were payable by both the Company and the Dutch State. The Company incurred net fees of $6.1 million, $8.3 million and $9.4 million in the years ended December 31, 2012, 2011 and 2010, respectively.
The Company executed a second transaction effective January 26, 2009, in which an additional $445.9 million par Alt-A RMBS portfolio owned by the Company was sold to ING Direct Bancorp. ING Direct Bancorp paid cash in the amount of $321.0 million for 80% of the Company’s additional $445.9 million par Alt-A RMBS and included those purchased securities as part of its Alt-A RMBS portfolio sale to the Dutch State. ING Direct Bancorp paid cash in the amount of $54.3 million and retained the remaining 20% of this Alt-A RMBS portfolio.
Upon the closing of the $4.5 billion par and the $445.9 million par transactions on March 31, 2009, the Company recognized a gain of $844.0 million, as the securities were impaired and written down to fair value in 2008.
On November 13, 2012, ING Group, ING Support Holding, ING Bank and the Company entered into restructuring arrangements with the Dutch State, which closed the following day (collectively, the “Termination Agreement”). Pursuant to the Termination Agreement, the Company sold the Dutch State Obligation to ING Support Holding at fair value and transferred legal title to 80% of the securities subject to the Alt-A Back-up Facility to ING Bank. The restructuring resulted in an immaterial pre-tax loss. Following the Termination Agreement, the Company retains ownership of 20% of the Alt-A RMBS from the first transaction and had a right to sell these securities, subject to a right of first refusal granted to ING Bank. Effective March 14, 2014, the right of first refusal granted to ING Bank was terminated and the Company may freely dispose of the securities.
Asset Management Arrangements
Prior to the Termination Agreement, our Investment Management business managed the underlying assets and provided services related to the Company’s securities subject to the Alt-A Back-up Facility pursuant to services agreements with each of the participating subsidiaries. We did not include these underlying assets whose beneficial ownership had been transferred (as described herein) in our calculation of AUM or AUA.
As part of ING Group’s divestiture of ING Direct U.S., ING Group, ING Bank and ING Direct U.S. entered into an agreement with the Dutch State similar to the Termination Agreement with respect to the Alt-A RMBS owned by ING Direct U.S. (the “ING Direct Restructuring”). As part of the ING Direct Restructuring, in February 2012 our Investment Management business entered into an agreement (the “Alt-A Asset Management Agreement”) with ING Bank pursuant to which it managed the assets transferred to ING Bank from ING Direct U.S. In November 2012, in connection with the Termination Agreement, this Alt-A Asset Management Agreement was amended to provide that our Investment Management business would also manage the assets transferred to ING Bank as part of the Termination Agreement. For the years ended December 31, 2013 and 2012, ING Bank paid us approximately $5.5 million and $7.7 million, respectively, in fees related to the Alt-A Asset Management Agreement.
Transition Services Agreements
In 2009, ING Group announced that it would begin the process of separating its insurance and banking businesses and divesting certain businesses (See “Organizational History and Structure—Plan of Divestment
-311-
Table of Contents
from ING Group”). As part of this process, we entered into a number of transition services agreements with our non-U.S. affiliates to continue to provide or receive services for certain periods. Pursuant to these arrangements, we benefited from certain services from such affiliates related to risk management, capital planning and corporate governance. We have also provided certain administration and consulting services to ING V related to ING Group’s divested Latin American businesses see below “—Latin America Service Arrangements”. In addition, we previously provided investment advisory and client solicitation services to ING Bank pursuant to a transition services agreement. With the exception of certain Latin America-related services, these arrangements expired on or before December 31, 2012. See “—Latin America Service Arrangements.”
Agreements related to ING Group Divestitures
In recent years, ING Group has divested several businesses and has agreed in certain cases with the buyers of the divested businesses to observe certain non-competition and other restrictions. We are subject to certain of those restrictions, the material aspects of which are indicated below:
Sale of ING Direct (Online US Retail Banking)
Until the earlier of February 17, 2017 and the date ING Group ceases to own 50% or more of the Company’s voting power or ceases to have the power to appoint the majority of the Company’s Board, we may not, within the United States, accept retail bank deposits or operate an online securities brokerage or mortgage or consumer lending business. There are a number of exceptions to these restrictions. For instance, we may continue to carry on any businesses in which we were actively engaged or were actively contemplating on June 16, 2011, even if they would otherwise violate the restrictions. Similarly, we may acquire a business as long as a significant portion of such business’ revenues does not come from competing operations or we divest the competing operations. We also may hold minority, passive investment positions in competing businesses.
Also, until February 17, 2017, we may not adopt, use or attempt to register any trademark, service mark or domain name in the United States, its territories or possessions that consists of or contains (i) an orange sphere, orange ball or similar orange object, or (ii) the word “orange” in connection with promoting retail banking products, although there are no restrictions on our use of the color orange. There are also certain restrictions on the use of certain domain names, trademarks, and other intellectual property rights.
Advisory Transactions
Several of our asset management subsidiaries have served as investment managers or sub-managers, investment advisors or sub-advisors, and portfolio managers or sub-managers for various funds pertaining to the asset management subsidiaries of ING Group or the general and separate accounts of non-U.S. insurance company subsidiaries of ING Group. The amount of fees we receive depends, in part, on the performance of the funds or the returns earned on the accounts which our subsidiaries are advising.
Fee and Revenue Sharing
Some of our asset management subsidiaries serve as co-managers or co-advisors for funds alongside other non-U.S. asset management subsidiaries of ING Group. For the services rendered as co-managers, we have agreed to share fees or revenues with our related party co-manager or co-advisor. Similarly, when asset management subsidiaries of ING Group serve as sub-advisors for our funds, we have entered into revenue sharing agreements, in which we receive a portion of the fees earned by the sub-advisor in return for hiring them as sub-advisor.
Non-Advisory Services
Several of our asset management subsidiaries have also provided and continue to provide non-advisory services to funds and asset management subsidiaries of ING Group. These services generally include, but are not
-312-
Table of Contents
limited to, providing research materials and recommendations, trading services, legal and tax advice, sales support services, compliance support and back office and administrative services.
Distribution and Solicitation Agreements
Several of our asset management subsidiaries are parties to distribution and/or solicitation agreements with non-U.S. asset management subsidiaries of ING Group through which these non-U.S. asset management subsidiaries of ING Group may distribute or sell our asset management products or strategies outside of the United States. Likewise, our U.S. asset management subsidiaries may distribute or sell products or strategies of ING Group’s non-U.S. asset management subsidiaries to U.S.-based clients and investors.
Allocated Expenses
With respect to these asset management arrangements, we previously received allocations of expenses from affiliates located outside of U.S. for staff and projects costs. No amounts were paid or received to or from non-U.S. affiliates during 2013. For the years ended December 31, 2012 and 2011, we paid our non-U.S. affiliates $0.4 million and $2.9 million, respectively, under these arrangements.
Reinsurance Agreements
Three of our insurance subsidiaries, RLI, ReliaStar Life Insurance Company of New York, and SLD, are parties to life reinsurance treaties with ING Re (Netherlands) N.V. (“ING Re”), a wholly owned reinsurance subsidiary of ING Group. These reinsurance treaties are all either yearly or monthly renewable term reinsurance treaties, and all of these treaties were closed for new business as of December 31, 2010. Although there are no new additional risks ceded under these agreements, the reinsurance of the risks already ceded will continue until the underlying policies lapse. In connection with these reinsurance treaties, our subsidiaries together paid premiums to ING Re of $10.4 million, $8.9 million and $9.3 million during the years ended December 31, 2013, 2012 and 2011, respectively.
Transfer Pricing Agreement
Prior to our initial public offering we were a party to a transfer pricing agreement between the Company and ING Group, pursuant to which ING Group charged us certain specified amounts for various services provided by the ING Group head office. These services included tax services, financial controls, acquisitions and divestments, vendor management, capital management general administrative services, human resources, corporate communications, and audit services among others. The total charges for the services provided pursuant to the transfer pricing agreement are a part of the administrative overhead allocation described below. We no longer make payments to ING Group under this agreement.
Compensation and Other Arrangements Concerning Employees
We have maintained human resources-related arrangements with ING Group in three primary areas: (i) long-term compensation for our employees, (ii) expatriate relationships and (iii) provision of services to employees of our former affiliates in Latin America (discussed below).
Incentive Compensation
Our employees have participated in certain of ING Group’s long-term incentive compensation programs. Following our initial public offering, this participation is governed by the Equity Administration Agreement. See “—Continuing Relationship with ING Group—Equity Administration Agreement.” We pay ING Group a recharge expense amount, which is an interest charge on a percentage of our outstanding stock options. This payment to ING Group was approximately $0.1 million, $2.1 million and $3.1 million for the years ended December 31, 2013, 2012 and 2011, respectively. Such payments are now made pursuant to the Equity Administration Agreement.
-313-
Table of Contents
When our employees or retirees receive payments through any of the long-term incentive plans managed by ING Group, ING Group reimburses the Company for amounts paid to employees. This reimbursement was approximately $53.4 million, $31.6 million and $10.9 million for the years ended December 31, 2013, 2012 and 2011, respectively. Such payments are now made pursuant to the Equity Administration Agreement.
Expatriate Relationships
During 2013, there were four employees originally hired by the Company who worked at other affiliates within ING Group; however, as of December 31, 2013, none of these employees were considered to be employees of the Company. Two left ING Group entirely while two were hired directly by ING Group affiliates. During the first three months of 2013, we hosted one employee originally hired elsewhere within ING Group (who has since become an employee of the Company). Any salary, tax and other expenses related to these expatriate arrangements were reimbursed to the entity incurring the cost. For the year ended December 31, 2013 we received approximately $1.7 million in reimbursements for such expenses while paying out $2.1 million; for the year ended December 31, 2012, we received approximately $4.9 million in reimbursements for such expenses while paying out $4.0 million; and for the year ended December 31, 2011, we received $10.4 million, while paying out $9.3 million.
Affiliate Loan Transaction with Named Executive Officer
One of our named executive officers has entered into an unsecured loan arrangement with a banking subsidiary of ING Group. Such loan was made in the ordinary course of business, was made on substantially the same terms, including interest rates, as those prevailing at the time for comparable loans made by the banking subsidiary with persons unrelated to it, and did not involve more than the normal risk of collectability or present other unfavorable features. We disclaim any participation in the transaction.
Latin America Service Arrangements
In 2009, the Company entered into an agreement with a Latin American subsidiary of ING Group, pursuant to which the Company agreed to provide a variety of services to its Latin American affiliates, including personnel, legal, compliance, IT, finance and accounting and other services. This agreement was terminated upon the divestiture of ING Group’s Latin American businesses in December 2011, at which time the Company entered into a transition services agreement with a subsidiary of ING Group to continue providing those services with respect to certain legacy operations. That transition services agreement, and the services provided thereunder, were terminated as of December 31, 2013. As part of this agreement, the Company was reimbursed $1.7 million for expenses incurred during the year ended December 31, 2013 and $30.1 million for expenses incurred during the year ended December 31, 2012. In addition, as a result of a separate understanding between the Company and ING Group, the Company was also reimbursed an additional $22.0 million for expenses incurred by the Company during 2011 to 2013.
Sourcing/Procurement
We contract directly for most of our strategic sourcing and procurement needs. In several instances, we have entered into consolidated global agreements with ING Bank as the contracting entity to achieve greater leverage. In some cases, we pay directly to vendors based on pricing negotiated by ING Group. In other cases, we pay fees to ING Bank in consideration for our participation in these global arrangements. These global arrangements cover a variety of sourcing needs, including software licenses, information technology service and support, audit services and market data services. We reimbursed ING Bank approximately $1.3 million, $3.2 million and $7.1 million for the years ended December 31, 2013, 2012 and 2011, respectively. In many cases, we have existing relationships with these vendors and have begun to contract directly with them.
-314-
Table of Contents
Insurance Coverage
The Company continues to benefit from the Risk Management Program (“RMP”) of ING Group (a self-insured insurance program) with respect to professional liability and employment practices-related claims for wrongful acts that occurred prior to May 2, 2013. This coverage will cease as of December 31, 2014. The RMP insurance policies and certain endorsements related to the Company were issued directly by a third party insurer to the Company, which has paid premiums directly to a non-affiliated broker which, in turn, has remitted such premiums directly to the insurer. The insurer, in turn, cedes 100% of the RMP risks, along with 100% of the remitted premiums, to ING Re. The annual premiums paid by the Company include taxes, fees and premiums. The RMP coverage applies to (i) any claims reported under the RMP prior to May 2, 2013 and (ii) claims alleging wrongful acts occurring prior to May 2, 2013 and reported under the professional liability and employment practices liability coverages of the RMP reported on or before December 31, 2014. On January 1, 2015, reporting periods for claims made under the professional liability and employment practices liability RMP policies will terminate though any previously reported claims will remain covered by the RMP.
Given our departure from participation in the RMP, the Company has taken out a stand-alone insurance program insuring professional liability, employment practices liability and network security/cyber liability claims arising from wrongful acts that occur on or after May 2, 2013. The Company has also taken out a stand-alone fidelity/crime program that covers all claims discovered on or after May 2, 2013. The Company also maintains a separate, standalone directors and officers liability insurance program and a separate, standalone fiduciary liability insurance program, each of which is issued by non-affiliated providers. Additionally, directors and officers of the Company designated by ING Group are eligible for excess coverage under the “Side A” directors and officers and fiduciary liability insurance policy issued to ING Group by non-affiliated providers.
Intellectual Property
We frequently make use of trademarks and other intellectual property owned by ING Group. Prior to our initial public offering, there were no formal, written license agreements in place between the Company and ING Group, although we followed brand guidelines as specified in the Trademark License Agreement concluded between ING Group and NN Group. Our use of trademarks and intellectual property owned by ING Group is now governed by the IP Agreement described above under “—Continuing Relationship with ING Group—Transitional Intellectual Property License Agreement”. We have not previously paid license fees for the use of ING Group intellectual property and will not be required to do so pursuant to the IP Agreement.
ING Global Network
Our Employee Benefits business, through our subsidiary, RLI, participates in a worldwide insurance network offering multinational pooling arrangements to global corporate clients. This network, called ING Global Network, is co-owned in equal portions by RLI, Nationale-Nederlanden Nederland B.V. (a subsidiary of ING Group) and an unaffiliated insurance company, and profits and losses of the network are split accordingly.
Administrative Overhead Allocations
Previously, we made use of various other administrative and corporate services provided by non-U.S. affiliates of ING Group. We did not reimburse our affiliate service providers pursuant to formal written agreements but through accounting allocations. The total net allocations were approximately $2.2 million, $6.6 million and $25.6 million for the years ended December 31, 2013, 2012 and 2011, respectively. These allocations will not continue in 2014.
-315-
Table of Contents
Revenues and Expenses Associated with Related Party Transactions
The approximate net fees and costs received or (paid), or intercompany charges, for our various arrangements with ING Group and its affiliates, including NN Group, are presented in the table below.
| ($ in millions) | Year Ended December 31, | |||||||||||
| 2013 | 2012 | 2011 | ||||||||||
| Types of Related Party Transactions |
||||||||||||
| Financing arrangements |
$ | (43.8 | ) | $ | (111.2 | ) | $ | (98.6 | ) | |||
| Fees related to Alt-A Back-up Facility |
— | (6.1 | ) | (8.3 | ) | |||||||
| Revenues related to the Alt-A Back-up Facility |
5.5 | 7.7 | — | |||||||||
| Transition services arrangements with affiliates (excluding Latin America human resources-related services set forth below) |
0.3 | (3.9 | ) | (5.4 | ) | |||||||
| Advisory, sub-advisory, distribution solicitation and portfolio management agreements fees |
10.9 | 11.6 | 2.8 | |||||||||
| Reinsurance Transactions |
(10.4 | ) | (8.9 | ) | (9.3 | ) | ||||||
| Human resources services and compensation arrangements (not including Latin America Services Arrangements) |
(0.1 | ) | (2.1 | ) | (3.1 | ) | ||||||
| Latin America human resources services arrangements |
— | (1) | 22.0 | (1) | (24.6 | )(1) | ||||||
| Sourcing/procurement services |
(1.3 | ) | (3.2 | ) | (7.1 | ) | ||||||
| Real estate |
— | — | (0.1 | ) | ||||||||
| Insurance policies |
(5.6 | ) | (5.8 | ) | (4.5 | ) | ||||||
| Other administrative services, overhead allocations |
(2.2 | ) | (6.6 | ) | (25.6 | ) | ||||||
|
|
|
|
|
|
|
|||||||
| Total |
$ | (46.7 | ) | $ | (106.5 | ) | $ | (183.8 | ) | |||
|
|
|
|
|
|
|
|||||||
| (1) | ING Group reimbursed ING U.S. for the full $1.7 million of expenses incurred under the Latin America transition services agreement referred to above. Also, based on agreements reached with ING Group (see “—Latin America Service Arrangements”) during 2012, the Company was reimbursed for expenses incurred in 2011, 2012 and 2013. |
Related Party Transaction Approval Policy
Our Board of Directors has adopted a written related party transaction approval policy pursuant to which an Independent Committee of our Board of Directors reviews and approves or takes such other action as it may deem appropriate with respect to the following transactions:
| • | a transaction in which we or one or more of our subsidiaries is a participant and which involves an amount exceeding $120,000 and in which any of our directors, executive officers, or 5% stockholders or any other “related person” as defined in Item 404 of Regulation S-K (“Item 404”), has or will have a direct or indirect material interest; |
| • | any material amendment, modification or extension of the Shareholder Agreement, the Equity Administration Agreement, the Registration Rights Agreement or the Transitional Intellectual Property License Agreement; and |
| • | any other transaction that meets the related party disclosure requirements of the SEC as set forth in Item 404. |
-316-
Table of Contents
The policy provides that an investment by a director or executive officer in a fund or other investment vehicle sponsored or managed by the Company or by one or more of its subsidiaries shall not be deemed to be a related party transaction if:
| • | such investment is made pursuant to the Company’s 401(k) plan, Deferred Compensation Savings Plan or any other similar type of Company-sponsored employee or director plan; or |
| • | such investment is made on terms and conditions that are in all material respects not more favorable to such director or executive officer than are available to investors that are not employed by or affiliated with the Company or any of its subsidiaries. |
This policy sets forth factors to be considered by the Independent Committee in determining whether to approve any such transaction, including the nature of our and our subsidiaries’ involvement in the transaction, whether we or our subsidiaries have demonstrable business reasons to enter into the transaction, whether the transaction would impair the independence of a director and whether the proposed transaction involves any potential reputational or other risk issues.
To simplify the administration of the approval process under this policy, the Independent Committee may, where appropriate, establish guidelines for certain types of related party transactions or designate certain types of such transactions that will be deemed pre-approved. This policy also provides that the following transactions are deemed pre-approved:
| • | decisions on compensation or benefits or the hiring or retention of our or any of our subsidiaries’ directors or executive officers, if approved by the applicable board committee; |
| • | the indemnification and advancement of expenses pursuant to our amended and restated certificate of incorporation, by-laws or an indemnification agreement; and |
| • | transactions where the related person’s interest or benefit arises solely from such person’s ownership of our securities and holders of such securities receive the same benefit on a pro rata basis. |
The Independent Committee is currently comprised of Messrs. Hubbell, Griswell and Zweiner. Mr. Hubbell, as “lead director,” is the chairperson of the Independent Committee. A director on the Independent Committee who has an interest in a related party transaction being considered by the Independent Committee, will not participate in the consideration of that transaction unless requested by the chairperson of the Independent Committee.
This policy does not apply to the implementation or administration of intercompany agreements, including the Shareholder Agreement, the Equity Administration Agreement, the Registration Rights Agreement and the Transitional Intellectual Property License Agreement. Our directors who are also senior executives or directors of ING Group or any of its subsidiaries may participate in the negotiation, execution, implementation, amendment, modification, or termination of these intercompany arrangements, as well as in any resolution of disputes thereunder, on behalf of either or both of us and ING Group or any of its subsidiaries, in each case under the direction of the Independent Committee or the comparable committee of the board of directors of ING Group.
Our amended and restated certificate of incorporation contains limitations on the obligations of our directors who have certain relationships with ING Group with respect to certain corporate opportunities.
-317-
Table of Contents
BENEFICIAL OWNERSHIP OF COMMON STOCK AND SELLING STOCKHOLDER
Immediately following the offering and the Direct Share Buyback, ING Group will own approximately 45% of our outstanding common stock, assuming no exercise by the underwriters of their option to purchase additional shares, and approximately 43% of our common stock if the underwriters exercise their option to purchase additional shares in full.
ING Group is selling 26,500,000 shares of our common stock in this offering, assuming no exercise by the underwriters of their option to purchase additional shares.
The following table presents information as of March 1, 2014, 2014 regarding the beneficial ownership of our common stock by:
| • | all persons known by us to own beneficially more than 5% of our common stock; |
| • | each of our named executive officers and directors (including those who we expect will be our named executive officers and directors upon completion of the offering); and |
| • | all executive officers and directors as a group. |
For purposes of the following table, beneficial ownership is determined in accordance with Rule 13d-3 under the Exchange Act, which includes in a person’s beneficial ownership any shares of common stock subject to options held by that person that are currently exercisable or are exercisable within 60 days of March 1, 2014 but does not deem such shares to be outstanding for purposes of calculating any other person’s percentage ownership of common stock.
In the table below, the number of shares shown under the column “Shares Being Sold by the Selling Stockholder in the Direct Share Buyback” is based on an assumed per share repurchase price of $35.60, the closing price per share of our common stock on March 17, 2014, as reported by the NYSE. The actual number of shares repurchased in the Direct Share Buyback will be equal to $250 million divided by the per share proceeds, before expenses, to the Selling Stockholder in this offering, as shown on the cover of this prospectus.
-318-
Table of Contents
Unless otherwise indicated, the address of each beneficial owner presented in the table below is c/o ING U.S., Inc., 230 Park Avenue, New York, New York 10169.
| Shares of Common Stock Beneficially Owned Before the Completion of the Offering |
Shares Being Sold by Stockholder in the Offering |
Shares Being Sold by Stockholder in Direct Share Buyback |
Shares of Common Stock Beneficially Owned After Completion of the Offering |
|||||||||||||||||||||
| Name and Address of Beneficial Owners and Selling Stockholders |
Number of Shares |
Percentage of Class |
Number of Shares |
Number of Shares |
Number of Shares |
Percentage of Class |
||||||||||||||||||
| ING Groep N.V.(1) |
147,848,227 | 57 | % | 26,500,000 | 7,022,471 | 114,325,756 | 45 | % | ||||||||||||||||
| Named executive officers and directors (13 persons) |
||||||||||||||||||||||||
| Rodney O. Martin, Jr.(2) |
185,483 | * | — | — | 185,483 | * | ||||||||||||||||||
| Alain M. Karaoglan(3) |
65,721 | * | — | — | 65,721 | * | ||||||||||||||||||
| Ewout L. Steenbergen(4) |
30,491 | * | — | — | 30,491 | * | ||||||||||||||||||
| Mary E. Beams(5) |
62,785 | * | — | — | 62,785 | * | ||||||||||||||||||
| Jeffrey T. Becker(6) |
35,836 | * | — | — | 35,836 | * | ||||||||||||||||||
| Johannes (“John”) M.M. Boers(7) |
— | * | — | — | — | * | ||||||||||||||||||
| Patrick G. Flynn(8) |
2,350 | * | — | — | 2,350 | * | ||||||||||||||||||
| J. Barry Griswell(9) |
5,100 | * | — | — | 5,100 | * | ||||||||||||||||||
| Dirk (“Dick”) H. Harryvan(10) |
— | * | — | — | — | * | ||||||||||||||||||
| Frederick S. Hubbell(11) |
7,664 | * | — | — | 7,664 | * | ||||||||||||||||||
| Hendricus (“Henny”) A. Koemans(12) |
— | * | — | — | — | * | ||||||||||||||||||
| Willem (“Wilfred”) F. Nagel(13) |
— | * | — | — | — | * | ||||||||||||||||||
| David Zwiener(14) |
5,100 | * | — | — | 5,100 | * | ||||||||||||||||||
| All executive officers and directors (17 persons)(15) |
585,054 | * | — | — | 585,054 | * | ||||||||||||||||||
| * | Less than 1% |
| (1) | The principal business address of ING Group is Bijlmerplein 888, 1102 MG Amsterdam, The Netherlands. Prior to September 30, 2013, ING Group held its shares in the Company through ING Insurance International B.V., an indirect wholly owned subsidiary of ING Group. |
| (2) | In connection with his Deal Incentive Award, Mr. Martin received 205,128 restricted stock units. See “Compensation of Executive Officers and Directors—Employment Agreements—Employment Agreement of Mr. Martin”. Mr. Martin purchased 5,100 shares of common stock of the Company in our IPO. |
| (3) | In connection with his Deal Incentive Award, Mr. Karaoglan received 68,376 restricted stock units. See “Compensation of Executive Officers and Directors—Employment Agreements—Employment Agreement of Mr. Karaoglan”. Mr. Karaoglan purchased 5,100 shares of common stock of the Company in our IPO. |
| (4) | In connection with his Deal Incentive Award, Mr. Steenbergen received 41,026 restricted stock units. See “Compensation of Executive Officers and Directors—Compensation of Named Executive Officers—Grants of Plan Based Awards—Deal Incentive Awards”. Mr. Steenbergen purchased 2,350 shares of common stock of the Company in our IPO. As of March 1, 2014, Mr. Steenbergen was the beneficial owner of 32,711 shares of ING Group, our majority shareholder, which represent less than 1% of the outstanding ordinary shares of ING Group. These shares consist of 284 ordinary shares and 32,427 shares issuable upon the exercise of currently exercisable options. |
| (5) | In connection with her Deal Incentive Award, Ms. Beams received 76,923 restricted stock units. See “Compensation of Executive Officers and Directors—Employment Agreements—Employment Agreement of Ms. Beams”. Ms. Beams purchased 5,100 shares of common stock of the Company in our IPO. |
| (6) | In connection with his Deal Incentive Award, Mr. Becker received 41,026 restricted stock units. See “Compensation of Executive Officers and Directors—Compensation of Named Executive Officers—Grants of Plan Based Awards—Deal Incentive Awards”. Mr. Becker purchased 5,100 shares of common stock of the Company in our IPO. As of March 1, 2014, Mr. Becker was the beneficial owner of 50,318 shares of ING Group, our majority shareholder, which represent less than 1% of the outstanding ordinary shares of |
-319-
Table of Contents
| ING Group. These shares consist of 511 ordinary shares, 48,062 shares issuable upon the exercise of currently exercisable options and 1,732 shares which reflect units in the Company’s 401(k) plan that may be settled in ordinary shares following a termination of employment. |
| (7) | As of March 1, 2014, Mr. Boers was the beneficial owner of 80,157 shares of ING Group, our majority shareholder, which represent less than 1% of the outstanding ordinary shares of ING Group. These shares consist of 2,907 ordinary shares, 74,189 shares issuable upon the exercise of currently exercisable options and 3,061 deferred shares that have vested (but have been deferred until March 27, 2014). |
| (8) | Mr. Flynn purchased 2,350 shares of common stock of the Company in our IPO. As of March 1, 2014, Mr. Flynn was the beneficial owner of 85,084 shares of ING Group, our majority shareholder, which represent less than 1% of the outstanding ordinary shares of ING Group. These shares consist of ordinary shares. |
| (9) | Mr. Griswell purchased 5,100 shares of common stock of the Company in our IPO. |
| (10) | As of March 1, 2014, Mr. Harryvan was the beneficial owner of 190,088 shares of ING Group, our majority shareholder, which represent less than 1% of the outstanding ordinary shares of ING Group. These shares consist of 8,250 ordinary shares and 181,838 shares issuable upon the exercise of currently exercisable options. |
| (11) | In connection with his Deal Incentive Award, Mr. Hubbell received 2,565 restricted stock units. See “Compensation of Executive Officers and Directors—Compensation of Directors”. Mr. Hubbell purchased 5,100 shares of common stock of the Company in our IPO. As of March 1, 2014, Mr. Hubbell was the beneficial owner of 627,153 shares of ING Group, our majority shareholder, which represent less than 1% of the outstanding ordinary shares of ING Group. These shares consist of 201,128 ordinary shares owned directly by Mr. Hubbell, 262,002 ordinary shares owned indirectly by Mr. Hubbell through family and charitable trusts and 164,023 shares issuable upon the exercise of currently exercisable options. |
| (12) | As of March 1, 2014, Mr. Koemans was the beneficial owner of 90,364 shares of ING Group, our majority shareholder, which represent less than 1% of the outstanding ordinary shares of ING Group. These shares consist of 12,913 ordinary shares, 70,406 shares issuable upon the exercise of currently exercisable options and 7,045 deferred shares that have vested (but with respect to which settlement of 5,684 shares has been deferred until March 27, 2014 and settlement of 1,361 shares has been deferred until March 28, 2014). |
| (13) | As of March 1, 2014, Mr. Nagel was the beneficial owner of 147,474 shares of ING Group, our majority shareholder, which represent less than 1% of the outstanding ordinary shares of ING Group. These shares consist of 60,901 ordinary shares, 77,447 shares issuable upon the exercise of currently exercisable options and 9,126 deferred shares that have vested (but with respect to which settlement of 2,207 shares has been deferred until March 28, 2014, settlement of 2,336 shares has been deferred until May 16, 2017, settlement of 1,188 shares has been deferred until May 16, 2017 and settlement of 3,395 shares has been deferred until May 15, 2018). |
| (14) | Mr. Zwiener purchased 5,100 shares of common stock of the Company in our IPO. |
| (15) | In connection with their Deal Incentive Awards, certain of our directors and executive officers received 541,454 restricted stock units, which represent less than 1% of our outstanding common stock. As of March 1, 2014, our directors, executive officers and director nominees were the beneficial owners of 1,586,252 shares of ING Group, our majority shareholder, which represent less than 1% of the outstanding ordinary shares of ING Group. These shares consist of 400,400 directly owned ordinary shares, 262,002 ordinary shares owned indirectly through family and charitable trusts, 300 ordinary shares owned by immediate family members, 901,343 shares issuable upon the exercise of currently exercisable options, 19,232 deferred shares, and 2,975 shares which reflect units in the Company’s 401(k) plan that may be settled in ordinary shares following a termination of employment. |
-320-
Table of Contents
The provisions of our amended and restated certificate of incorporation and amended and restated bylaws and relevant sections of the DGCL are summarized below. The following description of our capital stock and provisions of our amended and restated certificate of incorporation and our amended and restated bylaws are only summaries of such provisions and instruments and in each case are qualified by reference to our amended and restated certificate of incorporation and our amended and restated bylaws that are filed as exhibits to the registration statement of which this prospectus is a part.
Authorized Capital Stock
Our authorized capital stock consists of 1,000,000,000 shares, including: (i) 900,000,000 shares of our common stock, $0.01 par value per share, and (ii) 100,000,000 shares of preferred stock, $0.01 par value per share. As of March 7, 2014, we had outstanding 261,675,811 shares of our common stock, held of record by three stockholders, including Cede & Co., the nominee of The Depository Trust Company, through which shares held in “street name” are held, and no shares of preferred stock outstanding.
Common Stock
Holders of our common stock are entitled to one vote per share on all matters submitted to a vote of stockholders, including the election of directors. Our common stockholders are not entitled to cumulative voting in the election of directors. Subject to preferences that may be applicable to any outstanding shares of preferred stock, holders of our common stock are entitled to receive ratably such dividends as may be declared by our Board of Directors out of funds legally available therefor if our Board of Directors, in its discretion, determines to issue dividends and only then at the times and in the amounts that our Board of Directors may determine. Upon the liquidation, dissolution or winding-up of our Company, the holders of our common stock are entitled to receive their ratable share of the net assets of our Company available after payment of all debts and other liabilities, subject to the prior preferential rights and payment of liquidation preferences, if any, of any outstanding shares of preferred stock. Holders of our common stock have no preemptive, subscription or redemption rights. There are no redemption or sinking fund provisions applicable to our common stock. The rights, preferences and privileges of the holders of our common stock are subject to, and may be adversely affected by, the rights of the holders of shares of any series of preferred stock that we may designate in the future.
Preferred Stock
Our Board of Directors has the authority, subject to the limitations imposed by Delaware law, without any further vote or action by our stockholders, to issue preferred stock in one or more series and to fix the designations, powers, preferences, limitations and rights of the shares of each series, including:
| • | dividend rates; |
| • | terms of, and conditions upon, dividends payable to holders; |
| • | conversion and exchange rights; |
| • | voting rights; |
| • | repurchase obligations of our Company; |
| • | terms of redemption and liquidation preferences; and |
| • | the number of shares constituting each series. |
Satisfaction of any dividend preferences of outstanding shares of preferred stock would reduce the amount of funds available for the payment of dividends on shares of our common stock. Holders of shares of preferred stock may be entitled to receive a preference payment in the event of our liquidation, dissolution or winding-up before any payment is made to the holders of shares of our common stock.
-321-
Table of Contents
Our Board of Directors may authorize the issuance of preferred stock with voting or conversion rights that could adversely affect the voting power or other rights of the holders of our common stock. The issuance of preferred stock, while providing flexibility in connection with possible acquisitions and other corporate purposes, could, among other things, have the effect of delaying, deferring or preventing a change in control of our company and may adversely affect the market price of our common stock and the voting and other rights of the holders of our common stock.
There are no current agreements or understandings with respect to the issuance of preferred stock, except as set forth under “Certain Relationships and Related Party Transactions—Relationship with ING Group following the Offering—Shareholder Agreement—Consent Rights”, and our Board of Directors has no present intentions to issue any shares of preferred stock.
Certain Anti-Takeover Provisions of our Amended and Restated Certificate of Incorporation, our Amended and Restated Bylaws and Applicable Law
Certain provisions of our amended and restated certificate of incorporation, amended and restated bylaws, Delaware law and insurance regulations applicable to our business may discourage or make more difficult a takeover attempt that a stockholder might consider in his or her best interest. These provisions may also adversely affect prevailing market prices for our common stock. We believe that the benefits of increased protection give us the potential ability to negotiate with the proponent of an unsolicited proposal to acquire or restructure us and outweigh the disadvantage of discouraging those proposals because negotiation of the proposals could result in an improvement of their terms.
For example, our amended and restated certificate of incorporation and by-laws prohibit stockholders from calling special meetings of our stockholders and, from and after such time as ING Group ceases to beneficially own at least 50% of our outstanding common stock, from taking action by written consent, which will occur upon completion of this offering and the Direct Share Buyback. Also, to the extent that our stockholders seek to amend our by-laws, our amended and restated certificate of incorporation requires the affirmative vote of not less than two-thirds of the outstanding shares entitled to vote on the matter.
Section 203 of the Delaware General Corporation Law
As a Delaware corporation, we are subject to Section 203 of the DGCL. In general, Section 203 prohibits a publicly held Delaware corporation from engaging in a “business combination” with an “interested stockholder” for a three-year period following the time that this stockholder becomes an interested stockholder, unless the business combination is approved in a prescribed manner. A “business combination” includes, among other things, a merger, asset or stock sale or other transaction resulting in a financial benefit to the interested stockholder. An “interested stockholder” is a person who, together with affiliates and associates, owns, or did own within three years prior to the determination of interested stockholder status, 15% or more of the corporation’s voting stock. Under Section 203, a business combination between a corporation and an interested stockholder is prohibited unless it satisfies one of the following conditions:
| • | before the stockholder became interested, the Board of Directors approved either the business combination or the transaction which resulted in the stockholder becoming an interested stockholder; |
| • | upon consummation of the transaction which resulted in the stockholder becoming an interested stockholder, the interested stockholder owned at least 85% of the voting stock of the corporation outstanding at the time the transaction commenced, excluding for purposes of determining the voting stock outstanding, shares owned by persons who are directors and officers; or |
| • | at or after the time the stockholder became interested, the business combination was approved by the Board of Directors of the corporation and authorized at an annual or special meeting of the stockholders by the affirmative vote of at least two-thirds of the outstanding voting stock which is not owned by the interested stockholder. |
-322-
Table of Contents
A Delaware corporation may “opt out” of Section 203 with an express provision in its original certificate of incorporation or an express provision in its certificate of incorporation or bylaws resulting from amendments approved by holders of at least a majority of the corporation’s outstanding voting shares. We have not elected to “opt out” of Section 203.
Board of Directors
Our amended and restated certificate of incorporation provides that the number of directors of the Company will be established from time to time pursuant to the Company’s bylaws. However, until such time as ING Group first ceases to own at least 20% of our outstanding common stock, the number of directors shall not be fewer than seven or greater than nine. See “Certain Relationships and Related Party Transactions—Relationship with ING Group Following the Offering—Shareholder Agreement—Board of Directors and ING Group Rights with Respect to Director Nominations”.
Exclusive Forum
Our amended and restated certificate of incorporation provides that, unless we consent in writing to the selection of an alternative forum, the Court of Chancery of the State of Delaware shall be the exclusive forum for (i) any derivative action or proceeding brought on our behalf, (ii) any action asserting a claim of breach of fiduciary duty owed by any of our directors, officers or other employees to us or to our stockholders, (iii) any action asserting a claim arising pursuant to any provision of the DGCL or (iv) any action asserting a claim governed by the internal affairs doctrine.
Insurance Regulations
The insurance laws and regulations of the various states in which the Company’s insurance subsidiaries are organized may delay or impede a business combination involving the Company. State insurance laws prohibit an entity from acquiring control of an insurance company without the prior approval of the domestic insurance regulator. Under most states’ statutes, an entity is presumed to have control of an insurance company if it owns, directly or indirectly, 10% or more of the voting stock of that insurance company or its parent company. These regulatory restrictions may delay, deter or prevent a potential merger or sale of our Company, even if our Board of Directors decides that it is in the best interests of stockholders for us to merge or be sold. These restrictions also may delay sales by us or acquisitions by third parties of our subsidiaries.
Limitation of Liability and Indemnification of Directors and Officers
Our amended and restated certificate of incorporation includes provisions that limit the personal liability of our directors for monetary damages for breach of their fiduciary duties as directors, except to the extent that such limitation is not permitted under the DGCL. Such limitation shall not apply, except to the extent permitted by the DGCL, to (i) any breach of a director’s duty of loyalty to us or our stockholders, (ii) acts or omissions not in good faith or that involve intentional misconduct or a knowing violation of law, (iii) any unlawful payment of a dividend or unlawful stock repurchase or redemption, as provided in Section 174 of the DGCL, or (iv) any transaction from which the director derived an improper personal benefit. These provisions will have no effect on the availability of equitable remedies such as an injunction or rescission based on a director’s breach of his or her duty of care.
Our amended and restated certificate of incorporation provides, and our amended and restated bylaws will provide, for indemnification, to the fullest extent permitted by the DGCL, of any person made or threatened to be made a party to any action, suit or proceeding by reason of the fact that such person is or was a director, officer, employee or agent of the Company, or, at the request of the Company, serves or served as a director, officer, employee or agent of another corporation, partnership, joint venture, trust or any other enterprise, against all expenses, judgments, fines, amounts paid in settlement and other losses actually and reasonably incurred in
-323-
Table of Contents
connection with the defense or settlement of such action, suit or proceeding. In addition, we intend to enter into indemnification agreements with each of our executive officers and directors pursuant to which we will agree to indemnify each such executive officer and director to the fullest extent permitted by the DGCL.
Insofar as indemnification for liabilities arising under the Securities Act may be permitted to directors, officers or persons controlling the Company pursuant to the foregoing provisions, the Company has been informed that in the opinion of the SEC such indemnification is against public policy as expressed in the Act and is therefore unenforceable.
Potential Business Opportunities
Our amended and restated certificate of incorporation provides that certain of our directors, who have also served or may serve as directors, officers, employees or agents of ING Group (“Overlap Directors”), are relieved of any obligation to refer potential business opportunities to the Company or to notify the Company of potential business opportunities of which they become aware, and they may instead refer such opportunities to ING Group at which time we will be deemed to have renounced any interest or right with respect to such potential business opportunity. The only exception to this waiver is in the case of a “Restricted Business Opportunity,” which is defined to mean a business opportunity (i) expressly presented or offered in writing to the Overlap Director solely in his or her capacity as a director of the Company and for the benefit of the Company; (ii) for which the Overlap Director believed that the Company possessed, or would reasonably be expected to be able to possess, the resources necessary to exploit; and (iii) substantially all of which, at the time it is presented to the Overlap Director, is, and is expected to remain, an opportunity relating to the retirement solutions, investment management and insurance solutions businesses actively engaged in by the Company in the United States as of April 30, 2013, provided, that the Company is still directly engaged in that business at the time the business opportunity is presented or offered to the Overlap Director.
Our amended and restated certificate of incorporation provides that any person purchasing or otherwise acquiring shares of our common stock, or any interest therein, is deemed to have notice of the provisions described under this “Potential Business Opportunities” caption and to have consented to such provisions.
Our amended and restated certificate of incorporation also provides that no contract, agreement, arrangement or transaction entered into between us and ING Group prior to the completion of our IPO shall be void or voidable or be considered unfair solely because ING Group is a party thereto or because any directors, officers or employees of ING Group were present at or participated in any meeting at which the contract, agreement, arrangement or transaction was authorized. To the extent permitted by law, no such contract, agreement, arrangement or transaction shall be considered to be contrary to any fiduciary duty of any Overlap Director and no Overlap Director shall have any fiduciary duty to us (or to any stockholder) to refrain from acting on behalf of the Company or ING Group in respect of any such contract, agreement, arrangement or transaction in accordance with its terms. Future contracts or transactions between the Company and ING Group shall not be void or voidable solely because a director or officer of ING Group is present at or participates in the meeting of the Company’s board of directors which authorizes the contract or transaction or because his or her votes are counted toward such authorization, provided that (i) the board of directors is aware of the material facts and the board or a committee in good faith authorizes the contract or transaction by a majority vote of the disinterested directors, (ii) the stockholders entitled to vote on such matter are aware of the material facts and specifically approve in good faith such contract or transaction, or (iii) the contract or transaction is fair to the Company at the time it is authorized, approved or ratified by the board of directors, a committee thereof, or the stockholders.
Ownership Limitations
Certain transfers of our securities could result in an “ownership change” for purposes of Section 382, which would materially limit the use of certain of the Company’s tax attributes, including certain NOLs and capital loss carryforwards. We expect that the completion of this offering and the Direct Share Buyback will result in such an
-324-
Table of Contents
“ownership change”, and, accordingly, the following provisions of our amended and restated certificate of incorporation (the “Ownership Limitations”), which were designed to reduce the possibility of such an event from occurring prior to the time that ING Group’s divestment would otherwise trigger the Section 382 limitation, will cease to be operative following the completion of this offering and the Direct Share Buyback. This is because, subject to their terms, the occurrence of such an ownership change causes the Ownership Limitations to expire.
These provisions of our amended and restated certificate of incorporation generally restrict any direct or indirect transfer of a direct or indirect interest (including a securities entitlement) in our common stock or other classes of stock then outstanding, and including the warrants, rights or options discussed below (collectively “Company Securities”) (such as transfers of our securities that result from the transfer of interests in other entities that own our common stock) if the effect would be to:
| • | increase the direct, indirect or constructive ownership by any Person (as defined below) to 4.99% or more of our common stock then outstanding or other classes of stock then outstanding (a “Five Percent Shareholder”); or |
| • | increase the percentage of our stock owned directly, indirectly or constructively by a Five Percent Shareholder. |
“Person” means any individual, firm, partnership, limited liability company, trust, association, limited liability partnership, corporation or other “entity” within the meaning of U.S. Treasury Regulation §1.382-3(a)(1)(i), and includes any successor (by merger or otherwise) of such entity. Restricted transfers include sales to Persons whose resulting percentage ownership (direct, indirect or constructive) of Company Securities would equal or exceed the 4.99% threshold discussed above, or to Persons whose direct or indirect ownership of our common stock would by attribution cause another Person to equal or exceed such threshold. Complicated stock ownership rules prescribed by the U.S. Internal Revenue Code (and U.S. Treasury Regulations promulgated thereunder) apply in determining whether a Person is a Five Percent Shareholder for purposes of the Ownership Limitations.
These transfer restrictions may result in the delay or refusal of certain requested transfers of our common stock, or prohibit ownership (thus requiring dispositions) of our common stock due to a change in the relationship between two or more persons or entities or to a transfer of an interest in an entity that, directly or indirectly, owns our common stock. The transfer restrictions will also apply to proscribe the creation, transfer or exercise of certain warrants, rights or options (which are broadly defined by Section 382) with respect to our securities (other than the warrants issued to ING Group in conjunction with our IPO) to the extent that, in certain circumstances, the creation, transfer or exercise of the warrant, right or option would result in a proscribed level of ownership.
Any direct or indirect transfer attempted in violation of the Ownership Limitations will be void as of the date of the prohibited transfer as to the purported transferee (or, in the case of an indirect transfer, the direct owner of our securities will be deemed to have disposed of, and required to dispose of, the excess stock (as defined below), with such disposition being deemed to occur simultaneously with the transfer), and the purported transferee (or in the case of any indirect transfer, the direct owner) will not be recognized as the owner of the securities owned in violation of the Ownership Limitations for any purpose, including for purposes of voting and receiving dividends or other distributions in respect of our Company Securities, or in the case of options, receiving our securities in respect of their exercise. We refer to the Company Securities purportedly acquired in violation of the Ownership Limitations as “excess stock.”
In addition to a prohibited transfer being void as of the date it is attempted, upon demand, the purported transferee must transfer the excess stock to our agent along with any dividends or other distributions paid with respect to such excess stock. Our agent is required to sell such excess stock in an arm’s-length transaction (or series of transactions) that would not constitute a violation under the Ownership Limitations. The net proceeds of
-325-
Table of Contents
the sale, together with any other distributions with respect to such excess stock received by our agent, after deduction of all costs incurred by the agent, will be distributed first to the purported transferee in an amount, if any, up to the cost (or, in the case of gift, inheritance or similar transfer, the fair market value of the excess stock on the date of the prohibited transfer) incurred by the purported transferee to acquire such excess stock, and the balance of the proceeds, if any, will be distributed to the transferor in the prohibited transfer, or to a charitable beneficiary if the transferor cannot be readily identified. If the excess stock is sold by the purported transferee, such person will be treated as having sold the excess stock on behalf of our agent, and will be required to remit all proceeds to our agent (except to the extent we grant written permission to the purported transferee to retain an amount, not to exceed the amount such person otherwise would have been entitled to retain had our agent sold such shares for an amount equal to the proceeds of such sale (taking into account the actual costs incurred by our agent)).
The transfer restrictions in the Ownership Limitations do not apply to (i) any transfer for which, prior to such transfer being consummated (or, in the case of an involuntary transfer, as soon as practicable after the transfer is consummated), our Board of Directors has granted its approval, (ii) a transfer pursuant to any transaction, including, but not limited to, a merger, consolidation, mandatory share exchange or other business combination in which all holders of our stock and other specified securities receive, or are offered the same opportunity to receive, cash or other consideration for all such Company Securities, and upon the consummation of which the acquiror owns at least a majority of the outstanding shares of our common stock, (iii) a transfer to any employee stock ownership or other employee benefit plan of the Company (or any entity or trustee holding shares of our common stock for or pursuant to the terms of any such plan or for the purpose of funding any such plan or funding other employee benefits for our employees), (iv) a transfer by ING Group or any of its subsidiaries (including by means of a transfer to any underwriter, dealer or initial purchaser), and (v) the issuance of shares of our common stock upon exercise of the warrants to be issued to ING Group in conjunction with our IPO. Transfers by underwriters, dealers or purchasers following any transfer referred to in clause (iv) remain subject to the Ownership Limitations.
The Ownership Limitations expire on the earliest of (i) the date of the occurrence of an ownership change resulting from the sale of our common stock by ING Group, which we expect will be the date of completion of this offering and the Direct Share Buyback, (ii) the date on which our Board of Directors receives, at its request, a report from our advisors that the Ownership Limitations are no longer necessary for the preservation of our tax attributes described above because of the amendment or repeal of Section 382 or any other change in law, (iii) the first day of a taxable year to which our Board of Directors receives a report, at its request, from our advisors that the tax attributes described above may no longer be carried forward, and (iv) such other date as our Board of Directors determines.
In addition, the Board of Directors may determine that transfer and ownership restrictions shall not apply to any particular transaction or transactions and such determination may be made prospectively or retroactively.
Warrants Issued to ING Group
In conjunction with our IPO, we issued to ING Group warrants exercisable for a number of shares of our common stock equal in the aggregate to 26,050,846 shares of our common stock. The current exercise price of the warrants is $48.75 per share of common stock, subject to adjustments, including for stock dividends, certain cash dividends, subdivisions, combinations, reclassifications and non-cash distributions. The warrants also provide for, upon the occurrence of certain change of control events affecting the Company, an increase in the number of shares to which a warrant holder will be entitled upon payment of the aggregate exercise price of the warrant. The warrants are exercisable starting on the first anniversary of the completion of our IPO (May 7, 2014) and expire on the tenth anniversary of the completion of our IPO (May 7, 2023). The warrants are net share settled, which means that no cash will be payable by a warrant holder in respect of the exercise price of a warrant upon exercise. Such warrant holder will receive the number of shares of common stock equal to the number of shares into which the warrant is exercisable less the number of shares having a value equal to the
-326-
Table of Contents
aggregate exercise price. The value of the shares for purposes of the net share settlement will be determined based on the volume-weighted average prices of shares of common stock on the NYSE (or such other principal stock exchange on which such shares are traded at the time of exercise) during the ten consecutive trading day period beginning on and including the trading day immediately following the exercise date).
Warrant holders are not entitled, by virtue of holding warrants, to vote, to consent, to receive dividends, if any, to receive notices as stockholders with respect to any meeting of stockholders or to exercise any rights whatsoever as our stockholders until they become holders of the shares of our common stock issued upon exercise of the warrants.
The warrants are not subject to any contractual restrictions on transfer. However, the warrants will be subject to the lock-up arrangement entered into by ING Group with the underwriters in connection with our IPO. See “Underwriting.” The warrants are not exercisable by ING Group or any of its affiliates before January 1, 2017, but are exercisable in accordance with their terms before January 1, 2017, by holders other than ING Group or its affiliates, if any. For so long as ING Group holds warrants, ING Group will have registration rights under the registration rights agreement we have entered into with ING Group, with respect to such warrants and the shares to be issued upon exercise thereof. See “—Registration Rights Agreement” below.
Registration Rights Agreement
Concurrently with our IPO, we entered into a registration rights agreement with ING Group, pursuant to which ING Group is able to require us to file one or more registration statements with the SEC covering the public resale of registrable securities beneficially owned by ING Group. Registrable securities consist of shares of our common stock, warrants to purchase shares of our common stock and the shares of our common stock issuable upon the exercise of such warrants. We will not be obligated to effect more than one demand registration, in addition to any registration on a shelf registration statement, in any six month period. We will be obligated to file a shelf registration statement, upon any request made by ING Group subsequent to the date that is one year from the date of the registration rights agreement (or, if earlier, the date on which we become eligible to use Form S-3 for the registration of securities). In addition, ING Group will have certain “piggyback” registration rights, pursuant to which it will be entitled to register the resale of its registrable securities alongside any offering of securities that we may undertake, and the amount of securities we may offer may be subject to “cutback” in certain such cases. These registration rights are transferable by ING Group. We will be responsible for the expenses associated with any sale under the agreement by ING Group, except for its legal fees and underwriting discounts, selling commissions and transfer taxes applicable to such sale. The registration rights agreement will terminate at such time as no registrable securities remain outstanding. We are registering this offering of our common stock by ING Group pursuant to a registration demand under the registration rights agreement.
Listing
Our common stock is listed on the NYSE under the symbol “VOYA”. We expect to rebrand from ING U.S. to Voya Financial over time following this offering.
Transfer Agent and Registrar
The transfer agent and registrar for our common stock is Computershare Trust Company, N.A. The transfer agent’s address is 250 Royall Street, Canton, MA 02021.
-327-
Table of Contents
MATERIAL U.S. FEDERAL TAX CONSIDERATIONS
FOR NON-U.S. HOLDERS OF OUR COMMON STOCK
This section summarizes material U.S. federal income and estate tax consequences of the acquisition, ownership and disposition of our common stock by a non-U.S. holder. You are a “non-U.S. holder” if you are, for U.S. federal income tax purposes, a beneficial owner of our common stock that is:
| • | a nonresident alien individual, |
| • | a foreign corporation, or |
| • | an estate or trust that in either case is not subject to U.S. federal income tax on a net income basis on income or gain from common stock. |
This section applies to you only if you acquire our common stock in this offering and you hold our common stock as a capital asset for U.S. federal income tax purposes.
This section does not consider the specific facts and circumstances that may be relevant to a particular non-U.S. holder and does not address the treatment of a non-U.S. holder under the laws of any state, local or foreign taxing jurisdiction and does not address the potential application of the Medicare contribution tax. This section is based on the tax laws of the United States, including the Internal Revenue Code of 1986, as amended, existing and proposed regulations, and administrative and judicial interpretations, all as of the date hereof. These laws are subject to change, possibly on a retroactive basis.
If a partnership holds our common stock, the U.S. federal income tax treatment of a partner will generally depend on the status of the partner and the tax treatment of the partnership. A partner in a partnership holding our common stock should consult its tax advisor with regard to the U.S. federal income tax treatment of an investment in our common stock.
You should consult a tax advisor regarding the U.S. federal tax consequences of acquiring, owning and disposing of our common stock in your particular circumstances, as well as any tax consequences that may arise under the laws of any state, local or foreign taxing jurisdiction.
Dividends
Distributions on our common stock will generally be treated as dividends to the extent paid out of our current or accumulated earnings and profits (as determined by U.S. federal income tax principles). Distributions in excess of current and accumulated earnings and profits will be treated first as a tax-free return of capital to the extent of your tax basis in our common stock and then as gain on the disposition of our common stock. Except as described below, if you are a non-U.S. holder of our common stock, dividends paid to you are subject to withholding of U.S. federal income tax at a 30% rate or at a lower rate if you are eligible for the benefits of an income tax treaty that provides for a lower rate. Even if you are eligible for a lower treaty rate, we and other payors will generally be required to withhold at a 30% rate (rather than the lower treaty rate) on dividend payments to you, unless you have furnished to us or another payor:
| • | a valid IRS Form W-8BEN or an acceptable substitute form upon which you certify, under penalties of perjury, your status as a non-U.S. person and your entitlement to the lower treaty rate with respect to such payments, or |
| • | in the case of payments made outside the United States to an offshore account (generally, an account maintained by you at an office or branch of a bank or other financial institution at any location outside the United States), other documentary evidence establishing your entitlement to the lower treaty rate in accordance with U.S. Treasury Regulations. |
If you are eligible for a reduced rate of U.S. federal withholding tax under a tax treaty, you may obtain a refund of any amounts withheld in excess of that rate by filing a refund claim with the IRS.
-328-
Table of Contents
If dividends paid to you are “effectively connected” with your conduct of a trade or business within the United States and, if required by a tax treaty, the dividends are attributable to a permanent establishment that you maintain in the United States, we and other payors generally are not required to withhold tax from the dividends, provided that you have furnished to us or another payor a valid IRS Form W-8ECI or an acceptable substitute form upon which you represent, under penalties of perjury, that:
| • | you are a non-U.S. person, and |
| • | the dividends are effectively connected with your conduct of a trade or business within the United States and are includible in your gross income. |
“Effectively connected” dividends are taxed at rates applicable to U.S. citizens, resident aliens and domestic U.S. corporations.
If you are a corporate non-U.S. holder, “effectively connected” dividends that you receive may, under certain circumstances, be subject to an additional “branch profits tax” at a 30% rate or at a lower rate if you are eligible for the benefits of an income tax treaty that provides for a lower rate.
Gain on Disposition of Common Stock
If you are a non-U.S. holder, you generally will not be subject to U.S. federal income tax on gain that you recognize on a disposition of our common stock unless:
| • | the gain is “effectively connected” with your conduct of a trade or business in the United States and, if required by a tax treaty, the gain is attributable to a permanent establishment that you maintain in the United States, |
| • | you are an individual, you hold the common stock as a capital asset, you are present in the United States for 183 or more days in the taxable year of the sale and certain other conditions exist, or |
| • | we are or have been a “United States real property holding corporation” for U.S. federal income tax purposes at any time within the five-year period preceding the disposition or your holding period, whichever period is shorter, you are not eligible for a treaty exemption, and, either (i) our common stock has ceased to be traded on an established securities market prior to the beginning of the calendar year in which the sale or disposition occurs, or (ii) you held (directly or indirectly) more than 5% of our common stock at any time during the five-year period preceding the disposition. |
We have not been, are not and do not anticipate becoming a United States real property holding corporation for U.S. federal income tax purposes.
If you are a corporate non-U.S. holder, “effectively connected” gains that you recognize may, under certain circumstances, be subject to an additional “branch profits tax” at a 30% rate or at a lower rate if you are eligible for the benefits of an income tax treaty that provides for a lower rate.
Withholdable Payments to Foreign Financial Entities and Other Foreign Entities
A 30% withholding tax will be imposed on certain payments to you or certain foreign financial institutions, investment funds and other non-U.S. persons receiving payments on your behalf if you or such institutions fail to comply with information reporting requirements (“FATCA Withholding”). Such payments will include U.S.-source dividends and the gross proceeds from the sale or other disposition of stock that can produce U.S.-source dividends. Dividend payments you receive after June 30, 2014 could be subject to this withholding if you are subject to the information reporting requirements and fail to comply with them or if you hold common stock through another person (e.g., a foreign bank or broker) that is subject to withholding because it fails to comply with these requirements (even if you would not otherwise have been subject to withholding). However, FATCA Withholding will not apply to payments of gross proceeds from a sale or other disposition of common stock before January 1, 2017.
-329-
Table of Contents
Federal Estate Taxes
Common stock held by a non-U.S. holder at the time of death will be included in the holder’s gross estate for U.S. federal estate tax purposes, unless an applicable estate tax treaty provides otherwise.
Backup Withholding and Information Reporting
If you are a non-U.S. holder, we and other payors are required to report payments of dividends on IRS Form 1042-S even if the payments are exempt from withholding. You are generally exempt from backup withholding and information reporting on IRS Form 1099 with respect to:
| • | payment of dividends on our common stock and |
| • | payment of proceeds from the sale of our common stock effected at a U.S. office of a broker, |
in each case, as long as the income associated with such payments is otherwise exempt from U.S. federal income tax, and:
| • | the payor or broker does not have actual knowledge or reason to know that you are a U.S. person and you have furnished to the payor or broker: |
| • | a valid IRS Form W-8BEN or an acceptable substitute form upon which you certify, under penalties of perjury, that you are a non-U.S. person, or |
| • | other documentation upon which it may rely to treat the payments as made to a non-United States person in accordance with U.S. Treasury Regulations, or |
| • | you otherwise establish an exemption. |
Payment of proceeds from the sale of our common stock effected at a foreign office of a broker generally will not be subject to backup withholding or information reporting. However, a sale of our common stock that is effected at a foreign office of a broker will be subject to backup withholding and information reporting if:
| • | the proceeds are transferred to an account maintained by you in the United States, |
| • | the payment of proceeds or the confirmation of the sale is mailed to you at a U.S. address, or |
| • | the sale has some other specified connection with the United States as provided in U.S. Treasury Regulations, |
unless the broker does not have actual knowledge or reason to know that you are a U.S. person and the documentation requirements described above are met or you otherwise establish an exemption.
In addition, a sale of our common stock that is effected at a foreign office of a broker will be subject to information reporting if the broker is:
| • | a U.S. person, |
| • | a controlled foreign corporation for U.S. federal income tax purposes, |
| • | a foreign person 50% or more of whose gross income is effectively connected with the conduct of a U.S. trade or business for a specified three-year period, or |
| • | a foreign partnership, if at any time during its tax year: |
| • | one or more of its partners are “U.S. persons,” as defined in U.S. Treasury Regulations, who in the aggregate hold more than 50% of the income or capital interest in the partnership, or |
| • | the foreign partnership is engaged in the conduct of a U.S. trade or business, |
unless the broker does not have actual knowledge or reason to know that you are a U.S. person and the documentation requirements described above are met or you otherwise establish an exemption. Backup withholding will apply if the sale is subject to information reporting and the broker has actual knowledge that you are a U.S. person.
You generally may obtain a refund (or a credit) of any amounts withheld under the backup withholding rules that exceed your income tax liability by timely filing a refund claim with the IRS.
-330-
Table of Contents
Under the terms and subject to the conditions set forth in an underwriting agreement dated the date of this prospectus, the underwriters named below, for whom Morgan Stanley & Co. LLC, Goldman, Sachs & Co., Citigroup Global Markets Inc. and Merrill Lynch, Pierce, Fenner & Smith Incorporated are acting as representatives, have severally agreed to purchase, and the Selling Stockholder has agreed to sell to them, severally, the number of shares indicated below:
| Underwriters |
Number of Shares | |||
| Morgan Stanley & Co. LLC |
||||
| Goldman, Sachs & Co. |
||||
| Citigroup Global Markets Inc. |
||||
| Merrill Lynch, Pierce, Fenner & Smith |
||||
| Incorporated |
||||
|
|
|
|||
| Total |
26,500,000 | |||
The underwriters and the representatives are collectively referred to as the “underwriters” and the “representatives,” respectively. The underwriters are offering the shares of common stock subject to their acceptance of the shares from the Selling Stockholder and subject to prior sale. The underwriting agreement provides that the obligations of the several underwriters to pay for and accept delivery of the shares of common stock offered by this prospectus are subject to the approval of certain legal matters by their counsel and to certain other conditions. The underwriters are obligated to take and pay for all of the shares of common stock offered by this prospectus if any such shares are taken. However, the underwriters are not required to take or pay for the shares covered by the underwriters’ option to purchase additional shares described below.
The underwriters initially propose to offer part of the shares of common stock directly to the public at the offering price listed on the cover page of this prospectus and part to certain dealers at the public offering price less a concession not to exceed $ per share. After this offering of the shares of common stock, the offering price and other selling terms may from time to time be varied by the representatives. The offering of the shares by the underwriters is subject to receipt and acceptance and subject to the underwriters’ right to reject any order in whole or in part.
The Selling Stockholder has granted to the underwriters an option, exercisable for 30 days from the date of this prospectus, to purchase up to 3,975,000 additional shares of common stock at the public offering price listed on the cover page of this prospectus, less underwriting discounts and commissions. To the extent the option is exercised, each underwriter will become obligated, subject to certain conditions, to purchase about the same percentage of the additional shares of common stock as the number listed next to the underwriter’s name in the preceding table bears to the total number of shares of common stock listed next to the names of all underwriters in the preceding table.
Because of the relationship between the Selling Stockholder and the Company, the Selling Stockholder is deemed to be an “underwriter” of the offering for purposes of the Securities Act.
The following table presents the per share and total public offering price, underwriting discounts and commissions, and proceeds before expenses to the Selling Stockholder. These amounts are presented assuming both no exercise and full exercise of the underwriters’ option to purchase up to 3,975,000 additional shares of common stock.
|
|
Total | |||||
| Per Share | No Exercise | Full Exercise | ||||
| Public offering price |
||||||
| Underwriting discounts and commissions to be paid by the Selling Stockholder |
||||||
| Proceeds, before expenses, to the Selling Stockholder |
||||||
-331-
Table of Contents
The estimated offering expenses payable by us are approximately $1.4 million. We have agreed to reimburse the underwriters for expenses relating to the clearance of this offering with the Financial Industry Regulatory Authority up to $ .
Our common stock is listed on the New York Stock Exchange under the symbol “VOYA”. We expect to rebrand from ING U.S. to Voya Financial over time following this offering.
We and all of our directors and officers and the Selling Stockholder have agreed, subject to certain exceptions, that, without the prior written consent of Morgan Stanley & Co. LLC, Goldman, Sachs & Co., Citigroup Global Markets Inc. and Merrill Lynch, Pierce, Fenner & Smith Incorporated on behalf of the underwriters, we and they will not, during the period ending 90 days after the date of this prospectus (the “restricted period”):
| • | offer, pledge, sell, contract to sell, sell any option or contract to purchase, purchase any option or contract to sell, grant any option, right or warrant to purchase, lend or otherwise transfer or dispose of, directly or indirectly, any shares of common stock or any securities convertible into or exercisable or exchangeable for shares of common stock; |
| • | file any registration statement with the SEC relating to the offering of any shares of common stock or any securities convertible into or exercisable or exchangeable for common stock; or |
| • | enter into any swap or other arrangement that transfers to another, in whole or in part, any of the economic consequences of ownership of the common stock, |
whether any such transaction described above is to be settled by delivery of common stock or such other securities, in cash or otherwise. In addition, we and each such person have agreed that, without the prior written consent of Morgan Stanley & Co. LLC, Goldman, Sachs & Co., Citigroup Global Markets Inc. and Merrill Lynch, Pierce, Fenner & Smith Incorporated on behalf of the underwriters, we or such other person will not, during the restricted period, make any demand for, or exercise any right with respect to, the registration of any shares of common stock or any security convertible into or exercisable or exchangeable for common stock.
The restricted period described in the preceding paragraph will be extended if:
| • | during the last 17 days of the restricted period we issue an earnings release or material news event relating to us occurs, or |
| • | prior to the expiration of the restricted period, we announce that we will release earnings results during the 16-day period beginning on the last day of the restricted period or provide notification to Morgan Stanley & Co. LLC, Goldman, Sachs & Co., Citigroup Global Markets Inc. and Merrill Lynch, Pierce, Fenner & Smith Incorporated of any earnings release or material news or material event that may give rise to an extension of the initial 90 day restricted period, |
in which case the restrictions described in the preceding paragraph will continue to apply until the expiration of the 18-day period beginning on the issuance of the earnings release or the occurrence of the material news or material event.
Morgan Stanley & Co. LLC, Goldman, Sachs & Co., Citigroup Global Markets Inc. and Merrill Lynch, Pierce, Fenner & Smith Incorporated, in their sole discretion, may release the common stock and other securities subject to the lock-up agreements described above in whole or in part at any time with or without notice. When determining whether or not to release common stock and other securities from lock-up agreements, Morgan Stanley & Co. LLC, Goldman, Sachs & Co., Citigroup Global Markets Inc. and Merrill Lynch, Pierce, Fenner & Smith Incorporated will consider, among other factors, the holder’s reasons for requesting the release, the number of shares of common stock and other securities for which the release is being requested and market conditions at the time.
-332-
Table of Contents
In order to facilitate the offering of the common stock, the underwriters may engage in transactions that stabilize, maintain or otherwise affect the price of the common stock. Specifically, the underwriters may sell more shares than they are obligated to purchase under the underwriting agreement, creating a short position. A short sale is covered if the short position is no greater than the number of shares available for purchase by the underwriters under the option to purchase additional shares. The underwriters can close out a covered short sale by exercising the option to purchase additional shares or purchasing shares in the open market. In determining the source of shares to close out a covered short sale, the underwriters will consider, among other things, the open market price of shares compared to the price available under the option to purchase additional shares. The underwriters may also sell shares in excess of the option to purchase additional shares, creating a naked short position. The underwriters must close out any naked short position by purchasing shares in the open market. A naked short position is more likely to be created if the underwriters are concerned that there may be downward pressure on the price of the common stock in the open market after pricing that could adversely affect investors who purchase in this offering. As an additional means of facilitating this offering, the underwriters may bid for, and purchase, shares of common stock in the open market to stabilize the price of the common stock. The underwriters may also impose a penalty bid. This occurs when a particular underwriter repays to the underwriters a portion of the underwriting discount received by it because the representatives have repurchased shares sold by or for the account of such underwriter in stabilizing or short covering transactions. These activities may raise or maintain the market price of the common stock above independent market levels or prevent or retard a decline in the market price of the common stock. The underwriters are not required to engage in these activities and may end any of these activities at any time.
We, the Selling Stockholder and the underwriters have agreed to indemnify each other against certain liabilities, including liabilities under the Securities Act.
A prospectus in electronic format may be made available on websites maintained by one or more underwriters, or selling group members, if any, participating in this offering. The representatives may agree to allocate a number of shares of common stock to underwriters for sale to their online brokerage account holders. Internet distributions will be allocated by the representatives to underwriters that may make Internet distributions on the same basis as other allocations.
Other Relationships
The underwriters and their respective affiliates are full service financial institutions engaged in various activities, which may include sales and trading, commercial and investment banking, advisory, investment management, investment research, principal investment, hedging, market making, brokerage and other financial and non-financial activities and services. Some of the underwriters and their affiliates have engaged in, and may in the future engage in, investment banking and other commercial dealings in the ordinary course of business with us or persons or entities with a relationship with us. They have received, or may in the future receive, customary fees and commissions for these transactions. In particular, certain of the underwriters or their affiliates have a lending relationship with us under our Amended and Restated Revolving Credit Agreement and Term Loan Agreement and act as agents thereunder.
In addition, in the ordinary course of their business activities, the underwriters and their affiliates may make or hold a broad array of investments and actively trade debt and equity securities (or related derivative securities) and financial instruments (including bank loans) for their own account and for the accounts of their customers. Such investments and securities activities may involve securities and/or instruments of ours or our affiliates. The underwriters and their affiliates may also make investment recommendations and/or publish or express independent research views in respect of such securities or financial instruments and may hold, or recommend to clients that they acquire, long and/or short positions in such securities and instruments.
-333-
Table of Contents
Selling Restrictions
Australia
Neither this document nor any other disclosure document (as defined in the Corporations Act 2001 (Cth) of Australia (Corporations Act)) has been, or will be, lodged with the Australian Securities & Investments Commission (ASIC) and does not constitute an offer except to the following categories of exempt investors:
| (i) | “sophisticated investors” under section 708(8)(a) or (b) of the Corporations Act; |
| (ii) | “sophisticated investors” under section 708(8)(c) or (d) of the Corporations Act who have provided an accountant’s certificate to the Company which complies with the requirements of section 708(8)(c)(i) or (ii) of the Corporations Act and related regulations before any offer has been made; or |
| (iii) | “professional investors” within the meaning of section 708(11)(a) or (b) of the Corporations Act. |
By purchasing shares of common stock, you warrant and agree that:
| (i) | you are an exempt investor under one of the above categories; and |
| (ii) | you will not offer any shares of common stock issued or sold to you pursuant to this document for sale in Australia within 12 months of those shares being issued or sold unless any such sale offer is exempt from the requirement to issue a disclosure document (as defined in the Corporations Act) under sections 708 or 708A of the Corporations Act. |
People’s Republic of China
This prospectus may not be circulated or distributed in the People’s Republic of China (“China”) and the shares of common stock may not be offered or sold, and will not be offered or sold, to any person for re-offering or resale directly or indirectly to any resident of China except pursuant to applicable laws and regulations of China. For the purpose of this paragraph, China does not include Taiwan or the special administrative regions of Hong Kong and Macau.
Egypt
The shares of common stock may not be offered or sold in any form of general solicitation or general advertising or in a public offering in Egypt, unless the pre-approval of the Egyptian Financial Supervisory Authority (“EFSA”) has been obtained. Shares of common stock offered and sold in the offering may only be offered or sold in Egypt through a private placement to Egyptian QIBs or Professional High Net Worth Investors (each as defined below) whose ordinary activities involve them in acquiring, holding, managing or disposing of investments for the purposes of their business and only in accordance with applicable Egyptian law and regulations including the applicable provisions of the Capital Market Law (“CMA”) and the provisions of the CMA’s Directives No. 31 for the year 2002 concerning private placements.
Each purchaser of the shares of common stock offered in the private placement in Egypt will be deemed to have represented that it is either an Egyptian QIB or a Professional High Net Worth Investor within the meaning of the CMA and the CMA’s Directives No. 31 of the year 2002 concerning private placements.
An “Egyptian QIB” is an institutional investor having (i) a minimum asset book value of 20.0 million Egyptian Pounds (“EGP”); (ii) a minimum equity book value of EGP 10.0 million; (iii) a minimum investment in securities (excluding securities related to the offering) of EGP 5.0 million as of date of the placement; or (iv) a license to operate in the field of securities and permitted to acquire securities within its objects. In addition, an Egyptian QIB should also have at least five years experience in capital markets and stock exchanges locally and internationally.
A “Professional High Net Worth Investor” is an individual investor: (i) who owns assets with a minimum value of EGP 2.0 million; (ii) with a minimum annual income of EGP 500,000; (iii) with a minimum bank
-334-
Table of Contents
savings account balance of EGP 500,000; (iv) who, as of the placement date, holds securities in two joint stock companies (excluding the offering) with a minimum value of EGP 2.0 million; or (v) who has at least five years experience in capital markets and stock exchanges locally or internationally.
European Economic Area
In relation to each Member State of the European Economic Area which has implemented the Prospectus Directive (each, a “Relevant Member State”), with effect from and including the date on which the Prospectus Directive is implemented in that Relevant Member State (the “Relevant Implementation Date”), an offer to the public of any shares which are the subject of the offering contemplated by this Prospectus (the “Securities”) may not be made in that Relevant Member State, except that an offer to the public in that Relevant Member State of any Securities may be made at any time with effect from and including the Relevant Implementation Date under the following exemptions under the Prospectus Directive, if they have been implemented in that Relevant Member State:
| (a) | to legal entities which are qualified investors as defined in the Prospectus Directive; |
| (b) | to fewer than 100 or, if the Relevant Member State has implemented the relevant provision of the 2010 PD Amending Directive, 150, natural or legal persons (other than qualified investors as defined in the Prospectus Directive), as permitted under the Prospectus Directive, subject to obtaining the prior consent of the representatives for any such offer; or |
| (c) | in any other circumstances falling within Article 3(2) or Article 4(1) of the Prospectus Directive, |
provided that no such offer of Securities shall require us or any underwriter to publish a prospectus pursuant to Article 3 of the Prospectus Directive.
For the purposes of this provision, the expression an “offer to the public” in relation to any Securities in any Relevant Member State means the communication in any form and by any means of sufficient information on the terms of the offer and any Securities to be offered so as to enable an investor to decide to purchase any Securities, as the same may be varied in that Member State by any measure implementing the Prospectus Directive in that Member State, the expression “Prospectus Directive” means Directive 2003/71/EC (and amendments thereto, including the 2010 PD Amending Directive, to the extent implemented in the Relevant Member State), and includes any relevant implementing measure in each Relevant Member State, and the expression “2010 PD Amending Directive” means Directive 2010/73/EU.
This EEA selling restriction is in addition to any other selling restrictions set out in this Prospectus.
Hong Kong
Shares of our common stock may not be offered or sold by means of any document other than (i) in circumstances which do not constitute an offer to the public within the meaning of the Companies Ordinance (Cap.32, Laws of Hong Kong), or (ii) to “professional investors” within the meaning of the Securities and Futures Ordinance (Cap.571, Laws of Hong Kong) and any rules made thereunder, or (iii) in other circumstances which do not result in the document being a “prospectus” within the meaning of the Companies Ordinance (Cap.32, Laws of Hong Kong), and no advertisement, invitation or document relating to the shares of our common stock may be issued or may be in the possession of any person for the purpose of issue (in each case whether in Hong Kong or elsewhere), which is directed at, or the contents of which are likely to be accessed or read by, the public in Hong Kong (except if permitted to do so under the laws of Hong Kong) other than with respect to shares of our common stock which are or are intended to be disposed of only to persons outside Hong Kong or only to “professional investors” within the meaning of the Securities and Futures Ordinance (Cap. 571, Laws of Hong Kong) and any rules made thereunder.
-335-
Table of Contents
WARNING
The contents of this prospectus have not been reviewed by any regulatory authority in Hong Kong. You are advised to exercise caution in relation to the offer. If you are in any doubt about any of the contents of this prospectus, you should obtain independent professional advice.
Japan
The securities have not been and will not be registered under the Financial Instruments and Exchange Law of Japan (the Financial Instruments and Exchange Law) and each underwriter has agreed that it will not offer or sell any securities, directly or indirectly, in Japan or to, or for the benefit of, any resident of Japan (which term as used herein means any person resident in Japan, including any corporation or other entity organized under the laws of Japan), or to others for re-offering or resale, directly or indirectly, in Japan or to a resident of Japan, except pursuant to an exemption from the registration requirements of, and otherwise in compliance with, the Financial Instruments and Exchange Law and any other applicable laws, regulations and ministerial guidelines of Japan.
Jordan
The shares of common stock have not been presented to, or approved by, the Jordanian Securities Commission or the Board for Regulating Transactions in Foreign Exchanges. The underwriters have confirmed that they will not offer the shares of common stock to potential investors in Jordan except (i) pursuant to a prospectus that is filed and approved by the Jordanian Securities Commission and (ii) by persons licensed to do so pursuant to the Jordanian Securities Law and the Law Regulating Trading in Foreign Exchanges, or exemptions from such filing and licenses apply or have been obtained.
Kuwait
FOR RESIDENTS OF KUWAIT ONLY:
Unless all necessary approvals from the Kuwait Capital Markets Authority (“CMA”) pursuant to Law No. 7/2010, its Executive Regulations and the various Resolutions and Announcements issued pursuant thereto or in connection therewith have been given in relation to the marketing of, and sale of, the shares, these may not be offered for sale, nor sold in the State of Kuwait (“Kuwait”). Neither this prospectus nor any of the information contained herein is intended to lead to the conclusion of any contract of whatsoever nature within Kuwait.
With regard to the contents of this document we recommend that you consult a party licensed by the CMA to conduct securities activities in Kuwait and specialized in giving advice about the purchase of shares and other securities before making the subscription decision.
The Netherlands
No offer of any shares of our common stock, which are the subject of the offering contemplated by this document, has been made or will be made in the Netherlands, unless in reliance on Article 3(2) or Article 4(1) of the Prospectus Directive and provided that:
| (a) | such offer is made exclusively to legal entities which are qualified investors (as defined in the Prospectus Directive) in the Netherlands; or |
| (b) | standard exemption logo and wording are disclosed as required by article 5:20(5) of the Dutch Financial Supervision Act (Wet op het Financieel Toezicht, the “FSA”); or |
| (c) | such offer is otherwise made in circumstances in which article 5:20(5) of the FSA is not applicable. |
Qatar
Without the approval of the Qatar Financial Markets Authority (the “QFMA”), the common shares will not be provided, promoted, offered, sold or delivered, at any time, directly or indirectly in the State of Qatar to any person.
-336-
Table of Contents
If the approval of the QFMA is obtained, the offer of the common shares in the State of Qatar will only be made through a private placement on an exclusive basis to the specifically intended professional and sophisticated identified recipient thereof, upon that person’s request and initiative, for personal use only and will not be provided, promoted, offered, sold or delivered, at any time, directly or indirectly in the State of Qatar to any other person. Such an offer shall in no way be construed as a general public offer for the sale of securities to the public or an attempt to do business as a bank, an investment company or otherwise in the State of Qatar. Such promotion will not be approved by the Qatar Central Bank and will not be registered or licensed by any other regulator in the State of Qatar including the Qatar Financial Centre Regulatory Authority and the Qatar Exchange. If provided in the State of Qatar in accordance with the foregoing restrictions, the information contained in this prospectus shall be for the recipient only and may not be shared with any third party in Qatar. It shall not be for general circulation in the State of Qatar and any distribution or reproduction of this prospectus by any recipient to third parties in Qatar is not permitted and shall be at the liability of such recipient only and no liability whatsoever shall apply to ING U.S., Inc. or the underwriters in this regard.
Saudi Arabia
This document may not be distributed in the Kingdom of Saudi Arabia except to such persons as are permitted under the Offers of Securities Regulation issued by the Capital Market Authority.
The Capital Market Authority does not make any representation as to the accuracy or completeness of this document, and expressly disclaims any liability whatsoever for any loss arising from, or incurred in reliance upon, any part of this document. Prospective purchasers of the securities offered hereby should conduct their own due diligence on the accuracy of the information relating to the securities. If you do not understand the contents of this document you should consult an authorized financial adviser.
Singapore
This prospectus has not been registered as a prospectus with the Monetary Authority of Singapore. Accordingly, this prospectus and any other document or material in connection with the offer or sale, or invitation for subscription or purchase, of the shares of our common stock may not be circulated or distributed, nor may the shares of our common stock be offered or sold, or be made the subject of an invitation for subscription or purchase, whether directly or indirectly, to persons in Singapore other than (i) to an institutional investor under Section 274 of the Securities and Futures Act, Chapter 289 of Singapore (the “SFA”), (ii) to a relevant person pursuant to Section 275(1), or any person pursuant to Section 275(1A), and in accordance with the conditions, specified in Section 275 of the SFA or (iii) otherwise pursuant to, and in accordance with the conditions of, any other applicable provision of the SFA.
Where the shares of our common stock are subscribed or purchased under Section 275 of the SFA by a relevant person which is:
(a) a corporation (which is not an accredited investor as defined in Section 4A of the SFA) the sole business of which is to hold investments and the entire share capital of which is owned by one or more individuals, each of whom is an accredited investor; or
(b) a trust (where the trustee is not an accredited investor) whose sole purpose is to hold investments and each beneficiary of the trust is an individual who is an accredited investor,
securities (as defined in Section 239(1) of the SFA) of that corporation or the beneficiaries’ rights and interest (howsoever described) in that trust shall not be transferable within 6 months after that corporation or that trust has acquired the shares pursuant to an offer under Section 275 of the SFA except: (1) to an institutional investor or to a relevant person defined in Section 275(2) of the SFA, or any person arising from an offer referred to in Section 275(1A) or Section 276(4)(i)(B) of the SFA; (2) where no consideration is or will be given for the transfer; (3) where the transfer is by operation of law; (4) as specified in Section 276(7) of the SFA; or (5) as specified in Regulation 32 of the Securities and Futures (Offers of Investments) (Shares and Debentures) Regulations 2005 of Singapore.
-337-
Table of Contents
Taiwan
Shares of common stock cannot be offered, distributed, sold or resold to the public in Taiwan unless prior approval from, or effective registration with, the Republic of China government authorities has been obtained pursuant to the applicable laws or a private placement exemption is available under the applicable securities laws.
United Arab Emirates
The offering contemplated hereunder has not been approved or licensed by the Central Bank of the United Arab Emirates (“UAE”), the Securities and Commodities Authority of the UAE and/or any other relevant licensing authority in the UAE including any licensing authority incorporated under the laws and regulations of any of the free zones established and operating in the territory of the UAE, in particular the Dubai Financial Services Authority (“DFSA”), a regulatory authority of the Dubai International Financial Centre (“DIFC”). This offering does not constitute a public offer of shares in the UAE, DIFC and/or any other free zone in accordance with the Commercial Companies Law, Federal Law No. 8 of 1984 (as amended), or the DFSA Markets Rules, accordingly, or otherwise. The shares of common stock may not be offered to the public in the UAE and/or any of the free zones.
The shares of common stock may be offered and issued only to a limited number of investors in the UAE or any of its free zones who qualify as sophisticated investors under the relevant laws and regulations of the UAE or the free zone concerned. We represent and warrant that the shares will not be offered, sold, transferred or delivered to the public in the UAE or any of its free zones.
Dubai International Financial Centre. This document relates to an Exempt Offer in accordance with the Markets Rules of the Dubai Financial Services Authority. This document is intended for distribution only to Persons of a type specified in those rules to whom Exempt Offers can be made. It must not be delivered to, or relied on by, any other Person. The Dubai Financial Services Authority has no responsibility for reviewing or verifying any documents in connection with Exempt Offers. The Dubai Financial Services Authority has not approved this document nor taken steps to verify the information set out in it, and has no responsibility for it. The shares of common stock to which this document relates may be illiquid and/or subject to restrictions on their resale. Prospective purchasers of the shares of common stock offered should conduct their own due diligence on the shares. If you do not understand the contents of this document you should consult an authorized financial adviser.
United Kingdom
This communication is only being distributed to and is only directed at (i) persons who are outside the United Kingdom or (ii) investment professionals falling within Article 19(5) of the Financial Services and Markets Act 2000 (Financial Promotion) Order 2005 (the “Order”) or (iii) high net worth entities within Article 49(2)(a) to (d) of the Order or other persons to whom it may otherwise be lawfully communicated (all such persons together being referred to as “relevant persons”). The shares are only available to, and any invitation, offer or agreement to subscribe for, purchase or otherwise acquire such shares will be engaged in only with, relevant persons. Any person who is not a relevant person should not act or rely on this document or any of its contents.
Each underwriter has represented, warranted and agreed that:
| (a) | it has only communicated or caused to be communicated and will only communicate or cause to be communicated an invitation or inducement to engage in investment activity (within the meaning of Section 21 of the Financial Services and Markets Act 2000 (the “FSMA”)) received by it in connection with the issue or sale of the shares which are the subject of the offering contemplated by this Prospectus (the “Securities”) in circumstances in which Section 21(1) of the FSMA does not apply to us; and |
| (b) | it has complied and will comply with all applicable provisions of the FSMA with respect to anything done by it in relation to the Securities in, from or otherwise involving the United Kingdom. |
-338-
Table of Contents
The validity of the shares of our common stock offered hereby will be passed upon for us by Sullivan & Cromwell LLP, New York, New York and for the underwriters by Davis Polk & Wardwell LLP, New York, New York.
The Consolidated Financial Statements and schedules of ING U.S., Inc. as of December 31, 2013 and 2012 and for each of the three years in the period ended December 31, 2013, appearing in this prospectus and registration statement, have been audited by Ernst & Young LLP, independent registered public accounting firm, as set forth in their report thereon appearing elsewhere herein and are included in reliance upon such report given on the authority of such firm as experts in accounting and auditing.
WHERE YOU CAN FIND MORE INFORMATION
We have filed with the SEC a registration statement on Form S-1 under the Securities Act for the shares of our common stock being offered by this prospectus. This prospectus, which is part of the registration statement, does not contain all of the information included in the registration statement and the exhibits. For further information about us you should refer to the registration statement and its exhibits. References in this prospectus to any of our contracts or other documents are not necessarily complete, and you should refer to the exhibits attached to the registration statement for copies of the actual contract or document. You may read and copy any document that we file at the SEC’s public reference room located at 100 F Street, NE, Washington, D.C. 20549. Please call the SEC at 1-800-SEC-0330 for further information on the public reference rooms. SEC filings are also available to the public at the SEC’s website at www.sec.gov.
We are subject to the reporting and information requirements of the Exchange Act and, as a result, will file periodic and current reports, proxy statements and other information with the SEC. We expect to make our periodic reports and other information filed with or furnished to the SEC available, free of charge, through our website at ing.us as soon as reasonably practicable after those reports and other information are filed with or furnished to the SEC. The information contained on, or that can be accessed through, our website is not part of, and is not incorporated into, this prospectus. Additionally, these periodic reports, proxy statements and other information will be available for inspection and copying at the public reference room and website of the SEC referred to above.
-339-
Table of Contents
| 2018 Notes | $1.0 billion principal amount of 2.9% Senior Notes due 2018 that we issued on February 11, 2013 | |
| 2022 Notes | $850.0 million principal amount of 5.5% Senior Notes due 2022 that we issued on July 13, 2012 | |
| 2043 Notes | $400.0 million principal amount of 5.7% Senior Notes due 2043 that we issued on July 26, 2013 in a private placement | |
| ABS | Asset-backed securities | |
| ADOI | Arizona Department of Insurance | |
| Aetna Notes | Approximately $645.0 million of various debentures of Lion Holdings that were assumed by Lion Holdings in connection with the acquisition of Aetna’s life insurance and related businesses in 2000 | |
| AG38 | NAIC Actuarial Guideline XXXVIII, The Application of the Valuation of Life Insurance Policies Model Regulation (“Model”), which clarifies the application of XXX with respect to certain universal life insurance policies with secondary guarantees | |
| AG43 | NAIC Actuarial Guideline XLIII, Commissioners’ Annuity Reserve Valuation Method for Variable Annuities, which clarifies the approach to determining additional reserves required for variable annuities and the guaranteed benefits embedded in them | |
| ALM | Asset/liability management | |
| AOCI | Accumulated other comprehensive income (loss) | |
| ARO | NAIC acceptable rating organization providing credit quality and financial strength rating designations | |
| ASC | FASB Accounting Standards Codification | |
| ASU | FASB Accounting Standards Update | |
| AUA | Assets under administration. See “Management’s Discussion and Analysis of Financial Condition and Results of Operations—Operating Measures—AUM and AUA.” | |
| AUM | Assets under management. See “Management’s Discussion and Analysis of Financial Condition and Results of Operations—Operating Measures—AUM and AUA.” | |
| CAL | Company action level risk-based capital, as defined by the NAIC | |
| CBVA | Closed Block Variable Annuity | |
| CDS | Credit default swaps | |
| CFTC | U.S. Commodity Futures Trading Commission | |
| Capital Hedge Overlay program or CHO program | See “Business—Closed Blocks—Variable Annuity Hedge Program and Reinsurance—Variable Annuity Capital Hedge Overlay Program.” | |
| CMBS | Commercial mortgage-backed securities | |
| CMO | Collateralized mortgage obligation | |
-340-
Table of Contents
| CMO-B | A proprietary strategy to manage a portfolio of various CMO tranches in combination with financial derivatives. See “Investments—CMO-B Portfolio.” | |
| CRO | The Chief Risk Officer of ING U.S., Inc. or one of its businesses or segments | |
| DAC | Deferred acquisition cost, representing the incremental costs related directly to the successful acquisition of new and renewal insurance and annuity contracts | |
| DAC/VOBA and other intangibles | DAC, VOBA, DSI, and URR | |
| Divestment Transaction | Any sale or other divestment of all or a portion of ING U.S., Inc. common stock by ING Group, including this offering | |
| DNB | Dutch Central Bank (De Nederlandsche Bank) | |
| DOL | U.S. Department of Labor | |
| DSI | Deferred sales inducements, representing amounts that are credited to a policyholder’s account balance that are higher than the expected credited rates on similar contracts without such an inducement and that are an incentive to purchase a contract | |
| Dutch State loan obligation | The assignment by ING Support Holding of certain rights pursuant to participation agreements that certain subsidiaries of the Company entered into with ING Support Holding on January 26, 2009. See “Certain Relationships and Related Party Transactions—Alt-A Back-up Facility.” | |
| Dutch State Transactions | The state aid granted to ING Group by the Kingdom of the Netherlands in November 2008 and March 2009. See “Regulation—Dutch State Transactions and Restructuring Plan.” | |
| EC | European Commission | |
| Exit price | The price that would be received to sell an asset or transfer a liability in an orderly transaction between market participants | |
| FASB | Financial Accounting Standards Board | |
| Favorable unlocking | See “Management’s Discussion and Analysis of Financial Condition and Results of Operations—Results of Operations—Segment by Segment—Unlocking of DAC/VOBA and other Contract Owner/Policyholder Intangibles.” | |
| FIAs | Fixed indexed annuities | |
| FIO | United States Department of the Treasury’s Federal Insurance Office | |
| FSB | Financial Stability Board | |
| FSOC | Financial Stability Oversight Council | |
| FVO | Fair value option | |
| GAAP | Accounting principles generally accepted in the United States | |
| GICs | Guaranteed investment contracts | |
| GLWB | Guaranteed lifetime withdrawal benefits | |
| GMAB | Guaranteed minimum accumulation benefits | |
| GMDB | Guaranteed minimum death benefits | |
| GMIB | Guaranteed minimum income benefits | |
| GMWB | Guaranteed minimum withdrawal benefits | |
-341-
Table of Contents
| GMWBL | Guaranteed minimum withdrawal benefits for life | |
| GRA | Global Resolution Agreement, entered into with VERUS Financial LLC, effective as of July 26, 2013. | |
| GRIP | Guaranteed retirement income portfolio | |
| Guaranteed benefit derivatives | Embedded derivatives and derivatives related to product guarantees | |
| Hannover Re | Hannover Life Reassurance Company of America and Hannover Life Reassurance (Ireland) Limited, collectively | |
| ILIAC | ING Life Insurance and Annuity Company, a principal insurance subsidiary of ING U.S., Inc. | |
| ING Bank | ING Bank N.V., a wholly owned subsidiary of ING Group | |
| ING Group | ING Groep N.V. | |
| ING Re | ING Re (Netherlands) N.V., a wholly owned subsidiary of ING Group | |
| ING Support Holding | ING Support Holding, B.V., a wholly owned subsidiary of ING Group | |
| ING USA | ING USA Annuity and Life Insurance Company, a principal insurance subsidiary of ING U.S., Inc. | |
| ING V | ING Verzekeringen N.V., a wholly owned subsidiary of ING Group | |
| IRAs | Individual Retirement Accounts | |
| IRS | U.S. Internal Revenue Service | |
| Junior subordinated notes | $750.0 million principal amount of 5.65% Fixed-to-Floating Rate Junior Subordinated Notes due 2053 | |
| Lehman Recovery | Distribution of cash and securities received by us in connection with a Lehman Brothers bankruptcy settlement | |
| LIHTC | Low Income Housing Tax Credits | |
| Lion Holdings | Lion Connecticut Holdings Inc., our principal intermediate holding company, which is the parent of a number of our insurance and non-insurance operating entities | |
| LOCs | Letters of credit | |
| MAP-21 | Moving Ahead for Progress in the 21st Century Act | |
| MCG | Managed custody guarantee product | |
| MGIR | Minimum Guaranteed Interest Rates | |
| Missouri Division | Missouri Department of Insurance, Division of Insurance Company Regulation | |
| MPA | A master asset purchase agreement that the Company entered into, effective January 1, 2009, with Scottish Re and Hannover Re | |
| MYGAs | Multi-Year Guarantee Annuities | |
| NAIC | National Association of Insurance Commissioners | |
| NAR | Net amount at risk | |
| NAV | Net asset value | |
-342-
Table of Contents
| New VM | A new Valuation Manual for life insurance adopted by the NAIC in December 2012 | |
| NN Group | NN Group N.V., a wholly owned subsidiary of ING Group and the legal successor to ING V effective as of March 1, 2014 | |
| NOLs | Net operating loss carryforwards | |
| NYDFS | New York Department of Financial Services | |
| Nonperformance risk | Risk that our obligations or the obligations of one of our subsidiaries will not be fulfilled | |
| OCC | Office of the Comptroller of the Currency | |
| Operating ROC | Operating return on capital. See “Business—Operating Return on Capital Goal.” | |
| Operating ROE | Operating return on equity. See “Business—Operating Return on Equity.” | |
| OTTI | Other-than-temporary impairment | |
| PBGC | U.S. Pension Benefit Guaranty Corporation | |
| PBR | A Principles-Based Reserving framework under which the NAIC has begun a process of redefining the U.S. statutory reserve methodology for certain of our insurance liabilities | |
| Principal Insurance Subsidiaries | Each of, and collectively, ING USA, ILIAC, SLD and RLI | |
| RBC | Risk-based capital as defined by the NAIC | |
| RBC ratio | Company action level risk-based capital ratio | |
| Regulation XXX (XXX) | NAIC Model Regulation entitled “Valuation of Life Insurance Policies”, which requires insurers to establish additional statutory reserves for certain term life insurance policies with long-term premium guarantees and for certain universal life policies with secondary guarantees | |
| Restructuring Plan | A restructuring plan that ING Group submitted in October 2009 to the EC in order to receive approval for state aid granted to ING Group by the Dutch State in November 2008 and March 2009 | |
| Revolving Credit Agreement | A three-year committed revolving credit agreement, which provides for issuance of up to $3.5 billion of letters of credit with a $1.5 billion sublimit for cash borrowings (reduced, as required by the terms of the Revolving Credit Agreement, to $1.075 billion in connection with the 2022 Notes), that we entered into on April 20, 2012 as part of the Senior Unsecured Credit Facility | |
| RGA | Various subsidiaries of Reinsurance Group of America Incorporated, collectively | |
| RLI | ReliaStar Life Insurance Company, a principal insurance subsidiary of ING U.S., Inc. | |
| RMBS | Residential mortgage-backed securities | |
| RMP | Risk Management Program | |
| SAT | NAIC Suitability in Annuity Transactions Model Regulation | |
| Scottish Re | Scottish Re Group Limited, Scottish Holdings, Inc., Scottish Re (U.S.), Inc., Scottish Re Life (Bermuda) Limited and Scottish Re (Dublin) Limited, collectively | |
-343-
Table of Contents
| Section 382 | Section 382 of the U.S. Internal Revenue Code of 1986, as amended | |
| Selling Stockholder | ING Groep N.V. | |
| Senior Unsecured Credit Facility | A $5.0 billion senior unsecured credit facility that we entered into on April 20, 2012 with a syndicate of banks, which replaced financing that was either internally funded or guaranteed by ING V. See “Glossary—Revolving Credit Agreement” and “—Term Loan Agreement.” | |
| Shareholder Agreement | The shareholder agreement between ING U.S. and ING Group that will govern certain aspects of our continuing relationship. See “Certain Relationships and Related Party Transactions—Continuing Relationship with ING Group—Shareholder Agreement.” | |
| SLD | Security Life of Denver Insurance Company, a principal insurance subsidiary of ING U.S., Inc. | |
| SLDI | Security Life of Denver International Limited, our insurance subsidiary domiciled in Arizona | |
| SSDMF | U.S. Social Security Death Master File | |
| Supervisory Board | Supervisory Board of ING Group | |
| SVO | Securities Valuation Office of the NAIC | |
| TAC | Total adjusted capital | |
| Term Loan Agreement | A $1.5 billion two-year syndicated term loan agreement that we entered into on April 20, 2012 as part of the Senior Unsecured Credit Facility | |
| TPAs | Third-party administrators | |
| Unfavorable unlocking | See “Management’s Discussion and Analysis of Financial Condition and Results of Operations—Results of Operations—Segment by Segment—Unlocking of DAC/VOBA and other Contract Owner/Policyholder Intangibles.” | |
| Unlocking event | See “Management’s Discussion and Analysis of Financial Condition and Results of Operations—Results of Operations—Segment by Segment—Unlocking of DAC/VOBA and other Contract Owner/Policyholder Intangibles.” | |
| URR | Unearned revenue reserve, representing expense loads that are deducted from contract owner account balances and that are greater than the corresponding loads in subsequent contract years; the excess over the corresponding load in subsequent contract years is established as a liability when it is deducted and is amortized into revenue over the life of the associated contracts. | |
| Variable Annuity Guarantee Hedge Program | See “Business—Closed Blocks—Variable Annuity Hedge Program and Reinsurance—Variable Annuity Guarantee Hedge Program.” | |
| VB | Voluntary Benefits | |
| VIEs | Variable interest entities | |
| VMCR | Value of management contract rights | |
| VOBA | Value of business acquired, representing the present value of estimated cash flows embedded in acquired business, plus renewal commissions and certain other costs on such acquired business | |
| VOCRA | Value of customer relationships acquired | |
| VOEs | Voting interest entities | |
| XXX | See “—Regulation XXX (XXX).” | |
-344-
Table of Contents
INDEX TO FINANCIAL STATEMENTS AND SCHEDULES
| Page | ||||
| F- 2 | ||||
| Financial Statements as of December 31, 2013 and 2012 and for the Years Ended December 31, 2013, 2012 and 2011: |
||||
| Consolidated Balance Sheets as of December 31, 2013 and 2012 |
F- 3 | |||
| Consolidated Statements of Operations for the years ended December 31, 2013, 2012 and 2011 |
F- 5 | |||
| Consolidated Statements of Comprehensive Income for the years ended December 31, 2013, 2012 and 2011 |
F- 6 | |||
| F- 7 | ||||
| Consolidated Statements of Cash Flows for the years ended December 31, 2013, 2012 and 2011 |
F- 8 | |||
| F-10 | ||||
| Financial Statement Schedules as of December 31, 2013 and 2012 and for the Years Ended December 31, 2013, 2012 and 2011: |
||||
| Schedule I—Summary of Investments Other than Investments in Affiliates |
F-161 | |||
| F-162 | ||||
| F-173 | ||||
| F-175 | ||||
| F-176 | ||||
F-1
Table of Contents
Report of Independent Registered Public Accounting Firm
The Board of Directors
ING U.S., Inc.
We have audited the accompanying consolidated balance sheets of ING U.S., Inc. as of December 31, 2013 and 2012, and the related consolidated statements of operations, comprehensive income, changes in shareholders’ equity, and cash flows for each of the three years in the period ended December 31, 2013. Our audits also included the financial statement schedules listed in the Index to Financial Statements and Schedules. These financial statements and schedules are the responsibility of the Company’s management. Our responsibility is to express an opinion on these financial statements and schedules based on our audits.
We conducted our audits in accordance with the standards of the Public Company Accounting Oversight Board (United States). Those standards require that we plan and perform the audit to obtain reasonable assurance about whether the financial statements are free of material misstatement. We were not engaged to perform an audit of the Company’s internal control over financial reporting. Our audits include consideration of internal control over financial reporting as a basis for designing audit procedures that are appropriate in the circumstances, but not for the purpose of expressing an opinion on the effectiveness of the Company’s internal control over financial reporting. Accordingly, we express no such opinion. An audit also includes examining, on a test basis, evidence supporting the amounts and disclosures in the financial statements, assessing the accounting principles used and significant estimates made by management, and evaluating the overall financial statement presentation. We believe that our audits provide a reasonable basis for our opinion.
In our opinion, the financial statements referred to above present fairly, in all material respects, the consolidated financial position of ING U.S., Inc. at December 31, 2013 and 2012, and the consolidated results of its operations and its cash flows for each of the three years in the period ended December 31, 2013, in conformity with U.S. generally accepted accounting principles. Also, in our opinion, the related financial statement schedules, when considered in relation to the basic financial statements taken as a whole, present fairly in all material respects the information set forth therein.
/s/ Ernst & Young LLP
Atlanta, Georgia
March 10, 2014
F-2
Table of Contents
ING U.S., Inc.
December 31, 2013 and 2012
(In millions, except share and per share data)
| As of December 31, | ||||||||
| 2013 | 2012 | |||||||
| Assets: |
||||||||
| Investments: |
||||||||
| Fixed maturities, available-for-sale, at fair value (amortized cost of $65,033.8 at 2013 and $62,955.4 at 2012) |
$ | 68,317.8 | $ | 70,910.3 | ||||
| Fixed maturities, at fair value using the fair value option |
2,935.3 | 2,771.3 | ||||||
| Equity securities, available-for-sale, at fair value (cost of $267.4 at 2013 and $297.9 at 2012) |
314.4 | 340.1 | ||||||
| Short-term investments |
1,048.1 | 5,991.2 | ||||||
| Mortgage loans on real estate, net of valuation allowance of $3.8 at 2013 and $3.9 at 2012 |
9,312.2 | 8,662.3 | ||||||
| Policy loans |
2,147.0 | 2,200.3 | ||||||
| Limited partnerships/corporations |
236.4 | 465.1 | ||||||
| Derivatives |
1,149.3 | 2,374.5 | ||||||
| Other investments |
124.6 | 167.0 | ||||||
| Securities pledged (amortized cost of $1,457.9 at 2013 and $1,470.0 at 2012) |
1,465.7 | 1,605.5 | ||||||
|
|
|
|
|
|||||
| Total investments |
87,050.8 | 95,487.6 | ||||||
| Cash and cash equivalents |
2,840.8 | 1,786.8 | ||||||
| Short-term investments under securities loan agreements, including collateral delivered |
552.9 | 664.0 | ||||||
| Accrued investment income |
897.1 | 863.5 | ||||||
| Reinsurance recoverable |
6,702.2 | 7,379.3 | ||||||
| Deferred policy acquisition costs and Value of business acquired |
5,351.6 | 3,656.3 | ||||||
| Sales inducements to contract holders |
279.0 | 212.7 | ||||||
| Deferred income taxes |
162.1 | — | ||||||
| Goodwill and other intangible assets |
323.7 | 348.5 | ||||||
| Other assets |
1,036.5 | 1,362.5 | ||||||
| Assets related to consolidated investment entities: |
||||||||
| Limited partnerships/corporations, at fair value |
3,218.6 | 2,931.2 | ||||||
| Cash and cash equivalents |
710.7 | 440.8 | ||||||
| Corporate loans, at fair value using the fair value option |
4,965.3 | 3,559.3 | ||||||
| Other assets |
104.8 | 34.3 | ||||||
| Assets held in separate accounts |
106,827.1 | 97,667.4 | ||||||
|
|
|
|
|
|||||
| Total assets |
$ | 221,023.2 | $ | 216,394.2 | ||||
|
|
|
|
|
|||||
The accompanying notes are an integral part of these Consolidated Financial Statements.
F-3
Table of Contents
ING U.S., Inc.
Consolidated Balance Sheets
December 31, 2013 and 2012
(In millions, except share and per share data)
| As of December 31, | ||||||||
| 2013 | 2012 | |||||||
| Liabilities and Shareholders’ Equity: |
||||||||
| Future policy benefits |
$ | 14,098.4 | $ | 15,493.6 | ||||
| Contract owner account balances |
69,908.3 | 70,562.1 | ||||||
| Payables under securities loan agreement, including collateral held |
769.4 | 1,509.8 | ||||||
| Short-term debt |
— | 1,064.6 | ||||||
| Long-term debt |
3,514.7 | 3,171.1 | ||||||
| Funds held under reinsurance agreements |
1,181.5 | 1,236.6 | ||||||
| Derivatives |
1,351.8 | 1,944.2 | ||||||
| Pension and other post-employment provisions |
474.9 | 903.2 | ||||||
| Current income taxes |
44.1 | 11.7 | ||||||
| Deferred income taxes |
— | 1,042.7 | ||||||
| Other liabilities |
1,274.1 | 1,604.2 | ||||||
| Liabilities related to consolidated investment entities: |
||||||||
| Collateralized loan obligations notes, at fair value using the fair value option |
5,161.6 | 3,829.4 | ||||||
| Other liabilities |
903.3 | 292.4 | ||||||
| Liabilities related to separate accounts |
106,827.1 | 97,667.4 | ||||||
|
|
|
|
|
|||||
| Total liabilities |
205,509.2 | 200,333.0 | ||||||
|
|
|
|
|
|||||
| Shareholders’ equity: |
||||||||
| Common stock (900,000,000 shares authorized, 261,754,931 and 230,079,120 shares issued as of December 31, 2013 and 2012, respectively; 261,675,811 and 230,000,000 shares outstanding as of December 31, 2013 and 2012, respectively; $0.01 par value per share) |
2.6 | 2.3 | ||||||
| Treasury stock (79,120 shares as of December 31, 2013 and 2012, respectively; $0.01 par value per share) |
— | — | ||||||
| Additional paid-in capital |
23,563.7 | 22,917.6 | ||||||
| Accumulated other comprehensive income (loss) |
1,849.1 | 3,710.7 | ||||||
| Retained earnings (deficit): |
||||||||
| Appropriated-consolidated investment entities |
18.4 | 6.4 | ||||||
| Unappropriated |
(12,161.6 | ) | (12,762.1 | ) | ||||
|
|
|
|
|
|||||
| Total ING U.S., Inc. shareholders’ equity |
13,272.2 | 13,874.9 | ||||||
| Noncontrolling interest |
2,241.8 | 2,186.3 | ||||||
|
|
|
|
|
|||||
| Total shareholders’ equity |
15,514.0 | 16,061.2 | ||||||
|
|
|
|
|
|||||
| Total liabilities and shareholders’ equity |
$ | 221,023.2 | $ | 216,394.2 | ||||
|
|
|
|
|
|||||
The accompanying notes are an integral part of these Consolidated Financial Statements.
F-4
Table of Contents
ING U.S., Inc.
Consolidated Statements of Operations
For the Years Ended December 31, 2013, 2012 and 2011
(In millions, except per share data)
| Years Ended December 31, | ||||||||||||
| 2013 | 2012 | 2011 | ||||||||||
| Revenues: |
||||||||||||
| Net investment income |
$ | 4,689.0 | $ | 4,697.9 | $ | 4,968.8 | ||||||
| Fee income |
3,666.3 | 3,515.4 | 3,603.6 | |||||||||
| Premiums |
1,956.3 | 1,861.1 | 1,770.0 | |||||||||
| Net realized gains (losses): |
||||||||||||
| Total other-than-temporary impairments |
(43.7 | ) | (74.1 | ) | (550.6 | ) | ||||||
| Less: Portion of other-than-temporary impairments recognized in Other comprehensive income (loss) |
(8.0 | ) | (19.0 | ) | (47.9 | ) | ||||||
|
|
|
|
|
|
|
|||||||
| Net other-than-temporary impairments recognized in earnings |
(35.7 | ) | (55.1 | ) | (502.7 | ) | ||||||
| Other net realized capital gains (losses) |
(2,499.1 | ) | (1,225.7 | ) | (1,028.7 | ) | ||||||
|
|
|
|
|
|
|
|||||||
| Total net realized capital gains (losses) |
(2,534.8 | ) | (1,280.8 | ) | (1,531.4 | ) | ||||||
| Other revenue |
433.0 | 378.5 | 428.2 | |||||||||
| Income (loss) related to consolidated investment entities: |
||||||||||||
| Net investment income (loss) |
545.2 | 556.6 | 528.4 | |||||||||
| Changes in fair value related to collateralized loan obligations |
3.5 | (113.4 | ) | (48.8 | ) | |||||||
|
|
|
|
|
|
|
|||||||
| Total revenues |
8,758.5 | 9,615.3 | 9,718.8 | |||||||||
|
|
|
|
|
|
|
|||||||
| Benefits and expenses: |
||||||||||||
| Policyholder benefits |
2,409.4 | 2,613.5 | 3,286.5 | |||||||||
| Interest credited to contract owner account balance |
2,088.4 | 2,248.1 | 2,455.5 | |||||||||
| Operating expenses |
2,686.7 | 3,155.0 | 3,030.8 | |||||||||
| Net amortization of deferred policy acquisition costs and value of business acquired |
442.8 | 722.3 | 387.0 | |||||||||
| Interest expense |
184.8 | 153.7 | 139.3 | |||||||||
| Operating expenses related to consolidated investment entities: |
||||||||||||
| Interest expense |
180.6 | 106.4 | 68.4 | |||||||||
| Other expense |
7.7 | 10.3 | 73.5 | |||||||||
|
|
|
|
|
|
|
|||||||
| Total benefits and expenses |
8,000.4 | 9,009.3 | 9,441.0 | |||||||||
|
|
|
|
|
|
|
|||||||
| Income (loss) before income taxes |
758.1 | 606.0 | 277.8 | |||||||||
| Income tax expense (benefit) |
(32.5 | ) | (5.2 | ) | 175.0 | |||||||
|
|
|
|
|
|
|
|||||||
| Net income (loss) |
790.6 | 611.2 | 102.8 | |||||||||
| Less: Net income (loss) attributable to noncontrolling interest |
190.1 | 138.2 | 190.9 | |||||||||
|
|
|
|
|
|
|
|||||||
| Net income (loss) available to ING U.S., Inc.’s common shareholders |
$ | 600.5 | $ | 473.0 | $ | (88.1 | ) | |||||
|
|
|
|
|
|
|
|||||||
| Net income (loss) available to ING U.S., Inc.’s common shareholders per common share: |
||||||||||||
| Basic |
$ | 2.40 | $ | 2.06 | $ | (0.38 | ) | |||||
|
|
|
|
|
|
|
|||||||
| Diluted |
$ | 2.38 | $ | 2.06 | $ | (0.38 | ) | |||||
|
|
|
|
|
|
|
|||||||
| Cash dividends declared per share of common stock |
$ | 0.02 | $ | — | $ | — | ||||||
|
|
|
|
|
|
|
|||||||
The accompanying notes are an integral part of these Consolidated Financial Statements.
F-5
Table of Contents
ING U.S., Inc.
Consolidated Statements of Comprehensive Income
For the Years Ended December 31, 2013, 2012 and 2011
(In millions)
| Years Ended December 31, | ||||||||||||
| 2013 | 2012 | 2011 | ||||||||||
| Net income (loss) |
$ | 790.6 | $ | 611.2 | $ | 102.8 | ||||||
| Other comprehensive income (loss), before tax: |
||||||||||||
| Unrealized gains/losses on securities |
(2,989.8 | ) | 1,659.1 | 1,655.4 | ||||||||
| Other-than-temporary impairments |
48.0 | 52.2 | 165.4 | |||||||||
| Pension and other postretirement benefits liability |
(13.8 | ) | (21.4 | ) | 78.9 | |||||||
|
|
|
|
|
|
|
|||||||
| Other comprehensive income (loss), before tax |
(2,955.6 | ) | 1,689.9 | 1,899.7 | ||||||||
| Income tax expense (benefit) related to items of other comprehensive income (loss) |
(1,094.0 | ) | 574.2 | 278.0 | ||||||||
|
|
|
|
|
|
|
|||||||
| Other comprehensive income (loss), after tax |
(1,861.6 | ) | 1,115.7 | 1,621.7 | ||||||||
|
|
|
|
|
|
|
|||||||
| Comprehensive income (loss) |
(1,071.0 | ) | 1,726.9 | 1,724.5 | ||||||||
| Less: Comprehensive income (loss) attributable to the noncontrolling interest |
190.1 | 138.2 | 190.9 | |||||||||
|
|
|
|
|
|
|
|||||||
| Comprehensive income (loss) attributable to ING U.S., Inc.’s common shareholders |
$ | (1,261.1 | ) | $ | 1,588.7 | $ | 1,533.6 | |||||
|
|
|
|
|
|
|
|||||||
The accompanying notes are an integral part of these Consolidated Financial Statements.
F-6
Table of Contents
ING U.S., Inc.
Consolidated Statements of Changes in Shareholders’ Equity
For the Years Ended December 31, 2013, 2012 and 2011
(In millions)
| Common Stock |
Additional Paid-In Capital |
Accumulated Other Comprehensive Income (Loss) |
Retained Earnings (Deficit) |
Total ING U.S., Inc. Shareholders’ Equity |
Noncontrolling Interest |
Total Shareholders’ Equity |
||||||||||||||||||||||||||
| Appropriated | Unappropriated | |||||||||||||||||||||||||||||||
| Balance at January 1, 2011 |
$ | 2.3 | $ | 18,825.0 | $ | 973.3 | $ | 177.2 | $ | (13,147.0 | ) | $ | 6,830.8 | $ | 1,237.0 | $ | 8,067.8 | |||||||||||||||
| Comprehensive income (loss): |
||||||||||||||||||||||||||||||||
| Net income (loss) |
— | — | — | — | (88.1 | ) | (88.1 | ) | 190.9 | 102.8 | ||||||||||||||||||||||
| Other comprehensive income (loss), after tax |
— | — | 1,621.7 | — | — | 1,621.7 | — | 1,621.7 | ||||||||||||||||||||||||
|
|
|
|
|
|
|
|
|
|
|
|
|
|
|
|
|
|||||||||||||||||
| Total comprehensive income (loss) |
1,533.6 | 190.9 | 1,724.5 | |||||||||||||||||||||||||||||
| Reclassification of noncontrolling interest |
— | — | — | (50.7 | ) | — | (50.7 | ) | 50.7 | — | ||||||||||||||||||||||
| Contribution of capital |
— | 3,979.7 | — | — | — | 3,979.7 | — | 3,979.7 | ||||||||||||||||||||||||
| Common Stock Issuance |
— | — | — | — | — | — | — | — | ||||||||||||||||||||||||
| Dividends on common stock |
— | — | — | — | — | — | — | — | ||||||||||||||||||||||||
| Share-based compensation |
— | 60.5 | — | — | — | 60.5 | — | 60.5 | ||||||||||||||||||||||||
| Contribution from (Distribution to) noncontrolling interest, net |
— | — | — | — | — | — | 93.6 | 93.6 | ||||||||||||||||||||||||
|
|
|
|
|
|
|
|
|
|
|
|
|
|
|
|
|
|||||||||||||||||
| Balance at December 31, 2011 |
2.3 | 22,865.2 | 2,595.0 | 126.5 | (13,235.1 | ) | 12,353.9 | 1,572.2 | 13,926.1 | |||||||||||||||||||||||
| Comprehensive income (loss): |
||||||||||||||||||||||||||||||||
| Net income (loss) |
— | — | — | — | 473.0 | 473.0 | 138.2 | 611.2 | ||||||||||||||||||||||||
| Other comprehensive income (loss), after tax |
— | — | 1,115.7 | — | — | 1,115.7 | — | 1,115.7 | ||||||||||||||||||||||||
|
|
|
|
|
|
|
|
|
|
|
|
|
|
|
|
|
|||||||||||||||||
| Total comprehensive income (loss) |
1,588.7 | 138.2 | 1,726.9 | |||||||||||||||||||||||||||||
| Reclassification of noncontrolling interest |
— | — | — | (120.1 | ) | — | (120.1 | ) | 120.1 | — | ||||||||||||||||||||||
| Contribution of capital |
— | — | — | — | — | — | — | — | ||||||||||||||||||||||||
| Common Stock Issuance |
— | — | — | — | — | — | — | — | ||||||||||||||||||||||||
| Dividends on common stock |
— | — | — | — | — | — | — | — | ||||||||||||||||||||||||
| Share-based compensation |
— | 52.4 | — | — | — | 52.4 | — | 52.4 | ||||||||||||||||||||||||
| Contribution from (Distribution to) noncontrolling interest, net |
— | — | — | — | — | — | 355.8 | 355.8 | ||||||||||||||||||||||||
|
|
|
|
|
|
|
|
|
|
|
|
|
|
|
|
|
|||||||||||||||||
| Balance at December 31, 2012 |
2.3 | 22,917.6 | 3,710.7 | 6.4 | (12,762.1 | ) | 13,874.9 | 2,186.3 | 16,061.2 | |||||||||||||||||||||||
| Comprehensive income (loss): |
||||||||||||||||||||||||||||||||
| Net income (loss) |
— | — | — | — | 600.5 | 600.5 | 190.1 | 790.6 | ||||||||||||||||||||||||
| Other comprehensive income (loss), after tax |
— | — | (1,861.6 | ) | — | — | (1,861.6 | ) | — | (1,861.6 | ) | |||||||||||||||||||||
|
|
|
|
|
|
|
|
|
|
|
|
|
|
|
|
|
|||||||||||||||||
| Total comprehensive income (loss) |
(1,261.1 | ) | 190.1 | (1,071.0 | ) | |||||||||||||||||||||||||||
| Reclassification of noncontrolling interest |
— | — | — | 12.0 | — | 12.0 | (12.0 | ) | — | |||||||||||||||||||||||
| Contribution of capital |
— | — | — | — | — | — | — | — | ||||||||||||||||||||||||
| Common Stock Issuance |
0.3 | 571.3 | — | — | — | 571.6 | — | 571.6 | ||||||||||||||||||||||||
| Dividends on common stock |
— | (5.2 | ) | — | — | — | (5.2 | ) | — | (5.2 | ) | |||||||||||||||||||||
| Share-based compensation |
— | 80.0 | — | — | — | 80.0 | — | 80.0 | ||||||||||||||||||||||||
| Contribution from (Distribution to) noncontrolling interest, net |
— | — | — | — | — | — | (122.6 | ) | (122.6 | ) | ||||||||||||||||||||||
|
|
|
|
|
|
|
|
|
|
|
|
|
|
|
|
|
|||||||||||||||||
| Balance at December 31, 2013 |
$ | 2.6 | $ | 23,563.7 | $ | 1,849.1 | $ | 18.4 | $ | (12,161.6 | ) | $ | 13,272.2 | $ | 2,241.8 | $ | 15,514.0 | |||||||||||||||
|
|
|
|
|
|
|
|
|
|
|
|
|
|
|
|
|
|||||||||||||||||
The accompanying notes are an integral part of these Consolidated Financial Statements.
F-7
Table of Contents
ING U.S., Inc.
Consolidated Statements of Cash Flows
For the Years Ended December 31, 2013, 2012 and 2011
(In millions)
| Years Ended December 31, | ||||||||||||
| 2013 | 2012 | 2011 | ||||||||||
| Cash Flows from Operating Activities: |
||||||||||||
| Net income (loss) |
$ | 790.6 | $ | 611.2 | $ | 102.8 | ||||||
| Adjustments to reconcile net income (loss) to net cash provided by operating activities: |
||||||||||||
| Capitalization of deferred policy acquisition costs, value of business acquired and sales inducements |
(439.2 | ) | (642.7 | ) | (692.2 | ) | ||||||
| Net amortization of deferred policy acquisition costs, value of business acquired and sales inducements |
495.5 | 784.9 | 401.0 | |||||||||
| Net accretion/amortization of discount/premium |
54.9 | 70.8 | 133.4 | |||||||||
| Future policy benefits, claims reserves and interest credited |
493.2 | 949.2 | 2,946.0 | |||||||||
| Deferred income tax (benefit) expense |
(110.8 | ) | (44.5 | ) | 236.6 | |||||||
| Net realized capital losses |
2,534.8 | 1,280.8 | 1,531.4 | |||||||||
| Depreciation and amortization |
85.4 | 90.5 | 96.0 | |||||||||
| Employee retirement (benefit) cost |
(384.8 | ) | 190.3 | 204.5 | ||||||||
| Employer retirement contributions |
(57.4 | ) | (105.9 | ) | (178.0 | ) | ||||||
| Share-based compensation |
80.0 | 52.4 | 60.5 | |||||||||
| Gains on consolidated investment entities |
(214.5 | ) | (265.4 | ) | (315.3 | ) | ||||||
| (Gains) losses on limited partnerships/corporations |
(91.0 | ) | 138.3 | 42.6 | ||||||||
| Change in: |
||||||||||||
| Accrued investment income |
(33.6 | ) | 18.2 | (35.9 | ) | |||||||
| Reinsurance recoverable |
467.8 | 344.1 | 35.0 | |||||||||
| Other receivables and assets accruals |
24.8 | 125.4 | 12.1 | |||||||||
| Other payables and accruals |
(91.2 | ) | 78.3 | (293.2 | ) | |||||||
| Funds held under reinsurance agreements |
(55.1 | ) | (71.0 | ) | 47.1 | |||||||
| (Increase) decrease in cash held by consolidated investment entities |
(269.9 | ) | (303.8 | ) | 57.7 | |||||||
| Other, net |
(16.1 | ) | (19.0 | ) | (35.1 | ) | ||||||
|
|
|
|
|
|
|
|||||||
| Net cash provided by operating activities |
3,263.4 | 3,282.1 | 4,357.0 | |||||||||
|
|
|
|
|
|
|
|||||||
| Cash Flows from Investing Activities: |
||||||||||||
| Proceeds from the sale, maturity, disposal or redemption of: |
||||||||||||
| Fixed maturities |
16,681.3 | 17,015.2 | 17,312.4 | |||||||||
| Equity securities, available-for-sale |
51.6 | 66.8 | 206.9 | |||||||||
| Mortgage loans on real estate |
1,580.0 | 1,991.8 | 1,542.5 | |||||||||
| Loan—Dutch State obligation |
— | 1,781.9 | 505.6 | |||||||||
| Limited partnerships/corporations |
466.1 | 895.9 | 121.3 | |||||||||
| Acquisition of: |
||||||||||||
| Fixed maturities |
(19,014.8 | ) | (17,292.3 | ) | (18,598.9 | ) | ||||||
| Equity securities, available-for-sale |
(47.6 | ) | (41.8 | ) | (52.7 | ) | ||||||
| Mortgage loans on real estate |
(2,206.0 | ) | (1,969.0 | ) | (2,057.9 | ) | ||||||
| Limited partnerships/corporations |
(97.0 | ) | (178.9 | ) | (156.4 | ) | ||||||
| Short-term investments, net |
4,943.1 | (2,397.4 | ) | (763.2 | ) | |||||||
| Policy loans, net |
53.3 | 63.6 | 127.9 | |||||||||
| Derivatives, net |
(2,623.7 | ) | (1,395.8 | ) | (1,216.7 | ) | ||||||
| Other investments, net |
53.0 | 43.4 | (8.4 | ) | ||||||||
| Sales from consolidated investment entities |
3,203.0 | 1,781.7 | 2,422.8 | |||||||||
| Purchase of consolidated investment entities |
(4,257.9 | ) | (2,851.6 | ) | (3,044.6 | ) | ||||||
| Collateral (delivered) received, net |
(629.3 | ) | 139.9 | 756.7 | ||||||||
| Purchases of fixed assets, net |
(40.7 | ) | (29.3 | ) | (32.9 | ) | ||||||
| Other, net |
— | — | (16.1 | ) | ||||||||
|
|
|
|
|
|
|
|||||||
| Net cash used in investing activities |
(1,885.6 | ) | (2,375.9 | ) | (2,951.7 | ) | ||||||
|
|
|
|
|
|
|
|||||||
F-8
Table of Contents
ING U.S., Inc.
Consolidated Statements of Cash Flows
For the Years Ended December 31, 2013, 2012 and 2011
(In millions)
| Years Ended December 31, | ||||||||||||
| 2013 | 2012 | 2011 | ||||||||||
| Cash Flows from Financing Activities: |
||||||||||||
| Deposits received for investment contracts |
12,893.9 | 16,118.8 | 16,571.1 | |||||||||
| Maturities and withdrawals from investment contracts |
(14,301.0 | ) | (19,033.4 | ) | (16,746.6 | ) | ||||||
| Proceeds from issuance of debt with maturities of more than three months |
2,146.8 | 3,049.6 | 606.5 | |||||||||
| Repayment of debt with maturities of more than three months |
(2,697.4 | ) | (902.5 | ) | (573.8 | ) | ||||||
| Short-term debt, net |
(171.6 | ) | (309.1 | ) | (1,905.0 | ) | ||||||
| Debt issuance costs |
(26.5 | ) | (38.8 | ) | — | |||||||
| Borrowings of consolidated investment entities |
196.5 | 152.6 | 138.9 | |||||||||
| Repayments of borrowings of consolidated investment entities |
(128.2 | ) | (56.6 | ) | (121.4 | ) | ||||||
| Contributions from participants in consolidated investment entities |
1,197.3 | 1,262.0 | 647.7 | |||||||||
| Proceeds from issuance of common stock, net |
571.6 | — | — | |||||||||
| Dividends paid |
(5.2 | ) | — | — | ||||||||
|
|
|
|
|
|
|
|||||||
| Net cash (used in) provided by financing activities |
(323.8 | ) | 242.6 | (1,382.6 | ) | |||||||
|
|
|
|
|
|
|
|||||||
| Net increase in cash and cash equivalents |
1,054.0 | 1,148.8 | 22.7 | |||||||||
| Cash and cash equivalents, beginning of year |
1,786.8 | 638.0 | 615.3 | |||||||||
|
|
|
|
|
|
|
|||||||
| Cash and cash equivalents, end of year |
$ | 2,840.8 | $ | 1,786.8 | $ | 638.0 | ||||||
|
|
|
|
|
|
|
|||||||
| Supplemental cash flow information: |
||||||||||||
| Income taxes paid, net |
$ | 44.6 | $ | 3.5 | $ | 17.6 | ||||||
| Interest paid |
147.4 | 114.9 | 191.4 | |||||||||
| Non-cash financing activities: |
||||||||||||
| Debt extinguishment |
$ | — | $ | — | $ | 3,979.7 | ||||||
| Capital contribution |
— | — | 3,979.7 | |||||||||
The accompanying notes are an integral part of these Consolidated Financial Statements.
F-9
Table of Contents
ING U.S., Inc.
Notes to the Consolidated Financial Statements
(Dollar amounts in millions, unless otherwise stated)
1. Business, Basis of Presentation and Significant Accounting Policies
Business
ING U.S., Inc. and its subsidiaries (collectively, “the Company”) is a financial services organization in the United States that offers a broad range of retirement services, annuities, investment management services, mutual funds, life insurance, group insurance and supplemental health products, guaranteed investment contracts and funding agreements. The Company provides its principal products and services in three businesses (Retirement Solutions, Investment Management and Insurance Solutions) and reports results through five ongoing operating segments, including Retirement, Annuities, Investment Management, Individual Life and Employee Benefits. The Company also has a Corporate segment, which includes the financial data not directly related to the businesses, and Closed Block segments. See the Note 20. Segments to these Consolidated Financial Statements.
In 2009, ING Groep N.V. (“ING Group” or “ING”), a global financial services holding company based in The Netherlands, with American Depository Shares listed on the New York Stock Exchange, announced the anticipated separation of its global banking and insurance businesses, including the divestiture of the Company. On April 11, 2013, the Company announced plans to rebrand in the future as Voya Financial. On May 2, 2013, the common stock of ING U.S., Inc. began trading on the New York Stock Exchange under the symbol “VOYA.” On May 7, 2013 and May 31, 2013, ING U.S., Inc. completed its initial public offering of common stock, including the issuance and sale by ING U.S., Inc. of 30,769,230 shares of common stock and the sale by ING Insurance International B.V. (“ING International”), an indirect, wholly owned subsidiary of ING Group and previously the sole stockholder of ING U.S., Inc., of 44,201,773 shares of outstanding common stock of ING U.S., Inc. (collectively, “the IPO”). On September 30, 2013, ING International transferred all of its shares of ING U.S., Inc. common stock to ING Group.
On October 29, 2013, ING Group completed a sale of 37,950,000 shares of common stock of the Company in a registered public offering (“Secondary Offering”), reducing ING Group’s ownership in the Company to 57%.
Basis of Presentation
On April 11, 2013, the Company filed an amended restated certificate of incorporation that provides for an authorized capital stock consisting of 1,000,000,000 shares, of which 900,000,000 shares (par value $0.01 per share) are designated as common stock and 100,000,000 shares (par value $0.01 per share) are designated as preferred stock. In addition, the amended and restated certificate of incorporation effected a 2,295.248835-for-1 split of the Company’s then outstanding common stock, resulting in 230,079,120 shares of common stock issued, including 79,120 shares of Treasury stock, and 230,000,000 shares of common stock outstanding and held by ING International, prior to the IPO. The accompanying Consolidated Financial Statements and Notes to the Consolidated Financial Statements give retroactive effect to the stock split for all periods presented. There are no preferred shares issued or outstanding.
The accompanying Consolidated Financial Statements of the Company have been prepared in accordance with accounting principles generally accepted in the United States (“U.S. GAAP”).
The Consolidated Financial Statements include the accounts of ING U.S., Inc. and its subsidiaries, as well as partnerships (voting interest entities (“VOEs”)) in which the Company has control and variable interest entities (“VIEs”) for which the Company is the primary beneficiary. See Note 19. Consolidated Investment Entities. Intercompany transactions and balances have been eliminated.
Certain immaterial reclassifications have been made to prior year financial information to conform to the current year classifications.
F-10
Table of Contents
ING U.S., Inc.
Notes to the Consolidated Financial Statements
(Dollar amounts in millions, unless otherwise stated)
Significant Accounting Policies
Estimates and Assumptions
The preparation of financial statements in conformity with U.S. GAAP requires management to make estimates and assumptions that affect the reported amounts of assets and liabilities and disclosure of contingent assets and liabilities at the date of the Consolidated Financial Statements and the reported amounts of revenues and expenses during the reporting period. Those estimates are inherently subject to change and actual results could differ from those estimates.
The Company has identified the following accounts and policies as the most significant in that they involve a higher degree of judgment, are subject to a significant degree of variability and/or contain significant accounting estimates:
Reserves for future policy benefits, deferred policy acquisition costs (“DAC”), value of business acquired (“VOBA”) and other intangibles, valuation of investments and derivatives, impairments, income taxes, contingencies and employee benefit plans.
Fair Value Measurement
The Company measures the fair value of its financial assets and liabilities based on assumptions used by market participants in pricing the asset or liability, which may include inherent risk, restrictions on the sale or use of an asset or nonperformance risk, which is the risk that the issuing subsidiary will not fulfill its obligation. The estimate of an exchange price is the price in an orderly transaction between market participants to sell the asset or transfer the liability (“exit price”) in the principal market, or the most advantageous market in the absence of a principal market, for that asset or liability. The Company utilizes a number of valuation sources to determine the fair values of its financial assets and liabilities, including quoted market prices, third-party commercial pricing services, third-party brokers, industry-standard, vendor-provided software that models the value based on market observable inputs and other internal modeling techniques based on projected cash flows.
Investments
The accounting policies for the Company’s principal investments are as follows:
Fixed Maturities and Equity Securities: The Company’s fixed maturities and equity securities are currently designated as available-for-sale, except those accounted for using the fair value option (“FVO”). Available-for-sale securities are reported at fair value and unrealized capital gains (losses) on these securities are recorded directly in Accumulated other comprehensive income (loss) (“AOCI”) and presented net of related changes in DAC/VOBA and other intangibles and deferred income taxes. In addition, certain fixed maturities have embedded derivatives, which are reported with the host contract on the Consolidated Balance Sheets.
The Company has elected the FVO for certain of its fixed maturities to better match the measurement of assets and liabilities in the Consolidated Statements of Operations. Certain collateralized mortgage obligations (“CMOs”), primarily interest-only and principal-only strips, are accounted for as hybrid instruments and valued at fair value with changes in the fair value recorded in Other net realized capital gains (losses) in the Consolidated Statements of Operations.
Purchases and sales of fixed maturities and equity securities, excluding private placements, are recorded on the trade date. Purchases and sales of private placements and mortgage loans are recorded on the closing date. Investment gains and losses on sales of securities are generally determined on a first-in-first-out basis.
F-11
Table of Contents
ING U.S., Inc.
Notes to the Consolidated Financial Statements
(Dollar amounts in millions, unless otherwise stated)
Interest income on fixed maturities is recorded when earned using an effective yield method, giving effect to amortization of premiums and accretion of discounts. Dividends on equity securities are recorded when declared. Such dividends and interest income are recorded in Net investment income in the Consolidated Statements of Operations.
Included within fixed maturities are loan-backed securities, including residential mortgage-backed securities (“RMBS”), commercial mortgage-backed securities (“CMBS”) and asset-backed securities (“ABS”). Amortization of the premium or discount from the purchase of these securities considers the estimated timing and amount of prepayments of the underlying loans. Actual prepayment experience is periodically reviewed and effective yields are recalculated when differences arise between the prepayments originally anticipated and the actual prepayments received and currently anticipated. Prepayment assumptions for single class and multi-class mortgage-backed securities (“MBS”) and ABS are estimated by management using inputs obtained from third party specialists, including broker-dealers, and based on management’s knowledge of the current market. For prepayment-sensitive securities such as interest-only, principal-only strips, inverse floaters and credit-sensitive MBS and ABS securities, which represent beneficial interests in securitized financial assets that are not of high credit quality or that have been credit impaired, the effective yield is recalculated on a prospective basis. For all other MBS and ABS, the effective yield is recalculated on a retrospective basis.
Short-term Investments: Short-term investments include investments with remaining maturities of one year or less, but greater than three months, at the time of purchase. These investments are stated at fair value.
Assets Held in Separate Accounts: Assets held in separate accounts are reported at the fair values of the underlying investments in the separate accounts. The underlying investments include mutual funds, short-term investments, cash and fixed maturities.
Mortgage Loans on Real Estate: The Company’s mortgage loans on real estate are all commercial mortgage loans, which are reported at amortized cost, less impairment write-downs and allowance for losses. If a mortgage loan is determined to be impaired (i.e., when it is probable that the Company will be unable to collect all amounts due according to the contractual terms of the loan agreement), the carrying value of the mortgage loan is reduced to the lower of either the present value of expected cash flows from the loan discounted at the loan’s original purchase yield or fair value of the collateral. For those mortgages that are determined to require foreclosure, the carrying value is reduced to the fair value of the underlying collateral, net of estimated costs to obtain and sell at the point of foreclosure. The carrying value of the impaired loans is reduced by establishing a permanent write-down recorded in Other net realized capital gains (losses) in the Consolidated Statements of Operations. Property obtained from foreclosed mortgage loans is recorded in Other investments on the Consolidated Balance Sheets.
Mortgage loans are evaluated by the Company’s investment professionals, including an appraisal of loan-specific credit quality, property characteristics and market trends. Loan performance is continuously monitored on a loan-specific basis throughout the year. The Company’s review includes submitted appraisals, operating statements, rent revenues and annual inspection reports, among other items. This review evaluates whether the properties are performing at a consistent and acceptable level to secure the debt.
Mortgages are rated for the purpose of quantifying the level of risk. Those loans with higher risk are placed on a watch list and are closely monitored for collateral deficiency or other credit events that may lead to a potential loss of principal or interest. The Company defines delinquent mortgage loans consistent with industry practice as 60 days past due.
The Company’s policy is to recognize interest income until a loan becomes 90 days delinquent or foreclosure proceedings are commenced, at which point interest accrual is discontinued. Interest accrual is not resumed until the loan is brought current.
F-12
Table of Contents
ING U.S., Inc.
Notes to the Consolidated Financial Statements
(Dollar amounts in millions, unless otherwise stated)
The Company records an allowance for probable losses incurred on non-impaired loans on an aggregate basis, rather than specifically identified probable losses incurred by individual loan.
Policy Loans: Policy loans are carried at an amount equal to the unpaid balance. Interest income on such loans is recorded as earned in Net investment income using the contractually agreed upon interest rate. Generally, interest is capitalized on the policy’s anniversary date. Valuation allowances are not established for policy loans, as these loans are collateralized by the cash surrender value of the associated insurance contracts. Any unpaid principal or interest on the loan is deducted from the account value or the death benefit prior to settlement of the policy.
Limited Partnerships/Corporations: The Company uses the equity method of accounting for investments in limited partnership interests that are not consolidated, which consists primarily of private equities, hedge funds and VIEs for which the Company is not the primary beneficiary. Generally, the Company records its share of earnings using a lag methodology, relying upon the most recent financial information available, generally not to exceed three months. The Company’s earnings from limited partnership interests accounted for under the equity method are recorded in Net investment income.
Other Investments: Other investments are comprised primarily of Federal Home Loan Bank (“FHLB”) stock and property obtained from foreclosed mortgage loans, as well as other miscellaneous investments. The Company is a member of the FHLB system and is required to own a certain amount of stock based on the level of borrowings and other factors; the Company may invest in additional amounts. FHLB stock is carried at cost, classified as a restricted security and periodically evaluated for impairment based on ultimate recovery of par value.
Securities Lending: The Company engages in securities lending whereby certain securities from its portfolio are loaned to other institutions for short periods of time. Initial collateral, primarily cash, is required at a rate of 102% of the market value of the loaned securities. For certain transactions, a lending agent may be used and the agent may retain some or all of the collateral deposited by the borrower and transfer the remaining collateral to the Company. Collateral retained by the agent is invested in liquid assets on behalf of the Company. The market value of the loaned securities is monitored on a daily basis with additional collateral obtained or refunded as the market value of the loaned securities fluctuates.
Corporate Loans: Corporate loans held by consolidated collateralized loan obligations (“CLO” or “CLO entities”) are reported in Corporate loans, at fair value using the fair value option, on the Consolidated Balance Sheets. Changes in the fair value of the loans are recorded in Changes in fair value related to collateralized loan obligations in the Consolidated Statements of Operations. The fair values for corporate loans are determined using independent commercial pricing services. In the event that the third-party pricing source is unable to price an investment (which occurs in less than 2% of the loans), other relevant factors are considered including:
| • | Information relating to the market for the asset, including price quotations for and trading in the asset or in similar investments and the market environment and investor attitudes towards the asset and interests in similar investments; |
| • | The characteristics of and fundamental analytical data relating to the investment, including the cost, current interest rate, period until next interest rate reset, maturity and base lending rate, the terms and conditions of the corporate loan and any related agreements and the position of the corporate loan in the borrower’s debt structure; |
| • | The nature, adequacy, and value of the corporate loan’s collateral, including the CLO’s rights, remedies and interests with respect to the collateral; |
| • | The creditworthiness of the borrower, based on an evaluation of its financial condition, financial statements and information about the business, cash flows, capital structure and future prospects; |
F-13
Table of Contents
ING U.S., Inc.
Notes to the Consolidated Financial Statements
(Dollar amounts in millions, unless otherwise stated)
| • | The reputation and financial condition of the agent and any intermediate participants in the corporate loan; and |
| • | General economic and market conditions affecting the fair value of the corporate loan. |
Other-than-temporary Impairments
The Company periodically evaluates its available-for-sale investments to determine whether there has been an other-than-temporary decline in fair value below the amortized cost basis. Factors considered in this analysis include, but are not limited to, the length of time and the extent to which the fair value has been less than amortized cost, the issuer’s financial condition and near-term prospects, future economic conditions and market forecasts, interest rate changes and changes in ratings of the security. An extended and severe unrealized loss position on a fixed maturity may not have any impact on: (a) the ability of the issuer to service all scheduled interest and principal payments and (b) the evaluation of recoverability of all contractual cash flows or the ability to recover an amount at least equal to its amortized cost based on the present value of the expected future cash flows to be collected. In contrast, for certain equity securities, the Company gives greater weight and consideration to a decline in market value and the likelihood such market value decline will recover.
When assessing the Company’s intent to sell a security or if it is more likely than not it will be required to sell a security before recovery of its amortized cost basis, management evaluates facts and circumstances such as, but not limited to, decisions to rebalance the investment portfolio and sales of investments to meet cash flow or capital needs.
When the Company has determined it has the intent to sell or if it is more likely than not that the Company will be required to sell a security before recovery of its amortized cost basis and the fair value has declined below amortized cost (“intent impairment”), the individual security is written down from amortized cost to fair value, and a corresponding charge is recorded in Net realized capital gains (losses) in the Consolidated Statements of Operations as an other-than-temporary impairment (“OTTI”). If the Company does not intend to sell the security and it is not more likely than not that the Company will be required to sell the security before recovery of its amortized cost basis, but the Company has determined that there has been an other-than-temporary decline in fair value below the amortized cost basis, the OTTI is bifurcated into the amount representing the present value of the decrease in cash flows expected to be collected (“credit impairment”) and the amount related to other factors (“noncredit impairment”). The credit impairment is recorded in Net realized capital gains (losses) in the Consolidated Statements of Operations. The noncredit impairment is recorded in Other comprehensive income (loss).
The Company uses the following methodology and significant inputs to determine the amount of the OTTI credit loss:
| • | When determining collectability and the period over which the value is expected to recover for U.S. and foreign corporate securities, foreign government securities and state and political subdivision securities, the Company applies the same considerations utilized in its overall impairment evaluation process, which incorporates information regarding the specific security, the industry and geographic area in which the issuer operates and overall macroeconomic conditions. Projected future cash flows are estimated using assumptions derived from the Company’s best estimates of likely scenario-based outcomes, after giving consideration to a variety of variables that includes, but is not limited to: general payment terms of the security; the likelihood that the issuer can service the scheduled interest and principal payments; the quality and amount of any credit enhancements; the security’s position within the capital structure of the issuer; possible corporate restructurings or asset sales by the issuer; and changes to the rating of the security or the issuer by rating agencies. |
F-14
Table of Contents
ING U.S., Inc.
Notes to the Consolidated Financial Statements
(Dollar amounts in millions, unless otherwise stated)
| • | Additional considerations are made when assessing the unique features that apply to certain structured securities such as subprime, Alt-A, non-agency, RMBS, CMBS and ABS. These additional factors for structured securities include, but are not limited to: the quality of underlying collateral; expected prepayment speeds; loan-to-value ratios; debt service coverage ratios; current and forecasted loss severity; and the payment priority within the tranche structure of the security. |
| • | When determining the amount of the credit loss for U.S. and foreign corporate securities, foreign government securities and state and political subdivision securities, the Company considers the estimated fair value as the recovery value when available information does not indicate that another value is more appropriate. When information is identified that indicates a recovery value other than estimated fair value, the Company considers in the determination of recovery value the same considerations utilized in its overall impairment evaluation process, which incorporates available information and the Company’s best estimate of scenarios-based outcomes regarding the specific security and issuer; possible corporate restructurings or asset sales by the issuer; the quality and amount of any credit enhancements; the security’s position within the capital structure of the issuer; fundamentals of the industry and geographic area in which the security issuer operates, and the overall macroeconomic conditions. |
| • | The Company performs a discounted cash flow analysis comparing the current amortized cost of a security to the present value of future cash flows expected to be received, including estimated defaults and prepayments. The discount rate is generally the effective interest rate of the fixed maturity prior to impairment. |
In periods subsequent to the recognition of the credit related impairment components of OTTI on a fixed maturity, the Company accounts for the impaired security as if it had been purchased on the measurement date of the impairment. Accordingly, the discount (or reduced premium) based on the new cost basis is accreted into net investment income over the remaining term of the fixed maturity in a prospective manner based on the amount and timing of estimated future cash flows.
Derivatives
The Company’s use of derivatives is limited mainly to economic hedging to reduce the Company’s exposure to cash flow variability of assets and liabilities, interest rate risk, credit risk, exchange rate risk and market risk. It is the Company’s policy not to offset amounts recognized for derivative instruments and amounts recognized for the right to reclaim cash collateral or the obligation to return cash collateral arising from derivative instruments executed with the same counterparty under a master netting arrangement.
The Company enters into interest rate, equity market, credit default and currency contracts, including swaps, futures, forwards, caps, floors and options, to reduce and manage various risks associated with changes in value, yield, price, cash flow or exchange rates of assets or liabilities held or intended to be held, or to assume or reduce credit exposure associated with a referenced asset, index or pool. The Company also utilizes options and futures on equity indices to reduce and manage risks associated with its annuity products. Open derivative contracts are reported as Derivatives assets or liabilities on the Consolidated Balance Sheets at fair value. Changes in the fair value of derivatives are recorded in Net realized capital gains (losses) in the Consolidated Statements of Operations.
To qualify for hedge accounting, at the inception of the hedging relationship, the Company formally documents its risk management objective and strategy for undertaking the hedging transaction, as well as its designation of the hedge as either (a) a hedge of the exposure to changes in the estimated fair value of a recognized asset or liability or
F-15
Table of Contents
ING U.S., Inc.
Notes to the Consolidated Financial Statements
(Dollar amounts in millions, unless otherwise stated)
an identified portion thereof that is attributable to a particular risk (“fair value hedge”) or (b) a hedge of a forecasted transaction or of the variability of cash flows that is attributable to interest rate risk to be received or paid related to a recognized asset or liability (“cash flow hedge”). In this documentation, the Company sets forth how the hedging instrument is expected to hedge the designated risks related to the hedged item and sets forth the method that will be used to retrospectively and prospectively assess the hedging instrument’s effectiveness and the method that will be used to measure ineffectiveness. A derivative designated as a hedging instrument must be assessed as being highly effective in offsetting the designated risk of the hedged item. Hedge effectiveness is formally assessed at inception and periodically throughout the life of the designated hedging relationship.
| • | Fair Value Hedge: For derivative instruments that are designated and qualify as a fair value hedge, the gain or loss on the derivative instrument, as well as the hedged item, to the extent of the risk being hedged, are recognized in Other net realized capital gains (losses). |
| • | Cash Flow Hedge: For derivative instruments that are designated and qualify as a cash flow hedge, the effective portion of the gain or loss on the derivative instrument is reported as a component of AOCI and reclassified into earnings in the same periods during which the hedged transaction impacts earnings in the same line item associated with the forecasted transaction. The ineffective portion of the derivative’s change in value, if any, along with any of the derivative’s change in value that is excluded from the assessment of hedge effectiveness, are recorded in Other net realized capital gains (losses). |
When hedge accounting is discontinued because it is determined that the derivative is no longer expected to be highly effective in offsetting changes in the estimated fair value or cash flows of a hedged item, the derivative continues to be carried on the Consolidated Balance Sheets at its estimated fair value, with subsequent changes in estimated fair value recognized immediately in Other net realized capital gains (losses). The carrying value of the hedged asset or liability under a fair value hedge is no longer adjusted for changes in its estimated fair value due to the hedged risk, and the cumulative adjustment to its carrying value is amortized into income over the remaining life of the hedged item. Provided the hedged forecasted transaction is still probable of occurrence, the changes in estimated fair value of derivatives recorded in Other comprehensive income (loss) related to discontinued cash flow hedges are released into the Consolidated Statements of Operations when the Company’s earnings are affected by the variability in cash flows of the hedged item.
When hedge accounting is discontinued because it is no longer probable that the forecasted transactions will occur on the anticipated date or within two months of that date, the derivative continues to be carried on the Consolidated Balance Sheets at its estimated fair value, with changes in estimated fair value recognized currently in Other net realized capital gains (losses). Derivative gains and losses recorded in Other comprehensive income (loss) pursuant to the discontinued cash flow hedge of a forecasted transaction that is no longer probable are recognized immediately in Other net realized capital gains (losses).
The Company also has investments in certain fixed maturities and has issued certain annuity products, that contain embedded derivatives whose fair value is at least partially determined by levels of or changes in domestic and/or foreign interest rates (short-term or long-term), exchange rates, prepayment rates, equity markets or credit ratings/spreads. Embedded derivatives within fixed maturities are included with the host contract on the Consolidated Balance Sheets and changes in fair value of the embedded derivatives are recorded in Other net realized capital gains (losses) in the Consolidated Statements of Operations. Embedded derivatives within certain annuity products are included in Future policy benefits on the Consolidated Balance Sheets and changes in the fair value of the embedded derivatives are recorded in Other net realized capital gains (losses) in the Consolidated Statements of Operations.
In addition, the Company has entered into a coinsurance with funds withheld arrangement that contains an embedded derivative, the fair value of which is based on the change in the fair value of the underlying assets held
F-16
Table of Contents
ING U.S., Inc.
Notes to the Consolidated Financial Statements
(Dollar amounts in millions, unless otherwise stated)
in trust. The embedded derivative within the coinsurance with funds withheld arrangement is included in Funds held under reinsurance arrangements on the Consolidated Balance Sheets, and changes in the fair value of the embedded derivative are recorded in Policyholder benefits in the Consolidated Statements of Operations.
Cash and Cash Equivalents
Cash and cash equivalents include cash on hand, amounts due from banks and other highly liquid investments, such as money market instruments and debt instruments with maturities of three months or less at the time of purchase. Cash and cash equivalents are stated at fair value. Cash and cash equivalents of VIEs and VOEs are not available for general use by the Company.
Property and Equipment
Property and equipment are carried at cost, less accumulated depreciation and included in Other assets on the Consolidated Balance Sheets. Expenditures for replacements and major improvements are capitalized; maintenance and repair expenditures are expensed as incurred. Depreciation on property and equipment is provided on a straight-line basis over the estimated useful lives of the assets, with the exception of land and artwork which are not depreciated, as follows:
| Estimated Useful Lives | ||
| Buildings |
40 years | |
| Furniture and fixtures |
5 years | |
| Leasehold improvements |
10 years, or the life of the lease, whichever is shorter | |
| Equipment |
3 years |
As of December 31, 2013 and 2012, total cost basis was $451.5 and $463.5, respectively. As of December 31, 2013 and 2012, total accumulated depreciation was $313.0 and $305.1, respectively. For the years ended December 31, 2013, 2012 and 2011, depreciation expense was $33.7, $36.9 and $36.2, respectively, and included in Operating expenses in the Consolidated Statements of Operations.
Deferred Policy Acquisition Costs, Value of Business Acquired and Other Intangibles
DAC represents policy acquisition costs that have been capitalized and are subject to amortization and interest. Capitalized costs include incremental, direct costs of contract acquisition and certain costs related directly to successful acquisition activities. Such costs consist principally of commissions, underwriting, sales and contract issuance and processing expenses directly related to the successful acquisition of new and renewal business. Indirect or unsuccessful acquisition costs, maintenance, product development and overhead expenses are charged to expense as incurred. VOBA represents the outstanding value of in force business acquired and is subject to amortization and interest. The value is based on the present value of estimated net cash flows embedded in the insurance contracts at the time of the acquisition and increased for subsequent deferrable expenses on purchased policies.
Collectively, we refer to DAC, VOBA, deferred sales inducements (“DSI”) and unearned revenue (“URR”) as “DAC/VOBA and other intangibles”. (See respective DSI and URR sections below.)
Amortization Methodologies
The Company amortizes DAC and VOBA related to certain traditional life insurance contracts and certain accident and health insurance contracts over the premium payment period in proportion to the present value of
F-17
Table of Contents
ING U.S., Inc.
Notes to the Consolidated Financial Statements
(Dollar amounts in millions, unless otherwise stated)
expected gross premiums. Assumptions as to mortality, morbidity, persistency and interest rates, which include provisions for adverse deviation, are consistent with the assumptions used to calculate reserves for future policy benefits.
These assumptions are “locked-in” at issue and not revised unless the DAC or VOBA balance is deemed to be unrecoverable from future expected profits. Recoverability testing is performed for current issue year products to determine if gross premiums are sufficient to cover DAC or VOBA estimated benefits and expenses. In subsequent periods, the recoverability of the DAC or VOBA balances are determined by assessing whether future gross profits are sufficient to amortize DAC or VOBA, as well as provide for expected future benefits and maintenance costs. If a premium deficiency is deemed to be present, charges will be applied against the DAC and VOBA balances before an additional reserve is established. Absent such a premium deficiency, variability in amortization after policy issuance or acquisition relates only to variability in premium volumes.
The Company amortizes DAC and VOBA related to universal life (“UL”) and variable universal life (“VUL”) contracts and fixed and variable deferred annuity contracts over the estimated lives of the contracts in relation to the emergence of estimated gross profits. Assumptions as to mortality, persistency, interest crediting rates, fee income, returns associated with separate account performance, impact of hedge performance, expenses to administer the business and certain economic variables, such as inflation, are based on the Company’s experience and overall capital markets. At each valuation date, estimated gross profits are updated with actual gross profits, and the assumptions underlying future estimated gross profits are evaluated for continued reasonableness. Adjustments to estimated gross profits require that amortization rates be revised retroactively to the date of the contract issuance (“unlocking”). For variable deferred annuity contracts within Closed Block Variable Annuity, the Company amortizes DAC/VOBA and other intangibles in relation to the emergence of estimated gross revenue.
For UL and VUL contracts and fixed and variable deferred annuity contracts, recoverability testing is performed for current issue year products to determine if gross revenues are sufficient to cover DAC/VOBA and other intangibles estimated benefits and expenses. In subsequent years, the Company performs testing to assess the recoverability of DAC/VOBA and other intangibles on an annual basis, or more frequently if circumstances indicate a potential loss recognition issue exists. If DAC/VOBA or other intangibles are not deemed recoverable from future gross profits, changes will be applied against the DAC/VOBA or other intangible balances before an additional reserve is established.
Internal Replacements
Contract owners may periodically exchange one contract for another, or make modifications to an existing contract. These transactions are identified as internal replacements. Internal replacements that are determined to result in substantially unchanged contracts are accounted for as continuations of the replaced contracts. Any costs associated with the issuance of the new contracts are considered maintenance costs and expensed as incurred. Unamortized DAC/VOBA and other intangibles related to the replaced contracts continue to be deferred and amortized in connection with the new contracts. Internal replacements that are determined to result in contracts that are substantially changed are accounted for as extinguishments of the replaced contracts, and any unamortized DAC/VOBA and other intangibles related to the replaced contracts are written off to Net amortization of deferred policy acquisition costs and value of business acquired in the Consolidated Statements of Operations.
Assumptions
Changes in assumptions can have a significant impact on DAC/VOBA and other intangible balances, amortization rates and results of operations. Assumptions are management’s best estimate of future outcome.
F-18
Table of Contents
ING U.S., Inc.
Notes to the Consolidated Financial Statements
(Dollar amounts in millions, unless otherwise stated)
Several assumptions are considered significant in the estimation of gross profits associated with the Company’s variable products. One significant assumption is the assumed return associated with the variable account performance. To reflect the volatility in the equity markets, this assumption involves a combination of near-term expectations and long-term assumptions regarding market performance. The overall return on the variable account is dependent on multiple factors, including the relative mix of the underlying sub-accounts among bond funds and equity funds, as well as equity sector weightings. The Company’s practice assumes that intermediate-term appreciation in equity markets reverts to the long-term appreciation in equity markets (“reversion to the mean”). The Company monitors market events and only changes the assumption when sustained deviations are expected. This methodology incorporates a 9% long-term equity return assumption, a 14% cap and a five-year look-forward period.
Other significant assumptions used in the estimation of gross profits include mortality and for products with credited rates include interest rate spreads and credit losses. Estimated gross revenues and gross profits of variable annuity contracts are sensitive to mortality and estimated policyholder behavior assumptions, such as surrender, lapse and annuitization rates.
Sales Inducements
DSI represent benefits paid to contract owners for a specified period that are incremental to the amounts the Company credits on similar contracts without sales inducements and are higher than the contract’s expected ongoing crediting rates for periods after the inducement. The Company defers sales inducements and amortizes the DSI over the life of the policy using the same methodology and assumptions used to amortize DAC. The amortization of sales inducements is included in Interest credited to contract owner account balances in the Consolidated Statements of Operations. Each year, or more frequently if circumstances indicate a potentially significant recoverability issue exists, the Company reviews DSI to determine the recoverability of these balances.
For the years ended December 31, 2013, 2012 and 2011, the Company capitalized $29.7, $35.1 and $39.9, respectively, of sales inducements. For the years ended December 31, 2013, 2012 and 2011, the Company amortized $52.7, $62.6 and $14.0, respectively, of DSI.
Future Policy Benefits and Contract Owner Accounts
Future Policy Benefits
The Company establishes and carries actuarially-determined reserves that are calculated to meet its future obligations. Reserves also include estimates of unpaid claims as well as claims that the Company believes have been incurred but have not yet been reported as of the balance sheet date. The principal assumptions used to establish liabilities for future policy benefits are based on Company experience and periodically reviewed against industry standards. These assumptions include mortality, morbidity, policy lapse, contract renewal, payment of subsequent premiums or deposits by the contract owner, retirement, investment returns, inflation, benefit utilization and expenses. Changes in, or deviations from, the assumptions used can significantly affect the Company’s reserve levels and related results of operations.
Reserves for traditional life insurance contracts (term insurance, participating and non-participating whole life insurance and traditional group life insurance) and certain accident and health insurance represent the present value of future benefits to be paid to or on behalf of contract owners and related expenses, less the present value of future net premiums. Assumptions as to interest rates, mortality, expenses and persistency are based on the Company’s estimates of anticipated experience at the period the policy is sold or acquired, including a provision for adverse deviation. Interest rates used to calculate the present value of these reserves ranged from 2.5% to 8.3%.
F-19
Table of Contents
ING U.S., Inc.
Notes to the Consolidated Financial Statements
(Dollar amounts in millions, unless otherwise stated)
Reserves for payout contracts with life contingencies are equal to the present value of expected future payments. Assumptions as to interest rates, mortality and expenses are based on the Company’s experience at the period the policy is sold or acquired, including a provision for adverse deviation. Such assumptions generally vary by annuity plan type, year of issue and policy duration. Interest rates used to calculate the present value of future benefits ranged from 3.0% to 8.3%.
Although assumptions are “locked-in” upon the issuance of traditional life insurance contracts, certain accident and health insurance contracts and payout contracts with life contingencies, significant changes in experience or assumptions may require the Company to provide for expected future losses on a product by establishing premium deficiency reserves. Premium deficiency reserves are determined based on best estimate assumptions that exist at the time the premium deficiency reserve is established and do not include a provision for adverse deviation.
Contract Owner Account Balances
Contract owner account balances relate to investment-type contracts and certain annuity product guarantees, as follows:
| • | Account balances for guaranteed investment contracts and funding agreements with fixed maturities (collectively referred to as “GICs”) are calculated using the amount deposited with the Company, less withdrawals, plus interest accrued to the ending valuation date. Interest on these contracts is accrued by a predetermined index, plus a spread or a fixed rate, established at the issue date of the contract. |
| • | Account balances for universal life-type contracts, including VUL and indexed universal life contracts, are equal to cumulative deposits, less charges and withdrawals and account values released upon death, plus credited interest thereon. |
| • | Account balances for fixed annuities and payout contracts without life contingencies are equal to cumulative deposits, less charges and withdrawals, plus credited interest thereon. Credited interest rates vary by product and ranged up to 8.0% for the years 2013, 2012 and 2011. Account balances for group immediate annuities without life contingent payouts are equal to the discounted value of the payment at the implied break-even rate. |
| • | For fixed-indexed annuity contracts (“FIAs”), the aggregate initial liability is equal to the deposit received, plus a bonus, if applicable, and is split into a host component and an embedded derivative component. Thereafter, the host liability accumulates at a set interest rate, and the embedded derivative liability is recognized at fair value. |
Product Guarantees and Additional Reserves
The Company calculates additional reserve liabilities for certain universal life-type products, certain variable annuity guaranteed benefits and variable funding products. The Company periodically evaluates its estimates and adjusts the additional liability balance, with a related charge or credit to benefit expense, if actual experience or other evidence suggests that earlier assumptions should be revised. Changes in, or deviations from, the assumptions used can significantly affect the Company’s reserve levels and related results of operations.
Universal and Variable Life: Reserves for UL and VUL secondary guarantees and paid-up guarantees are calculated by estimating the expected value of death benefits payable and recognizing those benefits ratably over the accumulation period based on total expected assessments. The reserve for such products recognizes the portion of contract assessments received in early years used to compensate the Company for benefits provided in later years. Assumptions used, such as the interest rate, lapse rate and mortality, are consistent with assumptions used in estimating gross profits for purposes of amortizing DAC. Reserves for UL and VUL secondary guarantees and paid up guarantees are recorded in Future policy benefits on the Consolidated Balance Sheets.
F-20
Table of Contents
ING U.S., Inc.
Notes to the Consolidated Financial Statements
(Dollar amounts in millions, unless otherwise stated)
The Company also calculates a benefit ratio for each block of business that meets the requirements for additional reserves and calculates an additional reserve by accumulating amounts equal to the benefit ratio multiplied by the assessments for each period, reduced by excess benefits during the period. The additional reserve is accumulated at interest rates consistent with the DAC model for the period. The calculated reserve includes a provision for UL contracts with patterns of cost of insurance charges that produce expected gains from the insurance benefit function followed by losses from that function in later years. Additional reserves are recorded in Future policy benefits on the Consolidated Balance Sheets.
URR relates to UL and VUL products and represents policy charges for benefits or services to be provided in future periods (see the “Recognition of Insurance Revenue and Related Benefits” section below). The URR balance is recorded in Future policy benefits on the Consolidated Balance Sheets.
GMDB and GMIB: Reserves for annuity guaranteed minimum death benefits (“GMDB”) and guaranteed minimum income benefits (“GMIB”) are determined by estimating the value of expected benefits in excess of the projected account balance and recognizing the excess ratably over the accumulation period based on total expected assessments. Expected experience is based on a range of scenarios. Assumptions used, such as the long-term equity market return, lapse rate and mortality, are consistent with assumptions used in estimating gross revenues for purposes of amortizing DAC. The assumptions of investment performance and volatility are consistent with the historical experience of the appropriate underlying equity index, such as the Standard & Poor’s (“S&P”) 500 Index. In addition, the reserve for the GMIB incorporates assumptions for the likelihood and timing of the potential annuitizations that may be elected by the contract owner. In general, the Company assumes that GMIB annuitization rates will be higher for policies with more valuable guarantees (“in the money” guarantees where the notional benefit amount is in excess of the account value). Reserves for GMDB and GMIB are recorded in Future policy benefits on the Consolidated Balance Sheets. Changes in reserves for GMDB and GMIB are reported in Policyholder benefits in the Consolidated Statements of Operations.
Most contracts issued on or before December 31, 1999 with enhanced death benefit guarantees were reinsured to third-party reinsurers to mitigate the risk associated with such guarantees. For contracts issued after December 31, 1999, the Company instituted a variable annuity guarantee hedge program to mitigate the risks associated with these guarantees, which do not qualify for hedge accounting. The variable annuity guarantee hedge program is based on the Company entering into derivative positions to offset such exposures to GMDB and GMIB due to adverse changes in the equity markets.
GMAB, GMWB, GMWBL and FIA: The Company also issues certain products which contain embedded derivatives that are measured at estimated fair value separately from the host contracts. These products include annuity guaranteed minimum accumulation benefits (“GMAB”), guaranteed minimum withdrawal benefits (“GMWB”), guaranteed minimum withdrawal benefits with life payouts (“GMWBL”) and FIAs. Embedded derivatives associated with GMABs, GMWBs and GMWBLs are recorded in Future policy benefits on the Consolidated Balance Sheets. Embedded derivatives associated with FIAs are recorded in Contract owner account balances on the Consolidated Balance Sheets. Changes in estimated fair value, along with attributed fees collected or payments made, are reported in Other net realized capital gains (losses) in the Consolidated Statements of Operations.
At inception of the GMAB, GMWB and GMWBL contracts, the Company projects a fee to be attributed to the embedded derivative portion of the guarantee equal to the present value of projected future guaranteed benefits. After inception, the estimated fair value of the GMAB, GMWB and GMWBL contracts is determined based on the present value of projected future guaranteed benefits, minus the present value of projected attributed fees. A risk neutral valuation methodology is used under which the cash flows from the guarantees are projected under multiple
F-21
Table of Contents
ING U.S., Inc.
Notes to the Consolidated Financial Statements
(Dollar amounts in millions, unless otherwise stated)
capital market scenarios using observable risk free rates. The projection of future guaranteed benefits and future attributed fees require the use of assumptions for capital markets (e.g., implied volatilities, correlation among indices, risk-free swap curve, etc.) and policyholder behavior (e.g., lapse, benefit utilization, mortality, etc.).
The estimated fair value of the FIA contracts is based on the present value of the excess of interest payments to the contract owners over the growth in the minimum guaranteed contract value. The excess interest payments are determined as the excess of projected index driven benefits over the projected guaranteed benefits. The projection horizon is over the anticipated life of the related contracts, which takes into account best estimate actuarial assumptions, such as partial withdrawals, full surrenders, deaths, annuitizations and maturities.
Stabilizer and MCG: Products with guaranteed credited rates treat the guarantee as an embedded derivative for Stabilizer products and a stand-alone derivative for managed custody guarantee products (“MCG”). These derivatives are measured at estimated fair value and recorded in Contract owner account balances on the Consolidated Balance Sheets. Changes in estimated fair value along with attributed fees collected are reported in Other net realized capital gains (losses) in the Consolidated Statements of Operations.
The estimated fair value of the Stabilizer and MCG contracts is determined based on the present value of projected future claims, minus the present value of future guaranteed premiums. At inception of the contract the Company projects a guaranteed premium to be equal to the present value of the projected future claims. The income associated with the contracts is projected using actuarial and capital market assumptions, including benefits and related contract charges, over the anticipated life of the related contracts. The cash flow estimates are projected under multiple capital market scenarios using observable risk-free rates and other best estimate assumptions.
The GMAB, GMWB, GMWBL, FIA and Stabilizer embedded derivative liabilities and the stand-alone derivative for MCG include a risk margin to capture uncertainties related to policyholder behavior assumptions. The margin represents additional compensation a market participant would require to assume these risks.
The discount rate used to determine the fair value of GMAB, GMWB, GMWBL, FIA and Stabilizer embedded derivative liabilities and the stand-alone derivative for MCG includes an adjustment to reflect the risk that these obligations will not be fulfilled (“nonperformance risk”).
Separate Accounts
Separate account assets and liabilities generally represent funds maintained to meet specific investment objectives of contract owners or participants who bear the investment risk, subject, in limited cases, to minimum guaranteed rates. Investment income and investment gains and losses generally accrue directly to such contract owners. The assets of each account are legally segregated and are not subject to claims that arise out of any other business of the Company.
Separate account assets supporting variable options under variable annuity contracts are invested, as designated by the contract owner or participant under a contract, in shares of mutual funds that are managed by the Company or in other selected mutual funds not managed by the Company.
The Company reports separately, as assets and liabilities, investments held in the separate accounts and liabilities of separate accounts if:
| • | Such separate accounts are legally recognized; |
| • | Assets supporting the contract liabilities are legally insulated from the Company’s general account liabilities; |
F-22
Table of Contents
ING U.S., Inc.
Notes to the Consolidated Financial Statements
(Dollar amounts in millions, unless otherwise stated)
| • | Investments are directed by the contract owner or participant; and |
| • | All investment performance, net of contract fees and assessments, is passed through to the contract owner. |
The Company reports separate account assets that meet the above criteria at fair value on the Consolidated Balance Sheets based on the fair value of the underlying investments. Separate account liabilities equal separate account assets. Investment income and net realized and unrealized capital gains (losses) of the separate accounts, however, are not reflected in the Consolidated Statements of Operations. The Consolidated Statements of Cash Flows do not reflect investment activity of the separate accounts.
Short-term and Long-term Debt
Short-term and long-term debt are carried at an amount equal to the unpaid principal balance, net of any remaining unamortized discount or premium attributable to issuance. Direct and incremental costs to issue the debt are recorded in Other assets on the Consolidated Balance Sheets and are recognized as a component of Interest expense in the Consolidated Statements of Operations over the life of the debt using the effective interest method of amortization.
Collateralized Loan Obligations Notes
CLO notes issued by consolidated CLO entities are recorded as Collateralized loan obligations notes, at fair value using the fair value option, on the Consolidated Balance Sheets. Changes in the fair value of the notes are recorded in Changes in fair value related to collateralized loan obligations in the Company’s Consolidated Statements of Operations.
Repurchase Agreements
The Company engages in dollar repurchase agreements with MBS (“dollar rolls”) and repurchase agreements with other collateral types to increase its return on investments and improve liquidity. Such arrangements meet the requirements to be accounted for as financing arrangements.
The Company enters into dollar roll transactions by selling existing MBS and concurrently entering into an agreement to repurchase similar securities within a short time frame at a lower price. Under repurchase agreements, the Company borrows cash from a counterparty at an agreed upon interest rate for an agreed upon time frame and pledges collateral in the form of securities. At the end of the agreement, the counterparty returns the collateral to the Company, and the Company, in turn, repays the loan amount along with the additional agreed upon interest.
Company policy requires that at all times during the term of the dollar roll and repurchase agreements that cash or other collateral types obtained is sufficient to allow the Company to fund substantially all of the cost of purchasing replacement assets. Cash received is invested in Short-term investments, with the offsetting obligation to repay the loan included within Other liabilities on the Consolidated Balance Sheets. The carrying value of the securities pledged in dollar rolls and repurchase agreement transactions and the related repurchase obligation are included in Securities pledged and Short-term debt, respectively, on the Consolidated Balance Sheets.
The primary risk associated with short-term collateralized borrowings is that the counterparty will be unable to perform under the terms of the contract. The Company’s exposure is limited to the excess of the net replacement cost of the securities over the value of the short-term investments. The Company believes the counterparties to the dollar rolls and repurchase agreements are financially responsible and that the counterparty risk is minimal.
F-23
Table of Contents
ING U.S., Inc.
Notes to the Consolidated Financial Statements
(Dollar amounts in millions, unless otherwise stated)
Recognition of Insurance Revenue and Related Benefits
Premiums related to traditional life insurance contracts are recognized in Premiums in the Consolidated Statements of Operations when due from the contract owner. When premiums are due over a significantly shorter period than the period over which benefits are provided, any gross premium in excess of the net premium (i.e., the portion of the gross premium required to provide for all expected future benefits and expenses) is deferred and recognized into revenue in a constant relationship to insurance in force. Benefits are recorded in Policyholder benefits in the Consolidated Statements of Operations when incurred.
Amounts received as payment for investment-type, universal life-type, fixed annuities, payout contracts without life contingencies and FIA contracts are reported as deposits to contract owner account balances. Revenues from these contracts consist primarily of fees assessed against the contract owner account balance for mortality and policy administration charges and are reported in Fee income. Surrender charges are reported in Other revenue. In addition, the Company earns investment income from the investment of contract deposits in the Company’s general account portfolio, which is reported in Net investment income in the Consolidated Statements of Operations. Fees assessed that represent compensation to the Company for services to be provided in future periods and certain other fees are established as a URR liability and amortized into revenue over the expected life of the related contracts in proportion to estimated gross profits in a manner consistent with DAC for these contracts. URR is reported in Future policy benefits and amortized into Fee income. Benefits and expenses for these products include claims in excess of related account balances, expenses of contract administration and interest credited to contract owner account balances.
Income Taxes
The Company files a consolidated federal income tax return, which includes many of its subsidiaries, in accordance with the Internal Revenue Code of 1986, as amended.
The Company’s deferred tax assets and liabilities resulting from temporary differences between financial reporting and tax bases of assets and liabilities are measured at the balance sheet date using enacted tax rates expected to apply to taxable income in the years the temporary differences are expected to reverse.
Deferred tax assets represent the tax benefit of future deductible temporary differences and operating loss and tax credit carryforwards. The Company evaluates and tests the recoverability of its deferred tax assets. Deferred tax assets are reduced by a valuation allowance if, based on the weight of evidence, it is more likely than not that some portion, or all, of the deferred tax assets will not be realized. Considerable judgment and the use of estimates are required in determining whether a valuation allowance is necessary and, if so, the amount of such valuation allowance. In evaluating the need for a valuation allowance, the Company considers many factors, including:
| • | The nature and character of the deferred tax assets and liabilities; |
| • | The nature and character of income by life and non-life subgroups; |
| • | The recent cumulative book income (loss) position after adjustment for permanent differences; |
| • | Taxable income in prior carryback years; |
| • | Projected future taxable income, exclusive of reversing temporary differences and carryforwards; |
| • | Projected future reversals of existing temporary differences; |
| • | The length of time carryforwards can be utilized; |
F-24
Table of Contents
ING U.S., Inc.
Notes to the Consolidated Financial Statements
(Dollar amounts in millions, unless otherwise stated)
| • | Prudent and feasible tax planning strategies the Company would employ to avoid a tax benefit from expiring unused; and |
| • | Tax rules that would impact the utilization of the deferred tax assets. |
In establishing unrecognized tax benefits, the Company determines whether a tax position is more likely than not to be sustained under examination by the appropriate taxing authority. The Company also considers positions that have been reviewed and agreed to as part of an examination by the appropriate taxing authority. Tax positions that do not meet the more likely than not standard are not recognized in the Consolidated Financial Statements. Tax positions that meet this standard are recognized in the Consolidated Financial Statements. The Company measures the tax position as the largest amount of benefit that is greater than 50% likely of being realized upon ultimate resolution with the tax authority that has full knowledge of all relevant information.
Reinsurance
The Company utilizes reinsurance agreements in most aspects of its insurance business to reduce its exposure to large losses. Such reinsurance permits recovery of a portion of losses from reinsurers, although it does not discharge the primary liability of the Company as direct insurer of the risks reinsured.
For each of its reinsurance agreements, the Company determines whether the agreement provides indemnification against loss or liability relating to insurance risk. The Company reviews all contractual features, particularly those that may limit the amount of insurance risk to which the reinsurer is subject or features that delay the timely reimbursement of claims. The assumptions used to account for both long and short-duration reinsurance agreements are consistent with those used for the underlying contracts. Ceded future policy benefits and contract owner liabilities are reported gross on the Consolidated Balance Sheets.
Long-duration: For reinsurance of long-duration contracts that transfer significant insurance risk, the difference, if any, between the amounts paid and benefits received related to the underlying contracts is included in the expected net cost of reinsurance, which is recorded as a component of the reinsurance asset or liability. Any difference between actual and expected net cost of reinsurance is recognized in the current period and included as a component of profits used to amortize DAC.
Short-duration: For prospective reinsurance of short-duration contracts that meet the criteria for reinsurance accounting, amounts paid are recorded as ceded premiums and ceded unearned premiums and are reflected as a component of Premiums in the Consolidated Statements of Operations and Other assets on the Consolidated Balance Sheets, respectively. Ceded unearned premiums are amortized through premiums over the remaining contract period in proportion to the amount of protection provided.
For retroactive reinsurance of short-duration contracts that meet the criteria for reinsurance accounting, amounts paid in excess of the related insurance liabilities ceded are recognized immediately as a loss. Any gains on such retroactive agreements are deferred in Other liabilities and amortized over the remaining life of the underlying contracts.
Accounting for reinsurance requires extensive use of assumptions and estimates, particularly related to the future performance of the underlying business and the potential impact of counterparty credit risks. The Company periodically reviews actual and anticipated experience compared to the assumptions used to establish assets and liabilities relating to ceded and assumed reinsurance. The Company also evaluates the financial strength of potential reinsurers and continually monitors the financial condition of reinsurers. The S&P ratings for the Company’s reinsurers with the largest reinsurance recoverable balances are all A rated or better, including Lincoln National Corporation (“Lincoln”), Hannover Life Reassurance Company of America and Hannover Re
F-25
Table of Contents
ING U.S., Inc.
Notes to the Consolidated Financial Statements
(Dollar amounts in millions, unless otherwise stated)
(Ireland) Plc (collectively, “Hannover Re”) and various subsidiaries of Reinsurance Group of America Incorporated (collectively, “RGA”).
Only those reinsurance recoverable balances deemed probable of recovery are recognized as assets on the Company’s Consolidated Balance Sheets and are stated net of allowances for uncollectible reinsurance. Amounts currently recoverable and payable under reinsurance agreements are included in Reinsurance recoverable and Other liabilities, respectively. Such assets and liabilities relating to reinsurance agreements with the same reinsurer are recorded net on the Consolidated Balance Sheets if a right of offset exists within the reinsurance agreement. Premiums, Fee income and Policyholder benefits are reported net of reinsurance ceded. Amounts received from reinsurers for policy administration are reported in Other revenue.
The Company has entered into a coinsurance with funds withheld arrangement that contains an embedded derivative whose carrying value is estimated based upon the change in the fair value of the assets supporting the funds withheld payable under the agreement.
Employee Benefits Plans
Certain subsidiaries of the Company sponsor and/or administer various plans that provide defined benefit pension and other postretirement benefit plans covering eligible employees, sales representatives and other individuals. The plans are generally funded through payments, determined by periodic actuarial calculations, to trustee-administered funds.
A defined benefit plan is a pension plan that defines an amount of pension benefit that an employee will receive on retirement, usually dependent on one or more factors such as age, years of service and compensation. The liability recognized in respect of defined benefit pension plans is the present value of the projected pension benefit obligation (“PBO”) at the balance sheet date, less the fair value of plan assets, together with adjustments for unrecognized past service costs. This liability is included in Pension and other postretirement provisions on the Consolidated Balance Sheets. The PBO is defined as the actuarially calculated present value of vested and non-vested pension benefits accrued based on future salary levels. The Company recognizes the funded status of the PBO for pension plans and the accumulated postretirement benefit obligation (“APBO”) for other postretirement plans on the Consolidated Balance Sheets.
Net periodic benefit cost is determined using management estimates and actuarial assumptions to derive service cost, interest cost and expected return on plan assets for a particular year. The obligations and expenses associated with these plans require use of assumptions, such as discount rate, expected rate of return on plan assets, rate of future compensation increases and healthcare cost trend rates, as well as assumptions regarding participant demographics such as age of retirements, withdrawal rates and mortality. Management determines these assumptions based upon a variety of factors such as historical performance of the plan and its assets, currently available market and industry data and expected benefit payout streams. The assumptions used may differ materially from actual results due to, among other factors, changing market and economic conditions and changes in participant demographics. These differences may have a significant effect on the Company’s Consolidated Financial Statements and liquidity. Differences between the expected return and the actual return on plan assets and actuarial gains (losses) are immediately recognized in Operating expenses in the Consolidated Statements of Operations.
For postretirement healthcare and other benefits to retirees, the entitlement to these benefits is usually conditional on the employee remaining in service up to retirement age and the completion of a minimum service period. The expected costs of these benefits are accrued in Other liabilities over the period of employment using an
F-26
Table of Contents
ING U.S., Inc.
Notes to the Consolidated Financial Statements
(Dollar amounts in millions, unless otherwise stated)
accounting methodology similar to that for defined benefit pension plans. Actuarial gains (losses) are immediately recognized in Operating expenses in the Consolidated Statements of Operations.
Share-based Compensation
The Company grants certain employees and directors stock-based compensation awards under various plans. Certain employees of the Company have in the past participated in various ING Group share-based compensation plans for which awards remain outstanding. Both the ING U.S., Inc. and the ING Group share-based compensation plans are subject to certain vesting conditions. The Company measures the cost of the share-based awards at their grant date fair value, based upon the market value of the stock, and recognizes that cost over the vesting period. Differences in actual versus expected experience or changes in expected forfeitures are recognized in the period of change. Compensation expense is principally related to the granting of performance share units, restricted stock units and stock options and is recognized in Operating expenses in the Consolidated Statements of Operations. The majority of awards granted are provided in the first quarter of each year.
Earnings per Common Share
Basic earnings per common share (“EPS”) is computed by dividing earnings available to common shareholders by the weighted average number of common shares outstanding during the period. Diluted EPS is computed assuming the issuance of nonvested shares, restricted stock units, and performance share units using the treasury stock method. Under the treasury stock method, the Company utilizes the average market price to determine the amount of cash that would be available to repurchase shares if the common shares vested. The net incremental share count issued represents the potential dilutive or anti-dilutive securities.
For any period where a loss from earnings available to common shareholders is experienced, shares used in the diluted EPS calculation represent basic shares because using diluted shares would be anti-dilutive to the calculation.
Consolidation and Noncontrolling Interests
The Company consolidates entities in which it, directly or indirectly, is determined to have a controlling financial interest.
VIEs: The Company consolidates VIEs for which it is the primary beneficiary. An entity is a VIE if it has equity investors who lack the characteristics of a controlling financial interest or it does not have sufficient equity at risk to finance its expected activities without additional subordinated financial support from other parties. The primary beneficiary (a) has the power to direct the activities of the entity that most significantly impact the entity’s economic performance and (b) has the obligation to absorb losses or the right to receive benefits from the entity that could potentially be significant to the entity.
VOEs: For entities determined not to be VIEs, the Company consolidates entities in which it has an equity investment of greater than 50% and has control over significant operating, financial and investing decisions of the entity. Additionally, the Company consolidates entities in which the Company is a substantive, controlling general partner, and the limited partners have no substantive rights to impact ongoing governance and operating activities of the partnership.
The Company provides investment management services to, and has transactions with, various CLO entities, private equity funds, real estate funds, fund-of-hedge funds, single strategy hedge funds, insurance entities, securitizations and other investment entities in the normal course of business. In certain instances, the Company serves as the investment manager, making day-to-day investment decisions concerning the assets of these entities. These entities are considered to be either VIEs or VOEs, and the Company evaluates its involvement
F-27
Table of Contents
ING U.S., Inc.
Notes to the Consolidated Financial Statements
(Dollar amounts in millions, unless otherwise stated)
with each entity to determine whether consolidation is required. Investment management fees and contingent performance fees are recorded in Fee income in the Consolidated Statements of Operations.
For certain investment funds after January 1, 2010, and all entities prior to January 1, 2010, the determination is based on previous consolidation guidelines that require an analysis to determine whether (a) an entity in which the Company holds a variable interest is a VIE and (b) the Company’s involvement, through holding interests directly or indirectly in the entity or contractually through other variable interests (e.g., management fees), would be expected to absorb a majority of the entity’s expected losses or receive a majority of residual returns in the entity, or both.
The determination of whether an entity in which the Company holds a variable interest is a VIE requires judgments, which include (1) determining whether the equity investment at risk is sufficient to permit the entity to finance its activities without additional subordinated financial support; (2) evaluating whether the equity holders, as a group, can make decisions that have a significant effect on the success of the entity; (3) determining whether two or more parties’ equity interests should be aggregated; and (4) determining whether the equity investors have proportionate voting rights to their obligations to absorb losses or rights to receive returns from an entity. The Company determines whether it is the primary beneficiary of a VIE at the time it becomes involved with a VIE. Consolidation conclusions are reviewed quarterly to identify whether any reconsideration events have occurred, which would require detailed reassessment of the VIE status.
The Company has elected to apply the FVO for financial assets and financial liabilities held by consolidated CLO entities and continues to measure these assets (primarily senior bank and corporate loans) and liabilities (debt obligations issued by CLO entities) at fair value in subsequent periods. The Company has elected the FVO to more closely align its accounting with the economics of its transactions. This election allows the Company to more effectively align changes in the fair value of CLO assets with a commensurate change in the fair value of CLO liabilities.
Noncontrolling interest represents the interests of shareholders, other than the Company, in consolidated entities. In the Consolidated Statements of Operations, net earnings and losses attributable to noncontrolling interest represents such shareholders’ interests in the earnings and losses of those entities, or the attribution of results from consolidated VIEs or VOEs to which the Company is not economically entitled.
Contingencies
A loss contingency is an existing condition, situation or set of circumstances involving uncertainty as to possible loss that will ultimately be resolved when one or more future events occur or fail to occur. Examples of loss contingencies include pending or threatened adverse litigation, threat of expropriation of assets and actual or possible claims and assessments. Amounts related to loss contingencies are accrued and recorded in Other liabilities on the Consolidated Balance Sheets if it is probable that a loss has been incurred and the amount can be reasonably estimated, based on the Company’s best estimate of the ultimate outcome. If determined to meet the criteria for a reserve, the Company also evaluates whether there are external legal or other costs directly associated with the resolution of the matter and accrues such costs if estimable.
Adoption of New Pronouncements
Financial Instruments
Derivatives and Hedging
In July 2013, the Financial Accounting Standards Board (“FASB”) issued Accounting Standards Update (“ASU”) 2013-10, “Derivatives and Hedging (Accounting Standards Codification (“ASC”) Topic 815): Inclusion
F-28
Table of Contents
ING U.S., Inc.
Notes to the Consolidated Financial Statements
(Dollar amounts in millions, unless otherwise stated)
of the Fed Funds Effective Swap Rate (or Overnight Index Swap Rate) as a Benchmark Interest Rate for Hedge Accounting Purposes” (“ASU 2013-10”), which permits an entity to use the Fed Funds Effective Swap Rate (“OIS”) to be used as a U.S. benchmark interest rate for hedge accounting purposes. In addition, the guidance removes the restriction on using different benchmark rates for similar hedges.
The provisions of ASU 2013-10 were adopted by the Company on July 17, 2013 for qualifying new or redesigned hedges entered into on or after that date. The adoption had no effect on the Company’s financial condition, results of operations or cash flows.
Deferred Policy Acquisition Costs
Accounting for Costs Associated with Acquiring or Renewing Insurance Contracts
In October 2010, the FASB issued ASU 2010-26, “Financial Services—Insurance (ASC Topic 944): Accounting for Costs Associated with Acquiring or Renewing Insurance Contracts” (“ASU 2010-26”), which provides new guidance related to acquisition costs of new or renewal insurance contracts that qualify for deferral. Costs that should be capitalized include (1) incremental direct costs of successful contract acquisition and (2) certain costs related directly to successful acquisition activities (underwriting, policy issuance and processing, medical and inspection, and sales force contract selling) performed by the insurer for the contract. Advertising costs should be included in DAC only if the capitalization criteria for direct-response advertising guidance is met. All other acquisition-related costs should be charged to expense as incurred.
The Company early adopted the provisions of ASU 2010-26 on January 1, 2011, and applied the provisions retrospectively. If the Company’s Consolidated Balance Sheet as of December 31, 2010 had been issued prior to implementation, the impact to the Company’s January 1, 2011 Retained earnings, as a result of implementation, would have been a decrease of $1.2 billion, net of income taxes of $300.8.
Presentation and Disclosure
Disclosures about Offsetting Assets and Liabilities
In December 2011, FASB issued ASU 2011-11, “Balance Sheet (ASC Topic 210): Disclosures about Offsetting Assets and Liabilities” (“ASU 2011-11”), which requires an entity to disclose both gross and net information about instruments and transactions eligible for offset in the statement of financial position, as well as instruments and transactions subject to an agreement similar to a master netting arrangement. In addition, the standard requires disclosure of collateral received and posted in connection with master netting agreements or similar arrangements.
In January 2013, the FASB issued ASU 2013-01, “Balance Sheet (ASC Topic 210): Clarifying the Scope of Disclosures about Offsetting Assets and Liabilities” (“ASU 2013-01”), which clarifies that the scope of ASU 2011-11 applies to derivatives accounted for in accordance with ASU Topic 815, Derivatives and Hedging, including bifurcated embedded derivatives, repurchase agreements and reverse repurchase agreements, and securities borrowing and securities lending transactions that are either offset in accordance with Section 210-20-45 or Section 815-10-45 or subject to an enforceable master netting arrangement or similar agreement.
The provisions of ASU 2013-01 and ASU 2011-11 were adopted retrospectively by the Company on January 1, 2013. The adoption had no effect on the Company’s financial condition, results of operations or cash flows, as the pronouncement only pertains to additional disclosure. The disclosures required by ASU 2011-11 and ASU 2013-01 are included in Note 3. Derivative Financial Investments to these Consolidated Financial Statements.
F-29
Table of Contents
ING U.S., Inc.
Notes to the Consolidated Financial Statements
(Dollar amounts in millions, unless otherwise stated)
Disclosures about Amounts Reclassified out of Accumulated Other Comprehensive Income
In January 2013, the FASB issued ASU 2013-02, “Comprehensive Income (ASC Topic 220): Reporting of Amounts Reclassified Out of Accumulated Other Comprehensive Income” (“ASU 2013-02”), which requires an entity to provide information about the amounts reclassified out of accumulated other comprehensive income by component. In addition, an entity is required to present, either on the face of the statement where net income is presented or in the notes, significant amounts reclassified out of accumulated other comprehensive income by the respective line items of net income, but only if the amount reclassified is required under U.S. GAAP to be reclassified to net income in its entirety in the same reporting period. For other amounts that are not required under U.S. GAAP to be reclassified in their entirety to net income, an entity is required to cross-reference to other disclosures required under U.S. GAAP that provide additional detail about those amounts.
The provisions of ASU 2013-02 were adopted by the Company on January 1, 2013. The adoption had no effect on the Company’s financial condition, results of operations or cash flows, as the pronouncement only pertains to additional disclosure. The disclosures required by ASU 2013-02, including comparative period disclosures, are included in Note 14. Accumulated Other Comprehensive Income to these Consolidated Financial Statements.
Future Adoption of Accounting Pronouncements
Income Taxes
In July 2013, the FASB issued ASU 2013-11, “Income Taxes (ASC Topic 740): Presentation of an Unrecognized Tax Benefit When a Net Operating Loss Carryforward, a Similar Tax Loss, or a Tax Credit Carryforward Exists” (“ASU 2013-11”), which clarifies that:
| • | An unrecognized tax benefit should be presented as a reduction to a deferred tax asset for a net operating loss carryforward, a similar tax loss or a tax credit carryforward, except, |
| • | An unrecognized tax benefit should be presented as a liability and not be combined with a deferred tax asset (i) to the extent a net operating loss carryforward, a similar tax loss or a tax credit carryforward is not available at the reporting date to settle any additional income taxes that would result from the disallowance of a tax position or (ii) the tax law does not require the entity to use, or the entity does not intend to use, the deferred tax asset for such a purpose. |
| • | The assessment of whether a deferred tax asset is available is based on the unrecognized tax benefit and deferred tax asset that exist at the reporting date and should be made presuming disallowance of the tax position at the reporting date. |
The provisions of ASU 2013-11 are effective for years, and interim periods within those years, beginning after December 15, 2013, and should be applied prospectively to all unrecognized tax benefits that exist at the effective date. The Company does not expect ASU 2013-11 to have an impact on its financial condition, results of operations or cash flows as the guidance is consistent with that currently applied.
Investment Companies
In June 2013, the FASB issued ASU 2013-08, “Financial Services-Investment Companies (ASC Topic 946): Amendments to the Scope, Measurement, and Disclosure Requirements” (“ASU 2013-08”), which provides comprehensive guidance for assessing whether an entity is an investment company and requires an investment company to measure noncontrolling ownership interests in other investment companies at fair value. ASU 2013-08 also requires an entity to disclose that it is an investment company and any changes to that status, as well as information about financial support provided or required to be provided to investees.
F-30
Table of Contents
ING U.S., Inc.
Notes to the Consolidated Financial Statements
(Dollar amounts in millions, unless otherwise stated)
The provisions of ASU 2013-08 are effective for interim and annual reporting periods in years beginning after December 15, 2013, and should be applied prospectively for entities that are investment companies upon the effective date of the amendments. The Company is currently in the process of determining the impact of adoption of the provisions of ASU 2013-08.
Joint and Several Liability Arrangements
In February 2013, the FASB issued ASU 2013-04, “Liabilities (ASC Topic 405): Obligations Resulting from Joint and Several Liability Arrangements for Which the Total Amount of the Obligation Is Fixed at the Reporting Date” (“ASU 2013-04”), which requires an entity to measure obligations resulting from joint and several liable arrangements for which the total amount of the obligation within the scope of this guidance is fixed at the reporting date, as the sum of (1) the amount the reporting entity agreed to pay on the basis of its arrangement among its co-obligors and (2) any additional amount it expects to pay on behalf of its co-obligors. ASU 2013-04 also requires an entity to disclose the nature and amount of the obligation, as well as other information about those obligations.
The provisions of ASU 2013-04 are effective for years, and interim periods within those years, beginning after December 15, 2013. The amendments should be applied retrospectively for those obligations resulting from joint and several liability arrangements that exist at the beginning of an entity’s year of adoption. The Company does not expect ASU 2013-04 to have an impact on its financial condition, results of operations or cash flows, as the Company does not have any fixed obligations under joint and several liable arrangements as of December 31, 2013.
Fees Paid to the Federal Government by Health Insurers
In July 2011, the FASB issued ASU 2011-06, “Other Expenses (Topic 720): Fees Paid to the Federal Government by Health Insurers” (“ASU 2011-06”), which specifies how health insurers should recognize and classify the annual fee imposed by the Patient Protection and Affordable Care Act as amended by the Health Care Education Reconciliation Act (the “Acts”). The liability for the fee should be estimated and recorded in full at the time the entity provides qualifying health insurance in the year in which the fee is payable, with a corresponding deferred cost that is amortized to expense.
The provisions of ASU 2011-06 are effective for calendar years beginning after December 31, 2013, when the fee initially becomes effective. The Company does not expect ASU 2011-06 to have an impact on its financial condition, results of operations or cash flows, as the amount of net premium written for qualifying health insurance by the Company is expected to be below the $25.0 threshold as defined by the Acts and, thus, not subject to the fee.
F-31
Table of Contents
ING U.S., Inc.
Notes to the Consolidated Financial Statements
(Dollar amounts in millions, unless otherwise stated)
2. Investments (excluding Consolidated Investment Entities)
Fixed Maturities and Equity Securities
Available-for-sale and fair value option (“FVO”) fixed maturities and equity securities were as follows as of December 31, 2013:
| Amortized Cost |
Gross Unrealized Capital Gains |
Gross Unrealized Capital Losses |
Embedded Derivatives(2) |
Fair Value | OTTI(3) | |||||||||||||||||||
| Fixed maturities: |
||||||||||||||||||||||||
| U.S. Treasuries |
$ | 5,094.0 | $ | 174.0 | $ | 86.8 | $ | — | $ | 5,181.2 | $ | — | ||||||||||||
| U.S. Government agencies and authorities |
598.0 | 22.3 | 1.4 | — | 618.9 | — | ||||||||||||||||||
| State, municipalities and political subdivisions |
272.0 | 10.6 | 1.5 | — | 281.1 | — | ||||||||||||||||||
| U.S. corporate securities |
36,010.3 | 2,174.5 | 706.2 | — | 37,478.6 | 12.8 | ||||||||||||||||||
| Foreign securities(1): |
||||||||||||||||||||||||
| Government |
1,044.0 | 49.6 | 42.2 | — | 1,051.4 | — | ||||||||||||||||||
| Other |
14,617.4 | 864.2 | 176.5 | — | 15,305.1 | — | ||||||||||||||||||
|
|
|
|
|
|
|
|
|
|
|
|
|
|||||||||||||
| Total foreign securities |
15,661.4 | 913.8 | 218.7 | — | 16,356.5 | — | ||||||||||||||||||
| Residential mortgage-backed securities: |
||||||||||||||||||||||||
| Agency |
5,379.2 | 431.1 | 62.1 | 79.2 | 5,827.4 | 0.4 | ||||||||||||||||||
| Non-Agency |
1,101.1 | 166.2 | 18.3 | 47.3 | 1,296.3 | 103.2 | ||||||||||||||||||
|
|
|
|
|
|
|
|
|
|
|
|
|
|||||||||||||
| Total Residential mortgage-backed securities |
6,480.3 | 597.3 | 80.4 | 126.5 | 7,123.7 | 103.6 | ||||||||||||||||||
| Commercial mortgage-backed securities |
3,427.9 | 327.7 | 3.5 | — | 3,752.1 | 4.4 | ||||||||||||||||||
| Other asset-backed securities |
1,883.1 | 81.6 | 38.0 | — | 1,926.7 | 5.2 | ||||||||||||||||||
|
|
|
|
|
|
|
|
|
|
|
|
|
|||||||||||||
| Total fixed maturities, including securities pledged |
69,427.0 | 4,301.8 | 1,136.5 | 126.5 | 72,718.8 | 126.0 | ||||||||||||||||||
| Less: Securities pledged |
1,457.9 | 24.6 | 16.8 | — | 1,465.7 | — | ||||||||||||||||||
|
|
|
|
|
|
|
|
|
|
|
|
|
|||||||||||||
| Total fixed maturities |
67,969.1 | 4,277.2 | 1,119.7 | 126.5 | 71,253.1 | 126.0 | ||||||||||||||||||
| Equity securities: |
||||||||||||||||||||||||
| Common stock |
214.3 | 5.1 | 0.9 | — | 218.5 | — | ||||||||||||||||||
| Preferred stock |
53.1 | 43.4 | 0.6 | — | 95.9 | — | ||||||||||||||||||
|
|
|
|
|
|
|
|
|
|
|
|
|
|||||||||||||
| Total equity securities |
267.4 | 48.5 | 1.5 | — | 314.4 | — | ||||||||||||||||||
|
|
|
|
|
|
|
|
|
|
|
|
|
|||||||||||||
| Total fixed maturities and equity securities investments |
$ | 68,236.5 | $ | 4,325.7 | $ | 1,121.2 | $ | 126.5 | $ | 71,567.5 | $ | 126.0 | ||||||||||||
|
|
|
|
|
|
|
|
|
|
|
|
|
|||||||||||||
| (1) | Primarily U.S. dollar denominated. |
| (2) | Embedded derivatives within fixed maturity securities are reported with the host investment. The changes in fair value of embedded derivatives are reported in Other net realized capital gains (losses) in the Consolidated Statements of Operations. |
| (3) | Represents OTTI reported as a component of Other comprehensive income. |
F-32
Table of Contents
ING U.S., Inc.
Notes to the Consolidated Financial Statements
(Dollar amounts in millions, unless otherwise stated)
Available-for-sale and FVO fixed maturities and equity securities were as follows as of December 31, 2012:
| Amortized Cost |
Gross Unrealized Capital Gains |
Gross Unrealized Capital Losses |
Embedded Derivatives(2) |
Fair Value |
OTTI(3) | |||||||||||||||||||
| Fixed maturities: |
||||||||||||||||||||||||
| U.S. Treasuries |
$ | 5,194.3 | $ | 691.2 | $ | 1.8 | $ | — | $ | 5,883.7 | $ | — | ||||||||||||
| U.S. Government agencies and authorities |
645.4 | 78.8 | — | — | 724.2 | — | ||||||||||||||||||
| State, municipalities and political subdivisions |
320.2 | 32.6 | — | — | 352.8 | — | ||||||||||||||||||
| U.S. corporate securities |
32,986.1 | 4,226.6 | 48.8 | — | 37,163.9 | 13.4 | ||||||||||||||||||
| Foreign securities(1): |
||||||||||||||||||||||||
| Government |
1,069.4 | 125.2 | 4.6 | — | 1,190.0 | — | ||||||||||||||||||
| Other |
13,321.8 | 1,527.4 | 54.7 | — | 14,794.5 | — | ||||||||||||||||||
|
|
|
|
|
|
|
|
|
|
|
|
|
|||||||||||||
| Total foreign securities |
14,391.2 | 1,652.6 | 59.3 | — | 15,984.5 | — | ||||||||||||||||||
| Residential mortgage-backed securities: |
||||||||||||||||||||||||
| Agency |
5,071.6 | 633.3 | 14.8 | 156.0 | 5,846.1 | 1.2 | ||||||||||||||||||
| Non-Agency |
1,612.6 | 198.6 | 71.9 | 81.6 | 1,820.9 | 139.6 | ||||||||||||||||||
|
|
|
|
|
|
|
|
|
|
|
|
|
|||||||||||||
| Total Residential mortgage-backed securities |
6,684.2 | 831.9 | 86.7 | 237.6 | 7,667.0 | 140.8 | ||||||||||||||||||
| Commercial mortgage-backed securities |
4,438.9 | 513.6 | 6.1 | — | 4,946.4 | 4.4 | ||||||||||||||||||
| Other asset-backed securities |
2,536.4 | 128.4 | 90.0 | (10.2 | ) | 2,564.6 | 15.4 | |||||||||||||||||
|
|
|
|
|
|
|
|
|
|
|
|
|
|||||||||||||
| Total fixed maturities, including securities pledged |
67,196.7 | 8,155.7 | 292.7 | 227.4 | 75,287.1 | 174.0 | ||||||||||||||||||
| Less: Securities pledged |
1,470.0 | 139.6 | 4.1 | — | 1,605.5 | — | ||||||||||||||||||
|
|
|
|
|
|
|
|
|
|
|
|
|
|||||||||||||
| Total fixed maturities |
65,726.7 | 8,016.1 | 288.6 | 227.4 | 73,681.6 | 174.0 | ||||||||||||||||||
| Equity securities: |
||||||||||||||||||||||||
| Common stock |
194.4 | 13.2 | 1.0 | — | 206.6 | — | ||||||||||||||||||
| Preferred stock |
103.5 | 30.0 | — | — | 133.5 | — | ||||||||||||||||||
|
|
|
|
|
|
|
|
|
|
|
|
|
|||||||||||||
| Total equity securities |
297.9 | 43.2 | 1.0 | — | 340.1 | — | ||||||||||||||||||
|
|
|
|
|
|
|
|
|
|
|
|
|
|||||||||||||
| Total fixed maturities and equity securities investments |
$ | 66,024.6 | $ | 8,059.3 | $ | 289.6 | $ | 227.4 | $ | 74,021.7 | $ | 174.0 | ||||||||||||
|
|
|
|
|
|
|
|
|
|
|
|
|
|||||||||||||
| (1) | Primarily U.S. dollar denominated. |
| (2) | Embedded derivatives within fixed maturity securities are reported with the host investment. The changes in fair value of embedded derivatives are reported in Other net realized capital gains (losses) in the Consolidated Statements of Operations. |
| (3) | Represents OTTI reported as a component of Other comprehensive income. |
F-33
Table of Contents
ING U.S., Inc.
Notes to the Consolidated Financial Statements
(Dollar amounts in millions, unless otherwise stated)
The amortized cost and fair value of fixed maturities, including securities pledged, as of December 31, 2013, are shown below by contractual maturity. Actual maturities may differ from contractual maturities as securities may be restructured, called, or prepaid. Mortgage-backed securities (“MBS”) and Other asset-backed securities (“ABS”) are shown separately because they are not due at a single maturity date.
| Amortized Cost |
Fair Value |
|||||||
| Due to mature: |
||||||||
| One year or less |
$ | 2,104.7 | $ | 2,153.6 | ||||
| After one year through five years |
13,588.4 | 14,397.4 | ||||||
| After five years through ten years |
20,970.4 | 21,303.4 | ||||||
| After ten years |
20,972.2 | 22,061.9 | ||||||
| Mortgage-backed securities |
9,908.2 | 10,875.8 | ||||||
| Other asset-backed securities |
1,883.1 | 1,926.7 | ||||||
|
|
|
|
|
|||||
| Fixed maturities, including securities pledged |
$ | 69,427.0 | $ | 72,718.8 | ||||
|
|
|
|
|
|||||
The investment portfolio is monitored to maintain a diversified portfolio on an ongoing basis. Credit risk is mitigated by monitoring concentrations by issuer, sector and geographic stratification and limiting exposure to any one issuer.
As of December 31, 2013 and 2012, the Company did not have any investments in a single issuer, other than obligations of the U.S. Government and government agencies, with a carrying value in excess of 10% of the Company’s consolidated Shareholders’ equity.
The following tables set forth the composition of the U.S. and foreign corporate securities within the fixed maturity portfolio by industry category as of the dates indicated:
| Amortized Cost |
Gross Unrealized Capital Gains |
Gross Unrealized Capital Losses |
Fair Value |
|||||||||||||
| December 31, 2013 |
||||||||||||||||
| Communications |
$ | 4,016.2 | $ | 293.0 | $ | 73.4 | $ | 4,235.8 | ||||||||
| Financial |
6,640.7 | 566.6 | 72.6 | 7,134.7 | ||||||||||||
| Industrial and other companies |
29,303.1 | 1,524.5 | 564.5 | 30,263.1 | ||||||||||||
| Utilities |
9,200.6 | 570.0 | 142.2 | 9,628.4 | ||||||||||||
| Transportation |
1,467.1 | 84.6 | 30.0 | 1,521.7 | ||||||||||||
|
|
|
|
|
|
|
|
|
|||||||||
| Total |
$ | 50,627.7 | $ | 3,038.7 | $ | 882.7 | $ | 52,783.7 | ||||||||
|
|
|
|
|
|
|
|
|
|||||||||
| December 31, 2012 |
||||||||||||||||
| Communications |
$ | 3,609.5 | $ | 563.4 | $ | 2.4 | $ | 4,170.5 | ||||||||
| Financial |
5,912.9 | 749.4 | 46.7 | 6,615.6 | ||||||||||||
| Industrial and other companies |
26,613.3 | 3,063.3 | 24.2 | 29,652.4 | ||||||||||||
| Utilities |
8,893.1 | 1,210.5 | 28.9 | 10,074.7 | ||||||||||||
| Transportation |
1,279.1 | 167.4 | 1.3 | 1,445.2 | ||||||||||||
|
|
|
|
|
|
|
|
|
|||||||||
| Total |
$ | 46,307.9 | $ | 5,754.0 | $ | 103.5 | $ | 51,958.4 | ||||||||
|
|
|
|
|
|
|
|
|
|||||||||
F-34
Table of Contents
ING U.S., Inc.
Notes to the Consolidated Financial Statements
(Dollar amounts in millions, unless otherwise stated)
Fixed Maturities and Equity Securities
The Company’s fixed maturities and equity securities are currently designated as available-for-sale, except those accounted for using the fair value option (“FVO”). Available-for-sale securities are reported at fair value and unrealized capital gains (losses) on these securities are recorded directly in Accumulated other comprehensive income (loss) (“AOCI”), and presented net of related changes in DAC, VOBA, and deferred income taxes. In addition, certain fixed maturities have embedded derivatives, which are reported with the host contract on the Consolidated Balance Sheets.
The Company has elected the FVO for certain of its fixed maturities to better match the measurement of assets and liabilities in the Consolidated Statements of Operations. Certain collateralized mortgage obligations (“CMOs”), primarily interest-only and principal-only strips, are accounted for as hybrid instruments and valued at fair value with changes in the fair value recorded in Other net realized capital gains (losses) in the Consolidated Statements of Operations.
The Company invests in various categories of CMOs, including CMOs that are not agency-backed, that are subject to different degrees of risk from changes in interest rates and defaults. The principal risks inherent in holding CMOs are prepayment and extension risks related to significant decreases and increases in interest rates resulting in the prepayment of principal from the underlying mortgages, either earlier or later than originally anticipated. As of December 31, 2013 and 2012, approximately 38.3% and 33.1%, respectively, of the Company’s CMO holdings, such as interest-only or principal-only strips were invested in those types of CMOs that are subject to more prepayment and extension risk than traditional CMOs.
Repurchase Agreements
As of December 31, 2013 and 2012, the Company did not have any securities pledged in dollar rolls, repurchase agreement transactions or reverse repurchase agreements.
Securities Lending
As of December 31, 2013 and 2012, the fair value of loaned securities was $435.4 and $601.8, respectively, and is included in Securities pledged on the Consolidated Balance Sheets. As of December 31, 2013 and 2012, collateral retained by the lending agent and invested in liquid assets on the Company’s behalf was $451.0 and $619.5, respectively, and recorded in Short-term investments under securities loan agreement, including collateral delivered on the Consolidated Balance Sheets. As of December 31, 2013 and 2012, liabilities to return collateral of $451.0 and $619.5, respectively, were included in Payables under securities loan agreement, including collateral held on the Consolidated Balance Sheets.
F-35
Table of Contents
ING U.S., Inc.
Notes to the Consolidated Financial Statements
(Dollar amounts in millions, unless otherwise stated)
Unrealized Capital Losses
Unrealized capital losses (including noncredit impairments), along with the fair value of fixed maturity securities, including securities pledged, by market sector and duration were as follows as of December 31, 2013:
| Six Months or Less Below Amortized Cost |
More Than Six Months and Twelve Months or Less Below Amortized Cost |
More Than Twelve Months Below Amortized Cost |
Total | |||||||||||||||||||||||||||||
| Fair Value |
Unrealized Capital Losses |
Fair Value |
Unrealized Capital Losses |
Fair Value |
Unrealized Capital Losses |
Fair Value |
Unrealized Capital Losses |
|||||||||||||||||||||||||
| 2013 |
||||||||||||||||||||||||||||||||
| U.S. Treasuries |
$ | 1,559.5 | $ | 24.3 | $ | 1,087.6 | $ | 52.6 | $ | 41.9 | $ | 9.9 | $ | 2,689.0 | $ | 86.8 | ||||||||||||||||
| U.S. Government agencies and authorities |
9.5 | — | * | 55.9 | 1.4 | — | — | 65.4 | 1.4 | |||||||||||||||||||||||
| U.S. corporate, state and municipalities |
3,524.9 | 78.5 | 6,893.9 | 519.6 | 821.9 | 109.6 | 11,240.7 | 707.7 | ||||||||||||||||||||||||
| Foreign |
1,133.6 | 16.0 | 2,447.8 | 184.3 | 179.1 | 18.4 | 3,760.5 | 218.7 | ||||||||||||||||||||||||
| Residential mortgage-backed |
919.1 | 8.3 | 1,019.6 | 40.6 | 377.9 | 31.5 | 2,316.6 | 80.4 | ||||||||||||||||||||||||
| Commercial mortgage-backed |
235.8 | 3.3 | — | — | 6.2 | 0.2 | 242.0 | 3.5 | ||||||||||||||||||||||||
| Other asset-backed |
150.6 | 0.9 | 105.5 | 1.5 | 299.3 | 35.6 | 555.4 | 38.0 | ||||||||||||||||||||||||
|
|
|
|
|
|
|
|
|
|
|
|
|
|
|
|
|
|||||||||||||||||
| Total |
$ | 7,533.0 | $ | 131.3 | $ | 11,610.3 | $ | 800.0 | $ | 1,726.3 | $ | 205.2 | $ | 20,869.6 | $ | 1,136.5 | ||||||||||||||||
|
|
|
|
|
|
|
|
|
|
|
|
|
|
|
|
|
|||||||||||||||||
| * | Less than $0.1 |
Unrealized capital losses (including noncredit impairments), along with the fair value of fixed maturity securities, including securities pledged, by market sector and duration were as follows as of December 31, 2012:
| Six Months or Less Below Amortized Cost |
More Than Six Months and Twelve Months or Less Below Amortized Cost |
More Than Twelve Months Below Amortized Cost |
Total | |||||||||||||||||||||||||||||
| Fair Value |
Unrealized Capital Losses |
Fair Value | Unrealized Capital Losses |
Fair Value |
Unrealized Capital Losses |
Fair Value |
Unrealized Capital Losses |
|||||||||||||||||||||||||
| 2012 |
||||||||||||||||||||||||||||||||
| U.S. Treasuries |
$ | 451.2 | $ | 1.8 | $ | — | $ | — | $ | — | $ | — | $ | 451.2 | $ | 1.8 | ||||||||||||||||
| U.S. Government agencies and authorities |
— | — | — | — | — | — | — | — | ||||||||||||||||||||||||
| U.S. corporate, state and municipalities |
1,333.4 | 19.2 | 116.5 | 3.0 | 231.2 | 26.6 | 1,681.1 | 48.8 | ||||||||||||||||||||||||
| Foreign |
360.2 | 12.7 | 59.8 | 7.4 | 314.9 | 39.2 | 734.9 | 59.3 | ||||||||||||||||||||||||
| Residential mortgage-backed |
369.3 | 6.4 | 42.0 | 2.1 | 585.1 | 78.2 | 996.4 | 86.7 | ||||||||||||||||||||||||
| Commercial mortgage-backed |
22.0 | 0.2 | 15.3 | 1.7 | 44.4 | 4.2 | 81.7 | 6.1 | ||||||||||||||||||||||||
| Other asset-backed |
70.2 | — | * | 7.0 | 1.2 | 609.2 | 88.8 | 686.4 | 90.0 | |||||||||||||||||||||||
|
|
|
|
|
|
|
|
|
|
|
|
|
|
|
|
|
|||||||||||||||||
| Total |
$ | 2,606.3 | $ | 40.3 | $ | 240.6 | $ | 15.4 | $ | 1,784.8 | $ | 237.0 | $ | 4,631.7 | $ | 292.7 | ||||||||||||||||
|
|
|
|
|
|
|
|
|
|
|
|
|
|
|
|
|
|||||||||||||||||
| * | Less than $0.1 |
Of the unrealized capital losses aged more than twelve months, the average market value of the related fixed maturities was 89.4% and 88.3% of the average book value as of December 31, 2013 and 2012, respectively.
F-36
Table of Contents
ING U.S., Inc.
Notes to the Consolidated Financial Statements
(Dollar amounts in millions, unless otherwise stated)
Unrealized capital losses (including noncredit impairments) in fixed maturities, including securities pledged, for instances in which fair value declined below amortized cost by greater than or less than 20% for consecutive months as indicated in the tables below, were as follows as of the dates indicated:
| Amortized Cost | Unrealized Capital Losses | Number of Securities | ||||||||||||||||||||||
| < 20% | > 20% | < 20% | > 20% | < 20% | > 20% | |||||||||||||||||||
| December 31, 2013 |
||||||||||||||||||||||||
| Six months or less below amortized cost |
$ | 7,883.3 | $ | 80.5 | $ | 166.0 | $ | 18.6 | 570 | 20 | ||||||||||||||
| More than six months and twelve months or less below amortized cost |
12,339.7 | 67.6 | 776.8 | 16.7 | 798 | 8 | ||||||||||||||||||
| More than twelve months below amortized cost |
1,579.2 | 55.8 | 144.5 | 13.9 | 302 | 22 | ||||||||||||||||||
|
|
|
|
|
|
|
|
|
|
|
|
|
|||||||||||||
| Total |
$ | 21,802.2 | $ | 203.9 | $ | 1,087.3 | $ | 49.2 | 1,670 | 50 | ||||||||||||||
|
|
|
|
|
|
|
|
|
|
|
|
|
|||||||||||||
| December 31, 2012 |
||||||||||||||||||||||||
| Six months or less below amortized cost |
$ | 3,154.6 | $ | 42.1 | $ | 95.2 | $ | 11.4 | 308 | 21 | ||||||||||||||
| More than six months and twelve months or less below amortized cost |
363.3 | 30.2 | 19.5 | 10.3 | 83 | 9 | ||||||||||||||||||
| More than twelve months below amortized cost |
940.1 | 394.1 | 35.9 | 120.4 | 221 | 95 | ||||||||||||||||||
|
|
|
|
|
|
|
|
|
|
|
|
|
|||||||||||||
| Total |
$ | 4,458.0 | $ | 466.4 | $ | 150.6 | $ | 142.1 | 612 | 125 | ||||||||||||||
|
|
|
|
|
|
|
|
|
|
|
|
|
|||||||||||||
Unrealized capital losses (including noncredit impairments) in fixed maturities, including securities pledged, by market sector for instances in which fair value declined below amortized cost by greater than or less than 20% were as follows as of the dates indicated:
| Amortized Cost | Unrealized Capital Losses | Number of Securities | ||||||||||||||||||||||
| < 20% | > 20% | < 20% | > 20% | < 20% | > 20% | |||||||||||||||||||
| December 31, 2013 |
||||||||||||||||||||||||
| U.S. Treasuries |
$ | 2,750.5 | $ | 25.3 | $ | 81.4 | $ | 5.4 | 32 | 1 | ||||||||||||||
| U.S. Government agencies and authorities |
66.8 | — | 1.4 | — | 3 | — | ||||||||||||||||||
| U.S. corporate, state and municipalities |
11,892.6 | 55.8 | 694.2 | 13.5 | 744 | 5 | ||||||||||||||||||
| Foreign |
3,944.2 | 35.0 | 211.0 | 7.7 | 300 | 6 | ||||||||||||||||||
| Residential mortgage-backed |
2,361.4 | 35.6 | 70.2 | 10.2 | 471 | 25 | ||||||||||||||||||
| Commercial mortgage-backed |
245.5 | — | 3.5 | — | 16 | — | ||||||||||||||||||
| Other asset-backed |
541.2 | 52.2 | 25.6 | 12.4 | 104 | 13 | ||||||||||||||||||
|
|
|
|
|
|
|
|
|
|
|
|
|
|||||||||||||
| Total |
$ | 21,802.2 | $ | 203.9 | $ | 1,087.3 | $ | 49.2 | 1,670 | 50 | ||||||||||||||
|
|
|
|
|
|
|
|
|
|
|
|
|
|||||||||||||
| December 31, 2012 |
||||||||||||||||||||||||
| U.S. Treasuries |
$ | 453.0 | $ | — | $ | 1.8 | $ | — | 3 | — | ||||||||||||||
| U.S. Government agencies and authorities |
— | — | — | — | — | — | ||||||||||||||||||
| U.S. corporate, state and municipalities |
1,688.5 | 41.4 | 33.1 | 15.7 | 109 | 3 | ||||||||||||||||||
| Foreign |
684.9 | 109.3 | 24.1 | 35.2 | 50 | 14 | ||||||||||||||||||
| Residential mortgage-backed |
938.3 | 144.8 | 42.5 | 44.2 | 343 | 77 | ||||||||||||||||||
| Commercial mortgage-backed |
85.9 | 1.9 | 5.6 | 0.5 | 19 | 1 | ||||||||||||||||||
| Other asset-backed |
607.4 | 169.0 | 43.5 | 46.5 | 88 | 30 | ||||||||||||||||||
|
|
|
|
|
|
|
|
|
|
|
|
|
|||||||||||||
| Total |
$ | 4,458.0 | $ | 466.4 | $ | 150.6 | $ | 142.1 | 612 | 125 | ||||||||||||||
|
|
|
|
|
|
|
|
|
|
|
|
|
|||||||||||||
F-37
Table of Contents
ING U.S., Inc.
Notes to the Consolidated Financial Statements
(Dollar amounts in millions, unless otherwise stated)
The following tables summarize loan-to-value, credit enhancement and fixed floating rate details for RMBS and Other ABS in a gross unrealized loss position as of the dates indicated:
| Loan-to-Value Ratio | ||||||||||||||||
| Amortized Cost | Unrealized Capital Losses | |||||||||||||||
| < 20% | > 20% | < 20% | > 20% | |||||||||||||
| December 31, 2013 |
||||||||||||||||
| RMBS and Other ABS(1) |
||||||||||||||||
| Non-agency RMBS > 100% |
$ | 75.7 | $ | 36.4 | $ | 2.9 | $ | 8.3 | ||||||||
| Non-agency RMBS 90% - 100% |
156.8 | 24.1 | 8.6 | 5.7 | ||||||||||||
| Non-agency RMBS 80% - 90% |
151.3 | 5.9 | 8.4 | 1.7 | ||||||||||||
| Non-agency RMBS < 80% |
284.7 | 8.0 | 15.5 | 2.2 | ||||||||||||
| Agency RMBS |
2,008.9 | 11.3 | 57.9 | 4.2 | ||||||||||||
| Other ABS (Non-RMBS) |
225.2 | 2.1 | 2.5 | 0.5 | ||||||||||||
|
|
|
|
|
|
|
|
|
|||||||||
| Total RMBS and Other ABS |
$ | 2,902.6 | $ | 87.8 | $ | 95.8 | $ | 22.6 | ||||||||
|
|
|
|
|
|
|
|
|
|||||||||
| Credit Enhancement Percentage | ||||||||||||||||
| Amortized Cost | Unrealized Capital Losses | |||||||||||||||
| < 20% | > 20% | < 20% | > 20% | |||||||||||||
| December 31, 2013 |
||||||||||||||||
| RMBS and Other ABS(1) |
||||||||||||||||
| Non-agency RMBS 10% + |
$ | 407.1 | $ | 47.7 | $ | 27.6 | $ | 11.1 | ||||||||
| Non-agency RMBS 5% - 10% |
43.9 | 0.8 | 1.2 | 0.2 | ||||||||||||
| Non-agency RMBS 0% - 5% |
90.4 | 3.9 | 1.9 | 0.8 | ||||||||||||
| Non-agency RMBS 0% |
127.1 | 22.0 | 4.7 | 5.8 | ||||||||||||
| Agency RMBS |
2,008.9 | 11.3 | 57.9 | 4.2 | ||||||||||||
| Other ABS (Non-RMBS) |
225.2 | 2.1 | 2.5 | 0.5 | ||||||||||||
|
|
|
|
|
|
|
|
|
|||||||||
| Total RMBS and Other ABS |
$ | 2,902.6 | $ | 87.8 | $ | 95.8 | $ | 22.6 | ||||||||
|
|
|
|
|
|
|
|
|
|||||||||
| Fixed Rate/Floating Rate | ||||||||||||||||
| Amortized Cost | Unrealized Capital Losses | |||||||||||||||
| < 20% | > 20% | < 20% | > 20% | |||||||||||||
| December 31, 2013 |
||||||||||||||||
| Fixed Rate |
$ | 1,723.7 | $ | 4.4 | $ | 50.5 | $ | 1.6 | ||||||||
| Floating Rate |
1,178.9 | 83.4 | 45.3 | 21.0 | ||||||||||||
|
|
|
|
|
|
|
|
|
|||||||||
| Total |
$ | 2,902.6 | $ | 87.8 | $ | 95.8 | $ | 22.6 | ||||||||
|
|
|
|
|
|
|
|
|
|||||||||
| (1) | For purposes of this table, subprime mortgages are included in Non-agency RMBS categories. |
F-38
Table of Contents
ING U.S., Inc.
Notes to the Consolidated Financial Statements
(Dollar amounts in millions, unless otherwise stated)
| Loan-to-Value Ratio | ||||||||||||||||
| Amortized Cost | Unrealized Capital Losses | |||||||||||||||
| < 20% | > 20% | < 20% | > 20% | |||||||||||||
| December 31, 2012 | ||||||||||||||||
| RMBS and Other ABS(1) |
||||||||||||||||
| Non-agency RMBS > 100% |
$ | 562.3 | $ | 203.8 | $ | 39.5 | $ | 58.0 | ||||||||
| Non-agency RMBS 90% - 100% |
134.2 | 35.2 | 12.8 | 10.7 | ||||||||||||
| Non-agency RMBS 80% - 90% |
78.9 | 46.9 | 7.5 | 12.1 | ||||||||||||
| Non-agency RMBS < 80% |
288.9 | 17.5 | 14.0 | 5.5 | ||||||||||||
| Agency RMBS |
398.0 | 8.1 | 11.0 | 3.8 | ||||||||||||
| Other ABS (Non-RMBS) |
83.4 | 2.3 | 1.2 | 0.6 | ||||||||||||
|
|
|
|
|
|
|
|
|
|||||||||
| Total RMBS and Other ABS |
$ | 1,545.7 | $ | 313.8 | $ | 86.0 | $ | 90.7 | ||||||||
|
|
|
|
|
|
|
|
|
|||||||||
| Credit Enhancement Percentage | ||||||||||||||||
| Amortized Cost | Unrealized Capital Losses | |||||||||||||||
| < 20% | > 20% | < 20% | > 20% | |||||||||||||
| December 31, 2012 |
||||||||||||||||
| RMBS and Other ABS(1) |
||||||||||||||||
| Non-agency RMBS 10% + |
$ | 706.8 | $ | 187.1 | $ | 53.8 | $ | 51.2 | ||||||||
| Non-agency RMBS 5% - 10% |
187.6 | 2.2 | 6.8 | 0.7 | ||||||||||||
| Non-agency RMBS 0% - 5% |
89.4 | 12.3 | 7.6 | 4.2 | ||||||||||||
| Non-agency RMBS 0% |
80.5 | 101.8 | 5.6 | 30.2 | ||||||||||||
| Agency RMBS |
398.0 | 8.1 | 11.0 | 3.8 | ||||||||||||
| Other ABS (Non-RMBS) |
83.4 | 2.3 | 1.2 | 0.6 | ||||||||||||
|
|
|
|
|
|
|
|
|
|||||||||
| Total RMBS and Other ABS |
$ | 1,545.7 | $ | 313.8 | $ | 86.0 | $ | 90.7 | ||||||||
|
|
|
|
|
|
|
|
|
|||||||||
| Fixed Rate/Floating Rate | ||||||||||||||||
| Amortized Cost | Unrealized Capital Losses | |||||||||||||||
| < 20% | > 20% | < 20% | > 20% | |||||||||||||
| December 31, 2012 |
||||||||||||||||
| Fixed Rate |
$ | 669.4 | $ | 33.3 | $ | 14.2 | $ | 10.2 | ||||||||
| Floating Rate |
876.3 | 280.5 | 71.8 | 80.5 | ||||||||||||
|
|
|
|
|
|
|
|
|
|||||||||
| Total |
$ | 1,545.7 | $ | 313.8 | $ | 86.0 | $ | 90.7 | ||||||||
|
|
|
|
|
|
|
|
|
|||||||||
| (1) | For purposes of this table, subprime mortgages are included in Non-agency RMBS categories. |
All investments with fair values less than amortized cost are included in the Company’s other-than-temporary impairments analysis, and impairments were recognized as disclosed in the “Evaluating Securities for Other-Than-Temporary Impairments” section below. The Company evaluates non-agency RMBS and ABS for “other-than-temporary impairments” each quarter based on actual and projected cash flows after considering the quality and updated loan-to-value ratios reflecting current home prices of underlying collateral, forecasted loss severity, the payment priority within the tranche structure of the security and amount of any credit enhancements. The Company’s assessment of current levels of cash flows compared to estimated cash flows at the time the securities were acquired indicates the amount and the pace of projected cash flows from the underlying collateral has generally been lower and slower, respectively. However, since cash flows are typically projected at a trust level, the impairment review incorporates the security’s position within the trust structure as well as credit enhancement remaining in the trust to determine whether an impairment is warranted. Therefore, while lower and slower cash flows will impact the trust, the effect on a particular security within the trust will be dependent upon
F-39
Table of Contents
ING U.S., Inc.
Notes to the Consolidated Financial Statements
(Dollar amounts in millions, unless otherwise stated)
the trust structure. Where the assessment continues to project full recovery of principal and interest on schedule, the Company has not recorded an impairment. Unrealized losses on below investment grade securities are principally related to RMBS (primarily Alt-A RMBS), and ABS (primarily subprime RMBS) largely due to economic and market uncertainties including concerns over unemployment levels, lower interest rate environment on floating rate securities requiring higher risk premiums since purchase and valuations on residential real estate supporting non-agency RMBS. Based on this analysis, the Company determined that the remaining investments in an unrealized loss position were not other-than-temporarily impaired and therefore no further other-than-temporary impairment was necessary.
Troubled Debt Restructuring
The Company invests in high quality, well performing portfolios of commercial mortgage loans and private placements. Under certain circumstances, modifications are granted to these contracts. Each modification is evaluated as to whether a troubled debt restructuring has occurred. A modification is a troubled debt restructuring when the borrower is in financial difficulty and the creditor makes concessions. Generally, the types of concessions may include reducing the face amount or maturity amount of the debt as originally stated, reducing the contractual interest rate, extending the maturity date at an interest rate lower than current market interest rates and/or reducing accrued interest. The Company considers the amount, timing and extent of the concession granted in determining any impairment or changes in the specific valuation allowance recorded in connection with the troubled debt restructuring. A valuation allowance may have been recorded prior to the quarter when the loan is modified in a troubled debt restructuring. Accordingly, the carrying value (net of the specific valuation allowance) before and after modification through a troubled debt restructuring may not change significantly, or may increase if the expected recovery is higher than the pre-modification recovery assessment. As of December 31, 2013, the Company had no new private placement troubled debt restructurings and had 21 new commercial mortgage loan troubled debt restructurings with a pre-modification and post modification carrying value of $91.0. Of these 21 commercial mortgage loans, 20 comprise a portfolio of cross-defaulted, cross-collateralized individual loans, which are owned by the same sponsor. Between the date of the troubled debt restructurings and December 31, 2013, these loans have repaid $4.2 in principal. As of December 31, 2012, the Company had one private placement troubled debt restructuring with a pre-modification carrying value of $1.2, which was written down to zero and no commercial mortgage loan troubled debt restructurings.
As of December 31, 2013 and 2012, the Company did not have any commercial mortgage loans or private placements modified in a troubled debt restructuring with a subsequent payment default.
Mortgage Loans on Real Estate
The Company’s mortgage loans on real estate are all commercial mortgage loans held for investment, which are reported at amortized cost, less impairment write-downs and allowance for losses. The Company diversifies its commercial mortgage loan portfolio by geographic region and property type to reduce concentration risk. The Company manages risk when originating commercial mortgage loans by generally lending only up to 75% of the estimated fair value of the underlying real estate. Subsequently, the Company continuously evaluates all mortgage loans based on relevant current information including a review of loan-specific credit quality, property characteristics and market trends. Loan performance is monitored on a loan specific basis through the review of submitted appraisals, operating statements, rent revenues and annual inspection reports, among other items. This review ensures properties are performing at a consistent and acceptable level to secure the debt. The components to evaluate debt service coverage are received and reviewed at least annually to determine the level of risk.
F-40
Table of Contents
ING U.S., Inc.
Notes to the Consolidated Financial Statements
(Dollar amounts in millions, unless otherwise stated)
The following table summarizes the Company’s investment in mortgage loans as of the dates indicated:
| December 31, 2013 | December 31, 2012 | |||||||
| Commercial mortgage loans |
$ | 9,316.0 | $ | 8,666.2 | ||||
| Collective valuation allowance |
(3.8 | ) | (3.9 | ) | ||||
|
|
|
|
|
|||||
| Total net commercial mortgage loans |
$ | 9,312.2 | $ | 8,662.3 | ||||
|
|
|
|
|
|||||
There were no impairments taken on the mortgage loan portfolio for the year ended December 31, 2013.
Impairments taken on the mortgage loan portfolio for the years ended December 31, 2012 and 2011 were $7.7 and $9.3, respectively.
The following table summarizes the activity in the allowance for losses for all commercial mortgage loans for the periods indicated:
| December 31, 2013 | December 31, 2012 | |||||||
| Collective valuation allowance for losses, balance at January 1 |
$ | 3.9 | $ | 4.4 | ||||
| Addition to (reduction of) allowance for losses |
(0.1 | ) | (0.5 | ) | ||||
|
|
|
|
|
|||||
| Collective valuation allowance for losses, end of period |
$ | 3.8 | $ | 3.9 | ||||
|
|
|
|
|
|||||
The carrying values and unpaid principal balances of impaired mortgage loans were as follows as of the dates indicated:
| December 31, 2013 | December 31, 2012 | |||||||
| Impaired loans with allowances for losses |
$ | — | $ | — | ||||
| Impaired loans without allowances for losses |
94.3 | 16.8 | ||||||
|
|
|
|
|
|||||
| Subtotal |
94.3 | 16.8 | ||||||
| Less: Allowances for losses on impaired loans |
— | — | ||||||
|
|
|
|
|
|||||
| Impaired loans, net |
$ | 94.3 | $ | 16.8 | ||||
|
|
|
|
|
|||||
| Unpaid principal balance of impaired loans |
$ | 96.7 | $ | 31.9 | ||||
|
|
|
|
|
|||||
The following table presents information on impaired loans, restructured loans, loans 90 days or more past due and loans in foreclosure as of the dates indicated:
| December 31, 2013 | December 31, 2012 | |||||||
| Troubled debt restructured loans |
$ | 86.6 | $ | — | ||||
| Loans 90 days or more past due, interest no longer accruing, at amortized cost |
5.1 | — | ||||||
| Loans in foreclosure, at amortized cost |
— | 9.0 | ||||||
| Unpaid principal balance of loans 90 days or more past due, interest no longer accruing |
5.1 | — | ||||||
The Company’s policy is to recognize interest income until a loan becomes 90 days delinquent or foreclosure proceedings are commenced, at which point interest accrual is discontinued. Interest accrual is not resumed until the loan is brought current.
F-41
Table of Contents
ING U.S., Inc.
Notes to the Consolidated Financial Statements
(Dollar amounts in millions, unless otherwise stated)
The following table presents the aging of past due mortgage loans at carrying value as of the dates indicated:
| ($ in millions) | 30 days or less past due |
31 to 90 days past due |
91 to 180 days past due |
181 days or more past due |
Total | |||||||||||||||
| As of December 31, 2013 |
$ | — | $ | 5.1 | $ | — | $ | — | $ | 5.1 | ||||||||||
| As of December 31, 2012 |
— | — | — | 9.0 | 9.0 | |||||||||||||||
There were no mortgage loans in the Company’s portfolio in process of foreclosure as of December 31, 2013. There were four mortgage loans in the Company’s portfolio in process of foreclosure as of December 31, 2012 with a total amortized cost of $9.0.
There was one loan in arrears with respect to principal and interest as of December 31, 2013 with a total amortized cost of $5.1. There were no loans in arrears with respect to principal and interest as of December 31, 2012.
The following table presents information on the average investment during the period in impaired loans and interest income recognized on impaired and troubled debt restructured loans for the periods indicated:
| Years Ended December 31, | ||||||||||||
| 2013 | 2012 | 2011 | ||||||||||
| Impaired loans, average investment during the period (amortized cost)(1) |
$ | 55.6 | $ | 32.7 | $ | 43.7 | ||||||
| Interest income recognized on impaired loans, on an accrual basis(1) |
2.9 | 0.7 | 1.8 | |||||||||
| Interest income recognized on impaired loans, on a cash basis(1) |
2.9 | 0.8 | 1.8 | |||||||||
| Interest income recognized on troubled debt restructured loans, on an accrual basis |
2.4 | 0.3 | 0.3 | |||||||||
| (1) | Includes amounts for Troubled debt restructured loans. |
Loan-to-value (“LTV”) and debt service coverage (“DSC”) ratios are measures commonly used to assess the risk and quality of mortgage loans. The LTV ratio, calculated at time of origination, is expressed as a percentage of the amount of the loan relative to the value of the underlying property. A LTV ratio in excess of 100% indicates the unpaid loan amount exceeds the underlying collateral. The DSC ratio, based upon the most recently received financial statements, is expressed as a percentage of the amount of a property’s net income to its debt service payments. A DSC ratio of less than 1.0 indicates that property’s operations do not generate sufficient income to cover debt payments. These ratios are utilized as part of the review process described above.
The following table presents the LTV ratios as of the dates indicated:
| December 31, 2013(1) | December 31, 2012(1) | |||||||
| Loan-to-Value Ratio: |
||||||||
| 0% - 50% |
$ | 1,782.6 | $ | 1,987.9 | ||||
| 50% - 60% |
2,390.0 | 2,425.2 | ||||||
| 60% - 70% |
4,668.3 | 3,736.1 | ||||||
| 70% - 80% |
455.8 | 481.7 | ||||||
| 80% and above |
19.3 | 35.3 | ||||||
|
|
|
|
|
|||||
| Total Commercial mortgage loans |
$ | 9,316.0 | $ | 8,666.2 | ||||
|
|
|
|
|
|||||
| (1) | Balances do not include allowance for mortgage loan credit losses. |
F-42
Table of Contents
ING U.S., Inc.
Notes to the Consolidated Financial Statements
(Dollar amounts in millions, unless otherwise stated)
The following table presents the DSC ratios as of the dates indicated:
| December 31, 2013(1) | December 31, 2012(1) | |||||||
| Debt Service Coverage Ratio: |
||||||||
| Greater than 1.5x |
$ | 6,346.5 | $ | 5,953.7 | ||||
| 1.25x - 1.5x |
1,520.9 | 1,336.3 | ||||||
| 1.0x - 1.25x |
980.6 | 992.7 | ||||||
| Less than 1.0x |
467.8 | 374.6 | ||||||
| Commercial mortgage loans secured by land or construction loans |
0.2 | 8.9 | ||||||
|
|
|
|
|
|||||
| Total Commercial mortgage loans |
$ | 9,316.0 | $ | 8,666.2 | ||||
|
|
|
|
|
|||||
| (1) | Balances do not include allowance for mortgage loan credit losses. |
Properties collateralizing mortgage loans are geographically dispersed throughout the United States, as well as diversified by property type, as reflected in the following tables as of the dates indicated:
| December 31, 2013(1) | December 31, 2012(1) | |||||||||||||||
| Gross Carrying Value |
% of Total |
Gross Carrying Value |
% of Total |
|||||||||||||
| Commercial Mortgage Loans by U.S. Region: |
||||||||||||||||
| Pacific |
$ | 2,281.8 | 24.5 | % | $ | 1,973.9 | 22.8 | % | ||||||||
| South Atlantic |
1,936.0 | 20.8 | % | 1,687.6 | 19.4 | % | ||||||||||
| West South Central |
1,122.3 | 12.0 | % | 1,176.3 | 13.6 | % | ||||||||||
| Middle Atlantic |
1,112.0 | 11.9 | % | 1,059.5 | 12.2 | % | ||||||||||
| East North Central |
1,037.5 | 11.1 | % | 962.8 | 11.1 | % | ||||||||||
| Mountain |
790.4 | 8.5 | % | 718.2 | 8.3 | % | ||||||||||
| West North Central |
517.2 | 5.6 | % | 537.5 | 6.2 | % | ||||||||||
| New England |
318.1 | 3.4 | % | 334.6 | 3.9 | % | ||||||||||
| East South Central |
200.7 | 2.2 | % | 215.8 | 2.5 | % | ||||||||||
|
|
|
|
|
|
|
|
|
|||||||||
| Total Commercial mortgage loans |
$ | 9,316.0 | 100.0 | % | $ | 8,666.2 | 100.0 | % | ||||||||
|
|
|
|
|
|
|
|
|
|||||||||
| (1) | Balances do not include allowance for mortgage loan credit losses. |
| December 31, 2013(1) | December 31, 2012(1) | |||||||||||||||
| Gross Carrying Value |
% of Total |
Gross Carrying Value |
% of Total |
|||||||||||||
| Commercial Mortgage Loans by Property Type: |
||||||||||||||||
| Retail |
$ | 2,936.9 | 31.5 | % | $ | 2,350.2 | 27.1 | % | ||||||||
| Industrial |
2,848.0 | 30.6 | % | 3,361.5 | 38.8 | % | ||||||||||
| Apartments |
1,296.1 | 13.9 | % | 952.1 | 11.0 | % | ||||||||||
| Office |
1,242.2 | 13.3 | % | 1,284.7 | 14.8 | % | ||||||||||
| Hotel/Motel |
430.6 | 4.6 | % | 280.6 | 3.2 | % | ||||||||||
| Mixed Use |
184.1 | 2.0 | % | 74.0 | 0.9 | % | ||||||||||
| Other |
378.1 | 4.1 | % | 363.1 | 4.2 | % | ||||||||||
|
|
|
|
|
|
|
|
|
|||||||||
| Total Commercial mortgage loans |
$ | 9,316.0 | 100.0 | % | $ | 8,666.2 | 100.0 | % | ||||||||
|
|
|
|
|
|
|
|
|
|||||||||
| (1) | Balances do not include allowance for mortgage loan credit losses. |
F-43
Table of Contents
ING U.S., Inc.
Notes to the Consolidated Financial Statements
(Dollar amounts in millions, unless otherwise stated)
The following table sets forth the breakdown of mortgages by year of origination as of the dates indicated:
| December 31, 2013(1) | December 31, 2012(1) | |||||||
| Year of Origination: |
||||||||
| 2013 |
$ | 2,199.8 | $ | — | ||||
| 2012 |
1,743.3 | 1,821.0 | ||||||
| 2011 |
1,835.9 | 1,940.8 | ||||||
| 2010 |
409.8 | 429.9 | ||||||
| 2009 |
149.5 | 175.1 | ||||||
| 2008 |
408.6 | 725.1 | ||||||
| 2007 and prior |
2,569.1 | 3,574.3 | ||||||
|
|
|
|
|
|||||
| Total Commercial mortgage loans |
$ | 9,316.0 | $ | 8,666.2 | ||||
|
|
|
|
|
|||||
| (1) | Balances do not include allowance for mortgage loan credit losses. |
Evaluating Securities for Other-Than-Temporary Impairments
The Company performs a regular evaluation, on a security-by-security basis, of its available-for-sale securities holdings, including fixed maturity securities and equity securities in accordance with its impairment policy in order to evaluate whether such investments are other-than-temporarily impaired.
The following table identifies the Company’s credit-related and intent-related impairments included in the Consolidated Statements of Operations, excluding impairments included in Other comprehensive income (loss) by type for the periods indicated:
| Years Ended December 31, | ||||||||||||||||||||||||
| 2013 | 2012 | 2011 | ||||||||||||||||||||||
| Impairment | No. of Securities |
Impairment | No. of Securities |
Impairment | No. of Securities |
|||||||||||||||||||
| U.S. corporate |
$ | — | — | $ | 14.3 | 4 | $ | 55.2 | 41 | |||||||||||||||
| Foreign(1) |
5.1 | 1 | 2.2 | 5 | 71.3 | 61 | ||||||||||||||||||
| Residential mortgage-backed |
17.4 | 118 | 25.2 | 106 | 37.7 | 134 | ||||||||||||||||||
| Commercial mortgage-backed |
0.6 | 3 | 1.7 | 1 | 133.7 | 26 | ||||||||||||||||||
| Other asset-backed |
8.9 | 8 | 2.6 | 7 | 195.5 | 122 | ||||||||||||||||||
| Equity |
3.0 | 2 | — | — | — | — | ||||||||||||||||||
| Mortgage loans on real estate |
— | — | 7.7 | 2 | 9.3 | 7 | ||||||||||||||||||
| Other assets(2) |
0.7 | 1 | 1.4 | 1 | — | — | ||||||||||||||||||
|
|
|
|
|
|
|
|
|
|
|
|
|
|||||||||||||
| Total |
$ | 35.7 | 133 | $ | 55.1 | 126 | $ | 502.7 | 391 | |||||||||||||||
|
|
|
|
|
|
|
|
|
|
|
|
|
|||||||||||||
| (1) | Primarily U.S. dollar denominated. |
| (2) | Includes loss on real estate owned that is classified as Other assets on the Consolidated Balance Sheets. |
The above tables include $21.2, $47.3 and $72.5 of credit impairments for the years ended December 31, 2013, 2012 and 2011, respectively, in Other-than-temporary impairments, which are recognized in the Consolidated Statements of Operations. The remaining $14.5, $7.8 and $430.2 for the years ended December 31, 2013, 2012 and 2011, respectively, are related to intent impairments.
F-44
Table of Contents
ING U.S., Inc.
Notes to the Consolidated Financial Statements
(Dollar amounts in millions, unless otherwise stated)
The following table summarizes these intent impairments, which are also recognized in earnings, by type for the periods indicated:
| Years Ended December 31, | ||||||||||||||||||||||||
| 2013 | 2012 | 2011 | ||||||||||||||||||||||
| Impairment | No. of Securities |
Impairment | No. of Securities |
Impairment | No. of Securities |
|||||||||||||||||||
| U.S. corporate |
$ | — | — | $ | 1.1 | 2 | $ | 55.2 | 40 | |||||||||||||||
| Foreign(1) |
— | — | 1.5 | 4 | 59.0 | 56 | ||||||||||||||||||
| Residential mortgage-backed |
6.6 | 22 | 3.3 | 10 | 7.9 | 27 | ||||||||||||||||||
| Commercial mortgage-backed |
0.6 | 3 | 1.7 | 1 | 124.3 | 26 | ||||||||||||||||||
| Other asset-backed |
7.3 | 2 | 0.2 | 1 | 183.8 | 118 | ||||||||||||||||||
|
|
|
|
|
|
|
|
|
|
|
|
|
|||||||||||||
| Total |
$ | 14.5 | 27 | $ | 7.8 | 18 | $ | 430.2 | 267 | |||||||||||||||
|
|
|
|
|
|
|
|
|
|
|
|
|
|||||||||||||
| (1) | Primarily U.S. dollar denominated. |
The Company may sell securities during the period in which fair value has declined below amortized cost for fixed maturities or cost for equity securities. In certain situations, new factors, including changes in the business environment, can change the Company’s previous intent to continue holding a security. Accordingly, these factors may lead the Company to record additional intent related capital losses.
The following table identifies the amount of credit impairments on fixed maturities for which a portion of the OTTI loss was recognized in Other comprehensive income (loss) and the corresponding changes in such amounts for the periods indicated:
| Years Ended December 31, | ||||||||||||
| 2013 | 2012 | 2011 | ||||||||||
| Balance at January 1 |
$ | 114.7 | $ | 133.9 | $ | 304.6 | ||||||
| Additional credit impairments: |
||||||||||||
| On securities not previously impaired |
3.5 | 9.5 | 10.3 | |||||||||
| On securities previously impaired |
8.1 | 17.1 | 17.0 | |||||||||
| Reductions: |
||||||||||||
| Securities intent impaired |
— | — | (38.2 | ) | ||||||||
| Securities sold, matured, prepaid or paid down |
(23.5 | ) | (45.8 | ) | (159.8 | ) | ||||||
|
|
|
|
|
|
|
|||||||
| Balance at December 31 |
$ | 102.8 | $ | 114.7 | $ | 133.9 | ||||||
|
|
|
|
|
|
|
|||||||
F-45
Table of Contents
ING U.S., Inc.
Notes to the Consolidated Financial Statements
(Dollar amounts in millions, unless otherwise stated)
Net Investment Income
The following table summarizes Net investment income for the periods indicated:
| Years Ended December 31, | ||||||||||||
| 2013 | 2012 | 2011 | ||||||||||
| Fixed maturities |
$ | 3,952.5 | $ | 4,184.0 | $ | 4,402.1 | ||||||
| Equity securities, available-for-sale |
10.0 | 17.7 | 27.3 | |||||||||
| Mortgage loans on real estate |
483.9 | 500.0 | 500.0 | |||||||||
| Policy loans |
118.3 | 121.5 | 125.6 | |||||||||
| Short-term investments and cash equivalents |
3.5 | 5.4 | 6.7 | |||||||||
| Other |
125.3 | (1) | (123.3 | )(2) | (80.8 | ) | ||||||
|
|
|
|
|
|
|
|||||||
| Gross investment income |
4,693.5 | 4,705.3 | 4,980.9 | |||||||||
| Less: investment expenses |
4.5 | 7.4 | 12.1 | |||||||||
|
|
|
|
|
|
|
|||||||
| Net investment income |
$ | 4,689.0 | $ | 4,697.9 | $ | 4,968.8 | ||||||
|
|
|
|
|
|
|
|||||||
| (1) | Includes $143.8 in conjunction with a bankruptcy settlement for a prime broker who held assets on behalf of a limited partnership previously written down to realizable value. |
| (2) | Includes a pre-tax loss of $91.9 in conjunction with a sale of certain private equity limited partnership investments. See Note 19. Consolidated Investment Entities-Private Equity Funds and Single Strategy Hedge Funds (Limited Partnership) to these Consolidated Financial Statements for more information. |
As of December 31, 2013, the Company did not have any investments in fixed maturities that did not produce net investment income. As of December 31, 2012, the Company had $0.3 of investments in fixed maturities that did not produce net investment income. Fixed maturities are moved to a non-accrual status when the investment defaults.
Interest income on fixed maturities is recorded when earned using an effective yield method, giving effect to amortization of premiums and accretion of discounts. Such interest income is recorded in Net investment income in the Consolidated Statements of Operations.
Net Realized Capital Gains (Losses)
Net realized capital gains (losses) are comprised of the difference between the amortized cost of investments and proceeds from sale and redemption, as well as losses incurred due to the credit-related and intent-related other-than-temporary impairment of investments. Realized investment gains and losses are also primarily generated from changes in fair value of embedded derivatives within product guarantees and fixed maturities, changes in fair value of fixed maturities recorded at FVO and changes in fair value including accruals on derivative instruments, except for effective cash flow hedges. The cost of the investments on disposal is generally determined based on first-in-first-out (“FIFO”) methodology.
F-46
Table of Contents
ING U.S., Inc.
Notes to the Consolidated Financial Statements
(Dollar amounts in millions, unless otherwise stated)
Net realized capital gains (losses) were as follows for the periods indicated:
| Years Ended December 31, | ||||||||||||
| 2013 | 2012 | 2011 | ||||||||||
| Fixed maturities, available-for-sale, including securities pledged |
$ | 85.0 | $ | 391.7 | $ | 56.4 | ||||||
| Fixed maturities, at fair value option |
(449.4 | ) | (278.8 | ) | (92.0 | ) | ||||||
| Equity securities, available-for-sale |
(2.8 | ) | 4.2 | 18.6 | ||||||||
| Derivatives |
(3,152.9 | ) | (1,712.4 | ) | 418.6 | |||||||
| Embedded derivatives—fixed maturities |
(107.5 | ) | (15.7 | ) | 16.1 | |||||||
| Embedded derivatives—product guarantees |
1,094.7 | 337.3 | (1,945.1 | ) | ||||||||
| Other investments |
(1.9 | ) | (7.1 | ) | (4.0 | ) | ||||||
|
|
|
|
|
|
|
|||||||
| Net realized capital gains (losses) |
$ | (2,534.8 | ) | $ | (1,280.8 | ) | $ | (1,531.4 | ) | |||
|
|
|
|
|
|
|
|||||||
| After-tax net realized capital gains (losses) |
$ | (1,693.2 | ) | $ | (715.8 | ) | $ | (1,017.4 | ) | |||
|
|
|
|
|
|
|
|||||||
Proceeds from the sale of fixed maturities and equity securities, available-for-sale and the related gross realized gains and losses, before tax, were as follows for the periods indicated:
| Years Ended December 31, | ||||||||||||
| 2013 | 2012 | 2011 | ||||||||||
| Proceeds on sales |
$ | 10,559.8 | $ | 11,185.9 | $ | 12,850.7 | ||||||
| Gross gains |
185.2 | 484.2 | 648.5 | |||||||||
| Gross losses |
77.7 | 44.8 | 181.9 | |||||||||
3. Derivative Financial Instruments
The Company enters into the following types of derivatives:
Interest rate caps: The Company uses interest rate cap contracts to hedge the interest rate exposure arising from duration mismatches between assets and liabilities. Interest rate caps are also used to hedge interest rate exposure if rates rise above a specified level. Such increases in rates will require the Company to incur additional expenses. The future payout from the interest rate caps fund this increased exposure. The Company pays an upfront premium to purchase these caps. The Company utilizes these contracts in non-qualifying hedging relationships.
Interest rate swaps: Interest rate swaps are used by the Company primarily to reduce market risks from changes in interest rates and to alter interest rate exposure arising from mismatches between assets and/or liabilities. Interest rate swaps are also used to hedge the interest rate risk associated with the value of assets it owns or in an anticipation of acquiring them. Using interest rate swaps, the Company agrees with another party to exchange, at specified intervals, the difference between fixed rate and floating rate interest payments, calculated by reference to an agreed upon notional principal amount. These transactions are entered into pursuant to master agreements that provide for a single net payment to be made to/from the counterparty at each due date. The Company utilizes these contracts in qualifying hedging relationships as well as non-qualifying hedging relationships.
Foreign exchange swaps: The Company uses foreign exchange or currency swaps to reduce the risk of change in the value, yield or cash flows associated with certain foreign denominated invested assets. Foreign exchange swaps represent contracts that require the exchange of foreign currency cash flows against U.S. dollar cash flows
F-47
Table of Contents
ING U.S., Inc.
Notes to the Consolidated Financial Statements
(Dollar amounts in millions, unless otherwise stated)
at regular periods, typically quarterly or semi-annually. The Company utilizes these contracts in qualifying hedging relationships as well as non-qualifying hedging relationships.
Credit default swaps: Credit default swaps are used to reduce credit loss exposure with respect to certain assets that the Company owns, or to assume credit exposure on certain assets that the Company does not own. Payments are made to or received from the counterparty at specified intervals. In the event of a default on the underlying credit exposure, the Company will either receive a payment (purchased credit protection) or will be required to make a payment (sold credit protection) equal to the par minus recovery value of the swap contract. The Company utilizes these contracts in non-qualifying hedging relationships.
Total return swaps: The Company uses total return swaps as a hedge against a decrease in variable annuity account values, which are invested in certain indices. Using total return swaps, the Company agrees with another party to exchange, at specified intervals, the difference between the economic risk and reward of assets or a market index and the LIBOR rate, calculated by reference to an agreed upon notional principal amount. No cash is exchanged at the onset of the contracts. Cash is paid and received over the life of the contract based upon the terms of the swaps. The Company utilizes these contracts in non-qualifying hedging relationships.
Currency forwards: The Company uses currency forward contracts to hedge policyholder liabilities associated with the variable annuity contracts which are linked to foreign indices. The currency fluctuations may result in a decrease in account values, which would increase the possibility of the Company incurring an expense for guaranteed benefits in excess of account values. The Company utilizes these contracts in non-qualifying hedging relationships.
Forwards: The Company uses forward contracts to hedge certain invested assets against movement in interest rates, particularly mortgage rates. The Company uses To Be Announced mortgage-backed securities as an economic hedge against rate movements. The Company utilizes forward contracts in non-qualifying hedging relationships.
Futures: Futures contracts are used to hedge against a decrease in certain equity indices. Such decreases may result in a decrease in variable annuity account values which would increase the possibility of the Company incurring an expense for guaranteed benefits in excess of account values. The Company also uses futures contracts as a hedge against an increase in certain equity indices. Such increases may result in increased payments to the holders of the fixed index annuity (“FIA”) contracts. The Company enters into exchange traded futures with regulated futures commissions that are members of the exchange. The Company also posts initial and variation margin with the exchange on a daily basis. The Company utilizes exchange-traded futures in non-qualifying hedging relationships.
Swaptions: A swaption is an option to enter into a swap with a forward starting effective date. The Company uses swaptions to hedge the interest rate exposure associated with the minimum crediting rate and book value guarantees embedded in the retirement products that the Company offers. Increases in interest rates will generate losses on assets that are backing such liabilities. In certain instances, the Company locks in the economic impact of existing purchased swaptions by entering into offsetting written swaptions. Swaptions are also used to hedge against an increase in the interest rate benchmarked crediting strategies within FIA contracts. Such increases may result in increased payments to contract holders of FIA contracts and the interest rate swaptions offset this increased exposure. The Company pays a premium when it purchases the swaption. The Company utilizes these contracts in non-qualifying hedging relationships.
Options: The Company uses put options to manage the equity, interest rate and equity volatility risk of the economic liabilities associated with certain variable annuity minimum guaranteed living benefits. The Company
F-48
Table of Contents
ING U.S., Inc.
Notes to the Consolidated Financial Statements
(Dollar amounts in millions, unless otherwise stated)
also uses call options to hedge against an increase in various equity indices. Such increases may result in increased payments to the holders of the FIA contracts. The Company pays an upfront premium to purchase these options. The Company utilizes these options in non-qualifying hedging relationships.
Variance swaps: The Company uses variance swaps to manage equity volatility risk on the economic liabilities associated with certain minimum guaranteed living benefits. An increase in the equity volatility results in a higher valuations of such liabilities. In an equity variance swap, the Company agrees with another party to exchange amounts in the future, based on the changes in equity volatility over a defined period. The Company utilizes equity variance swaps in non-qualifying hedging relationships.
Managed custody guarantees (“MCG”): The Company issues certain credited rate guarantees on externally managed variable bond funds that represent stand-alone derivatives. The market value is partially determined by, among other things, levels of or changes in interest rates, prepayment rates and credit ratings/spreads.
Embedded derivatives: The Company also invests in certain fixed maturity instruments and has issued certain annuity products that contain embedded derivatives whose market value is at least partially determined by, among other things, levels of or changes in domestic and/or foreign interest rates (short-term or long-term), exchange rates, prepayment rates, equity rates, or credit ratings/spreads. In addition, the Company has entered into a coinsurance with a funds withheld arrangement which contains an embedded derivative whose fair value is based on the change in the fair value of the underlying assets held in trust. The embedded derivatives for certain fixed maturity instruments, certain annuity products and coinsurance with funds withheld arrangements are reported with the host contract in investments, in Future policy benefits or Funds held under reinsurance agreements, respectively, on the Consolidated Balance Sheets. Changes in the fair value of embedded derivatives within fixed maturity investments and within annuity products are recorded in Other net realized capital gains (losses) in the Consolidated Statements of Operations. Changes in fair value of embedded derivatives with reinsurance agreements are reported in Policyholder benefits in the Consolidated Statements of Operations.
The Company’s use of derivatives is limited mainly to economic hedging to reduce the Company’s exposure to cash flow variability of assets and liabilities, interest rate risk, credit risk, exchange rate risk and market risk. It is the Company’s policy not to offset amounts recognized for derivative instruments and amounts recognized for the right to reclaim cash collateral or the obligation to return cash collateral arising from derivative instruments executed with the same counterparty under a master netting arrangement, which provides the Company with the legal right of offset.
F-49
Table of Contents
ING U.S., Inc.
Notes to the Consolidated Financial Statements
(Dollar amounts in millions, unless otherwise stated)
The notional amounts and fair values of derivatives were as follows as of the dates indicated:
| December 31, 2013 | December 31, 2012 | |||||||||||||||||||||||
| Notional Amount |
Asset Fair Value |
Liability Fair Value |
Notional Amount |
Asset Fair Value |
Liability Fair Value |
|||||||||||||||||||
| Derivatives: Qualifying for hedge accounting(1) |
||||||||||||||||||||||||
| Cash flow hedges: |
||||||||||||||||||||||||
| Interest rate contracts |
$ | 786.0 | $ | 81.0 | $ | 0.5 | $ | 1,000.0 | $ | 215.4 | $ | — | ||||||||||||
| Foreign exchange contracts |
174.7 | 6.3 | 1.6 | — | — | — | ||||||||||||||||||
| Fair value hedges: |
||||||||||||||||||||||||
| Interest rate contracts |
873.5 | 4.8 | 64.7 | 291.1 | — | 16.4 | ||||||||||||||||||
| Derivatives: Non-qualifying for hedge accounting(1) |
||||||||||||||||||||||||
| Interest rate contracts(2) |
63,122.0 | 826.2 | 1,174.3 | 69,719.2 | 1,981.1 | 1,545.0 | ||||||||||||||||||
| Foreign exchange contracts |
1,281.7 | 17.8 | 43.3 | 1,985.8 | 11.3 | 95.0 | ||||||||||||||||||
| Equity contracts |
11,725.9 | 172.7 | 52.9 | 14,890.4 | 103.4 | 235.1 | ||||||||||||||||||
| Credit contracts |
3,221.0 | 40.5 | 14.5 | 3,106.0 | 63.3 | 52.7 | ||||||||||||||||||
| Managed custody guarantees |
N/A | — | — | N/A | — | — | ||||||||||||||||||
| Embedded derivatives: |
||||||||||||||||||||||||
| Within fixed maturity investments |
N/A | 126.5 | — | N/A | 227.4 | — | ||||||||||||||||||
| Within annuity products |
N/A | — | 2,645.6 | N/A | — | 3,571.7 | ||||||||||||||||||
| Within reinsurance agreements |
N/A | — | 79.0 | N/A | — | 169.5 | ||||||||||||||||||
|
|
|
|
|
|
|
|
|
|||||||||||||||||
| Total |
$ | 1,275.8 | $ | 4,076.4 | $ | 2,601.9 | $ | 5,685.4 | ||||||||||||||||
|
|
|
|
|
|
|
|
|
|||||||||||||||||
| (1) | Open derivative contracts are reported as Derivatives assets or liabilities on the Consolidated Balance Sheets at fair value. |
| (2) | As of December 31, 2013, includes a notional amount, asset fair value and liability fair value for interest rate caps of $11.8 billion, $162.5 and $29.7, respectively. As of December 31, 2012, includes a notional amount, asset fair value and liability fair value for interest rate caps of $4.5 billion, $17.7 and $0.6, respectively. |
| N/A—Not | Applicable |
Based on the notional amounts, a substantial portion of the Company’s derivative positions was not designated or did not qualify for hedge accounting as part of a hedging relationship as of December 31, 2013 and 2012. The Company utilizes derivative contracts mainly to hedge exposure to variability in cash flows, interest rate risk, credit risk, foreign exchange risk and equity market risk. The majority of derivatives used by the Company are designated as product hedges, which hedge the exposure arising from insurance liabilities or guarantees embedded in the contracts the Company offers through various product lines. These derivatives do not qualify for hedge accounting as they do not meet the criteria of being “highly effective” as outlined in ASC Topic 815, but do provide an economic hedge, which is in line with the Company’s risk management objectives. The Company also uses derivatives contracts to hedge its exposure to various risks associated with the investment portfolio. The Company does not seek hedge accounting treatment for certain of these derivatives as they generally do not qualify for hedge accounting due to the criteria required under the portfolio hedging rules outlined in ASC Topic 815. The Company also uses credit default swaps coupled with other investments in order to produce the investment characteristics of otherwise permissible investments which do not qualify as effective accounting hedges under ASC Topic 815.
F-50
Table of Contents
ING U.S., Inc.
Notes to the Consolidated Financial Statements
(Dollar amounts in millions, unless otherwise stated)
The maximum length of time over which the Company is hedging its exposure to the variability in future cash flows for forecasted transactions is through the fourth quarter of 2016.
Although the Company has not elected to net its derivative exposures, the notional amounts and fair values of OTC and cleared derivatives excluding exchange traded contracts and forward contracts (To Be Announced mortgage-backed securities) are presented in the tables below as of the dates indicated:
| December 31, 2013 | ||||||||||||
| Notional Amount | Assets Fair Value | Liability Fair Value | ||||||||||
| Credit contracts |
$ | 3,221.0 | $ | 40.5 | $ | 14.5 | ||||||
| Equity contracts |
4,513.5 | 170.7 | 32.0 | |||||||||
| Foreign exchange contracts |
1,456.4 | 24.1 | 44.9 | |||||||||
| Interest rate contracts |
64,734.1 | 912.0 | 1,239.5 | |||||||||
|
|
|
|
|
|||||||||
| $ | 1,147.3 | $ | 1,330.9 | |||||||||
|
|
|
|
|
|||||||||
| Counterparty netting(1) |
(701.0 | ) | (701.0 | ) | ||||||||
| Cash collateral netting(1) |
(241.7 | ) | (15.7 | ) | ||||||||
| Securities collateral netting(1) |
(35.9 | ) | (479.1 | ) | ||||||||
|
|
|
|
|
|||||||||
| Net receivables/payables |
$ | 168.7 | $ | 135.1 | ||||||||
|
|
|
|
|
|||||||||
| (1) | Represents the netting of receivable balances with payable balances, net of collateral, for the same counterparty under eligible netting rules. |
| December 31, 2012 | ||||||||||||
| Notional Amount | Assets Fair Value | Liability Fair Value | ||||||||||
| Credit contracts |
$ | 3,106.0 | $ | 63.3 | $ | 52.7 | ||||||
| Equity contracts |
3,967.0 | 79.1 | 19.1 | |||||||||
| Foreign exchange contracts |
1,985.8 | 11.3 | 95.0 | |||||||||
| Interest rate contracts |
69,107.7 | 2,196.5 | 1,559.9 | |||||||||
|
|
|
|
|
|||||||||
| $ | 2,350.2 | $ | 1,726.7 | |||||||||
|
|
|
|
|
|||||||||
| Counterparty netting(1) |
(1,126.9 | ) | (1,126.9 | ) | ||||||||
| Cash collateral netting(1) |
(943.4 | ) | (85.7 | ) | ||||||||
| Securities collateral netting(1) |
(68.6 | ) | (395.6 | ) | ||||||||
|
|
|
|
|
|||||||||
| Net receivables/payables |
$ | 211.3 | $ | 118.5 | ||||||||
|
|
|
|
|
|||||||||
| (1) | Represents the netting of receivable balances with payable balances, net of collateral, for the same counterparty under eligible netting rules. |
Collateral
Under the terms of the Company’s Over-The-Counter (“OTC”) Derivative International Swaps and Derivatives Association, Inc. (“ISDA”) agreements, the Company may receive from, or deliver to, counterparties collateral to assure that all terms of the ISDA agreements will be met with regard to the Credit Support Annex (“CSA”). The terms of the CSA call for the Company to pay interest on any cash received equal to the Federal Funds rate. To the extent cash collateral is received and delivered, it is included in Payables under securities loan agreements, including collateral held and Short-term investments under securities loan agreements, including collateral
F-51
Table of Contents
ING U.S., Inc.
Notes to the Consolidated Financial Statements
(Dollar amounts in millions, unless otherwise stated)
delivered, respectively, on the Consolidated Balance Sheets and is reinvested in short-term investments. Collateral held is used in accordance with the CSA to satisfy any obligations. Investment grade bonds owned by the Company are the source of noncash collateral posted, which is reported in Securities pledged on the Consolidated Balance Sheets. As of December 31, 2013, the Company held $214.7 and $18.8 of net cash collateral related to OTC derivative contracts and cleared derivative contracts, respectively. As of December 31, 2012, the Company held $890.3 of net cash collateral related to OTC derivative contracts. In addition, as of December 31, 2013 and 2012, the Company delivered securities as collateral of $1.0 billion.
Net realized gains (losses) on derivatives were as follows for the periods indicated:
| Years Ended December 31, | ||||||||||||
| 2013 | 2012 | 2011 | ||||||||||
| Derivatives: Qualifying for hedge accounting(1) |
||||||||||||
| Cash flow hedges: |
||||||||||||
| Interest rate contracts |
$ | 0.4 | $ | — | $ | — | ||||||
| Foreign exchange contracts |
0.4 | — | — | |||||||||
| Fair value hedges: |
||||||||||||
| Interest rate contracts |
21.1 | (10.0 | ) | (57.2 | ) | |||||||
| Derivatives: Non-qualifying for hedge accounting(2) |
||||||||||||
| Interest rate contracts |
(1,058.5 | ) | 51.5 | 1,041.8 | ||||||||
| Foreign exchange contracts |
75.7 | 10.9 | (2.4 | ) | ||||||||
| Equity contracts |
(2,217.2 | ) | (1,801.9 | ) | (559.0 | ) | ||||||
| Credit contracts |
25.2 | 37.1 | (4.6 | ) | ||||||||
| Managed custody guarantees |
0.2 | 1.1 | 1.1 | |||||||||
| Embedded derivatives: |
||||||||||||
| Within fixed maturity investments(2) |
(107.5 | ) | (15.7 | ) | 16.1 | |||||||
| Within annuity products(2) |
1,094.5 | 336.2 | (1,946.2 | ) | ||||||||
| Within reinsurance agreements(3) |
90.4 | (32.2 | ) | (68.1 | ) | |||||||
|
|
|
|
|
|
|
|||||||
| Total |
$ | (2,075.3 | ) | $ | (1,423.0 | ) | $ | (1,578.5 | ) | |||
|
|
|
|
|
|
|
|||||||
| (1) | Changes in value for effective fair value hedges are recorded in Other net realized capital gains (losses). Changes in fair value upon disposal for effective cash flow hedges are amortized through Net investment income and the ineffective portion is recorded in Other net realized capital gains (losses) in the Consolidated Statements of Operations. For the years ended December 31, 2013, 2012 and 2011, ineffective amounts were immaterial. |
| (2) | Changes in value are included in Other net realized capital gains (losses) in the Consolidated Statements of Operations. |
| (3) | Changes in value are included in Policyholder benefits in the Consolidated Statements of Operations. |
Credit Default Swaps
The Company has entered into various credit default swaps. When credit default swaps are sold, the Company assumes credit exposure to certain assets that it does not own. Credit default swaps may also be purchased to reduce credit exposure in the Company’s portfolio. Credit default swaps involve a transfer of credit risk from one party to another in exchange for periodic payments. The Company has ISDA agreements with each counterparty with which it conducts business and tracks the collateral positions for each counterparty. To the extent cash collateral is received, it is included in Payables under securities loan agreements, including collateral held, on the
F-52
Table of Contents
ING U.S., Inc.
Notes to the Consolidated Financial Statements
(Dollar amounts in millions, unless otherwise stated)
Consolidated Balance Sheets and is reinvested in short-term investments. Collateral held is used in accordance with the CSA to satisfy any obligations. Investment grade bonds owned by the Company are the source of noncash collateral posted, which is reported in Securities pledged on the Consolidated Balance Sheets. As of December 31, 2013, the fair values of credit default swaps of $40.5 and $14.5 were included in Derivatives assets and Derivatives liabilities, respectively, on the Consolidated Balance Sheets. As of December 31, 2012, the fair value of credit default swaps of $63.3 and $52.7 were included in Derivatives assets and Derivatives liabilities, respectively, on the Consolidated Balance Sheets. As of December 31, 2013, the maximum potential future net exposure to the Company was $1.7 billion, net of purchased protection of $0.5 on credit default swaps. As of December 31, 2012, the maximum potential future net exposure to the Company was $1.1 billion, net of purchased protection of $1.0 billion on credit default swaps. These instruments are typically written for a maturity period of five years and contain no recourse provisions. If the Company’s current debt and claims paying ratings were downgraded in the future, the terms in the Company’s derivative agreements may be triggered, which could negatively impact overall liquidity.
4. Fair Value Measurements (excluding Consolidated Investment Entities)
Fair Value Measurement
The Company categorizes its financial instruments into a three-level hierarchy based on the priority of the inputs to the valuation technique, pursuant to the Fair Value Measurements and disclosures of the ASC Topic 820. The fair value hierarchy gives the highest priority to quoted prices in active markets for identical assets or liabilities (Level 1) and the lowest priority to unobservable inputs (Level 3). If the inputs used to measure fair value fall within different levels of the hierarchy, the category level is based on the lowest priority level input that is significant to the fair value measurement of the instrument. Financial assets and liabilities recorded at fair value on the Consolidated Balance Sheets are categorized as follows:
| • | Level 1—Unadjusted quoted prices for identical assets or liabilities in an active market. The Company defines an active market as a market in which transactions take place with sufficient frequency and volume to provide pricing information on an ongoing basis. |
| • | Level 2—Quoted prices in markets that are not active or valuation techniques that require inputs that are observable either directly or indirectly for substantially the full term of the asset or liability. Level 2 inputs include the following: |
| a) | Quoted prices for similar assets or liabilities in active markets; |
| b) | Quoted prices for identical or similar assets or liabilities in non-active markets; |
| c) | Inputs other than quoted market prices that are observable; and |
| d) | Inputs that are derived principally from or corroborated by observable market data through correlation or other means. |
| • | Level 3—Prices or valuation techniques that require inputs that are both unobservable and significant to the overall fair value measurement. These valuations, whether derived internally or obtained from a third party, use critical assumptions that are not widely available to estimate market participant expectations in valuing the asset or liability. |
When available, the estimated fair value of financial instruments is based on quoted prices in active markets that are readily and regularly obtainable. When quoted prices in active markets are not available, the determination of estimated fair value is based on market standard valuation methodologies, including discounted cash flow methodologies, matrix pricing, or other similar techniques.
F-53
Table of Contents
ING U.S., Inc.
Notes to the Consolidated Financial Statements
(Dollar amounts in millions, unless otherwise stated)
The following table presents the Company’s hierarchy for its assets and liabilities measured at fair value on a recurring basis as of December 31, 2013:
| Level 1 | Level 2 | Level 3 | Total | |||||||||||||
| Assets: |
||||||||||||||||
| Fixed maturities, including securities pledged: |
||||||||||||||||
| U.S. Treasuries |
$ | 4,617.0 | $ | 564.2 | $ | — | $ | 5,181.2 | ||||||||
| U.S. Government agencies and authorities |
— | 604.5 | 14.4 | 618.9 | ||||||||||||
| U.S. corporate, state and municipalities |
— | 37,303.2 | 456.5 | 37,759.7 | ||||||||||||
| Foreign(1) |
— | 16,202.2 | 154.3 | 16,356.5 | ||||||||||||
| Residential mortgage-backed securities |
— | 7,025.1 | 98.6 | 7,123.7 | ||||||||||||
| Commercial mortgage-backed securities |
— | 3,752.1 | — | 3,752.1 | ||||||||||||
| Other asset-backed securities |
— | 1,867.5 | 59.2 | 1,926.7 | ||||||||||||
|
|
|
|
|
|
|
|
|
|||||||||
| Total fixed maturities, including securities pledged |
4,617.0 | 67,318.8 | 783.0 | 72,718.8 | ||||||||||||
| Equity securities, available-for-sale |
238.5 | 20.6 | 55.3 | 314.4 | ||||||||||||
| Derivatives: |
||||||||||||||||
| Interest rate contracts |
— | 912.0 | — | 912.0 | ||||||||||||
| Foreign exchange contracts |
— | 24.1 | — | 24.1 | ||||||||||||
| Equity contracts |
1.9 | 83.3 | 87.5 | 172.7 | ||||||||||||
| Credit contracts |
— | 33.2 | 7.3 | 40.5 | ||||||||||||
| Cash and cash equivalents, short-term investments and short-term investments under securities loan agreements |
4,396.9 | 44.9 | — | 4,441.8 | ||||||||||||
| Assets held in separate accounts |
101,437.5 | 5,376.5 | 13.1 | 106,827.1 | ||||||||||||
|
|
|
|
|
|
|
|
|
|||||||||
| Total assets |
$ | 110,691.8 | $ | 73,813.4 | $ | 946.2 | $ | 185,451.4 | ||||||||
|
|
|
|
|
|
|
|
|
|||||||||
| Percentage of Level to total |
59.7 | % | 39.8 | % | 0.5 | % | 100.0 | % | ||||||||
| Liabilities: |
||||||||||||||||
| Derivatives: |
||||||||||||||||
| Annuity product guarantees: |
||||||||||||||||
| FIA |
$ | — | $ | — | $ | 1,736.7 | $ | 1,736.7 | ||||||||
| GMAB/GMWB/GMWBL |
— | — | 908.9 | 908.9 | ||||||||||||
| Stabilizer and MCGs |
— | — | — | — | ||||||||||||
| Other derivatives: |
||||||||||||||||
| Interest rate contracts |
— | 1,239.5 | — | 1,239.5 | ||||||||||||
| Foreign exchange contracts |
— | 44.9 | — | 44.9 | ||||||||||||
| Equity contracts |
20.9 | 32.0 | — | 52.9 | ||||||||||||
| Credit contracts |
— | — | 14.5 | 14.5 | ||||||||||||
| Embedded derivative on reinsurance |
— | 79.0 | — | 79.0 | ||||||||||||
|
|
|
|
|
|
|
|
|
|||||||||
| Total liabilities |
$ | 20.9 | $ | 1,395.4 | $ | 2,660.1 | $ | 4,076.4 | ||||||||
|
|
|
|
|
|
|
|
|
|||||||||
| (1) | Primarily U.S. dollar denominated. |
F-54
Table of Contents
ING U.S., Inc.
Notes to the Consolidated Financial Statements
(Dollar amounts in millions, unless otherwise stated)
The following table presents the Company’s hierarchy for its assets and liabilities measured at fair value on a recurring basis as of December 31, 2012:
| Level 1 | Level 2 | Level 3 | Total | |||||||||||||
| Assets: |
||||||||||||||||
| Fixed maturities, including securities pledged: |
||||||||||||||||
| U.S. Treasuries |
$ | 5,220.5 | $ | 663.2 | $ | — | $ | 5,883.7 | ||||||||
| U.S. Government agencies and authorities |
— | 724.2 | — | 724.2 | ||||||||||||
| U.S. corporate, state and municipalities |
— | 36,992.5 | 524.2 | 37,516.7 | ||||||||||||
| Foreign(1) |
— | 15,880.3 | 104.2 | 15,984.5 | ||||||||||||
| Residential mortgage-backed securities |
— | 7,592.9 | 74.1 | 7,667.0 | ||||||||||||
| Commercial mortgage-backed securities |
— | 4,946.4 | — | 4,946.4 | ||||||||||||
| Other asset-backed securities |
— | 2,449.4 | 115.2 | 2,564.6 | ||||||||||||
|
|
|
|
|
|
|
|
|
|||||||||
| Total fixed maturities, including securities pledged |
5,220.5 | 69,248.9 | 817.7 | 75,287.1 | ||||||||||||
| Equity securities, available-for-sale |
264.2 | 20.1 | 55.8 | 340.1 | ||||||||||||
| Derivatives: |
||||||||||||||||
| Interest rate contracts |
— | 2,196.5 | — | 2,196.5 | ||||||||||||
| Foreign exchange contracts |
— | 11.3 | — | 11.3 | ||||||||||||
| Equity contracts |
24.3 | 55.9 | 23.2 | 103.4 | ||||||||||||
| Credit contracts |
— | 10.9 | 52.4 | 63.3 | ||||||||||||
| Cash and cash equivalents, short-term investments and short-term investments under securities loan agreements |
8,365.4 | 76.6 | — | 8,442.0 | ||||||||||||
| Assets held in separate accounts |
91,928.5 | 5,722.6 | 16.3 | 97,667.4 | ||||||||||||
|
|
|
|
|
|
|
|
|
|||||||||
| Total assets |
$ | 105,802.9 | $ | 77,342.8 | $ | 965.4 | $ | 184,111.1 | ||||||||
|
|
|
|
|
|
|
|
|
|||||||||
| Percentage of Level to total |
57.5 | % | 42.0 | % | 0.5 | % | 100.0 | % | ||||||||
| Liabilities: |
||||||||||||||||
| Derivatives: |
||||||||||||||||
| Annuity product guarantees: |
||||||||||||||||
| FIA |
$ | — | $ | — | $ | 1,434.3 | $ | 1,434.3 | ||||||||
| GMAB/GMWB/GMWBL |
— | — | 2,035.4 | 2,035.4 | ||||||||||||
| Stabilizer and MCGs |
— | — | 102.0 | 102.0 | ||||||||||||
| Other derivatives: |
||||||||||||||||
| Interest rate contracts |
1.6 | 1,559.8 | — | 1,561.4 | ||||||||||||
| Foreign exchange contracts |
— | 95.0 | — | 95.0 | ||||||||||||
| Equity contracts |
216.0 | 19.1 | — | 235.1 | ||||||||||||
| Credit contracts |
— | — | 52.7 | 52.7 | ||||||||||||
| Embedded derivative on reinsurance |
— | 169.5 | — | 169.5 | ||||||||||||
|
|
|
|
|
|
|
|
|
|||||||||
| Total liabilities |
$ | 217.6 | $ | 1,843.4 | $ | 3,624.4 | $ | 5,685.4 | ||||||||
|
|
|
|
|
|
|
|
|
|||||||||
| (1) | Primarily U.S. dollar denominated. |
Valuation of Financial Assets and Liabilities at Fair Value
Certain assets and liabilities are measured at estimated fair value on the Company’s Consolidated Balance Sheets. The Company defines fair value as the price that would be received to sell an asset or paid to transfer a liability (an exit price) in the principal or most advantageous market for the asset or liability in an orderly
F-55
Table of Contents
ING U.S., Inc.
Notes to the Consolidated Financial Statements
(Dollar amounts in millions, unless otherwise stated)
transaction between market participants on the measurement date. The exit price and the transaction (or entry) price will be the same at initial recognition in many circumstances. However, in certain cases, the transaction price may not represent fair value. The fair value of a liability is based on the amount that would be paid to transfer a liability to a third party with an equal credit standing. Fair value is required to be a market-based measurement that is determined based on a hypothetical transaction at the measurement date, from a market participant’s perspective. The Company considers three broad valuation techniques when a quoted price is unavailable: (i) the market approach, (ii) the income approach and (iii) the cost approach. The Company determines the most appropriate valuation technique to use, given the instrument being measured and the availability of sufficient inputs. The Company prioritizes the inputs to fair valuation techniques and allows for the use of unobservable inputs to the extent that observable inputs are not available.
The Company utilizes a number of valuation methodologies to determine the fair values of its financial assets and liabilities in conformity with the concepts of “exit price” and the fair value hierarchy as prescribed in ASC Topic 820. Valuations are obtained from third-party commercial pricing services, brokers and industry-standard, vendor-provided software that models the value based on market observable inputs. The valuations obtained from third-party commercial pricing services are non-binding. The Company reviews the assumptions and inputs used by third-party commercial pricing services for each reporting period in order to determine an appropriate fair value hierarchy level. The documentation and analysis obtained from third-party commercial pricing services are reviewed by the Company, including in-depth validation procedures confirming the observability of inputs. The valuations are reviewed and validated monthly through the internal valuation committee price variance review, comparisons to internal pricing models, back testing to recent trades, or monitoring of trading volumes.
The following valuation methods and assumptions were used by the Company in estimating the reported values for the investments and derivatives described below:
Fixed maturities: The fair values for the actively traded marketable bonds are determined based upon the quoted market prices and are classified as Level 1 assets. Assets in this category would primarily include certain U.S. Treasury securities. The fair values for marketable bonds without an active market are obtained through several commercial pricing services, which provide the estimated fair values and are classified as Level 2 assets. These services incorporate a variety of market observable information in their valuation techniques, including benchmark yields, broker-dealer quotes, credit quality, issuer spreads, bids, offers and other reference data. This category includes U.S. and foreign corporate bonds, ABS, U.S. agency and government guaranteed securities, CMBS and RMBS, including certain CMO assets.
Generally, the Company does not obtain more than one vendor price from pricing services per instrument. The Company uses a hierarchy process in which prices are obtained from a primary vendor and, if that vendor is unable to provide the price, the next vendor in the hierarchy is contacted until a price is obtained or it is determined that a price cannot be obtained from a commercial pricing service. When a price cannot be obtained from a commercial pricing service, independent broker quotes are solicited. Securities priced using independent broker quotes are classified as Level 3.
Broker quotes and prices obtained from pricing services are reviewed and validated through an internal valuation committee price variance review, comparisons to internal pricing models, back testing to recent trades, or monitoring of trading volumes. As of December 31, 2013, $541.2 and $58.3 billion of a total fair value of $72.7 billion in fixed maturities, including securities pledged, were valued using unadjusted broker quotes and unadjusted prices obtained from pricing services, respectively, and verified through the review process. The remaining balance in fixed maturities consisted primarily of privately placed bonds valued using a matrix-based pricing. As of December 31, 2012, $580.4 and $60.4 billion of a total fair value of $75.3 billion in fixed maturities, including securities pledged, were valued using unadjusted broker quotes and unadjusted prices
F-56
Table of Contents
ING U.S., Inc.
Notes to the Consolidated Financial Statements
(Dollar amounts in millions, unless otherwise stated)
obtained from pricing services, respectively, and verified through the review process. The remaining balance in fixed maturities consisted primarily of privately placed bonds valued using a matrix-based pricing.
All prices and broker quotes obtained go through the review process described above including valuations for which only one broker quote is obtained. After review, for those instruments where the price is determined to be appropriate, the unadjusted price provided is used for financial statement valuation. If it is determined that the price is questionable, another price may be requested from a different vendor. The internal valuation committee then reviews all prices for the instrument again, along with information from the review, to determine which price best represents “exit price” for the instrument.
Fair values of privately placed bonds are determined primarily using a matrix-based pricing model and are generally classified as Level 2 assets. The model considers the current level of risk-free interest rates, current corporate spreads, the credit quality of the issuer and cash flow characteristics of the security. Also considered are factors such as the net worth of the borrower, the value of collateral, the capital structure of the borrower, the presence of guarantees and the Company’s evaluation of the borrower’s ability to compete in its relevant market. Using this data, the model generates estimated market values which the Company considers reflective of the fair value of each privately placed bond.
Equity securities, available-for-sale: Fair values of publicly traded equity securities are based upon quoted market price and are classified as Level 1 assets. Other equity securities, typically private equities or equity securities not traded on an exchange, are valued by other sources such as analytics or brokers and are classified as Level 2 or Level 3 assets.
Derivatives: Derivatives are carried at fair value, which is determined using the Company’s derivative accounting system in conjunction with observable key financial data from third-party sources, such as yield curves, exchange rates, S&P 500 Index prices, London Interbank Offered Rates (“LIBOR”) and Overnight Index Swap (“OIS”) rates. In June 2012, the Company began using OIS rather than LIBOR for valuations of collateralized interest rate derivatives, which are obtained from third-party sources. For those derivatives that are unable to be valued by the accounting system, the Company typically utilizes values established by third-party brokers. Counterparty credit risk is considered and incorporated in the Company’s valuation process through counterparty credit rating requirements and monitoring of overall exposure. It is the Company’s policy to transact only with investment grade counterparties with a credit rating of A- or better. The Company’s nonperformance risk is also considered and incorporated in the Company’s valuation process. Valuations for the Company’s futures and interest rate forward contracts are based on unadjusted quoted prices from an active exchange and, therefore, are classified as Level 1. The Company also has certain credit default swaps and options that are priced using models that primarily use market observable inputs, but contain inputs that are not observable to market participants, which have been classified as Level 3. However, all other derivative instruments are valued based on market observable inputs and are classified as Level 2.
The Company has entered into a number of options as hedges on its FIA liabilities. The maximum exposure is the current value of the option. The payoff of these contracts depends on market conditions during the lifetime of the option. The fair value measurement of options is highly sensitive to implied equity and interest rate volatility and the market reflects a considerable variance in broker quotes. The Company uses a third-party vendor to determine the market value of these options.
Cash and cash equivalents, Short-term investments and Short-term investments under securities loan agreement: The carrying amounts for cash reflect the assets’ fair values. The fair values for cash equivalents and most short-term investments are determined based on quoted market prices. These assets are classified as Level 1. Other
F-57
Table of Contents
ING U.S., Inc.
Notes to the Consolidated Financial Statements
(Dollar amounts in millions, unless otherwise stated)
short-term investments are valued and classified in the fair value hierarchy consistent with the policies described herein, depending on investment type.
Assets held in separate accounts: Assets held in separate accounts are reported at the quoted fair values of the underlying investments in the separate accounts. The underlying investments include mutual funds, short-term investments and cash, the valuations of which are based upon a quoted market price and are included in Level 1. Fixed maturity valuations are obtained from third-party commercial pricing services and brokers and are classified in the fair value hierarchy consistent with the policy described above for fixed maturities.
Product guarantees: The Company records reserves for annuity contracts containing GMAB, GMWB and GMWBL riders. The guarantee is an embedded derivative and is required to be accounted for separately from the host variable annuity contract. The fair value of the obligation is calculated based on actuarial and capital market assumptions related to the projected cash flows, including benefits and related contract charges, over the anticipated life of the related contracts. The cash flow estimates are produced by using stochastic techniques under a variety of market return scenarios and other market implied assumptions. These derivatives are classified as Level 3 liabilities in the fair value hierarchy.
The Company records an embedded derivative liability for its FIA contracts for interest payments to contract holders above the minimum guaranteed contract value. The guarantee is treated as an embedded derivative and is required to be accounted for separately from the host contract. The fair value of the obligation is calculated based on actuarial and capital market assumptions related to the projected cash flows, including benefits and related contract charges, over the anticipated life of the related contracts. The cash flow estimates are produced by market implied assumptions. These derivatives are classified as Level 3 liabilities in the fair value hierarchy.
The Company records reserves for Stabilizer and MCG contracts containing guaranteed credited rates. The guarantee is treated as an embedded derivative or a stand-alone derivative (depending on the underlying product) and is required to be reported at fair value. The estimated fair value is determined based on the present value of projected future claims, minus the present value of future guaranteed premiums. At inception of the contract, the Company projects a guaranteed premium to be equal to the present value of the projected future claims. The income associated with the contracts is projected using relevant actuarial and capital market assumptions, including benefits and related contract charges, over the anticipated life of the related contracts. The cash flow estimates are produced by using stochastic techniques under a variety of risk neutral scenarios and other market implied assumptions. These derivatives are classified as Level 3 liabilities.
The discount rate used to determine the fair value of the Company’s GMAB, GMWB, GMWBL, FIA, and Stabilizer embedded derivative liabilities and the stand-alone derivative for MCG includes an adjustment to reflect the risk that these obligations will not be fulfilled (“nonperformance risk”). Through June 30, 2012, nonperformance risk was based on the credit default swap spreads of ING V with similar term to maturity and priority of payment. The ING V credit default spread was applied to the risk-free swap curve in the Company’s valuation models for these products and guarantees. As a result of the availability of ING U.S., Inc.’s market observable data following the issuance of the $850.0 in 5.5% unsecured Senior Notes due 2022 (the “2022 Notes”) in the third quarter of 2012, the Company changed its estimate of nonperformance risk to incorporate a blend of observable, similarly rated peer company credit default swap spreads, adjusted to reflect the credit quality of the individual insurance subsidiary that issued the guarantee as well as an adjustment to reflect the priority of policyholder claims.
The Company’s valuation actuaries are responsible for the policies and procedures for valuing the embedded derivatives, reflecting the capital markets and actuarial valuation inputs and nonperformance risk in the estimate
F-58
Table of Contents
ING U.S., Inc.
Notes to the Consolidated Financial Statements
(Dollar amounts in millions, unless otherwise stated)
of the fair value of the embedded derivatives. The actuarial and capital market assumptions for each liability are approved by each product’s Chief Risk Officer (“CRO”), including an independent annual review by the U.S. CRO. Models used to value the embedded derivatives must comply with the Company’s governance policies.
Quarterly, an attribution analysis is performed to quantify changes in fair value measurements and a sensitivity analysis is used to analyze the changes. The changes in fair value measurements are also compared to corresponding movements in the hedge target to assess the validity of the attributions. The results of the attribution analysis are reviewed by the valuation actuaries, responsible CFOs, Controllers, CROs and/or others as nominated by management.
Embedded derivative on reinsurance: The carrying value of the embedded derivative is estimated based upon the change in the fair value of the assets supporting the funds withheld payable under reinsurance agreements between the Company and Hannover Re (Ireland) Plc. As the fair value of the assets held in trust is based on a quoted market price (Level 1), the fair value of the embedded derivative is based on market observable inputs and is classified as Level 2.
Transfers in and out of Level 1 and 2
There were no securities transferred between Level 1 and Level 2 for the years ended December 31, 2013 and 2012. The Company’s policy is to recognize transfers in and transfers out as of the beginning of the reporting period.
Level 3 Financial Instruments
The fair values of certain assets and liabilities are determined using prices or valuation techniques that require inputs that are both unobservable and significant to the overall fair value measurement (i.e., Level 3 as defined by ASC Topic 820), including but not limited to liquidity spreads for investments within markets deemed not currently active. These valuations, whether derived internally or obtained from a third party, use critical assumptions that are not widely available to estimate market participant expectations in valuing the asset or liability. In addition, the Company has determined, for certain financial instruments, an active market is such a significant input to determine fair value that the presence of an inactive market may lead to classification in Level 3. In light of the methodologies employed to obtain the fair values of financial assets and liabilities classified as Level 3, additional information is presented below.
F-59
Table of Contents
ING U.S., Inc.
Notes to the Consolidated Financial Statements
(Dollar amounts in millions, unless otherwise stated)
The following table summarizes the change in fair value of the Company’s Level 3 assets and liabilities and transfers in and out of Level 3 for the year ended December 31, 2013:
| Fair Value as of January 1 |
Total Realized/Unrealized Gains (Losses) Included in: |
Purchases | Issuances | Sales | Settlements | Transfers in to Level 3(2) |
Transfers out of Level 3(2) |
Fair Value as of December 31 |
Change In Unrealized Gains (Losses) Included in Earnings(3) |
|||||||||||||||||||||||||||||||||||
| Net Income |
OCI | |||||||||||||||||||||||||||||||||||||||||||
| Fixed maturities, including securities pledged: |
||||||||||||||||||||||||||||||||||||||||||||
| U.S. Government agencies and authorities |
$ | — | $ | — | $ | — | $ | 14.4 | $ | — | $ | — | $ | — | $ | — | $ | — | $ | 14.4 | $ | — | ||||||||||||||||||||||
| U.S. corporate, state and municipalities |
524.2 | (0.4 | ) | (3.3 | ) | 0.2 | — | (10.0 | ) | (49.8 | ) | 12.5 | (16.9 | ) | 456.5 | (0.3 | ) | |||||||||||||||||||||||||||
| Foreign |
104.2 | 0.2 | 10.0 | 61.0 | — | (4.8 | ) | (36.3 | ) | 20.0 | — | 154.3 | — | |||||||||||||||||||||||||||||||
| Residential mortgage-backed securities |
74.1 | (4.9 | ) | (4.4 | ) | 47.2 | — | (0.6 | ) | (0.4 | ) | — | (12.4 | ) | 98.6 | (5.0 | ) | |||||||||||||||||||||||||||
| Other asset-backed securities |
115.2 | 14.2 | (5.7 | ) | — | — | (8.0 | ) | (31.1 | ) | 0.3 | (25.7 | ) | 59.2 | 4.8 | |||||||||||||||||||||||||||||
|
|
|
|
|
|
|
|
|
|
|
|
|
|
|
|
|
|
|
|
|
|
|
|||||||||||||||||||||||
| Total fixed maturities including securities pledged |
817.7 | 9.1 | (3.4 | ) | 122.8 | — | (23.4 | ) | (117.6 | ) | 32.8 | (55.0 | ) | 783.0 | (0.5 | ) | ||||||||||||||||||||||||||||
| Equity securities, available-for-sale |
55.8 | (3.3 | ) | 0.9 | — | — | (0.2 | ) | — | 51.8 | (49.7 | ) | 55.3 | (1.9 | ) | |||||||||||||||||||||||||||||
| Derivatives: |
||||||||||||||||||||||||||||||||||||||||||||
| Product guarantees: |
||||||||||||||||||||||||||||||||||||||||||||
| FIA(1) |
(1,434.3 | ) | (276.5 | ) | — | — | (108.4 | ) | — | 82.5 | — | — | (1,736.7 | ) | — | |||||||||||||||||||||||||||||
| GMAB/GMWB/GMWBL(1) |
(2,035.4 | ) | 1,263.0 | — | — | (137.0 | ) | — | 0.5 | — | — | (908.9 | ) | — | ||||||||||||||||||||||||||||||
| Stabilizer and MCGs(1) |
(102.0 | ) | 108.2 | — | (6.2 | ) | — | — | — | — | — | — | — | |||||||||||||||||||||||||||||||
| Other derivatives, net |
22.9 | 102.6 | — | 27.6 | — | — | (72.8 | ) | — | — | 80.3 | 25.9 | ||||||||||||||||||||||||||||||||
| Assets held in separate accounts(4) |
16.3 | 0.1 | — | 16.0 | — | (11.6 | ) | — | 2.2 | (9.9 | ) | 13.1 | 0.1 | |||||||||||||||||||||||||||||||
| (1) | All gains and losses on Level 3 liabilities are classified as realized gains (losses) for the purpose of this disclosure because it is impracticable to track realized and unrealized gains (losses) separately on a contract-by contract basis. These amounts are included in Other net realized gains (losses) in the Consolidated Statements of Operations. |
| (2) | The Company’s policy is to recognize transfers in and transfers out as of the beginning of the reporting period. |
| (3) | For financial instruments still held as of December 31, amounts are included in Net investment income and Total net realized capital gains (losses) in the Consolidated Statements of Operations. |
| (4) | The investment income and realized gains (losses) and change in unrealized gains (losses) included in net income for separate account assets are offset by an equal amount for separate account liabilities, which result in a net zero impact on net income for the Company. |
F-60
Table of Contents
ING U.S., Inc.
Notes to the Consolidated Financial Statements
(Dollar amounts in millions, unless otherwise stated)
The following table summarizes the change in fair value of the Company’s Level 3 assets and liabilities and transfers in and out of Level 3 for the year ended December 31, 2012:
| Fair Value as of January 1 |
Total Realized/Unrealized Gains (Losses) Included in: |
Purchases | Issuances | Sales | Settlements | Transfers in to Level 3(2) |
Transfers out of Level 3(2) |
Fair Value as of December 31 |
Change In Unrealized Gains (Losses) Included in Earnings(3) |
|||||||||||||||||||||||||||||||||||
| Net Income |
OCI | |||||||||||||||||||||||||||||||||||||||||||
| Fixed maturities, including securities pledged: |
||||||||||||||||||||||||||||||||||||||||||||
| U.S. Government agencies and authorities |
$ | — | $ | — | $ | — | $ | — | $ | — | $ | — | $ | — | $ | — | $ | — | $ | — | $ | — | ||||||||||||||||||||||
| U.S. corporate, state and municipalities |
520.6 | 0.7 | (7.8 | ) | 0.5 | — | (3.1 | ) | (93.1 | ) | 142.7 | (36.3 | ) | 524.2 | 0.4 | |||||||||||||||||||||||||||||
| Foreign |
160.6 | 1.8 | (12.4 | ) | — | — | (11.5 | ) | (28.8 | ) | 79.4 | (84.9 | ) | 104.2 | — | |||||||||||||||||||||||||||||
| Residential mortgage-backed securities |
186.6 | 4.0 | 5.7 | 2.4 | — | (30.8 | ) | (1.2 | ) | 0.4 | (93.0 | ) | 74.1 | (3.6 | ) | |||||||||||||||||||||||||||||
| Other asset-backed securities |
104.5 | 15.6 | 4.3 | — | — | (32.8 | ) | (3.2 | ) | 27.9 | (1.1 | ) | 115.2 | 6.2 | ||||||||||||||||||||||||||||||
|
|
|
|
|
|
|
|
|
|
|
|
|
|
|
|
|
|
|
|
|
|
|
|||||||||||||||||||||||
| Total fixed maturities including securities pledged |
972.3 | 22.1 | (10.2 | ) | 2.9 | — | (78.2 | ) | (126.3 | ) | 250.4 | (215.3 | ) | 817.7 | 3.0 | |||||||||||||||||||||||||||||
| Equity securities, available-for-sale |
67.6 | (0.5 | ) | (1.2 | ) | 5.0 | — | (8.3 | ) | — | 2.4 | (9.2 | ) | 55.8 | (0.5 | ) | ||||||||||||||||||||||||||||
| Derivatives: |
||||||||||||||||||||||||||||||||||||||||||||
| Product guarantees: |
||||||||||||||||||||||||||||||||||||||||||||
| FIA(1) |
(1,304.9 | ) | (177.5 | ) | — | — | (94.5 | ) | — | 142.6 | — | — | (1,434.3 | ) | — | |||||||||||||||||||||||||||||
| GMAB/GMWB/GMWBL(1) |
(2,272.2 | ) | 390.3 | — | — | (154.1 | ) | — | 0.6 | — | — | (2,035.4 | ) | — | ||||||||||||||||||||||||||||||
| Stabilizer and MCGs(1) |
(221.0 | ) | 124.5 | — | (5.5 | ) | — | — | — | — | — | (102.0 | ) | — | ||||||||||||||||||||||||||||||
| Other derivatives, net |
(24.8 | ) | 4.2 | — | 23.9 | — | — | 25.0 | — | (5.4 | ) | 22.9 | (2.6 | ) | ||||||||||||||||||||||||||||||
| Assets held in separate accounts(4) |
16.1 | 0.3 | — | 16.3 | — | (8.3 | ) | — | — | (8.1 | ) | 16.3 | 0.6 | |||||||||||||||||||||||||||||||
| (1) | All gains and losses on Level 3 liabilities are classified as realized gains (losses) for the purpose of this disclosure because it is impracticable to track realized and unrealized gains (losses) separately on a contract-by contract basis. These amounts are included in Other net realized gains (losses) in the Consolidated Statements of Operations. |
| (2) | The Company’s policy is to recognize transfers in and transfers out as of the beginning of the reporting period. |
| (3) | For financial instruments still held as of December 31, amounts are included in Net investment income and Total net realized capital gains (losses) in the Consolidated Statements of Operations. |
| (4) | The investment income and realized gains (losses) and change in unrealized gains (losses) included in net income for separate account assets are offset by an equal amount for separate account liabilities, which result in a net zero impact on net income for the Company. |
F-61
Table of Contents
ING U.S., Inc.
Notes to the Consolidated Financial Statements
(Dollar amounts in millions, unless otherwise stated)
For the years ended December 31, 2013 and 2012, the transfers in and out of Level 3 for fixed maturities including securities pledged, equity securities and separate accounts, were due to the variation in inputs relied upon for valuation each quarter. Securities that are primarily valued using independent broker quotes when prices are not available from one of the commercial pricing services are reflected as transfers into Level 3. When securities are valued using more widely available information, the securities are transferred out of Level 3 and into Level 1 or 2, as appropriate.
The fair value of certain options and swap contracts were valued using observable inputs, and such options and swap contracts were transferred from Level 3 to Level 2 for the year ended December 31, 2012.
Significant Unobservable Inputs
Quantitative information about the significant unobservable inputs used in the Company’s Level 3 fair value measurements of its annuity product guarantees is presented in the following sections and table.
The Company’s Level 3 fair value measurements of its fixed maturities, equity securities available-for-sale and equity and credit derivative contracts are primarily based on broker quotes for which the quantitative detail of the unobservable inputs is neither provided nor reasonably corroborated, thus negating the ability to perform a sensitivity analysis. The Company performs a review of broker quotes by performing a monthly price variance comparison and back tests broker quotes to recent trade prices.
Significant unobservable inputs used in the fair value measurements of GMABs, GMWBs and GMWBLs include long-term equity and interest rate implied volatility, correlations between the rate of return on policyholder funds and between interest rates and equity returns, nonperformance risk, mortality and policyholder behavior assumptions, such as benefit utilization, lapses and partial withdrawals.
Significant unobservable inputs used in the fair value measurements of FIAs include nonperformance risk and lapses. Such inputs are monitored quarterly.
The significant unobservable inputs used in the fair value measurement of the Stabilizer embedded derivatives and MCG derivative are interest rate implied volatility, nonperformance risk, lapses and policyholder deposits. Such inputs are monitored quarterly.
Following is a description of selected inputs:
Equity / Interest Rate Volatility: A term-structure model is used to approximate implied volatility for the equity indices and swap rates for GMAB, GMWB and GMWBL fair value measurements and swap rates for the Stabilizer and MCG fair value measurements. Where no implied volatility is readily available in the market, an alternative approach is applied based on historical volatility.
Correlations: Integrated interest rate and equity scenarios are used in GMAB, GMWB and GMWBL fair value measurements to better reflect market interest rates and interest rate volatility correlations between equity and fixed income fund groups and between equity fund groups and interest rates. The correlations are based on historical fund returns and swap rates from external sources.
Nonperformance Risk: For the estimate of the fair value of embedded derivatives associated with the Company’s product guarantees, the Company uses a blend of observable, similarly rated peer company credit default swap spreads, adjusted to reflect the credit quality of the individual insurance company subsidiary that issued the guarantee and the priority of policyholder claims.
F-62
Table of Contents
ING U.S., Inc.
Notes to the Consolidated Financial Statements
(Dollar amounts in millions, unless otherwise stated)
Actuarial Assumptions: Management regularly reviews actuarial assumptions, which are based on the Company’s experience and periodically reviewed against industry standards. Industry standards and Company experience may be limited on certain products.
The following table presents the unobservable inputs for Level 3 fair value measurements as of December 31, 2013:
| Range(1) | ||||||||||||||||
| Unobservable Input |
GMWB / GMWBL |
GMAB | FIA | Stabilizer / MCG |
||||||||||||
| Long-term equity implied volatility |
15% to 25% | 15% to 25% | — | — | ||||||||||||
| Interest rate implied volatility |
0.2% to 16% | 0.2% to 16% | — | 0.2% to 8.0% | ||||||||||||
| Correlations between: |
||||||||||||||||
| Equity Funds |
50% to 98% | 50% to 98% | — | — | ||||||||||||
| Equity and Fixed Income Funds |
-33% to 62% | -33% to 62% | — | — | ||||||||||||
| Interest Rates and Equity Funds |
-30% to -14% | -30% to -14% | — | — | ||||||||||||
| Nonperformance risk |
-0.1% to 0.79% | -0.1% to 0.79% | -0.1% to 0.79% | -0.1% to 0.79% | ||||||||||||
| Actuarial Assumptions: |
||||||||||||||||
| Benefit Utilization |
85% to 100% | (2) | — | — | — | |||||||||||
| Partial Withdrawals |
0% to 10% | 0% to 10% | — | — | ||||||||||||
| Lapses |
0.08% to 40% | (3) | 0.08% to 31% | (3) | 0% to 10% | (3) | 0% to 55% | (4) | ||||||||
| Policyholder Deposits(5) |
— | — | — | 0% to 60% | (4) | |||||||||||
| Mortality |
— | (6) | — | (6) | — | — | ||||||||||
| (1) | Represents the range of reasonable assumptions that management has used in its fair value calculations. |
| (2) | Those policyholders who have elected systematic withdrawals are assumed to continue taking withdrawals. As a percent of account value, 30% are taking systematic withdrawals. Of those policyholders who are not taking withdrawals, we assume that 85% will begin systematic withdrawals after a delay period. The utilization function varies by policyholder age and policy duration. Interactions with lapse and mortality also affect utilization. The utilization rate for GMWB and GMWBL tends to be lower for younger contract owners and contracts that have not reached their maximum accumulated GMWB and GMWBL benefit amount. There is also a lower utilization rate, though indirectly, for contracts that are less “in the money” (i.e., where the notional benefit amount is in excess of the account value) due to higher lapses. Conversely, the utilization rate tends to be higher for contract owners near or beyond retirement age and contracts that have accumulated their maximum GMWB or GMWBL benefit amount. There is also a higher utilization rate, though indirectly, for contracts which are highly “in the money”. The chart below provides the GMWBL account value by current age group and average expected delay times from the associated attained age group as of December 31, 2013 (account value amounts are in $ billions). |
| Account Values | ||||||||||||||||
| Attained Age Group |
In the Money | Out of the Money | Total | Average Expected Delay (Years) |
||||||||||||
| < 60 |
$ | 2.1 | $ | 1.4 | $ | 3.5 | 5.4 | |||||||||
| 60-69 |
5.1 | 2.6 | 7.7 | 1.4 | ||||||||||||
| 70+ |
4.0 | 1.3 | 5.3 | 0.0 | * | |||||||||||
|
|
|
|
|
|
|
|
|
|||||||||
| $ | 11.2 | $ | 5.3 | $ | 16.5 | 2.3 | ||||||||||
|
|
|
|
|
|
|
|||||||||||
| * | Less than 0.1 |
F-63
Table of Contents
ING U.S., Inc.
Notes to the Consolidated Financial Statements
(Dollar amounts in millions, unless otherwise stated)
| (3) | Lapse rates tend to be lower during the contractual surrender charge period and higher after the surrender charge period ends; the highest lapse rates occur in the year immediately after the end of the surrender charge period. The Company makes dynamic adjustments to lower the lapse rates for contracts that are more “in the money.” The table below shows an analysis of policy account values according to whether they are in or out of the surrender charge period and to whether they are “in the money” or “out of the money” as of December 31, 2013 (account value amounts are in $ billions). |
| GMAB | GMWB/GMWBL | |||||||||||||
| Moneyness |
Account Value |
Lapse Range |
Account Value |
Lapse Range | ||||||||||
| During Surrender Charge Period |
||||||||||||||
| In the Money** | $ | — | * | 0.08% to 8.2% | $ | 5.7 | 0.08% to 5.5% | |||||||
| Out of the Money | — | * | 0.41% to 12% | 3.3 | 0.36% to 11% | |||||||||
| After Surrender Charge Period |
||||||||||||||
| In the Money** | — | * | 2.5% to 21% | 5.6 | 1.5% to 21% | |||||||||
| Out of the Money | 0.1 | 12% to 31% | 2.8 | 6.9% to 40% | ||||||||||
| * | Less than $0.1 |
| ** | The low end of the range corresponds to policies that are highly “in the money.” The high end of the range corresponds to the policies that are close to zero in terms of “in the moneyness.” |
| (4) | Stabilizer contracts with recordkeeping agreements have a different range of lapse and policyholder deposit assumptions from Stabilizer (Investment only) and MCG contracts as shown below: |
| Percentage of Plans |
Overall Range of Lapse Rates |
Range of Lapse Rates for 85% of Plans |
Overall Range of Policyholder Deposits |
Range of Policyholder Deposits for 85% of Plans |
||||||||||||||||
| Stabilizer (Investment Only) and MCG Contracts |
88 | % | 0-30 | % | 0-15 | % | 0-55 | % | 0-15 | % | ||||||||||
| Stabilizer with Recordkeeping Agreements |
12 | % | 0-55 | % | 0-25 | % | 0-60 | % | 0-30 | % | ||||||||||
| Aggregate of all plans |
100 | % | 0-55 | % | 0-25 | % | 0-60 | % | 0-30 | % | ||||||||||
| (5) | Measured as a percentage of assets under management or assets under administration. |
| (6) | The mortality rate is based on the Annuity 2000 Basic table with mortality improvements. |
F-64
Table of Contents
ING U.S., Inc.
Notes to the Consolidated Financial Statements
(Dollar amounts in millions, unless otherwise stated)
The following table presents the unobservable inputs for Level 3 fair value measurements as of December 31, 2012:
| Range(1) | ||||||||||||||||
| Unobservable Input |
GMWB / GMWBL |
GMAB | FIA | Stabilizer / MCG | ||||||||||||
| Long-term equity implied volatility |
15% to 25 | % | 15% to 25 | % | — | — | ||||||||||
| Interest rate implied volatility |
0.1% to 19 | % | 0.1% to 19 | % | — | 0.1% to 7.6 | % | |||||||||
| Correlations between: |
||||||||||||||||
| Equity Funds |
50% to 98 | % | 50% to 98 | % | — | — | ||||||||||
| Equity and Fixed Income Funds |
-40% to 65 | % | -40% to 65 | % | — | — | ||||||||||
| Interest Rates and Equity Funds |
-25% to -16 | % | -25% to -16 | % | — | — | ||||||||||
| Nonperformance risk |
0.1% to 1.3 | % | 0.1% to 1.3 | % | 0.1% to 1.3 | % | 0.1% to 1.3 | % | ||||||||
| Actuarial Assumptions: |
||||||||||||||||
| Benefit Utilization |
85% to 100 | %(2) | — | — | — | |||||||||||
| Partial Withdrawals |
0% to 10 | % | 0% to 10 | % | — | — | ||||||||||
| Lapses |
0.08% to 32 | %(3) | 0.08% to 31 | %(3) | 0% to 10 | %(3) | 0% to 55 | %(4) | ||||||||
| Policyholder Deposits(5) |
— | — | — | 0% to 60 | %(4) | |||||||||||
| Mortality |
— | (6) | — | (6) | — | — | ||||||||||
| (1) | Represents the range of reasonable assumptions that management has used in its fair value calculations. |
| (2) | Those policyholders who have elected systematic withdrawals are assumed to continue taking withdrawals. As a percent of account value, 26% are taking systematic withdrawals. Of those policyholders who are not taking withdrawals, we assume that 85% will begin systematic withdrawals after a delay period. The utilization function varies by policyholder age and policy duration. Interactions with lapse and mortality also affect utilization. The utilization rate for GMWB and GMWBL tends to be lower for younger contract owners and contracts that have not reached their maximum accumulated GMWB and GMWBL benefit amount. There is also a lower utilization rate, though indirectly, for contracts that are less “in the money” (i.e., where the notional benefit amount is in excess of the account value) due to higher lapses. Conversely, the utilization rate tends to be higher for contract owners near or beyond retirement age and contracts that have accumulated their maximum GMWB or GMWBL benefit amount. There is also a higher utilization rate, though indirectly, for contracts which are highly “in the money”. The chart below provides the GMWBL account value by current age group and average expected delay times from the associated attained age group as of December 31, 2012 (account value amounts are in $ billions). |
| Account Values | ||||||||||||||||
| Attained Age Group |
In the Money | Out of the Money | Total | Average Expected Delay (Years) |
||||||||||||
| < 60 |
$ | 3.5 | $ | 0.3 | $ | 3.8 | 5.5 | |||||||||
| 60-69 |
7.0 | 0.4 | 7.4 | 1.9 | ||||||||||||
| 70+ |
4.3 | 0.1 | 4.4 | 0.2 | ||||||||||||
|
|
|
|
|
|
|
|
|
|||||||||
| $ | 14.8 | $ | 0.8 | $ | 15.6 | 2.8 | ||||||||||
|
|
|
|
|
|
|
|||||||||||
| (3) | Lapse rates tend to be lower during the contractual surrender charge period and higher after the surrender charge period ends; the highest lapse rates occur in the year immediately after the end of the surrender charge period. The Company makes dynamic adjustments to lower the lapse rates for contracts that are more |
F-65
Table of Contents
ING U.S., Inc.
Notes to the Consolidated Financial Statements
(Dollar amounts in millions, unless otherwise stated)
| “in the money.” The table below shows an analysis of policy account values according to whether they are in or out of the surrender charge period and to whether they are “in the money” or “out of the money” as of December 31, 2012 (account value amounts are in $ billions): |
| GMAB | GMWB/GMWBL | |||||||||||||
| Moneyness |
Account Value |
Lapse Range |
Account Value |
Lapse Range | ||||||||||
| During Surrender Charge Period |
||||||||||||||
| In the Money** |
$ | — | * | 0.08% to 8.2% | $ | 8.8 | 0.08% to 5.8% | |||||||
| Out of the Money | — | * | 0.41% to 12% | 0.9 | 0.35% to 12% | |||||||||
| After Surrender Charge Period |
||||||||||||||
| In the Money** |
$ | — | * | 2.4% to 22% | $ | 6.2 | 1.5% to 17% | |||||||
| Out of the Money |
0.1 | 12% to 31% | 0.6 | 6.9% to 32% | ||||||||||
| * | Less than $0.1. |
| ** | The low end of the range corresponds to policies that are highly “in the money.” The high end of the range corresponds to the policies that are close to zero in terms of “in the moneyness.” |
| (4) | Stabilizer contracts with recordkeeping agreements have a different range of lapse and policyholder deposit assumptions from Stabilizer (Investment only) and MCG contracts as shown below: |
| Percentage of Plans |
Overall Range of Lapse Rates |
Range of Lapse Rates for 85% of Plans |
Overall Range of Policyholder Deposits |
Range of Policyholder Deposits for 85% of Plans |
||||||||||||||||
| Stabilizer (Investment Only) and MCG Contracts |
87 | % | 0-30 | % | 0-15 | % | 0-55 | % | 0-20 | % | ||||||||||
| Stabilizer with Recordkeeping Agreements |
13 | % | 0-55 | % | 0-25 | % | 0-60 | % | 0-30 | % | ||||||||||
| Aggregate of all plans |
100 | % | 0-55 | % | 0-25 | % | 0-60 | % | 0-30 | % | ||||||||||
| (5) | Measured as a percentage of assets under management or assets under administration. |
| (6) | The mortality rate is based on the Annuity 2000 Basic table with mortality improvements. |
Generally, the following will cause an increase (decrease) in the GMAB, GMWB and GMWBL embedded derivative fair value liabilities:
| • | An increase (decrease) in long-term equity implied volatility |
| • | An increase (decrease) in interest rate implied volatility |
| • | An increase (decrease) in equity-interest rate correlations |
| • | A decrease (increase) in nonperformance risk |
| • | A decrease (increase) in mortality |
| • | An increase (decrease) in benefit utilization |
| • | A decrease (increase) in lapses |
Changes in fund correlations may increase or decrease the fair value depending on the direction of the movement and the mix of funds. Changes in partial withdrawals may increase or decrease the fair value depending on the timing and magnitude of withdrawals.
F-66
Table of Contents
ING U.S., Inc.
Notes to the Consolidated Financial Statements
(Dollar amounts in millions, unless otherwise stated)
Generally, the following will cause an increase (decrease) in the FIA embedded derivative fair value liability:
| • | A decrease (increase) in nonperformance risk |
| • | A decrease (increase) in lapses |
Generally, the following will cause an increase (decrease) in the derivative and embedded derivative fair value liabilities related to Stabilizer and MCG contracts:
| • | An increase (decrease) in interest rate implied volatility |
| • | A decrease (increase) in nonperformance risk |
| • | A decrease (increase) in lapses |
| • | A decrease (increase) in policyholder deposits |
The Company notes the following interrelationships:
| • | Higher long-term equity implied volatility is often correlated with lower equity returns, which will result in higher in-the-moneyness, which in turn, results in lower lapses due to the dynamic lapse component reducing the lapses. This increases the projected number of policies that are available to use the GMWBL benefit and may also increase the fair value of the GMWBL. |
| • | Generally, an increase (decrease) in benefit utilization will decrease (increase) lapses for GMWB and GMWBL. |
| • | Generally, an increase (decrease) in interest rate volatility will increase (decrease) lapses of Stabilizer and MCG contracts due to dynamic participant behavior. |
F-67
Table of Contents
ING U.S., Inc.
Notes to the Consolidated Financial Statements
(Dollar amounts in millions, unless otherwise stated)
Other Financial Instruments
The carrying values and estimated fair values of the Company’s financial instruments as of the dates indicated:
| December 31, 2013 | December 31, 2012 | |||||||||||||||
| Carrying Value |
Fair Value |
Carrying Value |
Fair Value |
|||||||||||||
| Assets: |
||||||||||||||||
| Fixed maturities, including securities pledged |
$ | 72,718.8 | $ | 72,718.8 | $ | 75,287.1 | $ | 75,287.1 | ||||||||
| Equity securities, available-for-sale |
314.4 | 314.4 | 340.1 | 340.1 | ||||||||||||
| Mortgage loans on real estate |
9,312.2 | 9,404.7 | 8,662.3 | 8,954.8 | ||||||||||||
| Policy loans |
2,147.0 | 2,147.0 | 2,200.3 | 2,200.3 | ||||||||||||
| Limited partnerships/corporations |
236.4 | 236.4 | 465.1 | 465.1 | ||||||||||||
| Cash, cash equivalents, short-term investments and short-term investments under securities loan agreements |
4,441.8 | 4,441.8 | 8,442.0 | 8,442.0 | ||||||||||||
| Derivatives |
1,149.3 | 1,149.3 | 2,374.5 | 2,374.5 | ||||||||||||
| Other investments |
124.6 | 131.1 | 167.0 | 173.7 | ||||||||||||
| Assets held in separate accounts |
106,827.1 | 106,827.1 | 97,667.4 | 97,667.4 | ||||||||||||
| Liabilities: |
||||||||||||||||
| Investment contract liabilities: |
||||||||||||||||
| Funding agreements without fixed maturities and deferred annuities(1) |
49,418.4 | 53,713.8 | 50,133.7 | 56,851.0 | ||||||||||||
| Funding agreements with fixed maturities and guaranteed investment contracts |
2,692.3 | 2,663.9 | 3,784.0 | 3,671.0 | ||||||||||||
| Supplementary contracts, immediate annuities and other |
3,383.6 | 3,567.3 | 3,109.2 | 3,482.3 | ||||||||||||
| Derivatives: |
||||||||||||||||
| Annuity product guarantees: |
||||||||||||||||
| FIA |
1,736.7 | 1,736.7 | 1,434.3 | 1,434.3 | ||||||||||||
| GMAB / GMWB / GMWBL |
908.9 | 908.9 | 2,035.4 | 2,035.4 | ||||||||||||
| Stabilizer and MCGs |
— | — | 102.0 | 102.0 | ||||||||||||
| Other derivatives |
1,351.8 | 1,351.8 | 1,944.2 | 1,944.2 | ||||||||||||
| Short-term debt |
— | — | 1,064.6 | 1,070.6 | ||||||||||||
| Long-term debt |
3,514.7 | 3,717.8 | 3,171.1 | 3,386.2 | ||||||||||||
| Embedded derivatives on reinsurance |
79.0 | 79.0 | 169.5 | 169.5 | ||||||||||||
| (1) | Certain amounts included in Funding agreements without fixed maturities and deferred annuities are also reflected within the Annuity product guarantees section of the table above. |
The following disclosures are made in accordance with the requirements of ASC Topic 825 which requires disclosure of fair value information about financial instruments, whether or not recognized at fair value on the Consolidated Balance Sheets, for which it is practicable to estimate that value. In cases where quoted market prices are not available, fair values are based on estimates using present value or other valuation techniques. Those techniques are significantly affected by the assumptions used, including the discount rate and estimates of future cash flows. In that regard, the derived fair value estimates, in many cases, could not be realized in immediate settlement of the instrument.
F-68
Table of Contents
ING U.S., Inc.
Notes to the Consolidated Financial Statements
(Dollar amounts in millions, unless otherwise stated)
ASC Topic 825 excludes certain financial instruments, including insurance contracts and all nonfinancial instruments from its disclosure requirements. Accordingly, the aggregate fair value amounts presented do not represent the underlying value of the Company.
The following valuation methods and assumptions were used by the Company in estimating the fair value of the following financial instruments, which are not carried at fair value on the Consolidated Balance Sheets:
Mortgage loans on real estate: The fair values for mortgage loans on real estate are estimated on a monthly basis using discounted cash flow analyses and rates currently being offered in the marketplace for similar loans to borrowers with similar credit ratings. Loans with similar characteristics are aggregated for purposes of the calculations. Mortgage loans on real estate are classified as Level 3.
Policy loans: The fair value of policy loans approximates the carrying value of the loans. Policy loans are collateralized by the cash surrender value of the associated insurance contracts and are classified as Level 2.
Limited partnerships/corporations: The fair value for these investments, primarily private equity fund of funds and hedge funds, is based on actual or estimated Net Asset Value (“NAV”) information, as provided by the investee and are classified as Level 3.
Other investments: Federal Home Loan Bank (“FHLB”) stock is carried at cost and periodically evaluated for impairment based on ultimate recovery of par value and is classified as Level 1.
Investment contract liabilities:
Funding agreements without a fixed maturity and deferred annuities: Fair value is estimated as the mean present value of stochastically modeled cash flows associated with the contract liabilities taking into account assumptions about contract holder behavior. The stochastic valuation scenario set is consistent with current market parameters and discount is taken using stochastically evolving risk-free rates in the scenarios plus an adjustment for nonperformance risk. Margins for non-financial risks associated with the contract liabilities are also included. These liabilities are classified as Level 3.
Funding agreements with a fixed maturity and guaranteed investment contracts: Fair value is estimated by discounting cash flows, including associated expenses for maintaining the contracts, at rates, that are risk-free rates plus an adjustment for nonperformance risk. These liabilities are classified as Level 2.
Supplementary contracts and immediate annuities: Fair value is estimated as the mean present value of the single deterministically modeled cash flows associated with the contract liabilities discounted using stochastically evolving short risk-free rates in the scenarios plus an adjustment for nonperformance risk. The valuation is consistent with current market parameters. Margins for non-financial risks associated with the contract liabilities are also included. These liabilities are classified as Level 3.
Short-term debt and Long-term debt: Estimated fair value of the Company’s short-term and long-term debt is based upon discounted future cash flows using a discount rate approximating the current market rate, incorporating nonperformance risk. Short-term debt is classified as Level 1 and Level 2 and long-term debt is classified as Level 2.
Fair value estimates are made at a specific point in time, based on available market information and judgments about various financial instruments, such as estimates of timing and amounts of future cash flows. Such estimates do not reflect any premium or discount that could result from offering for sale at one time the Company’s entire
F-69
Table of Contents
ING U.S., Inc.
Notes to the Consolidated Financial Statements
(Dollar amounts in millions, unless otherwise stated)
holdings of a particular financial instrument, nor do they consider the tax impact of the realization of unrealized capital gains (losses). In many cases, the fair value estimates cannot be substantiated by comparison to independent markets, nor can the disclosed value be realized in immediate settlement of the instruments. In evaluating the Company’s management of interest rate, price and liquidity risks, the fair values of all assets and liabilities should be taken into consideration, not only those presented above.
5. Deferred Policy Acquisition Costs and Value of Business Acquired
Activity within DAC and VOBA was as follows for the years ended December 31, 2013, 2012 and 2011:
| DAC | VOBA | Total | ||||||||||
| Balance at January 1, 2011 |
$ | 3,810.6 | $ | 1,227.7 | $ | 5,038.3 | ||||||
| Deferrals of commissions and expenses |
633.6 | 18.7 | 652.3 | |||||||||
| Amortization: |
||||||||||||
| Amortization |
(459.5 | ) | (265.8 | ) | (725.3 | ) | ||||||
| Interest accrued(1) |
238.2 | 100.1 | 338.3 | |||||||||
|
|
|
|
|
|
|
|||||||
| Net amortization included in Consolidated Statements of Operations |
(221.3 | ) | (165.7 | ) | (387.0 | ) | ||||||
| Change in unrealized capital gains/losses on available-for-sale securities |
(556.0 | ) | (395.3 | ) | (951.3 | ) | ||||||
|
|
|
|
|
|
|
|||||||
| Balance at December 31, 2011 |
3,666.9 | 685.4 | 4,352.3 | |||||||||
|
|
|
|
|
|
|
|||||||
| Deferrals of commissions and expenses |
590.3 | 17.3 | 607.6 | |||||||||
| Amortization: |
||||||||||||
| Amortization |
(846.4 | ) | (210.3 | ) | (1,056.7 | ) | ||||||
| Interest accrued(1) |
243.6 | 90.8 | 334.4 | |||||||||
|
|
|
|
|
|
|
|||||||
| Net amortization included in Consolidated Statements of Operations |
(602.8 | ) | (119.5 | ) | (722.3 | ) | ||||||
| Change in unrealized capital gains/losses on available-for-sale securities |
(432.8 | ) | (148.5 | ) | (581.3 | ) | ||||||
|
|
|
|
|
|
|
|||||||
| Balance at December 31, 2012 |
3,221.6 | 434.7 | 3,656.3 | |||||||||
|
|
|
|
|
|
|
|||||||
| Deferrals of commissions and expenses |
395.8 | 13.7 | 409.5 | |||||||||
| Amortization: |
||||||||||||
| Amortization |
(669.0 | ) | (98.1 | ) | (767.1 | ) | ||||||
| Interest accrued(1) |
233.9 | 90.4 | 324.3 | |||||||||
|
|
|
|
|
|
|
|||||||
| Net amortization included in Consolidated Statements of Operations |
(435.1 | ) | (7.7 | ) | (442.8 | ) | ||||||
| Change in unrealized capital gains/losses on available-for-sale securities |
1,133.8 | 594.8 | 1,728.6 | |||||||||
|
|
|
|
|
|
|
|||||||
| Balance at December 31, 2013 |
$ | 4,316.1 | $ | 1,035.5 | $ | 5,351.6 | ||||||
|
|
|
|
|
|
|
|||||||
| (1) | Interest accrued at the following rates for DAC: 0.8% to 7.4% during 2013, 1.5% to 7.4% during 2012, and 2.0% to 8.0% during 2011. Interest accrued at the following rates for VOBA: 3.0% to 7.5% during 2013, 2.0% to 7.4% during 2012, and 3.0% to 7.0% during 2011. |
F-70
Table of Contents
ING U.S., Inc.
Notes to the Consolidated Financial Statements
(Dollar amounts in millions, unless otherwise stated)
The estimated amount of VOBA amortization expense, net of interest, is presented in the following table. Actual amortization incurred during these years may vary as assumptions are modified to incorporate actual results and/or changes in best estimates of future results.
| Year |
Amount | |||
| 2014 |
$ | 105.9 | ||
| 2015 |
93.0 | |||
| 2016 |
82.7 | |||
| 2017 |
78.6 | |||
| 2018 |
74.4 | |||
6. Reserves for Future Policy Benefits and Contract Owner Account Balances
Future policy benefits and contract owner account balances were as follows as of December 31, 2013 and 2012:
| 2013 | 2012 | |||||||
| Future policy benefits: |
||||||||
| Individual and group life insurance contracts |
$ | 8,253.9 | $ | 8,132.4 | ||||
| Guaranteed benefits on annuity contracts, and payout contracts with life contingencies |
4,931.7 | 6,371.5 | ||||||
| Accident and health |
912.8 | 989.7 | ||||||
|
|
|
|
|
|||||
| Total |
$ | 14,098.4 | $ | 15,493.6 | ||||
|
|
|
|
|
|||||
| Contract owner account balances: |
||||||||
| GICs |
$ | 2,581.9 | $ | 3,642.8 | ||||
| Universal life type contracts |
16,851.5 | 16,915.0 | ||||||
| Fixed annuities and payout contracts without life contingencies |
37,563.5 | 37,577.2 | ||||||
| Fixed indexed annuities |
12,911.4 | 12,427.1 | ||||||
|
|
|
|
|
|||||
| Total |
$ | 69,908.3 | $ | 70,562.1 | ||||
|
|
|
|
|
|||||
7. Guaranteed Benefit Features
While the Company ceased new sales of certain retail variable annuity products in 2010, its currently-sold retail variable annuity contracts with separate account options guarantee the contract owner a return of no less than (i) total deposits made to the contract less any partial withdrawals, (ii) total deposits made to the contract less any partial withdrawals plus a minimum return, or (iii) the highest contract value on a specified date minus any withdrawals. These guarantees include benefits that are payable in the event of death, annuitization or at specified dates.
The Company also issues variable life, UL and VUL contracts where the Company contractually guarantees to the contract owner a death benefit even when there is insufficient value to cover monthly mortality and expense charges, whereas otherwise the contract would typically lapse (“no lapse guarantee”).
In addition, the Company’s Stabilizer and MCG products have guaranteed credited rates. Credited rates are set either quarterly or annually. Most contracts have a zero percent minimum credited rate guarantee, although some contracts have minimum credited rate guarantees up to 3% and allow the contract holder to select either the
F-71
Table of Contents
ING U.S., Inc.
Notes to the Consolidated Financial Statements
(Dollar amounts in millions, unless otherwise stated)
market value of the account or the book value of the account at termination. The book value of the account is equal to deposits plus interest, less any withdrawals. The fair value is estimated using the income approach.
The Company also offers optional guaranteed withdrawal benefit provisions on its indexed annuity products. This provision guarantees an annual withdrawal amount for life that is calculated as a percentage of the benefit base, which equals premium paid at the time of product issue, and can increase by a rollup percentage (mainly 7% or 6%, depending on versions of the benefit) or annual ratchet. The percentage used to determine the guaranteed annual withdrawal amount may vary by age at first withdrawal and depends on whether the benefit is for a single, or joint lives.
The Company’s major source of income from guaranteed benefit features is the base contract mortality, expense, and guaranteed death and living benefit rider fees charged to the contract owner, less the costs of administering the product and providing for the guaranteed death and living benefits.
The Company’s retail variable annuity contracts offer one or more of the following guaranteed death and living benefits:
Guaranteed Minimum Death Benefits (GMDB).
| • | Standard. Guarantees that, upon the death of the individual specified in the policy, the death benefit will be no less than the premiums paid by the customer, adjusted for withdrawals. |
| • | Ratchet. Guarantees that, upon the death of the individual specified in the policy, the death benefit will be no less than the greater of (1) Standard or (2) the maximum policy anniversary (or quarterly) value of the variable annuity, adjusted for withdrawals. |
| • | Rollup. Guarantees that, upon the death of the individual specified in the policy, the death benefit will be no less than the aggregate premiums paid by the contract owner, with interest at the contractual rate per annum, adjusted for withdrawals. The Rollup may be subject to a maximum cap on the total benefit. |
| • | Combo. Guarantees that, upon the death of the individual specified in the policy, the death benefit will be no less than the greater of (1) Ratchet or (2) Rollup. |
Guaranteed Minimum Living Benefits
Guaranteed Minimum Income Benefit (GMIB). Guarantees a minimum income payout, exercisable only on a contract anniversary on or after a specified date, in most cases 10 years after purchase of the GMIB rider. The income payout is determined based on contractually established annuity factors multiplied by the benefit base. The benefit base equals the premium paid at the time of product issue and may increase over time based on a number of factors, including a rollup percentage (mainly 7% or 6% depending on the version of the benefit) and ratchet frequency subject to maximum caps which vary by product version (200%, 250% or 300% of initial premium).
Guaranteed Minimum Withdrawal Benefit and Guaranteed Minimum Withdrawal Benefit for Life (GMWB/GMWBL). Guarantees an annual withdrawal amount for a specified period of time (GMWB) or life (GMWBL) that is calculated as a percentage of the benefit base that equals premium paid at the time of product issue and may increase over time based on a number of factors, including a rollup percentage (mainly 7%, 6% or 0%, depending on versions of the benefit) and ratchet frequency (primarily annually or quarterly, depending on versions). The percentage used to determine the guaranteed annual withdrawal amount may vary by age at first withdrawal and depends on versions of the benefit. A joint life-time withdrawal benefit option was available to
F-72
Table of Contents
ING U.S., Inc.
Notes to the Consolidated Financial Statements
(Dollar amounts in millions, unless otherwise stated)
include coverage for spouses. Most versions of the withdrawal benefit included reset and/or step-up features that may increase the guaranteed withdrawal amount in certain conditions. Earlier versions of the withdrawal benefit guarantee that annual withdrawals of up to 7.0% of eligible premiums may be made until eligible premiums previously paid by the contract owner are returned, regardless of account value performance. Asset allocation requirements apply at all times where withdrawals are guaranteed for life.
Guaranteed Minimum Accumulation Benefit (GMAB). Guarantees that the account value will be at least 100% of the eligible premiums paid by the customer after 10 years, adjusted for withdrawals. We offered an alternative design that guaranteed the account value to be at least 200% of the eligible premiums paid by contract owners after 20 years.
The following assumptions and methodologies were used to determine the guaranteed reserves for retail variable annuity contracts at December 31, 2013 and 2012:
| Area |
Assumptions/Basis for Assumptions | |
| Data used |
Based on 1,000 investment performance scenarios. | |
| Mean investment performance |
GMDB: The mean investment performance varies by fund group. In general, the Company groups all separate account returns into 6 fund groups, and generate stochastic returns for each of these fund groups. The overall blended mean separate account return is 8.1%. The general account fixed portion is a small percentage of the overall total. | |
| GMIB: the overall blended mean is 8.1% based on a single fund group | ||
| GMAB/GMWB/GMWBL: Zero rate curve | ||
| Volatility |
GMDB: 15.8% for 2013 and 2012 | |
| GMIB: 15.8% for 2013 and 2012 | ||
| GMAB/GMWB/GMWBL: Implied volatilities through the first 5 years and then a blend of implied and historical thereafter. | ||
| Mortality |
Depending on the type of benefit and gender, the Company uses the Annuity 2000 basic table with mortality improvement through 2013, further adjusted for company experience. | |
| Lapse rates |
Vary by contract type, share class, time remaining in the surrender charge period and in-the-moneyness. | |
| Discount rates |
GMDB/GMIB: 5.5% for 2013 and 2012. | |
| GMAB/GMWB/GMWBL: Zero rate curve plus adjustment for nonperformance risk. | ||
Variable annuity contracts containing guaranteed minimum death and living benefits expose the Company to equity risk. With a decline in the equity markets, the Company has exposure to increasing claims due to the guaranteed minimum benefits. On the other hand, with an increase in the equity markets, the Company’s exposure to risks associated with the guaranteed minimum benefits generally decreases. In order to mitigate the risk associated with guaranteed death and living benefits, the Company enters into reinsurance agreements and derivative positions on various public market indices chosen to closely replicate contract owner variable fund returns.
F-73
Table of Contents
ING U.S., Inc.
Notes to the Consolidated Financial Statements
(Dollar amounts in millions, unless otherwise stated)
The calculation of the GMDB, GMIB, GMAB, GMWB, and GMWBL liabilities assumes dynamic surrenders and dynamic utilization of the guaranteed living benefit feature.
The liabilities for UL and VUL contracts, as well as variable annuity contracts containing guaranteed minimum death and living benefits, are recorded in separate account liabilities as follows as of December 31, 2013 and 2012. The separate account liabilities may include more than one type of guarantee. These liabilities are subject to the requirements for additional reserve liabilities under ASC Topic 944, which are recorded on the Consolidated Balance Sheets in Future policy benefits and Contract owner account balances. The paid and incurred amounts were as follows for the years ended December 31, 2013, 2012 and 2011:
| Variable Life and Universal Life |
GMDB | GMAB/ GMWB |
GMIB | GMWBL | Stabilizer and MCGs(1) |
|||||||||||||||||||
| Separate account liability at December 31, 2013 |
$ | 563.1 | $ | 44,239.7 | $ | 940.6 | $ | 15,894.1 | $ | 16,516.8 | $ | 36,858.1 | ||||||||||||
|
|
|
|
|
|
|
|
|
|
|
|
|
|||||||||||||
| Separate account liability at December 31, 2012 |
$ | 517.4 | $ | 41,932.5 | $ | 1,027.3 | $ | 14,881.3 | $ | 15,587.8 | $ | 34,150.7 | ||||||||||||
|
|
|
|
|
|
|
|
|
|
|
|
|
|||||||||||||
| Additional liability balance: |
||||||||||||||||||||||||
| Balance at January 1, 2011 |
$ | 1,230.5 | $ | 378.4 | $ | 85.5 | $ | 769.3 | $ | 414.8 | $ | 3.0 | ||||||||||||
| Incurred guaranteed benefits |
589.6 | 258.7 | 44.8 | 586.3 | 1,729.2 | 218.0 | ||||||||||||||||||
| Paid guaranteed benefits |
(312.9 | ) | (106.8 | ) | (2.1 | ) | (65.4 | ) | — | — | ||||||||||||||
|
|
|
|
|
|
|
|
|
|
|
|
|
|||||||||||||
| Balance at December 31, 2011 |
1,507.2 | 530.3 | 128.2 | 1,290.2 | 2,144.0 | 221.0 | ||||||||||||||||||
|
|
|
|
|
|
|
|
|
|
|
|
|
|||||||||||||
| Incurred guaranteed benefits |
512.6 | 89.2 | (42.7 | ) | (5.4 | ) | (193.5 | ) | (119.0 | ) | ||||||||||||||
| Paid guaranteed benefits |
(348.6 | ) | (118.8 | ) | (0.6 | ) | (38.7 | ) | — | — | ||||||||||||||
|
|
|
|
|
|
|
|
|
|
|
|
|
|||||||||||||
| Balance at December 31, 2012 |
1,671.2 | 500.7 | 84.9 | 1,246.1 | 1,950.5 | 102.0 | ||||||||||||||||||
|
|
|
|
|
|
|
|
|
|
|
|
|
|||||||||||||
| Incurred guaranteed benefits |
442.5 | (59.5 | ) | (52.7 | ) | (144.6 | ) | (1,073.3 | ) | (102.0 | ) | |||||||||||||
| Paid guaranteed benefits |
(369.2 | ) | (90.5 | ) | (0.5 | ) | (32.1 | ) | — | — | ||||||||||||||
|
|
|
|
|
|
|
|
|
|
|
|
|
|||||||||||||
| Balance at December 31, 2013 |
$ | 1,744.5 | $ | 350.7 | $ | 31.7 | $ | 1,069.4 | $ | 877.2 | $ | — | ||||||||||||
|
|
|
|
|
|
|
|
|
|
|
|
|
|||||||||||||
| (1) | The Separate account liability at December 31, 2013 and 2012 includes $28.7 billion and $25.9 billion, respectively, of externally managed assets, which are not reported on the Company’s Consolidated Balance Sheets. |
The Company also calculates additional liabilities for FIA contracts with guaranteed withdrawal benefits. The additional liability represents the expected value of these benefits in excess of the projected account balance, and is accreted based on assessments over the accumulation period of the contract. The additional liability for FIA guaranteed withdrawal benefits was $35.1 and $22.8, as of December 31, 2013 and 2012, respectively. The additional liability is recorded in Future policy benefits on the Consolidated Balance Sheets.
The net amount at risk for the GMDB, GMAB and GMWB benefits is equal to the guaranteed value of these benefits in excess of the account values.
F-74
Table of Contents
ING U.S., Inc.
Notes to the Consolidated Financial Statements
(Dollar amounts in millions, unless otherwise stated)
The net amount at risk for the GMIB and GMWBL benefits is equal to the excess of the present value of the minimum guaranteed annuity payments available to the contract owner over the current account value.
The separate account values, net amount at risk, net of reinsurance, and the weighted average attained age of contract owners by type of minimum guaranteed benefit for retail variable annuity contracts were as follows as of December 31, 2013 and 2012:
| 2013 | ||||||||||||||||
| In the Event of Death | At Annuitization, Maturity, or Withdrawal | |||||||||||||||
| GMDB | GMAB/ GMWB |
GMIB | GMWBL | |||||||||||||
| Annuity Contracts: |
||||||||||||||||
| Minimum Return or Contract Value |
||||||||||||||||
| Separate account value |
$ | 44,239.7 | $ | 940.6 | $ | 15,894.1 | $ | 16,516.8 | ||||||||
| Net amount at risk, net of reinsurance |
$ | 5,074.2 | $ | 20.4 | $ | 1,681.8 | $ | 452.3 | ||||||||
| Weighted average attained age |
70 | 70 | 62 | 66 | ||||||||||||
| 2012 | ||||||||||||||||
| In the Event of Death | At Annuitization, Maturity, or Withdrawal | |||||||||||||||
| GMDB | GMAB/ GMWB |
GMIB | GMWBL | |||||||||||||
| Annuity Contracts: |
||||||||||||||||
| Minimum Return or Contract Value |
||||||||||||||||
| Separate account value |
$ | 41,932.5 | $ | 1,027.3 | $ | 14,881.3 | $ | 15,587.8 | ||||||||
| Net amount at risk, net of reinsurance |
$ | 7,029.1 | $ | 42.4 | $ | 3,576.0 | $ | 1,702.5 | ||||||||
| Weighted average attained age |
69 | 69 | 61 | 65 | ||||||||||||
The net amount at risk for the secondary guarantees is equal to the current death benefit in excess of the account values.
The separate account values, net amount at risk, net of reinsurance, and the weighted average attained age of contract owners by type of minimum guaranteed benefit for UL and VUL contracts were as follows as of December 31, 2013 and 2012:
| 2013 | 2012 | |||||||||||||||
| Secondary Guarantees |
Paid-up Guarantees |
Secondary Guarantees |
Paid-up Guarantees |
|||||||||||||
| Universal and Variable Life Contracts: |
||||||||||||||||
| Account value (general and separate account) |
$ | 3,307.6 | $ | — | $ | 3,232.6 | $ | — | ||||||||
| Net amount at risk, net of reinsurance |
$ | 17,039.6 | $ | — | $ | 17,885.6 | $ | — | ||||||||
| Weighted average attained age |
60 | — | 59 | — | ||||||||||||
F-75
Table of Contents
ING U.S., Inc.
Notes to the Consolidated Financial Statements
(Dollar amounts in millions, unless otherwise stated)
Account balances of contracts with guarantees invested in variable separate accounts were as follows as of December 31, 2013 and 2012:
| 2013 | 2012 | |||||||
| Equity securities (including mutual funds): |
||||||||
| Equity funds |
$ | 34,084.4 | $ | 31,287.0 | ||||
| Bond funds |
5,186.4 | 6,058.4 | ||||||
| Balanced funds |
5,438.2 | 4,794.7 | ||||||
| Money market funds |
812.3 | 948.9 | ||||||
| Other |
141.2 | 140.8 | ||||||
|
|
|
|
|
|||||
| Total |
$ | 45,662.5 | $ | 43,229.8 | ||||
|
|
|
|
|
|||||
In addition, the aggregate fair value of fixed income securities supporting separate accounts with Stabilizer benefits as of December 31, 2013 and 2012, was $8.1 billion and $8.3 billion, respectively.
8. Reinsurance
The Company has reinsurance treaties covering a portion of the mortality risks and guaranteed death and living benefits under its life insurance and annuity contracts. The Company remains liable to the extent its reinsurers do not meet their obligations under the reinsurance agreements.
The Company reinsures its business through a diversified group of reinsurers. The Company monitors trends in arbitration and any litigation outcomes with its reinsurers. Collectability of reinsurance balances are evaluated by monitoring ratings and evaluating the financial strength of its reinsurers. Large reinsurance recoverable balances with offshore or other non-accredited reinsurers are secured through various forms of collateral, including secured trusts, funds withheld accounts and irrevocable letters of credit.
As of December 31, 2013, the Company had $6.7 billion of net unaffiliated reinsurance recoverables, of which $2.4 billion, or 35.8%, were due from the Company’s largest unaffiliated reinsurer, Hannover Re. As of December 31, 2012, the Company had $7.4 billion of net unaffiliated reinsurance recoverables, of which $2.7 billion, or 36.5%, were due from Hannover Re. Of the total amounts due from Hannover Re, all were fully secured as of December 31, 2013 and $2.3 billion were fully secured as of December 31, 2012.
Information regarding the effect of reinsurance is as follows as of December 31, 2013 and 2012:
| 2013 | ||||||||||||||||
| Direct | Assumed | Ceded | Total, Net of Reinsurance |
|||||||||||||
| Assets |
||||||||||||||||
| Premiums receivable |
$ | 93.5 | $ | 356.7 | $ | (374.6 | ) | $ | 75.6 | |||||||
| Reinsurance recoverable |
— | — | 6,702.2 | 6,702.2 | ||||||||||||
|
|
|
|
|
|
|
|
|
|||||||||
| Total |
$ | 93.5 | $ | 356.7 | $ | 6,327.6 | $ | 6,777.8 | ||||||||
|
|
|
|
|
|
|
|
|
|||||||||
| Liabilities |
||||||||||||||||
| Future policy benefits and contract owner account balances |
$ | 80,315.6 | $ | 3,691.1 | $ | (6,702.2 | ) | $ | 77,304.5 | |||||||
| Liability for funds withheld under reinsurance agreements |
1,181.5 | — | — | 1,181.5 | ||||||||||||
|
|
|
|
|
|
|
|
|
|||||||||
| Total |
$ | 81,497.1 | $ | 3,691.1 | $ | (6,702.2 | ) | $ | 78,486.0 | |||||||
|
|
|
|
|
|
|
|
|
|||||||||
F-76
Table of Contents
ING U.S., Inc.
Notes to the Consolidated Financial Statements
(Dollar amounts in millions, unless otherwise stated)
| 2012 | ||||||||||||||||
| Direct | Assumed | Ceded | Total, Net of Reinsurance |
|||||||||||||
| Assets |
||||||||||||||||
| Premiums receivable |
$ | 96.9 | $ | 384.7 | $ | (411.4 | ) | $ | 70.2 | |||||||
| Reinsurance recoverable |
— | — | 7,379.3 | 7,379.3 | ||||||||||||
|
|
|
|
|
|
|
|
|
|||||||||
| Total |
$ | 96.9 | $ | 384.7 | $ | 6,967.9 | $ | 7,449.5 | ||||||||
|
|
|
|
|
|
|
|
|
|||||||||
| Liabilities |
||||||||||||||||
| Future policy benefits and contract owner account balances |
$ | 82,185.3 | $ | 3,870.4 | $ | (7,379.3 | ) | $ | 78,676.4 | |||||||
| Liability for funds withheld under reinsurance agreements |
1,236.6 | — | — | 1,236.6 | ||||||||||||
|
|
|
|
|
|
|
|
|
|||||||||
| Total |
$ | 83,421.9 | $ | 3,870.4 | $ | (7,379.3 | ) | $ | 79,913.0 | |||||||
|
|
|
|
|
|
|
|
|
|||||||||
Information regarding the effect of reinsurance is as follows for the years ended December 31, 2013, 2012 and 2011:
| 2013 | 2012 | 2011 | ||||||||||
| Premiums: |
||||||||||||
| Direct premiums |
$ | 2,184.1 | $ | 2,084.0 | $ | 1,999.2 | ||||||
| Reinsurance assumed |
1,233.0 | 1,303.6 | 1,329.2 | |||||||||
| Reinsurance ceded |
(1,460.8 | ) | (1,526.5 | ) | (1,558.4 | ) | ||||||
|
|
|
|
|
|
|
|||||||
| Net premiums |
$ | 1,956.3 | $ | 1,861.1 | $ | 1,770.0 | ||||||
|
|
|
|
|
|
|
|||||||
| Fee income: |
||||||||||||
| Gross fee income |
$ | 3,671.4 | $ | 3,520.7 | $ | 3,609.6 | ||||||
| Reinsurance ceded |
(5.1 | ) | (5.3 | ) | (6.0 | ) | ||||||
|
|
|
|
|
|
|
|||||||
| Net fee income |
$ | 3,666.3 | $ | 3,515.4 | $ | 3,603.6 | ||||||
|
|
|
|
|
|
|
|||||||
| Interest credited and other benefits to contract owners / policyholders: |
||||||||||||
| Direct interest credited and other benefits to contract owners / policyholders |
$ | 4,786.9 | $ | 5,205.5 | $ | 6,179.9 | ||||||
| Reinsurance assumed |
1,221.9 | 1,153.4 | 1,333.2 | |||||||||
| Reinsurance ceded(1) |
(1,511.0 | ) | (1,497.3 | ) | (1,771.1 | ) | ||||||
|
|
|
|
|
|
|
|||||||
| Net interest credited and other benefits to contract owners / policyholders |
$ | 4,497.8 | $ | 4,861.6 | $ | 5,742.0 | ||||||
|
|
|
|
|
|
|
|||||||
| (1) | Includes $414.8, $399.7 and $391.6 for amounts paid to reinsurers in connection with our UL contracts for the years ended December 31, 2013, 2012 and 2011, respectively. |
Effective October 1, 1998, the Company disposed of a block of its individual life insurance business under an indemnity reinsurance arrangement with a subsidiary of Lincoln National Corporation (“Lincoln”) for $1.0 billion. Under the agreement, Lincoln contractually assumed from the Company certain policyholder liabilities and obligations, although the Company remains obligated to contract owners. The Lincoln subsidiary established a trust to secure its obligations to the Company under the reinsurance transaction. Of the Reinsurance recoverable on the Consolidated Balance Sheets, $2.0 billion and $2.1 billion as of December 31, 2013 and 2012, respectively, is related to the reinsurance recoverable from the subsidiary of Lincoln under this reinsurance agreement.
F-77
Table of Contents
ING U.S., Inc.
Notes to the Consolidated Financial Statements
(Dollar amounts in millions, unless otherwise stated)
Effective January 1, 2009, the Company executed a Master Asset Purchase Agreement (the “MPA”) with respect to its individual reinsurance business with Scottish Re Group Limited, Scottish Holdings, Inc., Scottish Re (U.S.), Inc., Scottish Re Life (Bermuda) Limited and Scottish Re (Dublin) Limited (collectively, “Scottish Re”) and Hannover Re. Pursuant to the MPA, the Company recaptured business then-reinsured to Scottish Re, and immediately ceded 100% of such business to Hannover Re on a modified coinsurance, funds withheld, and coinsurance basis, which resulted in no gain or loss. The Company will remain obligated to maintain collateral for certain reserve requirements of the business transferred from the Company to Hannover Re for the duration of such reserve requirements, until the underlying reinsurance contracts are novated to Hannover Re, or Hannover Re puts into place its own collateral for such reserve requirements. Effective October 1, 2013, on a 32% quota share basis, the Company recaptured a portion of the business from Hannover Re (Ireland) Limited (“HLRI”) and retroceded the recaptured business to Hannover Life Reassurance Company of America (“HLRUS”). As a result, the Company’s collateral requirement was reduced to $2.3 billion as of December 31, 2013. Of the Reinsurance recoverable on the Consolidated Balance Sheets, $2.4 billion and $2.7 billion as of December 31, 2013 and 2012, respectively, is related to the reinsurance recoverable from Hannover Re under this reinsurance agreement.
9. Goodwill and Other Intangible Assets
Goodwill
Goodwill is the excess of cost over the estimated fair value of net assets acquired. As of December 31, 2013 and 2012, the Company had $31.1 in goodwill allocated to the Investment Management segment. There is no accumulated impairment balance associated with this goodwill. The Company performs the Step 1 goodwill impairment analysis annually as of October 1 and more frequently if facts and circumstances indicate that goodwill may be impaired.
Other Intangible Assets
The Company has the following assets included in Other intangible assets, which have been capitalized and are amortized over their expected economic lives.
The Company recorded Value of Management Contracts (“VMCR”) from the acquisition of ReliaStar Life Insurance Company in 2000 that represent the right by the mutual fund advisor company to manage the assets that are held in the mutual funds business.
Customer relationship lists from the acquisition of CitiStreet, LLC in 2008 represent Value of Customer Relationship Acquired (“VOCRA”) for contracts with customers that were in place at the time of the acquisition.
In addition, computer software that has been purchased or developed internally for own use is stated at cost, less amortization and any impairment losses. Amortization is calculated on a straight-line basis over its useful life. When assessing potential impairment, the unamortized capitalized costs are compared with the net realizable value of the computer software. The amount by which the unamortized capitalized costs exceed the net realizable value is written off.
F-78
Table of Contents
ING U.S., Inc.
Notes to the Consolidated Financial Statements
(Dollar amounts in millions, unless otherwise stated)
Other intangible assets were as follows at December 31, 2013 and 2012:
| Weighted Average Amortization Lives |
2013 | 2012 | ||||||||||||||||||||||||||
| Gross Carrying Amount |
Accumulated Amortization |
Net Carrying Amount |
Gross Carrying Amount |
Accumulated Amortization |
Net Carrying Amount |
|||||||||||||||||||||||
| Management contract rights |
20 years | $ | 550.0 | $ | 366.7 | $ | 183.3 | $ | 550.0 | $ | 339.2 | $ | 210.8 | |||||||||||||||
| Customer relationship lists |
20 years | 115.8 | 41.9 | 73.9 | 115.8 | 34.5 | 81.3 | |||||||||||||||||||||
| Computer software |
3 years | 485.3 | 449.9 | 35.4 | 478.7 | 453.4 | 25.3 | |||||||||||||||||||||
|
|
|
|
|
|
|
|
|
|
|
|
|
|||||||||||||||||
| Total intangible assets |
$ | 1,151.1 | $ | 858.5 | $ | 292.6 | $ | 1,144.5 | $ | 827.1 | $ | 317.4 | ||||||||||||||||
|
|
|
|
|
|
|
|
|
|
|
|
|
|||||||||||||||||
Amortization expense related to intangible assets was $51.7, $53.7 and $59.8 for the years ended December 31, 2013, 2012 and 2011, respectively. The estimated amortization of intangible assets are as follows:
| Year |
Amount | |||
| 2014 |
$ | 51.5 | ||
| 2015 |
48.8 | |||
| 2016 |
42.2 | |||
| 2017 |
36.4 | |||
| 2018 |
35.0 | |||
| Thereafter |
78.7 | |||
|
|
|
|||
| $ | 292.6 | |||
|
|
|
|||
Amortization of intangibles assets is included in the Consolidated Statements of Operations in Operating expenses.
The Company does not have any indefinite-lived intangibles other than goodwill.
10. Share-based Compensation
ING U.S., Inc. 2013 Omnibus Employee Incentive Plan
The Company provides equity-based compensation awards to its employees principally under the ING U.S., Inc. 2013 Omnibus Employee Incentive Plan (the “Omnibus Plan”), which the Company adopted in connection with the IPO. At inception of the Omnibus Plan, a total of 7,650,000 shares of Company common stock were reserved and available for issuance under the Omnibus Plan.
During 2013, the Company provided awards under the Omnibus Plan in connection with (1) the conversion of ING Group equity-based awards granted in March 2013 to employees of the Company into Company equity-based awards, (2) Deal Incentive Awards, and (3) certain other one-time awards of time-vested restricted stock units (“RSUs”), including in connection with new employee hires.
The Omnibus Plan permits the granting of a wide range of equity-based awards, including RSUs, which represent the right to receive a number of shares of Company common stock upon vesting; restricted stock, which are shares of Company stock that are subject to sale and transfer restrictions until the vesting conditions are met; performance share units (“PSUs”) awards, which are RSUs subject to certain time- and performance-based
F-79
Table of Contents
ING U.S., Inc.
Notes to the Consolidated Financial Statements
(Dollar amounts in millions, unless otherwise stated)
vesting conditions, and under which the number of shares of common stock delivered upon vesting varies with the level of achievement of performance criteria; and stock options. Following the IPO, grants of equity-based awards under the Omnibus Plan are made by the Compensation and Benefits Committee (the “Committee”) of the Board of Directors of the Company, and are subject to such terms and conditions as the Committee may determine, including in respect of vesting and forfeiture, subject to certain limitations provided in the Omnibus Plan. Equity-based awards under the Omnibus Plan may carry dividend equivalent rights, pursuant to which notional dividends accumulate on unvested equity awards and are paid, in cash, upon vesting. To date, all awards made under the Omnibus Plan have included dividend equivalent rights. Dividend equivalents are credited to the recipient and are paid only to the extent the applicable performance criteria and service conditions are met.
In 2013, the Company awarded only RSUs and PSUs under the Omnibus Plan. RSUs were awarded in respect of (1) conversion of ING Group equity awards under the LSPP (as described below) which were not subject to performance-based vesting conditions, (2) Deal Incentive Awards, and (3) one-time equity awards. PSUs awarded in respect of the conversion of ING Group equity awards under the LSPP were subject to performance-based vesting conditions. PSUs in 2013 generally entitle recipients to receive, upon vesting, a number of shares of common stock that ranges from 0% to 150% of the number of PSUs awarded, depending on the level of achievement of the specified performance condition. The establishment and the achievement of performance objectives is determined and approved by the Committee. These awards vest no earlier than one year from the date of the award and no later than three years from the date of the award. Dividend equivalents are credited to the recipient and are paid only to the extent the applicable performance criteria and service conditions are met. In the case of retirement (as defined in the award agreement), awards vest depending on the employee’s age and years of service subject to the satisfaction of the applicable performance criteria.
If an award under the Omnibus Plan is forfeited, expired, terminated, otherwise lapses, the shares of Company common stock underlying that award will again become available for issuance under the Omnibus Plan. Shares withheld by the Company to pay taxes, or which are withheld by or tendered to the Company to pay the exercise price of stock options (or are repurchased from an option holder by the Company with proceeds from the exercise of stock options) are not available for reissuance.
As of December 31, 2013, there were no stock options issued or outstanding under the Omnibus Plan.
Deal Incentive Awards: Upon closing of the IPO, 1,993,614 RSUs were granted to employees of the Company under the Omnibus Plan in connection with Deal Incentive Awards. Deal Incentive Awards were conditional agreements to grant equity awards to certain employees of the Company, upon the closing of the IPO or upon the satisfaction of certain other conditions. RSUs granted in connection with Deal Incentive Awards are subject to certain vesting conditions, lockup period and other holding requirements. Of the Deal Incentive Award RSUs granted, 895,544 vested in 2013, primarily upon the pricing of the Secondary Offering.
Due to the completion of the Secondary Offering in 2013 and the ending of the related underwriters’ lockup period, a further 800,032 of such RSUs will vest over 90 days from the pricing of the Secondary Offering. Of the 1,993,614 RSUs granted upon the closing of the IPO, 219,573 RSUs will proportionately vest upon further sales of Company stock by ING Group.
ING U.S., Inc. 2013 Omnibus Non-Employee Director Incentive Plan
The Company offers equity-based awards to ING U.S. Inc. non-employee directors under the ING U.S., Inc. 2013 Omnibus Non-Employee Director Incentive Plan (“2013 Director Plan”), which the Company adopted in connection with the IPO. A total of 88,000 shares of Company common stock were initially reserved and available for issuance under the 2013 Director Plan. The grant date fair value of awards granted under the Plan to
F-80
Table of Contents
ING U.S., Inc.
Notes to the Consolidated Financial Statements
(Dollar amounts in millions, unless otherwise stated)
any one individual in any one fiscal year may not exceed $250 thousand. The material terms of the 2013 Director Plan are substantially consistent with the material terms of the 2013 Omnibus Plan described above.
Director Deal Incentive Award: Upon the closing of the IPO, one director of the Company received 2,564 RSUs granted under the 2013 Director Plan in connection with a Deal Incentive Award, subject to certain vesting conditions, lockup period and other holding requirements. Of the total RSUs awarded, 1,282 RSUs vested in 2013, upon the pricing of the Secondary Offering. In addition, due to the completion of the Secondary Offering in 2013 and the ending of the related underwriters’ lockup period, the remaining 1,282 RSUs will vest over 90 days from the pricing of the Secondary Offering. Upon vesting, common stock issued pursuant to Deal Incentive Awards remains subject to a further holding period.
Non-Employee Director Service Grants: On June 13, 2013, 10,932 RSUs were granted under the 2013 Director Plan to the four non-employee directors then serving on the Board. These awards vest half on the second anniversary of the grant date, and one-quarter vest on the third and fourth anniversaries of the grant date, in each case provided that the grantee remains a director of the Company on the relevant vesting date, and provided that no shares will be delivered in connection with the RSUs until such time as service on the Board is terminated.
ING Group Equity-Based Plans
Prior to the IPO, employees of the Company received equity-based compensation in the form of ING Group equity awards, pursuant to equity compensation plans adopted by ING Group. These plans included:
Long-term Sustainable Performance Plan: In 2011, 2012 and 2013 employees of the Company received ING Group-based equity awards under the Long-Term Sustainable Performance Plan (“LSPP”) of ING Group. LSPP awards made to Company employees are settled by delivery of ING Group American Depository Receipts (“ADRs”).
All LSPP awards to employees of the Company provided in 2013 were, upon the closing of the IPO, converted into Company-based equity awards under the Omnibus Plan. Outstanding awards made in 2011 and 2012 were not converted. The converted awards would have entitled holders to receive up to an aggregate of 5,898,279 ING Group ADRs, and were converted into awards that entitled holders to receive up to an aggregate of 2,495,458 shares of Company common stock upon vesting. These converted awards consist of 1,717,746 PSUs and 777,712 RSUs. Of the converted awards 572,369 PSUs were considered granted during 2013, because the relevant performance measure had been established and communicated to recipients. The remaining PSUs will be considered granted upon the establishment and communication of the performance measures for the applicable performance period by the Committee, which is generally carried out during the first quarter of each year.
With respect to employees who are not “Identified Staff” for purposes of the European Union’s Capital Requirements Directive III, the 2013 ING Group LSPP awards that were converted to PSU awards and RSUs under the Omnibus Plan vest one-third on each of the first, second and third anniversaries of the date of the award, provided that the participant is still employed by the Company on the relevant vesting date, and, in the case of PSU awards, subject to satisfaction of the performance condition. With respect to employees who are “Identified Staff,” 2013 ING Group awards were converted exclusively to time-vested RSUs under the Omnibus Plan, half of which vest on the second anniversary of the grant date, and one-quarter vest on each of the third and fourth anniversaries of the grant date, in each case provided that the participant is still employed by the Company on the relevant vesting date.
LSPP awards provided to the Company’s employees in 2011 and 2012 remain outstanding and will continue to vest according to the terms of their original grant. One-third of these awards vest, and the underlying ING Group
F-81
Table of Contents
ING U.S., Inc.
Notes to the Consolidated Financial Statements
(Dollar amounts in millions, unless otherwise stated)
ADRs are delivered, on each of the first, second and third anniversaries of the award date, provided that the participants are still employed by the Company on the relevant vesting date, and, in the case of performance-based LSPP, provided that the relevant performance condition has been satisfied, as determined by the Committee and the Supervisory Board of ING Group.
Discretionary Bonus Deferral Shares: In connection with the mandatory ING Group 2012 Incentive Compensation Plan (“ICP”), a portion of annual cash incentive awards that exceeded €100,000 equivalent in value $(129,368) of restricted ING Group ADRs were granted in 2013 to employees of the Company. Upon the closing of the IPO, the 731,015 of restricted ING Group ADRs were converted into 309,272 RSUs under the Omnibus Plan. RSUs granted to employees who are not “Identified Staff” vest one-third on each of the first, second and third anniversaries of the grant date, provided that the participant is still employed by the Company on the relevant vesting date. With respect to employees who are “Identified Staff,” RSUs vest half on the second anniversary of the grant date, and one-quarter vest on the third and fourth anniversaries of the grant date, in each case provided that the participant is still employed by the Company on the relevant vesting date.
Equity Compensation Plan: In 2011, 2012, and 2013, certain employees of the Company (principally those employed within the Investment Management business) received equity-based awards under ING Group’s ING America Insurance Holdings, Inc. Equity Compensation Plan (the “Equity Compensation Plan”). Awards made under the Equity Compensation Plan are in the form of restricted ING Group ADRs.
All Equity Compensation Plan awards to employees of the Company provided in 2013 were, upon the closing of the IPO, converted into company-based equity awards under the Omnibus Plan. Outstanding awards made in 2011 and 2012 were not converted. The converted awards consisted of 1,271,322 restricted ING Group ADRs, which were converted into 537,911 RSUs under the Omnibus Plan. These awards are subject to a three-year vesting period ending January 1, 2016 provided that the participant is still employed by the Company on the relevant vesting date.
Equity Compensation Plan awards to employees of the Company provided in 2012 and 2011 remain outstanding and are subject to a three-year vesting period ending January 1, 2015 and 2014, respectively, provided that the participant is still employed by the Company on the relevant vesting date.
LEO Plan: Prior to 2011, employees of the Company received equity-based awards under ING Group’s Long-Term Equity Ownership (“LEO”) plan. Awards included both performance-based awards of ING Group ADRs (“LEO PSUs”) and options to acquire ING Group ordinary shares. LEO options are nonqualified options with an exercise price equal to the fair market value of one ING Group ordinary share on the date of grant. The options have a ten-year term and vest three years from the grant date provided that the participant was still employed by the Company on the relevant vesting date. LEO options will remain outstanding until exercised, lapsed, forfeited, or cancelled.
LEO PSUs are a contingent award of ING Group ordinary shares and generally vested three years from the award date. The number of ING Group ordinary shares deliverable upon vesting ranged from 0% to 200% of the number of LEO PSUs awarded, depending on the level of achievement of ING Group’s Total Shareholder Return relative to a peer group of global financial services companies as determined at the end of the vesting period, provided that the participant was still employed by the Company on the relevant vesting date.
F-82
Table of Contents
ING U.S., Inc.
Notes to the Consolidated Financial Statements
(Dollar amounts in millions, unless otherwise stated)
Compensation Cost
The following table summarizes compensation costs recognized for awards granted under the Omnibus Plan and ING Group share-based compensation plan for the periods indicated:
| Years Ended December 31, | ||||||||||||
| 2013(1) | 2012(2) | 2011(2) | ||||||||||
| RSUs |
$ | 24.2 | $ | 24.4 | $ | 22.2 | ||||||
| RSUs—Deal incentive awards |
29.5 | — | — | |||||||||
| PSU awards |
40.6 | 36.8 | 29.3 | |||||||||
| Stock options(2) |
0.8 | 5.2 | 9.3 | |||||||||
|
|
|
|
|
|
|
|||||||
| Share-based compensation(3) |
$ | 95.1 | $ | 66.4 | $ | 60.8 | ||||||
|
|
|
|
|
|
|
|||||||
| (1) | This table includes compensation costs of $14.9 and $24.5 of ING Group RSUs and LSPP PSU awards, respectively, for the year ended December 31, 2013. |
| (2) | All compensation costs recognized during the period December 31, 2012 and 2011 represent the Company’s allocated portion of ING Group share-based compensation plans and ING Group stock option plans. |
| (3) | The Company recognized no income tax benefit due to recognized valuation allowances for all periods presented. See Note 15. Income Taxes to these Consolidated Financial Statements for additional information. |
Shares Available for Issuance
The following table summarizes the number of Company shares authorized and available for issuance as of December 31, 2013:
| (shares in millions) | ING U.S. Omnibus Plan |
|||
| Authorized for issuance |
7.7 | |||
| Issued and reserved for issuance of outstanding: |
||||
| RSUs |
1.6 | |||
| RSUs—Deal incentive awards |
2.0 | |||
| PSU awards (1.5 times the number of awards) |
1.9 | |||
|
|
|
|||
| Shares available for issuance |
2.2 | |||
|
|
|
|||
F-83
Table of Contents
ING U.S., Inc.
Notes to the Consolidated Financial Statements
(Dollar amounts in millions, unless otherwise stated)
Awards Outstanding
The following tables summarize the number of awards under the Omnibus Plan and ING Group share-based compensation plans for the periods indicated:
| RSUs | RSUs—Deal Incentive Awards |
PSU Awards | ||||||||||||||||||||||
| (awards in millions) | Number of Awards |
Weighted Average Grant Date Fair Value |
Number of Awards |
Weighted Average Grant Date Fair Value |
Number of Awards(1) |
Weighted Average Grant Date Fair Value |
||||||||||||||||||
| Outstanding at December 31, 2012 |
— | — | — | — | ||||||||||||||||||||
| Converted at the time of the IPO |
1.6 | $ | 18.73 | — | $ | — | 0.6 | $ | 28.06 | |||||||||||||||
| Granted |
— | * | 29.79 | 1.8 | 19.80 | — | — | |||||||||||||||||
| Vested |
— | * | 18.98 | (0.9 | ) | 20.13 | — | * | 28.06 | |||||||||||||||
| Forfeited |
— | * | 18.77 | (0.1 | ) | 19.50 | (0.1 | ) | 28.05 | |||||||||||||||
|
|
|
|
|
|
|
|||||||||||||||||||
| Outstanding at December 31, 2013 |
1.6 | $ | 19.15 | 0.8 | $ | 19.50 | 0.5 | $ | 28.06 | |||||||||||||||
|
|
|
|
|
|
|
|||||||||||||||||||
| Awards expected to vest as of December 31, 2013 |
1.6 | $ | 19.15 | 0.8 | $ | 19.50 | 0.5 | $ | 28.06 | |||||||||||||||
| Unrecognized compensation cost |
$ | 22.4 | $ | 4.0 | $ | 4.8 | ||||||||||||||||||
| Expected remaining weighted-average period of expense recognition (in years) |
1.96 | 0.06 | 0.24 | |||||||||||||||||||||
| (1) | Based upon performance through December 31, 2013, recipients of performance awards would be entitled to 0.8 shares at the vesting date. The performance awards are included in the preceding table as if the participants earn shares equal to 100% of the units granted. |
| * | Less than 0.1. |
The total fair value of shares vested for the year ended December 31, 2013 were $0.1, $17.9 and $0.3 for RSUs, RSUs—Deal Incentive Awards, and PSU awards, respectively.
| ING Group Awards Outstanding |
||||||||||||
| (awards in millions) | Stock Options | RSUs | PSU Awards | |||||||||
| Year ended December 31, 2013 |
16.3 | 3.2 | 2.5 | |||||||||
| Year ended December 31, 2012 |
19.7 | 6.1 | 8.5 | |||||||||
| Year ended December 31, 2011 |
23.8 | 6.1 | 6.8 | |||||||||
| 2013 Unrecognized compensation cost |
$ | — | $ | 5.6 | $ | 8.8 | ||||||
| 2013 Expected remaining weighted-average period of expense recognition (in years) |
— | 0.98 | 0.28 | |||||||||
11. Shareholders’ Equity and Earnings per Common Share
Common Shares
Prior to April 11, 2013, the Company had custody of 100,207 shares of outstanding common stock, net of 79,120 shares held in Treasury. Refer to “Note 1. Business, Basis of Presentation and Significant Accounting Policies” to these Consolidated Financial Statements for more information about the IPO.
F-84
Table of Contents
ING U.S., Inc.
Notes to the Consolidated Financial Statements
(Dollar amounts in millions, unless otherwise stated)
The following transactions related to the Company’s IPO took place on or after April 11, 2013 and before December 31, 2013:
| • | the Company filed an amended and restated Certificate of Incorporation, under which the Company is authorized to issue up to 1,000,000,000 shares, of which 900,000,000 shares, par value $0.01 per share are designated as common stock and 100,000,000 shares, par value $0.01 per share are designated as preferred stock; |
| • | the filing of the amended and restated Certificate of Incorporation effected a 2,295.248835 -for-1 stock split of the Company’s then outstanding common stock, resulting in 230,079,120 shares of common stock issued as of April 11, 2013; |
| • | the Company’s common shares began trading under the ticker symbol VOYA on the New York Stock Exchange; |
| • | ING U.S., Inc. issued 30,769,230 shares of the Company’s common stock to the public in the IPO; |
| • | ING Group sold 44,201,773 shares of the Company’s common stock to the public in the IPO; |
| • | ING Group sold 37,950,000 shares of the Company’s common stock in the Secondary Offering; |
| • | the Company issued shares of common stock in respect of vested deal incentive awards held by certain employees of the Company. |
The following table summarizes the rollforward of common shares used in calculating the weighted average shares utilized in the basic earnings per common share calculation for the periods indicated:
| Years Ended December 31, | ||||||||||||
| (shares in millions) | 2013 | 2012(1) | 2011(1) | |||||||||
| Common stock—issued: |
||||||||||||
| Balance, beginning of period |
230.1 | 230.1 | 230.1 | |||||||||
| Shares issued |
30.8 | — | — | |||||||||
| Issuance of shares for share-based incentive compensation |
0.9 | — | — | |||||||||
|
|
|
|
|
|
|
|||||||
| Balance, end of period |
261.8 | 230.1 | 230.1 | |||||||||
| Treasury stock: |
||||||||||||
| Balance, beginning of period |
0.1 | 0.1 | 0.1 | |||||||||
|
|
|
|
|
|
|
|||||||
| Balance, end of period |
0.1 | 0.1 | 0.1 | |||||||||
|
|
|
|
|
|
|
|||||||
| Common shares outstanding, end of period |
261.7 | 230.0 | 230.0 | |||||||||
|
|
|
|
|
|
|
|||||||
| (1) | Share amounts give retroactive effect to the 2,295.248835-to-1 stock split effected on April 11, 2013. |
Warrants
On May 7, 2013, the Company issued to ING Group warrants to purchase up to 26,050,846 shares of the Company’s common stock, a number of shares equal in the aggregate to 9.99% of the outstanding shares of common stock at that date. The warrants have an exercise price of $48.75 per share of common stock, are exercisable from May 7, 2014 to May 7, 2023 and are subject to certain exercise restrictions. The warrants are net share settled and are classified as permanent equity. They were recorded at their fair value determined on the issuance date of May 7, 2013 in the amount of $94.0 as an addition and reduction to Additional-paid-in-capital. Warrant holders are not entitled to receive dividends. ING Group and its subsidiaries may not exercise the warrants until January 1, 2017.
F-85
Table of Contents
ING U.S., Inc.
Notes to the Consolidated Financial Statements
(Dollar amounts in millions, unless otherwise stated)
Earnings Per Share
The following table summarizes the reconciliation of net income (loss) and shares used in calculating basic and diluted net income (loss) per common share for the periods indicated:
| ($ and shares in millions) | Years Ended December 31, | |||||||||||
| 2013 | 2012(1) | 2011(1) | ||||||||||
| Earnings |
||||||||||||
| Net income (loss) available to common shareholders |
||||||||||||
| Net income (loss) |
$ | 790.6 | $ | 611.2 | $ | 102.8 | ||||||
| Less: Net income (loss) attributable to noncontrolling interest |
190.1 | 138.2 | 190.9 | |||||||||
|
|
|
|
|
|
|
|||||||
| Net income (loss) available to common shareholders |
$ | 600.5 | $ | 473.0 | $ | (88.1 | ) | |||||
|
|
|
|
|
|
|
|||||||
| Weighted-average common shares outstanding |
||||||||||||
| Basic |
250.6 | 230.0 | 230.0 | |||||||||
| Dilutive Effects: |
||||||||||||
| RSUs |
0.6 | — | — | |||||||||
| RSUs—Deal incentive awards |
0.4 | — | — | |||||||||
| PSU awards |
0.2 | — | — | |||||||||
|
|
|
|
|
|
|
|||||||
| Diluted |
251.8 | 230.0 | 230.0 | |||||||||
|
|
|
|
|
|
|
|||||||
| Net income (loss) per common share |
||||||||||||
| Basic |
$ | 2.40 | $ | 2.06 | $ | (0.38 | ) | |||||
| Diluted |
2.38 | 2.06 | (0.38 | ) | ||||||||
| (1) | Per-share amounts give retroactive effect to the 2,295.248835-to-1 stock split effected on April 11, 2013. |
Dividends to Common Shareholders
The declaration and payment of dividends is subject to the discretion of the Board of Directors, and depends on ING U.S., Inc.’s financial condition, results of operations, cash requirements, future prospects, regulatory restrictions on the payment of dividends by ING U.S., Inc.’s other insurance subsidiaries and other factors deemed relevant by the Board. The payment of dividends is also subject to restrictions under the described terms of Note 16. Financing Agreements-Junior Subordinated Debt to these Consolidated Financial Statements in the event we should choose to defer interest payments on those debentures.
The table below summarizes dividend declarations, record and payment dates, as well as per share dividend amounts, for the common shares:
| ($ in millions except per share data) | ||||||||||||
| Declaration Date |
Record Date | Payment Date | Dividend Per Share | |||||||||
| July 25, 2013 |
August 30, 2013 | October 1, 2013 | $ | 0.01 | ||||||||
| October 31, 2013 |
November 29, 2013 | December 30, 2013 | $ | 0.01 | ||||||||
| February 6, 2014 |
February 28, 2014 | March 31, 2014 | $ | 0.01 | ||||||||
F-86
Table of Contents
ING U.S., Inc.
Notes to the Consolidated Financial Statements
(Dollar amounts in millions, unless otherwise stated)
12. Insurance Subsidiaries
Principal Insurance Subsidiaries Statutory Equity and Income
Each of ING U.S., Inc.’s four principal insurance subsidiaries (the “Principal Insurance Subsidiaries”) is subject to minimum risk-based capital (“RBC”) requirements established by the insurance departments of their respective states of domicile. The formula for determining the amount of RBC specify various weighting factors that are applied to financial balances or various levels of activity based on the perceived degree of risk. Regulatory compliance is determined by a ratio of total adjusted capital (“TAC”), as defined by the National Association of Insurance Commissioners (“NAIC”), to authorized control level RBC, as defined by the NAIC. Each of the Company’s Principal Insurance Subsidiaries exceeded the minimum RBC requirements that would require any regulatory or corrective action for all periods presented herein.
The Company’s Principal Insurance Subsidiaries are each required to prepare statutory financial statements in accordance with statutory accounting practices prescribed or permitted by the insurance department of its respective state of domicile. Such statutory accounting practices primarily differ from U.S. GAAP by charging policy acquisition costs to expense as incurred, establishing future policy benefit liabilities and contract owner account balances using different actuarial assumptions as well as valuing investments and certain assets and accounting for deferred taxes on a different basis. Certain assets that are not admitted under statutory accounting principles are charged directly to surplus. Depending on the regulations of the insurance department of an insurance company’s state of domicile, the entire amount or a portion of an insurance company’s asset balance can be nonadmitted based on the specific rules regarding admissibility. The Principal Insurance Subsidiaries have no material prescribed or permitted practices for the years ended December 31, 2013, 2012 and 2011 that impact total capital and surplus.
Statutory Net income (loss) for the years ended December 31, 2013, 2012 and 2011, statutory capital and surplus for the years ended as of December 31, 2013 and 2012 and minimum capital requirements as of December 31, 2013 of the Company’s Principal Insurance Subsidiaries are as follows:
| Statutory Net Income (Loss) | Statutory Capital and Surplus |
Minimum Capital Requirements(1) |
||||||||||||||||||||||
| 2013 | 2012 | 2011 | 2013 | 2012 | 2013 | |||||||||||||||||||
| Subsidiary Name (State of Domicile): |
||||||||||||||||||||||||
| ING USA Annuity and Life Insurance Company (“ING USA”) (IA) |
$ | (55.8 | ) | $ | (9.1 | ) | $ | 386.0 | $ | 1,941.6 | $ | 2,174.1 | $ | 5.0 | ||||||||||
| ING Life Insurance and Annuity Company (“ILIAC”) (CT) |
175.2 | 261.6 | 194.4 | 2,010.8 | 1,921.8 | 3.0 | ||||||||||||||||||
| Security Life of Denver Insurance Company (“SLD”) (CO) |
(0.1 | ) | (129.8 | ) | 175.2 | 1,034.0 | 1,459.9 | 1.5 | ||||||||||||||||
| ReliaStar Life Insurance Company (“RLI”) (MN) |
215.9 | (155.3 | ) | (83.0 | ) | 1,942.5 | 2,278.6 | 4.5 | ||||||||||||||||
| (1) | The insurance statutes of the respective state of domicile for the Company’s Principal Insurance Subsidiaries set forth specific minimum capital requirements. |
Insurance Subsidiaries Dividend Restrictions
The states in which the insurance subsidiaries of ING U.S., Inc. are domiciled impose certain restrictions on the subsidiaries’ ability to pay dividends to their parent. These restrictions are based in part on the prior year’s
F-87
Table of Contents
ING U.S., Inc.
Notes to the Consolidated Financial Statements
(Dollar amounts in millions, unless otherwise stated)
statutory income and surplus. In general, dividends up to specified levels are considered ordinary and may be paid without prior approval. Dividends in larger amounts, or “extraordinary” dividends, are subject to approval by the insurance commissioner of the state of domicile of the insurance subsidiary proposing to pay the dividend.
Under the insurance laws applicable to ING U.S., Inc.’s subsidiaries domiciled in Connecticut, Colorado, Indiana, Iowa and Minnesota, an “extraordinary” dividend or distribution is defined as a dividend or distribution that, together with other dividends and distributions made within the preceding twelve months, exceeds the greater of (i) 10% of the insurer’s policyholder surplus as of the preceding December 31, or (ii) the insurer’s net gain from operations for the twelve-month period ending the preceding December 31, in each case determined in accordance with statutory accounting principles. New York has similar restrictions, except that New York’s statutory definition of “extraordinary” dividend or distribution is an aggregate amount in any calendar year that exceeds the lesser of (i) 10% of policyholder’s surplus for the twelve-month period ending the preceding December 31, or (ii) the insurer’s net gain from operations for the twelve-month period ending the preceding December 31, not including realized capital gains. In addition, under the insurance laws of Connecticut, Colorado, Iowa and Minnesota, no dividend or other distribution exceeding an amount equal to a domestic insurance company’s earned surplus may be paid without the domiciliary insurance regulator’s prior approval.
Principal Insurance Subsidiaries—Dividends and Return of Capital
The following table summarizes dividends permitted to be paid by the Company’s Principal Insurance Subsidiaries to ING U.S., Inc. or Lion Holdings without the need for insurance regulatory approval for the periods presented:
| Dividends Permitted without Approval |
||||||||||||
| 2014 | 2013 | 2012 | ||||||||||
| Subsidiary Name (State of domicile): |
||||||||||||
| ING USA Annuity and Life Insurance Company (IA) |
$ | 216.3 | (3) | $ | — | $ | — | |||||
| ING Life Insurance and Annuity Company (CT) |
371.4 | (4) | 264.1 | (1) | 190.0 | (2) | ||||||
| Security Life of Denver Insurance Company (CO) |
32.5 | (3) | — | — | ||||||||
| ReliaStar Life Insurance Company (MN) |
194.0 | (3) | — | — | ||||||||
| (1) | $264.1 could have been paid without approval after June 26, 2013. $174.0 was paid on May 8, 2013 as an extraordinary distribution. $90.0 was paid as an ordinary dividend on December 9, 2013. |
| (2) | $190.0 was paid as part of the June 26, 2012 distribution of $800.0. |
| (3) | These can be paid as ordinary dividends after May 8, 2014. |
| (4) | $281.4 can be paid as ordinary dividends after May 8, 2014. $90.0 can be paid as ordinary dividends after December 9, 2014. |
The following table summarizes dividends and return of capital distributions paid by each of the Company’s Principal Insurance Subsidiaries to its parent for the periods indicated:
| Dividends Paid | Return of Capital Distributions |
|||||||||||||||
| As of December 31, | As of December 31, | |||||||||||||||
| 2013 | 2012 | 2013 | 2012 | |||||||||||||
| Subsidiary Name (State of domicile): |
||||||||||||||||
| ING USA Annuity and Life Insurance Company (IA)(1) |
$ | — | $ | — | $ | 230.0 | $ | 250.0 | ||||||||
| ING Life Insurance and Annuity Company (CT)(2) |
264.0 | 190.0 | — | 150.0 | ||||||||||||
| Security Life of Denver Insurance Company (CO)(3) |
— | — | 447.0 | 80.0 | ||||||||||||
| ReliaStar Life Insurance Company (MN)(4) |
— | 130.0 | 583.0 | — | ||||||||||||
F-88
Table of Contents
ING U.S., Inc.
Notes to the Consolidated Financial Statements
(Dollar amounts in millions, unless otherwise stated)
| (1) | Iowa Insurance Division approved ING USA’s 2013 and 2012 return of capital distributions. |
| (2) | Connecticut Insurance Department approved ILIAC’s $174.0 extraordinary dividend as part of the May 8, 2013 extraordinary distribution. In December 2013, ILIAC paid a $90.0 ordinary dividend. In 2012, ILIAC paid $340.0 in distributions, which included a $190.0 ordinary dividend. |
| (3) | Colorado Insurance Division approved SLD’s 2013 and 2012 return of capital distributions. |
| (4) | Minnesota Insurance Division approved RLI’s 2013 distribution and 2012 dividend. |
In March and April 2013, in response to requests made in 2012 and refreshed in 2013, ING U.S., Inc.’s Principal Insurance Subsidiaries which are domiciled in Colorado, Connecticut, Iowa and Minnesota received approvals or notices of non-objection, as the case may be, from their respective domiciliary insurance regulators to make extraordinary distributions to ING U.S., Inc. or Lion Connecticut Holdings Inc. (“Lion Holdings”), a wholly owned subsidiary of ING U.S., Inc., in the aggregate amount of $1.4 billion, contingent upon completion of the IPO and the use of the extraordinary distribution funds solely for Company operations. The approved distributions of $1.4 billion were made on May 8, 2013.
In addition, on May 8, 2013, the Principal Insurance Subsidiaries domiciled in Colorado, Iowa and Minnesota each reset, on a one-time basis, their respective negative unassigned funds account as of December 31, 2012 (as reported in their respective 2012 statutory annual statements) to zero (with an offsetting reduction in gross paid-in capital and contributed surplus). These resets were made pursuant to permitted practices in accordance with statutory accounting practices granted by their respective domiciliary insurance regulators. These permitted practices have no impact on total capital and surplus of these insurance subsidiaries and were recorded in each of their respective second quarter 2013 statutory financial statements. See “Management’s Discussion and Analysis of Financial Condition and Results of Operations —Liquidity and Capital Resources—Restrictions on Dividends and Returns of Capital from Subsidiaries.”
In June 2012, the Principal Insurance Subsidiaries each received regulatory approvals or notices of non-objection from their respective domiciliary insurance regulators to make distributions to ING U.S., Inc. or Lion Holdings in the aggregate amount of $800.0. Such distributions were made on June 26, 2012. These domiciliary state regulatory actions have been taken by the relevant domiciliary state insurance regulators in response to requests that stated the intended use of the proceeds was to provide $500.0 to the captive reinsurance subsidiary, Security Life of Denver International Limited (“SLDI”), and retain the balance at ING U.S., Inc. for general corporate purposes. On June 26, 2012, ING U.S., Inc. made a capital contribution to SLDI in the amount of $400.0. Additionally, ING U.S., Inc. repaid $100.0 of intercompany loan from a subsidiary of SLDI and, on June 28, 2012 the proceeds of this loan repayment were used to pay a dividend to SLDI.
Captive Reinsurance Subsidiaries
ING U.S., Inc.’s special purpose life reinsurance captive insurance company subsidiaries domiciled in Missouri (collectively referred to as the “captive reinsurance subsidiaries”) provide reinsurance to the Company’s insurance subsidiaries in order to facilitate the financing of statutory reserves including those associated with Regulation XXX or AG38. A portion of this reinsurance was, until January 1, 2014, also provided by a special purpose life reinsurance captive insurance subsidiary domiciled in South Carolina and was novated to one of the captive reinsurance subsidiaries on that date. Each of the captive reinsurance subsidiaries in operation as of December 31, is a wholly owned direct or indirect subsidiary of one of the Principal Insurance Subsidiaries. Each of the captive reinsurance subsidiaries is subject to specific minimum capital requirements set forth in the insurance statutes of the State of Missouri, its state of domicile, and is required to prepare statutory financial statements in accordance with statutory accounting practices prescribed in the insurance statutes or permitted by the Insurance Department of the State of Missouri, its state of domicile. There are no prescribed practices material to the captive reinsurance subsidiaries, except that certain of these subsidiaries have included the value
F-89
Table of Contents
ING U.S., Inc.
Notes to the Consolidated Financial Statements
(Dollar amounts in millions, unless otherwise stated)
of letters of credit, surplus notes and trust notes as admitted assets supporting the statutory reserves ceded to such subsidiaries. The effect of these prescribed practices was to increase statutory capital and surplus by $1,612.0 and $1,339.0 as of December 31, 2013 and 2012, respectively. The aggregate statutory capital and surplus, including the aforementioned prescribed practices, was $616.6 and $596.6 as of December 31, 2013 and 2012, respectively.
Our Arizona captive, SLDI, provides reinsurance to the Company’s insurance subsidiaries in order to facilitate the financing of statutory reserves including those associated with Regulation XXX or AG38 and to fund certain statutory annuity reserve requirements. On December 20, 2013, SLDI redomesticated from the Cayman Islands to the State of Arizona. Arizona state insurance statutes and regulations require SLDI to file financial statements with the Arizona Department of Insurance (“ADOI”) and allow the filing of such financial statements on a U.S. GAAP basis modified for certain prescribed practices outlined in the Arizona insurance statutes that are applicable to all U.S. GAAP filers. These prescribed practices had no impact on SLDI’s Shareholder’s equity as of December 31, 2013. In addition, SLDI has obtained approval from the ADOI for certain permitted practices, including taking reinsurance credit for certain ceded reserves where the assets backing the liabilities are held by a wholly owned Principal Insurance Subsidiary of ING U.S., Inc. SLDI has recorded a receivable for these assets. The effect of the permitted practice was to increase SLDI’s Shareholder’s equity by $490.6 as of December 31, 2013, but has no effect on the Company’s consolidated Total shareholders’ equity.
The captive reinsurance subsidiaries may not declare or pay any dividends other than in accordance with their respective insurance reserve financing transaction agreements and their respective governing licensing orders. Likewise, SLDI may not declare or pay dividends other than in accordance with its annual capital and dividend plan as approved by the ADOI, which includes a minimum capital requirement. SLDI does not expect to make any dividend payments during calendar year 2014.
13. Employee Benefit Arrangements
Pension, Other Postretirement Benefit Plans and Other Benefit Plans
ING U.S., Inc.’s subsidiaries maintain both qualified and non-qualified defined benefit pension plans (the “Plans”). These plans generally cover all employees and certain sales representatives who meet specified eligibility requirements. Pension benefits are based on a formula using compensation and length of service of employees at retirement. Annual contributions are paid to the Plans at a rate necessary to adequately fund the accrued liabilities of the Plans calculated in accordance with legal requirements. The Plans comply with applicable regulations concerning investments and funding levels.
Effective October 1, 2013, the Compensation and Benefits Committee of the Board of Directors of the Company, approved changing the Plan’s name from the ING Americas Retirement Plan to the ING U.S. Retirement Plan (the “Retirement Plan”). The Retirement Plan is a tax qualified defined benefit plan, the benefits of which are guaranteed (within certain specified legal limits) by the Pension Benefit Guaranty Corporation (“PBGC”). Beginning January 1, 2012, the Retirement Plan adopted a cash balance pension formula instead of a final average pay (“FAP”) formula, allowing all eligible employees to participate in the Retirement Plan. Participants will earn an annual credit equal to 4% of eligible compensation. Interest is credited monthly based on a 30-year U.S. Treasury securities bond rate published by the Internal Revenue Service in the preceding August of each year. The accrued vested cash pension balance benefit is portable; participants can take it if they leave the Company. For participants in the Retirement Plan as of December 31, 2012, there will be a two-year transition period from the Retirement Plan’s current FAP formula to the cash balance pension formula. Due to ASC Topic 715 requirements, the accounting impact of the change in the Retirement Plan was recognized upon the sponsoring company’s approval November 10, 2011, resulting in an $83.6 decrease to the benefit obligation.
F-90
Table of Contents
ING U.S., Inc.
Notes to the Consolidated Financial Statements
(Dollar amounts in millions, unless otherwise stated)
During the year ended December 31, 2013, the Committee approved amendments to the Retirement Plan to comply with changes in regulations and adopt operational changes, none of which changed the level of benefits under the Retirement Plan.
In addition to providing qualified retirement benefit plans, the Company provides certain supplemental retirement benefits to eligible employees, non-qualified pension plans for insurance sales representatives who have entered into a career agent agreement and certain other individuals. These plans are non-qualified defined benefit plans which means all benefits are payable from the general assets of the sponsoring company.
The Company also offers deferred compensation plans for eligible employees, including eligible career agents and certain other individuals who meet the eligibility criteria. The Company’s deferred compensation commitment for employees is recorded on the Consolidated Balance Sheets in Other liabilities and totaled $271.6 and $268.8 as of December 31, 2013 and 2012, respectively.
ING U.S., Inc.’s subsidiaries also provide other post-employment and postretirement employee benefits to certain employees. These are primarily postretirement healthcare and life insurance benefits to retired employees and other eligible dependents and post-employment/pre-retirement plans provided to employees and former employees.
On June 14, 2012, the Company announced an agreement with Cognizant Technology Solutions U.S. Corporation (“Cognizant”) under which Cognizant provides business processing and operations services related to the Company. Under the terms of the seven-year agreement, Cognizant made offers of employment to more than 1,000 employees of the Company in Minot, North Dakota and Des Moines, Iowa. Based on an actuarial estimate using the Retirement Plan assets and obligations, the Company recognized a remeasurement loss of $115.2 resulting from the revaluation of the Retirement Plan’s assets and obligations, partially offset by a $6.9 curtailment gain. The net loss before income taxes was $108.3 and was recognized on the date the employees transitioned to Cognizant, which was on August 16, 2012.
F-91
Table of Contents
ING U.S., Inc.
Notes to the Consolidated Financial Statements
(Dollar amounts in millions, unless otherwise stated)
Obligations, Funded Status and Net Periodic Benefit Costs
The following tables summarize a reconciliation of beginning and ending balances of the benefit obligation and fair value of plan assets, as well as the funded status of the Company’s defined benefit pension and postretirement healthcare benefit plans for the years ended December 31, 2013 and 2012:
| Pension Plans | Other Postretirement Benefits |
|||||||||||||||
| 2013 | 2012 | 2013 | 2012 | |||||||||||||
| Change in benefit obligation: |
||||||||||||||||
| Benefit obligations, January 1 |
$ | 2,229.6 | $ | 1,945.2 | $ | 45.3 | $ | 46.0 | ||||||||
| Service cost |
45.3 | 40.5 | — | — | ||||||||||||
| Interest cost |
88.3 | 90.2 | 1.7 | 1.7 | ||||||||||||
| Plan participants’ contribution |
— | — | 0.1 | 0.4 | ||||||||||||
| Net actuarial (gains) losses |
(277.9 | ) | 233.0 | (7.2 | ) | 1.7 | ||||||||||
| Benefits paid |
(90.3 | ) | (79.3 | ) | (3.2 | ) | (4.5 | ) | ||||||||
|
|
|
|
|
|
|
|
|
|||||||||
| Benefit obligations, December 31 |
1,995.0 | 2,229.6 | 36.7 | 45.3 | ||||||||||||
|
|
|
|
|
|
|
|
|
|||||||||
| Change in plan assets: |
||||||||||||||||
| Fair value of plan net assets, January 1 |
1,371.7 | 1,193.5 | — | — | ||||||||||||
| Actual return on plan assets |
221.1 | 155.7 | — | — | ||||||||||||
| Employer contributions |
54.3 | 101.8 | 3.1 | 4.1 | ||||||||||||
| Plan participants’ contributions |
— | — | 0.1 | 0.4 | ||||||||||||
| Benefits paid |
(90.3 | ) | (79.3 | ) | (3.2 | ) | (4.5 | ) | ||||||||
|
|
|
|
|
|
|
|
|
|||||||||
| Fair value of plan net assets, December 31 |
1,556.8 | 1,371.7 | — | — | ||||||||||||
|
|
|
|
|
|
|
|
|
|||||||||
| Unfunded status at end of year(1) |
$ | (438.2 | ) | $ | (857.9 | ) | $ | (36.7 | ) | $ | (45.3 | ) | ||||
|
|
|
|
|
|
|
|
|
|||||||||
| (1) | Funded status is not indicative of the Company’s ability to pay ongoing pension benefits or of its obligation to fund retirement trusts. Required pension funding for qualified plans is determined in accordance with Employee Retirement Income Security Act (“ERISA”) regulations . |
The following table summarizes amounts recognized on the Consolidated Balance Sheets and AOCI were as follows as of December 31, 2013 and 2012:
| Pension Plans | Other Postretirement Benefits |
|||||||||||||||
| 2013 | 2012 | 2013 | 2012 | |||||||||||||
| Amounts recognized in the Consolidated Balance Sheets consist of: |
||||||||||||||||
| Accrued benefit cost |
$ | (438.2 | ) | $ | (857.9 | ) | $ | (36.7 | ) | $ | (45.3 | ) | ||||
|
|
|
|
|
|
|
|
|
|||||||||
| Net amount recognized |
$ | (438.2 | ) | $ | (857.9 | ) | $ | (36.7 | ) | $ | (45.3 | ) | ||||
|
|
|
|
|
|
|
|
|
|||||||||
| Accumulated other comprehensive (income) loss: |
||||||||||||||||
| Prior service cost (credit) |
$ | (52.6 | ) | $ | (63.0 | ) | $ | (24.9 | ) | $ | (28.3 | ) | ||||
| Tax effect |
18.4 | 22.0 | 8.7 | 9.9 | ||||||||||||
|
|
|
|
|
|
|
|
|
|||||||||
| Accumulated other comprehensive (income) loss, net of tax |
$ | (34.2 | ) | $ | (41.0 | ) | $ | (16.2 | ) | $ | (18.4 | ) | ||||
|
|
|
|
|
|
|
|
|
|||||||||
F-92
Table of Contents
ING U.S., Inc.
Notes to the Consolidated Financial Statements
(Dollar amounts in millions, unless otherwise stated)
The following table summarizes information for pension and other postretirement benefit plans with a projected benefit obligation and an accumulated benefit obligation in excess of plan assets was as follows as of December 31, 2013 and 2012:
| Pension Plans | Other Postretirement Benefits |
|||||||||||||||
| 2013 | 2012 | 2013 | 2012 | |||||||||||||
| Projected benefit obligation |
$ | 1,995.0 | $ | 2,229.6 | $ | 36.7 | $ | 45.3 | ||||||||
| Accumulated benefit obligation |
1,994.8 | 2,218.5 | N/A | N/A | ||||||||||||
| Fair value of plan assets |
1,556.8 | 1,371.7 | — | — | ||||||||||||
Components of Periodic Net Benefit Cost
Net periodic pension cost and net periodic other postretirement benefit plan cost consist of the following:
| • | Service Cost: Service cost represents the increase in the projected benefit obligation as a result of benefits payable to employees on service rendered during the current year. |
| • | Interest Cost (on the Liability): Interest cost represents the increase in the amount of projected benefit obligation at the end of each year due to the time value adjustment. |
| • | Expected Return on Plan Assets: Expected return on plan assets represents the anticipated return earned by the pension fund assets in a given year. |
| • | Net Loss (Gain) Recognition: Actuarial gains and losses occur as a result of differences between actual and expected experience on pension plan assets or projected benefit obligation during a given period. The Company immediately recognizes actuarial losses (gains) on the qualified and nonqualified retirement plans as well as the other postretirement benefit plans. |
| • | Amortization of Prior Service Cost: This cost represents the recognition of increases or decreases in pension (other postretirement) benefit obligation as a result of changes in plans or initiation of new plans. The increases or decreases in obligation are recognized in AOCI at the time of the particular amendment. The costs are then amortized to pension (other postretirement benefit) expense over the expected service years of the covered employees. |
F-93
Table of Contents
ING U.S., Inc.
Notes to the Consolidated Financial Statements
(Dollar amounts in millions, unless otherwise stated)
The components of net periodic benefit costs recognized in the Statements of Operations and other changes in plan assets and benefit obligations recognized in Other comprehensive income (loss) were as follows for the years ended December 31, 2013, 2012 and 2011:
| Pension Plans | Other Postretirement Benefits | |||||||||||||||||||||||
| 2013 | 2012 | 2011 | 2013 | 2012 | 2011 | |||||||||||||||||||
| Net Periodic (Benefit) Costs Recognized in Consolidated Statements of Operations: |
||||||||||||||||||||||||
| Service cost |
$ | 45.3 | $ | 40.5 | $ | 37.5 | $ | — | $ | — | $ | (2.1 | ) | |||||||||||
| Interest cost |
88.3 | 90.2 | 95.0 | 1.7 | 1.7 | 2.6 | ||||||||||||||||||
| Expected return on plan assets |
(101.2 | ) | (92.6 | ) | (81.6 | ) | — | — | — | |||||||||||||||
| Amortization of prior service cost (credit) |
(10.4 | ) | (11.1 | ) | (1.3 | ) | (3.4 | ) | (3.4 | ) | (3.4 | ) | ||||||||||||
| (Gain) loss recognized due to curtailments |
— | (6.9 | ) | — | — | — | — | |||||||||||||||||
| Net (gain) loss recognition |
(397.9 | ) | 170.0 | 163.3 | (7.2 | ) | 1.9 | (5.5 | ) | |||||||||||||||
|
|
|
|
|
|
|
|
|
|
|
|
|
|||||||||||||
| Net periodic (benefit) costs |
(375.9 | ) | 190.1 | 212.9 | (8.9 | ) | 0.2 | (8.4 | ) | |||||||||||||||
|
|
|
|
|
|
|
|
|
|
|
|
|
|||||||||||||
| Other Changes in Plan Assets and Benefit Obligations Recognized in AOCI: |
||||||||||||||||||||||||
| Prior service cost (credit) |
— | — | (83.6 | ) | — | — | — | |||||||||||||||||
| Amortization of prior service (credit) cost |
10.4 | 11.1 | 1.3 | 3.4 | 3.4 | 3.4 | ||||||||||||||||||
| The effect of any curtailment or settlement |
— | 6.9 | — | — | — | — | ||||||||||||||||||
|
|
|
|
|
|
|
|
|
|
|
|
|
|||||||||||||
| Total recognized in AOCI |
10.4 | 18.0 | (82.3 | ) | 3.4 | 3.4 | 3.4 | |||||||||||||||||
|
|
|
|
|
|
|
|
|
|
|
|
|
|||||||||||||
| Total recognized in net periodic (benefit) costs and AOCI |
$ | (365.5 | ) | $ | 208.1 | $ | 130.6 | $ | (5.5 | ) | $ | 3.6 | $ | (5.0 | ) | |||||||||
|
|
|
|
|
|
|
|
|
|
|
|
|
|||||||||||||
The estimated prior service cost for the pension plans and other postretirement benefit plans are amortized from AOCI into net periodic (benefit) cost. Such amounts included in AOCI and expected to be recognized as components of periodic (benefit) cost in 2014 are as follows:
| Pension Plans | Other Postretirement Benefits |
|||||||
| Amortization of prior service cost (credit) |
$ | (10.4 | ) | $ | (3.4 | ) | ||
Assumptions
The weighted-average assumptions used in determining benefit obligations were as follows:
| Pension Plans | Other Postretirement Benefits |
|||||||||||||||
| 2013 | 2012 | 2013 | 2012 | |||||||||||||
| Discount rate |
4.95 | % | 4.05 | % | 4.95 | % | 4.05 | % | ||||||||
| Rate of compensation increase |
4.00 | % | 4.00 | % | N/A | N/A | ||||||||||
In determining the discount rate assumption, the Company utilizes current market information provided by its plan actuaries including a discounted cash flow analysis of the Company’s pension obligation and general movements in the current market environment. The discount rate modeling process involves selecting a portfolio of high quality, noncallable bonds that will match the cash flows of the Retirement Plan.
F-94
Table of Contents
ING U.S., Inc.
Notes to the Consolidated Financial Statements
(Dollar amounts in millions, unless otherwise stated)
The weighted-average assumptions used in determining net benefit cost were as follows:
| Pension Plans | Other Postretirement Benefits | |||||||||||||||||||||||
| 2013 | 2012 | 2011 | 2013 | 2012 | 2011 | |||||||||||||||||||
| Discount rate |
4.05 | % | 4.59 | % | 5.50 | % | 4.05 | % | 4.75 | % | 5.50 | % | ||||||||||||
| Rate of compensation increase |
4.00 | % | 4.00 | % | 4.00 | % | N/A | N/A | N/A | |||||||||||||||
| Expected rate of return on plan assets |
7.50 | % | 7.50 | % | 7.50 | % | N/A | N/A | N/A | |||||||||||||||
The expected return on plan assets is updated at least annually, taking into consideration the Plan’s asset allocation, historical returns on the types of assets held in the Retirement Plan’s portfolio of assets (“the Fund”), and the current economic environment. Based on these factors, it is expected that the Fund’s assets will earn an average percentage per year over the long term. This estimation is based on an active return on a compound basis, with a reduction for administrative expenses and non-ING investment manager fees paid from the Fund. For estimation purposes, it is assumed the long-term asset mix will be consistent with the current mix. Changes in the asset mix could impact the amount of recorded pension income or expense, the funded status of the Plan, and the need for future cash contributions.
The annual assumed rate of increase in the per capita cost of covered benefits (i.e. health care cost trend rate) for the medical rate within the other postretirement benefit plan is 7.75%, decreasing gradually to 7.08% over the next five years with an ultimate trend rate of 5.0%.
Assumed healthcare cost trend rates may have a significant effect on the amounts reported for healthcare plans. A one-percentage point change in assumed healthcare cost trend rates would have the following effects:
| One Percentage Point Increase |
One Percentage Point Decrease |
|||||||
| Effect on the aggregate of service and interest cost components |
$ | 0.1 | $ | — | * | |||
| Effect on accumulated postretirement benefit obligation |
1.1 | (0.9 | ) | |||||
| * | Less than $0.1 |
Plan Assets
The Retirement Plan is the only defined benefit plan with plan assets in a trust. The primary financial objective of the Retirement Plan is to secure participant retirement benefits. As such, the key objective in the Retirement Plan’s financial management is to promote stability and, to the extent appropriate, growth in funded status (i.e. the ratio of market value of assets to liabilities). The investment strategy for the Fund balances the requirement to generate returns with the need to control risk. The asset mix is recognized as the primary mechanism to influence the reward and risk structure of the Fund in an effort to accomplish the Retirement Plan’s funding objectives. Desirable target allocations amongst identified asset classes are set and within each asset class, careful consideration is given to balancing the portfolio among industry sectors, geographies, interest rate sensitivity, economic growth, currency and other factors affecting investment returns. The assets are managed by professional investment firms. They are bound by mandates and are measured against benchmarks. Consideration is given to balancing security concentration, investment style, and reliance on particular active investment strategies, among other factors. The Company reviews its asset mix of the Fund on a regular basis. Generally, the pension committee of the Company will rebalance the Fund’s asset mix to the target mix as individual portfolios approach their minimum or maximum levels. However, the pension committee has the discretion to deviate from these ranges or to manage investment performance using different criteria.
F-95
Table of Contents
ING U.S., Inc.
Notes to the Consolidated Financial Statements
(Dollar amounts in millions, unless otherwise stated)
Derivative contracts may be used for hedging purposes to reduce the Retirement Plan’s exposure to interest rate risk. Interest rate swaps and/or Treasury futures are used to manage the interest rate risk in the Retirement Plan’s fixed maturity portfolio. Interest rate swaps represent contracts that require the exchange of cash flows at regular interim periods. The derivatives do not qualify for hedge accounting.
The following table summarizes the Company’s pension plan’s target allocation range and actual asset allocation by asset category as of December 31, 2013 and 2012:
| Actual Asset Allocation | ||||||||
| 2013 | 2012 | |||||||
| Equity securities: |
||||||||
| Target allocation range |
34%-67% | 45%-70% | ||||||
| Large-cap domestic |
26.4% | 29.4% | ||||||
| Small/Mid-cap domestic |
5.9% | 6.8% | ||||||
| International commingled funds |
14.2% | 12.4% | ||||||
| Other |
4.6% | 4.4% | ||||||
|
|
|
|
|
|||||
| Total equity securities |
51.1% | 53.0% | ||||||
|
|
|
|
|
|||||
| Fixed maturities: |
||||||||
| Target allocation range |
30%-50% | 25%-40% | ||||||
| U.S. Treasuries, short term investments, cash and futures |
10.0% | 13.8% | ||||||
| U.S. Government agencies and authorities |
3.8% | 5.7% | ||||||
| U.S. corporate, state and municipalities |
22.0% | 7.8% | ||||||
| Foreign securities |
3.1% | 2.9% | ||||||
| Residential mortgage-backed securities |
0.2% | 4.7% | ||||||
| Commercial mortgage-backed securities |
— % | 2.3% | ||||||
| Other asset-backed securities |
0.1% | 0.4% | ||||||
|
|
|
|
|
|||||
| Total fixed maturities |
39.2% | 37.6% | ||||||
|
|
|
|
|
|||||
| Other investments: |
||||||||
| Target allocation range |
6%-14% | 6%-14% | ||||||
| Hedge funds |
4.9% | 4.5% | ||||||
| Real estate |
4.8% | 4.9% | ||||||
|
|
|
|
|
|||||
| Total other investments |
9.7% | 9.4% | ||||||
|
|
|
|
|
|||||
| Total |
100.0% | 100.0% | ||||||
|
|
|
|
|
|||||
F-96
Table of Contents
ING U.S., Inc.
Notes to the Consolidated Financial Statements
(Dollar amounts in millions, unless otherwise stated)
The following table summarizes the fair values of the pension plan assets as of December 31, 2013 by asset class were as follows:
| Level 1 | Level 2 | Level 3(1) | Total | |||||||||||||
| Assets |
||||||||||||||||
| Fixed maturities, short-term investments and cash: |
||||||||||||||||
| Cash and cash equivalents |
$ | 1.5 | $ | — | $ | — | $ | 1.5 | ||||||||
| Short-term investment fund(2) |
— | 153.8 | — | 153.8 | ||||||||||||
| U.S. Government securities |
58.4 | — | — | 58.4 | ||||||||||||
| U.S. corporate, state and municipalities |
2.6 | 340.9 | — | 343.5 | ||||||||||||
| Foreign securities |
— | 48.6 | — | 48.6 | ||||||||||||
| Residential mortgage-backed securities |
— | 2.9 | — | 2.9 | ||||||||||||
| Commercial mortgage-backed securities |
— | — | — | — | ||||||||||||
| Other asset-backed securities |
— | 1.1 | — | 1.1 | ||||||||||||
|
|
|
|
|
|
|
|
|
|||||||||
| Total fixed maturities |
62.5 | 547.3 | — | 609.8 | ||||||||||||
|
|
|
|
|
|
|
|
|
|||||||||
| Equity securities: |
||||||||||||||||
| Large-cap domestic |
412.0 | — | — | 412.0 | ||||||||||||
| Small/Mid-cap domestic |
91.4 | — | — | 91.4 | ||||||||||||
| International commingled funds(3) |
— | 221.5 | — | 221.5 | ||||||||||||
| Limited partnerships(4) |
— | — | 71.4 | 71.4 | ||||||||||||
|
|
|
|
|
|
|
|
|
|||||||||
| Total equity securities |
503.4 | 221.5 | 71.4 | 796.3 | ||||||||||||
|
|
|
|
|
|
|
|
|
|||||||||
| Other investments: |
||||||||||||||||
| Real estate(5) |
— | — | 74.6 | 74.6 | ||||||||||||
| Limited partnerships(6) |
— | — | 76.1 | 76.1 | ||||||||||||
|
|
|
|
|
|
|
|
|
|||||||||
| Total other investments |
— | — | 150.7 | 150.7 | ||||||||||||
|
|
|
|
|
|
|
|
|
|||||||||
| Total assets |
$ | 565.9 | $ | 768.8 | $ | 222.1 | $ | 1,556.8 | ||||||||
|
|
|
|
|
|
|
|
|
|||||||||
| Liabilities |
||||||||||||||||
| Derivatives |
$ | — | $ | — | — | $ | — | |||||||||
|
|
|
|
|
|
|
|
|
|||||||||
| Total Liabilities |
$ | — | $ | — | $ | — | $ | — | ||||||||
|
|
|
|
|
|
|
|
|
|||||||||
| Net, total pension assets |
$ | 565.9 | $ | 768.8 | $ | 222.1 | $ | 1,556.8 | ||||||||
|
|
|
|
|
|
|
|
|
|||||||||
| (1) | Level 3 net assets accounted for 14.3% of total net assets measured at fair value on a recurring basis. |
| (2) | This category includes common collective trust funds invested in the EB Temporary Investment Fund of The Bank of New York Mellon (“Short-term Investment Fund”). The Short-term Investment Fund is designed to provide a rate of return by investing in a full range of high-quality, short-term money market securities. Participant’s redemptions in the Short-term Investment Fund may be requested by 2 p.m. eastern standard time and are processed by the following day. |
| (3) | International Commingled funds are comprised of two assets which use NAV to calculate fair value. Baillie Gifford Funds has a balance of $119.5 and uses a bottom up approach to stock picking. In determining the potential of a company, the fund manager analyzes industry background, competitive advantage, management attitudes and financial strength, and valuation. There are no redemption restrictions in the Baillie Gifford Funds. Silchester has a fund balance of $102.0 that has an investment objective to achieve long-term growth primarily by investing in a diversified portfolio of equity securities of companies located in any country other than the United States. Silchester clients may contribute to and redeem monies from the |
F-97
Table of Contents
ING U.S., Inc.
Notes to the Consolidated Financial Statements
(Dollar amounts in millions, unless otherwise stated)
| funds on a monthly basis as of the last business day of each month. Clients must notify Silchester at least six business days before the month-end to make a redemption request. Baillie Gifford and Silchester, as a normal course of business, enter into contracts (commitments) that contain indemnifications or warranties. The funds’ maximum exposure under these arrangements is unknown, as this would involve future claims that have not yet occurred. Baillie Gifford and Silchester have no unfunded commitments. |
| (4) | Limited partnerships are comprised of two assets which use NAV to calculate fair value. Pantheon Europe has a balance of $16.5 and Pantheon USA has a balance of $54.9. Their strategy is to create a portfolio of high quality private equity funds, operating across Europe and diversified by stage, sector, geography, manager and vintage year. For the year ended December 31, 2013, Pantheon Europe and Pantheon USA have unfunded commitments of $3.8 and $11.1, respectively, and there were no significant redemption restrictions. |
| (5) | UBS Trumbull Property Fund (“UBS”) uses the NAV to calculate fair value. UBS has a balance of $74.6 and is an actively managed core portfolio of equity real estate. The Fund has both relative and real return objectives. Its relative performance objective is to outperform the National Council of Real Estate investment Fiduciaries Open-End Diversified Core (“NFI_ODCE”) index over any given three-to-five-year period. The Fund’s real return performance objective is to achieve at least a 5.0% real rate of return (i.e., inflation-adjusted return), before advisory fees, over any given three-to-five-year period. Investors may request redemptions of all or a portion of their units as of the end of a calendar quarter by delivering written notice to the Fund at least 60 days prior to the end of the quarter. |
| (6) | Magnitude Institutional, Ltd. (“MIL”) has a balance of $76.1 and is designed to realize appreciation in value primarily through the allocation of capital directly and indirectly among investment funds and accounts. There are significant redemption restrictions in the MIL fund. |
F-98
Table of Contents
ING U.S., Inc.
Notes to the Consolidated Financial Statements
(Dollar amounts in millions, unless otherwise stated)
The following table summarizes the fair values of the pension plan assets at December 31, 2012 by asset class were as follows:
| Level 1 | Level 2 | Level 3(1) | Total | |||||||||||||
| Assets |
||||||||||||||||
| Fixed maturities, short term investments and cash: |
||||||||||||||||
| Cash and cash equivalents |
$ | 21.8 | $ | — | $ | — | $ | 21.8 | ||||||||
| Short-term investment fund(2) |
— | 178.1 | — | 178.1 | ||||||||||||
| U.S. Government securities |
77.5 | — | — | 77.5 | ||||||||||||
| U.S. corporate, state and municipalities |
1.1 | 106.3 | — | 107.4 | ||||||||||||
| Foreign securities |
— | 40.0 | — | 40.0 | ||||||||||||
| Residential mortgage-backed securities |
— | 64.3 | — | 64.3 | ||||||||||||
| Commercial mortgage-backed securities |
— | 31.3 | — | 31.3 | ||||||||||||
| Other asset-backed securities |
— | 5.2 | — | 5.2 | ||||||||||||
|
|
|
|
|
|
|
|
|
|||||||||
| Total fixed maturities |
100.4 | 425.2 | — | 525.6 | ||||||||||||
|
|
|
|
|
|
|
|
|
|||||||||
| Equity securities: |
||||||||||||||||
| Large-cap domestic |
402.9 | — | — | 402.9 | ||||||||||||
| Small/Mid-cap domestic |
94.0 | — | — | 94.0 | ||||||||||||
| International commingled funds(3) |
— | 169.6 | — | 169.6 | ||||||||||||
| Limited partnerships(4) |
— | — | 60.8 | 60.8 | ||||||||||||
|
|
|
|
|
|
|
|
|
|||||||||
| Total equity securities |
496.9 | 169.6 | 60.8 | 727.3 | ||||||||||||
|
|
|
|
|
|
|
|
|
|||||||||
| Other investments: |
||||||||||||||||
| Real estate(5) |
— | — | 67.4 | 67.4 | ||||||||||||
| Limited partnerships(6) |
— | — | 62.2 | 62.2 | ||||||||||||
|
|
|
|
|
|
|
|
|
|||||||||
| Total other investments |
— | — | 129.6 | 129.6 | ||||||||||||
|
|
|
|
|
|
|
|
|
|||||||||
| Total assets |
$ | 597.3 | $ | 594.8 | $ | 190.4 | $ | 1,382.5 | ||||||||
|
|
|
|
|
|
|
|
|
|||||||||
| Liabilities |
||||||||||||||||
| Derivatives |
$ | 10.8 | $ | — | $ | — | $ | 10.8 | ||||||||
|
|
|
|
|
|
|
|
|
|||||||||
| Total Liabilities |
$ | 10.8 | $ | — | $ | — | $ | 10.8 | ||||||||
|
|
|
|
|
|
|
|
|
|||||||||
| Net, total pension assets |
$ | 586.5 | $ | 594.8 | $ | 190.4 | $ | 1,371.7 | ||||||||
|
|
|
|
|
|
|
|
|
|||||||||
| (1) | Level 3 net assets accounted for 13.9% of total net assets measured at fair value on a recurring basis. |
| (2) | This category includes common collective trust funds invested in the Short-term Investment Fund. The Short-term Investment Fund is designed to provide a rate of return by investing in a full range of high-quality, short-term money market securities. Participants redemptions in the Short-term Investment Fund were the result of the normal course of business, the Trustee permitted redemptions in cash. In order to control liquidity and realized losses on the sale of securities in the Short-term Investment Fund, requests for cash redemptions were not permitted where participants desired to exit the Short-term investment fund. |
| (3) | International Commingled funds are comprised of two assets which use NAV to calculate fair value. Baillie Gifford Funds has a balance of $90.7 and uses a bottom up approach to stock picking. In determining the potential of a company, the fund manager analyzes industry background, competitive advantage, management attitudes and financial strength, and valuation. There are no redemption restrictions in the Baillie Gifford Funds. Silchester has a fund balance of $78.9 that has an investment objective to achieve long-term growth primarily by investing in a diversified portfolio of equity securities of companies located |
F-99
Table of Contents
ING U.S., Inc.
Notes to the Consolidated Financial Statements
(Dollar amounts in millions, unless otherwise stated)
| in any country other than the United States. Silchester clients may contribute to and redeem moneys from the funds on a monthly basis as of the first business day of each month. Clients must notify Silchester at least six business days before the month-end to make a redemption request. Baillie Gifford and Silchester, as a normal course of business, enter into contracts (commitments) that contain indemnifications or warranties. The funds’ maximum exposure under these arrangements is unknown, as this would involve future claims that have not yet occurred. Baillie Gifford and Silchester have no unfunded commitments. |
| (4) | Limited partnerships are comprised of two assets which use NAV to calculate fair value. Pantheon Europe has a balance of $15.5 and Pantheon USA has a balance of $45.3. Their strategy is to create a portfolio of high quality private equity funds, operating across Europe and diversified by stage, sector, geography, manager and vintage year. For the year ended December 31, 2012, Pantheon Europe and Pantheon USA have unfunded commitments of $4.0 and $17.1, respectively, and there were no significant redemption restrictions. |
| (5) | UBS Trumbull Property Fund (“UBS”) uses the NAV to calculate fair value. UBS has a balance of $67.4 and is an actively managed core portfolio of equity real estate. The Fund has both relative and real return objectives. Its relative performance objective is to outperform the NFI_ODCE index over any given three-to-five-year period. The Fund’s real return performance objective is to achieve at least a 5.0% real rate of return (i.e., inflation-adjusted return), before advisory fees, over any given three-to-five-year period. |
| (6) | MIL has a balance of $62.2 and is designed to realize appreciation in value primarily through the allocation of capital directly and indirectly among investment funds and accounts. |
As described in Note 4. Fair Value Measurements (excluding Consolidated Investment Entities) to these Consolidated Financial Statements, pension plan assets are categorized into a three-level fair value hierarchy based upon the inputs available in valuating each of the assets. The fair value hierarchy gives the highest priority to quoted prices in active markets for identical assets (Level 1) and the lowest priority to unobservable inputs (Level 3). The leveling hierarchy is applied to the pension plans assets as follows:
Cash and cash equivalents: The carrying amounts for cash and cash equivalents reflect the assets’ fair value. The fair values for cash and cash equivalents are determined based on quoted market prices. These assets are classified as Level 1.
Short-term Investment Funds : Short term investment funds are valued by investment managers and are reported as a NAV per share in which is classified as Level 2. See subscript (5) in Fair Value Plan Assets footnote table for a description of the fund’s redemption policies.
U.S. Government securities, corporate bonds and notes, and foreign securities: Fair values for actively traded marketable bonds are determined based upon quoted market prices or dealer quotes and are classified as Level 1 assets. Corporate bonds, ABS, and U.S. agency bonds use observable pricing method such as matrix pricing, market corroborated pricing or inputs such as yield curves and indices. These investments are classified as Level 2.
International Commingled Funds: Commingled funds are classified as Level 2 investments. These investments categorize alternative assets as Level 2 when there is an ability to redeem its investments with the investee at the Net Asset Value (“NAV”) per share at the measurement date. If it is redeemable at a future date, the entity must consider the length of time in which the investment is redeemable in making the determination of the fair value hierarchy level. See subscript (3) in Fair Value Hierarchy table footnotes for description of the fund’s redemption policies.
Equity securities: Fair values are based upon a quoted market price determined in an active market and are included in Level 1. The valuations obtained from broker-dealers are non-binding.
F-100
Table of Contents
ING U.S., Inc.
Notes to the Consolidated Financial Statements
(Dollar amounts in millions, unless otherwise stated)
Real estate: Real estate is based on unobservable inputs. The fair value used relies on the investment manager’s own assumptions and the use of appraisals. These investments are included in Level 3. The fair value of the investment in this category has been estimated using the NAV per share.
Limited partnerships: Limited partnerships are classified as Level 3 because of the investment manager’s use of unobservable inputs in its valuation assumptions. The fair value of the investments in this category has been estimated using the NAV per share.
Derivatives: For the interest rate swaps, the fair values are derived using market observable inputs from third-party sources and are classified as Level 2. Futures contracts are based on unadjusted quoted prices from an active exchange and therefore, are classified as Level 1.
The following table summarizes the change in fair value of the pension plan’s Level 3 assets and liabilities and transfers in and out of Level 3 for the years ended December 31, 2013 and 2012:
| 2013 |
||||||||||||||||||||||||||||||||||||||||
| Actual Return on Plan Assets |
Issuances | Settlements | Transfers in to Level 3 |
Transfers out of Level 3 |
||||||||||||||||||||||||||||||||||||
| Fair Value as of January 1 |
Held at Year-end |
Sold During Year |
Purchases | Sales | Fair Value as of December 31 |
|||||||||||||||||||||||||||||||||||
| Other liabilities |
$ | — | $ | — | $ | — | $ | — | $ | — | $ | — | $ | — | $ | — | $ | — | $ | — | ||||||||||||||||||||
| Real estate |
67.4 | 0.8 | — | 6.4 | — | — | — | — | — | 74.6 | ||||||||||||||||||||||||||||||
| Limited partnerships |
123.0 | 13.7 | 2.5 | 18.2 | — | (9.9 | ) | — | — | — | 147.5 | |||||||||||||||||||||||||||||
|
|
|
|
|
|
|
|
|
|
|
|
|
|
|
|
|
|
|
|
|
|||||||||||||||||||||
| $ | 190.4 | $ | 14.5 | $ | 2.5 | $ | 24.6 | $ | — | $ | (9.9 | ) | $ | — | $ | — | $ | — | $ | 222.1 | ||||||||||||||||||||
|
|
|
|
|
|
|
|
|
|
|
|
|
|
|
|
|
|
|
|
|
|||||||||||||||||||||
| 2012 |
||||||||||||||||||||||||||||||||||||||||
| Actual Return on Plan Assets |
Issuances | Settlements | Transfers in to Level 3 |
Transfers out of Level 3 |
||||||||||||||||||||||||||||||||||||
| Fair Value as of January 1 |
Held at Year-end |
Sold During Year |
Purchases | Sales | Fair Value as of December 31 |
|||||||||||||||||||||||||||||||||||
| Other liabilities |
$ | (0.8 | ) | $ | — | $ | — | $ | — | $ | — | $ | 0.8 | $ | — | $ | — | $ | — | $ | — | |||||||||||||||||||
| Real estate |
62.0 | (0.4 | ) | — | 5.8 | — | — | — | — | — | 67.4 | |||||||||||||||||||||||||||||
| Limited partnerships |
110.1 | 9.7 | 0.3 | 7.6 | — | (4.7 | ) | — | — | — | 123.0 | |||||||||||||||||||||||||||||
|
|
|
|
|
|
|
|
|
|
|
|
|
|
|
|
|
|
|
|
|
|||||||||||||||||||||
| $ | 171.3 | $ | 9.3 | $ | 0.3 | $ | 13.4 | $ | — | $ | (3.9 | ) | $ | — | $ | — | $ | — | $ | 190.4 | ||||||||||||||||||||
|
|
|
|
|
|
|
|
|
|
|
|
|
|
|
|
|
|
|
|
|
|||||||||||||||||||||
Expected Future Contributions and Benefit Payments
The following table summarizes the expected benefit payments for the Company’s pension and postretirement plans to be paid for the years indicated are as follows:
| Pension Benefits |
Other Postretirement Benefits Gross |
|||||||
| 2014 |
$ | 97.1 | $ | 3.7 | ||||
| 2015 |
102.4 | 3.3 | ||||||
| 2016 |
107.9 | 3.0 | ||||||
| 2017 |
113.0 | 2.8 | ||||||
| 2018 |
119.0 | 2.6 | ||||||
| 2019-2022 |
670.9 | 11.1 | ||||||
F-101
Table of Contents
ING U.S., Inc.
Notes to the Consolidated Financial Statements
(Dollar amounts in millions, unless otherwise stated)
The Company expects that it will make a cash contribution of approximately $28.2 to the qualified and non-qualified pension plans and approximately $3.7 to other postretirement plans in 2014.
Defined Contribution Plans
Certain of the Company’s subsidiaries sponsor defined contribution plans. The largest defined contribution plan is the ING U.S. Savings Plan and ESOP (the “Savings Plan”). The assets of the Savings Plan are held in independently administered funds. Substantially all employees of the Company are eligible to participate, other than the Company’s agents. The Savings Plan is a tax qualified defined contribution and stock bonus plan, which includes an employee stock ownership plan component. Savings Plan benefits are not guaranteed by the PBGC. The Savings Plan allows eligible participants to defer into the Savings Plan a specified percentage of eligible compensation on a pretax basis. The Company matches such pretax contributions, up to a maximum of 6% of eligible compensation, subject to IRS limits. All matching contributions are subject to a 4 year graded vesting schedule. All contributions made to the Savings Plan are subject to certain limits imposed by applicable law. These plans do not give rise to balance sheet provisions, other than relating to short-term timing differences included in Other liabilities. The amount of cost recognized for the defined contribution pension plans for the years ended December 31, 2013, 2012 and 2011 was $37.2, $34.4 and $38.2, respectively, and is recorded in Operating expenses in the Consolidated Statements of Operations.
14. Accumulated Other Comprehensive Income (Loss)
Shareholders’ equity included the following components of Accumulated Other Comprehensive Income (“AOCI”) as of the dates indicated:
| December 31, | ||||||||||||
| 2013 | 2012 | 2011 | ||||||||||
| Fixed maturities, net of OTTI |
$ | 3,165.3 | $ | 7,863.0 | $ | 5,546.8 | ||||||
| Equity securities, available-for-sale |
47.0 | 42.2 | 33.2 | |||||||||
| Derivatives |
134.8 | 214.4 | 172.6 | |||||||||
| DAC/VOBA adjustment on available-for-sale securities |
(1,055.0 | ) | (2,783.6 | ) | (2,202.3 | ) | ||||||
| Sales inducements adjustment on available-for-sale securities |
(58.1 | ) | (147.4 | ) | (80.3 | ) | ||||||
| Other |
(27.7 | ) | (40.5 | ) | (33.2 | ) | ||||||
|
|
|
|
|
|
|
|||||||
| Unrealized capital gains (losses), before tax |
2,206.3 | 5,148.1 | 3,436.8 | |||||||||
| Deferred income tax asset (liability) |
(407.6 | ) | (1,496.8 | ) | (915.1 | ) | ||||||
|
|
|
|
|
|
|
|||||||
| Net unrealized capital gains (losses) |
1,798.7 | 3,651.3 | 2,521.7 | |||||||||
| Pension and other postretirement benefits liability, net of tax |
50.4 | 59.4 | 73.3 | |||||||||
|
|
|
|
|
|
|
|||||||
| AOCI |
$ | 1,849.1 | $ | 3,710.7 | $ | 2,595.0 | ||||||
|
|
|
|
|
|
|
|||||||
F-102
Table of Contents
ING U.S., Inc.
Notes to the Consolidated Financial Statements
(Dollar amounts in millions, unless otherwise stated)
Changes in AOCI, including the reclassification adjustments recognized in the Consolidated Statements of Operations were as follows for the periods indicated:
| As of December 31, 2013 | ||||||||||||
| Before-Tax Amount |
Income Tax |
After-Tax Amount |
||||||||||
| Available-for-sale securities: |
||||||||||||
| Fixed maturities |
$ | (4,628.9 | ) | $ | 1,678.3 | (4) | $ | (2,950.6 | ) | |||
| Equity securities |
4.8 | (0.3 | ) | 4.5 | ||||||||
| Other |
12.8 | (4.5 | ) | 8.3 | ||||||||
| OTTI |
48.0 | (16.8 | ) | 31.2 | ||||||||
| Adjustments for amounts recognized in Net realized capital gains (losses) in the Consolidated Statements of Operations |
(116.8 | ) | 40.9 | (75.9 | ) | |||||||
| DAC/VOBA |
1,728.6 | (1) | (605.0 | ) | 1,123.6 | |||||||
| Sales inducements |
89.3 | (31.3 | ) | 58.0 | ||||||||
|
|
|
|
|
|
|
|||||||
| Change in unrealized gains/losses on available-for-sale securities |
(2,862.2 | ) | 1,061.3 | (1,800.9 | ) | |||||||
|
|
|
|
|
|
|
|||||||
| Derivatives: |
||||||||||||
| Derivatives |
(76.9 | )(2) | 27.0 | (49.9 | ) | |||||||
| Adjustments related to effective cash flow hedges for amounts recognized in Net investment income in the Consolidated Statements of Operations |
(2.7 | ) | 0.9 | (1.8 | ) | |||||||
|
|
|
|
|
|
|
|||||||
| Change in unrealized gains/losses on derivatives |
(79.6 | ) | 27.9 | (51.7 | ) | |||||||
|
|
|
|
|
|
|
|||||||
| Pension and other postretirement benefits liability: |
||||||||||||
| Amortization of prior service cost recognized in Operating expenses in the Consolidated Statements of Operations |
(13.8 | )(3) | 4.8 | (9.0 | ) | |||||||
|
|
|
|
|
|
|
|||||||
| Change in pension and other postretirement benefits liability |
(13.8 | ) | 4.8 | (9.0 | ) | |||||||
|
|
|
|
|
|
|
|||||||
| Change in Other comprehensive income (loss) |
$ | (2,955.6 | ) | $ | 1,094.0 | $ | (1,861.6 | ) | ||||
|
|
|
|
|
|
|
|||||||
| (1) | See Note 5. Deferred Policy Acquisition Costs and Value of Business Acquired for additional information. |
| (2) | See Note 3. Derivative Financial Instruments for additional information. |
| (3) | See Note 13. Employee Benefit Arrangements for amounts reported in Net Periodic (Benefit) Costs. |
| (4) | Amount includes $65.6 release of valuation allowance. See Note 15. Income Taxes to these Consolidated Financial Statements for additional information. |
F-103
Table of Contents
ING U.S., Inc.
Notes to the Consolidated Financial Statements
(Dollar amounts in millions, unless otherwise stated)
| As of December 31, 2012 | ||||||||||||
| Before-Tax Amount |
Income Tax |
After-Tax Amount |
||||||||||
| Available-for-sale securities: |
||||||||||||
| Fixed maturities |
$ | 2,653.8 | $ | (907.7 | ) | $ | 1,746.1 | |||||
| Equity securities |
9.0 | (3.2 | ) | 5.8 | ||||||||
| Other |
(7.3 | ) | 2.6 | (4.7 | ) | |||||||
| OTTI |
52.2 | (18.3 | ) | 33.9 | ||||||||
| Adjustments for amounts recognized in Net realized capital gains (losses) in the Consolidated Statements of Operations |
(389.8 | ) | 132.5 | (257.3 | ) | |||||||
| DAC/VOBA |
(581.3 | )(1) | 203.5 | (377.8 | ) | |||||||
| Sales inducements |
(67.1 | ) | 23.5 | (43.6 | ) | |||||||
|
|
|
|
|
|
|
|||||||
| Change in unrealized gains/losses on available-for-sale securities |
1,669.5 | (567.1 | ) | 1,102.4 | ||||||||
|
|
|
|
|
|
|
|||||||
| Derivatives: |
||||||||||||
| Derivatives |
41.8 | (2) | (14.6 | ) | 27.2 | |||||||
| Adjustments related to effective cash flow hedges for amounts recognized in Net investment income in the Consolidated Statements of Operations |
— | — | — | |||||||||
|
|
|
|
|
|
|
|||||||
| Change in unrealized gains/losses on derivatives |
41.8 | (14.6 | ) | 27.2 | ||||||||
|
|
|
|
|
|
|
|||||||
| Pension and other postretirement benefits liability: |
||||||||||||
| Amortization of prior service cost recognized in Operating expenses in the Consolidated Statements of Operations |
(21.4 | )(3) | 7.5 | (13.9 | ) | |||||||
|
|
|
|
|
|
|
|||||||
| Change in pension and other postretirement benefits liability |
(21.4 | ) | 7.5 | (13.9 | ) | |||||||
|
|
|
|
|
|
|
|||||||
| Change in Other comprehensive income (loss) |
$ | 1,689.9 | $ | (574.2 | ) | $ | 1,115.7 | |||||
|
|
|
|
|
|
|
|||||||
| (1) | See Note 5. Deferred Policy Acquisition Costs and Value of Business Acquired to the Consolidated Financial Statements for additional information. |
| (2) | See Note 3. Derivative Financial Instruments to the Consolidated Financial Statements for additional information. |
| (3) | See Note 13. Employee Benefit Arrangements to the Consolidated Financial Statements for amounts reported in Net Periodic (Benefit) Costs. |
F-104
Table of Contents
ING U.S., Inc.
Notes to the Consolidated Financial Statements
(Dollar amounts in millions, unless otherwise stated)
| As of December 31, 2011 | ||||||||||||
| Before-Tax Amount |
Income Tax |
After-Tax Amount |
||||||||||
| Available-for-sale securities: |
||||||||||||
| Fixed maturities |
$ | 2,505.0 | $ | (489.7 | )(4) | $ | 2,015.3 | |||||
| Equity securities |
(42.4 | ) | 14.8 | (27.6 | ) | |||||||
| Other |
5.6 | (2.1 | ) | 3.5 | ||||||||
| OTTI |
165.4 | (57.9 | ) | 107.5 | ||||||||
| Adjustments for amounts recognized in Net realized capital gains (losses) in the Consolidated Statements of Operations |
(47.8 | ) | 16.7 | (31.1 | ) | |||||||
| DAC/VOBA |
(951.3 | )(1) | 333.0 | (618.3 | ) | |||||||
| Sales inducements |
15.1 | (5.3 | ) | 9.8 | ||||||||
|
|
|
|
|
|
|
|||||||
| Change in unrealized gains/losses on available-for-sale securities |
1,649.6 | (190.5 | ) | 1,459.1 | ||||||||
|
|
|
|
|
|
|
|||||||
| Derivatives: |
||||||||||||
| Derivatives |
171.2 | (2) | (59.9 | ) | 111.3 | |||||||
| Adjustments related to effective cash flow hedges for amounts recognized in Net investment income in the Consolidated Statements of Operations |
— | — | — | |||||||||
|
|
|
|
|
|
|
|||||||
| Change in unrealized gains/losses on derivatives |
171.2 | (59.9 | ) | 111.3 | ||||||||
|
|
|
|
|
|
|
|||||||
| Pension and other postretirement benefits liability: |
||||||||||||
| Amortization of prior service cost recognized in Operating expenses in the Consolidated Statements of Operations |
78.9 | (3) | (27.6 | ) | 51.3 | |||||||
|
|
|
|
|
|
|
|||||||
| Change in pension and other postretirement benefits liability |
78.9 | (27.6 | ) | 51.3 | ||||||||
|
|
|
|
|
|
|
|||||||
| Change in Other comprehensive income (loss) |
$ | 1,899.7 | $ | (278.0 | ) | $ | 1,621.7 | |||||
|
|
|
|
|
|
|
|||||||
| (1) | See Note 5. Deferred Policy Acquisition Costs and Value of Business Acquired to the Consolidated Financial Statements for additional information. |
| (2) | See Note 3. Derivative Financial Instruments to the Consolidated Financial Statements for additional information. |
| (3) | See Note 13. Employee Benefit Arrangements to the Consolidated Financial Statements for amounts reported in Net Periodic (Benefit) Costs. |
| (4) | Amount includes $387.0 release of valuation allowance. See Note 15. Income Taxes to these Consolidated Financial Statements for additional information. |
F-105
Table of Contents
ING U.S., Inc.
Notes to the Consolidated Financial Statements
(Dollar amounts in millions, unless otherwise stated)
15. Income Taxes
Income tax expense (benefit) consisted of the following for the periods indicated:
| Years Ended December 31, | ||||||||||||
| 2013 | 2012 | 2011 | ||||||||||
| Current tax expense (benefit): |
||||||||||||
| Federal |
$ | 84.6 | $ | 51.3 | $ | (18.0 | ) | |||||
| State |
(6.4 | ) | (5.3 | ) | (22.0 | ) | ||||||
|
|
|
|
|
|
|
|||||||
| Total current tax expense (benefit) |
78.2 | 46.0 | (40.0 | ) | ||||||||
|
|
|
|
|
|
|
|||||||
| Deferred tax expense (benefit): |
||||||||||||
| Federal |
(112.5 | ) | (49.4 | ) | 213.0 | |||||||
| State |
1.8 | (1.8 | ) | 2.0 | ||||||||
|
|
|
|
|
|
|
|||||||
| Total deferred tax expense (benefit) |
(110.7 | ) | (51.2 | ) | 215.0 | |||||||
|
|
|
|
|
|
|
|||||||
| Total income tax expense (benefit) |
$ | (32.5 | ) | $ | (5.2 | ) | $ | 175.0 | ||||
|
|
|
|
|
|
|
|||||||
Income taxes were different from the amount computed by applying the federal income tax rate to income (loss) before income taxes for the following reasons for the periods indicated:
| Years Ended December 31, | ||||||||||||
| 2013 | 2012 | 2011 | ||||||||||
| Income (loss) before income taxes |
$ | 758.1 | $ | 606.0 | $ | 277.8 | ||||||
| Tax rate |
35.0 | % | 35.0 | % | 35.0 | % | ||||||
|
|
|
|
|
|
|
|||||||
| Income tax expense (benefit) at federal statutory rate |
265.3 | 212.1 | 97.2 | |||||||||
| Tax effect of: |
||||||||||||
| Valuation allowance |
(86.6 | ) | (48.3 | ) | 175.0 | |||||||
| Dividend received deduction |
(119.3 | ) | (101.3 | ) | (74.0 | ) | ||||||
| Audit settlement |
(4.1 | ) | (4.3 | ) | 13.0 | |||||||
| State tax expense (benefit) |
5.9 | (8.8 | ) | 17.0 | ||||||||
| Noncontrolling interest |
(66.5 | ) | (48.4 | ) | (67.0 | ) | ||||||
| Tax credits |
(14.8 | ) | (19.6 | ) | (19.0 | ) | ||||||
| Non-deductible expenses |
(14.6 | ) | 14.2 | 32.0 | ||||||||
| Other |
2.2 | (0.8 | ) | 0.8 | ||||||||
|
|
|
|
|
|
|
|||||||
| Income tax expense (benefit) |
$ | (32.5 | ) | $ | (5.2 | ) | $ | 175.0 | ||||
|
|
|
|
|
|
|
|||||||
F-106
Table of Contents
ING U.S., Inc.
Notes to the Consolidated Financial Statements
(Dollar amounts in millions, unless otherwise stated)
Temporary Differences
The tax effects of temporary differences that give rise to deferred tax assets and deferred tax liabilities as of December 31, 2013 and 2012, are presented below:
| 2013 | 2012 | |||||||
| Deferred tax assets |
||||||||
| Federal and state loss carryforwards |
$ | 1,112.9 | $ | 1,154.9 | ||||
| Investments |
3,379.2 | 1,811.1 | ||||||
| Insurance reserves |
499.3 | 1,967.1 | ||||||
| Compensation and benefits |
423.7 | 578.7 | ||||||
| Other assets |
399.4 | 182.7 | ||||||
|
|
|
|
|
|||||
| Total gross assets before valuation allowance |
5,814.5 | 5,694.5 | ||||||
| Less: Valuation allowance |
2,821.9 | 2,974.1 | ||||||
|
|
|
|
|
|||||
| Assets, net of valuation allowance |
2,992.6 | 2,720.4 | ||||||
| Deferred tax liabilities |
||||||||
| Net unrealized investment gains |
(1,160.3 | ) | (2,707.9 | ) | ||||
| Deferred policy acquisition costs |
(1,596.4 | ) | (1,045.3 | ) | ||||
| Other liabilities |
(73.8 | ) | (9.9 | ) | ||||
|
|
|
|
|
|||||
| Total gross liabilities |
(2,830.5 | ) | (3,763.1 | ) | ||||
|
|
|
|
|
|||||
| Net deferred income tax asset (liability) |
$ | 162.1 | $ | (1,042.7 | ) | |||
|
|
|
|
|
|||||
The following table sets forth the federal, state and capital loss carryforwards for tax purposes as of December 31, 2013 and 2012:
| 2013 | 2012 | |||||||
| Federal net operating loss carryforward(1) |
$ | 2,871.5 | $ | 2,947.0 | ||||
| State net operating loss carryforward(1) |
2,376.0 | 2,373.6 | ||||||
| Federal tax capital loss carryforward(2) |
88.3 | 123.4 | ||||||
| Credit carryforward(3) |
279.1 | 191.5 | ||||||
| (1) | Expire between 2017 and 2033. |
| (2) | Expire between 2014 and 2018. |
| (3) | Expire between 2014 and 2033. |
Valuation allowances are provided when it is considered unlikely that deferred tax assets will be realized. As of December 31, 2013 and 2012, the Company had valuation allowances of $3.2 billion and $3.3 billion respectively, that were allocated to continuing operations, and $(354.1) and $(288.5) as of the end of each period that were allocated to other comprehensive income related to realized and unrealized capital losses.
For the years ended December 31, 2013, 2012 and 2011, the increases (decreases) in the valuation allowances were $(152.2), $99.1, and $(212.0), respectively. In 2013, 2012 and 2011, there were increases (decreases) of $(86.6), $99.1, and $175.0, respectively, in the valuation allowance that were allocated to operations and (decreases) of $(65.6), $0.0 and $(387.0), respectively, that were allocated to Other comprehensive income. With respect to the 2013 amount allocated to operations, the decrease of $(86.6) was due to positive evidence primarily the result of current year net income before income tax. With respect to the 2012 amount allocated to operations, there was a decrease of $(48.3) that impacted income tax expense as a reduction in the valuation
F-107
Table of Contents
ING U.S., Inc.
Notes to the Consolidated Financial Statements
(Dollar amounts in millions, unless otherwise stated)
allowance due to positive evidence primarily the result of net income before income tax, and the remainder consisted of a $147.4 increase in the valuation allowance that did not impact income tax expense, which was established against the Company’s estimate of additional deferred tax assets based on the Company’s 2011 tax return as filed. The 2011 amount allocated to operations was primarily the result of increasing negative evidence that caused a change in judgment regarding the ability to realize deferred tax assets. For 2011, the Company concluded that the cumulative loss in recent years was significant negative evidence requiring the establishment of a valuation allowance. For 2013 and 2011, the valuation allowance allocated to Other comprehensive income was directly related to the appreciation of the Company’s available-for-sale portfolio during those years and not due to changes in expectations of taxable income in future periods.
Unrecognized Tax Benefits
Reconciliations of the change in the unrecognized income tax benefits were as follows for the periods indicated:
| Years Ended December 31, | ||||||||||||
| 2013 | 2012 | 2011 | ||||||||||
| Balance at beginning of period |
$ | 61.1 | $ | 74.0 | $ | 197.0 | ||||||
| Additions for tax positions related to current year |
1.7 | 2.4 | 7.0 | |||||||||
| Additions for tax positions related to prior years |
4.4 | 1.3 | — | |||||||||
| Reductions for tax positions related to prior years |
(1.2 | ) | (6.0 | ) | (25.0 | ) | ||||||
| Reductions for settlements with taxing authorities |
— | — | (105.0 | ) | ||||||||
| Reductions for expiring statutes |
(5.1 | ) | (10.6 | ) | — | |||||||
|
|
|
|
|
|
|
|||||||
| Balance at end of period |
$ | 60.9 | $ | 61.1 | $ | 74.0 | ||||||
|
|
|
|
|
|
|
|||||||
The Company had $16.1, $19.7, and $24.0 of unrecognized tax benefits as of December 31, 2013, 2012 and 2011, respectively, which would affect the Company’s effective rate if recognized.
Interest and Penalties
The Company recognizes interest expense and penalties, if applicable, related to unrecognized tax benefits in tax expense net of federal income tax. The total amounts of gross accrued interest and penalties on the Company’s Consolidated Balance Sheets as of December 31, 2013 and 2012 were $6.2 and $5.9, respectively. The Company recognized gross interest (benefit) related to unrecognized tax in its Consolidated Statements of Operations of $0.3, $(17.3) and $(7.0) for the years ended December 31, 2013, 2012 and 2011, respectively.
Tax Regulatory Matters
During the first quarter 2013, the IRS completed its examination of the Company’s returns through tax year 2011. The 2011 audit settlement did not have a material impact on the financial statements. The Company is currently under audit by the IRS, and it is expected that the examination of tax year 2012 will be finalized within the next twelve months. The Company and the IRS have agreed to participate in the Compliance Assurance Program for the tax years 2012 through 2014.
The Company does not expect any material changes to the unrecognized tax benefits within the next year.
F-108
Table of Contents
ING U.S., Inc.
Notes to the Consolidated Financial Statements
(Dollar amounts in millions, unless otherwise stated)
16. Financing Agreements
Short-term Debt
The following table summarizes the Company’s short-term debt including the weighted average interest rate on short-term borrowings outstanding as of December 31, 2013 and 2012:
| Weighted Average Rate | ||||||||||||||||
| 2013 | 2012 | 2013 | 2012 | |||||||||||||
| Commercial paper |
$ | — | $ | 192.0 | — | % | 1.22 | % | ||||||||
| Current portion of long-term debt(1)(2) |
— | 872.6 | — | % | 2.42 | % | ||||||||||
|
|
|
|
|
|||||||||||||
| Total |
$ | — | $ | 1,064.6 | ||||||||||||
|
|
|
|
|
|||||||||||||
| (1) | See the “Credit Facilities” section of this note for information on the Term Loan Agreement of the Senior Unsecured Credit Facility. |
| (2) | See Note 18. Related Party Transactions-Affiliated Financing Agreements to these Consolidated Financial Statements. |
Commercial Paper
The Company had a commercial paper program with an authorized capacity of $3.0 billion, which was guaranteed by ING V. The Company paid ING V 10 basis points (“bps”) on the outstanding balance of the commercial paper program as a fee for this guarantee. The Company’s commercial paper borrowings were generally used to fund the working capital needs of the Company’s subsidiaries and provide short-term liquidity. All outstanding amounts were repaid in April 2013. On October 3, 2013, the Company terminated the commercial paper program along with the guarantee provided by ING V.
F-109
Table of Contents
ING U.S., Inc.
Notes to the Consolidated Financial Statements
(Dollar amounts in millions, unless otherwise stated)
Long-term Debt
The following table summarizes the carrying value of the Company’s long-term debt securities issued and outstanding as of December 31, 2013 and 2012:
| Maturity | 2013 | 2012 | ||||||||||
| 2.21% Syndicated Bank Term Loan, due 2014 |
04/20/2014 | $ | — | $ | 1,350.0 | |||||||
| 6.75% Lion Connecticut Holdings Inc. debentures, due 2013(1) |
09/15/2013 | — | 138.3 | |||||||||
| 7.25% Lion Connecticut Holdings Inc. debentures, due 2023(1) |
08/15/2023 | 158.6 | 158.1 | |||||||||
| 7.63% Lion Connecticut Holdings Inc. debentures, due 2026(1) |
08/15/2026 | 232.1 | 231.9 | |||||||||
| 8.42% Equitable of Iowa Companies Capital Trust II Notes, due 2027 |
04/01/2027 | 13.8 | 13.9 | |||||||||
| 6.97% Lion Connecticut Holdings Inc. debentures, due 2036(1) |
08/15/2036 | 108.6 | 108.6 | |||||||||
| 2.54% Lion Connecticut Holdings Inc. Floating Rate Note, due 2016 |
04/29/2016 | — | 500.0 | |||||||||
| 1.00% Windsor Property Loan |
06/14/2027 | 4.9 | 4.9 | |||||||||
| 0.96% Surplus Floating Rate Note |
12/31/2037 | — | 359.3 | |||||||||
| 0.93% Surplus Floating Rate Note |
06/30/2037 | — | 329.1 | |||||||||
| 5.5% Senior Notes, due 2022 |
07/15/2022 | 849.6 | 849.6 | |||||||||
| 2.9% Senior Notes, due 2018 |
02/15/2018 | 998.5 | — | |||||||||
| 5.65% Fixed-to-Floating Rate Junior Subordinated Notes, due 2053 |
05/15/2053 | 750.0 | — | |||||||||
| 5.7% Senior Notes, due 2043 |
07/15/2043 | 398.6 | — | |||||||||
|
|
|
|
|
|||||||||
| Subtotal |
3,514.7 | 4,043.7 | ||||||||||
| Less: Current portion of long-term debt |
— | 872.6 | ||||||||||
|
|
|
|
|
|||||||||
| Total |
$ | 3,514.7 | $ | 3,171.1 | ||||||||
|
|
|
|
|
|||||||||
| (1) | Guaranteed by ING Group. |
As of December 31, 2013 and 2012, the Company was in compliance with all debt covenants.
Unsecured senior debt which consists of senior notes, fixed rate notes and other notes with varying interest rates, rank highest in priority, followed by subordinated debt which consists of junior subordinated debt securities.
Aggregate amounts of future principal payments of long-term debt for the next five years and thereafter are as follows:
| 2014 |
$ | — | ||
| 2015 |
— | |||
| 2016 |
— | |||
| 2017 |
— | |||
| 2018 |
1,000.0 | |||
| Thereafter |
2,524.0 | |||
|
|
|
|||
| Total |
$ | 3,524.0 | ||
|
|
|
F-110
Table of Contents
ING U.S., Inc.
Notes to the Consolidated Financial Statements
(Dollar amounts in millions, unless otherwise stated)
Senior Notes
On July 13, 2012, ING U.S., Inc. issued $850.0 of unsecured 5.5% Senior Notes due 2022 (the “2022 Notes”) in a private placement with registration rights. The 2022 Notes are guaranteed by Lion Holdings. Interest is paid semi-annually, in arrears, on each January 15 and July 15, commencing on January 15, 2013. ING Financial Markets, LLC, an affiliate, served as Joint Book Running Manager for the 2022 Notes and was paid $0.3 for its services. The Company used the proceeds of the 2022 Notes to repay $500.0 of the direct borrowings under a $3.5 billion committed Revolving Credit Agreement (“Revolving Credit Agreement”). The remaining proceeds were used for general corporate purposes, including the retirement of a portion of our outstanding commercial paper.
On February 11, 2013, ING U.S., Inc. issued $1.0 billion of unsecured 2.9% Senior Notes due 2018 (the “2018 Notes”) in a private placement with registration rights. The 2018 Notes are guaranteed by Lion Holdings. Interest is paid semi-annually, in arrears, on each February 15 and August 15, commencing on August 15, 2013. ING Financial Markets, LLC, an affiliate, served as Joint Book Running Manager for the 2018 Notes and was paid $0.3 for its services. The Company made payments totaling $850.0 on the Term Loan portion of the Company’s Senior Unsecured Credit Facility from the proceeds of the 2018 Notes. The remaining proceeds were used for general corporate purposes.
On July 26, 2013, ING U.S., Inc. issued $400.0 of unsecured 5.7% Senior Notes due 2043 (the “2043 Notes”) in a private placement with registration rights. The 2043 Notes are guaranteed by Lion Holdings. Interest is paid semi-annually on each January 15 and July 15, commencing on January 15, 2014. ING Financial Markets, LLC, an affiliate, served as Senior Co-Manager for the 2043 Notes and was paid an immaterial amount for its services. The Company used the proceeds of the 2043 Notes for general corporate purposes, including the repayment of certain borrowings.
Junior Subordinated Notes
On May 16, 2013, ING U.S., Inc. issued $750.0 of 5.65% Fixed-to-Floating Rate Junior Subordinated Notes due 2053 (the “2053 Notes”) in a private placement with registration rights. The 2053 Notes are guaranteed on junior subordinated basis by Lion Holdings. Interest is paid semi-annually, in arrears, on each May 15 and November 15, commencing November 15, 2013 and ending on May 15, 2023. The 2053 Notes will bear interest at a fixed rate of 5.65% prior to May 15, 2023. From May 15, 2023, the 2053 Notes will bear interest at an annual rate equal to three-month LIBOR plus 3.58% payable quarterly, in arrears, on February 15, May 15, August 15 and November 15. So long as no event of default with respect to the 2053 Notes has occurred and is continuing, the Company has the right on one or more occasions, to defer the payment of interest on the 2053 Notes for one or more consecutive interest periods for up to five years. During the deferral period, interest will continue to accrue at the then-applicable rate and deferred interest will bear additional interest at the then-applicable rate. ING Financial Markets, LLC, an affiliate, served as Senior Co-Manager for the 2053 Notes and was paid $0.2 for its services.
At any time following notice of the Company’s plan to defer interest and during the period interest is deferred, the Company and its subsidiaries generally, with certain exceptions, may not make payments on or redeem or purchase any shares of the Company’s common stock or any of the debt securities or guarantees that rank in liquidation on a parity with or are junior to the 2053 Notes.
The Company may elect to redeem the 2053 Notes (i) in whole at any time or in part on or after May 15, 2023 at a redemption price equal to the principal amount plus accrued and unpaid interest. If the notes are not redeemed in whole, $25.0 of aggregate principal (excluding the principal amount of 2053 Notes held by the Company, or
F-111
Table of Contents
ING U.S., Inc.
Notes to the Consolidated Financial Statements
(Dollar amounts in millions, unless otherwise stated)
its affiliates) must remain outstanding after giving effect to the redemption; or (ii) in whole, but not in part, at any time prior to May 15, 2023 within 90 days after the occurrence of a “tax event” or “rating agency event”, as defined in the 2053 Notes Offering Memorandum, at a redemption price equal to the principal amount, or, if greater, a “make-whole redemption price,” as defined in the 2053 Notes Offering Memorandum, plus, in each case accrued and unpaid interest.
On May 21, 2013, the Company used the proceeds from the 2053 Notes for the repayment of the remaining outstanding borrowings of $392.5 under the Term Loan portion of the Company’s Senior Unsecured Credit Facility. The remaining proceeds were used to partially repay borrowings with ING V.
Registration Rights Agreements
Under the Registration Rights Agreements associated with the 2022 Notes, the 2018 Notes, the 2053 Notes and the 2043 Notes, ING U.S., Inc. and Lion Holdings agreed to use reasonable best efforts to cause a registration statement to be filed with the SEC that, upon effectiveness, would permit holders of these notes to exchange them for new notes containing identical terms except for the restrictions on transfer contained in the original notes. The offer to exchange the 2022 Notes, the 2018 Notes and the 2053 Notes was completed on August 14, 2013. The offer to exchange the 2043 Notes was completed on December 23, 2013.
Aetna Notes
ING Group guarantees various debentures of Lion Holdings that were assumed by Lion Holdings in connection with the Company’s acquisition of Aetna’s life insurance and related businesses in 2000 (the “Aetna Notes”). Concurrent with the completion of the Company’s IPO, the Company entered into a shareholder agreement with ING Group that governs certain aspects of the Company’s continuing relationship. The Company agreed in the shareholder agreement to reduce the aggregate outstanding principal amount of Aetna Notes to:
| • | no more than $400.0 as of December 31, 2015; |
| • | no more than $300.0 as of December 31, 2016; |
| • | no more than $200.0 as of December 31, 2017; |
| • | no more than $100.0 as of December 31, 2018; |
| • | and zero as of December 31, 2019. |
The reduction in principal amount of Aetna Notes can be accomplished, at the Company’s option, through redemptions, repurchases or other means, but will also be deemed to have been reduced to the extent the Company posts collateral with a third-party collateral agent, for the benefit of ING Group, which may consist of cash collateral; certain investment-grade debt instruments; a letter of credit (“LOC”) meeting certain requirements; or senior debt obligations of ING Group or a wholly owned subsidiary of ING Group (other than the Company or its subsidiaries).
If the Company fails to reduce the outstanding principal amount of the Aetna Notes, the Company agreed to pay a quarterly fee (ranging from 0.5% per quarter for 2016 to 1.25% per quarter for 2019) to ING Group based on the outstanding principal amount of Aetna Notes which exceed the limits set forth above.
On September 15, 2013, the Company repaid, at maturity, a portion of the Aetna Notes which carried an ING Group guarantee. As of December 31, 2013, the outstanding par amount of the Aetna Notes guaranteed by ING Group was $506.1.
F-112
Table of Contents
ING U.S., Inc.
Notes to the Consolidated Financial Statements
(Dollar amounts in millions, unless otherwise stated)
Surplus Notes
On November 1, 2007, Whisperingwind II, LLC (“Whisperingwind II”), an indirect wholly owned subsidiary of the Company, entered into a Variable Funding Surplus Note Purchase Agreement (the “WWII Purchase Agreement”) with Structured Asset Repackaged Trust II, 2005-B (the “STARTS Trust”), a Delaware statutory business trust organized by HSBC Securities (USA), Inc. (“HSBC”), as part of an insurance securitization transaction. Under the WWII Purchase Agreement, Whisperingwind II is provided opportunity for issuance and sale, and for the STARTS Trust to purchase one or more floating rate variable funding surplus notes (“WWII Note”).
On December 31, 2012, the Company executed a binding letter of intent with a third-party reinsurer on behalf of RLI and Whisperingwind II, its indirect wholly owned subsidiaries, to enter into a novation and recapture agreement related to an existing insurance securitization transaction. As a result, the carrying value of the WWII Note of $359.3 was repaid on January 3, 2013 and recorded as current debt in the December 31, 2012 financial statements. The WWII Note bears interest at a variable rate equal to LIBOR plus periodic adjustments as defined by the WWII Purchase Agreement. There was no interest paid for the year ended December 31, 2013. Interest paid for the years ended December 31, 2012 and 2011 was $4.1.and $3.1, respectively.
On June 29, 2007, Whisperingwind III, LLC (Whisperingwind III”), an indirect wholly owned subsidiary of the Company, entered into a Variable Funding Surplus Note Purchase Agreement (the “WWIII Purchase Agreement”) with Structured Asset Repackaged Trust II, 2007-ING WWIII (the “WWIII STARTS Trust”), a Delaware statutory business trust organized by HSBC, as part of an insurance securitization transaction. Under the WWIII Purchase Agreement, Whisperingwind III is provided opportunity for issuance and sale, and for the WWIII STARTS Trust to purchase one or more floating rate variable funding surplus notes (the “WWIII Note”) up to an aggregate principal commitment amount of $498.8 with an available commitment period extending through June 30, 2037. There were no amounts outstanding on the WWIII Note at December 31, 2013. The carrying value and par value of the WWIII Note at December 31, 2012 was $329.1. The WWIII Note bears interest at a variable rate equal to the LIBOR plus periodic adjustments as defined by the WWIII Purchase Agreement. Principal and interest repayments cannot be made without prior written approval (or written confirmation of non-disapproval) of the South Carolina Director of Insurance. In anticipation of receiving regulatory approval to redeem the WWIII Note, and upon the agreement of the ceding insurer, WWIII replaced the surplus note with LOCs totaling $305.0. Upon receiving regulatory approval, on April 19, 2013 WWIII executed a Redemption and Cancellation Agreement with WWIII STARTS Trust to redeem the WWIII Note in full. The carrying amount of the WWIII Note, $329.1, was paid in full on April 19, 2013, and was cancelled. Interest paid for the years ended December 31, 2013, 2012 and 2011 was $1.0, $3.7 and $3.0, respectively. Effective January 1, 2014, the reinsurance agreements were novated from WWIII to Roaring River IV, LLC (“Roaring River IV”), a wholly owned reinsurance subsidiary of the Company. The LOCs were cancelled and replaced with trust notes provided under a reimbursement agreement with a third-party bank.
Windsor Property Loan
On June 16, 2007, the State of Connecticut acting on behalf of the Department of Economic and Community Development (“DECD”) loaned ILIAC $9.9 (the “DECD Loan”) in connection with the development of a corporate office facility located at One Orange Way, Windsor, Connecticut (the “Windsor Property”). The loan has a term of twenty years and bears an annual interest rate of 1.00%. As long as no defaults have occurred under the loan, no payments of principal or interest are due for the initial ten years of the loan. For the second ten years of the DECD Loan term, ILIAC is obligated to make monthly payments of principal and interest.
The DECD Loan provided for loan forgiveness during the first five years of the term at varying amounts up to $5.0 if ILIAC and its affiliates met certain employment thresholds at the Windsor Property during that period. On
F-113
Table of Contents
ING U.S., Inc.
Notes to the Consolidated Financial Statements
(Dollar amounts in millions, unless otherwise stated)
December 1, 2008, the DECD determined that the Company had met the employment thresholds for loan forgiveness and, accordingly, forgave $5.0 of the DECD Loan to ILIAC in accordance with the terms of the DECD Loan. The DECD Loan provides additional loan forgiveness at varying amounts up to $4.9 if ILIAC and its ING affiliates meet certain employment thresholds at the Windsor Property during years five through ten of the loan. ILIAC’s obligations under the DECD Loan are secured by an unlimited recourse guaranty from ING North America Corporation. In November 2012, ILIAC provided a letter of credit to the DECD in the amount of $10.6 as security for its repayment obligations with respect to the loan.
As of December 31, 2013 and 2012, the amount of the loan outstanding was $4.9, which was reflected in Long-term debt on the Consolidated Balance Sheets.
Credit Facilities
The Company maintains credit facilities used primarily for collateral required under affiliated reinsurance transactions and also for general corporate purposes. As of December 31, 2013, unsecured and uncommitted credit facilities totaled $17.0, unsecured and committed credit facilities totaled $9.0 billion and secured facilities totaled $275.0. Of the aggregate $9.3 billion ($1.4 billion with ING Bank, N.V. (“ING Bank”), an affiliate) capacity available, the Company utilized $6.3 billion ($734.9 with ING Bank) in credit facilities outstanding as of December 31, 2013. Total fees associated with credit facilities for the years ended December 31, 2013, 2012 and 2011 were $149.3, $223.2 and $103.4, respectively.
F-114
Table of Contents
ING U.S., Inc.
Notes to the Consolidated Financial Statements
(Dollar amounts in millions, unless otherwise stated)
The following table outlines the Company’s credit facilities, their dates of expiration, capacity and utilization as of December 31, 2013:
| Secured/ Unsecured |
Committed/ Uncommitted |
Expiration | Capacity | Utilization | Unused Commitment |
|||||||||||||
| Obligor / Applicant |
||||||||||||||||||
| ING U.S., Inc.(1)(2) |
Unsecured | Committed | 4/20/2015 | $ | 3,500.0 | $ | 2,103.9 | $ | 1,396.1 | |||||||||
| ING U.S., Inc. / Security Life of Denver International Limited, Roaring River LLC(1)(3) |
Unsecured | Uncommitted | 2/28/2013 | 15.0 | 15.0 | — | ||||||||||||
| ING U.S., Inc. / Security Life of Denver International Limited |
Unsecured | Committed | 11/9/2021 | 750.0 | 750.0 | — | ||||||||||||
| Security Life of Denver International Limited(1) |
Unsecured | Committed | 10/29/2020 | 1,125.0 | 569.6 | 555.4 | ||||||||||||
| ING U.S., Inc. / Security Life of Denver International Limited |
Unsecured | Committed | 12/27/2022 | 750.0 | 750.0 | — | ||||||||||||
| ING U.S., Inc. / Security Life of Denver International Limited |
Unsecured | Committed | 12/29/2023 | 250.0 | 250.0 | — | ||||||||||||
| ReliaStar Life Insurance Company |
Secured | Committed | Conditional | 265.0 | 265.0 | — | ||||||||||||
| ING U.S., Inc. / Security Life of Denver International Limited |
Unsecured | Committed | 12/31/2025 | 475.0 | 475.0 | — | ||||||||||||
| ING U.S., Inc. |
Unsecured | Uncommitted | Various dates |
2.0 | 2.0 | — | ||||||||||||
| ING U.S., Inc. |
Secured | Uncommitted | Various dates |
10.0 | 4.7 | — | ||||||||||||
| ING U.S., Inc. / Roaring River III LLC |
Unsecured | Committed | 6/30/2022 | 1,151.2 | 581.0 | 570.2 | ||||||||||||
| ING U.S., Inc. / Roaring River II LLC |
Unsecured | Committed | 12/31/2021 | 995.0 | 573.0 | 422.0 | ||||||||||||
|
|
|
|
|
|
|
|||||||||||||
| Total |
$ | 9,288.2 | $ | 6,339.2 | $ | 2,943.7 | ||||||||||||
|
|
|
|
|
|
|
|||||||||||||
| Secured facilities |
$ | 275.0 | $ | 269.7 | $ | — | ||||||||||||
| Unsecured and uncommitted |
17.0 | 17.0 | — | |||||||||||||||
| Unsecured and committed |
8,996.2 | 6,052.5 | 2,943.7 | |||||||||||||||
|
|
|
|
|
|
|
|||||||||||||
| Total |
$ | 9,288.2 | $ | 6,339.2 | $ | 2,943.7 | ||||||||||||
|
|
|
|
|
|
|
|||||||||||||
| ING Bank |
$ | 1,390.0 | $ | 734.9 | $ | 655.1 | ||||||||||||
|
|
|
|
|
|
|
|||||||||||||
| (1) | Refer to Note 18. Related Party Transactions to these Consolidated Financial Statements for additional information. |
| (2) | On February 14, 2014, the term of the facility was extended to February 14, 2018 and the total amount of LOCs that may be issued was reduced from $3.5 billion to $3.0 billion. |
| (3) | Facilities matured as of the date stated above. Each LOC issued prior to the facility expiring remains outstanding until its stated expiry date. On January 14, 2014, the letter of credit was cancelled and the corresponding guarantee obligation of ING V was extinguished. |
F-115
Table of Contents
ING U.S., Inc.
Notes to the Consolidated Financial Statements
(Dollar amounts in millions, unless otherwise stated)
Effective October 30, 2013, SLDI completed a $1.125 billion letter of credit facility which replaced the $825.0 letter of credit facility maturing December 31, 2013 and the $300.0 letter of credit facility which matured June 30, 2013. The new facility provides $1.125 billion of capacity on a committed basis until October 29, 2020 and supports the Individual Reinsurance business.
Effective December 31, 2013, SLDI and ING U.S., Inc. completed a $250.0 letter of credit facility with a third-party bank which matures December 29, 2023 and also supports the Individual Reinsurance business.
Effective January 1, 2014, the reinsurance agreements with Whisperingwind III were novated to Roaring River IV, a wholly owned reinsurance subsidiary of the Company, which completed a transaction with a third-party bank to provide up to $565.0 of AG38 reserve financing through a trust note which matures December 31, 2028. The initial amount of the trust note issued on January 1, 2014 is $297.0. The trust note replaces $330.0 of letters of credit associated with the Whisperingwind III reinsurance agreements which were cancelled in January 2014.
Effective January 15, 2014, Langhorne I, LLC (“Langhorne I”), a wholly owned reinsurance subsidiary of the Company, completed a financing arrangement with a third-party trust to provide up to $500.0 of trust note collateral funding. The financing arrangement is designed to manage reserve and capital requirements in connection with the stable value business and matures on January 15, 2019. No trust notes were being utilized as of financing arrangement inception.
Effective January 24, 2014, SLDI entered into a letter of credit facility agreement with a third-party bank providing up to $150.0 of committed capacity until January 24, 2018 which supports reserves on an affiliated reinsurance agreement in connection with a portion of its deferred annuity business.
Senior Unsecured Credit Facility
On April 20, 2012, the Company entered into a $5.0 billion unsecured Senior Credit Facility (“Senior Unsecured Credit Facility”) with a syndicate of banks, replacing financing that was either internally funded or guaranteed by ING V. The Senior Unsecured Credit Facility is guaranteed by Lion Holdings, a wholly owned subsidiary of the Company. As part of the Senior Unsecured Credit Facility, the Company entered into a Revolving Credit Agreement and a $1.5 billion syndicated Term Loan Agreement (“Term Loan Agreement”).
The Revolving Credit Agreement includes a $3.5 billion LOC facility with a revolving credit borrowing sublimit of $1.5 billion. Under the terms of the Revolving Credit Agreement, the revolving credit borrowing sublimit would be reduced by 50% of any debt securities issued by the Company, to a minimum of $750.0. Additionally, the terms required ING U.S., Inc. to maintain liquidity of $500.0 at all times. The total amount of LOCs and revolving credit borrowings outstanding at any time may not exceed $3.5 billion. The Revolving Credit Agreement expires on April 20, 2015 at which time any outstanding borrowings are due. The Company must collateralize any LOCs outstanding as of the expiration date of the facility. As of December 31, 2013, $2.1 billion of LOCs were outstanding under the Revolving Credit Agreement. Of this total, LOCs issued by ING Bank amount to $150.3. The costs of the Revolving Credit Agreement vary depending on the current credit rating of the Company. Currently, the Company pays interest equal to LIBOR plus 200 bps on direct borrowings and an issuance fee of 200 bps for LOCs.
As of December 31, 2013, there were no amounts outstanding as revolving credit borrowings. On July 17, 2012, the Company repaid $500.0 of revolving credit borrowings with proceeds from the issuance of the 2022 Notes. As a result of the issuance of the 2018 Notes and the 2022 Notes, the revolving credit borrowing sublimit was reduced to $750.0. As a member of the syndicate which entered into the Revolving Credit Agreement, ING Bank
F-116
Table of Contents
ING U.S., Inc.
Notes to the Consolidated Financial Statements
(Dollar amounts in millions, unless otherwise stated)
committed up to $250.0 in financing. ING Bank acted as Joint Lead Arranger, Joint Book Manager and Documentation Agent for these transactions. For these services, ING Bank received various fees totaling $3.3.
On May 21, 2013, ING U.S., Inc. repaid all amounts outstanding under the Term Loan Agreement. This action, together with the satisfaction of certain other requirements, caused the requirement to maintain liquidity of $500.0 at all times to terminate.
Amended and Restated Credit Agreement
On February 14, 2014 the Company revised the terms of its Revolving Credit Agreement by entering into the Amended and Restated Revolving Credit Agreement (the “Amended and Restated Credit Agreement”) with a syndicate of banks. The Amended and Restated Credit Agreement modifies the original agreement by 1) extending the term of the agreement to February 14, 2018; 2) reducing the total amount of LOCs that may be issued from $3.5 billion to $3.0 billion and 3) reducing the current cost of LOC issuance fees from 200 bps to 175 bps. ING Bank, an affiliate, acted as Joint Lead Arranger, Joint Book Manager and Documentation Agent and received $0.7 for its services and participation in the syndicate.
17. Commitments and Contingencies
Leases
The Company leases its office space and certain equipment under operating leases, the longest term of which expires in 2025.
For the years ended December 31, 2013, 2012 and 2011, rent expense for leases was $40.5, $41.7 and $51.3, respectively. The future net minimum payments under noncancelable leases for the years ended December 31, 2014 through 2018 are estimated to be $32.7, $32.2, $31.3, $27.6 and $17.4, respectively, and $74.6, thereafter, totaling $215.8. The Company pays substantially all expenses associated with its leased and subleased office properties.
Commitments
Through the normal course of investment operations, the Company commits to either purchase or sell securities, mortgage loans, or money market instruments, at a specified future date and at a specified price or yield. The inability of counterparties to honor these commitments may result in either a higher or lower replacement cost. Also, there is likely to be a change in the value of the securities underlying the commitments.
As of December 31, 2013, the Company had off-balance sheet commitments to purchase investments equal to their fair value of $1.2 billion, of which $321.3 relates to consolidated investment entities. As of December 31, 2012, the Company had off-balance sheet commitments to purchase investments equal to their fair value of $890.1, of which $254.9 relates to consolidated investment entities.
Insurance Company Guaranty Fund Assessments
Insurance companies are assessed on the costs of funding the insolvencies of other insurance companies by the various state guaranty associations, generally based on the amount of premiums companies collect in that state.
The Company accrues the cost of future guaranty fund assessments based on estimates of insurance company’s insolvencies provided by the National Organization of Life and Health Insurance Guaranty Associations and the
F-117
Table of Contents
ING U.S., Inc.
Notes to the Consolidated Financial Statements
(Dollar amounts in millions, unless otherwise stated)
amount of premiums written in each state. The Company has estimated this undiscounted liability, which is included in Other liabilities on the Consolidated Balance Sheets, to be $19.2 and $51.3 as of December 31, 2013 and 2012, respectively. The Company has also recorded an asset, in Other assets on the Consolidated Balance Sheets of $18.4 and $20.9 as of December 31, 2013 and 2012, respectively, for future credits to premium taxes. The Company estimates its liabilities for future assessments under state insurance guaranty association laws. The Company believes the reserves established are adequate for future assessments relating to insurance companies that are currently subject to insolvency proceedings.
Restricted Assets
The Company is required to maintain assets on deposit with various regulatory authorities to support its insurance operations. The Company may also post collateral in connection with certain securities lending, repurchase agreements, funding agreements, credit facilities and derivative transactions. The components of the fair value of the restricted assets were as follows as of December 31, 2013 and 2012:
| 2013 | 2012 | |||||||
| Fixed maturity collateral pledged to FHLB |
$ | 2,333.4 | $ | 3,400.9 | ||||
| FHLB restricted stock(1) |
99.1 | 144.6 | ||||||
| Other fixed maturities-state deposits |
251.0 | 262.1 | ||||||
| Securities pledged(2) |
1,465.7 | 1,605.5 | ||||||
|
|
|
|
|
|||||
| Total restricted assets |
$ | 4,149.2 | $ | 5,413.1 | ||||
|
|
|
|
|
|||||
| (1) | Included in Other investments in the Consolidated Balance Sheets. |
| (2) | Includes the fair value of loaned securities of $435.4 and $601.8 as of December 31, 2013 and 2012, respectively, which is included in Securities pledged on the Consolidated Balance Sheets. In addition, as of December 31, 2013 and 2012, the Company delivered securities as collateral of $1.0 billion, respectively, which was included in Securities pledged in the Consolidated Balance Sheets. |
Federal Home Loan Bank Funding Agreements
The Company is a member of the FHLB of Des Moines and the FHLB of Topeka and are required to pledge collateral to back funding agreements issued to the FHLB. As of December 31, 2013 and 2012, the Company had $1.8 billion and $2.6 billion in non-putable funding agreements, respectively, which are included in Contract owner account balances on the Consolidated Balance Sheets. As of December 31, 2013 and 2012, the Company had $265.0 in LOCs issued by the FHLBs, respectively. As of December 31, 2013 and 2012, assets with a market value of approximately $2.0 billion and $3.1 billion, respectively, collateralized the FHLB funding agreements. As of December 31, 2013 and 2012, assets with a market value of approximately $294.1 and $336.5, respectively, collateralized the FHLB LOCs. Assets pledged to the FHLBs are included in Fixed maturities, available-for-sale, on the Consolidated Balance Sheets.
Litigation and Regulatory Matters
The Company is a defendant in a number of litigation matters arising from the conduct of its business, both in the ordinary course and otherwise. In some of these matters, claimants seek to recover very large or indeterminate amounts, including compensatory, punitive, treble and exemplary damages. Modern pleading practice in the U.S. permits considerable variation in the assertion of monetary damages and other relief. Claimants are not always required to specify the monetary damages they seek or they may be required only to state an amount sufficient to
F-118
Table of Contents
ING U.S., Inc.
Notes to the Consolidated Financial Statements
(Dollar amounts in millions, unless otherwise stated)
meet a court’s jurisdictional requirements. Moreover, some jurisdictions allow claimants to allege monetary damages that far exceed any reasonable possible verdict. The variability in pleading requirements and past experience demonstrates that the monetary and other relief that may be requested in a lawsuit or claim often bears little relevance to the merits or potential value of a claim. Litigation against the Company includes a variety of claims including negligence, breach of contract, fraud, violation of regulation or statute, breach of fiduciary duty, negligent misrepresentation, failure to supervise, elder abuse and other torts.
As with other financial services companies, the Company periodically receives informal and formal requests for information from various state and federal governmental agencies and self-regulatory organizations in connection with inquiries and investigations of the products and practices of the Company or the financial services industry. It is the practice of the Company to cooperate fully in these matters.
The outcome of a litigation or regulatory matter and amount or range of potential loss is difficult to forecast and estimating potential losses requires significant management judgment. It is not possible to predict the ultimate outcome or to provide reasonably possible losses or ranges of losses for all pending regulatory matters and litigation. While it is possible that an adverse outcome in certain cases could have a material adverse effect upon the Company’s financial position, based on information currently known, management believes that the outcome of pending litigation and regulatory matters is not likely to have such an effect. However, given the large and indeterminate amounts sought and the inherent unpredictability of such matters, it is possible that an adverse outcome in certain of the Company’s litigation or regulatory matters could, from time to time, have a material adverse effect upon the Company’s results of operations or cash flows in a particular quarterly or annual period.
For some matters, the Company is able to estimate a possible range of loss. For such matters in which a loss is probable, an accrual has been made. This paragraph contains an estimate of reasonably possible losses above any amounts accrued. For matters where the Company, however, believes a loss is reasonably possible, but not probable, no accrual is required. For matters for which an accrual has been made, but there remains a reasonably possible range of loss in excess of the amounts accrued, the estimate reflects the reasonably possible range of loss in excess of the accrued amounts. For matters for which a reasonably possible (but not probable) range of loss exists, the estimate reflects the reasonably possible and unaccrued loss or range of loss. As of December 31, 2013, the Company estimates the aggregate range of reasonably possible losses, in excess of any amounts accrued for these matters as of such date, to be up to approximately $100.0.
For other matters, the Company is currently not able to estimate the reasonably possible loss or range of loss. The Company is often unable to estimate the possible loss or range of loss until developments in such matters have provided sufficient information to support an assessment of the range of possible loss, such as quantification of a damage demand from plaintiffs, discovery from plaintiffs and other parties, investigation of factual allegations, rulings by a court on motions or appeals, analysis by experts and the progress of settlement discussions. On a quarterly and annual basis, the Company reviews relevant information with respect to litigation and regulatory contingencies and updates the Company’s accruals, disclosures and reasonably possible losses or ranges of loss based on such reviews.
Litigation against the Company includes a case styled Healthcare Strategies, Inc., Plan Administrator of the Healthcare Strategies Inc. 401(k) Plan v. ING Life Insurance and Annuity Company (U.S.D.C. D. CT, filed February 22, 2011), in which sponsors of 401(k) plans governed by ERISA, claim that ILIAC has entered into revenue sharing agreements with mutual funds and others in violation of the prohibited transaction rules of ERISA. Among other things, the plaintiffs seek disgorgement of all revenue sharing payments and profits earned in connection with such payments, an injunction barring the practice of revenue sharing, and attorney fees. On September 26, 2012, the district court certified the case as a class action in which the named plaintiffs represent approximately 15,000 similarly situated plan sponsors. ILIAC denies the allegations and is vigorously defending
F-119
Table of Contents
ING U.S., Inc.
Notes to the Consolidated Financial Statements
(Dollar amounts in millions, unless otherwise stated)
this litigation. The Court conducted a bench trial of the liability issues, which concluded on October 3, 2013 and the Court has taken the matter under advisement.
Regulatory matters include considerable regulatory scrutiny regarding whether and to what extent life insurance companies are using the United States Social Security Administration’s Death Master File (“SSDMF”) to proactively ascertain when customers have deceased and to pay benefits even where no claim for benefits has been made. The Company has received industry-wide and company-specific inquiries and is engaged in multi-state market conduct examinations with respect to its claims settlement practices, including its use of Personal Transition Accounts and of the SSDMF and compliance with unclaimed property laws. The Company also has been reviewing whether benefits are owed and whether reserves are adequate in instances where an insured appears to have died, but no claim for death benefits has been made. Some of the investigations, exams, inquiries and audits could result in regulatory action against the Company. The potential outcome of such action is difficult to predict but could subject the Company to adverse consequences, including, but not limited to, settlement payments, additional payments to beneficiaries and additional escheatment of funds deemed abandoned under state laws. The investigations may also result in fines and penalties and changes to the Company’s procedures for the identification and escheatment of abandoned property and other financial liability. On June 6, 2013, the Company executed a Global Resolution Agreement (“GRA”) establishing a process to resolve the audit of the Company’s compliance with unclaimed property laws being conducted by a majority of the states. The GRA became effective on July 26, 2013. The GRA establishes procedures for determining whether amounts may be payable under certain life insurance policies, annuity contracts, and retained asset accounts. It also establishes procedures for seeking to locate and pay beneficiaries and owners and for escheating benefits (with interest in certain circumstances) to relevant jurisdictions.
On August 13, 2013, the Company executed a Regulatory Settlement Agreement (“RSA”) that settles a multi-state market conduct examination (“Exam”) regarding benefit payment practices, procedures and policy administration relating to claims, and use of the SSDMF, including efforts to identify owners and beneficiaries of unclaimed benefits. The RSA establishes procedures for determining whether benefits may be payable under certain life insurance policies, annuity contracts, and retained asset accounts. It also establishes procedures for seeking to locate and pay beneficiaries and owners. The RSA became effective on September 4, 2013. Fifty Departments of Insurance have executed the RSA.
18. Related Party Transactions
In the normal course of business, the Company enters into various transactions with affiliated companies. Parties are considered to be related if one party has the ability to control or exercise significant influence over the other party in making financial or operating decisions.
The following tables summarize income and expense from transactions with related parties for the periods indicated:
| Years Ended December 31, | ||||||||||||||||||||||||
| 2013 | 2012 | 2011 | ||||||||||||||||||||||
| Income | Expense | Income | Expense | Income | Expense | |||||||||||||||||||
| ING V |
$ | 1.9 | $ | 6.1 | $ | 1.8 | $ | 13.5 | $ | 11.1 | $ | 38.9 | ||||||||||||
| ING Group |
7.4 | 18.0 | 13.9 | 8.2 | — | 78.1 | ||||||||||||||||||
| ING Bank |
7.2 | 39.5 | 35.5 | 104.6 | 367.9 | 67.1 | ||||||||||||||||||
| Other |
18.6 | 14.6 | 10.5 | 7.9 | 18.4 | 20.7 | ||||||||||||||||||
|
|
|
|
|
|
|
|
|
|
|
|
|
|||||||||||||
| Total |
$ | 35.1 | $ | 78.2 | $ | 61.7 | $ | 134.2 | $ | 397.4 | $ | 204.8 | ||||||||||||
|
|
|
|
|
|
|
|
|
|
|
|
|
|||||||||||||
F-120
Table of Contents
ING U.S., Inc.
Notes to the Consolidated Financial Statements
(Dollar amounts in millions, unless otherwise stated)
Assets and liabilities from transactions with related parties as of December 31, 2013 and 2012 are shown in the following table:
| 2013 | 2012 | |||||||||||||||
| Assets | Liabilities | Assets | Liabilities | |||||||||||||
| ING V |
$ | 0.5 | $ | 0.2 | $ | 0.3 | $ | 501.9 | ||||||||
| ING Group |
1.3 | 0.9 | 3.4 | 0.1 | ||||||||||||
| ING Bank |
13.8 | 5.8 | 33.6 | 33.6 | ||||||||||||
| Other |
2.6 | 2.0 | 2.2 | 1.1 | ||||||||||||
|
|
|
|
|
|
|
|
|
|||||||||
| Total |
$ | 18.2 | $ | 8.9 | $ | 39.5 | $ | 536.7 | ||||||||
|
|
|
|
|
|
|
|
|
|||||||||
The material agreements whereby the Company generates revenues and expenses with affiliated entities are as follows:
Credit Facilities
The Company is a borrower in several credit facility agreements with ING Bank, in which ING Bank provides LOC capacity. The Company had accrued payables of $4.9 and $18.4 as of December 31, 2013 and 2012, respectively. The Company incurred expenses of $38.2, $98.2, and $43.7 for the years ended December 31, 2013, 2012 and 2011, respectively.
During 2011, 2012 and 2013, the Company utilized $825.0 of capacity from a committed LOC facility, maturing in December 2013, with ING Bank completed in September 2008 to support the reinsurance obligations of SLDI. See Note 19. Consolidated Investment Entities-Collateral Support for Reinsurance Contracts to these Consolidated Financial Statements for further discussion. Additionally, on July 1, 2011, the Company entered into a $625.0 bilateral LOC facility agreement with ING Bank. Effective October 4, 2012, the LOC facility was reduced to $300.0 and extended for another year until June 30, 2013. Effective October 30, 2013, SLDI completed a $1.125 billion LOC facility with ING Bank which replaced the $300.0 LOC facility which matured June 30, 2013 as well as the $825.0 LOC facility maturing December 2013. The new $1.125 billion LOC facility matures effective October 29, 2020.
On April 20, 2012, ING U.S., Inc. entered into the Revolving Credit Agreement. ING Bank has committed to providing $250.0 of the $3.5 billion in total financing under the Revolving Credit Agreement.
The Company provided a $15.0 LOC for a captive reinsurance subsidiary which was issued by ING Bank and was scheduled to expire in 2026. ING V was the guarantor of the LOC and indemnifies ING Bank up to $15.0. On January 14, 2014, the LOC was cancelled and the corresponding guarantee obligation of ING V was extinguished.
On December 31, 2011, the Company entered into a $1.5 billion contingent capital LOC facility with ING Bank to support the reinsurance obligations of SLDI to another of the Company’s wholly-owned subsidiaries, which was unconditional and irrevocable and scheduled to expire on December 31, 2031. Following the deposit by SLDI of contributed capital as cash collateral into a funds withheld trust account to support its reinsurance obligations to ING USA, the $1.5 billion contingent capital LOCs issued under the contingent capital LOC facility were cancelled and on May 14, 2013, the $1.5 billion contingent capital LOC facility was terminated.
F-121
Table of Contents
ING U.S., Inc.
Notes to the Consolidated Financial Statements
(Dollar amounts in millions, unless otherwise stated)
Affiliated Financing Agreements
The Company previously borrowed funds from time to time from ING V under a facility loan agreement (the “Facility Loan Agreement”). The borrowings under the Facility Loan Agreement were made at varying rates of interest and had varying maturity dates. The Company incurred no interest for the years ended December 31, 2013 and 2012. The Company incurred interest of $32.1 for the year ended December 31, 2011.
During 2011, the Company made an additional $263.0 of borrowings under the Facility Loan Agreement. Subsequently, during 2011, ING V contributed to the Company all borrowings under the Facility Loan Agreement. The debt outstanding under the Facility Loan Agreement was immediately extinguished as a result of the contribution. The borrowings contributed had a book value and fair value of $4.0 billion.
In 2007 the Company entered into a $500.0 par floating rate loan agreement with ING V pursuant to which the Company pays a variable rate of interest based on three month LIBOR. This note originally was to have matured on August 10, 2012. Effective April 13, 2012, however, the term of the note was extended to April 29, 2016 (the “2.54% Lion Connecticut Holdings Inc. Floating Rate Note, due 2016”). As of December 31, 2012, the Company had debt of $500.0 related to this loan agreement. On July 5, 2013, the outstanding balance of $150.0 for this note was paid in full to ING V. The Company incurred interest of $5.6, $12.5 and $1.8 for the years ended December 31, 2013, 2012 and 2011, respectively.
Derivatives
The Company is party to several derivative contracts with ING V and ING Bank and one or more of ING Bank’s subsidiaries. Each of these contracts were entered into as a result of a competitive bid, which included unaffiliated counterparties. The Company is exposed to various risks relating to its ongoing business operations, including but not limited to interest rate risk, foreign currency risk and equity market risk. To manage these risks, the Company uses various strategies, including derivatives contracts, certain of which are with related parties, such as interest rate swaps, equity options and currency forwards.
As of December 31, 2013 and 2012, the outstanding notional amounts were $518.9 (consisting of interest rate swaps of $328.8 and equity options of $190.1) and $2.1 billion (consisting of interest rate swaps of $1.9 billion and equity options of $265.7), respectively. As of December 31, 2013 and 2012, the market values for these contracts were $10.5 and $15.6, respectively. For the years ended December 31, 2013, 2012 and 2011, the Company recorded net realized capital gains (losses) of $1.7, $20.1 and $376.4, respectively, with ING Bank and ING V.
The Company has sold protection under certain credit default swap derivative contracts that were previously supported by a guarantee provided by ING V. During 2013, the guarantee provided by ING V on the sold protection was replaced with guarantees provided by ING U.S., Inc. The Company purchased protection under one credit default swap derivative contract that is supported by the ING V guarantee with the potential exposure limited to swap premiums to be paid. As of December 31, 2013 and 2012, the maximum potential future exposure to the Company on credit default swaps supported by the ING V guarantee was $43.5 million and $1.0 billion, respectively.
Operating Agreements
ING Investment Management LLC (“IIM”), a wholly owned subsidiary of the Company, has certain operating agreements whereby it generates revenues and incurs expenses with affiliated entities. As of December 31, 2013,
F-122
Table of Contents
ING U.S., Inc.
Notes to the Consolidated Financial Statements
(Dollar amounts in millions, unless otherwise stated)
IIM generated revenues and incurred expenses of $26.0 and $15.0, respectively, with ING V, ING Group and other affiliates under the following operating agreements. As of December 31, 2012, IIM generated revenues and incurred expenses of $20.0 and $8.8, respectively, with ING V, ING Group and other affiliates under the following operating agreements. As of December 31, 2011, IIM generated revenues and incurred expenses of $20.6 and $17.8, respectively, with ING V and Other Affiliates, under the following operating agreements:
| • | IIM manages, co-manages, and distributes certain investment products for various affiliates. For the years ended December 31, 2013, 2012 and 2011, revenue earned under these agreements was $25.7, $20.0 and $19.1, respectively. |
| • | IIM receives distribution fees for the sale of certain offshore funds to U.S. clients and closed end funds in the U.S. For the year ended December 31, 2013, revenue under these arrangements was $0.3. For the year ended December 31, 2012 there was no revenue under these arrangements. For the year ended December 31, 2011, revenue under these agreements was $1.5. |
| • | IIM pays sub advisory and other fees to certain affiliates related to the management of mutual funds and other investment products. For the years ended December 31, 2013, 2012 and 2011, fees incurred under these agreements were $15.0, $12.3 and $23.1, respectively. |
| • | IIM provided IT support, management oversight, risk management, procurement services, and trade processing to certain affiliates and is reimbursed for a share of the related costs. For the year ended December 31, 2013, there were no expenses reimbursed to IIM under these agreements. For the years ended December 31, 2012 and 2011, expenses reimbursed to IIM under these agreements were $3.9 and $8.2, respectively. |
| • | IIM received allocation of expenses from affiliates located outside of U.S. for staff and projects costs. For the year ended December 31, 2013, there were no costs incurred under these agreements. For the years ended December 31, 2012 and 2011, costs incurred under these agreements were $0.4 and $2.9, respectively. |
As of December 31, 2013, the Company had net receivables of $2.2 resulting from operating agreements with other affiliates, ING Bank and ING V of $0.6, $1.3 and $0.3, respectively. As of December 31, 2012, the Company had net receivables of $1.9 resulting from operating agreements with other affiliates, ING Group and ING V of $1.1, $0.7 and $0.1, respectively.
Administrative Overhead Allocations
The Company is allocated expenses for various administrative and corporate services provided by ING Group. Net allocations were $2.2, $6.6 and $25.6 for the years ended December 31, 2013, 2012 and 2011, respectively.
Latin America Service Arrangements
Prior to the divestiture of ING Group’s Latin American pensions, life insurance and investment management businesses in December 2011, the Company provided a variety of services to its Latin American affiliates, including personnel, legal, compliance, IT, finance and accounting and other services pursuant to an agreement with one of ING’s Latin American subsidiaries. The Company incurred net expenses of $24.6 for the year ended December 31, 2011. In 2012, this agreement was replaced by a transition services agreement between the Company and ING Group pursuant to which the Company has continued providing certain of these services through the end of 2013. The Company was reimbursed by ING Group for the entire $1.7 and $30.1 of expenses incurred for the years ended December 31, 2013 and 2012. In June 2012, as part of an agreement with ING Group, the Company was reimbursed by ING Group for $22.0 of expenses incurred during 2011.
F-123
Table of Contents
ING U.S., Inc.
Notes to the Consolidated Financial Statements
(Dollar amounts in millions, unless otherwise stated)
Funding Agreements
On April 9, 2009, the Company sold a funding agreement in the amount of $600.0 to the Columbine Funding Trust (“CFT”), a special purpose Delaware business trust. CFT, in turn, issued a trust note to ING Bank, an affiliate, which was collateralized by the cash flows from the funding agreement and otherwise matches the terms of the funding agreement. The Company is not a party to the trust note. The funding agreement was scheduled to mature in April 2012, however it was terminated on May 18, 2011 with an early termination fee paid to ING Bank of $8.6. The interest expense related to the funding agreement was $7.5 for the year ended December 31, 2011.
Back-up Facility
On January 26 2009, ING, for itself and on behalf of certain subsidiaries, including the Company, reached an agreement with the Dutch State on an Illiquid Asset Back-up Facility (the “Alt-A Back-up Facility”) regarding Alt-A RMBS owned by certain subsidiaries, including the Company. Pursuant to this transaction, the Company transferred all risks and rewards on 80% of a $4.5 billion par Alt-A RMBS portfolio to ING Support Holding B.V., a wholly owned subsidiary of ING Group (“ING Support Holding”) by means of the granting of a participation interest to ING Support Holding. ING and ING Support Holding entered into a back-to-back arrangement with the Dutch State on this 80%. As a result of this transaction, the Company retained 20% of the exposure for any results on the $4.5 billion Alt-A RMBS portfolio.
The purchase price for the participation payable by the Dutch State was set at 90% of the par value of the 80% interest in the securities as of that date. This purchase price was payable in installments, was recognized as a loan granted to the Dutch State with a value of $3.3 billion, and was recorded as Loan-Dutch State Obligation on the Consolidated Balance Sheets (the “Dutch State Obligation”). Under the transaction, other fees were payable by both the Company and the Dutch State.
On November 13, 2012, ING, ING Support Holding, ING Bank, and the Company entered into restructuring arrangements with the Dutch State, which closed the following day (the “Termination Agreement”). Pursuant to the restructuring transaction, the Company sold the Dutch State Obligation to ING Support Holding at fair value and transferred legal title to 80% of the securities subject to the Alt-A Back-up Facility to ING Bank. The restructuring resulted in an immaterial pre-tax loss. Following the restructuring transaction, the Company continued to own 20% of the Alt-A RMBS from the transaction and had the right to sell these securities, subject to a right of first refusal granted to ING Bank.
The Company incurred no net fees for the year ended December 31, 2013. The Company incurred net fees of $6.1 and $8.3 for the years ended December 31, 2012 and 2011, respectively.
Asset Management Arrangements
Prior to the Termination Agreement, IIM managed the underlying assets and provided services related to the Company’s securities subject to the Alt-A Back-up Facility pursuant to services agreements with each of the participating subsidiaries.
ING, ING Bank and ING Direct U.S., as part of ING’s divestiture of ING Direct U.S., entered into an agreement with the Dutch State similar to the Termination Agreement with respect to the Alt-A RMBS owned by ING Direct U.S. (the “ING Direct Restructuring”). As part of the ING Direct Restructuring, in February 2012, IIM entered into an agreement (the “Alt-A Asset Management Agreement”) with ING Bank pursuant to which it
F-124
Table of Contents
ING U.S., Inc.
Notes to the Consolidated Financial Statements
(Dollar amounts in millions, unless otherwise stated)
managed the assets transferred to ING Bank from ING Direct. In November 2012, in connection with the Termination Agreement, this Alt-A Asset Management Agreement was amended to provide that IIM would also manage the assets transferred to ING Bank as part of the Termination Agreement. For the years ended December 31, 2013 and 2012, ING Bank paid the Company approximately $5.5 and $7.7 in fees related to the Alt-A Asset Management Agreement.
19. Consolidated Investment Entities
The Company provides investment management services to and has transactions with, various collateralized loan obligations, private equity funds, single strategy hedge funds, insurance entities, securitizations and other investment entities in the normal course of business. In certain instances, the Company serves as the investment manager, making day-to-day investment decisions concerning the assets of these entities. These entities are considered to be either VIEs or VOEs and the Company evaluates its involvement with each entity to determine whether consolidation is required.
Certain investment entities are consolidated under VIE or VOE consolidation guidance. The Company consolidates certain entities under the VIE guidance when it is determined that the Company is the primary beneficiary of these entities. The Company consolidates certain entities under the VOE guidance when it acts as the controlling general partner and the limited partners have no substantive rights to impact ongoing governance and operating activities.
With the exception of guarantees issued by the Company in relation to collateral support for reinsurance contracts, the Company has no right to the benefits from, nor does it bear the risks associated with these investments beyond the Company’s direct equity and debt investments in and management fees generated from these investment products. Such direct investments amounted to approximately $654.0 and $600.0 as of December 31, 2013 and 2012, respectively. If the Company were to liquidate, the assets held by consolidated investment entities would not be available to the general creditors of the Company as a result of the liquidation.
Consolidated Investments
Collateral Loan Obligations (“CLO”) Entities
Certain subsidiaries of the Company structure and manage CLO entities created for the sole purpose of offering investors various maturity and risk characteristics by issuing multiple tranches of collateralized debt. The notes issued by the CLO entities are backed by diversified portfolios consisting primarily of senior secured floating rate leveraged loans.
The Company provides collateral management services to the CLO entities. In return for providing management services, the Company earns investment management fees and contingent performance fees. The Company has invested in certain of the entities, generally taking an ownership position in the unrated junior subordinated tranches. The CLO entities are structured and managed similarly but have differing fee structures and initial capital investments made by the Company. The Company’s ownership interests and management and contingent performance fees were assessed to determine if the Company is the primary beneficiary of these entities.
As of December 31, 2013 and 2012, the Company consolidated 12 CLOs and 9 CLOs, respectively.
Private Equity Funds and Single Strategy Hedge Funds (Limited Partnerships)
The Company invests in and manages various limited partnerships, including private equity funds and single strategy hedge funds. The Company, as a general partner or managing member of certain sponsored investment
F-125
Table of Contents
ING U.S., Inc.
Notes to the Consolidated Financial Statements
(Dollar amounts in millions, unless otherwise stated)
funds, is generally presumed to control the limited partnerships unless the limited partners have the substantive ability to remove the general partner without cause based upon a simple majority vote, can otherwise dissolve the partnership or have substantive participating rights over decision-making of the partnerships.
On June 4, 2012, certain insurance subsidiaries of the Company entered into an agreement to sell certain general account private equity limited partnership investment interest holdings with a carrying value of $812.2 as of March 31, 2012 included in Assets related to consolidated investment entities to a group of private equity funds that are managed by Pomona Management LLC, also a subsidiary of the Company. The transaction resulted in a net pre-tax loss of $91.9 in the second quarter of 2012. The transaction closed in two tranches with the first tranche closed on June 29, 2012 and the second tranche closed on October 29, 2012. No additional loss was incurred on the second tranche since the fair value of the alternative investments was reduced to the agreed upon sales price as of June 30, 2012.
As of December 31, 2013 and 2012, the Company consolidated 35 funds which were structured as partnerships.
Collateral Support for Reinsurance Contracts
Beginning in December 2009, the Company entered into various guarantee agreements involving Karson Capital Limited (“Karson”). Karson is an unaffiliated company that provides collateral alternatives to letters of credit for reinsurance transactions. Karson established the KCL Master Trust (“Master Trust” or “Borrower”), which is a Delaware statutory series trust. The Master Trust enters into securities lending agreements as borrower with ING Bank and various unaffiliated banks (“Securities Lenders”) as lenders. As of December 31, 2013, fair value of the loaned securities was $1.5 billion. Effective November 5, 2013, the securities lending agreement with ING Bank was terminated. As of December 31, 2012, fair value of the loaned securities was $2.8 billion including securities with a fair value of $825.0 provided by ING Bank.
Collateral notes backed by the borrowed securities, with a face value of $1.5 billion and $2.8 billion as of December 31, 2013 and 2012, respectively, were issued by the Master Trust and placed in reinsurance trusts established for the benefit of the Company’s insurance subsidiaries, which are eliminated in the Company’s Consolidated Financial Statements.
The Company has provided certain guarantees of the Borrower’s performance obligations to the Securities Lenders as collateral for the Borrower’s obligations under the securities lending agreements. As of December 31, 2013, additional collateral in the form of letters of credit or similar liquidity obligations have been provided by banks for $1.5 billion. As of December 31, 2012, additional collateral in the form of letters of credit or similar liquidity obligations have been provided by banks for $2.8 billion, including $825.0 provided by ING Bank. The Company pays the securities lending and LOC fees directly to ING Bank and unaffiliated banks. See Note 18. Related Party Transactions to these Consolidated Financial Statements for further details.
The Master Trust sponsored by Karson has minimal equity, and therefore falls under the VIE model. The Company holds variable interests in this VIE relating to the guarantees of the obligations under the securities lending agreements. The Company considered its implicit and explicit financial responsibility to ensure that the Master Trust operates as designed and, thus, determined that the Company has the implied power to direct the activities that most significantly impact the Master Trust’s economic performance under the VIE model. The Company also determined it has the obligation to absorb losses under the securities lending guarantees. Based on these conclusions, the Company determined it is the primary beneficiary under the VIE model and should consolidate the Master Trust.
F-126
Table of Contents
ING U.S., Inc.
Notes to the Consolidated Financial Statements
(Dollar amounts in millions, unless otherwise stated)
Following the Company’s review of the Master Trust assets, liabilities, revenues and expenses, a determination was made that although the VIE is subject to consolidation, the securities lending arrangements were not subject to consolidation since the Borrower is not required to recognize borrowed securities on its balance sheet. The obligation to return borrowed securities is only recorded if the securities are sold by the borrower; otherwise, the borrowed securities are disclosed in the financial statements. The Master Trust reported no other assets, liabilities, revenues or expenses.
The following table summarizes the components of the consolidated investment entities, excluding collateral support for certain reinsurance contracts, as of the dates indicated:
| December 31, 2013 |
December 31, 2012 |
|||||||
| Assets of Consolidated Investment Entities |
||||||||
| VIEs—CLO entities: |
||||||||
| Cash and cash equivalents |
$ | 642.5 | $ | 360.6 | ||||
| Corporate loans, at fair value using the fair value option |
4,965.3 | 3,559.3 | ||||||
| Other assets |
83.1 | — | ||||||
|
|
|
|
|
|||||
| Total CLO entities |
5,690.9 | 3,919.9 | ||||||
|
|
|
|
|
|||||
| VOEs—Private equity funds and single strategy hedge funds: |
||||||||
| Cash and cash equivalents |
68.2 | 80.2 | ||||||
| Limited partnerships/corporations, at fair value |
3,218.6 | 2,931.2 | ||||||
| Other assets |
21.7 | 34.3 | ||||||
|
|
|
|
|
|||||
| Total investment funds |
3,308.5 | 3,045.7 | ||||||
|
|
|
|
|
|||||
| Total assets of consolidated investment entities |
$ | 8,999.4 | $ | 6,965.6 | ||||
|
|
|
|
|
|||||
| Liabilities of Consolidated Investment Entities |
||||||||
| VIEs—CLO entities: |
||||||||
| CLO notes, at fair value using the fair value option |
$ | 5,161.6 | $ | 3,829.4 | ||||
| Other liabilities |
468.0 | — | ||||||
|
|
|
|
|
|||||
| Total CLO entities |
5,629.6 | 3,829.4 | ||||||
| VOEs—Private equity funds and single strategy hedge funds: |
||||||||
| Other liabilities |
435.3 | 292.4 | ||||||
|
|
|
|
|
|||||
| Total investment funds |
435.3 | 292.4 | ||||||
|
|
|
|
|
|||||
| Total liabilities of consolidated investment entities |
$ | 6,064.9 | $ | 4,121.8 | ||||
|
|
|
|
|
|||||
F-127
Table of Contents
ING U.S., Inc.
Notes to the Consolidated Financial Statements
(Dollar amounts in millions, unless otherwise stated)
The following tables summarize the impact of consolidation of investment entities into the Consolidated Balance Sheets as of the dates indicated:
| Before Consolidation(1) |
CLOs | VOEs | CLOs Adjustments(2) |
VOEs Adjustments(2) |
Total | |||||||||||||||||||
| December 31, 2013 |
||||||||||||||||||||||||
| Total investments and cash |
$ | 90,569.7 | $ | — | $ | — | $ | (43.0 | ) | $ | (635.1 | ) | $ | 89,891.6 | ||||||||||
| Other assets |
15,305.1 | — | — | — | — | 15,305.1 | ||||||||||||||||||
| Assets held in consolidated investment entities |
— | 5,690.9 | 3,288.1 | — | 20.4 | 8,999.4 | ||||||||||||||||||
| Assets held in separate accounts |
106,827.1 | — | — | — | — | 106,827.1 | ||||||||||||||||||
|
|
|
|
|
|
|
|
|
|
|
|
|
|||||||||||||
| Total assets |
$ | 212,701.9 | 5,690.9 | $ | 3,288.1 | $ | (43.0 | ) | $ | (614.7 | ) | $ | 221,023.2 | |||||||||||
|
|
|
|
|
|
|
|
|
|
|
|
|
|||||||||||||
| Future policy benefits and contract owner account balances |
$ | 84,006.7 | $ | — | $ | — | $ | — | $ | — | $ | 84,006.7 | ||||||||||||
| Other liabilities |
8,614.3 | — | — | — | (3.8 | ) | 8,610.5 | |||||||||||||||||
| Liabilities held in consolidated investment entities |
— | 5,672.5 | 435.4 | (43.0 | ) | — | 6,064.9 | |||||||||||||||||
| Liabilities related to separate accounts |
106,827.1 | — | — | — | — | 106,827.1 | ||||||||||||||||||
|
|
|
|
|
|
|
|
|
|
|
|
|
|||||||||||||
| Total liabilities |
199,448.1 | 5,672.5 | 435.4 | (43.0 | ) | (3.8 | ) | 205,509.2 | ||||||||||||||||
|
|
|
|
|
|
|
|
|
|
|
|
|
|||||||||||||
| Equity attributable to common shareholders |
13,253.8 | — | 2,852.7 | — | (2,852.7 | ) | 13,253.8 | |||||||||||||||||
| Retained earnings appropriated for investors in consolidated investment entities |
— | 18.4 | — | — | — | 18.4 | ||||||||||||||||||
| Equity attributable to noncontrolling interest in consolidated investment entities |
— | — | — | — | 2,241.8 | 2,241.8 | ||||||||||||||||||
|
|
|
|
|
|
|
|
|
|
|
|
|
|||||||||||||
| Total liabilities and equity |
$ | 212,701.9 | $ | 5,690.9 | $ | 3,288.1 | $ | (43.0 | ) | $ | (614.7 | ) | $ | 221,023.2 | ||||||||||
|
|
|
|
|
|
|
|
|
|
|
|
|
|||||||||||||
| (1) | The Before Consolidation column includes the Company’s equity interest in the investment products subsequently consolidated, accounted for as equity method and available-for-sale investments. |
| (2) | Adjustments include the elimination of intercompany transactions between the Company and its consolidated investment entities, primarily the elimination of the Company’s equity at risk recorded as investments by the Company (before consolidation) against either equity (private equity and real estate partnership funds) or senior and subordinated debt (CLOs) of the funds. |
F-128
Table of Contents
ING U.S., Inc.
Notes to the Consolidated Financial Statements
(Dollar amounts in millions, unless otherwise stated)
| Before Consolidation(1) |
CLOs | VOEs | CLOs Adjustments(2) |
VOEs Adjustments(2) |
Total | |||||||||||||||||||
| December 31, 2012 |
||||||||||||||||||||||||
| Total investments and cash |
$ | 97,925.5 | $ | — | $ | — | $ | (84.1 | ) | $ | (567.0 | ) | $ | 97,274.4 | ||||||||||
| Other assets |
14,486.8 | — | — | — | — | 14,486.8 | ||||||||||||||||||
| Assets held in consolidated investment entities |
— | 3,919.9 | 2,999.4 | — | 46.3 | 6,965.6 | ||||||||||||||||||
| Assets held in separate accounts |
97,667.4 | — | — | — | — | 97,667.4 | ||||||||||||||||||
|
|
|
|
|
|
|
|
|
|
|
|
|
|||||||||||||
| Total assets |
$ | 210,079.7 | $ | 3,919.9 | $ | 2,999.4 | $ | (84.1 | ) | $ | (520.7 | ) | $ | 216,394.2 | ||||||||||
|
|
|
|
|
|
|
|
|
|
|
|
|
|||||||||||||
| Future policy benefits and contract owner account balances |
$ | 86,055.7 | $ | — | $ | — | $ | — | $ | — | $ | 86,055.7 | ||||||||||||
| Other liabilities |
12,488.1 | — | — | — | — | 12,488.1 | ||||||||||||||||||
| Liabilities held in consolidated investment entities |
— | 3,913.5 | 292.4 | (84.1 | ) | — | 4,121.8 | |||||||||||||||||
| Liabilities related to separate accounts |
97,667.4 | — | — | — | — | 97,667.4 | ||||||||||||||||||
|
|
|
|
|
|
|
|
|
|
|
|
|
|||||||||||||
| Total liabilities |
196,211.2 | 3,913.5 | 292.4 | (84.1 | ) | — | 200,333.0 | |||||||||||||||||
|
|
|
|
|
|
|
|
|
|
|
|
|
|||||||||||||
| Equity attributable to common shareholder |
13,868.5 | — | 2,707.0 | — | (2,707.0 | ) | 13,868.5 | |||||||||||||||||
| Retained earnings appropriated for investors in consolidated investment entities |
— | 6.4 | — | — | — | 6.4 | ||||||||||||||||||
| Equity attributable to noncontrolling interest in consolidated investment entities |
— | — | — | — | 2,186.3 | 2,186.3 | ||||||||||||||||||
|
|
|
|
|
|
|
|
|
|
|
|
|
|||||||||||||
| Total liabilities and equity |
$ | 210,079.7 | $ | 3,919.9 | $ | 2,999.4 | $ | (84.1 | ) | $ | (520.7 | ) | $ | 216,394.2 | ||||||||||
|
|
|
|
|
|
|
|
|
|
|
|
|
|||||||||||||
| (1) | The Before Consolidation column includes the Company’s equity interest in the investment products subsequently consolidated, accounted for as equity method and available-for-sale investments. |
| (2) | Adjustments include the elimination of intercompany transactions between the Company and its consolidated investment entities, primarily the elimination of the Company’s equity at risk recorded as investments by the Company (before consolidation) against either equity (private equity and real estate partnership funds) or senior and subordinated debt (CLOs) of the funds. |
F-129
Table of Contents
ING U.S., Inc.
Notes to the Consolidated Financial Statements
(Dollar amounts in millions, unless otherwise stated)
The following tables summarize the impact of consolidation of investment entities into the Consolidated Statements of Operations for the periods indicated:
| Before Consolidation(1) |
CLOs | VOEs | CLOs Adjustments(2) |
VOEs Adjustments(2) |
Total | |||||||||||||||||||
| December 31, 2013 |
||||||||||||||||||||||||
| Revenues: |
||||||||||||||||||||||||
| Net investment income |
$ | 4,791.2 | $ | — | $ | — | $ | (5.7 | ) | $ | (96.5 | ) | $ | 4,689.0 | ||||||||||
| Fee income |
3,723.8 | — | — | (23.2 | ) | (34.3 | ) | 3,666.3 | ||||||||||||||||
| Premiums |
1,956.3 | — | — | — | — | 1,956.3 | ||||||||||||||||||
| Net realized capital losses |
(2,534.8 | ) | — | — | — | — | (2,534.8 | ) | ||||||||||||||||
| Other income |
443.6 | — | — | (10.0 | ) | (0.6 | ) | 433.0 | ||||||||||||||||
| Income related to consolidated investment entities |
— | 234.6 | 322.6 | (8.5 | ) | — | 548.7 | |||||||||||||||||
|
|
|
|
|
|
|
|
|
|
|
|
|
|||||||||||||
| Total revenues |
8,380.1 | 234.6 | 322.6 | (47.4 | ) | (131.4 | ) | 8,758.5 | ||||||||||||||||
| Benefits and expenses: |
||||||||||||||||||||||||
| Policyholder benefits and Interest credited and other benefits to contract owners |
4,497.8 | — | — | — | — | 4,497.8 | ||||||||||||||||||
| Other expense |
3,314.3 | — | — | — | — | 3,314.3 | ||||||||||||||||||
| Operating expenses related to consolidated investment entities |
— | 222.6 | 48.0 | (47.4 | ) | (34.9 | ) | 188.3 | ||||||||||||||||
|
|
|
|
|
|
|
|
|
|
|
|
|
|||||||||||||
| Total benefits and expenses |
7,812.1 | 222.6 | 48.0 | (47.4 | ) | (34.9 | ) | 8,000.4 | ||||||||||||||||
| Income (loss) before income taxes |
568.0 | 12.0 | 274.6 | — | (96.5 | ) | 758.1 | |||||||||||||||||
| Income tax expense (benefit) |
(32.5 | ) | — | — | — | — | (32.5 | ) | ||||||||||||||||
|
|
|
|
|
|
|
|
|
|
|
|
|
|||||||||||||
| Net income (loss) |
600.5 | 12.0 | 274.6 | — | (96.5 | ) | 790.6 | |||||||||||||||||
| Less: Net income (loss) attributable to noncontrolling interest |
— | 12.0 | — | — | 178.1 | 190.1 | ||||||||||||||||||
|
|
|
|
|
|
|
|
|
|
|
|
|
|||||||||||||
| Net income (loss) available to ING U.S., Inc.’s common shareholders |
$ | 600.5 | $ | — | $ | 274.6 | $ | — | $ | (274.6 | ) | $ | 600.5 | |||||||||||
|
|
|
|
|
|
|
|
|
|
|
|
|
|||||||||||||
| (1) | The Before Consolidation column includes the Company’s equity interest in the investment products accounted for as equity method (private equity and real estate partnership funds) and available-for-sale investments (CLOs). The net income arising from consolidation of CLOs is completely attributable to other investors in these CLOs, as the Company’s share has been eliminated through consolidation. |
| (2) | Adjustments include the elimination of intercompany transactions between the Company and its consolidated investment products, primarily the elimination of the Company’s management fees expensed by the funds and recorded as operating revenues (before consolidation) by the Company. |
F-130
Table of Contents
ING U.S., Inc.
Notes to the Consolidated Financial Statements
(Dollar amounts in millions, unless otherwise stated)
| Before Consolidation(1) |
CLOs | VOEs | CLOs Adjustments(2) |
VOEs Adjustments(2) |
Total | |||||||||||||||||||
| December 31, 2012 |
||||||||||||||||||||||||
| Revenues: |
||||||||||||||||||||||||
| Net investment income |
$ | 4,830.0 | $ | 0.5 | $ | — | $ | (20.7 | ) | $ | (111.9 | ) | $ | 4,697.9 | ||||||||||
| Fee income |
3,565.6 | — | — | (14.4 | ) | (35.8 | ) | 3,515.4 | ||||||||||||||||
| Premiums |
1,861.1 | — | — | — | — | 1,861.1 | ||||||||||||||||||
| Net realized capital losses |
(1,280.8 | ) | — | — | — | — | (1,280.8 | ) | ||||||||||||||||
| Other income |
384.5 | — | — | (6.0 | ) | — | 378.5 | |||||||||||||||||
| Income related to consolidated investment entities |
— | 21.5 | 415.1 | 6.6 | — | 443.2 | ||||||||||||||||||
|
|
|
|
|
|
|
|
|
|
|
|
|
|||||||||||||
| Total revenues |
9,360.4 | 22.0 | 415.1 | (34.5 | ) | (147.7 | ) | 9,615.3 | ||||||||||||||||
| Benefits and expenses: |
||||||||||||||||||||||||
| Policyholder benefits and Interest credited and other benefits to contract owners |
4,861.6 | — | — | — | — | 4,861.6 | ||||||||||||||||||
| Other expense |
4,031.0 | — | — | — | — | 4,031.0 | ||||||||||||||||||
| Operating expenses related to consolidated investment entities |
— | 142.1 | 44.9 | (34.5 | ) | (35.8 | ) | 116.7 | ||||||||||||||||
|
|
|
|
|
|
|
|
|
|
|
|
|
|||||||||||||
| Total benefits and expenses |
8,892.6 | 142.1 | 44.9 | (34.5 | ) | (35.8 | ) | 9,009.3 | ||||||||||||||||
| Income (loss) before income taxes |
467.8 | (120.1 | ) | 370.2 | — | (111.9 | ) | 606.0 | ||||||||||||||||
| Income tax expense (benefit) |
(5.2 | ) | — | — | — | — | (5.2 | ) | ||||||||||||||||
|
|
|
|
|
|
|
|
|
|
|
|
|
|||||||||||||
| Net income (loss) |
473.0 | (120.1 | ) | 370.2 | — | (111.9 | ) | 611.2 | ||||||||||||||||
| Less: Net income (loss) attributable to noncontrolling interest |
— | (120.1 | ) | — | — | 258.3 | 138.2 | |||||||||||||||||
|
|
|
|
|
|
|
|
|
|
|
|
|
|||||||||||||
| Net income (loss) available to ING U.S., Inc.’s common shareholder |
$ | 473.0 | $ | — | $ | 370.2 | $ | — | $ | (370.2 | ) | $ | 473.0 | |||||||||||
|
|
|
|
|
|
|
|
|
|
|
|
|
|||||||||||||
| (1) | The Before Consolidation column includes the Company’s equity interest in the investment products accounted for as equity method (private equity and real estate partnership funds) and available-for-sale investments (CLOs). The net income arising from consolidation of CLOs is completely attributable to other investors in these CLOs, as the Company’s share has been eliminated through consolidation. |
| (2) | Adjustments include the elimination of intercompany transactions between the Company and its consolidated investment products, primarily the elimination of the Company’s management fees expensed by the funds and recorded as operating revenues (before consolidation) by the Company. |
F-131
Table of Contents
ING U.S., Inc.
Notes to the Consolidated Financial Statements
(Dollar amounts in millions, unless otherwise stated)
| Before Consolidation(1) |
CLOs | VOEs | CLOs Adjustments(2) |
VOEs Adjustments(2) |
Total | |||||||||||||||||||
| December 31, 2011 |
||||||||||||||||||||||||
| Revenues: |
||||||||||||||||||||||||
| Net investment income |
$ | 5,104.7 | $ | — | $ | — | $ | (11.5 | ) | $ | (124.4 | ) | $ | 4,968.8 | ||||||||||
| Fee income |
3,614.5 | — | — | (10.9 | ) | — | 3,603.6 | |||||||||||||||||
| Premiums |
1,770.0 | — | — | — | — | 1,770.0 | ||||||||||||||||||
| Net realized capital losses |
(1,531.4 | ) | — | — | — | — | (1,531.4 | ) | ||||||||||||||||
| Other income |
428.2 | — | — | — | — | 428.2 | ||||||||||||||||||
| Income related to consolidated investment entities |
— | 41.0 | 438.6 | — | — | 479.6 | ||||||||||||||||||
|
|
|
|
|
|
|
|
|
|
|
|
|
|||||||||||||
| Total revenues |
9,386.0 | 41.0 | 438.6 | (22.4 | ) | (124.4 | ) | 9,718.8 | ||||||||||||||||
| Benefits and expenses: |
||||||||||||||||||||||||
| Policyholder benefits and Interest credited and other benefits to contract owners |
5,742.0 | — | — | — | — | 5,742.0 | ||||||||||||||||||
| Other expense |
3,557.1 | — | — | — | — | 3,557.1 | ||||||||||||||||||
| Operating expenses related to consolidated investment entities |
— | 91.7 | 72.6 | (22.4 | ) | — | 141.9 | |||||||||||||||||
|
|
|
|
|
|
|
|
|
|
|
|
|
|||||||||||||
| Total benefits and expenses |
9,299.1 | 91.7 | 72.6 | (22.4 | ) | — | 9,441.0 | |||||||||||||||||
| Income (loss) before income taxes |
86.9 | (50.7 | ) | 366.0 | — | (124.4 | ) | 277.8 | ||||||||||||||||
| Income tax expense (benefit) |
175.0 | — | — | — | — | 175.0 | ||||||||||||||||||
|
|
|
|
|
|
|
|
|
|
|
|
|
|||||||||||||
| Net income (loss) |
(88.1 | ) | (50.7 | ) | 366.0 | — | (124.4 | ) | 102.8 | |||||||||||||||
|
|
|
|
|
|
|
|
|
|
|
|
|
|||||||||||||
| Less: Net income (loss) attributable to noncontrolling interest |
— | (50.7 | ) | — | — | 241.6 | 190.9 | |||||||||||||||||
|
|
|
|
|
|
|
|
|
|
|
|
|
|||||||||||||
| Net income (loss) available to ING U.S., Inc.’s common shareholder |
$ | (88.1 | ) | $ | — | $ | 366.0 | $ | — | $ | (366.0 | ) | $ | (88.1 | ) | |||||||||
|
|
|
|
|
|
|
|
|
|
|
|
|
|||||||||||||
| (1) | The Before Consolidation column includes the Company’s equity interest in the investment products accounted for as equity method (private equity and real estate partnership funds) and available-for-sale investments (CLOs). The net income arising from consolidation of CLOs is completely attributable to other investors in these CLOs, as the Company’s share has been eliminated through consolidation. |
| (2) | Adjustments include the elimination of intercompany transactions between the Company and its consolidated investment products, primarily the elimination of the Company’s management fees expensed by the funds and recorded as operating revenues (before consolidation) by the Company. |
Fair Value Measurement
Upon consolidation of CLO entities, the Company elected to apply the FVO for financial assets and financial liabilities held by these entities and continued to measure these assets (primarily corporate loans) and liabilities (debt obligations issued by CLO entities) at fair value in subsequent periods. The Company has elected the FVO to more closely align its accounting with the economics of its transactions and allows the Company to more effectively align changes in the fair value of CLO assets with a commensurate change in the fair value of CLO liabilities.
Investments held by consolidated private equity funds and single strategy hedge funds are measured and reported at fair value in the Company’s Consolidated Financial Statements. Changes in the fair value of consolidated
F-132
Table of Contents
ING U.S., Inc.
Notes to the Consolidated Financial Statements
(Dollar amounts in millions, unless otherwise stated)
investment entities are recorded as a separate line item within Income (loss) related to consolidated investment entities in the Company’s Consolidated Statements of Operations.
The methodology for measuring the fair value and fair value hierarchy classification of financial assets and liabilities of consolidated investment entities is consistent with the methodology and fair value hierarchy rules applied by the Company to its investment portfolio. Refer to Note 1. Business, Basis of Presentation and Significant Policies-Fair Value Measurement to these Consolidated Financial Statements for further information.
As discussed in more detail below, the Company utilizes valuations obtained from third-party commercial pricing services, brokers and investment sponsors or third-party administrators that supply NAV (or its equivalent) per share used as a practical expedient. The valuations obtained from brokers and third-party commercial pricing services are non-binding. These valuations are reviewed on a monthly or quarterly basis (dependent on the type of fund or product). Procedures include, but are not limited to, a review of underlying fund investor reports, review of top and worst performing funds requiring further scrutiny, review of variance from prior periods and review of variance from benchmarks, where applicable. In addition, the Company considers both macro and fund specific events that may impact the latest NAV supplied and determines if further adjustments of value should be made. Such changes, if any, are subject to senior management review.
When a price cannot be obtained from a commercial pricing service, independent broker quotes are solicited. Securities priced using independent broker quotes are classified as Level 3. Broker quotes and prices obtained from pricing services are reviewed and validated through an internal valuation committee price variance review, comparisons to internal pricing models, back testing to recent trades or monitoring of trading volumes.
Cash and Cash Equivalents
The carrying amounts for cash reflect the assets’ fair values. The fair value for cash equivalents is determined based on quoted market prices. These assets are classified as Level 1.
VIEs—CLO Entities
Corporate loans—Corporate loan investments, which comprise the majority of consolidated CLO portfolio collateral, are senior secured corporate loans from a variety of industries, including, but not limited to, the aerospace and defense, broadcasting, technology, utilities, household products, healthcare, oil and gas and finance industries. Corporate loans mature at various dates between 2013 and 2022, pay interest at LIBOR, EURIBOR or PRIME plus a spread of up to 10.0% and typically range in credit rating categories from AAA+ down to unrated. As of December 31, 2013 and 2012, the unpaid principal balance exceeded the fair value of the corporate loans by approximately $9.7 and $26.9, respectively. Less than 1% of the collateral assets were in default as of December 31, 2013 and 2012.
The fair values for corporate loans are determined using independent commercial pricing services. Fair value measurement based on pricing services may be classified in Level 2 or Level 3 depending on the type, complexity, observability and liquidity of the asset being measured. The inputs used by independent commercial pricing services, such as benchmark yields and credit risk adjustments, are those that are derived principally from or corroborated by observable market data. Hence, the fair value measurement of corporate loans priced by independent pricing service providers is classified within Level 2 of the fair value hierarchy.
For assets held in the CLO portfolios representing senior level debt of other third-party CLOs (“CLO investments”), the pricing of these positions is obtained from a third-party commercial pricing service. See
F-133
Table of Contents
ING U.S., Inc.
Notes to the Consolidated Financial Statements
(Dollar amounts in millions, unless otherwise stated)
discussion of CLO note valuation below. Accordingly, these CLO investments are classified within Level 3 of the fair value hierarchy. See description of fair value process for CLO notes below.
CLO notes—The CLO notes are backed by a diversified loan portfolio consisting primarily of senior secured floating rate leveraged loans. Repayment risk is segmented into tranches with credit ratings of these tranches reflecting both the credit quality of underlying collateral as well as how much protection a given tranche is afforded by tranches that are subordinate to it. The most subordinated tranche bears the first loss and receives the residual payments, if any. The interest rates are generally variable rates based on LIBOR plus a pre-defined spread, which varies from 0.22% for the more senior tranches to 7.00% for the more subordinated tranches. CLO notes mature at various dates between 2020 and 2026 and have a weighted average maturity of 9.1 years. The outstanding balance on the notes issued by consolidated CLOs exceeds their fair value by approximately $139.6 and $99.6 as of December 31, 2013 and 2012, respectively. The investors in this debt are not affiliated with the Company and have no recourse to the general credit of the Company for this debt.
The fair values of the CLO notes including subordinated tranches in which the Company retains an ownership interest are obtained from a third-party commercial pricing service. The service combines the modeling of projected cash flow activity and the calibration of modeled results with transactions that have taken place in the specific debt issue as well as debt issues with similar characteristics. Several of the more significant inputs to the models including default rate, recovery rate, prepayment rate and discount margin, are determined primarily based on the nature of the investments in the underlying collateral pools and cannot be corroborated by observable market data. Accordingly, CLO notes are classified within Level 3 of the fair value hierarchy.
To evaluate the reliability of the option-pricing models, the Company obtains broker-dealer pricing information from broker-dealers, which is based on the broker’s proprietary pricing models considering the deals in the market of similar quality and tranches of same priority. The broker-dealer will model the price based on projected cash flows and terminal value, which often incorporate unobservable inputs. As such, the prices are not considered official marks for CLO tranches.
In determining the fair value of subordinated tranches in which the Company retains ownership interest, similar assumptions as noted above are used to project future cash flows and determine the fair value of the CLO notes. In the event that the Company’s modeled prices differ significantly from the observed market transactions, the Company reviews its assumptions and may adjust the fair value of such subordinated and equity classes if necessary.
The following table summarizes significant unobservable inputs for Level 3 fair value measurements as of the dates indicated:
| Fair Value | Valuation Technique |
Unobservable Inputs | ||||||
| December 31, 2013 |
||||||||
| Assets: |
||||||||
| CLO Investments |
$ | 25.5 | Discounted Cash Flow | Default Rate Recovery Rate Prepayment Rate Discount Margin | ||||
| Liabilities: |
||||||||
| CLO Notes |
$ | 5,161.6 | Discounted Cash Flow | Default Rate Recovery Rate Prepayment Rate Discount Margin | ||||
F-134
Table of Contents
ING U.S., Inc.
Notes to the Consolidated Financial Statements
(Dollar amounts in millions, unless otherwise stated)
| Fair Value | Valuation Technique |
Unobservable Inputs | ||||||
| December 31, 2012 |
||||||||
| Liabilities: |
||||||||
| CLO Notes |
$ | 3,829.4 | Discounted Cash Flow | Default Rate Recovery Rate Prepayment Rate Discount Margin | ||||
The following narrative indicates the sensitivity of inputs:
| • | Default Rate: An increase (decrease) in the expected default rate would likely increase (decrease) the discount margin (increase risk premium) used to value the CLO investments and CLO notes and, as a result, would potentially decrease the value of the CLO investments and CLO notes; however, if an increase in the expected default rates does not have a subsequent change in the discount margin used to value the CLO investments and CLO notes, then an increase in default rate would potentially increase the value of the CLO investments and CLO notes as the expected weighted average life (“WAL”) of the CLO investments and CLO notes would decrease. |
| • | Recovery rate: A decrease (increase) in the expected recovery of defaulted assets would potentially decrease (increase) the valuation of CLO investments and CLO notes. |
| • | Prepayment Rate: A decrease (increase) in the expected rate of collateral prepayments would potentially decrease (increase) the valuation of CLO investments and CLO notes as the expected WAL would increase. |
| • | Discount Margin (spread over LIBOR): An increase (decrease) in the discount margin used to value the CLO investments and CLO notes and would decrease (increase) the value of the CLO investments and CLO notes. |
VOEs—Private Equity Funds and Single Strategy Hedge Funds (Limited Partnerships)
Limited partnerships, at fair value, primarily represent the Company’s investments in private equity funds and single strategy hedge funds. The fair value for these investments is estimated based on the NAV from the latest financial statements of these funds, provided by the fund’s investment manager or third-party administrator.
Valuations of single strategy hedge funds, generally based on the valuations provided by the funds third-party administrator, are based on a pricing matrix which primarily relies upon prices received from third-party pricing services. The inputs used by independent commercial pricing services are those that are derived principally from or corroborated by observable market data. Hence, the fair value measurement of single strategy hedge funds priced by independent pricing service providers is classified within Level 2 of the fair value hierarchy.
These consolidated investments are mostly private equity funds spread across 35 limited partnerships that focus on the primary or secondary market. The limited partnerships invest in private equity funds and, at times, make strategic co-investments directly into private equity companies, including, but not limited to, buyout, venture capital, distressed and mezzanine.
Private Equity Funds
As prescribed in ASC Topic 820, the unit of account for these investments is the interest in the investee fund. The Company owns an undivided interest in the fund portfolio and does not have the ability to dispose of
F-135
Table of Contents
ING U.S., Inc.
Notes to the Consolidated Financial Statements
(Dollar amounts in millions, unless otherwise stated)
individual assets and liabilities in the fund portfolio. Rather, the Company would be required to redeem or dispose of its entire interest in the investee fund. There is no current active market for interests in underlying private equity funds.
Valuation is generally based on the valuations provided by the fund’s general partner or investment manager. The valuations typically reflect the fair value of the Company’s capital account balance of each fund investment, including unrealized capital gains (losses), as reported in the financial statements of the respective investee fund as of the respective year end or the latest available date. In circumstances where fair values are not provided, the Company seeks to determine the fair value of fund investments based upon other information provided by the fund’s general partner or investment manager or from other sources. Private equity fund investments are classified within Level 3 of the fair value hierarchy.
The fair value of securities received in-kind from fund investments is determined based on the restrictions around the securities.
| • | Unrestricted, publicly traded securities are valued at the closing public market price on the reporting date; |
| • | Restricted, publicly traded securities may be valued at a discount from the closing public market price on the reporting date, depending on the circumstances; and |
| • | Privately held securities are valued by the directors/general partner of the investee fund, based on a variety of factors, including the price of recent transactions in the company’s securities and the company’s earnings, revenue and book value. |
As of December 31, 2013, certain private equity funds maintained revolving lines of credit of $400.0, which renew annually and bear interest at LIBOR/EURIBOR plus 235-250 bps. As of December 31, 2012, a private equity fund maintained a revolving line of credit of $325.3, which renews annually and bears interest at LIBOR/EURIBOR plus 250 bps. The lines of credit are used for funding transactions before capital is called from investors, as well as for the financing of certain purchases. The private equity funds generally may borrow an amount that does not exceed the lesser of a certain percentage of the funds’ undrawn commitments or a certain percentage of the funds’ undrawn commitments plus 350% asset coverage from the invested assets of the funds. As of December 31, 2013 and 2012, outstanding borrowings amount to $212.2 and $288.4, respectively. The borrowings are reflected in Liabilities related to consolidated investment entities—other liabilities on the Consolidated Balance Sheets. The borrowings are carried at an amount equal to the unpaid principal balance.
As of December 31, 2013, a certain single strategy hedge fund sold securities under an agreement to repurchase at a specified future date. Securities sold under an agreement to repurchase are not derecognized on the Consolidated Balance Sheets as the single strategy hedge fund retains substantially all the risks and rewards of ownership. The obligation to repay the corresponding cash received is recognized in the Consolidated Balance Sheets in Liabilities related to consolidated investment entities—other liabilities. As of December 31, 2013, outstanding financings amount to $147.5.
Private Equity Companies
In the case of direct investments or co-investments in private equity companies, the Company initially recognizes investments at cost and subsequently adjusts investments to fair value. On a quarterly basis, the Company reviews the general partner or lead investor’s valuation of the investee company, taking into account other available information, such as indications of a market value through subsequent issues of capital or transactions between third-parties, performance of the investee company during the period and public, comparable companies’ analysis, where appropriate.
F-136
Table of Contents
ING U.S., Inc.
Notes to the Consolidated Financial Statements
(Dollar amounts in millions, unless otherwise stated)
The following table summarizes the fair value hierarchy levels of consolidated investment entities as of December 31, 2013:
| Level 1 | Level 2 | Level 3 | Total | |||||||||||||
| Assets |
||||||||||||||||
| VIEs—CLO entities: |
||||||||||||||||
| Cash and cash equivalents |
$ | 642.5 | $ | — | $ | — | $ | 642.5 | ||||||||
| Corporate loans, at fair value using the fair value option |
— | 4,939.8 | 25.5 | 4,965.3 | ||||||||||||
| VOEs—Private equity funds and single strategy hedge funds: |
||||||||||||||||
| Cash and cash equivalents |
68.2 | — | — | 68.2 | ||||||||||||
| Limited partnerships/corporations, at fair value |
— | 484.5 | 2,734.1 | 3,218.6 | ||||||||||||
|
|
|
|
|
|
|
|
|
|||||||||
| Total assets, at fair value |
$ | 710.7 | $ | 5,424.3 | $ | 2,759.6 | $ | 8,894.6 | ||||||||
|
|
|
|
|
|
|
|
|
|||||||||
| Liabilities |
||||||||||||||||
| VIEs—CLO entities: |
||||||||||||||||
| CLO notes, at fair value using the fair value option |
$ | — | $ | — | $ | 5,161.6 | $ | 5,161.6 | ||||||||
|
|
|
|
|
|
|
|
|
|||||||||
| Total liabilities, at fair value |
$ | — | $ | — | $ | 5,161.6 | $ | 5,161.6 | ||||||||
|
|
|
|
|
|
|
|
|
|||||||||
The following table summarizes the fair value hierarchy levels of consolidated investment entities as of December 31, 2012:
| Level 1 | Level 2 | Level 3 | Total | |||||||||||||
| Assets |
||||||||||||||||
| VIEs—CLO entities: |
||||||||||||||||
| Cash and cash equivalents |
$ | 360.6 | $ | — | $ | — | $ | 360.6 | ||||||||
| Corporate loans, at fair value using the fair value option |
— | 3,559.3 | — | 3,559.3 | ||||||||||||
| VOEs—Private equity funds and single strategy hedge funds: |
||||||||||||||||
| Cash and cash equivalents |
80.2 | — | — | 80.2 | ||||||||||||
| Limited partnerships/corporations, at fair value |
— | — | 2,931.2 | 2,931.2 | ||||||||||||
|
|
|
|
|
|
|
|
|
|||||||||
| Total assets, at fair value |
$ | 440.8 | $ | 3,559.3 | $ | 2,931.2 | $ | 6,931.3 | ||||||||
|
|
|
|
|
|
|
|
|
|||||||||
| Liabilities |
||||||||||||||||
| VIEs—CLO entities: |
||||||||||||||||
| CLO notes, at fair value using the fair value option |
$ | — | $ | — | $ | 3,829.4 | $ | 3,829.4 | ||||||||
|
|
|
|
|
|
|
|
|
|||||||||
| Total liabilities, at fair value |
$ | — | $ | — | $ | 3,829.4 | $ | 3,829.4 | ||||||||
|
|
|
|
|
|
|
|
|
|||||||||
F-137
Table of Contents
ING U.S., Inc.
Notes to the Consolidated Financial Statements
(Dollar amounts in millions, unless otherwise stated)
Level 3 assets primarily include investments in private equity funds and single strategy hedge funds held by the consolidated VOEs, while the Level 3 liabilities consist of CLO notes. Transfers of investments out of Level 3 and into Level 2 or Level 1, if any, are recorded as of the beginning of the period in which the transfer occurred. During the year ended December 31, 2013, investments held in single strategy hedge funds were transferred from Level 3 to level 2 based upon the specific review and assessment of the underlying securities held by a single strategy hedge fund. There were no transfers between Level 1 and Level 2. During the year ended December 31, 2012, there were no transfers in or out of Level 3, or transfers between Level 1 and Level 2.
The reconciliation of the beginning and ending fair value measurements for Level 3 assets and liabilities using significant unobservable inputs for the year ended December 31, 2013 is presented in the table below:
| Fair Value as of January 1 |
Gains (Losses) Included in the Consolidated Statement of Operations |
Purchases | Sales | Transfer in to Level 3 |
Transfer out of Level 3 |
Fair Value as of December 31 |
||||||||||||||||||||||
| Assets |
||||||||||||||||||||||||||||
| VIEs—CLO entities: |
||||||||||||||||||||||||||||
| Corporate loans, at fair value using the fair value option |
$ | — | $ | — | $ | — | $ | — | $ | 25.5 | $ | — | $ | 25.5 | ||||||||||||||
| VOEs—Private equity funds and single strategy hedge funds: |
||||||||||||||||||||||||||||
| Limited partnerships/corporations, at fair value |
2,931.2 | 211.0 | 848.0 | (771.6 | ) | — | (484.5 | ) | 2,734.1 | |||||||||||||||||||
|
|
|
|
|
|
|
|
|
|
|
|
|
|
|
|||||||||||||||
| Total assets, at fair value |
$ | 2,931.2 | $ | 211.0 | $ | 848.0 | $ | (771.6 | ) | $ | 25.5 | $ | (484.5 | ) | $ | 2,759.6 | ||||||||||||
|
|
|
|
|
|
|
|
|
|
|
|
|
|
|
|||||||||||||||
| Liabilities |
||||||||||||||||||||||||||||
| VIEs—CLO entities: |
||||||||||||||||||||||||||||
| CLO notes, at fair value using the fair value option |
$ | (3,829.4 | ) | $ | (6.3 | ) | $ | (1,594.1 | ) | $ | 268.2 | $ | — | $ | — | $ | (5,161.6 | ) | ||||||||||
|
|
|
|
|
|
|
|
|
|
|
|
|
|
|
|||||||||||||||
| Total liabilities, at fair value |
$ | (3,829.4 | ) | $ | (6.3 | ) | $ | (1,594.1 | ) | $ | 268.2 | $ | — | $ | — | $ | (5,161.6 | ) | ||||||||||
|
|
|
|
|
|
|
|
|
|
|
|
|
|
|
|||||||||||||||
F-138
Table of Contents
ING U.S., Inc.
Notes to the Consolidated Financial Statements
(Dollar amounts in millions, unless otherwise stated)
The reconciliation of the beginning and ending fair value measurements for Level 3 assets and liabilities using significant unobservable inputs for the year ended December 31, 2012 is presented in the table below:
| Fair Value as of January 1 |
Gains (Losses) Included in the Consolidated Statement of Operations |
Purchases | Sales | Transfer in to Level 3 |
Transfer out of Level 3 |
Fair Value as of December 31 |
||||||||||||||||||||||
| Assets |
||||||||||||||||||||||||||||
| VIEs—CLO entities: |
||||||||||||||||||||||||||||
| Corporate loans, at fair value using the fair value option |
$ | — | $ | — | $ | — | $ | — | $ | — | $ | — | $ | — | ||||||||||||||
| VOEs—Private equity funds and single strategy hedge funds: |
||||||||||||||||||||||||||||
| Limited partnerships/corporations, at fair value |
2,860.3 | 282.2 | 389.8 | (601.1 | ) | — | — | 2,931.2 | ||||||||||||||||||||
|
|
|
|
|
|
|
|
|
|
|
|
|
|
|
|||||||||||||||
| Total assets, at fair value |
$ | 2,860.3 | $ | 282.2 | $ | 389.8 | $ | (601.1 | ) | $ | — | $ | — | $ | 2,931.2 | |||||||||||||
|
|
|
|
|
|
|
|
|
|
|
|
|
|
|
|||||||||||||||
| Liabilities |
||||||||||||||||||||||||||||
| VIEs—CLO entities: |
||||||||||||||||||||||||||||
| CLO notes, at fair value using the fair value option |
$ | (2,057.1 | ) | $ | (173.1 | ) | $ | (1,603.6 | ) | $ | 4.4 | $ | — | $ | — | $ | (3,829.4 | ) | ||||||||||
|
|
|
|
|
|
|
|
|
|
|
|
|
|
|
|||||||||||||||
| Total liabilities, at fair value |
$ | (2,057.1 | ) | $ | (173.1 | ) | $ | (1,603.6 | ) | $ | 4.4 | $ | — | $ | — | $ | (3,829.4 | ) | ||||||||||
|
|
|
|
|
|
|
|
|
|
|
|
|
|
|
|||||||||||||||
Deconsolidation of Certain Investment Entities
During the years ended December 31, 2013 and 2012, the Company did not deconsolidate any investment entities.
Nonconsolidated VIEs
CLO Entities
In addition to the consolidated CLO entities, the Company also holds variable interest in certain CLO entities that are not consolidated as it has been determined that the Company is not the primary beneficiary. With these CLO entities, the Company serves as the investment manager and receives investment management fees and contingent performance fees. Generally, the Company does not hold any interest in the nonconsolidated CLO entities but if it does, such ownership has been deemed to be insignificant. The Company has never provided, and is not obligated to provide, any financial or other support to these entities.
The Company reviews its assumptions on a periodic basis to determine if conditions have changed such that the projection of these contingent fees becomes significant enough to reconsider the Company’s consolidation status as variable interest holder. As of December 31, 2013 and 2012, the Company does not hold any ownership interests in these unconsolidated CLOs.
F-139
Table of Contents
ING U.S., Inc.
Notes to the Consolidated Financial Statements
(Dollar amounts in millions, unless otherwise stated)
The following table presents the carrying amounts of total assets and liabilities of the VIEs in which the Company has concluded that it holds a variable interest, but is not the primary beneficiary as of the dates indicated. The Company determines its maximum exposure to loss to be: (i) the amount invested in the debt or equity of the VIE and (ii) other commitments and guarantees to the VIE.
| December 31, 2013 |
December 31, 2012 |
|||||||
| Carrying amount |
$ | — | $ | — | ||||
| Maximum exposure to loss |
— | — | ||||||
| Assets of nonconsolidated investment entities |
1,640.4 | 1,792.2 | ||||||
| Liabilities of nonconsolidated investment entities |
1,639.0 | 1,772.9 | ||||||
Investment Funds
The Company manages or holds investments in certain private equity funds and single strategy hedge funds. With these entities, the Company serves as the investment manager and is entitled to receive investment management fees and contingent performance fees that are generally expected to be insignificant. Although the Company has the power to direct the activities that significantly impact the economic performance of the funds, it does not hold a significant variable interest in any of these funds and, as such, does not have the obligation to absorb losses or the right to receive benefits from the entity that could potentially be significant to the entity. Accordingly, the Company is not considered the primary beneficiary and did not consolidate any of these investment funds.
In addition, the Company does not consolidate the funds in which its involvement takes a form of a limited partner interest and is restricted to a role of a passive investor, as a limited partner’s interest does not provide the Company with any substantive kick-out or participating rights, which would overcome the presumption of control by the general partner.
Securitizations
The Company invests in various tranches of securitization entities, including RMBS, CMBS and ABS. Through its investments, the Company is not obligated to provide any financial or other support to these entities. Each of the RMBS, CMBS and ABS entities are thinly capitalized by design and considered VIEs. The Company’s involvement with these entities is limited to that of a passive investor. The Company has no unilateral right to appoint or remove the servicer, special servicer, or investment manager, which are generally viewed to have the power to direct the activities that most significantly impact the securitization entities’ economic performance, in any of these entities, nor does the Company function in any of these roles. The Company, through its investments or other arrangements, does not have the obligation to absorb losses or the right to receive benefits from the entity that could potentially be significant to the entity. Therefore, the Company is not the primary beneficiary and will not consolidate any of the RMBS, CMBS and ABS entities in which it holds investments. These investments are accounted for as investments available-for-sale as described in the Note 4. Fair Value Measurements (excluding Consolidated Investment Entities) and unrealized capital gains (losses) on these securities are recorded directly in AOCI, except for certain RMBS which are accounted for under the FVO whose change in fair value is reflected in Other net realized gains (losses) in the Consolidated Statements of Operations. The Company’s maximum exposure to loss on these structured investments is limited to the amount of its investment. Refer to Note 2. Investments (excluding Consolidated Investment Entities) for details regarding the carrying amounts and classifications of these assets.
F-140
Table of Contents
ING U.S., Inc.
Notes to the Consolidated Financial Statements
(Dollar amounts in millions, unless otherwise stated)
20. Segments
The Company provides its principal products and services in three ongoing businesses and reports results through five ongoing segments as follows:
| Business |
Segment | |
| Retirement Solutions |
Retirement Annuities | |
| Investment Management |
Investment Management | |
| Insurance Solutions |
Individual Life Employee Benefits | |
The Company also has a Corporate segment, which includes the financial data not directly related to the businesses and Closed Block segments, which include non-strategic products that are in run-off and no longer being actively marketed and sold.
These segments reflect the manner by which the Company’s chief operating decision maker views and manages the business. The following is a brief description of these segments, as well as Corporate and Closed Block segments.
Retirement Solutions
The Retirement Solutions business provides its products through two segments: Retirement and Annuities. The Retirement segment provides tax-deferred, employer-sponsored retirement savings plans and administrative services in corporate, education, healthcare and government markets, as well as rollover IRAs and other retail financial products. The Annuities segment primarily provides fixed and indexed annuities, tax-qualified mutual fund custodial products and payout annuities for pre-retirement wealth accumulation and post-retirement income management sold through multiple channels.
Investment Management
The Investment Management business provides investment products and retirement solutions through a broad range of traditional and alternative asset classes, geographies and styles, in separate accounts, pooled accounts, annuity portfolios and mutual funds. Products and services are offered to institutional clients, including public, corporate and union retirement plans, endowments and foundations and insurance companies, as well as individual investors and affiliated U.S. businesses and are distributed through the Company’s direct sales force, consultant channel and intermediary partners (such as banks, broker-dealers and independent financial advisers).
Insurance Solutions
The Insurance Solutions business provides its products through two segments: Individual Life and Employee Benefits. The Individual Life segment provides wealth protection and transfer opportunities through universal, variable, whole life and term products, distributed through independent channels to meet the needs of a broad range of customers from the middle market through affluent market segments. The Employee Benefits segment provides stop loss, group life, voluntary employee-paid and disability products to mid-sized and large businesses.
F-141
Table of Contents
ING U.S., Inc.
Notes to the Consolidated Financial Statements
(Dollar amounts in millions, unless otherwise stated)
Corporate
Corporate includes corporate operations and corporate level assets and financial obligations. The Corporate segment includes investment income on assets backing surplus in excess of amounts held at the segment level, financing and interest expenses, other items not allocated to segments, such as certain expenses and liabilities of employee benefit plans and intercompany eliminations.
Closed Blocks
Closed Blocks include the Closed Block Variable Annuity, Closed Block Institutional Spread Products and Closed Block Other, which are in run-off. Closed Block Variable Annuity and Closed Block Institutional Spread Products (which issues guaranteed investment contracts and funding agreements) are no longer being actively marketed and sold, but are managed to protect regulatory and rating agency capital from equity market movements. The Closed Block Other segment mainly consists of the contingent consideration and loss related to the 2010 sale of three of the Company’s broker dealers and the amortization of the deferred gain related to the divestment of Group Reinsurance in 2010 via reinsurance and the Individual Reinsurance segment that was divested in 2004 via reinsurance.
Measurement
Operating earnings before income taxes is an internal measure used by management to evaluate segment performance. The Company uses the same accounting policies and procedures to measure segment operating earnings before income taxes as it does for consolidated net income (loss). Operating earnings before income taxes does not replace net income (loss) as the U.S. GAAP measure of the Company’s consolidated results of operations. However, the Company believes that the definitions of operating earnings before income taxes provide users with a more valuable measure of its business and segment performances and enhance the understanding of the Company’s performance by highlighting performance drivers. Each segment’s operating earnings before income taxes is calculated by adjusting income (loss) before income taxes for the following items:
| • | Net investment gains (losses), net of related amortization of DAC, VOBA, sales inducements and unearned revenue. Net investment gains (losses) include gains (losses) on the sale of securities, impairments, changes in the fair value of investments using the FVO unrelated to the implied loan-backed security income recognition for certain mortgage-backed obligations and changes in the fair value of derivative instruments, excluding realized gains (losses) associated with swap settlements and accrued interest; |
| • | Net guaranteed benefit hedging gains (losses), which include changes in the fair value of derivatives related to guaranteed benefits, net of related reserve increases (decreases) and net of related amortization of DAC, VOBA and sales inducements, less the estimated cost of these benefits. The estimated cost, which is reflected in operating results, reflects the expected cost of these benefits if markets perform in line with the Company’s long-term expectations and includes the cost of hedging. All other derivative and reserve changes related to guaranteed benefits are excluded from operating results, including the impacts related to changes in the Company’s nonperformance spread; |
| • | Income (loss) related to business exited through reinsurance or divestment; |
| • | Income (loss) attributable to noncontrolling interests; |
| • | Income (loss) related to early extinguishment of debt; |
| • | Impairment of goodwill, value of management contract rights and value of customer relationships acquired; |
F-142
Table of Contents
ING U.S., Inc.
Notes to the Consolidated Financial Statements
(Dollar amounts in millions, unless otherwise stated)
| • | Immediate recognition of net actuarial gains (losses) related to the Company’s pension and other postretirement benefit obligations and gains (losses) from plan amendments and curtailments; and |
| • | Other items, including restructuring expenses (severance, lease write-offs, etc.), integration expenses related to the Company’s acquisition of CitiStreet and certain third-party expenses and deal incentives related to the divestment of the Company by ING Group. |
Operating earnings before income taxes also does not reflect the results of operations of the Company’s Closed Block Variable Annuity segment, since this segment is managed to focus on protecting regulatory and rating agency capital rather than achieving operating metrics. When the Company presents the adjustments to Income (loss) before income taxes on a consolidated basis, each adjustment excludes the relative portions attributable to the Company’s Closed Block Variable Annuity segment.
The summary below reconciles operating earnings before income taxes for the segments to Income (loss) before income taxes for the years ended December 31, 2013, 2012 and 2011:
| 2013 | 2012 | 2011 | ||||||||||
| Retirement Solutions: |
||||||||||||
| Retirement |
$ | 595.8 | $ | 448.6 | $ | 441.9 | ||||||
| Annuities |
293.8 | 102.2 | 387.6 | |||||||||
| Investment Management |
178.1 | 134.5 | 87.5 | |||||||||
| Insurance Solutions: |
||||||||||||
| Individual Life |
254.8 | 196.2 | 279.3 | |||||||||
| Employee Benefits |
106.1 | 109.4 | 83.3 | |||||||||
|
|
|
|
|
|
|
|||||||
| Total Ongoing Businesses |
1,428.6 | 990.9 | 1,279.6 | |||||||||
| Corporate |
(210.6 | ) | (182.3 | ) | (230.2 | ) | ||||||
| Closed Blocks: |
||||||||||||
| Closed Block Institutional Spread Products |
35.9 | 45.7 | 83.2 | |||||||||
| Closed Block Other |
14.7 | 64.0 | (13.0 | ) | ||||||||
|
|
|
|
|
|
|
|||||||
| Closed Blocks |
50.6 | 109.7 | 70.2 | |||||||||
|
|
|
|
|
|
|
|||||||
| Total operating earnings before income taxes |
1,268.6 | 918.3 | 1,119.6 | |||||||||
|
|
|
|
|
|
|
|||||||
| Adjustments: |
||||||||||||
| Closed Block Variable Annuity |
(1,209.3 | ) | (692.3 | ) | (564.5 | ) | ||||||
| Net investment gains (losses) and related charges and adjustments |
212.1 | 455.5 | 71.8 | |||||||||
| Net guaranteed benefit hedging gains (losses) and related charges and adjustments |
19.4 | 97.2 | (269.4 | ) | ||||||||
| Loss related to businesses exited through reinsurance or divestment |
(59.8 | ) | (45.8 | ) | (35.1 | ) | ||||||
| Income (loss) attributable to noncontrolling interests |
190.1 | 138.2 | 190.9 | |||||||||
| Immediate recognition of net actuarial gains (losses) related to pension and other postretirement benefit obligations and gains (losses) from plan amendments and curtailments |
405.2 | (165.0 | ) | (157.8 | ) | |||||||
| Other adjustments to operating income |
(68.2 | ) | (100.1 | ) | (77.7 | ) | ||||||
|
|
|
|
|
|
|
|||||||
| Income (loss) before income taxes |
$ | 758.1 | $ | 606.0 | $ | 277.8 | ||||||
|
|
|
|
|
|
|
|||||||
F-143
Table of Contents
ING U.S., Inc.
Notes to the Consolidated Financial Statements
(Dollar amounts in millions, unless otherwise stated)
Operating revenues is a measure of the Company’s segment revenues. The Company calculates operating revenues by adjusting each segment’s revenues for the following items:
| • | Net realized investment gains (losses) and related charges and adjustments include gains (losses) on the sale of securities, impairments, changes in the fair value of investments using the fair value option (“FVO”) unrelated to the implied loan-backed security income recognition for certain mortgage-backed obligations and changes in the fair value of derivative instruments, excluding realized gains (losses) associated with swap settlements and accrued interest. These are net of related amortization of unearned revenue; |
| • | Gain (loss) on change in fair value of derivatives related to guaranteed benefits include changes in the fair value of derivatives related to guaranteed benefits, less the estimated cost of these benefits. The estimated cost, which is reflected in operating results, reflects the expected cost of these benefits if markets perform in line with the Company’s long-term expectations and includes the cost of hedging. All other derivative and reserve changes related to guaranteed benefits are excluded from operating revenues, including the impacts related to changes in the Company’s nonperformance spread; |
| • | Revenues related to businesses exited through reinsurance or divestment; |
| • | Revenues attributable to noncontrolling interests; and |
| • | Other adjustments to operating revenues primarily reflect fee income earned by the Company’s broker-dealers for sales of non-proprietary products, which are reflected net of commission expense in the Company’s segments’ operating revenues, as well as other items where the income is passed on to third parties. |
Operating revenues also do not reflect the revenues of the Company’s Closed Block Variable Annuity segment, since this segment is managed to focus on protecting regulatory and rating agency capital rather than achieving operating metrics. When the Company presents the adjustments to Total revenues on a consolidated basis, each adjustment excludes the relative portions attributable to the Company’s Closed Block Variable Annuity segment.
F-144
Table of Contents
ING U.S., Inc.
Notes to the Consolidated Financial Statements
(Dollar amounts in millions, unless otherwise stated)
The summary below reconciles operating revenues for the segments to Total revenues for the years ended December 31, 2013, 2012 and 2011:
| 2013 | 2012 | 2011 | ||||||||||
| Retirement Solutions: |
||||||||||||
| Retirement |
$ | 2,399.4 | $ | 2,271.9 | $ | 2,225.4 | ||||||
| Annuities |
1,244.6 | 1,307.0 | 1,401.4 | |||||||||
| Investment Management |
607.7 | 545.5 | 491.9 | |||||||||
| Insurance Solutions: |
||||||||||||
| Individual Life |
2,791.9 | 2,793.9 | 2,785.0 | |||||||||
| Employee Benefits |
1,262.5 | 1,251.2 | 1,246.2 | |||||||||
|
|
|
|
|
|
|
|||||||
| Total Ongoing Businesses |
8,306.1 | 8,169.5 | 8,149.9 | |||||||||
| Corporate |
87.4 | 65.9 | (13.7 | ) | ||||||||
| Closed Blocks: |
||||||||||||
| Closed Block Institutional Spread Products |
109.1 | 127.2 | 188.1 | |||||||||
| Closed Block Other |
27.7 | 43.8 | 52.2 | |||||||||
|
|
|
|
|
|
|
|||||||
| Closed Blocks |
136.8 | 171.0 | 240.3 | |||||||||
|
|
|
|
|
|
|
|||||||
| Total operating revenues |
8,530.3 | 8,406.4 | 8,376.5 | |||||||||
|
|
|
|
|
|
|
|||||||
| Adjustments: |
||||||||||||
| Closed Block Variable Annuity |
(726.2 | ) | (70.0 | ) | 794.9 | |||||||
| Net realized investment gains (losses) and related charges and adjustments |
157.4 | 603.4 | 219.2 | |||||||||
| Gain (loss) on change in fair value of derivatives related to guaranteed benefits |
104.0 | 83.1 | (399.0 | ) | ||||||||
| Revenues related to businesses exited through reinsurance or divestment |
(76.2 | ) | 64.6 | 116.1 | ||||||||
| Revenues (loss) attributable to noncontrolling interests |
411.2 | 313.8 | 399.1 | |||||||||
| Other adjustments to operating revenues |
358.0 | 214.0 | 212.0 | |||||||||
|
|
|
|
|
|
|
|||||||
| Total revenues |
$ | 8,758.5 | $ | 9,615.3 | $ | 9,718.8 | ||||||
|
|
|
|
|
|
|
|||||||
Other Segment Information
The Investment Management segment revenues include the following intersegment revenues, primarily consisting of asset-based management and administration fees.
| Years Ended December 31, | ||||||||||||
| 2013 | 2012 | 2011 | ||||||||||
| Investment management intersegment revenues |
$ | 157.8 | $ | 157.6 | $ | 164.1 | ||||||
F-145
Table of Contents
ING U.S., Inc.
Notes to the Consolidated Financial Statements
(Dollar amounts in millions, unless otherwise stated)
The summary below presents Total assets for the Company’s segments as of December 31, 2013 and 2012:
| 2013 | 2012 | |||||||
| Retirement Solutions: |
||||||||
| Retirement |
$ | 92,336.7 | $ | 86,504.3 | ||||
| Annuities |
26,528.3 | 27,718.6 | ||||||
| Investment Management |
463.3 | 498.5 | ||||||
| Insurance Solutions: |
||||||||
| Individual Life |
25,592.2 | 25,319.0 | ||||||
| Employee Benefits |
2,518.5 | 2,657.0 | ||||||
|
|
|
|
|
|||||
| Total Ongoing Businesses |
147,439.0 | 142,697.4 | ||||||
| Corporate |
4,802.8 | 5,593.4 | ||||||
| Closed Blocks: |
||||||||
| Closed Block Variable Annuity |
49,483.5 | 49,157.6 | ||||||
| Closed Block Institutional Spread Products |
3,390.1 | 4,392.2 | ||||||
| Closed Block Other |
7,586.5 | 8,239.1 | ||||||
|
|
|
|
|
|||||
| Closed Blocks |
60,460.1 | 61,788.9 | ||||||
|
|
|
|
|
|||||
| Total assets of segments |
212,701.9 | 210,079.7 | ||||||
| Noncontrolling interest |
8,321.3 | 6,314.5 | ||||||
|
|
|
|
|
|||||
| Total assets |
$ | 221,023.2 | $ | 216,394.2 | ||||
|
|
|
|
|
|||||
21. Condensed Consolidating Financial Information
The accompanying condensed consolidating financial information has been prepared and presented pursuant to SEC Regulation S-X, Rule 3-10, “Financial Statements of Guarantors and Issuers of Guaranteed Securities Registered or Being Registered”(“Rule 3-10”). The condensed consolidating financial information presents the financial position of ING U.S., Inc. (“Parent Issuer”), Lion Holdings (“Subsidiary Guarantor”) and all other subsidiaries (“Non-Guarantor Subsidiaries”) of the Company as of December 31, 2013 and 2012, and the results of their operations, comprehensive income and cash flows for periods ended December 31, 2013, 2012 and 2011.
The 2022 Notes, 2018 Notes, 2053 Notes and 2043 Notes are fully and unconditionally guaranteed by Lion Holdings, a 100% owned subsidiary of the Company. No other subsidiary of ING U.S., Inc. guarantees the 2022 Notes, 2018 Notes, 2053 Notes or 2043 Notes. Rule 3-10(h) provides that a guarantee is full and unconditional if, when the issuer of a guaranteed security has failed to make a scheduled payment, the guarantor is obligated to make the scheduled payment immediately and, if it does not, any holder of the guaranteed security may immediately bring suit directly against the guarantor for payment of all amounts due and payable. In the event that Lion Holdings does not fulfill the guaranteed obligations, any holder of the 2022 Notes, 2018 Notes, 2053 Notes or 2043 Notes may immediately bring a claim against Lion Holdings for all amounts due and payable. See Note 12. Insurance Subsidiaries to these Consolidated Financial Statements for information on any significant restrictions on the ability of the Parent Issuer or Subsidiary Guarantor to obtain funds from its subsidiaries by dividend or return of capital.
The following condensed consolidating financial information is presented in conformance with the consolidated financial statements. Investments in subsidiaries are accounted for using the equity method for purposes of illustrating the consolidating presentation. Equity in the subsidiaries is therefore reflected in the Parent Issuer’s and Subsidiary Guarantor’s Investment in subsidiaries and Equity in earnings of subsidiaries, net of tax. Non-Guarantor Subsidiaries represent all other subsidiaries on a combined basis. The consolidating adjustments presented eliminate investments in subsidiaries and intercompany balances and transactions.
F-146
Table of Contents
ING U.S., Inc.
Notes to the Consolidated Financial Statements
(Dollar amounts in millions, unless otherwise stated)
Condensed Consolidating Balance Sheet
December 31, 2013
| Parent Issuer |
Subsidiary Guarantor |
Non-Guarantor Subsidiaries |
Consolidating Adjustments |
Consolidated | ||||||||||||||||
| Assets: |
||||||||||||||||||||
| Investments: |
||||||||||||||||||||
| Fixed maturities, available-for-sale, at fair value |
$ | — | $ | — | $ | 68,333.2 | $ | (15.4 | ) | $ | 68,317.8 | |||||||||
| Fixed maturities, at fair value using the fair value option |
— | — | 2,935.3 | — | 2,935.3 | |||||||||||||||
| Equity securities, available-for-sale, at fair value |
76.6 | 20.6 | 217.2 | — | 314.4 | |||||||||||||||
| Short-term investments |
— | — | 1,048.1 | — | 1,048.1 | |||||||||||||||
| Mortgage loans on real estate, net of valuation allowance |
— | — | 9,312.2 | — | 9,312.2 | |||||||||||||||
| Policy loans |
— | — | 2,147.0 | — | 2,147.0 | |||||||||||||||
| Limited partnerships/corporations |
— | — | 236.4 | — | 236.4 | |||||||||||||||
| Derivatives |
69.9 | — | 1,261.8 | (182.4 | ) | 1,149.3 | ||||||||||||||
| Investments in subsidiaries |
15,103.8 | 12,572.7 | — | (27,676.5 | ) | — | ||||||||||||||
| Other investments |
— | 0.4 | 124.2 | — | 124.6 | |||||||||||||||
| Securities pledged |
— | — | 1,465.7 | — | 1,465.7 | |||||||||||||||
|
|
|
|
|
|
|
|
|
|
|
|||||||||||
| Total investments |
15,250.3 | 12,593.7 | 87,081.1 | (27,874.3 | ) | 87,050.8 | ||||||||||||||
| Cash and cash equivalents |
640.2 | 1.1 | 2,199.5 | — | 2,840.8 | |||||||||||||||
| Short-term investments under securities loan agreements, including collateral delivered |
30.7 | — | 542.3 | (20.1 | ) | 552.9 | ||||||||||||||
| Accrued investment income |
— | — | 897.1 | — | 897.1 | |||||||||||||||
| Reinsurance recoverable |
— | — | 6,702.2 | — | 6,702.2 | |||||||||||||||
| Deferred policy acquisition costs, Value of business acquired |
— | — | 5,351.6 | — | 5,351.6 | |||||||||||||||
| Sales inducements to contract holders |
— | — | 279.0 | — | 279.0 | |||||||||||||||
| Deferred income taxes |
204.4 | — | (42.3 | ) | — | 162.1 | ||||||||||||||
| Goodwill and other intangible assets |
— | — | 323.7 | — | 323.7 | |||||||||||||||
| Loans to subsidiaries and affiliates |
211.3 | — | 0.3 | (211.6 | ) | — | ||||||||||||||
| Due from subsidiaries and affiliates |
26.9 | 0.6 | 1.7 | (29.2 | ) | — | ||||||||||||||
| Other assets |
43.4 | — | 995.1 | (2.0 | ) | 1,036.5 | ||||||||||||||
| Assets related to consolidated investment entities: |
||||||||||||||||||||
| Limited partnerships/corporations, at fair value |
— | — | 3,218.6 | — | 3,218.6 | |||||||||||||||
| Cash and cash equivalents |
— | — | 710.7 | — | 710.7 | |||||||||||||||
| Corporate loans, at fair value using the fair value option |
— | — | 4,965.3 | — | 4,965.3 | |||||||||||||||
| Other assets |
— | — | 104.8 | — | 104.8 | |||||||||||||||
| Assets held in separate accounts |
— | — | 106,827.1 | — | 106,827.1 | |||||||||||||||
|
|
|
|
|
|
|
|
|
|
|
|||||||||||
| Total assets |
$ | 16,407.2 | $ | 12,595.4 | $ | 220,157.8 | $ | (28,137.2 | ) | $ | 221,023.2 | |||||||||
|
|
|
|
|
|
|
|
|
|
|
|||||||||||
F-147
Table of Contents
ING U.S., Inc.
Notes to the Consolidated Financial Statements
(Dollar amounts in millions, unless otherwise stated)
Condensed Consolidating Balance Sheet (Continued)
December 31, 2013
| Parent Issuer |
Subsidiary Guarantor |
Non-Guarantor Subsidiaries |
Consolidating Adjustments |
Consolidated | ||||||||||||||||
| Liabilities and Shareholders’ Equity: |
||||||||||||||||||||
| Future policy benefits |
$ | — | $ | — | $ | 14,098.4 | $ | — | $ | 14,098.4 | ||||||||||
| Contract owner account balances |
— | — | 69,908.3 | — | 69,908.3 | |||||||||||||||
| Payables under securities loan agreement, including collateral held |
— | — | 769.4 | — | 769.4 | |||||||||||||||
| Short-term debt |
— | 125.4 | 85.9 | (211.3 | ) | — | ||||||||||||||
| Long-term debt |
2,996.7 | 514.7 | 18.7 | (15.4 | ) | 3,514.7 | ||||||||||||||
| Funds held under reinsurance agreements |
— | — | 1,181.5 | — | 1,181.5 | |||||||||||||||
| Derivatives |
114.0 | — | 1,420.2 | (182.4 | ) | 1,351.8 | ||||||||||||||
| Pension and other post-employment provisions |
— | — | 474.9 | — | 474.9 | |||||||||||||||
| Current income taxes |
(47.0 | ) | 10.6 | 80.5 | — | 44.1 | ||||||||||||||
| Due to subsidiaries and affiliates |
0.2 | 1.5 | 12.5 | (14.2 | ) | — | ||||||||||||||
| Other liabilities |
71.1 | 14.4 | 1,226.0 | (37.4 | ) | 1,274.1 | ||||||||||||||
| Liabilities related to consolidated investment entities: |
||||||||||||||||||||
| Collateralized loan obligations notes, at fair value using the fair value option |
— | — | 5,161.6 | — | 5,161.6 | |||||||||||||||
| Other liabilities |
— | — | 903.3 | — | 903.3 | |||||||||||||||
| Liabilities related to separate accounts |
— | — | 106,827.1 | — | 106,827.1 | |||||||||||||||
|
|
|
|
|
|
|
|
|
|
|
|||||||||||
| Total liabilities |
3,135.0 | 666.6 | 202,168.3 | (460.7 | ) | 205,509.2 | ||||||||||||||
|
|
|
|
|
|
|
|
|
|
|
|||||||||||
| Shareholders’ equity: |
||||||||||||||||||||
| Total ING U.S., Inc. shareholders’ equity |
13,272.2 | 11,928.8 | 15,747.7 | (27,676.5 | ) | 13,272.2 | ||||||||||||||
| Noncontrolling interest |
— | — | 2,241.8 | — | 2,241.8 | |||||||||||||||
|
|
|
|
|
|
|
|
|
|
|
|||||||||||
| Total shareholders’ equity |
13,272.2 | 11,928.8 | 17,989.5 | (27,676.5 | ) | 15,514.0 | ||||||||||||||
|
|
|
|
|
|
|
|
|
|
|
|||||||||||
| Total liabilities and shareholders’ equity |
$ | 16,407.2 | $ | 12,595.4 | $ | 220,157.8 | $ | (28,137.2 | ) | $ | 221,023.2 | |||||||||
|
|
|
|
|
|
|
|
|
|
|
|||||||||||
F-148
Table of Contents
ING U.S., Inc.
Notes to the Consolidated Financial Statements
(Dollar amounts in millions, unless otherwise stated)
Condensed Consolidating Balance Sheet
December 31, 2012
| Parent Issuer |
Subsidiary Guarantor |
Non-Guarantor Subsidiaries |
Consolidating Adjustments |
Consolidated | ||||||||||||||||
| Assets: |
||||||||||||||||||||
| Investments: |
||||||||||||||||||||
| Fixed maturities, available-for-sale, at fair value |
$ | — | $ | — | $ | 70,925.7 | $ | (15.4 | ) | $ | 70,910.3 | |||||||||
| Fixed maturities, at fair value using the fair value option |
— | — | 2,771.3 | — | 2,771.3 | |||||||||||||||
| Equity securities, available-for-sale, at fair value |
63.9 | 20.1 | 256.1 | — | 340.1 | |||||||||||||||
| Short-term investments |
— | — | 5,991.2 | — | 5,991.2 | |||||||||||||||
| Mortgage loans on real estate, net of valuation allowance |
— | — | 8,662.3 | — | 8,662.3 | |||||||||||||||
| Policy loans |
— | — | 2,200.3 | — | 2,200.3 | |||||||||||||||
| Limited partnerships/corporations |
— | — | 465.1 | — | 465.1 | |||||||||||||||
| Derivatives |
59.3 | — | 2,433.8 | (118.6 | ) | 2,374.5 | ||||||||||||||
| Investments in subsidiaries |
15,715.1 | 14,044.3 | — | (29,759.4 | ) | — | ||||||||||||||
| Other investments |
— | 0.4 | 166.6 | — | 167.0 | |||||||||||||||
| Securities pledged |
— | — | 1,605.5 | — | 1,605.5 | |||||||||||||||
|
|
|
|
|
|
|
|
|
|
|
|||||||||||
| Total investments |
15,838.3 | 14,064.8 | 95,477.9 | (29,893.4 | ) | 95,487.6 | ||||||||||||||
| Cash and cash equivalents |
357.5 | 0.4 | 1,428.9 | — | 1,786.8 | |||||||||||||||
| Short-term investments under securities loan agreements, including collateral delivered |
58.4 | — | 640.7 | (35.1 | ) | 664.0 | ||||||||||||||
| Accrued investment income |
— | — | 863.5 | — | 863.5 | |||||||||||||||
| Reinsurance recoverable |
— | — | 7,379.3 | — | 7,379.3 | |||||||||||||||
| Deferred policy acquisition costs, Value of business acquired |
— | — | 3,656.3 | — | 3,656.3 | |||||||||||||||
| Sales inducements to contract holders |
— | — | 212.7 | — | 212.7 | |||||||||||||||
| Goodwill and other intangible assets |
— | — | 348.5 | — | 348.5 | |||||||||||||||
| Loans to subsidiaries and affiliates |
77.0 | 58.0 | 261.4 | (396.4 | ) | — | ||||||||||||||
| Due from subsidiaries and affiliates |
16.5 | 1.5 | 24.6 | (42.6 | ) | — | ||||||||||||||
| Other assets |
35.8 | — | 1,326.7 | — | 1,362.5 | |||||||||||||||
| Assets related to consolidated investment entities: |
||||||||||||||||||||
| Limited partnerships/corporations, at fair value |
— | — | 2,931.2 | — | 2,931.2 | |||||||||||||||
| Cash and cash equivalents |
— | — | 440.8 | — | 440.8 | |||||||||||||||
| Corporate loans, at fair value using the fair value option |
— | — | 3,559.3 | — | 3,559.3 | |||||||||||||||
| Other assets |
— | — | 34.3 | — | 34.3 | |||||||||||||||
| Assets held in separate accounts |
— | — | 97,667.4 | — | 97,667.4 | |||||||||||||||
|
|
|
|
|
|
|
|
|
|
|
|||||||||||
| Total assets |
$ | 16,383.5 | $ | 14,124.7 | $ | 216,253.5 | $ | (30,367.5 | ) | $ | 216,394.2 | |||||||||
|
|
|
|
|
|
|
|
|
|
|
|||||||||||
F-149
Table of Contents
ING U.S., Inc.
Notes to the Consolidated Financial Statements
(Dollar amounts in millions, unless otherwise stated)
Condensed Consolidating Balance Sheet (Continued)
December 31, 2012
| Parent Issuer |
Subsidiary Guarantor |
Non-Guarantor Subsidiaries |
Consolidating Adjustments |
Consolidated | ||||||||||||||||
| Liabilities and Shareholder’s Equity: |
||||||||||||||||||||
| Future policy benefits |
$ | — | $ | — | $ | 15,493.6 | $ | — | $ | 15,493.6 | ||||||||||
| Contract owner account balances |
— | — | 70,562.1 | — | 70,562.1 | |||||||||||||||
| Payables under securities loan agreement, including collateral held |
— | — | 1,509.8 | — | 1,509.8 | |||||||||||||||
| Short-term debt |
886.1 | 138.3 | 436.3 | (396.1 | ) | 1,064.6 | ||||||||||||||
| Long-term debt |
1,824.6 | 1,014.1 | 347.8 | (15.4 | ) | 3,171.1 | ||||||||||||||
| Funds held under reinsurance agreements |
— | — | 1,236.6 | — | 1,236.6 | |||||||||||||||
| Derivatives |
59.3 | — | 2,003.5 | (118.6 | ) | 1,944.2 | ||||||||||||||
| Pension and other post-employment provisions |
— | — | 903.2 | — | 903.2 | |||||||||||||||
| Current income taxes |
(221.1 | ) | 7.2 | 225.6 | — | 11.7 | ||||||||||||||
| Deferred income taxes |
(127.4 | ) | 0.2 | 1,169.9 | — | 1,042.7 | ||||||||||||||
| Due to subsidiaries and affiliates |
23.1 | 1.5 | 18.0 | (42.6 | ) | — | ||||||||||||||
| Other liabilities |
64.0 | 19.0 | 1,556.6 | (35.4 | ) | 1,604.2 | ||||||||||||||
| Liabilities related to consolidated investment entities: |
||||||||||||||||||||
| Collateralized loan obligations notes, at fair value using the fair value option |
— | — | 3,829.4 | — | 3,829.4 | |||||||||||||||
| Other liabilities |
— | — | 292.4 | — | 292.4 | |||||||||||||||
| Liabilities related to separate accounts |
— | — | 97,667.4 | — | 97,667.4 | |||||||||||||||
|
|
|
|
|
|
|
|
|
|
|
|||||||||||
| Total liabilities |
2,508.6 | 1,180.3 | 197,252.2 | (608.1 | ) | 200,333.0 | ||||||||||||||
|
|
|
|
|
|
|
|
|
|
|
|||||||||||
| Shareholder’s equity: |
||||||||||||||||||||
| Total ING U.S., Inc. shareholder’s equity |
13,874.9 | 12,944.4 | 16,815.0 | (29,759.4 | ) | 13,874.9 | ||||||||||||||
| Noncontrolling interest |
— | — | 2,186.3 | — | 2,186.3 | |||||||||||||||
|
|
|
|
|
|
|
|
|
|
|
|||||||||||
| Total shareholder’s equity |
13,874.9 | 12,944.4 | 19,001.3 | (29,759.4 | ) | 16,061.2 | ||||||||||||||
|
|
|
|
|
|
|
|
|
|
|
|||||||||||
| Total liabilities and shareholder’s equity |
$ | 16,383.5 | $ | 14,124.7 | $ | 216,253.5 | $ | (30,367.5 | ) | $ | 216,394.2 | |||||||||
|
|
|
|
|
|
|
|
|
|
|
|||||||||||
F-150
Table of Contents
ING U.S., Inc.
Notes to the Consolidated Financial Statements
(Dollar amounts in millions, unless otherwise stated)
Condensed Consolidating Statement of Operations
For the Year Ended December 31, 2013
| Parent Issuer |
Subsidiary Guarantor |
Non-Guarantor Subsidiaries |
Consolidating Adjustments |
Consolidated | ||||||||||||||||
| Revenues: |
||||||||||||||||||||
| Net investment income |
$ | 36.4 | $ | 0.2 | $ | 4,656.2 | $ | (3.8 | ) | $ | 4,689.0 | |||||||||
| Fee income |
— | — | 3,666.3 | — | 3,666.3 | |||||||||||||||
| Premiums |
— | — | 1,956.3 | — | 1,956.3 | |||||||||||||||
| Net realized gains (losses): |
||||||||||||||||||||
| Total other-than-temporary impairments |
— | — | (43.7 | ) | — | (43.7 | ) | |||||||||||||
| Less: Portion of other-than-temporary impairments recognized in Other comprehensive income (loss) |
— | — | (8.0 | ) | — | (8.0 | ) | |||||||||||||
|
|
|
|
|
|
|
|
|
|
|
|||||||||||
| Net other-than-temporary impairments recognized in earnings |
— | — | (35.7 | ) | — | (35.7 | ) | |||||||||||||
| Other net realized capital gains (losses) |
(39.2 | ) | — | (2,459.9 | ) | — | (2,499.1 | ) | ||||||||||||
|
|
|
|
|
|
|
|
|
|
|
|||||||||||
| Total net realized capital gains (losses) |
(39.2 | ) | — | (2,495.6 | ) | — | (2,534.8 | ) | ||||||||||||
| Other revenue |
4.2 | 2.6 | 429.2 | (3.0 | ) | 433.0 | ||||||||||||||
| Income (loss) related to consolidated investment entities: |
||||||||||||||||||||
| Net investment income (loss) |
— | — | 545.2 | — | 545.2 | |||||||||||||||
| Changes in fair value related to collateralized loan obligations |
— | — | 3.5 | — | 3.5 | |||||||||||||||
|
|
|
|
|
|
|
|
|
|
|
|||||||||||
| Total revenues |
1.4 | 2.8 | 8,761.1 | (6.8 | ) | 8,758.5 | ||||||||||||||
| Benefits and expenses: |
||||||||||||||||||||
| Policyholder benefits |
— | — | 2,409.4 | — | 2,409.4 | |||||||||||||||
| Interest credited to contract owner account balance |
— | — | 2,088.4 | — | 2,088.4 | |||||||||||||||
| Operating expenses |
8.8 | — | 2,680.9 | (3.0 | ) | 2,686.7 | ||||||||||||||
| Net amortization of deferred policy acquisition costs and value of business acquired |
— | — | 442.8 | — | 442.8 | |||||||||||||||
| Interest expense |
129.2 | 52.8 | 6.6 | (3.8 | ) | 184.8 | ||||||||||||||
| Operating expenses related to consolidated investment entities: |
||||||||||||||||||||
| Interest expense |
— | — | 180.6 | — | 180.6 | |||||||||||||||
| Other expense |
— | — | 7.7 | — | 7.7 | |||||||||||||||
|
|
|
|
|
|
|
|
|
|
|
|||||||||||
| Total benefits and expenses |
138.0 | 52.8 | 7,816.4 | (6.8 | ) | 8,000.4 | ||||||||||||||
|
|
|
|
|
|
|
|
|
|
|
|||||||||||
| Income (loss) before income taxes |
(136.6 | ) | (50.0 | ) | 944.7 | — | 758.1 | |||||||||||||
| Income tax expense (benefit) |
(208.0 | ) | (31.0 | ) | 206.5 | — | (32.5 | ) | ||||||||||||
|
|
|
|
|
|
|
|
|
|
|
|||||||||||
| Net income (loss) before equity in earnings (losses) of unconsolidated affiliates |
71.4 | (19.0 | ) | 738.2 | — | 790.6 | ||||||||||||||
| Equity in earnings (losses) of subsidiaries, net of tax |
529.1 | 866.0 | — | (1,395.1 | ) | — | ||||||||||||||
|
|
|
|
|
|
|
|
|
|
|
|||||||||||
| Net income (loss) including noncontrolling interest |
600.5 | 847.0 | 738.2 | (1,395.1 | ) | 790.6 | ||||||||||||||
| Less: Net income (loss) attributable to noncontrolling interest |
— | — | 190.1 | — | 190.1 | |||||||||||||||
|
|
|
|
|
|
|
|
|
|
|
|||||||||||
| Net income (loss) available to ING U.S., Inc.’s common shareholders |
$ | 600.5 | $ | 847.0 | $ | 548.1 | $ | (1,395.1 | ) | $ | 600.5 | |||||||||
|
|
|
|
|
|
|
|
|
|
|
|||||||||||
F-151
Table of Contents
ING U.S., Inc.
Notes to the Consolidated Financial Statements
(Dollar amounts in millions, unless otherwise stated)
Condensed Consolidating Statement of Operations
For the Year Ended December 31, 2012
| Parent Issuer |
Subsidiary Guarantor |
Non-Guarantor Subsidiaries |
Consolidating Adjustments |
Consolidated | ||||||||||||||||
| Revenues: |
||||||||||||||||||||
| Net investment income |
$ | 2.4 | $ | 1.9 | $ | 4,698.3 | $ | (4.7 | ) | $ | 4,697.9 | |||||||||
| Fee income |
— | — | 3,515.4 | — | 3,515.4 | |||||||||||||||
| Premiums |
— | — | 1,861.1 | — | 1,861.1 | |||||||||||||||
| Net realized gains (losses): |
||||||||||||||||||||
| Total other-than-temporary impairments |
— | — | (74.1 | ) | — | (74.1 | ) | |||||||||||||
| Less: Portion of other-than-temporary impairments recognized in Other comprehensive income (loss) |
— | — | (19.0 | ) | — | (19.0 | ) | |||||||||||||
|
|
|
|
|
|
|
|
|
|
|
|||||||||||
| Net other-than-temporary impairments recognized in earnings |
— | — | (55.1 | ) | — | (55.1 | ) | |||||||||||||
| Other net realized capital gains (losses) |
— | — | (1,225.7 | ) | — | (1,225.7 | ) | |||||||||||||
|
|
|
|
|
|
|
|
|
|
|
|||||||||||
| Total net realized capital gains (losses) |
— | — | (1,280.8 | ) | — | (1,280.8 | ) | |||||||||||||
| Other revenue |
12.5 | 0.7 | 373.7 | (8.4 | ) | 378.5 | ||||||||||||||
| Income (loss) related to consolidated investment entities: |
||||||||||||||||||||
| Net investment income (loss) |
— | — | 556.6 | — | 556.6 | |||||||||||||||
| Changes in fair value related to collateralized loan obligations |
— | — | (113.4 | ) | — | (113.4 | ) | |||||||||||||
|
|
|
|
|
|
|
|
|
|
|
|||||||||||
| Total revenues |
14.9 | 2.6 | 9,610.9 | (13.1 | ) | 9,615.3 | ||||||||||||||
| Benefits and expenses: |
||||||||||||||||||||
| Policyholder benefits |
— | — | 2,613.5 | — | 2,613.5 | |||||||||||||||
| Interest credited to contract owner account balance |
— | — | 2,248.1 | — | 2,248.1 | |||||||||||||||
| Operating expenses |
30.5 | 1.2 | 3,131.7 | (8.4 | ) | 3,155.0 | ||||||||||||||
| Net amortization of deferred policy acquisition costs and value of business acquired |
— | — | 722.3 | — | 722.3 | |||||||||||||||
| Interest expense |
74.1 | 61.4 | 22.9 | (4.7 | ) | 153.7 | ||||||||||||||
| Operating expenses related to consolidated investment entities: |
||||||||||||||||||||
| Interest expense |
— | — | 106.4 | — | 106.4 | |||||||||||||||
| Other expense |
— | — | 10.3 | — | 10.3 | |||||||||||||||
|
|
|
|
|
|
|
|
|
|
|
|||||||||||
| Total benefits and expenses |
104.6 | 62.6 | 8,855.2 | (13.1 | ) | 9,009.3 | ||||||||||||||
|
|
|
|
|
|
|
|
|
|
|
|||||||||||
| Income (loss) before income taxes |
(89.7 | ) | (60.0 | ) | 755.7 | — | 606.0 | |||||||||||||
| Income tax expense (benefit) |
(349.4 | ) | (1.2 | ) | 395.9 | (50.5 | ) | (5.2 | ) | |||||||||||
|
|
|
|
|
|
|
|
|
|
|
|||||||||||
| Net income (loss) before equity in earnings (losses) of unconsolidated affiliates |
259.7 | (58.8 | ) | 359.8 | 50.5 | 611.2 | ||||||||||||||
| Equity in earnings (losses) of subsidiaries, net of tax |
213.3 | 811.1 | — | (1,024.4 | ) | — | ||||||||||||||
|
|
|
|
|
|
|
|
|
|
|
|||||||||||
| Net income (loss) including noncontrolling interest |
473.0 | 752.3 | 359.8 | (973.9 | ) | 611.2 | ||||||||||||||
| Less: Net income (loss) attributable to noncontrolling interest |
— | — | 138.2 | — | 138.2 | |||||||||||||||
|
|
|
|
|
|
|
|
|
|
|
|||||||||||
| Net income (loss) available to ING U.S., Inc.’s common shareholder |
$ | 473.0 | $ | 752.3 | $ | 221.6 | $ | (973.9 | ) | $ | 473.0 | |||||||||
|
|
|
|
|
|
|
|
|
|
|
|||||||||||
F-152
Table of Contents
ING U.S., Inc.
Notes to the Consolidated Financial Statements
(Dollar amounts in millions, unless otherwise stated)
Condensed Consolidating Statement of Operations
For the Year Ended December 31, 2011
| Parent Issuer |
Subsidiary Guarantor |
Non-Guarantor Subsidiaries |
Consolidating Adjustments |
Consolidated | ||||||||||||||||
| Revenues: |
||||||||||||||||||||
| Net investment income |
$ | 10.9 | $ | 1.8 | $ | 4,968.5 | $ | (12.4 | ) | $ | 4,968.8 | |||||||||
| Fee income |
— | — | 3,603.6 | — | 3,603.6 | |||||||||||||||
| Premiums |
— | — | 1,770.0 | — | 1,770.0 | |||||||||||||||
| Net realized gains (losses): |
||||||||||||||||||||
| Total other-than-temporary impairments |
— | — | (550.6 | ) | — | (550.6 | ) | |||||||||||||
| Less: Portion of other-than-temporary impairments recognized in Other comprehensive income (loss) |
— | — | (47.9 | ) | — | (47.9 | ) | |||||||||||||
|
|
|
|
|
|
|
|
|
|
|
|||||||||||
| Net other-than-temporary impairments recognized in earnings |
— | — | (502.7 | ) | — | (502.7 | ) | |||||||||||||
| Other net realized capital gains (losses) |
(42.2 | ) | — | (986.5 | ) | — | (1,028.7 | ) | ||||||||||||
|
|
|
|
|
|
|
|
|
|
|
|||||||||||
| Total net realized capital gains (losses) |
(42.2 | ) | — | (1,489.2 | ) | — | (1,531.4 | ) | ||||||||||||
| Other revenue |
19.7 | 1.1 | 412.1 | (4.7 | ) | 428.2 | ||||||||||||||
| Income (loss) related to consolidated investment entities: |
||||||||||||||||||||
| Net investment income (loss) |
— | — | 528.4 | — | 528.4 | |||||||||||||||
| Changes in fair value related to collateralized loan obligations |
— | — | (48.8 | ) | — | (48.8 | ) | |||||||||||||
|
|
|
|
|
|
|
|
|
|
|
|||||||||||
| Total revenues |
(11.6 | ) | 2.9 | 9,744.6 | (17.1 | ) | 9,718.8 | |||||||||||||
| Benefits and expenses: |
||||||||||||||||||||
| Policyholder benefits |
— | — | 3,286.5 | — | 3,286.5 | |||||||||||||||
| Interest credited to contract owner account balance |
— | — | 2,452.3 | 3.2 | 2,455.5 | |||||||||||||||
| Operating expenses |
11.9 | 3.2 | 3,023.6 | (7.9 | ) | 3,030.8 | ||||||||||||||
| Net amortization of deferred policy acquisition costs and value of business acquired |
— | — | 387.0 | — | 387.0 | |||||||||||||||
| Interest expense |
61.7 | 56.4 | 33.6 | (12.4 | ) | 139.3 | ||||||||||||||
| Operating expenses related to consolidated investment entities: |
||||||||||||||||||||
| Interest expense |
— | — | 68.4 | — | 68.4 | |||||||||||||||
| Other expense |
— | — | 73.5 | — | 73.5 | |||||||||||||||
|
|
|
|
|
|
|
|
|
|
|
|||||||||||
| Total benefits and expenses |
73.6 | 59.6 | 9,324.9 | (17.1 | ) | 9,441.0 | ||||||||||||||
|
|
|
|
|
|
|
|
|
|
|
|||||||||||
| Income (loss) before income taxes |
(85.2 | ) | (56.7 | ) | 419.7 | — | 277.8 | |||||||||||||
| Income tax expense (benefit) |
363.0 | (17.1 | ) | (354.0 | ) | 183.1 | 175.0 | |||||||||||||
|
|
|
|
|
|
|
|
|
|
|
|||||||||||
| Net income (loss) before equity in earnings (losses) of unconsolidated affiliates |
(448.2 | ) | (39.6 | ) | 773.7 | (183.1 | ) | 102.8 | ||||||||||||
| Equity in earnings (losses) of subsidiaries, net of tax |
360.1 | 481.9 | — | (842.0 | ) | — | ||||||||||||||
|
|
|
|
|
|
|
|
|
|
|
|||||||||||
| Net income (loss) including noncontrolling interest |
(88.1 | ) | 442.3 | 773.7 | (1,025.1 | ) | 102.8 | |||||||||||||
| Less: Net income (loss) attributable to noncontrolling interest |
— | — | 190.9 | — | 190.9 | |||||||||||||||
|
|
|
|
|
|
|
|
|
|
|
|||||||||||
| Net income (loss) available to ING U.S., Inc.’s common shareholder |
$ | (88.1 | ) | $ | 442.3 | $ | 582.8 | $ | (1,025.1 | ) | $ | (88.1 | ) | |||||||
|
|
|
|
|
|
|
|
|
|
|
|||||||||||
F-153
Table of Contents
ING U.S., Inc.
Notes to the Consolidated Financial Statements
(Dollar amounts in millions, unless otherwise stated)
Condensed Consolidated Statements of Comprehensive Income
For the Year Ended December 31, 2013
| Parent Issuer |
Subsidiary Guarantor |
Non-Guarantor Subsidiaries |
Consolidating Adjustments |
Consolidated | ||||||||||||||||
| Net income (loss) including noncontrolling interest |
$ | 600.5 | $ | 847.0 | $ | 738.2 | $ | (1,395.1 | ) | $ | 790.6 | |||||||||
| Other comprehensive income (loss), before tax: |
||||||||||||||||||||
| Unrealized gains/losses on securities |
(2,989.8 | ) | (1,894.2 | ) | (2,993.2 | ) | 4,887.4 | (2,989.8 | ) | |||||||||||
| Other-than-temporary impairments |
48.0 | 26.8 | 48.0 | (74.8 | ) | 48.0 | ||||||||||||||
| Pension and other post-employment benefit liability |
(13.8 | ) | (3.2 | ) | (13.8 | ) | 17.0 | (13.8 | ) | |||||||||||
|
|
|
|
|
|
|
|
|
|
|
|||||||||||
| Other comprehensive income (loss), before tax |
(2,955.6 | ) | (1,870.6 | ) | (2,959.0 | ) | 4,829.6 | (2,955.6 | ) | |||||||||||
| Income tax (benefit) expense related to items of other comprehensive income (loss) |
(1,094.0 | ) | (698.8 | ) | (1,093.8 | ) | 1,792.6 | (1,094.0 | ) | |||||||||||
|
|
|
|
|
|
|
|
|
|
|
|||||||||||
| Other comprehensive income (loss), after tax |
(1,861.6 | ) | (1,171.8 | ) | (1,865.2 | ) | 3,037.0 | (1,861.6 | ) | |||||||||||
|
|
|
|
|
|
|
|
|
|
|
|||||||||||
| Comprehensive income (loss) |
(1,261.1 | ) | (324.8 | ) | (1,127.0 | ) | 1,641.9 | (1,071.0 | ) | |||||||||||
| Less: Comprehensive income (loss) attributable to the noncontrolling interest |
— | — | 190.1 | — | 190.1 | |||||||||||||||
|
|
|
|
|
|
|
|
|
|
|
|||||||||||
| Comprehensive income (loss) attributable to ING U.S., Inc.’s common shareholders |
$ | (1,261.1 | ) | $ | (324.8 | ) | $ | (1,317.1 | ) | $ | 1,641.9 | $ | (1,261.1 | ) | ||||||
|
|
|
|
|
|
|
|
|
|
|
|||||||||||
F-154
Table of Contents
ING U.S., Inc.
Notes to the Consolidated Financial Statements
(Dollar amounts in millions, unless otherwise stated)
Condensed Consolidated Statements of Comprehensive Income
For the Year Ended December 31, 2012
| Parent Issuer |
Subsidiary Guarantor |
Non-Guarantor Subsidiaries |
Consolidating Adjustments |
Consolidated | ||||||||||||||||
| Net income (loss) including noncontrolling interest |
$ | 473.0 | $ | 752.3 | $ | 359.8 | $ | (973.9 | ) | $ | 611.2 | |||||||||
| Other comprehensive income (loss), before tax: |
||||||||||||||||||||
| Unrealized gains/losses on securities |
1,659.1 | 1,281.7 | 1,655.9 | (2,937.6 | ) | 1,659.1 | ||||||||||||||
| Other-than-temporary impairments |
52.2 | 30.4 | 52.2 | (82.6 | ) | 52.2 | ||||||||||||||
| Pension and other post-employment benefit liability |
(21.4 | ) | (3.2 | ) | (21.4 | ) | 24.6 | (21.4 | ) | |||||||||||
|
|
|
|
|
|
|
|
|
|
|
|||||||||||
| Other comprehensive income (loss), before tax |
1,689.9 | 1,308.9 | 1,686.7 | (2,995.6 | ) | 1,689.9 | ||||||||||||||
| Income tax (benefit) expense related to items of other comprehensive income (loss) |
574.2 | 411.9 | 555.3 | (967.2 | ) | 574.2 | ||||||||||||||
|
|
|
|
|
|
|
|
|
|
|
|||||||||||
| Other comprehensive income (loss), after tax |
1,115.7 | 897.0 | 1,131.4 | (2,028.4 | ) | 1,115.7 | ||||||||||||||
|
|
|
|
|
|
|
|
|
|
|
|||||||||||
| Comprehensive income (loss) |
1,588.7 | 1,649.3 | 1,491.2 | (3,002.3 | ) | 1,726.9 | ||||||||||||||
| Less: Comprehensive income (loss) attributable to the noncontrolling interest |
— | — | 138.2 | — | 138.2 | |||||||||||||||
|
|
|
|
|
|
|
|
|
|
|
|||||||||||
| Comprehensive income (loss) attributable to ING U.S., Inc.’s common shareholder |
$ | 1,588.7 | $ | 1,649.3 | $ | 1,353.0 | $ | (3,002.3 | ) | $ | 1,588.7 | |||||||||
|
|
|
|
|
|
|
|
|
|
|
|||||||||||
F-155
Table of Contents
ING U.S., Inc.
Notes to the Consolidated Financial Statements
(Dollar amounts in millions, unless otherwise stated)
Condensed Consolidated Statements of Comprehensive Income
For the Year Ended December 31, 2011
| Parent Issuer |
Subsidiary Guarantor |
Non-Guarantor Subsidiaries |
Consolidating Adjustments |
Consolidated | ||||||||||||||||
| Net income (loss) including noncontrolling interest |
$ | (88.1 | ) | $ | 442.3 | $ | 773.7 | $ | (1,025.1 | ) | $ | 102.8 | ||||||||
| Other comprehensive income (loss), before tax: |
||||||||||||||||||||
| Unrealized gains/losses on securities |
1,655.4 | 901.5 | 1,658.7 | (2,560.2 | ) | 1,655.4 | ||||||||||||||
| Other-than-temporary impairments |
165.4 | 68.2 | 165.3 | (233.5 | ) | 165.4 | ||||||||||||||
| Pension and other post-employment benefit liability |
78.9 | 6.9 | 78.9 | (85.8 | ) | 78.9 | ||||||||||||||
|
|
|
|
|
|
|
|
|
|
|
|||||||||||
| Other comprehensive income (loss), before tax |
1,899.7 | 976.6 | 1,902.9 | (2,879.5 | ) | 1,899.7 | ||||||||||||||
| Income tax (benefit) expense related to items of other comprehensive income (loss) |
278.0 | 215.7 | 455.8 | (671.5 | ) | 278.0 | ||||||||||||||
|
|
|
|
|
|
|
|
|
|
|
|||||||||||
| Other comprehensive income (loss), after tax |
1,621.7 | 760.9 | 1,447.1 | (2,208.0 | ) | 1,621.7 | ||||||||||||||
|
|
|
|
|
|
|
|
|
|
|
|||||||||||
| Comprehensive income (loss) |
1,533.6 | 1,203.2 | 2,220.8 | (3,233.1 | ) | 1,724.5 | ||||||||||||||
| Less: Comprehensive income (loss) attributable to the noncontrolling interest |
— | — | 190.9 | — | 190.9 | |||||||||||||||
|
|
|
|
|
|
|
|
|
|
|
|||||||||||
| Comprehensive income (loss) attributable to ING U.S., Inc.’s common shareholder |
$ | 1,533.6 | $ | 1,203.2 | $ | 2,029.9 | $ | (3,233.1 | ) | $ | 1,533.6 | |||||||||
|
|
|
|
|
|
|
|
|
|
|
|||||||||||
F-156
Table of Contents
ING U.S., Inc.
Notes to the Consolidated Financial Statements
(Dollar amounts in millions, unless otherwise stated)
Condensed Consolidating Statement of Cash Flows
For the Year Ended December 31, 2013
| Parent Issuer |
Subsidiary Guarantor |
Non-Guarantor Subsidiaries |
Consolidating Adjustments |
Consolidated | ||||||||||||||||
| Net cash provided by (used in) operating activities |
$ | 203.4 | $ | 83.3 | $ | 3,076.7 | $ | (100.0 | ) | $ | 3,263.4 | |||||||||
|
|
|
|
|
|
|
|
|
|
|
|||||||||||
| Cash Flows from Investing Activities: |
||||||||||||||||||||
| Proceeds from the sale, maturity, disposal or redemption of: |
||||||||||||||||||||
| Fixed maturities |
— | — | 16,681.3 | — | 16,681.3 | |||||||||||||||
| Equity securities, available-for-sale |
14.5 | 14.0 | 23.1 | — | 51.6 | |||||||||||||||
| Mortgage loans on real estate |
— | — | 1,580.0 | — | 1,580.0 | |||||||||||||||
| Limited partnerships/corporations |
— | — | 466.1 | — | 466.1 | |||||||||||||||
| Acquisition of: |
||||||||||||||||||||
| Fixed maturities |
— | — | (19,014.8 | ) | — | (19,014.8 | ) | |||||||||||||
| Equity securities, available-for-sale |
(19.6 | ) | (11.1 | ) | (16.9 | ) | — | (47.6 | ) | |||||||||||
| Mortgage loans on real estate |
— | 0.4 | (2,206.4 | ) | — | (2,206.0 | ) | |||||||||||||
| Limited partnerships/corporations |
— | — | (97.0 | ) | — | (97.0 | ) | |||||||||||||
| Short-term investments, net |
— | — | 4,943.1 | — | 4,943.1 | |||||||||||||||
| Policy loans, net |
— | — | 53.3 | — | 53.3 | |||||||||||||||
| Derivatives, net |
(6.6 | ) | — | (2,617.1 | ) | — | (2,623.7 | ) | ||||||||||||
| Other investments, net |
— | — | 53.0 | — | 53.0 | |||||||||||||||
| Sales from consolidated investments entities |
— | — | 3,203.0 | — | 3,203.0 | |||||||||||||||
| Purchase of consolidated investment entities |
— | — | (4,257.9 | ) | — | (4,257.9 | ) | |||||||||||||
| Maturity of intercompany loans with maturities more than three months |
2.3 | — | — | (2.3 | ) | — | ||||||||||||||
| Net maturity of short-term intercompany loans to subsidiaries |
(136.6 | ) | 58.0 | 261.1 | (182.5 | ) | — | |||||||||||||
| Return of capital contributions from subsidiaries |
1,434.0 | 1,077.0 | — | (2,511.0 | ) | — | ||||||||||||||
| Capital contributions to subsidiaries |
(2,062.0 | ) | (0.3 | ) | — | 2,062.3 | — | |||||||||||||
| Collateral received (delivered), net |
27.7 | — | (657.0 | ) | — | (629.3 | ) | |||||||||||||
| Purchases of fixed assets, net |
— | — | (40.7 | ) | — | (40.7 | ) | |||||||||||||
| Other, net |
— | (0.4 | ) | 0.4 | — | — | ||||||||||||||
|
|
|
|
|
|
|
|
|
|
|
|||||||||||
| Net cash provided by (used in) investing activities |
$ | (746.3 | ) | $ | 1,137.6 | $ | (1,643.4 | ) | $ | (633.5 | ) | $ | (1,885.6 | ) | ||||||
|
|
|
|
|
|
|
|
|
|
|
|||||||||||
| Cash Flows from Financing Activities: |
||||||||||||||||||||
| Deposits received for investment contracts |
$ | — | $ | — | $ | 12,893.9 | $ | — | $ | 12,893.9 | ||||||||||
| Maturities and withdrawals from investment contracts |
— | — | (14,301.0 | ) | — | (14,301.0 | ) | |||||||||||||
| Proceeds from issuance of debt with maturities of more than three months |
2,146.8 | — | — | — | 2,146.8 | |||||||||||||||
| Repayment of debt with maturities of more than three months |
(1,370.4 | ) | (638.6 | ) | (688.4 | ) | — | (2,697.4 | ) | |||||||||||
| Short-term debt, net |
(171.6 | ) | — | — | — | (171.6 | ) | |||||||||||||
| Debt issuance costs |
(26.5 | ) | — | — | — | (26.5 | ) | |||||||||||||
| Intercompany loans with maturities of more than three months |
— | — | (2.3 | ) | 2.3 | — | ||||||||||||||
| Net (repayments of) proceeds from short-term intercompany loans |
(319.1 | ) | 125.4 | 11.2 | 182.5 | — | ||||||||||||||
| Dividends to parent |
— | — | (100.0 | ) | 100.0 | — | ||||||||||||||
| Return of capital contributions to parent |
— | (987.0 | ) | (1,524.0 | ) | 2,511.0 | — | |||||||||||||
| Contributions of capital from parent |
— | 280.0 | 1,782.3 | (2,062.3 | ) | — | ||||||||||||||
| Borrowings of consolidated investment entities |
— | — | 196.5 | — | 196.5 | |||||||||||||||
| Repayments of debt of consolidated investment entities |
— | — | (128.2 | ) | — | (128.2 | ) | |||||||||||||
| Contributions from (distributions to) participants in consolidated investment entities |
— | — | 1,197.3 | — | 1,197.3 | |||||||||||||||
| Proceeds from issuance of common stock, net |
571.6 | — | — | — | 571.6 | |||||||||||||||
| Dividends paid |
(5.2 | ) | — | — | — | (5.2 | ) | |||||||||||||
|
|
|
|
|
|
|
|
|
|
|
|||||||||||
| Net cash provided by (used in) financing activities |
825.6 | (1,220.2 | ) | (662.7 | ) | 733.5 | (323.8 | ) | ||||||||||||
|
|
|
|
|
|
|
|
|
|
|
|||||||||||
| Net increase (decrease) in cash and cash equivalents |
282.7 | 0.7 | 770.6 | — | 1,054.0 | |||||||||||||||
| Cash and cash equivalents, beginning of year |
357.5 | 0.4 | 1,428.9 | — | 1,786.8 | |||||||||||||||
|
|
|
|
|
|
|
|
|
|
|
|||||||||||
| Cash and cash equivalents, end of year |
$ | 640.2 | $ | 1.1 | $ | 2,199.5 | $ | — | $ | 2,840.8 | ||||||||||
|
|
|
|
|
|
|
|
|
|
|
|||||||||||
F-157
Table of Contents
ING U.S., Inc.
Notes to the Consolidated Financial Statements
(Dollar amounts in millions, unless otherwise stated)
Condensed Consolidating Statement of Cash Flows
For the Year Ended December 31, 2012
| Parent Issuer |
Subsidiary Guarantor |
Non-Guarantor Subsidiaries |
Consolidating Adjustments |
Consolidated | ||||||||||||||||
| Net cash provided by (used in) operating activities |
$ | 59.7 | $ | 50.5 | $ | 3,264.9 | $ | (93.0 | ) | $ | 3,282.1 | |||||||||
|
|
|
|
|
|
|
|
|
|
|
|||||||||||
| Cash Flows from Investing Activities: |
||||||||||||||||||||
| Proceeds from the sale, maturity, disposal or redemption of: |
||||||||||||||||||||
| Fixed maturities |
— | — | 17,015.2 | — | 17,015.2 | |||||||||||||||
| Equity securities, available-for-sale |
27.2 | 12.0 | 27.6 | — | 66.8 | |||||||||||||||
| Mortgage loans on real estate |
— | — | 1,991.8 | — | 1,991.8 | |||||||||||||||
| Loan—Dutch State obligation |
— | — | 1,781.9 | — | 1,781.9 | |||||||||||||||
| Limited partnerships/corporations |
— | — | 895.9 | — | 895.9 | |||||||||||||||
| Acquisition of: |
||||||||||||||||||||
| Fixed maturities |
— | — | (17,292.3 | ) | — | (17,292.3 | ) | |||||||||||||
| Equity securities, available-for-sale |
(14.0 | ) | (17.5 | ) | (10.3 | ) | — | (41.8 | ) | |||||||||||
| Mortgage loans on real estate |
— | — | (1,969.0 | ) | — | (1,969.0 | ) | |||||||||||||
| Limited partnerships/corporations |
— | — | (178.9 | ) | — | (178.9 | ) | |||||||||||||
| Short-term investments, net |
— | — | (2,397.4 | ) | — | (2,397.4 | ) | |||||||||||||
| Policy loans, net |
— | — | 63.6 | — | 63.6 | |||||||||||||||
| Derivatives, net |
— | — | (1,395.8 | ) | — | (1,395.8 | ) | |||||||||||||
| Other investments, net |
— | 1.3 | 42.1 | — | 43.4 | |||||||||||||||
| Sales from consolidated investments entities |
— | — | 1,781.7 | — | 1,781.7 | |||||||||||||||
| Purchase of consolidated investment entities |
— | — | (2,851.6 | ) | — | (2,851.6 | ) | |||||||||||||
| Net maturity of short-term intercompany loans |
102.3 | (33.5 | ) | 2,070.8 | (2,139.6 | ) | — | |||||||||||||
| Return of capital contributions from subsidiaries |
813.0 | 720.0 | — | (1,533.0 | ) | — | ||||||||||||||
| Capital contributions to subsidiaries |
(400.0 | ) | — | — | 400.0 | — | ||||||||||||||
| Collateral received (delivered), net |
7.2 | — | 132.7 | — | 139.9 | |||||||||||||||
| Purchases of fixed assets, net |
— | — | (29.3 | ) | — | (29.3 | ) | |||||||||||||
|
|
|
|
|
|
|
|
|
|
|
|||||||||||
| Net cash provided by (used in) investing activities |
$ | 535.7 | $ | 682.3 | $ | (321.3 | ) | $ | (3,272.6 | ) | $ | (2,375.9 | ) | |||||||
|
|
|
|
|
|
|
|
|
|
|
|||||||||||
| Cash Flows from Financing Activities: |
||||||||||||||||||||
| Deposits received for investment contracts |
$ | — | $ | — | $ | 16,118.8 | $ | — | $ | 16,118.8 | ||||||||||
| Maturities and withdrawals from investment contracts |
— | — | (19,033.4 | ) | — | (19,033.4 | ) | |||||||||||||
| Proceeds from issuance of debt with maturities of more than three months |
3,048.5 | — | 1.1 | — | 3,049.6 | |||||||||||||||
| Repayment of debt with maturities of more than three months |
(902.5 | ) | — | — | — | (902.5 | ) | |||||||||||||
| Short-term debt, net |
(309.1 | ) | — | — | — | (309.1 | ) | |||||||||||||
| Debt issuance costs |
(38.8 | ) | — | — | — | (38.8 | ) | |||||||||||||
| Net (repayments of) proceeds from short-term intercompany loans |
(2,037.3 | ) | — | (102.3 | ) | 2,139.6 | — | |||||||||||||
| Dividends to parent |
— | — | (93.0 | ) | 93.0 | — | ||||||||||||||
| Return of capital contributions to parent |
— | (733.0 | ) | (800.0 | ) | 1,533.0 | — | |||||||||||||
| Contributions of capital from parent |
— | — | 400.0 | (400.0 | ) | — | ||||||||||||||
| Borrowings of consolidated investment entities |
— | — | 152.6 | — | 152.6 | |||||||||||||||
| Repayments of debt of consolidated investment entities |
— | — | (56.6 | ) | — | (56.6 | ) | |||||||||||||
| Contributions from (distributions to) participants in consolidated investment entities |
— | — | 1,262.0 | — | 1,262.0 | |||||||||||||||
|
|
|
|
|
|
|
|
|
|
|
|||||||||||
| Net cash provided by (used in) financing activities |
(239.2 | ) | (733.0 | ) | (2,150.8 | ) | 3,365.6 | 242.6 | ||||||||||||
|
|
|
|
|
|
|
|
|
|
|
|||||||||||
| Net increase (decrease) in cash and cash equivalents |
356.2 | (0.2 | ) | 792.8 | — | 1,148.8 | ||||||||||||||
| Cash and cash equivalents, beginning of year |
1.3 | 0.6 | 636.1 | — | 638.0 | |||||||||||||||
|
|
|
|
|
|
|
|
|
|
|
|||||||||||
| Cash and cash equivalents, end of year |
$ | 357.5 | $ | 0.4 | $ | 1,428.9 | $ | — | $ | 1,786.8 | ||||||||||
|
|
|
|
|
|
|
|
|
|
|
|||||||||||
F-158
Table of Contents
ING U.S., Inc.
Notes to the Consolidated Financial Statements
(Dollar amounts in millions, unless otherwise stated)
Condensed Consolidating Statement of Cash Flows
For the Year Ended December 31, 2011
| Parent Issuer |
Subsidiary Guarantor |
Non-Guarantor Subsidiaries |
Consolidating Adjustments |
Consolidated | ||||||||||||||||
| Net cash provided by (used in) operating activities |
$ | 134.4 | $ | 48.7 | $ | 4,273.9 | $ | (100.0 | ) | $ | 4,357.0 | |||||||||
|
|
|
|
|
|
|
|
|
|
|
|||||||||||
| Cash Flows from Investing Activities: |
||||||||||||||||||||
| Proceeds from the sale, maturity, disposal or redemption of: |
||||||||||||||||||||
| Fixed maturities |
— | — | 17,312.4 | — | 17,312.4 | |||||||||||||||
| Equity securities, available-for-sale |
21.2 | 15.7 | 170.0 | — | 206.9 | |||||||||||||||
| Mortgage loans on real estate |
— | — | 1,542.5 | — | 1,542.5 | |||||||||||||||
| Loan—Dutch State obligation |
— | — | 505.6 | — | 505.6 | |||||||||||||||
| Limited partnerships/corporations |
— | — | 121.3 | — | 121.3 | |||||||||||||||
| Acquisition of: |
||||||||||||||||||||
| Fixed maturities |
— | — | (18,598.9 | ) | — | (18,598.9 | ) | |||||||||||||
| Equity securities, available-for-sale |
(12.5 | ) | (17.2 | ) | (23.0 | ) | — | (52.7 | ) | |||||||||||
| Mortgage loans on real estate |
— | — | (2,057.9 | ) | — | (2,057.9 | ) | |||||||||||||
| Limited partnerships/corporations |
— | — | (156.4 | ) | — | (156.4 | ) | |||||||||||||
| Short-term investments, net |
— | — | (763.2 | ) | — | (763.2 | ) | |||||||||||||
| Policy loans, net |
— | — | 127.9 | — | 127.9 | |||||||||||||||
| Derivatives, net |
(410.4 | ) | — | (806.3 | ) | — | (1,216.7 | ) | ||||||||||||
| Other investments, net |
— | 1.0 | (9.4 | ) | — | (8.4 | ) | |||||||||||||
| Sales from consolidated investments entities |
— | — | 2,422.8 | — | 2,422.8 | |||||||||||||||
| Purchase of consolidated investment entities |
— | — | (3,044.6 | ) | — | (3,044.6 | ) | |||||||||||||
| Maturity of intercompany loans with maturities more than three months |
13.9 | 500.0 | — | (513.9 | ) | — | ||||||||||||||
| Net maturity of short-term intercompany loans |
856.3 | 425.4 | (384.6 | ) | (897.1 | ) | — | |||||||||||||
| Return of capital contributions from subsidiaries |
200.0 | 9.6 | — | (209.6 | ) | — | ||||||||||||||
| Capital contributions to subsidiaries |
(377.0 | ) | (347.0 | ) | — | 724.0 | — | |||||||||||||
| Collateral received (delivered), net |
(2.5 | ) | — | 759.2 | — | 756.7 | ||||||||||||||
| Purchases of fixed assets, net |
— | — | (32.9 | ) | — | (32.9 | ) | |||||||||||||
| Other, net |
— | — | (16.1 | ) | — | (16.1 | ) | |||||||||||||
|
|
|
|
|
|
|
|
|
|
|
|||||||||||
| Net cash provided by (used in) investing activities |
$ | 289.0 | $ | 587.5 | $ | (2,931.6 | ) | $ | (896.6 | ) | $ | (2,951.7 | ) | |||||||
|
|
|
|
|
|
|
|
|
|
|
|||||||||||
| Cash Flows from Financing Activities: |
||||||||||||||||||||
| Deposits received for investment contracts |
$ | — | $ | — | $ | 16,571.1 | $ | — | $ | 16,571.1 | ||||||||||
| Maturities and withdrawals from investment contracts |
— | — | (17,246.6 | ) | 500.0 | (16,746.6 | ) | |||||||||||||
| Proceeds from issuance of debt with maturities of more than three months |
548.5 | — | 58.0 | — | 606.5 | |||||||||||||||
| Repayment of debt with maturities of more than three months |
(573.8 | ) | — | — | — | (573.8 | ) | |||||||||||||
| Short-term debt, net |
(359.0 | ) | — | (1,546.0 | ) | — | (1,905.0 | ) | ||||||||||||
| Intercompany loans with maturities of more than three months |
— | — | (13.9 | ) | 13.9 | — | ||||||||||||||
| Net (repayments of) proceeds from short-term intercompany loans |
(40.8 | ) | (983.1 | ) | 126.8 | 897.1 | — | |||||||||||||
| Dividends to parent |
— | — | (100.0 | ) | 100.0 | — | ||||||||||||||
| Return of capital contributions to parent |
— | — | (209.6 | ) | 209.6 | — | ||||||||||||||
| Contributions of capital from parent |
— | 347.0 | 377.0 | (724.0 | ) | — | ||||||||||||||
| Borrowings of consolidated investment entities |
— | — | 138.9 | — | 138.9 | |||||||||||||||
| Repayments of debt of consolidated investment entities |
— | — | (121.4 | ) | — | (121.4 | ) | |||||||||||||
| Contributions from (distributions to) participants in consolidated investment entities |
— | — | 647.7 | — | 647.7 | |||||||||||||||
|
|
|
|
|
|
|
|
|
|
|
|||||||||||
| Net cash provided by (used in) financing activities |
(425.1 | ) | (636.1 | ) | (1,318.0 | ) | 996.6 | (1,382.6 | ) | |||||||||||
|
|
|
|
|
|
|
|
|
|
|
|||||||||||
| Net increase (decrease) in cash and cash equivalents |
(1.7 | ) | 0.1 | 24.3 | — | 22.7 | ||||||||||||||
| Cash and cash equivalents, beginning of year |
3.0 | 0.5 | 611.8 | — | 615.3 | |||||||||||||||
|
|
|
|
|
|
|
|
|
|
|
|||||||||||
| Cash and cash equivalents, end of year |
$ | 1.3 | $ | 0.6 | $ | 636.1 | $ | — | $ | 638.0 | ||||||||||
|
|
|
|
|
|
|
|
|
|
|
|||||||||||
F-159
Table of Contents
ING U.S., Inc.
Notes to the Consolidated Financial Statements
(Dollar amounts in millions, unless otherwise stated)
22. Selected Consolidated Unaudited Quarterly Financial Data
The unaudited quarterly results of operations for 2013 and 2012 are summarized in the table below:
| Three Months Ended, | ||||||||||||||||
| March 31, | June 30, | September 30, | December 31, | |||||||||||||
| ($ in millions, except per share amounts) | ||||||||||||||||
| 2013 |
||||||||||||||||
| Total revenues |
$ | 1,818.6 | $ | 2,140.6 | $ | 2,435.3 | $ | 2,364.0 | ||||||||
| Total benefits and expenses |
2,032.9 | 2,215.8 | 2,015.3 | 1,736.4 | ||||||||||||
| Income (loss) before income taxes |
(214.3 | ) | (75.2 | ) | 420.0 | 627.6 | ||||||||||
| Net income (loss) |
(225.5 | ) | (85.3 | ) | 447.7 | 653.7 | ||||||||||
| Less: Net income (loss) attributable to noncontrolling interest |
(13.5 | ) | (3.1 | ) | 101.1 | 105.6 | ||||||||||
| Net income (loss) available to ING U.S., Inc.’s common shareholders |
(212.0 | ) | (82.2 | ) | 346.6 | 548.1 | ||||||||||
| Earnings Per Share(1) |
||||||||||||||||
| Basic |
$ | (0.92 | ) | $ | (0.33 | ) | $ | 1.33 | $ | 2.10 | ||||||
|
|
|
|
|
|
|
|
|
|||||||||
| Diluted |
$ | (0.92 | ) | $ | (0.33 | ) | $ | 1.32 | $ | 2.08 | ||||||
|
|
|
|
|
|
|
|
|
|||||||||
| Cash dividends declared per common share |
$ | — | $ | — | $ | 0.01 | $ | 0.01 | ||||||||
| 2012 |
||||||||||||||||
| Total revenues |
$ | 1,485.3 | $ | 3,361.9 | $ | 2,564.3 | $ | 2,203.8 | ||||||||
| Total benefits and expenses |
1,998.2 | 2,508.8 | 2,190.4 | 2,311.9 | ||||||||||||
| Income (loss) before income taxes |
(512.9 | ) | 853.1 | 373.9 | (108.1 | ) | ||||||||||
| Net income (loss) |
(520.8 | ) | 852.1 | 386.8 | (106.9 | ) | ||||||||||
| Less: Net income (loss) attributable to noncontrolling interest |
(15.6 | ) | 217.7 | 20.3 | (84.2 | ) | ||||||||||
| Net income (loss) available to ING U.S., Inc.’s common shareholders |
(505.2 | ) | 634.4 | 366.5 | (22.7 | ) | ||||||||||
| Earnings Per Share(1) |
||||||||||||||||
| Basic |
$ | (2.20 | ) | $ | 2.76 | $ | 1.59 | $ | (0.10 | ) | ||||||
|
|
|
|
|
|
|
|
|
|||||||||
| Diluted |
$ | (2.20 | ) | $ | 2.76 | $ | 1.59 | $ | (0.10 | ) | ||||||
|
|
|
|
|
|
|
|
|
|||||||||
| Cash dividends declared per common share |
$ | — | $ | — | $ | — | $ | — | ||||||||
| (1) | Per-share amounts give retroactive effect to the 2,295.248835-to-1 stock split effected on April 11, 2013. |
F-160
Table of Contents
ING U.S., Inc.
Summary of Investments Other than Investments in Affiliates
As of December 31, 2013
(In millions)
| Cost | Value | Amount Shown on Consolidated Balance Sheet |
||||||||||
| Type of Investments |
||||||||||||
| Fixed maturities: |
||||||||||||
| U.S. Treasuries |
$ | 5,094.0 | $ | 5,181.2 | $ | 5,181.2 | ||||||
| U.S. Government agencies and authorities |
598.0 | 618.9 | 618.9 | |||||||||
| State, municipalities, and political subdivisions |
272.0 | 281.1 | 281.1 | |||||||||
| U.S. corporate securities |
36,010.3 | 37,478.6 | 37,478.6 | |||||||||
| Foreign securities(1) |
15,661.4 | 16,356.5 | 16,356.5 | |||||||||
| Residential mortgage-backed securities |
6,480.3 | 7,123.7 | 7,123.7 | |||||||||
| Commercial mortgage-backed securities |
3,427.9 | 3,752.1 | 3,752.1 | |||||||||
| Other asset-backed securities |
1,883.1 | 1,926.7 | 1,926.7 | |||||||||
|
|
|
|
|
|
|
|||||||
| Total fixed maturities, including securities pledged |
69,427.0 | 72,718.8 | 72,718.8 | |||||||||
| Equity securities, available-for-sale |
267.4 | 314.4 | 314.4 | |||||||||
| Short-term investments |
1,048.1 | 1,048.1 | 1,048.1 | |||||||||
| Mortgage loans on real estate |
9,312.2 | 9,404.7 | 9,312.2 | |||||||||
| Policy loans |
2,147.0 | 2,147.0 | 2,147.0 | |||||||||
| Limited partnerships/corporations |
236.4 | 236.4 | 236.4 | |||||||||
| Derivatives |
307.3 | 1,149.3 | 1,149.3 | |||||||||
| Other investments |
124.6 | 131.1 | 124.6 | |||||||||
|
|
|
|
|
|
|
|||||||
| Total investments |
$ | 82,870.0 | $ | 87,149.8 | $ | 87,050.8 | ||||||
|
|
|
|
|
|
|
|||||||
| (1) | The term “foreign” includes foreign governments, foreign political subdivisions, foreign public utilities, and all other bonds of foreign issuers. Substantially all of the Company’s foreign securities are denominated in U.S. dollars. |
F-161
Table of Contents
ING U.S., Inc.
Financial Information of Parent
Balance Sheets
(In millions, except share data)
| As of December 31, | ||||||||
| 2013 | 2012 | |||||||
| Assets |
||||||||
| Investments: |
||||||||
| Equity securities, available-for-sale, at fair value (cost of $76.6 at 2013 and $52.4 at 2012) |
$ | 76.6 | $ | 63.9 | ||||
| Derivatives |
69.9 | 59.3 | ||||||
| Investments in subsidiaries |
15,103.8 | 15,715.1 | ||||||
|
|
|
|
|
|||||
| Total investments |
15,250.3 | 15,838.3 | ||||||
| Cash and cash equivalents |
640.2 | 357.5 | ||||||
| Short-term investments under securities loan agreements, including collateral delivered |
30.7 | 58.4 | ||||||
| Loans to subsidiaries |
211.3 | 77.0 | ||||||
| Due from subsidiaries |
26.9 | 16.5 | ||||||
| Current income taxes |
47.0 | 221.1 | ||||||
| Deferred income taxes |
204.4 | 127.4 | ||||||
| Other assets |
43.4 | 35.8 | ||||||
|
|
|
|
|
|||||
| Total assets |
$ | 16,454.2 | $ | 16,732.0 | ||||
|
|
|
|
|
|||||
| Liabilities and Shareholders’ Equity |
||||||||
| Short-term debt |
$ | — | $ | 886.1 | ||||
| Long-term debt |
2,996.7 | 1,824.6 | ||||||
| Derivatives |
114.0 | 59.3 | ||||||
| Due to subsidiaries |
0.2 | 23.1 | ||||||
| Other liabilities |
71.1 | 64.0 | ||||||
|
|
|
|
|
|||||
| Total liabilities |
3,182.0 | 2,857.1 | ||||||
|
|
|
|
|
|||||
| Shareholders’ equity: |
||||||||
| Common stock (900,000,000 shares authorized, 261,754,931 and 230,079,120 shares issued as of December 31, 2013 and 2012, respectively; 261,675,811 and 230,000,000 shares outstanding as of December 31, 2013 and 2012, respectively; $0.01 par value per share) |
2.6 | 2.3 | ||||||
| Treasury stock (79,120 shares as of December 31, 2013 and 2012, respectively; $0.01 par value per share) |
— | — | ||||||
| Additional paid-in capital |
23,563.7 | 22,917.6 | ||||||
| Accumulated other comprehensive income |
1,849.1 | 3,710.7 | ||||||
| Retained earnings (deficit): |
||||||||
| Appropriated |
18.4 | 6.4 | ||||||
| Unappropriated |
(12,161.6 | ) | (12,762.1 | ) | ||||
|
|
|
|
|
|||||
| Total ING U.S., Inc. shareholders’ equity |
13,272.2 | 13,874.9 | ||||||
|
|
|
|
|
|||||
| Total liabilities and shareholders’ equity |
$ | 16,454.2 | $ | 16,732.0 | ||||
|
|
|
|
|
|||||
The accompanying notes are an integral part of this Financial Information.
F-162
Table of Contents
ING U.S., Inc.
Schedule II
Financial Information of Parent
Statements of Operations
(In millions)
| Years Ended December 31, | ||||||||||||
| 2013 | 2012 | 2011 | ||||||||||
| Revenues: |
||||||||||||
| Net investment income |
$ | 36.4 | $ | 2.4 | $ | 10.9 | ||||||
| Net realized capital gains (losses) |
(39.2 | ) | — | (42.2 | ) | |||||||
| Other income |
4.2 | 12.5 | 19.7 | |||||||||
|
|
|
|
|
|
|
|||||||
| Total revenues |
1.4 | 14.9 | (11.6 | ) | ||||||||
|
|
|
|
|
|
|
|||||||
| Expenses: |
||||||||||||
| Interest expense |
129.2 | 74.1 | 61.7 | |||||||||
| Other expense |
8.8 | 30.5 | 11.9 | |||||||||
|
|
|
|
|
|
|
|||||||
| Total expenses |
138.0 | 104.6 | 73.6 | |||||||||
|
|
|
|
|
|
|
|||||||
| Loss before income taxes and equity in earnings of subsidiaries |
(136.6 | ) | (89.7 | ) | (85.2 | ) | ||||||
| Income tax (benefit) expense |
(208.0 | ) | (349.4 | ) | 363.0 | |||||||
|
|
|
|
|
|
|
|||||||
| Net income (loss) before equity in earnings of subsidiaries |
71.4 | 259.7 | (448.2 | ) | ||||||||
| Equity in earnings of subsidiaries |
529.1 | 213.3 | 360.1 | |||||||||
|
|
|
|
|
|
|
|||||||
| Net income (loss) available to ING U.S., Inc.’s common shareholders |
$ | 600.5 | $ | 473.0 | $ | (88.1 | ) | |||||
|
|
|
|
|
|
|
|||||||
The accompanying notes are an integral part of this Financial Information.
F-163
Table of Contents
ING U.S., Inc.
Schedule II
Financial Information of Parent
Statements of Comprehensive Income
(In millions)
| Years Ended December 31, | ||||||||||||
| 2013 | 2012 | 2011 | ||||||||||
| Net income (loss) available to ING U.S., Inc.’s common shareholders |
$ | 600.5 | $ | 473.0 | $ | (88.1 | ) | |||||
| Other comprehensive income (loss), after tax |
(1,861.6 | ) | 1,115.7 | 1,621.7 | ||||||||
|
|
|
|
|
|
|
|||||||
| Comprehensive income (loss) attributable to ING U.S., Inc.’s common shareholders |
$ | (1,261.1 | ) | $ | 1,588.7 | $ | 1,533.6 | |||||
|
|
|
|
|
|
|
|||||||
The accompanying notes are an integral part of this Financial Information.
F-164
Table of Contents
ING U.S., Inc.
Schedule II
Financial Information of Parent
Statements of Cash Flows
(In millions)
| Years Ended December 31, | ||||||||||||
| 2013 | 2012 | 2011 | ||||||||||
| Cash Flows from Operating Activities: |
||||||||||||
| Net income (loss) available to ING U.S., Inc.’s common shareholders |
$ | 600.5 | $ | 473.0 | $ | (88.1 | ) | |||||
| Adjustments to reconcile net income (loss) available to ING U.S., Inc.’s common shareholders to net cash provided by (used in) operating activities: |
||||||||||||
| Equity in earnings of subsidiaries |
(529.1 | ) | (213.3 | ) | (360.1 | ) | ||||||
| Net accretion/amortization of discount premium |
0.3 | — | — | |||||||||
| Provision for deferred income taxes |
(77.0 | ) | 135.6 | 48.0 | ||||||||
| Realized investment losses, net |
39.2 | — | 42.2 | |||||||||
| Change in: |
||||||||||||
| Receivable and asset accruals |
191.8 | (162.4 | ) | 295.1 | ||||||||
| Due from subsidiaries |
1.1 | (10.2 | ) | 2.9 | ||||||||
| Due to subsidiaries |
(22.9 | ) | (0.8 | ) | (2.3 | ) | ||||||
| Other payables and accruals |
7.1 | (162.2 | ) | 196.7 | ||||||||
| Other, net |
(7.6 | ) | — | — | ||||||||
|
|
|
|
|
|
|
|||||||
| Net cash provided by operating activities |
203.4 | 59.7 | 134.4 | |||||||||
|
|
|
|
|
|
|
|||||||
| Cash Flows from Investing Activities: |
||||||||||||
| Proceeds from the sale, maturity, disposal or redemption of equity securities, available-for-sale |
14.5 | 27.2 | 21.2 | |||||||||
| Acquisition of equity securities, available-for-sale |
(19.6 | ) | (14.0 | ) | (12.5 | ) | ||||||
| Derivatives, net |
(6.6 | ) | — | (410.4 | ) | |||||||
| Short-term intercompany loans issued to subsidiaries with maturities more than three months |
2.3 | — | 13.9 | |||||||||
| Net maturity of intercompany loans to subsidiaries |
(136.6 | ) | 102.3 | 856.3 | ||||||||
| Return of capital contributions from subsidiaries |
1,434.0 | 813.0 | 200.0 | |||||||||
| Capital contributions to subsidiaries |
(2,062.0 | ) | (400.0 | ) | (377.0 | ) | ||||||
| Collateral received (delivered), net |
27.7 | 7.2 | (2.5 | ) | ||||||||
|
|
|
|
|
|
|
|||||||
| Net cash (used in) provided by investing activities |
(746.3 | ) | 535.7 | 289.0 | ||||||||
|
|
|
|
|
|
|
|||||||
The accompanying notes are an integral part of this Financial Information.
F-165
Table of Contents
ING U.S., Inc.
Schedule II
Financial Information of Parent
Statements of Cash Flows (Continued)
(In millions)
| Years Ended December 31, | ||||||||||||
| 2013 | 2012 | 2011 | ||||||||||
| Cash Flows from Financing Activities: |
||||||||||||
| Short-term debt, net |
(171.6 | ) | (309.1 | ) | (359.0 | ) | ||||||
| Proceeds from issuance of long-term debt |
2,146.8 | 3,048.5 | 548.5 | |||||||||
| Repayment of long-term debt |
(1,370.4 | ) | (902.5 | ) | (573.8 | ) | ||||||
| Debt issuance costs |
(26.5 | ) | (38.8 | ) | — | |||||||
| Net (repayments of) proceeds from loans to subsidiaries |
(319.1 | ) | (2,037.3 | ) | (40.8 | ) | ||||||
| Proceeds from issuance of common stock, net |
571.6 | — | — | |||||||||
| Dividends paid |
(5.2 | ) | — | — | ||||||||
|
|
|
|
|
|
|
|||||||
| Net cash provided by (used in) financing activities |
825.6 | (239.2 | ) | (425.1 | ) | |||||||
|
|
|
|
|
|
|
|||||||
| Net increase (decrease) in cash and cash equivalents |
282.7 | 356.2 | (1.7 | ) | ||||||||
| Cash and cash equivalents, beginning of year |
357.5 | 1.3 | 3.0 | |||||||||
|
|
|
|
|
|
|
|||||||
| Cash and cash equivalents, end of year |
$ | 640.2 | $ | 357.5 | $ | 1.3 | ||||||
|
|
|
|
|
|
|
|||||||
| Supplemental cash flow information: |
||||||||||||
| Income taxes paid, net |
$ | 43.0 | $ | 5.2 | $ | 13.6 | ||||||
| Interest paid |
90.6 | 33.4 | 52.6 | |||||||||
| Non-cash financing activity: |
||||||||||||
| Debt extinguishment |
$ | — | $ | — | $ | 3,979.7 | ||||||
| Capital contribution |
— | — | 3,979.7 | |||||||||
The accompanying notes are an integral part of this Financial Information.
F-166
Table of Contents
ING U.S., Inc.
Schedule II
Notes to Condensed Financial Information of Parent
(Dollar amounts in millions, unless otherwise stated)
1. Basis of Presentation
The financial information of ING U.S., Inc. should be read in conjunction with the consolidated financial statements of ING U.S., Inc. and its subsidiaries (collectively the “Company”) and the notes thereto (the “Consolidated Financial Statements”).
ING Groep N.V. (“ING Group” or “ING”), the ultimate parent company, is a global financial services holding company based in The Netherlands. In 2009, ING, with American Depository Shares listed on the New York Stock Exchange, announced the anticipated separation of its global banking and insurance businesses, including the divestiture of the Company. On May 2, 2013, the common stock of ING U.S., Inc. began trading on the New York Stock Exchange under the symbol “VOYA.” On May 7, 2013 and May 31, 2013, ING U.S., Inc. completed its initial public offering (“IPO”) of common stock, including the issuance and sale by ING U.S., Inc. of 30,769,230 shares of common stock and the sale by ING Insurance International B.V. (“ING International”), an indirect, wholly owned subsidiary of ING Group and previously the sole stockholder of ING U.S., Inc., of 44,201,773 shares of outstanding common stock of ING U.S., Inc. (collectively, “the IPO”). On September 30, 2013, ING International transferred all of its shares of ING U.S., Inc. common stock to ING Group.
On October 29, 2013, ING Group completed a sale of 37,950,000 shares of common stock of ING U.S., Inc. in a registered public offering (“Secondary Offering”), reducing ING Group’s ownership in the Company to 57%.
The accompanying financial information reflects the results of operations, financial position and cash flows for ING U.S., Inc. The financial information is in conformity with accounting principles generally accepted in the United States and require management to adopt accounting policies and make certain estimates and assumptions. Investments in subsidiaries are accounted for using the equity method of accounting.
Certain immaterial reclassifications have been made to prior year financial information to conform to the current year classifications.
2. Loans to Subsidiaries
ING U.S., Inc. maintains reciprocal loan agreements with subsidiaries to facilitate unanticipated short-term cash requirements that arise in the ordinary course of business. Under these loan agreements, the limitations on borrowing are based on the nature of the subsidiary’s operations. For reciprocal loan agreements with insurance companies, the amounts that either party may borrow from the other under the agreement vary, depending on the state of domicile, and are equal to 2%-5% of the insurance subsidiary’s statutory net admitted assets, excluding separate accounts, as of the preceding December 31. For reciprocal loan agreements with non-insurance subsidiaries, the limits vary and are set by management based on an assessment of the financial position of the subsidiary. During 2012 and 2013, interest on any borrowing by a subsidiary was charged at the rate of ING U.S., Inc.’s cost of funds for the interest period, plus 0.15%. Effective January 2014, interest on any borrowing by a subsidiary under a reciprocal loan agreement is charged at a rate based on the prevailing market rate for similar third-party borrowing or securities. Borrowings by ING Alternative Asset Management LLC (“IAAM”) occur to enable IAAM to make capital contributions to the ING Multi-Strategy Opportunity Fund LLC (“the fund”), the fund that it manages. The applicable variable interest rate is equal to the rate of return on capital invested in the fund, which may be negative over any given period.
F-167
Table of Contents
ING U.S., Inc.
Schedule II
Notes to Condensed Financial Information of Parent
(Dollar amounts in millions, unless otherwise stated)
| Subsidiaries | Rate | Maturity Date | 2013 | 2012 | ||||||||||||
| ING Alternative Asset Management LLC |
-3.44 | % | 6/30/2014 | $ | 4.1 | $ | 6.4 | |||||||||
| ING Institutional Plan Services, LLC |
1.02 | % | 1/3/2013 | — | 8.0 | |||||||||||
| ING Institutional Plan Services, LLC |
1.12 | % | 1/14/2013 | — | 4.0 | |||||||||||
| ING Investment Management |
1.02 | % | 1/7/2014 | 8.0 | — | |||||||||||
| ING North America Insurance Corporation |
0.90 | % | 1/2/2014 | 69.8 | 53.6 | |||||||||||
| Lion Connecticut Holdings Inc. |
1.12 | % | 1/3/2014 | 69.2 | — | |||||||||||
| Lion Connecticut Holdings Inc. |
1.12 | % | 1/9/2014 | 34.5 | — | |||||||||||
| Lion Connecticut Holdings Inc. |
1.12 | % | 1/14/2014 | 21.7 | — | |||||||||||
| Security Life of Denver International Limited |
1.12 | % | 1/14/2014 | 4.0 | 5.0 | |||||||||||
|
|
|
|
|
|||||||||||||
| Total |
$ | 211.3 | $ | 77.0 | ||||||||||||
|
|
|
|
|
|||||||||||||
Interest income earned on loans to subsidiaries of $2.0, $1.1, and $8.1 for the years ended December 31, 2013, 2012 and 2011, respectively, is included in Net investment income.
3. Financing Agreements
Short-term Debt
The following table summarizes ING U.S., Inc.’s short-term debt and the related weighted average interest rate on short-term borrowings as of December 31, 2013 and 2012:
| Weighted Average Rate |
||||||||||||||||
| 2013 | 2012 | 2013 | 2012 | |||||||||||||
| Commercial paper |
$ | — | $ | 192.0 | — % | 1.22 | % | |||||||||
| Inter-company financing—subsidiaries |
— | 319.1 | — % | 0.19 | % | |||||||||||
| Current portion of long-term debt |
— | 375.0 | — % | 2.21 | % | |||||||||||
|
|
|
|
|
|||||||||||||
| Total |
$ | — | $ | 886.1 | ||||||||||||
|
|
|
|
|
|||||||||||||
Commercial Paper
ING U.S., Inc. had a commercial paper program with an authorized capacity of $3.0 billion, which was guaranteed by ING V. ING U.S., Inc.’s commercial paper borrowings were generally used to fund the working capital needs of the Company’s subsidiaries and provide short-term liquidity. All outstanding amounts were repaid in April 2013. On October 3, 2013, ING U.S., Inc. terminated the commercial paper program along with the guarantee provided by ING V.
Inter-company financing
Under the reciprocal loan agreements with subsidiaries, interest on any borrowing by ING U.S., Inc. from a subsidiary was charged during 2013 at a rate based on the prevailing interest rate of U.S. commercial paper available for purchase with a similar duration. Effective January 2014, interest on any borrowing under reciprocal loan agreements is charged at a rate based on the prevailing market interest for similar third-party borrowings or securities.
F-168
Table of Contents
ING U.S., Inc.
Schedule II
Notes to Condensed Financial Information of Parent
(Dollar amounts in millions, unless otherwise stated)
Long-term Debt
The following table summarizes ING U.S., Inc.’s long-term debt securities as of December 31, 2013 and 2012:
| Interest Rate |
Maturity | 2013 | 2012 | |||||||||||||
| 2.21% Syndicated Bank Term Loan, due 2014 |
2.21 | % | 4/20/2014 | $ | — | $ | 1,350.0 | |||||||||
| 5.5% Senior Notes, due 2022 |
5.50 | % | 7/15/2022 | 849.6 | 849.6 | |||||||||||
| 2.9% Senior Notes, due 2018 |
2.90 | % | 2/15/2018 | 998.5 | — | |||||||||||
| 5.7% Senior Notes, due 2043 |
5.70 | % | 7/15/2043 | 398.6 | — | |||||||||||
| 5.65% Fixed-to-Floating Rate Junior Subordinated Notes, due 2053 |
5.65 | % | 5/15/2053 | 750.0 | — | |||||||||||
|
|
|
|
|
|||||||||||||
| Subtotal |
2,996.7 | 2,199.6 | ||||||||||||||
| Less: Current portion of long-term debt |
— | 375.0 | ||||||||||||||
|
|
|
|
|
|||||||||||||
| Total |
$ | 2,996.7 | $ | 1,824.6 | ||||||||||||
|
|
|
|
|
|||||||||||||
As of December 31, 2013 and 2012, ING U.S., Inc. was in compliance with all debt covenants related to the borrowings in the table above.
Aggregate amounts of future principal payments of long-term debt for the next five years and thereafter are as follows:
| 2014 |
$ | — | ||
| 2015 |
— | |||
| 2016 |
— | |||
| 2017 |
— | |||
| 2018 |
1,000.0 | |||
| Thereafter |
2,000.0 | |||
|
|
|
|||
| Total |
$ | 3,000.0 | ||
|
|
|
Credit Facilities
ING U.S., Inc. maintains credit facilities used primarily for collateral required under affiliated reinsurance transactions and also for general corporate purposes. Unsecured and uncommitted credit facilities totaled $17.0 and unsecured and committed facilities totaled $7.9 billion. ING U.S., Inc. additionally has approximately $10.0 of secured facilities. Of the aggregate $7.9 billion capacity available, ING U.S., Inc. utilized $5.5 billion in credit facilities outstanding as of December 31, 2013. Total fees associated with credit facilities in 2013, 2012 and 2011 totaled $92.3, $166.4, and $103.2, respectively.
Guarantees
As of December 31, 2013, ING U.S., Inc. guaranteed $25.0 in notes issued by Silver Cup V, L.P., a special purpose entity wholly owned by ING Pomona Holdings LLC (which is a wholly owned subsidiary of ING U.S., Inc.), to ING U.S., Inc.’s subsidiary life insurance companies ING Life Insurance and Annuity Company, ING USA Annuity and Life Insurance Company, ReliaStar Life Insurance Company, Security Life of Denver Insurance Company, Midwestern United Life Insurance Company and ReliaStar Life Insurance Company of New York.
F-169
Table of Contents
ING U.S., Inc.
Schedule II
Notes to Condensed Financial Information of Parent
(Dollar amounts in millions, unless otherwise stated)
ING U.S., Inc. provided an indemnification of a limited nature, effective on December 19, 2011, in connection with an $825.0 securities lending agreement between the KCL Master Trust (“Master Trust”) and ING Bank, N.V. (“ING Bank”). In the event of default on the securities lending agreement by the Master Trust, ING U.S., Inc. was required to indemnify ING Bank for the outstanding obligations of the Master Trust. This agreement and the related indemnification were entered into to obtain collateral to support ING U.S., Inc.’s reinsurance obligations. The securities lending agreement and accordingly, ING U.S. Inc.’s indemnification obligations were cancelled in November 2013.
ING U.S., Inc. provides various indemnifications of securities lending agreements between the Master Trust and third-party banks. In the event of default on the securities lending agreements by the Master Trust, ING U.S., Inc. is required to indemnify the third-party banks for the outstanding obligations of the Master Trust. These agreements and the related indemnifications amounted to $1.5 billion and $2.0 billion as of December 31, 2013 and 2012, respectively, and were entered into to obtain collateral to support ING U.S., Inc.’s reinsurance obligations and are effective for the duration that the collateral remains outstanding.
The following surplus maintenance agreements associated with our captive reinsurance subsidiaries and special purpose life reinsurance captive insurance company subsidiary domiciled in South Carolina are effective for the duration of the in force policies subject to the related reinsurance transactions:
On December 31, 2010, ING U.S., Inc. entered into a surplus maintenance agreement with Roaring River II, LLC (“Roaring River II”), a wholly owned subsidiary of ING U.S., Inc., whereby ING U.S., Inc. agrees to cause Roaring River II to maintain Adjusted Capital and Surplus at 250% of its Company Action Level Risk Based Capital. The Roaring River II agreement includes a provision for capital contributions to be made in the event certain expense thresholds are exceeded by Roaring River II.
On September 6, 2012, ING U.S., Inc. entered into a reimbursement agreement with a third-party bank for its wholly owned subsidiary, Roaring River III, LLC (“Roaring River III”). At inception, the reimbursement agreement requires ING U.S., Inc. to cause $165.0 of capital to be maintained in Roaring River III Holding LLC, the intermediate holding company of Roaring River III, and $60.0 of capital to be maintained in Roaring River III for a total of $225.0. This amount will vary over time based on a percentage of Roaring River III in force life insurance.
On January 1, 2014, ING U.S., Inc. entered into a reimbursement agreement with a third-party bank for its wholly owned subsidiary, Roaring River IV, LLC (“Roaring River IV”). At inception, the reimbursement agreement requires ING U.S., Inc. to cause no less than $78.6 of capital to be maintained in Roaring River IV Holding LLC, the intermediate holding company of Roaring River IV and Roaring River III Holding LLC, and $45.0 of capital to be maintained in Roaring River IV for a total of $123.6. This amount is exclusive of any capital held for Roaring River III Holding LLC and will vary over time based on a percentage of Roaring River IV in force life insurance.
ING U.S., Inc. entered into surplus maintenance agreements with Whisperingwind I, LLC (“WWI”), Whisperingwind II, LLC (“WWII”) and Whisperingwind III, LLC (“WWIII”), special purpose life reinsurance captive insurance subsidiaries, on September 30, 2010, November 1, 2007 and June 28, 2007, respectively. The surplus maintenance agreements for WWI and WWII were terminated during 2012 prior to the dissolution of the subsidiaries.
On June 28, 2007, the ING U.S., Inc. entered into a surplus maintenance agreement whereby ING U.S., Inc. agreed to cause WWIII to maintain Adjusted Capital and Surplus at 200% of its Company Action Level Risk Based Capital.
F-170
Table of Contents
ING U.S., Inc.
Schedule II
Notes to Condensed Financial Information of Parent
(Dollar amounts in millions, unless otherwise stated)
Effective January 1, 2014, the surplus maintenance agreement was terminated when the reinsurance agreements with WWIII were novated to Roaring River IV.
Effective January 15, 2014, ING U.S., Inc. entered into a surplus maintenance agreement with Langhorne I, LLC (“Langhorne I”), a wholly owned captive reinsurance subsidiary, whereby ING U.S., Inc. agrees to cause Langhorne I to maintain capital of at least $85.0.
The maximum potential obligations associated with the above surplus maintenance agreements are not specified in the agreements and therefore, it is not possible to determine the maximum potential amounts due under these guarantees.
ING U.S., Inc. entered into a guaranty agreement on December 31, 2013 with a third-party bank in order to guarantee certain reimbursement obligations of Security Life of Denver International Limited, a wholly owned subsidiary of ING U.S., Inc., under a $250.0 letter of credit facility with a third party.
ING V issued a $500.0 loan to Lion Connecticut Holdings Inc. on August 9, 2007. This loan had an interest rate of LIBOR plus .05% and was scheduled to mature on April 29, 2016. Upon issuance of this loan, ING U.S., Inc. entered into an agreement in which it guaranteed all obligations under the loan agreement to ING V. On July 5, 2013 all amounts outstanding under this loan were repaid.
Lion Connecticut Holdings Inc. issued $50.0 of 8.424% Trust Originated Preferred Securities (“ToPR”) on April 3, 1997 due on April 1, 2027. As of December 31, 2013, $13.0 total par value amount is outstanding. On January 27, 2003, ING U.S., Inc. entered into an agreement in which it guaranteed the full payment when due of all obligations under ToPR. Under the same guarantee agreement, ING U.S., Inc. also unconditionally guarantees the payment of any principal or interest due in respect of Lion Connecticut Holdings notes (“Aetna Notes”). As of December 31, 2013, the remaining par amounts of the Aetna Notes outstanding were $506.1.
Lion Connecticut Holdings Inc. entered into a Capital Assurance Agreement with ING National Trust effective May 23, 2007. ING National Trust is required to maintain a minimum capital level of $2.0 to comply with Office of the Comptroller of the Currency (“OCC”) capital and liquidity requirements. Pursuant to the Capital Assurance Agreement, if at any time ING National Trust’s capital level falls below the minimum capital requirement, Lion Connecticut Holdings agrees to contribute capital up to the minimum capital requirement. This agreement is effective until terminated upon mutual agreement of ING National Trust and Lion Connecticut Holdings Inc. The maximum potential obligation is not specified or applicable. Since these obligations are not subject to limitations, it is not possible to determine the maximum potential amount due under these guarantees. Additionally, should Lion Connecticut Holdings Inc. be unable to contribute capital under the Agreement, ING U.S., Inc. has agreed to perform such duties.
Effective February 25, 2000, ING U.S., Inc. entered into a Corporate Guarantee Agreement with a third-party ceding insurer where ING U.S., Inc. guarantees the reinsurance obligations of one of its wholly owned subsidiaries assumed under a reinsurance agreement with the third-party cedent. The maximum potential obligation is not specified or applicable. Since these obligations are not subject to limitations, it is not possible to determine the maximum potential amount due under these guarantees.
There were no assets or liabilities recognized by ING U.S., Inc. as of December 31, 2013 and 2012 in relation to these intercompany indemnifications and support agreements. As of December 31, 2013 and 2012, no circumstances existed in which ING U.S., Inc. was required to currently perform under these indemnifications and support agreements.
F-171
Table of Contents
ING U.S., Inc.
Schedule II
Notes to Condensed Financial Information of Parent
(Dollar amounts in millions, unless otherwise stated)
4. Return of Capital
ING U.S., Inc. received returns of capital from the following subsidiaries for the periods indicated:
| Years Ended December 31, | ||||||||||||
| 2013 | 2012 | 2011 | ||||||||||
| Lion Connecticut Holdings Inc. |
$ | 987.0 | $ | 733.0 | $ | — | ||||||
| Security Life of Denver Insurance Company |
447.0 | 80.0 | 200.0 | |||||||||
|
|
|
|
|
|
|
|||||||
| Total |
$ | 1,434.0 | $ | 813.0 | $ | 200.0 | ||||||
|
|
|
|
|
|
|
|||||||
5. Income Taxes
As of December 31, 2013 and 2012, ING U.S., Inc. held deferred tax assets related to loss and credit carryforwards, which have not been realized by its subsidiaries but have been reimbursed to the subsidiaries by ING U.S., Inc. pursuant to the intercompany tax sharing agreement. These deferred tax assets were primarily comprised of payments associated with federal net operating loss, state net operating loss, federal tax capital loss, and credit carryforwards.
Valuation allowances have been applied to these deferred tax assets as of December 31, 2013 and 2012. Character, amount, and estimated expiration date of the carryforwards and the related allowances are disclosed in Note 15. Income Taxes to the Consolidated Financial Statements.
As of December 31, 2013 and 2012, ING U.S., Inc. has recognized deferred tax assets of $204.4 and $127.4, respectively, related to Alternative Minimum Tax (“AMT”) credit carryforwards, which do not expire and are not subject to a valuation allowance.
Tax Sharing Agreement
ING U.S., Inc. has entered into a federal tax sharing agreement with members of an affiliated group as defined in Section 1504 of the Internal Revenue Code of 1986, as amended. The agreement provides for the manner of calculation and the amounts/timing of the payments between the parties as well as other related matters in connection with the filing of consolidated federal income tax returns. For 2012 and prior years, the federal tax sharing agreement requires ING U.S., Inc. to pay its subsidiaries for the tax benefits of ordinary and capital losses as they are incurred, and in turn requires its subsidiaries to pay ING U.S., Inc. for the taxes payable on their ordinary income and capital gains. Under the agreement, ING U.S., Inc. is required to make payments even if losses do not offset other subsidiaries’ ordinary income or capital gains. Effective January 1, 2013, the parties have entered into a federal tax sharing agreement which provides that for 2013 and subsequent years, ING U.S., Inc. will pay its subsidiaries for the tax benefits of ordinary and capital losses only in the event that the consolidated tax group actually uses the tax benefit of losses generated.
ING U.S., Inc. has also entered into a state tax sharing agreement with each of the specific subsidiaries that are parties to the agreement. The state tax agreement applies to situations in which ING U.S., Inc. and all or some of the subsidiaries join in the filing of a state or local franchise, income tax, or other tax return on a consolidated, combined or unitary basis.
F-172
Table of Contents
ING U.S., Inc.
Supplementary Insurance Information
As of December 31, 2013 and 2012
(In millions)
| Segment | DAC and VOBA |
Future Policy Benefits and Contract Owner Account Balances |
Unearned Premiums(1) |
|||||||||
| 2013 |
||||||||||||
| Retirement Solutions: |
||||||||||||
| Retirement |
$ | 1,415.3 | $ | 28,748.3 | $ | — | ||||||
| Annuities |
591.7 | 22,675.5 | — | |||||||||
| Insurance Solutions: |
||||||||||||
| Individual Life |
2,752.9 | 18,314.1 | (0.1 | ) | ||||||||
| Employee Benefits |
99.2 | 2,036.6 | (0.4 | ) | ||||||||
| Investment Management |
2.5 | — | — | |||||||||
| Corporate |
0.8 | 85.0 | — | |||||||||
| Closed Blocks: |
||||||||||||
| Variable Annuity |
489.0 | 3,824.7 | — | |||||||||
| Institutional Spread Products |
0.2 | 2,602.1 | — | |||||||||
| Other |
— | 5,720.4 | (0.1 | ) | ||||||||
|
|
|
|
|
|
|
|||||||
| Total |
$ | 5,351.6 | $ | 84,006.7 | $ | (0.6 | ) | |||||
|
|
|
|
|
|
|
|||||||
| 2012 |
||||||||||||
| Retirement Solutions: |
||||||||||||
| Retirement |
$ | 712.4 | $ | 27,924.0 | $ | — | ||||||
| Annuities |
260.7 | 23,100.8 | — | |||||||||
| Insurance Solutions: |
||||||||||||
| Individual Life |
2,127.6 | 17,807.5 | — | |||||||||
| Employee Benefits |
99.2 | 2,031.6 | (0.5 | ) | ||||||||
| Investment Management |
2.2 | — | — | |||||||||
| Corporate |
0.9 | 104.1 | — | |||||||||
| Closed Blocks: |
||||||||||||
| Variable Annuity |
453.1 | 5,243.1 | — | |||||||||
| Institutional Spread Products |
0.2 | 3,664.4 | — | |||||||||
| Other |
— | 6,180.2 | (0.2 | ) | ||||||||
|
|
|
|
|
|
|
|||||||
| Total |
$ | 3,656.3 | $ | 86,055.7 | $ | (0.7 | ) | |||||
|
|
|
|
|
|
|
|||||||
| (1) | Represents unearned premiums associated with short-duration products of the Company’s accident and health business. |
F-173
Table of Contents
ING U.S., Inc.
Schedule III
Supplementary Insurance Information
Years Ended December 31, 2013, 2012 and 2011
(In millions)
| Segment |
Net Investment Income(1)(2) |
Premiums and Fee Income(1)(2) |
Interest Credited and Other Benefits to Contract Owners |
Amortization of DAC and VOBA |
Other Operating Expenses(1)(2) |
Premiums Written (Excluding Life) |
||||||||||||||||||
| 2013 |
||||||||||||||||||||||||
| Retirement Solutions: |
||||||||||||||||||||||||
| Retirement |
$ | 1,809.4 | $ | 765.6 | $ | 848.8 | $ | 45.9 | $ | 1,112.2 | $ | — | ||||||||||||
| Annuities |
1,271.1 | 81.4 | 755.5 | 114.4 | 127.0 | — | ||||||||||||||||||
| Insurance Solutions: |
||||||||||||||||||||||||
| Individual Life |
931.9 | 1,866.9 | 2,059.6 | 193.0 | 358.3 | — | ||||||||||||||||||
| Employee Benefits |
118.3 | 1,148.9 | 903.5 | 16.8 | 236.0 | 587.0 | ||||||||||||||||||
| Investment Management |
(60.8 | ) | 552.0 | — | 4.4 | 493.2 | — | |||||||||||||||||
| Corporate |
336.0 | (163.2 | ) | 10.5 | 0.2 | (194.6 | ) | — | ||||||||||||||||
| Closed Blocks: |
||||||||||||||||||||||||
| Variable Annuity |
97.7 | 1,366.4 | (51.8 | ) | 67.5 | 467.5 | — | |||||||||||||||||
| Institutional Spread Products |
187.0 | 2.4 | 62.8 | 0.6 | 10.0 | — | ||||||||||||||||||
| Other |
(1.6 | ) | 2.2 | (91.1 | ) | — | 77.1 | — | ||||||||||||||||
|
|
|
|
|
|
|
|
|
|
|
|
|
|||||||||||||
| Total |
$ | 4,689.0 | $ | 5,622.6 | $ | 4,497.8 | $ | 442.8 | $ | 2,686.7 | $ | 587.0 | ||||||||||||
|
|
|
|
|
|
|
|
|
|
|
|
|
|||||||||||||
| 2012 |
||||||||||||||||||||||||
| Retirement Solutions: |
||||||||||||||||||||||||
| Retirement |
$ | 1,764.2 | $ | 719.9 | $ | 842.2 | $ | 160.1 | $ | 1,058.1 | $ | — | ||||||||||||
| Annuities |
1,365.7 | 71.4 | 861.0 | 269.0 | 124.6 | — | ||||||||||||||||||
| Insurance Solutions: |
||||||||||||||||||||||||
| Individual Life |
936.1 | 1,870.5 | 2,063.3 | 211.3 | 433.1 | — | ||||||||||||||||||
| Employee Benefits |
127.3 | 1,140.6 | 892.1 | 13.5 | 236.2 | 589.5 | ||||||||||||||||||
| Investment Management |
(89.0 | ) | 493.6 | — | 3.0 | 465.6 | — | |||||||||||||||||
| Corporate |
275.0 | (163.0 | ) | (6.5 | ) | 6.5 | 317.4 | — | ||||||||||||||||
| Closed Blocks: |
||||||||||||||||||||||||
| Variable Annuity |
52.7 | 1,235.9 | 113.6 | 58.3 | 450.3 | — | ||||||||||||||||||
| Institutional Spread Products |
233.3 | 2.4 | 67.4 | 0.6 | 11.5 | — | ||||||||||||||||||
| Other |
32.6 | 5.2 | 28.5 | — | 58.2 | — | ||||||||||||||||||
|
|
|
|
|
|
|
|
|
|
|
|
|
|||||||||||||
| Total |
$ | 4,697.9 | $ | 5,376.5 | $ | 4,861.6 | $ | 722.3 | $ | 3,155.0 | $ | 589.5 | ||||||||||||
|
|
|
|
|
|
|
|
|
|
|
|
|
|||||||||||||
| 2011 |
||||||||||||||||||||||||
| Retirement Solutions: |
||||||||||||||||||||||||
| Retirement |
$ | 1,733.7 | $ | 721.7 | $ | 826.2 | $ | 149.5 | $ | 1,095.6 | $ | — | ||||||||||||
| Annuities |
1,494.6 | 63.9 | 978.0 | (159.4 | ) | 126.7 | — | |||||||||||||||||
| Insurance Solutions: |
||||||||||||||||||||||||
| Individual Life |
1,009.5 | 1,810.0 | 1,872.5 | 328.6 | 332.9 | 0.1 | ||||||||||||||||||
| Employee Benefits |
143.7 | 1,125.2 | 917.7 | 15.9 | 229.3 | 575.2 | ||||||||||||||||||
| Investment Management |
(123.9 | ) | 529.3 | — | 4.1 | 463.8 | — | |||||||||||||||||
| Corporate |
222.8 | (169.5 | ) | 78.4 | (7.5 | ) | 234.8 | — | ||||||||||||||||
| Closed Blocks: |
||||||||||||||||||||||||
| Variable Annuity |
85.8 | 1,280.7 | 890.2 | 55.2 | 413.8 | — | ||||||||||||||||||
| Institutional Spread Products |
372.4 | 2.4 | 89.0 | 0.6 | 11.3 | — | ||||||||||||||||||
| Other |
30.2 | 9.9 | 90.0 | — | 122.6 | — | ||||||||||||||||||
|
|
|
|
|
|
|
|
|
|
|
|
|
|||||||||||||
| Total |
$ | 4,968.8 | $ | 5,373.6 | $ | 5,742.0 | $ | 387.0 | $ | 3,030.8 | $ | 575.3 | ||||||||||||
|
|
|
|
|
|
|
|
|
|
|
|
|
|||||||||||||
| (1) | Includes the elimination of certain intersegment revenues and expenses that have been recorded on an arm’s length basis, primarily consisting of asset-based management and administration fees, which have been charged by Investment Management and eliminated in the Corporate segment. |
| (2) | Includes the elimination of intercompany transactions between the Company and its consolidated investment entities, primarily the elimination of the Company’s management fees expensed by the funds, recorded as operating revenues before the Company’s consolidation of its consolidated investment entities and eliminated in the Investment Management segment. |
F-174
Table of Contents
ING U.S., Inc.
Reinsurance
Years Ended December 31, 2013, 2012 and 2011
(In millions)
| Gross | Ceded | Assumed | Net | Percentage of Assumed to Net |
||||||||||||||||
| 2013 |
||||||||||||||||||||
| Life insurance in force |
$ | 811,134.1 | $ | 541,044.0 | $ | 393,712.4 | $ | 663,802.5 | 59.3 | % | ||||||||||
|
|
|
|
|
|
|
|
|
|||||||||||||
| Premiums: |
||||||||||||||||||||
| Life insurance |
$ | 1,387.7 | $ | 1,360.4 | $ | 1,228.5 | $ | 1,255.8 | 97.8 | % | ||||||||||
| Accident and health insurance |
675.1 | 100.4 | 4.4 | 579.1 | 0.8 | % | ||||||||||||||
| Annuities |
121.3 | — | 0.1 | 121.4 | 0.1 | % | ||||||||||||||
|
|
|
|
|
|
|
|
|
|||||||||||||
| Total premiums |
$ | 2,184.1 | $ | 1,460.8 | $ | 1,233.0 | $ | 1,956.3 | 63.0 | % | ||||||||||
|
|
|
|
|
|
|
|
|
|||||||||||||
| 2012(1) |
||||||||||||||||||||
| Life insurance in force |
$ | 814,923.0 | $ | 592,756.2 | $ | 426,188.3 | $ | 648,355.1 | 65.7 | % | ||||||||||
|
|
|
|
|
|
|
|
|
|||||||||||||
| Premiums: |
||||||||||||||||||||
| Life insurance |
$ | 1,368.6 | $ | 1,429.0 | $ | 1,296.2 | $ | 1,235.8 | 104.9 | % | ||||||||||
| Accident and health insurance |
678.2 | 97.4 | 5.3 | 586.1 | 0.9 | % | ||||||||||||||
| Annuities |
37.2 | 0.1 | 2.1 | 39.2 | 5.4 | % | ||||||||||||||
|
|
|
|
|
|
|
|
|
|||||||||||||
| Total premiums |
$ | 2,084.0 | $ | 1,526.5 | $ | 1,303.6 | $ | 1,861.1 | 70.0 | % | ||||||||||
|
|
|
|
|
|
|
|
|
|||||||||||||
| 2011(1) |
||||||||||||||||||||
| Life insurance in force |
$ | 766,019.8 | $ | 649,667.2 | $ | 483,286.4 | $ | 599,639.0 | 80.6 | % | ||||||||||
|
|
|
|
|
|
|
|
|
|||||||||||||
| Premiums: |
||||||||||||||||||||
| Life insurance |
$ | 1,291.8 | $ | 1,454.0 | $ | 1,319.8 | $ | 1,157.6 | 114.0 | % | ||||||||||
| Accident and health insurance |
670.0 | 104.4 | 9.3 | 574.9 | 1.6 | % | ||||||||||||||
| Annuities |
37.4 | — | 0.1 | 37.5 | 0.3 | % | ||||||||||||||
|
|
|
|
|
|
|
|
|
|||||||||||||
| Total premiums |
$ | 1,999.2 | $ | 1,558.4 | $ | 1,329.2 | $ | 1,770.0 | 75.1 | % | ||||||||||
|
|
|
|
|
|
|
|
|
|||||||||||||
| (1) | Life insurance in force amounts for 2012 and 2011 have been adjusted to include certain closed blocks of business divested through reinsurance transactions that were previously omitted, to conform to the current year presentation. |
F-175
Table of Contents
ING U.S., Inc.
Valuation and Qualifying Accounts
Years Ended December 31, 2013, 2012 and 2011
(In millions)
| Balance at January 1, |
Charged to Costs and Expenses |
Write-offs/ Payments/ Other |
Balance at December 31, |
|||||||||||||
| 2013 |
||||||||||||||||
| Valuation allowance on deferred tax assets |
$ | 2,974.1 | $ | (86.6 | ) | $ | (65.6 | )(1) | $ | 2,821.9 | ||||||
| 2012 |
||||||||||||||||
| Valuation allowance on deferred tax assets |
$ | 2,875.0 | $ | 99.1 | $ | — | $ | 2,974.1 | ||||||||
| 2011 |
||||||||||||||||
| Valuation allowance on deferred tax assets |
$ | 3,087.0 | $ | 175.0 | $ | (387.0 | )(1) | $ | 2,875.0 | |||||||
| (1) | For 2013 and 2011, these amounts represent valuation allowances allocated to Other comprehensive income directly related to the appreciation of the Company’s available-for-sale portfolio, and not pertaining to expectations of taxable income in future years. |
F-176
Table of Contents
PART II INFORMATION NOT REQUIRED IN PROSPECTUS
| Item 13. | Other Expenses Of Issuance And Distribution |
The following table sets forth all expenses, other than the estimated underwriting discounts and commissions, payable by us in connection with this offering. All the amounts shown are estimates except the SEC registration fee, the Financial Industry Regulatory Authority, or FINRA, filing fee and the listing fee.
| SEC registration fee |
$ | 137,460 | ||
| FINRA filing fee |
160,586 | |||
| Printing and engraving |
200,000 | |||
| Legal fees and expenses |
450,000 | |||
| Accounting fees and expenses |
300,000 | |||
| Transfer agent and registrar fees |
3,000 | |||
| Miscellaneous fees and expenses |
100,000 | |||
|
|
|
|||
| Total |
1,351,046 | |||
|
|
|
| Item 14. | Indemnification Of Directors And Officers |
Section 145 of the Delaware General Corporation Law (the “DGCL”) provides in relevant part that a corporation may indemnify any person who was or is a party or is threatened to be made a party to any threatened, pending or completed action, suit or proceeding, whether civil, criminal, administrative or investigative (other than an action by or in the right of such corporation) by reason of the fact that such person is or was a director, officer, employee or agent of the corporation, or serving at the request of the corporation in such capacity for another corporation, partnership, joint venture, trust or other enterprise, against expenses (including attorneys’ fees), judgments, fines and amounts paid in settlement actually and reasonably incurred in connection with such action, suit or proceeding, if such person acted in good faith and in a manner he or she reasonably believed to be in or not opposed to the best interests of the corporation, and, with respect to any criminal action or proceeding, had no reasonable cause to believe his or her conduct was unlawful.
The DGCL also permits a corporation to indemnify such persons against expenses (including attorneys’ fees) in connection with the defense or settlement of an action by or in the right of the corporation under the same conditions, except that no indemnification is permitted without judicial approval if such person is adjudged to be liable to the corporation. Where a present or former director or officer is successful in the defense of such an action, suit or proceeding referenced above, or in defense of any claim, issue or matter therein, the corporation must indemnify him or her against the expenses which such officer or director actually and reasonably incurred. Expenses (including attorneys’ fees) incurred by such persons in defending any action, suit or proceeding may be paid in advance of the final disposition of such action, suit or proceeding upon, in the case of a current officer or director, receipt of an undertaking by or on behalf of such person to repay such amount if it is ultimately determined that such person is not entitled to be so indemnified.
The DGCL provides that the indemnification described above is not exclusive of other rights to which those seeking indemnification may be entitled under any bylaw, agreement, vote of stockholders or disinterested directors or otherwise. The Company’s amended and restated certificate of incorporation provides for indemnification by the Company of its directors and officers to the fullest extent permitted by the DGCL.
In accordance with Section 102(b)(7) of the DGCL, our amended and restated certificate of incorporation contains a provision to limit the personal liability of a director to the corporation or its stockholders for monetary damages for violations of the directors’ fiduciary duty, except (i) for any breach of the director’s duty of loyalty to the corporation or its stockholders, (ii) for acts or omissions not in good faith or which involve intentional misconduct or a knowing violation of law, (iii) pursuant to Section 174 of the DGCL, for liability of directors for unlawful payment of dividends or unlawful stock purchases or redemptions or (iv) for any transaction from which a director derived an improper personal benefit.
Table of Contents
The DGCL also provides corporations with the power to purchase and maintain insurance on behalf of any person who is or was a director, officer, employee or agent of such corporation, or is or was serving at the request of such corporation in a similar capacity for another corporation, partnership, joint venture, trust or other enterprise, against any liability asserted against him or her in any such capacity or arising out of his or her status as such, whether or not the corporation would have the power to indemnify him or her against such liability as described above. Policies of insurance are maintained by the Company under which our directors and officers are insured, within the limits and subject to the terms of the policies, against certain expenses in connection with the defense of, and certain liabilities which might be imposed as a result of, actions, suits or proceedings to which they are parties by reason of being or having been directors or officers.
The foregoing statements are subject to the detailed provisions of the DGCL and the full text of our amended and restated certificate of incorporation, which is filed as Exhibit 3.1 hereto.
We have entered into separate indemnification agreements with each of our directors and officers that provide, subject to their terms, the maximum indemnity allowed to directors and officers by Section 145 of the DGCL and certain additional procedural protections.
The proposed form of underwriting agreement to be filed as Exhibit 1 provides that the underwriters are obligated under certain circumstances to indemnify our directors, officers and certain controlling persons against specified liabilities, including liabilities under the Securities Act of 1933, as amended.
| Item 15. | Recent Sales Of Unregistered Securities |
On July 10, 2012, ING U.S., Inc. sold $850,000,000 aggregate principal amount of its 5.5% Senior Notes due 2022 (the “2022 Notes”), fully and unconditionally guaranteed by Lion Connecticut Holdings, Inc. The 2022 Notes were sold to qualified institutional buyers in the United States in reliance on Rule 144A and to investors outside the United States in reliance on Regulation S. The 2022 Notes were offered to investors at 99.946% of the principal amount thereof. Merrill Lynch, Pierce, Fenner & Smith Incorporated, Citigroup Global Markets Inc., J.P. Morgan Securities LLC and Morgan Stanley & Co. LLC acted as joint book-running managers for the initial purchasers. The aggregate initial purchasers’ discount was $5,525,000.
On February 6, 2013, ING U.S., Inc. sold $1,000,000,000 aggregate principal amount of its 2.9% Senior Notes due 2018 (the “2018 Notes”), fully and unconditionally guaranteed by Lion Connecticut Holdings, Inc. The 2018 Notes were sold to qualified institutional buyers in the United States in reliance on Rule 144A and to investors outside the United States in reliance on Regulation S. The 2018 Notes were offered to investors at 99.824% of the principal amount thereof. Deutsche Bank Securities Inc., J.P. Morgan Securities LLC, RBC Capital Markets, LLC and SunTrust Robinson Humphrey, Inc. acted as joint book-running managers for the initial purchasers. The aggregate initial purchasers’ discount was $6,000,000.
On May 7, 2013, in conjunction with our IPO, we issued to ING Group warrants exercisable for a number of shares of our common stock equal in the aggregate to 26,050,846 shares of our common stock. The warrants were issued in reliance upon Section 4(2) of the Securities Act. The current exercise price of the warrants is $48.75 per share of common stock, subject to adjustments, including for stock dividends, certain cash dividends, subdivisions, combinations, reclassifications and non-cash distributions. The warrants also provide for, upon the occurrence of certain change of control events affecting the Company, an increase in the number of shares to which a warrant holder will be entitled upon payment of the aggregate exercise price of the warrant. The warrants are exercisable starting on the first anniversary of the completion of our IPO and expire on the tenth anniversary of the completion of our IPO. The warrants are net share settled, which means that no cash will be payable by a warrant holder in respect of the exercise price of a warrant upon exercise. For so long as the ING Group holds warrants, ING Group will have registration rights under the registration rights agreement entered into by ING U.S., Inc. and ING Group, with respect to such warrants and the shares to be issued upon exercise thereof.
On May 13, 2013, ING U.S., Inc. sold $750,000,000 aggregate principal amount of its 5.650% Fixed-to-Floating Rate Junior Subordinated Notes due 2053 (the “junior subordinated notes”), fully and unconditionally
Table of Contents
guaranteed by Lion Connecticut Holdings, Inc. The junior subordinated notes were sold to qualified institutional buyers in the United States in reliance on Rule 144A and to investors outside the United States in reliance on Regulation S. The junior subordinated notes were offered to investors at 100.00% of the principal amount thereof. Barclays Capital Inc., J.P. Morgan Securities LLC and Merrill Lynch, Pierce, Fenner & Smith Incorporated acted as joint book-running managers for the initial purchasers. The aggregate initial purchasers’ discount was $11,250,000.
On July 23, 2013, ING U.S., Inc. sold $400,000,000 aggregate principal amount of its 5.7% Senior Notes due 2043 (the “2043 Notes”), fully and unconditionally guaranteed by Lion Connecticut Holdings, Inc. The 2043 Notes were sold to qualified institutional buyers in the United States in reliance on Rule 144A and to investors outside the United States in reliance on Regulation S. The 2043 Notes were offered to investors at 99.646% of the principal amount thereof. Credit Suisse Securities (USA) LLC, Deutsche Bank Securities Inc. and Goldman, Sachs & Co. acted as joint book-running managers for the initial purchasers. The aggregate initial purchasers’ discount was $3,500,000.
| Item 16. | Exhibits And Financial Statement Schedules |
| (a) | Exhibits. |
The following documents are filed as exhibits hereto:
| Exhibit No. |
Description | |
| 1.1 | Form of Underwriting Agreement | |
| 3.1 | Amended and Restated Certificate of Incorporation of ING U.S., Inc. (incorporated by reference to Exhibit 3.2 to the Company’s Amendment No. 4 to Registration Statement on Form S-1 (File No. 333-184847) filed on April 16, 2013) | |
| 3.2 | Amended and Restated By-Laws of ING U.S., Inc. (incorporated by reference to Exhibit 3.1 to the Company’s Current Report on Form 8-K filed on May 7, 2013) | |
| 4.1 | Form of Common Stock Certificate (incorporated by reference to Exhibit 4.2 to Amendment No. 4 to the Company’s Registration Statement on Form S-1 (File No. 333-184847) filed on April 16, 2013 | |
| 5.1 | Opinion of Sullivan & Cromwell LLP | |
| 10.01 | Registration Rights Agreement, dated as of May 7, 2013, between ING U.S., Inc. and ING Groep N.V. (incorporated by reference to Exhibit 10.4 to the Company’s Current Report on Form 8-K filed on May 7, 2013) | |
| 10.02 | Warrant Agreement, dated as of May 7, 2013, among ING U.S., Inc., Computershare Inc. and Computershare Trust Company, N.A. (incorporated by reference to Exhibit 99.1 to the Company’s Current Report on Form 8-K filed on May 7, 2013) | |
| 10.03 | Warrant issued to ING Groep N.V, dated May 7, 2013 (incorporated by reference to Exhibit 99.2 to the Company's Current Report on Form 8-K filed on May 7, 2013) | |
| 10.04 | Indenture, dated as of July 13, 2012, among ING U.S., Inc., Lion Connecticut Holdings Inc. and U.S. Bank National Association, as trustee (incorporated by reference to Exhibit 10.1 to the Company’s Amendment No. 1 to Registration Statement on Form S-1 (File No. 333-184847) filed on January 23, 2013) | |
| 10.05 | First Supplemental Indenture, dated as of July 13, 2012, among ING U.S., Inc., Lion Connecticut Holdings Inc. and U.S. Bank National Association, as trustee (incorporated by reference to Exhibit 10.2 to the Company’s Amendment No. 1 to Registration Statement on Form S-1 (File No. 333-184847) filed on January 23, 2013) | |
| 10.06 | Second Supplemental Indenture, dated as of February 11, 2013, among ING U.S., Inc., Lion Connecticut Holdings Inc. and U.S. Bank National Association, as trustee (incorporated by reference to Exhibit 10.74 to the Company’s Amendment No. 2 to Registration Statement on Form S-1 (File No. 333-184847) filed on March 19, 2013) | |
Table of Contents
| Exhibit No. |
Description | |
| 10.07 | Third Supplemental Indenture, dated as of July 26, 2013 among ING U.S., Inc., Lion Connecticut Holdings Inc. and U.S. Bank National Association, as trustee (incorporated by reference to Exhibit 10.1 to the Company’s Current Report on Form 8-K filed on July 26, 2013) | |
| 10.08 | Junior Subordinated Indenture, dated as of May 16, 2013, among ING U.S., Inc., Lion Connecticut Holdings Inc. and U.S. Bank National Association, as trustee (incorporated by reference to Exhibit 10.15 to the Company’s Quarterly Report on Form 10-Q (File No. 001-35897) filed on May 23, 2013) | |
| 10.09 | First Supplemental Indenture, dated as of May 16, 2013, among ING U.S., Inc., Lion Connecticut Holdings Inc. and U.S. Bank National Association, as trustee (incorporated by reference to Exhibit 10.16 to the Company’s Quarterly Report on Form 10-Q (File No. 001-35897) filed on May 23, 2013) | |
| 10.10 | Indenture, dated as of August 1, 1993, between Aetna Life and Casualty Company and State Street Bank and Trust Company of Connecticut, National Association, as trustee (incorporated by reference to Exhibit 10.4 to the Company’s Amendment No. 1 to Registration Statement on Form S-1 (File No. 333-184847) filed on January 23, 2013) | |
| 10.11 | First Indenture Supplement, dated as of August 1, 1996 between Aetna Services, Inc. (F/K/A Aetna Life and Casualty Company) and State Street Bank and Trust Company of Connecticut, National Association, as trustee (incorporated by reference to Exhibit 10.5 to the Company’s Amendment No. 1 to Registration Statement on Form S-1 (File No. 333-184847) filed on January 23, 2013) | |
| 10.12 | Second Indenture Supplement, dated as of October 30, 2000, among Aetna Services, Inc. (F/K/A Aetna Life and Casualty Company), Aetna Inc. and State Street Bank and Trust Company of Connecticut, National Association, as trustee (incorporated by reference to Exhibit 10.6 to the Company’s Amendment No. 1 to Registration Statement on Form S-1 (File No. 333-184847) filed on January 23, 2013) | |
| 10.13 | Third Indenture Supplement, dated as of December 13, 2000, among Aetna, Inc., ING Groep N.V. and State Street Bank and Trust Company of Connecticut, National Association, as trustee (incorporated by reference to Exhibit 10.7 to the Company’s Amendment No. 1 to Registration Statement on Form S-1 (File No. 333-184847) filed on January 23, 2013) | |
| 10.14 | Indenture, dated as of July 1, 1996, among Aetna Life and Casualty Company, Aetna, Inc. and State Street Bank and Trust Company of Connecticut, National Association, as trustee (incorporated by reference to Exhibit 10.8 to the Company’s Amendment No. 1 to Registration Statement on Form S-1 (File No. 333-184847) filed on January 23, 2013) | |
| 10.15 | First Indenture Supplement dated as of October 30, 2000 among Aetna Services, Inc. (F/K/A Aetna Life and Casualty Company), Aetna Inc. and State Street Bank and Trust Company of Connecticut, National Association, as trustee (incorporated by reference to Exhibit 10.9 to the Company’s Amendment No. 1 to Registration Statement on Form S-1 (File No. 333-184847) filed on January 23, 2013) | |
| 10.16 | Second Indenture Supplement dated as of December 13, 2000, between Lion Connecticut Holdings, Inc. (as successor to Aetna, Inc., Aetna Services, Inc. and Aetna Life and Casualty Company) and State Street Bank and Trust Company of Connecticut, National Association, as trustee (incorporated by reference to Exhibit 10.10 to the Company’s Amendment No. 1 to Registration Statement on Form S-1 (File No. 333-184847) filed on January 23, 2013) | |
| 10.17 | Revolving Credit Agreement, dated as of April 20, 2012, among ING America Insurance Holdings, Inc., Bank of America, N.A. and the other parties thereto (incorporated by reference to Exhibit 10.11 to the Company’s Amendment No. 1 to Registration Statement on Form S-1 (File No. 333-184847) filed on January 23, 2013) | |
| 10.18 | Term Loan Agreement, dated as of April 20, 2012, among Bank of America, N.A. and the other parties thereto (incorporated by reference to Exhibit 10.12 to the Company’s Amendment No. 1 to Registration Statement on Form S-1 (File No. 333-184847) filed on January 23, 2013) | |
Table of Contents
| Exhibit No. |
Description | |
| 10.19 | Amended and Restated Revolving Credit Agreement dated as of February 14, 2014, among ING U.S., Inc., Bank of America, N.A. and the other parties thereto (incorporated by reference to Exhibit 10.1 to the Company’s Current Report on Form 8-K filed on February 21, 2014) | |
| 10.20 | Credit Agreement, dated as of December 30, 2011, by and between Security Life of Denver International Limited, ING Bank N.V., London Branch, as administrative agent, and the Issuing Banks described therein (incorporated by reference to Exhibit 10.13 to the Company’s Amendment No. 1 to Registration Statement on Form S-1 (File No. 333-184847) filed on January 23, 2013) | |
| 10.21 | Master Transaction Agreement, dated as of May 1, 2006, by and between ING USA Annuity and Life Insurance Company and the Federal Home Loan Bank of Des Moines (incorporated by reference to Exhibit 10.14 to the Company’s Amendment No. 1 to Registration Statement on Form S-1 (File No. 333-184847) filed on January 23, 2013) | |
| 10.22 | Advances, Pledge and Security Agreement, dated as of March 27, 2009, by and between ING USA Annuity and Life Insurance Company and the Federal Home Loan Bank of Des Moines (incorporated by reference to Exhibit 10.15 to the Company’s Amendment No. 1 to Registration Statement on Form S-1 (File No. 333-184847) filed on January 23, 2013) | |
| 10.23 | Deposit Agreement, dated as of May 15, 2000 between the Federal Home Loan Bank of Topeka and Security Life of Denver Insurance Company (incorporated by reference to Exhibit 10.16 to the Company’s Amendment No. 1 to Registration Statement on Form S-1 (File No. 333-184847) filed on January 23, 2013) | |
| 10.24 | Advance, Pledge and Security Agreement, dated as of August 30, 2004, by and between the Federal Home Loan Bank of Topeka and Security Life of Denver Insurance Company (incorporated by reference to Exhibit 10.17 to the Company’s Amendment No. 1 to Registration Statement on Form S-1 (File No. 333-184847) filed on January 23, 2013) | |
| 10.25 | Amended and Restated Institutional Custody Agreement, dated as of May 12, 2004, by and between Security Life of Denver Insurance Company and the Federal Home Loan Bank of Topeka (incorporated by reference to Exhibit 10.18 to the Company’s Amendment No. 1 to Registration Statement on Form S-1 (File No. 333-184847) filed on January 23, 2013) | |
| 10.26 | Master Asset Purchase Agreement, dated as of January 22, 2009, by and among Scottish Re Group Limited, Scottish Holdings, Inc., Scottish Re (U.S.), Inc., Scottish Re Life (Bermuda) Limited, Scottish Re (Dublin) Limited, Hannover Life Reassurance Company of America, Hannover Life Reassurance (Ireland) Limited, Security Life of Denver Insurance Company, Security Life of Denver International Limited (incorporated by reference to Exhibit 10.19 to the Company’s Amendment No. 1 to Registration Statement on Form S-1 (File No. 333-184847) filed on January 23, 2013) | |
| 10.27 | Reinsurance Agreement, effective as of January 1, 2009, between Security Life of Denver Insurance Company and Hannover Life Reassurance Company of America (incorporated by reference to Exhibit 10.20 to the Company’s Amendment No. 1 to Registration Statement on Form S-1 (File No. 333-184847) filed on January 23, 2013) | |
| 10.28 | Reinsurance Agreement, effective as of July 1, 2011, between Security Life of Denver International Limited and Hannover Life Reassurance (Ireland) Limited (incorporated by reference to Exhibit 10.21 to the Company’s Amendment No. 1 to Registration Statement on Form S-1 (File No. 333-184847) filed on January 23, 2013) | |
| 10.29 | Reinsurance Agreement, effective as of July 1, 2011, between Security Life of Denver International Limited and Hannover Life Reassurance (Ireland) Limited (incorporated by reference to Exhibit 10.22 to the Company’s Amendment No. 1 to Registration Statement on Form S-1 (File No. 333-184847) filed on January 23, 2013) | |
| 10.30 | Reinsurance Agreement, effective as of July 1, 2011, between Security Life of Denver International Limited and Hannover Life Reassurance (Ireland) Limited (incorporated by reference to Exhibit 10.23 to the Company’s Amendment No. 1 to Registration Statement on Form S-1 (File No. 333-184847) filed on January 23, 2013) | |
Table of Contents
| Exhibit No. |
Description | |
| 10.31 | Coinsurance Agreement, dated as of October 1, 1998, between Aetna Life Insurance and Annuity Company and The Lincoln National Life Insurance Company (incorporated by reference to Exhibit 10.24 to the Company’s Amendment No. 1 to Registration Statement on Form S-1 (File No. 333-184847) filed on January 23, 2013) | |
| 10.32 | Modified Coinsurance Agreement, dated as of October 1, 1998, between Aetna Life Insurance and Annuity Company and The Lincoln National Life Insurance Company (incorporated by reference to Exhibit 10.25 to the Company’s Amendment No. 1 to Registration Statement on Form S-1 (File No. 333-184847) filed on January 23, 2013) | |
| 10.33 | Coinsurance Agreement, dated as of October 1, 1998, between Aetna Life Insurance and Annuity Company and Lincoln Life & Annuity Company of New York (incorporated by reference to Exhibit 10.26 to the Company’s Amendment No. 1 to Registration Statement on Form S-1 (File No. 333-184847) filed on January 23, 2013) | |
| 10.34 | Amendment No. 1 to Coinsurance Agreement, effective March 1, 2007 between ING Life Insurance and Annuity Company (f/k/a Aetna Life Insurance and Annuity Company) and Lincoln Life & Annuity Company of New York (incorporated by reference to Exhibit 10.27 to the Company’s Amendment No. 1 to Registration Statement on Form S-1 (File No. 333-184847) filed on January 23, 2013) | |
| 10.35 | Modified Coinsurance Agreement, dated as of October 1, 1998, between Aetna Life Insurance and Annuity Company and Lincoln Life & Annuity Company of New York (incorporated by reference to Exhibit 10.28 to the Company’s Amendment No. 1 to Registration Statement on Form S-1 (File No. 333-184847) filed on January 23, 2013) | |
| 10.36 | Master Services Agreement for Business Processes, dated as of June 5, 2012, between ING North America Insurance Corporation and Cognizant Technology Solutions U.S. Corporation (incorporated by reference to Exhibit 10.29 to the Company’s Amendment No. 1 to Registration Statement on Form S-1 (File No. 333-184847) filed on January 23, 2013) | |
| 10.37 | Tax Sharing Agreement by and between ING America Insurance Holdings, Inc. and various subsidiaries with respect to federal taxes (incorporated by reference to Exhibit 10.30 to the Company’s Amendment No. 2 to Registration Statement on Form S-1 (File No. 333-184847) filed on March 19, 2013) | |
| 10.38 | Tax Sharing Agreement by and between ING America Insurance Holdings, Inc. and various subsidiaries with respect to state taxes (incorporated by reference to Exhibit 10.31 to the Company’s Amendment No. 1 to Registration Statement on Form S-1 (File No. 333-184847) filed on January 23, 2013) | |
| 10.39 | Shareholder Agreement, dated as of May 7, 2013, between ING U.S., Inc. and ING Groep N.V. (incorporated by reference to Exhibit 10.1 to the Company’s Current Report on Form 8-K filed on May 7, 2013) | |
| 10.40 | Transitional Intellectual Property License Agreement, dated as of May 7, 2013, between ING U.S., Inc. and ING Groep N.V. (incorporated by reference to Exhibit 10.2 to the Company’s Current Report on Form 8-K filed on May 7, 2013) | |
| 10.41 | Equity Administration Agreement between ING U.S., Inc. and ING Groep N.V. dated as of May 7, 2013 (incorporated by reference to Exhibit 10.3 to the Company’s Current Report on Form 8-K filed on May 7, 2014) | |
| 10.42 | Termination Agreement, dated May 3, 2013, between Security Life of Denver International Limited and ING Bank N.V., London Branch (incorporated by reference to Exhibit 10.1 to the Company’s Current Report on Form 8-K filed on May 8, 2013) | |
| 10.43 | Master Claim Agreement, dated April 17, 2012, between ING Groep N.V., ING America Insurance Holdings, Inc. and ING Insurance Eurasia N.V. (incorporated by reference to Exhibit 10.35 to the Company’s Amendment No. 1 to Registration Statement on Form S-1 (File No. 333-184847) filed on January 23, 2013) | |
Table of Contents
| Exhibit No. |
Description | |
| 10.44 | Form of Director Indemnification Agreement (incorporated by reference to Exhibit 10.37 to the Company’s Amendment No. 3 to Registration Statement on Form S-1 (File No. 333-184847) filed on April 5, 2013) | |
| 10.45 | Amended and Restated Employment Agreement, dated July 26, 2013, of Rodney O. Martin, Jr. (incorporated by reference to Exhibit 10.1 to the Company’s Current Report on Form 8-K filed on July 31, 2013) | |
| 10.46 | Offer Letter, dated July 5, 1994, between Jeffrey Becker and Aetna Life and Casualty (incorporated by reference to Exhibit 10.39 to the Company’s Amendment No. 2 to Registration Statement on Form S-1 (File No. 333-184847) filed on March 19, 2013) | |
| 10.47 | Retention Award, dated March 30, 2010, between Jeffrey Becker and ING Investment Management Holdings N.V. (incorporated by reference to Exhibit 10.40 to the Company’s Amendment No. 2 to Registration Statement on Form S-1 (File No. 333-184847) filed on March 19, 2013) | |
| 10.48 | Deal Incentive Award Agreement, dated July 2011, between Jeffrey Becker, ING Groep, N.V. and ING U.S., Inc. (f/k/a ING America Insurance Holdings, Inc.) (incorporated by reference to Exhibit 10.41 to the Company’s Amendment No. 2 to Registration Statement on Form S-1 (File No. 333-184847) filed on March 19, 2013) | |
| 10.49 | Amended and Restated Offer Letter of Alain M. Karaoglan, (incorporated by reference to Exhibit 10.02 to the Company’s Current Report on Form 8-K filed on July 31, 2013) | |
| 10.50 | Employment Contract, dated May 19, 2004, between Ewout Steenbergen and ING Personnel VOF (incorporated by reference to Exhibit 10.43 to the Company’s Amendment No. 2 to Registration Statement on Form S-1 (File No. 333-184847) filed on March 19, 2013) | |
| 10.51 | Amendment to Employment Contract, dated December 8, 2005, between Ewout Steenbergen and ING Personnel VOF (incorporated by reference to Exhibit 10.44 to the Company’s Amendment No. 2 to Registration Statement on Form S-1 (File No. 333-184847) filed on March 19, 2013) | |
| 10.52 | Retention Award, dated March 19, 2010, between Ewout Steenbergen and ING U.S., Inc. (incorporated by reference to Exhibit 10.45 to the Company’s Amendment No. 2 to Registration Statement on Form S-1 (File No. 333-184847) filed on March 19, 2013) | |
| 10.53 | Deal Incentive Award Agreement, dated July 2011, between Ewout Steenbergen, ING Groep, N.V. and ING U.S., Inc. (f/k/a ING America Insurance Holdings, Inc.) (incorporated by reference to Exhibit 10.46 to the Company’s Amendment No. 2 to Registration Statement on Form S-1 (File No. 333-184847) filed on March 19, 2013) | |
| 10.54 | International Assignment Agreement, dated October 27, 2009, between Ewout Steenbergen and ING Group as amended on November 12, 2009 (incorporated by reference to Exhibit 10.47 to the Company’s Amendment No. 2 to Registration Statement on Form S-1 (File No. 333-184847) filed on March 19, 2013) | |
| 10.55 | Letter, dated October 27, 2009, relating to appointment of Ewout Steenbergen as CFO of ING U.S. Insurance (incorporated by reference to Exhibit 10.48 to the Company’s Amendment No. 2 to Registration Statement on Form S-1 (File No. 333-184847) filed on March 19, 2013) | |
| 10.56 | Release Agreement with Robert G. Leary, dated December 20, 2012 (incorporated by reference to Exhibit 10.49 to the Company’s Amendment No. 2 to Registration Statement on Form S-1 (File No. 333-184847) filed on March 19, 2013) | |
| 10.57 | Retention Award, dated January 4, 2010, between Robert Leary and ING Verzekeringen N.V. (incorporated by reference to Exhibit 10.50 to the Company’s Amendment No. 2 to Registration Statement on Form S-1 (File No. 333-184847) filed on March 19, 2013) | |
| 10.58 | Maliz Beams Offer Letter dated May 27, 2011 (incorporated by reference to Exhibit 10.51 to the Company’s Amendment No. 2 to Registration Statement on Form S-1 (File No. 333-184847) filed on March 19, 2013) | |
Table of Contents
| Exhibit No. |
Description | |
| 10.59 | ING Group Incentive Compensation Plan (incorporated by reference to Exhibit 10.52 to the Company’s Amendment No. 1 to Registration Statement on Form S-1 (File No. 333-184847) filed on January 23, 2013) | |
| 10.60 | ING Group Long-Term Sustainable Performance Plan (incorporated by reference to Exhibit 10.53 to the Company’s Amendment No. 1 to Registration Statement on Form S-1 (File No. 333-184847) filed on January 23, 2013) | |
| 10.61 | Form of ING Group Long-Term Sustainable Performance Plan Grant (incorporated by reference to Exhibit 10.54 to the Company’s Amendment No. 1 to Registration Statement on Form S-1 (File No. 333-184847) filed on January 23, 2013) | |
| 10.62 | Form of ING Group Grant of Deferred Shares (incorporated by reference to Exhibit 10.55 to the Company’s Amendment No. 1 to Registration Statement on Form S-1 (File No. 333-184847) filed on January 23, 2013) | |
| 10.63 | ING Group Long-Term Equity Ownership Plan (incorporated by reference to Exhibit 10.56 to the Company’s Amendment No. 1 to Registration Statement on Form S-1 (File No. 333-184847) filed on January 23, 2013) | |
| 10.64 | Form of ING Group Long-Term Equity Ownership Plan Grant (incorporated by reference to Exhibit 10.57 to the Company’s Amendment No. 1 to Registration Statement on Form S-1 (File No. 333-184847) filed on January 23, 2013) | |
| 10.65 | ING Group Standard Share Option Plan (incorporated by reference to Exhibit 10.58 to the Company’s Amendment No. 1 to Registration Statement on Form S-1 (File No. 333-184847) filed on January 23, 2013) | |
| 10.66 | ING Americas Supplemental Executive Retirement Plan (Amended/Restated December 2011) (incorporated by reference to Exhibit 10.59 to the Company’s Amendment No. 1 to Registration Statement on Form S-1 (File No. 333-184847) filed on January 23, 2013) | |
| 10.67 | ING Americas Retirement Plan (Amended/Restated December 2011) (incorporated by reference to Exhibit 10.60 to the Company’s Amendment No. 1 to Registration Statement on Form S-1 (File No. 333-184847) filed on January 23, 2013) | |
| 10.68 | ING Insurance Americas 409A Deferred Compensation Savings Plan (incorporated by reference to Exhibit 10.61 to the Company’s Amendment No. 1 to Registration Statement on Form S-1 (File No. 333-184847) filed on January 23, 2013) | |
| 10.69 | Amendment No. 1 to ING Insurance Americas 409A Deferred Compensation Savings Plan (Amended/Restated January 1, 2010) (incorporated by reference to Exhibit 10.62 to the Company’s Amendment No. 1 to Registration Statement on Form S-1 (File No. 333-184847) filed on January 23, 2013) | |
| 10.70 | ING Americas Severance Pay Plan (As Amended and Restated Effective as of January 1, 2008) (incorporated by reference to Exhibit 10.63 to the Company’s Amendment No. 1 to Registration Statement on Form S-1 (File No. 333-184847) filed on January 23, 2013) | |
| 10.71 | Amendment No. 1 to ING Americas Severance Pay Plan (Amended/Restated October 1, 2008) (incorporated by reference to Exhibit 10.64 to the Company’s Amendment No. 1 to Registration Statement on Form S-1 (File No. 333-184847) filed on January 23, 2013) | |
| 10.72 | Amendment No. 2 to ING Americas Severance Pay Plan (Amended/Restated June 22, 2009) (incorporated by reference to Exhibit 10.65 to the Company’s Amendment No. 1 to Registration Statement on Form S-1 (File No. 333-184847) filed on January 23, 2013) | |
| 10.73 | Amendment No. 3 to ING Americas Severance Pay Plan (Amended/Restated October 1, 2009) (incorporated by reference to Exhibit 10.66 to the Company’s Amendment No. 1 to Registration Statement on Form S-1 (File No. 333-184847) filed on January 23, 2013) | |
| 10.74 | Amendment No. 4 to ING Americas Severance Pay Plan (Amended/Restated December 1, 2010) (incorporated by reference to Exhibit 10.67 to the Company’s Amendment No. 1 to Registration Statement on Form S-1 (File No. 333-184847) filed on January 23, 2013) | |
Table of Contents
| Exhibit No. |
Description | |
| 10.75 | ING Investment Management—Retention Participation Plan (incorporated by reference to Exhibit 10.68 to the Company’s Amendment No. 1 to Registration Statement on Form S-1 (File No. 333-184847) filed on January 23, 2013) | |
| 10.76 | ING Investment Management, LLC Annual Incentive Plan (incorporated by reference to Exhibit 10.69 to the Company’s Amendment No. 1 to Registration Statement on Form S-1 (File No. 333-184847) filed on January 23, 2013) | |
| 10.77 | ING Investment Management—Deferred Compensation Plan (incorporated by reference to Exhibit 10.70 to the Company’s Amendment No. 1 to Registration Statement on Form S-1 (File No. 333-184847) filed on January 23, 2013) | |
| 10.78 | ING Americas Insurance Holdings, Inc. Equity Compensation Plan (incorporated by reference to Exhibit 10.71 to the Company’s Amendment No. 1 to Registration Statement on Form S-1 (File No. 333-184847) filed on January 23, 2013) | |
| 10.79 | ING Directors’ Pension Scheme (incorporated by reference to Exhibit 10.72 to the Company’s Amendment No. 1 to Registration Statement on Form S-1 (File No. 333-184847) filed on January 23, 2013) | |
| 10.80 | ING International Assignments Long-Term Assignments Policy (incorporated by reference to Exhibit 10.73 to the Company’s Amendment No. 1 to Registration Statement on Form S-1 (File No. 333-184847) filed on January 23, 2013) | |
| 10.81 | Employment Agreement Amendment with Robert G. Leary, dated December 20, 2012 (incorporated by reference to Exhibit 10.76 to the Company’s Amendment No. 2 to Registration Statement on Form S-1 (File No. 333-184847) filed on March 19, 2013) | |
| 10.82 | Equity Administration Agreement, dated as of May 7, 2013 between ING U.S., Inc. and ING Groep N.V. (incorporated by reference to Exhibit 10.3 to the Company’s Current Report on Form 8-K filed on May 7, 2013) | |
| 10.83 | Offer Letter, dated March 28, 2013, between Ewout Steenbergen and ING. U.S., Inc. (incorporated by reference to Exhibit 10.78 to the Company’s Amendment No. 3 to Registration Statement on Form S-1 (File No. 333-184847) filed on April 5, 2013) | |
| 10.84 | Form of ING U.S., Inc. 2013 Omnibus Employee Incentive Plan (incorporated by reference to Exhibit 10.79 to the Company’s Amendment No. 4 to Registration Statement on Form S-1 (No. 333-184847) filed on April 16, 2013) | |
| 10.85 | Form of ING U.S., Inc. 2013 Omnibus Non-Employee Director Incentive Plan (incorporated by reference to Exhibit 10.80 to the Company’s Amendment No. 4 to Registration Statement on Form S-1 (No. 333-184847) filed on April 16, 2013) | |
| 10.86 | Deal Incentive Award Agreement, dated April 30, 2013, between Fred Hubbell, ING Groep, N.V. and ING U.S., Inc. (incorporated by reference to Exhibit 10.22 to the Company’s Quarterly Report on Form 10-Q (File No. 001-35897) filed on August 9, 2013) | |
| 10.87 | Form of 2013 Converted Award Agreement under the ING U.S., Inc. 2013 Omnibus Employee Incentive Plan related to the conversion of deferred shares granted in 2013 as both a mandatory partial deferral of 2012 annual incentive awards and an annual long-term incentive award to “Identified Staff” (as defined by the European Union’s Capital Requirements Directive) pursuant to the ING Group Long-Term Sustainable Performance Plan (incorporated by reference to Exhibit 10.09 to Amendment No. 1 to the Company’s Quarterly Report on Form 10-Q (File No. 001-35897) filed on June 20, 2013) | |
| 10.88 | Form of 2013 Converted Award Agreement under the ING U.S., Inc. 2013 Omnibus Employee Incentive Plan related to the conversion of deferred shares granted in 2013 as mandatory partial deferrals of 2012 long term incentive awards to “Identified Staff” (as defined by the European Union’s Capital Requirements Directive) pursuant to the ING Group Long-Term Sustainable Performance Plan (incorporated by reference to Exhibit 10.10 to Amendment No. 1 of the Company’s Quarterly Report on Form 10-Q (File No. 001-35897) filed on June 20, 2013) | |
Table of Contents
| Exhibit No. |
Description | |
| 10.89 | Form of 2013 Converted Award Agreement under the ING U.S., Inc. 2013 Omnibus Employee Incentive Plan related to the conversion of deferred shares and performance shares granted in 2013 to non-“Identified Staff” (as defined by the European Union’s Capital Requirements Directive) pursuant to the ING Group Long-Term Sustainable Performance Plan (incorporated by reference to Exhibit 10.11 to Amendment No. 1 to the Company’s Quarterly Report on Form 10-Q (File No. 001-35897) filed on June 20, 2013) | |
| 10.90 | Form of 2013 Converted Award Agreement under the ING U.S., Inc. 2013 Omnibus Employee Incentive Plan related to the conversion of performance shares granted in 2013 to non-“Identified Staff” (as defined by the European Union’s Capital Requirements Directive) pursuant to the ING Group Long-Term Sustainable Performance Plan (incorporated by reference to Exhibit 10.12 to Amendment No. 1 to the Company’s Quarterly Report on Form 10-Q (File No. 001-35897) filed on June 20, 2013) | |
| 10.91 | Notice of conversion of restricted stock units granted in 2013 under the ING America Insurance Holdings, Inc. Equity Compensation Plan, as amended, into restricted stock units of ING U.S., Inc. under the 2013 Omnibus Employee Incentive Plan (incorporated by reference to Exhibit 10.13 to Amendment No. 1 to the Company’s Quarterly Report on Form 10-Q (File No. 001-35897) filed on June 20, 2013) | |
| 10.92 | Form of ING U.S., Inc. 2013 Omnibus Non-Employee Director Incentive Plan Restricted Stock Unit Award Agreement (incorporated by reference to Exhibit 10.94 to the Company’s Registration Statement on Form S-1 (File No. 333-191163) filed on September 13, 2013) | |
| 10.93 | Form of ING U.S., Inc. 2013 Omnibus Employee Incentive Plan Award Supplement Providing for Dividend Equivalent Rights (incorporated by reference to Exhibit 10.95 to the Company’s Registration Statement on Form S-1 (File No. 333-191163) filed on September 13, 2013) | |
| 10.94 | Newco Deal Incentive Award Agreement, dated April 30, 2013, between Maliz Beams, ING Groep, N.V. and ING U.S., Inc. (incorporated by reference to Exhibit 10.96 to the Company’s Registration Statement on Form S-1 (File No. 333-191163) filed on September 13, 2013) | |
| 10.95 | Form of 2014 Restricted Stock Unit Award Agreement under the ING U.S., Inc. 2013 Omnibus Employee Incentive Plan (incorporated by reference to Exhibit 10.95 to the Company’s Annual Report on Form 10-K (File No. 001-35897) filed on March 10, 2014) | |
| 10.96 | Share Repurchase Agreement, dated as of March 18, 2014, between the Company and ING Groep N.V. | |
| 21.1 | List of Subsidiaries of ING U.S., Inc. (incorporated by reference to Exhibit 21.1 to the Company’s Annual Report on Form 10-K (File No. 001-35897) filed on March 10, 2014) | |
| 23.1 | Consent of Ernst & Young LLP | |
| 23.2 | Consent of Sullivan & Cromwell LLP (included in Exhibit 5.1) | |
| 24.1 | Power of Attorney* | |
| 101.INS | XBRL Instance Document (1)* | |
| 101.SCH | XBRL Taxonomy Extension Schema* | |
| 101.CAL | XBRL Taxonomy Extension Calculation Linkbase* | |
| 101.DEF | XBRL Taxonomy Extension Definition Linkbase* | |
| 101.LAB | XBRL Taxonomy Extension Label Linkbase* | |
| 101.PRE | XBRL Taxonomy Extension Presentation Linkbase* | |
| * | Previously filed with Registration Statement on Form S-1, filed March 10, 2014. |
| (1) | In accordance with Rule 406T of Regulation S-T, the interactive data files contained in Exhibit 101 to this Form S-1 are furnished and shall not be deemed to be “filed” for purposes of Sections 11 and 12 of the Securities Act, nor will they be deemed filed for purposes of Section 18 of the Exchange Act, or otherwise subject to the liability of such sections. |
Table of Contents
| (b) | Financial Statements Schedules. |
| Number |
Description |
|||||
| I | Summary of Investments Other than Investments in Affiliates | F-161 | ||||
| II | Financial Information of Parent | F-162 | ||||
| III | Supplementary Insurance Information | F-173 | ||||
| IV | Reinsurance | F-175 | ||||
| V | Valuation and Qualifying Accounts | F-176 | ||||
| Item 17. | Undertakings |
The undersigned Registrant hereby undertakes that:
(1) Insofar as indemnification for liabilities arising under the Securities Act of 1933 may be permitted to directors, officers and controlling persons of the registrant pursuant to the foregoing provisions, or otherwise, the registrant has been advised that in the opinion of the Securities and Exchange Commission such indemnification is against public policy as expressed in the Act and is, therefore, unenforceable. In the event that a claim for indemnification against such liabilities (other than the payment by the registrant of expenses incurred or paid by a director, officer, or controlling person of the registrant in the successful defense of any action, suit or proceeding) is asserted by such director, officer or controlling person in connection with the securities being registered hereunder, the registrant will, unless in the opinion of its counsel the matter has been settled by controlling precedent, submit to a court of appropriate jurisdiction the question of whether such indemnification by it is against public policy as expressed in the Act and will be governed by the final adjudication of such issue.
(2) For purposes of determining any liability under the Securities Act, the information omitted from the form of prospectus filed as part of this Registration Statement in reliance upon Rule 430A and contained in a form of prospectus filed by the Registrant pursuant to Rule 424(b)(1) or (4) or 497(h) under the Securities Act shall be deemed to be part of this Registration Statement as of the time it was declared effective.
(3) For the purpose of determining any liability under the Securities Act, each post- effective amendment that contains a form of prospectus shall be deemed to be a new registration statement relating to the securities offered therein, and the offering of such securities at that time shall be deemed to be the initial bona fide offering thereof.
Table of Contents
SIGNATURES
Pursuant to the requirements of the Securities Act of 1933, the Registrant has duly caused this Amendment No. 1 to Registration Statement on Form S-1 to be signed on its behalf by the undersigned, thereunto duly authorized, in the city of New York, on the 18th day of March, 2014.
| ING U.S., INC. | ||||
| By: |
/s/ Rodney O. Martin, Jr. | |||
| Name: | Rodney O. Martin, Jr. | |||
| Title: | Chief Executive Officer | |||
| By: |
/s/ Alain M. Karaoglan | |||
| Name: | Alain M. Karaoglan | |||
| Title: | EVP and Chief Operating Officer | |||
Pursuant to the requirements of the Securities Act of 1933, this Amendment No. 1 to Registration Statement on Form S-1 has been signed by the following persons in the capacities and on the dates indicated:
| Signatures |
Title |
Date | ||
| * Rodney O. Martin, Jr. |
Chairman and Chief Executive Officer (Principal Executive Officer) |
March 18, 2014 | ||
| * Johannes M.M. Boers |
Director |
March 18, 2014 | ||
| * Patrick G. Flynn |
Director |
March 18, 2014 | ||
| * J. Barry Griswell |
Director |
March 18, 2014 | ||
| * Dirk H. Harryvan |
Director |
March 18, 2014 | ||
| * Frederick S. Hubbell |
Director |
March 18, 2014 | ||
| * Hendricus A. Koemans |
Director |
March 18, 2014 | ||
| * Willem F. Nagel |
Director |
March 18, 2014 | ||
| * David Zwiener |
Director |
March 18, 2014 | ||
| * Ewout L. Steenbergen |
Chief Financial Officer (Principal Financial Officer) |
March 18, 2014 | ||
| * Steven T. Pierson |
Chief Accounting Officer (Principal Accounting Officer) |
March 18, 2014 | ||
| *By |
/s/ Bridget M. Healy |
|||||
| Attorney-in-Fact |
||||||