0001534254false2023FY0.50.50.50.33330.666600015342542023-01-012023-12-3100015342542023-06-30iso4217:USD00015342542024-03-06xbrli:shares0001534254cion:SeniorSecuredFirstLienDebtMember2023-12-310001534254cion:InvestmentPortfolioConcentrationMembercion:InvestmentsAtCostAndFairValueMembercion:SeniorSecuredFirstLienDebtMember2023-01-012023-12-31xbrli:pure0001534254cion:SeniorSecuredSecondLienDebtMember2023-12-310001534254cion:InvestmentPortfolioConcentrationMembercion:InvestmentsAtCostAndFairValueMembercion:SeniorSecuredSecondLienDebtMember2023-01-012023-12-310001534254us-gaap:CollateralizedSecuritiesMember2023-12-310001534254cion:InvestmentPortfolioConcentrationMembercion:InvestmentsAtCostAndFairValueMemberus-gaap:CollateralizedSecuritiesMember2023-01-012023-12-310001534254us-gaap:UnsecuredDebtMember2023-12-310001534254cion:InvestmentPortfolioConcentrationMembercion:InvestmentsAtCostAndFairValueMemberus-gaap:UnsecuredDebtMember2023-01-012023-12-310001534254us-gaap:EquitySecuritiesMember2023-12-310001534254cion:InvestmentPortfolioConcentrationMembercion:InvestmentsAtCostAndFairValueMemberus-gaap:EquitySecuritiesMember2023-01-012023-12-310001534254cion:InvestmentsExcludingShortTermInvestmentsMember2023-12-310001534254cion:InvestmentsAtCostAndFairValueMembercion:InvestmentPortfolioConcentrationMember2023-01-012023-12-310001534254us-gaap:ShortTermInvestmentsMember2023-12-3100015342542023-12-3100015342542012-07-022023-12-310001534254cion:PublicStockOfferingMember2012-07-022023-12-310001534254cion:PublicStockOfferingReinvestedShareholderDistributionsMember2012-07-022023-12-3100015342542022-01-012022-03-31iso4217:USDxbrli:shares00015342542022-04-012022-06-3000015342542022-07-012022-09-3000015342542022-10-012022-12-3100015342542022-01-012022-12-3100015342542023-01-012023-03-3100015342542023-04-012023-06-3000015342542023-07-012023-09-3000015342542023-10-012023-12-310001534254cion:CIONEagleTreeNotesMembercion:ETBCMember2023-12-310001534254cion:CIONEagleTreeMember2023-12-310001534254First American Treasury Obligations Fund, Class Z Shares, Short Term Investments2023-12-310001534254us-gaap:ShortTermInvestmentsMember2022-12-310001534254cion:RisksRelatedToOurBusinessAndStructureMember2023-01-012023-12-310001534254cion:RisksRelatedToCIMAndItsAffiliatesMember2023-01-012023-12-310001534254cion:RisksRelatedToBusinessDevelopmentCompaniesMember2023-01-012023-12-310001534254cion:RisksRelatingToOurDebtFinancingsMember2023-01-012023-12-310001534254cion:FederalIncomeTaxRisksMember2023-01-012023-12-310001534254cion:RisksRelatingToAnInvestmentInOurCommonStockMember2023-01-012023-12-310001534254cion:GeneralRiskFactorsMember2023-01-012023-12-3100015342542023-03-0800015342542023-03-082023-03-0800015342542024-01-012024-03-3100015342542023-03-3100015342542023-09-3000015342542022-03-3100015342542022-06-3000015342542022-09-3000015342542022-12-3100015342542021-12-3100015342542021-10-012021-12-310001534254cion:DRPMember2022-01-012022-01-310001534254cion:DRPMember2022-02-012022-02-280001534254cion:DRPMember2022-03-012022-03-310001534254cion:DRPMember2022-04-012022-04-300001534254cion:DRPMember2022-05-012022-05-310001534254cion:DRPMember2022-06-012022-06-300001534254cion:DRPMember2022-07-012022-07-310001534254cion:DRPMember2022-08-012022-08-310001534254cion:DRPMember2022-09-012022-09-300001534254cion:DRPMember2022-10-012022-10-310001534254cion:DRPMember2022-11-012022-11-300001534254cion:DRPMember2022-12-012022-12-310001534254cion:DRPMember2022-01-012022-12-310001534254cion:DRPMember2023-01-012023-01-310001534254cion:DRPMember2023-02-012023-02-280001534254cion:DRPMember2023-03-012023-03-310001534254cion:DRPMember2023-04-012023-04-300001534254cion:DRPMember2023-05-012023-05-310001534254cion:DRPMember2023-06-012023-06-300001534254cion:DRPMember2023-07-012023-07-310001534254cion:DRPMember2023-08-012023-08-310001534254cion:DRPMember2023-09-012023-09-300001534254cion:DRPMember2023-10-012023-10-310001534254cion:DRPMember2023-11-012023-11-300001534254cion:DRPMember2023-12-012023-12-310001534254cion:DRPMember2023-01-012023-12-3100015342542022-01-012022-01-3100015342542022-02-012022-02-2800015342542022-03-012022-03-3100015342542022-04-012022-04-3000015342542022-05-012022-05-3100015342542022-06-012022-06-3000015342542022-07-012022-07-3100015342542022-08-012022-08-3100015342542022-09-012022-09-3000015342542022-10-012022-10-3100015342542022-11-012022-11-3000015342542022-12-012022-12-3100015342542023-01-012023-01-3100015342542023-02-012023-02-2800015342542023-03-012023-03-3100015342542023-04-012023-04-3000015342542023-05-012023-05-3100015342542023-06-012023-06-3000015342542023-07-012023-07-3100015342542023-08-012023-08-3100015342542023-09-012023-09-3000015342542023-10-012023-10-3100015342542023-11-012023-11-3000015342542023-12-012023-12-310001534254us-gaap:SubsequentEventMember2024-03-062024-03-060001534254cion:SeriesANotesMember2023-02-272023-12-310001534254cion:A2027NotesMember2023-11-082023-12-310001534254us-gaap:InvestmentUnaffiliatedIssuerMember2023-12-310001534254us-gaap:InvestmentUnaffiliatedIssuerMember2022-12-310001534254us-gaap:InvestmentAffiliatedIssuerNoncontrolledMember2023-12-310001534254us-gaap:InvestmentAffiliatedIssuerNoncontrolledMember2022-12-310001534254us-gaap:InvestmentAffiliatedIssuerControlledMember2023-12-310001534254us-gaap:InvestmentAffiliatedIssuerControlledMember2022-12-310001534254us-gaap:InvestmentUnaffiliatedIssuerMember2023-01-012023-12-310001534254us-gaap:InvestmentUnaffiliatedIssuerMember2022-01-012022-12-310001534254us-gaap:InvestmentUnaffiliatedIssuerMember2021-01-012021-12-310001534254us-gaap:InvestmentAffiliatedIssuerNoncontrolledMember2023-01-012023-12-310001534254us-gaap:InvestmentAffiliatedIssuerNoncontrolledMember2022-01-012022-12-310001534254us-gaap:InvestmentAffiliatedIssuerNoncontrolledMember2021-01-012021-12-310001534254us-gaap:InvestmentAffiliatedIssuerControlledMember2023-01-012023-12-310001534254us-gaap:InvestmentAffiliatedIssuerControlledMember2022-01-012022-12-310001534254us-gaap:InvestmentAffiliatedIssuerControlledMember2021-01-012021-12-3100015342542021-01-012021-12-3100015342542021-09-212021-09-2100015342542020-12-310001534254Adapt Laser Acquisition, Inc., Senior Secured First Lien Debt, 12/31/2025 Maturity, 12023-12-310001534254Adapt Laser Acquisition, Inc., Senior Secured First Lien Debt, 12/31/2025 Maturity, 22023-12-310001534254Afore Insurance Services, LLC., Senior Secured First Lien Debt, 3/24/2025 Maturity 2023-12-310001534254AHF Parent Holding, Inc., Senior Secured First Lien Debt, 2/1/2028 Maturity2023-12-310001534254Allen Media, LLC, Senior Secured First Lien Debt, 2/10/2027 Maturity2023-12-310001534254ALM Media, LLC, Senior Secured First Lien Debt, 11/25/2024 Maturity2023-12-310001534254AMCP Clean Acquisition Company, LLC, Senior Secured First Lien Debt, 6/15/2025 Maturity2023-12-310001534254AMCP Clean Acquisition Company, LLC, Senior Secured First Lien Debt, 6/15/2025 Maturity, 12023-12-310001534254American Clinical Solutions LLC, Senior Secured First Lien Debt, 6/30/2025 Maturity2023-12-310001534254American Clinical Solutions LLC, Senior Secured First Lien Debt, 3/29/2024 Maturity, 12023-12-310001534254American Health Staffing Group, Inc. Senior Secured First Lien Debt, 11/19/2026 Maturity, 12023-12-310001534254American Health Staffing Group, Inc., Senior Secured First Lien Debt, 11/19/2026 Maturity, 22023-12-310001534254American Teleconferencing Services, Ltd., Senior Secured First Lien Debt, 4/07/2023 Maturity, 12023-12-310001534254American Teleconferencing Services, Ltd., Senior Secured First Lien Debt, 4/07/2023 Maturity, 22023-12-310001534254Ancile Solutions, Inc., Senior Secured First Lien Debt, 6/11/2026 Maturity2023-12-310001534254Anthem Sports & Entertainment Inc., Senior Secured First Lien Debt, 11/15/2026 Maturity, 12023-12-310001534254Anthem Sports & Entertainment Inc., Senior Secured First Lien Debt, 11/15/2026 Maturity, 22023-12-310001534254Anthem Sports & Entertainment Inc., Senior Secured First Lien Debt, 11/15/2026 Maturity, 32023-12-310001534254Appalachian Resource Company, LLC, Senior Secured First Lien Debt, 9/30/2024 Maturity2023-12-310001534254Appalachian Resource Company, LLC, Senior Secured First Lien Debt, 9/15/2024 Maturity2023-12-310001534254Atlas Supply LLC, Senior Secured First Lien Debt, 4/29/2025 Maturity2023-12-310001534254Avalign Holdings, Inc., Senior Secured First Lien Debt, 12/22/2025 Maturity2023-12-310001534254Avison Young (USA) Inc., Senior Secured First Lien Debt, 1/31/2026 Maturity2023-12-310001534254Avison Young (USA) Inc., Senior Secured First Lien Debt, 1/31/2026 Maturity, 12023-12-310001534254BDS Solutions Intermediateco, LLC, Senior Secured First Lien Debt, 2/7/2027 Maturity, 12023-12-310001534254BDS Solutions Intermediateco, LLC, Senior Secured First Lien Debt, 2/7/2027 Maturity, 22023-12-310001534254BDS Solutions Intermediateco, LLC, Senior Secured First Lien Debt, 2/7/2027 Maturity, 32023-12-310001534254Berlitz Holdings, Inc., Senior Secured First Lien Debt, 2/14/2025 Maturity2023-12-310001534254Bradshaw International Parent Corp., Senior Secured First Lien Debt, 10/21/2027 Maturity2023-12-310001534254Bradshaw International Parent Corp., Senior Secured First Lien Debt, 10/21/2026 Maturity2023-12-310001534254Cabi, LLC, Senior Secured First Lien Debt, 2/28/2027 Maturity2023-12-310001534254Carestream Health, Inc., Senior Secured First Lien Debt, 9/30/2027 Maturity2023-12-310001534254Celerity Acquisition Holdings, LLC, Senior Secured First Lien Debt, 5/28/2026 Maturity2023-12-310001534254Cennox, Inc., Senior Secured First Lien Debt, 5/4/2026 Maturity, 12023-12-310001534254Cennox, Inc., Senior Secured First Lien Debt, 5/4/2026 Maturity, 22023-12-310001534254Cennox, Inc., Senior Secured First Lien Debt, 5/4/2026 Maturity, 42023-12-310001534254CION/EagleTree Partners, LLC., Senior Secured First Lien Debt, 12/21/2026 Maturity2023-12-310001534254Community Tree Service, LLC., Senior Secured First Lien Debt, 6/17/2027 Maturity2023-12-310001534254Country Fresh Holdings, LLC., Senior Secured First Lien Debt, 4/30/2024 Maturity, 12023-12-310001534254Country Fresh Holdings, LLC., Senior Secured First Lien Debt, 4/30/2024 Maturity, 22023-12-310001534254Coyote Buyer, LLC., Senior Secured First Lien Debt, 2/6/2025 Maturity, 12023-12-310001534254Coyote Buyer, LLC., Senior Secured First Lien Debt, 8/6/2026 Maturity2023-12-310001534254Coyote Buyer, LLC., Senior Secured First Lien Debt, 2/6/2025 Maturity, 32023-12-310001534254Critical Nurse Staffing, LLC., Senior Secured First Lien Debt, 11/1/2026 Maturity, 12023-12-310001534254Critical Nurse Staffing, LLC., Senior Secured First Lien Debt, 11/1/2026 Maturity, 22023-12-310001534254Critical Nurse Staffing, LLC., Senior Secured First Lien Debt, 11/1/2026 Maturity, 52023-12-310001534254David's Bridal, LLC., Senior Secured First Lien Debt, 12/21/2027 Maturity, 12023-12-310001534254David's Bridal, LLC., Senior Secured First Lien Debt, 12/21/2027 Maturity, 22023-12-310001534254Deluxe Entertainment Services, Inc., Senior Secured First Lien Debt, 3/25/2024 Maturity2023-12-310001534254Dermcare Management, LLC., Senior Secured First Lien Debt, 4/22/2028 Maturity, 12023-12-310001534254Dermcare Management, LLC., Senior Secured First Lien Debt, 4/22/2028 Maturity, 22023-12-310001534254Dermcare Management, LLC., Senior Secured First Lien Debt, 4/22/2028 Maturity, 32023-12-310001534254Dermcare Management, LLC., Senior Secured First Lien Debt, 4/22/2028 Maturity, 42023-12-310001534254Emerald Technologies (U.S.) Acquisitionco, Inc.., Senior Secured First Lien Debt, 12/29/2027 Maturity2023-12-310001534254Entertainment Studios P&A LLC., Senior Secured First Lien Debt, 9/28/2027 Maturity2023-12-310001534254Entertainment Studios P&A LLC., Senior Secured First Lien Debt, 5/18/2037 Maturity2023-12-310001534254ESP Associates, Inc., Senior Secured First Lien Debt, 7/24/2028 Maturity, 12023-12-310001534254ESP Associates, Inc., Senior Secured First Lien Debt, 7/24/2028 Maturity, 22023-12-310001534254Flatworld Intermediate Corp.., Senior Secured First Lien Debt, 10/3/2027 Maturity, 12023-12-310001534254Flatworld Intermediate Corp.., Senior Secured First Lien Debt, 10/3/2027 Maturity, 22023-12-310001534254Fluid Control II Inc., Senior Secured First Lien Debt 8/3/2029 Maturity, 12023-12-310001534254Fluid Control II Inc., Senior Secured First Lien Debt 8/3/2029 Maturity, 22023-12-310001534254FuseFX, LLC., Senior Secured First Lien Debt, 9/30/2026 Maturity2023-12-310001534254Future Pak, LLC., Senior Secured First Lien Debt, 9/22/2026 Maturity2023-12-310001534254Gold Medal Holdings, Inc., Senior Secured First Lien Debt, 3/17/2027 Maturity2023-12-310001534254GSC Technologies Inc., Senior Secured First Lien Debt, 9/30/2025 Maturity, 12023-12-310001534254GSC Technologies Inc., Senior Secured First Lien Debt, 9/30/2025 Maturity, 22023-12-310001534254H.W. Lochner, Inc., Senior Secured First Lien Debt, 7/2/2027 Maturity, 12023-12-310001534254H.W. Lochner, Inc., Senior Secured First Lien Debt, 7/2/2027 Maturity, 22023-12-310001534254H.W. Lochner, Inc., Senior Secured First Lien Debt, 7/2/2027 Maturity, 32023-12-310001534254H.W. Lochner, Inc., Senior Secured First Lien Debt, 7/2/2027 Maturity, 42023-12-310001534254Harland Clarke Holdings Corp., Senior Secured First Lien Debt, 6/16/2026 Maturity2023-12-310001534254Heritage Power, LLC., Senior Secured First Lien Debt, 7/20/2026 Maturity2023-12-310001534254Hilliard, Martinez & Gonzales, LLP., Senior Secured First Lien Debt, 9/16/2024 Maturity2023-12-310001534254Hollander Intermediate LLC., Senior Secured First Lien Debt, 9/19/2026 Maturity2023-12-310001534254Homer City Generation, L.P., Senior Secured First Lien Debt, 4/16/2024 Maturity, 12023-12-310001534254Homer City Generation, L.P., Senior Secured First Lien Debt, 4/16/2024 Maturity, 22023-12-310001534254Homer City Generation, L.P., Senior Secured First Lien Debt, 4/16/2024 Maturity, 32023-12-310001534254Hudson Hospital Opco, LLC., Senior Secured First Lien Debt, 11/4/2023 Maturity2023-12-310001534254HUMC Holdco, LLC., Senior Secured First Lien Debt, 11/4/2023 Maturity2023-12-310001534254HW Acquisition, LLC., Senior Secured First Lien Debt, 9/28/2026 Maturity, 12023-12-310001534254HW Acquisition, LLC., Senior Secured First Lien Debt, 9/28/2026 Maturity, 22023-12-310001534254HW Acquisition, LLC., Senior Secured First Lien Debt, 9/28/2026 Maturity, 32023-12-310001534254ICA Foam Holdings, LLC., Senior Secured First Lien Debt, 11/5/2025 Maturity2023-12-310001534254IJKG Opco LLC., Senior Secured First Lien Debt, 11/4/2023 Maturity2023-12-310001534254Inotiv, Inc., Senior Secured First Lien Debt, 11/5/2026 Maturity2023-12-310001534254Instant Web, LLC., Senior Secured First Lien Debt, 2/25/2027 Maturity, 12023-12-310001534254Instant Web, LLC., Senior Secured First Lien Debt, 2/25/2027 Maturity, 22023-12-310001534254Instant Web, LLC., Senior Secured First Lien Debt, 2/25/2027 Maturity, 32023-12-310001534254Instant Web, LLC., Senior Secured First Lien Debt, 2/25/2027 Maturity, 42023-12-310001534254Instant Web, LLC., Senior Secured First Lien Debt, 2/25/2027 Maturity, 52023-12-310001534254Invincible Boat Company LLC., Senior Secured First Lien Debt, 8/28/2025 Maturity, 12023-12-310001534254Invincible Boat Company LLC., Senior Secured First Lien Debt, 8/28/2025 Maturity, 22023-12-310001534254Invincible Boat Company LLC., Senior Secured First Lien Debt, 8/28/2025 Maturity, 32023-12-310001534254INW Manufacturing, LLC., Senior Secured First Lien Debt, 3/25/2027 Maturity2023-12-310001534254Ironhorse Purchaser, LLC., Senior Secured First Lien Debt, 9/30/2027 Maturity 12023-12-310001534254Ironhorse Purchaser, LLC., Senior Secured First Lien Debt, 9/30/2027 Maturity 22023-12-310001534254Ironhorse Purchaser, LLC., Senior Secured First Lien Debt, 9/30/2027 Maturity 32023-12-310001534254Ironhorse Purchaser, LLC., Senior Secured First Lien Debt, 9/30/2027 Maturity 42023-12-310001534254Isagenix International, LLC., Senior Secured First Lien Debt, 4/14/2028 Maturity2023-12-310001534254Jenny C Acquisition, Inc., Senior Secured First Lien Debt, 10/1/2024 Maturity, 22023-12-310001534254JP Intermediate B, LLC., Senior Secured First Lien Debt, 8/21/2027 Maturity2023-12-310001534254K&N Parent, Inc., Senior Secured First Lien Debt, 8/16/2027 Maturity2023-12-310001534254K&N Parent, Inc., Senior Secured First Lien Debt, 2/16/2027 Maturity2023-12-310001534254Klein Hersh, LLC., Senior Secured First Lien Debt, 4/27/2027 Maturity2023-12-310001534254KNB Holdings Corp., Senior Secured First Lien Debt, 4/26/2024 Maturity2023-12-310001534254LAV Gear Holdings, Inc., Senior Secured First Lien Debt, 10/31/2024 Maturity, 12023-12-310001534254LAV Gear Holdings, Inc., Senior Secured First Lien Debt, 10/31/2024 Maturity, 22023-12-310001534254LGC US Finco, LLC., Senior Secured First Lien Debt, 12/20/2025 Maturity2023-12-310001534254Lift Brands, Inc., Senior Secured First Lien Debt, 6/29/2025 Maturity, 12023-12-310001534254Lift Brands, Inc., Senior Secured First Lien Debt, 6/29/2025 Maturity, 22023-12-310001534254Lift Brands, Inc., Senior Secured First Lien Debt, 6/29/2025 Maturity, 32023-12-310001534254MacNeill Pride Group Corp., Senior Secured First Lien Debt, 4/22/2026 Maturity, 12023-12-310001534254MacNeill Pride Group Corp., Senior Secured First Lien Debt, 4/22/2026 Maturity, 22023-12-310001534254MacNeill Pride Group Corp., Senior Secured First Lien Debt, 4/30/2024 Maturity 2023-12-310001534254Manus Bio Inc., Senior Secured First Lien Debt, 8/20/2026 Maturity2023-12-310001534254Medplast Holdings, Inc.., Senior Secured First Lien Debt, 7/2/2025 Maturity2023-12-310001534254Mimeo.com, Inc., Senior Secured First Lien Debt, 12/21/2024 Maturity, 12023-12-310001534254Mimeo.com, Inc., Senior Secured First Lien Debt, 12/21/2024 Maturity, 22023-12-310001534254Mimeo.com, Inc., Senior Secured First Lien Debt, 12/21/2024 Maturity, 32023-12-310001534254Moss Holding Company., Senior Secured First Lien Debt, 4/17/2024 Maturity, 12023-12-310001534254Moss Holding Company, Senior Secured First Lien Debt, 4/17/2024 Maturity, 22023-12-310001534254Moss Holding Company, Senior Secured First Lien Debt, 4/17/2024 Maturity, 32023-12-310001534254NewsCycle Solutions, Inc., Senior Secured First Lien Debt, 2/27/2024 Maturity2023-12-310001534254Nova Compression, LLC., Senior Secured First Lien Debt, 10/13/2027 Maturity2023-12-310001534254Nova Compression, LLC., Senior Secured First Lien Debt, 10/13/2024 Maturity2023-12-310001534254Nova Compression, LLC., Senior Secured First Lien Debt, 10/13/2027 Maturity, 22023-12-310001534254NTM Acquisition Corp., Senior Secured First Lien Debt, 6/18/2026 Maturity2023-12-310001534254OpCo Borrower, LLC., Senior Secured First Lien Debt, 8/19/2027 Maturity, 12023-12-310001534254OpCo Borrower, LLC., Senior Secured First Lien Debt, 8/19/2027 Maturity, 32023-12-310001534254Optio Rx, LLC., Senior Secured First Lien Debt, 6/28/2028 Maturity, 12023-12-310001534254Optio Rx, LLC., Senior Secured First Lien Debt, 6/28/2028 Maturity, 22023-12-310001534254Pentec Acquisition Corp., Senior Secured First Lien Debt, 10/8/2026 Maturity2023-12-310001534254PH Beauty Holdings III. Inc., Senior Secured First Lien Debt, 9/28/2025 Maturity2023-12-310001534254Playboy Enterprises, Inc., Senior Secured First Lien Debt, 5/25/2027 Maturity2023-12-310001534254PRA Acquisition, LLC, 5/12/2028 Maturity2023-12-310001534254Project Castle, Inc., Senior Secured First Lien Debt, 6/1/2029 Maturity2023-12-310001534254R. R. Donnelley & Sons Company , 3/22/2028 Maturity2023-12-310001534254RA Outdoors, LLC., Senior Secured First Lien Debt, 4/8/2026 Maturity, 12023-12-310001534254RA Outdoors, LLC., Senior Secured First Lien Debt, 4/8/2026 Maturity, 22023-12-310001534254RA Outdoors, LLC., Senior Secured First Lien Debt, 4/8/2026 Maturity, 32023-12-310001534254Retail Services WIS Corp., Senior Secured First Lien Debt, 5/20/2025 Maturity2023-12-310001534254Robert C. Hilliard, L.L.P., Senior Secured First Lien Debt, 12/17/2023 Maturity2023-12-310001534254Rogers Mechanical Contractors, LLC., Senior Secured First Lien Debt, 9/9/2025 Maturity, 12023-12-310001534254Rogers Mechanical Contractors, LLC., Senior Secured First Lien Debt, 9/9/2025 Maturity, 22023-12-310001534254Rogers Mechanical Contractors, LLC., Senior Secured First Lien Debt, 9/9/2025 Maturity, 42023-12-310001534254RumbleOn, Inc., Senior Secured First Lien Debt, 8/31/2026 Maturity, 12023-12-310001534254RumbleOn, Inc., Senior Secured First Lien Debt, 8/31/2026 Maturity, 22023-12-310001534254Securus Technologies Holdings, Inc., Senior Secured First Lien Debt, 11/1/2024 Maturity2023-12-310001534254Sequoia Healthcare Management, LLC., Senior Secured First Lien Debt, 11/4/2023 Maturity2023-12-310001534254Service Compression, LLC., Senior Secured First Lien Debt, 5/6/2027 Maturity, 12023-12-310001534254Service Compression, LLC., Senior Secured First Lien Debt, 5/6/2027 Maturity, 22023-12-310001534254Service Compression, LLC., Senior Secured First Lien Debt, 5/5/2025 Maturity2023-12-310001534254Sleep Opco, LLC., Senior Secured First Lien Debt, 10/12/2026 Maturity, 12023-12-310001534254Sleep Opco, LLC., Senior Secured First Lien Debt, 10/12/2026 Maturity, 22023-12-310001534254Sleep Opco, LLC., Senior Secured First Lien Debt, 10/12/2026 Maturity, 42023-12-310001534254Spinal USA, Inc. / Precision Medical Inc., Senior Secured First Lien Debt, 11/29/2024 Maturity, 12023-12-310001534254Spinal USA, Inc. / Precision Medical Inc., Senior Secured First Lien Debt, 11/29/2024 Maturity, 22023-12-310001534254Spinal USA, Inc. / Precision Medical Inc., Senior Secured First Lien Debt, 11/29/2024 Maturity, 32023-12-310001534254Spinal USA, Inc. / Precision Medical Inc., Senior Secured First Lien Debt, 11/29/2024 Maturity, 42023-12-310001534254Spinal USA, Inc. / Precision Medical Inc., Senior Secured First Lien Debt, 11/29/2024 Maturity, 52023-12-310001534254Spinal USA, Inc. / Precision Medical Inc., Senior Secured First Lien Debt, 11/29/2024 Maturity, 62023-12-310001534254STATinMED, LLC., Senior Secured First Lien Debt, 7/1/2027 Maturity2023-12-310001534254Stengel Hill Architecture, LLC, Senior Secured First Lien Debt, 8/16/2028 Maturity2023-12-310001534254Tactical Air Support, Inc., Senior Secured First Lien Debt, 12/22/2028 Maturity2023-12-310001534254Tactical Air Support, Inc., Senior Secured First Lien Debt, 12/23/2024 Maturity2023-12-310001534254Thrill Holdings LLC., Senior Secured First Lien Debt, 5/27/2027 Maturity, 12023-12-310001534254Thrill Holdings LLC., Senior Secured First Lien Debt, 5/27/2027 Maturity, 22023-12-310001534254Thrill Holdings LLC., Senior Secured First Lien Debt, 5/27/2024 Maturity2023-12-310001534254TMK Hawk Parent, Corp., Senior Secured First Lien Debt, 8/28/2024 Maturity, 12023-12-310001534254TMK Hawk Parent, Corp., Senior Secured First Lien Debt, 8/28/2024 Maturity, 22023-12-310001534254Trademark Global, LLC., Senior Secured First Lien Debt, 7/30/2024 Maturity2023-12-310001534254Trammell, P.C., Senior Secured First Lien Debt, 4/28/2026 Maturity2023-12-310001534254Usalco, LLC., Senior Secured First Lien Debt, 10/19/2027 Maturity2023-12-310001534254Williams Industrial Services Group, Inc., Senior Secured First Lien Debt, 12/16/2025 Maturity, 12023-12-310001534254Williams Industrial Services Group, Inc., Senior Secured First Lien Debt, 12/16/2025 Maturity, 22023-12-310001534254Wok Holdings Inc., Senior Secured First Lien Debt, 3/1/2026 Maturity2023-12-310001534254WorkGenius, Inc., Senior Secured First Lien Debt, 6/7/2027 Maturity, 12023-12-310001534254WorkGenius, Inc., Senior Secured First Lien Debt, 6/7/2027 Maturity, 22023-12-310001534254WorkGenius, Inc., Senior Secured First Lien Debt, 6/7/2027 Maturity, 32023-12-310001534254Xenon Arc, Inc., Senior Secured First Lien Debt, 12/17/2027 Maturity2023-12-310001534254Yak Access, LLC., Senior Secured First Lien Debt, 3/10/2028 Maturity2023-12-310001534254Global Tel*Link Corp., Senior Secured Second Lien Debt, 11/29/2026 Maturity2023-12-310001534254OpCo Borrower, LLC., Senior Secured Second Lien Debt, 2/19/2028 Maturity2023-12-310001534254RA Outdoors, LLC, Senior Secured Second Lien Debt, 10/8/2026 Maturity2023-12-310001534254Securus Technologies Holdings, Inc., Senior Secured Second Lien Debt, 11/1/2025 Maturity2023-12-310001534254TMK Hawk Parent, Corp., Senior Secured Second Lien Debt, 8/26/2025 Maturity2023-12-310001534254cion:CollateralizedSecuritiesAndStructuredProductsEquityMember2023-12-310001534254APIDOS CLO XVI Subordinated Notes., Collateralized Securities and Structured Products - Equity, 1/19/2025 Maturity2023-12-310001534254Galaxy XV CLO Ltd. Class A Subordinated Notes., Collateralized Securities and Structured Products - Equity, 4/15/2025 Maturity2023-12-310001534254Lucky Bucks Holdings LLC., Unsecured Debt, 5/26/2028 Maturity2023-12-310001534254WPLM Acquisition Corp., Unsecured Debt, 11/24/2025 Maturity2023-12-310001534254ARC Financial Partners, LLC, Membership Interests., Equity2023-12-310001534254Ascent Resources - Marcellus, LLC, Membership Units., Equity2023-12-310001534254Carestream Health Holdings Inc., Common Stock, Equity2023-12-310001534254CF Arch Holdings LLC, Class A Units, Equity2023-12-310001534254CION/EagleTree Partners, LLC, Participating Preferred Shares Equity2023-12-310001534254CION/EagleTree Partners, LLC, Membership Units Equity2023-12-310001534254David's Bridal Holdings, LLC, Preferred Units, Equity2023-12-310001534254David's Bridal Holdings, LLC, Common Units, Equity2023-12-310001534254FWS Parent Holdings, LLC, Class A Membership Interests, Equity2023-12-310001534254GSC Technologies Inc., Common Shares., Equity2023-12-310001534254Heritage Litigation Trust, Restricted Stock2023-12-310001534254IPP Buyer Holdings, LLC., Equity2023-12-310001534254Instant Web Holdings, LLC, Class A Common Units., Equity2023-12-310001534254Isagenix Worldwide, Inc. Equity2023-12-310001534254K&N Holdco, LLC, Membership Units, Equity2023-12-310001534254Language Education Holdings GP LLC, Common Units., Equity2023-12-310001534254Language Education Holdings LP, Ordinary Common Units., Equity2023-12-310001534254Longview Intermediate Holdings C, LLC, Membership Units., Equity2023-12-310001534254Macquarie Capital Funding LLC2023-12-310001534254Mount Logan Capital Inc., Common Stock., Equity2023-12-310001534254New Giving Acquisition, Inc., Warrants, Equity, 8/19/2029 Maturity2023-12-310001534254New HW Holdings Corp., Common Stock, Equity2023-12-310001534254NS NWN Acquisition, LLC, Class A Preferred Units., Equity2023-12-310001534254NS NWN Acquisition, LLC, Common Equity, Equity2023-12-310001534254NS NWN Holdco LLC, Non-Voting Units, Equity2023-12-310001534254NSG Co-Invest (Bermuda) LP, Partnership Interests., Equity2023-12-310001534254Palmetto Clean Technology, Inc., Warrants., Equity2023-12-310001534254Reorganized Heritage TopCo, LLC, Common Stock2023-12-310001534254RumbleOn, Inc., Warrants, Equity, 8/14/2028 Maturity2023-12-310001534254Service Compression, LLC, Warrants., Equity2023-12-310001534254Snap Fitness Holdings, Inc., Class A Common Stock., Equity2023-12-310001534254Snap Fitness Holdings, Inc., Warrants., Equity2023-12-310001534254SRA Holdings, LLC, Membership Units, Equity2023-12-310001534254STATinMed Parent, LLC, Class A Preferred Units, Equity2023-12-310001534254STATinMed Parent, LLC, Class B Preferred Units, Equity2023-12-310001534254URS Topco, LLC, Common Equity2023-12-310001534254WorkGenius, LLC, Class A Units., Equity2023-12-310001534254Yak Holding II, LLC, Series A Preferred Units, Equity2023-12-310001534254Yak Holding II, LLC, Series B-1 Preferred Units, Equity2023-12-310001534254Yak Holding II, LLC, Series A Common Units, Equity2023-12-310001534254Afore Insurance Services, LLC, First Lien Term Loan, Non-Controlled, Affiliated Investments2022-12-310001534254Afore Insurance Services, LLC, First Lien Term Loan, Non-Controlled, Affiliated Investments2023-01-012023-12-310001534254Afore Insurance Services, LLC, First Lien Term Loan, Non-Controlled, Affiliated Investments2023-12-310001534254ARC Financial, LLC, Membership Interests, Non-Controlled, Affiliated Investments2022-12-310001534254ARC Financial, LLC, Membership Interests, Non-Controlled, Affiliated Investments2023-01-012023-12-310001534254ARC Financial, LLC, Membership Interests, Non-Controlled, Affiliated Investments2023-12-310001534254Carestream Health, Inc., First Lien Term Loan, Non-Controlled, Affiliated Investments2022-12-310001534254Carestream Health, Inc., First Lien Term Loan, Non-Controlled, Affiliated Investments2023-01-012023-12-310001534254Carestream Health, Inc., First Lien Term Loan, Non-Controlled, Affiliated Investments2023-12-310001534254Carestream, Common Shares, Non-Controlled, Affiliated Investments2022-12-310001534254Carestream, Common Shares, Non-Controlled, Affiliated Investments2023-01-012023-12-310001534254Carestream, Common Shares, Non-Controlled, Affiliated Investments2023-12-310001534254DESG Holdings, Inc., First Lien Term Loan, Non-Controlled, Affiliated Investments2022-12-310001534254DESG Holdings, Inc., First Lien Term Loan, Non-Controlled, Affiliated Investments2023-01-012023-12-310001534254DESG Holdings, Inc., First Lien Term Loan, Non-Controlled, Affiliated Investments2023-12-310001534254GSC Technologies Inc., Incremental Term Loan, Non-Controlled, Affiliated Investments2022-12-310001534254GSC Technologies Inc., Incremental Term Loan, Non-Controlled, Affiliated Investments2023-01-012023-12-310001534254GSC Technologies Inc., Incremental Term Loan, Non-Controlled, Affiliated Investments2023-12-310001534254GSC Technologies Inc., First Lien Term Loan A, Non-Controlled, Affiliated Investments2022-12-310001534254GSC Technologies Inc., First Lien Term Loan A, Non-Controlled, Affiliated Investments2023-01-012023-12-310001534254GSC Technologies Inc., First Lien Term Loan A, Non-Controlled, Affiliated Investments2023-12-310001534254GSC Technologies Inc., First Lien Term Loan B, Non-Controlled, Affiliated Investments2022-12-310001534254GSC Technologies Inc., First Lien Term Loan B, Non-Controlled, Affiliated Investments2023-01-012023-12-310001534254GSC Technologies Inc., First Lien Term Loan B, Non-Controlled, Affiliated Investments2023-12-310001534254GSC Technologies Inc., Common Shares, Non-Controlled, Affiliated Investments2022-12-310001534254GSC Technologies Inc., Common Shares, Non-Controlled, Affiliated Investments2023-01-012023-12-310001534254GSC Technologies Inc., Common Shares, Non-Controlled, Affiliated Investments2023-12-310001534254Instant Web, LLC, Revolving Loan, Non-Controlled, Affiliated Investments2022-12-310001534254Instant Web, LLC, Revolving Loan, Non-Controlled, Affiliated Investments2023-01-012023-12-310001534254Instant Web, LLC, Revolving Loan, Non-Controlled, Affiliated Investments2023-12-310001534254Instant Web, LLC, Priming Term Loan, Non-Controlled, Affiliated Investments2022-12-310001534254Instant Web, LLC, Priming Term Loan, Non-Controlled, Affiliated Investments2023-01-012023-12-310001534254Instant Web, LLC, Priming Term Loan, Non-Controlled, Affiliated Investments2023-12-310001534254Instant Web, LLC, First Lien Term Loan, Non-Controlled, Affiliated Investments2022-12-310001534254Instant Web, LLC, First Lien Term Loan, Non-Controlled, Affiliated Investments2023-01-012023-12-310001534254Instant Web, LLC, First Lien Term Loan, Non-Controlled, Affiliated Investments2023-12-310001534254Instant Web, LLC, First Lien Delayed Draw Term Loan, Non-Controlled, Affiliated Investments2022-12-310001534254Instant Web, LLC, First Lien Delayed Draw Term Loan, Non-Controlled, Affiliated Investments2023-01-012023-12-310001534254Instant Web, LLC, First Lien Delayed Draw Term Loan, Non-Controlled, Affiliated Investments2023-12-310001534254Instant Web Holdings, LLC, Class A Common Units, Non-Controlled, Affiliated Investments2022-12-310001534254Instant Web Holdings, LLC, Class A Common Units, Non-Controlled, Affiliated Investments2023-01-012023-12-310001534254Instant Web Holdings, LLC, Class A Common Units, Non-Controlled, Affiliated Investments2023-12-310001534254IPP Buyer Holdings, LLC2022-12-310001534254IPP Buyer Holdings, LLC2023-01-012023-12-310001534254IPP Buyer Holdings, LLC2023-12-310001534254Isagenix International, LLC, First Lien Term Loan2022-12-310001534254Isagenix International, LLC, First Lien Term Loan2023-01-012023-12-310001534254Isagenix International, LLC, First Lien Term Loan2023-12-310001534254Isagenix Worldwide, Inc.2022-12-310001534254Isagenix Worldwide, Inc.2023-01-012023-12-310001534254Isagenix Worldwide, Inc.2023-12-310001534254Lift Brands, Inc., Term Loan A, Non-Controlled, Affiliated Investments2022-12-310001534254Lift Brands, Inc., Term Loan A, Non-Controlled, Affiliated Investments2023-01-012023-12-310001534254Lift Brands, Inc., Term Loan A, Non-Controlled, Affiliated Investments2023-12-310001534254Lift Brands, Inc., Term Loan B, Non-Controlled, Affiliated Investments2022-12-310001534254Lift Brands, Inc., Term Loan B, Non-Controlled, Affiliated Investments2023-01-012023-12-310001534254Lift Brands, Inc., Term Loan B, Non-Controlled, Affiliated Investments2023-12-310001534254Lift Brands, Inc., Term Loan C, Non-Controlled, Affiliated Investments2022-12-310001534254Lift Brands, Inc., Term Loan C, Non-Controlled, Affiliated Investments2023-01-012023-12-310001534254Lift Brands, Inc., Term Loan C, Non-Controlled, Affiliated Investments2023-12-310001534254Longview Intermediate Holdings C, LLC, Membership Units, Non-Controlled, Affiliated Investments2022-12-310001534254Longview Intermediate Holdings C, LLC, Membership Units, Non-Controlled, Affiliated Investments2023-01-012023-12-310001534254Longview Intermediate Holdings C, LLC, Membership Units, Non-Controlled, Affiliated Investments2023-12-310001534254Longview Power, LLC, First Lien Term Loan, Non-Controlled, Affiliated Investments2022-12-310001534254Longview Power, LLC, First Lien Term Loan, Non-Controlled, Affiliated Investments2023-01-012023-12-310001534254Longview Power, LLC, First Lien Term Loan, Non-Controlled, Affiliated Investments2023-12-310001534254Mount Logan Capital Inc., Common Stock, Non-Controlled, Affiliated Investments2022-12-310001534254Mount Logan Capital Inc., Common Stock, Non-Controlled, Affiliated Investments2023-01-012023-12-310001534254Mount Logan Capital Inc., Common Stock, Non-Controlled, Affiliated Investments2023-12-310001534254Snap Fitness Holdings, Inc., Class A Stock, Non-Controlled, Affiliated Investments2022-12-310001534254Snap Fitness Holdings, Inc., Class A Stock, Non-Controlled, Affiliated Investments2023-01-012023-12-310001534254Snap Fitness Holdings, Inc., Class A Stock, Non-Controlled, Affiliated Investments2023-12-310001534254Snap Fitness Holdings, Inc., Warrants, Non-Controlled, Affiliated Investments2022-12-310001534254Snap Fitness Holdings, Inc., Warrants, Non-Controlled, Affiliated Investments2023-01-012023-12-310001534254Snap Fitness Holdings, Inc., Warrants, Non-Controlled, Affiliated Investments2023-12-310001534254SRA Holdings, LLC, Membership Units, Non-Controlled, Affiliated Investments2022-12-310001534254SRA Holdings, LLC, Membership Units, Non-Controlled, Affiliated Investments2023-01-012023-12-310001534254SRA Holdings, LLC, Membership Units, Non-Controlled, Affiliated Investments2023-12-310001534254STATinMED, LLC, First Lien Term Loan, Non-Controlled, Affiliated Investments2022-12-310001534254STATinMED, LLC, First Lien Term Loan, Non-Controlled, Affiliated Investments2023-01-012023-12-310001534254STATinMED, LLC, First Lien Term Loan, Non-Controlled, Affiliated Investments2023-12-310001534254Delayed Draw First Lien Term Loan, Non-Controlled, Affiliated Investments2022-12-310001534254Delayed Draw First Lien Term Loan, Non-Controlled, Affiliated Investments2023-01-012023-12-310001534254Delayed Draw First Lien Term Loan, Non-Controlled, Affiliated Investments2023-12-310001534254STATinMed Parent, LLC, Class A Preferred Units, Non-Controlled, Affiliated Investments2022-12-310001534254STATinMed Parent, LLC, Class A Preferred Units, Non-Controlled, Affiliated Investments2023-01-012023-12-310001534254STATinMed Parent, LLC, Class A Preferred Units, Non-Controlled, Affiliated Investments2023-12-310001534254STATinMed Parent, LLC, Class B Preferred Units, Non-Controlled, Affiliated Investments2022-12-310001534254STATinMed Parent, LLC, Class B Preferred Units, Non-Controlled, Affiliated Investments2023-01-012023-12-310001534254STATinMed Parent, LLC, Class B Preferred Units, Non-Controlled, Affiliated Investments2023-12-310001534254CION/EagleTree Partners, LLC, Senior Secured Note, Controlled Investments2022-12-310001534254CION/EagleTree Partners, LLC, Senior Secured Note, Controlled Investments2023-01-012023-12-310001534254CION/EagleTree Partners, LLC, Senior Secured Note, Controlled Investments2023-12-310001534254CION/EagleTree Partners, LLC, Participating Preferred Shares, Controlled Investments2022-12-310001534254CION/EagleTree Partners, LLC, Participating Preferred Shares, Controlled Investments2023-01-012023-12-310001534254CION/EagleTree Partners, LLC, Participating Preferred Shares, Controlled Investments2023-12-310001534254CION/EagleTree Partners, LLC, Common Shares, Controlled Investments2022-12-310001534254CION/EagleTree Partners, LLC, Common Shares, Controlled Investments2023-01-012023-12-310001534254CION/EagleTree Partners, LLC, Common Shares, Controlled Investments2023-12-310001534254David's Bridal, Inc., LLC, Exit First Lien Term Loan, Controlled Investments2022-12-310001534254David's Bridal, Inc., LLC, Exit First Lien Term Loan, Controlled Investments2023-01-012023-12-310001534254David's Bridal, Inc., LLC, Exit First Lien Term Loan, Controlled Investments2023-12-310001534254David's Bridal, Inc., LLC, Incremental First Lien Term Loan, Controlled Investments2022-12-310001534254David's Bridal, Inc., LLC, Incremental First Lien Term Loan, Controlled Investments2023-01-012023-12-310001534254David's Bridal, Inc., LLC, Incremental First Lien Term Loan, Controlled Investments2023-12-310001534254David's Bridal Holdings, LLC, LLC, Preferred Units, Controlled Investments2022-12-310001534254David's Bridal Holdings, LLC, LLC, Preferred Units, Controlled Investments2023-01-012023-12-310001534254David's Bridal Holdings, LLC, LLC, Preferred Units, Controlled Investments2023-12-310001534254David's Bridal Holdings, LLC, Common Units, Controlled Investments2022-12-310001534254David's Bridal Holdings, LLC, Common Units, Controlled Investments2023-01-012023-12-310001534254David's Bridal Holdings, LLC, Common Units, Controlled Investments2023-12-310001534254American Clinical Solutions LLC, Senior Secured First Lien Debt2023-12-310001534254Anthem Sports & Entertainment Inc., Senior Secured First Lien Debt2023-12-310001534254Celerity Acquisition Holdings, LLC, Senior Secured First Lien Debt2023-12-310001534254Cennox, Inc., Senior Secured First Lien Debt2023-12-310001534254CION/EagleTree Partners, LLC, Senior Secured Note2023-12-310001534254Community Tree Service, LLC, Senior Secured First Lien Debt2023-12-310001534254Deluxe Entertainment Services, Inc., Senior Secured First Lien Debt2023-12-310001534254FuseFX, LLC, Senior Secured First Lien Debt2023-12-310001534254GSC Technologies Inc., Senior Secured First Lien Debt2023-12-310001534254Hilliard, Martinez & Gonzales, LLP, Senior Secured First Lien Debt2023-12-310001534254Homer City Generation, L.P., Senior Secured First Lien Debt 12023-12-310001534254Homer City Generation, L.P., Senior Secured First Lien Debt 22023-12-310001534254Inotiv, Inc., Senior Secured First Lien Debt2023-12-310001534254Instant Web, LLC, Senior Secured First Lien Debt 2023-12-310001534254Isagenix International, LLC, Senior Secured First Lien Debt2023-12-310001534254K&N Parent, Inc., Senior Secured First Lien Debt2023-12-310001534254Klein Hersh , LLC, Senior Secured First Lien Debt2023-12-310001534254Lift Brands, Inc., Senior Secured First Lien Debt2023-12-310001534254Lucky Bucks Holdings LLC, Unsecured Note2023-12-310001534254Nova Compression, LLC, Senior Secured First Lien Debt2023-12-310001534254Playboy Enterprises, Inc., Senior Secured First Lien Debt2023-12-310001534254Robert C. Hilliard, L.L.P., Senior Secured First Lien Debt2023-12-310001534254RumbleOn, Inc., Senior Secured First Lien Debt2023-12-310001534254Securus Technologies Holdings, Inc., Senior Secured First Lien Debt2023-12-310001534254Securus Technologies Holdings, Inc., Senior Secured Second Lien Debt2023-12-310001534254Service Compression, LLC, Senior Secured First Lien Debt2023-12-310001534254Spinal USA, Inc. / Precision Medical Inc., Senior Secured First Lien Debt2023-12-310001534254STATinMED, LLC, Senior Secured First Lien Debt2023-12-310001534254Trademark Global, LLC, Senior Secured First Lien Debt2023-12-310001534254Trammell, P.C., Senior Secured First Lien Debt2023-12-310001534254Williams Industrial Services Group, Inc., Senior Secured First Lien Debt2023-12-310001534254WPLM Acquisition Corp., Unsecured Note2023-12-310001534254cion:SeniorSecuredFirstLienDebtMember2022-12-310001534254Adapt Laser Acquisition, Inc., Senior Secured First Lien Debt, 12/31/2023 Maturity, 12022-12-310001534254Adapt Laser Acquisition, Inc., Senior Secured First Lien Debt, 12/31/2023 Maturity, 22022-12-310001534254AHF Parent Holding, Inc., Senior Secured First Lien Debt, 2/1/2028 Maturity2022-12-310001534254Allen Media, LLC, Senior Secured First Lien Debt, 2/10/2027 Maturity2022-12-310001534254ALM Media, LLC 1, Senior Secured First Lien Debt, 11/25/2024 Maturity2022-12-310001534254ALM Media, LLC, Senior Secured First Lien Debt, 11/25/2024 Maturity2022-12-310001534254American Clinical Solutions LLC, Senior Secured First Lien Debt, 12/31/2024 Maturity2022-12-310001534254American Consolidated Natural Resources, Inc., Senior Secured First Lien Debt, 9/16/2025 Maturity2022-12-310001534254American Health Staffing Group, Inc. Senior Secured First Lien Debt, 11/19/2026 Maturity, 22022-12-310001534254American Health Staffing Group, Inc., Senior Secured First Lien Debt, 11/19/2026 Maturity, 12022-12-310001534254American Teleconferencing Services, Ltd., Senior Secured First Lien Debt, 1/31/23 Maturity, 12022-12-310001534254American Teleconferencing Services, Ltd. Senior Secured First Lien Debt, 1/31/23 Maturity, 22022-12-310001534254Analogic Corp., Senior Secured First Lien Debt, 6/21/2024 Maturity2022-12-310001534254Ancile Solutions, Inc., Senior Secured First Lien Debt, 6/11/2026 Maturity2022-12-310001534254Anthem Sports & Entertainment Inc., Senior Secured First Lien Debt, 11/15/2026 Maturity, 12022-12-310001534254Anthem Sports & Entertainment Inc., Senior Secured First Lien Debt, 11/15/2026 Maturity, 22022-12-310001534254Anthem Sports & Entertainment Inc., Senior Secured First Lien Debt, 11/15/2026 Maturity, 32022-12-310001534254Appalachian Resource Company, LLC, Senior Secured First Lien Debt, 9/10/2023 Maturity, 12022-12-310001534254Appalachian Resource Company, LLC, Senior Secured First Lien Debt, 9/10/2023 Maturity, 22022-12-310001534254Archer Systems, LLC, Senior Secured First Lien Debt, 8/11/2027 Maturity, 12022-12-310001534254Archer Systems, LLC, Senior Secured First Lien Debt, 8/11/2027 Maturity, 22022-12-310001534254Associated Asphalt Partners, LLC, Senior Secured First Lien Debt, 4/5/2024 Maturity2022-12-310001534254Atlas Supply LLC, Senior Secured First Lien Debt, 4/29/2025 Maturity2022-12-310001534254Avison Young (USA) Inc., Senior Secured First Lien Debt, 1/31/2026 Maturity2022-12-310001534254BDS Solutions Intermediateco, LLC, Senior Secured First Lien Debt, 2/7/2027 Maturity, 12022-12-310001534254BDS Solutions Intermediateco, LLC, Senior Secured First Lien Debt, 2/7/2027 Maturity, 22022-12-310001534254BDS Solutions Intermediateco, LLC, Senior Secured First Lien Debt, 2/7/2027 Maturity, 32022-12-310001534254Berlitz Holdings, Inc., Senior Secured First Lien Debt, 2/14/2025 Maturity2022-12-310001534254Bradshaw International Parent Corp., Senior Secured First Lien Debt, 10/21/2027 Maturity, 12022-12-310001534254Bradshaw International Parent Corp., Senior Secured First Lien Debt, 10/21/2026 Maturity, 22022-12-310001534254Cabi, LLC, Senior Secured First Lien Debt, 2/28/2027 Maturity2022-12-310001534254Cadence Aerospace, LLC, Senior Secured First Lien Debt, 11/14/2023 Maturity2022-12-310001534254Carestream Health, Inc., Senior Secured First Lien Debt, 9/30/2027 Maturity2022-12-310001534254CB URS Holdings Corp., Senior Secured First Lien Debt, 9/1/2024 Maturity2022-12-310001534254Celerity Acquisition Holdings, LLC, Senior Secured First Lien Debt, 5/28/2026 Maturity2022-12-310001534254Cennox, Inc., Senior Secured First Lien Debt, 5/4/2026 Maturity, 12022-12-310001534254Cennox, Inc., Senior Secured First Lien Debt, 5/4/2026 Maturity, 22022-12-310001534254Cennox, Inc., Senior Secured First Lien Debt, 5/4/2026 Maturity, 32022-12-310001534254Cennox, Inc., Senior Secured First Lien Debt, 8/11/2023 Maturity2022-12-310001534254Cennox, Inc., Senior Secured First Lien Debt, 5/4/2026 Maturity, 42022-12-310001534254CION/EagleTree Partners, LLC., Senior Secured First Lien Debt, 12/21/2026 Maturity2022-12-310001534254CircusTrix Holdings, LLC., Senior Secured First Lien Debt, 1/16/2024 Maturity, 12022-12-310001534254CircusTrix Holdings, LLC., Senior Secured First Lien Debt, 1/16/2024 Maturity, 22022-12-310001534254CircusTrix Holdings, LLC., Senior Secured First Lien Debt, 7/16/2023 Maturity2022-12-310001534254Community Tree Service, LLC., Senior Secured First Lien Debt, 6/17/2027 Maturity2022-12-310001534254Country Fresh Holdings, LLC., Senior Secured First Lien Debt, 4/29/2023 Maturity, 12022-12-310001534254Country Fresh Holdings, LLC., Senior Secured First Lien Debt, 4/29/2023 Maturity, 22022-12-310001534254Coyote Buyer, LLC., Senior Secured First Lien Debt, 2/6/2025 Maturity, 12022-12-310001534254Coyote Buyer, LLC., Senior Secured First Lien Debt, 8/6/2026 Maturity2022-12-310001534254Coyote Buyer, LLC., Senior Secured First Lien Debt, 2/6/2025 Maturity, 22022-12-310001534254Critical Nurse Staffing, LLC., Senior Secured First Lien Debt, 11/1/2026 Maturity, 12022-12-310001534254Critical Nurse Staffing, LLC., Senior Secured First Lien Debt, 11/1/2026 Maturity, 22022-12-310001534254Critical Nurse Staffing, LLC., Senior Secured First Lien Debt, 11/1/2026 Maturity, 32022-12-310001534254Critical Nurse Staffing, LLC., Senior Secured First Lien Debt, 11/1/2026 Maturity, 42022-12-310001534254Critical Nurse Staffing, LLC., Senior Secured First Lien Debt, 11/1/2026 Maturity, 52022-12-310001534254David's Bridal, LLC., Senior Secured First Lien Debt, 5/23/2024 Maturity, 12022-12-310001534254David's Bridal, LLC., Senior Secured First Lien Debt, 5/23/2024 Maturity, 22022-12-310001534254David's Bridal, LLC., Senior Secured First Lien Debt, 12/23/2024 Maturity2022-12-310001534254David's Bridal, LLC., Senior Secured First Lien Debt, 12/31/2024 Maturity2022-12-310001534254Deluxe Entertainment Services, Inc., Senior Secured First Lien Debt, 3/25/2024 Maturity2022-12-310001534254Dermcare Management, LLC., Senior Secured First Lien Debt, 4/22/2028 Maturity, 12022-12-310001534254Dermcare Management, LLC., Senior Secured First Lien Debt, 4/22/2028 Maturity, 22022-12-310001534254Dermcare Management, LLC., Senior Secured First Lien Debt, 4/22/2028 Maturity, 32022-12-310001534254Dermcare Management, LLC., Senior Secured First Lien Debt, 10/22/2023 Maturity2022-12-310001534254Dermcare Management, LLC., Senior Secured First Lien Debt, 4/22/2028 Maturity, 52022-12-310001534254DMT Solutions Global Corp., Senior Secured First Lien Debt, 7/2/2024 Maturity2022-12-310001534254Emerald Technologies (U.S.) Acquisitionco, Inc.., Senior Secured First Lien Debt, 12/29/2027 Maturity2022-12-310001534254Entertainment Studios P&A LLC., Senior Secured First Lien Debt, 9/28/2027 Maturity2022-12-310001534254Entertainment Studios P&A LLC., Senior Secured First Lien Debt, 5/18/2037 Maturity2022-12-310001534254Flatworld Intermediate Corp., Senior Secured First Lien Debt, 10/3/2027 Maturity, 12022-12-310001534254Flatworld Intermediate Corp., Senior Secured First Lien Debt, 10/3/2027 Maturity, 22022-12-310001534254FuseFX, LLC., Senior Secured First Lien Debt, 10/1/2024 Maturity2022-12-310001534254Fusion Connect Inc., Senior Secured First Lien Debt, 1/18/2027 Maturity2022-12-310001534254Future Pak, LLC., Senior Secured First Lien Debt, 7/2/2024 Maturity2022-12-310001534254Gold Medal Holdings, Inc., Senior Secured First Lien Debt, 3/17/2027 Maturity2022-12-310001534254GSC Technologies Inc., Senior Secured First Lien Debt, 9/30/2025 Maturity, 12022-12-310001534254GSC Technologies Inc., Senior Secured First Lien Debt, 9/30/2025 Maturity, 22022-12-310001534254GSC Technologies Inc., Senior Secured First Lien Debt, 9/30/2025 Maturity, 32022-12-310001534254H.W. Lochner, Inc., Senior Secured First Lien Debt, 7/2/2027 Maturity, 12022-12-310001534254H.W. Lochner, Inc., Senior Secured First Lien Debt, 7/2/2027 Maturity, 22022-12-310001534254H.W. Lochner, Inc., Senior Secured First Lien Debt, 7/2/2027 Maturity, 32022-12-310001534254H.W. Lochner, Inc., Senior Secured First Lien Debt, 7/2/2027 Maturity, 42022-12-310001534254Harland Clarke Holdings Corp., Senior Secured First Lien Debt, 6/16/2026 Maturity2022-12-310001534254Heritage Power, LLC., Senior Secured First Lien Debt, 7/30/2026 Maturity2022-12-310001534254Hilliard, Martinez & Gonzales, LLP., Senior Secured First Lien Debt, 12/17/2023 Maturity2022-12-310001534254Hollander Intermediate LLC., Senior Secured First Lien Debt, 9/19/2026 Maturity2022-12-310001534254Homer City Generation, L.P., Senior Secured First Lien Debt, 4/5/2023 Maturity, 12022-12-310001534254Homer City Generation, L.P., Senior Secured First Lien Debt, 5/31/2023 Maturity2022-12-310001534254Homer City Generation, L.P., Senior Secured First Lien Debt, 1/29/2023 Maturity2022-12-310001534254Hudson Hospital Opco, LLC, Senior Secured First Lien Debt, 11/4/2024 Maturity2022-12-310001534254HUMC Holdco, LLC., Senior Secured First Lien Debt, 11/4/2023 Maturity2022-12-310001534254HW Acquisition, LLC., Senior Secured First Lien Debt, 9/28/2026 Maturity, 12022-12-310001534254HW Acquisition, LLC., Senior Secured First Lien Debt, 9/28/2026 Maturity, 22022-12-310001534254HW Acquisition, LLC., Senior Secured First Lien Debt, 9/28/2026 Maturity, 32022-12-310001534254ICA Foam Holdings, LLC, Senior Secured First Lien Debt, 11/5/2025 Maturity2022-12-310001534254IJKG Opco LLC, Senior Secured First Lien Debt, 11/4/2023 Maturity2022-12-310001534254Independent Pet Partners Intermediate Holdings, LLC., Senior Secured First Lien Debt, 11/20/2023 Maturity2022-12-310001534254Independent Pet Partners Intermediate Holdings, LLC., Senior Secured First Lien Debt, 2/27/2023 Maturity, 12022-12-310001534254Independent Pet Partners Intermediate Holdings, LLC., Senior Secured First Lien Debt, 2/27/2023 Maturity, 22022-12-310001534254Independent Pet Partners Intermediate Holdings, LLC., Senior Secured First Lien Debt, 2/27/2023 Maturity, 32022-12-310001534254Infogroup Inc., Senior Secured First Lien Debt, 4/3/2023 Maturity2022-12-310001534254Inotiv, Inc., Senior Secured First Lien Debt, 11/5/2026 Maturity, 12022-12-310001534254Instant Web, LLC., Senior Secured First Lien Debt, 2/25/2027 Maturity, 12022-12-310001534254Instant Web, LLC., Senior Secured First Lien Debt, 2/25/2027 Maturity, 22022-12-310001534254Instant Web, LLC., Senior Secured First Lien Debt, 2/25/2027 Maturity, 32022-12-310001534254Instant Web, LLC., Senior Secured First Lien Debt, 2/25/2027 Maturity, 42022-12-310001534254Instant Web, LLC., Senior Secured First Lien Debt, 2/25/2027 Maturity, 52022-12-310001534254Invincible Boat Company LLC., Senior Secured First Lien Debt, 8/28/2025 Maturity, 12022-12-310001534254Invincible Boat Company LLC., Senior Secured First Lien Debt, 8/28/2025 Maturity, 22022-12-310001534254Invincible Boat Company LLC., Senior Secured First Lien Debt, 8/28/2025 Maturity, 32022-12-310001534254INW Manufacturing, LLC., Senior Secured First Lien Debt, 3/25/2027 Maturity2022-12-310001534254Ironhorse Purchaser, LLC, Senior Secured First Lien Debt, 9/30/2027 Maturity 12022-12-310001534254Ironhorse Purchaser, LLC, Senior Secured First Lien Debt, 9/30/2027 Maturity 22022-12-310001534254Ironhorse Purchaser, LLC, Senior Secured First Lien Debt, 9/30/2027 Maturity 32022-12-310001534254Ironhorse Purchaser, LLC, Senior Secured First Lien Debt, 9/30/2024 Maturity 2022-12-310001534254Isagenix International, LLC., Senior Secured First Lien Debt, 6/14/2025 Maturity2022-12-310001534254Jenny C Acquisition, Inc., Senior Secured First Lien Debt, 10/1/2024 Maturity2022-12-310001534254JP Intermediate B, LLC., Senior Secured First Lien Debt, 11/20/2025 Maturity2022-12-310001534254K&N Parent, Inc., Senior Secured First Lien Debt, 10/20/2023 Maturity 2022-12-310001534254K&N Parent, Inc., Senior Secured First Lien Debt, 2/15/2023 Maturity 2022-12-310001534254Klein Hersh, LLC., Senior Secured First Lien Debt, 4/27/2027 Maturity2022-12-310001534254KNB Holdings Corp., Senior Secured First Lien Debt, 4/26/2024 Maturity2022-12-310001534254LaserAway Intermediate Holdings II, LLC., Senior Secured First Lien Debt, 10/12/2027 Maturity2022-12-310001534254LAV Gear Holdings, Inc., Senior Secured First Lien Debt, 10/31/2024 Maturity, 12022-12-310001534254LAV Gear Holdings, Inc., Senior Secured First Lien Debt, 10/31/2024 Maturity, 22022-12-310001534254LGC US Finco, LLC., Senior Secured First Lien Debt, 12/20/2025 Maturity2022-12-310001534254Lift Brands, Inc., Senior Secured First Lien Debt, 6/29/2025 Maturity, 12022-12-310001534254Lift Brands, Inc., Senior Secured First Lien Debt, 6/29/2025 Maturity, 22022-12-310001534254Lift Brands, Inc., Senior Secured First Lien Debt, 6/29/2025 Maturity, 32022-12-310001534254Longview Power, LLC., Senior Secured First Lien Debt, 7/30/2025 Maturity2022-12-310001534254MacNeill Pride Group Corp., Senior Secured First Lien Debt, 4/22/2026 Maturity, 12022-12-310001534254MacNeill Pride Group Corp., Senior Secured First Lien Debt, 4/22/2026 Maturity, 22022-12-310001534254MacNeill Pride Group Corp., Senior Secured First Lien Debt, 4/30/2024 Maturity2022-12-310001534254Manus Bio Inc., Senior Secured First Lien Debt, 8/20/2026 Maturity2022-12-310001534254Marble Point Credit Management LLC., Senior Secured First Lien Debt, 8/11/2028 Maturity, 12022-12-310001534254Marble Point Credit Management LLC., Senior Secured First Lien Debt, 8/11/2028 Maturity, 22022-12-310001534254Mimeo.com, Inc., Senior Secured First Lien Debt, 12/21/2024 Maturity, 12022-12-310001534254Mimeo.com, Inc., Senior Secured First Lien Debt, 12/21/2024 Maturity, 22022-12-310001534254Mimeo.com, Inc., Senior Secured First Lien Debt, 12/21/2024 Maturity, 32022-12-310001534254Moss Holding Company., Senior Secured First Lien Debt, 4/17/2024 Maturity, 12022-12-310001534254Moss Holding Company, Senior Secured First Lien Debt, 4/17/2024 Maturity, 22022-12-310001534254Moss Holding Company, Senior Secured First Lien Debt, 4/17/2024 Maturity, 32022-12-310001534254Neptune Flood Inc., Senior Secured First Lien Debt, 10/21/2026 Maturity2022-12-310001534254NewsCycle Solutions, Inc., Senior Secured First Lien Debt, 12/29/2023 Maturity2022-12-310001534254NWN Parent Holdings LLC., Senior Secured First Lien Debt, 5/7/2026 Maturity, 12022-12-310001534254NWN Parent Holdings LLC., Senior Secured First Lien Debt, 5/7/2026 Maturity, 22022-12-310001534254NWN Parent Holdings LLC., Senior Secured First Lien Debt, 5/7/2026 Maturity, 32022-12-310001534254OpCo Borrower, LLC., Senior Secured First Lien Debt, 8/19/2027 Maturity, 12022-12-310001534254OpCo Borrower, LLC., Senior Secured First Lien Debt, 8/19/2027 Maturity, 22022-12-310001534254OpCo Borrower, LLC., Senior Secured First Lien Debt, 8/19/2027 Maturity, 32022-12-310001534254Optio Rx, LLC., Senior Secured First Lien Debt, 6/28/2024 Maturity, 12022-12-310001534254Optio Rx, LLC., Senior Secured First Lien Debt, 6/28/2024 Maturity, 22022-12-310001534254Pentec Acquisition Corp., Senior Secured First Lien Debt, 10/8/2026 Maturity2022-12-310001534254PH Beauty Holdings III. Inc., Senior Secured First Lien Debt, 9/28/2025 Maturity2022-12-310001534254Playboy Enterprises, Inc., Senior Secured First Lien Debt, 5/25/2027 Maturity2022-12-310001534254Project Castle, Inc., Senior Secured First Lien Debt, 6/1/2029 Maturity2022-12-310001534254RA Outdoors, LLC., Senior Secured First Lien Debt, 4/8/2026 Maturity, 12022-12-310001534254RA Outdoors, LLC., Senior Secured First Lien Debt, 4/8/2026 Maturity, 22022-12-310001534254Retail Services WIS Corp., Senior Secured First Lien Debt, 5/20/2025 Maturity2022-12-310001534254Robert C. Hilliard, L.L.P., Senior Secured First Lien Debt, 12/17/2023 Maturity2022-12-310001534254Rogers Mechanical Contractors, LLC., Senior Secured First Lien Debt, 9/9/2025 Maturity, 12022-12-310001534254Rogers Mechanical Contractors, LLC., Senior Secured First Lien Debt, 9/9/2025 Maturity, 22022-12-310001534254Rogers Mechanical Contractors, LLC., Senior Secured First Lien Debt, 4/28/2023 Maturity2022-12-310001534254Rogers Mechanical Contractors, LLC., Senior Secured First Lien Debt, 9/9/2025 Maturity 32022-12-310001534254RumbleOn, Inc., Senior Secured First Lien Debt, 8/31/2026 Maturity, 12022-12-310001534254RumbleOn, Inc., Senior Secured First Lien Debt, 8/31/2026 Maturity, 22022-12-310001534254RumbleOn, Inc., Senior Secured First Lien Debt, 2/28/2023 Maturity2022-12-310001534254Securus Technologies Holdings, Inc., Senior Secured First Lien Debt, 11/1/2024 Maturity2022-12-310001534254Sequoia Healthcare Management, LLC., Senior Secured First Lien Debt, 11/4/2023 Maturity2022-12-310001534254Service Compression, LLC., Senior Secured First Lien Debt, 5/6/2027 Maturity, 12022-12-310001534254Service Compression, LLC., Senior Secured First Lien Debt, 5/6/2027 Maturity, 22022-12-310001534254Service Compression, LLC., Senior Secured First Lien Debt, 5/6/2025 Maturity, 32022-12-310001534254Sleep Opco, LLC., Senior Secured First Lien Debt, 10/12/2026 Maturity, 12022-12-310001534254Sleep Opco, LLC., Senior Secured First Lien Debt, 10/12/2026 Maturity, 22022-12-310001534254Spinal USA, Inc. / Precision Medical Inc., Senior Secured First Lien Debt, 5/29/2023 Maturity, 12022-12-310001534254Spinal USA, Inc. / Precision Medical Inc., Senior Secured First Lien Debt, 5/29/2023 Maturity, 22022-12-310001534254Spinal USA, Inc. / Precision Medical Inc., Senior Secured First Lien Debt, 5/29/2023 Maturity, 32022-12-310001534254Spinal USA, Inc. / Precision Medical Inc., Senior Secured First Lien Debt, 5/29/2023 Maturity, 42022-12-310001534254Spinal USA, Inc. / Precision Medical Inc., Senior Secured First Lien Debt, 5/29/2023 Maturity, 52022-12-310001534254STATinMED, LLC., Senior Secured First Lien Debt, 7/1/2027 Maturity 12022-12-310001534254STATinMED, LLC., Senior Secured First Lien Debt, 3/31/2023 Maturity 22022-12-310001534254STATinMED, LLC., Senior Secured First Lien Debt, 3/31/2023 Maturity 32022-12-310001534254Thrill Holdings LLC., Senior Secured First Lien Debt, 5/27/2027 Maturity, 12022-12-310001534254Thrill Holdings LLC., Senior Secured First Lien Debt, 5/27/2024 Maturity2022-12-310001534254Thrill Holdings LLC., Senior Secured First Lien Debt, 5/27/2027 Maturity, 22022-12-310001534254Trademark Global, LLC., Senior Secured First Lien Debt, 7/30/2024 Maturity, 12022-12-310001534254Trammell, P.C., Senior Secured First Lien Debt, 4/28/2026 Maturity2022-12-310001534254Usalco, LLC., Senior Secured First Lien Debt, 10/19/2027 Maturity2022-12-310001534254Vesta Holdings, LLC., Senior Secured First Lien Debt, 2/25/2024 Maturity 12022-12-310001534254Vesta Holdings, LLC., Senior Secured First Lien Debt, 3/12/2023 Maturity 2022-12-310001534254Vesta Holdings, LLC., Senior Secured First Lien Debt, 2/25/2024 Maturity 22022-12-310001534254Volta Charging, LLC., Senior Secured First Lien Debt, 6/19/2024 Maturity, 12022-12-310001534254Volta Charging, LLC., Senior Secured First Lien Debt, 6/19/2024 Maturity, 22022-12-310001534254Williams Industrial Services Group, Inc., Senior Secured First Lien Debt, 12/16/2025 Maturity2022-12-310001534254Wok Holdings Inc., Senior Secured First Lien Debt, 3/1/2026 Maturity2022-12-310001534254WorkGenius, Inc., Senior Secured First Lien Debt, 6/7/2027 Maturity 12022-12-310001534254WorkGenius, Inc., Senior Secured First Lien Debt, 6/7/2027 Maturity 22022-12-310001534254Xenon Arc, Inc., Senior Secured First Lien Debt, 12/17/2027 Maturity2022-12-310001534254Yak Access, LLC., Senior Secured First Lien Debt, 7/11/2025 Maturity2022-12-310001534254cion:SeniorSecuredSecondLienDebtMember2022-12-310001534254Global Tel*Link Corp., Senior Secured Second Lien Debt, 11/29/2026 Maturity2022-12-310001534254OpCo Borrower, LLC., Senior Secured Second Lien Debt, 2/19/2028 Maturity2022-12-310001534254RA Outdoors, LLC., Senior Secured Second Lien Debt, 10/8/2026 Maturity2022-12-310001534254Securus Technologies Holdings, Inc., Senior Secured Second Lien Debt, 11/1/2025 Maturity2022-12-310001534254TMK Hawk Parent, Corp., Senior Secured Second Lien Debt, 8/28/2025 Maturity2022-12-310001534254cion:CollateralizedSecuritiesAndStructuredProductsEquityMember2022-12-310001534254APIDOS CLO XVI Subordinated Notes., Collateralized Securities and Structured Products - Equity, 1/19/2025 Maturity2022-12-310001534254Galaxy XV CLO Ltd. Class A Subordinated Notes., Collateralized Securities and Structured Products - Equity, 4/15/2025 Maturity2022-12-310001534254us-gaap:UnsecuredDebtMember2022-12-310001534254Lucky Bucks Holdings LLC., Unsecured Debt, 5/29/2028 Maturity2022-12-310001534254WPLM Acquisition Corp., Unsecured Debt, 11/24/2025 Maturity2022-12-310001534254us-gaap:EquitySecuritiesMember2022-12-310001534254ARC Financial Partners, LLC., Equity2022-12-310001534254ARC Financial Partners, LLC, Membership Interests., Equity2022-12-310001534254Ascent Resources - Marcellus, LLC, Membership Units., Equity2022-12-310001534254Ascent Resources - Marcellus, LLC, Warrants., Equity2022-12-310001534254Carestream Health Holdings Inc., Common Stock, Equity Securities2022-12-310001534254CF Arch Holdings LLC, Class A Units, Equity2022-12-310001534254CION/EagleTree Partners, LLC, Participating Preferred Shares Equity2022-12-310001534254CION/EagleTree Partners, LLC, Membership Units Equity2022-12-310001534254DBI Investors, Inc., Series A1 Preferred Stock., Equity2022-12-310001534254DBI Investors, Inc., Series A2 Preferred Stock., Equity2022-12-310001534254DBI Investors, Inc., Series A Preferred Stock., Equity2022-12-310001534254DBI Investors, Inc., Series B Preferred Stock., Equity2022-12-310001534254DBI Investors, Inc., Common Stock., Equity2022-12-310001534254DBI Investors, Inc., Reallocation Rights., Equity2022-12-310001534254FWS Parent Holdings, LLC. Class A Membership Interests, Equity2022-12-310001534254GSC Technologies Inc., Common Shares., Equity2022-12-310001534254Independent Pet Partners Intermediate Holdings, LLC, Class A Preferred Units., Equity2022-12-310001534254Independent Pet Partners Intermediate Holdings, LLC, Class B-2 Preferred Units., Equity2022-12-310001534254Independent Pet Partners Intermediate Holdings, LLC, Class C Preferred Units., Equity,2022-12-310001534254Independent Pet Partners Intermediate Holdings, LLC, Warrants., Equity2022-12-310001534254Instant Web Holdings, LLC, Class A Common Units., Equity2022-12-310001534254Language Education Holdings GP LLC, Common Units., Equity2022-12-310001534254Language Education Holdings LP, Ordinary Common Units., Equity2022-12-310001534254Longview Intermediate Holdings C, LLC, Membership Units., Equity2022-12-310001534254Mount Logan Capital Inc., Common Stock., Equity2022-12-310001534254New Giving Acquisition, Inc., Warrants, Equity2022-12-310001534254NS NWN Acquisition, LLC, Class A Preferred Units., Equity2022-12-310001534254NS NWN Acquisition, LLC, Common Equity, Equity2022-12-310001534254NS NWN Holdco LLC, Non-Voting Units., Equity2022-12-310001534254NSG Co-Invest (Bermuda) LP, Partnership Interests., Equity2022-12-310001534254Palmetto Clean Technology, Inc., Warrants., Equity2022-12-310001534254RumbleOn, Inc., Warrants., Equity2022-12-310001534254Service Compression, LLC, Warrants., Equity2022-12-310001534254Snap Fitness Holdings, Inc., Class A Common Stock., Equity2022-12-310001534254Snap Fitness Holdings, Inc., Warrants., Equity2022-12-310001534254SIMR Parent, LLC, Class A Common Units., Equity2022-12-310001534254SIMR Parent, LLC, Class B Common Units., Equity2022-12-310001534254WorkGenius, LLC, Class A Units., Equity2022-12-310001534254First American Treasury Obligations Fund., Short Term Investments2022-12-310001534254ARC Financial, LLC, Membership Interests, Non-Controlled, Affiliated Investments2021-12-310001534254ARC Financial, LLC, Membership Interests, Non-Controlled, Affiliated Investments2022-01-012022-12-310001534254Berlitz Holdings, Inc., First Lien Term Loan, Non-Controlled, Affiliated Investments2021-12-310001534254Berlitz Holdings, Inc., First Lien Term Loan, Non-Controlled, Affiliated Investments2022-01-012022-12-310001534254Berlitz Holdings, Inc., First Lien Term Loan, Non-Controlled, Affiliated Investments2022-12-310001534254Carestream Health, Inc., First Lien Term Loan, Non-Controlled, Affiliated Investments2021-12-310001534254Carestream Health, Inc., First Lien Term Loan, Non-Controlled, Affiliated Investments2022-01-012022-12-310001534254Carestream, Common Shares, Non-Controlled, Affiliated Investments2021-12-310001534254Carestream, Common Shares, Non-Controlled, Affiliated Investments2022-01-012022-12-310001534254Charming Charlie, LLC, Vendor Payment Financing Facility, Non-Controlled, Affiliated Investments2021-12-310001534254Charming Charlie, LLC, Vendor Payment Financing Facility, Non-Controlled, Affiliated Investments2022-01-012022-12-310001534254Charming Charlie, LLC, Vendor Payment Financing Facility, Non-Controlled, Affiliated Investments2022-12-310001534254DESG Holdings, Inc., First Lien Term Loan, Non-Controlled, Affiliated Investments2021-12-310001534254DESG Holdings, Inc., First Lien Term Loan, Non-Controlled, Affiliated Investments2022-01-012022-12-310001534254DESG Holdings, Inc., Second Lien Term Loan, Non-Controlled, Affiliated Investments2021-12-310001534254DESG Holdings, Inc., Second Lien Term Loan, Non-Controlled, Affiliated Investments2022-01-012022-12-310001534254DESG Holdings, Inc., Second Lien Term Loan, Non-Controlled, Affiliated Investments2022-12-310001534254GSC Technologies Inc., Incremental Term Loan, Non-Controlled, Affiliated Investments2021-12-310001534254GSC Technologies Inc., Incremental Term Loan, Non-Controlled, Affiliated Investments2022-01-012022-12-310001534254GSC Technologies Inc., First Lien Term Loan A, Non-Controlled, Affiliated Investments2021-12-310001534254GSC Technologies Inc., First Lien Term Loan A, Non-Controlled, Affiliated Investments2022-01-012022-12-310001534254GSC Technologies Inc., First Lien Term Loan B, Non-Controlled, Affiliated Investments2021-12-310001534254GSC Technologies Inc., First Lien Term Loan B, Non-Controlled, Affiliated Investments2022-01-012022-12-310001534254GSC Technologies Inc., Common Shares, Non-Controlled, Affiliated Investments2021-12-310001534254GSC Technologies Inc., Common Shares, Non-Controlled, Affiliated Investments2022-01-012022-12-310001534254Instant Web Holdings, LLC, Class A Common Units, Non-Controlled, Affiliated Investments2021-12-310001534254Instant Web Holdings, LLC, Class A Common Units, Non-Controlled, Affiliated Investments2022-01-012022-12-310001534254Instant Web, LLC, Revolving Loan, Non-Controlled, Affiliated Investments2021-12-310001534254Instant Web, LLC, Revolving Loan, Non-Controlled, Affiliated Investments2022-01-012022-12-310001534254Instant Web, LLC, Priming Term Loan, Non-Controlled, Affiliated Investments2021-12-310001534254Instant Web, LLC, Priming Term Loan, Non-Controlled, Affiliated Investments2022-01-012022-12-310001534254Instant Web, LLC, First Lien Term Loan, Non-Controlled, Affiliated Investments2021-12-310001534254Instant Web, LLC, First Lien Term Loan, Non-Controlled, Affiliated Investments2022-01-012022-12-310001534254Instant Web, LLC, First Lien Delayed Draw Term Loan, Non-Controlled, Affiliated Investments2021-12-310001534254Instant Web, LLC, First Lien Delayed Draw Term Loan, Non-Controlled, Affiliated Investments2022-01-012022-12-310001534254Language Education Holdings GP LLC, Common Units, Non-Controlled, Affiliated Investments2021-12-310001534254Language Education Holdings GP LLC, Common Units, Non-Controlled, Affiliated Investments2022-01-012022-12-310001534254Language Education Holdings GP LLC, Common Units, Non-Controlled, Affiliated Investments2022-12-310001534254Language Education Holdings LP, Ordinary Common Units, Non-Controlled, Affiliated Investments2021-12-310001534254Language Education Holdings LP, Ordinary Common Units, Non-Controlled, Affiliated Investments2022-01-012022-12-310001534254Language Education Holdings LP, Ordinary Common Units, Non-Controlled, Affiliated Investments2022-12-310001534254Lift Brands, Inc., Term Loan A, Non-Controlled, Affiliated Investments2021-12-310001534254Lift Brands, Inc., Term Loan A, Non-Controlled, Affiliated Investments2022-01-012022-12-310001534254Lift Brands, Inc., Term Loan B, Non-Controlled, Affiliated Investments2021-12-310001534254Lift Brands, Inc., Term Loan B, Non-Controlled, Affiliated Investments2022-01-012022-12-310001534254Lift Brands, Inc., Term Loan C, Non-Controlled, Affiliated Investments2021-12-310001534254Lift Brands, Inc., Term Loan C, Non-Controlled, Affiliated Investments2022-01-012022-12-310001534254Longview Intermediate Holdings C, LLC, Membership Units, Non-Controlled, Affiliated Investments2021-12-310001534254Longview Intermediate Holdings C, LLC, Membership Units, Non-Controlled, Affiliated Investments2022-01-012022-12-310001534254Longview Power, LLC, First Lien Term Loan, Non-Controlled, Affiliated Investments2021-12-310001534254Longview Power, LLC, First Lien Term Loan, Non-Controlled, Affiliated Investments2022-01-012022-12-310001534254Mount Logan Capital Inc., Common Stock, Non-Controlled, Affiliated Investments2021-12-310001534254Mount Logan Capital Inc., Common Stock, Non-Controlled, Affiliated Investments2022-01-012022-12-310001534254SIMR, LLC, First Lien Term Loan, Non-Controlled, Affiliated Investments2021-12-310001534254SIMR, LLC, First Lien Term Loan, Non-Controlled, Affiliated Investments2022-01-012022-12-310001534254SIMR, LLC, First Lien Term Loan, Non-Controlled, Affiliated Investments2022-12-310001534254SIMR Parent, LLC, Class B Membership Units, Non-Controlled, Affiliated Investments2021-12-310001534254SIMR Parent, LLC, Class B Membership Units, Non-Controlled, Affiliated Investments2022-01-012022-12-310001534254SIMR Parent, LLC, Class B Membership Units, Non-Controlled, Affiliated Investments2022-12-310001534254SIMR Parent, LLC, Class W Membership Units, Non-Controlled, Affiliated Investments2021-12-310001534254SIMR Parent, LLC, Class W Membership Units, Non-Controlled, Affiliated Investments2022-01-012022-12-310001534254SIMR Parent, LLC, Class W Membership Units, Non-Controlled, Affiliated Investments2022-12-310001534254Snap Fitness Holdings, Inc., Class A Stock, Non-Controlled, Affiliated Investments2021-12-310001534254Snap Fitness Holdings, Inc., Class A Stock, Non-Controlled, Affiliated Investments2022-01-012022-12-310001534254Snap Fitness Holdings, Inc., Warrants, Non-Controlled, Affiliated Investments2021-12-310001534254Snap Fitness Holdings, Inc., Warrants, Non-Controlled, Affiliated Investments2022-01-012022-12-310001534254STATinMED, LLC, First Lien Term Loan, Non-Controlled, Affiliated Investments2021-12-310001534254STATinMED, LLC, First Lien Term Loan, Non-Controlled, Affiliated Investments2022-01-012022-12-310001534254STATinMED, LLC, Delayed Draw First Lien Term Loan, Non-Controlled, Affiliated Investments2021-12-310001534254STATinMED, LLC, Delayed Draw First Lien Term Loan, Non-Controlled, Affiliated Investments2022-01-012022-12-310001534254STATinMED, LLC, Delayed Draw First Lien Term Loan, Non-Controlled, Affiliated Investments2022-12-310001534254STATinMed Parent, LLC, Class A Preferred Units, Non-Controlled, Affiliated Investments2021-12-310001534254STATinMed Parent, LLC, Class A Preferred Units, Non-Controlled, Affiliated Investments2022-01-012022-12-310001534254STATinMed Parent, LLC, Class B Preferred Units, Non-Controlled, Affiliated Investments2021-12-310001534254STATinMed Parent, LLC, Class B Preferred Units, Non-Controlled, Affiliated Investments2022-01-012022-12-310001534254Non-Controlled, Affiliated Investments2021-12-310001534254Non-Controlled, Affiliated Investments2022-01-012022-12-310001534254Non-Controlled, Affiliated Investments2022-12-310001534254CION/EagleTree Partners, LLC, Senior Secured Note, Controlled Investments2021-12-310001534254CION/EagleTree Partners, LLC, Senior Secured Note, Controlled Investments2022-01-012022-12-310001534254CION/EagleTree Partners, LLC, Participating Preferred Shares, Controlled Investments2021-12-310001534254CION/EagleTree Partners, LLC, Participating Preferred Shares, Controlled Investments2022-01-012022-12-310001534254CION/EagleTree Partners, LLC, Common Shares, Controlled Investments2021-12-310001534254CION/EagleTree Partners, LLC, Common Shares, Controlled Investments2022-01-012022-12-310001534254Controlled Investments2021-12-310001534254Controlled Investments2022-01-012022-12-310001534254Controlled Investments2022-12-310001534254Adapt Laser Acquisition, Inc., Senior Secured First Lien Debt2022-12-310001534254American Clinical Solutions LLC, Senior Secured First Lien Debt2022-12-310001534254American Consolidated Natural Resources, Inc., Senior Secured First Lien Debt2022-12-310001534254Ancile Solutions, Inc., Senior Secured First Lien Debt2022-12-310001534254Anthem Sports & Entertainment Inc., Senior Secured First Lien Debt2022-12-310001534254Cadence Aerospace, LLC, Senior Secured First Lien Debt2022-12-310001534254CION/EagleTree Partners, LLC, Senior Secured Note2022-12-310001534254David's Bridal, LLC 1, Senior Secured First Lien Debt2022-12-310001534254David's Bridal, LLC 2, Senior Secured First Lien Debt2022-12-310001534254Deluxe Entertainment Services, Inc., Senior Secured First Lien Debt2022-12-310001534254Fusion Connect Inc., Senior Secured First Lien Debt2022-12-310001534254GSC Technologies Inc., 1, Senior Secured First Lien Debt2022-12-310001534254GSC Technologies Inc., 2, Senior Secured First Lien Debt2022-12-310001534254Hilliard, Martinez & Gonzales, LLP, Senior Secured First Lien Debt2022-12-310001534254Homer City Generation, L.P., Senior Secured First Lien Debt2022-12-310001534254Independent Pet Partners Intermediate Holdings, LLC, 1, Senior Secured First Lien Debt2022-12-310001534254Independent Pet Partners Intermediate Holdings, LLC, 2, Senior Secured First Lien Debt2022-12-310001534254Independent Pet Partners Intermediate Holdings, LLC, 3, Senior Secured First Lien Debt2022-12-310001534254Independent Pet Partners Intermediate Holdings, LLC 4, Senior Secured First Lien Debt2022-12-310001534254Instant Web, LLC, Senior Secured First Lien Debt2022-12-310001534254Lucky Bucks Holdings LLC, Unsecured Note2022-12-310001534254Robert C. Hilliard, L.L.P., Senior Secured First Lien Debt2022-12-310001534254Rogers Mechanical Contractors, LLC, Senior Secured First Lien Debt2022-12-310001534254Service Compression, LLC, Senior Secured First Lien Debt2022-12-310001534254Spinal USA, Inc. / Precision Medical Inc., Senior Secured First Lien Debt2022-12-310001534254STATinMED, LLC 1, Senior Secured First Lien Debt2022-12-310001534254STATinMED, LLC 2, Senior Secured First Lien Debt2022-12-310001534254Trademark Global, LLC, Senior Secured First Lien Debt2022-12-310001534254Trammell, P.C., Senior Secured First Lien Debt2022-12-310001534254Vesta Holdings, LLC, Senior Secured First Lien Debt2022-12-310001534254Williams Industrial Services Group, Inc., Senior Secured First Lien Debt2022-12-310001534254WPLM Acquisition Corp., Unsecured Note2022-12-310001534254DMT Solutions Global Corp., Senior Secured First Lien Debt, 7/2/2024 Maturity, 1 Month LIBOR2022-12-310001534254DMT Solutions Global Corp., Senior Secured First Lien Debt, 7/2/2024 Maturity, 3 Month LIBOR2022-12-3100015342542012-12-172012-12-1700015342542021-04-052021-04-050001534254cion:CIONInvestmentGroupLLCMembercion:CIONInvestmentManagementLLCMember2017-07-110001534254cion:CIONInvestmentManagementLLCMembercion:ApolloInvestmentManagementLPMember2017-07-1100015342542021-10-042021-10-0400015342542021-10-052021-10-0500015342542023-09-152023-09-1500015342542021-09-2000015342542021-09-2100015342542021-10-05utr:D00015342542021-09-1500015342542022-06-240001534254us-gaap:SubsequentEventMember2024-01-012024-03-060001534254cion:CIMManagementFeeMember2023-01-012023-12-310001534254cion:CIMManagementFeeMember2022-01-012022-12-310001534254cion:CIMManagementFeeMember2021-01-012021-12-310001534254cion:CIMIncentiveFeeMember2023-01-012023-12-310001534254cion:CIMIncentiveFeeMember2022-01-012022-12-310001534254cion:CIMIncentiveFeeMember2021-01-012021-12-310001534254cion:CIMAdministrativeServiceExpenseMember2023-01-012023-12-310001534254cion:CIMAdministrativeServiceExpenseMember2022-01-012022-12-310001534254cion:CIMAdministrativeServiceExpenseMember2021-01-012021-12-310001534254cion:ApolloInvestmentAdministrationTransactionCostsMember2023-01-012023-12-310001534254cion:ApolloInvestmentAdministrationTransactionCostsMember2022-01-012022-12-310001534254cion:ApolloInvestmentAdministrationTransactionCostsMember2021-01-012021-12-310001534254cion:InvestmentAdvisoryAgreementAnnualBaseManagementFeeMember2023-08-072023-08-070001534254cion:InvestmentAdvisoryAgreementAnnualBaseManagementFeeMember2021-10-052021-10-050001534254cion:InvestmentAdvisoryAgreementAssetCoverageRatioMember2021-10-052021-10-050001534254cion:InvestmentAdvisoryAgreementAnnualBaseManagementFeeStepDownMember2021-10-052021-10-050001534254cion:InvestmentAdvisoryAgreementAssetCoverageRatioMember2021-12-312021-12-310001534254cion:InvestmentAdvisoryAgreementHurdleRatePerQuarterMember2021-08-102021-08-100001534254cion:InvestmentAdvisoryAgreementHurdleRatePerYearMember2021-08-102021-08-100001534254cion:InvestmentAdvisoryAgreementPreIncentiveFeeUpToThresholdMember2021-08-102021-08-100001534254cion:InvestmentAdvisoryFeeHurdleRateThresholdMember2021-08-102021-08-100001534254cion:InvestmentAdvisoryAgreementPreIncentiveFeeAfterThresholdMember2021-08-102021-08-100001534254cion:InvestmentAdvisoryAgreementSecondAmendmentHurdleRatePerQuarterMember2021-08-102021-08-100001534254cion:InvestmentAdvisoryAgreementSecondAmendmentHurdleRatePerYearMember2021-08-102021-08-100001534254cion:InvestmentAdvisoryAgreementSecondAmendmentPreIncentiveFeeUpToThresholdMember2021-08-102021-08-100001534254cion:InvestmentAdvisoryFeeSecondAmendmentHurdleRateThresholdMember2021-08-102021-08-100001534254cion:InvestmentAdvisoryAgreementSecondAmendmentPreIncentiveFeeAfterThresholdMember2021-08-102021-08-1000015342542019-01-012019-01-010001534254cion:ExpenseSupportAndConditionalReimbursementAgreementMember2018-01-022018-01-020001534254cion:InvestmentAdvisoryAgreementMember2023-01-012023-12-310001534254cion:InvestmentAdvisoryAgreementMember2022-01-012022-12-3100015342542021-01-012021-03-3100015342542021-04-012021-06-3000015342542021-07-012021-09-300001534254us-gaap:SubsequentEventMember2024-03-112024-03-110001534254cion:InvestmentPortfolioConcentrationMembercion:InvestmentsAtCostAndFairValueMembercion:SeniorSecuredFirstLienDebtMember2022-01-012022-12-310001534254cion:InvestmentPortfolioConcentrationMembercion:InvestmentsAtCostAndFairValueMembercion:SeniorSecuredSecondLienDebtMember2022-01-012022-12-310001534254us-gaap:CollateralizedSecuritiesMember2022-12-310001534254cion:InvestmentPortfolioConcentrationMembercion:InvestmentsAtCostAndFairValueMemberus-gaap:CollateralizedSecuritiesMember2022-01-012022-12-310001534254cion:InvestmentPortfolioConcentrationMembercion:InvestmentsAtCostAndFairValueMemberus-gaap:UnsecuredDebtMember2022-01-012022-12-310001534254cion:InvestmentPortfolioConcentrationMembercion:InvestmentsAtCostAndFairValueMemberus-gaap:EquitySecuritiesMember2022-01-012022-12-310001534254cion:InvestmentsExcludingShortTermInvestmentsMember2022-12-310001534254cion:InvestmentsAtCostAndFairValueMembercion:InvestmentPortfolioConcentrationMember2022-01-012022-12-310001534254cion:ServicesBusinessMember2023-12-310001534254cion:ServicesBusinessMembercion:IndustryConcentrationRiskMembercion:InvestmentsAtFairValueMember2023-01-012023-12-310001534254cion:ServicesBusinessMember2022-12-310001534254cion:ServicesBusinessMembercion:IndustryConcentrationRiskMembercion:InvestmentsAtFairValueMember2022-01-012022-12-310001534254cion:HealthcarePharmaceuticalsMember2023-12-310001534254cion:HealthcarePharmaceuticalsMembercion:IndustryConcentrationRiskMembercion:InvestmentsAtFairValueMember2023-01-012023-12-310001534254cion:HealthcarePharmaceuticalsMember2022-12-310001534254cion:HealthcarePharmaceuticalsMembercion:IndustryConcentrationRiskMembercion:InvestmentsAtFairValueMember2022-01-012022-12-310001534254cion:MediaDiversifiedProductionMember2023-12-310001534254cion:MediaDiversifiedProductionMembercion:IndustryConcentrationRiskMembercion:InvestmentsAtFairValueMember2023-01-012023-12-310001534254cion:MediaDiversifiedProductionMember2022-12-310001534254cion:MediaDiversifiedProductionMembercion:IndustryConcentrationRiskMembercion:InvestmentsAtFairValueMember2022-01-012022-12-310001534254cion:RetailsMember2023-12-310001534254cion:IndustryConcentrationRiskMembercion:InvestmentsAtFairValueMembercion:RetailsMember2023-01-012023-12-310001534254cion:RetailsMember2022-12-310001534254cion:IndustryConcentrationRiskMembercion:InvestmentsAtFairValueMembercion:RetailsMember2022-01-012022-12-310001534254cion:MediaAdvertisingPrintingPublishingMember2023-12-310001534254cion:IndustryConcentrationRiskMembercion:InvestmentsAtFairValueMembercion:MediaAdvertisingPrintingPublishingMember2023-01-012023-12-310001534254cion:MediaAdvertisingPrintingPublishingMember2022-12-310001534254cion:IndustryConcentrationRiskMembercion:InvestmentsAtFairValueMembercion:MediaAdvertisingPrintingPublishingMember2022-01-012022-12-310001534254cion:ServicesConsumerMember2023-12-310001534254cion:IndustryConcentrationRiskMembercion:InvestmentsAtFairValueMembercion:ServicesConsumerMember2023-01-012023-12-310001534254cion:ServicesConsumerMember2022-12-310001534254cion:IndustryConcentrationRiskMembercion:InvestmentsAtFairValueMembercion:ServicesConsumerMember2022-01-012022-12-310001534254cion:EnergyOilGasMember2023-12-310001534254cion:IndustryConcentrationRiskMembercion:InvestmentsAtFairValueMembercion:EnergyOilGasMember2023-01-012023-12-310001534254cion:EnergyOilGasMember2022-12-310001534254cion:IndustryConcentrationRiskMembercion:InvestmentsAtFairValueMembercion:EnergyOilGasMember2022-01-012022-12-310001534254cion:ConstructionBuildingMember2023-12-310001534254cion:ConstructionBuildingMembercion:IndustryConcentrationRiskMembercion:InvestmentsAtFairValueMember2023-01-012023-12-310001534254cion:ConstructionBuildingMember2022-12-310001534254cion:ConstructionBuildingMembercion:IndustryConcentrationRiskMembercion:InvestmentsAtFairValueMember2022-01-012022-12-310001534254cion:DiversifiedFinancialsMember2023-12-310001534254cion:IndustryConcentrationRiskMembercion:InvestmentsAtFairValueMembercion:DiversifiedFinancialsMember2023-01-012023-12-310001534254cion:DiversifiedFinancialsMember2022-12-310001534254cion:IndustryConcentrationRiskMembercion:InvestmentsAtFairValueMembercion:DiversifiedFinancialsMember2022-01-012022-12-310001534254cion:ChemicalsPlasticsRubberMember2023-12-310001534254cion:IndustryConcentrationRiskMembercion:InvestmentsAtFairValueMembercion:ChemicalsPlasticsRubberMember2023-01-012023-12-310001534254cion:ChemicalsPlasticsRubberMember2022-12-310001534254cion:IndustryConcentrationRiskMembercion:InvestmentsAtFairValueMembercion:ChemicalsPlasticsRubberMember2022-01-012022-12-310001534254cion:BeverageFoodTobaccoMember2023-12-310001534254cion:BeverageFoodTobaccoMembercion:IndustryConcentrationRiskMembercion:InvestmentsAtFairValueMember2023-01-012023-12-310001534254cion:BeverageFoodTobaccoMember2022-12-310001534254cion:BeverageFoodTobaccoMembercion:IndustryConcentrationRiskMembercion:InvestmentsAtFairValueMember2022-01-012022-12-310001534254cion:ConsumerGoodsDurableMember2023-12-310001534254cion:ConsumerGoodsDurableMembercion:IndustryConcentrationRiskMembercion:InvestmentsAtFairValueMember2023-01-012023-12-310001534254cion:ConsumerGoodsDurableMember2022-12-310001534254cion:ConsumerGoodsDurableMembercion:IndustryConcentrationRiskMembercion:InvestmentsAtFairValueMember2022-01-012022-12-310001534254cion:BankingFinanceInsuranceRealEstateMember2023-12-310001534254cion:BankingFinanceInsuranceRealEstateMembercion:IndustryConcentrationRiskMembercion:InvestmentsAtFairValueMember2023-01-012023-12-310001534254cion:BankingFinanceInsuranceRealEstateMember2022-12-310001534254cion:BankingFinanceInsuranceRealEstateMembercion:IndustryConcentrationRiskMembercion:InvestmentsAtFairValueMember2022-01-012022-12-310001534254cion:HotelGamingLeisureMember2023-12-310001534254cion:HotelGamingLeisureMembercion:IndustryConcentrationRiskMembercion:InvestmentsAtFairValueMember2023-01-012023-12-310001534254cion:HotelGamingLeisureMember2022-12-310001534254cion:HotelGamingLeisureMembercion:IndustryConcentrationRiskMembercion:InvestmentsAtFairValueMember2022-01-012022-12-310001534254cion:CapitalEquipmentMember2023-12-310001534254cion:CapitalEquipmentMembercion:IndustryConcentrationRiskMembercion:InvestmentsAtFairValueMember2023-01-012023-12-310001534254cion:CapitalEquipmentMember2022-12-310001534254cion:CapitalEquipmentMembercion:IndustryConcentrationRiskMembercion:InvestmentsAtFairValueMember2022-01-012022-12-310001534254cion:ConsumerGoodsNonDurableMember2023-12-310001534254cion:IndustryConcentrationRiskMembercion:InvestmentsAtFairValueMembercion:ConsumerGoodsNonDurableMember2023-01-012023-12-310001534254cion:ConsumerGoodsNonDurableMember2022-12-310001534254cion:IndustryConcentrationRiskMembercion:InvestmentsAtFairValueMembercion:ConsumerGoodsNonDurableMember2022-01-012022-12-310001534254cion:HighTechIndustriesMember2023-12-310001534254cion:IndustryConcentrationRiskMembercion:InvestmentsAtFairValueMembercion:HighTechIndustriesMember2023-01-012023-12-310001534254cion:HighTechIndustriesMember2022-12-310001534254cion:IndustryConcentrationRiskMembercion:InvestmentsAtFairValueMembercion:HighTechIndustriesMember2022-01-012022-12-310001534254cion:ContainersPackagingGlassMember2023-12-310001534254cion:IndustryConcentrationRiskMembercion:InvestmentsAtFairValueMembercion:ContainersPackagingGlassMember2023-01-012023-12-310001534254cion:ContainersPackagingGlassMember2022-12-310001534254cion:IndustryConcentrationRiskMembercion:InvestmentsAtFairValueMembercion:ContainersPackagingGlassMember2022-01-012022-12-310001534254cion:TelecommunicationsMember2023-12-310001534254cion:IndustryConcentrationRiskMembercion:InvestmentsAtFairValueMembercion:TelecommunicationsMember2023-01-012023-12-310001534254cion:TelecommunicationsMember2022-12-310001534254cion:IndustryConcentrationRiskMembercion:InvestmentsAtFairValueMembercion:TelecommunicationsMember2022-01-012022-12-310001534254cion:EnvironmentalIndustriesMember2023-12-310001534254cion:IndustryConcentrationRiskMembercion:InvestmentsAtFairValueMembercion:EnvironmentalIndustriesMember2023-01-012023-12-310001534254cion:EnvironmentalIndustriesMember2022-12-310001534254cion:IndustryConcentrationRiskMembercion:InvestmentsAtFairValueMembercion:EnvironmentalIndustriesMember2023-01-012023-03-310001534254cion:MetalsMiningMember2023-12-310001534254cion:IndustryConcentrationRiskMembercion:InvestmentsAtFairValueMembercion:MetalsMiningMember2023-01-012023-12-310001534254cion:MetalsMiningMember2022-12-310001534254cion:IndustryConcentrationRiskMembercion:InvestmentsAtFairValueMembercion:MetalsMiningMember2022-01-012022-12-310001534254cion:AutomotiveMember2023-12-310001534254cion:IndustryConcentrationRiskMembercion:InvestmentsAtFairValueMembercion:AutomotiveMember2023-01-012023-12-310001534254cion:AutomotiveMember2022-12-310001534254cion:IndustryConcentrationRiskMembercion:InvestmentsAtFairValueMembercion:AutomotiveMember2022-01-012022-12-310001534254cion:TransportationCargoMember2023-12-310001534254cion:IndustryConcentrationRiskMembercion:InvestmentsAtFairValueMembercion:TransportationCargoMember2023-01-012023-12-310001534254cion:TransportationCargoMember2022-12-310001534254cion:IndustryConcentrationRiskMembercion:InvestmentsAtFairValueMembercion:TransportationCargoMember2022-01-012022-12-310001534254cion:AerospaceDefenseMember2023-12-310001534254cion:IndustryConcentrationRiskMembercion:InvestmentsAtFairValueMembercion:AerospaceDefenseMember2023-01-012023-12-310001534254cion:AerospaceDefenseMember2022-12-310001534254cion:IndustryConcentrationRiskMembercion:InvestmentsAtFairValueMembercion:AerospaceDefenseMember2022-01-012022-12-310001534254cion:InvestmentsAtFairValueMembercion:IndustryConcentrationRiskMember2023-01-012023-12-310001534254cion:InvestmentsAtFairValueMembercion:IndustryConcentrationRiskMember2022-01-012022-12-310001534254country:US2023-12-310001534254country:USus-gaap:GeographicConcentrationRiskMembercion:InvestmentsAtFairValueMember2023-01-012023-12-310001534254country:US2022-12-310001534254country:USus-gaap:GeographicConcentrationRiskMembercion:InvestmentsAtFairValueMember2022-01-012022-12-310001534254country:CA2023-12-310001534254us-gaap:GeographicConcentrationRiskMembercion:InvestmentsAtFairValueMembercountry:CA2023-01-012023-12-310001534254country:CA2022-12-310001534254us-gaap:GeographicConcentrationRiskMembercion:InvestmentsAtFairValueMembercountry:CA2022-01-012022-12-310001534254country:KY2023-12-310001534254country:KYus-gaap:GeographicConcentrationRiskMembercion:InvestmentsAtFairValueMember2023-01-012023-12-310001534254country:KY2022-12-310001534254country:KYus-gaap:GeographicConcentrationRiskMembercion:InvestmentsAtFairValueMember2022-01-012022-12-310001534254country:BM2023-12-310001534254us-gaap:GeographicConcentrationRiskMembercion:InvestmentsAtFairValueMembercountry:BM2023-01-012023-12-310001534254country:BM2022-12-310001534254us-gaap:GeographicConcentrationRiskMembercion:InvestmentsAtFairValueMembercountry:BM2022-01-012022-12-310001534254cion:InvestmentsAtFairValueMemberus-gaap:GeographicConcentrationRiskMember2023-01-012023-12-310001534254cion:InvestmentsAtFairValueMemberus-gaap:GeographicConcentrationRiskMember2022-01-012022-12-310001534254cion:UnfundedCommitmentsMember2023-12-310001534254cion:UnfundedCommitmentsMember2022-12-310001534254cion:UnfundedCommitmentsMemberus-gaap:SubsequentEventMember2024-03-060001534254cion:CIONEagleTreeMember2023-12-310001534254cion:ETBCMembercion:CIONEagleTreeMember2023-12-31cion:member0001534254us-gaap:SeniorNotesMembercion:CIONEagleTreeNotesMembercion:CIONEagleTreeMember2021-12-210001534254us-gaap:SeniorNotesMembercion:CIONEagleTreeNotesMembercion:ETBCMembercion:CIONEagleTreeMember2021-12-210001534254CION/EagleTree, Berlitz Holdings, Inc, Senior Secured First Lien Debt2023-12-310001534254CION/EagleTree, Community Tree Service, LLC, Senior Secured First Lien Debt2023-12-310001534254cion:CIONEagleTreeMembercion:SeniorSecuredFirstLienDebtMember2023-12-310001534254CION/EagleTree, Access CIG, LLC, Senior Secured Second Lien Debt2023-12-310001534254CION/EagleTree, MedPlast Holdings, Inc, Senior Secured Second Lien Debt2023-12-310001534254cion:SeniorSecuredSecondLienDebtMembercion:CIONEagleTreeMember2023-12-310001534254CION/EagleTree, Ivy Hill Middle Market Credit Fund VIII, Ltd. Subordinated Loan, Collateralized Securities and Structured Products - Equity2023-12-310001534254cion:CollateralizedSecuritiesAndStructuredProductsEquityMembercion:CIONEagleTreeMember2023-12-310001534254CION/EagleTree, American Clinical Solutions LLC, Class A Membership Interests, Equity2023-12-310001534254CION/EagleTree, Anthem Sports and Entertainment Inc., Class A Preferred Stock Warrants, Equity2023-12-310001534254CION/EagleTree, Anthem Sports and Entertainment Inc., Class B Preferred Stock Warrants, Equity2023-12-310001534254CION/EagleTree, Anthem Sports and Entertainment Inc., Common Stock Warrants, Equity2023-12-310001534254CION/EagleTree, BCP Great Lakes II - Series A Holdings LP, Partnership Equity2023-12-310001534254CION/EagleTree, Carestream Health Holdings, Inc., Common Stock, Equity2023-12-310001534254CION/EagleTree, CHC Medical Partners, Inc., Series C Preferred Stock, Equity2023-12-310001534254CION/EagleTree, CTS Ultimate Holdings LLC, Class A Preferred Units, Equity2023-12-310001534254CION/EagleTree, Dayton HoldCo, LLC, Membership Units, Equity2023-12-310001534254CION/EagleTree, HDNet Holdco LLC, Preferred Unit Call Option, Equity2023-12-310001534254CION/EagleTree, HW Ultimate Holdings, LP, Class A Membership Units, Equity2023-12-310001534254CION/EagleTree, Language Education Holdings GP LLC, Common Units, Equity2023-12-310001534254CION/EagleTree, Language Education Holdings LP, Ordinary Common Units, Equity2023-12-310001534254CION/EagleTree, Skillsoft Corp., Class A Common Stock, Equity2023-12-310001534254CION/EagleTree, Spinal USA, Inc. / Precision Medical Inc., Warrants, Equity2023-12-310001534254us-gaap:EquityMembercion:CIONEagleTreeMember2023-12-310001534254CION/EagleTree, First American Treasury Obligations Fund, Class Z Shares, Short Term Investments2023-12-310001534254First American Treasury Obligations Fund, Class Z Shares 2023-12-310001534254cion:CIONEagleTreeMemberus-gaap:ShortTermInvestmentsMember2023-12-310001534254CION/EagleTree, Berlitz Holdings, Inc, Senior Secured First Lien Debt2022-12-310001534254CION/EagleTree, Community Tree Service, LLC, Senior Secured First Lien Debt2022-12-310001534254CION/EagleTree, Future Pak, LLC, Senior Secured First Lien Debt2022-12-310001534254cion:CIONEagleTreeMembercion:SeniorSecuredFirstLienDebtMember2022-12-310001534254CION/EagleTree, Access CIG, LLC, Senior Secured Second Lien Debt2022-12-310001534254CION/EagleTree, Dayton Superior Corp, Senior Secured Second Lien Debt2022-12-310001534254CION/EagleTree, MedPlast Holdings, Inc, Senior Secured Second Lien Debt2022-12-310001534254CION/EagleTree, Zest Acquisition Corp, Senior Secured Second Lien Debt2022-12-310001534254cion:SeniorSecuredSecondLienDebtMembercion:CIONEagleTreeMember2022-12-310001534254CION/EagleTree, Ivy Hill Middle Market Credit Fund VIII, Ltd. Subordinated Loan, Collateralized Securities and Structured Products - Equity2022-12-310001534254cion:CollateralizedSecuritiesAndStructuredProductsEquityMembercion:CIONEagleTreeMember2022-12-310001534254CION/EagleTree, American Clinical Solutions LLC, Class A Membership Interests, Equity2022-12-310001534254CION/EagleTree, Anthem Sports and Entertainment Inc., Class A Preferred Stock Warrants, Equity2022-12-310001534254CION/EagleTree, Anthem Sports and Entertainment Inc., Class B Preferred Stock Warrants, Equity2022-12-310001534254CION/EagleTree, Anthem Sports and Entertainment Inc., Common Stock Warrants, Equity2022-12-310001534254CION/EagleTree, BCP Great Lakes Fund LP, Partnership Interests, Equity2022-12-310001534254CION/EagleTree, Carestream Health Holdings, Inc., Common Stock, Equity2022-12-310001534254CION/EagleTree, CHC Medical Partners, Inc., Series C Preferred Stock, Equity2022-12-310001534254CION/EagleTree, CTS Ultimate Holdings LLC, Class A Preferred Units, Equity2022-12-310001534254CION/EagleTree, Dayton HoldCo, LLC, Membership Units, Equity2022-12-310001534254CION/EagleTree, HDNet Holdco LLC, Preferred Unit Call Option, Equity2022-12-310001534254CION/EagleTree, HW Ultimate Holdings, LP, Class A Membership Units, Equity2022-12-310001534254CION/EagleTree, Language Education Holdings GP LLC, Common Units, Equity2022-12-310001534254CION/EagleTree, Language Education Holdings LP, Ordinary Common Units, Equity2022-12-310001534254CION/EagleTree, Skillsoft Corp., Class A Common Stock, Equity2022-12-310001534254CION/EagleTree, Spinal USA, Inc. / Precision Medical Inc., Warrants, Equity2022-12-310001534254us-gaap:EquityMembercion:CIONEagleTreeMember2022-12-310001534254cion:CIONEagleTreeMember2022-12-310001534254cion:CIONEagleTreeMember2023-01-012023-12-310001534254cion:CIONEagleTreeMember2022-01-012022-12-310001534254cion:CIONSOFFundingLLCMember2019-10-020001534254cion:BCPMembercion:CIONSOFFundingLLCMember2019-10-020001534254us-gaap:LineOfCreditMembercion:CIONSOFMembercion:SOFCreditFacilityMember2019-10-020001534254cion:LondonInterbankOfferedRateLIBOR1Memberus-gaap:LineOfCreditMembercion:CIONSOFMembercion:ThroughOctober12022Membercion:SOFCreditFacilityMember2019-10-022019-10-020001534254cion:ThereafterOctober12022ThroughOctober22024Membercion:LondonInterbankOfferedRateLIBOR1Memberus-gaap:LineOfCreditMembercion:CIONSOFMembercion:SOFCreditFacilityMember2019-10-022019-10-020001534254cion:CIONSOFFundingLLCMember2023-12-310001534254cion:JPMCreditFacilitySOFRMember2023-01-012023-12-310001534254cion:JPMCreditFacilitySOFRMember2023-12-310001534254us-gaap:UnsecuredDebtMembercion:A2026NotesMember2023-12-310001534254cion:A2026NotesMember2023-12-310001534254cion:UBSFacilityMember2023-01-012023-12-310001534254cion:UBSFacilityMember2023-12-310001534254cion:SeniorNotesAMembercion:SecuredOvernightFinancingRateSOFRMember2023-01-012023-12-310001534254cion:SeniorNotesAMember2023-12-310001534254cion:A2027NotesMemberus-gaap:UnsecuredDebtMembercion:SecuredOvernightFinancingRateSOFRMember2023-01-012023-12-310001534254cion:A2027NotesMember2023-12-310001534254us-gaap:UnsecuredDebtMembercion:SecuredOvernightFinancingRateSOFRMembercion:A2022MoreTermLoanMember2023-01-012023-12-310001534254cion:A2022MoreTermLoanMember2023-12-310001534254us-gaap:UnsecuredDebtMembercion:A2021MoreTermLoanMember2023-12-310001534254cion:A2021MoreTermLoanMember2023-12-310001534254us-gaap:UnsecuredDebtMembercion:SeniorNotesAMember2023-12-310001534254cion:JPMCreditFacilityMember2023-01-012023-12-310001534254us-gaap:SecuredDebtMembercion:JPMCreditFacilityMemberus-gaap:LineOfCreditMember2016-08-260001534254cion:JPMCreditFacilityMemberus-gaap:RevolvingCreditFacilityMemberus-gaap:LineOfCreditMember2016-08-260001534254cion:JPMCreditFacilityMemberus-gaap:LineOfCreditMember2016-08-262016-08-260001534254us-gaap:SecuredDebtMembercion:JPMCreditFacilityMemberus-gaap:LineOfCreditMember2016-09-300001534254cion:JPMCreditFacilityMemberus-gaap:RevolvingCreditFacilityMemberus-gaap:LineOfCreditMember2016-09-300001534254us-gaap:SecuredDebtMembercion:JPMCreditFacilityMemberus-gaap:LineOfCreditMember2018-05-230001534254cion:JPMCreditFacilityMemberus-gaap:RevolvingCreditFacilityMemberus-gaap:LineOfCreditMember2018-05-230001534254us-gaap:SecuredDebtMembercion:UBSFacilityMember2020-05-152020-05-150001534254us-gaap:SecuredDebtMembercion:JPMCreditFacilityMemberus-gaap:LineOfCreditMember2020-05-150001534254cion:JPMCreditFacilityMemberus-gaap:RevolvingCreditFacilityMemberus-gaap:LineOfCreditMember2020-05-150001534254us-gaap:SecuredDebtMembercion:JPMCreditFacilityMembercion:LondonInterbankOfferedRateLIBOR1Member2020-05-152020-05-150001534254us-gaap:SecuredDebtMembercion:JPMCreditFacilityMemberus-gaap:LineOfCreditMember2021-02-260001534254us-gaap:SecuredDebtMembercion:LondonInterbankOfferedRateLIBOR1Membercion:JPMCreditFacilityLIBORMember2021-02-262021-02-260001534254us-gaap:SecuredDebtMembercion:JPMCreditFacilityMemberus-gaap:LineOfCreditMember2022-03-280001534254cion:SecuredOvernightFinancingRateSOFRMembercion:JPMCreditFacilitySOFRMember2022-03-282022-03-280001534254us-gaap:SecuredDebtMembercion:JPMCreditFacilityMembercion:LondonInterbankOfferedRateLIBOR1Member2022-03-282022-03-280001534254us-gaap:SecuredDebtMembercion:JPMCreditFacilityMemberus-gaap:LineOfCreditMember2023-05-150001534254cion:SecuredOvernightFinancingRateSOFRMembercion:JPMCreditFacilitySOFRMember2023-05-152023-05-150001534254us-gaap:SecuredDebtMembercion:JPMCreditFacilityMembercion:SecuredOvernightFinancingRateSOFRMember2023-05-152023-05-150001534254us-gaap:SecuredDebtMembercion:JPMCreditFacilityMemberus-gaap:LineOfCreditMember2023-05-152023-05-150001534254us-gaap:SecuredDebtMembercion:JPMCreditFacilityMember2022-03-282022-03-280001534254us-gaap:SecuredDebtMembercion:JPMCreditFacilityMember2023-12-310001534254us-gaap:SecuredDebtMembercion:JPMCreditFacilityMember2022-12-310001534254cion:JPMCreditFacilityMember2022-01-012022-12-310001534254cion:A2026NotesMember2023-01-012023-12-310001534254us-gaap:UnsecuredDebtMembercion:A2026NotesMember2021-02-110001534254us-gaap:UnsecuredDebtMembercion:A2026NotesMember2021-02-112021-02-110001534254cion:AfterFebruary112024ButOnOrBeforeFebruary112025Memberus-gaap:UnsecuredDebtMembercion:A2026NotesMember2021-02-112021-02-110001534254us-gaap:UnsecuredDebtMembercion:A2026NotesMembercion:AfterFebruary112025ButOnOrBeforeAugust112025Member2021-02-112021-02-110001534254us-gaap:UnsecuredDebtMembercion:AfterAugust112025Membercion:A2026NotesMember2021-02-112021-02-110001534254cion:A2026NotesMember2022-01-012022-12-310001534254cion:UBSFacilityMember2017-05-19cion:subsidiary0001534254cion:MurrayHillFundingIIMembercion:UBSFacilityMember2017-05-190001534254cion:MurrayHillFundingIIMembercion:UBSFacilityMember2017-05-192017-05-190001534254cion:UBSFacilityMember2017-05-192017-05-190001534254cion:LondonInterbankOfferedRateLIBOR1Membercion:UBSFacilityMember2017-05-192017-05-190001534254cion:MurrayHillFundingIIMembercion:UBSFacilityMember2017-12-010001534254cion:UBSFacilityMember2017-12-152018-04-020001534254cion:UBSFacilityMember2018-04-020001534254cion:LondonInterbankOfferedRateLIBOR1Membercion:UBSFacilityMember2020-11-092020-11-090001534254cion:UBSFacilityMember2020-05-190001534254cion:UBSFacilityMember2020-12-310001534254cion:LondonInterbankOfferedRateLIBOR1Membercion:UBSFacilityMember2020-12-172020-12-170001534254us-gaap:RevolvingCreditFacilityMembercion:ARNotesMember2020-12-170001534254cion:LondonInterbankOfferedRateLIBOR1Memberus-gaap:RevolvingCreditFacilityMembercion:ARNotesMember2020-12-172020-12-170001534254us-gaap:RevolvingCreditFacilityMembercion:ARNotesMember2020-12-172020-12-170001534254cion:LondonInterbankOfferedRateLIBOR1Memberus-gaap:RevolvingCreditFacilityMember2023-06-142023-06-140001534254cion:SecuredOvernightFinancingRateSOFRMembercion:UBSFacilityMember2023-06-142023-06-140001534254cion:ARNotesMember2023-01-012023-12-310001534254us-gaap:RevolvingCreditFacilityMembercion:ARNotesMember2021-07-010001534254us-gaap:RevolvingCreditFacilityMembercion:ARNotesMember2021-12-140001534254us-gaap:RevolvingCreditFacilityMembercion:ARNotesMember2022-04-190001534254us-gaap:RevolvingCreditFacilityMembercion:ARNotesMember2023-08-160001534254cion:ARNotesMember2021-08-200001534254cion:ARNotesMember2023-03-070001534254cion:ARNotesMember2023-04-140001534254cion:ARNotesMember2021-08-202021-08-200001534254cion:ARNotesMember2023-03-072023-03-070001534254cion:ARNotesMember2023-04-142023-04-140001534254cion:UBSFacilityMember2020-12-172020-12-170001534254cion:MurrayHillFundingIIMembercion:UBSFacilityMember2020-12-170001534254cion:MurrayHillFundingIIMember2023-12-310001534254cion:UBSFacilityMember2022-01-012022-12-310001534254cion:SeniorNotesAMember2023-01-012023-12-310001534254cion:SeniorNotesAMember2023-02-280001534254cion:SeniorNotesAMember2023-02-282023-02-280001534254cion:SeriesAUnsecuredNotesDue2026Member2023-10-100001534254cion:SeriesAUnsecuredNotesDue2026Member2023-10-102023-10-100001534254cion:SeriesAUnsecuredNotesDue2026Member2023-12-310001534254cion:A2027NotesMember2023-01-012023-12-310001534254cion:A2027NotesMemberus-gaap:UnsecuredDebtMember2023-11-080001534254cion:A2027NotesMemberus-gaap:UnsecuredDebtMember2023-11-082023-11-080001534254cion:A2027NotesMembercion:SecuredOvernightFinancingRateSOFRMember2023-11-082023-11-080001534254cion:A2027NotesMemberus-gaap:UnsecuredDebtMembercion:AfterFebruary112025ButOnOrBeforeAugust112025Member2023-11-082023-11-080001534254cion:A2027NotesMemberus-gaap:UnsecuredDebtMembercion:AfterAugust112025Member2023-11-082023-11-080001534254cion:A2027NotesMemberus-gaap:UnsecuredDebtMembercion:OnOrBeforeFebruary112024Member2023-11-082023-11-080001534254cion:A2027NotesMember2023-11-080001534254cion:A2027NotesMemberus-gaap:UnsecuredDebtMember2023-12-310001534254cion:A2022MoreTermLoanMember2023-01-012023-12-310001534254us-gaap:UnsecuredDebtMembercion:A2022MoreTermLoanMember2022-04-270001534254cion:A2022MoreTermLoanMember2022-04-272022-04-270001534254us-gaap:UnsecuredDebtMembercion:SOFRFloorRateMembercion:A2022MoreTermLoanMember2022-04-272022-04-270001534254us-gaap:UnsecuredDebtMembercion:SecuredOvernightFinancingRateSOFRMembercion:A2022MoreTermLoanMember2022-04-272022-04-270001534254us-gaap:UnsecuredDebtMembercion:A2022MoreTermLoanMember2022-04-272022-04-270001534254us-gaap:UnsecuredDebtMembercion:A2022MoreTermLoanMember2023-12-310001534254cion:A2022MoreTermLoanMember2022-04-272022-12-310001534254cion:A2021MoreTermLoanMember2023-01-012023-12-310001534254us-gaap:UnsecuredDebtMembercion:A2021MoreTermLoanMember2021-04-140001534254us-gaap:UnsecuredDebtMembercion:A2021MoreTermLoanMember2021-04-142021-04-140001534254cion:A2021MoreTermLoanMember2022-01-012022-12-310001534254us-gaap:FairValueInputsLevel1Membercion:SeniorSecuredFirstLienDebtMember2023-12-310001534254us-gaap:FairValueInputsLevel2Membercion:SeniorSecuredFirstLienDebtMember2023-12-310001534254us-gaap:FairValueInputsLevel3Membercion:SeniorSecuredFirstLienDebtMember2023-12-310001534254cion:SeniorSecuredFirstLienDebtMember2023-12-310001534254us-gaap:FairValueInputsLevel1Membercion:SeniorSecuredFirstLienDebtMember2022-12-310001534254us-gaap:FairValueInputsLevel2Membercion:SeniorSecuredFirstLienDebtMember2022-12-310001534254us-gaap:FairValueInputsLevel3Membercion:SeniorSecuredFirstLienDebtMember2022-12-310001534254cion:SeniorSecuredFirstLienDebtMember2022-12-310001534254cion:SeniorSecuredSecondLienDebtMemberus-gaap:FairValueInputsLevel1Member2023-12-310001534254cion:SeniorSecuredSecondLienDebtMemberus-gaap:FairValueInputsLevel2Member2023-12-310001534254cion:SeniorSecuredSecondLienDebtMemberus-gaap:FairValueInputsLevel3Member2023-12-310001534254cion:SeniorSecuredSecondLienDebtMember2023-12-310001534254cion:SeniorSecuredSecondLienDebtMemberus-gaap:FairValueInputsLevel1Member2022-12-310001534254cion:SeniorSecuredSecondLienDebtMemberus-gaap:FairValueInputsLevel2Member2022-12-310001534254cion:SeniorSecuredSecondLienDebtMemberus-gaap:FairValueInputsLevel3Member2022-12-310001534254cion:SeniorSecuredSecondLienDebtMember2022-12-310001534254us-gaap:FairValueInputsLevel1Membercion:CollateralizedSecuritiesAndStructuredProductsEquityMember2023-12-310001534254us-gaap:FairValueInputsLevel2Membercion:CollateralizedSecuritiesAndStructuredProductsEquityMember2023-12-310001534254us-gaap:FairValueInputsLevel3Membercion:CollateralizedSecuritiesAndStructuredProductsEquityMember2023-12-310001534254cion:CollateralizedSecuritiesAndStructuredProductsEquityMember2023-12-310001534254us-gaap:FairValueInputsLevel1Membercion:CollateralizedSecuritiesAndStructuredProductsEquityMember2022-12-310001534254us-gaap:FairValueInputsLevel2Membercion:CollateralizedSecuritiesAndStructuredProductsEquityMember2022-12-310001534254us-gaap:FairValueInputsLevel3Membercion:CollateralizedSecuritiesAndStructuredProductsEquityMember2022-12-310001534254cion:CollateralizedSecuritiesAndStructuredProductsEquityMember2022-12-310001534254us-gaap:FairValueInputsLevel1Membercion:DebtSecuritiesUnsecuredDebtMember2023-12-310001534254us-gaap:FairValueInputsLevel2Membercion:DebtSecuritiesUnsecuredDebtMember2023-12-310001534254us-gaap:FairValueInputsLevel3Membercion:DebtSecuritiesUnsecuredDebtMember2023-12-310001534254cion:DebtSecuritiesUnsecuredDebtMember2023-12-310001534254us-gaap:FairValueInputsLevel1Membercion:DebtSecuritiesUnsecuredDebtMember2022-12-310001534254us-gaap:FairValueInputsLevel2Membercion:DebtSecuritiesUnsecuredDebtMember2022-12-310001534254us-gaap:FairValueInputsLevel3Membercion:DebtSecuritiesUnsecuredDebtMember2022-12-310001534254cion:DebtSecuritiesUnsecuredDebtMember2022-12-310001534254us-gaap:FairValueInputsLevel1Memberus-gaap:EquitySecuritiesMember2023-12-310001534254us-gaap:FairValueInputsLevel2Memberus-gaap:EquitySecuritiesMember2023-12-310001534254us-gaap:FairValueInputsLevel3Memberus-gaap:EquitySecuritiesMember2023-12-310001534254us-gaap:EquitySecuritiesMember2023-12-310001534254us-gaap:FairValueInputsLevel1Memberus-gaap:EquitySecuritiesMember2022-12-310001534254us-gaap:FairValueInputsLevel2Memberus-gaap:EquitySecuritiesMember2022-12-310001534254us-gaap:FairValueInputsLevel3Memberus-gaap:EquitySecuritiesMember2022-12-310001534254us-gaap:EquitySecuritiesMember2022-12-310001534254us-gaap:FairValueInputsLevel1Memberus-gaap:ShortTermInvestmentsMember2023-12-310001534254us-gaap:FairValueInputsLevel2Memberus-gaap:ShortTermInvestmentsMember2023-12-310001534254us-gaap:FairValueInputsLevel3Memberus-gaap:ShortTermInvestmentsMember2023-12-310001534254us-gaap:ShortTermInvestmentsMember2023-12-310001534254us-gaap:FairValueInputsLevel1Memberus-gaap:ShortTermInvestmentsMember2022-12-310001534254us-gaap:FairValueInputsLevel2Memberus-gaap:ShortTermInvestmentsMember2022-12-310001534254us-gaap:FairValueInputsLevel3Memberus-gaap:ShortTermInvestmentsMember2022-12-310001534254us-gaap:ShortTermInvestmentsMember2022-12-310001534254us-gaap:FairValueInputsLevel1Member2023-12-310001534254us-gaap:FairValueInputsLevel2Member2023-12-310001534254us-gaap:FairValueInputsLevel3Member2023-12-310001534254us-gaap:FairValueInputsLevel1Member2022-12-310001534254us-gaap:FairValueInputsLevel2Member2022-12-310001534254us-gaap:FairValueInputsLevel3Member2022-12-310001534254us-gaap:InvestmentAffiliatedIssuerControlledMembercion:CIONEagleTreePartnersLLCMember2023-12-310001534254cion:SeniorSecuredFirstLienDebtMember2022-12-310001534254cion:SeniorSecuredSecondLienDebtMember2022-12-310001534254cion:CollateralizedSecuritiesAndStructuredProductsEquityMember2022-12-310001534254cion:DebtSecuritiesUnsecuredDebtMember2022-12-310001534254us-gaap:EquitySecuritiesMember2022-12-310001534254us-gaap:InvestmentsMember2022-12-310001534254cion:SeniorSecuredFirstLienDebtMember2023-01-012023-12-310001534254cion:SeniorSecuredSecondLienDebtMember2023-01-012023-12-310001534254cion:CollateralizedSecuritiesAndStructuredProductsEquityMember2023-01-012023-12-310001534254cion:DebtSecuritiesUnsecuredDebtMember2023-01-012023-12-310001534254us-gaap:EquitySecuritiesMember2023-01-012023-12-310001534254us-gaap:InvestmentsMember2023-01-012023-12-310001534254cion:DebtAndEquitySecuritiesRealizedGainLossMembercion:SeniorSecuredFirstLienDebtMember2023-01-012023-12-310001534254cion:DebtAndEquitySecuritiesRealizedGainLossMembercion:SeniorSecuredSecondLienDebtMember2023-01-012023-12-310001534254cion:CollateralizedSecuritiesAndStructuredProductsEquityMembercion:DebtAndEquitySecuritiesRealizedGainLossMember2023-01-012023-12-310001534254cion:DebtAndEquitySecuritiesRealizedGainLossMembercion:DebtSecuritiesUnsecuredDebtMember2023-01-012023-12-310001534254us-gaap:EquitySecuritiesMembercion:DebtAndEquitySecuritiesRealizedGainLossMember2023-01-012023-12-310001534254cion:DebtAndEquitySecuritiesRealizedGainLossMemberus-gaap:InvestmentsMember2023-01-012023-12-310001534254cion:DebtAndEquitySecuritiesUnrealizedGainLossMembercion:SeniorSecuredFirstLienDebtMember2023-01-012023-12-310001534254cion:DebtAndEquitySecuritiesUnrealizedGainLossMembercion:SeniorSecuredSecondLienDebtMember2023-01-012023-12-310001534254cion:CollateralizedSecuritiesAndStructuredProductsEquityMembercion:DebtAndEquitySecuritiesUnrealizedGainLossMember2023-01-012023-12-310001534254cion:DebtAndEquitySecuritiesUnrealizedGainLossMembercion:DebtSecuritiesUnsecuredDebtMember2023-01-012023-12-310001534254us-gaap:EquitySecuritiesMembercion:DebtAndEquitySecuritiesUnrealizedGainLossMember2023-01-012023-12-310001534254cion:DebtAndEquitySecuritiesUnrealizedGainLossMemberus-gaap:InvestmentsMember2023-01-012023-12-310001534254cion:SeniorSecuredFirstLienDebtMember2023-12-310001534254cion:SeniorSecuredSecondLienDebtMember2023-12-310001534254cion:CollateralizedSecuritiesAndStructuredProductsEquityMember2023-12-310001534254cion:DebtSecuritiesUnsecuredDebtMember2023-12-310001534254us-gaap:EquitySecuritiesMember2023-12-310001534254us-gaap:InvestmentsMember2023-12-310001534254cion:SeniorSecuredFirstLienDebtMember2021-12-310001534254cion:SeniorSecuredSecondLienDebtMember2021-12-310001534254cion:CollateralizedSecuritiesAndStructuredProductsEquityMember2021-12-310001534254cion:DebtSecuritiesUnsecuredDebtMember2021-12-310001534254us-gaap:EquitySecuritiesMember2021-12-310001534254us-gaap:InvestmentsMember2021-12-310001534254cion:SeniorSecuredFirstLienDebtMember2022-01-012022-12-310001534254cion:SeniorSecuredSecondLienDebtMember2022-01-012022-12-310001534254cion:CollateralizedSecuritiesAndStructuredProductsEquityMember2022-01-012022-12-310001534254cion:DebtSecuritiesUnsecuredDebtMember2022-01-012022-12-310001534254us-gaap:EquitySecuritiesMember2022-01-012022-12-310001534254us-gaap:InvestmentsMember2022-01-012022-12-310001534254cion:DebtAndEquitySecuritiesRealizedGainLossMembercion:SeniorSecuredFirstLienDebtMember2022-01-012022-12-310001534254cion:DebtAndEquitySecuritiesRealizedGainLossMembercion:SeniorSecuredSecondLienDebtMember2022-01-012022-12-310001534254cion:CollateralizedSecuritiesAndStructuredProductsEquityMembercion:DebtAndEquitySecuritiesRealizedGainLossMember2022-01-012022-12-310001534254cion:DebtAndEquitySecuritiesRealizedGainLossMembercion:DebtSecuritiesUnsecuredDebtMember2022-01-012022-12-310001534254us-gaap:EquitySecuritiesMembercion:DebtAndEquitySecuritiesRealizedGainLossMember2022-01-012022-12-310001534254cion:DebtAndEquitySecuritiesRealizedGainLossMemberus-gaap:InvestmentsMember2022-01-012022-12-310001534254cion:DebtAndEquitySecuritiesUnrealizedGainLossMembercion:SeniorSecuredFirstLienDebtMember2022-01-012022-12-310001534254cion:DebtAndEquitySecuritiesUnrealizedGainLossMembercion:SeniorSecuredSecondLienDebtMember2022-01-012022-12-310001534254cion:CollateralizedSecuritiesAndStructuredProductsEquityMembercion:DebtAndEquitySecuritiesUnrealizedGainLossMember2022-01-012022-12-310001534254cion:DebtAndEquitySecuritiesUnrealizedGainLossMembercion:DebtSecuritiesUnsecuredDebtMember2022-01-012022-12-310001534254us-gaap:EquitySecuritiesMembercion:DebtAndEquitySecuritiesUnrealizedGainLossMember2022-01-012022-12-310001534254cion:DebtAndEquitySecuritiesUnrealizedGainLossMemberus-gaap:InvestmentsMember2022-01-012022-12-310001534254us-gaap:FairValueInputsLevel3Memberus-gaap:MeasurementInputDiscountRateMemberus-gaap:ValuationTechniqueDiscountedCashFlowMembercion:SeniorSecuredFirstLienDebtMember2023-12-310001534254us-gaap:FairValueInputsLevel3Memberus-gaap:MeasurementInputDiscountRateMembersrt:MinimumMemberus-gaap:ValuationTechniqueDiscountedCashFlowMembercion:SeniorSecuredFirstLienDebtMember2023-12-310001534254us-gaap:FairValueInputsLevel3Memberus-gaap:MeasurementInputDiscountRateMemberus-gaap:ValuationTechniqueDiscountedCashFlowMembersrt:MaximumMembercion:SeniorSecuredFirstLienDebtMember2023-12-310001534254us-gaap:FairValueInputsLevel3Memberus-gaap:MeasurementInputDiscountRateMembersrt:WeightedAverageMemberus-gaap:ValuationTechniqueDiscountedCashFlowMembercion:SeniorSecuredFirstLienDebtMember2023-12-310001534254cion:ValuationTechniqueBrokerQuotesMemberus-gaap:FairValueInputsLevel3Membercion:SeniorSecuredFirstLienDebtMembercion:MeasurementInputBrokerQuotesMember2023-12-310001534254us-gaap:FairValueInputsLevel3Memberus-gaap:MeasurementInputRevenueMultipleMemberus-gaap:MarketApproachValuationTechniqueMembercion:SeniorSecuredFirstLienDebtMember2023-12-310001534254us-gaap:FairValueInputsLevel3Memberus-gaap:MeasurementInputRevenueMultipleMembersrt:MinimumMemberus-gaap:MarketApproachValuationTechniqueMembercion:SeniorSecuredFirstLienDebtMember2023-12-310001534254us-gaap:FairValueInputsLevel3Memberus-gaap:MeasurementInputRevenueMultipleMemberus-gaap:MarketApproachValuationTechniqueMembersrt:MaximumMembercion:SeniorSecuredFirstLienDebtMember2023-12-310001534254us-gaap:FairValueInputsLevel3Membersrt:WeightedAverageMemberus-gaap:MeasurementInputRevenueMultipleMemberus-gaap:MarketApproachValuationTechniqueMembercion:SeniorSecuredFirstLienDebtMember2023-12-310001534254us-gaap:FairValueInputsLevel3Memberus-gaap:MeasurementInputEbitdaMultipleMemberus-gaap:MarketApproachValuationTechniqueMembercion:SeniorSecuredFirstLienDebtMember2023-12-310001534254us-gaap:FairValueInputsLevel3Memberus-gaap:MeasurementInputEbitdaMultipleMembersrt:MinimumMemberus-gaap:MarketApproachValuationTechniqueMembercion:SeniorSecuredFirstLienDebtMember2023-12-310001534254us-gaap:FairValueInputsLevel3Memberus-gaap:MeasurementInputEbitdaMultipleMemberus-gaap:MarketApproachValuationTechniqueMembersrt:MaximumMembercion:SeniorSecuredFirstLienDebtMember2023-12-310001534254us-gaap:FairValueInputsLevel3Memberus-gaap:MeasurementInputEbitdaMultipleMembersrt:WeightedAverageMemberus-gaap:MarketApproachValuationTechniqueMembercion:SeniorSecuredFirstLienDebtMember2023-12-310001534254us-gaap:FairValueInputsLevel3Membercion:OtherValuationTechniqueMembercion:SeniorSecuredFirstLienDebtMember2023-12-310001534254cion:SeniorSecuredSecondLienDebtMemberus-gaap:FairValueInputsLevel3Memberus-gaap:MeasurementInputDiscountRateMemberus-gaap:ValuationTechniqueDiscountedCashFlowMember2023-12-310001534254cion:SeniorSecuredSecondLienDebtMemberus-gaap:FairValueInputsLevel3Memberus-gaap:MeasurementInputDiscountRateMembersrt:MinimumMemberus-gaap:ValuationTechniqueDiscountedCashFlowMember2023-12-310001534254cion:SeniorSecuredSecondLienDebtMemberus-gaap:FairValueInputsLevel3Memberus-gaap:MeasurementInputDiscountRateMemberus-gaap:ValuationTechniqueDiscountedCashFlowMembersrt:MaximumMember2023-12-310001534254cion:SeniorSecuredSecondLienDebtMemberus-gaap:FairValueInputsLevel3Memberus-gaap:MeasurementInputDiscountRateMembersrt:WeightedAverageMemberus-gaap:ValuationTechniqueDiscountedCashFlowMember2023-12-310001534254cion:SeniorSecuredSecondLienDebtMemberus-gaap:FairValueInputsLevel3Memberus-gaap:MeasurementInputDiscountRateMemberus-gaap:MarketApproachValuationTechniqueMember2023-12-310001534254us-gaap:FairValueInputsLevel3Memberus-gaap:MeasurementInputDiscountRateMemberus-gaap:ValuationTechniqueDiscountedCashFlowMembercion:CollateralizedSecuritiesAndStructuredProductsEquityMember2023-12-310001534254us-gaap:FairValueInputsLevel3Memberus-gaap:MeasurementInputDiscountRateMembersrt:MinimumMemberus-gaap:ValuationTechniqueDiscountedCashFlowMembercion:CollateralizedSecuritiesAndStructuredProductsEquityMember2023-12-310001534254us-gaap:FairValueInputsLevel3Memberus-gaap:MeasurementInputDiscountRateMemberus-gaap:ValuationTechniqueDiscountedCashFlowMembercion:CollateralizedSecuritiesAndStructuredProductsEquityMembersrt:MaximumMember2023-12-310001534254us-gaap:FairValueInputsLevel3Memberus-gaap:MeasurementInputDiscountRateMembersrt:WeightedAverageMemberus-gaap:ValuationTechniqueDiscountedCashFlowMembercion:CollateralizedSecuritiesAndStructuredProductsEquityMember2023-12-310001534254us-gaap:FairValueInputsLevel3Memberus-gaap:MeasurementInputDiscountRateMemberus-gaap:ValuationTechniqueDiscountedCashFlowMembercion:DebtSecuritiesUnsecuredDebtMember2023-12-310001534254us-gaap:FairValueInputsLevel3Memberus-gaap:MeasurementInputDiscountRateMembersrt:MinimumMemberus-gaap:ValuationTechniqueDiscountedCashFlowMembercion:DebtSecuritiesUnsecuredDebtMember2023-12-310001534254us-gaap:FairValueInputsLevel3Membercion:OtherValuationTechniqueMembercion:DebtSecuritiesUnsecuredDebtMember2023-12-310001534254us-gaap:FairValueInputsLevel3Memberus-gaap:MeasurementInputEbitdaMultipleMemberus-gaap:EquitySecuritiesMemberus-gaap:MarketApproachValuationTechniqueMember2023-12-310001534254us-gaap:FairValueInputsLevel3Memberus-gaap:MeasurementInputEbitdaMultipleMembersrt:MinimumMemberus-gaap:EquitySecuritiesMemberus-gaap:MarketApproachValuationTechniqueMember2023-12-310001534254us-gaap:FairValueInputsLevel3Memberus-gaap:MeasurementInputEbitdaMultipleMemberus-gaap:EquitySecuritiesMemberus-gaap:MarketApproachValuationTechniqueMembersrt:MaximumMember2023-12-310001534254us-gaap:FairValueInputsLevel3Memberus-gaap:MeasurementInputEbitdaMultipleMembersrt:WeightedAverageMemberus-gaap:EquitySecuritiesMemberus-gaap:MarketApproachValuationTechniqueMember2023-12-310001534254us-gaap:FairValueInputsLevel3Memberus-gaap:MeasurementInputRevenueMultipleMemberus-gaap:EquitySecuritiesMemberus-gaap:MarketApproachValuationTechniqueMember2023-12-310001534254us-gaap:FairValueInputsLevel3Memberus-gaap:MeasurementInputRevenueMultipleMembersrt:MinimumMemberus-gaap:EquitySecuritiesMemberus-gaap:MarketApproachValuationTechniqueMember2023-12-310001534254us-gaap:FairValueInputsLevel3Memberus-gaap:MeasurementInputRevenueMultipleMemberus-gaap:EquitySecuritiesMemberus-gaap:MarketApproachValuationTechniqueMembersrt:MaximumMember2023-12-310001534254us-gaap:FairValueInputsLevel3Membersrt:WeightedAverageMemberus-gaap:MeasurementInputRevenueMultipleMemberus-gaap:EquitySecuritiesMemberus-gaap:MarketApproachValuationTechniqueMember2023-12-310001534254us-gaap:FairValueInputsLevel3Membercion:MeasurementInputDollerPerKWMemberus-gaap:EquitySecuritiesMemberus-gaap:MarketApproachValuationTechniqueMember2023-12-310001534254us-gaap:FairValueInputsLevel3Membersrt:MinimumMemberus-gaap:EquitySecuritiesMembercion:MeasurementInputDollerPerKWMemberus-gaap:MarketApproachValuationTechniqueMember2023-12-310001534254us-gaap:FairValueInputsLevel3Memberus-gaap:EquitySecuritiesMembercion:MeasurementInputDollerPerKWMemberus-gaap:MarketApproachValuationTechniqueMembersrt:MaximumMember2023-12-310001534254us-gaap:FairValueInputsLevel3Membersrt:WeightedAverageMemberus-gaap:EquitySecuritiesMembercion:MeasurementInputDollerPerKWMemberus-gaap:MarketApproachValuationTechniqueMember2023-12-310001534254cion:ValuationTechniqueBrokerQuotesMemberus-gaap:FairValueInputsLevel3Memberus-gaap:EquitySecuritiesMembercion:MeasurementInputBrokerQuotesMember2023-12-310001534254us-gaap:FairValueInputsLevel3Membercion:MeasurementInputExpectedVolatilityMemberus-gaap:ValuationTechniqueOptionPricingModelMemberus-gaap:EquitySecuritiesMember2023-12-310001534254us-gaap:FairValueInputsLevel3Membercion:MeasurementInputExpectedVolatilityMemberus-gaap:ValuationTechniqueOptionPricingModelMembersrt:MinimumMemberus-gaap:EquitySecuritiesMember2023-12-310001534254us-gaap:FairValueInputsLevel3Memberus-gaap:MeasurementInputDiscountRateMemberus-gaap:ValuationTechniqueDiscountedCashFlowMembercion:SeniorSecuredFirstLienDebtMember2022-12-310001534254us-gaap:FairValueInputsLevel3Memberus-gaap:MeasurementInputDiscountRateMembersrt:MinimumMemberus-gaap:ValuationTechniqueDiscountedCashFlowMembercion:SeniorSecuredFirstLienDebtMember2022-12-310001534254us-gaap:FairValueInputsLevel3Memberus-gaap:MeasurementInputDiscountRateMemberus-gaap:ValuationTechniqueDiscountedCashFlowMembersrt:MaximumMembercion:SeniorSecuredFirstLienDebtMember2022-12-310001534254us-gaap:FairValueInputsLevel3Memberus-gaap:MeasurementInputDiscountRateMembersrt:WeightedAverageMemberus-gaap:ValuationTechniqueDiscountedCashFlowMembercion:SeniorSecuredFirstLienDebtMember2022-12-310001534254cion:ValuationTechniqueBrokerQuotesMemberus-gaap:FairValueInputsLevel3Membercion:SeniorSecuredFirstLienDebtMembercion:MeasurementInputBrokerQuotesMember2022-12-310001534254us-gaap:FairValueInputsLevel3Memberus-gaap:MeasurementInputRevenueMultipleMemberus-gaap:MarketApproachValuationTechniqueMembercion:SeniorSecuredFirstLienDebtMember2022-12-310001534254us-gaap:FairValueInputsLevel3Memberus-gaap:MeasurementInputRevenueMultipleMembersrt:MinimumMemberus-gaap:MarketApproachValuationTechniqueMembercion:SeniorSecuredFirstLienDebtMember2022-12-310001534254us-gaap:FairValueInputsLevel3Memberus-gaap:MeasurementInputRevenueMultipleMemberus-gaap:MarketApproachValuationTechniqueMembersrt:MaximumMembercion:SeniorSecuredFirstLienDebtMember2022-12-310001534254us-gaap:FairValueInputsLevel3Membersrt:WeightedAverageMemberus-gaap:MeasurementInputRevenueMultipleMemberus-gaap:MarketApproachValuationTechniqueMembercion:SeniorSecuredFirstLienDebtMember2022-12-310001534254us-gaap:FairValueInputsLevel3Membercion:MeasurementInputDollerPerKWMemberus-gaap:MarketApproachValuationTechniqueMembercion:SeniorSecuredFirstLienDebtMember2022-12-310001534254us-gaap:FairValueInputsLevel3Memberus-gaap:MeasurementInputEbitdaMultipleMemberus-gaap:MarketApproachValuationTechniqueMembercion:SeniorSecuredFirstLienDebtMember2022-12-310001534254us-gaap:FairValueInputsLevel3Memberus-gaap:MeasurementInputEbitdaMultipleMembersrt:MinimumMemberus-gaap:MarketApproachValuationTechniqueMembercion:SeniorSecuredFirstLienDebtMember2022-12-310001534254us-gaap:FairValueInputsLevel3Memberus-gaap:MeasurementInputEbitdaMultipleMemberus-gaap:MarketApproachValuationTechniqueMembersrt:MaximumMembercion:SeniorSecuredFirstLienDebtMember2022-12-310001534254us-gaap:FairValueInputsLevel3Memberus-gaap:MeasurementInputEbitdaMultipleMembersrt:WeightedAverageMemberus-gaap:MarketApproachValuationTechniqueMembercion:SeniorSecuredFirstLienDebtMember2022-12-310001534254us-gaap:FairValueInputsLevel3Membercion:OtherValuationTechniqueMembercion:SeniorSecuredFirstLienDebtMember2022-12-310001534254cion:SeniorSecuredSecondLienDebtMemberus-gaap:FairValueInputsLevel3Memberus-gaap:MeasurementInputDiscountRateMemberus-gaap:ValuationTechniqueDiscountedCashFlowMember2022-12-310001534254cion:SeniorSecuredSecondLienDebtMemberus-gaap:FairValueInputsLevel3Memberus-gaap:MeasurementInputDiscountRateMembersrt:MinimumMemberus-gaap:ValuationTechniqueDiscountedCashFlowMember2022-12-310001534254cion:SeniorSecuredSecondLienDebtMemberus-gaap:FairValueInputsLevel3Memberus-gaap:MeasurementInputDiscountRateMemberus-gaap:ValuationTechniqueDiscountedCashFlowMembersrt:MaximumMember2022-12-310001534254cion:SeniorSecuredSecondLienDebtMemberus-gaap:FairValueInputsLevel3Memberus-gaap:MeasurementInputDiscountRateMembersrt:WeightedAverageMemberus-gaap:ValuationTechniqueDiscountedCashFlowMember2022-12-310001534254us-gaap:FairValueInputsLevel3Memberus-gaap:MeasurementInputDiscountRateMemberus-gaap:ValuationTechniqueDiscountedCashFlowMembercion:CollateralizedSecuritiesAndStructuredProductsEquityMember2022-12-310001534254us-gaap:FairValueInputsLevel3Memberus-gaap:MeasurementInputEbitdaMultipleMemberus-gaap:MarketApproachValuationTechniqueMembercion:DebtSecuritiesUnsecuredDebtMember2022-12-310001534254us-gaap:FairValueInputsLevel3Memberus-gaap:MeasurementInputDiscountRateMemberus-gaap:ValuationTechniqueDiscountedCashFlowMembercion:DebtSecuritiesUnsecuredDebtMember2022-12-310001534254us-gaap:FairValueInputsLevel3Memberus-gaap:MeasurementInputEbitdaMultipleMemberus-gaap:EquitySecuritiesMemberus-gaap:MarketApproachValuationTechniqueMember2022-12-310001534254us-gaap:FairValueInputsLevel3Memberus-gaap:MeasurementInputEbitdaMultipleMembersrt:MinimumMemberus-gaap:EquitySecuritiesMemberus-gaap:MarketApproachValuationTechniqueMember2022-12-310001534254us-gaap:FairValueInputsLevel3Memberus-gaap:MeasurementInputEbitdaMultipleMemberus-gaap:EquitySecuritiesMemberus-gaap:MarketApproachValuationTechniqueMembersrt:MaximumMember2022-12-310001534254us-gaap:FairValueInputsLevel3Memberus-gaap:MeasurementInputEbitdaMultipleMembersrt:WeightedAverageMemberus-gaap:EquitySecuritiesMemberus-gaap:MarketApproachValuationTechniqueMember2022-12-310001534254us-gaap:FairValueInputsLevel3Membercion:MeasurementInputDollerPerKWMemberus-gaap:EquitySecuritiesMemberus-gaap:MarketApproachValuationTechniqueMember2022-12-310001534254us-gaap:FairValueInputsLevel3Memberus-gaap:MeasurementInputRevenueMultipleMemberus-gaap:EquitySecuritiesMemberus-gaap:MarketApproachValuationTechniqueMember2022-12-310001534254us-gaap:FairValueInputsLevel3Memberus-gaap:MeasurementInputRevenueMultipleMembersrt:MinimumMemberus-gaap:EquitySecuritiesMemberus-gaap:MarketApproachValuationTechniqueMember2022-12-310001534254us-gaap:FairValueInputsLevel3Memberus-gaap:MeasurementInputRevenueMultipleMemberus-gaap:EquitySecuritiesMemberus-gaap:MarketApproachValuationTechniqueMembersrt:MaximumMember2022-12-310001534254us-gaap:FairValueInputsLevel3Membersrt:WeightedAverageMemberus-gaap:MeasurementInputRevenueMultipleMemberus-gaap:EquitySecuritiesMemberus-gaap:MarketApproachValuationTechniqueMember2022-12-310001534254us-gaap:FairValueInputsLevel3Memberus-gaap:MeasurementInputDiscountRateMemberus-gaap:EquitySecuritiesMemberus-gaap:ValuationTechniqueDiscountedCashFlowMember2022-12-310001534254us-gaap:FairValueInputsLevel3Memberus-gaap:MeasurementInputDiscountRateMembersrt:MinimumMemberus-gaap:EquitySecuritiesMemberus-gaap:ValuationTechniqueDiscountedCashFlowMember2022-12-310001534254cion:ValuationTechniqueBrokerQuotesMemberus-gaap:FairValueInputsLevel3Memberus-gaap:EquitySecuritiesMembercion:MeasurementInputBrokerQuotesMember2022-12-310001534254us-gaap:FairValueInputsLevel3Membercion:MeasurementInputExpectedVolatilityMemberus-gaap:ValuationTechniqueOptionPricingModelMemberus-gaap:EquitySecuritiesMember2022-12-310001534254us-gaap:FairValueInputsLevel3Membercion:MeasurementInputExpectedVolatilityMemberus-gaap:ValuationTechniqueOptionPricingModelMembersrt:MinimumMemberus-gaap:EquitySecuritiesMember2022-12-310001534254us-gaap:FairValueInputsLevel3Membercion:MeasurementInputExpectedVolatilityMemberus-gaap:ValuationTechniqueOptionPricingModelMemberus-gaap:EquitySecuritiesMembersrt:MaximumMember2022-12-310001534254us-gaap:FairValueInputsLevel3Membersrt:WeightedAverageMembercion:MeasurementInputExpectedVolatilityMemberus-gaap:ValuationTechniqueOptionPricingModelMemberus-gaap:EquitySecuritiesMember2022-12-310001534254Flatworld Intermediate Corp.2023-12-310001534254Flatworld Intermediate Corp.2022-12-310001534254Thrill Holdings LLC2023-12-310001534254Thrill Holdings LLC2022-12-310001534254American Health Staffing Group, Inc.2023-12-310001534254American Health Staffing Group, Inc.2022-12-310001534254Nova Compression, LLC2023-12-310001534254Nova Compression, LLC2022-12-310001534254Mimeo.com, Inc.2023-12-310001534254Mimeo.com, Inc.2022-12-310001534254Coyote Buyer, LLC2023-12-310001534254Coyote Buyer, LLC2022-12-310001534254Rogers Mechanical Contractors, LLC2023-12-310001534254Rogers Mechanical Contractors, LLC2022-12-310001534254Moss Holding Company2023-12-310001534254Moss Holding Company2022-12-310001534254Instant Web, LLC2023-12-310001534254Instant Web, LLC2022-12-310001534254MacNeill Pride Group Corp.2023-12-310001534254MacNeill Pride Group Corp.2022-12-310001534254Tactical Air Support, Inc.2023-12-310001534254Tactical Air Support, Inc.2022-12-310001534254BDS Solutions Intermediateco, LLC2023-12-310001534254BDS Solutions Intermediateco, LLC2022-12-310001534254Bradshaw International Parent Corp.2023-12-310001534254Bradshaw International Parent Corp.2022-12-310001534254Fluid Control II Inc.2023-12-310001534254Fluid Control II Inc.2022-12-310001534254Sleep Opco, LLC2023-12-310001534254Sleep Opco, LLC2022-12-310001534254ESP Associates, Inc.2023-12-310001534254ESP Associates, Inc.2022-12-310001534254OpCo Borrower, LLC2023-12-310001534254OpCo Borrower, LLC2022-12-310001534254H.W. Lochner, Inc.2023-12-310001534254H.W. Lochner, Inc.2022-12-310001534254Critical Nurse Staffing, LLC2023-12-310001534254Critical Nurse Staffing, LLC2022-12-310001534254Dermcare Management, LLC2023-12-310001534254Dermcare Management, LLC2022-12-310001534254Service Compression, LLC2023-12-310001534254Service Compression, LLC2022-12-310001534254Invincible Boat Company LLC2023-12-310001534254Invincible Boat Company LLC2022-12-310001534254RA Outdoors, LLC2023-12-310001534254RA Outdoors, LLC2022-12-310001534254Ironhorse Purchaser, LLC2023-12-310001534254Ironhorse Purchaser, LLC2022-12-310001534254American Clinical Solutions LLC2023-12-310001534254American Clinical Solutions LLC2022-12-310001534254American Teleconferencing Services, Ltd.2023-12-310001534254American Teleconferencing Services, Ltd.2022-12-310001534254Homer City Holdings LLC2023-12-310001534254Homer City Holdings LLC2022-12-310001534254Anthem Sports & Entertainment Inc.2023-12-310001534254Anthem Sports & Entertainment Inc.2022-12-310001534254HW Acquisition, LLC2023-12-310001534254HW Acquisition, LLC2022-12-310001534254Cennox, Inc.2023-12-310001534254Cennox, Inc.2022-12-310001534254Archer Systems, LLC2023-12-310001534254Archer Systems, LLC2022-12-310001534254RumbleOn, Inc.2023-12-310001534254RumbleOn, Inc.2022-12-310001534254WorkGenius, Inc2023-12-310001534254WorkGenius, Inc2022-12-310001534254STATinMED, LLC2023-12-310001534254STATinMED, LLC2022-12-310001534254NWN Parent Holdings LLC2023-12-310001534254NWN Parent Holdings LLC2022-12-3100015342542019-12-3100015342542018-12-3100015342542020-01-012020-12-3100015342542019-01-012019-12-310001534254us-gaap:AdditionalPaidInCapitalMember2023-01-012023-12-310001534254us-gaap:AdditionalPaidInCapitalMember2022-01-012022-12-310001534254us-gaap:AccumulatedOtherComprehensiveIncomeMember2023-01-012023-12-310001534254us-gaap:AccumulatedOtherComprehensiveIncomeMember2022-01-012022-12-31
UNITED STATES
SECURITIES AND EXCHANGE COMMISSION
Washington, D.C. 20549
FORM 10-K
| | | | | |
| ☒ | ANNUAL REPORT PURSUANT TO SECTION 13 OR 15(d) OF THE SECURITIES EXCHANGE ACT OF 1934 |
For the fiscal year ended December 31, 2023
OR
| | | | | |
| ☐ | TRANSITION REPORT PURSUANT TO SECTION 13 OR 15(d) OF THE SECURITIES EXCHANGE ACT OF 1934 |
For the transition period from __________ to __________
Commission File Number 000-54755
| | | | | | | | |
| | CĪON Investment Corporation | |
| | (Exact name of registrant as specified in its charter) | |
| | | | | | | | |
| Maryland | | 45-3058280 |
(State or other jurisdiction of
incorporation or organization) | | (I.R.S. Employer
Identification No.) |
| | |
100 Park Avenue, 25th Floor New York, New York | | 10017 |
| (Address of principal executive offices) | | (Zip Code) |
| | | | | | | | |
| | (212) 418-4700 | |
| | (Registrant’s telephone number, including area code) | |
Securities registered pursuant to Section 12(b) of the Act:
| | | | | | | | |
| Title of each class | Trading symbol(s) | Name of each exchange on which registered |
Common stock, par value $0.001 per share | CION | The New York Stock Exchange |
Securities registered pursuant to Section 12(g) of the Act: None.
Indicate by check mark if the registrant is a well-known seasoned issuer, as defined in Rule 405 of the Securities Act.
Yes ☐ No ☒
Indicate by check mark if the registrant is not required to file reports pursuant to Section 13 or Section 15(d) of the Act.
Yes ☐ No ☒
Indicate by check mark whether the registrant (1) has filed all reports required to be filed by Section 13 or 15(d) of the Securities Exchange Act of 1934 during the preceding 12 months (or for such shorter period that the registrant was required to file such reports), and (2) has been subject to such filing requirements for the past 90 days.
Yes ☒ No ☐
Indicate by check mark whether the registrant has submitted electronically every Interactive Data File required to be submitted pursuant to Rule 405 of Regulation S-T (§232.405 of this chapter) during the preceding 12 months (or for such shorter period that the registrant was required to submit such files).
Yes ☒ No ☐
Indicate by check mark whether the registrant is a large accelerated filer, an accelerated filer, a non-accelerated filer, a smaller reporting company, or an emerging growth company. See the definitions of “large accelerated filer,” “accelerated filer,” “smaller reporting company,” and "emerging growth company" in Rule 12b-2 of the Exchange Act.
| | | | | | | | | | | | | | | | | | | | |
| | Large accelerated filer | ☐ | | Accelerated filer | ☒ | |
| | Non-accelerated filer | ☐ | | Smaller reporting company | ☐ | |
| | | | Emerging growth company | ☐ | |
If an emerging growth company, indicate by check mark if the registrant has elected not to use the extended transition period for complying with any new or revised financial accounting standards provided pursuant to Section 13(a) of the Exchange Act.
☐
Indicate by check mark whether the registrant has filed a report on and attestation to its management’s assessment of the effectiveness of its internal control over financial reporting under Section 404(b) of the Sarbanes-Oxley Act (15 U.S.C. 7262(b)) by the registered public accounting firm that prepared or issued its audit report.
☒
If securities are registered pursuant to Section 12(b) of the Act, indicate by check mark whether the financial statements of the registrant included in the filing reflect the correction of an error to previously issued financial statements.
☐
Indicate by check mark whether any of those error corrections are restatements that required a recovery analysis of incentive-based compensation received by any of the registrant’s executive officers during the relevant recovery period pursuant to §240.10D-1(b).
☐
Indicate by check mark whether the registrant is a shell company (as defined in Rule 12b-2 of the Exchange Act).
Yes ☐ No ☒
The aggregate market value of the voting common stock held by non-affiliates of the registrant on June 30, 2023, based on the closing price on that date of $10.38 on the New York Stock Exchange, was approximately $564,737,167.
The number of shares of the registrant’s common stock, $0.001 par value, outstanding as of March 6, 2024 was 53,844,131.
Documents Incorporated by Reference. None.
CĪON INVESTMENT CORPORATION
FORM 10-K
TABLE OF CONTENTS
PART I
Forward-Looking Statements
Some of the statements within this Annual Report on Form 10-K constitute forward-looking statements because they relate to future events or our future performance or financial condition. The forward-looking statements contained in this Annual Report on Form 10-K involve numerous risks and uncertainties, including statements as to:
•our future operating results;
•our business prospects and the prospects of our portfolio companies, including our and their ability to achieve our respective objectives as a result of inflation, high interest rates and the risk of recession;
•the impact of the investments that we expect to make;
•the ability of our portfolio companies to achieve their objectives;
•our current and expected financings and investments;
•the adequacy of our cash resources, financing sources and working capital;
•the use of borrowed money to finance a portion of our investments;
•the timing of cash flows, if any, from the operations of our portfolio companies;
•our contractual arrangements and relationships with third parties;
•the actual and potential conflicts of interest with our investment adviser, CION Investment Management, LLC, or CIM, a registered investment adviser and our affiliate, and CIM's affiliates;
•the ability of CIM's investment professionals to locate suitable investments for us and the ability of CIM to monitor and administer our investments;
•the ability of CIM and its affiliates to attract and retain highly talented professionals;
•the dependence of our future success on the general economy and its impact on the industries in which we invest, including inflation and high interest rates and the related economic disruptions caused thereby;
•the effects of a changing interest rate environment;
•our ability to source favorable private investments;
•our tax status;
•the effect of changes to tax legislation and our tax position;
•the tax status of the companies in which we invest; and
•the timing and amount of distributions and dividends from the companies in which we invest.
In addition, words such as “anticipate,” “believe,” “expect” and “intend” indicate a forward-looking statement, although not all forward-looking statements include these words. The forward-looking statements contained in this Annual Report on Form 10-K involve risks and uncertainties. Our actual results could differ materially from those implied or expressed in the forward-looking statements for any reason, including the factors set forth in “Risk Factors” in Item 1A of Part I of this Annual Report on Form 10-K. Other factors that could cause actual results to differ materially include:
•changes in the economy;
•risks associated with possible disruption in our operations or the economy generally due to terrorism, pandemics, or natural disasters;
•future changes in laws or regulations and conditions in our operating areas;
•the price at which shares of our common stock may trade on and volume fluctuations in the New York Stock Exchange, or the NYSE; and
•the costs associated with being a publicly traded company.
We have based the forward-looking statements on information available to us on the date of this Annual Report on Form 10-K. Except as required by the federal securities laws, we undertake no obligation to revise or update any forward-looking statements, whether as a result of new information, future events or otherwise. You are advised to review any additional disclosures that we may make directly to you or through reports that we in the future may file with the Securities and Exchange Commission, or the SEC, including Annual Reports on Form 10-K, Quarterly Reports on Form 10-Q and Current Reports on Form 8-K. The forward-looking statements contained in this Annual Report on Form 10-K are excluded from the safe harbor protection provided by Section 27A of the Securities Act of 1933, as amended, or the Securities Act, and Section 21E of the Securities Exchange Act of 1934, as amended, or the Exchange Act.
Summary of Risk Factors
An investment in our securities involves a high degree of risk and may be considered speculative. Some, but not all, of the risks and uncertainties that we face are related to:
Risks Relating to Our Business and Structure
•our ability to achieve our investment objective depends on the ability of CIM to manage and support our investment process and if CIM was to lose any members of its senior management team, our ability to achieve our investment objective could be significantly harmed;
•because our business model depends to a significant extent upon relationships with public and private lenders, selected middle-market private equity sponsors, large private equity sponsors (on a limited basis), investment banks and commercial banks, the inability of CIM or its affiliates to maintain or develop these relationships, or the failure of these relationships to generate investment opportunities, could adversely affect our business;
•we may face increasing competition for investment opportunities, which could delay deployment of our capital, reduce returns and result in losses;
•as required by the Investment Company Act of 1940, as amended, or the 1940 Act, a significant portion of our investment portfolio is and will be recorded at fair value as determined in good faith by our board of directors and, as a result, there is and will be uncertainty as to the value of our portfolio investments;
•there is a risk that investors in our common stock may not receive distributions or that our distributions may not grow over time;
•changes in laws or regulations governing our operations may adversely affect our business or cause us to alter our business strategy;
•any unrealized losses we experience on our portfolio may be an indication of future realized losses, which could reduce our income available for distribution;
Risks Relating to CIM and its Affiliates
•CIM and its affiliates, including our officers and some of our directors, face conflicts of interest caused by compensation arrangements with us and our affiliates, which could result in actions that are not in the best interests of our shareholders;
•we may be obligated to pay CIM incentive compensation even if we incur a net loss due to a decline in the value of our portfolio;
•there may be conflicts of interest related to obligations that CIM’s senior management and investment teams have to other clients;
•our base management and incentive fees may induce CIM to make and identify speculative investments or to incur additional leverage;
•the compensation we pay to CIM was determined without independent assessment on our behalf, and these terms may be less advantageous to us than if such terms had been the subject of arm’s-length negotiations;
Risks Relating to Business Development Companies
•the requirement that we invest a sufficient portion of our assets in qualifying assets could preclude us from investing in accordance with our current business strategy; conversely, the failure to invest a sufficient portion of our assets in qualifying assets could result in our failure to maintain our status as a business development company, or BDC;
•failure to maintain our status as a BDC would reduce our operating flexibility;
•regulations governing our operation as a BDC and as a regulated investment company, or RIC, will affect our ability to raise, and the way in which we raise, additional capital or borrow for investment purposes, which may have a negative effect on our growth;
•our ability to enter into transactions with our affiliates is restricted;
•increasing scrutiny from stakeholders and regulators with respect to ESG matters and corporate social responsibility may impose additional costs and expose us to additional risks;
Risks Relating to Our Investments
•our investments in prospective portfolio companies may be risky, and we could lose all or part of our investment;
•our portfolio companies may incur debt that ranks equally with, or senior to, our investments in such companies;
•there may be circumstances where our debt investments could be subordinated to claims of other creditors or we could be subject to lender liability claims;
•we are exposed to risks associated with changes in interest rates, including the current high interest rate environment;
•inflation has adversely affected and may continue to adversely affect the business, results of operations and financial condition of our portfolio companies;
•second priority liens on collateral securing debt investments that we make to our portfolio companies may be subject to control by senior creditors with first priority liens. If there is a default, the value of the collateral may not be sufficient to repay in full both the first priority creditors and us;
•economic recessions or downturns could impair our portfolio companies and adversely affect our operating results;
•a covenant breach or other defaults by our portfolio companies may adversely affect our operating results;
•investing in middle-market companies involves a number of significant risks, any one of which could have a material adverse effect on our operating results;
•a lack of liquidity in certain of our investments may adversely affect our business;
•we may not have the funds or ability to make additional investments in our portfolio companies or to fund our unfunded debt commitments;
•prepayments of our debt investments by our portfolio companies could adversely impact our results of operations and reduce our return on equity;
•the effect of global climate change may impact our operations and the operations of our portfolio companies;
Risks Relating to Our Debt Financings
•the Small Business Credit Availability Act of 2018 allows us to incur additional leverage and our shareholders approved a proposal permitting us to incur additional leverage, effective December 31, 2021;
•since we have borrowed money, the potential for loss on amounts invested in us is magnified and may increase the risk of investing in us. Borrowed money may also adversely affect the return on our assets, reduce cash available for distribution to our shareholders, and result in losses;
•in addition to regulatory requirements that restrict our ability to raise capital, the JPM Credit Facility, the UBS Facility, the 2026 Notes, the More Term Loans, the Series A Notes and the 2027 Notes contain various covenants that, if not complied with, could accelerate repayment under such secured and unsecured borrowings, thereby materially and adversely affecting our liquidity, financial condition and results of operations;
•the 2026 Notes, the More Term Loans, the Series A Notes and the 2027 Notes are unsecured and therefore are effectively subordinated to any secured indebtedness we have currently incurred or may incur in the future;
Federal Income Tax Risks
•we will be subject to corporate-level income tax if we are unable to qualify as a RIC under Subchapter M of the Internal Revenue Code of 1986, as amended, or the Code, or to satisfy RIC distribution requirements;
Risks Relating to an Investment in Our Common Stock
•the market price of our common stock may fluctuate significantly;
•we cannot assure you that a market for shares of our common stock will be maintained or the market price of our shares will trade close or at a premium to our net asset value, or NAV;
•sales of substantial amounts of our common stock in the public market may have an adverse effect on the market price of our common stock;
•we may in the future determine to issue preferred stock, which could adversely affect the market value of our common stock;
•we may incur significant costs as a result of being a public company;
•in 2023 we obtained, and in 2024 we intend to seek, the approval of our shareholders to issue shares of our common stock at prices below the then current NAV per share of our common stock. If we issue such shares and again receive such approval from shareholders in the future, we may issue shares of our common stock at a price below the then current NAV per share of common stock. Any such issuance could materially dilute your interest in our common stock and reduce our NAV per share and potentially the trading price of our common stock;
•a shareholder’s interest in us will be diluted if we issue additional shares of common stock, which could reduce the overall value of an investment in us;
•purchases of our common stock by us under our 10b5-1 plan may result in dilution to our NAV per share;
General Risk Factors
•global economic, political and market conditions may adversely affect our business, financial condition and results of operations, including our revenue growth and profitability;
•political, social and economic uncertainty, including uncertainty related to the Russia-Ukraine war and more recently the Israel-Hamas war, creates and exacerbates risks;
•the capital markets may experience periods of disruption, instability and economic uncertainty. Such market conditions may materially and adversely affect the debt and equity capital markets, which may have a negative impact on our business and operations;
•we are highly dependent on the information systems of CIG and operational risks including systems failures could significantly disrupt our business, result in losses or limit our growth, which may, in turn, negatively affect the market price of our common stock and our ability to pay distributions; and
•cybersecurity failures and data security incidents could adversely affect our business by causing a disruption to our operations, a compromise or corruption of our confidential, personal or other sensitive information and/or damage to our business relationships or reputation, any of which could negatively impact our business, financial condition and operating results.
Additional risks and uncertainties not currently known to us or that we currently deem to be immaterial may also have a material adverse effect on our business, financial condition and/or operating results. For a more detailed discussion of the risks that you should consider prior to investing in our securities, see “Item 1A. Risk Factors” in this Annual Report on Form 10-K.
Amounts and percentages presented herein may have been rounded for presentation and all dollar amounts, excluding share and per share amounts, are presented in thousands unless otherwise noted. In addition, all share and per share amounts for 2021 have been retroactively adjusted to reflect the two-to-one reverse stock split, which became effective on September 21, 2021, or the Reverse Stock Split.
Item 1. Business
Overview
CĪON Investment Corporation, or the Company, was incorporated under the general corporation laws of the State of Maryland on August 9, 2011. When used in this Annual Report on Form 10-K, the terms “we,” “us,” “our” or similar terms refer to the Company and its consolidated subsidiaries. In addition, the term “portfolio companies” refers to companies in which we have invested, either directly or indirectly through our consolidated subsidiaries.
We are an externally managed, non-diversified, closed-end management investment company that has elected to be regulated as a BDC under the 1940 Act. We elected to be treated for U.S. federal income tax purposes as a RIC, as defined under Subchapter M of the Code.
We are managed by CIM, our affiliate and a registered investment adviser under the Investment Advisers Act of 1940, as amended, or the Advisers Act. Pursuant to an investment advisory agreement with us, CIM oversees the management of our activities and is responsible for making investment decisions for our portfolio. We have also entered into an administration agreement with CIM to provide us with administrative services necessary for us to operate. CIM is a controlled and consolidated subsidiary of CION Investment Group, LLC, or CIG, our affiliate. As a member of CIM, CIG’s investment professionals provide investment advisory services, including advice, evaluation and recommendations with respect to our investments. Additionally, Apollo Investment Management, L.P., or AIM, a subsidiary of Apollo Global Management, Inc. (NYSE: APO), or Apollo, also a member of CIM and a registered investment adviser under the Advisers Act, performs certain services for CIM, which include, among other services, providing (a) trade and settlement support; (b) portfolio and cash reconciliation; (c) market pipeline information regarding syndicated deals, in each case, as reasonably requested by CIM; and (d) monthly valuation reports and support for all broker-quoted investments. AIM may also, from time to time, provide us with access to potential investment opportunities made available on Apollo’s credit platform on a similar basis as other third-party market participants. All of our investment decisions are the sole responsibility of, and are made at the sole discretion of, CIM’s investment committee, which consists entirely of CIG senior personnel.
Our investment objective is to generate current income and, to a lesser extent, capital appreciation for investors. We seek to meet our investment objective by utilizing the experienced management team of CIM, which includes its access to the relationships and human capital of its affiliates in sourcing, evaluating and structuring transactions, as well as monitoring and servicing our investments. Our portfolio is comprised primarily of investments in senior secured debt, including first lien loans, second lien loans and unitranche loans, and, to a lesser extent, collateralized securities, structured products and other similar securities, unsecured debt, and equity, of private and thinly-traded U.S. middle-market companies. See “Item 1. Business – Investment Types” below for a detailed description of the types of investments that may comprise our portfolio. We define middle-market companies as companies that generally possess annual earnings before interest, taxes, depreciation and amortization, or EBITDA, of $75 million or less, with experienced management teams, significant free cash flow, strong competitive positions and potential for growth.
In addition, we may from time to time invest up to 30% of our assets opportunistically in other types of investments, including collateralized securities, structured products and other similar securities and the securities of larger public companies and foreign securities, which may be deemed “non-qualifying assets” for the purpose of complying with investment restrictions under the 1940 Act. See “Item 1. Business - Qualifying Assets” below.
In connection with our debt investments, we may receive equity interests such as warrants or options as additional consideration. We may also purchase equity interests in the form of common or preferred stock in our target companies, either in conjunction with one of our debt investments or through a co-investment with a financial sponsor. We expect that our investments will generally range between $5 million and $50 million each, although investments may vary as the size of our capital base changes and will ultimately be at the discretion of CIM, subject to oversight by our board of directors. We have made and intend to make smaller investments in syndicated loan opportunities, which typically include investments in companies with annual EBITDA of greater than $75 million, subject to liquidity and diversification constraints.
To enhance our opportunity for gain, we employ leverage as market conditions permit and at the discretion of CIM. On March 23, 2018, an amendment to Section 61(a) of the 1940 Act was signed into law to permit BDCs to reduce the minimum “asset coverage” ratio from 200% to 150% and, as a result, to potentially increase the ratio of a BDC's debt to equity from a maximum of 1-to-1 to a maximum of 2-to-1, so long as certain approval and disclosure requirements are satisfied. At our Special Meeting of Shareholders on December 30, 2021, shareholders approved a proposal to reduce our asset coverage ratio to 150% (i.e., $2 of debt outstanding for each $1 of equity), which allows us to increase the maximum amount of leverage that we are permitted to incur. Such asset coverage ratio became effective on December 31, 2021. We are required to make certain disclosures on our website and in SEC filings regarding, among other things, the receipt of approval to increase our leverage, our leverage capacity and usage, and risks related to leverage.
As a BDC, we are subject to certain regulatory restrictions in negotiating or investing in certain investments with entities with which we may be prohibited from doing so under the 1940 Act, such as CIM and its affiliates, unless we obtain an exemptive order from the SEC. On August 30, 2022, we, CIM and certain of our affiliates were granted an order for exemptive relief, or the Order, by the SEC for us to co-invest with other funds managed by CIM or certain affiliates in a manner consistent with our investment objectives, positions, policies, strategies and restrictions as well as regulatory requirements and other pertinent factors. Pursuant to such Order, we generally are permitted to co-invest with certain of our affiliates if a “required majority” (as defined in Section 57(o) of the 1940 Act) of the independent directors make certain conclusions in connection with a co-investment transaction, including that (1) the terms of the proposed transaction, including the consideration to be paid, are reasonable and fair to us and our shareholders and do not involve overreaching of us or our shareholders on the part of any person concerned, (2) the transaction is consistent with the interests of our shareholders and is consistent with our investment objective and strategies, (3) the investment by our affiliates would not disadvantage us, and our participation would not be on a basis different from or less advantageous than that on which our affiliates are investing, and (4) the proposed investment by us would not benefit CIM or its affiliates or any affiliated person of any of them (other than the parties to the transaction), except to the extent permitted by the Order and applicable law, including the limitations set forth in Section 57(k) of the 1940 Act. In addition, the Order permits us to co-invest in our existing portfolio companies with certain affiliates that are private funds, even if such private funds did not have an investment in such existing portfolio company. Even though we were granted the Order by the SEC, CIM’s investment committee may determine that we should not participate in a co-investment transaction.
Portfolio and Investment Activity
As of December 31, 2023, we engaged in the purchase of debt and equity securities primarily issued by portfolio companies and lend directly to portfolio companies. The following table summarizes the composition of our investment portfolio at amortized cost and fair value as of December 31, 2023:
| | | | | | | | | | | | | | | | | | | | |
| | | December 31, 2023 |
| | | Investments Cost(1) | | Investments Fair Value | | Percentage of Investment Portfolio |
| Senior secured first lien debt | | $ | 1,604,111 | | | $ | 1,565,171 | | | 85.0 | % |
| Senior secured second lien debt | | 41,280 | | | 29,111 | | | 1.6 | % |
| Collateralized securities and structured products - equity | | 2,362 | | | 1,096 | | | 0.1 | % |
| Unsecured debt | | 31,693 | | | 12,874 | | | 0.7 | % |
| Equity | | 182,738 | | | 232,572 | | | 12.6 | % |
| Subtotal/total percentage | | 1,862,184 | | | 1,840,824 | | | 100.0 | % |
| Short term investments(2) | | 113,446 | | | 113,446 | | | |
| Total investments | | $ | 1,975,630 | | | $ | 1,954,270 | | | |
| Number of portfolio companies | | | | 111 |
| Purchased at a weighted average price of par | | 96.33 | % |
| Gross annual portfolio yield based upon the purchase price(3) | | 12.12 | % |
(1)Represents amortized cost for debt investments and cost for equity investments. Amortized cost represents the original cost adjusted for the amortization of premiums and/or accretion of discounts, as applicable, on our investments.
(2)Short term investments represent an investment in a fund that invests in highly liquid investments with average original maturity dates of three months or less.
(3)The gross annual portfolio yield does not represent and may be higher than an actual investment return to shareholders because it excludes our expenses and all sales commissions and dealer manager fees and does not consider the cost of leverage.
Our Common Stock and Listings
On December 17, 2012, we met our minimum offering requirement of $2,500 in capital raised from persons not affiliated with us, admitted our initial public investors as shareholders and officially commenced operations. Our initial continuous public offering ended on December 31, 2015, and our follow-on continuous public offering commenced on January 25, 2016 and ended on January 25, 2019, the date on which we closed the public offering of our shares. On October 5, 2021, our shares of common stock commenced trading on the NYSE under the ticker symbol “CION”, or the Listing. Since commencing our initial continuous public offering on July 2, 2012 and through December 31, 2023, we sold 54,184,636 shares of common stock for corresponding net proceeds of $1,133,345. The net proceeds include gross proceeds received from reinvested shareholder distributions of $237,451 pursuant to our pre-Listing distribution reinvestment plan, for which we issued 13,523,489 shares of common stock, and gross proceeds paid for shares of common stock repurchased of $259,392, for which we repurchased 16,084,731 shares of common stock. As of December 31, 2023, 16,084,731 shares of common stock repurchased had been retired. For a complete description of our pre-Listing and post-Listing distribution reinvestment plans and pre-Listing and post-Listing share repurchase programs, refer to "Item 5. Market for Registrant’s Common Equity, Related Shareholder Matters and Issuer Purchases of Equity Securities" in this report.
On February 26, 2023, our shares of common stock and our Series A Notes listed and commenced trading in Israel on the Tel Aviv Stock Exchange Ltd., or the TASE, under the ticker symbol “CION” and "CION B1", respectively. For a detailed discussion of our Series A Notes, refer to Note 8 to our consolidated financial statements included in this report.
On September 15, 2023, our shareholders approved a proposal that authorizes us to issue shares of our common stock at prices below the then current NAV per share of our common stock in one or more offerings for a 12-month period following such shareholder approval. As of December 31, 2023, we had not issued any such shares. See "Item 1. Business - Regulation" below.
Distributions
In January 2013, we began authorizing monthly distributions to our shareholders. From February 1, 2014 through July 17, 2017, our board of directors authorized and declared on a monthly basis a weekly distribution amount per share of our common stock. On July 18, 2017, our board of directors authorized and declared on a quarterly basis a weekly distribution amount per share of our common stock. Effective September 28, 2017, our board of directors delegated to management the authority to determine the amount, record dates, payment dates and other terms of distributions to shareholders, which are ratified by our board of directors, each on a quarterly basis. Beginning on March 19, 2020, we changed the timing of declaring distributions from quarterly to monthly and temporarily suspended the payment of distributions to shareholders commencing with the month ended April 30, 2020. On July 15, 2020, our board of directors determined to recommence the payment of distributions to shareholders in August 2020. On September 15, 2021, we changed the timing of declaring and paying regular distributions to shareholders from monthly to quarterly commencing with the fourth quarter of 2021. Distributions in respect of future quarters and any supplemental or special distributions will be evaluated by management and the board of directors based on circumstances and expectations existing at the time of consideration. Declared regular distributions are paid quarterly.
Our management declared and our board of directors ratified distributions for 7, 5 and 11 record dates during the years ended December 31, 2023, 2022 and 2021, respectively. The following table presents distributions per share that were declared during the years ended December 31, 2023, 2022 and 2021:
| | | | | | | | | | | | | | |
| | | Distributions |
| Three Months Ended | | Per Share(1) | | Amount |
| | | | |
| | | | |
| | | | |
| | | | |
| | | | |
| | | | |
| 2021 | | | | |
| March 31, 2021 (three record dates) | | $ | 0.2648 | | | $ | 15,029 | |
| June 30, 2021 (three record dates) | | 0.2648 | | | 15,000 | |
| September 30, 2021 (three record dates) | | 0.2648 | | | 15,027 | |
| December 31, 2021 (two record dates) | | 0.4648 | | | 26,474 | |
| Total distributions for the year ended December 31, 2021 | | $ | 1.2592 | | | $ | 71,530 | |
| 2022 | | | | |
| March 31, 2022 (one record date) | | $ | 0.2800 | | | $ | 15,948 | |
| June 30, 2022 (one record date) | | 0.2800 | | | 15,949 | |
| September 30, 2022 (one record date) | | 0.3100 | | | 17,604 | |
| December 31, 2022 (two record dates) | | 0.5800 | | | 32,074 | |
| Total distributions for the year ended December 31, 2022 | | $ | 1.4500 | | | $ | 81,575 | |
| 2023 | | | | |
| March 31, 2023 (one record date) | | $ | 0.3400 | | | $ | 18,687 | |
| June 30, 2023 (one record date) | | 0.3400 | | | 18,614 | |
| September 30, 2023 (two record dates) | | 0.3900 | | | 21,276 | |
| December 31, 2023 (three record dates) | | 0.5400 | | | 29,290 | |
| Total distributions for the year ended December 31, 2023 | | $ | 1.6100 | | | $ | 87,867 | |
(1) The per share distribution amount for 2021 has been retroactively adjusted to reflect the Reverse Stock Split as discussed in Note 3 to the consolidated financial statements included within this report.
On March 11, 2024, our co-chief executive officers declared a regular quarterly distribution of $0.34 per share for the first quarter of 2024 payable on March 28, 2024 to shareholders of record as of March 22, 2024.
We intend to pay distributions in an amount sufficient to maintain RIC status each year and to avoid any federal income taxes on income. Therefore, subject to applicable legal restrictions and the sole discretion of our board of directors, we intend to authorize, declare, and pay regular cash distributions on a quarterly basis. However, there can be no assurances that we will maintain positive investment performance in future periods in order to sustain our distributions or be able to pay distributions at all. For a detailed discussion of our distributions, refer to Note 5 to our consolidated financial statements included in this report.
About CIM
CIM is a registered investment adviser and our affiliate. CIM is a controlled and consolidated subsidiary of CIG and part of the CION Investments group of companies, or CION Investments. We believe that CION Investments is a leading manager of alternative investment solutions that focuses on alternative credit strategies for individual investors. CION Investments is headquartered in New York, with offices in Los Angeles and Boston.
Mark Gatto and Michael A. Reisner, together with Keith S. Franz, Gregg A. Bresner, Stephen Roman, Eric A. Pinero and Charlie Arestia, form the senior management team of CIM. Both Messrs. Gatto and Reisner have significant managerial and investing experience and serve as our co-chairmen and co-chief executive officers.
CIM’s senior management team has extensive experience in lending to private U.S. middle-market companies and has developed an expertise in using all levels of a firm’s capital structure to produce income-generating investments, focusing on risk management and delivering risk-adjusted returns that typically are collateralized by a company’s business-essential equipment or corporate infrastructure.
Pursuant to an administration agreement, CIM furnishes us with office facilities and equipment, and clerical, bookkeeping and record keeping services. CIM also oversees our financial records and prepares our reports to shareholders and reports filed with the SEC. CIM also performs the calculation and publication of our NAV and oversees the preparation and filing of our tax returns, the payment of our expenses and the performance of various third party service providers. Furthermore, CIM provides on our behalf managerial assistance to those portfolio companies to which we are required to provide such assistance. On August 7, 2023, our board of directors, including a majority of the board of directors who are not interested persons, approved the renewal of the administration agreement with CIM for a period of twelve months commencing August 9, 2023.
About CION Investments
CION Investments is a leading manager of investment solutions designed to redefine the way individual investors can build their portfolios and help meet their long-term investment goals. With more than 30 years of experience in the alternative asset management industry, CION Investments strives to level the playing field by giving investors direct access to asset management historically only available to the largest institutions. CION Investments provides distribution services as well through CION Securities, LLC, or CION Securities, one of our affiliates.
Market Opportunity
We believe that the market for lending to private U.S. middle-market companies continues to present a compelling investment opportunity. CIM’s management team has witnessed significant demand for debt capital among middle-market companies that have the characteristics we target. We believe that this demand, coupled with the fragmented availability of funding within our target market, will continue to enable us to achieve favorable transaction pricing. We believe that the following characteristics and market trends support our belief:
•The middle-market is a large addressable market that continues to grow. According to the National Center for the Middle Market Year-End 2023 Middle Market Indicator, there are approximately 200,000 U.S. middle-market companies employing approximately 48 million people. Approximately 59% of middle market companies have increased their workforce by an average of 9.6%, which is well above the overall average middle market employment growth rate of 4.8%. In addition, the U.S. middle-market accounts for approximately one-third of private sector gross domestic product, or GDP, which, measured on a global scale, would be the fifth largest global economy. Collectively, the U.S. middle market generates more than $10 trillion in annual revenue. The year-over-year revenue growth rate realized by the middle market reached an all-time high of 12.4%, with 83% of middle market companies reporting revenue increases in 2023 and 55% of middle market companies experiencing double-digit growth compared to 2022. The National Center for the Middle Market defines middle-market companies as those with $10 million to $1 billion in annual revenue, which we believe has significant overlap with our definition of middle-market companies that generally possess EBITDA of $75 million or less.
•Changes in business strategy by banks have further reduced the supply of capital to U.S. middle-market companies. The trend of consolidation of regional banks into money center banks has reduced the focus of these businesses on middle-market lending. Money center banks traditionally focus on lending and providing other services to large corporate clients to whom they can deploy larger amounts of capital more efficiently. We believe that this has resulted in fewer bank lenders to U.S. middle-market companies and reduced the availability of debt capital to the companies that we expect to target. As a result, we believe there is an increasing trend for middle-market companies to seek financing from other sources, such as us.
•It is difficult for new direct lending platforms to enter the middle market and fill the capital void because it is very fragmented. While the middle market is a very large component of the U.S. economy, it is a highly fragmented space with thousands of companies operating in many different geographies and industries. Typically, companies that need capital find lenders and investors based on pre-existing relationships, referrals and word of mouth. Developing the many relationships and wide-spread recognition required to become a source of capital to the middle market is a time consuming, highly resource-intensive endeavor. As a result, we believe that it is difficult for new lending platforms to successfully enter the middle market, thereby providing insulation from rapid shifts in the supply of capital to the middle market that might otherwise disrupt pricing of capital.
•There is a large pool of uninvested private equity capital likely to seek additional senior debt capital to finance strategic transactions. We expect that middle-market private equity firms will continue to invest the approximately $1.7 trillion raised since 2013 in middle-market companies, as reported in Pitchbook’s 3Q 2023 U.S. PE Middle Market Report, and that these private equity firms will seek to support their investments with senior loans from other sources, such as us.
•Specialized lending and unfunded private equity commitments drive demand for debt capital. Lending to small- and middle-market companies requires in-depth diligence, credit expertise, structuring experience and active portfolio management. In addition, middle-market companies may require more active monitoring and participation on the lender’s part. As such, we believe that, of the U.S. financial institutions that are not liquidity constrained, few are capable of pursuing a sustained lending strategy successfully. We believe this creates a significant supply/demand imbalance for small and middle-market credit. We also expect that private equity firms will continue to pursue acquisitions and will seek to leverage their equity investments with debt financing, including senior debt, unitranche debt, and mezzanine loans provided by companies such as ours. According to Pitchbook, from 2020 to 2023, the aggregate assets under management in private debt funds, BDCs, and interval funds investing in middle-market companies have reached $869 billion. Also, adding to the imbalance in the availability of credit is the significant amount of unallocated private equity capital raised since 2013 described above, much of which will require debt financing in the coming years. As depicted in the chart below, almost $956 billion of unfunded private equity commitments were outstanding through the first quarter of 2023 (Source: Pitchbook's Q3 2023 Global Private Credit Review).
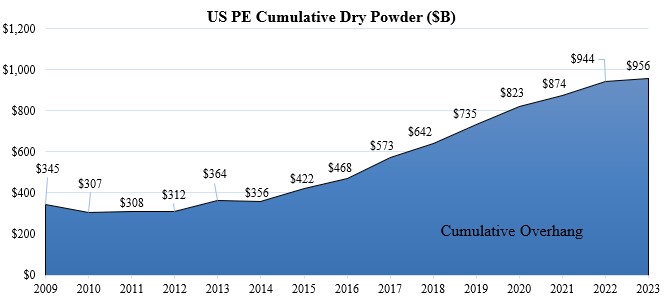
* As of 3/31/2023
•Active private equity focus on small- and middle-market firms. Private equity firms have continued their active roles investing in small- and middle-market companies, and CIM expects this trend to continue. Private equity funds often seek to leverage their investments by combining equity capital with senior secured and mezzanine loans from other sources. Thus, we believe that significant private equity investment in middle-market firms will create substantial investment opportunities for us to fill the role of leverage provider. We believe that the network of relationships between CIM’s senior management team and the private equity community will be a key channel through which we will seek to access significant investment opportunities.
•Attractive market segment. We believe that the underserved nature of such a large segment of the market can at times create a significant opportunity for investment. In particular, we believe that middle-market companies are more likely to offer attractive economics in terms of transaction pricing (including higher debt yields), upfront and ongoing fees, prepayment penalties and more attractive security features in the form of stricter covenants and quality collateral. In addition, as compared to larger companies, middle-market companies often have simpler capital structures and carry less leverage, thus aiding the structuring and negotiation process and allowing us greater flexibility in structuring favorable transactions.
1 Excludes all facilities in default.
Source: Pitchbook LCD and Morningstar LSTA US Leveraged Loan Index.
2 Excludes all facilities in default.
Spread calculations have been adjusted to be based off of the bid rather than par (that is assuming that the discounted margin is as a percent of the current market value rather than the par amount of the loan).
Source: Pitchbook LCD and Morningstar LSTA US Leveraged Loan Index.
Characteristics of and Risks Related to Investments in Private Companies
We have invested and continue to invest primarily in the debt of privately held companies. Investments in private companies pose significantly greater risks as compared to investments in public companies. First, private companies have reduced access to the capital markets, resulting in diminished capital resources and ability to withstand financial distress. Second, the investments themselves are often illiquid. As such, we may have difficulty exiting an investment promptly or at a desired price prior to maturity or outside of a normal amortization schedule. In addition, little public information generally exists about private companies. Finally, these companies often do not have third-party debt ratings or audited financial statements. We must therefore rely on the ability of CIM to obtain adequate information through its due diligence efforts to evaluate the creditworthiness of, and risks involved with, investing in these companies. These companies and their financial information will also generally not be subject to the Sarbanes-Oxley Act, and other rules and regulations that govern public companies that are designed to protect investors.
Investment Strategy
When evaluating an investment, we use the resources of CIM to develop an investment thesis and a proprietary view of a potential company’s value. When identifying prospective portfolio companies, we focus primarily on the following attributes, which we believe will help us generate higher total returns with an acceptable level of risk. These attributes are:
•Leading, defensible market positions that present attractive growth opportunities. We seek to invest in companies that we believe possess advantages in scale, scope, customer loyalty, product pricing or product quality versus their competitors, minimizing sales risk and protecting profitability.
•Companies with leading market positions and strong free cash flows. We seek to invest in the debt of companies that have a leading market position or other significant competitive advantages and significant free cash flow. We believe that such companies are able to maintain consistent cash flow to service and repay our loans and maintain growth or market share.
•Investing in middle-market, private companies. We seek to invest in middle-market, private companies that generally possess annual EBITDA of $75 million or less at the time of investment. We do not intend to invest in start-up companies, turnaround situations or companies with speculative business plans.
•Proven management teams with meaningful equity ownership. We focus on investments in which the target company has an experienced management team with an established track record of success. We typically require the portfolio companies to have in place proper incentives to align management’s goals with ours. Generally, we focus on companies in which the management teams have significant equity interests.
•Private equity sponsorship. Often we seek to participate in transactions sponsored by what we believe to be high-quality private equity firms. CIM’s management team believes that a private equity sponsor’s willingness to invest significant sums of equity capital into a company provides an additional level of due diligence investigation and is an implicit endorsement of the quality of the investment. Further, by co-investing with quality private equity firms that commit significant sums of equity capital with junior priority to our debt investments, we may benefit from having due diligence on our investments performed by both parties. Further, strong private equity sponsors with significant investments at risk have the ability and a strong incentive to contribute additional capital in difficult economic times should operational or financial issues arise.
•Broad portfolio. We seek to create a portfolio of companies engaged in a variety of industries and located in a variety of geographic locations, thereby potentially reducing the risk of a downturn in any one industry, including, without limitation, because of inflation, high interest rates, the risk of recession, or geographic location having a disproportionate impact on the value of our portfolio. We are not a “diversified company” as such term is defined under the 1940 Act. Because we are a BDC, we focus on and invest at least 70% of our total assets in U.S. companies, but seek to maintain investments across the various geographic regions of the U.S. To the extent that we invest in foreign companies, we intend to do so in accordance with the limitations under the 1940 Act and only in jurisdictions with established legal frameworks and a history of respecting creditor rights, including the United Kingdom and countries that are members of the European Union, as well as Canada, Australia and Japan. We cannot assure investors that we will be successful in our efforts to maintain a broad portfolio of investments.
•Viable exit strategy. We focus our investment activity primarily in companies whose business models and growth prospects offer attractive exit possibilities, including repayment of our investments, with the potential for capital gain on any equity interest we hold through an initial public offering of common stock, a merger, a sale or other recapitalization.
Moreover, we may acquire investments in the secondary loan market, and, in analyzing such investments, we will employ the same analytical process that we use for our primary investments.
Potential Competitive Advantages
We believe that we offer to our investors the following potential competitive advantages over other capital providers to private U.S. middle-market companies:
•Proven ability to invest in middle-market companies. We believe that CIM has proven its ability to source, structure and manage private investments for us since our inception in 2012. In addition, CIM maintains a deep and diverse network of highly experienced and like-minded partners including, without limitation, public and private lenders, selected middle-market private equity sponsors, large private equity sponsors (on a limited basis), and lightly syndicated loans. We leverage these proprietary relationships and CIM’s expertise, which we believe enables us to be highly selective with a diverse array of investment opportunities that offer the most favorable risk/reward characteristics.
•We are CIM’s only client resulting in its investment professionals sourcing for and managing a single investment platform. Since we are CIM’s only client, its investment professionals solely source for and manage our investment portfolio, which we believe results in sourcing focus and efficiencies. CIM’s investment professionals do not source and monitor the investments of other funds within a larger platform, which we believe provides for a more efficient, focused, and responsive investment process. This allows CIM’s investment professionals to provide timely, candid feedback to potential borrowers and deal partners, and to solely focus on one investment portfolio building the knowledge and expertise from sourcing, to monitoring, to exit. All investment opportunities are sourced and underwritten by CIM only with our risk and return objectives in mind, which we believe mitigates the potential risk of conflict among numerous portfolio managers within a larger platform.
•First lien investment focus rather than relying on the capital structure to generate risk-adjusted returns. Although CIM will selectively target higher return/special situation investments in the secondary loan market through the purchase of illiquid, lightly syndicated loans, CIM focuses primarily on senior secured first lien loans to private U.S. middle-market companies rather than relying on such borrower’s capital structure to generate risk-adjusted returns from junior debt or equity investments. In addition to providing us with favorable returns, we believe that this first lien investment focus allows us to mitigate risk in the event of a borrower’s default since we will be in a senior secured first lien position with respect to such borrower’s assets.
•Long-term investment horizon. We believe that our flexibility to make investments with a long-term view provides us with the opportunity to generate favorable returns on invested capital and expands the types of investments that we may consider. The long-term nature of our capital structure helps us avoid disposing of assets at unfavorable prices and we believe makes us a better partner for portfolio companies.
•Transaction sourcing capability. CIM seeks to identify attractive investment opportunities both through active origination channels and through its long-term relationships with numerous corporate and fund management teams, members of the financial community and potential corporate partners. We also have access to the experience of CIM’s officers in sourcing middle-market transactions through such persons’ network of originators and underwriters. We believe that the broad networks of CIM and its affiliates will continue to produce a significant amount of investment opportunities for us.
•Disciplined, income-oriented investment philosophy. CIM employs a defensive investment approach focused on long-term credit performance and principal protection. This investment approach involves a multi-stage selection process for each investment opportunity as well as ongoing monitoring by CIM of each investment made, with particular emphasis on early detection of credit deterioration. This strategy is designed to maximize current yield and minimize the risk of capital loss while maintaining potential for long-term capital appreciation.
•Ability to utilize a wide range of transaction structures. Although CIM focuses primarily on senior secured first lien debt, we believe that CIM’s broad expertise and experience in transaction structuring at all levels of a company’s capital structure affords us numerous tools to manage risk while preserving the opportunity for returns on investments. We attempt to capitalize on this expertise in an effort to produce an investment portfolio that will perform in a broad range of economic conditions. In addition, we believe that the ability to offer several forms of financing makes us an attractive provider of capital to prospective portfolio companies. Such flexible transaction structuring allows a prospective portfolio company to forego the substantial cost of conducting multiple negotiations and undergoing multiple due diligence processes to secure the different types of capital it requires.
Investment Types
There are a number of investment types corresponding to a company’s capital structure. Typically, investors determine the appropriate type of investment based upon their risk and return requirements. Below is a diagram illustrating where these investments lie in a typical target company’s capital structure. First lien debt is situated at the top of the capital structure, and typically has the first claim on the assets and cash flows of the company, followed by second lien debt, mezzanine debt, preferred equity and finally common equity. Due to this priority of cash flows and claims on assets, an investment’s risk increases as it moves further down the capital structure. Investors are usually compensated for this risk associated with junior status in the form of higher returns, either through higher interest payments or potentially higher capital appreciation.
We focus primarily on investments in senior secured debt, including first lien loans, second lien loans and unitranche loans, and, to a lesser extent, collateralized securities, structured products and other similar securities, unsecured debt, including corporate bonds and long-term subordinated loans, referred to as mezzanine loans, and equity. The mix of investments in our portfolio and other aspects regarding the implementation of our strategy may change materially over time.
Although we focus primarily on senior secured first lien debt, CIM can tailor our investment focus as market conditions evolve. Depending on market conditions and other factors, we may, as noted above, increase or decrease our exposure to less senior portions of the capital structure, where returns tend to be stronger in a more stable or growing economy, but less secure in weak economic environments. We rely on CIM’s experience to structure investments, potentially using all levels of the capital structure, which we believe will perform in a broad range of economic environments.
Typical Leveraged Capital Structure Diagram
Senior Secured Debt
First Lien Loans
First lien secured loans are situated at the top of the capital structure. Because these loans have priority in payment, they carry the least risk among all investments in a company. Generally, our first lien secured loans are expected to have maturities of three to six years, offer some form of amortization, and have first priority security interests in the assets of the borrower. We expect that our first lien secured loans typically will have variable interest rates ranging between 4.0% and 9.0% over a standard benchmark, such as the prime rate or the Secured Overnight Financing Rate, or SOFR. In some cases, a portion of the total interest may accrue or be paid in kind.
Unitranche Loans
Unitranche loans provide all of the debt needed to finance a leveraged buyout or other corporate transaction, both senior and subordinated, but generally in a first lien position, while the borrower generally pays a blended, uniform interest rate rather than different rates for different tranches. Unitranche loans generally require payments of both principal and interest throughout the life of the loan. Unitranche loans generally have contractual maturities of five to six years and interest is generally paid quarterly. Generally, we expect these securities to carry a blended yield that is between first lien secured and subordinated debt interest rates. Unitranche loans provide a number of advantages for borrowers, including the following: simplified documentation, greater certainty of execution and reduced decision-making complexity throughout the life of the loan. In addition, we may receive additional returns from any warrants we may receive in connection with these investments. In some cases, a portion of the total interest may accrue or be paid in kind.
Second Lien Loans
Second lien secured loans are immediately junior to first lien secured loans and have substantially the same maturities, collateral and covenant structures as first lien secured loans. Second lien secured loans, however, are granted a second priority security interest in the assets of the borrower. In return for this junior ranking, second lien secured loans generally offer higher returns compared to first lien secured debt. These higher returns come in the form of higher interest and in some cases the potential for equity participation through warrants, though to a lesser extent than with mezzanine loans. Generally, we expect these loans to carry a fixed rate of 10.0% to 13.0% or a floating current yield of 7.0% to 12.0% over the prime rate or SOFR. In addition, we may receive additional returns from any warrants we may receive in connection with these investments. In some cases, a portion of the total interest may accrue or be paid in kind.
Unsecured Debt
In addition to first lien loans and second lien loans, we also may invest a portion of our assets in unsecured debt, including corporate bonds and subordinated debt. Unsecured debt investments usually rank junior in priority of payment to first lien loans and second lien loans, but are situated above preferred equity and common stock in the capital structure. In return for their junior status compared to first lien loans and second lien loans, unsecured debt investments typically offer higher returns through both higher interest rates and possible equity ownership in the form of warrants, enabling the lender to participate in the capital appreciation of the borrower. These warrants typically require only a nominal cost to exercise. We intend to generally target unsecured debt with interest-only payments throughout the life of the security, with the principal due at maturity. Typically, unsecured debt investments have maturities of five to eight years. Generally, we expect these securities to carry a fixed rate of 10% to 15%. In addition, we may receive additional returns from any warrants we may receive in connection with these investments. In some cases, a portion of the total interest may accrue or be paid in kind.
Collateralized Securities, Structured Products and Other
We may also invest in collateralized securities, structured products and other similar securities, which may include collateralized debt obligations, or CDOs, collateralized bond obligations, or CBOs, collateralized loan obligations, or CLOs, structured notes and credit-linked notes. These investments may be structured as trusts or other types of pooled investment vehicles. They may also involve the deposit with or purchase by an entity of the underlying investments and the issuance by that entity of one or more classes of securities backed by, or representing interests in, the underlying investments or referencing an indicator related to such investments. CDOs, CBOs and CLOs are types of asset-backed securities issued by special purpose vehicles created to reapportion the risk and return characteristics of a pool of assets. The underlying pool for a CLO, for example, may include domestic and foreign senior loans, senior unsecured loans and subordinate corporate loans.
Equity and Equity-Related Securities
While we intend to maintain our focus on investments in debt securities, from time to time, when we see the potential for significant gains, or in connection with securing particularly favorable terms in a debt investment, we may make primarily non-control investments in preferred or common equity, typically in conjunction with a private equity sponsor we believe to be of high quality. Alternatively, we may hold equity-related securities consisting primarily of warrants or other equity interests generally obtained in connection with our unsecured debt investments. In the future, we may achieve liquidity through a merger or acquisition of a portfolio company, a public offering of a portfolio company’s stock or by exercising our right, if any, to require a portfolio company to repurchase the equity-related securities we hold. With respect to any preferred or common equity investments, we expect to target an annual investment return of at least 20%.
Non-U.S. Securities
We may invest in non-U.S. securities, which may include securities denominated in U.S. dollars or in non-U.S. currencies, to the extent permitted by the 1940 Act.
Cash and Cash Equivalents
We may maintain a certain level of cash or equivalent instruments to make follow-on investments, if necessary, in existing portfolio companies or to take advantage of new opportunities.
Comparison of Targeted Debt Investments to Corporate Bonds
Loans to private companies are debt instruments that can be compared to corporate bonds to aid an investor’s understanding. As with corporate bonds, loans to private companies can range in credit quality depending on security-specific factors, including total leverage, amount of leverage senior to the security in question, variability in the issuer’s cash flows, the quality of assets securing debt and the degree to which such assets cover the subject company’s debt obligations. As is the case in the corporate bond market, we will require greater returns for securities that we perceive to carry increased risk. The companies in which we invest may be leveraged, often as a result of leveraged buyouts or other recapitalization transactions, and, in certain cases, will not be rated by national rating agencies. We believe that our targeted debt investments typically will carry ratings from a nationally recognized statistical ratings organization, or NRSRO, and that such ratings generally will be below investment grade (rated lower than “Baa3” by Moody’s or lower than “BBB-” by S&P). To the extent we make unrated investments, we believe that such investments would likely receive similar ratings if they were to be examined by an NRSRO. Compared to below-investment grade corporate bonds that are typically available to the public, our targeted first lien secured and second lien secured loan investments are higher in the capital structure, have priority in receiving payment, are secured by the issuer’s assets, allow the lender to seize collateral if necessary, and generally exhibit higher rates of recovery in the event of default. Corporate bonds, on the other hand, are often unsecured obligations of the issuer.
The market for loans to private companies possesses several key differences compared to the corporate bond market. For instance, due to a possible lack of debt ratings for certain middle market firms, and also due to the reduced availability of information for private companies, investors must conduct extensive due diligence investigations before committing to an investment. This intensive due diligence process gives the investor significant access to management, which is often not possible in the case of corporate bondholders, who rely on underwriters, debt rating agencies and publicly available information for due diligence reviews and monitoring of corporate issuers. While holding these investments, private debt investors often receive monthly or quarterly updates on the portfolio company’s financial performance, along with possible representation on the company’s board of directors, which allows the investor to take remedial action quickly if conditions happen to deteriorate. Due to reduced liquidity, the relative scarcity of capital and extensive due diligence and expertise required on the part of the investor, we believe that private debt securities typically offer higher returns than corporate bonds of equivalent credit quality.
CION/EagleTree Partners, LLC
On December 21, 2021, we formed CION/EagleTree Partners, LLC, or CION/EagleTree, an off-balance sheet joint venture partnership with ET-BC Debt Opportunities, LP, or ET-BC, which is an affiliate of EagleTree Capital, LP, or EagleTree. EagleTree made a Firm-level investment with proprietary capital. CION/EagleTree jointly pursues debt and equity opportunities, as well as special situation, crossover, subordinated and other junior capital investments that leverages our and EagleTree's combined sourcing and portfolio management capabilities.
We contributed a portfolio of second lien loans and equity investments and ET-BC contributed proprietary Firm-level cash in exchange for 85% and 15%, respectively, of the senior secured notes, participating preferred equity, and common share interests of CION/EagleTree. We and ET-BC are not required to make any additional capital contributions to CION/EagleTree. Our equity investment in CION/EagleTree is not redeemable. All portfolio and other material decisions regarding CION/EagleTree must be submitted to its board of managers, which is comprised of four members, two of whom were selected by us and the other two were selected by ET-BC. Further, all portfolio and other material decisions require the affirmative vote of at least one board member from us and one board member from ET-BC.
We also serve as administrative agent to CION/EagleTree to provide servicing functions and other administrative services. In certain cases, these servicing functions and other administrative services may be performed by CIM. Amounts charged to CION/EagleTree by us for services performed by CIM are netted against amounts we are charged by CIM for administrative services.
On December 21, 2021, CION/EagleTree issued senior secured notes of $61,629 to us and $10,875 to ET-BC, or the CION/EagleTree Notes. The CION/EagleTree Notes bear interest at a fixed rate of 14.0% per year and are secured by a first priority security interest in all of the assets of CION/EagleTree. As of December 31, 2023, we held $59,598 and ET-BC held $4,904 of the CION/EagleTree Notes. The obligations of CION/EagleTree under the CION/EagleTree Notes are non-recourse to us.
Operating and Regulatory Structure
Our investment activities are managed by CIM and supervised by our board of directors, a majority of whom are independent.
Pursuant to our investment advisory agreement, as amended and restated, we pay CIM an annual base management fee based on our gross assets as well as incentive fees based on our performance. The annual base management fee is calculated at a rate of 1.5% of the average value of our gross assets (including cash pledged as collateral for our secured financing arrangements, but excluding other cash and cash equivalents so that investors do not pay the base management fee on such assets) to the extent that our asset coverage ratio is greater than or equal to 200% (i.e., $1 of debt outstanding for each $1 of equity); provided that, the annual base management fee is reduced to 1.0% of the average value of our gross assets (including cash pledged as collateral for our secured financing arrangements, but excluding other cash and cash equivalents so that investors do not pay the base management fee on such assets) purchased with leverage resulting in our asset coverage ratio dropping below 200%. At our Special Meeting of Shareholders on December 30, 2021, shareholders approved a proposal to reduce our asset coverage ratio to 150%, which became effective on December 31, 2021. The annual base management fee is payable to CIM quarterly in arrears and is calculated based on the two most recently completed calendar quarters.
The incentive fee consists of two parts.
•The first part, which we refer to as the subordinated incentive fee on income, is calculated and payable to CIM quarterly in arrears based upon our “pre-incentive fee net investment income” for the immediately preceding quarter and is subject to a hurdle rate, measured quarterly and expressed as a rate of return on our net assets at the beginning of the calendar quarter, equal to 1.625% per quarter, or an annualized rate of 6.5%, or the hurdle rate. We pay to CIM (x) 100.0% of our pre-incentive fee net investment income, if any, that exceeds the hurdle rate, but is less than or equal to 1.970% in any calendar quarter (7.879% annualized) and (y) 17.5% of the amount of our pre-incentive fee net investment income, if any, that exceeds 1.970% in any calendar quarter (7.879% annualized); and
•The second part of the incentive fee, which we refer to as the incentive fee on capital gains, is an incentive fee on capital gains earned on liquidated investments from our investment portfolio during operations and is determined and payable to CIM in arrears as of the end of each calendar year (or upon termination of the investment advisory agreement). This fee equals 17.5% of our incentive fee capital gains (i.e., our realized capital gains on a cumulative basis from inception, calculated as of the end of each calendar year, computed net of all realized capital losses and unrealized capital depreciation on a cumulative basis), less the aggregate amount of any previously paid incentive fees on capital gains.
On July 11, 2017, the members of CIM entered into the third amended and restated limited liability company agreement of CIM, or the Third Amended CIM LLC Agreement, for the purpose of creating a joint venture between AIM and CIG. Under the Third Amended CIM LLC Agreement, AIM became a member of CIM and was issued a newly-created class of membership interests in CIM pursuant to which AIM, among other things, shares in the profits, losses, distributions and expenses of CIM with the other members in accordance with the terms of the Third Amended CIM LLC Agreement, which results in CIG and AIM each owning a 50% economic interest in CIM.
On July 10, 2017, our independent directors unanimously approved the termination of the investment sub-advisory agreement with AIM, effective as of July 11, 2017. Although the investment sub-advisory agreement and AIM's engagement as our investment sub-adviser were terminated, AIM continues to perform certain services for CIM and our company. AIM is not paid a separate fee in exchange for such services, but is entitled to receive distributions as a member of CIM as described above.
On December 4, 2017, the members of CIM entered into the fourth amended and restated limited liability company agreement of CIM, or the Fourth Amended CIM LLC Agreement, under which AIM performs certain services for CIM, which include, among other services, providing (a) trade and settlement support; (b) portfolio and cash reconciliation; (c) market pipeline information regarding syndicated deals, in each case, as reasonably requested by CIM; and (d) monthly valuation reports and support for all broker-quoted investments. AIM may also, from time to time, provide us with access to potential investment opportunities made available on Apollo’s credit platform on a similar basis as other third-party market participants. All of our investment decisions are the sole responsibility of, and are made at the sole discretion of, CIM's investment committee, which consists entirely of CIG senior personnel.
Pursuant to an administration agreement, CIM provides us with general ledger accounting, fund accounting, investor relations, employee compensation and benefit-related services, and other administrative services. In addition, we have contracted with U.S. Bancorp Fund Services, LLC to provide additional accounting and administrative services.
We are an externally managed, non-diversified, closed-end management investment company that has elected to be regulated as a BDC under the 1940 Act. As a BDC, we are required to comply with certain regulatory requirements. Also, while we are permitted to finance investments using debt, our ability to use debt is limited in certain significant respects pursuant to the 1940 Act. Within the limits of existing regulation, we will adjust our use of debt, according to market conditions, to the level we believe will allow us to generate maximum risk-adjusted returns. We elected to be treated for federal income tax purposes, and intend to qualify annually, as a RIC under Subchapter M of the Code.
Sources of Income
The primary means through which our shareholders will receive a return of value is through interest income, dividends and capital gains generated by our investments. In addition to these sources of income, we may receive fees paid by our portfolio companies, including one-time closing fees paid at the time an investment is made and/or monitoring fees paid throughout the term of our investments. Closing fees typically range from 1.0% to 3.0% of the purchase price of an investment, while annual monitoring fees generally range from 0.25% to 1.0% of the purchase price of an investment. In addition, we may generate revenue in the form of commitment and capital structuring fees, monitoring fees, fees for providing managerial assistance and possibly consulting fees and performance-based fees. Any such fees generated in connection with our investments will be recognized when earned.
Risk Management
We seek to limit the downside potential of our investment portfolio by:
•applying our investment strategy guidelines for portfolio investments;
•requiring a total return on investments (including both interest and potential appreciation) that adequately compensates us for credit risk;
•creating and maintaining a broad portfolio of investments, size permitting, with an adequate number of companies, across different industries, with different types of collateral; and
•negotiating or seeking debt investments with covenants or features that protect us while affording portfolio companies flexibility in managing their businesses consistent with preservation of capital.
Such restrictions may include affirmative and negative covenants, default penalties, lien protection, change of control provisions and board rights. We may also enter into interest rate hedging transactions at the sole discretion of CIM. Such transactions will enable us to selectively modify interest rate exposure as market conditions dictate. Furthermore, our ability to engage in hedging transactions may be adversely affected by rules adopted by the U.S. Commodity Futures Trading Commission, or CFTC.
Affirmative Covenants
Affirmative covenants require borrowers to take actions that are meant to ensure the solvency of the company, facilitate the lender’s monitoring of the borrower, and ensure payment of interest and loan principal due to lenders. Examples of affirmative covenants include covenants requiring the borrower to maintain adequate insurance, accounting and tax records, and to produce frequent financial reports for the benefit of the lender.
Negative Covenants
Negative covenants impose restrictions on the borrower and are meant to protect lenders from actions that the borrower may take that could harm the credit quality of the lender’s investment. Examples of negative covenants include restrictions on the payment of distributions and restrictions on the issuance of additional debt without the lender’s approval. In addition, certain covenants restrict a borrower’s activities by requiring it to meet certain earnings interest coverage ratio and leverage ratio requirements. These covenants are also referred to as financial or maintenance covenants.
Investment Process
The investment professionals employed by CIM have spent their careers developing the resources necessary to make investments in private companies. Our transaction process is highlighted below.
Our Transaction Process
Sourcing
CIM utilizes its access to transaction flow to source transactions. With respect to CIM’s origination channel, CIM seeks to leverage CION Investments' significant industry relationships and investment personnel that actively source new investments. We believe that CIM’s broad networks have produced and will continue to produce a significant pipeline of investment opportunities for us.
Evaluation
Initial Review. In its initial review of an investment opportunity to present to us, CIM’s transaction team examines information furnished by the target company and external sources, including rating agencies, if applicable, to determine whether the investment meets our basic investment criteria and other guidelines, within the context of creating and maintaining a broad portfolio of investments, and offers an acceptable probability of attractive returns with identifiable downside risk.
Credit Analysis/Due Diligence. Before undertaking an investment, the transaction team from CIM conducts a thorough due diligence review of the opportunity to ensure the company fits our investment strategy, which may include:
•a full operational analysis to identify the key risks and opportunities of the target’s business, including a detailed review of historical and projected financial results;
•a detailed analysis of industry dynamics, competitive position, regulatory, tax and legal matters;
•on-site visits, if deemed necessary, as well as meetings and other engagements with management and other key personnel;
•background checks to further evaluate management and other key personnel;
•a review by legal and accounting professionals, environmental or other industry consultants, if necessary;
•financial sponsor due diligence, including portfolio company and lender reference checks, if necessary; and
•a review of management’s experience and track record.
When possible, our advisory team seeks to structure transactions in such a way that our target companies are required to bear the costs of due diligence, including those costs related to any outside consulting work we may require.
CIM may integrate environmental, social and governance, or ESG, risk considerations within its process for originating loans to U.S. middle market companies. As part of its due diligence process, CIM may consider, alongside other relevant factors, ESG risks, events or conditions that have or could have a material negative impact on the operating and performance metrics of these borrowers in the portfolio. Depending on the circumstances, examples of ESG risks can include physical environmental risks, climate change transition risks, supply chain disruptions, improper labor practices, lack of board diversity and corruption. CIM may utilize proprietary research to assess ESG risks that are relevant to our investment.
Execution
Recommendation. CIM seeks to maintain a defensive approach toward its investment recommendations by emphasizing risk control in its transaction process, which includes (1) the pre-review of each opportunity by one of its portfolio managers to assess the general quality, value and fit relative to our portfolio, (2) where possible, transaction structuring with a focus on preservation of capital in varying economic environments and (3) ultimate approval of investment recommendations by CIM’s investment committee.
Approval. After completing its internal transaction process, the CIM transaction team makes formal recommendations for review and approval by CIM's investment committee. In connection with its recommendation, it transmits any relevant underwriting material and other information pertinent to the decision-making process. Each new investment that we make requires the approval of a majority of members of CIM's investment committee.
Monitoring
Portfolio Monitoring. CIM closely monitors our portfolio companies on an ongoing basis, as well as monitors the financial trends of each portfolio company to determine if each is meeting its respective business plans and to assess the appropriate course of action for each company. In addition, depending on the size, nature and performance of the transaction, senior investment professionals of CIM may take board seats or obtain board observation rights for our portfolio companies.
CIM has several methods of evaluating and monitoring the performance and fair value of our investments, which includes, but are not limited to, the assessment of success in adhering to a portfolio company’s business plan and compliance with covenants; periodic and regular contact with portfolio company management and, if appropriate, the financial or strategic sponsor, to discuss financial position, requirements and accomplishments; comparisons to other portfolio companies in the industry; attendance at and participation in board meetings; and review of monthly and quarterly financial statements and financial projections for portfolio companies.
CIM uses an investment rating system to characterize and monitor our expected level of returns on each investment in our portfolio. These ratings are just one of several factors that CIM uses to monitor our portfolio, are not in and of themselves determinative of fair value or revenue recognition and are presented for indicative purposes. CIM rates the credit risk of all investments on a scale of 1 to 5 no less frequently than quarterly. This system is intended primarily to reflect the underlying risk of a portfolio investment relative to our initial cost basis in respect of such portfolio investment (i.e., at the time of acquisition), although it may also take into account under certain circumstances the performance of the portfolio company’s business, the collateral coverage of the investment and other relevant factors.
The following is a description of the conditions associated with each investment rating used in this ratings system:
| | | | | | | | |
| Investment Rating | | Description |
| | |
| 1 | | Indicates the least amount of risk to our initial cost basis. The trends and risk factors for this investment since origination or acquisition are generally favorable, which may include the performance of the portfolio company or a potential exit. |
| 2 | | Indicates a level of risk to our initial cost basis that is similar to the risk to our initial cost basis at the time of origination or acquisition. This portfolio company is generally performing in accordance with our analysis of its business and the full return of principal and interest or dividend is expected. |
| 3 | | Indicates that the risk to our ability to recoup the cost of such investment has increased since origination or acquisition, but full return of principal and interest or dividend is expected. A portfolio company with an investment rating of 3 requires closer monitoring. |
| 4 | | Indicates that the risk to our ability to recoup the cost of such investment has increased significantly since origination or acquisition, including as a result of factors such as declining performance and noncompliance with debt covenants, and we expect some loss of interest, dividend or capital appreciation, but still expect an overall positive internal rate of return on the investment. |
| 5 | | Indicates that the risk to our ability to recoup the cost of such investment has increased materially since origination or acquisition and the portfolio company likely has materially declining performance. Loss of interest or dividend and some loss of principal investment is expected, which would result in an overall negative internal rate of return on the investment. |
For investments rated 3, 4 or 5, CIM enhances its level of scrutiny over the monitoring of such portfolio company.
CIM monitors and, when appropriate, changes investment ratings assigned to each investment in our portfolio. In connection with our valuation process, CIM reviews these investment ratings on a quarterly basis.
The following table summarizes the composition of our investment portfolio based on the 1 to 5 investment rating scale at fair value as of December 31, 2023 and 2022, excluding short term investments of $113,446 and $10,869, respectively:
| | | | | | | | | | | | | | | | | | | | | | | | | | |
| | | December 31, 2023 | | December 31, 2022 |
| Investment Rating | | Investments Fair Value | | Percentage of Investment Portfolio | | Investments Fair Value | | Percentage of Investment Portfolio |
| 1 | | $ | 98,255 | | | 5.3 | % | | $ | 24,450 | | | 1.4 | % |
| 2 | | 1,603,975 | | | 87.2 | % | | 1,424,681 | | | 81.5 | % |
| 3 | | 120,132 | | | 6.5 | % | | 260,662 | | | 14.9 | % |
| 4 | | 10,304 | | | 0.6 | % | | 39,032 | | | 2.2 | % |
| 5 | | 8,158 | | | 0.4 | % | | 336 | | | — | |
| | | $ | 1,840,824 | | | 100.0 | % | | $ | 1,749,161 | | | 100.0 | % |
The amount of the investment portfolio in each rating category may vary substantially from period to period resulting primarily from changes in the composition of such portfolio as a result of new investment, repayment and exit activities. In addition, changes in the rating of investments may be made to reflect our expectation of performance and changes in investment values.
Valuation Process. Each quarter, we value investments in our portfolio, and such values are disclosed each quarter in reports filed with the SEC. Investments for which market quotations are readily available are recorded at such market quotations. With respect to investments for which market quotations are not readily available, our board of directors determines the fair value of investments, including through delegation to CIM as our valuation designee, in good faith utilizing the input of our audit committee, CIM, and any other professionals or materials that our board of directors deems worthy and relevant, including independent third-party valuation firms, if applicable.
Managerial Assistance. As a BDC, we must offer, and provide upon request, managerial assistance to certain of our portfolio companies. This assistance could involve, among other things, monitoring the operations of our portfolio companies, participating in board and management meetings, consulting with and advising officers of portfolio companies and providing other organizational and financial guidance. Depending on the nature of the assistance required, CIM will provide such managerial assistance on our behalf to portfolio companies that request this assistance. To the extent fees are paid for these services, we, rather than CIM, will retain any fees paid for such assistance.
Exit
Exit Transactions. We seek to invest in companies that can generate consistent cash flow to repay their loans while maintaining growth in their businesses. We expect this internally generated cash flow to be a key means through which we will receive timely payment of interest and loan principal. Additionally, we attempt to invest in portfolio companies whose business models and growth prospects offer attractive exit possibilities via third-party transactions, including sales to strategic or other buyers and initial public offerings of common stock. Such third-party transactions may be particularly important in realizing capital gains through the equity portions of our investments. We also seek to exit investments in secondary market transactions when price targets are achieved or circumstances otherwise warrant.
Use of Leverage - Our Financing Arrangements
To seek to enhance our returns, we employ leverage as market conditions permit and at the discretion of CIM. Our (i) $675 million senior secured credit facility, or the JPM Credit Facility, with JPMorgan Chase Bank, National Association, or JPM, (ii) $150 million repurchase agreement, or the UBS Facility, with UBS AG, or UBS, (iii) $125 million senior unsecured notes due in 2026, or the 2026 Notes, (iv) $100 million senior unsecured notes due in 2027, or the 2027 Notes, (v) $30 million unsecured term loan, or the 2021 More Term Loan, with More Provident Funds Ltd., or More, (vi) $50 million unsecured term loan, or the 2022 More Term Loan, with More, and (vii) approximately $114.8 million in Series A unsecured notes due in 2026, or the Series A Notes, allow us to borrow money and lever our investment portfolio, subject to the limitations of the 1940 Act, with the objective of increasing our yield. This is known as “leverage” and could increase or decrease returns to our shareholders. The use of leverage involves significant risks. As of December 31, 2023, our total outstanding consolidated indebtedness, at par value, was approximately $1.09 billion, $672.5 million of which was secured and was indebtedness of our subsidiaries, and we had $152.5 million of commitments available to be borrowed under our existing secured financing arrangements. See Note 8 to our consolidated financial statements contained in this annual report on Form 10-K for additional information regarding our financing arrangements.
On March 23, 2018, an amendment to Section 61(a) of the 1940 Act was signed into law to permit BDCs to reduce the minimum “asset coverage” ratio from 200% to 150% and, as a result, to potentially increase the ratio of a BDC's debt to equity from a maximum of 1-to-1 to a maximum 2-to-1, so long as certain approval and disclosure requirements are satisfied. At our Special Meeting of Shareholders on December 30, 2021, shareholders approved a proposal to reduce our asset coverage ratio to 150%, which allows us to increase the maximum amount of leverage that we are permitted to incur. Such asset coverage ratio became effective on December 31, 2021. We are required to make certain disclosures on our website and in SEC filings regarding, among other things, the receipt of approval to increase our leverage, our leverage capacity and usage, and risks related to leverage. As of December 31, 2023 and 2022, our asset coverage ratio based on the aggregate amount outstanding of our senior securities was 181% and 192%, respectively.
Determination of Net Asset Value
The value of our assets is determined quarterly and at such other times that an event occurs that materially affects the valuation. The valuation is made pursuant to Section 2(a)(41) of the 1940 Act, which requires that we value our assets as follows: (i) the market price for those securities for which a market quotation is readily available, and (ii) for all other securities and assets, at fair value, as determined in good faith by our board of directors. As a BDC, Section 2(a)(41) of the 1940 Act requires the board of directors to determine in good faith the fair value of portfolio securities for which a market price is not readily available, and it does so in conjunction with the application of our valuation procedures by CIM. In accordance with Rule 2a-5 of the 1940 Act, our board of directors has designated CIM as our “valuation designee.” Our board of directors and the audit committee of our board of directors, which is comprised solely of our independent directors, oversees the activities, methodology and processes of the valuation designee.
There is no single standard for determining fair value in good faith. As a result, determining fair value requires that judgment be applied to the specific facts and circumstances of each asset while employing a valuation process that is consistently followed. Determinations of fair value involve subjective judgments and estimates. Accordingly, the notes to our consolidated financial statements refer to the uncertainty with respect to the possible effect of such valuations, and any change in such valuations in our consolidated financial statements.
Regulation
We have elected to be regulated as a BDC under the 1940 Act. A BDC is a special category of investment company under the 1940 Act that was added by Congress to facilitate the flow of capital to private companies and small public companies that do not have efficient or cost-effective access to public capital markets or other conventional forms of corporate financing. BDCs make investments in private or thinly-traded public companies in the form of long-term debt and/or equity capital, with the goal of generating current income or capital growth.
BDCs are closed-end funds that elect to be regulated as BDCs under the 1940 Act. As such, BDCs are subject to only certain provisions of the 1940 Act, as well as the Securities Act and the Exchange Act. BDCs are provided greater flexibility under the 1940 Act than are other investment companies in dealing with their portfolio companies, issuing securities, and compensating their managers. BDCs can be internally or externally managed and may qualify to elect to be taxed as RICs for federal tax purposes. The 1940 Act contains prohibitions and restrictions relating to transactions between BDCs and their affiliates, principal underwriters, and affiliates of those affiliates or underwriters. The 1940 Act requires that a majority of a BDC’s directors be persons other than “interested persons,” as that term is defined in the 1940 Act. In addition, the 1940 Act provides that we may not change the nature of our business so as to cease to be or withdraw our election as a BDC, unless approved by a majority of our outstanding voting securities.
The 1940 Act defines “a majority of the outstanding voting securities” as the lesser of (i) 67% or more of the voting securities present at a meeting if the holders of more than 50% of our outstanding voting securities are present or represented by proxy or (ii) a majority of our outstanding voting securities.
We are generally not able to issue and sell our common stock at a price below NAV per share. We may, however, sell our common stock, or warrants, options or rights to acquire our common stock, at a price below the then-current NAV of our common stock if our board of directors determines that such sale is in our best interests and the best interests of our shareholders, and our shareholders approve such sale. In addition, we may generally issue new shares of our common stock at a price below NAV in rights offerings to existing shareholders, in payment of distributions and in certain other limited circumstances. On September 15, 2023, our shareholders approved our ability to sell or otherwise issue during the next year shares of our common stock at a price below our then current NAV per share in one or more public or private offerings of our common stock not exceeding 25% of such then outstanding shares. If we issue such shares and again receive such approval from shareholders in 2024 or otherwise in the future, we may issue shares of our common stock at a price below the then current NAV per share of common stock.
As a BDC, we are subject to certain regulatory restrictions in negotiating or investing in certain investments. For example, we generally are not permitted to co-invest with certain entities affiliated with CIM in transactions originated by CIM or its affiliates unless we obtain an exemptive order from the SEC. On August 30, 2022, we, CIM and certain of our affiliates were granted the Order by the SEC for us to co-invest with other funds managed by CIM or certain affiliates in a manner consistent with our investment objectives, positions, policies, strategies and restrictions as well as regulatory requirements and other pertinent factors. Pursuant to such Order, we generally are permitted to co-invest with certain of our affiliates if a “required majority” (as defined in Section 57(o) of the 1940 Act) of the independent directors make certain conclusions in connection with a co-investment transaction, including that (1) the terms of the proposed transaction, including the consideration to be paid, are reasonable and fair to us and our shareholders and do not involve overreaching of us or our shareholders on the part of any person concerned, (2) the transaction is consistent with the interests of our shareholders and is consistent with our investment objective and strategies, (3) the investment by our affiliates would not disadvantage us, and our participation would not be on a basis different from or less advantageous than that on which our affiliates are investing, and (4) the proposed investment by us would not benefit CIM or its affiliates or any affiliated person of any of them (other than the parties to the transaction), except to the extent permitted by the Order and applicable law, including the limitations set forth in Section 57(k) of the 1940 Act. In addition, the Order permits us to co-invest in our existing portfolio companies with certain affiliates that are private funds, even if such private funds did not have an investment in such existing portfolio company. Even though we were granted the Order by the SEC, CIM’s investment committee may determine that we should not participate in a co-investment transaction.
We may invest up to 100% of our assets in securities acquired directly from issuers in privately negotiated transactions. With respect to such securities, we may, for the purpose of public resale, be deemed an “underwriter” as that term is defined in the Securities Act. We do not intend to acquire securities issued by any investment company that exceed the limits imposed by the 1940 Act. Under these limits, except for registered money market funds, we generally cannot acquire more than 3% of the voting stock of any investment company, invest more than 5% of the value of our total assets in the securities of one investment company or invest more than 10% of the value of our total assets in the securities of more than one investment company. With regard to that portion of our portfolio invested in securities issued by investment companies, it should be noted that such investments might indirectly subject our shareholders to additional expenses as they will indirectly be responsible for the costs and expenses of such companies. None of our investment policies are fundamental and any may be changed without shareholder approval.
Qualifying Assets
Under the 1940 Act, a BDC may not acquire any asset other than assets of the type listed in Section 55(a) of the 1940 Act, which are referred to as qualifying assets, unless, at the time the acquisition is made, qualifying assets represent at least 70% of the company’s total assets. The principal categories of qualifying assets relevant to our business are any of the following:
1.Securities purchased in transactions not involving any public offering from the issuer of such securities, which issuer (subject to certain limited exceptions) is an eligible portfolio company, or from any person who is, or has been during the preceding 13 months, an affiliated person of an eligible portfolio company, or from any other person, subject to such rules as may be prescribed by the SEC. An eligible portfolio company is defined in the 1940 Act as any issuer that:
a.is organized under the laws of, and has its principal place of business in, the U.S.;
b.is not an investment company (other than a small business investment company wholly-owned by the BDC) or a company that would be an investment company but for certain exclusions under the 1940 Act; and
c.satisfies any of the following:
i.does not have any class of securities that is traded on a national securities exchange;
ii.has a class of securities listed on a national securities exchange, but has an aggregate market value of outstanding voting and non-voting common equity of less than $250 million;
iii.is controlled by a BDC or a group of companies including a BDC and the BDC has an affiliated person who is a director of the eligible portfolio company; or
iv.is a small and solvent company having total assets of not more than $4.0 million and capital and surplus of not less than $2.0 million.
2.Securities of any eligible portfolio company that we control.
3.Securities purchased in a private transaction from a U.S. issuer that is not an investment company or from an affiliated person of the issuer, or in transactions incident thereto, if the issuer is in bankruptcy and subject to reorganization or if the issuer, immediately prior to the purchase of its securities, was unable to meet its obligations as they came due without material assistance other than conventional lending or financing arrangements.
4.Securities of an eligible portfolio company purchased from any person in a private transaction if there is no ready market for such securities and we already own 60% of the outstanding equity of the eligible portfolio company.
5.Securities received in exchange for or distributed on or with respect to securities described in (1) through (4) above, or pursuant to the exercise of warrants or rights relating to such securities.
6.Cash, cash equivalents, U.S. government securities or high-quality debt securities maturing in one year or less from the time of investment.
In addition, a BDC must have been organized and have its principal place of business in the U.S. and must be operated for the purpose of making investments in the types of securities described in (1), (2) or (3) above.
Managerial Assistance to Portfolio Companies
In order to count portfolio securities as qualifying assets for the purpose of the 70% test, we must either control the issuer of the securities or must offer to make available to the issuer of the securities (other than small and solvent companies described above) significant managerial assistance; except that, where we purchase such securities in conjunction with one or more other persons acting together, one of the other persons in the group may make available such managerial assistance. Making available managerial assistance means, among other things, any arrangement whereby the BDC, through its directors, officers or employees, offers to provide, and, if accepted, does so provide, significant guidance and counsel concerning the management, operations or business objectives and policies of a portfolio company. Depending on the nature of the assistance required, CIM will provide such managerial assistance on our behalf to portfolio companies that request this assistance. To the extent fees are paid for these services, we, rather than CIM, will retain any fees paid for such assistance.
Temporary Investments
Pending investment in other types of “qualifying assets,” as described above, our investments may consist of cash, cash equivalents, U.S. government securities or high-quality debt securities maturing in one year or less from the time of investment, which we refer to, collectively, as temporary investments, so that 70% of our assets are qualifying assets. Typically, we will invest in U.S. Treasury bills or in repurchase agreements, provided that such agreements are fully collateralized by cash or securities issued by the U.S. government or its agencies. A repurchase agreement involves the purchase by an investor, such as us, of a specified security and the simultaneous agreement by the seller to repurchase it at an agreed-upon future date and at a price that is greater than the purchase price by an amount that reflects an agreed-upon interest rate. There is no percentage restriction on the proportion of our assets that may be invested in such repurchase agreements. However, if more than 25% of our total assets constitute repurchase agreements from a single counterparty, we may not meet the RIC diversification tests, as further described in the “Taxation as a Regulated Investment Company” section below, in order to qualify as a RIC for federal income tax purposes. Thus, we do not intend to enter into repurchase agreements with a single counterparty in excess of this limit. CIM will monitor the creditworthiness of the counterparties with which we enter into repurchase agreement transactions.
Senior Securities
We were permitted, under specified conditions, to issue multiple classes of debt and one class of stock senior to our common stock if our asset coverage, as defined in the 1940 Act, was at least equal to 200% immediately after each such issuance. Recent legislation has modified the 1940 Act by allowing a BDC to increase the maximum amount of leverage it may incur from an asset coverage ratio of 200% to an asset coverage ratio of 150%, if certain requirements are met. On December 30, 2021, we received approval from our shareholders to reduce our minimum "asset coverage" ratio from 200% to 150% in accordance with the 1940 Act. Such asset coverage ratio became effective on December 31, 2021. In addition, while any senior securities remain outstanding, we must make provisions to prohibit any distribution to our shareholders or the repurchase of such securities or shares unless we meet the applicable asset coverage ratios at the time of the distribution or repurchase. We may also borrow amounts up to 5% of the value of our total assets for temporary or emergency purposes without regard to asset coverage. See “Item 1A. Risk Factors - Risks Related to Business Development Companies - Regulations governing our operation as a BDC and RIC will affect our ability to raise, and the way in which we raise, additional capital or borrow for investment purposes, which may have a negative effect on our growth.”
Code of Ethics
We and CIM have adopted a code of ethics pursuant to Rule 17j-1 under the 1940 Act that establishes procedures for personal investments and restricts certain personal securities transactions. Personnel subject to the code may invest in securities for their personal investment accounts, including securities that may be purchased or held by us, so long as such investments are made in accordance with the code’s requirements. The code of ethics is attached as an exhibit to our Current Report on Form 8-K filed with the SEC on May 10, 2023, which is available on the EDGAR Database on the SEC’s Internet site at http://www.sec.gov, and is also available on our Internet site at http:www.cionbdc.com and Exhibit 14.1 to this Annual Report on Form 10-K. Shareholders may also obtain copies by electronic request at the following e-mail address: publicinfo@sec.gov.
Compliance Policies and Procedures
We and CIM have adopted and implemented written policies and procedures reasonably designed to prevent violation of the federal securities laws and are required to review these compliance policies and procedures annually for their adequacy and the effectiveness of their implementation. Our Chief Compliance Officer, or CCO, is responsible for administering our policies and procedures and CIM’s chief compliance officer is responsible for administering its policies and procedures.
Proxy Voting Policies and Procedures
We have delegated our proxy voting responsibility to CIM. The proxy voting policies and procedures of CIM are set forth below. The guidelines are reviewed periodically by CIM and our non-interested directors, and, accordingly, are subject to change.
Introduction
As an investment adviser registered under the Advisers Act, CIM has a fiduciary duty to act solely in the best interests of its clients. As part of this duty, it recognizes that it must vote client securities in a timely manner free of conflicts of interest and in the best interests of its clients. These policies and procedures for voting proxies for the investment advisory clients of CIM are intended to comply with Section 206 of, and Rule 206(4)-6 under, the Advisers Act.
Proxy Policies
CIM will vote proxies relating to our securities in a manner that it believes, in its discretion, to be in the best interest of our shareholders. It will review on a case-by-case basis each proposal submitted for a shareholder vote to determine its impact on the portfolio securities held by its clients. Although CIM will generally vote against proposals that may have a negative impact on its clients’ portfolio securities, it may vote for such a proposal if there exists compelling long-term reasons to do so.
The proxy voting decisions of CIM are made by the senior officers who are responsible for monitoring each of its clients’ investments. To ensure that its vote is not the product of a conflict of interest, it will require that: (a) anyone involved in the decision-making process disclose to the chief compliance officer any potential conflict that he or she is aware of and any contact that he or she has had with any interested party regarding a proxy vote and (b) officers and employees involved in the decision making process or vote administration are prohibited from revealing how CIM intends to vote on a proposal in order to reduce any attempted influence from interested parties. The CCO of CIM will work with the appropriate senior officers to resolve any conflict that may arise.
Proxy Voting Records
Shareholders may obtain information, without charge, regarding how CIM voted proxies with respect to our portfolio securities by making a written request for proxy voting information to: Chief Compliance Officer, c/o CĪON Investment Corporation, 100 Park Avenue, 25th Floor, New York, NY 10017.
Privacy
The following information is provided to help investors understand what personal information we collect, how we protect that information and why, in certain cases, we may share information with select other parties.
We generally will not receive any nonpublic personal information relating to shareholders who purchase our common stock. We may collect nonpublic personal information regarding our existing investors from sources such as subscription agreements, investor questionnaires and other forms; individual investors’ account histories; and correspondence between us and individual investors. We may share information that we collect regarding an investor with our affiliates and the employees of such affiliates for everyday business purposes, for example, to service the investor’s accounts and, unless an investor opts out, provide the investor with information about other products and services offered by us or our affiliates that may be of interest to the investor. In addition, we may disclose information that we collect regarding investors to third parties who are not affiliated with us (i) as authorized by our investors in investor subscription agreements or our organizational documents; (ii) as required by applicable law or in connection with a properly authorized legal or regulatory investigation, subpoena or summons, or to respond to judicial process or government regulatory authorities having property jurisdiction; (iii) as required to fulfill investor instructions; or (iv) as otherwise permitted by applicable law to perform support services for investor accounts or process investor transactions with us or our affiliates.
Any party not affiliated with us that receives nonpublic personal information relating to investors from us is required to adhere to confidentiality agreements and to maintain appropriate safeguards to protect your information. Additionally, for officers, employees and agents of ours and our affiliates, access to such information is restricted to those who need such access to provide services to us and investors. We maintain physical, electronic and procedural safeguards to seek to guard investor nonpublic personal information. For a discussion of the risks associated with cyber incidents, see “Item 1A—Risk Factors—General Risk Factors—Cybersecurity failures and data security incidents could adversely affect our business by causing a disruption to our operations, a compromise or corruption of our confidential, personal or other sensitive information and/or damage to our business relationships or reputation, any of which could negatively impact our business, financial condition and operating results” in this report.
Election to be Taxed as a Regulated Investment Company
We elected to be treated as a RIC under Subchapter M of the Code. As a RIC, we generally will not be subject to corporate-level federal income taxes on any income that we distribute to our shareholders from our tax earnings and profits. To qualify as a RIC, we must, among other things, meet certain source-of-income and asset diversification requirements (as described below). In addition, in order to maintain RIC tax treatment, we must distribute to our shareholders, for each taxable year, at least 90% of our “investment company taxable income,” which is generally our net ordinary income plus the excess, if any, of realized net short-term capital gains over realized net long-term capital losses and determined without regard to any deduction for distributions paid. We refer to this as the Annual Distribution Requirement.
Taxation as a Regulated Investment Company
If we:
•qualify as a RIC; and
•satisfy the Annual Distribution Requirement,
then we will not be subject to federal income tax on the portion of our income we distribute (or are deemed to distribute) to shareholders. We will be subject to U.S. federal income tax at the regular corporate rates on any income or capital gains not distributed (or deemed distributed) to our shareholders.
We will be subject to a 4.0% nondeductible federal excise tax on certain undistributed income unless we distribute in a timely manner an amount at least equal to the sum of (1) 98.0% of our net ordinary income (taking into account certain deferrals and elections) for each calendar year, (2) 98.2% of our capital gain net income (adjusted for certain ordinary losses) for the one-year period ending October 31 in that calendar year and (3) any ordinary income and capital gain net income recognized, but not distributed, in preceding years and on which we paid no federal income tax, or the Excise Tax Avoidance Requirement.
In order to qualify as a RIC for federal income tax purposes, we must, among other things:
•continue to qualify as a BDC under the 1940 Act at all times during each taxable year;
•derive in each taxable year at least 90% of our gross income from dividends, interest, payments with respect to certain securities, loans, gains from the sale of stock or other securities, net income from certain “qualified publicly traded partnerships,” or other income derived with respect to our business of investing in such stock or securities, or the 90% Income Test; and
•diversify our holdings so that at the end of each quarter of the taxable year:
◦at least 50% of the value of our assets consists of cash, cash equivalents, U.S. government securities, securities of other RICs, and other securities if such other securities of any one issuer do not represent more than 5% of the value of our assets or more than 10% of the outstanding voting securities of the issuer; and
◦no more than 25% of the value of our assets is invested in the securities, other than U.S. government securities or securities of other RICs, of one issuer, of two or more issuers that are controlled, as determined under applicable Code rules, by us and that are engaged in the same or similar or related trades or businesses or of certain “qualified publicly traded partnerships,” or the Diversification Tests.
For federal income tax purposes, we may be required to recognize taxable income in circumstances in which we do not receive a corresponding payment in cash. For example, if we hold debt obligations that are treated under applicable tax rules as having original issue discount (such as debt instruments with contractual “payment-in-kind,” or PIK, interest or, in certain cases, increasing interest rates or debt instruments that were issued with warrants), we must include in income each taxable year a portion of the original issue discount that accrues over the life of the obligation, regardless of whether cash representing such income is received by us in the same taxable year. We may also have to include in income other amounts that we have not yet received in cash, such as deferred loan origination fees that are paid after origination of the loan or are paid in non-cash compensation such as warrants or stock. We anticipate that a portion of our income may constitute original issue discount or other income required to be included in taxable income prior to receipt of cash.
Because any original issue discount or other amounts accrued will be included in our investment company taxable income for the year of the accrual, we may be required to make a distribution to our shareholders in order to satisfy the Annual Distribution Requirement, even though we will not have received any corresponding cash amount. As a result, we may have difficulty meeting the Annual Distribution Requirement necessary to qualify for and maintain RIC tax treatment under the Code. We may have to sell some of our investments at times and/or at prices we would not consider advantageous, raise additional debt or equity capital or forego new investment opportunities for this purpose. If we are not able to obtain cash from other sources, we may fail to qualify for RIC tax treatment and thus become subject to corporate-level income tax. Our ability to dispose of assets to meet our distribution requirements may be limited by (1) the illiquid nature of our portfolio and/or (2) other requirements relating to our status as a RIC, including the Diversification Tests. If we dispose of assets in order to meet the Annual Distribution Requirement or the Excise Tax Avoidance Requirement, we may make such dispositions at times that, from an investment standpoint, are not advantageous.
Under the 1940 Act, we are not permitted to make distributions to our shareholders while our debt obligations and other senior securities are outstanding unless certain “asset coverage” tests are met. As a result, we may be prohibited from making distributions necessary to satisfy the Annual Distribution Requirement. Even if we are not prohibited from making distributions, our ability to raise additional capital to satisfy the Annual Distribution Requirement may be limited. If we are not able to make sufficient distributions to satisfy the Annual Distribution Requirement, we may fail to qualify for RIC tax treatment and thus become subject to corporate-level income tax.
Certain of our investment practices may be subject to special and complex federal income tax provisions that may, among other things, (1) treat dividends that would otherwise constitute qualified dividend income as non-qualified dividend income, (2) disallow, suspend or otherwise limit the allowance of certain losses or deductions, (3) convert lower-taxed long-term capital gain into higher-taxed short-term capital gain or ordinary income, (4) convert an ordinary loss or a deduction into a capital loss (the deductibility of which is more limited), (5) cause us to recognize income or gain without receipt of a corresponding distribution of cash, (6) adversely affect the time as to when a purchase or sale of stock or securities is deemed to occur, (7) adversely alter the characterization of certain complex financial transactions and (8) produce income that will not be qualifying income for purposes of the 90% Income Test. We intend to monitor our transactions and may make certain tax elections to mitigate the potential adverse effect of these provisions, but there can be no assurance that any adverse effects of these provisions will be mitigated.
If we purchase shares in a passive foreign investment company, or a PFIC, we may be subject to federal income tax on its allocable share of a portion of any “excess distribution” received on, or any gain from the disposition of, such shares even if our allocable share of such income is distributed as a taxable dividend to our shareholders. Additional charges in the nature of interest generally will be imposed on us in respect of deferred taxes arising from any such excess distribution or gain. If we invest in a PFIC and elect to treat the PFIC as a “qualified electing fund” under the Code, or a QEF, in lieu of the foregoing requirements, we will be required to include in income each year our proportionate share of the ordinary earnings and net capital gain of the QEF, even if such income is not distributed by the QEF. Alternatively, we may be able to elect to mark-to-market at the end of each taxable year our shares in a PFIC; in this case, we will recognize as ordinary income our allocable share of any increase in the value of such shares, and as ordinary loss our allocable share of any decrease in such value to the extent that any such decrease does not exceed prior increases included in our income. Under either election, we may be required to recognize in a year income in excess of distributions from PFICs and proceeds from dispositions of PFIC stock during that year, and such income will nevertheless be subject to the Annual Distribution Requirement and will be taken into account for purposes of the 4% excise tax.
Exchange Act and Sarbanes-Oxley Act Compliance
We are subject to the reporting and disclosure requirements of the Exchange Act, including the filing of quarterly, annual and current reports, proxy statements and other required items. In addition, we are subject to the Sarbanes-Oxley Act, which imposes a wide variety of regulatory requirements on publicly-held companies and their insiders. Many of these requirements affect us. For example:
•pursuant to Rule 13a-14 of the Exchange Act, our co-chief executive officers and our chief financial officer are required to certify the accuracy of the financial statements contained in our periodic reports;
•pursuant to Item 307 of Regulation S-K, our periodic reports are required to disclose our conclusions about the effectiveness of our disclosure controls and procedures; and
•pursuant to Rule 13a-15 of the Exchange Act, our management is required to prepare a report regarding its assessment of our internal control over financial reporting.
The Sarbanes-Oxley Act requires us to review our current policies and procedures to determine whether we comply with the Sarbanes-Oxley Act and the regulations promulgated thereunder. We intend to monitor our compliance with all regulations that are adopted under the Sarbanes-Oxley Act and will take actions necessary to ensure that we are in compliance.
Due to our Listing, we are no longer a “non-accelerated filer” as defined in Rule 12b-2 of the Exchange Act and as a result, we are required to comply with the independent auditor attestation requirements of Section 404(b) of the Sarbanes-Oxley Act, which requires our independent registered public accounting firm to provide an attestation report on the effectiveness of our internal control over financial reporting. Complying with Section 404(b) requires a rigorous compliance program as well as adequate time and resources. We are subject to significant documentation and administrative burdens as a result of being required to comply with Section 404(b), which requires us to utilize additional resources, and our internal controls may not be determined to be effective, which may adversely affect investor confidence in us and, as a result, the value of our securities.
Competition
Our primary competitors provide financing to middle-market companies and include other BDCs, commercial and investment banks, commercial financing companies, CLOs, private funds, including hedge funds, and, to the extent they provide an alternative form of financing, private equity funds. Some of our existing and potential competitors are substantially larger and have considerably greater financial, technical and marketing resources than we do. For example, some competitors may have a lower cost of funds and access to funding sources that are not available to us.
In addition, some of our competitors may have higher risk tolerances or different risk assessments, which could allow them to consider a wider variety of investments and establish more relationships than us. Furthermore, many of our competitors are not subject to the regulatory restrictions that the 1940 Act imposes on us as a BDC.
We do not seek to compete primarily based on the interest rates we offer and CIM believes that some of our competitors may make loans with interest rates that are comparable to or lower than the rates we offer. Rather, we compete with our competitors based on our reputation in the market, our existing investment platform, the seasoned investment professionals of CIM, our experience and focus on middle-market companies, our disciplined investment philosophy, our extensive industry focus and relationships and our flexible transaction structuring.
Compliance with Exchange Listing Requirements
Our common stock is listed on the NYSE under the symbol “CION”. As a listed company on the NYSE, we are subject to various listing standards including corporate governance listing standards. We believe we are in compliance with these rules and standards. On February 26, 2023, our common stock and our Series A Notes listed in Israel on the TASE under the symbol “CION” and "CION B1", respectively, which subjects us to various TASE listing standards including corporate governance listing standards. We believe we are also in compliance with these rules and standards.
Other
We are periodically examined by the SEC for compliance with the 1940 Act.
We provide and maintain a bond issued by a reputable fidelity insurance company to protect us against larceny and embezzlement. Furthermore, as a BDC, we are prohibited from protecting any director or officer against any liability to us or our shareholders arising from willful misconduct, bad faith, gross negligence or reckless disregard of the duties involved in the conduct of such person’s office.
Employees
We do not currently have any employees and we do not currently intend to hire any in the future. The compensation of our chief financial officer and treasurer, Keith S. Franz, and our chief compliance officer and secretary, Stephen Roman, is paid by CIM. We reimburse CIM for the compensation paid to our chief financial officer and his staff and our chief compliance officer and his staff. In the future, CIM may retain additional investment personnel based upon its needs.
Recent Developments
Q1 2024 Regular Distribution
On March 11, 2024, our co-chief executive officers declared a regular quarterly distribution of $0.34 per share for the first quarter of 2024 payable on March 28, 2024 to shareholders of record as of March 22, 2024.
Available Information
We file with or submit to the SEC annual, quarterly and current reports, proxy statements and other information meeting the informational requirements of the Exchange Act. We maintain a website at www.cionbdc.com and make all of our annual, quarterly and current reports, proxy statements and other publicly filed information available, free of charge, on or through our website. Information contained on our website is not incorporated by reference into this Annual Report on Form 10-K and shareholders should not consider information contained on our website to be part of this Annual Report on Form 10-K. You may also obtain such information by contacting us, in writing at: 100 Park Avenue, 25th Floor, New York, New York 10017, or toll free at 1-877-822-4276 or collect at (212) 418-4700. The SEC maintains an Internet site that contains reports, proxy statements and other information filed electronically by us with the SEC which are available on the SEC’s Internet site at http://www.sec.gov. Copies of these reports, proxy statements and other information may be obtained by electronic request at the following e-mail address: publicinfo@sec.gov.
Item 1A. Risk Factors
Investing in our securities involves a high degree of risk, including those relating to our structure and investment objective. You should carefully consider these risk factors, together with all of the other information included in this report, before you decide whether to make an investment in our securities. The risks set forth below are not the only risks we face, and we may face other risks that we have not yet identified, which we do not currently deem material or which are not yet predictable. If any of the following risks occur, our business, financial condition and results of operations could be materially adversely affected. In such case, our NAV and the trading price of our shares of common stock could decline, and you may lose all or part of your investment.
Risks Relating to Our Business and Structure
Our board of directors may change our operating policies and strategies without prior notice or shareholder approval, the effects of which may be adverse to our results of operations and financial condition.
Our board of directors has the authority to modify or waive our current operating policies, investment criteria and strategies without prior notice and without shareholder approval. We cannot predict the effect any changes to our current operating policies, investment criteria and strategies would have on our business, NAV, operating results or trading price of our common stock. However, the effects might be adverse, which could negatively impact our ability to pay shareholders distributions and cause shareholders to lose all or part of their investment.
Price declines in the medium- and large-sized U.S. corporate debt market may adversely affect the fair value of our portfolio, reducing our NAV through increased net unrealized depreciation.
Conditions in the medium- and large-sized U.S. corporate debt market may deteriorate, as seen during the 2008 financial crisis and the 2020 outbreak of the COVID-19 pandemic, which may cause pricing levels to similarly decline or be volatile. During the financial crisis and the 2020 outbreak of the COVID-19 pandemic, many institutions were forced to raise cash by selling their interests in performing assets in order to satisfy margin requirements or the equivalent of margin requirements imposed by their lenders and/or, in the case of hedge funds and other investment vehicles, to satisfy widespread redemption requests. This resulted in a forced deleveraging cycle of price declines, compulsory sales, and further price declines, with falling underlying credit values, and other constraints resulting from the credit crisis and the pandemic generating further selling pressure. If similar events occurred in the medium- and large-sized U.S. corporate debt market, our NAV could decline through an increase in unrealized depreciation and incurrence of realized losses in connection with the sale of our investments, which could have a material adverse impact on our business, financial condition and results of operations.
Our ability to achieve our investment objective depends on the ability of CIM to manage and support our investment process. If CIM was to lose any members of its senior management team, our ability to achieve our investment objective could be significantly harmed.
Since we have no employees, we depend on the investment expertise, skill and network of business contacts of the broader networks of CIM and its affiliates. CIM evaluates, negotiates, structures, executes, monitors and services our investments. Our future success depends to a significant extent on the continued service and coordination of CIM and its senior management team. The departure of any members of CIM’s senior management team could have a material adverse effect on our ability to achieve our investment objective.
Our ability to achieve our investment objective depends on CIM’s ability to identify and analyze, and to invest in, finance and monitor companies that meet our investment criteria. CIM’s capabilities in structuring the investment process, providing competent, attentive and efficient services to us, and facilitating access to financing on acceptable terms depend on the employment of investment professionals in an adequate number and of adequate sophistication to match the corresponding flow of transactions. To achieve our investment objective, CIM may need to hire, train, supervise and manage new investment professionals to participate in our investment selection and monitoring process. CIM may not be able to find investment professionals in a timely manner or at all. Failure to support our investment process could have a material adverse effect on our business, financial condition and results of operations.
The investment advisory agreement between CIM and us has been approved pursuant to Section 15 of the 1940 Act. In addition, the investment advisory agreement has termination provisions that allow the parties to terminate the agreement. The investment advisory agreement may be terminated at any time, without penalty, by us or by CIM, upon 60 days' notice. If the agreement is terminated, it may adversely affect the quality of our investment opportunities. In addition, in the event such agreement is terminated, it may be difficult for us to replace CIM.
Because our business model depends to a significant extent upon relationships with public and private lenders, selected middle-market private equity sponsors, large private equity sponsors (on a limited basis), investment banks and commercial banks, the inability of CIM or its affiliates to maintain or develop these relationships, or the failure of these relationships to generate investment opportunities, could adversely affect our business.
CIM depends on its broader organizations’ relationships with public and private lenders, selected middle-market private equity sponsors, large private equity sponsors (on a limited basis), investment banks and commercial banks, and we rely to a significant extent upon these relationships to provide us with potential investment opportunities. If CIM or its affiliates fail to maintain their existing relationships or develop new relationships with other sponsors or sources of investment opportunities, we may not be able to grow our investment portfolio. In addition, individuals with whom CIM has relationships are not obligated to provide us with investment opportunities, and, therefore, there is no assurance that such relationships will generate investment opportunities for us.
We may face increasing competition for investment opportunities, which could delay deployment of our capital, reduce returns and result in losses.
We compete for investments with other BDCs and investment funds (including private equity funds, mezzanine funds and funds that invest in CLOs, structured notes, derivatives and other types of collateralized securities and structured products), as well as traditional financial services companies such as commercial banks and other sources of funding. Moreover, alternative investment vehicles, such as hedge funds, have invested in areas in which they have not traditionally invested, including making investments in small to mid-sized private U.S. companies. As a result of these new entrants, competition for investment opportunities in small and middle-market private U.S. companies has intensified. Many of our competitors are substantially larger and have considerably greater financial, technical and marketing resources than we do. For example, some competitors may have a lower cost of capital and access to funding sources that are not available to us. In addition, some of our competitors may have higher risk tolerances or different risk assessments than we have. These characteristics could allow our competitors to consider a wider variety of investments, establish more relationships and offer better pricing and more flexible structuring than we are able to do. We may lose investment opportunities if we do not match our competitors’ pricing, terms or structure. If we are forced to match our competitors’ pricing, terms or structure, we may not be able to achieve acceptable returns on our investments or may bear substantial risk of capital loss. A significant increase in the number and/or the size of our competitors in our target market could force us to accept less attractive investment terms.
As required by the 1940 Act, a significant portion of our investment portfolio is and will be recorded at fair value as determined in good faith by our board of directors and, as a result, there is and will be uncertainty as to the value of our portfolio investments.
Under the 1940 Act, we are required to carry our portfolio investments at market value or, if there is no readily available market value, at fair value as determined by our board of directors, including through delegation to CIM as our valuation designee. There is not a public market for the securities of the privately held companies in which we invest. Most of our investments will not be publicly traded or actively traded on a secondary market. As a result, we value these securities quarterly at fair value as determined in good faith by our board of directors as required by the 1940 Act.
Certain factors that may be considered in determining the fair value of our investments include investment dealer quotes for securities traded on the secondary market for institutional investors, the nature and realizable value of any collateral, the portfolio company’s earnings and its ability to make payments on its indebtedness, the markets in which the portfolio company does business, comparison to comparable publicly-traded companies, discounted cash flow and other relevant factors. As a result, our determinations of fair value may differ materially from the values that would have been used if a ready market for these non-traded securities existed. Due to this uncertainty, our fair value determinations may cause our NAV on a given date to materially differ from the value that we may ultimately realize upon the sale of one or more of our investments.
There is a risk that investors in our common stock may not receive distributions or that our distributions may not grow over time.
We may not maintain investment results that will allow us to pay a specified level of distributions or year-to-year increases in distributions. In addition, due to the asset coverage test applicable to us as a BDC, we may be limited in our ability to make distributions.
The amount of any distributions we may pay is uncertain and our distributions may exceed our earnings. Therefore, portions of the distributions that we pay may represent a return of capital to shareholders that will lower their tax basis in their common stock.
We may fund our distributions to shareholders from any sources of funds available to us, including borrowings, net investment income from operations, capital gains proceeds from the sale of assets, non-capital gains proceeds from the sale of assets, and dividends or other distributions paid to us on account of preferred and common equity investments in portfolio companies.
Our ability to pay distributions might be adversely affected by, among other things, the impact of one or more of the risk factors described in this section. In addition, the inability to satisfy the asset coverage test applicable to us as a BDC may limit our ability to pay distributions. All distributions are and will be paid at the discretion of our board of directors and will depend on our earnings, our financial condition, maintenance of our RIC status, compliance with applicable BDC regulations, compliance with the terms, conditions and covenants in our financing arrangements, and such other factors as our board of directors may deem relevant from time to time. We cannot assure investors that we will continue to pay distributions to our shareholders in the future.
The tax treatment and characterization of our distributions may vary significantly from time to time due to the nature of our investments. The ultimate tax characterization of our distributions paid during a tax year may not finally be determined until after the end of that tax year. We may pay distributions during a tax year that exceed our investment company taxable income and net capital gains for that tax year. In such a situation, the amount by which our total distributions exceed investment company taxable income and net capital gains generally would be treated as a return of capital up to the amount of a shareholder’s tax basis in the shares, with any amounts exceeding such tax basis treated as a gain from the sale or exchange of such shares. A return of capital generally is a return of a shareholder’s investment rather than a return of earnings or gains derived from our investment activities. Moreover, we may pay all or a substantial portion of our distributions from the proceeds of the sale of shares of our common stock (if any) or from borrowings in anticipation of future cash flow, which could constitute a return of shareholders’ capital and will lower such shareholders’ tax basis in our shares, which may result in increased tax liability to shareholders when they sell such shares.
Changes in laws or regulations governing our operations may adversely affect our business or cause us to alter our business strategy.
We and our portfolio companies are subject to regulation at the local, state and federal level. New legislation may be enacted or new interpretations, rulings or regulations could be adopted, including those governing the types of investments we are permitted to make, any of which could harm us and our shareholders, potentially with retroactive effect.
Additionally, any changes to the laws and regulations governing our operations relating to permitted investments may cause us to alter our investment strategy to avail ourselves of new or different opportunities. Such changes could result in material differences to our strategies and plans as set forth herein and may result in our investment focus shifting from the areas of expertise of CIM to other types of investments in which CIM may have less expertise or little or no experience. Thus, any such changes, if they occur, could have a material adverse effect on our financial condition and results of operations and the value of a shareholder’s investment.
As a public company, we are subject to regulations not applicable to private companies, such as provisions of the Sarbanes-Oxley Act. Efforts to comply with such regulations will involve significant expenditures, and non-compliance with such regulations may adversely affect us.
As a public company, we are subject to the Sarbanes-Oxley Act and the related rules and regulations promulgated by the SEC. Our management is required to report on our internal control over financial reporting pursuant to Section 404 of the Sarbanes-Oxley Act. We are required to review on an annual basis our internal control over financial reporting, and on a quarterly and annual basis to evaluate and disclose changes in our internal control over financial reporting. Maintaining an effective system of internal controls may require significant expenditures, which may negatively impact our financial performance and our ability to pay distributions. This process also will result in a diversion of our management’s time and attention. We cannot be certain of when our evaluation, testing, and remediation actions will be completed or the impact of the same on our operations. In addition, we may be unable to ensure that the process is effective or that our internal controls over financial reporting are or will be effective in a timely manner. In the event that we are unable to maintain an effective system of internal controls and maintain compliance with the Sarbanes-Oxley Act and related rules, we may be adversely affected.
Due to our Listing, we are no longer a “non-accelerated filer” as defined in Rule 12b-2 of the Exchange Act and as a result, we are required to comply with the independent auditor attestation requirements of Section 404(b) of the Sarbanes-Oxley Act. Complying with Section 404(b) requires a rigorous compliance program as well as adequate time and resources. We are subject to significant documentation and administrative burdens as a result of being required to comply with Section 404(b), which will require us to utilize additional resources, and our internal controls may not be determined to be effective, which may adversely affect investor confidence in us and, as a result, the value of our securities.
We may experience fluctuations in our quarterly results.
We could experience fluctuations in our quarterly operating results due to a number of factors, including our ability or inability to make investments in companies that meet our investment criteria, the interest rate payable on the debt securities we acquire, the level of our expenses (including our borrowing costs), variations in and the timing of the recognition of realized and unrealized gains or losses, the degree to which we encounter competition in our markets and general economic conditions. As a result of these factors, results for any previous period should not be relied upon as being indicative of performance in future periods.
Any unrealized losses we experience on our portfolio may be an indication of future realized losses, which could reduce our income available for distribution.
As a BDC, we are required to carry our investments at market value or, if no market value is ascertainable, at fair value as determined in good faith by our board of directors, including through delegation to CIM as our valuation designee. Decreases in the market value or fair value of our investments relative to amortized cost will be recorded as unrealized depreciation. Any unrealized losses in our portfolio could be an indication of a portfolio company’s inability to meet its repayment obligations to us with respect to the affected loans. This could result in realized losses in the future and ultimately in reductions of our income available for distribution in future periods. In addition, decreases in the market value or fair value of our investments will reduce our NAV.
Risks Relating to CIM and its Affiliates
CIM and its affiliates, including our officers and some of our directors, face conflicts of interest caused by compensation arrangements with us and our affiliates, which could result in actions that are not in the best interests of our shareholders.
CIM and its affiliates receive substantial fees from us in return for their services, and these fees could influence the advice provided to us. Among other matters, the decision to utilize leverage will increase our assets and, as a result, will increase the amount of management fees payable to CIM and may increase the amount of subordinated income incentive fees payable to CIM.
We may be obligated to pay CIM incentive compensation even if we incur a net loss due to a decline in the value of our portfolio.
Our investment advisory agreement entitles CIM to receive incentive compensation on income regardless of any capital losses. In such case, we may be required to pay CIM incentive compensation for a fiscal quarter even if there is a decline in the value of our portfolio or if we incur a net loss for that quarter.
Any incentive fee payable by us that relates to our net investment income may be computed and paid on income that may include interest that has been accrued, but not yet received, including original issue discount, which may arise if we receive warrants in connection with the origination of a loan or possibly in other circumstances, or contractual PIK interest, which represents contractual interest added to the loan balance and due at the end of the loan term. To the extent we do not distribute accrued PIK interest, the deferral of PIK interest has the simultaneous effects of increasing the assets under management and increasing the base management fee at a compounding rate, while generating investment income and increasing the incentive fee at a compounding rate. In addition, the deferral of PIK interest would also increase the loan-to-value ratio at a compounding rate if the issuer’s assets do not increase in value, and investments with a deferred interest feature, such as PIK interest, may represent a higher credit risk than loans on which interest must be paid in full in cash on a regular basis.
For example, if a portfolio company defaults on a loan that is structured to provide accrued interest, it is possible that accrued interest previously included in the calculation of the incentive fee will become uncollectible. CIM is not under any obligation to reimburse us for any part of the incentive fee it received that was based on accrued income that we never received as a result of a default by an entity on the obligation that resulted in the accrual of such income, and such circumstances would result in our paying an incentive fee on income we never received.
There may be conflicts of interest related to obligations that CIM’s senior management and investment teams have to other clients.
The members of the senior management and investment teams of CIM may serve as officers, directors or principals of entities that operate in the same or a related line of business as we do, or of investment funds managed by the same personnel. In serving in these multiple capacities, they may have obligations to other clients or investors in those entities, the fulfillment of which may not be in our best interests or in the best interest of our shareholders. Our investment objective may overlap with the investment objectives of such investment funds, accounts or other investment vehicles. In particular, we rely on CIM to manage our day-to-day activities and to implement our investment strategy. CIM and certain of its affiliates are presently, and plan in the future to continue to be, involved with activities that are unrelated to us. As a result of these activities, CIM, its officers and employees and certain of its affiliates will have conflicts of interest in allocating their time between us and other activities in which they are or may become involved, including the management of its affiliated funds. CIM and its officers and employees will devote only as much of its or their time to our business as CIM and its officers and employees, in their judgment, determine is reasonably required, which may be substantially less than their full time.
Our base management and incentive fees may induce CIM to make and identify speculative investments or to incur additional leverage.
The incentive fee payable by us to CIM may create an incentive for it to make investments on our behalf that are risky or more speculative than would be the case in the absence of such compensation arrangement. The way in which the incentive fee payable to CIM is determined may encourage it to use leverage to increase the return on our investments. The part of the management and incentive fees payable to CIM that relates to our net investment income is computed and paid on income that may include interest income that has been accrued but not yet received in cash, such as market discount, debt instruments with PIK interest, preferred stock with PIK dividends and zero-coupon securities. This fee structure may be considered to involve a conflict of interest for CIM to the extent that it may encourage CIM to favor debt financings that provide for deferred interest, rather than current cash payments of interest. In addition, the fact that our base management fee is payable based upon our gross assets, which would include any borrowings for investment purposes, may encourage CIM to use leverage to make additional investments. Under certain circumstances, the use of leverage may increase the likelihood of default, which would disfavor holders of our common stock. Such a practice could result in our investing in more speculative securities than would otherwise be in our best interests, which could result in higher investment losses, particularly during cyclical economic downturns.
CIM relies on key personnel, the loss of any of whom could impair its ability to successfully manage us.
Our future success depends, to a significant extent, on the continued services of the officers and employees of CIM and its affiliates. The loss of services of one or more members of CIM’s management team, including members of our investment committee, could adversely affect our financial condition, business and results of operations.
The compensation we pay to CIM was determined without independent assessment on our behalf, and these terms may be less advantageous to us than if such terms had been the subject of arm’s-length negotiations.
The compensation we pay to CIM was not entered into on an arm’s-length basis with an unaffiliated third party. As a result, the form and amount of such compensation may be less favorable to us than they might have been had these been entered into through arm’s-length transactions with an unaffiliated third party.
CIM’s influence on conducting our operations gives it the ability to increase its fees, which may reduce the amount of cash flow available for distribution to our shareholders.
CIM is paid a base management fee calculated as a percentage of our gross assets and unrelated to net income or any other performance base or measure. CIM may advise us to consummate transactions or conduct our operations in a manner that, in CIM’s reasonable discretion, is in the best interests of our shareholders. These transactions, however, may increase the amount of fees paid to CIM. CIM’s ability to influence the base management fee paid to it by us could reduce the amount of cash flow available for distribution to our shareholders.
Risks Relating to Business Development Companies
The requirement that we invest a sufficient portion of our assets in qualifying assets could preclude us from investing in accordance with our current business strategy; conversely, the failure to invest a sufficient portion of our assets in qualifying assets could result in our failure to maintain our status as a BDC.
As a BDC, we may not acquire any assets other than “qualifying assets” unless, at the time of and after giving effect to such acquisition, at least 70% of our total assets are qualifying assets. See “Item 1. Business – Regulation.” Therefore, we may be precluded from investing in what we believe are attractive investments if such investments are not qualifying assets. Conversely, if we fail to invest a sufficient portion of our assets in qualifying assets, we could lose our status as a BDC, which would have a material adverse effect on our business, financial condition and results of operations. Similarly, these rules could prevent us from making additional investments in existing portfolio companies, which could result in the dilution of our position, or could require us to dispose of investments at an inopportune time to comply with the 1940 Act. If we were forced to sell non-qualifying investments in the portfolio for compliance purposes, the proceeds from such sale could be significantly less than the current value of such investments.
Failure to maintain our status as a BDC would reduce our operating flexibility.
If we do not remain a BDC, we might be regulated as a registered closed-end investment company under the 1940 Act, which would subject us to substantially more regulatory restrictions under the 1940 Act and correspondingly decrease our operating flexibility.
Regulations governing our operation as a BDC and RIC will affect our ability to raise, and the way in which we raise, additional capital or borrow for investment purposes, which may have a negative effect on our growth.
As a result of the annual distribution requirement to maintain status as a RIC, we may need to periodically access the capital markets to raise cash to fund new investments. We may issue “senior securities,” as defined under the 1940 Act, including borrowing money from banks or other financial institutions, only in amounts such that our asset coverage, as defined in the 1940 Act, equals at least 150% after such incurrence or issuance (effective on December 31, 2021, after we obtained the requisite shareholder approval and otherwise continue to satisfy disclosure requirements in accordance with the 1940 Act). Our ability to issue different types of securities is also limited. Compliance with these requirements may unfavorably limit our investment opportunities and reduce our ability in comparison to other companies to profit from favorable spreads between the rates at which we can borrow and the rates at which we can lend.
We have borrowed for investment purposes. If the value of our assets declines, we may be unable to satisfy the asset coverage test, which would prohibit us from paying distributions and could prevent us from qualifying as a RIC. If we cannot satisfy the asset coverage test, we may be required to sell a portion of our investments and, depending on the nature of our financing arrangements, repay a portion of our indebtedness at a time when such sales may be disadvantageous.
Under the 1940 Act, we generally are prohibited from issuing or selling our common stock at a price per share, after deducting selling commissions and dealer manager fees, that is below our NAV per share, which may be a disadvantage as compared with other public companies. However, in 2023 we obtained, and in 2024 we intend to again seek, the approval of our shareholders to issue shares of our common stock at prices below the then current NAV per share of our common stock in accordance with the 1940 Act. We may also, however, sell our common stock, or warrants, options or rights to acquire our common stock, at a price below the current NAV of our common stock if our board of directors, including our independent directors, determine that such sale is in our best interests and the best interests of our shareholders, and our shareholders, as well as those shareholders that are not affiliated with us, approve such sale. In any such case, the price at which our securities are to be issued and sold may not be less than a price that, in the determination of our board of directors, closely approximates the fair value of such securities.
Our ability to enter into transactions with our affiliates is restricted.
We are prohibited under the 1940 Act from participating in certain transactions with certain of our affiliates without the prior approval of a majority of the independent members of our board of directors and, in some cases, the SEC. Any person that owns, directly or indirectly, 5% or more of our outstanding voting securities will be our affiliate for purposes of the 1940 Act and generally we will be prohibited from buying or selling any securities from or to such affiliate, absent the prior approval of our board of directors. The 1940 Act also prohibits certain “joint” transactions with certain of our affiliates, which could include investments in the same portfolio company (whether at the same or closely related times), without prior approval of our board of directors and, in some cases, the SEC. If a person acquires more than 25% of our voting securities, we will be prohibited from buying or selling any security from or to such person or certain of that person’s affiliates, or entering into prohibited joint transactions with such persons, absent the prior approval of the SEC. Similar restrictions limit our ability to transact business with our officers, directors, CIM or their respective affiliates. As a result of these restrictions, we may be prohibited from buying or selling any security from or to any fund or any portfolio company of a fund managed by CIM or entering into joint arrangements such as certain co-investments with these companies or funds without the prior approval of the SEC, which may limit the scope of investment opportunities that would otherwise be available to us. Although on August 30, 2022, we, CIM and certain of our affiliates were granted the Order for exemptive relief by the SEC for us to co-invest with other funds managed by CIM or certain affiliates, our board of directors or CIM’s investment committee may determine that we should not participate in a co-investment transaction.
We are uncertain of our sources for funding our future capital needs; if we cannot obtain debt or equity financing on acceptable terms, our ability to acquire investments and to expand our operations will be adversely affected.
We will need to periodically access the capital markets to raise cash to fund new investments in excess of our repayments, and we may also need to access the capital markets to refinance existing debt obligations to the extent such maturing obligations are not repaid with availability under our secured credit facilities, which include the JPM Credit Facility and the UBS Facility, or cash flows from operations. Our working capital is used for our investment opportunities, operating expenses and for payment of various fees and expenses such as base management fees, incentive fees and other expenses. Any working capital reserves we maintain may not be sufficient for investment purposes, and we may require additional debt or equity financing to operate. Accordingly, in the event that we develop a need for additional capital in the future for investments or for any other reason, these sources of funding may not be available to us. Consequently, if we cannot obtain debt or equity financing on acceptable terms, our ability to acquire investments and to expand our operations will be adversely affected. As a result, we would be less able to maintain a broad portfolio of investments and achieve our investment objective, which may negatively impact our results of operations and reduce our ability to pay distributions to our shareholders.
We are a non-diversified investment company within the meaning of the 1940 Act, and therefore we are not limited with respect to the proportion of our assets that may be invested in securities of a single issuer.
We are classified as a non-diversified investment company within the meaning of the 1940 Act, which means that we are not limited by the 1940 Act with respect to the proportion of our assets that we may invest in securities of a single issuer. Under the 1940 Act, a “diversified” investment company is required to invest at least 75% of the value of its total assets in cash and cash items, government securities, securities of other investment companies and other securities limited in respect of any one issuer to an amount not greater than 5% of the value of the total assets of such company and no more than 10% of the outstanding voting securities of such issuer. As a non-diversified investment company, we are not subject to this requirement. To the extent that we assume large positions in the securities of a small number of issuers, or within a particular industry, our NAV may fluctuate to a greater extent than that of a diversified investment company as a result of changes in the financial condition or the market’s assessment of the issuer. We may also be more susceptible to any single economic or regulatory occurrence than a diversified investment company or to a general downturn in the economy. However, we will be subject to the diversification requirements applicable to RICs under Subchapter M of the Code.
Increasing scrutiny from stakeholders and regulators with respect to ESG matters and corporate social responsibility may impose additional costs and expose us to additional risks.
Our business (including that of our portfolio companies) faces increasing public scrutiny related to environmental, social and governance, or ESG, activities, which are increasingly considered to contribute to reducing a company’s operational risk, market risk and reputational risk, which may in turn impact the long-term sustainability of a company’s performance. A variety of organizations measure the performance of companies on ESG topics, and the results of these assessments are widely publicized. In addition, investment in funds that specialize in companies that perform well in such assessments are increasingly popular, and major institutional investors have publicly emphasized the importance of such ESG ratings and measures to their investment decisions.
Our brand and reputation may be negatively impacted if we fail to act responsibly in a number of areas, including, but not limited to, diversity, equity and inclusion, human rights, climate change and environmental stewardship, support for local communities, corporate governance, and transparency and consideration of ESG factors in our investment processes. Adverse incidents with respect to ESG activities could impact the value of our brand, our relationship with existing and future portfolio companies, the cost of our operations and relationships with investors, all of which could adversely affect our business and results of operations.
However, regional and investor specific sentiment may differ in what constitutes a material positive or negative ESG corporate practice. There is no guarantee that our ESG and sustainability practices will uniformly fit every investor’s definition of best practices for all ESG considerations across geographies and investor types. If we do not successfully manage expectations across varied stakeholder interests, it could erode stakeholder trust, impact our reputation, and constrain our investment opportunities.
Additionally, new regulatory initiatives related to ESG that are applicable to us and our portfolio companies could adversely affect our business. For example, in May 2018, the European Commission adopted an “action plan on financing sustainable growth.” The action plan is, among other things, designed to define and reorient investment toward sustainability. The action plan contemplates: establishing European Union, or EU, labels for green financial products; clarifying asset managers’ and institutional investors’ duties regarding sustainability in their investment decision-making processes; increasing disclosure requirements in the financial services sector around ESG and strengthening the transparency of companies on their ESG policies and introducing a ‘green supporting factor’ in the EU prudential rules for banks and insurance companies to incorporate climate risks into banks’ and insurance companies’ risk management policies. There is a risk that a significant reorientation in the market following the implementation of these and further measures could be adverse to our portfolio companies if they are perceived to be less valuable as a consequence of, e.g., their carbon footprint or “greenwashing” (i.e., the holding out of a product as having green or sustainable characteristics where this is not, in fact, the case). We and our portfolio companies are subject to the risk that similar measures might be introduced in other jurisdictions in the future.
There is also a growing regulatory interest across jurisdictions in improving transparency regarding the definition, measurement and disclosure of ESG factors in order to allow investors to validate and better understand sustainability claims. In 2021, the SEC established an enforcement task force to look into ESG practices and disclosures by public companies and investment managers and has started to bring enforcement actions based on ESG disclosures not matching actual investment processes. Further, in 2022, the SEC issued a proposed rule regarding the enhancement and standardization of mandatory climate-related disclosures for investors that would mandate extensive disclosure of climate-related data, risks, and opportunities for certain public companies. In addition, the SEC has announced that it is working on proposals for mandatory disclosure of certain ESG-related matters, including with respect to board diversity and human capital management. At this time, there is uncertainty regarding the scope of such proposals or when they would become effective (if at all). Compliance with any new laws or regulations increases our regulatory burden and could make compliance more difficult and expensive, affect the manner in which we or our portfolio companies conduct our businesses and adversely affect our profitability.
Risks Relating to Our Investments
Our investments in prospective portfolio companies may be risky, and we could lose all or part of our investment.
We invest and intend to invest in the following types of loans of private and thinly-traded U.S. middle-market companies.
Senior Secured Debt.
First Lien Loans and Second Lien Loans. When we invest in senior secured term debt, including first lien loans and second lien loans, we will generally take a security interest in the available assets of these portfolio companies, including the equity interests of their subsidiaries. We expect this security interest to help mitigate the risk that we will not be repaid. However, there is a risk that the collateral securing our loans may decrease in value over time or lose its entire value, may be difficult to sell in a timely manner, may be difficult to appraise and may fluctuate in value based upon the success of the business and market conditions, including as a result of the inability of the portfolio company to raise additional capital. Also, in some circumstances, our security interest could be subordinated to claims of other creditors. In addition, deterioration in a portfolio company’s financial condition and prospects, including its inability to raise additional capital, may be accompanied by deterioration in the value of the collateral for the loan. Consequently, the fact that a loan is secured does not guarantee that we will receive principal and interest payments according to the loan’s terms, or at all, or that we will be able to collect on the loan should we be forced to enforce our remedies.
Unitranche Loans. We also expect to invest in unitranche loans, which are loans that combine both senior and subordinated financing, generally in a first-lien position. Unitranche loans provide all of the debt needed to finance a leveraged buyout or other corporate transaction, both senior and subordinated, but generally in a first lien position, while the borrower generally pays a blended, uniform interest rate rather than different rates for different tranches. Unitranche debt generally requires payments of both principal and interest throughout the life of the loan. Unitranche debt generally has contractual maturities of five to six years and interest is typically paid quarterly. Generally, we expect these securities to carry a blended yield that is between senior secured and subordinated debt interest rates. Unitranche loans provide a number of advantages for borrowers, including the following: simplified documentation, greater certainty of execution and reduced decision-making complexity throughout the life of the loan. In addition, we may receive additional returns from any warrants we may receive in connection with these investments. In some cases, a portion of the total interest may accrue or be paid in kind. Because unitranche loans combine characteristics of senior and subordinated financing, unitranche loans have risks similar to the risks associated with senior secured debt, including first lien loans and second lien loans, and subordinated debt in varying degrees according to the combination of loan characteristics of the unitranche loan.
Unsecured Debt. Our unsecured debt, including corporate bonds and subordinated, or mezzanine, investments will generally rank junior in priority of payment to senior debt. This may result in a heightened level of risk and volatility or a loss of principal, which could lead to the loss of the entire investment. These investments may involve additional risks that could adversely affect our investment returns. To the extent interest payments associated with such debt are deferred, such debt may be subject to greater fluctuations in valuations, and such debt could subject us and our shareholders to non-cash income, including PIK interest and original issue discount. Loans structured with these features may represent a higher level of credit risk than loans that require interest to be paid in cash at regular intervals during the term of the loan. Since we generally will not receive any principal repayments prior to the maturity of some of our unsecured debt investments, such investments will have greater risk than amortizing loans.
Collateralized Securities, Structured Products and Other. We may also invest in collateralized securities, structured products and other similar securities, which may include CDOs, CBOs, CLOs, structured notes and credit-linked notes. Investments in such securities and products involve risks, including, without limitation, credit risk and market risk. Certain of these securities and products may be thinly traded or have a limited trading market. Where our investments in collateralized securities, structured products and other similar securities are based upon the movement of one or more factors, including currency exchange rates, interest rates, reference bonds (or loans) and stock indices, depending on the factor used and the use of multipliers or deflators, changes in interest rates and movement of any factor may cause significant price fluctuations. Additionally, changes in the reference instrument or security may cause the interest rate on such a security or product to be reduced to zero, and any further changes in the reference instrument may then reduce the principal amount payable on maturity of the security or product. Collateralized securities, structured products and other similar securities may be less liquid than other types of securities and more volatile than the reference instrument or security underlying the product.
Equity Investments. We make selected equity investments. In addition, when we invest in senior secured debt, including first lien loans and second lien loans, or unsecured debt, we may acquire warrants to purchase equity securities. Our goal is ultimately to dispose of these equity interests and realize gains upon our disposition of such interests. However, the equity interests we receive may not appreciate in value and, in fact, may decline in value. Accordingly, we may not be able to realize gains from our equity interests, and any gains that we do realize on the disposition of any equity interests may not be sufficient to offset any other losses we experience.
Non-U.S. Securities. We may invest in non-U.S. securities, which may include securities denominated in U.S. dollars or in non-U.S. currencies, to the extent permitted by the 1940 Act. Because evidence of ownership of such securities usually are held outside the United States, we would be subject to additional risks if we invested in non-U.S. securities, which include possible adverse political and economic developments, seizure or nationalization of foreign deposits and adoption of governmental restrictions, which might adversely affect or restrict the payment of principal and interest on the non-U.S. securities to investors located outside the country of the issuer, whether from currency blockage or otherwise. Since non-U.S. securities may be purchased with and payable in foreign currencies, the value of these assets as measured in U.S. dollars may be affected unfavorably by changes in current rates and exchange control regulations.
Below-Investment Grade Debt Securities. In addition, we invest in debt securities that are rated below investment grade by rating agencies or that would be rated below investment grade if they were rated. Debt securities rated below investment grade quality are generally regarded as having predominantly speculative characteristics and may carry a greater risk with respect to a borrower’s capacity to pay interest and repay principal. They may also be difficult to value and illiquid.
To the extent original issue discount constitutes a portion of our income, we will be exposed to risks associated with the deferred receipt of cash representing such income.
Our investments may include original issue discount instruments. To the extent original issue discount constitutes a portion of our income, we will be exposed to typical risks associated with such income being required to be included in taxable and accounting income prior to receipt of cash, including the following:
•Original issue discount instruments may have unreliable valuations because the accruals require judgments about collectability.
•Original issue discount instruments may create heightened credit risks because the inducement to trade higher rates for the deferral of cash payments typically represents, to some extent, speculation on the part of the borrower.
•For accounting purposes, distributions to shareholders representing original issue discount income do not come from paid-in capital, although they may be paid from offering proceeds (if any) or borrowings. Thus, although a distribution of original issue discount income comes from the cash invested by shareholders or from borrowings, the 1940 Act does not require that shareholders be given notice of this fact.
•In the case of PIK “toggle” debt, the PIK election has the simultaneous effects of increasing our assets under management, thus increasing the base management fee, and increasing our investment income, thus increasing the potential for realizing incentive fees.
•Since original issue discount will be included in our investment company taxable income for the year of the accrual, we may be required to make a distribution to our shareholders in order to satisfy the annual distribution requirement applicable to RICs, even if we will not have received any corresponding cash amount. As a result, we may have difficulty meeting such annual distribution requirement necessary to maintain RIC tax treatment under the Code. If we are not able to obtain cash from other sources, and choose not to make a qualifying share distribution, we may fail to qualify for RIC tax treatment and thus become subject to corporate-level income tax.
•Original issue discount creates a risk of non-refundable cash payments to the advisor based on non-cash accruals that may never be realized.
Our portfolio companies may incur debt that ranks equally with, or senior to, our investments in such companies.
We intend to invest primarily in senior secured debt, including first lien loans, second lien loans and unitranche loans of private and thinly-traded U.S. middle-market companies. Our portfolio companies may have, or may be permitted to incur, other debt that ranks equally with, or senior to, the debt in which we invest. By their terms, such debt instruments may entitle the holders to receive payment of interest or principal on or before the dates on which we are entitled to receive payments with respect to the debt instruments in which we invest. Also, in the event of insolvency, liquidation, dissolution, reorganization or bankruptcy of a portfolio company, holders of debt instruments ranking senior to our investment in that portfolio company would typically be entitled to receive payment in full before we receive any payment or distribution. After repaying such senior creditors, such portfolio company may not have any remaining assets to use for repaying its obligation to us. In the case of debt ranking equally with debt instruments in which we invest, we would have to share on an equal basis any payments or distributions with other creditors holding such debt in the event of an insolvency, liquidation, dissolution, reorganization or bankruptcy of the relevant portfolio company.
There may be circumstances where our debt investments could be subordinated to claims of other creditors or we could be subject to lender liability claims.
If one of our portfolio companies were to file for bankruptcy, depending on the facts and circumstances, including the extent to which we actually provided managerial assistance to that portfolio company, a bankruptcy court might recharacterize our debt investment and subordinate all or a portion of our claim to that of other creditors. We may also be subject to lender liability claims for actions taken by us with respect to a borrower’s business or instances where we exercise control over the borrower.
We generally will not control our portfolio companies.
We do not expect to control most of our portfolio companies, even though we may have board representation or board observation rights and our debt agreements with such portfolio companies may contain certain restrictive covenants. As a result, we are subject to the risk that a portfolio company in which we invest may make business decisions with which we disagree and the management of such company, as representatives of the holders of the company’s common equity, may take risks or otherwise act in ways that do not serve our interests as debt investors. Due to the lack of liquidity for our investments in non-traded companies, we may not be able to dispose of our interests in our portfolio companies as readily as we would like or at an appropriate valuation. As a result, a portfolio company may make decisions that could decrease the value of our portfolio holdings.
We are exposed to risks associated with changes in interest rates, including the current high interest rate environment.
We are subject to financial market risks, including changes in interest rates. General interest rate fluctuations may have a substantial negative impact on our investments and investment returns and, accordingly, may have a material adverse effect on our ability to achieve our investment objective and our target rate of return on invested capital. In addition, an increase in interest rates would make it more expensive to use debt for our financing needs.
Changing interest rates, including rates that fall below zero, may have unpredictable effects on markets, may result in heightened market volatility and may detract from our performance to the extent we are exposed to such interest rates and/or volatility. In periods of high interest rates, such as the current interest rate environment, to the extent we borrow money subject to a floating interest rate, our cost of funds would increase, which could reduce our net investment income. Further, high interest rates could also adversely affect our performance if such rates cause our borrowing costs to rise at a rate in excess of the rate that our investments yield. Further, high interest rates could also adversely affect our performance if we hold investments with floating interest rates, subject to specified minimum interest rates (such as a SOFR floor), while at the same time engaging in borrowings subject to floating interest rates not subject to such minimums. In such a scenario, high interest rates may increase our interest expense, even though our interest income from investments is not increasing in a corresponding manner as a result of such minimum interest rates.
In an effort to combat inflation, the Federal Reserve increased the federal funds rate in 2023. Although the Federal Reserve left its benchmark rates steady in the fourth quarter of 2023, it has indicated that additional rate increases in the future may be necessary to mitigate inflationary pressures and there can be no assurance that the Federal Reserve will not make upwards adjustments to the federal funds rate in the future. However, there are reports that the Federal Reserve may begin to cut the benchmark rates in 2024. If general interest rates remain high, there is a risk that the portfolio companies in which we hold floating rate securities will be unable to pay high interest amounts, which could result in a default under their loan documents with us. High interest rates could also cause portfolio companies to shift cash from other productive uses to the payment of interest, which may have a material adverse effect on their business and operations and could, over time, lead to increased defaults. In addition, high interest rates may increase pressure on us to provide fixed rate loans to our portfolio companies, which could adversely affect our net investment income, as increases in our cost of borrowed funds would not be accompanied by increased interest income from such fixed-rate investments. Also, an increase in interest rates available to investors could make an investment in our common stock less attractive if we are not able to pay distributions at a level that provides a similar return, which could reduce the value of our common stock. A decrease in the general level of interest rates can be expected to lead to lower interest rates applicable to our portfolio investments and therefore lower net investment income available for distributions to shareholders. The timing, number and amount of any such future interest rate changes are uncertain and there can be no assurance that a significant change in market interest rates will not have a material adverse effect on our net investment income.
Inflation has adversely affected and may continue to adversely affect the business, results of operations and financial condition of our portfolio companies.
Certain of our portfolio companies are in industries that have been impacted by inflation. Although the U.S. inflation rate has decreased in the fourth quarter of 2023, it remains well above the historic levels over the past several decades. Inflationary pressures have increased the costs of labor, energy and raw materials and have adversely affected consumer spending, economic growth and certain of our portfolio companies’ operations. If such portfolio companies are unable to pass any increases in their costs along to their customers, it could adversely affect their results and impact their ability to pay interest and principal on our loans, particularly if interest rates remain high or rise further in response to inflation. In addition, any projected future decreases in our portfolio companies’ operating results due to inflation could adversely impact the fair value of those investments. Any decreases in the fair value of our investments could result in future unrealized losses and therefore reduce our net assets resulting from operations.
While the United States and other developed economies are experiencing higher-than-normal inflation rates, it remains uncertain whether substantial inflation will be sustained over an extended period of time or have a significant effect on the U.S. economy or other economies. Inflation may affect our investments adversely in a number of ways, including those noted above. During periods of rising inflation, interest and dividend rates of any instruments we or our portfolio companies may have issued could increase, which would tend to reduce returns to our investors. Inflationary expectations or periods of rising inflation could also be accompanied by the rising prices of commodities that are critical to the operation of portfolio companies. Portfolio companies may have fixed income streams and, therefore, be unable to pay their debts when they become due. The market value of such investments may decline in value in times of higher inflation rates. Some of our portfolio investments may have income linked to inflation through contractual rights or other means. However, as inflation may affect both income and expenses, any increase in income may not be sufficient to cover increases in expenses. Governmental efforts to curb inflation often have negative effects on the level of economic activity. In an attempt to stabilize inflation, certain countries have imposed wage and price controls at times. Past governmental efforts to curb inflation have also involved more drastic economic measures that have had a materially adverse effect on the level of economic activity in the countries where such measures were employed. We can offer no assurance that continued and more widespread inflation in the United States and/or other economies will not become a serious problem in the future and have a material adverse impact on us.
International investments create additional risks.
We have made, and expect to continue to make, investments in portfolio companies that are domiciled outside of the United States. We anticipate that up to 30% of our investments may be in assets located in jurisdictions outside the United States. Our investments in foreign portfolio companies are deemed “non-qualifying assets,” which means, as required by the 1940 Act, they may not constitute more than 30% of our total assets at the time of our acquisition of any asset, after giving effect to the acquisition. Notwithstanding that limitation on our ownership of foreign portfolio companies, those investments subject us to many of the same risks as our domestic investments, as well as certain additional risks including the following:
•foreign governmental laws, rules and policies, including those restricting the ownership of assets in the foreign country or the repatriation of profits from the foreign country to the United States;
•foreign currency devaluations that reduce the value of and returns on our foreign investments;
•adverse changes in the availability, cost and terms of investments due to the varying economic policies of a foreign country in which we invest;
•adverse changes in tax rates, the tax treatment of transaction structures and other changes in operating expenses of a particular foreign country in which we invest;
•the assessment of foreign-country taxes (including withholding taxes, transfer taxes and value added taxes, any or all of which could be significant) on income or gains from our investments in the foreign country;
•adverse changes in foreign-country laws, including those relating to taxation, bankruptcy and ownership of assets;
•changes that adversely affect the social, political and/or economic stability of a foreign country in which we invest;
•high inflation in the foreign countries in which we invest, which could increase the costs to us of investing in those countries;
•deflationary periods in the foreign countries in which we invest, which could reduce demand for our assets in those countries and diminish the value of such investments and the related investment returns to us; and
•legal and logistical barriers in the foreign countries in which we invest that materially and adversely limit our ability to enforce our contractual rights with respect to those investments.
In addition, we may make investments in countries whose governments or economies may prove unstable. Certain of the countries in which we may invest may have political, economic and legal systems that are unpredictable, unreliable or otherwise inadequate with respect to the implementation, interpretation and enforcement of laws protecting asset ownership and economic interests. In some of the countries in which we may invest, there may be a risk of nationalization, expropriation or confiscatory taxation, which may have an adverse effect on our portfolio companies in those countries and the rates of return we are able to achieve on such investments. We may also lose the total value of any investment which is nationalized, expropriated or confiscated. The financial results and investment opportunities available to us, particularly in developing countries and emerging markets, may be materially and adversely affected by any or all of these political, economic and legal risks.
Second priority liens on collateral securing debt investments that we make to our portfolio companies may be subject to control by senior creditors with first priority liens. If there is a default, the value of the collateral may not be sufficient to repay in full both the first priority creditors and us.
Certain debt investments that we make to portfolio companies may be secured on a second priority basis by the same collateral securing first priority debt of such companies. The first priority liens on the collateral will secure the portfolio company’s obligations under any outstanding senior debt and may secure certain other future debt that may be permitted to be incurred by the company under the agreements governing the loans. The holders of obligations secured by the first priority liens on the collateral will generally control the liquidation of and be entitled to receive proceeds from any realization of the collateral to repay their obligations in full before us. In addition, the value of the collateral in the event of liquidation will depend on market and economic conditions, the availability of buyers and other factors. There can be no assurance that the proceeds, if any, from the sale or sales of all of the collateral would be sufficient to satisfy the debt obligations secured by the second priority liens after payment in full of all obligations secured by the first priority liens on the collateral. If such proceeds are not sufficient to repay amounts outstanding under the debt obligations secured by the second priority liens, then we, to the extent not repaid from the proceeds of the sale of the collateral, will only have an unsecured claim against the company’s remaining assets, if any.
The rights we may have with respect to the collateral securing the debt investments we make to our portfolio companies with senior debt outstanding may also be limited pursuant to the terms of one or more intercreditor agreements that we enter into with the holders of senior debt. Under such an intercreditor agreement, at any time that obligations that have the benefit of the first priority liens are outstanding, any of the following actions that may be taken in respect of the collateral will be at the direction of the holders of the obligations secured by the first priority liens: the ability to cause the commencement of enforcement proceedings against the collateral; the ability to control the conduct of such proceedings; the approval of amendments to collateral documents; releases of liens on the collateral; and waivers of past defaults under collateral documents. We may not have the ability to control or direct such actions, even if our rights are adversely affected.
Economic recessions or downturns could impair our portfolio companies and adversely affect our operating results.
Many of our portfolio companies may be susceptible to economic recessions or downturns and may be unable to repay our debt investments during these periods. Therefore, our non-performing assets are likely to increase, and the value of our portfolio is likely to decrease, during these periods. Adverse economic conditions may also decrease the value of any collateral securing our senior secured debt. A prolonged recession may further decrease the value of such collateral and result in losses of value in our portfolio and a decrease in our revenues, net income and NAV. Unfavorable economic conditions also could increase our funding costs, limit our access to the capital markets or result in a decision by lenders not to extend credit to us on terms we deem acceptable. These events could prevent us from increasing investments and adversely affect our operating results.
A covenant breach or other defaults by our portfolio companies may adversely affect our operating results.
A portfolio company’s failure to satisfy financial or operating covenants imposed by us or other lenders could lead to defaults and, potentially, termination of its loans and foreclosure on its secured assets, which could trigger cross-defaults under other agreements and jeopardize a portfolio company’s ability to meet its obligations under the debt or equity securities that we hold. We may incur expenses to the extent necessary to seek recovery upon default or to negotiate new terms, which may include the waiver of certain financial covenants, with a defaulting portfolio company.
Investing in middle-market companies involves a number of significant risks, any one of which could have a material adverse effect on our operating results.
Investments in middle-market companies involve the same risks that apply generally to investments in larger, more established companies. However, such investments have more pronounced risks in that middle-market companies:
•may have limited financial resources and may be unable to meet their obligations under their debt securities that we hold, which may be accompanied by a deterioration in the value of any collateral and a reduction in the likelihood of us realizing on any guarantees we may have obtained in connection with our investment;
•have shorter operating histories, narrower product lines and smaller market shares than larger businesses, which tends to render them more vulnerable to competitors’ actions and changing market conditions, as well as general economic downturns;
•are more likely to depend on the management talents and efforts of a small group of persons; therefore, the death, disability, resignation or termination of one or more of these persons could have a material adverse impact on our portfolio company and, in turn, on us;
•generally have less predictable operating results, may from time to time be parties to litigation, may be engaged in rapidly changing businesses with products subject to a substantial risk of obsolescence, and may require substantial additional capital to support their operations, finance expansion or maintain their competitive position. In addition, our executive officers, directors and members of CIM may, in the ordinary course of business, be named as defendants in litigation arising from our investments in the portfolio companies; and
•may have difficulty accessing the capital markets to meet future capital needs, which may limit their ability to grow or to repay their outstanding indebtedness upon maturity.
We may not realize gains from our equity investments.
Certain investments that we may make could include warrants or other equity securities. In addition, we may make direct equity investments in portfolio companies. Our goal is ultimately to realize gains upon our disposition of such equity interests. However, the equity interests we receive may not appreciate in value and, in fact, may decline in value. Accordingly, we may not be able to realize gains from our equity interests, and any gains that we do realize on the disposition of any equity interests may not be sufficient to offset any other losses we experience. We also may be unable to realize any value if a portfolio company does not have a liquidity event, such as a sale of the business, recapitalization or public offering, which would allow us to sell the underlying equity interests. We may seek puts or similar rights to give us the right to sell our equity securities back to the portfolio company issuer. We may be unable to exercise these put rights for the consideration provided in our investment documents if the issuer is in financial distress.
An investment strategy focused primarily on privately-held companies presents certain challenges, including, but not limited to, the lack of available information about these companies.
We have invested and continue to invest primarily in privately-held companies. Investments in private companies pose significantly greater risks than investments in public companies. First, private companies have reduced access to the capital markets, resulting in diminished capital resources and the ability to withstand financial distress. Second, the depth and breadth of experience of management in private companies tends to be less than that at public companies, which makes such companies more likely to depend on the management talents and efforts of a smaller group of persons and/or persons with less depth and breadth of experience. Therefore, the decisions made by such management teams and/or the death, disability, resignation or termination of one or more of these persons could have a material adverse impact on our investments and, in turn, on us. Third, the investments themselves tend to be less liquid. As such, we may have difficulty exiting an investment promptly or at a desired price prior to maturity or outside of a normal amortization schedule. As a result, the relative lack of liquidity and the potential diminished capital resources of our target portfolio companies may affect our investment returns. Fourth, little public information generally exists about private companies. Further, these companies may not have third-party debt ratings or audited financial statements. We must therefore rely on the ability of CIM to obtain adequate information through due diligence to evaluate the creditworthiness and potential returns from investing in these companies. These companies and their financial information will generally not be subject to the Sarbanes-Oxley Act and other rules that govern public companies. If we are unable to uncover all material information about these companies, we may not make a fully informed investment decision, and we may lose money on our investments.
A lack of liquidity in certain of our investments may adversely affect our business.
We have invested and continue to invest in certain companies whose securities are not publicly traded or actively traded on the secondary market, and whose securities are subject to legal and other restrictions on resale or will otherwise be less liquid than publicly traded securities. The illiquidity of certain of our investments may make it difficult for us to sell these investments when desired. In addition, if we are required to liquidate all or a portion of our portfolio quickly, we may realize significantly less than the value at which we had previously recorded these investments. The reduced liquidity of our investments may make it difficult for us to dispose of them at a favorable price, and, as a result, we may suffer losses.
We may not have the funds or ability to make additional investments in our portfolio companies or to fund our unfunded debt commitments.
We may not have the funds or ability to make additional investments in our portfolio companies or to fund our unfunded debt commitments. After our initial investment in a portfolio company, we may be called upon from time to time to provide additional funds to such company or have the opportunity to increase our investment through the exercise of a warrant to purchase common stock. There is no assurance that we will make, or will have sufficient funds to make, follow-on investments. Any decisions not to make a follow-on investment or any inability on our part to make such an investment may have a negative impact on a portfolio company in need of such an investment, may result in a missed opportunity for us to increase our participation in a successful operation or may reduce the expected return on the investment.
We may acquire various financial instruments for purposes of “hedging” or reducing our risks, which may be costly and ineffective and could reduce our cash available for distribution to our shareholders.
We may seek to hedge against interest rate and currency exchange rate fluctuations and credit risk by using financial instruments such as futures, options, swaps and forward contracts, subject to the requirements of the 1940 Act. These financial instruments may be purchased on exchanges or may be individually negotiated and traded in over-the-counter markets. Use of such financial instruments for hedging purposes may present significant risks, including the risk of loss of the amounts invested. Defaults by the other party to a hedging transaction can result in losses in the hedging transaction. Hedging activities also involve the risk of an imperfect correlation between the hedging instrument and the asset being hedged, which could result in losses both on the hedging transaction and on the instrument being hedged. Use of hedging activities may not prevent significant losses and could increase our losses. Further, hedging transactions may reduce cash available to pay distributions to our shareholders.
Prepayments of our debt investments by our portfolio companies could adversely impact our results of operations and reduce our return on equity.
We are subject to the risk that the investments we make in our portfolio companies may be repaid prior to maturity. When this occurs, we will generally reinvest these proceeds in temporary investments, pending their future investment in new portfolio companies. These temporary investments will typically have substantially lower yields than the debt being prepaid, and we could experience significant delays in reinvesting these amounts. Any future investment in a new portfolio company may also be at lower yields than the debt that was repaid. As a result, our results of operations could be materially adversely affected if one or more of our portfolio companies elect to prepay amounts owed to us. Additionally, prepayments, net of prepayment fees, could negatively impact our return on equity.
The effect of global climate change may impact our operations and the operations of our portfolio companies.
Climate change is widely considered to be a significant threat to the global economy. Climate change creates physical and financial risk and we and some of our portfolio companies may be adversely affected by climate change. For example, the needs of customers of energy companies vary with weather conditions, primarily temperature and humidity. To the extent weather conditions are affected by climate change, energy use could increase or decrease depending on the duration and magnitude of any changes. Increases in the cost of energy could adversely affect the cost of operations of our portfolio companies if the use of energy products or services is material to their business. A decrease in energy use due to weather changes may affect some of our portfolio companies’ financial condition through, for example, decreased revenues. Extreme weather conditions in general require more system backup, adding to costs, and can contribute to increased system stresses, including service interruptions.
Our business operations and our portfolio companies may face risks associated with climate change, including risks related to the impact of climate-related legislation and regulation (both domestically and internationally), risks related to climate-related business trends (such as the process of transitioning to a lower-carbon economy), and risks stemming from the physical impacts of climate change, such as the increasing frequency or severity of extreme weather events and rising sea levels and temperatures.
Risks Relating to Our Debt Financings
The Small Business Credit Availability Act of 2018 allows us to incur additional leverage and our shareholders approved a proposal permitting us to incur additional leverage, effective December 31, 2021.
As a BDC, we were generally not permitted to incur indebtedness unless immediately after such borrowings we had an asset coverage for total borrowings of at least 200% (i.e., the amount of debt may not exceed 50% of the value of our assets). On March 23, 2018, the Small Business Credit Availability Act of 2018, which amended Section 61(a) of the 1940 Act, was signed into law to permit BDCs to reduce the minimum “asset coverage” ratio from 200% to 150% and, as a result, to potentially increase the ratio of a BDC’s debt to equity from a maximum of 1-to-1 to a maximum of 2-to-1, so long as certain approval and disclosure requirements are satisfied. Specifically, a BDC is permitted to apply a lower minimum asset coverage ratio of 150% if: (1) the BDC complies with certain additional asset coverage disclosure requirements; and (2)(A) a “required majority” of the BDC’s directors, as defined in Section 57(o) of the 1940 Act, approves the application of such a lower minimum asset coverage ratio to the BDC, in which case the 150% minimum asset coverage ratio will become effective on the date that is one year after the date of such independent director approval; or (B) the BDC obtains, at a special or annual meeting of its shareholders at which a quorum is present, the approval of more than 50% of the votes cast for the application of such a lower minimum asset coverage ratio to the BDC, in which case the 150% minimum asset coverage ratio will become effective on the first day after the date of such shareholder approval.
On December 30, 2021, we received approval from our shareholders to reduce our minimum "asset coverage" ratio from 200% to 150% in accordance with the 1940 Act, effective December 31, 2021. We are required to make certain disclosures on our website and in SEC filings regarding, among other things, the receipt of approval to increase our leverage, our leverage capacity and usage, and risks related to leverage. Leverage magnifies the potential for loss on investments in our indebtedness and on invested equity capital. We are also subject to asset coverage requirements for total borrowings under our financing arrangements. As we use leverage to partially finance our investments, you will experience increased risks of investing in our securities. If the value of our assets increases, then leveraging would cause the NAV attributable to our common stock to increase more sharply than it would have had we not leveraged. Conversely, if the value of our assets decreases, leveraging would cause NAV to decline more sharply than it otherwise would have had we not leveraged our business. Similarly, any increase in our income in excess of interest payable on the borrowed funds would cause our net investment income to increase more than it would without the leverage, while any decrease in our income would cause net investment income to decline more sharply than it would have had we not borrowed. Such a decline could negatively affect our ability to pay distributions, scheduled debt payments or other payments related to our securities. Leverage is generally considered a speculative investment technique. Because we borrow money, the potential for loss on amounts invested in us is magnified and may increase the risk of investing in us.
Since we have borrowed money, the potential for loss on amounts invested in us is magnified and may increase the risk of investing in us. Borrowed money may also adversely affect the return on our assets, reduce cash available for distribution to our shareholders, and result in losses.
The use of borrowings, also known as leverage, increases the volatility of investments by magnifying the potential for loss on invested equity capital. Since we have used leverage to partially finance our investments through borrowings from banks and other institutional investors, shareholders experience increased risks of investing in our common stock. If the value of our assets decreases, leveraging would cause NAV to decline more sharply than it otherwise would have had we not leveraged. Similarly, any decrease in our income would cause net income to decline more sharply than it would have had we not borrowed. Such a decline could negatively affect our ability to pay distributions to our shareholders. In addition, our shareholders bear the burden of any increase in our expenses as a result of our use of leverage, including interest expenses and any increase in the management or incentive fees payable to CIM.
We may continue to use leverage to finance our investments. The amount of leverage that we employ will depend on CIM’s and our board of directors’ assessment of market and other factors at the time of any proposed borrowing. There can be no assurance that leveraged financing will be available to us on favorable terms or at all. However, to the extent that we continue to use leverage to finance our assets, our financing costs will reduce cash available for distributions to shareholders. Moreover, we may not be able to meet our financing obligations and, to the extent that we cannot, we risk the loss of some or all of our assets to liquidation or sale to satisfy the obligations. In such an event, we may be forced to sell assets at significantly depressed prices due to market conditions or otherwise, which may result in losses.
As a BDC, we generally are required to meet a coverage ratio of total assets to total borrowings and other senior securities, which include all of our borrowings and any preferred stock that we may issue in the future. Recent legislation has modified the 1940 Act by allowing a BDC to increase the maximum amount of leverage it may incur from an asset coverage ratio of 200% to an asset coverage ratio of 150%, if certain requirements are met. See "The Small Business Credit Availability Act of 2018 allows us to incur additional leverage and our shareholders approved a proposal permitting us to incur additional leverage, effective December 31, 2021” above for more information. On December 30, 2021, we received approval from our shareholders to reduce our minimum "asset coverage" ratio from 200% to 150% in accordance with the 1940 Act, which allows us to increase the maximum amount of leverage that we are permitted to incur. If this ratio declines below 150%, we cannot incur additional debt and could be required to sell a portion of our investments to repay some debt when it is disadvantageous to do so. This could have a material adverse effect on our operations and investment activities. Moreover, our ability to pay distributions to shareholders may be significantly restricted or we may not be able to pay any such distributions whatsoever. The amount of leverage that we will employ will be subject to oversight by our board of directors, a majority of whom are independent directors with no material interests in such transactions.
At December 31, 2023, 2022 and 2021, our borrowings for the BDC coverage ratio were $1,092,344, $957,500 and $830,000, respectively, and resulted in coverage ratios of 181%, 192% and 212%, respectively. For a detailed discussion on the coverage ratio calculation, refer to Note 13 to our consolidated financial statements included in this report.
Illustration. The following table illustrates the effect of leverage on returns from an investment in our common stock assuming various annual returns, net of expenses. The calculations in the table below are hypothetical and actual returns may be higher or lower than those appearing below. The calculation assumes (i) $2.00 billion in total assets as of December 31, 2023, (ii) a weighted average cost of funds of 8.95%, (iii) $1,092 million in debt outstanding (i.e., assumes that 88% of the $1.24 billion available to us as of December 31, 2023 under our financing arrangements as of such date is outstanding) and (iv) $880 million in shareholders’ equity. In order to compute the “Corresponding return to shareholders,” the “Assumed Return on Our Portfolio (net of expenses)” is multiplied by the assumed total assets to obtain an assumed return to us. From this amount, the interest expense is calculated by multiplying the assumed weighted average cost of funds times the assumed debt outstanding, and the product is subtracted from the assumed return to us in order to determine the return available to shareholders. The return available to shareholders is then divided by our shareholders’ equity to determine the “Corresponding return to shareholders.” Actual interest payments may be different.
| | | | | | | | | | | | | | | | | | | | | | | | | | | | | | | | |
| Assumed Return on Our Portfolio (net of expenses) | | -10% | | -5% | | 0% | | 5% | | 10% |
| Corresponding return to shareholders | | (33.86)% | | (22.49)% | | (11.11)% | | 0.27% | | 11.65% |
Similarly, assuming (i) $2.00 billion in total assets as of December 31, 2023, (ii) a weighted average cost of funds of 8.95% and (iii) $1,092 million in debt outstanding (i.e., assumes that 88% of the $1.24 billion available to us as of December 31, 2023 under our financing arrangements as of such date is outstanding), our assets would need to yield an annual return (net of expenses) of approximately 4.88% just to cover the annual interest payments on our outstanding debt.
Changes in interest rates may affect our cost of capital and net investment income.
Since we have used debt to finance a portion of our investments, our net investment income will depend, in part, upon the difference between the rate at which we borrow funds and the rate at which we invest those funds. As a result, we can offer no assurance that a significant change in market interest rates will not have a material adverse effect on our net investment income. In periods of rising interest rates when we have debt outstanding, our cost of funds will increase, which could reduce our net investment income. We expect that our long-term fixed-rate investments will be financed primarily with equity and long-term debt. We may use interest rate risk management techniques in an effort to limit our exposure to interest rate fluctuations. These techniques may include various interest rate hedging activities to the extent permitted by the 1940 Act. These activities may limit our ability to participate in the benefits of lower interest rates with respect to the hedged portfolio. Adverse developments resulting from changes in interest rates or hedging transactions could have a material adverse effect on our business, financial condition and results of operations. Also, we have limited experience in entering into hedging transactions, and we will initially have to purchase or develop such expertise.
A rise in the general level of interest rates can be expected to lead to higher interest rates applicable to our debt investments. Accordingly, an increase in interest rates would make it easier for us to meet or exceed the incentive fee hurdle rate and may result in a substantial increase in the amount of incentive fees payable to CIM with respect to pre-incentive fee net investment income. A decrease in the general level of interest rates can be expected to lead to lower interest rates applicable to our portfolio investments and lower net investment income available for distributions to shareholders.
In addition to regulatory requirements that restrict our ability to raise capital, the JPM Credit Facility, the UBS Facility, the 2026 Notes, the More Term Loans, the Series A Notes and the 2027 Notes contain various covenants that, if not complied with, could accelerate repayment under such secured and unsecured borrowings, thereby materially and adversely affecting our liquidity, financial condition and results of operations.
The agreements governing the JPM Credit Facility, the UBS Facility, the 2026 Notes, the More Term Loans, the Series A Notes and the 2027 Notes require us to comply with certain financial and operational covenants. These covenants may include, among other things:
•restrictions on the level of indebtedness that we are permitted to incur in relation to the value of our assets;
•restrictions on our ability to incur liens; and
•maintenance of a minimum level of shareholders’ equity.
As of the date of this Annual Report, we are in compliance in all material respects with the covenants of the JPM Credit Facility, the UBS Facility, the 2026 Notes, the More Term Loans, the Series A Notes and the 2027 Notes. However, our continued compliance with these covenants depends on many factors, some of which are beyond our control. For example, depending on the condition of the public debt and equity markets and pricing levels, unrealized depreciation in our portfolio may increase in the future. Any such increase could result in our inability to comply with our obligation to restrict the level of indebtedness that we are able to incur in relation to the value of our assets or to maintain a minimum level of shareholders’ equity.
Accordingly, although we believe we will continue to be in compliance, there are no assurances that we will continue to comply with the covenants in the JPM Credit Facility, the UBS Facility, the 2026 Notes, the More Term Loans, the Series A Notes and the 2027 Notes. Failure to comply with these covenants could result in a default under such secured and unsecured borrowings, that, if we were unable to obtain a waiver from the lenders or holders of such indebtedness, as applicable, such lenders or holders could accelerate repayment under such indebtedness and thereby have a material adverse impact on our business, financial condition and results of operations.
The 2026 Notes, the More Term Loans, the Series A Notes and the 2027 Notes are unsecured and therefore are effectively subordinated to any secured indebtedness we have currently incurred or may incur in the future.
The 2026 Notes, the 2021 More Term Loan, the 2022 More Term Loan, the Series A Notes and the 2027 Notes are generally not secured by any of our assets or any of the assets of our subsidiaries. As a result, the 2026 Notes, the 2021 More Term Loan, the 2022 More Term Loan, the Series A Notes and the 2027 Notes are effectively subordinated to any secured indebtedness we or our subsidiaries have currently incurred and may incur in the future (or any indebtedness that is initially unsecured to which we subsequently grant security) to the extent of the value of the assets securing such indebtedness. In any liquidation, dissolution, bankruptcy or other similar proceeding, the holders of any of our existing or future secured indebtedness and the secured indebtedness of our subsidiaries may assert rights against the assets pledged to secure that indebtedness in order to receive full payment of their indebtedness before the assets may be used to pay other creditors, including the holders of the 2026 Notes, the 2021 More Term Loan, the 2022 More Term Loan, the Series A Notes and the 2027 Notes. As a result, the indebtedness under the JPM Credit Facility and the UBS Facility is therefore effectively senior in right of payment to our 2026 Notes, the 2021 More Term Loan, the 2022 More Term Loan, the Series A Notes and the 2027 Notes to the extent of the value of such assets.
Federal Income Tax Risks
We will be subject to corporate-level income tax if we are unable to qualify as a RIC under Subchapter M of the Code or to satisfy RIC distribution requirements.
To qualify for and maintain RIC tax treatment under Subchapter M of the Code, we must, among other things, meet the following annual distribution, income source and asset diversification requirements:
•The annual distribution requirement for a RIC will be satisfied if we distribute to our shareholders on an annual basis at least 90% of our net ordinary income and realized net short-term capital gains in excess of realized net long-term capital losses, if any. Because we use debt financing, we are subject to an asset coverage ratio requirement under the 1940 Act and are subject to certain financial covenants under our financing arrangements that could, under certain circumstances, restrict us from paying distributions necessary to satisfy the distribution requirement. If we are unable to obtain cash from other sources, we could fail to qualify for RIC tax treatment and thus become subject to corporate-level income tax.
•The income source requirement will be satisfied if we obtain at least 90% of our income for each taxable year from dividends, interest, gains from the sale of common stock or securities or similar sources.
•The asset diversification requirement will be satisfied if we meet certain asset diversification requirements at the end of each quarter of our taxable year. To satisfy this requirement, at least 50% of the value of our assets must consist of cash, cash equivalents, U.S. government securities, securities of other RICs, and other securities if such other securities of any one issuer do not represent more than 5% of the value of our assets or more than 10% of the outstanding voting securities of the issuer; and no more than 25% of the value of our assets can be invested in the securities, other than U.S. government securities or securities of other RICs, of one issuer, of two or more issuers that are controlled, as determined under applicable Code rules, by us and that are engaged in the same or similar or related trades or businesses or of certain “qualified publicly-traded partnerships.” Failure to meet these requirements may result in our having to dispose of certain investments quickly in order to prevent the loss of RIC status. Because most of our investments will be in private companies, and therefore will be relatively illiquid, any such dispositions could be made at disadvantageous prices and could result in substantial losses.
If we fail to maintain RIC tax treatment for any reason and are subject to corporate income tax, the resulting corporate taxes could substantially reduce our net assets, the amount of income available for distribution and the amount of our distributions.
We may have difficulty paying our required distributions if we recognize income before or without receiving cash representing such income.
For federal income tax purposes, we may be required to recognize taxable income in circumstances in which we do not receive a corresponding payment in cash. For example, if we hold debt obligations that are treated under applicable tax rules as having original issue discount (such as debt instruments with PIK interest or, in certain cases, increasing interest rates or debt instruments that were issued with warrants), we must include in income each year a portion of the original issue discount that accrues over the life of the obligation, regardless of whether cash representing such income is received by us in the same taxable year. We may also have to include in income other amounts that we have not yet received in cash, such as deferred loan origination fees that are paid after origination of the loan or are paid in non-cash compensation such as warrants or stock. We anticipate that a portion of our income may constitute original issue discount or other income required to be included in taxable income prior to receipt of cash. Further, we may elect to amortize market discounts and include such amounts in our taxable income in the current year, instead of upon disposition, as an election not to do so would limit our ability to deduct interest expenses for tax purposes.
Because any original issue discount or other amounts accrued will be included in our investment company taxable income for the year of the accrual, we may be required to pay a distribution to our shareholders in order to satisfy the annual distribution requirement, even though we will not have received any corresponding cash amount. As a result, we may have difficulty meeting the annual distribution requirement necessary to qualify for and maintain RIC tax treatment under Subchapter M of the Code. We may have to sell some of our investments at times and/or at prices we would not consider advantageous, raise additional debt or equity capital or forgo new investment opportunities for this purpose. If we are not able to obtain cash from other sources, we may fail to qualify for or maintain RIC tax treatment and thus become subject to corporate-level income tax.
Deferred PIK interest instruments may have less reliable valuations because these instruments have continuing accruals that require continuing judgment about the collectability of the deferred payments and the value of any associated collateral. In addition, deferred PIK interest instruments create the risk of non-refundable cash payments to our investment adviser based on non-cash accruals that ultimately may not be realized. For accounting purposes, any distributions to shareholders representing deferred PIK interest income are not treated as coming from paid-in capital, even though the cash to pay these distributions may come from offering proceeds (if any) or borrowings. Thus, although a distribution of deferred PIK interest may come from the cash invested by shareholders or from borrowings, the 1940 Act does not require that shareholders be given notice of this fact by reporting it as a return of capital.
If we do not qualify as a “publicly offered regulated investment company,” as defined in the Code, shareholders will be taxed as though they received a distribution of some of our expenses.
A “publicly offered regulated investment company” is a RIC whose shares are either (i) continuously offered pursuant to a public offering within the meaning of Section 4 of the Securities Act, (ii) regularly traded on an established securities market or (iii) held by at least 500 persons at all times during the taxable year. If we are not a publicly offered RIC for any period, a non-corporate shareholder’s allocable portion of our affected expenses, including our management fees, will be treated as an additional distribution to the shareholder and will be deductible by such shareholder only to the extent permitted under the limitations described below. For non-corporate shareholders, including individuals, trusts, and estates, significant limitations generally apply to the deductibility of certain expenses of a non-publicly offered RIC, including advisory fees. In particular, these expenses, referred to as miscellaneous itemized deductions, are deductible to an individual only to the extent they exceed 2% of such shareholder’s adjusted gross income, and are not deductible for alternative minimum tax purposes. While we anticipate that we will constitute a publicly offered RIC, there can be no assurance that we will in fact so qualify for any of our taxable years.
Risks Relating to an Investment in Our Common Stock
The market price of our common stock may fluctuate significantly.
The market price and liquidity of the market for shares of our common stock that will prevail in the market may be higher or lower than the price you pay and may be significantly affected by numerous factors, some of which are beyond our control and may not be directly related to our operating performance. These factors include:
•significant volatility in the market price and trading volume of securities of BDCs or other companies in our sector, which are not necessarily related to the operating performance of these companies;
•price and volume fluctuations in the overall stock market from time to time;
•the inclusion or exclusion of our stock from certain indices;
•changes in regulatory policies or tax guidelines, particularly with respect to RICs or BDCs;
•any loss of RIC or BDC status;
•changes in earnings or perceived changes or variations in operating results;
•changes or perceived changes in the value of our portfolio of investments;
•changes in accounting guidelines governing valuation of our investments;
•any shortfall in revenue or net income or any increase in losses from levels expected by investors or securities analysts;
•the inability of CIM to employ additional experienced investment professionals or the departure of any of CIM’s key personnel;
•short-selling pressure with respect to shares of our common stock or BDCs generally;
•future sales of our securities convertible into or exchangeable or exercisable for our common stock or the conversion of such securities;
•uncertainty surrounding the strength of the U.S. economy;
•concerns regarding European sovereign debt and economic activity generally;
•operating performance of companies comparable to us;
•general economic trends and other external factors; and
•loss of a major funding source.
In the past, following periods of volatility in the market price of a company’s securities, securities class action litigation has often been brought against that company. If our stock price fluctuates significantly, we may be the target of securities litigation in the future. Securities litigation could result in substantial costs and divert management’s attention and resources from our business.
We cannot assure you that a market for shares of our common stock will be maintained or the market price of our shares will trade close or at a premium to NAV.
We cannot assure you that a trading market for our common stock can be sustained. In addition, we cannot predict the prices at which our common stock will trade, whether at, above or below NAV. Shares of closed-end investment companies, including BDCs, frequently trade at a discount from NAV, and our common stock may also be discounted in the market. In addition, if our common stock trades below its NAV, we will generally not be able to sell additional shares of our common stock to the public at its market price without, among other things, the requisite shareholders approving such a sale.
Sales of substantial amounts of our common stock in the public market may have an adverse effect on the market price of our common stock.
Sales of substantial amounts of our common stock, or the availability of such shares for sale, could adversely affect the prevailing market prices for our common stock. If this occurs and continues, it could impair our ability to raise additional capital through the sale of equity securities should we desire to do so.
We may in the future determine to issue preferred stock, which could adversely affect the market value of our common stock.
The issuance of shares of preferred stock with dividend or conversion rights, liquidation preferences or other economic terms more favorable to the holders of preferred stock than to our common shareholders could adversely affect the market price for our common stock by making an investment in the common stock less attractive. In addition, the dividends on any preferred stock we issue must be cumulative. Payment of dividends and repayment of the liquidation preference of preferred stock must take preference over any distributions or other payments to our common shareholders, and holders of preferred stock are not subject to any of our expenses or losses and are not entitled to participate in any income or appreciation in excess of their stated preference (other than convertible preferred stock that converts into common stock). In addition, under the 1940 Act, participating preferred stock and preferred stock constitutes a “senior security” for purposes of the asset coverage test.
We may incur significant costs as a result of being a public company.
Public companies incur legal, accounting and other expenses, including costs associated with the periodic reporting requirements applicable to a company whose securities are registered under the Exchange Act, as well as additional corporate governance requirements, including requirements under the Sarbanes-Oxley Act and the NYSE Listed Company Rules. Accordingly, we may incur significant additional costs as a result of being a public company. These requirements may place a strain on our systems and resources. The Sarbanes-Oxley Act requires that we maintain effective disclosure controls and procedures and internal controls over financial reporting, which are discussed below. In order to maintain and improve the effectiveness of our disclosure controls and procedures and internal controls, significant resources and management oversight may be required. We may be implementing additional procedures, processes, policies and practices for the purpose of addressing the standards and requirements applicable to public companies. These activities may divert management’s attention from other business concerns, which could have a material adverse effect on our business, financial condition, results of operations and cash flows. We may incur significant additional annual expenses related to these steps such as, among other things, directors’ and officers’ liability insurance, director fees, reporting requirements of the SEC, transfer agent fees, additional administrative expenses payable to CIM, as our administrator, to compensate it for hiring additional accounting, legal and administrative personnel, increased auditing and legal fees and similar expenses.
We are obligated to maintain proper and effective internal control over financial reporting. We may not complete our analysis of our internal control over financial reporting in a timely manner, or our internal controls may not be determined to be effective, which may adversely affect investor confidence in our company and, as a result, the value of our common stock.
Due to the Listing, we are required to comply with the independent auditor attestation requirements of Section 404 of the Sarbanes-Oxley Act beginning with our Annual Report on Form 10-K for the fiscal year ended December 31, 2022. Complying with Section 404 requires a rigorous compliance program as well as adequate time and resources. We may not be able to complete our internal control evaluation, testing and any required remediation in a timely fashion. Additionally, if we identify one or more material weaknesses in our internal control over financial reporting, we will be unable to assert that our internal controls are effective. If we are unable to assert that our internal control over financial reporting is effective, or if our auditors are unable to attest to management’s report on the effectiveness of our internal controls, we could lose investor confidence in the accuracy and completeness of our financial reports, which would have a material adverse effect on the price of our common stock.
In 2023 we obtained, and in 2024 we intend to seek, the approval of our shareholders to issue shares of our common stock at prices below the then current NAV per share of our common stock. If we issue such shares and again receive such approval from shareholders in the future, we may issue shares of our common stock at a price below the then current NAV per share of common stock. Any such issuance could materially dilute your interest in our common stock and reduce our NAV per share and potentially the trading price of our common stock.
In September 2023, we obtained approval from our shareholders authorizing us to issue shares of our common stock at prices below the then current NAV per share of our common stock in one or more offerings for a 12-month period. We have not issued any such shares as of the date of this report. In 2024, we intend to seek to obtain from our shareholders and they may approve a proposal that again authorizes us to issue shares of our common stock at prices below the then current NAV per share of our common stock in one or more offerings for a 12-month period. Such approval would allow us to access the capital markets in a way that we were previously unable to do as a result of restrictions that, absent shareholder approval, apply to BDCs under the 1940 Act.
Any sale or other issuance of shares of our common stock at a price below NAV per share will result in an immediate dilution to your interest in our common stock and a reduction of our NAV per share and potentially the trading price of our common stock. This dilution would occur as a result of a proportionately greater decrease in a shareholder’s interest in our earnings and assets and voting interest in us than the increase in our assets resulting from such issuance. Because the number of future shares of common stock that may be issued below our NAV per share and the price and timing of such issuances are not currently known, we cannot predict the actual dilutive effect of any such issuance. We also cannot determine the resulting reduction in our NAV per share or the trading price of our common stock of any such issuance at this time. We caution you that such effects may be material, and we undertake to describe all the material risks and dilutive effects of any actual offerings we may make at a price below our then current NAV in the future.
The determination of NAV in connection with an offering of shares of common stock will involve the determination by our board of directors or a committee thereof that we are not selling shares of our common stock at a price below the then current NAV of our common stock at the time at which the sale is made or otherwise in violation of the 1940 Act, unless we have previously received the consent of the majority of our shareholders to do so and the board of directors decides such an offering is in the best interests of our shareholders. Whenever we do not have current shareholder approval to issue shares of our common stock at a price per share below our then current NAV per share, the offering price per share (after any sales commission or discounts (if applicable)) will equal or exceed our then current NAV per share, based on the value of our portfolio securities and other assets determined in good faith by our board of directors.
A shareholder’s interest in us will be diluted if we issue additional shares of common stock, which could reduce the overall value of an investment in us.
Potential investors will not have preemptive rights to any common stock we issue in the future. Our articles of incorporation authorize us to issue 500,000,000 shares of common stock. Pursuant to our articles of incorporation, a majority of our entire board of directors may amend our articles of incorporation to increase the number of authorized shares of common stock without shareholder approval. To the extent that we issue additional shares of common stock at or below NAV after an investor purchases shares of our common stock, an investor’s percentage ownership interest in us will be diluted. In addition, depending upon the terms and pricing of any additional offerings and the value of our investments, an investor may also experience dilution in the book value and fair value of his or her shares of common stock.
Certain provisions of our articles of incorporation and bylaws could deter takeover attempts and have an adverse impact on the value of our common stock.
Our bylaws exempt us from the Maryland Control Share Acquisition Act, which significantly restricts the voting rights of control shares of a Maryland corporation acquired in a control share acquisition. If our board of directors were to amend our bylaws to repeal this exemption from the Maryland Control Share Acquisition Act, that statute may make it more difficult for a third party to obtain control of us and increase the difficulty of consummating such a transaction. There can be no assurance, however, that we will not so amend our bylaws in such a manner at some time in the future. We will not, however, amend our bylaws to make us subject to the Maryland Control Share Acquisition Act without our board of directors determining that doing so would not conflict with the 1940 Act.
Our articles of incorporation and bylaws, as well as certain statutory and regulatory requirements, contain certain provisions that may have the effect of discouraging a third party from attempting to acquire us. Our board of directors may, without shareholder action, authorize the issuance of shares in one or more classes or series, including preferred shares; and our board of directors may, without shareholder action, amend our articles of incorporation to increase the number of our shares, of any class or series, that we have authority to issue. These anti-takeover provisions may inhibit a change of control in circumstances that could give the holders of our common stock the opportunity to realize a premium over the value of our common stock.
Investing in our common stock involves a high degree of risk.
The investments we make in accordance with our investment objective may result in a higher amount of risk than alternative investment options and volatility or loss of principal. Our investments in portfolio companies may be highly speculative and aggressive and, therefore, an investment in our common stock may not be suitable for someone with lower risk tolerance.
The NAV of our common stock may fluctuate significantly.
The NAV and liquidity, if any, of the market for shares of our common stock may be significantly affected by numerous factors, some of which are beyond our control and may not be directly related to our operating performance. These factors include:
•changes in regulatory policies or tax guidelines, particularly with respect to RICs or BDCs;
•loss of RIC or BDC status;
•changes in earnings or variations in operating results;
•changes in the value of our portfolio of investments;
•changes in accounting guidelines governing valuation of our investments;
•any shortfall in revenue or net income or any increase in losses from levels expected by investors;
•departure of either of our adviser or certain of its key personnel;
•general economic trends and other external factors; and
•loss of a major funding source.
Purchases of our common stock by us pursuant to our 10b5-1 plan may result in the price of our common stock being higher than the price that otherwise might exist in the open market.
We are authorized to purchase up to $60 million of shares of our common stock if our shares trade on the NYSE below the most recently announced NAV per share, subject to certain limitations. Any such purchases will be conducted in accordance with applicable securities laws. During the year ended December 31, 2023, we repurchased an aggregate of 1,114,848 shares under the 10b5-1 trading plan for an aggregate purchase price of $11,518, or an average purchase price of $10.33 per share. Purchases made under our 10b5-1 plan and how much will be purchased at any time is uncertain, dependent on prevailing market prices and trading volumes, all of which we cannot predict. These activities may have the effect of maintaining the market price of our common stock or slowing a decline in the market price of our common stock, and, as a result, the price of our common stock may be higher than the price that otherwise might exist in the open market.
Purchases of our common stock by us under our 10b5-1 plan may result in dilution to our NAV per share.
Under our 10b5-1 plan, we are authorized to purchase shares of our common stock when the market price per share is below the most recently reported NAV per share, subject to certain limitations. Because purchases may be made beginning at any price below our most recently reported NAV per share, if our NAV per share decreases after the date as of which NAV per share was last reported, such purchases may result in dilution to our NAV per share. This dilution would occur because we would purchase shares at a price above the then-current NAV per share, which would cause a proportionately smaller increase in our shareholders’ interest in our earnings and assets and their voting interest in us than the decrease in our assets resulting from such purchase. As a result of any such dilution, our market price per share may decline. The actual dilutive effect will depend on the number of shares of common stock that could be so purchased, the price and the timing of any purchases.
The tax treatment of a non-U.S. shareholder in its jurisdiction of tax residence will depend entirely on the laws of such jurisdiction, and may vary considerably from jurisdiction to jurisdiction.
Depending on (i) the laws of such non-U.S. shareholder’s jurisdiction of tax residence, (ii) how we, the investments and/or any other investment vehicles through which we directly or indirectly invest are treated in such jurisdiction, and (iii) the activities of any such entities, an investment in us could result in such non-U.S. shareholder recognizing adverse tax consequences in its jurisdiction of tax residence, including (a) with respect to any generally required or additional tax filings and/or additional disclosure required in such filings in relation to the treatment for tax purposes in the relevant jurisdiction of an interest in us, the investments and/or any other investment vehicles through which we directly or indirectly invest and/or of distributions from such entities and any uncertainties arising in that respect (such entities not being established under the laws of the relevant jurisdiction), (b) the possibility of taxable income significantly in excess of cash distributed to a non-U.S. shareholder, and possibly in excess of our actual economic income, (c) the possibilities of losing deductions or the ability to utilize tax basis and of sums invested being returned in the form of taxable income or gains, and (d) the possibility of being subject to tax at unfavorable tax rates. A non-U.S. shareholder may also be subject to restrictions on the use of its share of our deductions and losses in its jurisdiction of tax residence. Each shareholder is urged to consult its own tax advisors with respect to the tax and tax filing consequences, if any, in its jurisdiction of tax residence of an investment in us, as well as any other jurisdiction in which such shareholder is subject to taxation.
General Risk Factors
Global economic, political and market conditions may adversely affect our business, financial condition and results of operations, including our revenue growth and profitability.
The current worldwide financial market situation, as well as various social and political tensions in the United States and around the world, have contributed and may continue to contribute to increased market volatility, may have long-term effects on the United States and worldwide financial markets, and may cause economic uncertainties or deterioration in the United States and worldwide. We monitor developments and seek to manage our investments in a manner consistent with achieving our investment objective, but there can be no assurance that we will be successful in doing so.
Concerns over the United States’ debt ceiling and budget-deficit have driven downgrades by rating agencies to the U.S. government’s credit rating. Downgrades by rating agencies to the U.S. government’s credit rating or concerns about its credit and deficit levels in general could cause interest rates and borrowing costs to rise, which may negatively impact both the perception of credit risk associated with our debt portfolio and our ability to access the debt markets on favorable terms. In addition, a decreased U.S. government credit rating, any default by the U.S. government on its obligations, or any prolonged U.S. government shutdown, could create broader financial turmoil and uncertainty, which may weigh heavily on our financial performance and the value of our common stock. U.S. debt ceiling and budget deficit concerns have increased the possibility of additional credit-rating downgrades and economic slowdowns or a recession in the United States.
Deterioration in the economic conditions in the Eurozone and other regions or countries globally and the resulting instability in global financial markets may pose a risk to our business. Financial markets have been affected at times by a number of global macroeconomic events, including large sovereign debts and fiscal deficits of several countries in Europe and in emerging markets jurisdictions, levels of non‑performing loans on the balance sheets of European banks, instability in the Chinese capital markets and the COVID-19 pandemic. Global market and economic disruptions have affected, and may in the future affect, the U.S. capital markets, which could adversely affect our business, financial condition or results of operations. We cannot assure you that market disruptions in Europe and other regions or countries, including the increased cost of funding for certain governments and financial institutions, will not impact the global economy, and we cannot assure you that assistance packages will be available, or if available, be sufficient to stabilize countries and markets in Europe or elsewhere affected by a financial crisis. To the extent uncertainty regarding any economic recovery in Europe or elsewhere negatively impacts consumer confidence and consumer credit factors, our business, financial condition and results of operations could be significantly and adversely affected. Moreover, there is a risk of both sector-specific and broad-based corrections and/or downturns in the equity and credit markets. Any of the foregoing could have a significant impact on the markets in which we operate and could have a material adverse impact on our business prospects and financial condition.
Our business is directly influenced by the economic cycle and could be negatively impacted by a downturn in economic activity in the U.S. as well as globally. Fiscal and monetary actions taken by U.S. and non-U.S. government and regulatory authorities could have a material adverse impact on our business. To the extent uncertainty regarding the U.S. or global economy negatively impacts consumer confidence and consumer credit factors, our business, financial condition and results of operations could be adversely affected. Moreover, Federal Reserve policy, including with respect to certain interest rates, along with the general policies of the current Presidential administration, may also adversely affect the value, volatility and liquidity of dividend- and interest-paying securities. These conditions, government actions and future developments may cause interest rates and borrowing costs to remain high, which may adversely affect our ability to access debt financing on favorable terms and may increase the interest costs of our borrowers, hampering their ability to repay us. Continued or future adverse economic conditions could have a material adverse effect on our business, financial condition and results of operations.
If key economic indicators, such as the unemployment rate or inflation, do not progress at a rate consistent with the Federal Reserve’s objectives, the target range for the federal funds rate may remain high and cause interest rates and borrowing costs to remain high, which may negatively impact our ability to access the debt markets on favorable terms and may also increase the costs of our borrowers, hampering their ability to repay us. In an effort to combat inflation, the Federal Reserve increased the federal funds rate in 2023. Although the Federal Reserve left its benchmark rates steady in the fourth quarter of 2023, it has indicated that additional rate increases in the future may be necessary to mitigate inflationary pressures and there can be no assurance that the Federal Reserve will not make upwards adjustments to the federal funds rate in the future. However, there are reports that the Federal Reserve may begin to cut the benchmark rates in 2024. The timing, number and amount of any such future interest rate changes are uncertain.
Various social and political circumstances in the U.S. and around the world (including wars and other forms of conflict, terrorist acts, security operations and catastrophic events such as fires, floods, earthquakes, tornadoes, hurricanes and global health epidemics or outbreaks of infectious diseases), may also contribute to increased market volatility and economic uncertainties or deterioration in the U.S. and worldwide. Such events, including trade tensions between the United States and China, other uncertainties regarding actual and potential shifts in U.S. and foreign trade, economic and other policies with other countries, the Russia-Ukraine war and more recently the Israel-Hamas war, and health epidemics and pandemics, could adversely affect our business, financial condition or results of operations. These market and economic disruptions could also negatively impact the operating results of our portfolio companies.
Political, social and economic uncertainty, including uncertainty related to the Russia-Ukraine war and more recently the Israel-Hamas war, creates and exacerbates risks.
Social, political, economic and other conditions and events in the U.S., the United Kingdom, the European Union, China and elsewhere around the world (such as natural disasters, epidemics and pandemics, terrorism, military conflicts and social unrest) may occur that create uncertainty and have significant impacts on issuers, industries, governments and other systems, including the financial markets, to which companies and their investments are exposed.
The uncertainties caused by these conditions and events could result in or coincide with, among other things: increased volatility in the financial markets for securities, derivatives, loans, credit and currency; a decrease in the reliability of market prices and difficulty in valuing assets (including portfolio company assets); greater fluctuations in spreads on debt investments and currency exchange rates; increased risk of default (by both government and private obligors and issuers); changes to governmental regulation and supervision of the loan, securities, derivatives and currency markets and market participants; limitations on the activities of investors in the financial markets; and substantial, and in some periods extremely high, rates of inflation, which can last many years and have substantial negative effects on credit and securities markets.
The conditions noted above could continue for an extended period and other adverse developments may occur or reoccur, including (i) the decline in value and performance of us and our portfolio companies, (ii) the ability of our borrowers to continue to meet loan covenants or repay loans provided by us on a timely basis or at all, which may require us to restructure our investments or write down the value of our investments, (iii) our ability to comply with the covenants and other terms of our debt obligations and to repay such obligations, on a timely basis or at all, (iv) our ability to comply with certain regulatory requirements, such as asset coverage requirements under the 1940 Act, (v) our ability to maintain our distributions at their current level or to pay them at all or (vi) our ability to source, manage and divest investments and achieve our investment objectives, all of which could result in significant losses to us. We will also be negatively affected if the operations and effectiveness of any of our portfolio companies (or any of the key personnel or service providers of the foregoing) is compromised or if necessary or beneficial systems and processes are disrupted.
In addition, Russia’s invasion of Ukraine in February 2022 and corresponding events have had, and could continue to have, severe adverse effects on regional and global economic markets. Following Russia’s actions, various governments, including the government of the United States, issued broad-ranging economic sanctions against Russia, including, among other actions, a prohibition on doing business with certain Russian companies, large financial institutions, officials and oligarchs; a commitment by certain countries and the European Union to remove selected Russian banks from the Society for Worldwide Interbank Financial Telecommunications, the electronic banking network that connects banks globally; and restrictive measures to prevent the Russian Central Bank from undermining the impact of the sanctions. The duration of hostilities and the vast array of sanctions and related events (including cyber incidents and espionage) cannot be predicted. The Israel-Hamas war has created similar adverse effects on regional and global economic markets, including social unrest in the United States and around the world. These events present material uncertainty and risk with respect to markets globally, which pose potential adverse risks to us and the performance of our investments and operations. Any such market disruptions could affect our portfolio companies’ operations and, as a result, could have a material adverse effect on our business, financial condition and results of operations.
The capital markets may experience periods of disruption, instability and economic uncertainty. Such market conditions may materially and adversely affect the debt and equity capital markets, which may have a negative impact on our business and operations.
From time to time, capital markets may experience periods of disruption, instability and economic uncertainty. Such periods may result in, among other things, write-offs, the re-pricing of credit risk, the failure of financial institutions or worsening general economic conditions, any of which could materially and adversely impact the broader financial and credit markets and reduce the availability of debt and equity capital for the market as a whole and financial services firms in particular. In addition, social and political tensions in the U.S. and around the world may contribute to increased market volatility, may have long-term effects on the U.S. and worldwide financial markets, and may cause economic uncertainties or deterioration in the U.S. and worldwide. There can be no assurance these market conditions will not occur or worsen in the future, including as a result of the Russia-Ukraine war and more recently the Israel-Hamas war, health epidemics and pandemics, rising interest rates or renewed inflationary pressure.
Significant disruption or volatility in the capital markets may also negatively affect the valuations of our investments. While most of our investments are not publicly traded, applicable accounting standards require us to assume as part of our valuation process that our investments are sold in a principal market to market participants (even if we plan to hold an investment to maturity). Our valuations, and particularly valuations of private investments and private companies, are inherently uncertain, fluctuate over short periods of time and are often based on estimates, comparisons and qualitative evaluations of private information that may not reflect the full impact of inflation and high interest rates and measures taken in response thereto. Significant disruption or volatility in the capital markets also could limit our investment originations, limit the potential for liquidity events involving our investments, limit our ability to grow and have a material negative impact on our and our portfolio companies’ operating results and the fair values of our debt and equity investments. The illiquidity of our investments may make it difficult for us to sell such investments to access capital, if required. As a result, we could realize significantly less than the value at which we have recorded our investments if we were required to sell them to increase our liquidity. An inability on our part to raise incremental capital, and any required sale of all or a portion of our investments as a result, could have a material adverse effect on our business, financial condition or results of operations.
Further, volatility and dislocation in the capital markets may make it difficult to raise equity capital, extend the maturity of or refinance our existing indebtedness or obtain new indebtedness with similar terms and any failure to do so could have a material adverse effect on our business. The debt capital that we have raised over the last year has generally been at higher rates than we have raised debt at in the past due to the higher interest rate environment we have been experiencing. The debt capital available to us in the future, if available at all, may bear a higher interest rate and may be available only on terms and conditions less favorable than those of our existing debt and such debt may need to be incurred in a high interest rate environment. If we are unable to raise new debt or refinance our existing debt, then our equity investors will not benefit from the potential for increased returns on equity resulting from leverage, and we may be unable to make new commitments or to fund existing commitments to our portfolio companies. Any inability to extend the maturity of or refinance our existing debt, or to obtain new debt, could have a material adverse effect on our business, financial condition or results of operations.
Terrorist attacks, acts of war, global health emergencies or natural disasters may impact the businesses in which we invest and harm our business, operating results and financial condition.
Terrorist acts, acts of war, including the Russia-Ukraine war and more recently the Israel-Hamas war, global health emergencies or natural disasters may disrupt our operations, as well as the operations of the businesses in which we invest. Such acts have created, and continue to create, economic and political uncertainties and have contributed to global economic instability. Future terrorist activities, military or security operations, global health emergencies or natural disasters could further weaken the domestic/global economies and create additional uncertainties, which may negatively impact the businesses in which we invest directly or indirectly and, in turn, could have a material adverse impact on our business, operating results and financial condition. Losses from terrorist attacks, global health emergencies and natural disasters are generally uninsurable.
We are highly dependent on the information systems of CIG and operational risks including systems failures could significantly disrupt our business, result in losses or limit our growth, which may, in turn, negatively affect the market price of our common stock and our ability to pay distributions.
Our business is highly dependent on communications and information systems of CIG, the parent of CIM, which is our investment adviser and our administrator. In this Annual Report, we sometimes refer to hardware, software, information and communications systems maintained by CIG and used by us and CIM as “our” systems. We also face operational risk from transactions and key data not being properly recorded, evaluated or accounted for with respect to our portfolio companies. In addition, we face operational risk from errors made in the execution, confirmation or settlement of transactions. In particular, CIM is highly dependent on its ability to process and evaluate, on a daily basis, transactions across markets and geographies in a time-sensitive, efficient and accurate manner. Consequently, we and CIM rely heavily on CIG’s financial, accounting and other data processing systems.
In addition, we operate in a business that is highly dependent on information systems and technology. CIG’s and our information systems and technology may not continue to be able to accommodate our growth, and the cost of maintaining the information systems and technology, which may be partially allocated to or borne by us, may increase from its current level. Such a failure to accommodate growth, or an increase in costs related to the information systems and technology, could have a material adverse effect on our business and results of operations.
Furthermore, a disaster or a disruption in the infrastructure that supports our businesses, including a disruption involving electronic communications, human resources systems or other services used by us, CIM or third parties with whom we conduct business could have a material adverse effect on our ability to continue to operate our businesses without interruption. Although we and CIG have disaster recovery programs in place, these may not be sufficient to mitigate the harm that may result from such a disaster or disruption. In addition, insurance and other safeguards might only partially reimburse us for any losses as a result of such a disaster or disruption, if at all.
We and CIG also rely on third-party service providers for certain aspects of our respective businesses, including for certain information systems, technology and administration of our portfolio company investments and compliance matters. Operational risks could increase as vendors increasingly offer mobile and cloud-based software services rather than software services that can be operated within CIG’s own data centers, as certain aspects of the security of such technologies may be complex, unpredictable or beyond our or CIG’s control, and any failure by mobile technology or cloud service providers to adequately safeguard their systems and prevent cyber-attacks could disrupt our operations and result in misappropriation, corruption or loss of confidential, proprietary or personal information. In addition, our counterparties’ information systems, technology or accounts may be the target of cyber-attacks. Any interruption or deterioration in the performance of these third parties or the service providers of our counterparties or failures or vulnerabilities of their respective information systems or technology could impair the quality of our operations and could impact our reputation, adversely affect our businesses and limit our ability to grow.
Finally, there has been significant evolution and developments in the use of artificial intelligence technologies, such as ChatGPT. We cannot fully determine the impact of such evolving technology to our business at this time.
Cybersecurity failures and data security incidents could adversely affect our business by causing a disruption to our operations, a compromise or corruption of our confidential, personal or other sensitive information and/or damage to our business relationships or reputation, any of which could negatively impact our business, financial condition and operating results.
The efficient operation of our business is dependent on computer hardware and software systems, as well as data processing systems and the secure processing, storage and transmission of information, all of which are potentially vulnerable to security breaches and cyber-attacks or other security breaches, which may include intentional attacks or accidental losses, either of which may result in unauthorized access to, or corruption of, our hardware, software, or data processing systems, or to our confidential, personal, or other sensitive information. In addition, we, CIM or its employees may be the target of fraudulent emails or other targeted attempts to gain unauthorized access to confidential, personal, or other sensitive information. The result of any cyber-attack or other security incidents may include disrupted operations, misstated or unreliable financial data, fraudulent transfers or requests for transfers of money, liability for stolen assets or information (including personal information), fines or penalties, investigations, increased cybersecurity protection and insurance costs, litigation, or damage to our business relationships and reputation, in each case, causing our business and results of operations to suffer. The rapid evolution and increasing prevalence of artificial intelligence technologies may also increase our cybersecurity risks.
Although we are not currently aware of any cyber-attacks or other incidents that, individually or in the aggregate, have materially affected, or would reasonably be expected to materially affect, our operations or financial condition, there has been an increase in the frequency and sophistication of the cyber and security threats that we face, with attacks ranging from those common to businesses generally to more advanced and persistent attacks. Cyber-attacks and other security threats could originate from a wide variety of sources, including cyber criminals, nation state hackers, hacktivists and other outside or inside parties. We or our third-party providers may face a heightened risk of a security breach or disruption with respect to confidential, personal or other sensitive information resulting from an attack by foreign governments or cyber terrorists. We may be a target for attacks because, as a specialty finance company, we hold confidential and other sensitive information, including price information, about existing and potential investments. Further, we are dependent on third-party vendors for hosting hardware, software and data processing systems that we do not control. We also rely on third-party service providers for certain aspects of our business, including for certain information systems, technology and administration and compliance matters. While we rely on the cybersecurity strategy and policies implemented by CIG, which includes the performance of risk assessments on third-party providers, our reliance on them and their potential reliance on third-party providers removes certain cybersecurity functions from outside of our immediate control, and cyber-attacks on CIG, on us or on our third-party service providers could adversely affect us, our business and our reputation. The costs related to cyber-attacks or other security threats or disruptions may not be fully insured or indemnified by others, including by our third-party providers.
As our reliance on computer hardware and software systems, data processing systems, and other technology has increased, so have the risks posed to such systems, both those we or CIG control and those provided by third-party vendors. Cyber-attacks may originate from a wide variety of sources, and while CIG has implemented processes, procedures and internal controls designed to mitigate cybersecurity risks and cyber-attacks, these measures do not guarantee that a cyber-attack will not occur or that our financial results, operations or confidential information, personal or other sensitive information will not be negatively impacted by such an incident, especially because the techniques of threat actors change frequently and are often not recognized until launched. CIG relies on industry accepted security measures and technology to securely maintain confidential and proprietary information maintained on its information systems, as well as on policies and procedures to protect against the unauthorized or unlawful disclosure of confidential, personal or other sensitive information. Although CIG takes protective measures and endeavors to strengthen its computer systems, software, technology assets and networks to prevent and address potential cyber-attacks, there can be no assurance that any of these measures prove effective. CIG expects to be required to devote increasing levels of funding and resources, which may in part be allocated to us, to comply with evolving cybersecurity and privacy laws and regulations and to continually monitor and enhance its cybersecurity procedures and controls.
Cybersecurity risks are exacerbated by the rapidly increasing volume of highly sensitive data, including our proprietary business information and intellectual property, personal information of CIM’s employees, our investors and others and other sensitive information that CIG collects, processes and stores in its data centers and on its networks or those of its third-party service providers. The secure processing, maintenance and transmission of this information are critical to our operations. A significant actual or potential theft, loss, corruption, exposure, fraudulent use or misuse of investor, employee or other personal information, proprietary business data or other sensitive information, whether by third parties or as a result of employee malfeasance or otherwise, non-compliance with applicable contractual or other legal obligations regarding such data or intellectual property or a violation of applicable privacy and security policies with respect to such data could result in significant investigation, remediation and other costs, fines, penalties, litigation or regulatory actions against us and significant reputational harm, any of which could harm our business and results of operations.
Our portfolio companies also rely on similar systems and face similar risks. A disruption or compromise of these systems could have a material adverse effect on the value of these businesses. We may invest in strategic assets having a national or regional profile, the nature of which could expose them to a greater risk of being subject to a terrorist attack or cyber-attack than other assets or businesses. Such an event may have material adverse consequences on our investments or may require portfolio companies to increase preventative security measures or expand insurance coverage.
In addition, we operate in a business that is highly dependent on information systems and technology. The costs related to cyber or other security threats or disruptions may not be fully insured or indemnified by other means. Cybersecurity has become a priority for regulators in the U.S. and around the world. In the latter half of 2021, the SEC brought three charges, sanctioning eight companies, all of which were registered as broker dealers, investment advisory firms or both, for deficient cybersecurity policies and procedures, and settled charges in two separate actions against public companies for deficient disclosure controls and procedures violations related to a cybersecurity vulnerability that exposed sensitive customer information. More recently, the SEC proposed new rules related to cybersecurity risk management for registered investment advisers, registered investment companies and BDCs, as well as amendments to certain rules that govern investment adviser and fund disclosures. In July 2023, the SEC also adopted rules requiring public companies to disclose material cybersecurity incidents on Form 8-K and periodic disclosure of a registrant’s cybersecurity risk management, strategy, and governance in annual reports. The rules became effective beginning with annual reports for fiscal years ending on or after December 15, 2023 and beginning with Form 8-Ks on December 18, 2023. With the SEC particularly focused on cybersecurity, we expect increased scrutiny of our and CIG’s policies and systems designed to manage cybersecurity risks and related disclosures. We also may face increased costs to comply with the new SEC rules, including CIG’s increased costs for cybersecurity training and management, a portion of which may be allocated to us. Many jurisdictions in which we operate have laws and regulations relating to data privacy, cybersecurity and protection of personal information, including, the CCPA, the New York SHIELD Act, the General Data Protection Regulation, or GDPR, and the U.K. GDPR. In addition, the SEC has indicated in recent periods that one of its examination priorities for the Office of Compliance Inspections and Examinations is to continue to examine cybersecurity procedures and controls, including testing the implementation of these procedures and controls.
There may be substantial financial penalties or fines for breach of privacy laws (which may include insufficient security for personal or other sensitive information). For example, the maximum penalty for breach of the GDPR is the greater of 20 million Euros and 4% of group annual worldwide turnover, and fines for each violation of the CCPA are $2,500, or $7,500 per violation for intentional violations. Non-compliance with any applicable privacy or data security laws represents a serious risk to our business. Some jurisdictions have also enacted laws requiring companies to notify individuals of data security breaches involving certain types of personal information. Breaches in security could potentially jeopardize CIM’s employees’ or our investors’ or counterparties’ confidential or other information processed and stored in, or transmitted through, our or CIG’s computer systems and networks (or those of our third-party service providers), or otherwise cause interruptions or malfunctions in CIM’s employees’, our investors’, our portfolio companies’, our counterparties’ or third parties’ operations, which could result in significant losses, increased costs, disruption of our business, liability to our investors, our portfolio companies and other counterparties, fines or penalties, litigation, regulatory intervention or reputational damage, which could also lead to a loss of investors.
We and our portfolio companies may maintain cash balances at financial institutions that exceed federally insured limits and may otherwise be materially affected by adverse developments affecting the financial services industry, such as actual events or concerns involving liquidity, defaults or non-performance by financial institutions or transactional counterparties.
Our cash is held principally at one financial institution that we believe is of high quality and at times may exceed insured limits. Cash held by us and by our portfolio companies in non-interest-bearing and interest-bearing operating accounts may exceed the FDIC insurance limits. If such banking institutions were to fail, we or our portfolio companies could lose all or a portion of those amounts held in excess of such insurance limitations. In addition, actual events involving limited liquidity, defaults, non-performance or other adverse developments that affect financial institutions, transactional counterparties or other companies in the financial services industry or the financial services industry generally, or concerns or rumors about any events of these kinds or other similar risks, have in the past and may in the future lead to market-wide liquidity problems, which could adversely affect our and our portfolio companies’ business, financial condition, results of operations, or prospects.
Although we assess our banking relationships as we believe necessary or appropriate, our access to funding sources and other credit arrangements in amounts adequate to finance or capitalize our current and projected future business operations could be significantly impaired by factors that affect us, the financial institutions with which we have arrangements directly, or the financial services industry or economy in general. These factors could include, among others, events such as liquidity constraints or failures, the ability to perform obligations under various types of financial, credit or liquidity agreements or arrangements, disruptions or instability in the financial services industry or financial markets or concerns or negative expectations about the prospects for companies in the financial services industry. These factors could involve financial institutions or financial services industry companies with which we have financial or business relationships but could also include factors involving financial markets or the financial services industry generally.
In addition, investor concerns regarding the U.S. or international financial systems could result in less favorable commercial financing terms, including higher interest rates or costs and tighter financial and operating covenants, or systemic limitations on access to credit and liquidity sources, thereby making it more difficult for us to acquire financing on acceptable terms or at all.
Item 1B. Unresolved Staff Comments
Not applicable.
Item 1C. Cybersecurity
Assessment, Identification and Management of Material Risks from Cybersecurity Threats
We rely on the cybersecurity strategy and policies implemented by CIG, the parent of CIM, which is our investment adviser and our administrator. CIG’s cybersecurity strategy prioritizes detection and analysis of and response to known, anticipated or unexpected threats, effective management of security risks and resilience against cyber incidents. CIG’s enterprise-wide cybersecurity program is aligned to the National Institute of Standards and Technology Cybersecurity Framework. CIG’s cybersecurity risk management processes include technical security controls, policy enforcement mechanisms, monitoring systems, tools and related services, which include tools and services from third-party providers, and management oversight to assess, identify and manage risks from cybersecurity threats. CIG has implemented and continues to implement risk-based controls designed to prevent, detect and respond to information security threats and we rely on those controls to help us protect our information, our information systems, and the information of our investors and other third parties who entrust us with their sensitive information.
CIG’s cybersecurity program includes physical, administrative and technical safeguards, as well as plans and procedures designed to help CIG prevent and timely and effectively respond to cybersecurity threats and incidents, including threats or incidents that may impact us or CIM. CIG’s cybersecurity risk management process seeks to monitor cybersecurity vulnerabilities and potential attack vectors, evaluate the potential operational and financial effects of any threat and mitigate such threats. In addition, CIG may periodically engage with third-party consultants and key vendors to assist it in assessing, enhancing, implementing and monitoring its cybersecurity risk management programs and responding to incidents.
The CIG cybersecurity risk management and awareness programs include periodic identification and testing of vulnerabilities, regular phishing simulations and annual general cybersecurity awareness and data protection training, including for employees of CIM. CIG also has annual certification requirements for employees, including employees who provide services to us pursuant to our investment advisory agreement and our administration agreement with respect to certain policies supporting the cybersecurity program, including CIG’s Information Security Policy, Business Continuity, Disaster Recovery and Cybersecurity Plan, and Privacy Policy. CIG undertakes periodic internal security reviews of our information systems and related controls, including systems affecting personal data and the cybersecurity risks of CIG’s and our critical third-party vendors and other partners. We depend on and engage various third parties, including suppliers, vendors, and service providers. Our risk management, legal, information technology, and compliance personnel identify and oversee risks from cybersecurity threats associated with our use of such third parties. CIG also completes periodic external reviews of its cybersecurity program and practices, which include assessments of relevant data protection practices and targeted attack simulations.
In the event of a cybersecurity incident impacting us or CIM, CIG has developed an incident response plan that provides guidelines for responding to such an incident and facilitates coordination across multiple operational functions of CIG, including coordinating with the relevant employees of CIM. The incident response plan includes notification to the applicable members of cybersecurity leadership. Depending on their nature, incidents may also be reported to the audit committee of our board of directors and to our full board of directors, if appropriate.
Material Impact of Cybersecurity Risks
The potential impact of risks from cybersecurity threats are assessed on an ongoing basis, and how such risks could materially affect our business strategy, operational results, and financial condition are regularly evaluated. In the last three fiscal years, we have not experienced a material information security breach incident and the expenses we have incurred from information security breach incidents have been immaterial, and we have not identified any risks from cybersecurity threats, including as a result of previous cybersecurity incidents, that we believe have materially affected, or are reasonably likely to materially affect, us, including our business strategy, operational results, and financial condition. However, future incidents could have a material impact on our business strategy, results of operations or financial condition. For additional discussion of the risks posed by cybersecurity threats, see “Item 1A. Risk Factors— General Risk Factors—Cybersecurity failures and data security incidents could adversely affect our business by causing a disruption to our operations, a compromise or corruption of our confidential, personal or other sensitive information and/or damage to our business relationships or reputation, any of which could negatively impact our business, financial condition and operating results.”
Oversight of Cybersecurity Risks
Our board of directors provides strategic oversight on cybersecurity matters, including risks associated with cybersecurity threats. Our board of directors receives periodic updates from our Chief Compliance Officer regarding the overall state of our cybersecurity program, information on the current threat landscape, and risks from cybersecurity threats and cybersecurity incidents. These reports also include updates on our preparedness, prevention, detection, responsiveness and recovery with respect to cyber incidents.
Our management, including our Chief Compliance Officer, and members of CIG’s information technology team, are responsible for assessing and managing material risks from cybersecurity threats. Such individuals possess relevant expertise in various disciplines that are key to effectively managing such risks, such as information systems technology, cybersecurity, regulatory compliance and corporate governance. Our management and members of CIG’s information technology team are informed about and monitor the prevention, detection, mitigation, and remediation of cybersecurity incidents, including through the receipt of notifications from service providers and reliance on communications with risk management, legal, information technology, and/or compliance personnel.
Item 2. Properties
We do not own any real estate or other physical properties materially important to our operations. Our executive offices are located at 100 Park Avenue, 25th Floor, New York, NY 10017. We believe that our current office facilities are adequate for our business as it is presently conducted.
Item 3. Legal Proceedings
We are not currently subject to any material legal proceedings, nor, to our knowledge, is any material legal proceeding threatened against us. From time to time, we may be party to certain legal proceedings in the ordinary course of business, including proceedings relating to the enforcement of our rights under contracts with our portfolio companies and other third parties. While the outcome of these legal proceedings cannot be predicted with certainty, we do not expect that any such proceedings will have a material effect upon our financial condition or results of operations.
Item 4. Mine Safety Disclosures
Not applicable.
PART II
Item 5. Market for Registrant’s Common Equity, Related Shareholder Matters and Issuer Purchases of Equity Securities
Price Range of Common Stock
Our common stock has been listed on the NYSE under the ticker symbol "CION" since October 5, 2021. Prior to October 5, 2021, our shares were not listed on an exchange or quoted through a quotation system. The following table sets forth, for each fiscal quarter commencing September 30, 2021, the NAV per share of our common stock, the range of high and low closing sales prices of our common stock reported on the NYSE, the closing sales price as a premium (discount) to NAV and distributions declared by us. On March 6, 2024, the last reported closing sales price of our common stock on the NYSE was $10.88 per share, which represented a discount of approximately (33.0)% to the NAV per share reported by us as of December 31, 2023.
| | | | | | | | | | | | | | | | | | | | | | | | | | | | | | | | | | | | | | |
| | | | Closing Sales
Price | | Premium (Discount) of High Sales Price to NAV(2) | | Premium (Discount) of Low Sales Price to NAV(2) | | Declared Distributions(3) |
| | NAV(1) | | High | | Low | | | |
| Fiscal Year Ending December 31, 2024 | | | | | | | | | | | | |
First Fiscal Quarter(4) | | * | | $ | 11.43 | | | $ | 10.74 | | | * | | * | | $ | 0.34 | |
| Fiscal Year Ended December 31, 2023 | | | | | | | | | | | | |
| First Fiscal Quarter | | $ | 15.11 | | | $ | 11.25 | | | $ | 9.42 | | | (25.5) | % | | (37.7) | % | | $ | 0.34 | |
| Second Fiscal Quarter | | $ | 15.31 | | | $ | 10.74 | | | $ | 9.13 | | | (29.8) | % | | (40.4) | % | | $ | 0.34 | |
| Third Fiscal Quarter | | $ | 15.80 | | | $ | 11.65 | | | $ | 10.48 | | | (26.3) | % | | (33.7) | % | | $ | 0.39 | |
| Fourth Fiscal Quarter | | $ | 16.23 | | | $ | 11.65 | | | $ | 9.70 | | | (28.2) | % | | (40.2) | % | | $ | 0.54 | |
| Fiscal Year Ended December 31, 2022 | | | | | | | | | | | | |
| First Fiscal Quarter | | $ | 16.20 | | | $ | 14.98 | | | $ | 11.80 | | | (7.5) | % | | (27.2) | % | | $ | 0.28 | |
| Second Fiscal Quarter | | $ | 15.89 | | | $ | 14.13 | | | $ | 7.98 | | | (11.1) | % | | (49.8) | % | | $ | 0.28 | |
| Third Fiscal Quarter | | $ | 16.26 | | | $ | 10.85 | | | $ | 8.09 | | | (33.3) | % | | (50.2) | % | | $ | 0.31 | |
| Fourth Fiscal Quarter | | $ | 15.98 | | | $ | 10.83 | | | $ | 8.36 | | | (32.2) | % | | (47.7) | % | | $ | 0.58 | |
| Fiscal Year Ended December 31, 2021 | | | | | | | | | | | | |
| Fourth Fiscal Quarter | | $ | 16.34 | | | $ | 14.86 | | | $ | 11.80 | | | (9.1) | % | | (27.8) | % | | $ | 0.46 | |
(1) NAV per share is determined as of the last day in the relevant quarter and therefore may not reflect the NAV per share on the date of the high and low closing sales prices. The NAV shown is based on outstanding shares at the end of the relevant quarter.
(2) Calculated as the respective high or low closing sales price less NAV divided by NAV as of the last day in the relevant quarter.
(3) Represents the distributions declared in the relevant quarter.
(4) Through March 6, 2024.
* NAV has not yet been calculated for this period.
Shares of BDCs may trade at a market price that is less than the value of the net assets attributable to those shares. The possibility that our shares of common stock will trade at a discount from NAV or at premiums that are unsustainable over the long term is separate and distinct from the risk that our NAV will decrease. At times, our shares of common stock may trade at a premium to NAV and at times our shares of common stock have traded at a discount to the net assets attributable to those shares. It is not possible to predict whether shares of our common stock will trade at, above or below our NAV in the future. See “Risk Factors—Risks Related to an Investment in Our Common Stock—We cannot assure you that a market for shares of our common stock will be maintained or the market price of our shares will trade close or at a premium to NAV."
Holders
As of March 6, 2024, we had 2,199 record holders of our common stock, which includes Cede & Co. but does not include beneficial owners of shares of common stock held in “street name” by brokers and other institutions on behalf of shareholders.
Transfer Agent
SS&C Technologies, Inc. (formerly, DST Systems, Inc.) serves as our transfer agent, distribution paying agent and registrar.
Reverse Stock Split
Effective on September 21, 2021, every two shares of our common stock then issued and outstanding were automatically combined into one share of our common stock, with the number of then issued and outstanding shares reduced from 113,916,869 to 56,958,440. The reverse stock split amendment also provided that there was no change in the par value of $0.001 per share as a result of the reverse stock split. In addition, the reverse stock split did not modify the rights or preferences of our common stock.
Listings
On October 5, 2021, our shares of common stock commenced trading on the NYSE under the ticker symbol “CION”. As approved by shareholders on September 7, 2021, the Listing was staggered such that (i) up to 1/3rd of shares held by all shareholders were available for trading upon Listing, (ii) up to 2/3rd of shares held by all shareholders were available for trading starting 180 days after Listing, or April 4, 2022, and (iii) all shares were available for trading starting 270 days after Listing, or July 5, 2022.
On February 26, 2023, our common stock and our Series A Notes listed in Israel on the TASE under the ticker symbol “CION” and "CION B1", respectively.
Distributions and Distribution Reinvestment Plan
We did not declare or pay any distributions during 2012. In January 2013, we began authorizing monthly distributions to our shareholders. From February 1, 2014 through July 17, 2017, our board of directors authorized and declared on a monthly basis a weekly distribution amount per share of our common stock. On July 18, 2017, our board of directors authorized and declared on a quarterly basis a weekly distribution amount per share of our common stock. Effective September 28, 2017, our board of directors delegated to management the authority to determine the amount, record dates, payment dates and other terms of distributions to shareholders, which are ratified by our board of directors, each on a quarterly basis. Beginning on March 19, 2020, we changed the timing of declaring distributions from quarterly to monthly and temporarily suspended the payment of distributions to shareholders commencing with the month ended April 30, 2020. On July 15, 2020, our board of directors determined to recommence the payment of distributions to shareholders in August 2020. On September 15, 2021, we changed the timing of declaring and paying regular distributions to shareholders from monthly to quarterly commencing with the fourth quarter of 2021. Distributions in respect of future quarters and any supplemental or special distributions will be evaluated by management and the board of directors based on circumstances and expectations existing at the time of consideration.
Subject to our board of directors’ discretion and applicable legal restrictions, our management intends to continue to authorize and declare, and our board of directors intends to continue to ratify, a quarterly distribution amount per share of our common stock. Declared regular distributions are paid quarterly. We will calculate each shareholder’s specific distribution amount for the period using record and declaration dates and each shareholder’s distributions will begin to accrue on the date such shareholder first owns shares of our common stock. From time to time, we may also pay interim supplemental or special distributions in the form of cash or shares of common stock at the discretion of our board of directors. As required under the 1940 Act, a quarterly estimate of the tax attributes of our distributions will be disclosed to our shareholders on our website at www.cionbdc.com; however, actual determinations of such tax attributes, including determinations from return of capital, will be made available annually as of the end of our fiscal year, based upon our taxable income and distributions paid for the full year. Each year, information regarding the source of our distributions (i.e., whether paid from ordinary income, paid from net capital gains on the sale of securities, and/or a return of capital, the latter of which is a nontaxable distribution) will be disclosed to our shareholders on our website at www.cionbdc.com. Our distributions may exceed our earnings. As a result, a portion of the distributions we make may represent a return of capital.
We elected to be treated for U.S. federal income tax purposes as a RIC, as defined under Subchapter M of the Code, beginning in 2012.
To qualify for and maintain RIC tax treatment, we must, among other things, meet certain source of income and asset diversification requirements and distribute in respect of each taxable year at least 90% of our “investment company taxable income”, which is generally equal to the sum of our net ordinary income plus the excess, if any, of realized net short-term capital gains over realized net long-term capital losses, if any. In order to avoid certain excise taxes imposed on RICs, we are required to distribute in respect of each calendar year an amount at least equal to the sum of (1) 98.0% of our net ordinary income (taking into account certain deferrals and elections) for the calendar year, (2) 98.2% of our capital gains in excess of capital losses, or capital gain net income (adjusted for certain ordinary losses), for the one-year period ending on October 31 of the calendar year and (3) any net ordinary income and capital gain net income from preceding years that were not distributed during such years and on which we paid no federal income tax. We intend to continue to pay quarterly distributions to our shareholders out of assets legally available for distribution in an amount sufficient to maintain RIC status each year and to avoid any federal income taxes on income. However, we can offer no assurance that (i) we will maintain results that will permit the payment of any distributions, and (ii) we will not be prohibited from paying distributions if doing so causes us to fail to maintain the asset coverage ratios stipulated by the 1940 Act or if distributions are limited by the terms of any of our borrowings.
Our management declared and our board of directors ratified distributions for 7, 5 and 11 record dates during the years ended December 31, 2023, 2022 and 2021, respectively. The following table presents distributions per share that were declared during the years ended December 31, 2023, 2022 and 2021:
| | | | | | | | | | | | | | |
| | Distributions |
| Three Months Ended | | Per Share(1) | | Amount |
| | | | |
| | | | |
| | | | |
| | | | |
| | | | |
| | | | |
| 2021 | | | | |
| March 31, 2021 (three record dates) | | $ | 0.2648 | | | $ | 15,029 | |
| June 30, 2021 (three record dates) | | 0.2648 | | | 15,000 | |
| September 30, 2021 (three record dates) | | 0.2648 | | | 15,027 | |
| December 31, 2021 (two record dates) | | 0.4648 | | | 26,474 | |
| Total distributions for the year ended December 31, 2021 | | $ | 1.2592 | | | $ | 71,530 | |
| 2022 | | | | |
| March 31, 2022 (one record date) | | $ | 0.2800 | | | $ | 15,948 | |
| June 30, 2022 (one record date) | | 0.2800 | | | 15,949 | |
| September 30, 2022 (one record date) | | 0.3100 | | | 17,604 | |
| December 31, 2022 (two record dates) | | 0.5800 | | | 32,074 | |
| Total distributions for the year ended December 31, 2022 | | $ | 1.4500 | | | $ | 81,575 | |
| 2023 | | | | |
| March 31, 2023 (one record date) | | $ | 0.3400 | | | $ | 18,687 | |
| June 30, 2023 (one record date) | | 0.3400 | | | 18,614 | |
| September 30, 2023 (two record dates) | | 0.3900 | | | 21,276 | |
| December 31, 2023 (three record dates) | | 0.5400 | | | 29,290 | |
Total distributions for the year ended December 31, 2023 | | $ | 1.6100 | | | $ | 87,867 | |
(1)The per share distribution amount for 2021 has been retroactively adjusted to reflect the Reverse Stock Split as discussed in Note 3 to the consolidated financial statements included within this report.
On March 11, 2024, our co-chief executive officers declared a regular quarterly distribution of $0.34 per share for the first quarter of 2024 payable on March 28, 2024 to shareholders of record as of March 22, 2024.
In connection with the Listing of our shares of common stock on the NYSE, on September 15, 2021, we terminated our previous fifth amended and restated distribution reinvestment plan, or the Old DRP. The final distribution reinvestment under the Old DRP was made as part of the regular monthly distribution paid on September 14, 2021. On September 15, 2021, we adopted a new distribution reinvestment plan, or the New DRP, which became effective as of the Listing and first applied to the reinvestment of distributions paid on December 8, 2021.
Under the Old DRP and prior to the Listing, distributions to participating shareholders who “opted in” to the Old DRP were reinvested in additional shares of our common stock at a purchase price equal to the estimated NAV per share of common stock as of the date of issuance.
The New DRP is an “opt out” distribution reinvestment plan for our shareholders. As a result, unless shareholders specifically elect to receive their distributions in cash, distributions will automatically be reinvested in additional shares of our common stock. Under the New DRP, we reserve the right, subject to the provisions of the 1940 Act, to either issue new shares or cause the plan administrator to purchase shares in the open market for the accounts of plan participants in connection with implementation of the New DRP. We intend to use primarily newly issued shares of our common stock to implement the distribution reinvestment plan, so long as such shares are trading at or above NAV. If shares of our common stock are trading below NAV, we intend to cause the plan administrator or its designee, to the extent permitted by law and after taking into account any additional expenses related to open market purchases, to purchase shares of our common stock in the open market in connection with the implementation of the distribution reinvestment plan. However, we reserve the right to issue new shares of our common stock in connection with our obligations under the distribution reinvestment plan even if such shares are trading below NAV. Any distributions reinvested under the plan will nevertheless remain taxable to U.S. shareholders.
We may fund our distributions to shareholders in the future from any sources of funds available to us, including borrowings, net investment income from operations, capital gains proceeds from the sale of assets, non-capital gains proceeds from the sale of assets, and dividends or other distributions paid to us on account of preferred and common equity investments in portfolio companies. The amount of the distribution for shareholders receiving our common stock will be equal to the fair market value of the stock received. If shareholders hold common stock in the name of a broker or financial intermediary, they should contact the broker or financial intermediary regarding their election to receive distributions in cash.
The table below provides information concerning our purchases of shares of our common stock in the open market during the years ended December 31, 2022 and 2023 pursuant to the New DRP in order to satisfy the reinvestment portion of our distributions.
| | | | | | | | | | | | | | | | | | | | | | | | | | |
| Period | | Total Number of Shares Purchased | | Average Price Paid per Share | | Total Number of Shares Purchased as Part of Publicly Announced Plans or Programs | | Approximate Dollar Value of Shares That May Yet Be Purchased Under Publicly Announced Plans or Programs |
| 2022 | | | | | | | | |
| January 1 to January 31, 2022 | | — | | | $ | — | | | — | | | — | |
| February 1 to February 28, 2022 | | — | | | — | | | — | | | — | |
| March 1 to March 31, 2022 | | 54,613 | | | 14.77 | | | 54,613 | | | (1) | |
| April 1 to April 30, 2022 | | — | | | — | | | — | | | — | |
| May 1 to May 31, 2022 | | — | | | — | | | — | | | — | |
| June 1 to June 30, 2022 | | 155,800 | | | 10.06 | | | 155,800 | | | (1) | |
| July 1 to July 31, 2022 | | — | | | — | | | — | | | — | |
| August 1 to August 31, 2022 | | — | | | — | | | — | | | — | |
| September 1 to September 30, 2022 | | 207,602 | | | 10.14 | | | 207,602 | | | (1) | |
| October 1 to October 31, 2022 | | — | | | — | | | — | | | — | |
| November 1 to November 30, 2022 | | — | | | — | | | — | | | — | |
| December 1 to December 31, 2022 | | 182,234 | | | 10.78 | | | 182,234 | | | (1) | |
Total for the year ended December 31, 2022 | | 600,249 | | | $ | 10.74 | | | 600,249 | | | (1) | |
| | | | | | | | |
| 2023 | | | | | | | | |
| January 1 to January 31, 2023 | | 146,946 | | | $ | 11.19 | | | 146,946 | | | (1) |
| February 1 to February 28, 2023 | | — | | | — | | | — | | | — | |
| March 1 to March 31, 2023 | | 204,427 | | | 9.78 | | | 204,427 | | | (1) |
| April 1 to April 30, 2023 | | — | | | — | | | — | | | — | |
| May 1 to May 31, 2023 | | — | | | — | | | — | | | — | |
| June 1 to June 30, 2023 | | 174,424 | | | 10.71 | | | 174,424 | | | (1) |
| July 1 to July 31, 2023 | | — | | | — | | | — | | | — | |
| August 1 to August 31, 2023 | | — | | | — | | | — | | | — | |
| September 1 to September 30, 2023 | | 160,383 | | | 11.10 | | | 160,383 | | | (1) |
| October 1 to October 31, 2023 | | 25,764 | | | 10.30 | | | 25,764 | | | (1) |
| November 1 to November 30, 2023 | | — | | | — | | | — | | | — | |
| December 1 to December 31, 2023 | | 139,731 | | | 11.66 | | | 139,731 | | | (1) |
Total for the year ended December 31, 2023 | | 851,675 | | | $ | 10.79 | | | 851,675 | | | (1) |
(1) See the description of the New DRP above.
Pursuant to an expense support and conditional reimbursement agreement entered into on January 2, 2018 between us and CIM, CIM agreed to provide expense support to us in an amount that was sufficient to: (i) ensure that no portion of our distributions to shareholders was paid from our offering proceeds or borrowings, and/or (ii) reduce our operating expenses until we achieved economies of scale sufficient to ensure that we bore a reasonable level of expense in relation to our investment income. Under certain conditions, CIM would have been entitled to reimbursement of such expense support. On December 31, 2021, we and CIM allowed the expense support and conditional reimbursement agreement to expire in accordance with its terms. For the year ended December 31, 2021, none of our distributions resulted from expense support from CIM.
The following table reflects the sources of distributions on a GAAP basis that were declared during the years ended December 31, 2023, 2022 and 2021:
| | | | | | | | | | | | | | | | | | | | | | | | | | | | | | | | | | | | | | | | | | | | | | | | | | | | | | | | |
| | Years Ended December 31, |
| | 2023 | | 2022 | | 2021 |
| Source of Distribution | | Per Share | | Amount | | Percentage | | Per Share | | Amount | | Percentage | | Per Share(1) | | Amount | | Percentage |
| Net investment income | | $ | 1.6100 | | | $ | 87,867 | | | 100.0 | % | | $ | 1.4500 | | | $ | 81,575 | | | 100.0 | % | | $ | 1.2592 | | | $ | 71,530 | | | 100.0 | % |
| | | | | | | | | | | | | | | | | | |
| | | | | | | | | | | | | | | | | | |
| | | | | | | | | | | | | | | | | | |
| | | | | | | | | | | | | | | | | | |
| | | | | | | | | | | | | | | | | | |
| Total distributions | | $ | 1.6100 | | | $ | 87,867 | | | 100.0 | % | | $ | 1.4500 | | | $ | 81,575 | | | 100.0 | % | | $ | 1.2592 | | | $ | 71,530 | | | 100.0 | % |
(1)The per share amount for 2021 has been retroactively adjusted to reflect the Reverse Stock Split as discussed in Note 3 to the consolidated financial statements included within this report.
Issuing Shares Below NAV
We are generally not able to issue and sell our common stock at a price below NAV per share. We may, however, sell our common stock, or warrants, options or rights to acquire our common stock, at a price below the then-current NAV of our common stock if our board of directors determines that such sale is in our best interests and the best interests of our shareholders, and our shareholders approve such sale. In addition, we may generally issue new shares of our common stock at a price below NAV in rights offerings to existing shareholders, in payment of distributions and in certain other limited circumstances. On September 15, 2023, our shareholders approved our ability to sell or otherwise issue during the next year shares of our common stock at a price below our then current NAV per share in one or more public or private offerings of our common stock not exceeding 25% of such then outstanding shares. If we issue such shares and again receive such approval from shareholders in 2024 or otherwise in the future, we may issue shares of our common stock at a price below the then current NAV per share of common stock.
Recent Sales of Unregistered Equity Securities
We did not sell any equity securities during the period covered by this report that were not registered under the Securities Act.
Share Repurchases
Pre-Listing Share Repurchase Program
Prior to October 5, 2021, our common stock was not listed on any securities exchange.
In order to provide shareholders with a measure of liquidity, beginning in the first quarter of 2014, we began offering to repurchase common stock on a quarterly basis on such terms as were determined by our board of directors in its complete and absolute discretion unless, in the judgment of the independent directors of our board of directors, such repurchases would not have been in the best interests of our shareholders or would have violated applicable law. We conducted such repurchase offers in accordance with the requirements of Rule 13e-4 of the Exchange Act and the 1940 Act. The offer to repurchase common stock was conducted solely through tender offer materials made available to each shareholder.
The board considered the following factors, among others, in making its determination regarding whether to cause us to continue offering to repurchase shares and under what terms:
•the effect of such repurchases on our qualification as a RIC (including the consequences of any necessary asset sales);
•the liquidity of our assets (including fees and costs associated with disposing of assets);
•our investment plans and working capital requirements;
•the relative economies of scale with respect to our size;
•our history in repurchasing shares or portions thereof; and
•the condition of the securities markets.
On July 30, 2021, our board of directors, including the independent directors, determined to suspend our pre-Listing share repurchase program commencing with the third quarter of 2021 in anticipation of the Listing and the concurrent enhanced liquidity the Listing was expected to provide. The pre-Listing share repurchase program ultimately terminated upon the Listing.
We limited the number of shares of common stock to be repurchased during any calendar year to the number of shares of common stock we could have repurchased with the proceeds we received from the issuance of shares of our common stock pursuant to the Old DRP. At the discretion of our board of directors, we could have used cash on hand, cash available from borrowings and cash from liquidation of investments as of the end of the applicable period to repurchase common stock. We offered to repurchase such common stock on each date of repurchase at a price equal to the estimated NAV per share on each date of repurchase.
Post-Listing Share Repurchase Policy
On September 15, 2021, our board of directors, including the independent directors, approved a share repurchase policy, or the Post-Listing Share Repurchase Policy. Under the Post-Listing Share Repurchase Policy, we were authorized to repurchase up to $50 million of our outstanding common stock through various means such as open market transactions, including block purchases, and privately negotiated transactions. On June 24, 2022, our board of directors, including the independent directors, increased the amount of shares of common stock that may be repurchased under the Post-Listing Share Repurchase Policy by $10 million to up to an aggregate of $60 million. The number of shares repurchased and the timing, manner, price and amount of any repurchases will be determined at our discretion. Factors include, but are not limited to, share price, trading volume and general market conditions, along with our general business conditions. The Post-Listing Share Repurchase Policy may be suspended or discontinued at any time and does not obligate us to acquire any specific number of shares of our common stock.
On August 29, 2023, as part of the Post-Listing Share Repurchase Policy, we entered into a new trading plan with an independent broker, Wells Fargo Securities, LLC, in accordance with Rule 10b5-1 of the Exchange Act, based in part on historical trading data with respect to our common stock. The 10b5-1 trading plan permits common stock to be repurchased at a time that we might otherwise be precluded from doing so under insider trading laws or self-imposed trading restrictions. The 10b5-1 trading plan expires on August 29, 2024, and is subject to price, market volume and timing restrictions.
The table below provides information concerning our repurchases of shares of our common stock in the open market during the years ended December 31, 2022 and 2023 pursuant to our Post-Listing Share Repurchase Policy.
| | | | | | | | | | | | | | | | | | | | | | | | | | |
| Period | | Total Number of Shares Repurchased | | Average Price Paid per Share | | Total Number of Shares Repurchased as Part of Publicly Announced Plans or Programs | | Approximate Dollar Value of Shares That May Yet Be Repurchased Under Publicly Announced Plans or Programs(1) |
| 2022 | | | | | | | | |
| January 1 to January 31, 2022 | | — | | N/A | | — | | — |
| February 1 to February 28, 2022 | | — | | N/A | | — | | — |
| March 1 to March 31, 2022 | | — | | N/A | | — | | — |
| April 1 to April 30, 2022 | | — | | N/A | | — | | — |
| May 1 to May 31, 2022 | | — | | N/A | | — | | — |
| June 1 to June 30, 2022 | | — | | N/A | | — | | — |
| July 1 to July 31, 2022 | | — | | N/A | | — | | — |
| August 1 to August 31, 2022 | | 170,424 | | $10.52 | | 170,424 | | $ | 58,210 | |
| September 1 to September 30, 2022 | | 525,052 | | 9.37 | | 525,052 | | 53,303 | |
| October 1 to October 31, 2022 | | 738,221 | | 8.91 | | 738,221 | | 46,740 | |
| November 1 to November 30, 2022 | | 225,259 | | 9.57 | | 225,259 | | 44,589 | |
| December 1 to December 31, 2022 | | — | | N/A | | — | | 44,589 | |
| Total for the year ended December 31, 2022 | | 1,658,956 | | | | 1,658,956 | | |
| | | | | | | | |
| 2023 | | | | | | | | |
| January 1 to January 31, 2023 | | 129,873 | | $10.58 | | 129,873 | | 43,218 | |
| February 1 to February 28, 2023 | | 114,733 | | 11.06 | | 114,733 | | 41,951 | |
| March 1 to March 31, 2023 | | 93,423 | | 10.17 | | 93,423 | | 41,003 | |
| April 1 to April 30, 2023 | | 126,980 | | 9.69 | | 126,980 | | 39,775 | |
| May 1 to May 31, 2023 | | 86,950 | | 9.34 | | 86,950 | | 38,964 | |
| June 1 to June 30, 2023 | | 114,698 | | 10.31 | | 114,698 | | 37,784 | |
| July 1 to July 31, 2023 | | 54,048 | | 10.74 | | 54,048 | | 37,205 | |
| August 1 to August 31, 2023 | | 18,518 | | 10.96 | | 18,518 | | 37,002 | |
| September 1 to September 30, 2023 | | 95,457 | | 10.65 | | 95,457 | | 35,988 | |
| October 1 to October 31, 2023 | | 145,599 | | 10.08 | | 145,599 | | 34,056 | |
| November 1 to November 30, 2023 | | 45,556 | | 10.26 | | 45,556 | | 34,056 | |
| December 1 to December 31, 2023 | | 89,013 | | 10.84 | | 89,013 | | 33,093 | |
| Total for the year ended December 31, 2023 | | 1,114,848 | | | | 1,114,848 | | | |
(1) - Amounts do not include any commissions paid to Wells Fargo Securities, LLC on shares repurchased.
From January 1, 2024 to March 6, 2024, we repurchased 340,505 shares of common stock under the 10b5-1 trading plan for an aggregate purchase price of $3,750, or an average purchase price of $11.01 per share. As of March 6, 2024, 16,084,731 shares of common stock repurchased by us had been retired.
Stock Performance Graph
The following stock performance graph compares the cumulative shareholder return assuming that, on October 5, 2021, which was the date on which our common stock listed and commenced trading on the NYSE, a person invested $100 in each of our common stock, the S&P BDC Index and the S&P 500 Index. The graph also assumes the reinvestment of all cash distributions on the respective distribution payment dates prior to any tax effect.
This graph and other information furnished under Part II. Item 5 of this Annual Report on Form 10-K shall not be deemed to be “soliciting material” or to be “filed” with the SEC or subject to Regulation 14A or 14C, or to the liabilities of Section 18 of the Exchange Act. The stock price performance included in the above graph is not necessarily indicative of, or intended to forecast, future stock price performance.
Fees and Expenses
The following table is intended to assist you in understanding the various fees and expenses that an investor in our common stock will bear, directly or indirectly, based on the assumptions set forth below. We caution you that some of the percentages indicated in the table below are estimates and may vary. The expenses shown in the table under “annual expenses” are based on amounts incurred during the year ended December 31, 2023. The following table and example should not be considered a representation of our future expenses. Actual expenses may be greater or less than shown. Except where the context suggests otherwise, whenever this report contains a reference to fees or expenses paid by “you,” “us” or “the Company,” or that “we” will pay fees or expenses, the holders of our common stock will indirectly bear such fees or expenses as investors in us.
| | | | | |
| Shareholder transaction expenses (as a percentage of offering price): | |
Sales load(1) | — | % |
Offering costs(2) | — | % |
Distribution reinvestment plan fees(3) | — | % |
Total shareholder transaction expenses (as a percentage of offering price)(2) | — | % |
Estimated annual expenses (as a percentage of average net assets attributable to common stock):(4) | |
Base management fees(5) | 3.05 | % |
Accrued incentive fees pursuant to our investment advisory agreement (17.5% of investment income, subject to a hurdle rate, and capital gains fee)(6) | 2.53 | % |
Interest payments on borrowed funds(7) | 9.70 | % |
Other expenses(8) | 1.31 | % |
Total estimated annual expenses(9) | 16.59 | % |
(1)In the event that the securities are sold to or through underwriters or agents, a corresponding prospectus supplement and any related free writing prospectus will disclose the applicable sales load (underwriting discount or commission) and the example will be updated accordingly. Purchases of shares of our common stock on the secondary market are not subject to sales charges but may be subject to brokerage commissions or other charges. This table does not include any sales load that shareholders may have paid in connection with their purchase of shares of our common stock.
(2)The applicable prospectus supplement and any related free writing prospectus will disclose the applicable amount of offering costs and total shareholder transaction expenses that will supersede the information included in this report.
(3)The expenses of the distribution reinvestment plan are included in “Other expenses” in the table. The plan administrator’s fees are paid by us. There will be no brokerage charges or other charges to shareholders who participate in the distribution reinvestment plan.
(4)Average net assets attributable to common stock used to calculate the percentages in this table equals our average net assets of approximately $882 million for the year ended December 31, 2023.
(5)The base management fees referenced in the table above are based upon the actual amounts incurred during the year ended December 31, 2023. Our annual base management fee payable to CIM pursuant to our investment advisory agreement is calculated at a rate of 1.5% of the average value of our gross assets (including cash pledged as collateral for our secured financing arrangements, but excluding other cash and cash equivalents so that investors do not pay the base management fee on such assets) to the extent that our asset coverage ratio is greater than or equal to 200% (i.e., $1 of debt outstanding for each $1 of equity); provided that, the annual base management fee is reduced to 1.0% of the average value of our gross assets (including cash pledged as collateral for our secured financing arrangements, but excluding other cash and cash equivalents so that investors do not pay the base management fee on such assets) purchased with leverage resulting in our asset coverage ratio dropping below 200%. At our Special Meeting of Shareholders on December 30, 2021, shareholders approved a proposal to reduce our asset coverage ratio to 150% (i.e., $2 of debt outstanding for each $1 of equity), which became effective on December 31, 2021. The annual base management fee is payable to CIM quarterly in arrears and is calculated based on the two most recently completed calendar quarters. The base management fee for any partial quarter will be appropriately prorated based on the actual number of days elapsed relative to the total number of days in such calendar quarter. For more detailed information about our base management fee payable to CIM under the terms of the investment advisory agreement, please also see Note 4 “Transactions with Related Parties” of our consolidated financial statements included in this report.
(6)The incentive fees payable to CIM referenced in the table above are based on the actual amount of the subordinated incentive fee on income recorded during the year ended December 31, 2023. For the year ended December 31, 2023, we had no liability for and did not record any capital gains incentive fees. As we cannot predict whether we will meet the thresholds for incentive fees payable to CIM under the investment advisory agreement, the incentive fees paid in subsequent periods, if any, may be substantially different than the fees incurred during the year ended December 31, 2023.
The incentive fee consists of two parts. The first part, which we refer to as the subordinated incentive fee on income, is calculated and payable to CIM quarterly in arrears based upon our “pre-incentive fee net investment income” for the immediately preceding quarter and is subject to a hurdle rate, measured quarterly and expressed as a rate of return on our net assets at the beginning of the calendar quarter, equal to 1.625% per quarter, or an annualized hurdle rate of 6.5%. We pay to CIM (x) 100.0% of our pre-incentive fee net investment income, if any, that exceeds the hurdle rate, but is less than or equal to 1.970% in any calendar quarter (7.879% annualized) and (y) 17.5% of the amount of our pre-incentive fee net investment income, if any, that exceeds 1.970% in any calendar quarter (7.879% annualized). The subordinated incentive fee on income for any partial quarter will be appropriately prorated based on the actual number of days elapsed relative to the total number of days in such calendar quarter. The amount in the table is based on our most recent financial performance for the year ended December 31, 2023.
The second part of the incentive fee, which we refer to as the incentive fee on capital gains, is earned on liquidated investments from our investment portfolio during operations and is determined and payable to CIM in arrears as of the end of each calendar year (or upon termination of the investment advisory agreement). This fee equals 17.5% of our incentive fee capital gains, which is our realized capital gains on a cumulative basis from inception, calculated as of the end of the applicable period, computed net of all realized capital losses and unrealized capital depreciation on a cumulative basis, less the aggregate amount of any previously paid capital gains incentive fees. The amount in the table assumes that the incentive fee on capital gains will be 0.0% of average net assets and is based on actual and projected realized capital gains on our investments through December 31, 2023 and the unrealized appreciation or depreciation of our investments and assumed converted to realized capital gains or losses on such date. See Note 4 “Transactions with Related Parties” of our consolidated financial statements included in this report.
(7)We have borrowed funds to make investments. The costs associated with such borrowings are indirectly borne by our shareholders. Interest payments on borrowed funds includes our interest expense based on borrowings under our $125 million 2026 Notes and our $30 million 2021 More Term Loan for the twelve months ended December 31, 2023, which pay interest at 4.5% and 5.2% per year, respectively. In addition, interest payments on borrowed funds includes our interest expense based on borrowings under our $675 million JPM Credit Facility, our $150 million UBS Facility, our $115 million Series A Notes, our $100 million 2027 Notes and our $50 million 2022 More Term Loan for the twelve months ended December 31, 2023, which bore weighted average interest rates of 8.45%, 8.76%, 8.98%, 9.97% and 8.54%, respectively. We may borrow additional funds from time to time to make investments to the extent we determine that the economic situation is conducive to doing so. We may also issue additional debt securities or preferred stock, subject to our compliance with applicable requirements under the 1940 Act. Our ability to incur additional leverage during 2024 depends, in large part, on our ability to locate additional debt financing on attractive terms or at all, and there is no guarantee we will do so or that such financing will be at the cost noted in the table above.
(8)Other expenses include our overhead expenses, including payments under the administration agreement based on our allocable portion of overhead and other expenses incurred by CIM in performing its obligations under the administration agreement. Other expenses also include accounting, legal and auditing fees as well as the reimbursement of the compensation of our chief financial officer, chief compliance officer and their respective staff and other administrative personnel and fees payable to our independent directors. Our short-term investments consist of an investment in the First American Treasury Obligations Fund, Class Z Shares, in which we paid manager fees and expenses equal to 0.18% of our total investment in the fund during the year ended December 31, 2023, which are "acquired fund fees and expenses" and are included within Other expenses in the table above. The amount presented in the table includes the amounts incurred during 2023. For more detailed information about the terms of the administration agreement, please see Note 4 “Transactions with Related Parties” of our consolidated financial statements included in this report.
(9)Total estimated annual expenses as a percentage of average net assets attributable to common stock are higher than the total estimated annual expenses percentage would be for a company that is not leveraged. We borrow money to leverage our net assets and increase our total assets. The reason for presenting expenses as a percentage of average net assets attributable to common stock is that our common shareholders bear all our fees and expenses.
Example
The below example demonstrates the projected dollar amount of total cumulative expenses that would be incurred over various periods with respect to a hypothetical investment in our common stock. In calculating the below expense amounts, we have assumed our annual operating expenses would remain at the percentage levels set forth in the table above and have excluded the subordinated incentive fee on income. In the event that shares are sold to or through underwriters or agents, a corresponding prospectus supplement and any related free writing prospectus will restate this example to reflect the applicable sales load and estimated offering expenses.
| | | | | | | | | | | | | | | | | | | | | | | | | | | | | | | | | | | | | | | | | | | | | | | | | | |
| | 1 Year | | | 3 Years | | | 5 Years | | | 10 Years | |
| You would pay the following expenses on a $1,000 common stock investment, assuming a 5% annual return (none of which is subject to a capital gains incentive fee): | | $ | 147 | | | $ | 400 | | | $ | 607 | | | $ | 970 | |
The example is designed to assist shareholders in understanding the various costs and expenses that an investor in our common stock will bear directly or indirectly. While the example assumes, as required by the SEC, a 5% annual return, our performance will vary and may result in a return greater or less than 5%. Assuming a 5% annual return, and considering our performance will vary, the incentive fees under the investment advisory agreement may not be earned or payable and are not included in the example. This illustration assumes that we will not realize any capital gains computed net of all realized capital losses and gross unrealized capital depreciation in any of the indicated time periods. If we achieve sufficient returns on our investments, including through the realization of capital gains, to trigger an incentive fee of a material amount, our expenses would be higher.
Assuming, however, that the incentive fee on capital gains under the investment advisory agreement is earned and payable and the subordinated incentive fee on income is not earned and payable the following example demonstrates the projected dollar amount of total expenses that would be incurred over various periods with respect to a hypothetical investment in our common stock:
| | | | | | | | | | | | | | | | | | | | | | | | | | | | | | | | | | | | | | | | | | | | | | | | | | |
| | 1 Year | | | 3 Years | | | 5 Years | | | 10 Years | |
| You would pay the following expenses on a $1,000 common stock investment, assuming a 5% annual return solely from realized capital gains (all of which is subject to a capital gains incentive fee): | | $ | 156 | | | $ | 420 | | | $ | 631 | | | $ | 992 | |
The example and the expenses in the tables above should not be considered a representation of our future expenses, and actual expenses (including the cost of debt, if any, and other expenses) may be greater or less than those shown. In addition, the example assumes no sales load. Also, while the example assumes reinvestment of all distributions at NAV, participants in our distribution reinvestment plan will receive a number of shares of our common stock, determined by dividing the total dollar amount of the distribution payable to a participant by the market price per share of our common stock at the close of trading on the distribution payment date, which may be at, above or below NAV.
Item 6. [RESERVED].
Item 7. Management’s Discussion and Analysis of Financial Condition and Results of Operations
The following discussion should be read in conjunction with our consolidated financial statements and related notes and other financial information appearing elsewhere in this Annual Report on Form 10-K. In addition to historical information, the following discussion and other parts of this Annual Report on Form 10-K contain forward-looking information that involves risks and uncertainties (see “Forward-Looking Statements” in this report). Amounts and percentages presented herein may have been rounded for presentation and all dollar amounts, excluding share and per share amounts, are presented in thousands unless otherwise noted. In addition, all share and per share amounts for 2021 have been retroactively adjusted to reflect the Reverse Stock Split, which became effective on September 21, 2021.
Overview
We were incorporated under the general corporation laws of the State of Maryland on August 9, 2011 and commenced operations on December 17, 2012 upon raising proceeds of $2,500 from persons not affiliated with us, CIM or its affiliates. We are an externally managed, non-diversified, closed-end management investment company that has elected to be regulated as a BDC under the 1940 Act. We elected to be treated for federal income tax purposes as a RIC, as defined under Subchapter M of the Code.
Our investment objective is to generate current income and, to a lesser extent, capital appreciation for investors. Our portfolio is comprised primarily of investments in senior secured debt, including first lien loans, second lien loans and unitranche loans, and, to a lesser extent, collateralized securities, structured products and other similar securities, unsecured debt, and equity, of private and thinly-traded U.S. middle-market companies. In connection with our debt investments, we may receive equity interests such as warrants or options as additional consideration. We may also purchase equity interests in the form of common or preferred stock in our target companies, either in conjunction with one of our debt investments or through a co-investment with a financial sponsor.
On October 5, 2021, shares of our common stock began trading on the NYSE under the ticker symbol “CION”. The Listing accomplished our goal of providing our shareholders with greatly enhanced liquidity. On February 26, 2023, our shares of common stock and our Series A Notes listed and commenced trading in Israel on the TASE under the ticker symbol “CION” and "CION B1", respectively.
We are managed by CIM, our affiliate and a registered investment adviser. Pursuant to an investment advisory agreement with us, CIM oversees the management of our activities and is responsible for making investment decisions for our portfolio. On August 7, 2023, our board of directors, including a majority of the board of directors who are not interested persons, approved the renewal of the second amended and restated investment advisory agreement with CIM for a period of twelve months, commencing August 9, 2023. We have also entered into an administration agreement with CIM to provide us with administrative services necessary for us to operate. We and CIM previously engaged AIM to act as our investment sub-adviser.
On July 11, 2017, the members of CIM entered into the Third Amended CIM LLC Agreement for the purpose of creating a joint venture between AIM and CIG. Under the Third Amended CIM LLC Agreement, AIM became a member of CIM and was issued a newly-created class of membership interests in CIM pursuant to which AIM, among other things, shares in the profits, losses, distributions and expenses of CIM with the other members in accordance with the terms of the Third Amended CIM LLC Agreement, which results in CIG and AIM each owning a 50% economic interest in CIM.
On July 10, 2017, our independent directors unanimously approved the termination of the investment sub-advisory agreement with AIM, effective as of July 11, 2017, as part of the new and ongoing relationship among us, CIM and AIM. Although the investment sub-advisory agreement and AIM's engagement as our investment sub-adviser were terminated, AIM continues to perform certain services for CIM and us. AIM is not paid a separate fee in exchange for such services, but is entitled to receive distributions as a member of CIM as described above.
On December 4, 2017, the members of CIM entered into the Fourth Amended CIM LLC Agreement under which AIM performs certain services for CIM, which include, among other services, providing (a) trade and settlement support; (b) portfolio and cash reconciliation; (c) market pipeline information regarding syndicated deals, in each case, as reasonably requested by CIM; and (d) monthly valuation reports and support for all broker-quoted investments. AIM may also, from time to time, provide us with access to potential investment opportunities made available on Apollo's credit platform on a similar basis as other third-party market participants. All of our investment decisions are the sole responsibility of, and are made at the sole discretion of, CIM's investment committee, which consists entirely of CIG senior personnel.
Upon the occurrence of the Listing on October 5, 2021, we and CIM entered into the second amended and restated investment advisory agreement in order to implement the changes to the advisory fees payable from us to CIM that (i) reduced the annual base management fee, (ii) amended the structure of the subordinated incentive fee on income payable from us to CIM and reduced the hurdle and incentive fee rates, and (iii) reduced the incentive fee on capital gains payable from us to CIM (as described in further detail in Notes 2 and 4 to our consolidated financial statements included in this report).
On September 21, 2021, we effected a two to one reverse split of our shares of common stock under which every two shares of our common stock issued and outstanding were automatically combined into one share of our common stock, with the number of then issued and outstanding shares reduced from 113,916,869 to 56,958,440. The reverse stock split amendment also provided that there was no change in the par value of $0.001 per share as a result of the reverse stock split. The reverse stock split did not modify the rights or preferences of our common stock.
We seek to meet our investment objective by utilizing the experienced management team of CIM, which includes its access to the relationships and human capital of its affiliates in sourcing, evaluating and structuring transactions, as well as monitoring and servicing our investments. We focus primarily on the senior secured debt of private and thinly-traded U.S. middle-market companies, which we define as companies that generally possess annual EBITDA of $75 million or less, with experienced management teams, significant free cash flow, strong competitive positions and potential for growth.
Revenue
We primarily generate revenue in the form of interest income on the debt securities that we hold and capital gains on debt or other equity interests that we acquire in portfolio companies. The majority of our senior debt investments bear interest at a floating rate. Interest on debt securities is generally payable quarterly or monthly. In some cases, some of our investments may provide for deferred interest payments or PIK interest. The principal amount of the debt securities and any accrued, but unpaid, interest generally will become due at the maturity date. In addition, we may generate revenue in the form of commitment and capital structuring fees, monitoring fees, fees for providing managerial assistance and possibly consulting fees and performance-based fees. Any such fees generated in connection with our investments will be recognized when earned.
Operating Expenses
Our primary operating expenses are the payment of management fees and subordinated incentive fees on income under the investment advisory agreement and interest expense on our financing arrangements. Our investment advisory fees compensate CIM for its work in identifying, evaluating, negotiating, executing, monitoring and servicing our investments. We bear all other expenses of our operations and transactions.
Recent Developments
Q1 2024 Regular Distribution
On March 11, 2024, our co-chief executive officers declared a regular quarterly distribution of $0.34 per share for the first quarter of 2024 payable on March 28, 2024 to shareholders of record as of March 22, 2024.
Portfolio Investment Activity for the Years Ended December 31, 2023 and 2022
The following table summarizes our investment activity, excluding short term investments and PIK securities, for the years ended December 31, 2023 and 2022:
| | | | | | | | | | | | | | | | | | | | | | |
| | Years Ended December 31, | | | | |
| Net Investment Activity | | 2023 | | | | | | 2022 | | | | |
| Purchases and drawdowns | | | | | | | | | | | | |
| Senior secured first lien debt | | $ | 340,704 | | | | | | | $ | 524,293 | | | | | |
| Senior secured second lien debt | | — | | | | | | | 19,932 | | | | | |
| | | | | | | | | | | | |
| Unsecured debt | | 4,200 | | | | | | | — | | | | | |
| Equity | | 5,283 | | | | | | | 6,313 | | | | | |
| Sales and principal repayments | | (300,250) | | | | | | | (469,760) | | | | | |
| Net portfolio activity | | $ | 49,937 | | | | | | | $ | 80,778 | | | | | |
The following tables summarize the composition of our investment portfolio at amortized cost and fair value as of December 31, 2023 and 2022:
| | | | | | | | | | | | | | | | | | | | |
| | December 31, 2023 |
| | Investments Cost(1) | | Investments Fair
Value | | Percentage of
Investment
Portfolio |
| Senior secured first lien debt | | $ | 1,604,111 | | | $ | 1,565,171 | | | 85.0 | % |
| Senior secured second lien debt | | 41,280 | | | 29,111 | | | 1.6 | % |
| | | | | | |
| Collateralized securities and structured products - equity | | 2,362 | | | 1,096 | | | 0.1 | % |
| Unsecured debt | | 31,693 | | | 12,874 | | | 0.7 | % |
| Equity | | 182,738 | | | 232,572 | | | 12.6 | % |
| Subtotal/total percentage | | 1,862,184 | | | 1,840,824 | | | 100.0 | % |
| Short term investments(2) | | 113,446 | | | 113,446 | | | |
| Total investments | | $ | 1,975,630 | | | $ | 1,954,270 | | | |
| Number of portfolio companies | | | | 111 | |
| Average annual EBITDA of portfolio companies | | $61.7 million |
| Median annual EBITDA of portfolio companies | | | | $33.7 million |
| Purchased at a weighted average price of par | | 96.33 | % |
| Gross annual portfolio yield based upon the purchase price(3) | | 12.12 | % |
(1)Represents amortized cost for debt investments and cost for equity investments. Amortized cost represents the original cost adjusted for the amortization of premiums and/or accretion of discounts, as applicable, on our investments.
(2)Short term investments represent an investment in a fund that invests in highly liquid investments with average original maturity dates of three months or less.
(3)The gross annual portfolio yield does not represent and may be higher than an actual investment return to shareholders because it excludes our expenses and all sales commissions and dealer manager fees and does not consider the cost of leverage.
| | | | | | | | | | | | | | | | | |
| December 31, 2022 |
| Investments Cost(1) | | Investments Fair
Value | | Percentage of
Investment
Portfolio |
| Senior secured first lien debt | $ | 1,638,995 | | | $ | 1,579,512 | | | 90.3 | % |
| Senior secured second lien debt | 41,036 | | | 38,769 | | | 2.2 | % |
| | | | | |
| Collateralized securities and structured products - equity | 2,687 | | | 1,179 | | | 0.1 | % |
| Unsecured debt | 30,427 | | | 22,643 | | | 1.3 | % |
| Equity | 79,595 | | | 107,058 | | | 6.1 | % |
| Subtotal/total percentage | 1,792,740 | | | 1,749,161 | | | 100.0 | % |
| Short term investments(2) | 10,869 | | | 10,869 | | | |
| Total investments | $ | 1,803,609 | | | $ | 1,760,030 | | | |
| Number of portfolio companies | | | | 113 | |
| Average annual EBITDA of portfolio companies | | $55.2 million |
| Median annual EBITDA of portfolio companies | | $35.0 million |
| Purchased at a weighted average price of par | | 97.81 | % |
| Gross annual portfolio yield based upon the purchase price(3) | | 11.80 | % |
(1)Represents amortized cost for debt investments and cost for equity investments. Amortized cost represents the original cost adjusted for the amortization of premiums and/or accretion of discounts, as applicable, on our investments.
(2)Short term investments represent an investment in a fund that invests in highly liquid investments with average original maturity dates of three months or less.
(3)The gross annual portfolio yield does not represent and may be higher than an actual investment return to shareholders because it excludes our expenses and all sales commissions and dealer manager fees and does not consider the cost of leverage.
The following table summarizes the composition of our investment portfolio by the type of interest rate as of December 31, 2023 and 2022, excluding short term investments of $113,446 and $10,869, respectively:
| | | | | | | | | | | | | | | | | | | | | | | | | | | | | | | | | | | | | | |
| | December 31, 2023 | | December 31, 2022 |
| Interest Rate Allocation | | Investments Cost | | Investments Fair Value | | Percentage of
Investment
Portfolio | | Investments Cost | | Investments Fair Value | | Percentage of
Investment
Portfolio |
| Floating interest rate investments | | $ | 1,521,848 | | | $ | 1,475,126 | | | 80.1 | % | | $ | 1,539,214 | | | $ | 1,477,630 | | | 84.5 | % |
| Non-income producing investments | | 154,419 | | | 184,175 | | | 10.0 | % | | 76,061 | | | 104,619 | | | 6.0 | % |
| Fixed interest rate investments | | 155,244 | | | 131,533 | | | 7.2 | % | | 166,297 | | | 157,006 | | | 9.0 | % |
| Other income producing investments | | 30,673 | | | 49,990 | | | 2.7 | % | | 11,168 | | | 9,906 | | | 0.5 | % |
| Total investments | | $ | 1,862,184 | | | $ | 1,840,824 | | | 100.0 | % | | $ | 1,792,740 | | | $ | 1,749,161 | | | 100.0 | % |
The following table shows the composition of our investment portfolio by industry classification and the percentage, by fair value, of the total assets in such industries as of December 31, 2023 and 2022:
| | | | | | | | | | | | | | | | | | | | | | | | | | |
| | December 31, 2023 | | December 31, 2022 |
| Industry Classification | | Investments Fair Value | | Percentage of
Investment Portfolio | | Investments Fair Value | | Percentage of
Investment Portfolio |
| Services: Business | | $ | 282,237 | | | 15.3 | % | | $ | 336,055 | | | 19.2 | % |
| Healthcare & Pharmaceuticals | | 238,624 | | | 13.0 | % | | 237,082 | | | 13.6 | % |
| Media: Diversified & Production | | 135,037 | | | 7.3 | % | | 134,927 | | | 7.7 | % |
| Retail | | 135,000 | | | 7.3 | % | | 74,718 | | | 4.3 | % |
| Media: Advertising, Printing & Publishing | | 116,100 | | | 6.3 | % | | 105,375 | | | 6.0 | % |
| Services: Consumer | | 107,195 | | | 5.8 | % | | 115,849 | | | 6.6 | % |
| Energy: Oil & Gas | | 104,893 | | | 5.7 | % | | 68,756 | | | 3.9 | % |
| Construction & Building | | 104,727 | | | 5.7 | % | | 46,007 | | | 2.6 | % |
| Diversified Financials | | 85,733 | | | 4.7 | % | | 99,819 | | | 5.7 | % |
| Chemicals, Plastics & Rubber | | 82,597 | | | 4.5 | % | | 66,753 | | | 3.8 | % |
| Beverage, Food & Tobacco | | 68,780 | | | 3.7 | % | | 45,396 | | | 2.6 | % |
| Consumer Goods: Durable | | 59,955 | | | 3.3 | % | | 60,735 | | | 3.5 | % |
| Banking, Finance, Insurance & Real Estate | | 52,272 | | | 2.8 | % | | 43,836 | | | 2.5 | % |
| Hotel, Gaming & Leisure | | 50,906 | | | 2.8 | % | | 46,739 | | | 2.7 | % |
| Capital Equipment | | 49,571 | | | 2.7 | % | | 41,580 | | | 2.4 | % |
| Consumer Goods: Non-Durable | | 42,381 | | | 2.3 | % | | 47,886 | | | 2.8 | % |
| High Tech Industries | | 22,671 | | | 1.2 | % | | 56,501 | | | 3.2 | % |
| Containers, Packaging & Glass | | 18,480 | | | 1.0 | % | | 19,551 | | | 1.1 | % |
| Telecommunications | | 17,768 | | | 1.0 | % | | 18,302 | | | 1.1 | % |
| Environmental Industries | | 15,336 | | | 0.8 | % | | — | | | — | |
| Metals & Mining | | 13,957 | | | 0.8 | % | | 15,780 | | | 0.9 | % |
| Automotive | | 12,403 | | | 0.7 | % | | 16,255 | | | 0.9 | % |
| Transportation: Cargo | | 12,201 | | | 0.7 | % | | 12,417 | | | 0.7 | % |
| Aerospace & Defense | | 12,000 | | | 0.6 | % | | 38,842 | | | 2.2 | % |
| | | | | | | | |
| | | | | | | | |
| | | | | | | | |
| | | | | | | | |
| Subtotal/total percentage | | 1,840,824 | | | 100.0 | % | | 1,749,161 | | | 100.0 | % |
| Short term investments | | 113,446 | | | | | 10,869 | | | |
| Total investments | | $ | 1,954,270 | | | | | $ | 1,760,030 | | | |
Our investment portfolio may contain senior secured investments that are in the form of lines of credit, delayed draw term loans, revolving credit facilities, or unfunded commitments, which may require us to provide funding when requested in accordance with the terms of the underlying agreements. As of December 31, 2023 and 2022, our unfunded commitments amounted to $47,349 and $71,420, respectively. As of March 6, 2024, our unfunded commitments amounted to $53,048. Since these commitments may expire without being drawn upon, unfunded commitments do not necessarily represent future cash requirements or future earning assets for us. Refer to the section “Commitments and Contingencies” for further details on our unfunded commitments.
Investment Portfolio Asset Quality
CIM uses an investment rating system to characterize and monitor our expected level of returns on each investment in our portfolio. These ratings are just one of several factors that CIM uses to monitor our portfolio, are not in and of themselves determinative of fair value or revenue recognition and are presented for indicative purposes. CIM rates the credit risk of all investments on a scale of 1 to 5 no less frequently than quarterly. This system is intended primarily to reflect the underlying risk of a portfolio investment relative to our initial cost basis in respect of such portfolio investment (i.e., at the time of acquisition), although it may also take into account under certain circumstances the performance of the portfolio company’s business, the collateral coverage of the investment and other relevant factors.
The following is a description of the conditions associated with each investment rating used in this ratings system:
| | | | | | | | |
| Investment Rating | | Description |
| 1 | | Indicates the least amount of risk to our initial cost basis. The trends and risk factors for this investment since origination or acquisition are generally favorable, which may include the performance of the portfolio company or a potential exit. |
| 2 | | Indicates a level of risk to our initial cost basis that is similar to the risk to our initial cost basis at the time of origination or acquisition. This portfolio company is generally performing in accordance with our analysis of its business and the full return of principal and interest or dividend is expected. |
| 3 | | Indicates that the risk to our ability to recoup the cost of such investment has increased since origination or acquisition, but full return of principal and interest or dividend is expected. A portfolio company with an investment rating of 3 requires closer monitoring. |
| 4 | | Indicates that the risk to our ability to recoup the cost of such investment has increased significantly since origination or acquisition, including as a result of factors such as declining performance and noncompliance with debt covenants, and we expect some loss of interest, dividend or capital appreciation, but still expect an overall positive internal rate of return on the investment. |
| 5 | | Indicates that the risk to our ability to recoup the cost of such investment has increased materially since origination or acquisition and the portfolio company likely has materially declining performance. Loss of interest or dividend and some loss of principal investment is expected, which would result in an overall negative internal rate of return on the investment. |
For investments rated 3, 4, or 5, CIM enhances its level of scrutiny over the monitoring of such portfolio company.
The following table summarizes the composition of our investment portfolio based on the 1 to 5 investment rating scale at fair value as of December 31, 2023 and 2022, excluding short term investments of $113,446 and $10,869, respectively:
| | | | | | | | | | | | | | | | | | | | | | | | | | |
| | December 31, 2023 | | December 31, 2022 |
| Investment Rating | | Investments
Fair Value | | Percentage of
Investment Portfolio | | Investments
Fair Value | | Percentage of
Investment Portfolio |
| 1 | | $ | 98,255 | | | 5.3 | % | | $ | 24,450 | | | 1.4 | % |
| 2 | | 1,603,975 | | | 87.2 | % | | 1,424,681 | | | 81.5 | % |
| 3 | | 120,132 | | | 6.5 | % | | 260,662 | | | 14.9 | % |
| 4 | | 10,304 | | | 0.6 | % | | 39,032 | | | 2.2 | % |
| 5 | | 8,158 | | | 0.4 | % | | 336 | | | — | |
| | $ | 1,840,824 | | | 100.0 | % | | $ | 1,749,161 | | | 100.0 | % |
The amount of the investment portfolio in each rating category may vary substantially from period to period resulting primarily from changes in the composition of such portfolio as a result of new investment, repayment and exit activities. In addition, changes in the rating of investments may be made to reflect our expectation of performance and changes in investment values.
Current Investment Portfolio
The following table summarizes the composition of our investment portfolio at fair value as of March 6, 2024:
| | | | | | | | | | | | | | | | | | | | |
| | | | Investments Fair
Value | | Percentage of
Investment
Portfolio |
| Senior secured first lien debt | | | | $ | 1,529,482 | | | 85.0 | % |
| Senior secured second lien debt | | | | 27,633 | | | 1.5 | % |
| | | | | | |
| Collateralized securities and structured products - equity | | | | 1,096 | | | 0.1 | % |
| Unsecured debt | | | | 4,135 | | | 0.2 | % |
| Equity | | | | 237,198 | | | 13.2 | % |
| Subtotal/total percentage | | | | 1,799,544 | | | 100.0 | % |
| Short term investments(1) | | | | 160,358 | | | |
| Total investments | | | | $ | 1,959,902 | | | |
| Number of portfolio companies | | | | 111 | |
| Average annual EBITDA of portfolio companies | | $60.4 million |
| Median annual EBITDA of portfolio companies | | $32.8 million |
| Purchased at a weighted average price of par | | | | | | 96.48 | % |
| Gross annual portfolio yield based upon the purchase price(2) | | | | | | 11.76 | % |
(1)Short term investments represent an investment in a fund that invests in highly liquid investments with average original maturity dates of three months or less.
(2)The gross annual portfolio yield does not represent and may be higher than an actual investment return to shareholders because it excludes our expenses and all sales commissions and dealer manager fees and does not consider the cost of leverage.
Results of Operations for the Years Ended December 31, 2023 and 2022
Our results of operations for the years ended December 31, 2023 and 2022 were as follows:
| | | | | | | | | | | |
| Years Ended December 31, |
| 2023 | | 2022 |
| Investment income | $ | 251,010 | | | $ | 194,898 | |
| Operating expenses and income taxes | 145,988 | | | 106,693 | |
| Net investment income after taxes | 105,022 | | | 88,205 | |
| Net realized loss on investments and foreign currency | (31,927) | | | (32,750) | |
| Net change in unrealized appreciation (depreciation) on investments | 22,219 | | | (5,314) | |
| | | |
| | | |
| Net increase in net assets resulting from operations | $ | 95,314 | | | $ | 50,141 | |
Investment Income
For the years ended December 31, 2023 and 2022, we generated investment income of $251,010 and $194,898, respectively, consisting primarily of interest income on investments in senior secured debt, collateralized securities and structured products, and unsecured debt of 113 and 128 portfolio companies held during each respective period. Higher LIBOR and SOFR rates during the year ended December 31, 2023 compared to the year ended December 31, 2022 primarily contributed to the increase in interest income generated on our investments. In addition, certain of our equity investments paid large dividends during the year ended December 31, 2023, increasing dividend income to $8,406 from $1,457 during the year ended December 31, 2022.
Operating Expenses and Income Taxes
The composition of our operating expenses and income taxes for the years ended December 31, 2023 and 2022 was as follows:
| | | | | | | | | | | |
| Years Ended December 31, |
| 2023 | | 2022 |
| Management fees | $ | 26,856 | | | $ | 27,361 | |
| Administrative services expense | 3,971 | | | 3,348 | |
| Subordinated incentive fee on income | 22,277 | | | 18,710 | |
| General and administrative | 7,382 | | | 7,278 | |
| Interest expense | 85,556 | | | 49,624 | |
| Income tax (benefit) expense, including excise tax | (54) | | | 372 | |
| Total operating expenses and income taxes | $ | 145,988 | | | $ | 106,693 | |
| | | |
| | | |
The increase in interest expense was primarily the result of (a) higher LIBOR and SOFR rates during the year ended December 31, 2023 compared to the year ended December 31, 2022, and (b) higher average borrowings under our financing arrangements during the year ended December 31, 2023 compared to the year ended December 31, 2022. The increase in subordinated incentive fee on income was primarily the result of the increase in investment income during the year ended December 31, 2023 compared to the year ended December 31, 2022, which was partially offset by the increase in interest expense during the year ended December 31, 2023 compared to the year ended December 31, 2022.
The composition of our general and administrative expenses for the years ended December 31, 2023 and 2022 was as follows:
| | | | | | | | | | | |
| Years Ended December 31, |
| 2023 | | 2022 |
| Professional fees | $ | 2,178 | | | $ | 1,778 | |
| Transfer agent expense | 911 | | | 1,124 | |
| Valuation expense | 853 | | | 821 | |
| Dues and subscriptions | 800 | | | 791 | |
| Director fees and expenses | 696 | | | 632 | |
| Insurance expense | 675 | | | 833 | |
| Accounting and administrative costs | 637 | | | 524 | |
| Printing and marketing expense | 351 | | | 708 | |
| | | |
| Other expenses | 281 | | | 67 | |
| Total general and administrative expense | $ | 7,382 | | | $ | 7,278 | |
Net Investment Income After Taxes
Our net investment income after taxes totaled $105,022 and $88,205 for the years ended December 31, 2023 and 2022, respectively. The increase in net investment income was a result of an increase in our investment income during the year ended December 31, 2023 as compared to the year ended December 31, 2022, which was partially offset by an increase in our operating expenses during the same period, which was driven primarily by increases in interest expense and the subordinated incentive fee on income.
Net Realized Loss on Investments and Foreign Currency
Our net realized loss on investments and foreign currency totaled $(31,927) and $(32,750) for the years ended December 31, 2023 and 2022, respectively. During the year ended December 31, 2023, net realized losses were driven primarily by the restructure of certain investments while net realized losses during the year ended December 31, 2022 were driven primarily by the write-off of certain investments.
Net Change in Unrealized Appreciation (Depreciation) on Investments
The net change in unrealized appreciation (depreciation) on our investments totaled $22,219 and $(5,314) for the years ended December 31, 2023 and 2022, respectively. This change was driven primarily by mark-to-market price changes on certain investments during the year ended December 31, 2023. During the year ended December 31, 2022, unrealized depreciation was driven primarily by the underperformance of certain investments, which was partially offset by the realization of previously unrealized losses due to the write-off of certain investments.
Net Increase in Net Assets Resulting from Operations
For the years ended December 31, 2023 and 2022, we recorded a net increase in net assets resulting from operations of $95,314 and $50,141, respectively, as a result of our operating activity for the respective periods.
Results of Operations for the Years Ended December 31, 2022 and 2021
Our results of operations for the years ended December 31, 2022 and 2021 were as follows:
| | | | | | | | | | | |
| Years Ended December 31, |
| 2022 | | 2021 |
| Investment income | $ | 194,898 | | | $ | 157,348 | |
| Operating expenses and income taxes | 106,693 | | | 83,041 | |
| Net investment income after taxes | 88,205 | | | 74,307 | |
| Net realized (loss) gain on investments and foreign currency | (32,750) | | | 840 | |
| Net change in unrealized (depreciation) appreciation on investments | (5,314) | | | 43,617 | |
| | | |
| | | |
| Net increase in net assets resulting from operations | $ | 50,141 | | | $ | 118,764 | |
Investment Income
For the years ended December 31, 2022 and 2021, we generated investment income of $194,898 and $157,348, respectively, consisting primarily of interest income on investments in senior secured debt, collateralized securities and structured products, and unsecured debt of 128 and 153 portfolio companies held during each respective period. Our average investment portfolio size, excluding our short term investments, increased $126,694, from $1,580,948 during the year ended December 31, 2021 to $1,707,642 during the year ended December 31, 2022. In addition, higher LIBOR and SOFR rates during the year ended December 31, 2022 compared to the year ended December 31, 2021 also contributed to the increase in interest income generated on our investments.
Operating Expenses and Income Taxes
The composition of our operating expenses and income taxes for the years ended December 31, 2022 and 2021 was as follows:
| | | | | | | | | | | |
| Years Ended December 31, |
| 2022 | | 2021 |
| Management fees | $ | 27,361 | | | $ | 31,143 | |
| Administrative services expense | 3,348 | | | 3,069 | |
| Subordinated incentive fee on income | 18,710 | | | 6,875 | |
| General and administrative | 7,278 | | | 9,805 | |
| Interest expense | 49,624 | | | 31,807 | |
| Income tax expense, including excise tax | 372 | | | 342 | |
| Total operating expenses and income taxes | $ | 106,693 | | | $ | 83,041 | |
| | | |
| | | |
The increase in interest expense was primarily the result of (a) higher average borrowings under our financing arrangements during the year ended December 31, 2022 compared to the year ended December 31, 2021, and (b) higher LIBOR and SOFR rates during the year ended December 31, 2022 compared to the year ended December 31, 2021. The increase in subordinated incentive fee on income was primarily the result of entering into (i) the amended and restated investment advisory agreement in August 2021, which changed the calculation of the subordinated incentive fee to express the hurdle rate required for CIM to earn, and be paid, the incentive fee as a percentage of our net assets rather than adjusted capital, and (ii) the second amended and restated investment advisory agreement in October 2021, which reduced the hurdle rate applicable to the subordinated incentive fee. The decrease in management fees was also primarily due to entering into the second amended and restated investment advisory agreement in October 2021, which among other things, reduced the annual rate from 2.0% to 1.5%, and further to 1.0% of our average gross assets purchased with leverage resulting in our asset coverage ratio dropping below 200%.
The composition of our general and administrative expenses for the years ended December 31, 2022 and 2021 was as follows:
| | | | | | | | | | | |
| Years Ended December 31, |
| 2022 | | 2021 |
| Professional fees | $ | 1,778 | | | $ | 4,214 | |
| Transfer agent expense | 1,124 | | | 1,290 | |
| Insurance expense | 833 | | | 612 | |
| Valuation expense | 821 | | | 904 | |
| Dues and subscriptions | 791 | | | 411 | |
| Printing and marketing expense | 708 | | | 990 | |
| Director fees and expenses | 632 | | | 516 | |
| Accounting and administrative costs | 524 | | | 759 | |
| Other expenses | 67 | | | 109 | |
| | | |
| Total general and administrative expense | $ | 7,278 | | | $ | 9,805 | |
The decrease in general and administrative expenses was primarily the result of higher nonrecurring professional fees incurred during the year ended December 31, 2021 associated with the Listing.
Net Investment Income After Taxes
Our net investment income after taxes totaled $88,205 and $74,307 for the years ended December 31, 2022 and 2021, respectively. The increase in net investment income was a result of an increase in our investment income during the year ended December 31, 2022 as compared to the year ended December 31, 2021, which was partially offset by an increase in our operating expenses during the same period that was driven primarily by increases in the subordinated incentive fee on income and interest expense.
Net Realized (Loss) Gain on Investments and Foreign Currency
Our net realized (loss) gain on investments and foreign currency totaled $(32,750) and $840 for the years ended December 31, 2022 and 2021, respectively. This change was driven primarily by the write-off of certain investments during the year ended December 31, 2022 as compared to fewer investment write-offs during the year ended December 31, 2021.
Net Change in Unrealized (Depreciation) Appreciation on Investments
The net change in unrealized (depreciation) appreciation on our investments totaled $(5,314) and $43,617 for the years ended December 31, 2022 and 2021, respectively. This change was driven primarily by the underperformance of certain investments during the year ended December 31, 2022, which was partially offset by the realization of previously unrealized losses due to the write-off of certain investments. In contrast, during the year ended December 31, 2021, tightening credit spreads and increased multiples in equity markets positively impacted the fair value of certain of our investments.
Net Increase in Net Assets Resulting from Operations
For the years ended December 31, 2022 and 2021, we recorded a net increase in net assets resulting from operations of $50,141 and $118,764, respectively, as a result of our operating activity for the respective periods.
Financial Condition, Liquidity and Capital Resources
We generate cash primarily from cash flows from interest, fees and dividends earned from our investments as well as principal repayments and proceeds from sales of our investments. We also employ leverage to seek to enhance our returns as market conditions permit and at the discretion of CIM and pursuant to the 1940 Act. As a result, we also generate cash from our existing financing arrangements and may generate cash from future borrowings, as well as future offerings of securities including public and/or private issuances of debt and/or equity securities. We use cash primarily to (i) purchase investments in new and existing portfolio companies, (ii) pay for the cost of operations (including paying advisory fees to and reimbursing CIM), (iii) make debt service payments related to any of our financing arrangements and (iv) pay cash distributions to the holders of our shares.
On March 23, 2018, an amendment to Section 61(a) of the 1940 Act was signed into law to permit BDCs to reduce the minimum “asset coverage” ratio from 200% to 150% and, as a result, to potentially increase the ratio of a BDC’s debt to equity from a maximum of 1-to-1 to a maximum of 2-to-1, so long as certain approval and disclosure requirements are satisfied. As a result of receiving shareholder approval on December 30, 2021, effective December 31, 2021, we are required to maintain asset coverage for our senior securities of 150% rather than 200%, which allows us to increase the maximum amount of leverage that we are permitted to incur. We may from time to time enter into additional financing arrangements or increase the size of our existing financing arrangements. Any such increase to our leverage would be subject to prevailing market conditions, our liquidity requirements, contractual and regulatory restrictions and other factors.
As of December 31, 2023 and 2022, our asset coverage ratio was 1.81 and 1.92, respectively. We seek to carefully consider our unfunded commitments for the purpose of planning our ongoing financial leverage and liquidity requirements.
On September 15, 2023, our shareholders authorized us to issue shares of our common stock at prices below the then current NAV per share in one or more offerings for a 12-month period following such shareholder approval. As of the date of this report, we are not engaged in discussions to issue any such shares.
As of December 31, 2023, we had cash of $8,415 and short term investments of $113,446 invested in a fund that primarily invests in U.S. government securities. Cash and short term investments as of December 31, 2023, taken together with our available debt, is expected to be sufficient for our investing activities and to conduct our operations in the near term. As of December 31, 2023, we had $153 million available under our secured financing arrangements.
Our short-term cash needs include the funding of additional portfolio investments, the payment of operating expenses including interest expense, management fees, incentive fees, administrative services expense and general and administrative expenses, as well as paying distributions to our shareholders. Our long-term cash needs will include principal payments on outstanding financing arrangements and funding of additional portfolio investments. Funding for short and long-term cash needs will come from cash provided from operating activities and/or unused net proceeds from financing activities. We believe that our liquidity and sources of capital are adequate to satisfy our short and long-term cash requirements. We cannot, however, be certain that these sources of funds will be available at a time and upon terms acceptable to us in sufficient amounts in the future.
Post-Listing Share Repurchase Policy
On September 15, 2021, our board of directors, including the independent directors, approved a share repurchase policy authorizing us to repurchase up to $50 million of our outstanding common stock after the Listing. On June 24, 2022, our board of directors, including the independent directors, increased the amount of shares of our common stock that may be repurchased under the share repurchase policy by $10 million to up to an aggregate of $60 million. Under the share repurchase policy, we may purchase shares of our common stock through various means such as open market transactions, including block purchases, and privately negotiated transactions. The number of shares repurchased and the timing, manner, price and amount of any repurchases will be determined at our discretion. Factors include, but are not limited to, share price, trading volume and general market conditions, along with our general business conditions. The policy may be suspended or discontinued at any time and does not obligate us to acquire any specific number of shares of our common stock.
On August 29, 2023, as part of the share repurchase policy, we entered into a new trading plan with an independent broker, Wells Fargo, in accordance with Rule 10b5-1 of the Securities Exchange Act of 1934, as amended, based in part on historical trading data with respect to our shares. The 10b5-1 trading plan permits common stock to be repurchased at a time that we might otherwise be precluded from doing so under insider trading laws or self-imposed trading restrictions. The 10b5-1 trading plan expires on August 29, 2024, and is subject to price, market volume and timing restrictions.
During the year ended December 31, 2023, we repurchased an aggregate of 1,114,848 shares under the 10b5-1 trading plan for an aggregate purchase price of $11,518, or an average purchase price of $10.33 per share.
From January 1, 2024 to March 6, 2024, we repurchased an aggregate of 340,505 shares of common stock under the 10b5-1 trading plan for an aggregate purchase price of $3,750, or an average purchase price of $11.01 per share. From the inception of the initial 10b5-1 trading plan in August 2022 through March 6, 2024, we repurchased an aggregate of 3,114,318 shares of common stock under the 10b5-1 trading plan for an aggregate purchase price of $30,714, or an average purchase price of $9.86 per share.
RIC Status and Distributions
To qualify for and maintain RIC tax treatment, we must, among other things, distribute in respect of each taxable year at least 90% of our net ordinary income and realized net short-term capital gains in excess of realized net long-term capital losses, if any. We will incur an excise tax of 4% imposed on RICs to the extent we do not distribute in respect of each calendar year an amount at least equal to the sum of (1) 98.0% of our net ordinary income (taking into account certain deferrals and elections) for the calendar year, (2) 98.2% of our capital gains in excess of capital losses, or capital gain net income (adjusted for certain ordinary losses), for the one-year period ending on October 31 of the calendar year and (3) any net ordinary income and capital gain net income from preceding years that were not distributed during such years and on which we paid no federal income tax. For an additional discussion of our RIC status and distributions, refer to Note 2 and Note 5, respectively, of our consolidated financial statements included in this report.
We intend to make distributions in an amount sufficient to maintain RIC status each year and to avoid any federal income taxes on income. Therefore, subject to applicable legal restrictions and the sole discretion of our board of directors, we intend to authorize, declare, and pay regular distributions on a quarterly basis. Regular and any supplemental and/or special distributions in respect of future periods will be evaluated by management and our board of directors based on circumstances and expectations existing at the time of consideration.
The following table presents distributions per share that were declared during the years ended December 31, 2023, 2022 and 2021:
| | | | | | | | | | | | | | |
| | Distributions |
| Three Months Ended | | Per Share(1) | | Amount |
| 2021 | | | | |
| March 31, 2021 (three record dates) | | $ | 0.2648 | | | $ | 15,029 | |
| June 30, 2021 (three record dates) | | 0.2648 | | | 15,000 | |
| September 30, 2021 (three record dates) | | 0.2648 | | | 15,027 | |
| December 31, 2021 (two record dates) | | 0.4648 | | | 26,474 | |
| Total distributions for the year ended December 31, 2021 | | $ | 1.2592 | | | $ | 71,530 | |
| | | | |
| 2022 | | | | |
| March 31, 2022 (one record date) | | $ | 0.2800 | | | $ | 15,948 | |
| June 30, 2022 (one record date) | | 0.2800 | | | 15,949 | |
| September 30, 2022 (one record date) | | 0.3100 | | | 17,604 | |
| December 31, 2022 (two record dates) | | 0.5800 | | | 32,074 | |
| Total distributions for the year ended December 31, 2022 | | $ | 1.4500 | | | $ | 81,575 | |
| | | | |
| 2023 | | | | |
| March 31, 2023 (one record date) | | $ | 0.3400 | | | $ | 18,687 | |
| June 30, 2023 (one record date) | | 0.3400 | | | 18,614 | |
| September 30, 2023 (two record dates) | | 0.3900 | | | 21,276 | |
| December 31, 2023 (three record dates) | | 0.5400 | | | 29,290 | |
| Total distributions for the year ended December 31, 2023 | | $ | 1.6100 | | | $ | 87,867 | |
(1)The per share distribution amount for 2021 has been retroactively adjusted to reflect the Reverse Stock Split as discussed in Note 3 to the consolidated financial statements included in this report.
On March 11, 2024, our co-chief executive officers declared a regular quarterly distribution of $0.34 per share for the first quarter of 2024 payable on March 28, 2024 to shareholders of record as of March 22, 2024. For an additional discussion of our RIC status and distributions, refer to Note 2 and Note 5, respectively, of our consolidated financial statements included in this report.
JPM Credit Facility
As of December 31, 2023 and March 6, 2024, our aggregate outstanding borrowings under the JPM Credit Facility were $550,000 and the aggregate unfunded principal amount in connection with the JPM Credit Facility was $125,000. For a detailed discussion of our JPM Credit Facility, refer to Note 8 to our consolidated financial statements included in this report.
UBS Facility
As of December 31, 2023 and March 6, 2024, our outstanding borrowings under the Amended UBS Facility were $122,500 and the aggregate unfunded principal amount in connection with the Amended UBS Facility was $27,500. For a detailed discussion of our Amended UBS Facility, refer to Note 8 to our consolidated financial statements included in this report.
2026 Notes
As of December 31, 2023 and March 6, 2024, we had $125,000 in aggregate principal amount of 2026 Notes outstanding and there was no unfunded principal amount in connection with the 2026 Notes. For a detailed discussion of our 2026 Notes, refer to Note 8 to our consolidated financial statements included in this report.
2021 More Term Loan
As of December 31, 2023 and March 6, 2024, our outstanding borrowings under the 2021 More Term Loan were $30,000 and there was no unfunded principal amount in connection with the 2021 More Term Loan. For a detailed discussion of our 2021 More Term Loan, refer to Note 8 to our consolidated financial statements included in this report.
2022 More Term Loan
As of December 31, 2023 and March 6, 2024, our outstanding borrowings under the 2022 More Term Loan were $50,000 and there was no unfunded principal amount in connection with the 2022 More Term Loan. For a detailed discussion of our 2022 More Term Loan, refer to Note 8 to our consolidated financial statements included in this report.
Series A Notes
As of December 31, 2023 and March 6, 2024, we had approximately $114,844 in aggregate principal amount of Series A Notes outstanding and there was no unfunded principal amount in connection with the Series A Notes. For a detailed discussion of our Series A Notes, refer to Note 8 to our consolidated financial statements included in this report.
2027 Notes
As of December 31, 2023 and March 6, 2024, we had $100,000 in aggregate principal amount of 2027 Notes outstanding and there was no unfunded principal amount in connection with the 2027 Notes. For a detailed discussion of our 2027 Notes, refer to Note 8 to our consolidated financial statements included in this report.
Unfunded Commitments
As of December 31, 2023 and March 6, 2024, our unfunded commitments amounted to $47,349 and $53,048, respectively. For a detailed discussion of our unfunded commitments, refer to Note 11 to our consolidated financial statements included in this report.
Recent Accounting Pronouncements
See Note 2 to our consolidated financial statements included in this report for a discussion of certain recent accounting pronouncements that are applicable to us.
Critical Accounting Policies
Our consolidated financial statements are prepared in conformity with U.S. generally accepted accounting principles, or GAAP, which requires us to make estimates and assumptions that affect the reported amounts of assets and liabilities at the date of the consolidated financial statements and the reported amounts of revenues and expenses during the reporting periods. Critical accounting policies are those that require the application of management’s most difficult, subjective or complex judgments, often because of the need to make estimates about the effect of matters that are inherently uncertain and that may change in subsequent periods. In preparing the consolidated financial statements, we also utilize available information, including our past history, industry standards and the current economic environment, among other factors, in forming our estimates and judgments, giving due consideration to materiality. Actual results may differ from these estimates. In addition, other companies may utilize different estimates, which may impact the comparability of our results of operations to those of companies in similar businesses.
Valuation of Portfolio Investments
The value of our assets is determined quarterly and at such other times that an event occurs that materially affects the valuation. The valuation is made pursuant to Section 2(a)(41) of the 1940 Act, which requires that we value our assets as follows: (i) the market price for those securities for which a market quotation is readily available, and (ii) for all other securities and assets, at fair value, as determined in good faith by our board of directors. As a BDC, Section 2(a)(41) of the 1940 Act requires the board of directors to determine in good faith the fair value of portfolio securities for which a market price is not readily available, and it does so in conjunction with the application of our valuation procedures by CIM. In accordance with Rule 2a-5 of the 1940 Act, our board of directors has designated CIM as our “valuation designee.” Our board of directors and the audit committee of our board of directors, which is comprised solely of our independent directors, oversees the activities, methodology and processes of the valuation designee.
There is no single standard for determining fair value in good faith. As a result, determining fair value requires that judgment be applied to the specific facts and circumstances of each asset while employing a valuation process that is consistently followed. Determinations of fair value involve subjective judgments and estimates. Accordingly, the notes to our consolidated financial statements refer to the uncertainty with respect to the possible effect of such valuations, and any change in such valuations in our consolidated financial statements.
Valuation Methods
With respect to investments for which market quotations are not readily available, CIM, as the valuation designee of our board of directors, undertakes a multi-step valuation process each quarter, as described below:
•our quarterly valuation process generally begins with each portfolio company or investment either being sent directly to an independent valuation firm or initially valued by certain of CIM’s investment professionals and certain members of its management team, with such valuation taking into account information received from various sources, including independent valuation firms, if applicable;
•preliminary valuation conclusions are then documented and discussed with members of CIM’s management team;
•designated members of CIM’s management team review the preliminary valuation, and, if applicable, deliver such preliminary valuation to an independent valuation firm for its review;
•designated members of CIM’s management team and, if appropriate, the relevant investment professionals meet with the independent valuation firm to discuss the preliminary valuation;
•designated members of CIM’s management team respond and supplement the preliminary valuation to reflect any comments provided by the independent valuation firm;
•our audit committee meets with members of CIM’s management team and the independent valuation firms to discuss the assistance provided and the results of the independent valuation firms' review; and
•our board of directors and our audit committee provide oversight with respect to this valuation process, including requesting such materials as they may determine appropriate.
We shall promptly (but no later than five business days after we become aware) report to our board of directors in writing on the occurrence of matters that materially affect the fair value of the designated portfolio of investments. Material matters in this instance include a significant deficiency or material weakness in the design or effectiveness of CIM’s fair value determination process resulting in a material error in the calculation of NAV of $0.01 per share or greater.
In addition to the foregoing, certain investments for which a market price is not readily available are evaluated on a quarterly basis by an independent valuation firm and certain other investments are on a rotational basis reviewed by an independent valuation firm. Finally, certain investments are not evaluated by an independent valuation firm unless certain aspects of such investments in the aggregate meet certain criteria.
Given the expected types of investments, excluding short term investments and stock of publicly traded companies that are classified as Level 1, management expects our portfolio holdings to be classified as Level 3. Due to the uncertainty inherent in the valuation process, particularly for Level 3 investments, such fair value estimates may differ significantly from the values that would have been used had an active market for the investments existed. In addition, changes in the market environment and other events that may occur over the life of the investments may cause the gains or losses that we ultimately realize on these investments to materially differ from the valuations currently assigned. Inputs used in the valuation process are subject to variability in the future and can result in materially different fair values.
For an additional discussion of our investment valuation process, refer to Note 2 to our consolidated financial statements included in this report.
Related Party Transactions
For a discussion of our relationship with related parties including CIM, CIG, and AIA and amounts incurred under agreements with such related parties, refer to Note 4 to our consolidated financial statements included in this report. For a discussion of our relationship with CION/EagleTree, refer to Note 7 to our consolidated financial statements included in this report.
Contractual Obligations
On August 26, 2016, 34th Street entered into the JPM Credit Facility with JPM, as amended and restated on September 30, 2016, July 11, 2017, November 28, 2017, May 23, 2018, May 15, 2020, February 26, 2021, March 28, 2022 and May 15, 2023. See Note 8 to our consolidated financial statements for a more detailed description of the JPM Credit Facility.
On May 19, 2017, Murray Hill Funding II entered into the UBS Facility with UBS, as amended on December 1, 2017, May 19, 2020, November 12, 2020, December 17, 2020 and June 14, 2023. See Note 8 to our consolidated financial statements for a more detailed description of the UBS Facility.
On February 11, 2021, we entered into the 2026 Note Purchase Agreement with purchasers of the 2026 Notes. See Note 8 to our consolidated financial statements for a more detailed description of the 2026 Notes.
On April 14, 2021, we entered into the 2021 More Term Loan with More. See Note 8 to our consolidated financial statements for a more detailed description of the 2021 More Term Loan.
On April 27, 2022, we entered into the 2022 More Term Loan with More. See Note 8 to our consolidated financial statements for a more detailed description of the 2022 More Term Loan.
On February 28, 2023, we entered into a Deed of Trust with Mishmeret Trust Company Ltd., as trustee, pursuant to which we issued our Series A Notes. See Note 8 to our consolidated financial statements for a more detailed description of the Deed of Trust and the Series A Notes.
On November 8, 2023, we entered into the 2027 Note Purchase Agreement with purchasers of the 2027 Notes. See Note 8 to our consolidated financial statements for a more detailed description of the 2027 Notes.
Commitments and Contingencies
We have entered into certain contracts with other parties that contain a variety of indemnifications. Our maximum exposure under these arrangements is unknown. However, we have not experienced claims or losses pursuant to these contracts and believe the risk of loss related to such indemnifications to be remote.
Our investment portfolio may contain debt investments that are in the form of lines of credit, delayed draw term loans, revolving credit facilities, or other unfunded commitments, which may require us to provide funding when requested in accordance with the terms of the underlying agreements. For further details on such debt investments, refer to Note 11 to our consolidated financial statements included in this report.
We currently have no off-balance sheet arrangements, except for those discussed in Note 7 and Note 11 to our consolidated financial statements included in this report.
Item 7A. Quantitative and Qualitative Disclosures About Market Risk
We are subject to financial market risks, including changes in interest rates. As of December 31, 2023, 80.1% of our investments paid variable interest rates. A rise in the general level of interest rates can be expected to lead to higher interest rates applicable to our debt investments, especially to the extent that we hold variable rate investments, and to declines in the value of any fixed rate investments we may hold. To the extent that a majority of our investments may be in variable rate investments, an increase in interest rates could make it easier for us to meet or exceed our incentive fee hurdle rate, as defined in our investment advisory agreement, and may result in a substantial increase in our net investment income, and also to the amount of incentive fees payable to CIM with respect to our pre-incentive fee net investment income.
As of December 31, 2023, under the terms of the JPM Second Amendment, advances bear interest at a floating rate equal to the three-month SOFR, plus a credit spread of 3.05% per year, and a LIBOR to SOFR credit spread adjustment of 0.15%. Pursuant to the terms of the Amended UBS Facility, we currently pay a financing fee equal to the three-month SOFR, plus a spread of 3.20% per year. Pursuant to the terms of the Deed of Trust, the Series A Notes bear interest at a floating rate equal to average overnight SOFR, plus a credit spread of 3.82% per year. The 2027 Notes bear interest at a floating rate equal to the three-month SOFR plus a credit spread of 4.75% per year and are subject to a 2.00% SOFR floor. Pursuant to the terms of the 2022 More Term Loan, advances bear interest at a floating rate equal to the three-month SOFR, plus a credit spread of 3.50% per year and subject to a 1.0% SOFR floor. In addition, we may seek to further borrow funds in order to make additional investments. Our net investment income will be impacted, in part, by the difference between the rate at which we borrow funds and the rate at which we invest those funds. As a result, we would be subject to risks relating to changes in market interest rates. In periods of rising interest rates when we have debt outstanding, our cost of funds would increase, which could reduce our net investment income, especially to the extent we hold fixed rate investments. We expect that our long-term investments will be financed primarily with equity and long-term debt. Our interest rate risk management techniques may include various interest rate hedging activities to the extent permitted by the 1940 Act. Adverse developments resulting from changes in interest rates could have a material adverse effect on our business, financial condition and results of operations.
The following table shows the effect over a twelve month period of changes in interest rates on our net interest income, excluding short term investments, assuming no changes in our investment portfolio, the JPM Second Amendment, the Amended UBS Facility, the Series A Notes, the 2027 Notes or the 2022 More Term Loan in effect as of December 31, 2023:
| | | | | | | | | | | | | | |
| Basis Point Change in Interest Rates | | (Decrease) Increase in Net Interest Income(1) | | Percentage Change in Net Interest Income |
| Down 300 basis points | | $ | (14,227) | | | (13.7) | % |
| Down 200 basis points | | (9,641) | | | (9.3) | % |
| Down 100 basis points | | (4,881) | | | (4.7) | % |
| Down 50 basis points | | (2,441) | | | (2.3) | % |
No change to current base rate (5.47% as of December 31, 2023) | | — | | | — | |
| Up 50 basis points | | 2,441 | | | 2.3 | % |
| Up 100 basis points | | 4,881 | | | 4.7 | % |
| Up 200 basis points | | 9,763 | | | 9.4 | % |
| Up 300 basis points | | 14,644 | | | 14.1 | % |
(1)This table assumes no change in defaults or prepayments by portfolio companies over the next twelve months.
The interest rate sensitivity analysis presented above does not consider the potential impact of the changes in fair value of our fixed rate debt investments, our fixed rate borrowings (the 2026 Notes and the 2021 More Term Loan), or the NAV of our common stock in the event of sudden changes in interest rates. Approximately 7.2% of our investments paid fixed interest rates as of December 31, 2023. Rising market interest rates will most likely lead to fair value declines for fixed interest rate investments and fixed interest rate borrowings and a decline in the NAV of our common stock, while declining market interest rates will most likely lead to an increase in the fair value of fixed interest rate investments and fixed interest rate borrowings and an increase in the NAV of our common stock.
In addition, we may have risk regarding portfolio valuation. See “Item 7. Management’s Discussion and Analysis of Financial Condition and Results of Operations—Critical Accounting Policies—Valuation of Portfolio Investments” and Note 2 to our consolidated financial statements included in this report.
Inflation
Economic activity has continued to accelerate across sectors and regions. Nevertheless, due to geopolitical events, a rise in energy prices and strong consumer demand, inflation is showing signs of remaining high in the U.S. and globally. Although the current outlook is uncertain, heightened inflation may persist in the near to medium-term, particularly in the U.S., with the possibility that monetary policy may tighten in response. Persistent inflationary pressures could affect our portfolio companies' respective profit margins.
Item 8. Consolidated Financial Statements and Supplementary Data
Report of Independent Registered Public Accounting Firm
To the Shareholders and the Board of Directors of CĪON Investment Corporation
Opinion on the Financial Statements
We have audited the accompanying consolidated balance sheets, including the consolidated schedules of investments, of CĪON Investment Corporation (the Company) as of December 31, 2023 and 2022, the related consolidated statements of operations, changes in net assets, and cash flows for each of the three years in the period ended December 31, 2023, and the related notes to the consolidated financial statements (collectively, the financial statements). In our opinion, the financial statements present fairly, in all material respects, the financial position of the Company as of December 31, 2023 and 2022, and the results of its operations, changes in net assets, and its cash flows for each of the three years in the period ended December 31, 2023, in conformity with accounting principles generally accepted in the United States of America.
We have also audited, in accordance with the standards of the Public Company Accounting Oversight Board (United States) (PCAOB), the Company's internal control over financial reporting as of December 31, 2023, based on criteria established in Internal Control — Integrated Framework issued by the Committee of Sponsoring Organizations of the Treadway Commission in 2013, and our report dated March 13, 2024 expressed an unqualified opinion on the effectiveness of the Company’s internal control over financial reporting.
Basis for Opinion
These financial statements are the responsibility of the Company’s management. Our responsibility is to express an opinion on the Company’s financial statements based on our audits. We are a public accounting firm registered with the PCAOB and are required to be independent with respect to the Company in accordance with U.S. federal securities laws and the applicable rules and regulations of the Securities and Exchange Commission and the PCAOB.
We conducted our audits in accordance with the standards of the PCAOB. Those standards require that we plan and perform the audits to obtain reasonable assurance about whether the financial statements are free of material misstatement, whether due to error or fraud.
Our audits included performing procedures to assess the risks of material misstatement of the financial statements, whether due to error or fraud, and performing procedures that respond to those risks. Such procedures included examining, on a test basis, evidence regarding the amounts and disclosures in the financial statements. Our procedures included confirmation of investments owned as of December 31, 2023 and 2022, by correspondence with the custodians, loan agents or management of the underlying investments, as applicable, or by other appropriate auditing procedures where replies from these parties, as applicable, were not received. Our audits also included evaluating the accounting principles used and significant estimates made by management, as well as evaluating the overall presentation of the financial statements. We believe that our audits provide a reasonable basis for our opinion.
Critical Audit Matter
The critical audit matter communicated below is a matter arising from the current period audit of the financial statements that was communicated or required to be communicated to the audit committee and that: (1) relates to accounts or disclosures that are material to the financial statements and (2) involved our especially challenging, subjective, or complex judgments. The communication of critical audit matters does not alter in any way our opinion on the financial statements, taken as a whole, and we are not, by communicating the critical audit matter below, providing separate opinions on the critical audit matter or on the accounts or disclosures to which it relates.
Valuation of Level 3 Investments
As discussed in Note 2 to the financial statements, substantially all of the Company’s investments are recorded at fair value, which represents the price that would be received from the sale of an asset in an orderly transaction between market participants at the measurement date. Accounting principles generally accepted in the United States of America establish a three-tier fair value hierarchy that prioritizes and ranks the level of market price observability of inputs used by management in measuring the Company’s investments at fair value. Market price observability is affected by a number of factors, including the type of investment and the characteristics specific to the investment. Investments with readily available active quoted prices or for which fair value can be measured from actively quoted prices generally will have a higher degree of market price observability and a lesser degree of judgment used in measuring fair value. Investments valued using unobservable inputs are classified as Level 3 investments according to the fair value hierarchy discussed in Note 2 and may require significant management judgment or estimation, including the selection of valuation techniques and the inputs used in those valuation techniques, to estimate fair value. As discussed in Note 9 to the financial statements, the fair value of the Company’s investments classified as Level 3 investments was approximately $1.81 billion as of December 31, 2023.
We identified the valuation of Level 3 investments as a critical audit matter because of the management judgment necessary to select the valuation techniques used to estimate the fair value of the investments and to estimate the significant unobservable inputs used in those valuation techniques. Auditing management’s estimates and judgments involved a high degree of auditor judgment and increased audit effort, including the use of valuation specialists, due to the impact these estimates and judgments have on the fair value of the investments.
Our audit procedures related to estimates and judgments used by management to select the valuation techniques and unobservable inputs used in the estimation of the fair value of Level 3 investments included the following, among others:
•We obtained an understanding of the relevant controls related to management’s valuation of Level 3 investments and tested such controls for design and operating effectiveness, including those related to management’s selection of valuation techniques and estimates of significant unobservable inputs.
•We selected a sample of investments and evaluated the appropriateness of the valuation techniques used by management to value the Level 3 investments by considering the reasonableness of any significant changes in valuation techniques from prior periods, if applicable, and also, comparing to those used by market participants.
•For a sample of investments, we evaluated both the reasonableness of the significant unobservable inputs and the reasonableness of any significant changes in significant unobservable inputs from prior periods, when applicable, by comparing the unobservable inputs to external sources, including, but not limited to:
◦Historical operating results of the investee.
◦Available market data for comparable companies.
◦Subsequent events and transactions, where available.
•For a sample of investments, we tested the completeness and accuracy of the underlying data used by management to determine the unobservable input by agreeing it to underlying source information, and we tested the mathematical accuracy of the calculation used to compute the unobservable input.
•For a sample of investments, we utilized valuation specialists to perform the following procedures, among others:
◦Evaluate the appropriateness of management’s valuation techniques by comparing them to those used by a market participant.
◦Develop an independent range of certain unobservable inputs such as market yield, comparable financial performance multiples and discount rates, among others, and compared them to the assumptions used by management.
◦Develop an independent estimate of the fair value and compared our estimate to management’s estimate.
•We evaluated management’s ability to reasonably estimate fair value by comparing management’s historical estimates to transactions subsequent to the measurement date, considering changes in market or investment specific factors, among others, when applicable.
/s/ RSM US LLP
We have served as the Company's auditor since 2019.
New York, New York
March 13, 2024
Report of Independent Registered Public Accounting Firm
To the Shareholders and the Board of Directors of CĪON Investment Corporation
Opinion on the Internal Control Over Financial Reporting
We have audited CĪON Investment Corporation's (the Company) internal control over financial reporting as of December 31, 2023, based on criteria established in Internal Control — Integrated Framework issued by the Committee of Sponsoring Organizations of the Treadway Commission in 2013. In our opinion, the Company maintained, in all material respects, effective internal control over financial reporting as of December 31, 2023, based on criteria established in Internal Control — Integrated Framework issued by the Committee of Sponsoring Organizations of the Treadway Commission in 2013.
We have also audited, in accordance with the standards of the Public Company Accounting Oversight Board (United States) (PCAOB), the consolidated balance sheets, including the consolidated schedules of investments, as of December 31, 2023 and 2022, and the related consolidated statements of operations, changes in net assets, and cash flows for each of the three years in the period ended December 31, 2023, and the related notes to the consolidated financial statements (collectively, the financial statements) of the Company and our report dated March 13, 2024 expressed an unqualified opinion.
Basis for Opinion
The Company’s management is responsible for maintaining effective internal control over financial reporting and for its assessment of the effectiveness of internal control over financial reporting in the accompanying Management’s Annual Report on Internal Control Over Financial Reporting. Our responsibility is to express an opinion on the Company’s internal control over financial reporting based on our audit. We are a public accounting firm registered with the PCAOB and are required to be independent with respect to the Company in accordance with U.S. federal securities laws and the applicable rules and regulations of the Securities and Exchange Commission and the PCAOB.
We conducted our audit in accordance with the standards of the PCAOB. Those standards require that we plan and perform the audit to obtain reasonable assurance about whether effective internal control over financial reporting was maintained in all material respects. Our audit included obtaining an understanding of internal control over financial reporting, assessing the risk that a material weakness exists, and testing and evaluating the design and operating effectiveness of internal control based on the assessed risk. Our audit also included performing such other procedures as we considered necessary in the circumstances. We believe that our audit provides a reasonable basis for our opinion.
Definition and Limitations of Internal Control Over Financial Reporting
A company's internal control over financial reporting is a process designed to provide reasonable assurance regarding the reliability of financial reporting and the preparation of financial statements for external purposes in accordance with generally accepted accounting principles. A company's internal control over financial reporting includes those policies and procedures that (1) pertain to the maintenance of records that, in reasonable detail, accurately and fairly reflect the transactions and dispositions of the assets of the company; (2) provide reasonable assurance that transactions are recorded as necessary to permit preparation of financial statements in accordance with generally accepted accounting principles, and that receipts and expenditures of the company are being made only in accordance with authorizations of management and directors of the company; and (3) provide reasonable assurance regarding prevention or timely detection of unauthorized acquisition, use or disposition of the company's assets that could have a material effect on the financial statements.
Because of its inherent limitations, internal control over financial reporting may not prevent or detect misstatements. Also, projections of any evaluation of effectiveness to future periods are subject to the risk that controls may become inadequate because of changes in conditions, or that the degree of compliance with the policies or procedures may deteriorate.
/s/ RSM US LLP
New York, New York
March 13, 2024
CĪON Investment Corporation
Consolidated Balance Sheets
(in thousands, except share and per share amounts)
| | | | | | | | | | | | | | |
| | December 31,
2023 | | December 31,
2022 |
| Assets |
| Investments, at fair value: | | | | |
Non-controlled, non-affiliated investments (amortized cost of $1,610,822 and $1,580,844, respectively) | | $ | 1,570,676 | | | $ | 1,525,040 | |
Non-controlled, affiliated investments (amortized cost of $210,103 and $140,344, respectively) | | 206,301 | | | 143,876 | |
Controlled investments (amortized cost of $154,705 and $82,421, respectively) | | 177,293 | | | 91,114 | |
Total investments, at fair value (amortized cost of $1,975,630 and $1,803,609, respectively) | | 1,954,270 | | | 1,760,030 | |
| | | | |
| Cash | | 8,415 | | | 82,739 | |
| | | | |
| | | | |
| | | | |
| Interest receivable on investments | | 36,724 | | | 26,526 | |
| | | | |
| Receivable due on investments sold and repaid | | 967 | | | 1,016 | |
| Dividends receivable on controlled investments | | — | | | 1,275 | |
| Prepaid expenses and other assets | | 1,348 | | | 825 | |
| Total assets | | $ | 2,001,724 | | | $ | 1,872,411 | |
| | | | | | | | | | | | | | |
| Liabilities and Shareholders' Equity |
| Liabilities | | | | |
Financing arrangements (net of unamortized debt issuance costs of $10,643 and $6,178, respectively) | | $ | 1,081,701 | | | $ | 951,322 | |
| Payable for investments purchased | | 4,692 | | | — | |
| Accounts payable and accrued expenses | | 1,036 | | | 1,012 | |
| Interest payable | | 10,231 | | | 7,820 | |
| | | | |
| Accrued management fees | | 6,893 | | | 6,924 | |
| Accrued subordinated incentive fee on income | | 4,615 | | | 5,065 | |
| Accrued administrative services expense | | 2,156 | | | 1,703 | |
| Shareholder distribution payable | | 10,837 | | | 14,931 | |
| | | | |
| | | | |
| | | | |
| Total liabilities | | 1,122,161 | | | 988,777 | |
| | | | |
| Commitments and contingencies (Note 4 and Note 11) | | | | |
| | | | |
| Shareholders' Equity | | | | |
Common stock, $0.001 par value; 500,000,000 shares authorized; 54,184,636 | | | | |
and 55,299,484 shares issued and 54,184,636 and 55,299,484 shares outstanding, respectively | | 54 | | | 55 | |
| Capital in excess of par value | | 1,033,030 | | | 1,044,547 | |
| Accumulated distributable losses | | (153,521) | | | (160,968) | |
| Total shareholders' equity | | 879,563 | | | 883,634 | |
| Total liabilities and shareholders' equity | | $ | 2,001,724 | | | $ | 1,872,411 | |
| Net asset value per share of common stock at end of year | | $ | 16.23 | | | $ | 15.98 | |
See accompanying notes to consolidated financial statements.
CĪON Investment Corporation
Consolidated Statements of Operations
(in thousands, except share and per share amounts)
| | | | | | | | | | | | | | | | | | | | |
| | Years Ended December 31, |
| | 2023 | | 2022 | | 2021 |
| Investment income | | | | | | |
| Non-controlled, non-affiliated investments | | | | | | |
| Interest income | | $ | 184,013 | | | $ | 140,560 | | | $ | 119,792 | |
| Paid-in-kind interest income | | 22,317 | | | 22,737 | | | 17,306 | |
| Fee income | | 7,871 | | | 9,019 | | | 5,927 | |
| Dividend income | | 210 | | | 103 | | | 366 | |
| Non-controlled, affiliated investments | | | | | | |
| Interest income | | 7,068 | | | 5,865 | | | 4,961 | |
| Paid-in-kind interest income | | 8,372 | | | 6,204 | | | 3,160 | |
| | | | | | |
| Fee income | | 2,432 | | | 525 | | | — | |
| Dividend income | | 3,946 | | | 79 | | | 5,576 | |
| Controlled investments | | | | | | |
| Interest income | | 8,090 | | | 6,049 | | | — | |
| Paid-in-kind interest income | | 1,050 | | | 2,482 | | | 260 | |
| Fee income | | 1,391 | | | — | | | — | |
| Dividend income | | 4,250 | | | 1,275 | | | — | |
| Total investment income | | 251,010 | | | 194,898 | | | 157,348 | |
| Operating expenses | | | | | | |
| Management fees | | 26,856 | | | 27,361 | | | 31,143 | |
| Administrative services expense | | 3,971 | | | 3,348 | | | 3,069 | |
| Subordinated incentive fee on income | | 22,277 | | | 18,710 | | | 6,875 | |
| General and administrative | | 7,382 | | | 7,278 | | | 9,805 | |
| Interest expense | | 85,556 | | | 49,624 | | | 31,807 | |
| Total operating expenses | | 146,042 | | | 106,321 | | | 82,699 | |
| Net investment income before taxes | | 104,968 | | | 88,577 | | | 74,649 | |
| Income tax (benefit) expense, including excise tax | | (54) | | | 372 | | | 342 | |
| Net investment income after taxes | | 105,022 | | | 88,205 | | | 74,307 | |
| Realized and unrealized (losses) gains | | | | | | |
| Net realized (losses) gains on: | | | | | | |
| Non-controlled, non-affiliated investments | | (31,927) | | | (11,217) | | | (4,100) | |
| Non-controlled, affiliated investments | | — | | | (21,530) | | | 8,010 | |
| Controlled investments | | — | | | — | | | (3,067) | |
| Foreign currency | | — | | | (3) | | | (3) | |
| Net realized (losses) gains | | (31,927) | | | (32,750) | | | 840 | |
| Net change in unrealized appreciation (depreciation) on: | | | | | | |
| Non-controlled, non-affiliated investments | | 15,658 | | | (19,807) | | | 25,566 | |
| Non-controlled, affiliated investments | | (7,335) | | | 13,523 | | | 7,261 | |
| Controlled investments | | 13,896 | | | 970 | | | 10,790 | |
| | | | | | |
| | | | | | |
| Net change in unrealized appreciation (depreciation) | | 22,219 | | | (5,314) | | | 43,617 | |
| Net realized and unrealized (losses) gains | | (9,708) | | | (38,064) | | | 44,457 | |
| Net increase in net assets resulting from operations | | $ | 95,314 | | | $ | 50,141 | | | $ | 118,764 | |
| Per share information—basic and diluted(1) | | | | | | |
| Net increase in net assets per share resulting from operations | | $ | 1.74 | | | $ | 0.89 | | | $ | 2.09 | |
| Net investment income per share | | $ | 1.92 | | | $ | 1.56 | | | $ | 1.31 | |
| Weighted average shares of common stock outstanding | | 54,685,327 | | | 56,556,510 | | | 56,808,960 | |
(1) As discussed in Note 3, the Company completed a two-to-one reverse stock split, effective as of September 21, 2021. The weighted average shares used in the computation of the net increase (decrease) in net assets per share resulting from operations and net investment income per share for 2021 reflect the reverse stock split on a retroactive basis.
See accompanying notes to consolidated financial statements.
CĪON Investment Corporation
Consolidated Statements of Changes in Net Assets
(in thousands, except share and per share amounts)
| | | | | | | | | | | | | | | | | | | | | | | |
| | Years Ended December 31, |
| | 2023 | | 2022 | | 2021 |
| Changes in net assets from operations: | | | | | | |
| Net investment income | | $ | 105,022 | | | $ | 88,205 | | | $ | 74,307 | |
| Net realized (loss) gain on investments | | (31,927) | | | (32,747) | | | 843 | |
| Net realized loss on foreign currency | | — | | | (3) | | | (3) | |
| Net change in unrealized appreciation (depreciation) on investments | | 22,219 | | | (5,314) | | | 43,617 | |
| | | | | | |
| | | | | | |
| | | | | | |
| Net increase in net assets resulting from operations | | 95,314 | | | 50,141 | | | 118,764 | |
| Changes in net assets from shareholders' distributions: | | | | | | |
| Distributions to shareholders | | (87,867) | | | (81,575) | | | (71,530) | |
| Net decrease in net assets resulting from shareholders' distributions | | (87,867) | | | (81,575) | | | (71,530) | |
| Changes in net assets from capital share transactions: | | | | | | |
| | | | | | |
| Reinvestment of shareholders' distributions | | — | | | — | | | 15,489 | |
| Repurchase of common stock | | (11,518) | | | (15,444) | | | (10,467) | |
| Net (decrease) increase in net assets resulting from capital share transactions | | (11,518) | | | (15,444) | | | 5,022 | |
| | | | | | |
| Total (decrease) increase in net assets | | (4,071) | | | (46,878) | | | 52,256 | |
| Net assets at beginning of year | | 883,634 | | | 930,512 | | | 878,256 | |
| Net assets at end of year | | $ | 879,563 | | | $ | 883,634 | | | $ | 930,512 | |
| Net asset value per share of common stock at end of year(1) | | $ | 16.23 | | | $ | 15.98 | | | $ | 16.34 | |
| Shares of common stock outstanding at end of year(1) | | 54,184,636 | | | 55,299,484 | | | 56,958,440 | |
| | | | | | |
(1) As discussed in Note 3, the Company completed a two-to-one reverse stock split, effective as of September 21, 2021. The shares outstanding used in the computation of net asset value per share for 2021 reflect the reverse stock split on a retroactive basis.
See accompanying notes to consolidated financial statements.
CĪON Investment Corporation
Consolidated Statements of Cash Flows
(in thousands)
| | | | | | | | | | | | | | | | | | | | |
| | Years Ended December 31, |
| | 2023 | | 2022 | | 2021 |
| | | | | | |
| Operating activities: | | | | | | |
| Net increase in net assets resulting from operations | | $ | 95,314 | | | $ | 50,141 | | | $ | 118,764 | |
| Adjustments to reconcile net increase in net assets resulting from operations to net cash (used in) provided by operating activities: | | | | | | |
| Net accretion of discount on investments | | (13,506) | | | (11,032) | | | (11,738) | |
| Proceeds from principal repayment of investments | | 287,480 | | | 407,174 | | | 568,907 | |
| Purchase of investments | | (350,203) | | | (550,538) | | | (920,039) | |
| Paid-in-kind interest and dividends capitalized | | (31,739) | | | (31,446) | | | (21,734) | |
| (Increase) decrease in short term investments, net | | (102,577) | | | 77,048 | | | (14,319) | |
| Proceeds from sale of investments | | 12,771 | | | 62,586 | | | 259,050 | |
| Net realized loss (gain) on investments | | 31,927 | | | 32,747 | | | (843) | |
| Net change in unrealized (appreciation) depreciation on investments | | (22,219) | | | 5,314 | | | (43,617) | |
| Amortization of debt issuance costs | | 4,073 | | | 3,175 | | | 2,800 | |
| | | | | | |
| (Increase) decrease in interest receivable on investments | | (16,372) | | | (2,821) | | | (4,400) | |
| (Increase) decrease in dividends receivable on investments | | 1,275 | | | (1,275) | | | 45 | |
| (Increase) decrease in receivable due on investments sold and repaid | | 49 | | | 1,838 | | | 3,339 | |
| (Increase) decrease in prepaid expenses and other assets | | (523) | | | (359) | | | 1,322 | |
| Increase (decrease) in payable for investments purchased | | 4,692 | | | (11,327) | | | 11,194 | |
| Increase (decrease) in accounts payable and accrued expenses | | 24 | | | (910) | | | 1,228 | |
| Increase (decrease) in interest payable | | 2,411 | | | 3,481 | | | 1,839 | |
| Increase (decrease) in accrued management fees | | (31) | | | 251 | | | (995) | |
| Increase (decrease) in accrued administrative services expense | | 453 | | | 108 | | | 330 | |
| | | | | | |
| | | | | | |
| Increase (decrease) in subordinated incentive fee on income payable | | (450) | | | 1,123 | | | (381) | |
| | | | | | |
| Net cash (used in) provided by operating activities | | (97,151) | | | 35,278 | | | (49,248) | |
| Financing activities: | | | | | | |
| | | | | | |
| | | | | | |
| Repurchase of common stock | | (11,518) | | | (15,444) | | | (10,467) | |
| Shareholders' distributions paid | | (91,961) | | | (66,644) | | | (56,041) | |
| Repayments under financing arrangements | | (102,500) | | | — | | | (171,000) | |
| Borrowings under financing arrangements | | 237,344 | | | 127,500 | | | 276,000 | |
| | | | | | |
| Debt issuance costs paid | | (8,538) | | | (1,725) | | | (5,384) | |
| Net cash provided by financing activities | | 22,827 | | | 43,687 | | | 33,108 | |
| Net (decrease) increase in cash and restricted cash | | (74,324) | | | 78,965 | | | (16,140) | |
| Cash and restricted cash, beginning of year | | 82,739 | | | 3,774 | | | 19,914 | |
| Cash and restricted cash, end of year | | $ | 8,415 | | | $ | 82,739 | | | $ | 3,774 | |
| | | | | | |
| Supplemental disclosure of cash flow information: | | | | | | |
| Cash paid for interest | | $ | 79,032 | | | $ | 42,930 | | | $ | 27,129 | |
| Supplemental non-cash operating and financing activities: | | | | | | |
| Reinvestment of shareholders' distributions | | $ | — | | | $ | — | | | $ | 15,489 | |
| Restructuring of portfolio investment | | $ | 118,256 | | | $ | 50,554 | | | $ | 5,455 | |
| Cash interest receivable exchanged for additional securities | | $ | 4,661 | | | $ | — | | | $ | 1,304 | |
| | | | | | |
See accompanying notes to consolidated financial statements.
CĪON Investment Corporation
Consolidated Schedule of Investments
December 31, 2023
(in thousands)
| | | | | | | | | | | | | | | | | | | | | | | | | | | | | | | | | | | | | | |
| Portfolio Company(a) | | Interest(b) | | Maturity | | Industry | | Principal/
Par Amount/
Units(e) | | Cost(d) | | Fair
Value(c) |
Senior Secured First Lien Debt - 178.0% | | | | | | | | | | | | |
| Adapt Laser Acquisition, Inc.(w) | | S+1000, 1.00% SOFR Floor | | 12/31/2025 | | Capital Equipment | | $ | 10,855 | | | $ | 10,855 | | | $ | 11,126 | |
| Adapt Laser Acquisition, Inc.(w) | | S+1000, 1.00% SOFR Floor | | 12/31/2025 | | Capital Equipment | | 2,104 | | | 2,104 | | | 2,085 | |
| Afore Insurance Services, LLC(m)(q)(w) | | S+600, 1.00% SOFR Floor | | 3/24/2025 | | Banking, Finance, Insurance & Real Estate | | 4,583 | | | 4,583 | | | 4,583 | |
| AHF Parent Holding, Inc.(n)(w) | | S+625, 0.75% SOFR Floor | | 2/1/2028 | | Construction & Building | | 2,738 | | | 2,697 | | | 2,662 | |
| Allen Media, LLC(n)(w) | | S+550, 0.00% SOFR Floor | | 2/10/2027 | | Media: Diversified & Production | | 8,772 | | | 8,718 | | | 8,487 | |
| ALM Media, LLC(m)(n)(w) | | S+600, 1.00% SOFR Floor | | 11/25/2024 | | Media: Advertising, Printing & Publishing | | 16,000 | | | 15,934 | | | 16,000 | |
| AMCP Clean Acquisition Company, LLC(w) | | S+425, 0.00% SOFR Floor | | 6/15/2025 | | Services: Business | | 12,117 | | | 11,403 | | | 11,439 | |
| AMCP Clean Acquisition Company, LLC(w) | | S+425, 0.00% SOFR Floor | | 6/15/2025 | | Services: Business | | 2,843 | | | 2,676 | | | 2,684 | |
| American Clinical Solutions LLC(m)(s)(w) | | S+700, 1.00% SOFR Floor | | 6/30/2025 | | Healthcare & Pharmaceuticals | | 6,312 | | | 6,321 | | | 6,107 | |
| American Clinical Solutions LLC(o) | | 0.00% Unfunded | | 3/29/2024 | | Healthcare & Pharmaceuticals | | 250 | | | (8) | | | (8) | |
| American Health Staffing Group, Inc.(m) | | Prime+500 | | 11/19/2026 | | Services: Business | | 16,375 | | | 16,271 | | | 16,375 | |
| American Health Staffing Group, Inc. | | 0.50% Unfunded | | 11/19/2026 | | Services: Business | | 3,333 | | | (19) | | | — | |
| | | | | | | | | | | | |
| American Teleconferencing Services, Ltd.(p) | | Prime+550 | | 4/7/2023 | | Telecommunications | | 3,116 | | | 3,116 | | | 140 | |
| American Teleconferencing Services, Ltd.(o) | | 0.00% Unfunded | | 4/7/2023 | | Telecommunications | | 235 | | | — | | | — | |
| | | | | | | | | | | | |
| Ancile Solutions, Inc.(m)(w) | | S+1000, 1.00% SOFR Floor | | 6/11/2026 | | High Tech Industries | | 11,204 | | | 11,006 | | | 11,078 | |
| Anthem Sports & Entertainment Inc.(m)(s)(w) | | S+950, 1.00% SOFR Floor | | 11/15/2026 | | Media: Diversified & Production | | 40,242 | | | 40,112 | | | 38,029 | |
| Anthem Sports & Entertainment Inc.(s)(w) | | S+950, 1.00% SOFR Floor | | 11/15/2026 | | Media: Diversified & Production | | 3,261 | | | 3,261 | | | 3,081 | |
| Anthem Sports & Entertainment Inc. | | 0.50% Unfunded | | 11/15/2026 | | Media: Diversified & Production | | 167 | | | — | | | (9) | |
| Appalachian Resource Company, LLC(v) | | S+500, 1.00% SOFR Floor | | 9/30/2024 | | Metals & Mining | | 11,137 | | | 11,123 | | | 8,957 | |
| Appalachian Resource Company, LLC(v) | | S+500, 1.00% SOFR Floor | | 9/15/2024 | | Metals & Mining | | 5,000 | | | 5,000 | | | 5,000 | |
| | | | | | | | | | | | |
| | | | | | | | | | | | |
| | | | | | | | | | | | |
| Atlas Supply LLC | | 11.00% | | 4/29/2025 | | Healthcare & Pharmaceuticals | | 5,000 | | | 5,000 | | | 4,938 | |
| Avalign Holdings, Inc.(v) | | S+450, 0.00% SOFR Floor | | 12/22/2025 | | Healthcare & Pharmaceuticals | | 6,710 | | | 6,318 | | | 6,268 | |
| Avison Young (USA) Inc.(m)(w) | | S+650, 0.00% SOFR Floor | | 1/31/2026 | | Banking, Finance, Insurance & Real Estate | | 23,696 | | | 13,299 | | | 18,602 | |
| Avison Young (USA) Inc.(w) | | S+700, 0.00% SOFR Floor | | 1/31/2026 | | Banking, Finance, Insurance & Real Estate | | 2,481 | | | 922 | | | 1,948 | |
| BDS Solutions Intermediateco, LLC(m)(w) | | S+700, 2.00% SOFR Floor | | 2/7/2027 | | Services: Business | | 19,892 | | | 19,629 | | | 19,394 | |
| BDS Solutions Intermediateco, LLC(w) | | S+700, 2.00% SOFR Floor | | 2/7/2027 | | Services: Business | | 952 | | | 928 | | | 929 | |
| BDS Solutions Intermediateco, LLC | | 0.50% Unfunded | | 2/7/2027 | | Services: Business | | 1,905 | | | (48) | | | (48) | |
| Berlitz Holdings, Inc.(v) | | S+900, 1.00% SOFR Floor | | 2/14/2025 | | Services: Business | | 13,800 | | | 13,339 | | | 13,095 | |
See accompanying notes to consolidated financial statements.
CĪON Investment Corporation
Consolidated Schedule of Investments
December 31, 2023
(in thousands)
| | | | | | | | | | | | | | | | | | | | | | | | | | | | | | | | | | | | | | |
| Portfolio Company(a) | | Interest(b) | | Maturity | | Industry | | Principal/
Par Amount/
Units(e) | | Cost(d) | | Fair
Value(c) |
| Bradshaw International Parent Corp.(m)(v) | | S+575, 1.00% SOFR Floor | | 10/21/2027 | | Consumer Goods: Durable | | 12,893 | | | 12,662 | | | 12,877 | |
| Bradshaw International Parent Corp. | | 0.50% Unfunded | | 10/21/2026 | | Consumer Goods: Durable | | 1,844 | | | (26) | | | (2) | |
| Cabi, LLC(j)(m)(v) | | S+450, 1.00% SOFR Floor | | 2/28/2027 | | Retail | | 16,477 | | | 16,300 | | | 16,394 | |
| | | | | | | | | | | | |
| Carestream Health, Inc.(n)(q)(w) | | S+750, 1.00% SOFR Floor | | 9/30/2027 | | Healthcare & Pharmaceuticals | | 11,481 | | | 10,457 | | | 11,423 | |
| | | | | | | | | | | | |
| Celerity Acquisition Holdings, LLC(m)(s)(w) | | S+1000, 1.00% SOFR Floor | | 5/28/2026 | | Services: Business | | 16,118 | | | 16,096 | | | 16,118 | |
| Cennox, Inc.(m)(s)(w) | | S+625, 1.00% SOFR Floor | | 5/4/2026 | | Services: Business | | 22,423 | | | 22,422 | | | 22,395 | |
| Cennox, Inc.(m)(n)(s)(w) | | S+625, 1.00% SOFR Floor | | 5/4/2026 | | Services: Business | | 11,554 | | | 11,551 | | | 11,540 | |
| | | | | | | | | | | | |
| Cennox, Inc.(s)(w) | | S+625, 1.00% SOFR Floor | | 5/4/2026 | | Services: Business | | 2,987 | | | 2,987 | | | 2,983 | |
| CION/EagleTree Partners, LLC(h)(r)(s) | | 14.00% | | 12/21/2026 | | Diversified Financials | | 59,598 | | | 59,598 | | | 59,598 | |
| | | | | | | | | | | | |
| | | | | | | | | | | | |
| | | | | | | | | | | | |
| Community Tree Service, LLC(m)(s)(w) | | S+850, 1.00% SOFR Floor | | 6/17/2027 | | Construction & Building | | 11,567 | | | 11,567 | | | 11,596 | |
| Country Fresh Holdings, LLC(p) | | Prime+600 | | 4/30/2024 | | Beverage, Food & Tobacco | | 844 | | | 645 | | | 21 | |
| Country Fresh Holdings, LLC(p) | | Prime+600 | | 4/30/2024 | | Beverage, Food & Tobacco | | 342 | | | 268 | | | 9 | |
| Coyote Buyer, LLC(m)(n)(w) | | S+600, 1.00% SOFR Floor | | 2/6/2026 | | Chemicals, Plastics & Rubber | | 33,688 | | | 33,569 | | | 33,688 | |
| Coyote Buyer, LLC(n)(w) | | S+800, 1.00% SOFR Floor | | 8/6/2026 | | Chemicals, Plastics & Rubber | | 6,063 | | | 5,997 | | | 6,063 | |
| | | | | | | | | | | | |
| Coyote Buyer, LLC | | 0.50% Unfunded | | 2/6/2025 | | Chemicals, Plastics & Rubber | | 2,500 | | | — | | | — | |
| Critical Nurse Staffing, LLC(m)(w) | | S+650, 1.00% SOFR Floor | | 11/1/2026 | | Healthcare & Pharmaceuticals | | 12,797 | | | 12,797 | | | 12,797 | |
| Critical Nurse Staffing, LLC(m)(w) | | S+650, 1.00% SOFR Floor | | 11/1/2026 | | Healthcare & Pharmaceuticals | | 989 | | | 989 | | | 989 | |
| | | | | | | | | | | | |
| | | | | | | | | | | | |
| Critical Nurse Staffing, LLC | | 0.50% Unfunded | | 11/1/2026 | | Healthcare & Pharmaceuticals | | 1,000 | | | — | | | — | |
| David's Bridal, LLC(r)(v) | | S+600, 0.00% SOFR Floor | | 12/21/2027 | | Retail | | 17,034 | | | 17,034 | | | 16,694 | |
| David's Bridal, LLC(m)(r)(w) | | S+650, 0.00% SOFR Floor | | 12/21/2027 | | Retail | | 22,050 | | | 22,050 | | | 22,050 | |
| | | | | | | | | | | | |
| | | | | | | | | | | | |
| Deluxe Entertainment Services, Inc.(m)(p)(q)(s) | | Prime+550 | | 3/25/2024 | | Media: Diversified & Production | | 2,623 | | | 2,542 | | | 85 | |
| Dermcare Management, LLC(m)(v) | | S+600, 1.00% SOFR Floor | | 4/22/2028 | | Healthcare & Pharmaceuticals | | 9,262 | | | 9,111 | | | 9,262 | |
| Dermcare Management, LLC(m)(v) | | S+600, 1.00% SOFR Floor | | 4/22/2028 | | Healthcare & Pharmaceuticals | | 4,202 | | | 4,132 | | | 4,202 | |
| Dermcare Management, LLC (v) | | S+600, 1.00% SOFR Floor | | 4/22/2028 | | Healthcare & Pharmaceuticals | | 672 | | | 672 | | | 672 | |
| Dermcare Management, LLC | | 0.50% Unfunded | | 4/22/2028 | | Healthcare & Pharmaceuticals | | 672 | | | — | | | — | |
| Emerald Technologies (U.S.) Acquisitionco, Inc.(n)(w) | | S+625, 1.00% SOFR Floor | | 12/29/2027 | | Services: Business | | 2,869 | | | 2,826 | | | 2,611 | |
| Entertainment Studios P&A LLC(m)(w) | | S+900, 1.00% SOFR Floor | | 9/28/2027 | | Media: Diversified & Production | | 32,189 | | | 32,111 | | | 32,189 | |
| Entertainment Studios P&A LLC(j) | | 5.00% | | 5/18/2037 | | Media: Diversified & Production | | — | | | — | | | 505 | |
See accompanying notes to consolidated financial statements.
CĪON Investment Corporation
Consolidated Schedule of Investments
December 31, 2023
(in thousands)
| | | | | | | | | | | | | | | | | | | | | | | | | | | | | | | | | | | | | | |
| Portfolio Company(a) | | Interest(b) | | Maturity | | Industry | | Principal/
Par Amount/
Units(e) | | Cost(d) | | Fair
Value(c) |
| | | | | | | | | | | | |
| | | | | | | | | | | | |
| ESP Associates, Inc.(m)(w) | | S+650, 1.50% SOFR Floor | | 7/24/2028 | | Construction & Building | | 8,684 | | | 8,518 | | | 8,597 | |
| ESP Associates, Inc. | | 0.50% Unfunded | | 7/24/2028 | | Construction & Building | | 1,316 | | | (26) | | | (13) | |
| Flatworld Intermediate Corp.(n)(w) | | S+700, 1.00% SOFR Floor | | 10/3/2027 | | Services: Business | | 23,208 | | | 23,208 | | | 23,208 | |
| Flatworld Intermediate Corp. | | 0.50% Unfunded | | 10/3/2027 | | Services: Business | | 5,865 | | | — | | | — | |
| Fluid Control II Inc.(m)(w) | | S+650, 1.00% SOFR Floor | | 8/3/2029 | | Chemicals, Plastics & Rubber | | 13,235 | | | 13,235 | | | 13,235 | |
| Fluid Control II Inc. | | 0.50% Unfunded | | 8/3/2029 | | Chemicals, Plastics & Rubber | | 1,765 | | | — | | | — | |
| FuseFX, LLC(m)(n)(s)(v) | | S+600, 1.00% SOFR Floor | | 9/30/2026 | | Media: Diversified & Production | | 19,706 | | | 19,643 | | | 19,115 | |
| | | | | | | | | | | | |
| Future Pak, LLC(m)(v) | | S+900, 4.00% SOFR Floor | | 9/22/2026 | | Healthcare & Pharmaceuticals | | 18,811 | | | 18,811 | | | 18,811 | |
| Gold Medal Holdings, Inc.(m)(v) | | S+700, 1.00% SOFR Floor | | 3/17/2027 | | Environmental Industries | | 15,336 | | | 15,220 | | | 15,336 | |
| GSC Technologies Inc.(q)(v) | | S+500, 1.00% SOFR Floor | | 9/30/2025 | | Chemicals, Plastics & Rubber | | 2,099 | | | 2,051 | | | 1,983 | |
| GSC Technologies Inc.(q)(s)(v) | | S+500, 1.00% SOFR Floor | | 9/30/2025 | | Chemicals, Plastics & Rubber | | 1,007 | | | 985 | | | 942 | |
| | | | | | | | | | | | |
| H.W. Lochner, Inc.(m)(w) | | S+675, 1.00% SOFR Floor | | 7/2/2027 | | Construction & Building | | 12,862 | | | 12,529 | | | 12,802 | |
| H.W. Lochner, Inc.(m)(w) | | S+625, 1.00% SOFR Floor | | 7/2/2027 | | Construction & Building | | 8,760 | | | 8,704 | | | 8,760 | |
| H.W. Lochner, Inc.(w) | | S+625, 1.00% SOFR Floor | | 7/2/2027 | | Construction & Building | | 964 | | | 914 | | | 964 | |
| H.W. Lochner, Inc. | | 0.50% Unfunded | | 7/2/2027 | | Construction & Building | | 1,036 | | | — | | | — | |
| Harland Clarke Holdings Corp.(m)(w) | | S+775, 1.00% SOFR Floor | | 6/16/2026 | | Media: Advertising, Printing & Publishing | | 9,244 | | | 9,239 | | | 8,886 | |
| Heritage Power, LLC(w) | | S+550, 1.00% SOFR Floor | | 7/20/2026 | | Energy: Oil & Gas | | 1,159 | | | 1,159 | | | 1,159 | |
| Hilliard, Martinez & Gonzales, LLP(m)(s)(v) | | S+1200, 2.00% SOFR Floor | | 9/16/2024 | | Services: Consumer | | 25,061 | | | 25,027 | | | 24,841 | |
| Hollander Intermediate LLC(m)(v) | | S+875, 3.00% SOFR Floor | | 9/19/2026 | | Consumer Goods: Durable | | 16,745 | | | 16,391 | | | 16,326 | |
| Homer City Generation, L.P.(m)(p)(s) | | 15.00% | | 4/16/2024 | | Energy: Oil & Gas | | 13,169 | | | 12,024 | | | 8,889 | |
| Homer City Generation, L.P.(s) | | 17.00% | | 4/16/2024 | | Energy: Oil & Gas | | 1,937 | | | 1,937 | | | 1,937 | |
| Homer City Generation, L.P.(o) | | 0.00% Unfunded | | 4/16/2024 | | Energy: Oil & Gas | | 197 | | | — | | | — | |
| Hudson Hospital Opco, LLC(v)(y) | | S+800, 3.00% SOFR Floor | | 11/4/2023 | | Healthcare & Pharmaceuticals | | 2,186 | | | 2,176 | | | 2,137 | |
| HUMC Holdco, LLC(m)(v)(y) | | S+800, 3.00% SOFR Floor | | 11/4/2023 | | Healthcare & Pharmaceuticals | | 7,780 | | | 7,780 | | | 7,780 | |
| HW Acquisition, LLC(m) | | Prime+500 | | 9/28/2026 | | Capital Equipment | | 18,781 | | | 18,664 | | | 15,658 | |
| HW Acquisition, LLC | | Prime+500 | | 9/28/2026 | | Capital Equipment | | 2,922 | | | 2,908 | | | 2,436 | |
| HW Acquisition, LLC | | 0.50% Unfunded | | 9/28/2026 | | Capital Equipment | | 12 | | | (2) | | | (2) | |
| ICA Foam Holdings, LLC(m)(w) | | S+725, 1.00% SOFR Floor | | 11/5/2025 | | Containers, Packaging & Glass | | 19,076 | | | 18,829 | | | 18,480 | |
| IJKG Opco LLC(v)(y) | | S+800, 3.00% SOFR Floor | | 11/4/2023 | | Healthcare & Pharmaceuticals | | 1,457 | | | 1,443 | | | 1,424 | |
| Inotiv, Inc.(m)(s)(x) | | S+675, 1.00% SOFR Floor | | 11/5/2026 | | Healthcare & Pharmaceuticals | | 16,345 | | | 16,149 | | | 15,773 | |
| Instant Web, LLC(q)(s)(v) | | S+700, 1.00% SOFR Floor | | 2/25/2027 | | Media: Advertising, Printing & Publishing | | 44,968 | | | 44,968 | | | 28,555 | |
| | | | | | | | | | | | |
| | | | | | | | | | | | |
See accompanying notes to consolidated financial statements.
CĪON Investment Corporation
Consolidated Schedule of Investments
December 31, 2023
(in thousands)
| | | | | | | | | | | | | | | | | | | | | | | | | | | | | | | | | | | | | | |
| Portfolio Company(a) | | Interest(b) | | Maturity | | Industry | | Principal/
Par Amount/
Units(e) | | Cost(d) | | Fair
Value(c) |
| | | | | | | | | | | | |
| | | | | | | | | | | | |
| Instant Web, LLC(q)(s)(v) | | S+650, 1.00% SOFR Floor | | 2/25/2027 | | Media: Advertising, Printing & Publishing | | 2,908 | | | 2,908 | | | 2,832 | |
| Instant Web, LLC(q)(s) | | Prime+375, 4.00% Prime Floor | | 2/25/2027 | | Media: Advertising, Printing & Publishing | | 497 | | | 497 | | | 513 | |
| Instant Web, LLC(q)(s) | | S+650, 1.00% SOFR Floor | | 2/25/2027 | | Media: Advertising, Printing & Publishing | | 1,082 | | | 1,131 | | | 1,059 | |
| Instant Web, LLC(q) | | 0.50% Unfunded | | 2/25/2027 | | Media: Advertising, Printing & Publishing | | 2,164 | | | (49) | | | (46) | |
| Invincible Boat Company LLC(m)(w) | | S+650, 1.50% SOFR Floor | | 8/28/2025 | | Consumer Goods: Durable | | 13,475 | | | 13,415 | | | 13,475 | |
| Invincible Boat Company LLC(w) | | S+650, 1.50% SOFR Floor | | 8/28/2025 | | Consumer Goods: Durable | | 399 | | | 399 | | | 399 | |
| Invincible Boat Company LLC | | 0.50% Unfunded | | 8/28/2025 | | Consumer Goods: Durable | | 399 | | | — | | | — | |
| INW Manufacturing, LLC(n)(w) | | S+575, 0.75% SOFR Floor | | 3/25/2027 | | Services: Business | | 17,750 | | | 17,419 | | | 16,286 | |
| Ironhorse Purchaser, LLC(n)(w) | | S+650, 1.00% SOFR Floor | | 9/30/2027 | | Services: Business | | 7,054 | | | 6,995 | | | 7,054 | |
| Ironhorse Purchaser, LLC(w) | | S+650, 1.00% SOFR Floor | | 9/30/2027 | | Services: Business | | 2,020 | | | 2,005 | | | 2,020 | |
| Ironhorse Purchaser, LLC(w) | | S+650, 1.00% SOFR Floor | | 9/30/2027 | | Services: Business | | 469 | | | 463 | | | 469 | |
| Ironhorse Purchaser, LLC | | 0.50% Unfunded | | 9/30/2027 | | Services: Business | | 347 | | | — | | | — | |
| Isagenix International, LLC(q)(s)(w) | | S+550, 1.00% SOFR Floor | | 4/14/2028 | | Beverage, Food & Tobacco | | 8,583 | | | 8,583 | | | 8,518 | |
| | | | | | | | | | | | |
| Jenny C Acquisition, Inc.(p)(v) | | S+900, 1.75% SOFR Floor | | 10/1/2024 | | Services: Consumer | | 534 | | | 534 | | | 131 | |
| JP Intermediate B, LLC(m)(w) | | S+550, 1.00% SOFR Floor | | 8/21/2027 | | Beverage, Food & Tobacco | | 34,703 | | | 18,528 | | | 27,155 | |
| K&N Parent, Inc.(m)(s)(v) | | S+825, 1.00% SOFR Floor | | 8/16/2027 | | Consumer Goods: Durable | | 5,441 | | | 5,441 | | | 5,244 | |
| K&N Parent, Inc.(m)(v) | | S+800, 1.00% SOFR Floor | | 2/16/2027 | | Consumer Goods: Durable | | 4,231 | | | 4,102 | | | 4,384 | |
| Klein Hersh, LLC(m)(s)(v) | | S+1313, 0.50% SOFR Floor | | 4/27/2027 | | Services: Business | | 21,918 | | | 21,918 | | | 18,795 | |
| KNB Holdings Corp.(m)(p)(u) | | L+550, 1.00% LIBOR Floor | | 4/26/2024 | | Consumer Goods: Durable | | 7,634 | | | 7,387 | | | 229 | |
| LAV Gear Holdings, Inc.(m)(n)(w) | | S+628, 1.00% SOFR Floor | | 10/31/2024 | | Services: Business | | 27,590 | | | 27,484 | | | 27,383 | |
| LAV Gear Holdings, Inc.(m)(n)(w) | | S+628, 1.00% SOFR Floor | | 10/31/2024 | | Services: Business | | 4,526 | | | 4,514 | | | 4,492 | |
| LGC US Finco, LLC(m)(v) | | S+650, 1.00% SOFR Floor | | 12/20/2025 | | Capital Equipment | | 11,226 | | | 11,053 | | | 11,226 | |
| Lift Brands, Inc.(m)(n)(q)(v) | | S+750, 1.00% SOFR Floor | | 6/29/2025 | | Services: Consumer | | 23,050 | | | 23,051 | | | 23,050 | |
| Lift Brands, Inc.(m)(n)(q)(s) | | 9.50% | | 6/29/2025 | | Services: Consumer | | 6,056 | | | 6,013 | | | 5,814 | |
| Lift Brands, Inc.(m)(n)(q)(s) | | 9.50% | | 6/29/2025 | | Services: Consumer | | 6,921 | | | 6,671 | | | 6,259 | |
| MacNeill Pride Group Corp.(m)(w) | | S+625, 1.00% SOFR Floor | | 4/22/2026 | | Services: Consumer | | 17,051 | | | 16,987 | | | 16,966 | |
| MacNeill Pride Group Corp.(m)(w) | | S+625, 1.00% SOFR Floor | | 4/22/2026 | | Services: Consumer | | 6,293 | | | 6,260 | | | 6,262 | |
| MacNeill Pride Group Corp. | | 1.00% Unfunded | | 4/30/2024 | | Services: Consumer | | 2,017 | | | (11) | | | (10) | |
| Manus Bio Inc. | | 13.00% | | 8/20/2026 | | Healthcare & Pharmaceuticals | | 11,094 | | | 11,043 | | | 11,094 | |
| Medplast Holdings, Inc.(m)(t) | | L+375, 0.00% LIBOR Floor | | 7/2/2025 | | Healthcare & Pharmaceuticals | | 4,961 | | | 4,801 | | | 4,914 | |
| Mimeo.com, Inc.(m)(w) | | L+640, 1.00% LIBOR Floor | | 12/21/2024 | | Media: Advertising, Printing & Publishing | | 21,638 | | | 21,638 | | | 21,638 | |
| Mimeo.com, Inc.(w) | | L+640, 1.00% LIBOR Floor | | 12/21/2024 | | Media: Advertising, Printing & Publishing | | 2,756 | | | 2,756 | | | 2,756 | |
| Mimeo.com, Inc. | | 1.00% Unfunded | | 12/21/2024 | | Media: Advertising, Printing & Publishing | | 2,500 | | | — | | | — | |
| Moss Holding Company(m)(n)(w) | | S+625, 1.00% SOFR Floor | | 4/17/2024 | | Services: Business | | 22,125 | | | 22,038 | | | 21,904 | |
See accompanying notes to consolidated financial statements.
CĪON Investment Corporation
Consolidated Schedule of Investments
December 31, 2023
(in thousands)
| | | | | | | | | | | | | | | | | | | | | | | | | | | | | | | | | | | | | | |
| Portfolio Company(a) | | Interest(b) | | Maturity | | Industry | | Principal/
Par Amount/
Units(e) | | Cost(d) | | Fair
Value(c) |
| Moss Holding Company | | 6.25% Unfunded | | 4/17/2024 | | Services: Business | | 106 | | | — | | | (1) | |
| Moss Holding Company | | 0.50% Unfunded | | 4/17/2024 | | Services: Business | | 2,126 | | | — | | | (21) | |
| | | | | | | | | | | | |
| NewsCycle Solutions, Inc.(m)(n)(w) | | S+700, 1.00% SOFR Floor | | 2/27/2024 | | Media: Advertising, Printing & Publishing | | 12,317 | | | 12,317 | | | 12,317 | |
| Nova Compression, LLC(m)(s)(v) | | S+1050, 2.00% SOFR Floor | | 10/13/2027 | | Energy: Oil & Gas | | 27,004 | | | 27,004 | | | 27,004 | |
| Nova Compression, LLC | | 1.00% Unfunded | | 10/13/2024 | | Energy: Oil & Gas | | 2,609 | | | — | | | — | |
| Nova Compression, LLC(s)(v) | | S+1050, 2.00% SOFR Floor | | 10/13/2027 | | Energy: Oil & Gas | | 652 | | | 652 | | | 652 | |
| NTM Acquisition Corp.(m)(w) | | S+675, 1.00% SOFR Floor | | 6/18/2026 | | Hotel, Gaming & Leisure | | 25,000 | | | 25,000 | | | 25,000 | |
| OpCo Borrower, LLC(m)(w) | | S+650, 1.00% SOFR Floor | | 8/19/2027 | | Healthcare & Pharmaceuticals | | 10,827 | | | 10,735 | | | 10,935 | |
| OpCo Borrower, LLC | | 0.50% Unfunded | | 8/19/2027 | | Healthcare & Pharmaceuticals | | 1,042 | | | — | | | 10 | |
| Optio Rx, LLC(m)(n)(u) | | L+900, 0.00% LIBOR Floor | | 6/28/2024 | | Healthcare & Pharmaceuticals | | 15,366 | | | 15,354 | | | 15,309 | |
| Optio Rx, LLC(n)(u) | | L+1200, 0.00% LIBOR Floor | | 6/28/2024 | | Healthcare & Pharmaceuticals | | 2,480 | | | 2,477 | | | 2,504 | |
| Pentec Acquisition Corp.(m)(v) | | S+600, 1.00% SOFR Floor | | 10/8/2026 | | Healthcare & Pharmaceuticals | | 24,500 | | | 24,351 | | | 24,500 | |
| PH Beauty Holdings III. Inc.(m)(w) | | S+500, 0.00% SOFR Floor | | 9/28/2025 | | Consumer Goods: Non-Durable | | 9,475 | | | 9,227 | | | 9,108 | |
| Playboy Enterprises, Inc.(h)(n)(s)(x) | | S+425, 0.50% SOFR Floor | | 5/25/2027 | | Consumer Goods: Non-Durable | | 19,689 | | | 19,372 | | | 18,926 | |
| PRA Acquisition, LLC(n)(w) | | S+650, 1.00% SOFR Floor | | 5/12/2028 | | Hotel, Gaming & Leisure | | 19,900 | | | 19,900 | | | 19,751 | |
| Project Castle, Inc.(m)(w) | | S+550, 0.50% SOFR Floor | | 6/1/2029 | | Capital Equipment | | 7,890 | | | 7,186 | | | 7,042 | |
| R. R. Donnelley & Sons Company(n)(v) | | S+725, 0.75% SOFR Floor | | 3/22/2028 | | Media: Advertising, Printing & Publishing | | 12,821 | | | 12,791 | | | 12,851 | |
| RA Outdoors, LLC(w) | | S+675, 1.00% SOFR Floor | | 4/8/2026 | | Media: Diversified & Production | | 677 | | | 600 | | | 677 | |
| RA Outdoors, LLC(m) | | S+675, 1.00% SOFR Floor | | 4/8/2026 | | Media: Diversified & Production | | 10,979 | | | 10,979 | | | 10,979 | |
| RA Outdoors, LLC | | 0.50% Unfunded | | 4/8/2026 | | Media: Diversified & Production | | 373 | | | — | | | — | |
| Retail Services WIS Corp.(m)(w) | | S+835, 1.00% SOFR Floor | | 5/20/2025 | | Services: Business | | 9,046 | | | 8,926 | | | 8,956 | |
| Robert C. Hilliard, L.L.P.(m)(s)(v) | | S+1200, 2.00% SOFR Floor | | 9/16/2024 | | Services: Consumer | | 2,149 | | | 2,149 | | | 2,130 | |
| Rogers Mechanical Contractors, LLC(m)(x) | | S+700, 1.00% SOFR Floor | | 9/9/2025 | | Construction & Building | | 14,930 | | | 14,930 | | | 14,911 | |
| Rogers Mechanical Contractors, LLC(m)(x) | | S+700, 1.00% SOFR Floor | | 9/9/2025 | | Construction & Building | | 881 | | | 881 | | | 880 | |
| | | | | | | | | | | | |
| | | | | | | | | | | | |
| Rogers Mechanical Contractors, LLC | | 0.75% Unfunded | | 9/9/2025 | | Construction & Building | | 2,404 | | | — | | | (3) | |
| RumbleOn, Inc.(m)(s)(w) | | S+875, 1.00% SOFR Floor | | 8/31/2026 | | Automotive | | 9,525 | | | 9,089 | | | 9,239 | |
| RumbleOn, Inc.(m)(s)(w) | | S+875, 1.00% SOFR Floor | | 8/31/2026 | | Automotive | | 2,875 | | | 2,858 | | | 2,788 | |
| Securus Technologies Holdings, Inc.(m)(s)(w) | | S+489, 1.00% SOFR Floor | | 11/1/2024 | | Telecommunications | | 3,865 | | | 3,627 | | | 3,623 | |
| Sequoia Healthcare Management, LLC(y) | | 12.75% | | 11/4/2023 | | Healthcare & Pharmaceuticals | | 8,525 | | | 8,540 | | | 7,289 | |
| Service Compression, LLC(m)(s)(v) | | S+1000, 1.00% SOFR Floor | | 5/6/2027 | | Energy: Oil & Gas | | 23,443 | | | 23,152 | | | 25,553 | |
| Service Compression, LLC(m)(s)(v) | | S+1000, 1.00% SOFR Floor | | 5/6/2027 | | Energy: Oil & Gas | | 7,036 | | | 6,948 | | | 7,669 | |
| Service Compression, LLC | | 0.50% Unfunded | | 5/6/2025 | | Energy: Oil & Gas | | 419 | | | — | | | 38 | |
| Sleep Opco, LLC(m)(w) | | S+650, 1.00% SOFR Floor | | 10/12/2026 | | Retail | | 13,635 | | | 13,469 | | | 13,635 | |
| Sleep Opco, LLC(m)(w) | | S+700, 1.00% SOFR Floor | | 10/12/2026 | | Retail | | 397 | | | 392 | | | 405 | |
| | | | | | | | | | | | |
| Sleep Opco, LLC | | 0.50% Unfunded | | 10/12/2026 | | Retail | | 1,750 | | | (20) | | | — | |
| Spinal USA, Inc. / Precision Medical Inc.(s)(u) | | L+950 | | 11/29/2024 | | Healthcare & Pharmaceuticals | | 15,453 | | | 15,398 | | | 8,576 | |
See accompanying notes to consolidated financial statements.
CĪON Investment Corporation
Consolidated Schedule of Investments
December 31, 2023
(in thousands)
| | | | | | | | | | | | | | | | | | | | | | | | | | | | | | | | | | | | | | |
| Portfolio Company(a) | | Interest(b) | | Maturity | | Industry | | Principal/
Par Amount/
Units(e) | | Cost(d) | | Fair
Value(c) |
| Spinal USA, Inc. / Precision Medical Inc.(s)(u) | | L+950 | | 11/29/2024 | | Healthcare & Pharmaceuticals | | 1,373 | | | 1,373 | | | 721 | |
| Spinal USA, Inc. / Precision Medical Inc.(s)(u) | | L+950 | | 11/29/2024 | | Healthcare & Pharmaceuticals | | 883 | | | 806 | | | 463 | |
| Spinal USA, Inc. / Precision Medical Inc.(s)(u) | | L+950 | | 11/29/2024 | | Healthcare & Pharmaceuticals | | 838 | | | 838 | | | 440 | |
| Spinal USA, Inc. / Precision Medical Inc.(s)(u) | | L+950 | | 11/29/2024 | | Healthcare & Pharmaceuticals | | 699 | | | 638 | | | 388 | |
| Spinal USA, Inc. / Precision Medical Inc.(s)(u) | | L+950 | | 11/29/2024 | | Healthcare & Pharmaceuticals | | 639 | | | 639 | | | 645 | |
| STATinMED, LLC(q)(s)(v) | | S+950, 2.00% SOFR Floor | | 7/1/2027 | | Healthcare & Pharmaceuticals | | 10,678 | | | 10,678 | | | 10,358 | |
| Stengel Hill Architecture, LLC(n)(w) | | S+650, 1.00% SOFR Floor | | 8/16/2028 | | Construction & Building | | 15,000 | | | 15,000 | | | 15,000 | |
| Tactical Air Support, Inc.(n)(v) | | S+850, 1.00% SOFR Floor | | 12/22/2028 | | Aerospace & Defense | | 12,000 | | | 12,000 | | | 12,000 | |
| Tactical Air Support, Inc. | | 0.75% Unfunded | | 12/23/2024 | | Aerospace & Defense | | 2,000 | | | — | | | — | |
| Thrill Holdings LLC(m)(v) | | S+650, 1.00% SOFR Floor | | 5/27/2027 | | Media: Diversified & Production | | 20,033 | | | 20,033 | | | 20,004 | |
| Thrill Holdings LLC | | 0.50% Unfunded | | 5/27/2027 | | Media: Diversified & Production | | 1,739 | | | — | | | 26 | |
| Thrill Holdings LLC | | 1.00% Unfunded | | 5/27/2024 | | Media: Diversified & Production | | 3,261 | | | — | | | 49 | |
| TMK Hawk Parent, Corp.(w) | | S+350, 1.00% SOFR Floor | | 8/28/2024 | | Services: Business | | 7,957 | | | 5,997 | | | 5,359 | |
| TMK Hawk Parent, Corp.(w) | | S+350, 1.00% SOFR Floor | | 8/28/2024 | | Services: Business | | 3,084 | | | 2,369 | | | 1,958 | |
| Trademark Global, LLC(m)(s)(v) | | S+750, 1.00% SOFR Floor | | 7/30/2024 | | Consumer Goods: Non-Durable | | 15,731 | | | 15,720 | | | 14,347 | |
| Trammell, P.C.(s)(v) | | S+1550, 2.00% SOFR Floor | | 4/28/2026 | | Services: Consumer | | 15,213 | | | 15,213 | | | 15,213 | |
| USALCO, LLC(m)(v) | | S+600, 1.00% SOFR Floor | | 10/19/2027 | | Chemicals, Plastics & Rubber | | 25,435 | | | 25,243 | | | 25,435 | |
| Williams Industrial Services Group, Inc.(p)(s)(w) | | S+1100, 1.00% SOFR Floor | | 12/16/2025 | | Services: Business | | 1,747 | | | 1,636 | | | 1,092 | |
| Williams Industrial Services Group, Inc.(p)(s)(w) | | S+1100, 1.00% SOFR Floor | | 12/16/2025 | | Services: Business | | 349 | | | 327 | | | 218 | |
| | | | | | | | | | | | |
| | | | | | | | | | | | |
| Wok Holdings Inc.(m)(v) | | S+625, 0.00% SOFR Floor | | 3/1/2026 | | Beverage, Food & Tobacco | | 24,844 | | | 24,291 | | | 24,673 | |
| WorkGenius, Inc.(m)(w) | | S+750, 1.00% SOFR Floor | | 6/7/2027 | | Services: Business | | 14,821 | | | 14,821 | | | 14,821 | |
| WorkGenius, Inc.(w) | | S+750, 1.00% SOFR Floor | | 6/7/2027 | | Services: Business | | 750 | | | 738 | | | 750 | |
| WorkGenius, Inc.(m)(w) | | S+750, 1.00% SOFR Floor | | 6/7/2027 | | Services: Business | | 3,500 | | | 3,500 | | | 3,500 | |
| Xenon Arc, Inc.(m)(w) | | S+575, 0.75% SOFR Floor | | 12/17/2027 | | High Tech Industries | | 3,876 | | | 3,844 | | | 3,876 | |
| Yak Access, LLC(m)(n)(w) | | S+640, 1.00% SOFR Floor | | 3/10/2028 | | Construction & Building | | 20,592 | | | 18,768 | | | 20,618 | |
| Total Senior Secured First Lien Debt | | | | | | | | | | 1,604,111 | | | 1,565,171 | |
Senior Secured Second Lien Debt - 3.3% | | | | | | | | | | | | |
| Global Tel*Link Corp.(n)(w) | | S+1000, 0.00% SOFR Floor | | 11/29/2026 | | Telecommunications | | 11,500 | | | 11,401 | | | 11,414 | |
| OpCo Borrower, LLC(m) | | 12.50% | | 2/19/2028 | | Healthcare & Pharmaceuticals | | 12,500 | | | 11,795 | | | 11,813 | |
| RA Outdoors, LLC(m)(w) | | S+900, 1.00% SOFR Floor | | 10/8/2026 | | Media: Diversified & Production | | 1,809 | | | 1,809 | | | 1,820 | |
| Securus Technologies Holdings, Inc.(s)(w) | | S+891, 1.00% SOFR Floor | | 11/1/2025 | | Telecommunications | | 2,999 | | | 2,990 | | | 2,591 | |
| TMK Hawk Parent, Corp.(p)(w) | | S+800, 1.00% SOFR Floor | | 8/26/2025 | | Services: Business | | 13,393 | | | 13,285 | | | 1,473 | |
| Total Senior Secured Second Lien Debt | | | | | | | | | | 41,280 | | | 29,111 | |
Collateralized Securities and Structured Products - Equity - 0.1% | | | | | | | | | | |
| APIDOS CLO XVI Subordinated Notes(g)(h) | | 0.00% Estimated Yield | | 1/19/2025 | | Diversified Financials | | 9,000 | | | 1,217 | | | 20 | |
| Galaxy XV CLO Ltd. Class A Subordinated Notes(g)(h) | | 19.30% Estimated Yield | | 4/15/2025 | | Diversified Financials | | 4,000 | | | 1,145 | | | 1,076 | |
| Total Collateralized Securities and Structured Products - Equity | | | | | | | | 2,362 | | | 1,096 | |
Unsecured Debt - 1.5% | | | | | | | | | | | | |
| Lucky Bucks Holdings LLC(p)(s) | | 12.50% | | 5/26/2028 | | Hotel, Gaming & Leisure | | 25,308 | | | 22,860 | | | 4,135 | |
See accompanying notes to consolidated financial statements.
CĪON Investment Corporation
Consolidated Schedule of Investments
December 31, 2023
(in thousands)
| | | | | | | | | | | | | | | | | | | | | | | | | | | | | | | | | | | | | | |
| Portfolio Company(a) | | Interest(b) | | Maturity | | Industry | | Principal/
Par Amount/
Units(e) | | Cost(d) | | Fair
Value(c) |
| WPLM Acquisition Corp.(s) | | 15.00% | | 11/24/2025 | | Media: Advertising, Printing & Publishing | | 8,872 | | | 8,833 | | | 8,739 | |
| Total Unsecured Debt | | | | | | | | | | 31,693 | | | 12,874 | |
Equity - 26.4% | | | | | | | | | | | | |
ARC Financial Partners, LLC, Membership Interests (25% ownership)(o)(q) | | | | | | Metals & Mining | | NA | | — | | | — | |
| Ascent Resources - Marcellus, LLC, Membership Units(o) | | | | | | Energy: Oil & Gas | | 511,255 Units | | 1,642 | | | 971 | |
| | | | | | | | | | | | |
| Carestream Health Holdings, Inc., Common Stock(o)(q) | | | | | | Healthcare & Pharmaceuticals | | 614,368 Units | | 21,758 | | | 21,386 | |
| CF Arch Holdings LLC, Class A Units(o) | | | | | | Services: Business | | 380,952 Units | | 381 | | | 606 | |
| CION/EagleTree Partners, LLC, Participating Preferred Shares(h)(r) | | | | | | Diversified Financials | | 22,072,841 Units | | 22,073 | | | 25,039 | |
CION/EagleTree Partners, LLC, Membership Units (85% ownership)(h)(o)(r) | | | | | | Diversified Financials | | NA | | — | | | — | |
| | | | | | | | | | | | |
| | | | | | | | | | | | |
| David's Bridal Holdings, LLC, Preferred Units(o)(r) | | | | | | Retail | | 1,000 Units | | 10,820 | | | 12,494 | |
| | | | | | | | | | | | |
| David's Bridal Holdings, LLC, Common Units(o)(r) | | | | | | Retail | | 900,000 Units | | 23,130 | | | 41,418 | |
| | | | | | | | | | | | |
| FWS Parent Holdings, LLC, Class A Membership Interests(o) | | | | | | Services: Business | | 35,242 Units | | 800 | | | 434 | |
| GSC Technologies Inc., Common Shares(o)(q) | | | | | | Chemicals, Plastics & Rubber | | 807,268 Units | | — | | | 1,251 | |
| Heritage Litigation Trust, Restricted Stock(o) | | | | | | Energy: Oil & Gas | | 238,375 Units | | 119 | | | 132 | |
| IPP Buyer Holdings, LLC, Class A Units(o)(q) | | | | | | Retail | | 8,888,354 Units | | 10,740 | | | 11,910 | |
| Instant Web Holdings, LLC, Class A Common Units(o)(q) | | | | | | Media: Advertising, Printing & Publishing | | 10,819 Units | | — | | | — | |
| Isagenix Worldwide, Inc., Common Shares(o)(q) | | | | | | Beverage, Food & Tobacco | | 601,941 Units | | 8,987 | | | 8,404 | |
| | | | | | | | | | | | |
| | | | | | | | | | | | |
| K&N Holdco, LLC, Membership Units(o) | | | | | | Consumer Goods: Durable | | 458,364 Units | | 8,356 | | | 6,061 | |
| Language Education Holdings GP LLC, Common Units(o) | | | | | | Services: Business | | 366,667 Units | | — | | | — | |
| Language Education Holdings LP, Ordinary Common Units(o) | | | | | | Services: Business | | 366,667 Units | | 825 | | | 1,382 | |
| Longview Intermediate Holdings C, LLC, Membership Units(q) | | | | | | Energy: Oil & Gas | | 653,989 Units | | 2,704 | | | 21,726 | |
| | | | | | | | | | | | |
Macquarie Capital Funding LLC(i)(o) | | | | | | Hotel, Gaming & Leisure | | 123,568 Units | | 4,200 | | | 2,020 | |
| Mount Logan Capital Inc., Common Stock(f)(h)(q) | | | | | | Banking, Finance, Insurance & Real Estate | | 1,075,557 Units | | 3,534 | | | 1,624 | |
| New Giving Acquisition, Inc., Warrants(o) | | | | 8/19/2029 | | Healthcare & Pharmaceuticals | | 4,630 Units | | 633 | | | 2,686 | |
| New HW Holdings Corp., Common Stock(o) | | | | | | Capital Equipment | | 133 Units | | — | | | — | |
| NS NWN Acquisition, LLC, Class A Preferred Units(o) | | | | | | High Tech Industries | | 111 Units | | 110 | | | 4,051 | |
| NS NWN Acquisition, LLC, Common Equity(o) | | | | | | High Tech Industries | | 346 Units | | 393 | | | — | |
| NS NWN Holdco LLC, Non-Voting Units(o) | | | | | | High Tech Industries | | 522 Units | | 504 | | | 893 | |
| NSG Co-Invest (Bermuda) LP, Partnership Interests(h)(o) | | | | | | Consumer Goods: Durable | | 1,575 Units | | 1,000 | | | 962 | |
| Palmetto Clean Technology, Inc., Warrants(o) | | | | | | High Tech Industries | | 724,112 Units | | 471 | | | 2,773 | |
| Reorganized Heritage TopCo, LLC, Common Stock(o) | | | | | | Energy: Oil & Gas | | 201,249 Units | | 7,225 | | | 7,737 | |
| RumbleOn, Inc., Warrants(o) | | | | 8/14/2028 | | Automotive | | 60,606 Units | | 378 | | | 376 | |
| Service Compression, LLC, Warrants(o) | | | | | | Energy: Oil & Gas | | N/A | | 509 | | | 1,426 | |
| Snap Fitness Holdings, Inc., Class A Common Stock(o)(q) | | | | | | Services: Consumer | | 9,858 Units | | 3,078 | | | 4,653 | |
| Snap Fitness Holdings, Inc., Warrants(o)(q) | | | | | | Services: Consumer | | 3,996 Units | | 1,247 | | | 1,886 | |
| SRA Holdings, LLC, Membership Units(m)(o)(q) | | | | | | Banking, Finance, Insurance & Real Estate | | 224,865 Units | | 23,611 | | | 25,515 | |
| STATinMed Parent, LLC, Class A Preferred Units(o)(q) | | | | | | Healthcare & Pharmaceuticals | | 6,182 Units | | 6,182 | | | 2,018 | |
| STATinMed Parent, LLC, Class B Preferred Units(o)(q) | | | | | | Healthcare & Pharmaceuticals | | 51,221 Units | | 3,193 | | | — | |
See accompanying notes to consolidated financial statements.
CĪON Investment Corporation
Consolidated Schedule of Investments
December 31, 2023
(in thousands)
| | | | | | | | | | | | | | | | | | | | | | | | | | | | | | | | | | |
| Portfolio Company(a) | | Interest | | | | Industry | | Principal/
Par Amount/
Units(e) | | Cost(d) | | Fair
Value(c) |
| URS Topco, LLC, Common Equity(o) | | | | | | Transportation: Cargo | | 430,540 Units | | 9,669 | | | 12,201 | |
| WorkGenius, LLC, Class A Units(o) | | | | | | Services: Business | | 500 Units | | 500 | | | 584 | |
| Yak Holding II, LLC, Series A Preferred Units(o) | | | | | | Construction & Building | | 4,000,000 Units | | 2,000 | | | 4,000 | |
| Yak Holding II, LLC, Series B-1 Preferred Units(o) | | | | | | Construction & Building | | 1,966,018 Units | | 1,966 | | | 1,986 | |
| Yak Holding II, LLC, Series A Common Units(o) | | | | | | Construction & Building | | 127,419 Units | | — | | | 1,967 | |
| Total Equity | | | | | | | | | | 182,738 | | | 232,572 | |
Short Term Investments - 12.9%(k) | | | | | | | | | | | | |
| First American Treasury Obligations Fund, Class Z Shares | | 5.24%(l) | | | | | | | | 113,446 | | | 113,446 | |
| Total Short Term Investments | | | | | | | | | | 113,446 | | | 113,446 | |
TOTAL INVESTMENTS - 222.2% | | | | | | | | | | $ | 1,975,630 | | | 1,954,270 | |
LIABILITIES IN EXCESS OF OTHER ASSETS - (122.2)% | | | | | | | | | | (1,074,707) | |
NET ASSETS - 100.0% | | | | | | | | | | | | $ | 879,563 | |
a.All of the Company’s investments are issued by eligible U.S. portfolio companies, as defined in the Investment Company Act of 1940, as amended, or the 1940 Act, except for investments specifically identified as non-qualifying per note h. below. Unless specifically identified in note s. below, investments do not contain a paid-in-kind, or PIK, interest provision.
b.The actual Secured Overnight Financing Rate, or SOFR, rate for each loan listed may not be the applicable SOFR rate as of December 31, 2023, as the loan may have been priced or repriced based on a SOFR rate prior to or subsequent to December 31, 2023. The actual London Interbank Offered Rate, or LIBOR, rate for each loan listed may not be the applicable LIBOR rate as of December 31, 2023, as the loan may have been priced or repriced based on a LIBOR rate prior to or subsequent to December 31, 2023.
c.Fair value determined in good faith by the Company’s board of directors (see Note 9), including via delegation to CIM as the Company’s valuation designee (see Note 2), using significant unobservable inputs unless otherwise noted.
d.Represents amortized cost for debt securities and cost for equity investments.
e.Denominated in U.S. dollars unless otherwise noted.
f.Fair value determined using level 1 inputs.
g.The CLO subordinated notes are considered equity positions in the CLO vehicles and are not rated. Equity investments are entitled to recurring distributions, which are generally equal to the remaining cash flow of the payments made by the underlying vehicle's securities less contractual payments to debt holders and expenses. The estimated yield indicated is based upon a current projection of the amount and timing of these recurring distributions and the estimated amount of repayment of principal upon termination. Such projections are periodically reviewed and adjusted, and the estimated yield may not ultimately be realized.
h.The investment or a portion thereof is not a qualifying asset under the 1940 Act. A business development company may not acquire any asset other than qualifying assets, unless, at the time the acquisition is made, qualifying assets represent at least 70% of the company’s total assets as defined under Section 55 of the 1940 Act. As of December 31, 2023, 94.6% of the Company’s total assets represented qualifying assets.
i.The Company has entered into a proceeds agreement with Macquarie Capital Funding LLC, or Macquarie, in which any proceeds received by Macquarie from an underlying first lien term loan were passed onto the Company. The underlying first lien term loan was subsequently exchanged for common shares of the underlying portfolio company. Macquarie's obligations under the proceeds agreement are not secured by any collateral. The industry and other investment characteristics reflect the terms of the underlying equity security.
j.In addition to the interest earned based on the stated interest rate of this loan, which is the amount reflected in this schedule, the Company may be entitled to receive additional residual amounts.
k.Short term investments represent an investment in a fund that invests in highly liquid investments with average original maturity dates of three months or less.
l.7-day effective yield as of December 31, 2023.
m.Investment or a portion thereof held within the Company’s wholly-owned consolidated subsidiary, 34th Street Funding, LLC, or 34th Street, and was pledged as collateral supporting the amounts outstanding under the credit facility with JPMorgan Chase Bank, National Association, or JPM, as of December 31, 2023 (see Note 8).
n.Investment or a portion thereof held within the Company’s wholly-owned consolidated subsidiary, Murray Hill Funding II, LLC, or Murray Hill Funding II, and was pledged as collateral supporting the amounts outstanding under the repurchase agreement with UBS AG, or UBS, as of December 31, 2023 (see Note 8).
o.Non-income producing security.
See accompanying notes to consolidated financial statements.
CĪON Investment Corporation
Consolidated Schedule of Investments
December 31, 2023
(in thousands)
p.Investment or a portion thereof was on non-accrual status as of December 31, 2023.
q.Investment determined to be an affiliated investment as defined in the 1940 Act as the Company owns between 5% and 25% of the portfolio company’s outstanding voting securities but does not control the portfolio company. Fair value as of December 31, 2022 and December 31, 2023, along with transactions during the year ended December 31, 2023 in these affiliated investments, were as follows:
| | | | | | | | | | | | | | | | | | | | | | | | | | | | | | | | | | | | | | | | | | | | | | | | | | | | | | | | |
| | | | Year Ended December 31, 2023 | | | | Year Ended December 31, 2023 |
| Non-Controlled, Affiliated Investments | | Fair Value at
December 31, 2022 | | Gross
Additions
(Cost)(1) | | Gross
Reductions
(Cost)(2) | | Net Unrealized Gain (Loss) | | Fair Value at December 31, 2023 | | Net Realized Gain (Loss) | | Interest
Income(3) | | Dividend Income | | Fee Income |
| Afore Insurance Services, LLC | | | | | | | | | | | | | | | | | | |
| First Lien Term Loan | | $ | — | | | $ | 4,583 | | | $ | — | | | $ | — | | | $ | 4,583 | | | $ | — | | | $ | 405 | | | $ | — | | | $ | — | |
| | | | | | | | | | | | | | | | | | |
| ARC Financial, LLC | | | | | | | | | | | | | | | | | | |
| Membership Interests | | — | | | — | | | — | | | — | | | — | | | — | | | — | | | 25 | | | — | |
| | | | | | | | | | | | | | | | | | |
| | | | | | | | | | | | | | | | | | |
| | | | | | | | | | | | | | | | | | |
| | | | | | | | | | | | | | | | | | |
| Carestream Health, Inc. | | | | | | | | | | | | | | | | | | |
| First Lien Term Loan | | 7,539 | | | 2,976 | | | (115) | | | 1,023 | | | 11,423 | | | — | | | 1,373 | | | — | | | — | |
| Carestream Health Holdings Inc. | | | | | | | | | | | | | | | | | | |
| Common Shares | | 21,544 | | | — | | | — | | | (158) | | | 21,386 | | | — | | | — | | | — | | | — | |
| | | | | | | | | | | | | | | | | | |
| | | | | | | | | | | | | | | | | | |
| | | | | | | | | | | | | | | | | | |
| | | | | | | | | | | | | | | | | | |
| | | | | | | | | | | | | | | | | | |
| DESG Holdings, Inc. | | | | | | | | | | | | | | | | | | |
| First Lien Term Loan | | 246 | | | — | | | (82) | | | (79) | | | 85 | | | — | | | — | | | — | | | — | |
| | | | | | | | | | | | | | | | | | |
| | | | | | | | | | | | | | | | | | |
| | | | | | | | | | | | | | | | | | |
| | | | | | | | | | | | | | | | | | |
| GSC Technologies Inc. | | | | | | | | | | | | | | | | | | |
| Incremental Term Loan | | 154 | | | 6 | | | (160) | | | — | | | — | | | — | | | 11 | | | — | | | — | |
| First Lien Term Loan A | | 2,064 | | | 27 | | | (297) | | | 189 | | | 1,983 | | | — | | | 279 | | | — | | | — | |
| First Lien Term Loan B | | 388 | | | 103 | | | — | | | 451 | | | 942 | | | — | | | 112 | | | — | | | — | |
| Common Shares | | — | | | — | | | — | | | 1,251 | | | 1,251 | | | — | | | — | | | — | | | — | |
| Instant Web, LLC | | | | | | | | | | | | | | | | | | |
| Revolving Loan | | 321 | | | 2,587 | | | — | | | (76) | | | 2,832 | | | — | | | 247 | | | — | | | — | |
| Priming Term Loan | | 469 | | | 39 | | | — | | | 5 | | | 513 | | | — | | | 57 | | | — | | | — | |
| First Lien Term Loan | | 28,167 | | | 5,166 | | | — | | | (4,778) | | | 28,555 | | | — | | | 5,188 | | | — | | | — | |
| First Lien Delayed Draw Term Loan | | — | | | 1,082 | | | — | | | (69) | | | 1,013 | | | — | | | 42 | | | — | | | — | |
| Instant Web Holdings, LLC | | | | | | | | | | | | | | | | | | |
| Class A Common Units | | — | | | — | | | — | | | — | | | — | | | — | | | — | | | — | | | — | |
| IPP Buyer Holdings, LLC | | | | | | | | | | | | | | | | | | |
| Class A Units | | — | | | 10,740 | | | — | | | 1,170 | | | 11,910 | | | — | | | — | | | — | | | — | |
| Isagenix International, LLC | | | | | | | | | | | | | | | | | | |
| First Lien Term Loan | | — | | | 8,583 | | | — | | | (65) | | | 8,518 | | | — | | | 647 | | | — | | | 477 | |
| Isagenix Worldwide, Inc. | | | | | | | | | | | | | | | | | | |
| Common Shares | | — | | | 8,987 | | | — | | | (583) | | | 8,404 | | | — | | | — | | | — | | | — | |
| Lift Brands, Inc. | | | | | | | | | | | | | | | | | | |
| Term Loan A | | 23,287 | | | — | | | (236) | | | (1) | | | 23,050 | | | — | | | 2,965 | | | — | | | 64 | |
| Term Loan B | | 5,154 | | | 523 | | | — | | | 137 | | | 5,814 | | | — | | | 572 | | | — | | | — | |
| Term Loan C | | 4,732 | | | 1,724 | | | — | | | (197) | | | 6,259 | | | — | | | 741 | | | — | | | 1,891 | |
| Longview Intermediate Holdings C, LLC | | | | | | | | | | | | | | | | | | |
| Membership Units | | 23,995 | | | — | | | — | | | (2,269) | | | 21,726 | | | — | | | — | | | 3,881 | | | — | |
| Longview Power, LLC | | | | | | | | | | | | | | | | | | |
| First Lien Term Loan | | 2,348 | | | 6 | | | (1,396) | | | (958) | | | — | | | — | | | 1,306 | | | — | | | — | |
| Mount Logan Capital Inc. | | | | | | | | | | | | | | | | | | |
| Common Stock | | 2,341 | | | — | | | — | | | (717) | | | 1,624 | | | — | | | — | | | 40 | | | — | |
| | | | | | | | | | | | | | | | | | |
| | | | | | | | | | | | | | | | | | |
| | | | | | | | | | | | | | | | | | |
| | | | | | | | | | | | | | | | | | |
| | | | | | | | | | | | | | | | | | |
| Snap Fitness Holdings, Inc. | | | | | | | | | | | | | | | | | | |
| Class A Stock | | 5,123 | | | — | | | — | | | (470) | | | 4,653 | | | — | | | — | | | — | | | — | |
| Warrants | | 2,077 | | | — | | | — | | | (191) | | | 1,886 | | | — | | | — | | | — | | | — | |
| SRA Holdings, LLC | | | | | | | | | | | | | | | | | | |
| Membership Units | | — | | | 23,611 | | | — | | | 1,904 | | | 25,515 | | | — | | | — | | | — | | | — | |
| STATinMED, LLC | | | | | | | | | | | | | | | | | | |
| First Lien Term Loan | | 9,107 | | | 1,456 | | | — | | | (205) | | | 10,358 | | | — | | | 1,485 | | | — | | | — | |
| Delayed Draw First Lien Term Loan | | 156 | | | 6 | | | (159) | | | (3) | | | — | | | — | | | 10 | | | — | | | — | |
| STATinMed Parent, LLC | | | | | | | | | | | | | | | | | | |
| Class A Preferred Units | | 4,530 | | | — | | | — | | | (2,512) | | | 2,018 | | | — | | | — | | | — | | | — | |
| Class B Preferred Units | | 134 | | | — | | | — | | | (134) | | | — | | | — | | | — | | | — | | | — | |
| Totals | | $ | 143,876 | | | $ | 72,205 | | | $ | (2,445) | | | $ | (7,335) | | | $ | 206,301 | | | $ | — | | | $ | 15,440 | | | $ | 3,946 | | | $ | 2,432 | |
See accompanying notes to consolidated financial statements.
CĪON Investment Corporation
Consolidated Schedule of Investments
December 31, 2023
(in thousands)
(1)Gross additions include increases in the cost basis of investments resulting from new portfolio investments, PIK interest, the amortization of unearned income, the exchange of one or more existing securities for one or more new securities and the movement of an existing portfolio company into this category from a different category.
(2)Gross reductions include decreases in the cost basis of investments resulting from principal collections related to investment repayments or sales, the exchange of one or more existing securities for one or more new securities and the movement of an existing portfolio company out of this category into a different category.
(3)Includes PIK interest income.
r.Investment determined to be a controlled investment as defined in the 1940 Act as the Company is deemed to exercise a controlling influence over the management or policies of the portfolio company due to beneficially owning, either directly or through one or more controlled companies, more than 25% of the outstanding voting securities of such portfolio company. Fair value as of December 31, 2022 and December 31, 2023, along with transactions during the year ended December 31, 2023 in these controlled investments, were as follows:
| | | | | | | | | | | | | | | | | | | | | | | | | | | | | | | | | | | | | | | | | | | | | | | | | | | | | | | | |
| | | | Year Ended December 31, 2023 | | | | Year Ended December 31, 2023 |
| Controlled Investments | | Fair Value at
December 31, 2022 | | Gross
Additions
(Cost)(1) | | Gross
Reductions
(Cost)(2) | | Net
Unrealized
Gain (Loss) | | Fair Value at December 31, 2023 | | Net Realized
Gain (Loss) | | Interest
Income(3) | | Dividend Income | | Fee Income |
| CION/EagleTree Partners, LLC | | | | | | | | | | | | | | | | | | |
| Senior Secured Note | | $ | 60,348 | | | $ | 4,771 | | | $ | (5,521) | | | $ | — | | | $ | 59,598 | | | $ | — | | | $ | 7,843 | | | $ | — | | | $ | — | |
| Participating Preferred Shares | | 30,766 | | | — | | | — | | | (5,727) | | | 25,039 | | | — | | | — | | | 4,250 | | | — | |
| Common Shares | | — | | | — | | | — | | | — | | | — | | | — | | | — | | | — | | | — | |
| David's Bridal, Inc. | | | | | | | | | | | | | | | | | | |
| Exit First Lien Term Loan | | — | | | 22,050 | | | — | | | — | | | 22,050 | | | — | | | 1,205 | | | — | | | 1,050 | |
| Incremental First Lien Term Loan | | — | | | 17,033 | | | — | | | (339) | | | 16,694 | | | — | | | 92 | | | — | | | 341 | |
| David's Bridal Holdings, LLC | | | | | | | | | | | | | | | | | | |
| Preferred Units | | — | | | 10,820 | | | — | | | 1,674 | | | 12,494 | | | — | | | — | | | — | | | — | |
| Common Units | | — | | | 23,130 | | | — | | | 18,288 | | | 41,418 | | | — | | | — | | | — | | | — | |
| Totals | | $ | 91,114 | | | $ | 77,804 | | | $ | (5,521) | | | $ | 13,896 | | | $ | 177,293 | | | $ | — | | | $ | 9,140 | | | $ | 4,250 | | | $ | 1,391 | |
(1)Gross additions include increases in the cost basis of investments resulting from new portfolio investments, PIK interest, the amortization of unearned income, the exchange of one or more existing securities for one or more new securities and the movement of an existing portfolio company into this category from a different category.
(2)Gross reductions include decreases in the cost basis of investments resulting from principal collections related to investment repayments or sales, the exchange of one or more existing securities for one or more new securities and the movement of an existing portfolio company out of this category into a different category.
(3)Includes PIK interest income.
See accompanying notes to consolidated financial statements.
CĪON Investment Corporation
Consolidated Schedule of Investments
December 31, 2023
(in thousands)
s.As of December 31, 2023, the below investments contain a PIK interest provision whereby the issuer has either the option or the obligation to make interest payments with the issuance of additional securities. For certain investments, the borrower may toggle between cash and PIK interest payments.
| | | | | | | | | | | | | | | | | | | | | | | | | | |
| | | | | Interest Rate |
| Portfolio Company | | Investment Type | | Cash | | PIK | | All-in-Rate |
| | | | | | | | |
| American Clinical Solutions LLC | | Senior Secured First Lien Debt | | 7.15% | | 5.35% | | 12.50% |
| | | | | | | | |
| | | | | | | | |
| Anthem Sports & Entertainment Inc. | | Senior Secured First Lien Debt | | 3.00% | | 12.11% | | 15.11% |
| Celerity Acquisition Holdings, LLC | | Senior Secured First Lien Debt | | 10.00% | | 4.05% | | 14.05% |
| Cennox, Inc. | | Senior Secured First Lien Debt | | 11.65% | | 0.25% | | 11.90% |
| CION/EagleTree Partners, LLC | | Senior Secured Note | | — | | 14.00% | | 14.00% |
| Community Tree Service, LLC | | Senior Secured First Lien Debt | | 14.00% | | 2.50% | | 16.50% |
| | | | | | | | |
| | | | | | | | |
| | | | | | | | |
| Deluxe Entertainment Services, Inc. | | Senior Secured First Lien Debt | | 12.50% | | 1.50% | | 14.00% |
| FuseFX, LLC | | Senior Secured First Lien Debt | | 6.47% | | 5.00% | | 11.47% |
| | | | | | | | |
| GSC Technologies Inc. | | Senior Secured First Lien Debt | | — | | 10.51% | | 10.51% |
| Hilliard, Martinez & Gonzales, LLP | | Senior Secured First Lien Debt | | — | | 17.46% | | 17.46% |
| Homer City Generation, L.P. | | Senior Secured First Lien Debt | | — | | 15.00% | | 15.00% |
| Homer City Generation, L.P. | | Senior Secured First Lien Debt | | — | | 17.00% | | 17.00% |
| Inotiv, Inc. | | Senior Secured First Lien Debt | | 11.96% | | 0.25% | | 12.21% |
| Instant Web, LLC | | Senior Secured First Lien Debt | | — | | 12.47% | | 12.47% |
| | | | | | | | |
| | | | | | | | |
| | | | | | | | |
| Isagenix International, LLC | | Senior Secured First Lien Debt | | 2.50% | | 8.54% | | 11.04% |
| K&N Parent, Inc. | | Senior Secured First Lien Debt | | 8.72% | | 5.00% | | 13.72% |
| Klein Hersh, LLC | | Senior Secured First Lien Debt | | 6.74% | | 12.00% | | 18.74% |
| | | | | | | | |
| | | | | | | | |
| Lift Brands, Inc. | | Senior Secured First Lien Debt | | — | | 9.50% | | 9.50% |
| Lucky Bucks Holdings LLC | | Unsecured Note | | — | | 12.50% | | 12.50% |
| | | | | | | | |
| | | | | | | | |
| Nova Compression, LLC | | Senior Secured First Lien Debt | | 12.61% | | 3.25% | | 15.86% |
| Playboy Enterprises, Inc. | | Senior Secured First Lien Debt | | 6.50% | | 3.25% | | 9.75% |
| Robert C. Hilliard, L.L.P. | | Senior Secured First Lien Debt | | — | | 17.44% | | 17.44% |
| | | | | | | | |
| RumbleOn, Inc. | | Senior Secured First Lien Debt | | 13.86% | | 0.50% | | 14.36% |
| Securus Technologies Holdings, Inc. | | Senior Secured First Lien Debt | | 6.61% | | 3.89% | | 10.50% |
| Securus Technologies Holdings, Inc. | | Senior Secured Second Lien Debt | | 6.61% | | 7.65% | | 14.26% |
| Service Compression, LLC | | Senior Secured First Lien Debt | | 13.46% | | 2.00% | | 15.46% |
| Spinal USA, Inc. / Precision Medical Inc. | | Senior Secured First Lien Debt | | — | | 15.16% | | 15.16% |
| STATinMED, LLC | | Senior Secured First Lien Debt | | — | | 14.96% | | 14.96% |
| Trademark Global, LLC | | Senior Secured First Lien Debt | | 11.11% | | 1.75% | | 12.86% |
| Trammell, P.C. | | Senior Secured First Lien Debt | | — | | 20.86% | | 20.86% |
| Williams Industrial Services Group, Inc. | | Senior Secured First Lien Debt | | 10.00% | | 6.18% | | 16.18% |
| WPLM Acquisition Corp. | | Unsecured Note | | — | | 15.00% | | 15.00% |
| | | | | | | | |
| | | | | | | | |
| | | | | | | | |
| | | | | | | | |
t.The interest rate on these loans is subject to 1 month LIBOR, which as of December 31, 2023 was 5.47%.
u.The interest rate on these loans is subject to 3 month LIBOR, which as of December 31, 2023 was 5.59%.
v.The interest rate on these loans is subject to 1 month SOFR, which as of December 31, 2023 was 5.35%.
w.The interest rate on these loans is subject to 3 month SOFR, which as of December 31, 2023 was 5.33%.
x.The interest rate on these loans is subject to 6 month SOFR, which as of December 31, 2023 was 5.16%.
y.While the maturity date of this loan has passed, the Company expects all interest and principal to be collected.
See accompanying notes to consolidated financial statements.
CĪON Investment Corporation
Consolidated Schedule of Investments
December 31, 2022
(in thousands)
| | | | | | | | | | | | | | | | | | | | | | | | | | | | | | | | | | | | | | |
| Portfolio Company(a) | | Interest(b) | | Maturity | | Industry | | Principal/
Par Amount/
Units(e) | | Cost(d) | | Fair
Value(c) |
Senior Secured First Lien Debt - 178.8% | | | | | | | | | | | | |
| Adapt Laser Acquisition, Inc.(t)(x) | | L+1200, 1.00% LIBOR Floor | | 12/31/2023 | | Capital Equipment | | $ | 11,047 | | | $ | 11,048 | | | $ | 10,329 | |
| Adapt Laser Acquisition, Inc.(t)(x) | | L+1200, 1.00% LIBOR Floor | | 12/31/2023 | | Capital Equipment | | 2,072 | | | 2,072 | | | 1,875 | |
| AHF Parent Holding, Inc.(n)(aa) | | S+625, 0.75% SOFR Floor | | 2/1/2028 | | Construction & Building | | 2,944 | | | 2,891 | | | 2,771 | |
| Allen Media, LLC(n)(aa) | | S+550, 0.00% SOFR Floor | | 2/10/2027 | | Media: Diversified & Production | | 8,863 | | | 8,793 | | | 8,420 | |
| ALM Media, LLC(m)(n)(x) | | L+650, 1.00% LIBOR Floor | | 11/25/2024 | | Media: Advertising, Printing & Publishing | | 17,000 | | | 16,855 | | | 17,000 | |
| American Clinical Solutions LLC(m)(t)(w) | | L+700, 1.00% LIBOR Floor | | 12/31/2024 | | Healthcare & Pharmaceuticals | | 4,250 | | | 4,250 | | | 4,122 | |
| American Consolidated Natural Resources, Inc.(m)(t)(x) | | L+1600, 1.00% LIBOR Floor | | 9/16/2025 | | Metals & Mining | | 47 | | | 35 | | | 47 | |
| American Health Staffing Group, Inc.(m)(y) | | L+600, 1.00% LIBOR Floor | | 11/19/2026 | | Services: Business | | 16,542 | | | 16,407 | | | 16,542 | |
| American Health Staffing Group, Inc. | | 0.50% Unfunded | | 11/19/2026 | | Services: Business | | 3,333 | | | (26) | | | — | |
| American Teleconferencing Services, Ltd.(o)(q) | | 0.50% Unfunded | | 1/31/23 | | Telecommunications | | 235 | | | — | | | — | |
| American Teleconferencing Services, Ltd.(q) | | Prime+550 | | 1/31/23 | | Telecommunications | | 3,116 | | | 3,116 | | | 156 | |
| Analogic Corp.(m)(n)(x) | | L+525, 1.00% LIBOR Floor | | 6/21/2024 | | Healthcare & Pharmaceuticals | | 4,850 | | | 4,823 | | | 4,795 | |
| Ancile Solutions, Inc.(m)(t)(x) | | L+1000, 1.00% LIBOR Floor | | 6/11/2026 | | High Tech Industries | | 11,967 | | | 11,681 | | | 11,608 | |
| Anthem Sports & Entertainment Inc.(m)(t)(x) | | L+950, 1.00% LIBOR Floor | | 11/15/2026 | | Media: Diversified & Production | | 36,914 | | | 36,749 | | | 35,161 | |
| Anthem Sports & Entertainment Inc.(x) | | L+950, 1.00% LIBOR Floor | | 11/15/2026 | | Media: Diversified & Production | | 3,000 | | | 3,000 | | | 2,857 | |
| Anthem Sports & Entertainment Inc. | | 0.50% Unfunded | | 11/15/2026 | | Media: Diversified & Production | | 167 | | | — | | | (8) | |
| Appalachian Resource Company, LLC(w) | | L+500, 1.00% LIBOR Floor | | 9/10/2023 | | Metals & Mining | | 11,137 | | | 10,625 | | | 10,733 | |
| Appalachian Resource Company, LLC(w) | | L+1000, 1.00% LIBOR Floor | | 9/10/2023 | | Metals & Mining | | 5,000 | | | 5,000 | | | 5,000 | |
| Archer Systems, LLC(m)(z) | | S+650, 1.00% SOFR Floor | | 8/11/2027 | | Services: Business | | 18,095 | | | 17,922 | | | 17,937 | |
| Archer Systems, LLC | | 0.50% Unfunded | | 8/11/2027 | | Services: Business | | 1,905 | | | (18) | | | (17) | |
| Associated Asphalt Partners, LLC(m)(n)(w) | | L+525, 1.00% LIBOR Floor | | 4/5/2024 | | Construction & Building | | 14,221 | | | 14,051 | | | 10,994 | |
| Atlas Supply LLC | | 11.00% | | 4/29/2025 | | Healthcare & Pharmaceuticals | | 5,000 | | | 5,000 | | | 4,950 | |
| Avison Young (USA) Inc.(h)(m)(w) | | S+575, 0.00% SOFR Floor | | 1/31/2026 | | Banking, Finance, Insurance & Real Estate | | 2,665 | | | 2,638 | | | 2,505 | |
| BDS Solutions Intermediateco, LLC(m)(aa) | | S+625, 1.00% SOFR Floor | | 2/7/2027 | | Services: Business | | 17,822 | | | 17,535 | | | 17,466 | |
| BDS Solutions Intermediateco, LLC(aa) | | S+625, 1.00% SOFR Floor | | 2/7/2027 | | Services: Business | | 859 | | | 802 | | | 842 | |
| BDS Solutions Intermediateco, LLC | | 0.50% Unfunded | | 2/7/2027 | | Services: Business | | 1,998 | | | — | | | (40) | |
| Berlitz Holdings, Inc.(r)(z) | | S+900, 1.00% SOFR Floor | | 2/14/2025 | | Services: Business | | 13,800 | | | 12,992 | | | 13,179 | |
| Bradshaw International Parent Corp.(m)(w) | | L+ 575, 1.00% LIBOR Floor | | 10/21/2027 | | Consumer Goods: Durable | | 13,024 | | | 12,746 | | | 12,650 | |
| Bradshaw International Parent Corp. | | 0.50% Unfunded | | 10/21/2026 | | Consumer Goods: Durable | | 1,844 | | | (36) | | | (53) | |
See accompanying notes to consolidated financial statements.
CĪON Investment Corporation
Consolidated Schedule of Investments
December 31, 2022
(in thousands)
| | | | | | | | | | | | | | | | | | | | | | | | | | | | | | | | | | | | | | |
| Portfolio Company(a) | | Interest(b) | | Maturity | | Industry | | Principal/
Par Amount/
Units(e) | | Cost(d) | | Fair
Value(c) |
| Cabi, LLC(m)(z) | | S+950, 1.00% SOFR Floor | | 2/28/2027 | | Retail | | 22,073 | | | 21,772 | | | 21,742 | |
| Cadence Aerospace, LLC(m)(n)(t)(x) | | L+850, 1.00% LIBOR Floor | | 11/14/2023 | | Aerospace & Defense | | 39,383 | | | 39,225 | | | 38,842 | |
| Carestream Health, Inc.(n)(r)(z) | | S+750, 1.00% SOFR Floor | | 9/30/2027 | | Healthcare & Pharmaceuticals | | 7,596 | | | 7,596 | | | 7,539 | |
| CB URS Holdings Corp.(m)(x) | | L+575, 1.00% LIBOR Floor | | 9/1/2024 | | Transportation: Cargo | | 14,826 | | | 14,801 | | | 12,417 | |
| Celerity Acquisition Holdings, LLC(m)(x) | | L+850, 1.00% LIBOR Floor | | 5/28/2026 | | Services: Business | | 14,775 | | | 14,775 | | | 14,590 | |
| Cennox, Inc.(m)(x) | | L+600, 1.00% LIBOR Floor | | 5/4/2026 | | Services: Business | | 22,509 | | | 22,509 | | | 22,425 | |
| Cennox, Inc.(n)(x) | | L+600, 1.00% LIBOR Floor | | 5/4/2026 | | Services: Business | | 11,787 | | | 11,730 | | | 11,743 | |
| Cennox, Inc. | | L+600, 1.00% LIBOR Floor | | 5/4/2026 | | Services: Business | | 2,614 | | | 2,614 | | | 2,604 | |
| Cennox, Inc. | | 1.00% Unfunded | | 8/11/2023 | | Services: Business | | 7,193 | | | — | | | (27) | |
| Cennox, Inc. | | 0.50% Unfunded | | 5/4/2026 | | Services: Business | | 373 | | | — | | | (1) | |
| CION/EagleTree Partners, LLC(h)(s)(t) | | 14.00% | | 12/21/2026 | | Diversified Financials | | 60,348 | | | 60,348 | | | 60,348 | |
| CircusTrix Holdings, LLC(m)(n)(w) | | L+550, 1.00% LIBOR Floor | | 1/16/2024 | | Hotel, Gaming & Leisure | | 26,824 | | | 26,782 | | | 26,824 | |
| CircusTrix Holdings, LLC(m)(w) | | L+550, 1.00% LIBOR Floor | | 1/16/2024 | | Hotel, Gaming & Leisure | | 2,737 | | | 2,715 | | | 2,737 | |
| CircusTrix Holdings, LLC(m)(w) | | L+550, 1.00% LIBOR Floor | | 7/16/2023 | | Hotel, Gaming & Leisure | | 1,560 | | | 1,525 | | | 1,862 | |
| Community Tree Service, LLC(m)(aa) | | S+850, 1.00% SOFR Floor | | 6/17/2027 | | Construction & Building | | 12,469 | | | 12,469 | | | 12,219 | |
| Country Fresh Holdings, LLC(q)(x) | | L+500, 1.00% LIBOR Floor | | 4/29/2023 | | Beverage, Food & Tobacco | | 877 | | | 765 | | | 92 | |
| Country Fresh Holdings, LLC(q)(x) | | L+500, 1.00% LIBOR Floor | | 4/29/2023 | | Beverage, Food & Tobacco | | 355 | | | 316 | | | 37 | |
| Coyote Buyer, LLC(m)(n)(x) | | L+600, 1.00% LIBOR Floor | | 2/6/2026 | | Chemicals, Plastics & Rubber | | 34,038 | | | 33,861 | | | 33,612 | |
| Coyote Buyer, LLC(n)(x) | | L+800, 1.00% LIBOR Floor | | 8/6/2026 | | Chemicals, Plastics & Rubber | | 6,125 | | | 6,041 | | | 6,125 | |
| Coyote Buyer, LLC | | 0.50% Unfunded | | 2/6/2025 | | Chemicals, Plastics & Rubber | | 2,500 | | | — | | | (31) | |
| Critical Nurse Staffing, LLC(m)(x) | | L+600, 1.00% LIBOR Floor | | 11/1/2026 | | Healthcare & Pharmaceuticals | | 12,928 | | | 12,928 | | | 12,928 | |
| Critical Nurse Staffing, LLC(x) | | L+600, 1.00% LIBOR Floor | | 11/1/2026 | | Healthcare & Pharmaceuticals | | 999 | | | 999 | | | 999 | |
| Critical Nurse Staffing, LLC(w) | | L+600, 1.00% LIBOR Floor | | 11/1/2026 | | Healthcare & Pharmaceuticals | | 300 | | | 300 | | | 300 | |
| Critical Nurse Staffing, LLC | | 1.00% Unfunded | | 11/1/2026 | | Healthcare & Pharmaceuticals | | 4,899 | | | — | | | — | |
| Critical Nurse Staffing, LLC | | 0.50% Unfunded | | 11/1/2026 | | Healthcare & Pharmaceuticals | | 700 | | | — | | | — | |
| David's Bridal, LLC(m)(t)(x) | | L+1000, 1.00% LIBOR Floor | | 5/23/2024 | | Retail | | 13,000 | | | 12,744 | | | 13,130 | |
| David's Bridal, LLC(t)(x) | | L+1000, 1.00% LIBOR Floor | | 5/23/2024 | | Retail | | 5,357 | | | 5,357 | | | 5,210 | |
| David's Bridal, LLC(t)(x) | | L+1000, 1.00% LIBOR Floor | | 12/23/2024 | | Retail | | 5,936 | | | 5,717 | | | 2,256 | |
| David's Bridal, LLC(q)(t)(w) | | L+700, 1.00% LIBOR Floor | | 12/31/2024 | | Retail | | 845 | | | 795 | | | 51 | |
| Deluxe Entertainment Services, Inc.(m)(q)(r)(t)(x) | | L+650, 1.00% LIBOR Floor | | 3/25/2024 | | Media: Diversified & Production | | 2,664 | | | 2,624 | | | 246 | |
| Dermcare Management, LLC(m)(z) | | S+600, 1.00% SOFR Floor | | 4/22/2028 | | Healthcare & Pharmaceuticals | | 9,356 | | | 9,178 | | | 9,297 | |
| Dermcare Management, LLC(z) | | S+600, 1.00% SOFR Floor | | 4/22/2028 | | Healthcare & Pharmaceuticals | | 3,540 | | | 3,458 | | | 3,518 | |
| Dermcare Management, LLC | | Prime+500 | | 4/22/2028 | | Healthcare & Pharmaceuticals | | 179 | | | 179 | | | 178 | |
| Dermcare Management, LLC | | 0.50% Unfunded | | 10/22/2023 | | Healthcare & Pharmaceuticals | | 698 | | | — | | | (4) | |
See accompanying notes to consolidated financial statements.
CĪON Investment Corporation
Consolidated Schedule of Investments
December 31, 2022
(in thousands)
| | | | | | | | | | | | | | | | | | | | | | | | | | | | | | | | | | | | | | |
| Portfolio Company(a) | | Interest(b) | | Maturity | | Industry | | Principal/
Par Amount/
Units(e) | | Cost(d) | | Fair
Value(c) |
| Dermcare Management, LLC | | 0.50% Unfunded | | 4/22/2028 | | Healthcare & Pharmaceuticals | | 1,164 | | | — | | | (7) | |
| DMT Solutions Global Corp.(n)(u) | | L+750, 1.00% LIBOR Floor | | 7/2/2024 | | Services: Business | | 3,974 | | | 3,942 | | | 3,766 | |
| Emerald Technologies (U.S.) Acquisitionco, Inc.(n)(z) | | S+625, 1.00% SOFR Floor | | 12/29/2027 | | Services: Business | | 2,944 | | | 2,891 | | | 2,794 | |
| Entertainment Studios P&A LLC(m)(x)(aa) | | S+850, 1.00% SOFR Floor | | 9/28/2027 | | Media: Diversified & Production | | 24,000 | | | 23,907 | | | 23,940 | |
| Entertainment Studios P&A LLC(j) | | 5.00% | | 5/18/2037 | | Media: Diversified & Production | | — | | | — | | | 1,654 | |
| Flatworld Intermediate Corp.(n)(z) | | S+600, 1.00% SOFR Floor | | 10/3/2027 | | Services: Business | | 25,135 | | | 25,135 | | | 25,135 | |
| Flatworld Intermediate Corp. | | 0.50% Unfunded | | 10/3/2027 | | Services: Business | | 5,865 | | | — | | | — | |
| FuseFX, LLC(m)(n)(w) | | S+575, 1.00% SOFR Floor | | 10/1/2024 | | Media: Diversified & Production | | 19,795 | | | 19,663 | | | 19,647 | |
| Fusion Connect Inc.(m)(t)(x) | | L+850, 1.00% LIBOR Floor | | 1/18/2027 | | High Tech Industries | | 19,626 | | | 19,141 | | | 19,626 | |
| Future Pak, LLC(m)(w) | | L+1000, 2.00% LIBOR Floor | | 7/2/2024 | | Healthcare & Pharmaceuticals | | 24,169 | | | 24,169 | | | 23,776 | |
| Gold Medal Holdings, Inc.(m)(aa) | | S+700, 1.00% SOFR Floor | | 3/17/2027 | | Services: Business | | 14,759 | | | 14,628 | | | 14,575 | |
| GSC Technologies Inc.(r)(w) | | L+500, 1.00% LIBOR Floor | | 9/30/2025 | | Chemicals, Plastics & Rubber | | 2,404 | | | 2,322 | | | 2,064 | |
| GSC Technologies Inc.(r)(t)(w) | | L+500, 1.00% LIBOR Floor | | 9/30/2025 | | Chemicals, Plastics & Rubber | | 915 | | | 882 | | | 388 | |
| GSC Technologies Inc.(r)(t)(x) | | L+1000, 1.00% LIBOR Floor | | 9/30/2025 | | Chemicals, Plastics & Rubber | | 154 | | | 154 | | | 154 | |
| H.W. Lochner, Inc.(m)(x) | | L+575, 1.00% LIBOR Floor | | 7/2/2027 | | Construction & Building | | 8,850 | | | 8,779 | | | 8,850 | |
| H.W. Lochner, Inc.(m)(aa) | | S+675, 1.00% SOFR Floor | | 7/2/2027 | | Construction & Building | | 7,457 | | | 7,234 | | | 7,233 | |
| H.W. Lochner, Inc.(x) | | L+575, 1.00% LIBOR Floor | | 7/2/2027 | | Construction & Building | | 775 | | | 765 | | | 775 | |
| H.W. Lochner, Inc. | | 0.50% Unfunded | | 7/2/2027 | | Construction & Building | | 225 | | | — | | | — | |
| Harland Clarke Holdings Corp. (m)(x) | | S+775, 1.00% SOFR Floor | | 6/16/2026 | | Services: Business | | 9,186 | | | 9,177 | | | 7,625 | |
| Heritage Power, LLC(x) | | L+600, 1.00% LIBOR Floor | | 7/30/2026 | | Energy: Oil & Gas | | 8,622 | | | 6,837 | | | 4,527 | |
| Hilliard, Martinez & Gonzales, LLP(m)(t)(w) | | L+1200, 2.00% LIBOR Floor | | 12/17/2023 | | Services: Consumer | | 21,798 | | | 21,736 | | | 21,798 | |
| Hollander Intermediate LLC(m)(w)(aa) | | S+875, 2.00% SOFR Floor | | 9/19/2026 | | Consumer Goods: Durable | | 17,358 | | | 16,915 | | | 16,794 | |
| Homer City Generation, L.P.(m)(t) | | 15.00% | | 4/5/2023 | | Energy: Oil & Gas | | 11,782 | | | 12,078 | | | 9,308 | |
| Homer City Generation, L.P. | | 17.00% | | 5/31/2023 | | Energy: Oil & Gas | | 1,000 | | | 1,000 | | | 1,000 | |
| Homer City Generation, L.P.(o) | | 0.00% Unfunded | | 1/29/2023 | | Energy: Oil & Gas | | 3,000 | | | — | | | — | |
| Hudson Hospital Opco, LLC(m)(n)(aa) | | S+800, 3.00% SOFR Floor | | 11/4/2023 | | Healthcare & Pharmaceuticals | | 1,700 | | | 1,667 | | | 1,673 | |
| HUMC Holdco, LLC(m)(aa) | | S+800, 3.00% SOFR Floor | | 11/4/2023 | | Healthcare & Pharmaceuticals | | 7,933 | | | 7,933 | | | 7,933 | |
| HW Acquisition, LLC | | Prime+500 | | 9/28/2026 | | Capital Equipment | | 733 | | | 711 | | | 686 | |
| HW Acquisition, LLC(m) | | Prime+500 | | 9/28/2026 | | Capital Equipment | | 18,876 | | | 18,725 | | | 17,649 | |
| HW Acquisition, LLC | | 0.50% Unfunded | | 9/28/2026 | | Capital Equipment | | 2,200 | | | — | | | (143) | |
| ICA Foam Holdings, LLC(m)(aa) | | S+675, 1.00% SOFR Floor | | 11/5/2025 | | Containers, Packaging & Glass | | 19,950 | | | 19,567 | | | 19,551 | |
| IJKG Opco LLC(m)(n)(aa) | | S+800, 3.00% SOFR Floor | | 11/4/2023 | | Healthcare & Pharmaceuticals | | 729 | | | 714 | | | 718 | |
| Independent Pet Partners Intermediate Holdings, LLC(t) | | 6.00% | | 11/20/2023 | | Retail | | 10,934 | | | 10,906 | | | 10,169 | |
| Independent Pet Partners Intermediate Holdings, LLC(t) | | Prime+550 | | 2/27/2023 | | Retail | | 2,238 | | | 2,238 | | | 2,216 | |
| Independent Pet Partners Intermediate Holdings, LLC(t)(aa) | | S+1000, 1.00% SOFR Floor | | 2/27/2023 | | Retail | | 473 | | | 459 | | | 473 | |
| Independent Pet Partners Intermediate Holdings, LLC(t)(x) | | L+650, 0.00% LIBOR Floor | | 2/27/2023 | | Retail | | 281 | | | 281 | | | 278 | |
See accompanying notes to consolidated financial statements.
CĪON Investment Corporation
Consolidated Schedule of Investments
December 31, 2022
(in thousands)
| | | | | | | | | | | | | | | | | | | | | | | | | | | | | | | | | | | | | | |
| Portfolio Company(a) | | Interest(b) | | Maturity | | Industry | | Principal/
Par Amount/
Units(e) | | Cost(d) | | Fair
Value(c) |
| InfoGroup Inc.(m)(n)(x) | | L+500, 1.00% LIBOR Floor | | 4/3/2023 | | Media: Advertising, Printing & Publishing | | 15,270 | | | 15,269 | | | 15,270 | |
| Inotiv, Inc.(m)(x) | | S+625, 1.00% SOFR Floor | | 11/5/2026 | | Healthcare & Pharmaceuticals | | 16,351 | | | 16,094 | | | 15,738 | |
| Instant Web, LLC(m)(n)(r)(t)(w) | | L+700, 1.00% LIBOR Floor | | 2/25/2027 | | Media: Advertising, Printing & Publishing | | 39,812 | | | 39,802 | | | 28,167 | |
| Instant Web, LLC(r) | | Prime+375 | | 2/25/2027 | | Media: Advertising, Printing & Publishing | | 458 | | | 458 | | | 469 | |
| Instant Web, LLC(r)(x) | | L+650, 1.00% LIBOR Floor | | 2/25/2027 | | Media: Advertising, Printing & Publishing | | 321 | | | 321 | | | 321 | |
| Instant Web, LLC(r) | | 0.50% Unfunded | | 2/25/2027 | | Media: Advertising, Printing & Publishing | | 2,383 | | | — | | | — | |
| Instant Web, LLC(r) | | 0.50% Unfunded | | 2/25/2027 | | Media: Advertising, Printing & Publishing | | 3,246 | | | — | | | — | |
| Invincible Boat Company LLC(m)(x) | | L+650, 1.50% LIBOR Floor | | 8/28/2025 | | Consumer Goods: Durable | | 13,536 | | | 13,444 | | | 13,469 | |
| Invincible Boat Company LLC(x) | | L+650, 1.50% LIBOR Floor | | 8/28/2025 | | Consumer Goods: Durable | | 239 | | | 239 | | | 238 | |
| Invincible Boat Company LLC | | 0.50% Unfunded | | 8/28/2025 | | Consumer Goods: Durable | | 559 | | | — | | | (3) | |
| INW Manufacturing, LLC(n)(x) | | L+575, 0.75% LIBOR Floor | | 3/25/2027 | | Services: Business | | 18,750 | | | 18,317 | | | 17,766 | |
| Ironhorse Purchaser, LLC(n)(aa) | | S+650, 1.00% SOFR Floor | | 9/30/2027 | | Services: Business | | 7,125 | | | 7,056 | | | 7,054 | |
| Ironhorse Purchaser, LLC(aa) | | S+650, 1.00% SOFR Floor | | 9/30/2027 | | Services: Business | | 388 | | | 380 | | | 384 | |
| Ironhorse Purchaser, LLC | | 0.50% Unfunded | | 9/30/2027 | | Services: Business | | 429 | | | — | | | (4) | |
| Ironhorse Purchaser, LLC | | 1.00% Unfunded | | 9/30/2024 | | Services: Business | | 2,041 | | | (20) | | | (20) | |
| Isagenix International, LLC(m)(x) | | L+775, 1.00% LIBOR Floor | | 6/14/2025 | | Beverage, Food & Tobacco | | 16,229 | | | 15,103 | | | 13,774 | |
| Jenny C Acquisition, Inc.(q)(x) | | L+900, 1.75% LIBOR Floor | | 10/1/2024 | | Services: Consumer | | 11,789 | | | 11,745 | | | 9,241 | |
| JP Intermediate B, LLC(m)(x) | | L+550, 1.00% LIBOR Floor | | 11/20/2025 | | Beverage, Food & Tobacco | | 13,438 | | | 13,296 | | | 9,809 | |
| K&N Parent, Inc.(x) | | L+675, 1.00% LIBOR Floor | | 10/20/2023 | | Consumer Goods: Durable | | 13,090 | | | 12,898 | | | 12,435 | |
| K&N Parent, Inc.(aa) | | S+800, 1.00% SOFR Floor | | 2/15/2023 | | Consumer Goods: Durable | | 1,200 | | | 1,152 | | | 1,220 | |
| Klein Hersh, LLC(m)(z) | | S+852, 0.50% SOFR Floor | | 4/27/2027 | | Services: Business | | 19,766 | | | 19,766 | | | 19,667 | |
| KNB Holdings Corp.(m)(n)(q)(y) | | L+550, 1.00% LIBOR Floor | | 4/26/2024 | | Consumer Goods: Durable | | 7,634 | | | 7,387 | | | 3,321 | |
| LaserAway Intermediate Holdings II, LLC(m)(x) | | L+575, 0.75% LIBOR Floor | | 10/12/2027 | | Services: Consumer | | 3,375 | | | 3,319 | | | 3,316 | |
| LAV Gear Holdings, Inc.(m)(n)(aa) | | S+550, 1.00% SOFR Floor | | 10/31/2024 | | Services: Business | | 27,854 | | | 27,625 | | | 27,366 | |
| LAV Gear Holdings, Inc.(m)(n)(aa) | | S+550, 1.00% SOFR Floor | | 10/31/2024 | | Services: Business | | 4,569 | | | 4,544 | | | 4,489 | |
| LGC US Finco, LLC(m)(w) | | L+650, 1.00% LIBOR Floor | | 12/20/2025 | | Capital Equipment | | 11,515 | | | 11,263 | | | 11,184 | |
| Lift Brands, Inc.(m)(n)(r)(w) | | L+750, 1.00% LIBOR Floor | | 6/29/2025 | | Services: Consumer | | 23,287 | | | 23,287 | | | 23,287 | |
| Lift Brands, Inc.(m)(n)(r) | | 9.50% | | 6/29/2025 | | Services: Consumer | | 5,556 | | | 5,490 | | | 5,154 | |
| Lift Brands, Inc.(m)(n)(r) | | (p) | | 6/29/2025 | | Services: Consumer | | 5,296 | | | 4,947 | | | 4,732 | |
| Longview Power, LLC(r)(x) | | L+1000, 1.50% LIBOR Floor | | 7/30/2025 | | Energy: Oil & Gas | | 2,073 | | | 1,390 | | | 2,348 | |
| MacNeill Pride Group Corp.(m)(aa) | | S+625, 1.00% SOFR Floor | | 4/22/2026 | | Services: Consumer | | 17,804 | | | 17,702 | | | 17,448 | |
| MacNeill Pride Group Corp.(m)(aa) | | S+625, 1.00% SOFR Floor | | 4/22/2026 | | Services: Consumer | | 7,910 | | | 7,836 | | | 7,751 | |
| MacNeill Pride Group Corp. | | 1.00% Unfunded | | 4/30/2024 | | Services: Consumer | | 2,017 | | | — | | | (40) | |
| Manus Bio Inc. | | 11.00% | | 8/20/2026 | | Healthcare & Pharmaceuticals | | 14,213 | | | 14,128 | | | 14,212 | |
| Marble Point Credit Management LLC(x) | | L+600, 1.00% LIBOR Floor | | 8/11/2028 | | Diversified Financials | | 6,089 | | | 5,985 | | | 6,089 | |
| Marble Point Credit Management LLC(x) | | L+600, 1.00% LIBOR Floor | | 8/11/2028 | | Diversified Financials | | 1,437 | | | 1,418 | | | 1,437 | |
See accompanying notes to consolidated financial statements.
CĪON Investment Corporation
Consolidated Schedule of Investments
December 31, 2022
(in thousands)
| | | | | | | | | | | | | | | | | | | | | | | | | | | | | | | | | | | | | | |
| Portfolio Company(a) | | Interest(b) | | Maturity | | Industry | | Principal/
Par Amount/
Units(e) | | Cost(d) | | Fair
Value(c) |
| Mimeo.com, Inc.(x) | | L+700, 1.00% LIBOR Floor | | 12/21/2024 | | Media: Advertising, Printing & Publishing | | 22,328 | | | 22,328 | | | 22,161 | |
| Mimeo.com, Inc.(x) | | L+700, 1.00% LIBOR Floor | | 12/21/2024 | | Media: Advertising, Printing & Publishing | | 2,256 | | | 2,256 | | | 2,239 | |
| Mimeo.com, Inc. | | 1.00% Unfunded | | 12/21/2024 | | Media: Advertising, Printing & Publishing | | 3,000 | | | — | | | (23) | |
| Moss Holding Company(m)(n)(aa) | | S+625, 1.00% SOFR Floor | | 4/17/2024 | | Services: Business | | 19,576 | | | 19,500 | | | 19,185 | |
| Moss Holding Company | | 6.25% Unfunded | | 4/17/2024 | | Services: Business | | 106 | | | — | | | (2) | |
| Moss Holding Company | | 0.50% Unfunded | | 4/17/2024 | | Services: Business | | 2,126 | | | — | | | (43) | |
| Neptune Flood Inc.(m)(x) | | L+600, 1.00% LIBOR Floor | | 10/21/2026 | | Banking, Finance, Insurance & Real Estate | | 7,789 | | | 7,742 | | | 7,867 | |
| NewsCycle Solutions, Inc.(m)(n)(x) | | S+700, 1.00% SOFR Floor | | 12/29/2023 | | Media: Advertising, Printing & Publishing | | 12,444 | | | 12,432 | | | 12,444 | |
| NWN Parent Holdings LLC(m)(x) | | S+800, 1.00% SOFR Floor | | 5/7/2026 | | High Tech Industries | | 12,755 | | | 12,664 | | | 12,643 | |
| NWN Parent Holdings LLC(x) | | S+800, 1.00% SOFR Floor | | 5/7/2026 | | High Tech Industries | | 810 | | | 798 | | | 803 | |
| NWN Parent Holdings LLC | | 0.50% Unfunded | | 5/7/2026 | | High Tech Industries | | 90 | | | — | | | (1) | |
| OpCo Borrower, LLC(m)(z) | | S+650, 1.00% SOFR Floor | | 8/19/2027 | | Healthcare & Pharmaceuticals | | 11,387 | | | 11,268 | | | 11,387 | |
| OpCo Borrower, LLC(z) | | S+650, 1.00% SOFR Floor | | 8/19/2027 | | Healthcare & Pharmaceuticals | | 208 | | | 208 | | | 208 | |
| OpCo Borrower, LLC | | 0.50% Unfunded | | 8/19/2027 | | Healthcare & Pharmaceuticals | | 833 | | | — | | | — | |
| Optio Rx, LLC(m)(n)(w) | | L+700, 0.00% LIBOR Floor | | 6/28/2024 | | Healthcare & Pharmaceuticals | | 15,929 | | | 15,892 | | | 15,749 | |
| Optio Rx, LLC(n)(w) | | L+1000, 0.00% LIBOR Floor | | 6/28/2024 | | Healthcare & Pharmaceuticals | | 2,515 | | | 2,504 | | | 2,615 | |
| Pentec Acquisition Corp.(m)(w) | | L+600, 1.00% LIBOR Floor | | 10/8/2026 | | Healthcare & Pharmaceuticals | | 24,750 | | | 24,551 | | | 24,750 | |
| PH Beauty Holdings III. Inc.(m)(x) | | L+500, 0.00% LIBOR Floor | | 9/28/2025 | | Consumer Goods: Non-Durable | | 9,575 | | | 9,195 | | | 8,677 | |
| Playboy Enterprises, Inc.(h)(n)(x) | | L+625, 0.50% LIBOR Floor | | 5/25/2027 | | Consumer Goods: Non-Durable | | 25,202 | | | 24,729 | | | 24,257 | |
| Project Castle, Inc.(m)(aa) | | S+550, 0.50% SOFR Floor | | 6/1/2029 | | Services: Business | | 9,975 | | | 8,979 | | | 8,117 | |
| RA Outdoors, LLC(m)(aa) | | S+675, 1.00% SOFR Floor | | 4/8/2026 | | Media: Diversified & Production | | 10,979 | | | 10,979 | | | 10,938 | |
| RA Outdoors, LLC | | 0.50% Unfunded | | 4/8/2026 | | Media: Diversified & Production | | 1,049 | | | (170) | | | (1) | |
| Retail Services WIS Corp.(m)(x) | | L+775, 1.00% LIBOR Floor | | 5/20/2025 | | Services: Business | | 9,548 | | | 9,374 | | | 9,357 | |
| Robert C. Hilliard, L.L.P.(m)(t)(w) | | L+1200, 2.00% LIBOR Floor | | 12/17/2023 | | Services: Consumer | | 1,815 | | | 1,815 | | | 1,815 | |
| Rogers Mechanical Contractors, LLC(m)(t)(aa) | | S+800, 1.00% SOFR Floor | | 9/9/2025 | | Services: Business | | 16,365 | | | 16,365 | | | 16,324 | |
| Rogers Mechanical Contractors, LLC(t)(aa) | | S+800, 1.00% SOFR Floor | | 9/9/2025 | | Services: Business | | 962 | | | 962 | | | 959 | |
| Rogers Mechanical Contractors, LLC | | 1.00% Unfunded | | 4/28/2023 | | Services: Business | | 962 | | | — | | | (2) | |
| Rogers Mechanical Contractors, LLC | | 0.75% Unfunded | | 9/9/2025 | | Services: Business | | 2,404 | | | — | | | (6) | |
| RumbleOn, Inc.(m)(x) | | L+825, 1.00% LIBOR Floor | | 8/31/2026 | | Automotive | | 13,284 | | | 12,497 | | | 12,554 | |
| RumbleOn, Inc.(x) | | L+825, 1.00% LIBOR Floor | | 8/31/2026 | | Automotive | | 4,019 | | | 3,976 | | | 3,798 | |
| RumbleOn, Inc.(o) | | 0.00% Unfunded | | 2/28/2023 | | Automotive | | 1,775 | | | — | | | (98) | |
| Securus Technologies Holdings, Inc.(m)(x) | | L+450, 1.00% LIBOR Floor | | 11/1/2024 | | Telecommunications | | 3,868 | | | 3,383 | | | 3,848 | |
| Sequoia Healthcare Management, LLC(m)(n)(q) | | 12.75% | | 11/4/2023 | | Healthcare & Pharmaceuticals | | 8,525 | | | 8,457 | | | 10,209 | |
| Service Compression, LLC(m)(t)(aa) | | S+1000, 1.00% SOFR Floor | | 5/6/2027 | | Energy: Oil & Gas | | 22,975 | | | 22,622 | | | 22,803 | |
| Service Compression, LLC(aa) | | S+1000, 1.00% SOFR Floor | | 5/6/2027 | | Energy: Oil & Gas | | 3,151 | | | 3,044 | | | 3,127 | |
See accompanying notes to consolidated financial statements.
CĪON Investment Corporation
Consolidated Schedule of Investments
December 31, 2022
(in thousands)
| | | | | | | | | | | | | | | | | | | | | | | | | | | | | | | | | | | | | | |
| Portfolio Company(a) | | Interest(b) | | Maturity | | Industry | | Principal/
Par Amount/
Units(e) | | Cost(d) | | Fair
Value(c) |
| Service Compression, LLC | | 0.50% Unfunded | | 5/6/2025 | | Energy: Oil & Gas | | 4,186 | | | — | | | (31) | |
| Sleep Opco, LLC(m)(x) | | L+650, 1.00% LIBOR Floor | | 10/12/2026 | | Retail | | 13,779 | | | 13,568 | | | 13,641 | |
| Sleep Opco, LLC | | 0.50% Unfunded | | 10/12/2026 | | Retail | | 1,750 | | | (27) | | | (18) | |
| Spinal USA, Inc. / Precision Medical Inc.(m)(t)(x) | | L+950 | | 5/29/2023 | | Healthcare & Pharmaceuticals | | 13,401 | | | 13,385 | | | 9,649 | |
| Spinal USA, Inc. / Precision Medical Inc.(m)(t)(x) | | L+950 | | 5/29/2023 | | Healthcare & Pharmaceuticals | | 1,191 | | | 1,191 | | | 816 | |
| Spinal USA, Inc. / Precision Medical Inc.(m)(t)(x) | | L+950 | | 5/29/2023 | | Healthcare & Pharmaceuticals | | 766 | | | 677 | | | 521 | |
| Spinal USA, Inc. / Precision Medical Inc.(m)(t)(x) | | L+950 | | 5/29/2023 | | Healthcare & Pharmaceuticals | | 727 | | | 727 | | | 498 | |
| Spinal USA, Inc. / Precision Medical Inc.(m)(t)(x) | | L+950 | | 5/29/2023 | | Healthcare & Pharmaceuticals | | 607 | | | 536 | | | 446 | |
| STATinMED, LLC(r)(t)(z) | | S+950, 2.00% SOFR Floor | | 7/1/2027 | | Healthcare & Pharmaceuticals | | 9,222 | | | 9,222 | | | 9,107 | |
| STATinMED, LLC(r)(t)(z) | | S+950, 2.00% SOFR Floor | | 3/31/2023 | | Healthcare & Pharmaceuticals | | 156 | | | 153 | | | 156 | |
| STATinMED, LLC(o)(r) | | 0.00% Unfunded | | 3/31/2023 | | Healthcare & Pharmaceuticals | | 156 | | | — | | | — | |
| Thrill Holdings LLC(m)(aa) | | S+650, 1.00% SOFR Floor | | 5/27/2027 | | Media: Diversified & Production | | 20,394 | | | 20,394 | | | 20,292 | |
| Thrill Holdings LLC | | 1.00% Unfunded | | 5/27/2024 | | Media: Diversified & Production | | 3,261 | | | — | | | (16) | |
| Thrill Holdings LLC(aa) | | S+650, 1.00% SOFR Floor | | 5/27/2027 | | Media: Diversified & Production | | 1,739 | | | 1,739 | | | 1,730 | |
| Trademark Global, LLC(t)(w) | | L+750, 1.00% LIBOR Floor | | 7/30/2024 | | Consumer Goods: Non-Durable | | 15,355 | | | 15,310 | | | 14,952 | |
| Trammell, P.C.(t)(z) | | S+1550, 2.00% SOFR Floor | | 4/28/2026 | | Services: Consumer | | 14,201 | | | 14,201 | | | 14,147 | |
| USALCO, LLC(m)(x) | | L+600, 1.00% LIBOR Floor | | 10/19/2027 | | Chemicals, Plastics & Rubber | | 24,750 | | | 24,539 | | | 24,441 | |
| Vesta Holdings, LLC(m)(t) | | P+900 | | 2/25/2024 | | Banking, Finance, Insurance & Real Estate | | 21,071 | | | 21,071 | | | 19,938 | |
| Vesta Holdings, LLC(m)(aa) | | S+1000, 1.00% SOFR Floor | | 3/12/2023 | | Banking, Finance, Insurance & Real Estate | | 10,392 | | | 10,159 | | | 10,392 | |
| Vesta Holdings, LLC(t) | | P+900 | | 2/25/2024 | | Banking, Finance, Insurance & Real Estate | | 838 | | | 838 | | | 793 | |
| Volta Charging, LLC(m) | | 12.00% | | 6/19/2024 | | Media: Diversified & Production | | 5,621 | | | 5,617 | | | 6,506 | |
| Volta Charging, LLC(m) | | 12.00% | | 6/19/2024 | | Media: Diversified & Production | | 1,500 | | | 1,499 | | | 1,736 | |
| Williams Industrial Services Group, Inc.(n)(t)(x) | | L+900, 1.00% LIBOR Floor | | 12/16/2025 | | Services: Business | | 7,173 | | | 7,173 | | | 7,182 | |
| Wok Holdings Inc.(m)(x) | | L+650, 0.00% LIBOR Floor | | 3/1/2026 | | Beverage, Food & Tobacco | | 25,105 | | | 24,335 | | | 21,684 | |
| WorkGenius, Inc.(m)(aa) | | S+700, 0.50% SOFR Floor | | 6/7/2027 | | Services: Business | | 12,938 | | | 12,937 | | | 12,938 | |
| WorkGenius, Inc. | | 0.50% Unfunded | | 6/7/2027 | | Services: Business | | 750 | | | (15) | | | — | |
| Xenon Arc, Inc.(m)(x) | | L+525, 0.75% LIBOR Floor | | 12/17/2027 | | High Tech Industries | | 6,915 | | | 6,846 | | | 6,846 | |
| Yak Access, LLC(m) | | L+400, 0.00% LIBOR Floor | | 7/11/2025 | | Construction & Building | | 4,925 | | | 3,299 | | | 3,165 | |
| Total Senior Secured First Lien Debt | | | | | | | | | | 1,638,995 | | | 1,579,512 | |
Senior Secured Second Lien Debt - 4.4% | | | | | | | | | | | | |
| Global Tel*Link Corp.(n)(aa) | | S+1000, 0.00% SOFR Floor | | 11/29/2026 | | Telecommunications | | 11,500 | | | 11,378 | | | 11,414 | |
| OpCo Borrower, LLC(m) | | 12.50% | | 2/19/2028 | | Healthcare & Pharmaceuticals | | 12,500 | | | 11,659 | | | 11,312 | |
| RA Outdoors, LLC(m)(aa) | | S+900, 1.00% SOFR Floor | | 10/8/2026 | | Media: Diversified & Production | | 1,827 | | | 1,827 | | | 1,825 | |
| Securus Technologies Holdings, Inc.(x) | | L+825, 1.00% LIBOR Floor | | 11/1/2025 | | Telecommunications | | 2,942 | | | 2,926 | | | 2,884 | |
| TMK Hawk Parent, Corp.(x) | | L+800, 1.00% LIBOR Floor | | 8/28/2025 | | Services: Business | | 13,393 | | | 13,246 | | | 11,334 | |
| Total Senior Secured Second Lien Debt | | | | | | | | | | 41,036 | | | 38,769 | |
See accompanying notes to consolidated financial statements.
CĪON Investment Corporation
Consolidated Schedule of Investments
December 31, 2022
(in thousands)
| | | | | | | | | | | | | | | | | | | | | | | | | | | | | | | | | | | | | | |
| Portfolio Company(a) | | Interest | | Maturity | | Industry | | Principal/
Par Amount/
Units(e) | | Cost(d) | | Fair
Value(c) |
Collateralized Securities and Structured Products - Equity - 0.1% | | | | | | | | | | |
| APIDOS CLO XVI Subordinated Notes(g)(h) | | 0.00% Estimated Yield | | 1/19/2025 | | Diversified Financials | | 9,000 | | | 1,246 | | | 71 | |
| Galaxy XV CLO Ltd. Class A Subordinated Notes(g)(h) | | 19.30% Estimated Yield | | 4/15/2025 | | Diversified Financials | | 4,000 | | | 1,441 | | | 1,108 | |
| Total Collateralized Securities and Structured Products - Equity | | | | | | | | | | 2,687 | | | 1,179 | |
Unsecured Debt - 2.6% | | | | | | | | | | | | |
| Lucky Bucks Holdings LLC(t) | | 12.50% | | 5/29/2028 | | Hotel, Gaming & Leisure | | 22,860 | | | 22,860 | | | 15,316 | |
| WPLM Acquisition Corp.(t) | | 15.00% | | 11/24/2025 | | Media: Advertising, Printing & Publishing | | 7,623 | | | 7,567 | | | 7,327 | |
| Total Unsecured Debt | | | | | | | | | | 30,427 | | | 22,643 | |
Equity - 12.1% | | | | | | | | | | | | |
ARC Financial Partners, LLC, Membership Interests (25% ownership)(o)(r) | | | | | | Metals & Mining | | NA | | — | | | — | |
| Ascent Resources - Marcellus, LLC, Membership Units(o) | | | | | | Energy: Oil & Gas | | 511,255 Units | | 1,642 | | | 1,235 | |
| Ascent Resources - Marcellus, LLC, Warrants(o) | | | | | | Energy: Oil & Gas | | 132,367 Units | | 13 | | | 3 | |
| Carestream Health Holdings Inc., Common Stock(o)(r) | | | | | | Healthcare & Pharmaceuticals | | 613,262 Units | | 21,758 | | | 21,544 | |
| CF Arch Holdings LLC, Class A Units(o) | | | | | | Services: Business | | 380,952 Units | | 381 | | | 442 | |
| CION/EagleTree Partners, LLC, Participating Preferred Shares(h)(o)(s) | | | | | | Diversified Financials | | 22,072,841 Units | | 22,073 | | | 30,766 | |
CION/EagleTree Partners, LLC, Membership Units (85% ownership)(h)(o)(s) | | | | | | Diversified Financials | | NA | | — | | | — | |
| DBI Investors, Inc., Series A1 Preferred Stock(o) | | | | | | Retail | | 20,000 Units | | 802 | | | 28 | |
| DBI Investors, Inc., Series A2 Preferred Stock(o) | | | | | | Retail | | 1,733 Units | | — | | | 2 | |
| DBI Investors, Inc., Series A Preferred Stock(o) | | | | | | Retail | | 1,396 Units | | 140 | | | 2 | |
| DBI Investors, Inc., Series B Preferred Stock(o) | | | | | | Retail | | 4,183 Units | | 410 | | | 2 | |
| DBI Investors, Inc., Common Stock(o) | | | | | | Retail | | 39,423 Units | | — | | | — | |
| DBI Investors, Inc., Reallocation Rights(o) | | | | | | Retail | | 7,500 Units | | — | | | — | |
| FWS Parent Holdings, LLC. Class A Membership Interests(o) | | | | | | Services: Business | | 35,242 Units | | 800 | | | 742 | |
| GSC Technologies Inc., Common Shares(o)(r) | | | | | | Chemicals, Plastics & Rubber | | 807,268 Units | | — | | | — | |
| Independent Pet Partners Intermediate Holdings, LLC, Class A Preferred Units(o) | | | | | | Retail | | 1,000,000 Units | | 1,000 | | | 60 | |
| Independent Pet Partners Intermediate Holdings, LLC, Class B-2 Preferred Units(m)(o) | | | | | | Retail | | 2,632,771 Units | | 2,133 | | | 3,238 | |
| Independent Pet Partners Intermediate Holdings, LLC, Class C Preferred Units(m)(o) | | | | | | Retail | | 2,632,771 Units | | 2,633 | | | 2,238 | |
| Independent Pet Partners Intermediate Holdings, LLC, Warrants(o) | | | | | | Retail | | 155,880 Units | | — | | | — | |
| Instant Web Holdings, LLC, Class A Common Units(o)(r) | | | | | | Media: Advertising, Printing & Publishing | | 10,819 Units | | — | | | — | |
| Language Education Holdings GP LLC, Common Units(o)(r) | | | | | | Services: Business | | 366,667 Units | | — | | | — | |
| Language Education Holdings LP, Ordinary Common Units(o)(r) | | | | | | Services: Business | | 366,667 Units | | 825 | | | 1,173 | |
| Longview Intermediate Holdings C, LLC, Membership Units(o)(r) | | | | | | Energy: Oil & Gas | | 653,989 Units | | 2,704 | | | 23,995 | |
| Mount Logan Capital Inc., Common Stock(f)(h)(r) | | | | | | Banking, Finance, Insurance & Real Estate | | 1,075,557 Units | | 3,534 | | | 2,341 | |
| New Giving Acquisition, Inc., Warrants(o) | | | | | | Healthcare & Pharmaceuticals | | 4,630 Units | | 633 | | | 786 | |
| NS NWN Acquisition, LLC, Class A Preferred Units(o) | | | | | | High Tech Industries | | 111 Units | | 110 | | | 909 | |
| NS NWN Acquisition, LLC, Common Equity(o) | | | | | | High Tech Industries | | 346 Units | | 393 | | | — | |
See accompanying notes to consolidated financial statements.
CĪON Investment Corporation
Consolidated Schedule of Investments
December 31, 2022
(in thousands)
| | | | | | | | | | | | | | | | | | | | | | | | | | | | | | | | | | |
| Portfolio Company(a) | | Interest | | | | Industry | | Principal/
Par Amount/
Units(e) | | Cost(d) | | Fair
Value(c) |
| NS NWN Holdco LLC, Non-Voting Units(o) | | | | | | High Tech Industries | | 522 Units | | 504 | | | 200 | |
| NSG Co-Invest (Bermuda) LP, Partnership Interests(h)(o) | | | | | | Consumer Goods: Durable | | 1,575 Units | | 1,000 | | | 664 | |
| Palmetto Clean Technology, Inc., Warrants(o) | | | | | | High Tech Industries | | 724,112 Units | | 471 | | | 3,867 | |
| RumbleOn, Inc., Warrants(o) | | | | | | Automotive | | 60,606 Units | | 927 | | | 1 | |
| Service Compression, LLC, Warrants(o) | | | | | | Energy: Oil & Gas | | N/A | | 509 | | | 441 | |
| Snap Fitness Holdings, Inc., Class A Common Stock(o)(r) | | | | | | Services: Consumer | | 9,858 Units | | 3,078 | | | 5,123 | |
| Snap Fitness Holdings, Inc., Warrants(o)(r) | | | | | | Services: Consumer | | 3,996 Units | | 1,247 | | | 2,077 | |
| STATinMed Parent, LLC, Class A Preferred Units(o)(r) | | | | | | Healthcare & Pharmaceuticals | | 6,182 Units | | 6,182 | | | 4,530 | |
| STATinMed Parent, LLC, Class B Preferred Units(o)(r) | | | | | | Healthcare & Pharmaceuticals | | 51,221 Units | | 3,193 | | | 134 | |
| WorkGenius, LLC, Class A Units(o) | | | | | | Services: Business | | 500 Units | | 500 | | | 515 | |
| Total Equity | | | | | | | | | | 79,595 | | | 107,058 | |
Short Term Investments - 1.2%(k) | | | | | | | | | | | | |
| First American Treasury Obligations Fund, Class Z Shares | | 3.95%(l) | | | | | | | | 10,869 | | | 10,869 | |
| Total Short Term Investments | | | | | | | | | | 10,869 | | | 10,869 | |
TOTAL INVESTMENTS - 199.2% | | | | | | | | | | $ | 1,803,609 | | | 1,760,030 | |
LIABILITIES IN EXCESS OF OTHER ASSETS - (99.2)% | | | | | | | | | | (876,396) | |
NET ASSETS - 100.0% | | | | | | | | | | | | $ | 883,634 | |
a.All of the Company’s investments are issued by eligible U.S. portfolio companies, as defined in the 1940 Act except for investments specifically identified as non-qualifying per note h. below. Unless specifically identified in note t. below, investments do not contain a PIK interest provision.
b.The actual LIBOR rate for each loan listed may not be the applicable LIBOR rate as of December 31, 2022, as the loan may have been priced or repriced based on a LIBOR rate prior to or subsequent to December 31, 2022. The actual SOFR rate for each loan listed may not be the applicable SOFR rate as of December 31, 2022, as the loan may have been priced or repriced based on a SOFR rate prior to or subsequent to December 31, 2022.
c.Fair value determined in good faith by the Company’s board of directors (see Note 9), including via delegation to CIM as the Company’s valuation designee (see Note 2), using significant unobservable inputs unless otherwise noted.
d.Represents amortized cost for debt securities and cost for equity investments.
e.Denominated in U.S. dollars unless otherwise noted.
f.Fair value determined using level 1 inputs.
g.The CLO subordinated notes are considered equity positions in the CLO vehicles and are not rated. Equity investments are entitled to recurring distributions, which are generally equal to the remaining cash flow of the payments made by the underlying vehicle's securities less contractual payments to debt holders and expenses. The estimated yield indicated is based upon a current projection of the amount and timing of these recurring distributions and the estimated amount of repayment of principal upon termination. Such projections are periodically reviewed and adjusted, and the estimated yield may not ultimately be realized.
h.The investment or a portion thereof is not a qualifying asset under the 1940 Act. A business development company may not acquire any asset other than qualifying assets, unless, at the time the acquisition is made, qualifying assets represent at least 70% of the company’s total assets as defined under Section 55 of the 1940 Act. As of December 31, 2022, 93.4% of the Company’s total assets represented qualifying assets.
See accompanying notes to consolidated financial statements.
CĪON Investment Corporation
Consolidated Schedule of Investments
December 31, 2022
(in thousands)
i.[Reserved]
j.In addition to the interest earned based on the stated interest rate of this loan, which is the amount reflected in this schedule, the Company may be entitled to receive additional residual amounts.
k.Short term investments represent an investment in a fund that invests in highly liquid investments with average original maturity dates of three months or less.
l.7-day effective yield as of December 31, 2022.
m.Investment or a portion thereof held within the Company’s wholly-owned consolidated subsidiary, 34th Street, and was pledged as collateral supporting the amounts outstanding under the credit facility with JPM as of December 31, 2022 (see Note 8).
n.Investment or a portion thereof held within the Company’s wholly-owned consolidated subsidiary, Murray Hill Funding II, and was pledged as collateral supporting the amounts outstanding under the repurchase agreement with UBS as of December 31, 2022 (see Note 8).
o.Non-income producing security.
p.The ultimate interest earned on this loan will be determined based on the portfolio company’s EBITDA at a specified trigger event.
q.Investment or a portion thereof was on non-accrual status as of December 31, 2022.
See accompanying notes to consolidated financial statements.
CĪON Investment Corporation
Consolidated Schedule of Investments
December 31, 2022
(in thousands)
r.Investment determined to be an affiliated investment as defined in the 1940 Act as the Company owns between 5% and 25% of the portfolio company’s outstanding voting securities but does not control the portfolio company. Fair value as of December 31, 2021 and 2022, along with transactions during the year ended December 31, 2022 in these affiliated investments, were as follows:
| | | | | | | | | | | | | | | | | | | | | | | | | | | | | | | | | | | | | | | | | | | | | | | | | | |
| | | | Year Ended December 31, 2022 | | | | Year Ended December 31, 2022 |
| Non-Controlled, Affiliated Investments | | Fair Value at
December 31, 2021 | | Gross
Additions
(Cost)(1) | | Gross
Reductions
(Cost)(2) | | Net Unrealized Gain (Loss) | | Fair Value at December 31, 2022 | | Net Realized Gain (Loss) | | Interest
Income(3) | | Dividend Income |
| | | | | | | | | | | | | | | | |
| | | | | | | | | | | | | | | | |
| | | | | | | | | | | | | | | | |
| ARC Financial, LLC | | | | | | | | | | | | | | | | |
| Membership Interests | | $ | — | | | $ | — | | | $ | — | | | $ | — | | | $ | — | | | $ | — | | | $ | — | | | $ | 25 | |
| Berlitz Holdings, Inc. | | | | | | | | | | | | | | | | |
| First Lien Term Loan | | — | | | 13,956 | | | (13,956) | | | — | | | — | | | — | | | 393 | | | — | |
| | | | | | | | | | | | | | | | |
| | | | | | | | | | | | | | | | |
| Carestream Health, Inc. | | | | | | | | | | | | | | | | |
| First Lien Term Loan | | — | | | 7,596 | | | — | | | (57) | | | 7,539 | | | — | | | 284 | | | — | |
| Carestream Health Holdings Inc. | | | | | | | | | | | | | | | | |
| Common Shares | | — | | | 21,758 | | | — | | | (214) | | | 21,544 | | | — | | | — | | | — | |
| Charming Charlie, LLC | | | | | | | | | | | | | | | | |
| Vendor Payment Financing Facility | | 350 | | | — | | | (657) | | | 307 | | | — | | | (657) | | | 26 | | | — | |
| | | | | | | | | | | | | | | | |
| | | | | | | | | | | | | | | | |
| | | | | | | | | | | | | | | | |
| DESG Holdings, Inc. | | | | | | | | | | | | | | | | |
| First Lien Term Loan | | 1,787 | | | — | | | (306) | | | (1,235) | | | 246 | | | — | | | 5 | | | — | |
| Second Lien Term Loan | | — | | | — | | | (10,017) | | | 10,017 | | | — | | | (10,017) | | | — | | | — | |
| | | | | | | | | | | | | | | | |
| | | | | | | | | | | | | | | | |
| | | | | | | | | | | | | | | | |
| GSC Technologies Inc. | | | | | | | | | | | | | | | | |
| Incremental Term Loan | | 170 | | | 8 | | | (24) | | | — | | | 154 | | | — | | | 22 | | | — | |
| First Lien Term Loan A | | 2,001 | | | 26 | | | — | | | 37 | | | 2,064 | | | — | | | 193 | | | — | |
| First Lien Term Loan B | | 485 | | | 67 | | | — | | | (164) | | | 388 | | | — | | | 72 | | | — | |
| Common Shares | | — | | | — | | | — | | | — | | | — | | | — | | | — | | | — | |
| Instant Web Holdings, LLC | | | | | | | | | | | | | | | | |
| Class A Common Units | | — | | | — | | | — | | | — | | | — | | | — | | | — | | | — | |
| Instant Web, LLC | | | | | | | | | | | | | | | | |
| Revolving Loan | | — | | | 970 | | | (649) | | | — | | | 321 | | | — | | | 26 | | | — | |
| Priming Term Loan | | — | | | 458 | | | — | | | 11 | | | 469 | | | — | | | 36 | | | — | |
| First Lien Term Loan | | — | | | 39,802 | | | — | | | (11,635) | | | 28,167 | | | — | | | 3,314 | | | — | |
| First Lien Delayed Draw Term Loan | | — | | | — | | | — | | | — | | | — | | | — | | | 14 | | | — | |
| Language Education Holdings GP LLC | | | | | | | | | | | | | | | | |
| Common Units | | — | | | — | | | — | | | — | | | — | | | — | | | — | | | — | |
| Language Education Holdings LP | | | | | | | | | | | | | | | | |
| Ordinary Common Units | | — | | | 1,125 | | | (1,125) | | | — | | | — | | | — | | | — | | | — | |
| Lift Brands, Inc. | | | | | | | | | | | | | | | | |
| Term Loan A | | 23,406 | | | — | | | (236) | | | 117 | | | 23,287 | | | — | | | 2,252 | | | — | |
| Term Loan B | | 5,156 | | | 235 | | | — | | | (237) | | | 5,154 | | | — | | | 545 | | | — | |
| Term Loan C | | 4,700 | | | 133 | | | — | | | (101) | | | 4,732 | | | — | | | 1,412 | | | — | |
| Longview Intermediate Holdings C, LLC | | | | | | | | | | | | | | | | |
| Membership Units | | 15,127 | | | — | | | — | | | 8,868 | | | 23,995 | | | — | | | — | | | — | |
| Longview Power, LLC | | | | | | | | | | | | | | | | |
| First Lien Term Loan | | 4,504 | | | 156 | | | (1,391) | | | (921) | | | 2,348 | | | — | | | 1,952 | | | — | |
| Mount Logan Capital Inc. | | | | | | | | | | | | | | | | |
| Common Stock | | 3,404 | | | — | | | — | | | (1,063) | | | 2,341 | | | — | | | — | | | 54 | |
| SIMR, LLC | | | | | | | | | | | | | | | | |
| First Lien Term Loan | | 16,000 | | | 1,447 | | | (21,261) | | | 3,814 | | | — | | | (2,854) | | | 804 | | | — | |
| SIMR Parent, LLC | | | | | | | | | | | | | | | | |
| Class B Membership Units | | — | | | — | | | (8,002) | | | 8,002 | | | — | | | (8,002) | | | — | | | — | |
| Class W Membership Units | | — | | | — | | | — | | | — | | | — | | | — | | | — | | | — | |
| | | | | | | | | | | | | | | | |
| | | | | | | | | | | | | | | | |
| | | | | | | | | | | | | | | | |
| | | | | | | | | | | | | | | | |
| | | | | | | | | | | | | | | | |
| | | | | | | | | | | | | | | | |
| | | | | | | | | | | | | | | | |
| | | | | | | | | | | | | | | | |
| | | | | | | | | | | | | | | | |
See accompanying notes to consolidated financial statements
CĪON Investment Corporation
Consolidated Schedule of Investments
December 31, 2022
(in thousands)
| | | | | | | | | | | | | | | | | | | | | | | | | | | | | | | | | | | | | | | | | | | | | | | | | | |
| | | | Year Ended December 31, 2022 | | | | Year Ended December 31, 2022 |
| Non-Controlled, Affiliated Investments | | Fair Value at
December 31, 2021 | | Gross
Additions
(Cost)(1) | | Gross
Reductions
(Cost)(2) | | Net Unrealized Gain (Loss) | | Fair Value at December 31, 2022 | | Net Realized Gain (Loss) | | Interest
Income(3) | | Dividend Income |
| | | | | | | | | | | | | | | | |
| | | | | | | | | | | | | | | | |
| | | | | | | | | | | | | | | | |
| | | | | | | | | | | | | | | | |
| | | | | | | | | | | | | | | | |
| | | | | | | | | | | | | | | | |
| | | | | | | | | | | | | | | | |
| | | | | | | | | | | | | | | | |
| | | | | | | | | | | | | | | | |
| | | | | | | | | | | | | | | | |
| | | | | | | | | | | | | | | | |
| | | | | | | | | | | | | | | | |
| | | | | | | | | | | | | | | | |
| | | | | | | | | | | | | | | | |
| | | | | | | | | | | | | | | | |
| | | | | | | | | | | | | | | | |
| | | | | | | | | | | | | | | | |
| | | | | | | | | | | | | | | | |
| | | | | | | | | | | | | | | | |
| | | | | | | | | | | | | | | | |
| | | | | | | | | | | | | | | | |
| | | | | | | | | | | | | | | | |
| | | | | | | | | | | | | | | | |
| | | | | | | | | | | | | | | | |
| | | | | | | | | | | | | | | | |
| | | | | | | | | | | | | | | | |
| | | | | | | | | | | | | | | | |
| | | | | | | | | | | | | | | | |
| | | | | | | | | | | | | | | | |
| | | | | | | | | | | | | | | | |
| | | | | | | | | | | | | | | | |
| | | | | | | | | | | | | | | | |
| | | | | | | | | | | | | | | | |
| | | | | | | | | | | | | | | | |
| | | | | | | | | | | | | | | | |
| | | | | | | | | | | | | | | | |
| | | | | | | | | | | | | | | | |
| | | | | | | | | | | | | | | | |
| | | | | | | | | | | | | | | | |
| | | | | | | | | | | | | | | | |
| | | | | | | | | | | | | | | | |
| | | | | | | | | | | | | | | | |
| | | | | | | | | | | | | | | | |
| | | | | | | | | | | | | | | | |
| | | | | | | | | | | | | | | | |
| | | | | | | | | | | | | | | | |
| | | | | | | | | | | | | | | | |
| | | | | | | | | | | | | | | | |
| | | | | | | | | | | | | | | | |
| | | | | | | | | | | | | | | | |
| | | | | | | | | | | | | | | | |
| | | | | | | | | | | | | | | | |
| | | | | | | | | | | | | | | | |
| | | | | | | | | | | | | | | | |
| | | | | | | | | | | | | | | | |
| Snap Fitness Holdings, Inc. | | | | | | | | | | | | | | | | |
| Class A Stock | | 3,131 | | | — | | | — | | | 1,992 | | | 5,123 | | | — | | | — | | | — | |
| Warrants | | 1,269 | | | — | | | — | | | 808 | | | 2,077 | | | — | | | — | | | — | |
| STATinMED, LLC | | | | | | | | | | | | | | | | |
| First Lien Term Loan | | — | | | 9,472 | | | (250) | | | (115) | | | 9,107 | | | — | | | 719 | | | — | |
| Delayed Draw First Lien Term Loan | | — | | | 153 | | | — | | | 3 | | | 156 | | | — | | | — | | | — | |
| STATinMed Parent, LLC | | | | | | | | | | | | | | | | |
| Class A Preferred Units | | — | | | 6,182 | | | — | | | (1,652) | | | 4,530 | | | — | | | — | | | — | |
| Class B Preferred Units | | — | | | 3,193 | | | — | | | (3,059) | | | 134 | | | — | | | — | | | — | |
| Totals | | $ | 81,490 | | | $ | 106,737 | | | $ | (57,874) | | | $ | 13,523 | | | $ | 143,876 | | | $ | (21,530) | | | $ | 12,069 | | | $ | 79 | |
(1)Gross additions include increases in the cost basis of investments resulting from new portfolio investments, PIK interest, the amortization of unearned income, the exchange of one or more existing securities for one or more new securities and the movement of an existing portfolio company into this category from a different category.
(2)Gross reductions include decreases in the cost basis of investments resulting from principal collections related to investment repayments or sales, the exchange of one or more existing securities for one or more new securities and the movement of an existing portfolio company out of this category into a different category.
(3)Includes PIK interest income.
s.Investment determined to be a controlled investment as defined in the 1940 Act as the Company is deemed to exercise a controlling influence over the management or policies of the portfolio company due to beneficially owning, either directly or through one or more controlled companies, more than 25% of the outstanding voting securities of such portfolio company. Fair value as of December 31, 2021 and 2022, along with transactions during the year ended December 31, 2022 in these controlled investments, were as follows:
| | | | | | | | | | | | | | | | | | | | | | | | | | | | | | | | | | | | | | | | | | | | | | | | | | |
| | | | Year Ended December 31, 2022 | | | | Year Ended December 31, 2022 |
| Controlled Investments | | Fair Value at
December 31, 2021 | | Gross
Additions
(Cost)(1) | | Gross
Reductions
(Cost)(2) | | Net
Unrealized
Gain (Loss) | | Fair Value at
December 31, 2022 | | Net Realized
Gain (Loss) | | Interest
Income(3) | | Dividend Income |
| CION/EagleTree Partners, LLC | | | | | | | | | | | | | | | | |
| Senior Secured Note | | $ | 61,629 | | | $ | 2,718 | | | $ | (3,999) | | | $ | — | | | $ | 60,348 | | | $ | — | | | $ | 8,531 | | | $ | — | |
| Participating Preferred Shares | | 29,796 | | | — | | | — | | | 970 | | | 30,766 | | | — | | | — | | | 1,275 | |
| Common Shares | | — | | | — | | | — | | | — | | | — | | | — | | | — | | | — | |
| Totals | | $ | 91,425 | | | $ | 2,718 | | | $ | (3,999) | | | $ | 970 | | | $ | 91,114 | | | $ | — | | | $ | 8,531 | | | $ | 1,275 | |
(1)Gross additions include increases in the cost basis of investments resulting from new portfolio investments, PIK interest, the amortization of unearned income, the exchange of one or more existing securities for one or more new securities and the movement of an existing portfolio company into this category from a different category.
(2)Gross reductions include decreases in the cost basis of investments resulting from principal collections related to investment repayments or sales, the exchange of one or more existing securities for one or more new securities and the movement of an existing portfolio company out of this category into a different category.
(3)Includes PIK interest income.
See accompanying notes to consolidated financial statements.
CĪON Investment Corporation
Consolidated Schedule of Investments
December 31, 2022
(in thousands)
t.As of December 31, 2022, the following investments contain a PIK interest provision whereby the issuer has either the option or the obligation to make interest payments with the issuance of additional securities:
| | | | | | | | | | | | | | | | | | | | | | | | | | |
| | | | | Interest Rate |
| Portfolio Company | | Investment Type | | Cash | | PIK | | All-in-Rate |
| Adapt Laser Acquisition, Inc. | | Senior Secured First Lien Debt | | 14.76% | | 2.00% | | 16.76% |
| American Clinical Solutions LLC | | Senior Secured First Lien Debt | | 7.00% | | 4.27% | | 11.27% |
| American Consolidated Natural Resources, Inc. | | Senior Secured First Lien Debt | | 17.33% | | 3.00% | | 20.33% |
| Ancile Solutions, Inc. | | Senior Secured First Lien Debt | | 11.75% | | 3.00% | | 14.75% |
| Anthem Sports & Entertainment Inc. | | Senior Secured First Lien Debt | | 11.48% | | 2.75% | | 14.23% |
| Cadence Aerospace, LLC | | Senior Secured First Lien Debt | | 10.92% | | 2.00% | | 12.92% |
| CION/EagleTree Partners, LLC | | Senior Secured Note | | — | | 14.00% | | 14.00% |
| | | | | | | | |
| David's Bridal, LLC | | Senior Secured First Lien Debt | | 9.28% | | 5.00% | | 14.28% |
| David's Bridal, LLC | | Senior Secured First Lien Debt | | 1.00% | | 9.42% | | 10.42% |
| Deluxe Entertainment Services, Inc. | | Senior Secured First Lien Debt | | 9.73% | | 1.50% | | 11.23% |
| Fusion Connect Inc. | | Senior Secured First Lien Debt | | 11.69% | | 1.00% | | 12.69% |
| GSC Technologies Inc. | | Senior Secured First Lien Debt | | — | | 9.12% | | 9.12% |
| GSC Technologies Inc. | | Senior Secured First Lien Debt | | 9.37% | | 5.00% | | 14.37% |
| Hilliard, Martinez & Gonzales, LLP | | Senior Secured First Lien Debt | | — | | 16.24% | | 16.24% |
| Homer City Generation, L.P. | | Senior Secured First Lien Debt | | — | | 15.00% | | 15.00% |
| Independent Pet Partners Intermediate Holdings, LLC | | Senior Secured First Lien Debt | | — | | 6.00% | | 6.00% |
| Independent Pet Partners Intermediate Holdings, LLC | | Senior Secured First Lien Debt | | — | | 13.00% | | 13.00% |
| Independent Pet Partners Intermediate Holdings, LLC | | Senior Secured First Lien Debt | | — | | 11.26% | | 11.26% |
| Independent Pet Partners Intermediate Holdings, LLC | | Senior Secured First Lien Debt | | — | | 14.42% | | 14.42% |
| Instant Web, LLC | | Senior Secured First Lien Debt | | — | | 11.38% | | 11.38% |
| | | | | | | | |
| | | | | | | | |
| | | | | | | | |
| Lucky Bucks Holdings LLC | | Unsecured Note | | — | | 12.50% | | 12.50% |
| | | | | | | | |
| Robert C. Hilliard, L.L.P. | | Senior Secured First Lien Debt | | — | | 16.24% | | 16.24% |
| Rogers Mechanical Contractors, LLC | | Senior Secured First Lien Debt | | 11.70% | | 1.00% | | 12.70% |
| Service Compression, LLC | | Senior Secured First Lien Debt | | 12.83% | | 2.00% | | 14.83% |
| Spinal USA, Inc. / Precision Medical Inc. | | Senior Secured First Lien Debt | | — | | 13.24% | | 13.24% |
| STATinMED, LLC | | Senior Secured First Lien Debt | | — | | 13.80% | | 13.80% |
| STATinMED, LLC | | Senior Secured First Lien Debt | | — | | 13.94% | | 13.94% |
| Trademark Global, LLC | | Senior Secured First Lien Debt | | 7.07% | | 4.50% | | 11.57% |
| Trammell, P.C. | | Senior Secured First Lien Debt | | — | | 19.94% | | 19.94% |
| Vesta Holdings, LLC | | Senior Secured First Lien Debt | | — | | 21.50% | | 21.50% |
| Williams Industrial Services Group, Inc. | | Senior Secured First Lien Debt | | 10.00% | | 2.75% | | 12.75% |
| WPLM Acquisition Corp. | | Unsecured Note | | — | | 15.00% | | 15.00% |
| | | | | | | | |
| | | | | | | | |
| | | | | | | | |
| | | | | | | | |
u.As of December 31, 2022, the index rate for $2,096 and $1,943 was 1 Month LIBOR and 3 Month LIBOR, respectively.
v.[Reserved]
w.The interest rate on these loans is subject to 1 month LIBOR, which as of December 31, 2022 was 5.47%.
x.The interest rate on these loans is subject to 3 month LIBOR, which as of December 31, 2022 was 5.59%.
y.The interest rate on these loans is subject to 6 month LIBOR, which as of December 31, 2022 was 5.16%.
z.The interest rate on these loans is subject to 1 month SOFR, which as of December 31, 2022 was 5.35%.
aa.The interest rate on these loans is subject to 3 month SOFR, which as of December 31, 2022 was 5.33%.
See accompanying notes to consolidated financial statements.
CĪON Investment Corporation
Notes to Consolidated Financial Statements
December 31, 2023
(in thousands, except share and per share amounts)
Note 1. Organization and Principal Business
CĪON Investment Corporation, or the Company, was incorporated under the general corporation laws of the State of Maryland on August 9, 2011. On December 17, 2012, the Company successfully raised gross proceeds from unaffiliated outside investors of at least $2,500, or the minimum offering requirement, and commenced operations. The Company is an externally managed, non-diversified, closed-end management investment company that has elected to be regulated as a business development company, or BDC, under the 1940 Act. The Company elected to be treated for federal income tax purposes as a regulated investment company, or RIC, as defined under Subchapter M of the Internal Revenue Code of 1986, as amended, or the Code.
The Company’s investment objective is to generate current income and, to a lesser extent, capital appreciation for investors. The Company’s portfolio is comprised primarily of investments in senior secured debt, including first lien loans, second lien loans and unitranche loans, and, to a lesser extent, collateralized securities, structured products and other similar securities, unsecured debt, and equity, of private and thinly-traded U.S. middle-market companies.
The Company is managed by CION Investment Management, LLC, or CIM, a registered investment adviser and an affiliate of the Company. Pursuant to an investment advisory agreement with the Company, CIM oversees the management of the Company’s activities and is responsible for making investment decisions for the Company’s investment portfolio. On August 7, 2023, the board of directors of the Company, including a majority of the board of directors who are not interested persons, approved the renewal of the second amended and restated investment advisory agreement with CIM for a period of twelve months, commencing August 9, 2023. The Company has also entered into an administration agreement with CIM to provide the Company with administrative services necessary for it to operate. The Company and CIM previously engaged Apollo Investment Management, L.P., or AIM, a subsidiary of Apollo Global Management, Inc., or, together with its subsidiaries, Apollo, a leading global alternative investment manager, to act as the Company’s investment sub-adviser.
On July 11, 2017, the members of CIM entered into a third amended and restated limited liability company agreement of CIM, or the Third Amended CIM LLC Agreement, for the purpose of creating a joint venture between AIM and CION Investment Group, LLC, or CIG, an affiliate of the Company. Under the Third Amended CIM LLC Agreement, AIM became a member of CIM and was issued a newly-created class of membership interests in CIM pursuant to which AIM, among other things, shares in the profits, losses, distributions and expenses of CIM with the other members in accordance with the terms of the Third Amended CIM LLC Agreement, which results in CIG and AIM each owning a 50% economic interest in CIM.
On July 10, 2017, the Company’s independent directors unanimously approved the termination of the investment sub-advisory agreement with AIM, effective as of July 11, 2017. Although the investment sub-advisory agreement and AIM's engagement as the Company’s investment sub-adviser were terminated, AIM continues to perform certain services for CIM and the Company. AIM is not paid a separate fee in exchange for such services, but is entitled to receive distributions as a member of CIM as described above.
On December 4, 2017, the members of CIM entered into a fourth amended and restated limited liability company agreement of CIM, or the Fourth Amended CIM LLC Agreement, under which AIM performs certain services for CIM, which include, among other services, providing (a) trade and settlement support; (b) portfolio and cash reconciliation; (c) market pipeline information regarding syndicated deals, in each case, as reasonably requested by CIM; and (d) monthly valuation reports and support for all broker-quoted investments. AIM may also, from time to time, provide the Company with access to potential investment opportunities made available on Apollo's credit platform on a similar basis as other third-party market participants. All of the Company's investment decisions are the sole responsibility of, and are made at the sole discretion of, CIM's investment committee, which consists entirely of CIG senior personnel.
The amended and restated investment advisory agreement was approved by shareholders on August 9, 2021 at the Company’s reconvened 2021 annual meeting of shareholders. As a result, on August 10, 2021, the Company and CIM entered into the amended and restated investment advisory agreement in order to implement the change to the calculation of the subordinated incentive fee payable from the Company to CIM that expresses the hurdle rate required for CIM to earn, and be paid, the incentive fee as a percentage of the Company’s net assets rather than adjusted capital.
On October 5, 2021, the Company's shares of common stock commenced trading on the New York Stock Exchange, or the NYSE, under the ticker symbol "CION", or the Listing. As a result, on October 5, 2021, the Company and CIM entered into the second amended and restated investment advisory agreement in order to implement the changes to the advisory fees payable from the Company to CIM that became effective upon the Listing that (i) reduced the annual base management fee, (ii) amended the structure of the subordinated incentive fee on income payable by the Company to CIM and reduced the hurdle and incentive fee rates, and (iii) reduced the incentive fee on capital gains payable by the Company to CIM (as described in further detail in Notes 2 and 4). On February 26, 2023, the Company’s shares of common stock and the Company's Series A Notes listed and commenced trading in Israel on the Tel Aviv Stock Exchange Ltd., or the TASE, under the ticker symbol “CION” and "CION B1", respectively.
CĪON Investment Corporation
Notes to Consolidated Financial Statements
December 31, 2023
(in thousands, except share and per share amounts)
Note 2. Summary of Significant Accounting Policies
Basis of Presentation and Consolidation
The accompanying consolidated financial statements of the Company have been prepared in accordance with U.S. generally accepted accounting principles, or GAAP, and include the accounts of the Company and its wholly-owned subsidiaries. The Company is considered an investment company as defined in Accounting Standards Codification Topic 946, Financial Services – Investment Companies, or ASC 946. Accordingly, the required disclosures as outlined in ASC 946 are included in the Company’s consolidated financial statements. In the opinion of management, all adjustments (consisting of normal recurring adjustments) considered necessary for a fair presentation have been included. All intercompany balances and transactions have been eliminated in consolidation. The Company did not consolidate its equity interest in CION SOF Funding, LLC, or CION SOF, and the Company does not consolidate its equity interest in CION/EagleTree Partners, LLC, or CION/EagleTree. See Note 7 for a description of the Company’s investments in CION SOF and CION/EagleTree.
The Company evaluates subsequent events through the date that the consolidated financial statements are issued.
Recent Accounting Pronouncements
In June 2022, the Financial Accounting Standards Board, or the FASB, issued ASU 2022-03, Fair Value Measurement (Topic 820): Fair Value Measurement of Equity Securities Subject to Contractual Sale Restrictions, or ASU 2022-03, which clarifies the guidance when measuring the fair value of an equity security subject to contractual restrictions that prohibit the sale of an equity security and introduces new disclosure requirements for equity securities subject to contractual sale restrictions that are measured at fair value in accordance with Topic 820. ASU 2022-03 is effective for fiscal years beginning after December 15, 2023, and interim periods within fiscal years beginning after December 15, 2023. The Company is evaluating the potential impact that the adoption of this guidance will have on the Company’s consolidated financial statements.
In March 2020, the FASB issued ASU 2020-04, Reference Rate Reform (Topic 848): Facilitation of the Effects of Reference Rate Reform on Financial Reporting, or ASU 2020-04, which provides optional expedients and exceptions for applying GAAP to contract modifications, hedging relationships and other transactions, subject to meeting certain criteria, that reference LIBOR or another reference rate expected to be discontinued because of the reference rate reform. ASU 2020-04 is effective for all entities as of March 12, 2020 through December 31, 2022. The expedients and exceptions provided by this guidance do not apply to contract modifications and hedging relationships entered into or evaluated after December 31, 2022. In December 2022, the FASB issued ASU No. 2022-06, Reference Rate Reform (Topic 848): Deferral of the Sunset Date of Topic 848, which deferred the sunset date of this guidance to December 31, 2024. The Company is evaluating the potential impact that the adoption of this guidance will have on the Company’s consolidated financial statements.
Cash and Cash Equivalents
Cash and cash equivalents include cash in banks and highly liquid investments with original maturity dates of three months or less. The Company’s cash and cash equivalents are held principally at one financial institution and at times may exceed insured limits. The Company periodically evaluates the creditworthiness of this institution and has not experienced any losses on such deposits.
CĪON Investment Corporation
Notes to Consolidated Financial Statements
December 31, 2023
(in thousands, except share and per share amounts)
Foreign Currency Translations
The accounting records of the Company are maintained in U.S. dollars. All assets and liabilities denominated in foreign currencies are translated into U.S. dollars based on the foreign exchange rate on the date of valuation. The Company does not isolate that portion of the results of operations resulting from changes in foreign exchange rates on investments from the fluctuations arising from changes in market prices of securities held. Changes in the relationship of foreign currencies to the U.S. dollar can significantly affect the value of these investments and therefore the earnings of the Company.
Short Term Investments
Short term investments include an investment in a U.S. Treasury obligations fund, which seeks to provide current income and daily liquidity by purchasing U.S. Treasury securities and repurchase agreements that are collateralized by such securities. The Company had $113,446 and $10,869 of such investments at December 31, 2023 and 2022, respectively, which are included in investments, at fair value on the accompanying consolidated balance sheets and on the consolidated schedules of investments.
Income Taxes
The Company elected to be treated for federal income tax purposes as a RIC under Subchapter M of the Code. To qualify and maintain qualification as a RIC, the Company must, among other things, meet certain source of income and asset diversification requirements and distribute to shareholders, for each taxable year, at least 90% of the Company’s “investment company taxable income”, which is generally equal to the sum of the Company’s net ordinary income plus the excess, if any, of realized net short-term capital gains over realized net long-term capital losses. If the Company continues to qualify as a RIC and continues to satisfy the annual distribution requirement, the Company will not be subject to corporate level federal income taxes on any income that the Company distributes to its shareholders. The Company intends to make distributions in an amount sufficient to maintain RIC status each year and to avoid any federal income taxes on income. The Company will also be subject to nondeductible federal excise taxes if the Company does not distribute at least 98.0% of net ordinary income, 98.2% of capital gains, if any, and any recognized and undistributed income from prior years for which it paid no federal income taxes.
Two of the Company’s wholly-owned consolidated subsidiaries, View ITC, LLC and View Rise, LLC, or collectively the Taxable Subsidiaries, have elected to be treated as taxable entities for U.S. federal income tax purposes. As a result, the Taxable Subsidiaries are not consolidated with the Company for income tax purposes and may generate income tax expense or benefit, and the related tax assets and liabilities, as a result of their ownership of certain portfolio investments. The income tax expense or benefit, if any, and the related tax assets and liabilities, where material, are reflected in the Company’s consolidated financial statements. There were no deferred tax assets or liabilities as of December 31, 2023 or 2022.
Book/tax differences relating to permanent differences are reclassified among the Company’s capital accounts, as appropriate. Additionally, the tax character of distributions is determined in accordance with income tax regulations that may differ from GAAP (see Note 14).
Uncertainty in Income Taxes
The Company evaluates its tax positions to determine if the tax positions taken meet the minimum recognition threshold for the purposes of measuring and recognizing tax liabilities in the consolidated financial statements. Recognition of a tax benefit or liability with respect to an uncertain tax position is required only when the position is “more likely than not” to be sustained assuming examination by the taxing authorities. The Company recognizes interest and penalties, if any, related to unrecognized tax benefits as income tax expense in the consolidated statements of operations. The Company did not have any uncertain tax positions during the periods presented herein.
The Company is subject to examination by U.S. federal, New York State, New York City and Maryland income tax jurisdictions for 2020, 2021 and 2022.
CĪON Investment Corporation
Notes to Consolidated Financial Statements
December 31, 2023
(in thousands, except share and per share amounts)
Use of Estimates
The preparation of the consolidated financial statements in conformity with GAAP requires the Company to make estimates and assumptions that affect the reported amounts of assets and liabilities and the disclosure of contingent assets and liabilities at the date of the consolidated financial statements and the reported amounts of revenues and expenses during the reporting period.
Actual results may materially differ from those estimates.
Valuation of Portfolio Investments
The fair value of the Company’s investments is determined quarterly in good faith by the Company’s board of directors pursuant to its consistently applied valuation procedures and valuation process in accordance with Accounting Standards Codification Topic 820, Fair Value Measurements and Disclosure, or ASC 820. In accordance with Rule 2a-5 of the 1940 Act, the Company’s board of directors has designated CIM as the Company’s “valuation designee.” The Company’s board of directors and the audit committee of the board of directors, the latter of which is comprised solely of independent directors, oversees the activities, methodology and processes of the valuation designee. ASC 820 defines fair value as the price that would be received from the sale of an asset or paid to transfer a liability in an orderly transaction between market participants at the measurement date. ASC 820 also establishes a three-tier fair value hierarchy that prioritizes and ranks the level of market price observability of inputs used in measuring investments at fair value. Inputs used to measure these fair values are classified into the following hierarchy:
Level 1 -Quoted prices in active markets for identical assets or liabilities, accessible by the Company at the measurement date.
Level 2 -Quoted prices for similar assets or liabilities in active markets, or quoted prices for identical or similar assets or liabilities in markets that are not active, or other observable inputs other than quoted prices.
Level 3 -Unobservable inputs for the asset or liability. The inputs used in the determination of fair value may require significant management judgment or estimation. Such information may be the result of consensus pricing information or broker quotes that include a disclaimer that the broker would not be held to such a price in an actual transaction. The non-binding nature of consensus pricing and/or quotes accompanied by the disclaimer would result in classification as a Level 3 asset, assuming no additional corroborating evidence.
Market price observability is affected by a number of factors, including the type of investment and the characteristics specific to the investment. Investments with readily available active quoted prices or for which fair value can be measured from actively quoted prices generally will have a higher degree of market price observability and a lesser degree of judgment used in measuring fair value.
Based on the observability of the inputs used in the valuation techniques, the Company is required to provide disclosures on fair value measurements according to the fair value hierarchy. The level in the fair value hierarchy for each fair value measurement has been determined based on the lowest level of input that is significant to the fair value measurement. Our assessment of the significance of a particular input to the fair value measurement in its entirety requires judgment and considers factors specific to each investment. The level assigned to the investment valuations may not be indicative of the risk or liquidity associated with investing in such investments. Because of the inherent uncertainties of valuation, the values reflected in the consolidated financial statements may differ materially from the value that would be received upon an actual sale of such investments. In addition, changes in the market environment and other events that may occur over the life of the investments may cause the gains or losses that the Company ultimately realizes on these investments to materially differ from the valuations currently assigned.
A portion of the Company’s investments consist of debt securities that are traded on a private over-the-counter market for institutional investments. CIM attempts to obtain market quotations from at least two brokers or dealers for each investment (if available, otherwise from a principal market maker or a primary market dealer or other independent pricing service). CIM typically uses the average midpoint of the broker bid/ask price to determine fair value unless a different point within the range is more representative. Because of the private nature of this marketplace (meaning actual transactions are not publicly reported) and the non-binding nature of consensus pricing and/or quotes, the Company believes that these valuation inputs result in Level 3 classification within the fair value hierarchy. As these quotes are only indicative of fair value, CIM benchmarks the implied fair value yield and leverage against what has been observed in the market. If the implied fair value yield and leverage fall within the range of CIM's market pricing matrix, the quotes are deemed to be reliable and used to determine the investment's fair value.
CĪON Investment Corporation
Notes to Consolidated Financial Statements
December 31, 2023
(in thousands, except share and per share amounts)
Notwithstanding the foregoing, if in the reasonable judgment of CIM, the price of any investment held by the Company and determined in the manner described above does not accurately reflect the fair value of such investment, CIM will value such investment at a price that reflects such investment’s fair value and report such change in the valuation to the board of directors or its designee as soon as practicable. Investments that carry certain restrictions on sale will typically be valued at a discount from the public market value of the investment.
Any investments that are not publicly traded or for which a market price is not otherwise readily available are valued at a price that reflects its fair value. With respect to such investments, if CIM is unable to obtain market quotations, the investments are reviewed and valued using one or more of the following types of analyses:
i.Market comparable statistics and public trading multiples discounted for illiquidity, minority ownership and other factors for companies with similar characteristics.
ii.Valuations implied by third-party investments in the applicable portfolio companies.
iii.A benchmarking analysis to compare implied fair value and leverage to comparable market investments.
iv.Discounted cash flow analysis, including a terminal value or exit multiple.
Determination of fair value involves subjective judgments and estimates. Accordingly, these notes to the Company’s consolidated financial statements refer to the uncertainty with respect to the possible effect of such valuations, and any change in such valuations, on the Company’s consolidated financial statements. Below is a description of factors that CIM may consider when valuing the Company’s equity and debt investments where a market price is not readily available:
•the size and scope of a portfolio company and its specific strengths and weaknesses;
•prevailing interest rates for like securities;
•expected volatility in future interest rates;
•leverage;
•call features, put features, fees and other relevant terms of the debt;
•the borrower’s ability to adequately service its debt;
•the fair market value of the portfolio company in relation to the face amount of its outstanding debt;
•the quality of collateral securing the Company’s debt investments;
•multiples of earnings before interest, taxes, depreciation and amortization, or EBITDA, cash flows, net income, revenues or, in some cases, book value or liquidation value; and
•other factors deemed applicable.
All of these factors may be subject to adjustment based upon the particular circumstances of a portfolio company or the Company’s actual investment position. For example, adjustments to EBITDA may take into account compensation to previous owners, or acquisition, recapitalization, and restructuring expenses or other related or non-recurring items. The choice of analyses and the weight assigned to such factors may vary across investments and may change within an investment if events occur that warrant such a change.
When CIM uses the discounted cash flow model to value the Company's investments, such model deemed appropriate by CIM is prepared for the applicable investments and reviewed by designated members of CIM’s management team. Such models are prepared at least quarterly or on an as needed basis. The model uses the estimated cash flow projections for the underlying investments and an appropriate discount rate is determined based on the latest financial information available for the borrower, prevailing market trends, comparable analysis and other inputs. The model, key assumptions, inputs, and results are reviewed by designated members of CIM’s management team with final approval from the board of directors or its designee.
CĪON Investment Corporation
Notes to Consolidated Financial Statements
December 31, 2023
(in thousands, except share and per share amounts)
Consistent with the Company’s valuation policy, the Company evaluates the source of inputs, including any markets in which the Company’s investments are trading, in determining fair value.
The Company periodically benchmarks the broker quotes from the brokers or dealers against the actual prices at which the Company purchases and sells its investments. Based on the results of the benchmark analysis and the experience of the Company’s management in purchasing and selling these investments, the Company believes that these quotes are reliable indicators of fair value. The Company may also use other methods to determine fair value for securities for which it cannot obtain market quotations through brokers or dealers, including the use of an independent valuation firm. Designated members of CIM’s management team and the Company's board of directors or its designee review and approve the valuation determinations made with respect to these investments in a manner consistent with the Company’s valuation process.
As a practical expedient, the Company used net asset value, or NAV, as the fair value for its equity investments in CION SOF and BCP Great Lakes Fund LP, and the Company uses NAV as the fair value for its equity investment in CION/EagleTree. CION SOF and BCP Great Lakes Fund LP recorded, and CION/EagleTree records, its underlying investments at fair value on a quarterly basis in accordance with ASC 820.
Revenue Recognition
Securities transactions are accounted for on the trade date. The Company records interest and dividend income on an accrual basis beginning on the trade settlement date or the ex-dividend date, respectively, to the extent that the Company expects to collect such amounts. For investments in equity tranches of collateralized loan obligations, the Company records income based on the effective interest rate determined using the amortized cost and estimated cash flows, which is updated periodically. Loan origination fees, original issue discounts, or OID, and market discounts/premiums are recorded and such amounts are amortized as adjustments to interest income over the respective term of the loan using the effective interest rate method. Upon the prepayment of a loan or security, prepayment premiums, any unamortized loan origination fees, OID, or market discounts/premiums are recorded as interest income.
The Company may have investments in its investment portfolio that contain a PIK interest provision. PIK interest is accrued as interest income if the portfolio company valuation indicates that such PIK interest is collectible and recorded as interest receivable up to the interest payment date. On the interest payment dates, the Company will capitalize the accrued interest receivable attributable to PIK as additional principal due from the borrower. Additional PIK securities typically have the same terms, including maturity dates and interest rates, as the original securities. In order to maintain RIC status, substantially all of this income must be paid out to shareholders in the form of distributions, even if the Company has not collected any cash. For additional information on investments that contain a PIK interest provision, see the consolidated schedules of investments as of December 31, 2023 and 2022.
Loans and debt securities, including those that are individually identified as being impaired under Accounting Standards Codification 310, Receivables, or ASC 310, are generally placed on non-accrual status immediately if, in the opinion of management, principal or interest is not likely to be paid, or when principal or interest is past due 90 days or more. Interest accrued but not collected at the date a loan or security is placed on non-accrual status is reversed against interest income. Interest income is recognized on non-accrual loans or debt securities only to the extent received in cash. However, where there is doubt regarding the ultimate collectability of principal, cash receipts, whether designated as principal or interest, are thereafter applied to reduce the carrying value of the loan or debt security. Loans or securities are restored to accrual status only when interest and principal payments are brought current and future payments are reasonably assured.
Dividend income on preferred equity securities is recorded on an accrual basis to the extent that such amounts are payable by the portfolio company and are expected to be collected. Dividend income on common equity securities is recorded on the record date for private portfolio companies or on the ex-dividend date for publicly-traded portfolio companies.
The Company may receive fees for capital structuring services that are fixed based on contractual terms, are normally paid at the closing of the investment, are generally non-recurring and non-refundable and are recognized as revenue when earned upon closing of the investment. The services that CIM provides vary by investment, but generally include reviewing existing credit facilities, arranging bank financing, arranging equity financing, structuring financing from multiple lenders, structuring financing from multiple equity investors, restructuring existing loans, raising equity and debt capital, and providing general financial advice, which concludes upon closing of the investment. In certain instances where the Company is invited to participate as a co-lender in a transaction and does not provide significant services in connection with the investment, a portion of loan fees paid to the Company in such situations will be deferred and amortized over the estimated life of the loan as interest income.
Other income includes amendment fees that are fixed based on contractual terms and are generally non-recurring and non-refundable and are recognized as revenue when earned upon closing of the transaction. Other income also includes fees for managerial assistance and other consulting services, loan guarantees, commitments, and other services rendered by the Company to its portfolio companies. Such fees are fixed based on contractual terms and are recognized as fee income when earned.
CĪON Investment Corporation
Notes to Consolidated Financial Statements
December 31, 2023
(in thousands, except share and per share amounts)
Net Realized Gains or Losses and Net Change in Unrealized Appreciation or Depreciation
Gains or losses on the sale of investments are calculated by using the weighted-average method. The Company measures realized gains or losses by the difference between the net proceeds from the sale and the weighted-average amortized cost of the investment, without regard to unrealized appreciation or depreciation previously recognized, but considering unamortized upfront fees. Net change in unrealized appreciation or depreciation reflects the change in portfolio investment values during the reporting period, including any reversal of previously recorded unrealized appreciation or depreciation when gains or losses are realized.
Capital Gains Incentive Fee
Pursuant to the terms of the investment advisory agreement the Company entered into with CIM, the incentive fee on capital gains earned on liquidated investments of the Company’s investment portfolio during operations is determined and payable in arrears as of the end of each calendar year. Prior to October 5, 2021 and under the investment advisory agreement, such fee equaled 20% of the Company’s incentive fee capital gains (i.e., the Company’s realized capital gains on a cumulative basis from inception, calculated as of the end of each calendar year, computed net of all realized capital losses and unrealized capital depreciation on a cumulative basis), less the aggregate amount of any previously paid capital gains incentive fees. Pursuant to the second amended and restated investment advisory agreement, the incentive fee on capital gains was reduced to 17.5%, which became effective on October 5, 2021.
On a cumulative basis and to the extent that all realized capital losses and unrealized capital depreciation exceed realized capital gains as well as the aggregate realized net capital gains for which a fee has previously been paid, the Company would not be required to pay CIM a capital gains incentive fee. On a quarterly basis, the Company accrues for the capital gains incentive fee by calculating such fee as if it were due and payable as of the end of such period.
While the investment advisory agreement with CIM neither includes nor contemplates the inclusion of unrealized gains in the calculation of the capital gains incentive fee, pursuant to an interpretation of the American Institute for Certified Public Accountants, or AICPA, Technical Practice Aid for investment companies, the Company accrues capital gains incentive fees on unrealized gains. This accrual reflects the incentive fees that would be payable to CIM if the Company’s entire investment portfolio was liquidated at its fair value as of the balance sheet date even though CIM is not entitled to an incentive fee with respect to unrealized gains unless and until such gains are actually realized.
Net Increase in Net Assets per Share
Net increase in net assets per share is calculated based upon the daily weighted average number of shares of common stock outstanding during the reporting period.
Distributions
Distributions to shareholders are recorded as of the record date. The amount paid as a distribution is declared by the Company's co-chief executive officers and ratified by the board of directors on a quarterly basis. Net realized capital gains, if any, are distributed at least annually.
Note 3. Share Transactions
The Company’s initial continuous public offering commenced on July 2, 2012 and ended on December 31, 2015. The Company’s follow-on continuous public offering commenced on January 25, 2016 and ended on January 25, 2019.
The following table summarizes transactions with respect to shares of the Company’s outstanding common stock during the years ended December 31, 2023, 2022 and 2021:
| | | | | | | | | | | | | | | | | | | | | | | | | | | | | | | | | | | |
| Years Ended December 31, |
| 2023 | | 2022 | | 2021 |
| Shares | | Amount | | Shares | | Amount | | Shares | | Amount |
| Gross shares/proceeds from the offering | — | | | $ | — | | | — | | | $ | — | | | — | | | $ | — | |
| Reinvestment of distributions | — | | | — | | | — | | | — | | | 970,223 | | | 15,489 | |
| Total shares/proceeds | — | | | — | | | — | | | — | | | 970,223 | | | 15,489 | |
| | | | | | | | | | | |
| | | | | | | | | | | |
| Share repurchase program | (1,114,848) | | | (11,518) | | | (1,658,956) | | | (15,444) | | | (658,650) | | | (10,467) | |
| Net shares/proceeds (for) from share transactions | (1,114,848) | | | $ | (11,518) | | | (1,658,956) | | | $ | (15,444) | | | 311,573 | | | $ | 5,022 | |
CĪON Investment Corporation
Notes to Consolidated Financial Statements
December 31, 2023
(in thousands, except share and per share amounts)
Since commencing its initial continuous public offering on July 2, 2012 and through December 31, 2023, the Company sold 54,184,636 shares of common stock for net proceeds of $1,133,345. The net proceeds include gross proceeds received from reinvested shareholder distributions of $237,451, for which the Company issued 13,523,489 shares of common stock, and gross proceeds paid for shares of common stock repurchased of $259,392, for which the Company repurchased 16,084,731 shares of common stock. As of December 31, 2023, 16,084,731 shares of common stock repurchased had been retired.
On September 15, 2023, the Company's shareholders approved a proposal that authorizes the Company to issue shares of its common stock at prices below the then current NAV per share of the Company’s common stock in one or more offerings for a 12-month period following such shareholder approval. As of December 31, 2023, the Company has not issued any such shares.
Distribution Reinvestment Plan
In connection with the Listing of its shares of common stock on the NYSE, on September 15, 2021, the Company terminated its previous fifth amended and restated distribution reinvestment plan, or the Old DRP. The final distribution reinvestment under the Old DRP was made as part of the regular monthly distribution paid on September 14, 2021. On September 15, 2021, the Company adopted a new distribution reinvestment plan, or the New DRP, which became effective as of the Listing and first applied to the reinvestment of distributions paid on December 8, 2021. For additional information regarding the terms of the New DRP, see Note 5.
Reverse Stock Split
Effective on September 21, 2021, every two shares of the Company's common stock then issued and outstanding were automatically combined into one share of the Company's common stock, with the number of then issued and outstanding shares reduced from 113,916,869 to 56,958,440. The reverse stock split amendment also provided that there was no change in the par value of $0.001 per share as a result of the reverse stock split. In addition, the reverse stock split did not modify the rights or preferences of the Company’s common stock.
Listing and Fractional Shares
On October 5, 2021, the Company's shares of common stock commenced trading on the NYSE under the ticker symbol “CION”. As approved by shareholders on September 7, 2021, the Listing was staggered such that (i) up to 1/3rd of shares held by all shareholders were available for trading upon Listing, (ii) up to 2/3rd of shares held by all shareholders were available for trading starting 180 days after Listing, or April 4, 2022, and (iii) all shares were available for trading starting 270 days after Listing, or July 5, 2022. The Company eliminated all then outstanding fractional shares of its common stock in connection with the Listing, as permitted by the Maryland General Corporation Law, on July 14, 2022. On February 26, 2023, the Company’s shares of common stock also listed and commenced trading in Israel on the TASE under the ticker symbol “CION”.
Pre-Listing Share Repurchase Program
Historically, the Company offered to repurchase shares on a quarterly basis on such terms as determined by the Company’s board of directors in its complete and absolute discretion unless, in the judgment of the independent directors of the Company’s board of directors, such repurchases would not have been in the best interests of the Company’s shareholders or would have violated applicable law.
On July 30, 2021, the Company's board of directors, including the independent directors, determined to suspend the Company's pre-Listing share repurchase program commencing with the third quarter of 2021 in anticipation of the Listing and the concurrent enhanced liquidity the Listing was expected to provide. The pre-Listing share repurchase program ultimately terminated upon the Listing and the Company does not expect to implement a new quarterly share repurchase program in the future.
Historically, the Company generally limited the number of shares to be repurchased during any calendar year to the number of shares it could have repurchased with the proceeds it received from the issuance of shares pursuant to the Old DRP. At the discretion of the Company’s board of directors, it could have also used cash on hand, cash available from borrowings and cash from liquidation of investments as of the end of the applicable period to repurchase shares. The Company offered to repurchase such shares at a price equal to the estimated NAV per share on each date of repurchase.
Any periodic repurchase offers were subject in part to the Company’s available cash and compliance with the BDC and RIC qualification and diversification rules promulgated under the 1940 Act and the Code, respectively.
CĪON Investment Corporation
Notes to Consolidated Financial Statements
December 31, 2023
(in thousands, except share and per share amounts)
Post-Listing Share Repurchase Policy
On September 15, 2021, the Company’s board of directors, including the independent directors, approved a share repurchase policy authorizing the Company to repurchase up to $50 million of its outstanding common stock after the Listing. On June 24, 2022, the Company’s board of directors, including the independent directors, increased the amount of shares of the Company’s common stock that may be repurchased under the share repurchase policy by $10 million to up to an aggregate of $60 million. Under the share repurchase policy, the Company may purchase shares of its common stock through various means such as open market transactions, including block purchases, and privately negotiated transactions. The number of shares repurchased and the timing, manner, price and amount of any repurchases will be determined at the Company's discretion. Factors include, but are not limited to, share price, trading volume and general market conditions, along with the Company’s general business conditions. The policy may be suspended or discontinued at any time and does not obligate the Company to acquire any specific number of shares of its common stock.
On August 29, 2023, as part of the share repurchase policy, the Company entered into a new trading plan with an independent broker, Wells Fargo Securities, LLC, or Wells Fargo, in accordance with Rule 10b5-1 of the Securities Exchange Act of 1934, as amended, based in part on historical trading data with respect to the Company’s shares. The 10b5-1 trading plan permits common stock to be repurchased at a time that the Company might otherwise be precluded from doing so under insider trading laws or self-imposed trading restrictions. The 10b5-1 trading plan expires on August 29, 2024, and is subject to price, market volume and timing restrictions.
The following table summarizes the share repurchases completed during the years ended December 31, 2022 and 2023:
| | | | | | | | | | | | | | | | | | | | | | | | | | |
| Period | | Total Number of Shares Repurchased | | Average Price Paid per Share | | Total Number of Shares Repurchased as Part of Publicly Announced Plans or Programs | | Approximate Dollar Value of Shares That May Yet Be Repurchased Under Publicly Announced Plans or Programs(1) |
| 2022 | | | | | | | | |
| January 1 to January 31, 2022 | | — | | N/A | | — | | — | |
| February 1 to February 28, 2022 | | — | | N/A | | — | | — | |
| March 1 to March 31, 2022 | | — | | N/A | | — | | — | |
| April 1 to April 30, 2022 | | — | | N/A | | — | | — | |
| May 1 to May 31, 2022 | | — | | N/A | | — | | — | |
| June 1 to June 30, 2022 | | — | | N/A | | — | | — | |
| July 1 to July 31, 2022 | | — | | N/A | | — | | — | |
| August 1 to August 31, 2022 | | 170,424 | | $10.52 | | 170,424 | | $ | 58,210 | |
| September 1 to September 30, 2022 | | 525,052 | | 9.37 | | 525,052 | | 53,303 | |
| October 1 to October 31, 2022 | | 738,221 | | 8.91 | | 738,221 | | 46,740 | |
| November 1 to November 30, 2022 | | 225,259 | | 9.57 | | 225,259 | | 44,589 | |
| December 1 to December 31, 2022 | | — | | N/A | | — | | 44,589 | |
| Total for the year ended December 31, 2022 | | 1,658,956 | | | | 1,658,956 | | |
| | | | | | | | |
| 2023 | | | | | | | | |
| January 1 to January 31, 2023 | | 129,873 | | $10.58 | | 129,873 | | $ | 43,218 | |
| February 1 to February 28, 2023 | | 114,733 | | 11.06 | | 114,733 | | 41,951 | |
| March 1 to March 31, 2023 | | 93,423 | | 10.17 | | 93,423 | | 41,003 | |
| April 1 to April 30, 2023 | | 126,980 | | 9.69 | | 126,980 | | 39,775 | |
| May 1 to May 31, 2023 | | 86,950 | | 9.34 | | 86,950 | | 38,964 | |
| June 1 to June 30, 2023 | | 114,698 | | 10.31 | | 114698 | | 37,784 | |
| July 1 to July 31, 2023 | | 54,048 | | 10.74 | | 54048 | | 37,205 | |
| August 1 to August 31, 2023 | | 18,518 | | 10.96 | | 18518 | | 37,002 | |
| September 1 to September 30, 2023 | | 95,457 | | 10.65 | | 95,457 | | 35,988 | |
| October 1 to October 31, 2023 | | 145,599 | | 10.08 | | 145,599 | | 34,056 | |
| November 1 to November 30, 2023 | | 45,556 | | 10.26 | | 45,556 | | 34,056 | |
| December 1 to December 31, 2023 | | 89,013 | | 10.84 | | 89,013 | | 33,093 | |
| Total for the year ended December 31, 2023 | | 1,114,848 | | | | 1,114,848 | | | |
(1) - Amounts do not include any commissions paid to Wells Fargo on shares repurchased.
CĪON Investment Corporation
Notes to Consolidated Financial Statements
December 31, 2023
(in thousands, except share and per share amounts)
From January 1, 2024 to March 6, 2024, the Company repurchased 340,505 shares of common stock under the 10b5-1 trading plan for an aggregate purchase price of $3,750, or an average purchase price of $11.01 per share. As of March 6, 2024, 16,084,731 shares of common stock repurchased by the Company had been retired.
Note 4. Transactions with Related Parties
For the years ended December 31, 2023, 2022 and 2021, fees and other expenses incurred by the Company related to CIM and its affiliates were as follows:
| | | | | | | | | | | | | | | | | | | | | | | | | | | | | | | | | | | |
| | | | | | Years Ended December 31, |
| Entity | | Capacity | | Description | | 2023 | | 2022 | | 2021 |
| | | | | | | | | | |
| CIM | | Investment adviser | | Management fees(1) | | $ | 26,856 | | | $ | 27,361 | | | $ | 31,143 | |
| CIM | | Investment adviser | | Incentive fees(1) | | 22,277 | | | 18,710 | | | 6,875 | |
| CIM | | Administrative services provider | | Administrative services expense(1) | | 3,971 | | | 3,348 | | | 3,069 | |
| Apollo Investment Administration, L.P. | | Administrative services provider | | Transaction costs(1) | | — | | | — | | | 105 | |
| | | | | | | | | | |
| | | | | | | | | | |
| | | | | | $ | 53,104 | | | $ | 49,419 | | | $ | 41,192 | |
(1)Amounts charged directly to operations.
The Company has entered into an investment advisory agreement with CIM. On August 7, 2023, the board of directors of the Company, including a majority of the board of directors who are not interested persons, approved the renewal of the second amended and restated investment advisory agreement with CIM for a period of twelve months, commencing August 9, 2023. Pursuant to the investment advisory agreement in effect prior to the Listing, CIM was paid an annual base management fee equal to 2.0% of the average value of the Company’s gross assets, less cash and cash equivalents, and an incentive fee based on the Company’s performance, as described below. Pursuant to the second amended and restated investment advisory agreement, which was effective upon the Listing on October 5, 2021, the annual base management fee was reduced to 1.5% of the average value of the Company’s gross assets (including cash pledged as collateral for the Company’s secured financing arrangements, but excluding other cash and cash equivalents so that investors do not pay the base management fee on such assets), to the extent that the Company’s asset coverage ratio is greater than or equal to 200% (i.e., $1 of debt outstanding for each $1 of equity); provided that, the annual base management fee will be reduced further to 1.0% for any such gross assets purchased with leverage resulting in the Company’s asset coverage ratio dropping below 200%. On December 30, 2021, shareholders approved a proposal to reduce the Company’s asset coverage ratio to 150%. As a result, commencing on December 31, 2021, the Company is required to maintain asset coverage for its senior securities of 150% (i.e., $2 of debt outstanding for each $1 of equity) rather than 200%. The base management fee is payable quarterly in arrears and is calculated based on the two most recently completed calendar quarters.
The incentive fee consists of two parts. The first part, which is referred to as the subordinated incentive fee on income, is calculated and payable quarterly in arrears based on “pre-incentive fee net investment income” for the immediately preceding quarter and was subject to a hurdle rate, measured quarterly and expressed as a rate of return on adjusted capital, as defined in the investment advisory agreement in effect prior to the Listing, equal to 1.875% per quarter, or an annualized rate of 7.5%. Under the investment advisory agreement in effect prior to the Listing, the Company paid to CIM 100% of pre-incentive fee net investment income once the hurdle rate was exceeded until the annualized rate of 9.375% was exceeded, at which point the Company paid to CIM 20% of all pre-incentive fee net investment income that exceeded the annualized rate of 9.375%. Under the amended and restated investment advisory agreement also in effect prior to the Listing, the change to the calculation of the subordinated incentive fee payable to CIM that expresses the hurdle rate required for CIM to earn, and be paid, the incentive fee as a percentage of the Company's net assets rather than adjusted capital was implemented. Under the second amended and restated investment advisory agreement, the hurdle rate was reduced to 1.625% per quarter, or an annualized rate of 6.5%, and the Company pays to CIM 100% of pre-incentive fee net investment income once the hurdle rate is exceeded until the annualized rate of 7.879% is exceeded, at which point the Company pays to CIM 17.5% of all pre-incentive fee net investment income. These changes to the subordinated incentive fee on income were effective upon the Listing, except for the change to the calculation of the subordinated incentive fee payable to CIM that replaced adjusted capital with the Company's net assets, which was effective on August 10, 2021. For the years ended December 31, 2023 and 2022, the Company recorded subordinated incentive fees on income of $22,277 and $18,710, respectively. As of December 31, 2023 and 2022, the liabilities recorded for subordinated incentive fees were $4,615 and $5,065, respectively. The second part of the incentive fee, which is referred to as the capital gains incentive fee, is described in Note 2.
The Company accrues the capital gains incentive fee based on net realized gains and net unrealized appreciation; however, under the terms of the investment advisory agreement, the fee payable to CIM is based on net realized gains and unrealized depreciation and no such fee is payable with respect to unrealized appreciation unless and until such appreciation is actually realized. For the years ended December 31, 2023, 2022 and 2021, the Company had no liability for and did not record any capital gains incentive fees.
CĪON Investment Corporation
Notes to Consolidated Financial Statements
December 31, 2023
(in thousands, except share and per share amounts)
On April 1, 2018, the Company entered into an administration agreement with CIM pursuant to which CIM furnishes the Company with administrative services including accounting, investor relations and other administrative services necessary to conduct its day-to-day operations. CIM is reimbursed for administrative expenses it incurs on the Company’s behalf in performing its obligations, provided that such reimbursement is for the lower of CIM’s actual costs or the amount that the Company would have been required to pay for comparable administrative services in the same geographic location. Such costs are reasonably allocated to the Company on the basis of assets, revenues, time records or other reasonable methods. The Company does not reimburse CIM for any services for which it receives a separate fee or for rent, depreciation, utilities, capital equipment or other administrative items allocated to a person with a controlling interest in CIM. On August 7, 2023, the board of directors of the Company, including a majority of the board of directors who are not interested persons, approved the renewal of the administration agreement with CIM for a period of twelve months commencing August 9, 2023.
On January 1, 2019, the Company entered into a servicing agreement with Apollo Investment Administration, L.P., or AIA, pursuant to which AIA furnished the Company with administrative services including, but not limited to, loan and high yield trading services, trade and settlement support, and supplementary investment valuation information. AIA was reimbursed for administrative expenses it incurred on the Company’s behalf in performing its obligations, provided that such reimbursement was reasonable, and costs and expenses incurred were documented. The servicing agreement may be terminated at any time, without the payment of any penalty, by either party, upon 60 days' written notice to the other party.
On January 30, 2013, the Company entered into the expense support and conditional reimbursement agreement with CIG, whereby CIG agreed to provide expense support to the Company in an amount that was sufficient to: (1) ensure that no portion of the Company’s distributions to shareholders was paid from its offering proceeds or borrowings, and/or (2) reduce the Company’s operating expenses until it achieved economies of scale sufficient to ensure that the Company bore a reasonable level of expense in relation to its investment income. On December 16, 2015, the Company further amended and restated the expense support and conditional reimbursement agreement for purposes of including AIM as a party to the agreement. On January 2, 2018, the Company entered into an expense support and conditional reimbursement agreement with CIM for purposes of, among other things, replacing CIG and AIM with CIM as the expense support provider pursuant to the terms of the expense support and conditional reimbursement agreement.
Pursuant to the expense support and conditional reimbursement agreement, the Company had a conditional obligation to reimburse CIM for any amounts funded by CIM under such agreement (i) if expense support amounts funded by CIM exceeded operating expenses incurred during any fiscal quarter, (ii) if the sum of the Company’s net investment income for tax purposes, net capital gains and the amount of any dividends and other distributions paid to the Company on account of investments in portfolio companies (to the extent not included in net investment income or net capital gains for tax purposes) exceeded the distributions paid by the Company to shareholders, and (iii) during any fiscal quarter that occurred within three years of the date on which CIM funded such amount. The obligation to reimburse CIM for any expense support provided by CIM under such agreement was further conditioned by the following: (i) in the period in which reimbursement was sought, the ratio of operating expenses to average net assets, when considering the reimbursement, could not have exceeded the ratio of operating expenses to average net assets, as defined, for the period when the expense support was provided; (ii) in the period when reimbursement was sought, the annualized distribution rate could not have fallen below the annualized distribution rate for the period when the expense support was provided; and (iii) the expense support could have only been reimbursed within three years from the date the expense support was provided.
Expense support, if any, was determined as appropriate to meet the objectives of the expense support and conditional reimbursement agreement. On December 31, 2021, the Company and CIM allowed the expense support and conditional reimbursement agreement to expire in accordance with its terms. There was no unreimbursed expense support funded by CIM upon such expiration. The specific amount of expense support provided by CIM, if any, was determined at the end of each quarter. For the years ended December 31, 2023, 2022 and 2021, the Company did not receive any expense support from CIM. See Note 5 for additional information on the sources of the Company’s distributions. The Company did not record any obligation to repay expense support from CIM and the Company did not repay any expense support to CIM during the years ended December 31, 2023, 2022 and 2021.
As of December 31, 2023 and 2022, the total liability payable to CIM and its affiliates was $13,664 and $13,692, respectively, which primarily related to fees earned by CIM during the three months ended December 31, 2023 and 2022, respectively.
In the event that CIM undertakes to provide investment advisory services to other clients in the future, it will strive to allocate investment opportunities in a fair and equitable manner consistent with the Company’s investment objective and strategies so that the Company will not be disadvantaged in relation to any other client of the investment adviser or its senior management team. However, it is currently possible that some investment opportunities will be provided to other clients of CIM rather than to the Company.
CĪON Investment Corporation
Notes to Consolidated Financial Statements
December 31, 2023
(in thousands, except share and per share amounts)
Indemnifications
The investment advisory agreement, the administration agreement and the dealer manager agreement each provide certain indemnifications from the Company to the other relevant parties to such agreements. The Company’s maximum exposure under these agreements is unknown. However, the Company has not experienced claims or losses pursuant to these agreements and believes the risk of loss related to such indemnifications to be remote.
Note 5. Distributions
From February 1, 2014 through July 17, 2017, the Company’s board of directors authorized and declared on a monthly basis a weekly distribution amount per share of common stock. On July 18, 2017, the Company's board of directors authorized and declared on a quarterly basis a weekly distribution amount per share of common stock. Effective September 28, 2017, the Company's board of directors delegated to management the authority to determine the amount, record dates, payment dates and other terms of distributions to shareholders, which will be ratified by the board of directors, each on a quarterly basis. Beginning on March 19, 2020, management changed the timing of declaring distributions from quarterly to monthly and temporarily suspended the payment of distributions to shareholders commencing with the month ended April 30, 2020, whether in cash or pursuant to the Old DRP. On July 15, 2020, the board of directors determined to recommence the payment of distributions to shareholders in August 2020. On September 15, 2021, management changed the timing of declaring and paying regular distributions to shareholders from monthly to quarterly commencing with the fourth quarter of 2021. Distributions in respect of future quarters and any supplemental or special distributions will be evaluated by management and the board of directors based on circumstances and expectations existing at the time of consideration. Declared regular distributions are paid quarterly.
The Company’s management declared and the Company's board of directors ratified distributions for 7, 5 and 11 record dates during the years ended December 31, 2023, 2022 and 2021, respectively.
The following table presents distributions per share that were declared during the years ended December 31, 2023, 2022 and 2021:
| | | | | | | | | | | | | | |
| | Distributions |
| Three Months Ended | | Per Share(1) | | Amount |
| 2021 | | | | |
| March 31, 2021 (three record dates) | | $ | 0.2648 | | | $ | 15,029 | |
| June 30, 2021 (three record dates) | | 0.2648 | | | 15,000 | |
| September 30, 2021 (three record dates) | | 0.2648 | | | 15,027 | |
| December 31, 2021 (two record dates) | | 0.4648 | | | 26,474 | |
| Total distributions for the year ended December 31, 2021 | | $ | 1.2592 | | | $ | 71,530 | |
| | | | |
| 2022 | | | | |
| March 31, 2022 (one record date) | | $ | 0.2800 | | | $ | 15,948 | |
| June 30, 2022 (one record date) | | 0.2800 | | | 15,949 | |
| September 30, 2022 (one record date) | | 0.3100 | | | 17,604 | |
| December 31, 2022 (two record dates) | | 0.5800 | | | 32,074 | |
| Total distributions for the year ended December 31, 2022 | | $ | 1.4500 | | | $ | 81,575 | |
| | | | |
| 2023 | | | | |
| March 31, 2023 (one record date) | | $ | 0.3400 | | | $ | 18,687 | |
| June 30, 2023 (one record date) | | 0.3400 | | | 18,614 | |
| September 30, 2023 (two record dates) | | 0.3900 | | | 21,276 | |
| December 31, 2023 (three record dates) | | 0.5400 | | | 29,290 | |
| Total distributions for the year ended December 31, 2023 | | $ | 1.6100 | | | $ | 87,867 | |
(1) The per share distribution amount for 2021 has been retroactively adjusted to reflect the reverse stock split as discussed in Note 3.
On March 11, 2024, the Company’s co-chief executive officers declared a regular quarterly distribution of $0.34 per share for the first quarter of 2024 payable on March 28, 2024 to shareholders of record as of March 22, 2024.
CĪON Investment Corporation
Notes to Consolidated Financial Statements
December 31, 2023
(in thousands, except share and per share amounts)
In connection with the Listing of its shares of common stock on the NYSE, on September 15, 2021, the Company terminated the Old DRP. The final distribution reinvestment under the Old DRP was made as part of the regular monthly distribution paid on September 14, 2021. On September 15, 2021, the Company adopted the New DRP, which became effective as of the Listing and first applied to the reinvestment of distributions paid on December 8, 2021.
Under the Old DRP and prior to the Listing, distributions to participating shareholders who “opted in” to the Old DRP were reinvested in additional shares of the Company's common stock at a purchase price equal to the estimated NAV per share of common stock as of the date of issuance.
Upon the Listing, all shareholders were automatically enrolled in the New DRP and will receive distributions as declared by the Company in additional shares of its common stock unless such shareholder affirmatively elects to receive an entire distribution in cash by notifying (i) such shareholder’s financial adviser; or (ii) if such shareholder has a registered account maintained at the Company’s transfer agent, the plan administrator. With respect to distributions to participating shareholders under the New DRP, the Company reserves the right to either issue new shares or cause the plan administrator to purchase shares in the open market in connection with implementation of the New DRP. Unless the Company, in its sole discretion, otherwise directs DST Asset Management Solutions, Inc., the plan administrator, (A) if the per share “market price” (as defined in the New DRP) is equal to or greater than the estimated NAV per share on the payment date for the distribution, then the Company will issue shares at the greater of (i) the estimated NAV or (ii) 95% of the market price, or (B) if the market price is less than the estimated NAV, then, in the Company’s sole discretion, (i) shares will be purchased in open market transactions for the accounts of participating shareholders to the extent practicable, or (ii) the Company will issue shares at the estimated NAV. Pursuant to the terms of the New DRP, the number of shares to be issued to a participating shareholder will be determined by dividing the total dollar amount of the distribution payable to a participating shareholder by the price per share at which the Company issues such shares; provided, however, that shares purchased in open market transactions by the plan administrator will be allocated to a participating shareholder based on the weighted average purchase price, excluding any brokerage charges or other charges, of all shares purchased in the open market with respect to such distribution.
If a shareholder receives distributions in the form of common stock pursuant to the New DRP, such shareholder generally will be subject to the same federal, state and local tax consequences as if they elected to receive distributions in cash. If the Company’s common stock is trading at or below NAV, a shareholder receiving distributions in the form of additional common stock will be treated as receiving a distribution in the amount of cash that such shareholder would have received if they had elected to receive the distribution in cash. If the Company’s common stock is trading above NAV, a shareholder receiving distributions in the form of additional common stock will be treated as receiving a distribution in the amount of the fair market value of the Company’s common stock. The shareholder’s basis for determining gain or loss upon the sale of common stock received in a distribution will be equal to the total dollar amount of the distribution payable to the shareholder. Any stock received in a distribution will have a holding period for tax purposes commencing on the day following the day on which the shares of common stock are credited to the shareholder’s account.
The following table provides information concerning the Company’s purchases of shares of its common stock in the open market during the years ended December 31, 2022 and 2023 pursuant to the New DRP in order to satisfy the reinvestment portion of the Company’s distributions:
| | | | | | | | | | | | | | | | | | | | | | | | | | |
| Period | | Total Number of Shares Purchased | | Average Price Paid per Share | | Total Number of Shares Purchased as Part of Publicly Announced Plans or Programs | | Approximate Dollar Value of Shares That May Yet Be Purchased Under Publicly Announced Plans or Programs |
| 2022 | | | | | | | | |
| January 1 to January 31, 2022 | | — | | | $ | — | | | — | | | — | |
| February 1 to February 28, 2022 | | — | | | — | | | — | | | — | |
| March 1 to March 31, 2022 | | 54,613 | | | 14.77 | | | 54,613 | | | (1) | |
| April 1 to April 30, 2022 | | — | | | — | | | — | | | — | |
| May 1 to May 31, 2022 | | — | | | — | | | — | | | — | |
| June 1 to June 30, 2022 | | 155,800 | | | 10.06 | | | 155,800 | | | (1) | |
| July 1 to July 31, 2022 | | — | | | — | | | — | | | — | |
| August 1 to August 31, 2022 | | — | | | — | | | — | | | — | |
| September 1 to September 30, 2022 | | 207,602 | | | 10.14 | | | 207,602 | | | (1) | |
| October 1 to October 31, 2022 | | — | | | — | | | — | | | — | |
| November 1 to November 30, 2022 | | — | | | — | | | — | | | — | |
| December 1 to December 31, 2022 | | 182,234 | | | 10.78 | | | 182,234 | | | (1) | |
| Total for the year ended December 31, 2022 | | 600,249 | | | $ | 10.74 | | | 600,249 | | | (1) | |
CĪON Investment Corporation
Notes to Consolidated Financial Statements
December 31, 2023
(in thousands, except share and per share amounts)
| | | | | | | | | | | | | | | | | | | | | | | | | | |
| Period | | Total Number of Shares Purchased | | Average Price Paid per Share | | Total Number of Shares Purchased as Part of Publicly Announced Plans or Programs | | Approximate Dollar Value of Shares That May Yet Be Purchased Under Publicly Announced Plans or Programs |
| 2023 | | | | | | | | |
| January 1 to January 31, 2023 | | 146,946 | | | $ | 11.19 | | | 146,946 | | | (1) |
| February 1 to February 28, 2023 | | — | | | — | | | — | | | — | |
| March 1 to March 31, 2023 | | 204,427 | | | 9.78 | | | 204,427 | | | (1) |
| April 1 to April 30, 2023 | | — | | | — | | | — | | | — | |
| May 1 to May 31, 2023 | | — | | | — | | | — | | | — | |
| June 1 to June 30, 2023 | | 174,424 | | | 10.71 | | | 174,424 | | | (1) |
| July 1 to July 31, 2023 | | — | | | — | | | — | | | — | |
| August 1 to August 31, 2023 | | — | | | — | | | — | | | — | |
| September 1 to September 30, 2023 | | 160,383 | | | 11.10 | | | 160,383 | | | (1) |
| October 1 to October 31, 2023 | | 25,764 | | | 10.30 | | | 25,764 | | | (1) |
| November 1 to November 30, 2023 | | — | | | — | | | — | | | — | |
| December 1 to December 31, 2023 | | 139,731 | | | 11.66 | | | 139,731 | | | (1) |
| Total for the year ended December 31, 2023 | | 851,675 | | | $ | 10.79 | | | 851,675 | | | (1) |
(1) See the description of the New DRP above.
The Company may fund its distributions to shareholders from any sources of funds available to the Company, including borrowings, net investment income from operations, capital gains proceeds from the sale of assets, non-capital gains proceeds from the sale of assets, and dividends or other distributions paid to it on account of preferred and common equity investments in portfolio companies. Any such distributions can only be sustained if the Company maintains positive investment performance in future periods. There can be no assurances that the Company will maintain such performance in order to sustain these distributions or be able to pay distributions at all. On December 31, 2021, the Company and CIM allowed the expense support and conditional reimbursement agreement to expire in accordance with its terms. As a result, CIM has no obligation to provide expense support to the Company in future periods. For the years ended December 31, 2023, 2022 and 2021, none of the Company's distributions resulted from expense support from CIM. The Company has not established limits on the amount of funds it may use from available sources to make distributions.
The following table reflects the sources of distributions on a GAAP basis that the Company has declared on its shares of common stock during the years ended December 31, 2023, 2022 and 2021:
| | | | | | | | | | | | | | | | | | | | | | | | | | | | | | | | | | | | | | | | | | | | | | | | | | | | | | | | |
| | Years Ended December 31, |
| | 2023 | | 2022 | | 2021 |
| Source of Distribution | | Per Share | | Amount | | Percentage | | Per Share | | Amount | | Percentage | | Per Share(1) | | Amount | | Percentage |
| Net investment income | | $ | 1.6100 | | | $ | 87,867 | | | 100.0 | % | | $ | 1.4500 | | | $ | 81,575 | | | 100.0 | % | | $ | 1.2592 | | | $ | 71,530 | | | 100.0 | % |
| | | | | | | | | | | | | | | | | | |
| | | | | | | | | | | | | | | | | | |
| | | | | | | | | | | | | | | | | | |
| | | | | | | | | | | | | | | | | | |
| | | | | | | | | | | | | | | | | | |
| Total distributions | | $ | 1.6100 | | | $ | 87,867 | | | 100.0 | % | | $ | 1.4500 | | | $ | 81,575 | | | 100.0 | % | | $ | 1.2592 | | | $ | 71,530 | | | 100.0 | % |
(1) The per share amount for 2021 has been retroactively adjusted to reflect the reverse stock split as discussed in Note 3.
CĪON Investment Corporation
Notes to Consolidated Financial Statements
December 31, 2023
(in thousands, except share and per share amounts)
Note 6. Investments
The composition of the Company’s investment portfolio as of December 31, 2023 and 2022 at amortized cost and fair value was as follows:
| | | | | | | | | | | | | | | | | | | | | | | | | | | | | | | | | | | | | | |
| | December 31, 2023 | | December 31, 2022 |
| | Cost(1) | | Fair
Value | | Percentage of
Investment
Portfolio | | Cost(1) | | Fair
Value | | Percentage of
Investment
Portfolio |
| Senior secured first lien debt | | $ | 1,604,111 | | | $ | 1,565,171 | | | 85.0 | % | | $ | 1,638,995 | | | $ | 1,579,512 | | | 90.3 | % |
| Senior secured second lien debt | | 41,280 | | | 29,111 | | | 1.6 | % | | 41,036 | | | 38,769 | | | 2.2 | % |
| | | | | | | | | | | | |
| Collateralized securities and structured products - equity | | 2,362 | | | 1,096 | | | 0.1 | % | | 2,687 | | | 1,179 | | | 0.1 | % |
| Unsecured debt | | 31,693 | | | 12,874 | | | 0.7 | % | | 30,427 | | | 22,643 | | | 1.3 | % |
| Equity | | 182,738 | | | 232,572 | | | 12.6 | % | | 79,595 | | | 107,058 | | | 6.1 | % |
| Subtotal/total percentage | | 1,862,184 | | | 1,840,824 | | | 100.0 | % | | 1,792,740 | | | 1,749,161 | | | 100.0 | % |
| Short term investments(2) | | 113,446 | | | 113,446 | | | | | 10,869 | | | 10,869 | | | |
| Total investments | | $ | 1,975,630 | | | $ | 1,954,270 | | | | | $ | 1,803,609 | | | $ | 1,760,030 | | | |
(1)Cost represents the original cost adjusted for the amortization of premiums and/or accretion of discounts, as applicable, for debt investments and cost for equity investments.
(2)Short term investments represent an investment in a fund that invests in highly liquid investments with average original maturity dates of three months or less.
CĪON Investment Corporation
Notes to Consolidated Financial Statements
December 31, 2023
(in thousands, except share and per share amounts)
The following tables show the composition of the Company’s investment portfolio by industry classification and geographic dispersion, and the percentage, by fair value, of the total investment portfolio assets in such industries and geographies as of December 31, 2023 and 2022:
| | | | | | | | | | | | | | | | | | | | | | | | | | |
| | December 31, 2023 | | December 31, 2022 |
| Industry Classification | | Investments at
Fair Value | | Percentage of
Investment Portfolio | | Investments at
Fair Value | | Percentage of
Investment Portfolio |
| Services: Business | | $ | 282,237 | | | 15.3 | % | | $ | 336,055 | | | 19.2 | % |
| Healthcare & Pharmaceuticals | | 238,624 | | | 13.0 | % | | 237,082 | | | 13.6 | % |
| Media: Diversified & Production | | 135,037 | | | 7.3 | % | | 134,927 | | | 7.7 | % |
| Retail | | 135,000 | | | 7.3 | % | | 74,718 | | | 4.3 | % |
| Media: Advertising, Printing & Publishing | | 116,100 | | | 6.3 | % | | 105,375 | | | 6.0 | % |
| Services: Consumer | | 107,195 | | | 5.8 | % | | 115,849 | | | 6.6 | % |
| Energy: Oil & Gas | | 104,893 | | | 5.7 | % | | 68,756 | | | 3.9 | % |
| Construction & Building | | 104,727 | | | 5.7 | % | | 46,007 | | | 2.6 | % |
| Diversified Financials | | 85,733 | | | 4.7 | % | | 99,819 | | | 5.7 | % |
| Chemicals, Plastics & Rubber | | 82,597 | | | 4.5 | % | | 66,753 | | | 3.8 | % |
| Beverage, Food & Tobacco | | 68,780 | | | 3.7 | % | | 45,396 | | | 2.6 | % |
| Consumer Goods: Durable | | 59,955 | | | 3.3 | % | | 60,735 | | | 3.5 | % |
| Banking, Finance, Insurance & Real Estate | | 52,272 | | | 2.8 | % | | 43,836 | | | 2.5 | % |
| Hotel, Gaming & Leisure | | 50,906 | | | 2.8 | % | | 46,739 | | | 2.7 | % |
| Capital Equipment | | 49,571 | | | 2.7 | % | | 41,580 | | | 2.4 | % |
| Consumer Goods: Non-Durable | | 42,381 | | | 2.3 | % | | 47,886 | | | 2.8 | % |
| High Tech Industries | | 22,671 | | | 1.2 | % | | 56,501 | | | 3.2 | % |
| Containers, Packaging & Glass | | 18,480 | | | 1.0 | % | | 19,551 | | | 1.1 | % |
| Telecommunications | | 17,768 | | | 1.0 | % | | 18,302 | | | 1.1 | % |
| Environmental Industries | | 15,336 | | | 0.8 | % | | — | | | — | |
| Metals & Mining | | 13,957 | | | 0.8 | % | | 15,780 | | | 0.9 | % |
| Automotive | | 12,403 | | | 0.7 | % | | 16,255 | | | 0.9 | % |
| Transportation: Cargo | | 12,201 | | | 0.7 | % | | 12,417 | | | 0.7 | % |
| Aerospace & Defense | | 12,000 | | | 0.6 | % | | 38,842 | | | 2.2 | % |
| | | | | | | | |
| | | | | | | | |
| | | | | | | | |
| Subtotal/total percentage | | 1,840,824 | | | 100.0 | % | | 1,749,161 | | | 100.0 | % |
| Short term investments | | 113,446 | | | | | 10,869 | | | |
| Total investments | | $ | 1,954,270 | | | | | $ | 1,760,030 | | | |
| | | | | | | | | | | | | | | | | | | | | | | | | | |
| | December 31, 2023 | | December 31, 2022 |
| Geographic Dispersion(1) | | Investments at
Fair Value | | Percentage of
Investment Portfolio | | Investments at
Fair Value | | Percentage of
Investment Portfolio |
| United States | | $ | 1,812,416 | | | 98.4 | % | | $ | 1,739,866 | | | 99.5 | % |
| Canada | | 26,350 | | | 1.4 | % | | 7,452 | | | 0.4 | % |
| Cayman Islands | | 1,096 | | | 0.1 | % | | 1,179 | | | 0.1 | % |
| | | | | | | | |
| | | | | | | | |
| | | | | | | | |
| Bermuda | | 962 | | | 0.1 | % | | 664 | | | — | |
| | | | | | | | |
| | | | | | | | |
| | | | | | | | |
| | | | | | | | |
| Subtotal/total percentage | | 1,840,824 | | | 100.0 | % | | 1,749,161 | | | 100.0 | % |
| Short term investments | | 113,446 | | | | | 10,869 | | | |
| Total investments | | $ | 1,954,270 | | | | | $ | 1,760,030 | | | |
(1)The geographic dispersion is determined by the portfolio company's country of domicile.
As of December 31, 2023 and 2022, investments on non-accrual status represented 0.9% and 1.3%, respectively, of the Company's investment portfolio on a fair value basis.
The Company’s investment portfolio may contain senior secured investments that are in the form of lines of credit, delayed draw term loans, revolving credit facilities, or unfunded commitments, which may require the Company to provide funding when requested in accordance with the terms of the underlying agreements. As of December 31, 2023 and 2022, the Company’s unfunded commitments amounted to $47,349 and $71,420, respectively. As of March 6, 2024, the Company’s unfunded commitments amounted to $53,048. Since these commitments may expire without being drawn upon, unfunded commitments do not necessarily represent future cash requirements or future earning assets for the Company. Refer to Note 11 for further details on the Company’s unfunded commitments.
CĪON Investment Corporation
Notes to Consolidated Financial Statements
December 31, 2023
(in thousands, except share and per share amounts)
Note 7. Joint Ventures
CION/EagleTree Partners, LLC
On December 21, 2021, the Company formed CION/EagleTree, an off-balance sheet joint venture partnership with ET-BC Debt Opportunities, LP, or ET-BC, which is an affiliate of EagleTree Capital, LP, or EagleTree. EagleTree made a Firm-level investment with proprietary capital. CION/EagleTree jointly pursues debt and equity opportunities, as well as special situation, crossover, subordinated and other junior capital investments that leverages the Company's and EagleTree's combined sourcing and portfolio management capabilities.
The Company contributed a portfolio of second lien loans and equity investments and ET-BC contributed proprietary Firm-level cash in exchange for 85% and 15%, respectively, of the senior secured notes, participating preferred equity, and common share interests of CION/EagleTree. The Company and ET-BC are not required to make any additional capital contributions to CION/EagleTree. The Company’s equity investment in CION/EagleTree is not redeemable. All portfolio and other material decisions regarding CION/EagleTree must be submitted to its board of managers, which is comprised of four members, two of whom were selected by the Company and the other two were selected by ET-BC. Further, all portfolio and other material decisions require the affirmative vote of at least one board member from the Company and one board member from ET-BC.
The Company also serves as administrative agent to CION/EagleTree to provide servicing functions and other administrative services. In certain cases, these servicing functions and other administrative services may be performed by CIM. Amounts charged to CION/EagleTree by the Company for services performed by CIM are netted against amounts the Company is charged by CIM for administrative services.
On December 21, 2021, CION/EagleTree issued senior secured notes of $61,629 to the Company and $10,875 to ET-BC, or the CION/EagleTree Notes. The CION/EagleTree Notes bear interest at a fixed rate of 14.0% per year and are secured by a first priority security interest in all of the assets of CION/EagleTree. On November 16, 2023, the Company purchased a portion of the CION/EagleTree Notes held by ET-BC. As a result, as of December 31, 2023, the Company held $59,598 and ET-BC held $4,904 of the CION/Eagletree Notes. The obligations of CION/EagleTree under the CION/EagleTree Notes are non-recourse to the Company.
In accordance with ASU 2015-02, Consolidation, the Company determined that CION/EagleTree is not a variable interest entity, or VIE, as the Company is not the primary beneficiary and therefore does not consolidate CION/EagleTree. The Company's maximum exposure to losses from CION/EagleTree is limited to its investment in CION/EagleTree.
CĪON Investment Corporation
Notes to Consolidated Financial Statements
December 31, 2023
(in thousands, except share and per share amounts)
The following table sets forth the individual investments in CION/EagleTree's portfolio as of December 31, 2023:
| | | | | | | | | | | | | | | | | | | | | | | | | | | | | | | | | | | | | | |
| Portfolio Company | | Interest(a) | | Maturity | | Industry | | Principal/
Par Amount/
Units | | Cost(b) | | Fair
Value |
| Senior Secured First Lien Debt | | | | | | | | | | | | |
| Berlitz Holdings, Inc.(f) | | S+900, 1.00% SOFR Floor | | 2/14/2025 | | Services: Business | | $ | 1,200 | | | $ | 1,157 | | | $ | 1,194 | |
| Community Tree Service, LLC(g) | | S+850, 1.00% SOFR Floor | | 6/17/2027 | | Construction & Building | | 463 | | | 463 | | | 464 | |
| | | | | | | | | | | | |
| Total Senior Secured First Lien Debt | | | | | | | | | | 1,620 | | | 1,658 | |
| Senior Secured Second Lien Debt | | | | | | | | | | | | |
| Access CIG, LLC(g) | | S+775, 0.00% SOFR Floor | | 2/27/2026 | | Services: Business | | 7,250 | | | 7,229 | | | 7,244 | |
| | | | | | | | | | | | |
| MedPlast Holdings, Inc.(e) | | L+775, 0.00% LIBOR Floor | | 7/2/2026 | | Healthcare & Pharmaceuticals | | 6,750 | | | 6,276 | | | 6,535 | |
| | | | | | | | | | | | |
| Total Senior Secured Second Lien Debt | | | | | | | | | | 13,505 | | | 13,779 | |
| Collateralized Securities and Structured Products - Equity | | | | | | | | | | |
| Ivy Hill Middle Market Credit Fund VIII, Ltd. Subordinated Loan(c) | | 11.84% Estimated Yield | | 2/2/2026 | | Diversified Financials | | 10,000 | | | 9,717 | | | 9,117 | |
| Total Collateralized Securities and Structured Products - Equity | | | | | | | | 9,717 | | | 9,117 | |
| Equity | | | | | | | | | | | | |
| American Clinical Solutions LLC, Class A Membership Interests(d) | | | | Healthcare & Pharmaceuticals | | 6,030,384 Units | | 5,200 | | | 5,065 | |
| Anthem Sports and Entertainment Inc., Class A Preferred Stock Warrants(d) | | | | Media: Diversified & Production | | 1,469 Units | | 486 | | | 1,622 | |
| Anthem Sports and Entertainment Inc., Class B Preferred Stock Warrants(d) | | | | Media: Diversified & Production | | 255 Units | | — | | | 31 | |
| Anthem Sports and Entertainment Inc., Common Stock Warrants(d) | | | | Media: Diversified & Production | | 4,746 Units | | — | | | — | |
BCP Great Lakes II - Series A Holdings LP, Partnership Interests (4.2% ownership) | | | | Diversified Financials | | N/A | | 12,144 | | | 12,464 | |
| Carestream Health Holdings, Inc., Common Stock(d) | | | | Healthcare & Pharmaceuticals | | 614,367 Units | | 21,759 | | | 21,386 | |
CHC Medical Partners, Inc., Series C Preferred Stock, 12% Dividend | | | | Healthcare & Pharmaceuticals | | 2,727,273 Units | | 8,218 | | | 10,391 | |
| CTS Ultimate Holdings LLC, Class A Preferred Units(d) | | | | Construction & Building | | 3,578,701 Units | | 1,000 | | | 895 | |
| Dayton HoldCo, LLC, Membership Units(d) | | | | Construction & Building | | 37,264 Units | | 8,400 | | | 14,537 | |
| HDNet Holdco LLC, Preferred Unit Call Option(d) | | | | Media: Diversified & Production | | 1 Unit | | — | | | 382 | |
| Language Education Holdings GP LLC, Common Units(d) | | | | Services: Business | | 133,333 Units | | — | | | — | |
| Language Education Holdings LP, Ordinary Common Units(d) | | | | Services: Business | | 133,333 Units | | 300 | | | 503 | |
| Skillsoft Corp., Class A Common Stock(d) | | | | High Tech Industries | | 12,171 Units | | 2,000 | | | 214 | |
| Spinal USA, Inc. / Precision Medical Inc., Warrants(d) | | | | Healthcare & Pharmaceuticals | | 20,667,324 Units | | — | | | — | |
| Total Equity | | | | | | | | | | 59,507 | | | 67,490 | |
| Short Term Investments(h) | | | | | | | | | | | | |
| First American Treasury Obligations Fund, Class Z Shares | | 5.24%(i) | | | | | | | | 1,306 | | | 1,306 | |
| Total Short Term Investments | | | | | | | | | | 1,306 | | | 1,306 | |
| TOTAL INVESTMENTS | | | | | | | | | | $ | 85,655 | | | $ | 93,350 | |
a.The actual SOFR rate for each loan listed may not be the applicable SOFR rate as of December 31, 2023, as the loan may have been priced or repriced based on a SOFR rate prior to or subsequent to December 31, 2023. The actual LIBOR rate for each loan listed may not be the applicable LIBOR rate as of December 31, 2023, as the loan may have been priced or repriced based on a LIBOR rate prior to or subsequent to December 31, 2023.
b.Represents amortized cost for debt securities and cost for equity investments.
c.The CLO subordinated notes are considered equity positions in the CLO vehicles and are not rated. Equity investments are entitled to recurring distributions, which are generally equal to the remaining cash flow of the payments made by the underlying vehicle's securities less contractual payments to debt holders and expenses. The estimated yield indicated is based upon a current projection of the amount and timing of these recurring distributions and the estimated amount of repayment of principal upon termination. Such projections are periodically reviewed and adjusted, and the estimated yield may not ultimately be realized.
d.Non-income producing security.
e.The interest rate on these loans is subject to 1 month LIBOR, which as of December 31, 2023 was 5.47%.
f.The interest rate on these loans is subject to 1 month SOFR, which as of December 31, 2023 was 5.35%.
g.The interest rate on these loans is subject to 3 month SOFR, which as of December 31, 2023 was 5.33%.
h.Short term investments represent an investment in a fund that invests in highly liquid investments with average original maturity dates of three months or less.
i.7-day effective yield as of December 31, 2023.
CĪON Investment Corporation
Notes to Consolidated Financial Statements
December 31, 2023
(in thousands, except share and per share amounts)
The following table sets forth the individual investments in CION/EagleTree's portfolio as of December 31, 2022:
| | | | | | | | | | | | | | | | | | | | | | | | | | | | | | | | | | | | | | |
| Portfolio Company | | Interest(a) | | Maturity | | Industry | | Principal/
Par Amount/
Units | | Cost(b) | | Fair
Value |
| Senior Secured First Lien Debt | | | | | | | | | | | | |
| Berlitz Holdings, Inc.(g) | | S+900, 1.00% SOFR Floor | | 2/14/2025 | | Services: Business | | $ | 1,200 | | | $ | 1,125 | | | $ | 1,146 | |
| Community Tree Service, LLC(h) | | S+850, 1.00% SOFR Floor | | 6/17/2027 | | Construction & Building | | 499 | | 499 | | | 489 | |
| Future Pak, LLC(e) | | L+800, 2.00% LIBOR Floor | | 7/2/2024 | | Healthcare & Pharmaceuticals | | 1,395 | | 1,382 | | | 1,372 | |
| Total Senior Secured First Lien Debt | | | | | | | | | | 3,006 | | | 3,007 | |
| Senior Secured Second Lien Debt | | | | | | | | | | | | |
| Access CIG, LLC(f) | | L+775, 0.00% LIBOR Floor | | 2/27/2026 | | Services: Business | | 7,250 | | | 7,220 | | | 6,933 | |
| Dayton Superior Corp.(e) | | L+700, 2.00% LIBOR Floor | | 12/4/2024 | | Construction & Building | | 1,010 | | 1,010 | | | 1,007 | |
| MedPlast Holdings, Inc.(e) | | L+775, 0.00% LIBOR Floor | | 7/2/2026 | | Healthcare & Pharmaceuticals | | 6,750 | | 6,135 | | | 6,337 | |
| Zest Acquisition Corp.(e) | | L+700, 1.00% LIBOR Floor | | 3/14/2026 | | Healthcare & Pharmaceuticals | | 15,000 | | 14,820 | | | 14,175 | |
| Total Senior Secured Second Lien Debt | | | | | | | | | | 29,185 | | | 28,452 | |
| Collateralized Securities and Structured Products - Equity | | | | | | | | | | |
| Ivy Hill Middle Market Credit Fund VIII, Ltd. Subordinated Loan(c) | | 11.84% Estimated Yield | | 2/2/2026 | | Diversified Financials | | 10,000 | | 9,874 | | | 9,523 | |
| Total Collateralized Securities and Structured Products - Equity | | | | | | | | 9,874 | | | 9,523 | |
| Equity | | | | | | | | | | | | |
| American Clinical Solutions LLC, Class A Membership Interests(d) | | | | Healthcare & Pharmaceuticals | | 6,030,384 Units | | 5,200 | | | 3,618 | |
| Anthem Sports and Entertainment Inc., Class A Preferred Stock Warrants(d) | | | | Media: Diversified & Production | | 1,469 Units | | 486 | | | 1,881 | |
| Anthem Sports and Entertainment Inc., Class B Preferred Stock Warrants(d) | | | | Media: Diversified & Production | | 255 Units | | — | | | 187 | |
| Anthem Sports and Entertainment Inc., Common Stock Warrants(d) | | | | Media: Diversified & Production | | 4,746 Units | | — | | | 580 | |
BCP Great Lakes II - Series A Holdings LP, Partnership Interests (4.2% ownership) | | | | Diversified Financials | | N/A | | 11,436 | | | 11,058 | |
| Carestream Health Holdings, Inc., Common Stock(d) | | | | Healthcare & Pharmaceuticals | | 613,262 Units | | 21,759 | | | 21,544 | |
CHC Medical Partners, Inc., Series C Preferred Stock, 12% Dividend | | | | Healthcare & Pharmaceuticals | | 2,727,273 Units | | 7,891 | | | 8,877 | |
| CTS Ultimate Holdings LLC, Class A Preferred Units(d) | | | | Construction & Building | | 3,578,701 Units | | 1,000 | | | 859 | |
| Dayton HoldCo, LLC, Membership Units(d) | | | | Construction & Building | | 37,264 Units | | 8,400 | | | 15,334 | |
| HDNet Holdco LLC, Preferred Unit Call Option(d) | | | | Media: Diversified & Production | | 1 Unit | | — | | | 185 | |
HW Ultimate Holdings, LP, Class A Membership Units, 4% Dividend | | | | Capital Equipment | | 2,000,000 Units | | 2,082 | | | 130 | |
| Language Education Holdings GP LLC, Common Units(d) | | | | Services: Business | | 133,333 Units | | — | | | — | |
| Language Education Holdings LP, Ordinary Common Units(d) | | | | Services: Business | | 133,333 Units | | 300 | | | 427 | |
| Skillsoft Corp., Class A Common Stock(d) | | | | High Tech Industries | | 243,425 Units | | 2,000 | | | 316 | |
| Spinal USA, Inc. / Precision Medical Inc., Warrants(d) | | | | Healthcare & Pharmaceuticals | | 20,667,324 Units | | — | | | — | |
| Total Equity | | | | | | | | | | 60,554 | | | 64,996 | |
| TOTAL INVESTMENTS | | | | | | | | | | $ | 102,619 | | | $ | 105,978 | |
a.The actual LIBOR rate for each loan listed may not be the applicable LIBOR rate as of December 31, 2022, as the loan may have been priced or repriced based on a LIBOR rate prior to or subsequent to December 31, 2022. The actual SOFR rate for each loan listed may not be the applicable SOFR rate as of December 31, 2022, as the loan may have been priced or repriced based on a SOFR rate prior to or subsequent to December 31, 2022.
b.Represents amortized cost for debt securities and cost for equity investments.
c.The CLO subordinated notes are considered equity positions in the CLO vehicles and are not rated. Equity investments are entitled to recurring distributions, which are generally equal to the remaining cash flow of the payments made by the underlying vehicle's securities less contractual payments to debt holders and expenses. The estimated yield indicated is based upon a current projection of the amount and timing of these recurring distributions and the estimated amount of repayment of principal upon termination. Such projections are periodically reviewed and adjusted, and the estimated yield may not ultimately be realized.
d.Non-income producing security.
e.The interest rate on these loans is subject to 1 month LIBOR, which as of December 31, 2022 was 4.39%.
f.The interest rate on these loans is subject to 3 month LIBOR, which as of December 31, 2022 was 4.77%.
g.The interest rate on these loans is subject to 1 month SOFR, which as of December 31, 2022 was 4.36%.
h.The interest rate on these loans is subject to 3 month SOFR, which as of December 31, 2022 was 4.59%.
CĪON Investment Corporation
Notes to Consolidated Financial Statements
December 31, 2023
(in thousands, except share and per share amounts)
The following table includes selected balance sheet information for CION/EagleTree as of December 31, 2023 and 2022:
| | | | | | | | | | | | | | |
| Selected Balance Sheet Information: | | December 31, 2023 | | December 31, 2022 |
Investments, at fair value (amortized cost of $85,655 and $102,619, respectively) | | $ | 93,350 | | | $ | 105,978 | |
| Cash and other assets | | 14 | | | 2,476 | |
| | | | |
| Dividend receivable on investments | | 414 | | | 225 | |
| Interest receivable on investments | | 287 | | | 301 | |
| Total assets | | $ | 94,065 | | | $ | 108,980 | |
| | | | |
Senior secured notes (net of unamortized debt issuance costs of $70 and $94, respectively) | | $ | 64,432 | | | $ | 70,904 | |
| Other liabilities | | 166 | | | 1,881 | |
| Total liabilities | | 64,598 | | | 72,785 | |
| Members' capital | | 29,467 | | | 36,195 | |
| Total liabilities and members' capital | | $ | 94,065 | | | $ | 108,980 | |
The following table includes selected statement of operations information for CION/EagleTree for the year ended December 31, 2023 and for the year ended December 31, 2022:
| | | | | | | | | | | |
| Selected Statement of Operations Information: | Year Ended December 31, 2023 | | Year Ended December 31, 2022 |
| Total revenues | $ | 6,230 | | | $ | 9,653 | |
| Total expenses | 10,213 | | | 11,120 | |
| Net realized (loss) gain on investments | (2,083) | | | 9,947 | |
| Net change in unrealized appreciation (depreciation) on investments | 4,338 | | | (5,839) | |
| Net (decrease) increase in net assets from operations | $ | (1,728) | | | $ | 2,641 | |
| | | |
| | | |
| | | |
| | | |
| | | |
| | | |
CION SOF Funding, LLC
CION SOF was organized on May 21, 2019 as a Delaware limited liability company and commenced operations on October 2, 2019 when the Company and BCP Special Opportunities Fund I, LP, or BCP, entered into the limited liability company agreement of CION SOF for purposes of establishing the manner in which the parties would invest in and co-manage CION SOF. CION SOF invested primarily in senior secured loans of U.S. middle-market companies. The Company and BCP contributed a portfolio of loans to CION SOF representing membership equity of $31,289 and $4,470, respectively, in exchange for 87.5% and 12.5% of the membership interests of CION SOF, respectively.
On October 2, 2019, CION SOF entered into a senior secured credit facility, or the SOF Credit Facility, with Morgan Stanley Bank, N.A., or MS, for borrowings of up to a maximum amount of $75,000. Advances under the SOF Credit Facility were available through October 2, 2022 and bore interest at a floating rate equal to the three-month LIBOR, plus a spread of (i) 3.0% per year through October 1, 2022 and (i) 3.5% per year thereafter through October 2, 2024. CION SOF's obligations to MS under the SOF Credit Facility were secured by a first priority security interest in all of the assets of CION SOF. The obligations of CION SOF under the SOF Credit Facility were non-recourse to the Company. On October 2, 2019, CION SOF drew down $64,702 of borrowings under the SOF Credit Facility.
In December 2020, the Company and BCP elected to wind-down the operations of CION SOF. On December 14, 2020, CION SOF repaid to MS all amounts outstanding under the SOF Credit Facility. On January 28, 2021, CION SOF sold all of its remaining debt and equity investments to the Company. On March 18, 2021, CION SOF declared a final distribution, which was a return of capital, and on March 19, 2021, distributed all remaining assets to the Company and BCP.
The Company and BCP were not required to make any additional capital contributions to CION SOF. The Company’s equity investment in CION SOF was not redeemable. All portfolio and other material decisions regarding CION SOF required approval of its board of managers, which was comprised of four members, two of whom were selected by the Company and the other two were selected by BCP. Further, all portfolio and other material decisions required the affirmative vote of at least one board member from the Company and one board member from BCP.
The Company also served as administrative agent to CION SOF to provide loan servicing functions and other administrative services. In certain cases, these loan servicing functions and other administrative services were performed by CIM.
CĪON Investment Corporation
Notes to Consolidated Financial Statements
December 31, 2023
(in thousands, except share and per share amounts)
In accordance with ASU 2015-02, Consolidation, the Company determined that CION SOF was a VIE. However, the Company was not the primary beneficiary and therefore did not consolidate CION SOF. The Company's maximum exposure to losses from CION SOF was limited to its equity contribution to CION SOF.
The Company did not record any dividend income from its equity interest in CION SOF for the years ended December 31, 2023, 2022 or 2021.
Note 8. Financing Arrangements
The following table presents summary information with respect to the Company’s outstanding financing arrangements as of December 31, 2023:
| | | | | | | | | | | | | | | | | | | | | | | | | | | | | | | | |
| Financing Arrangement | | Type of Financing Arrangement | | Rate | | Amount Outstanding | | Amount Available | | Maturity Date |
| JPM Credit Facility | | Term Loan Credit Facility | | SOFR+3.20% | | $ | 550,000 | | | $ | 125,000 | | | May 15, 2025 |
| 2026 Notes(1) | | Note Purchase Agreement | | 4.50% | | 125,000 | | | — | | | February 11, 2026 |
| UBS Facility | | Repurchase Agreement | | SOFR+3.20% | | 122,500 | | | 27,500 | | | November 19, 2024 |
| Series A Notes(2) | | Israel Public Bond Offering | | SOFR+3.82% | | 114,844 | | | — | | | August 31, 2026 |
| 2027 Notes | | Note Purchase Agreement | | SOFR+4.75% | | 100,000 | | | — | | | November 8, 2027 |
| 2022 More Term Loan | | Term Loan Facility Agreement | | SOFR+3.50% | | 50,000 | | | — | | | April 27, 2027 |
| 2021 More Term Loan(3) | | Term Loan Facility Agreement | | 5.20% | | 30,000 | | | — | | | September 30, 2024 |
| | | | | | $ | 1,092,344 | | | $ | 152,500 | | | |
(1)As of December 31, 2023, the fair value of the 2026 Notes was $125,000, which was based on a yield analysis and discount rate commensurate with the market yields for similar types of debt. The fair value of these debt obligations would be categorized as Level 3 under ASC 820 as of December 31, 2023.
(2)As of December 31, 2023, the fair value of the Series A Notes was $121,710, which was based on readily observable, transparent prices. The fair value of these debt obligations would be categorized as Level 1 under ASC 820 as of December 31, 2023.
(3)As of December 31, 2023, the fair value of the 2021 More Term Loan was $30,000, which was based on a yield analysis and discount rate commensurate with the market yields for similar types of debt. The fair value of these debt obligations would be categorized as Level 3 under ASC 820 as of December 31, 2023.
JPM Credit Facility
On August 26, 2016, 34th Street entered into a senior secured credit facility with JPM. The senior secured credit facility with JPM, or the JPM Credit Facility, provided for borrowings in an aggregate principal amount of $150,000, of which $25,000 could have been funded as a revolving credit facility, each subject to conditions described in the JPM Credit Facility. On August 26, 2016, 34th Street drew down $57,000 of borrowings under the JPM Credit Facility.
On September 30, 2016, July 11, 2017, November 28, 2017 and May 23, 2018, 34th Street amended and restated the JPM Credit Facility, or the Amended JPM Credit Facility, with JPM. Under the Amended JPM Credit Facility entered into on September 30, 2016, the aggregate principal amount available for borrowings was increased from $150,000 to $225,000, of which $25,000 could have been funded as a revolving credit facility, subject to conditions described in the Amended JPM Credit Facility. Under the Amended JPM Credit Facility entered into on July 11, 2017 and November 28, 2017, certain immaterial administrative amendments were made as a result of the termination of AIM as the Company's investment sub-adviser as discussed in Note 1. Under the Amended JPM Credit Facility entered into on May 23, 2018, (i) the aggregate principal amount available for borrowings was increased from $225,000 to $275,000, of which $25,000 could have been funded as a revolving credit facility, subject to conditions described in the Amended JPM Credit Facility, (ii) the reinvestment period was extended until August 24, 2020 and (iii) the maturity date was extended to August 24, 2021.
On May 15, 2020, 34th Street amended and restated the Amended JPM Credit Facility, or the Second Amended JPM Credit Facility, with JPM in order to fully repay all amounts outstanding under the Company's prior Citibank Credit Facility and MS Credit Facility and repay $100,000 of advances outstanding under the UBS Facility (as described below). Under the Second Amended JPM Credit Facility, the aggregate principal amount available for borrowings was increased from $275,000 to $700,000, of which $75,000 may be funded as a revolving credit facility, subject to conditions described in the Second Amended JPM Credit Facility, during the reinvestment period. Under the Second Amended JPM Credit Facility, the reinvestment period was extended until May 15, 2022 and the maturity date was extended to May 15, 2023. Advances under the Second Amended JPM Credit Facility bore interest at a floating rate equal to the three-month LIBOR, plus a spread of 3.25% per year.
CĪON Investment Corporation
Notes to Consolidated Financial Statements
December 31, 2023
(in thousands, except share and per share amounts)
On February 26, 2021, 34th Street amended and restated the Second Amended JPM Credit Facility, or the Third Amended JPM Credit Facility, with JPM. Under the Third Amended JPM Credit Facility, the aggregate principal amount available for borrowings was reduced from $700,000 to $575,000, subject to conditions described in the Third Amended JPM Credit Facility. In addition, under the Third Amended JPM Credit Facility, the reinvestment period was extended from May 15, 2022 to May 15, 2023 and the maturity date was extended from May 15, 2023 to May 15, 2024. Advances under the Third Amended JPM Credit Facility bore interest at a floating rate equal to the three-month LIBOR, plus a spread of 3.10% per year. 34th Street incurred certain customary costs and expenses in connection with the Third Amended JPM Credit Facility. No other material terms of the Second JPM Credit Facility were revised in connection with the Third Amended JPM Credit Facility.
On March 28, 2022, 34th Street entered into a First Amendment to the Third Amended JPM Credit Facility with JPM, or the JPM First Amendment. Under the JPM First Amendment, the aggregate principal amount available for borrowings was increased from $575,000 to $675,000, subject to conditions described in the JPM First Amendment. Additional advances of up to $100,000 under the JPM First Amendment bore interest at a floating rate equal to the three-month SOFR, plus a credit spread of 3.10% per year, and a LIBOR to SOFR credit spread adjustment of 0.15%. 34th Street incurred certain customary costs and expenses in connection with the JPM First Amendment. No other material terms of the Third Amended JPM Credit Facility were revised in connection with the JPM First Amendment.
On May 15, 2023, 34th Street entered into a Second Amendment to the Third Amended JPM Credit Facility with JPM, or the JPM Second Amendment. Under the JPM Second Amendment, the aggregate principal amount available for borrowings remained unchanged of up to $675,000 but all such advances bear interest at a floating rate equal to the three-month SOFR, plus a credit spread of 3.05% per year, and a LIBOR to SOFR credit spread adjustment of 0.15%. The reinvestment period was extended from May 15, 2023 to May 15, 2024 and the maturity date was extended from May 15, 2024 to May 15, 2025. Also under the JPM Second Amendment, the amount of minimum borrowings required was reduced by $50,000 to $550,000 with a six-month non-call provision. 34th Street incurred certain customary costs and expenses in connection with the JPM Second Amendment. No other material terms of the Third Amended JPM Credit Facility were revised in connection with the JPM Second Amendment.
Interest is payable quarterly in arrears. 34th Street may prepay advances pursuant to the terms and conditions of the Third Amended JPM Credit Facility and the JPM Second Amendment, subject to a 1.0% premium in certain circumstances. In addition, 34th Street will be subject to a non-usage fee of 1.0% per year on the amount, if any, of the aggregate principal amount available under the Third Amended JPM Credit Facility and the JPM Second Amendment that has not been borrowed through May 14, 2024. The non-usage fees, if any, are payable quarterly in arrears.
As of December 31, 2023 and 2022, the aggregate principal amount outstanding on the Third Amended JPM Credit Facility was $550,000 and $610,000, respectively. The carrying amount outstanding under the Third Amended JPM Credit Facility and the JPM Second Amendment approximates its fair value.
The Company contributed loans and other corporate debt securities to 34th Street in exchange for 100% of the membership interests of 34th Street, and may contribute additional loans and other corporate debt securities to 34th Street in the future. 34th Street’s obligations to JPM under the Third Amended JPM Credit Facility and the JPM Second Amendment are secured by a first priority security interest in all of the assets of 34th Street. The obligations of 34th Street under the Third Amended JPM Credit Facility and the JPM Second Amendment are non-recourse to the Company, and the Company’s exposure under the Third Amended JPM Credit Facility and the JPM Second Amendment is limited to the value of the Company’s investment in 34th Street.
In connection with the Third Amended JPM Credit Facility and the JPM Second Amendment, 34th Street made certain representations and warranties and is required to comply with a borrowing base requirement, various covenants, reporting requirements and other customary requirements for similar facilities. As of and for the year ended December 31, 2023, 34th Street was in compliance with all covenants and reporting requirements.
Through December 31, 2023, the Company incurred debt issuance costs of $13,790 in connection with obtaining and amending the JPM Credit Facility, which were recorded as a direct reduction to the outstanding balance of the Third Amended JPM Credit Facility and the JPM Second Amendment, which is included in the Company’s consolidated balance sheet as of December 31, 2023 and will amortize to interest expense over the term of the Third Amended JPM Credit Facility and the JPM Second Amendment. At December 31, 2023, the unamortized portion of the debt issuance costs was $2,725.
CĪON Investment Corporation
Notes to Consolidated Financial Statements
December 31, 2023
(in thousands, except share and per share amounts)
For the years ended December 31, 2023 and 2022, the components of interest expense, average borrowings, and weighted average interest rate for the JPM Second Amendment and the Third Amended JPM Credit Facility were as follows:
| | | | | | | | | | | | | | |
| | Years Ended December 31, |
| | 2023 | | 2022 |
| Stated interest expense | | $ | 50,223 | | | $ | 29,254 | |
| Amortization of deferred financing costs | | 2,097 | | | 2,214 | |
| Non-usage fee | | 808 | | | 617 | |
| Total interest expense | | $ | 53,128 | | | $ | 32,085 | |
| Weighted average interest rate(1) | | 8.45 | % | | 4.99 | % |
| Average borrowings | | $ | 595,342 | | | $ | 590,603 | |
(1)Includes the stated interest expense and non-usage fee on the unused portion of the JPM Second Amendment and the Third Amended JPM Credit Facility and is annualized for periods covering less than one year.
2026 Notes
On February 11, 2021, the Company entered into a Note Purchase Agreement with certain purchasers, or the Note Purchase Agreement, in connection with the Company’s issuance of $125,000 aggregate principal amount of its 4.50% senior unsecured notes due in 2026, or the 2026 Notes. The net proceeds to the Company were approximately $122,300, after the deduction of placement agent fees and other financing expenses, which the Company used to repay debt under its secured financing arrangements.
The 2026 Notes mature on February 11, 2026. The 2026 Notes bear interest at a rate of 4.50% per year payable semi-annually on February 11th and August 11th of each year, which commenced on August 11, 2021. The Company has the right to, at its option, redeem all or a part that is not less than 10% of the 2026 Notes (i) after February 11, 2024 but on or before February 11, 2025, at a redemption price equal to 102% of the principal amount of the 2026 Notes to be redeemed, plus accrued and unpaid interest, if any, (ii) after February 11, 2025 but on or before August 11, 2025, at a redemption price equal to 101% of the principal amount of the 2026 Notes to be redeemed, plus accrued and unpaid interest, if any, and (iii) after August 11, 2025, at a redemption price equal to 100% of the principal amount of the 2026 Notes to be redeemed, plus accrued and unpaid interest, if any.
The 2026 Notes are general unsecured obligations of the Company that rank pari passu with all existing and future unsecured unsubordinated indebtedness issued by the Company, rank effectively junior to any of the Company’s secured indebtedness (including unsecured indebtedness that the Company later secures) to the extent of the value of the assets securing such indebtedness, and rank structurally junior to all existing and future indebtedness (including trade payables) incurred by certain of the Company’s subsidiaries, financing vehicles or similar facilities.
The Note Purchase Agreement contains other terms and conditions, including, without limitation, affirmative and negative covenants such as (i) information reporting, (ii) maintenance of the Company’s status as a BDC, (iii) minimum shareholders’ equity of $543.6 million, (iv) a minimum asset coverage ratio of not less than 150%, (v) a minimum interest coverage ratio of 1.25 to 1.00 and (vi) an unencumbered asset coverage ratio of 1.25 to 1.00, provided that (a) first lien senior secured loans and cash represent more than 65% of the total value of unencumbered assets used by the Company for purposes of the ratio and (b) equity interests or structured products in the aggregate represent less than 15% of the total value of unencumbered assets used by the Company for purposes of the ratio. As of and for the year ended December 31, 2023, the Company was in compliance with all covenants and reporting requirements.
The Note Purchase Agreement also contains a “most favored lender” provision in favor of the purchasers in respect of any new unsecured credit facilities, loans or indebtedness in excess of $25,000 incurred by the Company, which indebtedness contains a financial covenant not contained in, or more restrictive against the Company than those contained, in the Note Purchase Agreement. In addition, the Note Purchase Agreement contains customary events of default with customary cure and notice periods, including, without limitation, nonpayment, incorrect representation in any material respect, breach of covenant, cross-default under other indebtedness or derivative securities of the Company in an outstanding aggregate principal amount of at least $25,000, certain judgments and orders, and certain events of bankruptcy.
As of December 31, 2023, the aggregate principal amount of 2026 Notes outstanding was $125,000.
Through December 31, 2023, the Company incurred debt issuance costs of $2,669 in connection with issuing the 2026 Notes, which were recorded as a direct reduction to the outstanding balance of the 2026 Notes, which is included in the Company’s consolidated balance sheet as of December 31, 2023 and will amortize to interest expense over the term of the 2026 Notes. At December 31, 2023, the unamortized portion of the debt issuance costs was $1,129.
CĪON Investment Corporation
Notes to Consolidated Financial Statements
December 31, 2023
(in thousands, except share and per share amounts)
For the years ended December 31, 2023 and 2022, the components of interest expense, average borrowings, and weighted average interest rate for the 2026 Notes were as follows:
| | | | | | | | | | | | | | |
| | Years Ended December 31, |
| | 2023 | | 2022 |
| Stated interest expense | | $ | 5,625 | | | $ | 5,600 | |
| Amortization of deferred financing costs | | 533 | | | 533 | |
| | | | |
| Total interest expense | | $ | 6,158 | | | $ | 6,133 | |
| Weighted average interest rate(1) | | 4.50 | % | | 4.50 | % |
| Average borrowings | | $ | 125,000 | | | $ | 125,000 | |
(1)Includes the stated interest expense on the 2026 Notes and is annualized for periods covering less than one year.
UBS Facility
On May 19, 2017, the Company, through two newly-formed, wholly-owned, special-purpose financing subsidiaries, entered into a financing arrangement with UBS pursuant to which up to $125,000 was made available to the Company.
Pursuant to the financing arrangement, assets in the Company's portfolio may be contributed from time to time to Murray Hill Funding II through Murray Hill Funding, LLC, or Murray Hill Funding, each a newly-formed, wholly-owned, special-purpose financing subsidiary of the Company. On May 19, 2017, the Company contributed assets to Murray Hill Funding II. The assets held by Murray Hill Funding II secure the obligations of Murray Hill Funding II under Class A-1 Notes, or the Notes, issued by Murray Hill Funding II. Pursuant to an Indenture, dated May 19, 2017, between Murray Hill Funding II and U.S. Bank National Association, or U.S. Bank, as trustee, or the Indenture, the aggregate principal amount of Notes that may be issued by Murray Hill Funding II from time to time was $192,308. Murray Hill Funding purchased the Notes issued by Murray Hill Funding II at a purchase price equal to their par value. Murray Hill Funding makes capital contributions to Murray Hill Funding II to, among other things, maintain the value of the portfolio of assets held by Murray Hill Funding II.
Principal on the Notes will be due and payable on the stated maturity date of May 19, 2027. Pursuant to the Indenture, Murray Hill Funding II made certain representations and warranties and is required to comply with various covenants, reporting requirements and other customary requirements for similar transactions. The Indenture contains events of default customary for similar transactions, including, without limitation: (a) the failure to make principal payments on the Notes at their stated maturity or any earlier redemption date or to make interest payments on the Notes and such failure is not cured within three business days; (b) the failure to disburse amounts in accordance with the priority of payments and such failure is not cured within three business days; and (c) the occurrence of certain bankruptcy and insolvency events with respect to Murray Hill Funding II or Murray Hill Funding. As of and for the year ended December 31, 2023, Murray Hill Funding II was in compliance with all covenants and reporting requirements.
Murray Hill Funding, in turn, entered into a repurchase transaction with UBS, pursuant to the terms of a Global Master Repurchase Agreement and the related Annex and Master Confirmation thereto, each dated May 19, 2017, or collectively, the UBS Facility. Pursuant to the UBS Facility, on May 19, 2017 and June 19, 2017, UBS purchased Notes held by Murray Hill Funding for an aggregate purchase price equal to 65% of the principal amount of Notes purchased. Subject to certain conditions, the maximum principal amount of Notes that may be purchased under the UBS Facility was $192,308. Accordingly, the aggregate maximum amount payable to Murray Hill Funding under the UBS Facility would not exceed $125,000. Murray Hill Funding was required to repurchase the Notes sold to UBS under the UBS Facility by no later than May 19, 2020. The repurchase price paid by Murray Hill Funding to UBS will be equal to the purchase price paid by UBS for the repurchased Notes (giving effect to any reductions resulting from voluntary partial prepayment(s)). The financing fee under the UBS Facility was equal to the three-month LIBOR plus a spread of up to 3.50% per year for the relevant period.
On December 1, 2017, Murray Hill Funding II amended and restated the Indenture, or the Amended Indenture, pursuant to which the aggregate principal amount of Notes that may be issued by Murray Hill Funding II was increased from $192,308 to $266,667. On December 1, 2017, Murray Hill Funding entered into a First Amended and Restated Master Confirmation to the Global Master Repurchase Agreement, or the Amended Master Confirmation, which sets forth the terms of the repurchase transaction between Murray Hill Funding and UBS under the UBS Facility. As part of the Amended Master Confirmation, on December 15, 2017 and April 2, 2018, UBS purchased the increased aggregate principal amount of Notes held by Murray Hill Funding for an aggregate purchase price equal to 75% of the principal amount of Notes issued. As a result of the Amended Master Confirmation, the aggregate maximum amount payable to Murray Hill Funding and made available to the Company under the UBS Facility was increased from $125,000 to $200,000. No other material terms of the UBS Facility were revised in connection with the amended UBS Facility, or the Amended UBS Facility.
CĪON Investment Corporation
Notes to Consolidated Financial Statements
December 31, 2023
(in thousands, except share and per share amounts)
On May 19, 2020, Murray Hill Funding entered into a Second Amended and Restated Master Confirmation to the Global Master Repurchase Agreement, or the Second Amended Master Confirmation, which extended the date that Murray Hill Funding will be required to repurchase the Notes sold to UBS under the Amended UBS Facility from May 19, 2020 to November 19, 2020, and increased the spread on the financing fee from 3.50% to 3.90% per year.
On May 19, 2020, Murray Hill Funding also repurchased Notes in the aggregate principal amount of $133,333 from UBS for an aggregate repurchase price of $100,000, which was then repaid by Murray Hill Funding II. The repurchase of the Notes on May 19, 2020 resulted in a repayment of one-half of the outstanding amount of borrowings under the Amended UBS Facility as of May 19, 2020. As of December 31, 2020, Notes remained outstanding in the aggregate principal amount of $133,333, which was purchased by Murray Hill Funding from Murray Hill Funding II and subsequently sold to UBS under the Amended UBS Facility for aggregate proceeds of $100,000.
On November 12, 2020, Murray Hill Funding entered into a Third Amended and Restated Master Confirmation to the Global Master Repurchase Agreement, or the Third Amended Master Confirmation, to further extend the date that Murray Hill Funding will be required to repurchase the Notes to December 18, 2020.
On December 17, 2020, Murray Hill Funding entered into a Fourth Amended and Restated Master Confirmation to the Global Master Repurchase Agreement, or the Fourth Amended Master Confirmation, which further extended the date that Murray Hill Funding will be required to repurchase the Notes sold to UBS under the Amended UBS Facility from December 18, 2020 to November 19, 2023, and decreased the spread on the financing fee from 3.90% to 3.375% per year. No other material terms of the Amended UBS Facility were revised in connection with the Fourth Amended Master Confirmation.
On December 17, 2020, Murray Hill Funding also entered into a Revolving Credit Note Agreement, or the Revolving Note Agreement, with Murray Hill Funding II, UBS and U.S. Bank, as note agent and trustee, which provides for a revolving credit facility in an aggregate principal amount of $50,000, subject to compliance with a borrowing base. Murray Hill Funding II will issue Class A-R Notes, or the Class A-R Notes, in exchange for advances under the Revolving Note Agreement. Principal on the Class A-R Notes will be due and payable on the stated maturity date of May 19, 2027, which is the same stated maturity date as the Notes.
The Class A-R Notes will be issued pursuant to a Second Amended and Restated Indenture, dated December 17, 2020, between Murray Hill Funding II and U.S. Bank, as trustee, or the Second Amended Indenture. Under the Second Amended Indenture, the aggregate principal amount of Notes and Class A-R Notes that may be issued by Murray Hill Funding II from time to time is $150,000. Murray Hill Funding, in turn, entered into a repurchase transaction with UBS pursuant to the terms of the related Annex and Master Confirmation, dated December 17, 2020, to the Global Master Repurchase Agreement, dated May 19, 2017, related to the Class A-R Notes. Murray Hill Funding was required to repurchase the Class A-R Notes that will be sold to UBS by no later than November 19, 2023. The financing fee for the funded Class A-R Notes was equal to the three-month LIBOR plus a spread of 3.375% per year while the financing fee for the unfunded Class A-R Notes is equal to 0.75% per year.
On June 14, 2023, Murray Hill Funding entered into with UBS (i) a Fifth Amended and Restated Master Confirmation (Class A-1 Notes) to the Global Master Repurchase Agreement, or the Fifth Amended Master Confirmation, and (ii) an Amended and Restated Master Confirmation (Class A-R Notes) to the Global Master Repurchase Agreement, or the Amended Master Confirmation. Under both Confirmations, the date that Murray Hill Funding will be required to repurchase the Notes and the Class A-R Notes previously sold to UBS under the Amended UBS Facility was extended from November 19, 2023 to November 19, 2024. Also under both Confirmations, the financing fee payable to UBS was revised from a floating rate equal to the three-month LIBOR, plus a spread of 3.375% per year, to a floating rate equal to the three-month SOFR, plus a spread of (a) to (but excluding) November 19, 2023, 3.525% per year, and (b) thereafter, 3.20% per year. The effective date of both Confirmations was June 15, 2023. No other material terms of the Amended UBS Facility were revised in connection with the Fifth Amended Master Confirmation or the Amended Master Confirmation.
On July 1, 2021, December 14, 2021, April 19, 2022 and August 16, 2023, UBS purchased Class A-R Notes held by Murray Hill Funding for an aggregate purchase price equal to 100% of the principal amount of Class A-R Notes purchased, which was $21,000, $25,000, $17,500 and $22,500, respectively. On August 20, 2021, March 7, 2023 and April 14, 2023, Murray Hill Funding repurchased Class A-R Notes from UBS in the aggregate principal amount of $21,000, $17,500 and $25,000, respectively, for an aggregate repurchase price of $21,000, $17,500 and $25,000, respectively, which was then repaid by Murray Hill Funding II. The repurchase of the Class A-R Notes on August 20, 2021, March 7, 2023 and April 14, 2023 resulted in repayments of $21,000, $17,500 and $25,000, respectively, of the outstanding amount of borrowings under the Amended UBS Facility.
UBS may require Murray Hill Funding to post cash collateral if, without limitation, the sum of the market value of the portfolio of assets and the cash and eligible investments held by Murray Hill Funding II, together with any posted cash collateral, is less than the required margin amount under the Amended UBS Facility; provided, however, that Murray Hill Funding will not be required to post cash collateral with UBS until such market value has declined at least 10% from the initial market value of the portfolio assets.
CĪON Investment Corporation
Notes to Consolidated Financial Statements
December 31, 2023
(in thousands, except share and per share amounts)
The Company has no contractual obligation to post any such cash collateral or to make any payments to UBS on behalf of Murray Hill Funding. The Company may, but is not obligated to, increase its investment in Murray Hill Funding for the purpose of funding any cash collateral or payment obligations for which Murray Hill Funding becomes obligated in connection with the Amended UBS Facility. The Company’s exposure under the Amended UBS Facility is limited to the value of the Company’s investment in Murray Hill Funding.
Pursuant to the Amended UBS Facility, Murray Hill Funding made certain representations and warranties and is required to comply with a borrowing base requirement, various covenants, reporting requirements and other customary requirements for similar transactions. The Amended UBS Facility contains events of default customary for similar financing transactions, including, without limitation: (a) failure to transfer the Notes to UBS on the applicable purchase date or repurchase the Notes from UBS on the applicable repurchase date; (b) failure to pay certain fees and make-whole amounts when due; (c) failure to post cash collateral as required; (d) the occurrence of insolvency events with respect to Murray Hill Funding; and (e) the admission by Murray Hill Funding of its inability to, or its intention not to, perform any of its obligations under the Amended UBS Facility. As of and for the year ended December 31, 2023, Murray Hill Funding was in compliance with all covenants and reporting requirements.
Murray Hill Funding paid an upfront fee and incurred certain other customary costs and expenses totaling $2,637 in connection with obtaining the Amended UBS Facility, which were recorded as a direct reduction to the outstanding balance of the Amended UBS Facility, which is included in the Company’s consolidated balance sheets and amortized to interest expense over the term of the Amended UBS Facility. At December 31, 2023, all upfront fees and other expenses were fully amortized.
As of December 31, 2023, Notes in the aggregate principal amount of $122,500 had been purchased by Murray Hill Funding from Murray Hill Funding II and subsequently sold to UBS under the Amended UBS Facility for aggregate proceeds of $122,500. The carrying amount outstanding under the Amended UBS Facility approximates its fair value. The Company funded each purchase of Notes by Murray Hill Funding through a capital contribution to Murray Hill Funding. As of December 31, 2023, the amount due at maturity under the Amended UBS Facility was $122,500. The Notes issued by Murray Hill Funding II and purchased by Murray Hill Funding eliminate in consolidation on the Company’s consolidated financial statements.
As of December 31, 2023, the fair value of assets held by Murray Hill Funding II was $252,001.
For the years ended December 31, 2023 and 2022, the components of interest expense, average borrowings, and weighted average interest rate for the Amended UBS Facility were as follows:
| | | | | | | | | | | | | | |
| | Years Ended December 31, |
| | 2023 | | 2022 |
| Stated interest expense | | $ | 10,297 | | | $ | 7,273 | |
| Non-usage fee | | 239 | | | 96 | |
| | | | |
| Total interest expense | | $ | 10,536 | | | $ | 7,369 | |
| Weighted average interest rate(1) | | 8.76 | % | | 5.29 | % |
| Average borrowings | | $ | 118,610 | | | $ | 137,322 | |
(1)Includes the stated interest expense and non-usage fee on the unused portion of the Amended UBS Facility and is annualized for periods covering less than one year.
Series A Notes
On February 28, 2023, the Company entered into a Deed of Trust, or the Deed of Trust, with Mishmeret Trust Company Ltd., as trustee, under which the Company issued $80,712 in aggregate principal amount of its Series A Unsecured Notes due 2026, or the Series A Notes. The Series A Notes offering in Israel closed on February 28, 2023 and the Series A Notes listed and commenced trading on the TASE on February 28, 2023. After the deduction of fees and other offering expenses, the Company received net proceeds of approximately $77,900, which it used to make investments in portfolio companies in accordance with its investment objectives and for working capital and general corporate purposes. The Series A Notes are rated A1.il by Midroog Ltd., an affiliate of Moody’s. The carrying amount outstanding under the Series A Notes approximates its fair value.
The Series A Notes will mature on August 31, 2026 and may be redeemed in whole or in part at the Company's option at par plus a “make-whole” premium, if applicable, as set forth in the Deed of Trust. The Series A Notes bear interest at a rate equal to SOFR plus a credit spread of 3.82% per year, which will be paid quarterly on February 28, May 31, August 31, and November 30 of each year, which commenced on May 31, 2023. The Series A Notes are general unsecured obligations of the Company that rank senior in right of payment to all of the Company’s existing and future indebtedness that is expressly subordinated in right of payment to the Series A Notes, rank pari passu with all existing and future unsecured unsubordinated indebtedness issued by the Company, rank effectively junior to any of the Company's secured indebtedness (including unsecured indebtedness that the Company later secures) to the extent of the value of the assets securing such indebtedness, and rank structurally junior to all existing and future indebtedness (including trade payables) incurred by the Company's subsidiaries, financing vehicles or similar facilities.
CĪON Investment Corporation
Notes to Consolidated Financial Statements
December 31, 2023
(in thousands, except share and per share amounts)
The Deed of Trust contains other terms and conditions, including, without limitation, affirmative and negative covenants such as (i) information reporting, (ii) maintenance of the Company’s status as a BDC within the meaning of the 1940 Act, (iii) minimum shareholders’ equity of $525 million, (iv) a minimum asset coverage ratio of not less than 150%, and (v) an unencumbered asset coverage ratio of 1.25 to 1.00. In addition, the Deed of Trust contains customary events of default with customary cure and notice periods, including, without limitation, nonpayment, incorrect representation in any material respect, breach of covenant, cross-default under the Company’s other indebtedness in an outstanding aggregate principal amount of at least $50,000, certain judgments and orders, and certain events of bankruptcy. As of and for the year ended December 31, 2023, the Company was in compliance with all covenants and reporting requirements.
On February 26, 2023, the Company’s shares of common stock also listed and commenced trading on the TASE under the ticker symbol “CION”.
On October 10, 2023, the Company issued $34,132 in aggregate principal amount of its additional Series A Unsecured Notes due 2026, or the Additional Series A Notes, to institutional investors in Israel. The Additional Series A Notes were issued pursuant to the Deed of Trust and were issued by way of expanding, and have the same terms and conditions as, the existing Series A Notes that were issued by the Company on February 28, 2023. After the deduction of fees and other offering expenses, the Company received net proceeds of $32,317, which the Company used to make investments in portfolio companies in accordance with its investment objectives and for working capital and general corporate purposes. The Additional Series A Notes are rated A1.il by Midroog Ltd., an affiliate of Moody’s, and commenced trading on the TASE on October 10, 2023.
Through December 31, 2023, the Company incurred debt issuance costs of $5,139 in connection with issuing the Series A Notes and the Additional Series A Notes, which were recorded as a direct reduction to the outstanding balance of the Series A Notes and the Additional Series A Notes, which is included in the Company’s consolidated balance sheet as of December 31, 2023 and will amortize to interest expense over the term of the Series A Notes and the Additional Series A Notes. At December 31, 2023, the unamortized portion of the debt issuance costs was $4,253.
For the period from February 28, 2023 through December 31, 2023, the components of interest expense, average borrowings, and weighted average interest rate for the Series A Notes were as follows:
| | | | | | | | | | |
| | | | For the Period From February 28, 2023 Through December 31, 2023 |
| | | |
| Stated interest expense | | | | $ | 6,886 | |
| | | | |
| Amortization of deferred financing costs | | | | 887 | |
| Total interest expense | | | | $ | 7,773 | |
| Weighted average interest rate(1) | | | | 8.98 | % |
| Average borrowings | | | | $ | 89,940 | |
(1) Includes the stated interest expense on the Series A Notes and the Additional Series A Notes and is annualized for periods covering less than one year.
2027 Notes
On November 8, 2023, the Company entered into a Note Purchase Agreement with certain institutional investors, or the 2027 Note Purchase Agreement, in connection with the Company’s issuance of $100,000 aggregate principal amount of its senior unsecured notes due 2027, or the 2027 Notes, at a purchase price equal to 99.25% of the principal amount of the 2027 Notes. The net proceeds to the Company were $98,290, after the deduction of placement agent fees and other financing expenses, which the Company intends to use to primarily repay debt under its senior secured financing arrangements, make investments in portfolio companies in accordance with its investment objectives, and for working capital and general corporate purposes. The 2027 Notes are rated BBB (low) by DBRS, Inc.
The 2027 Notes mature on November 8, 2027. The 2027 Notes bear interest at a floating rate equal to the three-month SOFR plus a credit spread of 4.75% per year and subject to a 2.00% SOFR floor, which will be paid quarterly on February 15, May 15, August 15, and November 15 of each year, commencing on February 15, 2024. The Company has the right to, at its option, redeem all or a part that is not less than 10% of the 2027 Notes (i) on or before August 8, 2027, at a redemption price equal to 100% of the principal amount of 2027 Notes to be redeemed plus an applicable “make-whole” amount equal to (x) the discounted value of the remaining scheduled payments with respect to the principal of such 2027 Note that is to be prepaid or becomes due and payable pursuant to the 2027 Note Purchase Agreement over (y) the amount of such called principal, plus accrued and unpaid interest, if any, and (ii) after August 8, 2027, at a redemption price equal to 100% of the principal amount of the 2027 Notes to be redeemed, plus accrued and unpaid interest, if any. For any redemptions occurring on or before August 8, 2027, the discounted value portion of the “make whole amount” is calculated by applying a discount rate on the same periodic basis as that on which interest on the 2027 Notes is payable equal to the sum of 0.50% plus the yield to maturity of the most recently issued U.S. Treasury securities having a maturity equal to the remaining average life of the 2027 Notes, or if there are no such U.S. Treasury securities, using such implied yield to maturity determined in accordance with the terms of the 2027 Note Purchase Agreement.
CĪON Investment Corporation
Notes to Consolidated Financial Statements
December 31, 2023
(in thousands, except share and per share amounts)
The 2027 Notes are general unsecured obligations of the Company that rank pari passu with all existing and future unsecured unsubordinated indebtedness issued by the Company, rank effectively junior to any of the Company’s secured indebtedness (including unsecured indebtedness that the Company later secures) to the extent of the value of the assets securing such indebtedness, and rank structurally junior to all existing and future indebtedness (including trade payables) incurred by certain of the Company’s subsidiaries, financing vehicles or similar facilities.
The 2027 Note Purchase Agreement contains other terms and conditions, including, without limitation, affirmative and negative covenants such as (i) information reporting, (ii) maintenance of the Company’s status as a business development company within the meaning of the 1940 Act, (iii) minimum shareholders’ equity of $543.6 million, (iv) a minimum asset coverage ratio of not less than 150%, (v) a minimum interest coverage ratio of 1.25 to 1.00 and (vi) an unencumbered asset coverage ratio of 1.25 to 1.00, provided that (a) first lien senior secured loans and cash represent more than 65% of the total value of unencumbered assets used by the Company for purposes of the ratio and (b) equity interests or structured products in the aggregate represent less than 15% of the total value of unencumbered assets used by the Company for purposes of the ratio. The 2027 Note Purchase Agreement also contains a “most favored lender” provision in favor of the purchasers in respect of any new credit facilities, loans, notes or unsecured indebtedness in excess of $25 million incurred by the Company, which indebtedness contains a financial covenant not contained in, or more restrictive against the Company than those contained, in the 2027 Note Purchase Agreement. In addition, the 2027 Note Purchase Agreement contains customary events of default with customary cure and notice periods, including, without limitation, nonpayment, incorrect representation in any material respect, breach of covenant, cross-default under other indebtedness or derivative securities of the Company in an outstanding aggregate principal amount of at least $25 million, certain judgments and orders, and certain events of bankruptcy. As of December 31, 2023 and for the period from November 8, 2023 through December 31, 2023, the Company was in compliance with all covenants and reporting requirements.
Through December 31, 2023, the Company incurred debt issuance costs of $1,710 in connection with issuing the 2027 Notes, which were recorded as a direct reduction to the outstanding balance of the 2027 Notes, which is included in the Company’s consolidated balance sheet as of December 31, 2023 and will amortize to interest expense over the term of the 2027 Notes. At December 31, 2023, the unamortized portion of the debt issuance costs was $1,647.
For the period from November 8, 2023 through December 31, 2023, the components of interest expense, average borrowings, and weighted average interest rate for the 2027 Notes were as follows:
| | | | | | | | | | |
| | | | For the Period From November 8, 2023 Through December 31, 2023 |
| | | |
| Stated interest expense | | | | $ | 1,495 | |
| | | | |
| Amortization of deferred financing costs | | | | 63 | |
| Total interest expense | | | | $ | 1,558 | |
| Weighted average interest rate(1) | | | | 9.97 | % |
| Average borrowings | | | | $ | 100,000 | |
(1) Includes the stated interest expense on the 2027 Notes and is annualized for periods covering less than one year.2022 More Term Loan
On April 27, 2022, the Company entered into an Unsecured Term Loan Facility Agreement, or the More Term Loan Agreement, with More Provident Funds and Pension Ltd., or More Provident, as lender, which provided for an unsecured term loan to the Company in an aggregate principal amount of $50,000, or the 2022 More Term Loan. On April 27, 2022, the Company drew down $50,000 of borrowings under the 2022 More Term Loan. After the deduction of fees and other financing expenses, the Company received net borrowings of approximately $49,000, which it used for working capital and other general corporate purposes. The carrying amount outstanding under the 2022 More Term Loan approximates its fair value.
Advances under the 2022 More Term Loan bear interest at a floating rate equal to the three-month SOFR, plus a credit spread of 3.50% per year and subject to a 1.0% SOFR floor, payable quarterly in arrears. Advances under the 2022 More Term Loan mature on April 27, 2027. The Company has the right to, at its option, prepay all or any portion of advances then outstanding together with a prepayment fee equal to the higher of (i) zero, or (ii) the discounted present value of all remaining interest payments that would have been paid by the Company through the maturity date with respect to the principal amount of such advance that is to be prepaid or becomes due and payable pursuant to the More Term Loan Agreement. The discounted present value portion of the prepayment fee is calculated by applying a discount rate on the same periodic basis as that on which interest on advances is payable equal to the three-month SOFR plus 2.00%.
CĪON Investment Corporation
Notes to Consolidated Financial Statements
December 31, 2023
(in thousands, except share and per share amounts)
Advances under the 2022 More Term Loan are general unsecured obligations of the Company that rank pari passu with all existing and future unsecured unsubordinated indebtedness issued by the Company, rank effectively junior to any of the Company’s secured indebtedness (including unsecured indebtedness that the Company later secures) to the extent of the value of the assets securing such indebtedness, and rank structurally junior to all existing and future indebtedness (including trade payables) incurred by certain of the Company’s subsidiaries, financing vehicles or similar facilities.
The More Term Loan Agreement contains other terms and conditions, including, without limitation, affirmative and negative covenants such as (i) information reporting, (ii) maintenance of the Company’s status as a BDC within the meaning of the 1940 Act, (iii) minimum shareholders’ equity of 60% of the Company’s net asset value as of the year ended December 31, 2021 plus 50% of the net cash proceeds of the sale of certain equity interests by the Company after April 27, 2022, if any, (iv) a minimum asset coverage ratio of not less than 150%, and (v) an unencumbered asset coverage ratio of 1.25 to 1.00, provided that (a) first lien senior secured loans and cash represent more than 65% of the total value of unencumbered assets used by the Company for purposes of the ratio and (b) equity interests or structured products in the aggregate represent less than 15% of the total value of unencumbered assets used by the Company for purposes of the ratio. In addition, the More Term Loan Agreement contains customary events of default with customary cure and notice periods, including, without limitation, nonpayment, incorrect representation in any material respect, breach of covenant, cross-default under other indebtedness or derivative securities of the Company in an outstanding aggregate principal amount of at least $25,000, certain judgments and orders, and certain events of bankruptcy. As of and for the year ended December 31, 2023, the Company was in compliance with all covenants and reporting requirements.
Through December 31, 2023, the Company incurred debt issuance costs of $1,025 in connection with obtaining the 2022 More Term Loan, which were recorded as a direct reduction to the outstanding balance of the 2022 More Term Loan, which is included in the Company’s consolidated balance sheet as of December 31, 2023 and will amortize to interest expense over the term of the 2022 More Term Loan. At December 31, 2023, the unamortized portion of the debt issuance costs was $680.
For the year ended December 31, 2023 and for the period from April 27, 2022 through December 31, 2022, the components of interest expense, average borrowings, and weighted average interest rate for the 2022 More Term Loan were as follows:
| | | | | | | | | | | | | | | | |
| | Year Ended December 31, 2023 | | For the Period From April 27, 2022 Through December 31, 2022 |
| | | | | | |
| Stated interest expense | | $ | 4,328 | | | | | $ | 2,027 | |
| | | | | | |
| Amortization of deferred financing costs | | 205 | | | | | 140 | |
| Total interest expense | | $ | 4,533 | | | | | $ | 2,167 | |
| Weighted average interest rate(1) | | 8.54 | % | | | | 5.86 | % |
| Average borrowings | | $ | 50,000 | | | | | $ | 50,000 | |
(1) Includes the stated interest expense on the 2022 More Term Loan and is annualized for periods covering less than one year.
2021 More Term Loan
On April 14, 2021, the Company entered into an Unsecured Term Loan Facility Agreement, or the Term Loan Agreement, with More Provident Funds Ltd., or More, as lender. The Term Loan Agreement with More, or the 2021 More Term Loan, provided for an unsecured term loan to the Company in an aggregate principal amount of $30,000. On April 20, 2021, the Company drew down $30,000 of borrowings under the 2021 More Term Loan. After the deduction of fees and other financing expenses, the Company received net borrowings of approximately $29,000, which the Company used for working capital and other general corporate purposes.
Advances under the 2021 More Term Loan mature on September 30, 2024, and bear interest at a rate of 5.20% per year payable quarterly in arrears. The Company has the right to, at its option, prepay all or any portion of advances then outstanding together with a prepayment fee equal to the higher of (i) zero, or (ii) the discounted present value of all remaining interest payments that would have been paid by the Company through the maturity date with respect to the principal amount of such advance that is to be prepaid or becomes due and payable pursuant to the Term Loan Agreement. The discounted present value portion of the prepayment fee is calculated by applying a discount rate on the same periodic basis as that on which interest on advances is payable equal to the sum of 2.00% plus the yield to maturity of the most recently issued U.S. Treasury securities having a maturity equal to the remaining average life of the 2021 More Term Loan, or if there are no such U.S. Treasury securities, using such implied yield to maturity determined in accordance with the terms of the Term Loan Agreement.
CĪON Investment Corporation
Notes to Consolidated Financial Statements
December 31, 2023
(in thousands, except share and per share amounts)
Advances under the 2021 More Term Loan are general unsecured obligations of the Company that rank pari passu with all existing and future unsecured unsubordinated indebtedness issued by the Company, rank effectively junior to the Company's secured indebtedness (including unsecured indebtedness that the Company later secures) to the extent of the value of the assets securing such indebtedness, and rank structurally junior to all existing and future indebtedness (including trade payables) incurred by certain of the Company's subsidiaries, financing vehicles or similar facilities.
The Term Loan Agreement contains other terms and conditions, including, without limitation, affirmative and negative covenants such as (i) information reporting, (ii) maintenance of the Company's status as a BDC within the meaning of the 1940 Act, (iii) minimum shareholders’ equity of 60% of the Company’s net asset value as of the year ended December 31, 2020 plus 50% of the net cash proceeds of the sale of certain equity interests by the Company after April 14, 2021, if any, (iv) a minimum asset coverage ratio of not less than 150%, and (v) an unencumbered asset coverage ratio of 1.25 to 1.00, provided that (a) first lien senior secured loans and cash represent more than 65% of the total value of unencumbered assets used by the Company for purposes of the ratio and (b) equity interests or structured products in the aggregate represent less than 15% of the total value of unencumbered assets used by the Company for purposes of the ratio. In addition, the Term Loan Agreement contains customary events of default with customary cure and notice periods, including, without limitation, nonpayment, incorrect representation in any material respect, breach of covenant, cross default under other indebtedness or derivative securities of the Company in an outstanding aggregate principal amount of at least $25,000, certain judgments and orders, and certain events of bankruptcy. As of and for the year ended December 31, 2023, the Company was in compliance with all covenants and reporting requirements.
Through December 31, 2023, the Company incurred debt issuance costs of $992 in connection with obtaining the 2021 More Term Loan, which were recorded as a direct reduction to the outstanding balance of the 2021 More Term Loan, which is included in the Company’s consolidated balance sheet as of December 31, 2023 and will amortize to interest expense over the term of the 2021 More Term Loan. At December 31, 2023, the unamortized portion of the debt issuance costs was $209.
For the years ended December 31, 2023 and 2022, the components of interest expense, average borrowings, and weighted average interest rate for the 2021 More Term Loan were as follows:
| | | | | | | | | | | | | | |
| | Years Ended December 31, |
| | 2023 | | 2022 |
| Stated interest expense | | $ | 1,582 | | | $ | 1,582 | |
| | | | |
| Amortization of deferred financing costs | | 288 | | | 288 | |
| Total interest expense | | $ | 1,870 | | | $ | 1,870 | |
| Weighted average interest rate(1) | | 5.20 | % | | 5.20 | % |
| Average borrowings | | $ | 30,000 | | | $ | 30,000 | |
(1) Includes the stated interest expense on the 2021 More Term Loan and is annualized for periods covering less than one year.
Note 9. Fair Value of Financial Instruments
The following table presents fair value measurements of the Company’s portfolio investments as of December 31, 2023 and 2022, according to the fair value hierarchy:
| | | | | | | | | | | | | | | | | | | | | | | | | | | | | | | | | | | | | | | | | | | | | | | |
| December 31, 2023(1) | | December 31, 2022(2) |
| Level 1 | | Level 2 | | Level 3 | | Total | | Level 1 | | Level 2 | | Level 3 | | Total |
| Senior secured first lien debt | $ | — | | | $ | — | | | $ | 1,565,171 | | | $ | 1,565,171 | | | $ | — | | | $ | — | | | $ | 1,579,512 | | | $ | 1,579,512 | |
| Senior secured second lien debt | — | | | — | | | 29,111 | | | 29,111 | | | — | | | — | | | 38,769 | | | 38,769 | |
| | | | | | | | | | | | | | | |
| Collateralized securities and structured products - equity | — | | | — | | | 1,096 | | | 1,096 | | | — | | | — | | | 1,179 | | | 1,179 | |
| Unsecured debt | — | | | — | | | 12,874 | | | 12,874 | | | — | | | — | | | 22,643 | | | 22,643 | |
| Equity | 1,624 | | | — | | | 205,909 | | | 207,533 | | | 2,341 | | | — | | | 73,951 | | | 76,292 | |
| Short term investments | 113,446 | | | — | | | — | | | 113,446 | | | 10,869 | | | — | | | — | | | 10,869 | |
| Total Investments | $ | 115,070 | | | $ | — | | | $ | 1,814,161 | | | $ | 1,929,231 | | | $ | 13,210 | | | $ | — | | | $ | 1,716,054 | | | $ | 1,729,264 | |
(1)Excludes the Company's $25,039 investment in CION/EagleTree, which is measured at NAV.
(2)Excludes the Company's $30,766 investment in CION/EagleTree, which is measured at NAV.
CĪON Investment Corporation
Notes to Consolidated Financial Statements
December 31, 2023
(in thousands, except share and per share amounts)
The following tables provide a reconciliation of the beginning and ending balances for investments that use Level 3 inputs for the years ended December 31, 2023 and 2022:
| | | | | | | | | | | | | | | | | | | | | | | | | | | | | | | | | | | | | |
| Year Ended December 31, 2023 |
| Senior Secured First Lien Debt | | Senior Secured Second Lien Debt | | | | Collateralized Securities and Structured Products - Equity | | Unsecured Debt | | Equity | | Total |
| Beginning balance, December 31, 2022 | $ | 1,579,512 | | | $ | 38,769 | | | | | $ | 1,179 | | | $ | 22,643 | | | $ | 73,951 | | | $ | 1,716,054 | |
| Investments purchased(2)(3) | 393,865 | | | 57 | | | | | — | | | 5,449 | | | 111,200 | | | 510,571 | |
| Net realized loss | (24,261) | | | — | | | | | — | | | — | | | (7,666) | | | (31,927) | |
| Net change in unrealized appreciation (depreciation) | 20,543 | | | (9,901) | | | | | 242 | | | (11,035) | | | 28,815 | | | 28,664 | |
| Accretion of discount | 13,285 | | | 204 | | | | | — | | | 17 | | | — | | | 13,506 | |
| Sales and principal repayments(3) | (417,773) | | | (18) | | | | | (325) | | | (4,200) | | | (391) | | | (422,707) | |
| Ending balance, December 31, 2023 | $ | 1,565,171 | | | $ | 29,111 | | | | | $ | 1,096 | | | $ | 12,874 | | | $ | 205,909 | | | $ | 1,814,161 | |
| Change in net unrealized appreciation (depreciation) on investments still held as of December 31, 2023(1) | $ | 5,416 | | | $ | (9,901) | | | | | $ | 242 | | | $ | (11,035) | | | $ | 26,333 | | | $ | 11,055 | |
(1)Included in net change in unrealized appreciation (depreciation) on investments in the consolidated statements of operations.
(2)Investments purchased includes PIK interest.
(3)Includes non-cash restructured securities.
| | | | | | | | | | | | | | | | | | | | | | | | | | | | | | | | | | | | | | | |
| Year Ended December 31, 2022 |
| Senior Secured First Lien Debt | | Senior Secured Second Lien Debt | | | | Collateralized Securities and Structured Products - Equity | | Unsecured Debt | | Equity | | | | Total |
| Beginning balance, December 31, 2021 | $ | 1,526,989 | | | $ | 38,583 | | | | | $ | 2,998 | | | $ | 26,616 | | | $ | 37,736 | | | | | $ | 1,632,922 | |
| Investments purchased(1) | 549,950 | | | 19,930 | | | | | — | | | 3,635 | | | 35,081 | | | | | 608,596 | |
| Net realized (loss) gain | (5,646) | | | (19,327) | | | | | 24 | | | — | | | (7,798) | | | | | (32,747) | |
| Net change in unrealized (depreciation) appreciation | (21,581) | | | 14,604 | | | | | (621) | | | (7,623) | | | 9,999 | | | | | (5,222) | |
| Accretion of discount | 10,517 | | | 500 | | | | | — | | | 15 | | | — | | | | | 11,032 | |
| Sales and principal repayments(1) | (480,717) | | | (15,521) | | | | | (1,222) | | | — | | | (1,067) | | | | | (498,527) | |
| Ending balance, December 31, 2022 | $ | 1,579,512 | | | $ | 38,769 | | | | | $ | 1,179 | | | $ | 22,643 | | | $ | 73,951 | | | | | $ | 1,716,054 | |
| Change in net unrealized (depreciation) appreciation on investments still held as of December 31, 2022(2) | $ | (39,831) | | | $ | 801 | | | | | $ | (621) | | | $ | (7,623) | | | $ | 1,604 | | | | | $ | (45,670) | |
(1)Includes non-cash restructured securities.
(2)Included in net change in unrealized appreciation (depreciation) on investments in the consolidated statements of operations.
CĪON Investment Corporation
Notes to Consolidated Financial Statements
December 31, 2023
(in thousands, except share and per share amounts)
Significant Unobservable Inputs
The valuation techniques and significant unobservable inputs used in recurring Level 3 fair value measurements of investments as of December 31, 2023 and 2022 were as follows:
| | | | | | | | | | | | | | | | | | | | | | | | | | | | | | | | | | | | | | | | | | | | |
| | December 31, 2023 |
| | Fair Value | | Valuation Techniques/
Methodologies | | Unobservable
Inputs | | Range | | Weighted Average(1) |
| Senior secured first lien debt | | $ | 1,354,388 | | | Discounted Cash Flow | | Discount Rates | | 8.5% | | — | | 32.5% | | 13.8% |
| | 108,992 | | | Broker Quotes | | Broker Quotes | | N/A | | N/A |
| | 72,229 | | | Market Comparable Approach | | Revenue Multiple | | 1.00x | | — | | 2.50x | | 1.61x |
| | | | | | | | | |
| | 27,867 | | | | EBITDA Multiple | | 9.00x | | — | | 16.25x | | 14.35x |
| | 1,695 | | | Other(2) | | Other(2) | | N/A | | N/A |
| Senior secured second lien debt | | 27,638 | | | Discounted Cash Flow | | Discount Rates | | 13.4% | | — | | 25.0% | | 16.1% |
| | 1,473 | | | Market Comparable Approach | | EBITDA Multiple | | 9.00x | | N/A |
| | | | | | | | | | |
| | | | | | | | | | |
| | | | | | | | | | |
| Collateralized securities and structured products - equity | | 1,096 | | | Discounted Cash Flow | | Discount Rates | | 5.4% | | — | | 21.0% | | 20.7% |
| | | | | | | | | | |
| Unsecured debt | | 8,739 | | | Discounted Cash Flow | | Discount Rates | | 16.0% | | N/A |
| | 4,135 | | | Other(2) | | Other(2) | | N/A | | N/A |
| | | | | | | | | | |
| Equity | | 90,771 | | | Market Comparable Approach | | EBITDA Multiple | | 4.75x | | — | | 17.25x | | 9.38x |
| | 84,328 | | | | Revenue Multiple | | 0.15x | | — | | 6.50x | | 1.48x |
| | 29,463 | | | | $ per kW | | $161.16 | | — | | $400.00 | | $337.28 |
| | | | | | | | | | |
| | 971 | | | Broker Quotes | | Broker Quotes | | N/A | | N/A |
| | 376 | | | Options Pricing Model | | Expected Volatility | | 115.0% | | N/A |
| | | | | | | | | | |
| | | | | | | | | | | | | | |
| Total | | $ | 1,814,161 | | | | | | | | | | | | | |
(1)Weighted average amounts are based on the estimated fair values.
(2)Fair value is based on the expected outcome of proposed corporate transactions and/or other factors.
CĪON Investment Corporation
Notes to Consolidated Financial Statements
December 31, 2023
(in thousands, except share and per share amounts)
| | | | | | | | | | | | | | | | | | | | | | | | | | | | | | | | | | | | | | | | | | | | |
| | December 31, 2022 |
| | Fair Value | | Valuation Techniques/
Methodologies | | Unobservable
Inputs | | Range | | Weighted Average(1) |
| Senior secured first lien debt | | $ | 1,471,816 | | | Discounted Cash Flow | | Discount Rates | | 6.5% | | — | | 34.0% | | 14.7% |
| | 79,035 | | | Broker Quotes | | Broker Quotes | | N/A | | N/A |
| | 20,050 | | | Market Comparable Approach | | Revenue Multiple | | 0.25x | | — | | 1.70x | | 1.19x |
| | 4,527 | | | | $ per kW | | $131.85 | | N/A |
| | 3,552 | | | | EBITDA Multiple | | 2.75x | | — | | 4.25x | | 4.09x |
| | 532 | | | Other(2) | | Other(2) | | N/A | | N/A |
| Senior secured second lien debt | | 38,769 | | | Discounted Cash Flow | | Discount Rates | | 14.3% | | — | | 21.5% | | 17.2% |
| | | | | | | | | | |
| | | | | | | | | | |
| | | | | | | | | |
| | | | | | | | | | |
| Collateralized securities and structured products - equity | | 1,179 | | | Discounted Cash Flow | | Discount Rates | | 21.0% | | N/A |
| | | | | | | | | | |
| Unsecured debt | | 15,316 | | | Market Comparable Approach | | EBITDA Multiple | | 9.25x | | N/A |
| | 7,327 | | | Discounted Cash Flow | | Discount Rates | | 17.7% | | N/A |
| Equity | | 33,441 | | | Market Comparable Approach | | EBITDA Multiple | | 2.75x | | — | | 14.55x | | 7.02x |
| | 23,995 | | | | $ per kW | | $412.5 | | N/A |
| | 13,038 | | | | Revenue Multiple | | 0.13x | | — | | 5.75x | | 2.93x |
| | 2,238 | | | Discounted Cash Flow | | Discount Rates | | 16.8% | | N/A |
| | 1,234 | | | Broker Quotes | | Broker Quotes | | N/A | | N/A |
| | 5 | | | Options Pricing Model | | Expected Volatility | | 80.0% | | — | | 90.0% | | 87.3% |
| Total | | $ | 1,716,054 | | | | | | | | | | | | | |
(1)Weighted average amounts are based on the estimated fair values.
(2)Fair value is based on the expected outcome of proposed corporate transactions and/or other factors.
The significant unobservable inputs used in the fair value measurement of the Company’s senior secured first lien debt, senior secured second lien debt, collateralized securities and structured products, unsecured debt and equity are discount rates, EBITDA multiples, revenue multiples, broker quotes and expected volatility. A significant increase or decrease in discount rates would result in a significantly lower or higher fair value measurement, respectively. A significant increase or decrease in the EBITDA multiples, revenue multiples, expected proceeds from proposed corporate transactions, broker quotes and expected volatility would result in a significantly higher or lower fair value measurement, respectively.
Note 10. General and Administrative Expense
General and administrative expense consisted of the following items for the years ended December 31, 2023, 2022 and 2021:
| | | | | | | | | | | | | | | | | |
| Years Ended December 31, |
| 2023 | | 2022 | | 2021 |
| Professional fees | $ | 2,178 | | | $ | 1,778 | | | $ | 4,214 | |
| Transfer agent expense | 911 | | | 1,124 | | | 1,290 | |
| Valuation expense | 853 | | | 821 | | | 904 | |
| Dues and subscriptions | 800 | | | 791 | | | 411 | |
| Director fees and expenses | 696 | | | 632 | | | 516 | |
| Insurance expense | 675 | | | 833 | | | 612 | |
| Accounting and administrative costs | 637 | | | 524 | | | 759 | |
| Printing and marketing expense | 351 | | | 708 | | | 990 | |
| Other expenses | 281 | | | 67 | | | 109 | |
| | | | | |
| Total general and administrative expense | $ | 7,382 | | | $ | 7,278 | | | $ | 9,805 | |
CĪON Investment Corporation
Notes to Consolidated Financial Statements
December 31, 2023
(in thousands, except share and per share amounts)
Note 11. Commitments and Contingencies
The Company entered into certain contracts with related and other parties that contain a variety of indemnifications. The Company’s maximum exposure under these arrangements is unknown. However, the Company has not experienced claims or losses pursuant to these contracts and believes the risk of loss related to such indemnifications to be remote.
As of December 31, 2023 and 2022, the Company’s unfunded commitments were as follows:
| | | | | | | | | | | | | | |
| Unfunded Commitments | | December 31, 2023(1) | | December 31, 2022(1) |
| Flatworld Intermediate Corp. | | $ | 5,865 | | | $ | 5,865 | |
| Thrill Holdings LLC | | 5,000 | | | 3,261 | |
| American Health Staffing Group, Inc. | | 3,333 | | | 3,333 | |
| Nova Compression, LLC | | 2,609 | | | — | |
| Mimeo.com, Inc. | | 2,500 | | | 3,000 | |
| Coyote Buyer, LLC | | 2,500 | | | 2,500 | |
| Rogers Mechanical Contractors, LLC | | 2,404 | | | 3,365 | |
| Moss Holding Company | | 2,232 | | | 2,232 | |
| Instant Web, LLC | | 2,164 | | | 5,628 | |
| MacNeill Pride Group Corp. | | 2,017 | | | 2,017 | |
| Tactical Air Support, Inc. | | 2,000 | | | — | |
| BDS Solutions Intermediateco, LLC | | 1,905 | | | 1,998 | |
| Bradshaw International Parent Corp. | | 1,844 | | | 1,844 | |
| Fluid Control II Inc. | | 1,765 | | | — | |
| Sleep Opco, LLC | | 1,750 | | | 1,750 | |
| ESP Associates, Inc. | | 1,316 | | | — | |
| OpCo Borrower, LLC | | 1,042 | | | 833 | |
| H.W. Lochner, Inc. | | 1,036 | | | 225 | |
| Critical Nurse Staffing, LLC | | 1,000 | | | 5,599 | |
| Dermcare Management, LLC | | 671 | | | 1,862 | |
| Service Compression, LLC | | 419 | | | 4,186 | |
| Invincible Boat Company LLC | | 399 | | | 559 | |
| RA Outdoors, LLC | | 372 | | | 1,049 | |
| Ironhorse Purchaser, LLC | | 347 | | | 2,469 | |
| American Clinical Solutions LLC | | 250 | | | — | |
| American Teleconferencing Services, Ltd. | | 234 | | | 235 | |
| Homer City Holdings LLC | | 196 | | | 3,000 | |
| Anthem Sports & Entertainment Inc. | | 167 | | | 167 | |
| HW Acquisition, LLC | | 12 | | | 2,200 | |
| Cennox, Inc. | | — | | | 7,567 | |
| Archer Systems, LLC | | — | | | 1,905 | |
| RumbleOn, Inc. | | — | | | 1,775 | |
| WorkGenius, Inc. | | — | | | 750 | |
| STATinMED, LLC | | — | | | 156 | |
| NWN Parent Holdings LLC | | — | | | 90 | |
| Total | | $ | 47,349 | | | $ | 71,420 | |
(1)Unless otherwise noted, the funding criteria for these unfunded commitments had not been met at the date indicated.
CĪON Investment Corporation
Notes to Consolidated Financial Statements
December 31, 2023
(in thousands, except share and per share amounts)
Unfunded commitments to provide funds to companies are not recorded on the Company’s consolidated balance sheets. Since these commitments may expire without being drawn upon, unfunded commitments do not necessarily represent future cash requirements or future earning assets for the Company. The Company intends to use cash on hand, short-term investments, proceeds from borrowings, and other liquid assets to fund these commitments should the need arise. For information on the companies to which the Company is committed to fund additional amounts as of December 31, 2023 and 2022, refer to the table above and the consolidated schedules of investments. As of March 6, 2024, the Company was committed, upon the satisfaction of certain conditions, to fund an additional $53,048.
The Company will fund its unfunded commitments from the same sources it uses to fund its investment commitments that are funded at the time they are made (i.e., advances from its financing arrangements and/or cash flows from operations). The Company will not fund its unfunded commitments from future net proceeds generated by securities offerings, if any. The Company follows a process to manage its liquidity and ensure that it has available capital to fund its unfunded commitments. Specifically, the Company prepares detailed analyses of the level of its unfunded commitments relative to its then available liquidity on a daily basis. These analyses are reviewed and discussed on a weekly basis by the Company's executive officers and senior members of CIM (including members of the investment committee) and are updated on a “real time” basis in order to ensure that the Company has adequate liquidity to satisfy its unfunded commitments.
Note 12. Fee Income
Fee income consists of amendment fees, capital structuring and other fees, conversion fees, commitment fees and administrative agent fees. The following table summarizes the Company’s fee income for the years ended December 31, 2023, 2022 and 2021:
| | | | | | | | | | | | | | | | | |
| Years Ended December 31, |
| 2023 | | 2022 | | 2021 |
| Amendment fees | $ | 6,415 | | | $ | 2,633 | | | $ | 869 | |
| Capital structuring and other fees | 4,309 | | | 4,446 | | | 4,973 | |
| Conversion fees | 477 | | | 2,365 | | | — | |
| Commitment fees | 308 | | | — | | | — | |
| Administrative agent fees | 185 | | | 100 | | | 85 | |
| Total | $ | 11,694 | | | $ | 9,544 | | | $ | 5,927 | |
Administrative agent fees are recurring income as long as the Company remains the administrative agent for the related investment. Income from all other fees was non-recurring.
CĪON Investment Corporation
Notes to Consolidated Financial Statements
December 31, 2023
(in thousands, except share and per share amounts)
Note 13. Financial Highlights
The following is a schedule of financial highlights as of and for the years ended December 31, 2023, 2022, 2021, 2020 and 2019:
| | | | | | | | | | | | | | | | | | | | | | | | | | | | | | | | |
| | Years Ended December 31, |
| | 2023 | | 2022 | | 2021 | | 2020 | | 2019 |
| Per share data:(1) | | | | | | | | | | |
| Net asset value at beginning of period | | $ | 15.98 | | | $ | 16.34 | | | $ | 15.50 | | | $ | 16.80 | | | $ | 17.38 | |
| Results of operations: | | | | | | | | | | |
| Net investment income | | 1.92 | | | 1.56 | | | 1.31 | | | 1.39 | | | 1.54 | |
| Net realized (loss) gain and net change in unrealized (depreciation) appreciation on investments and (loss) gain on foreign currency(2) | | (0.18) | | | (0.68) | | | 0.79 | | | (1.57) | | | (0.63) | |
| Net increase (decrease) in net assets resulting from operations(2) | | 1.74 | | | 0.88 | | | 2.10 | | | (0.18) | | | 0.91 | |
| Shareholder distributions: | | | | | | | | | | |
| Distributions from net investment income | | (1.61) | | | (1.44) | | | (1.26) | | | (1.12) | | | (1.49) | |
| | | | | | | | | | |
| | | | | | | | | | |
| | | | | | | | | | |
| Net decrease in net assets resulting from shareholders' distributions | | (1.61) | | | (1.44) | | | (1.26) | | | (1.12) | | | (1.49) | |
| Capital share transactions: | | | | | | | | | | |
| Issuance of common stock above net asset value(3) | | — | | | — | | | — | | | — | | | — | |
| Repurchases of common stock below net asset value(4) | | 0.12 | | | 0.20 | | | — | | | — | | | — | |
| Net increase in net assets resulting from capital share transactions | | 0.12 | | | 0.20 | | | — | | | — | | | — | |
| Net asset value at end of period | | $ | 16.23 | | | $ | 15.98 | | | $ | 16.34 | | | $ | 15.50 | | | $ | 16.80 | |
| Shares of common stock outstanding at end of period | | 54,184,636 | | | 55,299,484 | | | 56,958,440 | | | 56,646,867 | | | 56,690,578 | |
| Total investment return-net asset value(5) | | 17.00 | % | | 10.44 | % | | 14.43 | % | | (0.94) | % | | 5.55 | % |
| Total investment return-market value(6) | | 34.33 | % | | (14.87) | % | | 3.87 | % | | — | | | — | |
| Net assets at beginning of period | | $ | 883,634 | | | $ | 930,512 | | | $ | 878,256 | | | $ | 952,563 | | | $ | 979,271 | |
| Net assets at end of period | | $ | 879,563 | | | $ | 883,634 | | | $ | 930,512 | | | $ | 878,256 | | | $ | 952,563 | |
| Average net assets | | $ | 864,886 | | | $ | 917,781 | | | $ | 918,824 | | | $ | 875,846 | | | $ | 967,323 | |
| Ratio/Supplemental data: | | | | | | | | | | |
| Ratio of net investment income to average net assets | | 12.14 | % | | 9.61 | % | | 8.09 | % | | 8.99 | % | | 9.03 | % |
| Ratio of gross operating expenses to average net assets(7) | | 16.88 | % | | 11.63 | % | | 9.04 | % | | 9.72 | % | | 11.76 | % |
| Ratio of net operating expenses to average net assets | | 16.88 | % | | 11.63 | % | | 9.04 | % | | 9.72 | % | | 11.76 | % |
| Portfolio turnover rate(8) | | 17.43 | % | | 26.81 | % | | 52.04 | % | | 22.99 | % | | 31.59 | % |
| Total amount of senior securities outstanding | | $ | 1,092,344 | | | $ | 957,500 | | | $ | 830,000 | | | $ | 725,000 | | | $ | 841,042 | |
| Asset coverage ratio(9) | | 1.81 | | | 1.92 | | | 2.12 | | | 2.21 | | | 2.13 | |
(1)The per share data for the years ended December 31, 2023, 2022, 2021, 2020 and 2019 was derived by using the weighted average shares of common stock outstanding during each period. The share information utilized to determine per share data for 2021, 2020 and 2019 in this table has been retroactively adjusted to reflect the Reverse Stock Split discussed in Note 3.
CĪON Investment Corporation
Notes to Consolidated Financial Statements
December 31, 2023
(in thousands, except share and per share amounts)
(2)The amount shown for net realized (loss) gain, net change in unrealized (depreciation) appreciation on investments and (loss) gain on foreign currency is the balancing figure derived from the other figures in the schedule. The amount shown at this caption for a share outstanding throughout the period may not agree with the change in the aggregate gains and losses in portfolio securities for the period because of the timing of sales and repurchases of the Company’s shares in relation to fluctuating market values for the portfolio. As a result, net increase (decrease) in net assets resulting from operations in this schedule may vary from the consolidated statements of operations.
(3)The continuous issuance of shares of common stock may have caused an incremental increase in net asset value per share due to the sale of shares at the then prevailing public offering price and the receipt of net proceeds per share by the Company in excess of net asset value per share on each subscription closing date. The per share impact of the continuous issuance of shares of common stock was an increase to net asset value of less than $0.01 per share during the years ended December 31, 2023, 2022, 2021, 2020 and 2019. The Company's follow-on continuous public offering ended on January 25, 2019.
(4)Repurchases of common stock may have caused an incremental decrease or increase in net asset value per share due to the repurchase of shares at a price in excess of or below net asset value per share, respectively, on each repurchase date. The per share impact of repurchases of common stock was a decrease to net asset value of less than $0.01 per share during the years ended December 31, 2021, 2020 and 2019.
(5)Total investment return-net asset value is a measure of the change in total value for shareholders who held the Company’s common stock at the beginning and end of the period, including distributions paid or payable during the period. Total investment return-net asset value is based on (i) the beginning period net asset value per share on the first day of the period, (ii) the net asset value per share on the last day of the period of (A) one share plus (B) any fractional shares issued in connection with the reinvestment of distributions, and (iii) the value of distributions payable, if any, on the last day of the period. The total investment return-net asset value calculation assumes that distributions are reinvested in accordance with the Company's distribution reinvestment plan then in effect as described in Note 5. The total investment return-net asset value does not consider the effect of the sales load from the sale of the Company’s common stock. The total investment return-net asset value includes the effect of the issuance of shares at a net offering price that is greater than net asset value per share, which causes an increase in net asset value per share. Total returns covering less than a full year are not annualized.
(6)Total investment return-market value for the years ended December 31, 2023, 2022 and 2021 was calculated by taking the change in the market price of the Company's common stock since the first day of the period, and including the impact of distributions reinvested in accordance with the Company’s New DRP. Total investment return-market value does not consider the effect of any sales commissions or charges that may be incurred in connection with the sale of shares of the Company’s common stock. The historical calculation of total investment return-market value in the table should not be considered a representation of the Company’s future total return based on market value, which may be greater or less than the return shown in the table due to a number of factors, including the Company’s ability or inability to make investments in companies that meet its investment criteria, the interest rates payable on the debt securities the Company acquires, the level of the Company’s expenses, variations in and the timing of the recognition of realized and unrealized gains or losses, the degree to which the Company encounters competition in its markets, general economic conditions and fluctuations in per share market value. As a result of these factors, results for any previous period should not be relied upon as being indicative of performance in future periods.
(7)Ratio of gross operating expenses to average net assets does not include expense support provided by CIM, if any.
(8)Portfolio turnover rate is calculated using the lesser of year-to-date sales or purchases over the average of the invested assets at fair value, excluding short term investments, and is not annualized.
(9)Asset coverage ratio is equal to (i) the sum of (a) net assets at the end of the period and (b) total senior securities outstanding at the end of the period (excluding unfunded commitments), divided by (ii) total senior securities outstanding at the end of the period.
CĪON Investment Corporation
Notes to Consolidated Financial Statements
December 31, 2023
(in thousands, except share and per share amounts)
Note 14. Income Taxes
It is the Company's policy to comply with all requirements of the Code applicable to RICs and to distribute at least 90% of its taxable income to its shareholders. In addition, by distributing during each calendar year at least 90% of its “investment company taxable income”, which is generally equal to the sum of the Company’s net ordinary income plus the excess, if any, of realized net short-term capital gains over realized net long-term capital losses, the Company intends not to be subject to corporate level federal income tax. Accordingly, no federal income tax provision was required for the years ended December 31, 2023 or 2022. The Company will also be subject to nondeductible federal excise taxes of 4% if the Company does not distribute at least 98.0% of net ordinary income, 98.2% of capital gains, if any, and any recognized and undistributed income from prior years for which it paid no federal income taxes.
Income and capital gain distributions are determined in accordance with the Code and federal tax regulations, which may differ from amounts determined in accordance with GAAP. These book/tax differences, which could be material, are primarily due to differing treatments of income and gains on various investments held by the Company. Permanent book/tax differences result in reclassifications to capital in excess of par value, accumulated undistributed net investment income and accumulated undistributed realized gain on investments.
As of December 31, 2023 and 2022, the Company made the following reclassifications of permanent book and tax basis differences:
| | | | | | | | | | | | | | |
| Capital Accounts | | December 31, 2023 | | December 31, 2022 |
| Paid-in-capital in excess of par value | | $ | (341) | | | $ | (374) | |
| Accumulated losses | | 341 | | | 374 | |
These permanent differences are primarily due to the reclassification of nondeductible expenses. These reclassifications had no effect on net assets.
The determination of the tax attributes of the Company’s distributions is made annually as of the end of the Company’s fiscal year based upon the Company’s taxable income for the full year and distributions paid for the full year. The tax characteristics of distributions to shareholders are reported to shareholders annually on Form 1099-DIV and were as follows for the years ended December 31, 2023, 2022 and 2021:
| | | | | | | | | | | | | | | | | | | | | | | | | | | | | | | | | | | | | | |
| | | Years Ended December 31, |
| | | 2023 | | 2022 | | 2021 |
| | | Amount | | Percentage | | Amount | | Percentage | | Amount | | Percentage |
| Ordinary income(1) | | 87,867 | | 100.0 | % | | 81,575 | | 100.0 | % | | 71,530 | | 100.0 | % |
| Total | | 87,867 | | 100.0 | % | | 81,575 | | 100.0 | % | | 71,530 | | 100.0 | % |
(1)Includes net short term capital gains of $0, $0 and $0 for the years ended December 31, 2023, 2022 and 2021, respectively.
See Note 5, Distributions, for further information.
As of December 31, 2023 and 2022, the components of accumulated earnings on a tax basis were as follows:
| | | | | | | | | | | |
| | December 31, 2023 | | December 31, 2022 |
| Undistributed ordinary income | 6,562 | | 8,543 |
| Other accumulated losses (1) | (84,271) | | (77,942) |
| Net unrealized depreciation on investments | (74,433) | | (91,091) |
| Total accumulated losses | (152,142) | | (160,490) |
(1) Includes short term capital loss carryforwards of $0 and long term capital loss carryforwards of $82,541 as of December 31, 2023. Includes short term capital loss carryforwards of $7,233 and long term capital loss carryforwards of $66,284 as of December 31, 2022.
CĪON Investment Corporation
Notes to Consolidated Financial Statements
December 31, 2023
(in thousands, except share and per share amounts)
As of December 31, 2023, the aggregate gross unrealized appreciation for all securities in which there was an excess of value over tax cost was $71,010; the aggregate gross unrealized depreciation for all securities in which there was an excess of tax cost over value was $145,443; the net unrealized depreciation was $74,433; and the aggregate cost of securities for Federal income tax purposes was $2,028,711.
As of December 31, 2022, the aggregate gross unrealized appreciation for all securities in which there was an excess of value over tax cost was $31,155; the aggregate gross unrealized depreciation for all securities in which there was an excess of tax cost over value was $122,246; the net unrealized depreciation was $91,091; and the aggregate cost of securities for Federal income tax purposes was $1,851,121.
Note 15. Selected Quarterly Financial Data (unaudited)
The following is the selected quarterly financial data as of and for the years ended December 31, 2023 and 2022. The following information reflects all adjustments, which are of a normal recurring nature, considered necessary for a fair presentation. The operating results for any quarter are not necessarily indicative of results for any future period:
| | | | | | | | | | | | | | | | | | | | | | | | | | |
| Quarter Ended | | March 31, 2023 | | June 30, 2023 | | September 30, 2023 | | December 31, 2023 |
| Investment income | | $ | 64,975 | | | $ | 58,496 | | | $ | 67,540 | | | $ | 59,999 | |
| Net investment income | | 29,858 | | | 23,416 | | | 29,990 | | | 21,758 | |
| Net realized and unrealized (loss) gain on investments and foreign currency | | (60,903) | | | 4,478 | | | 17,483 | | | 29,234 | |
| Net (decrease) increase in net assets resulting from operations | | (31,045) | | | 27,894 | | | 47,473 | | | 50,992 | |
| Net (decrease) increase in net assets resulting from operations per share of common stock(1) | | (0.56) | | | 0.51 | | | 0.87 | | | 0.94 | |
| Net asset value per share of common stock at end of quarter | | 15.11 | | 15.31 | | 15.80 | | 16.23 |
| Weighted average shares of common stock outstanding | | 55,109,482 | | 54,788,740 | | 54,561,367 | | 54,292,065 |
| | | | | | | | |
| Quarter Ended | | March 31, 2022 | | June 30, 2022 | | September 30, 2022 | | December 31, 2022 |
| Investment income | | $ | 41,683 | | | $ | 43,552 | | | $ | 54,163 | | | $ | 55,500 | |
| Net investment income | | 19,483 | | | 19,288 | | | 25,557 | | | 23,877 | |
| Net realized and unrealized (loss) gain on investments and foreign currency | | (11,594) | | | (20,554) | | | 8,426 | | | (14,342) | |
| Net increase (decrease) in net assets resulting from operations | | 7,889 | | | (1,266) | | | 33,983 | | | 9,535 | |
| Net increase (decrease) in net assets resulting from operations per share of common stock(1) | | 0.14 | | | (0.02) | | | 0.60 | | | 0.17 | |
| Net asset value per share of common stock at end of quarter | | 16.20 | | 15.89 | | 16.26 | | 15.98 |
| Weighted average shares of common stock outstanding | | 56,958,440 | | 56,958,440 | | 56,816,992 | | 55,505,248 |
(1)The sum of the quarterly amounts may not equal amounts reported for the years ended December 31, 2023 and 2022. This is due to changes in the number of weighted-average shares outstanding and the effects of rounding for each period.
Item 9. Changes in and Disagreements With Accountants on Accounting and Financial Disclosure
None.
Item 9A. Controls and Procedures
Evaluation of disclosure controls and procedures
In connection with the preparation of this Annual Report on Form 10-K for the year ended December 31, 2023, we carried out an evaluation, under the supervision and with the participation of our management, including our Co-Chief Executive Officers and our Chief Financial Officer, of the effectiveness of the design and operation of our disclosure controls and procedures as of the end of the period covered by this report pursuant to Rule 13a-15(b) and Rule 15d-15(b) of the Securities Exchange Act of 1934, as amended. Based on the foregoing evaluation, the Co-Chief Executive Officers and the Chief Financial Officer concluded that our disclosure controls and procedures were effective.
In designing and evaluating our disclosure controls and procedures, we recognized that disclosure controls and procedures, no matter how well conceived and operated, can provide only reasonable, not absolute, assurance that the objectives of the disclosure controls and procedures are met. Our disclosure controls and procedures have been designed to meet reasonable assurance standards. Disclosure controls and procedures cannot detect or prevent all error and fraud. Some inherent limitations in disclosure controls and procedures include costs of implementation, faulty decision-making, simple error and mistake. Additionally, controls can be circumvented by the individual acts of some persons, by collusion of two or more people, or by management override of the controls. The design of any system of controls is based, in part, upon certain assumptions about the likelihood of future events, and there can be no assurance that any design will succeed in achieving its stated goals under all anticipated and unanticipated future conditions. Over time, controls may become inadequate because of changes in conditions, or the degree of compliance with established policies or procedures.
Management's Annual Report on Internal Control Over Financial Reporting
Our management is responsible for establishing and maintaining adequate internal control over financial reporting. As defined in Exchange Act Rules 13a-15(f) and 15d-15(f), internal control over financial reporting is a process designed by, or under the supervision of, our principal executive and principal financial officers, or persons performing similar functions, and effected by our board of directors, management and other personnel, to provide reasonable assurance regarding the reliability of financial reporting and the preparation of consolidated financial statements for external purposes in accordance with GAAP.
Our internal control over financial reporting includes those policies and procedures that:
1.Pertain to the maintenance of records that, in reasonable detail, accurately and fairly reflect our transactions and our dispositions of assets;
2.Provide reasonable assurance that our transactions are recorded as necessary to permit preparation of consolidated financial statements in accordance with generally accepted accounting principles, and that our receipts and expenditures are being made only in accordance with authorizations of our management and board of directors; and
3.Provide reasonable assurance regarding prevention or timely detection of unauthorized acquisition, use or disposition of our assets that could have a material effect on the consolidated financial statements.
Because of its inherent limitations, a system of internal control over financial reporting can provide only reasonable assurance with respect to financial statement preparation and presentation and may not prevent or detect misstatements. Also, projections of any evaluation of effectiveness to future periods are subject to the risk that controls may become inadequate because of changes in conditions, or that the degree of compliance with the policies or procedures may deteriorate.
In connection with the preparation of our annual consolidated financial statements, our management has conducted an assessment of the effectiveness of our internal control over financial reporting based on the framework set forth in Internal Control-Integrated Framework issued by the Committee of Sponsoring Organizations of the Treadway Commission in 2013. Management's assessment included an evaluation of the design of our internal control over financial reporting and testing of the operational effectiveness of those controls. Based on this evaluation, we have concluded that, as of December 31, 2023, our internal control over financial reporting was effective to provide reasonable assurance regarding the reliability of financial reporting and the preparation of financial statements for external purposes in accordance with GAAP.
Attestation Report of the Independent Registered Public Accounting Firm
Our independent registered public accounting firm, RSM US LLP, has issued an attestation report on the effectiveness of our internal control over financial reporting as of December 31, 2023, which is set forth under the heading “Reports of Independent Registered Public Accounting Firm” on page 86.
Changes in internal control over financial reporting
There have been no changes in our internal control over financial reporting during the three months ended December 31, 2023 that have materially affected, or are reasonably likely to materially affect, our internal control over financial reporting.
Item 9B. Other Information
During the fiscal quarter ended December 31, 2023, none of our directors or executive officers adopted or terminated any contract, instruction or written plan for the purchase or sale of our securities to satisfy the affirmative defense conditions of Rule 10b5-1(c) of the Exchange Act or any "non-Rule 10b5-1 trading arrangement."
Item 9C. Disclosure Regarding Foreign Jurisdictions that Prevent Inspections
Not applicable.
PART III
Item 10. Directors, Executive Officers and Corporate Governance
Directors and Executive Officers
Certain information pertaining to our board of directors, or the Board, and executive officers as of the date of this report is set forth below, including their names, ages, a brief description of their recent business experience, including present occupations and employment, and certain directorships that each person held during the last five years. We have divided the directors into two groups - independent directors and interested directors.
| | | | | | | | | | | | | | |
Name(1) | | Age | | Position(s) |
Interested Directors(2)(3) | | | | |
| Mark Gatto | | 51 | | Co-Chairman, Co-Chief Executive Officer and Director |
| Michael A. Reisner | | 53 | | Co-Chairman, Co-Chief Executive Officer and Director |
Independent Directors(2) | | | | |
| Robert A. Breakstone | | 86 | | Director |
| Aron I. Schwartz | | 53 | | Director |
| Peter I. Finlay | | 62 | | Director |
| Earl V. Hedin | | 67 | | Director |
| Catherine K. Choi | | 52 | | Director |
| Edward J. Estrada | | 51 | | Director |
| Executive Officers Who Are Not Directors | | | | |
| Keith S. Franz | | 55 | | Chief Financial Officer and Treasurer |
| Gregg A. Bresner | | 56 | | President and Chief Investment Officer |
| Stephen Roman | | 42 | | Chief Compliance Officer and Secretary |
| Eric A. Pinero | | 48 | | Chief Legal Officer |
| Charlie Arestia | | 38 | | Managing Director and Head of Investor Relations |
(1)The address for each director and executive officer is c/o CĪON Investment Corporation, 100 Park Avenue, 25th Floor, New York, NY 10017.
(2)Our directors are divided into three classes, each holding office for a three-year term. At each annual meeting of shareholders, the successors to the class of directors whose terms expire at such meeting will be elected to hold office for a term expiring at the annual meeting of shareholders held in the third year following the year of their election. Each director will hold office for the term to which he or she is elected and serve until his or her successor is duly elected and qualified.
(3)“Interested person” of our company as defined in Section 2(a)(19) of the 1940 Act. Messrs. Gatto and Reisner are each an “interested person” because of their affiliation with CIM.
Interested Directors
Mark Gatto serves as Co-Chairman of the Board and Co-Chief Executive Officer of our company (since 2011) and CIG. Mr. Gatto serves on the investment committee of CIM. In addition, Mr. Gatto is a Trustee, Co-President and Co-Chief Executive Officer and serves on the investment allocation committee of CION Ares Diversified Credit Fund, a diversified, closed-end management investment company. He joined CION Investments in 1999. Mr. Gatto was formerly Executive Vice President and Chief Acquisitions Officer from May 2007 through January 2008. He served as Executive Vice President of Business Development from May 2006 through May 2007 and Vice President of Marketing from August 2005 through February 2006. Mr. Gatto was also Associate General Counsel for CIG from November 1999 until October 2000. Previously, Mr. Gatto was an executive for a leading international product development and marketing company from 2000 through 2003 and later co-founded a specialty business-consulting firm in New York City where he served as its managing partner before re-joining CION Investments in 2005. Mr. Gatto was also an attorney in private practice from 1996 through 1999. Mr. Gatto received an M.B.A from the W. Paul Stillman School of Business at Seton Hall University, a J.D. from Seton Hall University School of Law, and a B.S. from Montclair State University.
Michael A. Reisner serves as Co-Chairman of the Board and Co-Chief Executive Officer of our company (since 2011) and CIG. Mr. Reisner serves on the investment committee of CIM. In addition, Mr. Reisner is a Trustee, Co-President and Co-Chief Executive Officer and serves on the investment allocation committee of CION Ares Diversified Credit Fund, a diversified, closed-end management investment company. He joined CION Investments in 2001. Mr. Reisner was formerly Chief Financial Officer from January 2007 through April 2008. Mr. Reisner was also formerly Executive Vice President — Originations from February 2006 through January 2007. Mr. Reisner was Senior Vice President and General Counsel from January 2004 through January 2006. Mr. Reisner was Vice President and Associate General Counsel from March 2001 until December 2003. Previously, from 1996 to 2001, Mr. Reisner was an attorney in private practice in New York. Mr. Reisner received a J.D., cum laude, from New York Law School and a B.A. from the University of Vermont.
Independent Directors
Robert A. Breakstone has served as a member of our Board since 2012. He has been the President and Chief Executive Officer of Landmark International Group, Inc., an independent consulting firm providing business development, financial, information technology, and marketing services to major corporations and start-up entrepreneurial ventures, since 1995. Previously, Mr. Breakstone served as Executive Vice President and Chief Operating Officer at GTECH Corporation, a provider of technology-based gaming systems and services, from 1988 to 1995, where he took the firm private in a leveraged buyout and then public again later in an initial public offering. Prior to GTECH, he was President and Chief Executive Officer at Health-tex, Inc., which we believe is a leading marketer and retailer of children’s apparel, from 1985 to 1988, where he led a management buyout of the firm from Chesebrough Pond’s Inc., where he served as Group Vice President and served on the Executive Committee and Board of Directors from 1974 to 1985. Prior to Chesebrough Pond’s, Mr. Breakstone was a Group Executive with the Chase Manhattan Bank N.A. from 1970 to 1974, where he managed major corporate, domestic and international banking divisions. From 1967 to 1970, he was Vice President and Chief Financial Officer of Systems Audits, Inc., a management consulting firm providing information technology services to the financial industry.
Mr. Breakstone also served on the board of directors of By Design International Ltd., a private, for-profit designer and marketer of women’s apparel and on the advisory board of Hoffinger Industries, Inc., a leader in the above-ground pool/filtration industry. In addition to his prior service as a member of the board of Chesebrough Pond’s, Mr. Breakstone also served on the board of directors of OSF, Inc., a Canadian publicly traded company, from 1996 to 1998 where, as a member of an independent special committee, he was responsible for selling the company to a US-based financial entity.
Mr. Breakstone served as an Adjunct Professor at the Graduate School of Business at Mercy College from 1999 to 2008. From 1963 to 1967, Mr. Breakstone was an adjunct professor at New York University. In addition, from 1967 to 1969, Mr. Breakstone was an Adjunct Assistant Professor at Pace University. Mr. Breakstone’s degrees include a B.S. in Mathematics and an M.B.A. from the City College of New York.
Aron I. Schwartz has served as a member of our Board since 2012. He has been a Managing Director at ACON Investments since July 2014. Mr. Schwartz is the founder of Constructivist Capital, LLC, a firm that works with family offices and alternative asset management firms to pursue attractive investment opportunities. He was previously a consultant to and a Managing Director at Avenue Capital from 2012 to 2014 and held various positions culminating in Managing Director of Fenway Partners, a middle market private equity firm based in New York, from 1999 to 2011. From 1997 to 1999, Mr. Schwartz was an associate in the Financial Entrepreneurs Group of Salomon Smith Barney, where he worked on a variety of financings and advisory assignments. He also serves or has served on the board of directors of a number of other public and private companies, including Invacare Corporation, True Value Company, 1-800 Contacts, Inc., Commonwealth Laminating & Coating, Inc., Easton Bell Sports, Inc., STVT-AAI Education Inc., Igloo Products Corp., APR Energy, PLC, Borden Dairy Holdings and ATU Auto Technick-Unger. In addition, Mr. Schwartz previously served on the board of directors of the Open Road Foundation and US-ASEAN Business Council. Mr. Schwartz, a Certified Management Accountant, received his J.D. and M.B.A with honors from U.C.L.A. and his B.A. and B.S.E. cum laude from the Wharton School at the University of Pennsylvania.
Peter I. Finlay has served as a member of our Board since 2016. He is the founder and Managing Principal of Ardentis LLC, a corporate finance consulting firm that provides advisory services to companies in the U.S. and international markets. From 2008 to 2013, Mr. Finlay served as Managing Director of ICON Capital, LLC and was responsible for managing new business origination in Europe and North America. Prior to 2008, Mr. Finlay held various management positions both in financial institutions and in relevant industries. From 2006 to 2008, he served as Director of Equipment Finance at Landsbanki Commercial Finance where he established a new industrial finance business with a focus on originating middle market secured debt transactions. From 2003 to 2006, he served as Vice President & Regional Director Europe for GMAC Commercial Finance where he started a new equipment finance business. From 2000 to 2003, Mr. Finlay served as a Director of Project Finance Organization at Bell Labs Lucent Technologies and from 1997 to 1999 he served as a Marketing Director of Structured Finance at Transamerica Leasing, where he established a structured finance operation covering Europe and the Middle East. Mr. Finlay started his career at National Westminster Bank (1979 – 1986) before moving to Barclays (1986 – 1997), where he held various positions, including Manager in the middle market structured leasing department and Manager in the para-banking inspection department where he was responsible for reviewing risk management compliance and risk underwriting in the bank’s European equipment finance subsidiaries.
Since 2014, Mr. Finlay has been the Managing Principal of Ardentis LLC and is also an advisor to the board of EMM Investments LLC, a privately held asset manager engaged in lending to asset intensive companies. From 2009 to 2011, Mr. Finlay served as Chairman and non-executive Director of Premier Telesolutions Ltd. (UK).
Mr. Finlay became an Associate of the Chartered Institute of Bankers in England and Wales in 1994 and completed a Diploma in Financial Studies in 1997. He completed an M.B.A. at City University Business School in London in 1997 and subsequently served as a tutor in the evening M.B.A. program.
Earl V. Hedin has served as a member of our Board since 2017. He is the co-founder and Managing Partner of Hudson Partners Group LLC. The firm assists investment managers in raising institutional capital for hedge funds, private equity and other alternative investment strategies. From 1999 to 2007, Mr. Hedin served as a Senior Managing Director at Bear, Stearns & Co. Inc., where he held various senior roles building and guiding the Bear Stearns Asset Management Group. These roles included Chief Financial Officer, Director of Alternatives and co-head and founder of the firm's Private Funds Group. He was responsible for the firm's sponsored venture capital funds and headed the approximately $1 billion private equity fund-of-funds program. During his tenure, he created numerous alternative asset products and helped raise over $3 billion for these funds. Mr. Hedin also created the first hedge fund-of-funds product at Bear Stearns. From 1995 to 1998, he served as a Managing Director – Principal, and worked on several key international financial structuring projects, including the creation of Bear Stearns Irish Bank in Dublin. Additionally, Mr. Hedin created the Bear Stearns Dublin Development Center to reduce technology related costs. From 1994 to 1995, he served as Vice President at Bankers Trust New York Corporation, where he was responsible for strategic planning and management reporting. Prior to that, from 1989 to 1993, he worked as a Vice President and Controller in the firm's Domestic Merchant Bank and directed all financial management functions across a variety of business units. During that time, he was also actively involved in the buying and selling of LBO partnership interests. From 1988 to 1989, he served as Vice President – Finance and Chief Financial Officer of American International Group's credit subsidiary, A.I. Credit Corporation, and managed the firm's liability portfolio. Previously, Mr. Hedin was an Associate in Morgan Stanley's venture capital group as well as the Chief Financial Officer of the group's activities. Prior to that, he served as a Senior Accountant at Price Waterhouse.
Mr. Hedin received his M.B.A from Rutgers Graduate School of Management in 1980 and did graduate studies at Carnegie-Mellon University. He received his B.A. from Rutgers College in 1978. Mr. Hedin is a holder of the right to use the Chartered Financial Analyst® designation and is a Certified Public Accountant (retired). Mr. Hedin also holds various FINRA licenses including Series 7, 63, 99, 24 (Securities Principal) and 27 (Financial Principal).
Catherine K. Choi has served as a member of our Board since 2021. Ms. Choi has served as President of BULBRITE Industries, a leading manufacturer and supplier of energy-efficient lighting solutions, since 2009. Founded 50 years ago by her parents, BULBRITE is a family-owned business renowned for its commitment to innovation, education and exceptional service. In her role as President, Ms. Choi oversees all aspects of the company’s operations including sales, marketing, operations, manufacturing and product development. During her tenure as President of BULBRITE, Ms. Choi has expanded sales and services to a broader community and distributor base throughout North America. She has helped expand the breadth of the company’s product line to LED decorative bulbs and patio string lights as well as a line of smart bulbs, Bulbrite Solana®, that has been featured in the Washington Post, Dwell, House Beautiful and Apartment Therapy.
Recipient of the 2021 Women in Lighting Leadership Award and Residential Lighting Industry Leadership Award in 2010, Ms. Choi is an active leader in the lighting industry, serving on the Lighting Board of Governors for the Dallas Market Center since 2018, and was a former Chair of the American Lighting Association Education Foundation Board from 2013 to 2015. She is an ALA Certified Lighting Specialist. Ms. Choi was recognized as a Woman of Influence in 2013 by the NJ Commerce and Industry Association. She is also an elected member of the President’s Council for Cornell Women since 2017, and has served as a director for the Ridgewood Public Library Foundation since 2017 and for a privately held company in NJ since 2015. Ms. Choi earned her MBA from New York University in 1996 and her BA from Cornell University in 1993. She is the Co-Chair of the NYU Stern Women in Business Alumnae Group, and Advisory Council Member for the Seton Hall Business School Leadership Program.
Edward J. Estrada has served as a member of our Board since 2021. Mr. Estrada is the Principal of Estrada Legal Consulting, a legal management consulting business working with law firms on strategy development, implementation and alignment, market positioning, margin improvement, and operational efficiency. Mr. Estrada was in private legal practice for 25 years. Most recently, he was a partner with the global law firm, Reed Smith, LLP, in its Global Financial Industry Group. He has served as a director for a family foundation since 2021 and as an advisory and executive board member for certain non-profit businesses. Mr. Estrada counseled his clients in a wide range of business matters, including acting as outside counsel, and addressing their regulatory, transactional and litigation needs. He held multiple leadership positions at Reed Smith, LLP, most recently as global chair of the firm’s Financial Industry Group from 2016 to 2021. Mr. Estrada also served as co-head of Reed Smith, LLP’s U.S. Litigation Group (2010 to 2012), served two terms on the firm’s Executive Committee (2009 and 2014), served as Managing Partner of the New York Office (2012 to 2014), and served as the firm’s Global Head of Business Strategy on the firm’s Senior Management Team (2014 to 2016). In his practice, and in his role as global chair of Reed Smith, LLP’s Financial Industry Group, Mr. Estrada counseled clients ranging from private funds to investment and regional banks and was responsible for identifying and responding to market and industry trends. Mr. Estrada received his J.D. from George Washington Law School in 1997 and his B.A. from Cornell University in 1994.
Classes of Directors:
As stated above, our directors are divided into three classes, each holding office for a three-year term. At each annual meeting of shareholders, the successors to the class of directors whose terms expire at such meeting will be elected to hold office for a term expiring at the annual meeting of shareholders held in the third year following the year of their election. Our directors are classified as below:
| | | | | | | | | | | | | | | | | | | | |
Class I - Independent (Serve Until the Annual Meeting of Shareholders in 2025) | | | Class II - Independent (Serve Until the Annual Meeting of Shareholders in 2026) | | | Class III - Interested (Serve Until the Annual Meeting of Shareholders in 2024) |
| Peter I. Finlay | | | Robert A. Breakstone | | | Mark Gatto |
| Earl V. Hedin | | | Aron I. Schwartz | | | Michael A. Reisner |
| Edward J. Estrada | | | Catherine K. Choi | | | |
Executive Officers Who Are Not Directors
Keith S. Franz has served as our Chief Financial Officer and Treasurer since 2011. Mr. Franz is principally responsible for our financial and day-to-day operating activities. Mr. Franz is also the Chief Financial Officer of CIM, our registered investment advisor. Mr. Franz joined CION Investments in March 2009. Prior to joining CION Investments, Mr. Franz was a senior executive for a business advisory and consulting firm from 2008 to 2009, the Vice President of Corporate Finance for a large publicly traded company from 2004 through 2008 and a Senior Audit Manager with E&Y, LLP in their assurance and business advisory group from 1991 through 2004. Mr. Franz received a B.S. from Binghamton University and is a certified public accountant and a Series 27 Financial and Operations principal.
Gregg A. Bresner joined our company as President and Chief Investment Officer in 2016. Mr. Bresner has over 25 years of corporate finance, investment and portfolio management experience with a focus in the leveraged finance sector. Prior to joining our company and CIM, Mr. Bresner worked at investment management and banking firms including Wasserstein Perella & Co., Bankers Trust Company, BT Alex. Brown, Deutsche Bank, Briscoe Capital Management and Plainfield Asset Management. Previously, Mr. Bresner served as the operating Chief Financial Officer of JDS Therapeutics from 2012 to 2016. At JDS, Mr. Bresner led the company's financial, accounting, capital raising, corporate development and human resource functions and completed multiple capital raises, licensing transactions and acquisitions. In 2010, Mr. Bresner co-founded Tyto Capital, an investment firm specializing in private debt and equity investments in U.S. based middle-market companies. Tyto originated and acquired multiple private investments from 2010 to 2012, including an equity investment in JDS Therapeutics. In 2003, Mr. Bresner co-founded Briscoe Capital Management, a registered investment manager and the portfolio manager of the Fairfield Briscoe Senior Capital Fund, a debt fund focused on non-investment grade senior secured debt assets. Mr. Bresner actively managed a diversified loan portfolio of approximately 100 issuers. While at Briscoe, Mr. Bresner successfully raised and utilized approximately $700 million of committed debt facilities with Citigroup and CIBC. In mid-2006, the Briscoe Capital team merged into Plainfield Asset Management, a multi-billion-dollar special situations hedge fund platform. From 2006 to 2010, Mr. Bresner served as a Managing Director of Plainfield, where he sourced and executed direct U.S. debt and equity investments for various Plainfield investment funds.
Mr. Bresner began his investment banking career in the Mergers & Acquisitions group of Wasserstein Perella, where he advised middle-market companies and private equity sponsors on mergers and acquisitions, leveraged recapitalization and restructuring transactions. While at Bankers Trust Company and Deutsche Bank, Mr. Bresner was a senior investment banker in the Financial Sponsors Group where he focused on sourcing, structuring and executing leveraged senior debt, high yield debt and mezzanine financings for private equity sponsors. Mr. Bresner graduated magna cum laude with a B.S. from Rensselaer Polytechnic Institute and received his M.B.A. from the Columbia University Graduate School of Business, where he was a Beta Gamma Sigma scholar. Mr. Bresner is a holder of the right to use the Chartered Financial Analyst® designation.
Stephen Roman joined CIG in July of 2013 and since August 2013 has been Vice President of CIM. During his tenure at our company, Mr. Roman has advised on numerous legal and regulatory matters and managed corporate and securities law compliance matters for our various corporate entities as well as our registered investment adviser. From November 2012 through June 2013, Mr. Roman served as an attorney in New York. Previously, he was an analyst at Forex Capital Markets. Mr. Roman received a J.D. from the Northwestern University School of Law and a B.S. from New York University. Mr. Roman is a holder of the right to use the Chartered Financial Analyst® designation and is a member of the CFA Institute.
Eric. A Pinero has served as our Chief Legal Officer since November 2021 and as Senior Director and Counsel of CIG and its affiliated entities since July 2013. At CIG, Mr. Pinero advises on all legal, compliance and regulatory matters, including, among others, matters related to corporate and securities law compliance for CIG as well as CIG’s sponsored alternative investment products, including our company. Prior to joining CIG in 2013, Mr. Pinero was an attorney with several highly regarded regional law firms representing both issuers and underwriters concentrating on securities law compliance, public and private debt and equity securities offerings, mergers and acquisitions, and a diverse range of corporate and commercial transactions. Mr. Pinero received a B.S. in Political Science and History from Roger Williams University and a J.D. from Brooklyn Law School.
Charlie Arestia has served as our Managing Director and Head of Investor Relations since March 2024. Prior to joining our company, Mr. Arestia was a Vice President at Focus Financial Partners from July 2021 to February 2024, with roles in both investor relations as well as mergers and acquisitions. While at Focus Financial Partners, his investor relations efforts included leading peer analysis and shareholder targeting efforts, as well as managing relationships with equity analysts and the investor community. Also, while at Focus Financial Partners, Mr. Arestia was responsible for sourcing and structuring mergers and acquisitions transactions in the wealth management space and working closely with partner firms on strategic initiatives to drive organic growth. From 2017 to 2021, he was an equity analyst at JP Morgan with coverage in the specialty finance sector including credit cards, auto and student lenders, BDCs, and mortgage finance. From 2014 to 2017, Mr. Arestia served in the US Army with assignments at Fort Benning, GA and Fort Bragg, NC. In 2010, Mr. Arestia began his career as an analyst at GS Gamma Advisors, a MBS-focused hedge fund at Guggenheim Partners. Mr. Arestia received a B.A from Johns Hopkins University.
Corporate Governance
Risk Oversight and Board Structure
The Board oversees our business and investment activities and is responsible for protecting the interests of our shareholders. The responsibilities of the Board include, among other things, the oversight of our investment activities, the quarterly valuation of our assets, oversight of our financing arrangements and corporate governance activities. Pursuant to our charter and bylaws, the Board may modify the number of directors on the Board, provided that the number of directors will not be fewer than one, the minimum number required by the Maryland General Corporation Law, or greater than twelve. Pursuant to our charter, our directors are divided into three classes. Each class of directors will hold office for a three-year term. At each annual meeting of shareholders, the successors to the class of directors whose terms expire at such meeting will be elected to hold office for a term expiring at the annual meeting of shareholders held in the third year following the year of their election. Each director will hold office for the term to which he or she is elected and serve until his or her successor is duly elected and qualified. The Board is currently comprised of eight directors, six of whom are independent.
Through its direct oversight role, and indirectly through its committees, the Board performs a risk oversight function for us consisting of, among other things, the following activities: (1) at regular and special Board meetings, and on an ad hoc basis as needed, receiving and reviewing reports related to our performance and operations; (2) reviewing and approving, as applicable, our compliance policies and procedures; (3) meeting with the portfolio management team to review investment strategies, techniques and the processes used to manage related risks; (4) meeting with, or reviewing reports prepared by, the representatives of our key service providers, including our investment adviser, administrator, and independent registered public accounting firm, to review and discuss our activities and to provide direction with respect thereto; and (5) engaging the services of our chief compliance officer to test our compliance procedures and certain of our service providers.
Our charter, as well as regulations governing BDCs generally, require that a majority of our Board be persons other than “interested persons” of the BDC, as defined in Section 2(a)(19) of the 1940 Act. A majority of the members of our Board are not “interested persons” of our company or CIM, as defined in Section 2(a)(19) of the 1940 Act and as required by Rule 303A.00 in the NYSE Listed Company Manual. These individuals are referred to as our independent directors. Section 2(a)(19) of the 1940 Act defines an “interested person” to include, among other things, any person who has, or within the last two years had, a material business or professional relationship with us. The members of the Board that are not independent directors are referred to as interested directors.
Messrs. Gatto and Reisner, who are “interested persons” as defined in Section 2(a)(19) of the 1940 Act, serve as the co-chief executive officers and co-chairmen of the Board. The Board believes that Messrs. Gatto and Reisner, as our co-chief executive officers and co-chairmen of the Board, are the directors with the most knowledge of our business strategy and are best situated to serve as chairmen of the Board.
The Board has determined that the following directors are independent directors pursuant to Section 2(a)(19) of the 1940 Act and as required by Rule 303A.00 in the NYSE Listed Company Manual: Robert A. Breakstone, Peter I. Finlay, Aron I. Schwartz, Earl V. Hedin, Catherine K. Choi and Edward J. Estrada. Based upon information requested from each director concerning his or her background, employment and affiliations, the Board has affirmatively determined that none of the independent directors has, or within the last two years had, a material business or professional relationship with us, other than in his or her capacity as a member of the Board or any Board committee or as a shareholder. The Board does not currently have a separately designated lead independent director and has not designated one independent director to preside over all executive sessions of independent directors. Rather, Aron I. Schwartz and Robert A. Breakstone, each independent directors and chairman of the audit committee and nominating and corporate governance committee, respectively, preside over such executive sessions on a rotational basis. Communications may be sent to the independent directors to: Stephen Roman, Corporate Secretary, CĪON Investment Corporation, 100 Park Avenue, 25th Floor, New York, NY 10017. The Board, after considering various factors, including, among other things, its current duties, responsibilities and our overall business, has concluded that its structure is appropriate at this time. The Board will continue to monitor our structure and determine whether it remains appropriate based on the complexity of our operations.
There have been no purchases or sales of securities of CIM or its parent or subsidiaries by any of our directors since the beginning of the most recently completed fiscal year.
Committees of the Board
The Board has established a standing audit committee, a standing nominating and corporate governance committee and a standing compensation committee. The Board met five times and took action by unanimous written consent eight times during the fiscal year ended December 31, 2023. Each director attended more than 95% of all meetings of the Board held during the fiscal year ended December 31, 2023. We do not have a formal policy regarding director attendance at an annual meeting of shareholders.
Audit Committee
The members of our audit committee are Robert A. Breakstone, Peter I. Finlay, Aron I. Schwartz, Earl V. Hedin, Catherine K. Choi and Edward J. Estrada, each of whom meets the independence standards established by the SEC for audit committees and is independent for purposes of the 1940 Act and the NYSE Listed Company Manual. Mr. Schwartz serves as chairman of the audit committee. The Board has determined that Mr. Schwartz is an “audit committee financial expert” as that term is defined under Item 407 of Regulation S-K of the Exchange Act. The audit committee operates pursuant to a written charter and meets periodically as necessary. A copy of the audit committee’s charter is available on our website: www.cionbdc.com. The audit committee is responsible for selecting, engaging and discharging our independent registered public accounting firm (the “independent accountants”), reviewing the plans, scope and results of the audit engagement with our independent accountants, approving professional services provided by our independent accountants (including compensation therefor), reviewing the independence of our independent accountants and reviewing the adequacy of our internal controls over financial reporting. The audit committee also establishes guidelines, reviews preliminary valuations and makes recommendations to the Board regarding the valuation of our loans and other investments. The audit committee met four times in 2023.
Nominating and Corporate Governance Committee
The members of our nominating and corporate governance committee are Robert A. Breakstone, Peter I. Finlay, Aron I. Schwartz, Earl V. Hedin, Catherine K. Choi and Edward J. Estrada, each of whom meets the independence standards established by the SEC for governance committees and is independent for purposes of the 1940 Act and the NYSE Listed Company Manual. Mr. Breakstone serves as chairman of the nominating and corporate governance committee. The nominating and corporate governance committee operates pursuant to a written charter and meets periodically as necessary. A copy of the nominating and corporate governance committee’s charter is available on our website: www.cionbdc.com. The nominating and corporate governance committee is responsible for selecting, researching, and nominating directors for election by our shareholders, selecting nominees to fill vacancies on the Board or a committee of the Board, developing and recommending to the Board a set of corporate governance principles and overseeing the evaluation of the Board and our management. The nominating and corporate governance committee will consider shareholders’ proposed nominations for directors. The nominating and corporate governance committee met three times in 2023.
The nominating and corporate governance committee considers candidates suggested by its members and other directors, as well as our management and shareholders. A shareholder who wishes to recommend a prospective nominee for the Board must provide notice to our corporate secretary in accordance with the requirements set forth in our bylaws, the nominating and corporate governance committee charter and any applicable law, rule or regulation regarding director nominations. Nominations should be sent to Stephen Roman, Corporate Secretary, CĪON Investment Corporation, 100 Park Avenue, 25th Floor, New York, NY 10017. To have a candidate considered by the nominating and corporate governance committee, a shareholder must submit the recommendation in writing and must include the following information:
•The name of the shareholder and evidence of the person’s ownership of shares, including the number of shares owned and the length of time of the ownership;
•The name of the candidate, the candidate’s resume or a listing of his or her qualifications to be a director of our company and the person’s consent to be named as a director if selected by the nominating and corporate governance committee and nominated to the Board; and
•If requested by the nominating and corporate governance committee, a completed and signed director’s questionnaire.
Compensation Committee
The members of our compensation committee are Robert A. Breakstone, Peter I. Finlay, Aron I. Schwartz, Earl V. Hedin, Catherine K. Choi and Edward J. Estrada, each of whom meets the independence standards established by the SEC for compensation committees and is independent for purposes of the 1940 Act and the NYSE Listed Company Manual. We currently do not have a chairperson of the compensation committee. The compensation committee operates pursuant to a written charter and meets periodically as necessary. A copy of the compensation committee’s charter is available on our website: www.cionbdc.com. The compensation committee is responsible for determining, or recommending to the Board for determination, the compensation, if any, of our co-chief executive officers and all other executive officers. The compensation committee also assists the Board with matters related to compensation generally, except with respect to compensation of the directors.
Our executive officers do not receive any direct compensation from us. However, the compensation payable to CIM pursuant to the investment advisory agreement has been separately approved by a majority of the independent directors, as well as our shareholders in 2021, and renewed annually by such independent directors commencing in 2023. As none of our executive officers currently is compensated by us, the compensation committee does not produce and/or review a report on executive compensation practices. The compensation committee did not hold any formal meetings in 2023.
Compensation of Directors
Directors who do not also serve in an executive officer capacity for us or CIM are entitled to receive annual cash retainer fees, fees for attending Board and committee meetings and annual fees for serving as a committee chairperson. These directors are Robert A. Breakstone, Peter I. Finlay, Aron I. Schwartz, Earl V. Hedin, Catherine K. Choi and Edward J. Estrada. These directors are paid (i) annual cash retainer fees of $100,000; (ii) fees for attending Board and committee meetings (in-person or telephonically) of $1,000 per meeting; and (iii) annual fees of $25,000 for serving as a committee chairperson (per committee). Amounts payable under this arrangement are determined and paid quarterly in arrears.
We also reimburse each of the above directors for all reasonable and authorized business expenses in accordance with our policies as in effect from time to time. We did not pay compensation to our directors who also serve in an executive officer capacity for us or CIM for the year ended December 31, 2023.
Our directors were paid compensation of $687,683 in connection with their service on the Board during the year ended December 31, 2023. No director or executive officer receives pension or retirement benefits from us.
Communications Between Shareholders and the Board of Directors
The Board welcomes communications from our shareholders. Shareholders may send communications to the Board, or to any particular director, to the following address: c/o CĪON Investment Corporation, 100 Park Avenue, 25th Floor, New York, NY 10017. Shareholders should indicate clearly the director or directors to whom the communication is being sent so that each communication may be forwarded directly to the appropriate director(s).
Code of Business Conduct
We have adopted a code of business conduct pursuant to Rule 17j-1 promulgated under the 1940 Act, which applies to, among others, our officers, including our Co-Chief Executive Officers and our Chief Financial Officer, as well as the members of the Board. Our code of business conduct can be accessed via our website at www.cionbdc.com. We intend to disclose any amendments to or waivers of required provisions of the code of business conduct on Form 8-K or on our website.
Practice and Policies Regarding Personal Trading and Hedging of Equity
We have also established a policy designed to prohibit the officers, directors, and certain employees of CIM and its affiliates from purchasing or selling our shares while in possession of material nonpublic information, or otherwise using such information for their personal benefit or in any manner that would violate applicable laws and regulations. The policy also prohibits all directors and officers from engaging in hedging or monetization transactions or similar arrangements with respect to our securities without prior approval of our chief compliance officer.
Corporate Governance Guidelines
We have adopted corporate governance guidelines pursuant to Section 303A.09 of the NYSE Listed Company Manual, which can be accessed via our website at www.cionbdc.com.
Section 16 Reporting
Based on publicly available information, we are not aware of any director, officer, beneficial owner of more than ten percent of any class of our equity securities registered pursuant to Section 12 of the Exchange Act, or any other person subject to Section 16 of the Exchange Act with respect to us, who failed to file a required form or failed to file their forms on a timely basis.
Item 11. Executive Compensation
Compensation Discussion and Analysis
Our executive officers do not receive any direct compensation from us. We do not currently have any employees and do not expect to have any employees. Services necessary for our business are provided by individuals who are officers of CIM or by individuals who were contracted by CIM to work on our behalf pursuant to the terms of the investment advisory agreement or administration agreement. Each of our executive officers is an officer of CIM, and the day-to-day investment operations and administration of our portfolio are managed by CIM. In addition, we reimburse CIM for our allocable portion of expenses incurred by CIM in performing its obligations under the administration agreement, including the allocable portion of the cost of our officers and their respective staffs determined under the administration agreement.
The investment advisory agreement and the administration agreement each provides that CIM and its officers, directors, controlling persons and any other person or entity affiliated with them acting as our agent shall be entitled to indemnification (including reasonable attorneys’ fees and amounts reasonably paid in settlement) for any liability or loss suffered by CIM or such other person, and CIM and such other person shall be held harmless for any loss or liability suffered by us, if (i) CIM has determined, in good faith, that the course of conduct which caused the loss or liability was in our best interests, (ii) CIM or such other person was acting on behalf of or performing services for us, (iii) the liability or loss suffered was not the result of willful malfeasance, bad faith or gross negligence by CIM or an affiliate thereof acting as our agent, and (iv) the indemnification or agreement to hold CIM or such other person harmless is only recoverable out of our net assets and not from our shareholders.
Item 12. Security Ownership of Certain Beneficial Owners and Management and Related Shareholder Matters
The following table sets forth, as of March 6, 2024, the beneficial ownership of our executive officers and directors, each person known to us to beneficially own 5% or more of our outstanding shares, and all of our executive officers and directors as a group.
Beneficial ownership is determined in accordance with the rules of the SEC and includes voting or investment power with respect to the securities. Ownership information for those persons who beneficially own 5% or more of our shares is based upon filings by such persons with the SEC, information furnished by our transfer agent and other information obtained from such persons, if available.
Unless otherwise indicated, we believe that each beneficial owner set forth in the table has sole voting and investment power and has the same address as us. Our address is 100 Park Avenue, 25th Floor, New York, NY 10017.
| | | | | | | | | | | | | | | | | | | | | | | | | | |
| Name and Address of Beneficial Owner | | Number of Shares Owned Beneficially(1) | | Percentage of Class(2) |
| Interested Directors: | | | | | | | | |
Mark Gatto(3) | | | 42,204.39 | | | | * | |
Michael A. Reisner(4) | | | 43,284.38 | | | | * | |
| Independent Directors: | | | | | | | | |
Robert A. Breakstone(5) | | | 10,201.00 | | | | * | |
Peter I. Finlay(6) | | | 2,300.00 | | | | * | |
Aron I. Schwartz(7) | | | 2,000.00 | | | | * | |
Earl V. Hedin(8) | | | 6,153.42 | | | | * | |
| Catherine K. Choi | | | 2,000.00 | | | | * | |
| Edward J. Estrada | | | 3,695.00 | | | | * | |
| Executive Officers: | | | | | | | | |
Keith S. Franz(9) | | | 75,608.50 | | | | * | |
Gregg A. Bresner(10) | | | 46,099.00 | | | | * | |
Stephen Roman(11) | | | 8,436.25 | | | | * | |
Eric A. Pinero(12) | | | 6,485.85 | | | | * | |
| Charlie Arestia | | | None | | | | None | |
| All Executive Officers and Directors as a group (13 persons) | | | 248,467.79 | | | | * | |
* Less than 1%.
(1)Beneficial ownership has been determined in accordance with Rule 13d-3 under the Exchange Act.
(2)Based on a total of 53,844,131 shares outstanding on March 6, 2024.
(3)Mr. Gatto is the record holder of 10,905 shares, and CIG is the record holder of 62,598.77 shares that includes 5,932.67 shares acquired under our distribution reinvestment plan. Messrs. Gatto and Reisner control CIG and, as a result, may be deemed to be the indirect beneficial owners of the shares held by CIG. As permitted by Rule 16a-1(a)(4) under the Exchange Act, Mr. Gatto disclaims beneficial ownership of the shares held by CIG except to the extent of his pecuniary interest therein.
(4)Mr. Reisner is the record holder of 11,985 shares, and CIG is the record holder of 62,598.77 shares that includes 5,932.67 shares acquired under our distribution reinvestment plan. Messrs. Gatto and Reisner control CIG and, as a result, may be deemed to be the indirect beneficial owners of the shares held by CIG. As permitted by Rule 16a-1(a)(4) under the Exchange Act, Mr. Reisner disclaims beneficial ownership of the shares held by CIG except to the extent of his pecuniary interest therein.
(5)Includes 1,806.00 shares acquired under our distribution reinvestment plan. An investment retirement account is the record holder of these shares. Mr. Breakstone is the indirect beneficial owner with sole voting and investment power with respect to the shares held by the investment retirement account.
(6)A self-employed pension plan is the record holder of these shares. Mr Finlay is the indirect beneficial owner with sole voting and investment power with respect to the shares held by the self-employed pension plan.
(7)An investment retirement account is the record holder of these shares. Mr. Schwartz is the indirect beneficial owner with sole voting and investment power with respect to the shares held by the investment retirement account.
(8)Includes 2,302.55 shares acquired under our distribution reinvestment plan. An investment retirement account is the record holder of these shares. Mr. Hedin is the indirect beneficial owner with sole voting and investment power with respect to the shares held by the investment retirement account.
(9)Mr. Franz is the record holder of 72,360.01 shares, and an investment retirement account is the record holder of 3,248.49 shares that includes 748.49 shares acquired under our distribution reinvestment plan. Mr. Franz is the indirect beneficial owner with sole voting and investment power with respect to the shares held by the investment retirement account.
(10)Mr. Bresner is the record holder of 38,599 shares and certain investment retirement accounts are the record holder of 7,500 shares. Mr. Bresner is the indirect beneficial owner with sole voting and investment power with respect to the shares held by the investment retirement accounts.
(11)Includes 1,336.25 shares acquired under our distribution reinvestment plan.
(12)Includes 915.85 shares acquired under our distribution reinvestment plan.
DOLLAR RANGE OF SECURITIES BENEFICIALLY OWNED BY DIRECTORS
The following table sets forth, as of March 6, 2024, the dollar range of our equity securities that are beneficially owned by each of our directors.
| | | | | | | | |
| Name of Director | | Dollar Range of Equity Securities Beneficially Owned in the Company(1)(2)(3) |
| Independent Directors: | | |
| Robert A. Breakstone | | $100,001 – $500,000 |
| Peter I. Finlay | | $10,001 – $50,000 |
| Aron I. Schwartz | | $10,001 – $50,000 |
| Earl V. Hedin | | $50,001 – $100,000 |
| Catherine K. Choi | | $10,001 – $50,000 |
| Edward J. Estrada | | $10,001 – $50,000 |
| Interested Directors: | | |
| Mark Gatto | | $100,001 – $500,000 |
| Michael A. Reisner | | $100,001 – $500,000 |
(1)Beneficial ownership determined in accordance with Rule 16a-1(a)(2) under the Exchange Act.
(2)The dollar range of equity securities beneficially owned in us is based on the closing price for our common stock of $10.88 on March 6, 2024 on the NYSE.
(3)The dollar range of equity securities beneficially owned are: None, $1—$10,000, $10,001—$50,000, $50,001—$100,000, $100,001—$500,000, $500,001—$1,000,000, or over $1,000,000.
Item 13. Certain Relationships and Related Transactions, and Director Independence
We have procedures in place for the review, approval and monitoring of transactions involving us and certain persons related to us. For example, we have a code of business conduct that generally prohibits any employee, officer or director from engaging in any transaction where there is a conflict between such individual’s personal interest and our interests. Waivers to the code of business conduct can generally only be obtained from the Chief Compliance Officer, the Co-Chairmen of the Board or the Chairman of the audit committee of the Board and are publicly disclosed as required by applicable law and regulations. In addition, the audit committee reviews all related person transactions for potential conflict of interest situations on an ongoing basis in accordance with our code of ethics, code of business conduct and other applicable policies and procedures, and all such transactions are approved or ratified by the audit committee as set forth in the audit committee charter.
Messrs. Gatto and Reisner, our Co-Chairmen and Co-Chief Executive Officers, also serve as Co-Chief Executive Officers of CIM. In addition, Messrs. Gatto and Reisner each directly and indirectly own approximately 38% of CIG’s ownership of CIM.
We have entered into an investment advisory agreement with CIM. Pursuant to the investment advisory agreement, we pay CIM a base management fee and an incentive fee. We have also entered into an administration agreement with CIM pursuant to which we reimburse CIM for administrative expenses it incurs on our behalf.
On January 1, 2019, we entered into a servicing agreement with CIM’s affiliate, Apollo Investment Administration, L.P., or AIA, pursuant to which AIA from time to time furnishes us with administrative services including, but not limited to, loan and high yield trading services, trade and settlement support, and supplementary investment valuation information. AIA is reimbursed for administrative expenses it incurs on our behalf in performing its obligations, provided that such reimbursement is reasonable, and costs and expenses incurred are documented. The servicing agreement may be terminated at any time, without the payment of any penalty, by either party, upon 60 days' written notice to the other party.
Our executive officers, certain of our directors and certain other finance professionals of CION Investments also serve as executives of CIM and officers of our company and Messrs. Gatto and Reisner are directors of CION Securities, LLC, the dealer manager for the offering of our shares, which ended on January 25, 2019. In addition, our executive officers and directors and the members of CIM and members of the investment committee serve or may serve as officers, directors or principals of entities that operate in the same, or related, line of business as we do or of investment funds, accounts or other investment vehicles managed by our affiliates. These investment funds, accounts or other investment vehicles may have investment objectives similar to our investment objective. We may compete with entities managed by CIM and its affiliates for capital and investment opportunities. As a result, we may not be given the opportunity to participate in certain investments made by investment funds, accounts or other investment vehicles managed by CIM or its affiliates or by members of the investment committee. However, to fulfill its fiduciary duties to each of its clients, CIM intends to allocate investment opportunities in a manner that is fair and equitable over time and is consistent with CIM’s allocation policy, investment objective and strategies so that we are not disadvantaged in relation to any other client. CIM has agreed with the Board that allocations among us and other investment funds affiliated with CIM will be made based on capital available for investment in the asset class being allocated. We expect that our available capital for investments will be determined based on the amount of cash on-hand, existing commitments and reserves, if any, and the targeted leverage level and targeted asset mix and other investment policies and restrictions set by the Board or as imposed by applicable laws, rules, regulations or interpretations.
Policies and Procedures for Managing Conflicts
CIM and its affiliates have both subjective and objective procedures and policies in place designed to manage the potential conflicts of interest between CIM’s fiduciary obligations to us and its similar fiduciary obligations to other clients. For example, such policies and procedures may be designed so that, when appropriate, certain investment opportunities may be allocated on an alternating basis that is fair and equitable among us and their other clients. An investment opportunity that is suitable for multiple clients of CIM and its affiliates may not be capable of being shared among some or all of such clients and affiliates due to the limited scale of the opportunity or other factors, including regulatory restrictions imposed by the 1940 Act. There can be no assurance that CIM’s or its affiliates’ efforts to allocate any particular investment opportunity fairly among all clients for whom such opportunity is appropriate will result in an allocation of all or part of such opportunity to us. Not all conflicts of interest can be expected to be resolved in our favor.
The principals of CIM have managed and will continue to manage investment vehicles with similar or overlapping investment strategies. In order to address these issues, CIM has put in place an investment allocation policy that addresses the co-investment restrictions set forth under the 1940 Act and seeks to ensure the equitable allocation of investment opportunities when we are able to co-invest with other accounts managed by CIM and affiliated entities. When we engage in such permitted co-investments, we will do so in a manner consistent with our exemptive relief from the SEC and with CIM’s allocation policy. Under this allocation policy, a fixed percentage of each opportunity, which may vary based on asset class and from time to time, will be offered to us and similar eligible accounts, as periodically determined by CIM and approved by the Board, including all of the independent directors. The allocation policy further provides that allocations among us and other accounts will generally be made pro rata based on each account’s capital available for investment, as determined, in our case, by the Board, including the independent directors. It is our policy to base our determinations as to the amount of capital available for investment on such factors as: the amount of cash on-hand, existing commitments and reserves, if any, the targeted leverage level, the targeted asset mix and other investment policies and restrictions set by the Board or imposed by applicable laws, rules, regulations or interpretations. We expect that these determinations will be made similarly for other accounts. In situations where co-investment with other entities managed by CIM or its affiliates is not permitted or appropriate, such as when there is an opportunity to invest in different securities of the same issuer, CIM will need to decide whether we or such other entity or entities will proceed with the investment. CIM will make these determinations based on its policies and procedures, which generally require that such opportunities be offered to eligible accounts in a manner that will be fair and equitable over time.
Share Repurchase Policy
On September 15, 2021, our board of directors, including the independent directors, approved a post- Listing share repurchase policy authorizing us to repurchase up to $50 million of our outstanding common stock after the Listing. On June 24, 2022, our board of directors, including the independent directors, increased the amount of shares of our common stock that may be repurchased under the post-Listing share repurchase policy by $10 million to up to an aggregate of $60 million. Under the post-Listing share repurchase policy, we may purchase shares of our common stock through various means such as open market transactions, including block purchases, and privately negotiated transactions. The number of shares repurchased and the timing, manner, price and amount of any repurchases will be determined at our discretion. Factors include, but are not limited to, share price, trading volume and general market conditions, along with our general business conditions. The policy may be suspended or discontinued at any time and does not obligate us to acquire any specific number of shares of our common stock.
On August 29, 2023, as part of the post-Listing share repurchase policy, we entered into a new trading plan with an independent broker, Wells Fargo Securities, LLC, or Wells Fargo, in accordance with Rule 10b5-1 of the Exchange Act based in part on historical trading data with respect to our shares. The 10b5-1 trading plan permits common stock to be repurchased at a time that we might otherwise be precluded from doing so under insider trading laws or self-imposed trading restrictions. The 10b5-1 trading plan expires on August 29, 2024 and is subject to price, market volume and timing restrictions.
Competition
Certain officers of CIM are simultaneously providing investment management services to certain funds managed by its affiliates. CIM may determine that it is appropriate for us and one or more other investment accounts managed by CIM or any of its affiliates to participate in an investment opportunity. As a BDC, we are subject to certain regulatory restrictions in negotiating or investing in certain investments with entities with which we may be prohibited from doing so under the 1940 Act, such as CIM and its affiliates, unless we obtain an exemptive order from the SEC or co-invest alongside such affiliates in accordance with existing regulatory guidance. On August 30, 2022, we, CIM and certain of our affiliates were granted the Order by the SEC for us to co-invest with other funds managed by CIM or certain affiliates in a manner consistent with our investment objectives, positions, policies, strategies and restrictions as well as regulatory requirements and other pertinent factors. Even though we were granted the Order by the SEC, CIM’s investment committee may determine that we should not participate in a co-investment transaction.
Affiliated Dealer Manager
The dealer manager is an affiliate of CIM. This relationship may have created conflicts in connection with the dealer manager’s due diligence obligations under the federal securities laws. Although the dealer manager examined the information in the prospectus for accuracy and completeness, due to its affiliation with CIM, no independent review of us was made in connection with the distribution of shares in the offering, which ended on January 25, 2019.
Co-Investment Opportunities
As a BDC, we are subject to certain regulatory restrictions in negotiating or investing in certain investments with entities with which we may be prohibited from doing so under the 1940 Act, such as CIM and its affiliates, unless we obtain an exemptive order from the SEC, which Order was issued by the SEC on August 30, 2022.
Pursuant to such Order, we generally are permitted to co-invest with certain of our affiliates if a “required majority” (as defined in Section 57(o) of the 1940 Act) of the independent directors make certain conclusions in connection with a co-investment transaction, including that (1) the terms of the proposed transaction, including the consideration to be paid, are reasonable and fair to us and our shareholders and do not involve overreaching of us or our shareholders on the part of any person concerned, (2) the transaction is consistent with the interests of our shareholders and is consistent with our investment objective and strategies, (3) the investment by our affiliates would not disadvantage us, and our participation would not be on a basis different from or less advantageous than that on which our affiliates are investing, and (4) the proposed investment by us would not benefit CIM or its affiliates or any affiliated person of any of them (other than the parties to the transaction), except to the extent permitted by the Order and applicable law, including the limitations set forth in Section 57(k) of the 1940 Act. In addition, the Order permits us to co-invest in our existing portfolio companies with certain affiliates that are private funds, even if such private funds did not have an investment in such existing portfolio company. Even though we were granted the Order by the SEC, CIM’s investment committee may determine that we should not participate in a co-investment transaction.
Material Non-Public Information
Our senior management, members of CIM’s investment committee and other investment professionals from CIM may serve as directors of, or in a similar capacity with, companies in which we invest or in which we are considering making an investment. Through these and other relationships with a company, these individuals may obtain material non-public information that might restrict our ability to buy or sell the securities of such company under the policies of the company or applicable law.
Item 14. Principal Accountant Fees and Services
RSM US LLP, or RSM, has served as our independent registered public accounting firm since March 26, 2019 and has been selected to continue serving as our independent registered public accounting firm for the fiscal year ending December 31, 2024. We know of no direct financial or material indirect financial interest of RSM in us.
Fees
RSM has acted as our independent registered public accounting firm for the fiscal years ended December 31, 2023, 2022, 2021, 2020 and 2019. Set forth in the table below are audit fees and non-audit related fees billed to us by RSM for professional services performed for our fiscal years ended December 31, 2023 and 2022.
| | | | | | | | | | | | | | | | | | | | | | | | | | | | | | | | | | | | | | | | | | | | | | | | | | |
| Fiscal Year | | Audit Fees* | | Audit-Related Fees** | | Tax Fees*** | | All Other Fees**** |
| 2023 | | $959,233 | | | $ | — | | | $ | 24,350 | | | $ | — | |
| 2022 | | $858,610 | | | $ | — | | | $ | 22,500 | | | $ | — | |
| | | | | | | | | | | | | | | |
| | | | | | | | | | | | | | |
| | | | | | | | |
| * | “Audit Fees” consist of fees billed to us by RSM for professional services rendered for the audit of our year-end financial statements. These fees billed include fees related to RSM's review of our debt offering document. |
| ** | “Audit-Related Fees” are those fees billed to us by RSM relating to audit services that are reasonably related to the performance of the audit or review of our financial statements and are not reported under “Audit Fees.” |
| *** | “Tax Fees” are those fees billed to us by RSM in connection with tax compliance services, including primarily the review of our income tax returns. |
| **** | “All Other Fees” are those fees billed to us by RSM in connection with permitted non-audit services. |
Our audit committee reviews, negotiates and approves in advance the scope of work, any related engagement letter and the fees to be charged by the independent registered public accounting firm for audit services and permitted non-audit services for us. All of the audit and non-audit services described above for which RSM billed us for the fiscal years ended December 31, 2023 and 2022 were pre-approved by the audit committee.
Audit Committee Report(1)
As part of its oversight of the financial statements of CĪON Investment Corporation, or the Company, the Audit Committee reviewed and discussed with both management and RSM US LLP, the Company’s independent registered public accounting firm, the Company’s consolidated financial statements to be filed with the SEC for the fiscal year ended December 31, 2023. Management advised the Audit Committee that all financial statements were prepared in accordance with U.S. generally accepted accounting principles, or GAAP, and reviewed significant accounting issues with the Audit Committee. The Audit Committee also discussed with RSM US LLP the matters required to be discussed by Statement on Auditing Standards No. 61, as amended (AICPA, Professional Standards, Vol. 1 AU section 380), as adopted by the Public Company Accounting Oversight Board in Rule 3200T, and by the Auditing Standards Board of the American Institute of Certified Public Accountants.
The Audit Committee has established a pre-approval policy that describes the permitted audit, audit-related, tax, and other services to be provided by RSM US LLP. Pursuant to the policy, the Audit Committee pre-approves the audit and non-audit services performed by RSM US LLP in order to assure that the provision of such service does not impair such firm’s independence.
Any requests for audit, audit-related, tax, and other services that have not received general pre-approval must be submitted to the Audit Committee for specific pre-approval in accordance with its pre-approval policy, irrespective of the amount, and cannot commence until such approval has been granted. Normally, pre-approval is provided at regularly scheduled meetings of the Audit Committee. However, the Audit Committee may delegate pre-approval authority to one or more of its members. The member or members to whom such authority is delegated must report any pre-approval decisions to the Audit Committee at its next scheduled meeting. The Audit Committee does not delegate its responsibilities to pre-approve services performed by RSM US LLP to management.
The Audit Committee received and reviewed the written disclosures and the letters from RSM US LLP required by the applicable requirements of the Public Company Accounting Oversight Board regarding RSM US LLP’s communications with the Audit Committee concerning independence and has discussed with RSM US LLP its independence. The Audit Committee has reviewed the audit fees paid by the Company to RSM US LLP. It has also reviewed non-audit services and fees to assure compliance with the Company’s and the Audit Committee’s policies restricting RSM US LLP from performing services that might impair its independence.
Based on the reviews and discussions referred to above, the Audit Committee recommended to the Board that the audited consolidated financial statements of the Company as of and for the years ended December 31, 2023, 2022 and 2021 be included in the Company’s Annual Report on Form 10-K for the fiscal year ended December 31, 2023 for filing with the SEC.
March 12, 2024
The Audit Committee
Aron I. Schwartz, Chair
Robert A. Breakstone
Peter I. Finlay
Earl V. Hedin
Catherine K. Choi
Edward J. Estrada
_______________________
(1) The material in this report is not “soliciting material,” is not deemed “filed” with the SEC, and is not to be incorporated by reference into any filing of the Company under the Exchange Act, whether made before or after the date hereof and irrespective of any general incorporation language in any such filing.
PART IV
Item 15. Exhibits and Financial Statement Schedules
(a) 1. Financial Statements
See the index to consolidated financial statements included as Item 8 to this Annual Report on Form 10-K hereof.
2. Financial Statement Schedules
Schedules not listed above have been omitted because they are not applicable or the information required to be set forth therein is included in the consolidated financial statements or notes thereto.
3. Exhibits
The following is a list of all exhibits filed as a part of this Annual Report on Form 10-K, including those incorporated by reference:
| | | | | | | | |
Exhibit Number | | Description of Document |
| 2.1 | | |
| 3.1 | | |
| 3.2 | | |
| 3.3 | | |
| | |
| 4.1 | | |
| 4.2 | | |
| 4.3 | | |
| 10.1 | | |
| | |
| 10.2 | | |
| 10.3 | | |
| | |
| | |
| 10.4 | | |
| 10.5 | | |
| 10.6 | | |
| 10.7 | | |
| 10.8 | | |
| | | | | | | | |
Exhibit Number | | Description of Document |
| | | |
| | |
| | |
| | |
| | |
| | |
| | |
| | |
| | |
| 10.9 | | Contribution Agreement, dated as of May 19, 2017, by and among UBS AG, London Branch, Murray Hill Funding II, LLC, U.S. Bank National Association, Murray Hill Funding, LLC and CION Investment Management, LLC (Incorporated by reference to Exhibit 10.4 to Registrant’s Current Report on Form 8-K filed with the SEC on May 25, 2017 (File No. 814-00941)). |
| 10.10 | | |
| 10.11 | | |
| 10.12 | | |
| 10.13 | | |
| | |
| | |
| | |
| 10.14 | | |
| | |
| | |
| | |
| | |
| 10.15 | | |
| 10.16 | | |
| 10.17 | | |
| | |
| 10.18 | | |
| 10.19 | | |
| 10.20 | | |
| | |
| 10.21 | | First Amendment to Third Amended and Restated Loan and Security Agreement, dated as of March 28, 2022, by and among 34th Street Funding, LLC, JPMorgan Chase Bank, National Association, U.S. Bank Trust Company, National Association, U.S. Bank National Association and CION Investment Management, LLC (Incorporated by reference to Exhibit 10.1 to Registrant’s Current Report on Form 8-K filed with the SEC on March 29, 2022 (File No. 814-00941)). |
| 10.22 | | |
| 10.23 | | |
| 10.24 | | Second Amendment to Third Amended and Restated Loan and Security Agreement, dated as of May 15, 2023, by and among 34th Street Funding, LLC, JPMorgan Chase Bank, National Association, U.S. Bank Trust Company, National Association, U.S. Bank National Association and CION Investment Management, LLC (Incorporated by reference to Exhibit 10.1 to Registrant’s Current Report on Form 8-K filed with the SEC on May 18, 2023 (File No. 814-00941)). |
| 10.25 | | |
| 10.26 | | |
| | |
| | |
| | |
| | |
| | |
| | |
| | |
| | | | | | | | |
Exhibit Number | | Description of Document |
| | | |
| | |
| | |
| | |
| | |
| | |
| | |
| | |
| | |
| | |
| | |
| | |
| | |
| | |
| | |
| | |
| | |
| | |
| | |
| | |
| | |
| | |
| | |
| | |
| | |
| | |
| | |
| | |
| | |
| | |
| | |
| | |
| 10.27 | | |
| 14.1 | | |
| 21.1 | | |
| 23.1 | | |
| 31.1 | | |
| 31.2 | | |
| 31.3 | | |
| 32.1 | | |
| 32.2 | | |
| 32.3 | | |
| 97.1 | | |
| 101.INS | | Inline XBRL Instance Document – the instance document does not appear in the Interactive Data File because XBRL tags are embedded within the Inline XBRL document. |
| 101.SCH | | Inline XBRL Taxonomy Extension Schema Document. |
| 101.CAL | | Inline XBRL Taxonomy Extension Calculation Linkbase Document. |
| 101.DEF | | Inline XBRL Taxonomy Extension Definition Linkbase Document. |
| 101.LAB | | Inline XBRL Taxonomy Extension Label Linkbase Document. |
| 101.PRE | | Inline XBRL Taxonomy Extension Presentation Linkbase Document. |
| 104 | | Cover Page Interactive Data File (formatted as inline XBRL and contained in Exhibit 101). |
* Filed herewith.
Item 16. Form 10-K Summary
None.
SIGNATURES
Pursuant to the requirements of Section 13 or 15(d) of the Securities Exchange Act of 1934, the registrant has duly caused this report to be signed on its behalf by the undersigned, thereunto duly authorized.
Date: March 13, 2024
CĪON Investment Corporation
(Registrant)
By: /s/ Michael A. Reisner
Michael A. Reisner
Co-Chief Executive Officer
By: /s/ Mark Gatto
Mark Gatto
Co-Chief Executive Officer
Pursuant to the requirements of the Securities Exchange Act of 1934, this report has been signed below by the following persons on behalf of the registrant and in the capacities and on the dates indicated.
Date: March 13, 2024
CĪON Investment Corporation
(Registrant)
By: /s/ Michael A. Reisner
Michael A. Reisner
Co-Chief Executive Officer and Director
(Principal Executive Officer)
By: /s/ Mark Gatto
Mark Gatto
Co-Chief Executive Officer and Director
(Principal Executive Officer)
By: /s/ Keith S. Franz
Keith S. Franz
Chief Financial Officer
(Principal Financial and Accounting Officer)
By: /s/ Robert A. Breakstone
Robert A. Breakstone
Director
By: /s/ Peter I. Finlay
Peter I. Finlay
Director
By: /s/ Aron I. Schwartz
Aron I. Schwartz
Director
By: /s/ Earl V. Hedin
Earl V. Hedin
Director
By: /s/ Catherine K. Choi
Catherine K. Choi
Director
By: /s/ Edward J. Estrada
Edward J. Estrada
Director