Exhibit 99.1

Global Medical REIT Announces Fourth Quarter and Year-End 2022 Financial Results
Acquires $149 Million in Medical Real Estate During 2022
Bethesda, MD – February 28, 2023 – (BUSINESS WIRE) – Global Medical REIT Inc. (NYSE: GMRE) (the “Company” or “GMRE”), a net-lease medical office real estate investment trust (REIT) that owns and acquires healthcare facilities and leases those facilities to physician groups and regional and national healthcare systems, today announced financial results for the three and twelve months ended December 31, 2022 and other data.
Jeffrey M. Busch, Chairman, Chief Executive Officer and President stated, “We were able to navigate through a challenging period during 2022 by relying on the quality of our portfolio and the resilience of our tenant base. With the rise in interest rates, we prudently moderated our pace of growth, even as we locked in long term capital at very favorable rates. As we look to the future, we believe we are well-positioned to restart our acquisition activity as cap rate spreads return to an attractive level, and markets normalize. I would like to thank the entire team for their collective efforts and contributions to these results.”
Fourth Quarter 2022 Highlights
| · | Net income attributable to common stockholders was $0.4 million, or $0.01 per diluted share, as compared to $3.8 million, or $0.06 per diluted share, in the comparable prior year period. | |
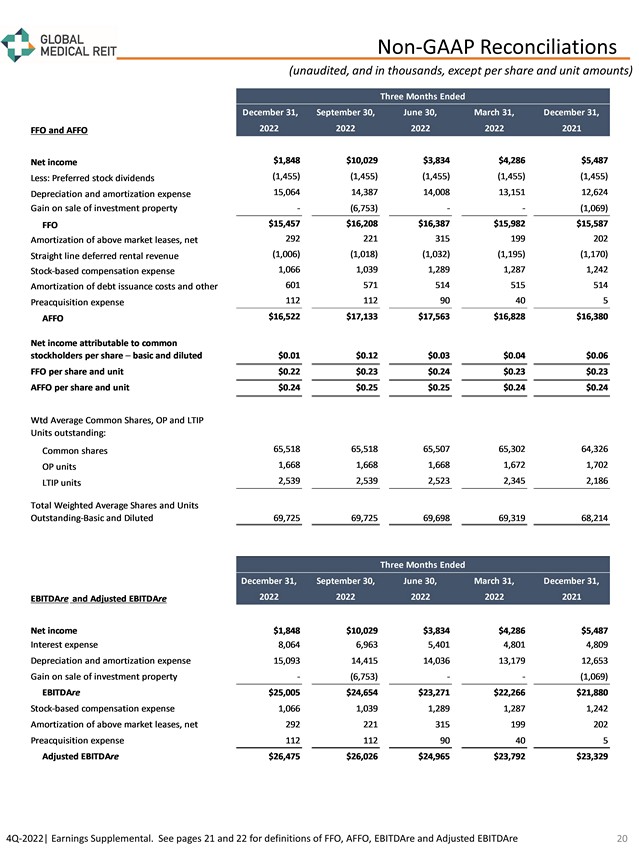
| · | Funds from Operations (“FFO”) of $15.5 million, or $0.22 per share and unit, as compared to $15.6 million, or $0.23 per share and unit, in the comparable prior year period. | |
| · | Adjusted Funds from Operations (“AFFO”) of $16.5 million, or $0.24 per share and unit, as compared to $16.4 million, or $0.24 per share and unit, in the comparable prior year period. | |
| · | Increased total revenue 19.6% year-over-year to $36.3 million, primarily driven by the Company’s acquisition activity since the comparable prior year period. |
Full Year 2022 Highlights
| · | Net income attributable to common stockholders was $13.3 million, or $0.20 per diluted share, as compared to $11.8 million, or $0.19 per diluted share, in the comparable prior year period. | |
| · | FFO of $64.0 million, or $0.92 per share and unit, as compared to $58.2 million, or $0.90 per share and unit, in the comparable prior year period. | |
| · | AFFO of $68.0 million, or $0.98 per share and unit, as compared to $61.4 million, or $0.95 per share and unit, in the comparable prior year period. | |
| · | Increased total revenue 18.4% year-over-year to $137.3 million, primarily driven by the Company’s acquisition activity since the comparable prior year period. | |
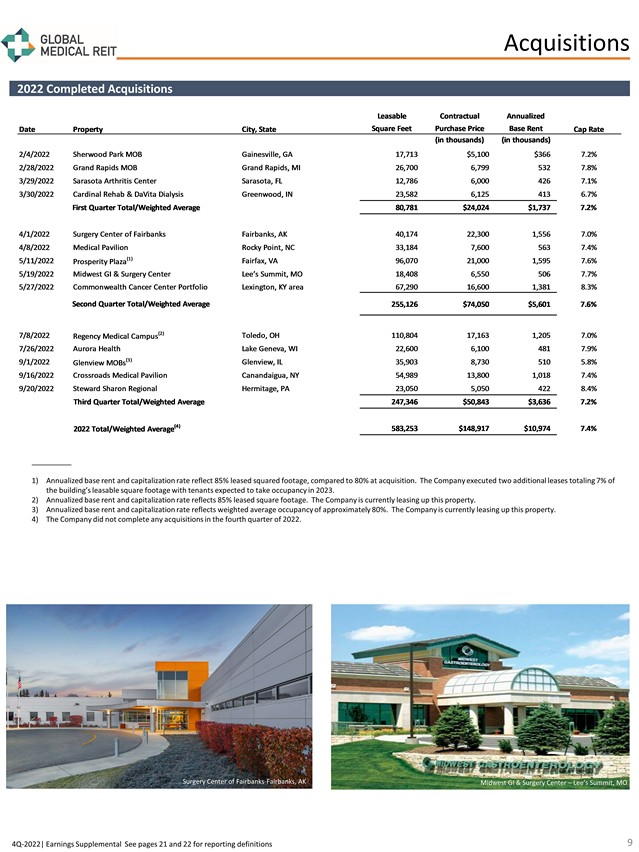
| · | Completed 14 acquisitions encompassing an aggregate 583,253 leasable square feet, for an aggregate purchase price of $148.9 million and a weighted average cap rate of 7.4%. | |
| · | Sold a medical office building located in Germantown, Tennessee, receiving gross proceeds of $17.9 million, resulting in a gain of $6.8 million. | |
| · | Amended credit facility to, among other things: (i) add a new $150 million term loan with a maturity date of February 1, 2028, (ii) extend the maturity of the revolver component of the credit facility from May 2025 to August 2026 with two six-month company-controlled extension options, and (iii) transition all LIBOR-based loans under the credit facility to SOFR-based loans. | |
| · | Entered into interest rate swaps with a notional value of $150 million that fix the SOFR component of the new term loan at 2.54% through its maturity. | |
| · | Generated $10.3 million in gross proceeds from ATM equity issuances at an average offering price of $17.15 per share. |
1
Financial Results
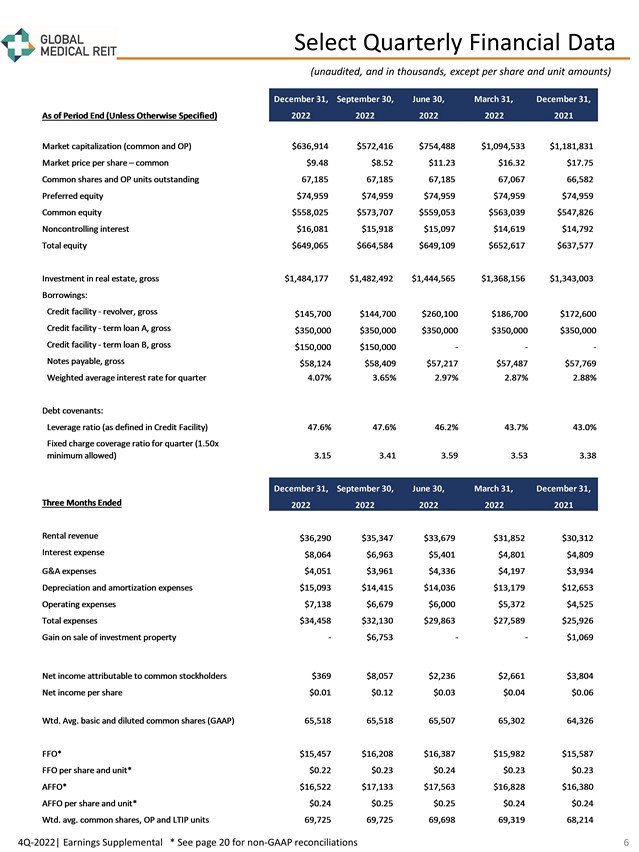
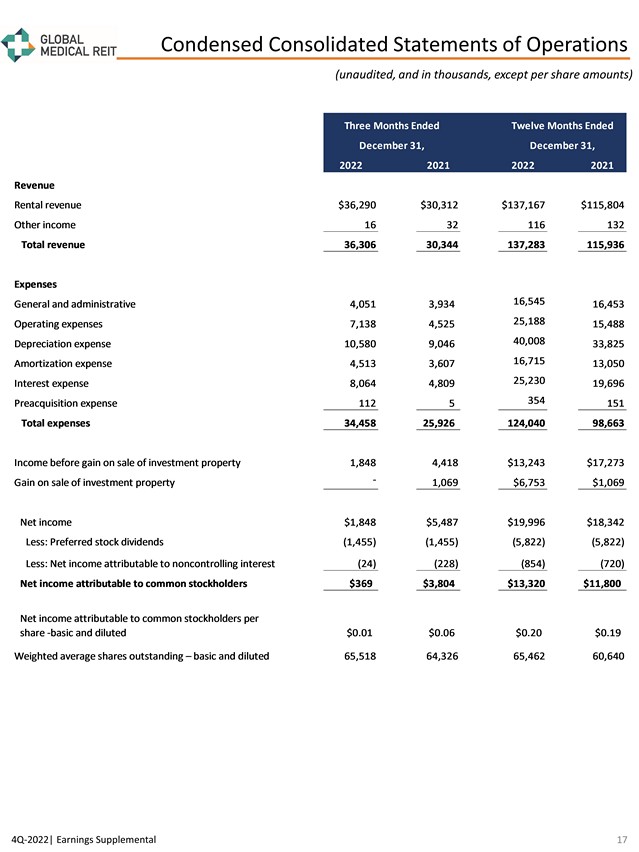
Rental revenue for the fourth quarter 2022 increased 19.7% year-over-year to $36.3 million, reflecting the growth in the Company’s portfolio.
Total expenses for the fourth quarter were $34.5 million, compared to $25.9 million for the comparable prior year period, primarily reflecting higher interest, operating, depreciation, and amortization expenses due to the growth in the Company’s portfolio as well as rising interest rates in 2022.
Interest expense for the fourth quarter was $8.1 million, compared to $4.8 million for the comparable prior year period. This change was primarily the result of increased interest rates during 2022. The Company’s weighted average interest rate on its indebtedness increased from 2.88% in the fourth quarter of 2021 to 4.07% during the fourth quarter of 2022.
Net income attributable to common stockholders for the fourth quarter totaled $0.4 million, or $0.01 per diluted share, compared to $3.8 million, or $0.06 per diluted share, in the comparable prior year period.
The Company reported FFO of $15.5 million, or $0.22 per share and unit, and AFFO of $16.5 million, or $0.24 per share and unit, for the fourth quarter of 2022, which compares to FFO of $15.6 million, or $0.23 per share and unit, and AFFO of $16.4 million, or $0.24 per share and unit, in the comparable prior year period.
Investment Activity
For the full year 2022, the Company completed 14 acquisitions, encompassing an aggregate 583,253 leasable square feet, for an aggregate purchase price of $148.9 million at a weighted average cap rate of 7.4%.
In July 2022, the Company sold its medical office building located in Germantown, Tennessee receiving gross proceeds of $17.9 million, resulting in a gain on sale of $6.8 million.
As of February 28, 2023, the Company had one property under contract to acquire for a purchase price of $6.7 million. This property is currently in the due diligence period and is subject to various closing conditions. Accordingly, the transaction may not close on a timely basis or we may terminate the purchase contract and not close the transaction.
As of February 28, 2023, the Company had two properties under contract to sell for an aggregate sales price of $11.6 million. The buyers are currently in the due diligence periods and the transactions are subject to various closing conditions. Accordingly, the transactions may not close on a timely basis or the buyers may terminate the purchase agreements and not close the transactions.
Portfolio Update
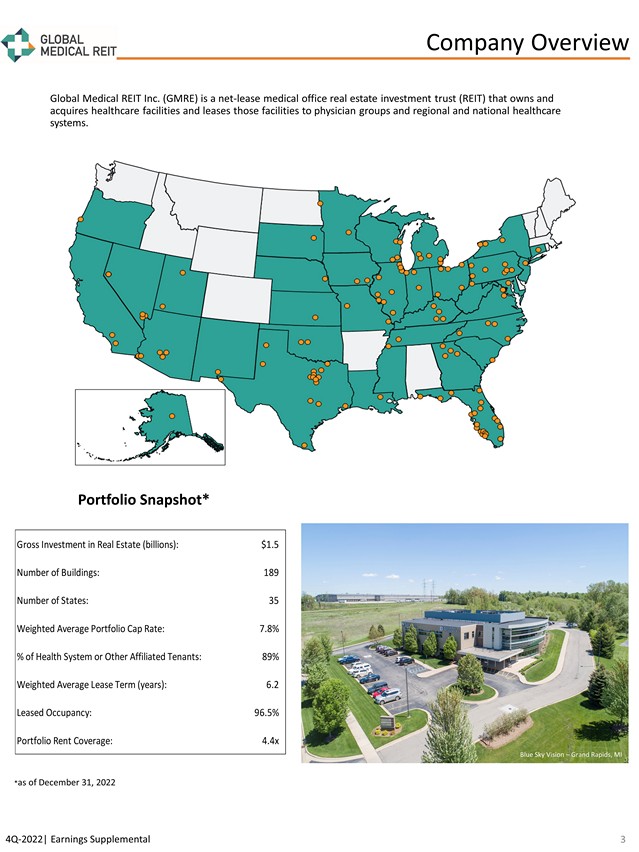
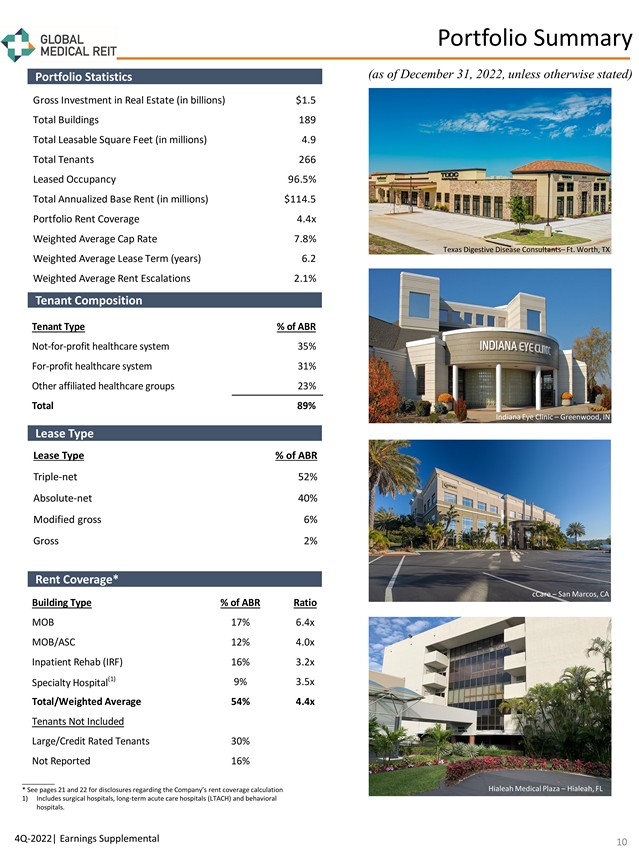
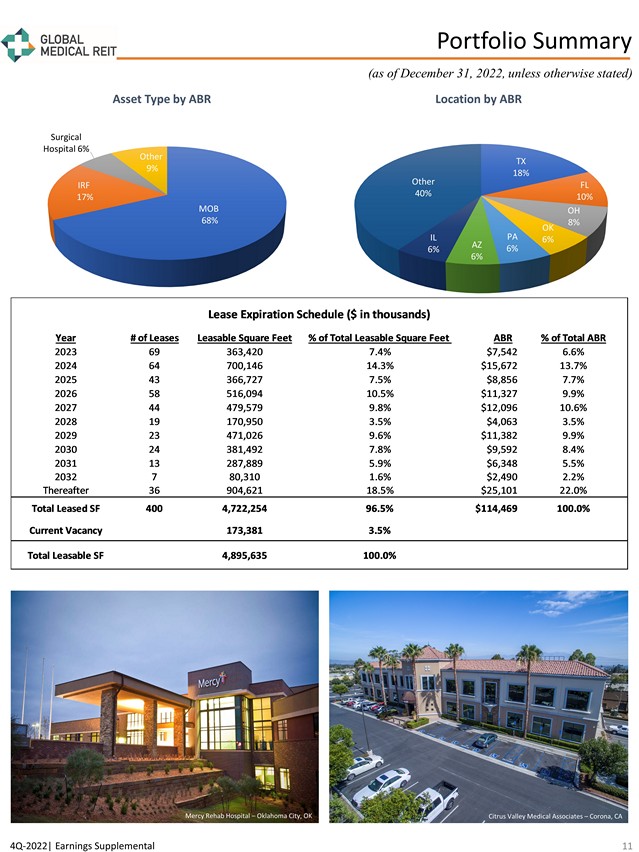
As of December 31, 2022, the Company’s portfolio was 96.5% occupied and comprised of 4.9 million leasable square feet with an annualized base rent of $114.5 million. The weighted average lease term for the Company’s portfolio was 6.2 years with weighted average annual rental escalations of 2.1%, and the Company’s portfolio rent coverage ratio was 4.4 times as of December 31, 2022.
Balance Sheet and Capital
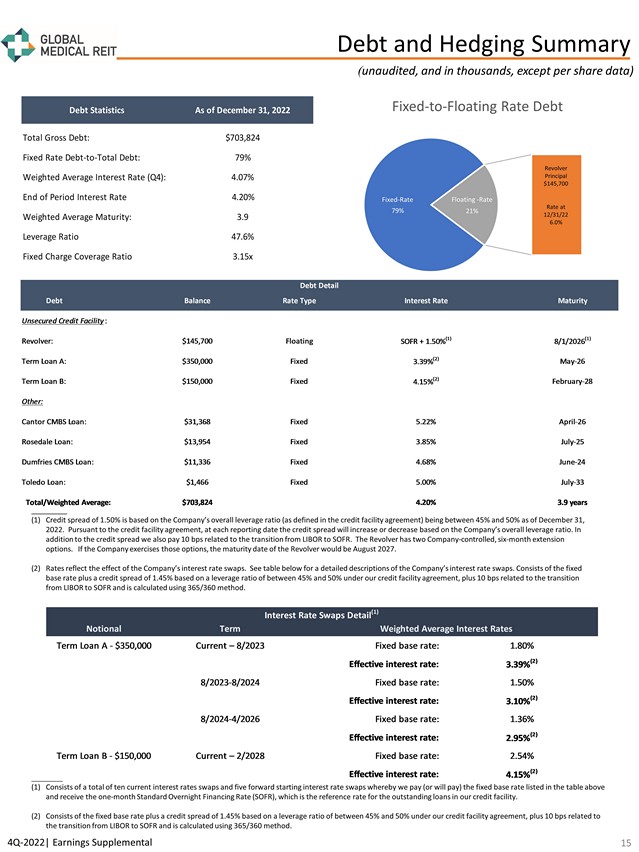
At December 31, 2022, total debt outstanding, including outstanding borrowings on the Company’s credit facility and notes payable (both net of unamortized debt issuance costs), was $694.1 million and the Company’s leverage was 47.6%, which was unchanged compared to September 30, 2022 and up from 43.0% at year-end 2021. As of December 31, 2022, the Company’s total debt carried a weighted average interest rate of 4.20% and a weighted average remaining term of 3.9 years. As of February 28, 2023, the Company’s unutilized borrowing capacity under the Company’s credit facility was $245.0 million.
2
The Company’s fixed debt totaled $558.1 million on a gross basis at December 31, 2022, representing 79% of its total debt, with a weighted average interest rate of 3.75% based on the Company’s interest rate swaps and at current leverage, with a weighted average maturity of 3.8 years. Due to the Company’s forward swap structures, the weighted average interest rate on fixed debt is expected to improve over the next few years. Weighted average interest rates on the Company’s fixed debt are expected to decrease to approximately 3.67% in 2023, 3.50% in 2024, and 3.43% in 2025, based on the Company’s current leverage.
During the year ended December 31, 2022, the Company issued 0.6 million shares of common stock through its ATM program at an average offering price of $17.15 per share, generating gross proceeds of $10.3 million. The Company did not issue any shares under its ATM program during the fourth quarter of 2022.
Dividends
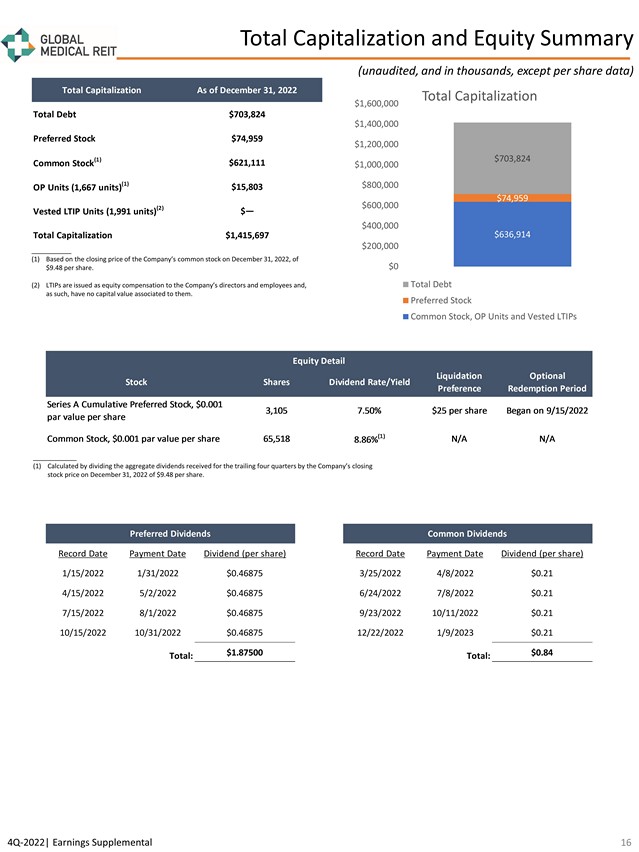
On December 7, 2022, the Board of Directors (the “Board”) declared a $0.21 per share cash dividend to common stockholders and unitholders of record as of December 22, 2022, which was paid on January 9, 2023, representing the Company’s fourth quarter 2022 dividend payment. The Board also declared a $0.46875 per share cash dividend to holders of record as of January 15, 2023 of the Company’s Series A Preferred Stock, which was paid on January 31, 2023. This dividend represented the Company’s quarterly dividend on its Series A Preferred Stock for the period from October 31, 2022 through January 30, 2023.
2023 Annual Meeting
On February 23, 2023, the Board approved the meeting and record dates for the Company’s 2023 Annual Stockholders’ Meeting. The Meeting will be held on Wednesday, May 10, 2023. Stockholders of record as of March 15, 2023 will be eligible to vote at the Meeting.
SUPPLEMENTAL INFORMATION
Details regarding these results can be found in the Company’s supplemental financial package available on the Investor Relations section of the Company’s website at http://investors.globalmedicalreit.com/.
CONFERENCE CALL AND WEBCAST INFORMATION
The Company will host a live webcast and conference call on Wednesday, March 1, 2023 at 9:00 a.m. Eastern Time. The webcast is located on the “Investor Relations” section of the Company’s website at http://investors.globalmedicalreit.com/.
To Participate via Telephone:
Dial in at least five minutes prior to start time and reference Global Medical REIT Inc.
Domestic: 1-877-704-4453
International: 1-201-389-0920
Replay:
An audio replay of the conference call will be posted on the Company’s website.
3
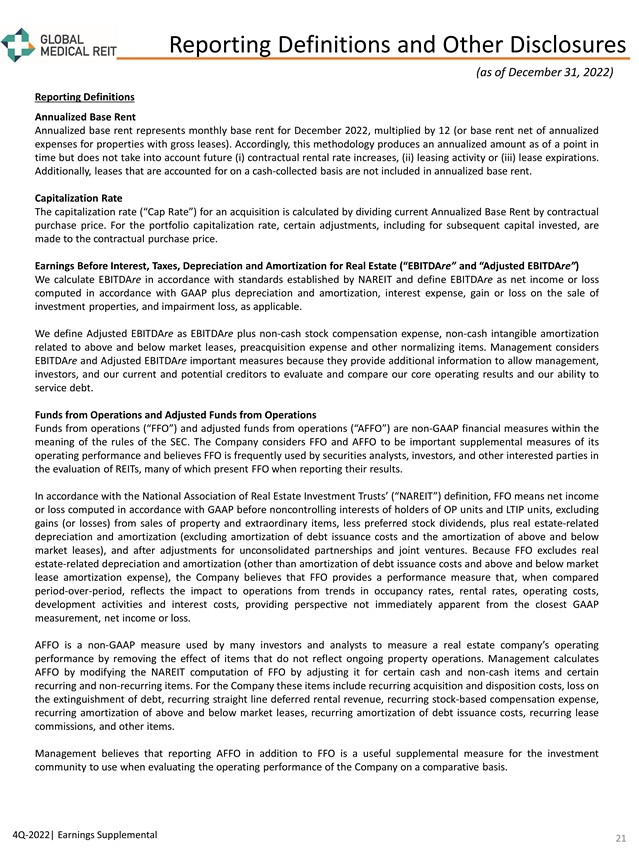
NON-GAAP FINANCIAL MEASURES
General
Management considers certain non-GAAP financial measures to be useful supplemental measures of the Company's operating performance. For the Company, non-GAAP measures consist of Earnings Before Interest, Taxes, Depreciation and Amortization for Real Estate (“EBITDAre” and “Adjusted EBITDAre”), FFO and AFFO. A non-GAAP financial measure is generally defined as one that purports to measure financial performance, financial position or cash flows, but excludes or includes amounts that would not be so adjusted in the most comparable measure determined in accordance with GAAP. The Company reports non-GAAP financial measures because these measures are observed by management to also be among the most predominant measures used by the REIT industry and by industry analysts to evaluate REITs. For these reasons, management deems it appropriate to disclose and discuss these non-GAAP financial measures.
The non-GAAP financial measures presented herein are not necessarily identical to those presented by other real estate companies due to the fact that not all real estate companies use the same definitions. These measures should not be considered as alternatives to net income, as indicators of the Company's financial performance, or as alternatives to cash flow from operating activities as measures of the Company's liquidity, nor are these measures necessarily indicative of sufficient cash flow to fund all of the Company's needs. Management believes that in order to facilitate a clear understanding of the Company's historical consolidated operating results, these measures should be examined in conjunction with net income and cash flows from operations as presented elsewhere herein.
FFO and AFFO
FFO and AFFO are non-GAAP financial measures within the meaning of the rules of the United States Securities and Exchange Commission (“SEC”). The Company considers FFO and AFFO to be important supplemental measures of its operating performance and believes FFO is frequently used by securities analysts, investors, and other interested parties in the evaluation of REITs, many of which present FFO when reporting their results. In accordance with the National Association of Real Estate Investment Trusts’ (“NAREIT”) definition, FFO means net income or loss computed in accordance with GAAP before noncontrolling interests of holders of OP units and LTIP units, excluding gains (or losses) from sales of property and extraordinary items, less preferred stock dividends, plus real estate-related depreciation and amortization (excluding amortization of debt issuance costs and the amortization of above and below market leases), and after adjustments for unconsolidated partnerships and joint ventures. Because FFO excludes real estate-related depreciation and amortization (other than amortization of debt issuance costs and above and below market lease amortization expense), the Company believes that FFO provides a performance measure that, when compared period-over-period, reflects the impact to operations from trends in occupancy rates, rental rates, operating costs, development activities and interest costs, providing perspective not immediately apparent from the closest GAAP measurement, net income or loss.
AFFO is a non-GAAP measure used by many investors and analysts to measure a real estate company’s operating performance by removing the effect of items that do not reflect ongoing property operations. Management calculates AFFO by modifying the NAREIT computation of FFO by adjusting it for certain cash and non-cash items and certain recurring and non-recurring items. For the Company these items include: (a) recurring acquisition and disposition costs, (b) loss on the extinguishment of debt, (c) recurring straight line deferred rental revenue, (d) recurring stock-based compensation expense, (e) recurring amortization of above and below market leases, (f) recurring amortization of debt issuance costs, (g) recurring lease commissions, and (h) other items.
Management believes that reporting AFFO in addition to FFO is a useful supplemental measure for the investment community to use when evaluating the operating performance of the Company on a comparative basis.
EBITDAre and Adjusted EBITDAre
We calculate EBITDAre in accordance with standards established by NAREIT and define EBITDAre as net income or loss computed in accordance with GAAP plus depreciation and amortization, interest expense, gain or loss on the sale of investment properties, and impairment loss, as applicable.
We define Adjusted EBITDAre as EBITDAre plus non-cash stock compensation expense, non-cash intangible amortization related to above and below market leases, preacquisition expense and other normalizing items. Management considers EBITDAre and Adjusted EBITDAre important measures because they provide additional information to allow management, investors, and our current and potential creditors to evaluate and compare our core operating results and our ability to service debt.
4
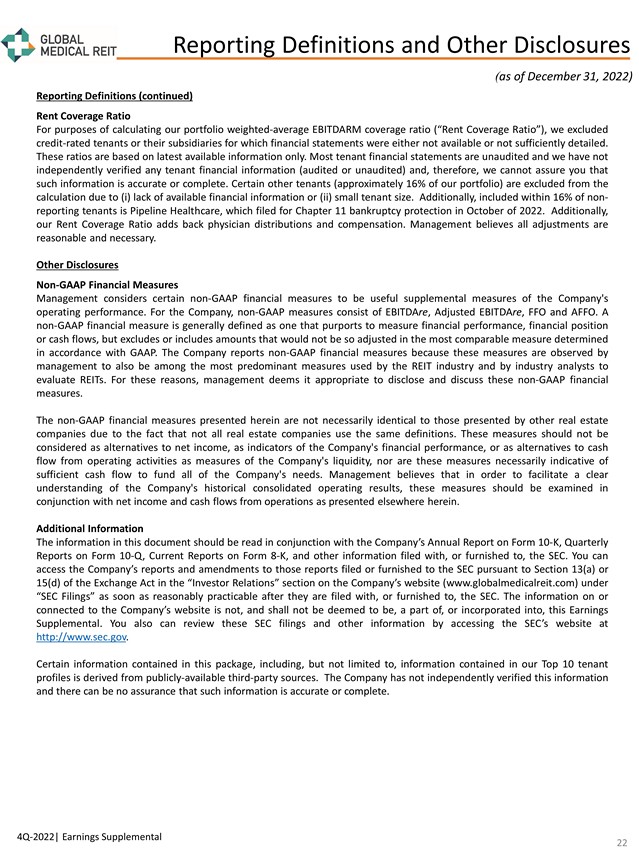
RENT COVERAGE RATIO
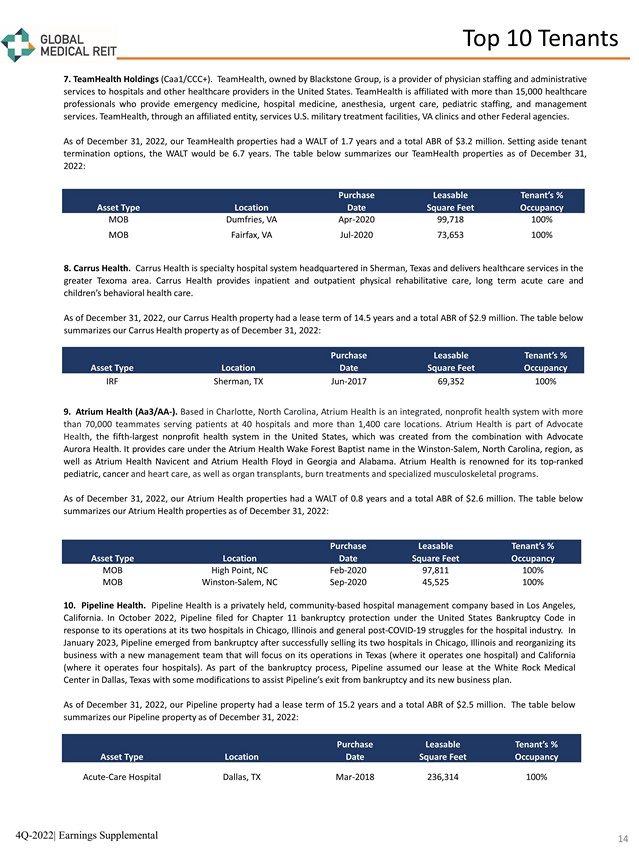
For purposes of calculating our portfolio weighted-average EBITDARM coverage ratio (“Rent Coverage Ratio”), we excluded credit-rated tenants or their subsidiaries for which financial statements were either not available or not sufficiently detailed. These ratios are based on latest available information only. Most tenant financial statements are unaudited and we have not independently verified any tenant financial information (audited or unaudited) and, therefore, we cannot assure you that such information is accurate or complete. Certain other tenants (approximately 16% of our portfolio) are excluded from the calculation due to (i) lack of available financial information or (ii) small tenant size. Additionally, included within 16% of non-reporting tenants is Pipeline Healthcare, LLC, which filed for Chapter 11 bankruptcy protection in October of 2022. Additionally, our Rent Coverage Ratio adds back physician distributions and compensation. Management believes all adjustments are reasonable and necessary.
ANNUALIZED BASE RENT
Annualized base rent represents monthly base rent for December 2022, multiplied by 12 (or base rent net of annualized expenses for properties with gross leases). Accordingly, this methodology produces an annualized amount as of a point in time but does not take into account future (i) contractual rental rate increases, (ii) leasing activity or (iii) lease expirations. Additionally, leases that are accounted for on a cash-collected basis are not included in annualized base rent.
CAPITALIZATION RATE
The capitalization rate (“cap rate”) for an acquisition is calculated by dividing current Annualized Base Rent by contractual purchase price. For the portfolio capitalization rate, certain adjustments, including for subsequent capital invested, are made to the contractual purchase price.
FORWARD-LOOKING STATEMENTS
Certain statements contained herein may be considered “forward-looking statements” within the meaning of the Private Securities Litigation Reform Act of 1995, and it is the Company’s intent that any such statements be protected by the safe harbor created thereby. These forward-looking statements are identified by their use of terms and phrases such as "anticipate," "believe," "could," "estimate," "expect," "intend," "may," "should," "plan," "predict," "project," "will," "continue" and other similar terms and phrases, including references to assumptions and forecasts of future results. Except for historical information, the statements set forth herein including, but not limited to, any statements regarding our earnings, our liquidity, our tenants’ ability to pay rent to us, expected financial performance (including future cash flows associated with new tenants or the expansion of current properties), future dividends or other financial items; any other statements concerning our plans, strategies, objectives and expectations for future operations and future portfolio occupancy rates, our pipeline of acquisition opportunities and expected acquisition activity, including the timing and/or successful completion of any acquisitions and expected rent receipts on these properties, our expected disposition activity, including the timing and/or successful completion of any dispositions and the expected use of proceeds therefrom, and any statements regarding future economic conditions or performance are forward-looking statements. These forward-looking statements are based on our current expectations, estimates and assumptions and are subject to certain risks and uncertainties. Although the Company believes that the expectations, estimates and assumptions reflected in its forward-looking statements are reasonable, actual results could differ materially from those projected or assumed in any of the Company’s forward-looking statements. Additional information concerning us and our business, including additional factors that could materially and adversely affect our financial results, include, without limitation, the risks described under Part I, Item 1A - Risk Factors, in our Annual Report on Form 10-K, our Quarterly Reports on Form 10-Q, and in our other filings with the SEC. You are cautioned not to place undue reliance on forward-looking statements. The Company does not intend, and undertakes no obligation, to update any forward-looking statement.
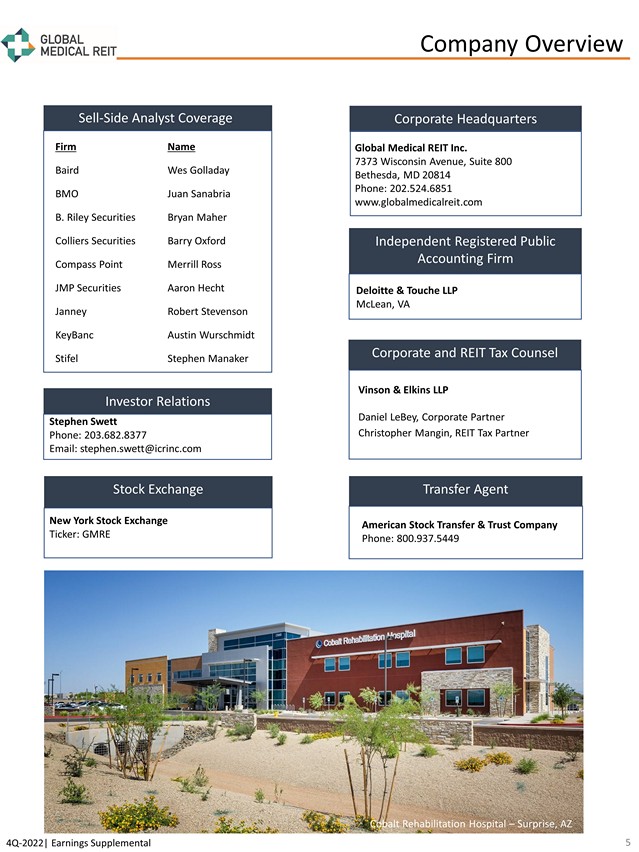
Investor Relations Contact:
Stephen Swett
stephen.swett@icrinc.com
203.682.8377
5
GLOBAL MEDICAL REIT INC.
Condensed Consolidated Balance Sheets
(unaudited, and in thousands, except par values)
| As of December 31, | ||||||||
| 2022 | 2021 | |||||||
| Assets | ||||||||
| Investment in real estate: | ||||||||
| Land | $ | 168,308 | $ | 152,060 | ||||
| Building | 1,079,781 | 985,091 | ||||||
| Site improvements | 22,024 | 19,021 | ||||||
| Tenant improvements | 65,987 | 58,900 | ||||||
| Acquired lease intangible assets | 148,077 | 127,931 | ||||||
| 1,484,177 | 1,343,003 | |||||||
| Less: accumulated depreciation and amortization | (198,218 | ) | (143,255 | ) | ||||
| Investment in real estate, net | 1,285,959 | 1,199,748 | ||||||
| Cash and cash equivalents | 4,016 | 7,213 | ||||||
| Restricted cash | 10,439 | 5,546 | ||||||
| Tenant receivables, net | 8,040 | 6,070 | ||||||
| Due from related parties | 200 | 163 | ||||||
| Escrow deposits | 7,833 | 5,957 | ||||||
| Deferred assets | 29,616 | 25,417 | ||||||
| Derivative asset | 34,705 | 1,236 | ||||||
| Goodwill | 5,903 | 5,903 | ||||||
| Other assets | 6,550 | 6,232 | ||||||
| Total assets | $ | 1,393,261 | $ | 1,263,485 | ||||
| Liabilities and Equity | ||||||||
| Liabilities: | ||||||||
| Credit Facility, net of unamortized debt issuance costs of $9,253 and $8,033 at December 31, 2022 and December 31, 2021, respectively | $ | 636,447 | $ | 514,567 | ||||
| Notes payable, net of unamortized debt issuance costs of $452 and $607 at December 31, 2022 and December 31, 2021, respectively | 57,672 | 57,162 | ||||||
| Accounts payable and accrued expenses | 13,819 | 10,344 | ||||||
| Dividends payable | 15,821 | 15,668 | ||||||
| Security deposits | 5,461 | 4,540 | ||||||
| Derivative liability | — | 7,790 | ||||||
| Other liabilities | 7,363 | 7,709 | ||||||
| Acquired lease intangible liability, net | 7,613 | 8,128 | ||||||
| Total liabilities | 744,196 | 625,908 | ||||||
| Commitments and Contingencies | ||||||||
| Equity: | ||||||||
| Preferred stock, $0.001 par value, 10,000 shares authorized; 3,105 issued and outstanding at December 31, 2022 and December 31, 2021, respectively (liquidation preference of $77,625 at December 31, 2022 and December 31, 2021, respectively) | 74,959 | 74,959 | ||||||
| Common stock, $0.001 par value, 500,000 shares authorized; 65,518 shares and 64,880 shares issued and outstanding at December 31, 2022 and December 31, 2021, respectively | 66 | 65 | ||||||
| Additional paid-in capital | 721,991 | 711,414 | ||||||
| Accumulated deficit | (198,706 | ) | (157,017 | ) | ||||
| Accumulated other comprehensive income (loss) | 34,674 | (6,636 | ) | |||||
| Total Global Medical REIT Inc. stockholders' equity | 632,984 | 622,785 | ||||||
| Noncontrolling interest | 16,081 | 14,792 | ||||||
| Total equity | 649,065 | 637,577 | ||||||
| Total liabilities and equity | $ | 1,393,261 | $ | 1,263,485 | ||||
6
GLOBAL MEDICAL REIT INC.
Condensed Consolidated Statements of Operations
(unaudited, and in thousands, except per share amounts)
| Three Months Ended December 31, | Twelve Months Ended December 31, | |||||||||||||||
| 2022 | 2021 | 2022 | 2021 | |||||||||||||
| Revenue | ||||||||||||||||
| Rental revenue | $ | 36,290 | $ | 30,312 | $ | 137,167 | $ | 115,804 | ||||||||
| Other income | 16 | 32 | 116 | 132 | ||||||||||||
| Total revenue | 36,306 | 30,344 | 137,283 | 115,936 | ||||||||||||
| Expenses | ||||||||||||||||
| General and administrative | 4,051 | 3,934 | 16,545 | 16,453 | ||||||||||||
| Operating expenses | 7,138 | 4,525 | 25,188 | 15,488 | ||||||||||||
| Depreciation expense | 10,580 | 9,046 | 40,008 | 33,825 | ||||||||||||
| Amortization expense | 4,513 | 3,607 | 16,715 | 13,050 | ||||||||||||
| Interest expense | 8,064 | 4,809 | 25,230 | 19,696 | ||||||||||||
| Preacquisition expense | 112 | 5 | 354 | 151 | ||||||||||||
| Total expenses | 34,458 | 25,926 | 124,040 | 98,663 | ||||||||||||
| Income before gain on sale of investment property | 1,848 | 4,418 | 13,243 | 17,273 | ||||||||||||
| Gain on sale of investment property | — | 1,069 | 6,753 | 1,069 | ||||||||||||
| Net income | $ | 1,848 | $ | 5,487 | $ | 19,996 | $ | 18,342 | ||||||||
| Less: Preferred stock dividends | (1,455 | ) | (1,455 | ) | (5,822 | ) | (5,822 | ) | ||||||||
| Less: Net income attributable to noncontrolling interest | (24 | ) | (228 | ) | (854 | ) | (720 | ) | ||||||||
| Net income attributable to common stockholders | $ | 369 | $ | 3,804 | $ | 13,320 | $ | 11,800 | ||||||||
| Net income attributable to common stockholders per share – basic and diluted | $ | 0.01 | $ | 0.06 | $ | 0.20 | $ | 0.19 | ||||||||
| Weighted average shares outstanding – basic and diluted | 65,518 | 64,326 | 65,462 | 60,640 | ||||||||||||
7
Global Medical REIT Inc.
Reconciliation of Net Income to FFO and AFFO
(unaudited, and in thousands, except per share and unit amounts)
Three Months Ended | Twelve Months Ended | |||||||||||||||
| 2022 | 2021 | 2022 | 2021 | |||||||||||||
| Net income | $ | 1,848 | $ | 5,487 | $ | 19,996 | $ | 18,342 | ||||||||
| Less: Preferred stock dividends | (1,455 | ) | (1,455 | ) | (5,822 | ) | (5,822 | ) | ||||||||
| Depreciation and amortization expense | 15,064 | 12,624 | 56,611 | 46,764 | ||||||||||||
| Gain on sale of investment property | — | (1,069 | ) | (6,753 | ) | (1,069 | ) | |||||||||
| FFO | $ | 15,457 | $ | 15,587 | $ | 64,032 | $ | 58,215 | ||||||||
| Amortization of above market leases, net | 292 | 202 | 1,027 | 520 | ||||||||||||
| Straight line deferred rental revenue | (1,006 | ) | (1,170 | ) | (4,251 | ) | (5,317 | ) | ||||||||
| Stock-based compensation expense | 1,066 | 1,242 | 4,681 | 5,810 | ||||||||||||
| Amortization of debt issuance costs and other | 601 | 514 | 2,201 | 1,982 | ||||||||||||
| Preacquisition expense | 112 | 5 | 354 | 151 | ||||||||||||
| AFFO | $ | 16,522 | $ | 16,380 | $ | 68,044 | $ | 61,361 | ||||||||
| Net income attributable to common stockholders per share – basic and diluted | $ | 0.01 | $ | 0.06 | $ | 0.20 | $ | 0.19 | ||||||||
| FFO per share and unit | $ | 0.22 | $ | 0.23 | $ | 0.92 | $ | 0.90 | ||||||||
| AFFO per share and unit | $ | 0.24 | $ | 0.24 | $ | 0.98 | $ | 0.95 | ||||||||
| Weighted Average Shares and Units Outstanding – basic and diluted | 69,725 | 68,214 | 69,662 | 64,548 | ||||||||||||
| Weighted Average Shares and Units Outstanding: | ||||||||||||||||
| Weighted Average Common Shares | 65,518 | 64,326 | 65,462 | 60,640 | ||||||||||||
| Weighted Average OP Units | 1,668 | 1,702 | 1,669 | 1,732 | ||||||||||||
| Weighted Average LTIP Units | 2,539 | 2,186 | 2,531 | 2,176 | ||||||||||||
| Weighted Average Shares and Units Outstanding – basic and diluted | 69,725 | 68,214 | 69,662 | 64,548 | ||||||||||||
8
Global Medical REIT Inc.
Reconciliation of Net Income to EBITDAre and Adjusted EBITDAre
(unaudited, and in thousands)
Three Months Ended | Twelve Months Ended | |||||||||||||||
| 2022 | 2021 | 2022 | 2021 | |||||||||||||
| Net income | $ | 1,848 | $ | 5,487 | $ | 19,996 | $ | 18,342 | ||||||||
| Interest expense | 8,064 | 4,809 | 25,230 | 19,696 | ||||||||||||
| Depreciation and amortization expense | 15,093 | 12,653 | 56,723 | 46,875 | ||||||||||||
| Gain on sale of investment property | — | (1,069 | ) | (6,753 | ) | (1,069 | ) | |||||||||
| EBITDAre | $ | 25,005 | $ | 21,880 | $ | 95,196 | $ | 83,844 | ||||||||
| Stock-based compensation expense | 1,066 | 1,242 | 4,681 | 5,810 | ||||||||||||
| Amortization of above market leases, net | 292 | 202 | 1,027 | 520 | ||||||||||||
| Preacquisition expense | 112 | 5 | 354 | 151 | ||||||||||||
| Adjusted EBITDAre | $ | 26,475 | $ | 23,329 | $ | 101,258 | $ | 90,325 | ||||||||
9