UNITED STATES
SECURITIES AND EXCHANGE COMMISSION
Washington, D.C. 20549
FORM
CURRENT REPORT
Pursuant to Section 13 or 15(d) of The Securities Exchange Act of 1934
Date of Report (Date of earliest event reported):
(Exact name of registrant as specified in its charter)
(State or other jurisdiction | (Commission File Number) | (IRS Employer |
of incorporation) | Identification No.) |
(Address of principal executive offices)
(Zip Code)
Registrant's telephone number, including area code: (
n/a
(Former name or former address, if changed since last report.)
Check the appropriate box below if the Form 8-K filing is intended to simultaneously satisfy the filing obligation of the registrant under any of the following provisions (see General Instruction A.2. below):
Written communications pursuant to Rule 425 under the Securities Act (17 CFR 230.425) | ||
Soliciting material pursuant to Rule 14a-12 under the Exchange Act (17 CFR 240.14a-12) | ||
| ||
Pre-commencement communications pursuant to Rule 14d-2(b) under the Exchange Act (17 CFR 240.14d-2(b)) | ||
| ||
Pre-commencement communications pursuant to Rule 13e-4(c) under the Exchange Act (17 CFR 240.13e-4(c)) |
Indicate by check mark whether the registrant is an emerging growth company as defined in Rule 405 of the Securities Act of 1933 (§230.405 of this chapter) or Rule 12b-2 of the Securities Exchange Act of 1934 (§240.12b-2 of this chapter).
Emerging growth company
If an emerging growth company, indicate by check mark if the registrant has elected not to use the extended transition period for complying with any new or revised financial accounting standards provided pursuant to Section 13(a) of the Exchange Act. ☐
Securities registered pursuant to Section 12(b) of the Exchange Act:
Title of each class | Trading Symbol(s) | Name of each exchange on which registered |
Item 2.02. | Results of Operations and Financial Condition |
On November 7, 2022, Ready Capital Corporation (the “Company”) issued an earnings release announcing the financial results for the quarter ended September 30, 2022. A copy of the earnings release is attached as Exhibit 99.1 hereto and incorporated herein by reference.
On November 7, 2022, the Company posted supplemental financial information on the Investor Relations section of its website (www.readycapital.com). A copy of the supplemental financial information is furnished as Exhibit 99.2 hereto and incorporated herein by reference.
The information in Item 2.02 of this Current Report, including Exhibits 99.1 and 99.2, is being furnished and shall not be deemed “filed” for purposes of Section 18 of the Securities Exchange Act of 1934, as amended, or otherwise subject to the liabilities of that Section. The information in this Current Report shall not be incorporated by reference into any registration statement or other document pursuant to the Securities Act of 1933, as amended, unless it is specifically incorporated by reference therein.
Item 9.01 Financial Statements and Exhibits
(d) | Exhibits |
Exhibit No. |
| Description |
|
| |
99.1 |
| |
99.2 | Supplemental Financial Information for the quarter ended September 30, 2022 | |
104 | Cover Page Interactive Data File (embedded within the Inline XBRL document). |
SIGNATURES
Pursuant to the requirements of the Securities Exchange Act of 1934, the registrant has duly caused this report to be signed on its behalf by the undersigned hereunto duly authorized.
| READY CAPITAL CORPORATION |
| |
|
|
|
|
|
|
|
|
| By: | /s/ Andrew Ahlborn |
|
|
| Name: Andrew Ahlborn |
|
|
| Title: Chief Financial Officer |
|
Date: November 7, 2022
Exhibit 99.1
READY CAPITAL CORPORATION REPORTS THIRD QUARTER 2022 RESULTS
- | GAAP EARNINGS PER COMMON SHARE OF $0.53 - |
- | DISTRIBUTABLE EARNINGS PER COMMON SHARE OF $0.46 - |
- | DISTRIBUTABLE RETURN ON AVERAGE STOCKHOLDERS’ EQUITY OF 12.7% - |
New York, New York, November 7, 2022 / PRNewswire / – Ready Capital Corporation (“Ready Capital” or the “Company”) (NYSE: RC), a multi-strategy real estate finance company that originates, acquires, finances, and services small-to-medium balance commercial loans, today reported financial results for the quarter ended September 30, 2022.
“Against the backdrop of market volatility, rising rates and inflationary pressures, Ready Capital remains focused on finding accretive ways to grow the Company’s platform while prudently managing our resources by taking a conservative stance on liquidity, leverage and credit,” commented Thomas Capasse, Ready Capital’s Chairman and Chief Executive Officer.
Third Quarter Highlights
● | Total investments of $1.5 billion, including $831.1 million of SBC originations and acquisitions, $534.3 million of residential mortgage loans, and $133.6 million of U.S. Small Business Administration 7(a) loans |
● | Total year-to-date investment activity of $6.7 billion |
● | Increased the size of the Company's existing stock repurchase program by an additional $25 million, bringing the total amount authorized under the program to $50 million |
● | Issued $100.0 million in aggregate principal amount of 7.375% Senior Unsecured Notes due 2027 |
● | Declared and paid dividend of $0.42 per share in cash with distributable earnings coverage of the common dividend at 1.1x |
● | Net book value of $15.40 per share of common stock as of September 30, 2022 |
Subsequent Events
● | During October 2022, the Company acquired approximately 3.6 million shares of the Company’s common stock, par value $0.0001 per share, at an average price of $10.34 through the Company’s share repurchase program. |
● | On October 19, 2022, the Company completed the securitization of $860.1 million of floating rate SBC loans and sold $656.9 million of senior bonds with a weighted average cost of debt of SOFR + 3.0%. |
Use of Non-GAAP Financial Information
In addition to the results presented in accordance with U.S. GAAP, this press release includes distributable earnings, formerly referred to as core earnings, which is a non-U.S. GAAP financial measure. The Company defines distributable earnings as net income adjusted for unrealized gains and losses related to certain mortgage backed securities (“MBS”) not retained by us as part of our loan origination business, realized gains and losses on sales of certain MBS, unrealized gains and losses related to residential mortgage servicing rights (“MSR”), unrealized current non-cash provision for credit losses on accrual loans and one-time non-recurring gains or losses, such as gains or losses on discontinued operations, bargain purchase gains, merger related expenses, or other one-time items.
The Company believes that this non-U.S. GAAP financial information, in addition to the related U.S. GAAP measures, provides investors greater transparency into the information used by management in its financial and operational decision-making, including the determination of dividends. However, because Distributable Earnings is an incomplete measure of the Company's financial performance and involves differences from net income computed in accordance with U.S. GAAP, it should be considered along with, but not as an alternative to, the Company's net income computed in accordance with U.S. GAAP as a measure of the Company's financial performance. In addition, because not all companies use identical calculations, the Company's presentation of Distributable Earnings may not be comparable to other similarly-titled measures of other companies.
In calculating Distributable Earnings, Net Income (in accordance with U.S. GAAP) is adjusted to exclude unrealized gains and losses on MBS acquired by the Company in the secondary market but is not adjusted to exclude unrealized gains and losses on MBS retained by Ready Capital as part of its loan origination businesses, where the Company transfers originated loans into an MBS securitization and the Company retains an interest in the securitization. In calculating Distributable Earnings, the Company does not adjust Net Income (in accordance with U.S. GAAP) to take into account unrealized gains and losses on MBS retained by us as part of the loan origination businesses because the unrealized gains and losses that are generated in the loan origination and securitization process are considered to be a fundamental part of this business and an indicator of the ongoing performance and credit quality of the Company’s historical loan originations. In calculating Distributable Earnings, Net Income (in accordance with U.S. GAAP) is adjusted to exclude realized gains and losses on certain MBS securities considered to be non-distributable. Certain MBS positions are considered to be non-distributable due to a variety of reasons which may include collateral type, duration, and size.
In addition, in calculating Distributable Earnings, Net Income (in accordance with U.S. GAAP) is adjusted to exclude unrealized gains or losses on residential MSRs, held at fair value. The Company treats its commercial MSRs and residential MSRs as two separate classes based on the nature of the underlying mortgages and the treatment of these assets as two separate pools for risk management purposes. Servicing rights relating to the Company’s small business commercial business are accounted for under ASC 860, Transfer and Servicing, while the Company’s residential MSRs are accounted for under the fair value option under ASC 825, Financial Instruments. In calculating Distributable Earnings, the Company does not exclude realized gains or losses on either commercial MSRs or residential MSRs, held at fair value, as servicing income is a fundamental part of Ready Capital’s business and is an indicator of the ongoing performance.
To qualify as a REIT, the Company must distribute to its stockholders each calendar year at least 90% of its REIT taxable income (including certain items of non-cash income), determined without regard to the deduction for dividends paid and excluding net capital gain. There are certain items, including net income generated from the creation of MSRs, that are included in distributable earnings but are not included in the calculation of the current year’s taxable income. These differences may result in certain items that are recognized in the current period’s calculation of distributable earnings not being included in taxable income, and thus not subject to the REIT dividend distribution requirement until future years.
The table below reconciles Net Income computed in accordance with U.S. GAAP to Distributable Earnings.
| | |
(in thousands) | Three Months Ended September 30, 2022 | |
Net Income | $ | 66,253 |
Reconciling items: | | |
Unrealized gain on MSR | | (16,649) |
Impact of CECL on accrual loans | | 2,462 |
Merger transaction costs and other non-recurring expenses | | 2,927 |
Total reconciling items | $ | (11,260) |
Income tax adjustments | | 3,193 |
Distributable earnings | $ | 58,186 |
Less: Distributable earnings attributable to non-controlling interests | | 2,655 |
Less: Income attributable to participating shares | | 2,407 |
Distributable earnings attributable to common stockholders | $ | 53,124 |
Distributable earnings per common share - basic | $ | 0.46 |
Distributable earnings per common share - diluted | $ | 0.44 |
U.S. GAAP return on equity is based on U.S. GAAP net income, while distributable return on equity is based on distributable earnings, which adjusts U.S. GAAP net income for the items in the distributable earnings reconciliation above.
Webcast and Earnings Conference Call
Management will host a webcast and conference call on Tuesday, November 8, 2022 at 8:30 am ET to provide a general business update and discuss the financial results for the quarter ended September 30, 2022.
The Company encourages use of the webcast due to potential extended wait times to access the conference call via dial-in. The webcast of the conference call will be available in the Investor Relations section of the Company’s website at www.readycapital.com. To listen to a live broadcast, go to the site at least 15 minutes prior to the scheduled start time in order to register, download and install any necessary audio software.
To Participate in the Telephone Conference Call:
Dial in at least five minutes prior to start time.
Domestic: 1-877-407-0792
International: 1-201-689-8263
Conference Call Playback:
Domestic: 1-844-512-2921
International: 1-412-317-6671
Replay Pin #: 13733002
The playback can be accessed through November 22, 2022.
Safe Harbor Statement
This press release contains statements that constitute "forward-looking statements," as such term is defined in Section 27A of the Securities Act of 1933, as amended, and Section 21E of the Securities Exchange Act of 1934, as amended, and such statements are intended to be covered by the safe harbor provided by the same. These statements are based on management's current expectations and beliefs and are subject to a number of trends and uncertainties that could cause actual results to differ materially from those described in the forward-looking statements; the Company can give no assurance that its expectations will be attained. Factors that could cause actual results to differ materially from the Company's expectations include, but are not limited to, applicable regulatory changes; general volatility of the capital markets; changes in the Company’s investment objectives and business strategy; the availability of financing on acceptable terms or at all; the availability, terms and deployment of capital; the availability of suitable investment opportunities; changes in the interest rates or the general economy; increased rates of default and/or decreased recovery rates on investments; changes in interest rates, interest rate spreads, the yield curve or prepayment rates; changes in prepayments of Company’s assets; the degree and nature of competition, including competition for the Company's target assets; and other factors, including those set forth in the Risk Factors section of the Company's most recent Annual Report on Form 10-K filed with the SEC, and other reports filed by the Company with the SEC, copies of which are available on the SEC's website, www.sec.gov. The Company undertakes no obligation to update these statements for revisions or changes after the date of this release, except as required by law.
About Ready Capital Corporation
Ready Capital Corporation (NYSE: RC) is a multi-strategy real estate finance company that originates, acquires, finances and services small- to medium-sized balance commercial loans. The Company specializes in loans backed by commercial real estate, including agency multifamily, investor and bridge as well as U.S. Small Business Administration loans under its Section 7(a) program. Headquartered in New York, New York, the Company employs over 600 professionals nationwide.
Contact
Investor Relations
Ready Capital Corporation
212-257-4666
InvestorRelations@readycapital.com
Additional information can be found on the Company’s website at www.readycapital.com
READY CAPITAL CORPORATION
UNAUDITED CONSOLIDATED BALANCE SHEETS
(in thousands) |
| September 30, 2022 |
| December 31, 2021 | ||
Assets | | | | | | |
Cash and cash equivalents | | $ | 208,037 | | $ | 229,531 |
Restricted cash | |
| 57,675 | |
| 51,569 |
Loans, net (including $9,582 and $10,766 held at fair value) | |
| 4,158,807 | |
| 2,915,446 |
Loans, held for sale, at fair value | |
| 403,609 | |
| 552,935 |
Paycheck Protection Program loans (including $599 and $3,243 held at fair value) | |
| 275,761 | |
| 870,352 |
Mortgage-backed securities, at fair value | |
| 37,895 | |
| 99,496 |
Loans eligible for repurchase from Ginnie Mae | | | 65,188 | | | 94,111 |
Investment in unconsolidated joint ventures (including $8,268 and $8,894 held at fair value) | | | 119,272 | | | 141,148 |
Investments held to maturity | | | 40,089 | | | — |
Purchased future receivables, net | | | 8,593 | | | 7,872 |
Derivative instruments | |
| 26,212 | |
| 7,022 |
Servicing rights (including $192,153 and $120,142 held at fair value) | |
| 277,692 | |
| 204,599 |
Real estate owned, held for sale | | | 82,977 | | | 42,288 |
Other assets | |
| 213,030 | |
| 172,098 |
Assets of consolidated VIEs | | | 5,883,374 | | | 4,145,564 |
Total Assets | | $ | 11,858,211 | | $ | 9,534,031 |
Liabilities | | | | | | |
Secured borrowings | |
| 3,348,249 | |
| 2,517,600 |
Paycheck Protection Program Liquidity Facility (PPPLF) borrowings | |
| 305,797 | |
| 941,505 |
Securitized debt obligations of consolidated VIEs, net | |
| 4,429,846 | |
| 3,214,303 |
Convertible notes, net | | | 114,108 | | | 113,247 |
Senior secured notes, net | |
| 342,912 | |
| 342,035 |
Corporate debt, net | | | 662,247 | | | 441,817 |
Guaranteed loan financing | |
| 283,822 | |
| 345,217 |
Contingent consideration | | | 33,200 | | | 16,400 |
Liabilities for loans eligible for repurchase from Ginnie Mae | | | 65,188 | | | 94,111 |
Derivative instruments | |
| 4,345 | |
| 410 |
Dividends payable | |
| 51,136 | |
| 34,348 |
Loan participations sold | | | 54,104 | | | — |
Due to third parties | | | 14,881 | | | 668 |
Accounts payable and other accrued liabilities | |
| 171,152 | |
| 183,411 |
Total Liabilities | | $ | 9,880,987 | | $ | 8,245,072 |
Preferred stock Series C, liquidation preference $25.00 per share (refer to Note 21) | | | 8,361 | | | 8,361 |
| | | | | | |
Commitments & contingencies (refer to Note 25) | | | | | | |
| | | | | | |
Stockholders’ Equity | | | | | | |
Preferred stock Series E, liquidation preference $25.00 per share (refer to Note 21) | | | 111,378 | | | 111,378 |
Common stock, $0.0001 par value, 500,000,000 shares authorized, 114,015,355 and 75,838,050 shares issued and outstanding, respectively | |
| 11 | |
| 8 |
Additional paid-in capital | |
| 1,720,019 | |
| 1,161,853 |
Retained earnings | | | 40,079 | | | 8,598 |
Accumulated other comprehensive loss | |
| (4,505) | |
| (5,733) |
Total Ready Capital Corporation equity | |
| 1,866,982 | |
| 1,276,104 |
Non-controlling interests | |
| 101,881 | |
| 4,494 |
Total Stockholders’ Equity | | $ | 1,968,863 | | $ | 1,280,598 |
Total Liabilities, Redeemable Preferred Stock, and Stockholders’ Equity | | $ | 11,858,211 | | $ | 9,534,031 |
READY CAPITAL CORPORATION
UNAUDITED CONSOLIDATED STATEMENTS OF INCOME
| | Three Months Ended September 30, | | Nine Months Ended September 30, | ||||||||
(in thousands, except share data) |
| 2022 |
| 2021 |
| 2022 |
| 2021 | ||||
Interest income | | $ | 186,026 | | $ | 105,136 | | $ | 464,102 | | $ | 281,554 |
Interest expense | |
| (115,495) | |
| (50,136) | |
| (257,339) | |
| (156,312) |
Net interest income before provision for loan losses | | $ | 70,531 | | $ | 55,000 | | $ | 206,763 | | $ | 125,242 |
Provision for loan losses | |
| (3,431) | |
| (1,579) | |
| (583) | | | (7,088) |
Net interest income after provision for loan losses | | $ | 67,100 | | $ | 53,421 | | $ | 206,180 | | $ | 118,154 |
Non-interest income | | | | | | | | | | | | |
Residential mortgage banking activities | | | 12,053 | | | 37,270 | | | 23,424 | | | 115,369 |
Net realized gain on financial instruments and real estate owned | | | 21,117 | | | 23,210 | | | 50,238 | | | 49,239 |
Net unrealized gain on financial instruments | | | 16,460 | | | 5,688 | | | 58,522 | | | 31,296 |
Servicing income, net of amortization and impairment of $4,123 and $13,128 for the three and nine months ended September 30, 2022, and $2,798 and $7,344 for three and nine months ended September 30, 2021, respectively | |
| 12,189 | |
| 10,243 | |
| 37,282 | | | 37,806 |
Income on purchased future receivables, net of allowance for (recovery of) doubtful accounts of $(941) and $(1,381) for the three and nine months ended September 30, 2022, and $(279) and $1,260 for three and nine months ended September 30, 2021, respectively | | | 1,162 | | | 2,838 | | | 5,490 | | | 7,934 |
Income (loss) on unconsolidated joint ventures | | | (603) | | | 3,548 | | | 11,160 | | | 6,100 |
Other income | |
| 16,150 | |
| 5,674 | |
| 30,985 | | | 5,557 |
Total non-interest income | | $ | 78,528 | | $ | 88,471 | | $ | 217,101 | | $ | 253,301 |
Non-interest expense | | | | | | | | | | | | |
Employee compensation and benefits | |
| (25,941) | |
| (24,537) | |
| (79,998) | | | (71,584) |
Allocated employee compensation and benefits from related party | |
| (1,745) | |
| (3,804) | |
| (6,549) | | | (9,226) |
Variable expenses on residential mortgage banking activities | |
| (9,061) | |
| (24,380) | |
| (5,508) | | | (61,286) |
Professional fees | |
| (3,865) | |
| (6,900) | |
| (12,842) | | | (12,754) |
Management fees – related party | |
| (5,410) | |
| (2,742) | |
| (14,071) | | | (8,061) |
Incentive fees – related party | |
| (949) | |
| (2,775) | |
| (949) | | | (3,061) |
Loan servicing expense | |
| (10,697) | |
| (8,124) | |
| (29,913) | | | (21,079) |
Transaction related expenses | | | (1,535) | | | (2,629) | | | (8,606) | | | (10,202) |
Other operating expenses | |
| (15,396) | |
| (12,926) | |
| (42,421) | | | (45,600) |
Total non-interest expense | | $ | (74,599) | | $ | (88,817) | | $ | (200,857) | | $ | (242,853) |
Income before provision for income taxes | | | 71,029 | | | 53,075 | | | 222,424 | | | 128,602 |
Income tax provision | |
| (4,776) | | | (6,540) | |
| (32,943) | | | (22,216) |
Net income | | $ | 66,253 | | $ | 46,535 | | $ | 189,481 | | $ | 106,386 |
Less: Dividends on preferred stock | | | 1,999 | | | 1,999 | | | 5,997 | | | 5,504 |
Less: Net income attributable to non-controlling interest | |
| 3,023 | | | 756 | |
| 6,672 | | | 1,859 |
Net income attributable to Ready Capital Corporation | | $ | 61,231 | | $ | 43,780 | | $ | 176,812 | | $ | 99,023 |
| | | | | | | | | | | | |
Earnings per common share - basic | | $ | 0.53 | | $ | 0.61 | | $ | 1.66 | | $ | 1.47 |
Earnings per common share - diluted | | $ | 0.50 | | $ | 0.60 | | $ | 1.56 | | $ | 1.46 |
| | | | | | | | | | | | |
Weighted-average shares outstanding | |
| | |
| | |
| | |
| |
Basic | | | 114,371,160 | | | 71,618,168 | | | 105,576,826 | | | 66,606,749 |
Diluted | | | 125,666,609 | | | 71,787,228 | | | 116,865,770 | | | 66,768,918 |
| | | | | | | | | | | | |
Dividends declared per share of common stock | | $ | 0.42 | | $ | 0.42 | | $ | 1.26 | | $ | 1.24 |
READY CAPITAL CORPORATION
UNAUDITED SEGMENT REPORTING
FOR THE THREE MONTHS ENDED SEPTEMBER 30, 2022
| | | | | Small | | Residential | | | | | | | ||
| | SBC Lending | | Business | | Mortgage | | Corporate- | | | |||||
(in thousands) | | and Acquisitions | | Lending | | Banking | | Other | | Consolidated | |||||
Interest income | | $ | 159,307 | | $ | 24,605 | | $ | 2,114 | | $ | — | | $ | 186,026 |
Interest expense | | | (105,560) | | | (7,097) | | | (2,479) | | | (359) | | | (115,495) |
Net interest income before provision for loan losses | | $ | 53,747 | | $ | 17,508 | | $ | (365) | | $ | (359) | | $ | 70,531 |
Provision for loan losses | | | (3,231) | | | (200) | | | — | | | — | |
| (3,431) |
Net interest income after provision for loan losses | | $ | 50,516 | | $ | 17,308 | | $ | (365) | | $ | (359) | | $ | 67,100 |
Non-interest income | | | | | | | | | | | | | | | |
Residential mortgage banking activities | | $ | — | | $ | — | | $ | 12,053 | | $ | — | | $ | 12,053 |
Net realized gain on financial instruments and real estate owned | | | 13,060 | | | 8,057 | | | — | | | — | | | 21,117 |
Net unrealized gain (loss) on financial instruments | | | 322 | | | (509) | | | 16,647 | | | — | | | 16,460 |
Servicing income, net | | | 1,191 | | | 1,991 | | | 9,007 | | | — | | | 12,189 |
Income on purchased future receivables, net | | | — | | | 1,162 | | | — | | | — | | | 1,162 |
Loss on unconsolidated joint ventures | | | (603) | | | — | | | — | | | — | | | (603) |
Other income | | | 5,476 | | | 10,641 | | | 15 | | | 18 | | | 16,150 |
Total non-interest income | | $ | 19,446 | | $ | 21,342 | | $ | 37,722 | | $ | 18 | | $ | 78,528 |
Non-interest expense | | | | | | | | | | | | | | | |
Employee compensation and benefits | | $ | (6,603) | | $ | (12,329) | | $ | (5,274) | | $ | (1,735) | | $ | (25,941) |
Allocated employee compensation and benefits from related party | | | (175) | | | — | | | — | | | (1,570) | |
| (1,745) |
Variable expenses on residential mortgage banking activities | | | — | | | — | | | (9,061) | | | — | | | (9,061) |
Professional fees | | | (1,630) | | | (1,426) | | | (138) | | | (671) | |
| (3,865) |
Management fees – related party | | | — | | | — | | | — | | | (5,410) | |
| (5,410) |
Incentive fees – related party | | | — | | | — | | | — | | | (949) | | | (949) |
Loan servicing expense | | | (8,226) | | | (103) | | | (2,368) | | | — | |
| (10,697) |
Transaction related expenses | | | — | | | — | | | — | | | (1,535) | | | (1,535) |
Other operating expenses | | | (6,208) | | | (5,482) | | | (2,034) | | | (1,672) | |
| (15,396) |
Total non-interest expense | | $ | (22,842) | | $ | (19,340) | | $ | (18,875) | | $ | (13,542) | | $ | (74,599) |
Income (loss) before provision for income taxes | | $ | 47,120 | | $ | 19,310 | | $ | 18,482 | | $ | (13,883) | | $ | 71,029 |
Total assets | | $ | 10,268,015 | | $ | 930,577 | | $ | 459,058 | | $ | 200,561 | | $ | 11,858,211 |
READY CAPITAL CORPORATION
UNAUDITED SEGMENT REPORTING
FOR THE NINE MONTHS ENDED SEPTEMBER 30, 2022
| | | | | Small | | Residential | | | | | | | ||
| | SBC Lending | | Business | | Mortgage | | Corporate- | | | |||||
(in thousands) | | and Acquisitions | | Lending | | Banking | | Other | | Consolidated | |||||
Interest income | | $ | 378,077 | | $ | 79,866 | | $ | 6,159 | | $ | — | | $ | 464,102 |
Interest expense | | | (231,338) | | | (18,703) | | | (6,663) | | | (635) | | | (257,339) |
Net interest income before recovery of (provision for) loan losses | | $ | 146,739 | | $ | 61,163 | | $ | (504) | | $ | (635) | | $ | 206,763 |
Recovery of (provision for) loan losses | | | 1,108 | | | (1,691) | | | — | | | — | |
| (583) |
Net interest income after recovery of (provision for) loan losses | | $ | 147,847 | | $ | 59,472 | | $ | (504) | | $ | (635) | | $ | 206,180 |
Non-interest income | | | | | | | | | | | | | | | |
Residential mortgage banking activities | | $ | — | | $ | — | | $ | 23,424 | | $ | — | | $ | 23,424 |
Net realized gain on financial instruments and real estate owned | | | 25,976 | | | 24,262 | | | — | | | — | | | 50,238 |
Net unrealized gain (loss) on financial instruments | | | 10,234 | | | (942) | | | 49,230 | | | — | | | 58,522 |
Servicing income, net | | | 3,542 | | | 8,042 | | | 25,698 | | | — | | | 37,282 |
Income on purchased future receivables, net | | | — | | | 5,490 | | | — | | | — | |
| 5,490 |
Income on unconsolidated joint ventures | | | 11,160 | | | — | | | — | | | — | | | 11,160 |
Other income | | | 14,828 | | | 15,462 | | | 60 | | | 635 | | | 30,985 |
Total non-interest income | | $ | 65,740 | | $ | 52,314 | | $ | 98,412 | | $ | 635 | | $ | 217,101 |
Non-interest expense | | | | | | | | | | | | | | | |
Employee compensation and benefits | | $ | (24,666) | | $ | (32,064) | | $ | (19,714) | | $ | (3,554) | | $ | (79,998) |
Allocated employee compensation and benefits from related party | | | (655) | | | — | | | — | | | (5,894) | |
| (6,549) |
Variable expenses on residential mortgage banking activities | | | — | | | — | | | (5,508) | | | — | |
| (5,508) |
Professional fees | | | (5,128) | | | (4,513) | | | (619) | | | (2,582) | |
| (12,842) |
Management fees – related party | | | — | | | — | | | — | | | (14,071) | |
| (14,071) |
Incentive fees – related party | | | — | | | — | | | — | | | (949) | | | (949) |
Loan servicing expense | | | (22,013) | | | (531) | | | (7,369) | | | — | |
| (29,913) |
Transaction related expenses | | | — | | | — | | | — | | | (8,606) | | | (8,606) |
Other operating expenses | | | (18,041) | | | (13,583) | | | (6,233) | | | (4,564) | |
| (42,421) |
Total non-interest expense | | $ | (70,503) | | $ | (50,691) | | $ | (39,443) | | $ | (40,220) | | $ | (200,857) |
Income (loss) before provision for income taxes | | $ | 143,084 | | $ | 61,095 | | $ | 58,465 | | $ | (40,220) | | $ | 222,424 |
Total assets | | $ | 10,268,015 | | $ | 930,577 | | $ | 459,058 | | $ | 200,561 | | $ | 11,858,211 |
SUPPLEMENTAL FINANCIAL DATAQ3 2022 |
2DisclaimerThispresentationcontainsstatementsthatconstitute“forward-lookingstatements,”assuchtermisdefinedinSection27AoftheSecuritiesActof1933,asamended,andSection21EoftheSecuritiesExchangeActof1934,asamended,andsuchstatementsareintendedtobecoveredbythesafeharborprovidedbythesame.Thesestatementsarebasedonmanagement’scurrentexpectationsandbeliefsandaresubjecttoanumberoftrendsanduncertaintiesthatcouldcauseactualresultstodiffermateriallyfromthosedescribedintheforward-lookingstatements;ReadyCapitalCorporation(the“Company”)cangivenoassurancethatitsexpectationswillbeattained.FactorsthatcouldcauseactualresultstodiffermateriallyfromtheCompany’sexpectationsincludethosesetforthintheRiskFactorssectionofthemostrecentAnnualReportonForm10-KfiledwiththeSECandotherreportsfiledbytheCompanywiththeSEC,copiesofwhichareavailableontheSEC’swebsite,www.sec.gov.TheCompanyundertakesnoobligationtoupdatethesestatementsforrevisionsorchangesafterthedateofthisrelease,exceptasrequiredbylaw.Thispresentationincludescertainnon-GAAPfinancialmeasures,includingDistributableearnings.Thesenon-GAAPfinancialmeasuresshouldbeconsideredonlyassupplementalto,andnotassuperiorto,financialmeasuresinaccordancewithGAAP.PleaserefertotheAppendixforthemostrecentGAAPinformation.Thispresentationalsocontainsmarketstatisticsandindustrydatawhicharesubjecttouncertaintyandarenotnecessarilyreflectiveofmarketconditions.ThesehavebeenderivedfromthirdpartysourcesandhavenotbeenindependentlyverifiedbytheCompanyoritsaffiliates.Allmaterialpresentediscompiledfromsourcesbelievedtobereliableandcurrent,butaccuracycannotbeguaranteed.AlldataisasofSeptember30,2022,unlessotherwisenoted. |
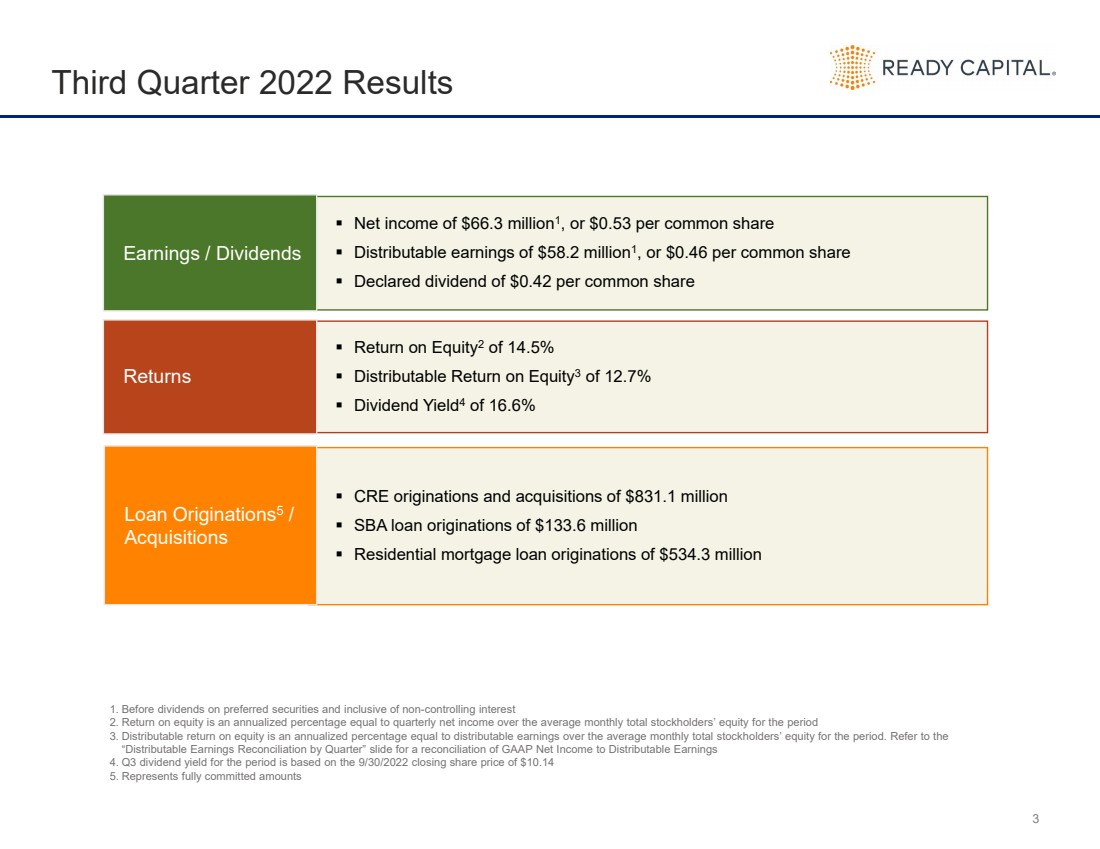
3Third Quarter 2022 Results Net income of $66.3 million1, or $0.53 per common share Distributable earnings of $58.2 million1, or $0.46 per common shareDeclared dividend of $0.42 per common share Earnings / Dividends Return on Equity2of 14.5%Distributable Return on Equity3of 12.7%Dividend Yield4of 16.6% Returns CREoriginationsandacquisitionsof$831.1millionSBAloanoriginationsof$133.6millionResidentialmortgageloanoriginationsof$534.3million Loan Originations5/ Acquisitions1.Before dividends on preferred securities and inclusive of non-controlling interest2.Return on equity is an annualized percentage equal to quarterly net income over the average monthly total stockholders’ equity for the period3.Distributable return on equity is an annualized percentage equal to distributable earnings over the average monthly total stockholders’ equity for the period. Refer to the “Distributable Earnings Reconciliation by Quarter” slide for a reconciliation of GAAP Net Income to Distributable Earnings4.Q3 dividend yield for the period is based on the 9/30/2022 closing share price of $10.145.Represents fully committed amounts |
4Third Quarter 2022 Results (continued) Issued$100.0millioninaggregateprincipalamountof7.375%SeniorUnsecuredNotesdue2027Fullmarkettomarketliabilitiesandcreditmarktomarketliabilitiesrepresent16%and13%oftotaldebt,respectivelyIncreasedthesizeoftheCompany'sexistingstockrepurchaseprogrambyanadditional$25million,bringingthetotalamountauthorizedundertheprogramto$50million.TheCompanyacquiredapproximately370thousandsharesoftheCompany’scommonstockatanaveragepriceof$10.29. Capital Markets Netbookvaluepershareof$15.40percommonshareTotalleverageof4.9xandrecourseleverageratioof1.6x1 Balance Sheet TheCompanyacquiredapproximately3.6millionsharesoftheCompany’scommonstockatanaveragepriceof$10.34.Completedthesecuritizationof$860.1millionoffloatingrateSBCloansandsold$656.9millionofseniorbondswithaweightedaveragecostofdebtofSOFR+3.0% Subsequent Events1. Recourse leverage ratio excludes $1.5 billion of secured borrowings that are non-recourse to the Company. |
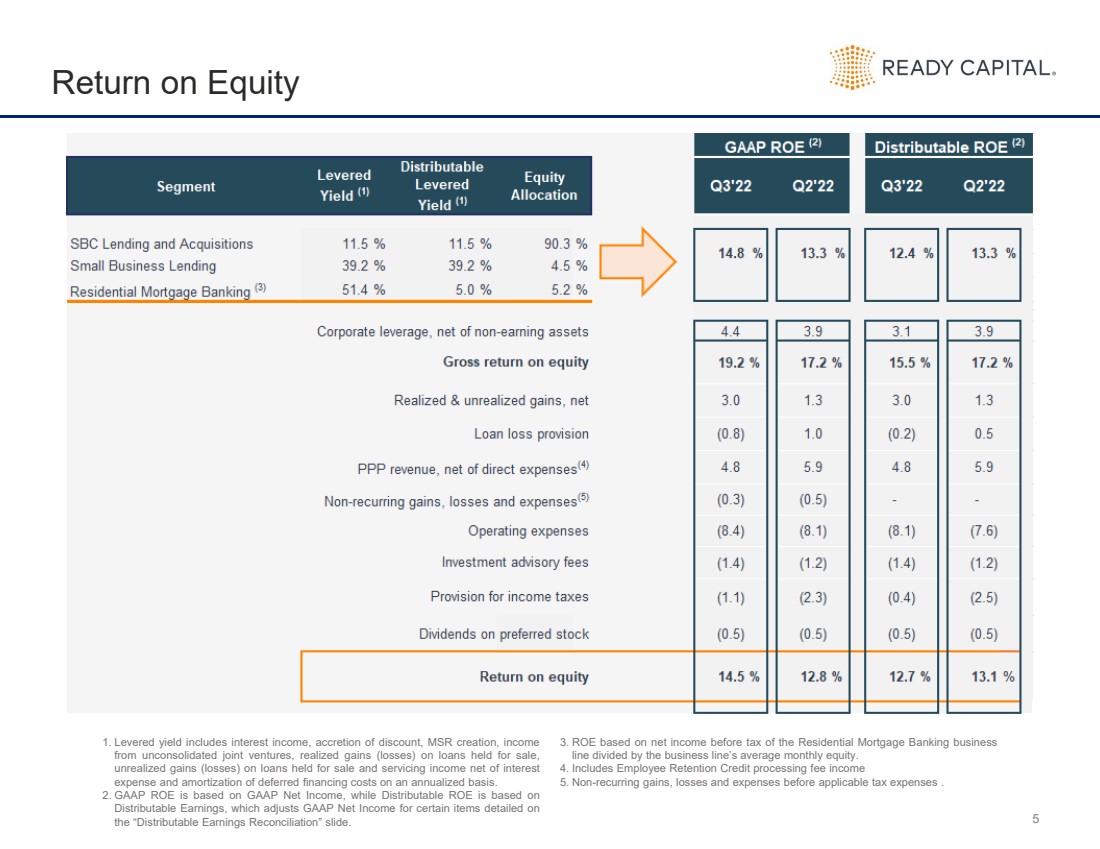
5Return on Equity1.Leveredyieldincludesinterestincome,accretionofdiscount,MSRcreation,incomefromunconsolidatedjointventures,realizedgains(losses)onloansheldforsale,unrealizedgains(losses)onloansheldforsaleandservicingincomenetofinterestexpenseandamortizationofdeferredfinancingcostsonanannualizedbasis.2.GAAPROEisbasedonGAAPNetIncome,whileDistributableROEisbasedonDistributableEarnings,whichadjustsGAAPNetIncomeforcertainitemsdetailedonthe“DistributableEarningsReconciliation”slide.3.ROEbasedonnetincomebeforetaxoftheResidentialMortgageBankingbusinesslinedividedbythebusinessline’saveragemonthlyequity.4.IncludesEmployeeRetentionCreditprocessingfeeincome5.Non-recurringgains,lossesandexpensesbeforeapplicabletaxexpenses. |
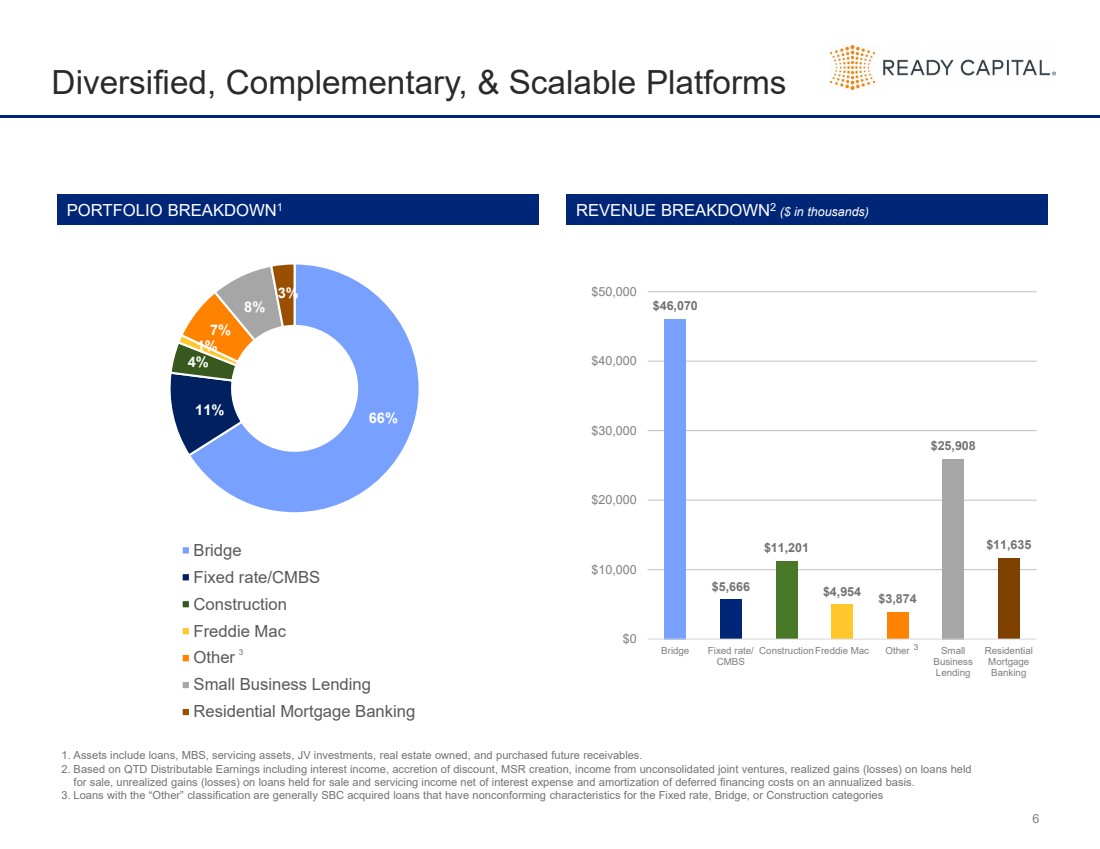
6Diversified, Complementary, & Scalable Platforms 66%11%4%1%7%8%3% Bridge Fixed rate/CMBS Construction Freddie Mac Other Small Business Lending Residential Mortgage Banking PORTFOLIO BREAKDOWN1 REVENUE BREAKDOWN2 ($ in thousands) $46,070$5,666$11,201$4,954$3,874$25,908$11,635$0$10,000$20,000 $30,000$40,000 $50,000BridgeFixed rate/CMBSConstructionFreddie MacOtherSmallBusinessLendingResidentialMortgageBanking31.Assetsincludeloans,MBS,servicingassets,JVinvestments,realestateowned,andpurchasedfuturereceivables.2.BasedonQTDDistributableEarningsincludinginterestincome,accretionofdiscount,MSRcreation,incomefromunconsolidatedjointventures,realizedgains(losses)onloansheldforsale,unrealizedgains(losses)onloansheldforsaleandservicingincomenetofinterestexpenseandamortizationofdeferredfinancingcostsonanannualizedbasis.3.Loanswiththe“Other”classificationaregenerallySBCacquiredloansthathavenonconformingcharacteristicsfortheFixedrate,Bridge,orConstructioncategories3 |
7SBC and SBA Investment by Platform $730.4$1,529.2$1,287.8$955.2$531.9$104.9$98.2$60.9$5.9$8.3$36.0$116.4$240.2$613.1$197.4$255.5$174.5$168.0$29.0$658.1$1.5$31.4$144.3$135.7$100.8$128.3$133.6$0$400$800$1,200 $1,600 $2,000 $2,400Q3'21Q4'21Q1'22Q2'22Q3'22 Bridge Fixed Rate/CMBS Construction Freddie Mac Acquired Other SBA $2,305.0 $2,405.2 $1,419.2 $964.71.Origination volumes are based on fully committed amounts in millions QUARTERLY INVESTMENT ACTIVITY1 $1,382.4 |
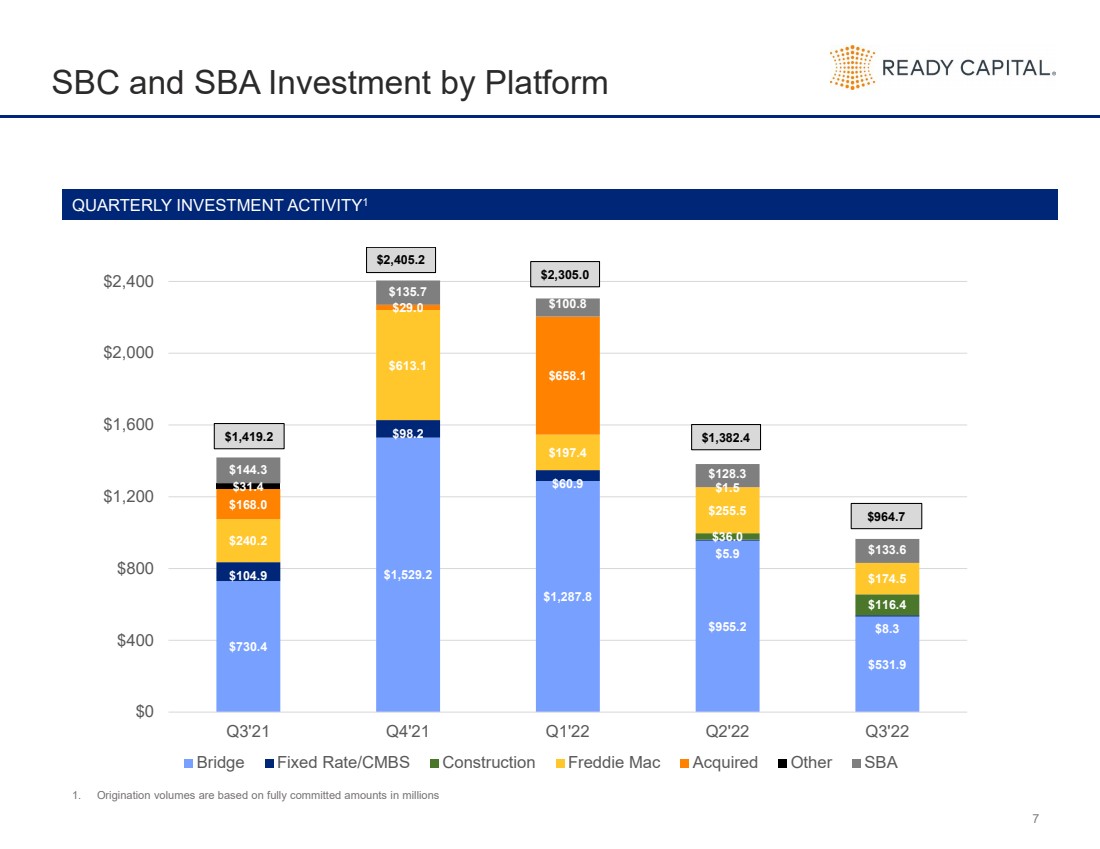
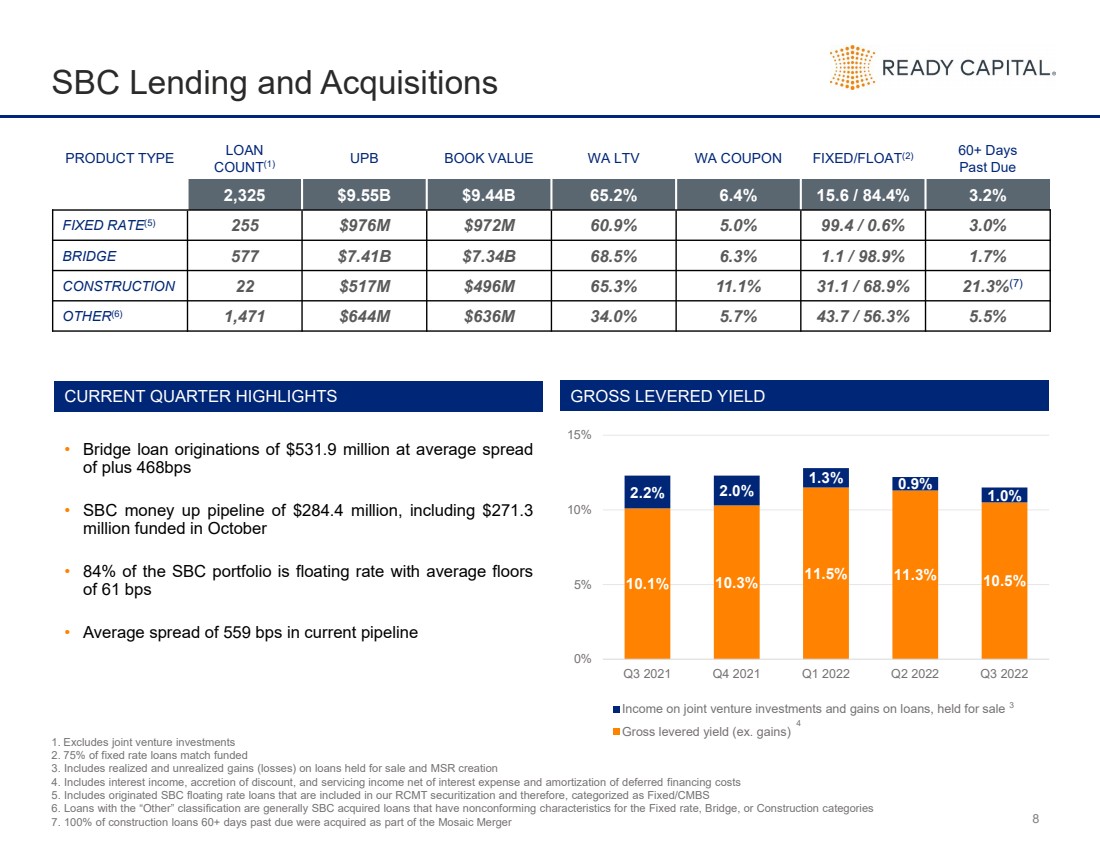
8SBC Lending and Acquisitions1.Excludes joint venture investments2.75% of fixed rate loans match funded3. Includes realized and unrealized gains (losses) on loans held for sale and MSR creation4. Includes interest income, accretion of discount, and servicing income net of interest expense and amortization of deferredfinancing costs5. Includes originated SBC floating rate loans that are included in our RCMT securitization and therefore, categorized as Fixed/CMBS6. Loans with the “Other” classification are generally SBC acquired loans that have nonconforming characteristics for the Fixed rate, Bridge, or Construction categories7.100%ofconstructionloans60+dayspastdue were acquired as part of the Mosaic Merger GROSS LEVERED YIELD PRODUCT TYPELOAN COUNT(1)UPBBOOK VALUEWA LTVWA COUPONFIXED/FLOAT(2)60+ Days Past Due2,325$9.55B$9.44B65.2%6.4%15.6 / 84.4%3.2%FIXED RATE(5)255$976M$972M60.9%5.0%99.4 / 0.6%3.0%BRIDGE577$7.41B$7.34B68.5%6.3%1.1 / 98.9%1.7%CONSTRUCTION22$517M$496M65.3%11.1%31.1 / 68.9%21.3%(7)OTHER(6)1,471$644M$636M34.0%5.7%43.7 / 56.3%5.5% CURRENT QUARTER HIGHLIGHTS 10.1%10.3%11.5%11.3%10.5%2.2%2.0%1.3%0.9%1.0%0%5%10% 15%Q3 2021Q4 2021Q1 2022Q2 2022Q3 2022 Income on joint venture investments and gains on loans, held for sale Gross levered yield (ex. gains)34•Bridgeloanoriginationsof$531.9millionataveragespreadofplus468bps•SBCmoneyuppipelineof$284.4million,including$271.3millionfundedinOctober•84%oftheSBCportfolioisfloatingratewithaveragefloorsof61bps•Averagespreadof559bpsincurrentpipeline |
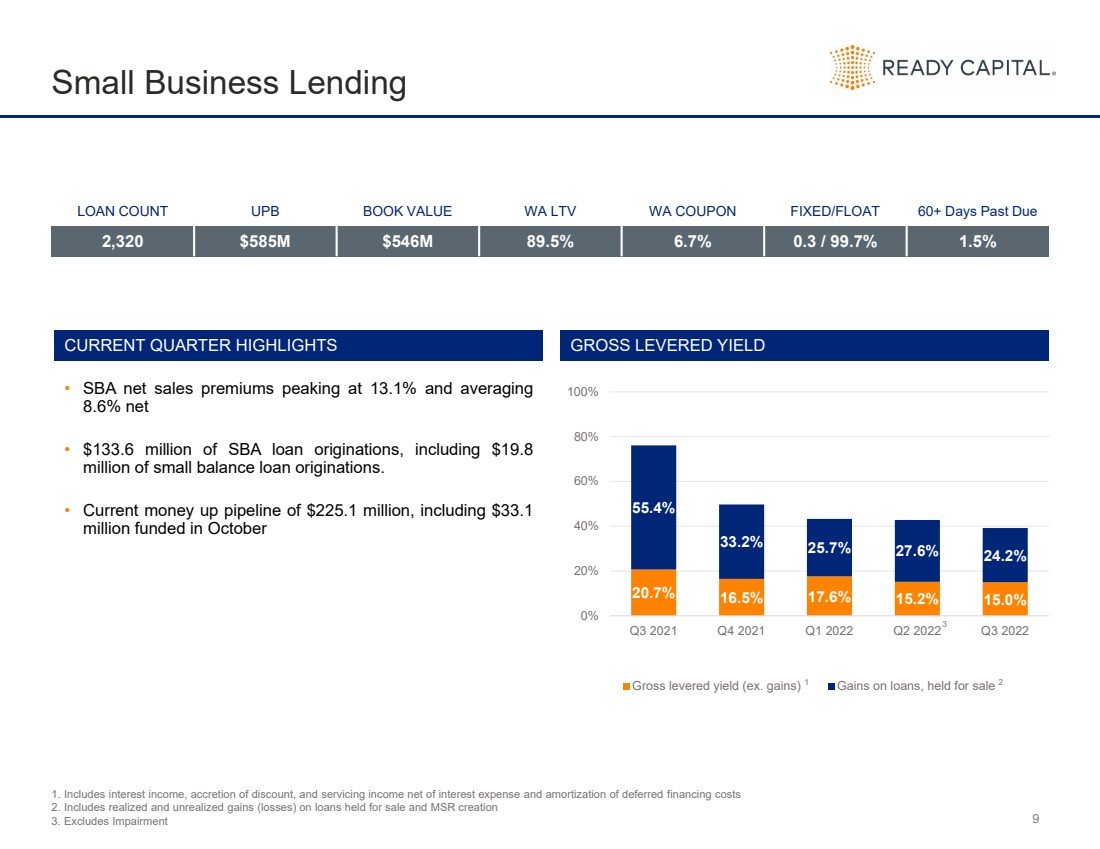
9Small Business Lending GROSS LEVERED YIELD LOAN COUNTUPBBOOK VALUEWA LTVWA COUPONFIXED/FLOAT60+ Days Past Due2,320$585M$546M89.5%6.7%0.3 / 99.7%1.5% CURRENT QUARTER HIGHLIGHTS 20.7%16.5%17.6%15.2%15.0%55.4%33.2%25.7%27.6%24.2%0%20%40%60%80%100%Q3 2021Q4 2021Q1 2022Q2 2022Q3 2022 Gross levered yield (ex. gains) Gains on loans, held for sale1. Includes interest income, accretion of discount, and servicing income net of interest expense and amortization of deferredfinancing costs2. Includes realized and unrealized gains (losses) on loans held for sale and MSR creation3. Excludes Impairment21•SBAnetsalespremiumspeakingat13.1%andaveraging8.6%net•$133.6millionofSBAloanoriginations,including$19.8millionofsmallbalanceloanoriginations.•Currentmoneyuppipelineof$225.1million,including$33.1millionfundedinOctober3 |
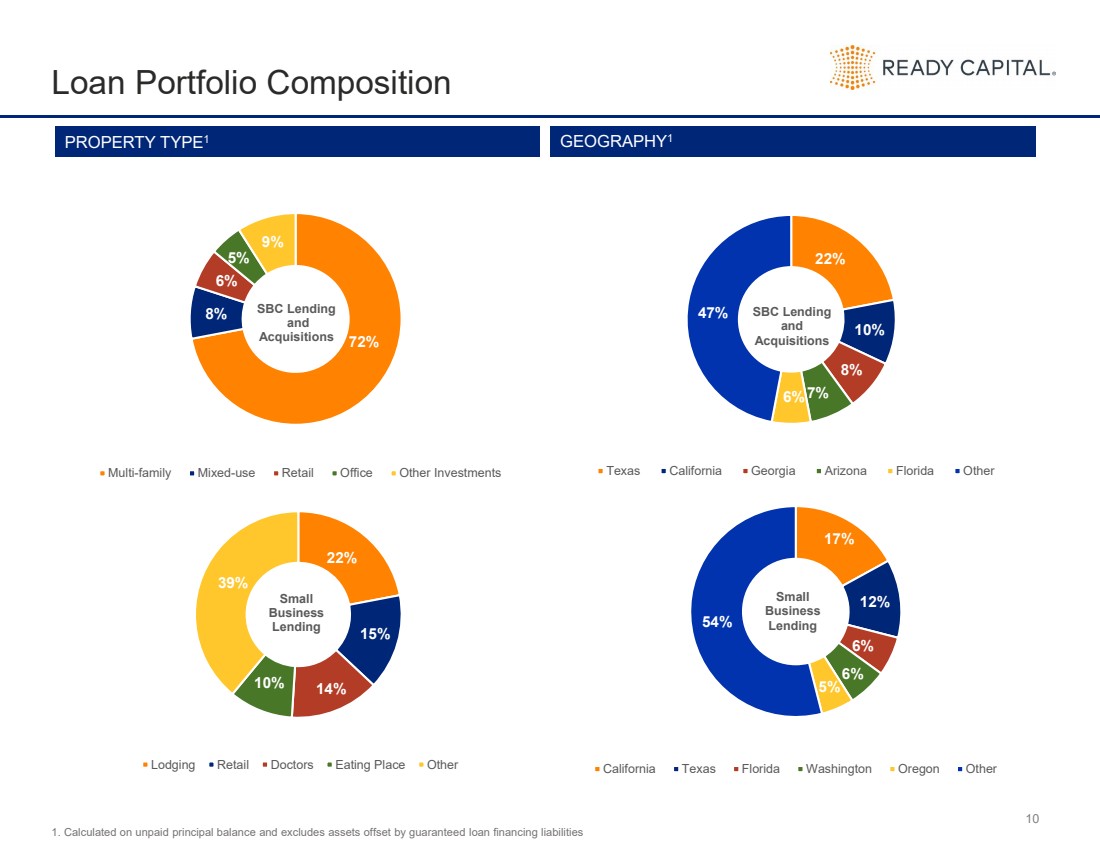
10Loan Portfolio Composition 22%15%14%10%39%Small Business Lending Lodging Retail Doctors Eating Place Other1. Calculated on unpaid principal balance and excludes assets offset by guaranteed loan financing liabilities 72%8%6%5%9%SBC Lendingand Acquisitions Multi-family Mixed-use Retail Office Other Investments PROPERTY TYPE1 GEOGRAPHY1 22%10%8%7%6%47%SBC Lendingand Acquisitions Texas California Georgia Arizona Florida Other 17%12%6%6%5%54%Small Business Lending California Texas Florida Washington Oregon Other |
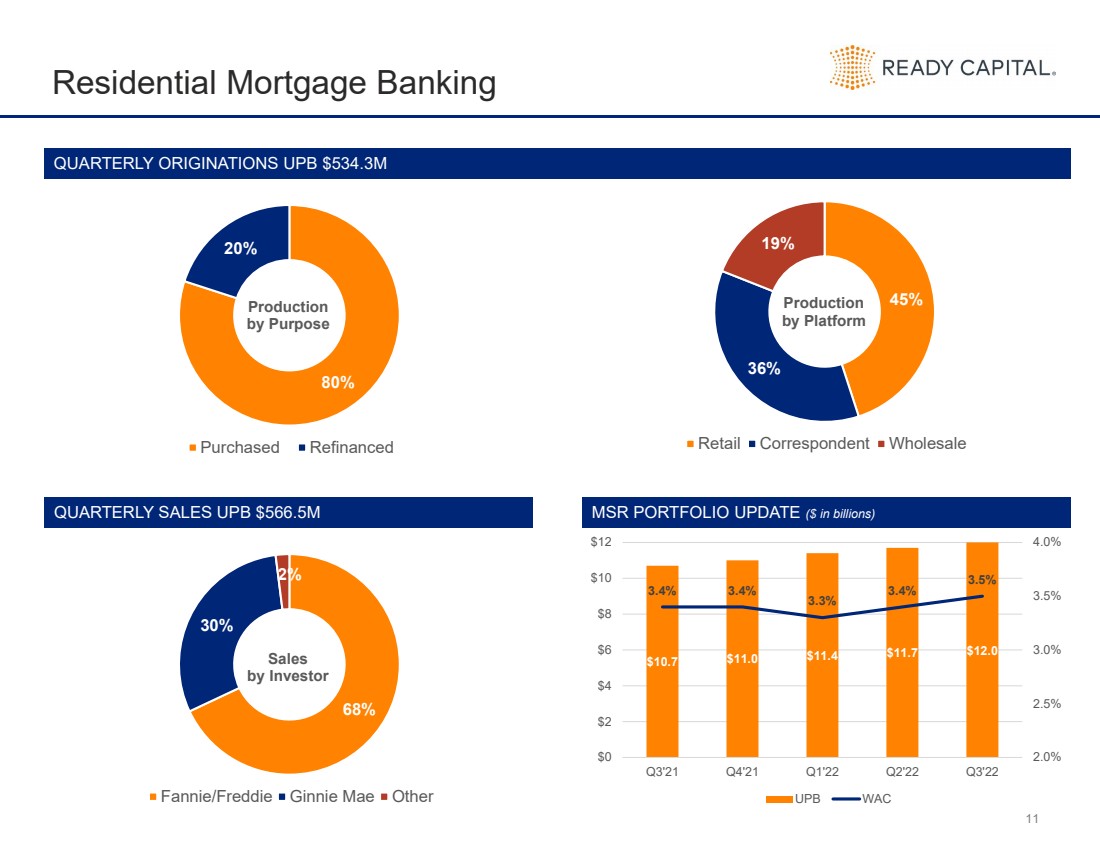
11 QUARTERLY ORIGINATIONS UPB $534.3MResidential Mortgage Banking 80%20%Production by Purpose Purchased Refinanced QUARTERLY SALES UPB $566.5M 68%30% 2% Sales by Investor Fannie/Freddie Ginnie Mae Other MSR PORTFOLIO UPDATE ($ in billions) 45%36%19%Production by Platform Retail Correspondent Wholesale $10.7$11.0$11.4$11.7$12.03.4%3.4%3.3%3.4%3.5%2.0%2.5% 3.0% 3.5% 4.0%$0$2$4$6 $8$10 $12Q3'21Q4'21Q1'22Q2'22Q3'22 UPB WAC |
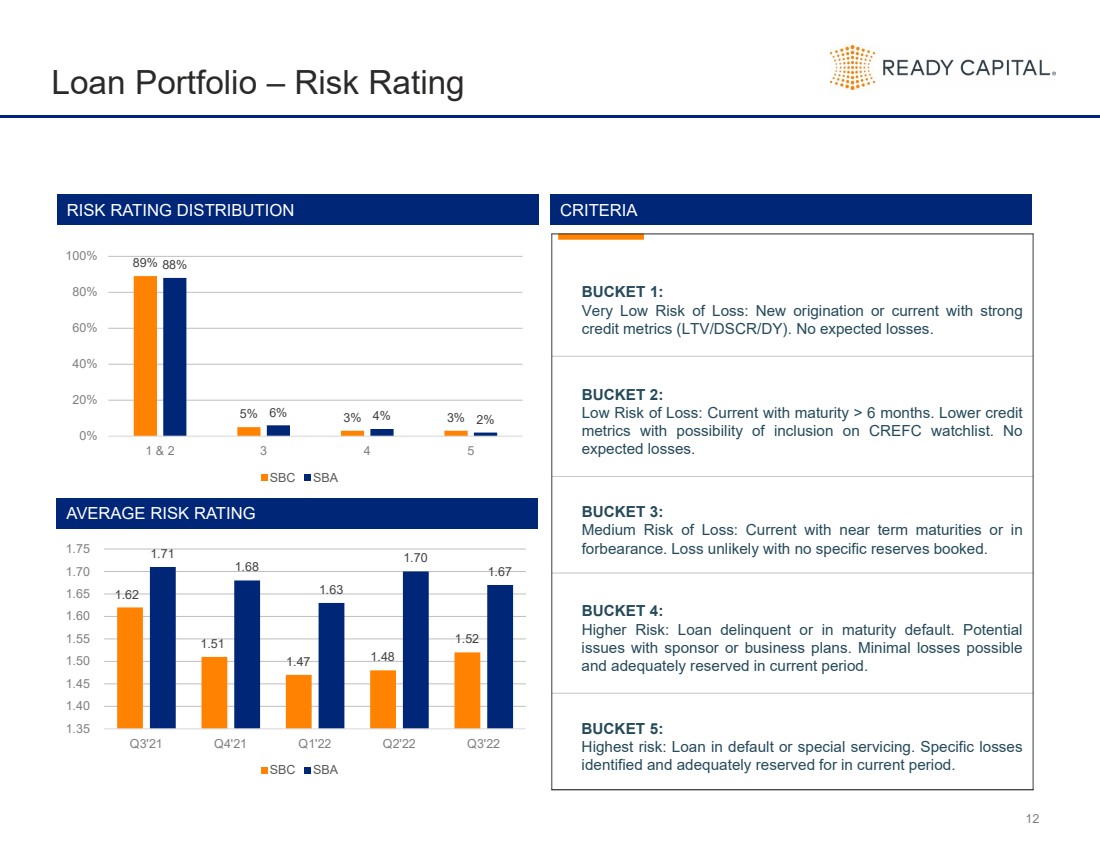
12Loan Portfolio –Risk Rating BUCKET1:VeryLowRiskofLoss:Neworiginationorcurrentwithstrongcreditmetrics(LTV/DSCR/DY).Noexpectedlosses.BUCKET2:LowRiskofLoss:Currentwithmaturity>6months.LowercreditmetricswithpossibilityofinclusiononCREFCwatchlist.Noexpectedlosses.BUCKET3:MediumRiskofLoss:Currentwithneartermmaturitiesorinforbearance.Lossunlikelywithnospecificreservesbooked.BUCKET4:HigherRisk:Loandelinquentorinmaturitydefault.Potentialissueswithsponsororbusinessplans.Minimallossespossibleandadequatelyreservedincurrentperiod.BUCKET5:Highestrisk:Loanindefaultorspecialservicing.Specificlossesidentifiedandadequatelyreservedforincurrentperiod. RISK RATING DISTRIBUTION CRITERIA 89%5%3%3%88%6%4%2%0%20%40% 60% 80%100%1 & 2345 SBC SBA 1.62 1.51 1.47 1.48 1.52 1.71 1.68 1.63 1.70 1.67 1.35 1.40 1.45 1.50 1.55 1.60 1.65 1.70 1.75Q3'21Q4'21Q1'22Q2'22Q3'22 SBC SBA AVERAGE RISK RATING |
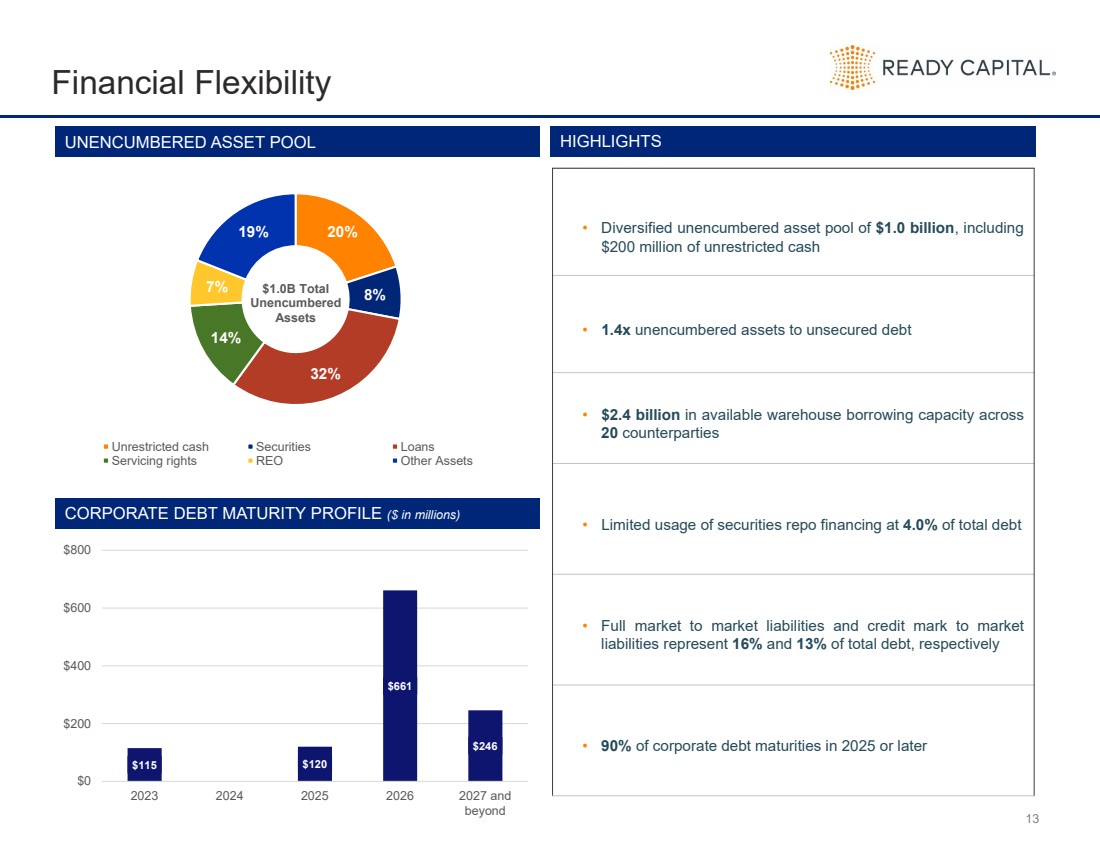
13Financial Flexibility 20%8%32%14%7%19%$1.0B Total Unencumbered Assets Unrestricted cash Securities Loans Servicing rights REO Other Assets UNENCUMBERED ASSET POOL HIGHLIGHTS $115 $120 $661 $246$0$200$400$600 $80020232024202520262027 andbeyond CORPORATE DEBT MATURITY PROFILE ($ in millions) •Diversifiedunencumberedassetpoolof$1.0billion,including$200millionofunrestrictedcash•1.4xunencumberedassetstounsecureddebt•$2.4billioninavailablewarehouseborrowingcapacityacross20counterparties•Limitedusageofsecuritiesrepofinancingat4.0%oftotaldebt•Fullmarkettomarketliabilitiesandcreditmarktomarketliabilitiesrepresent16%and13%oftotaldebt,respectively•90%ofcorporatedebtmaturitiesin2025orlater |
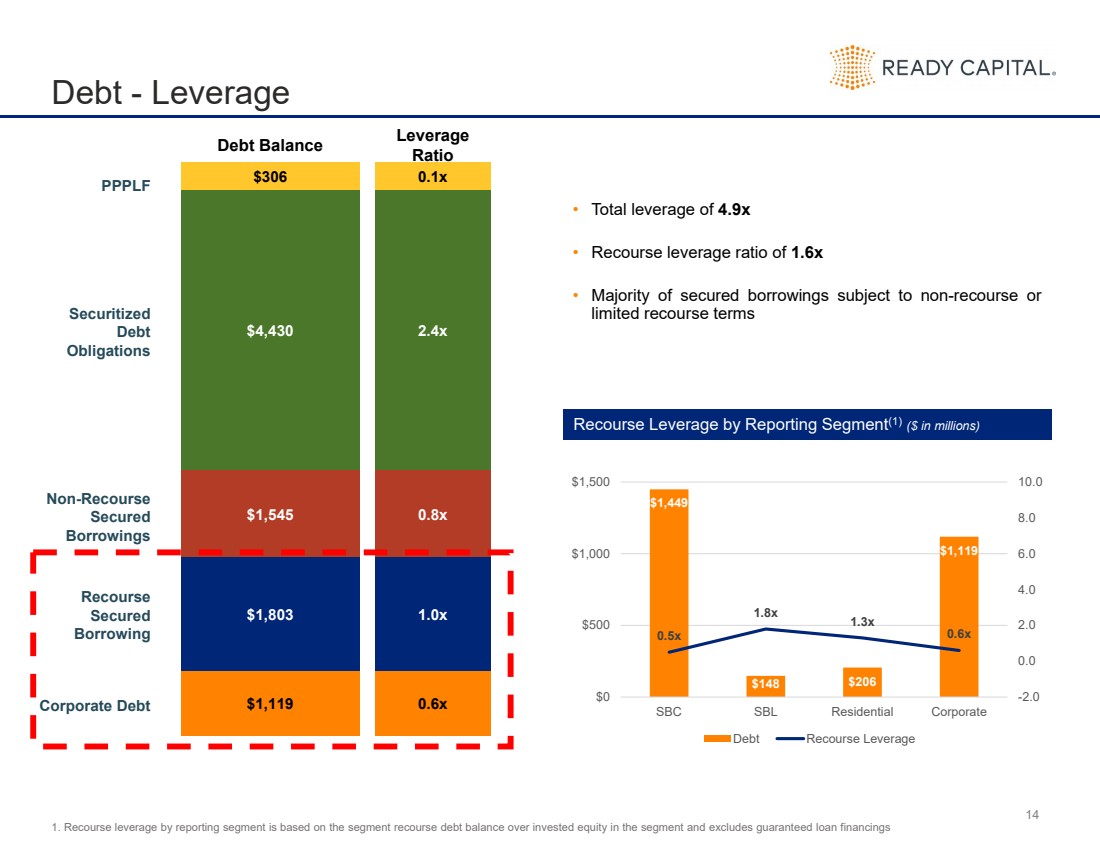
14Debt -LeverageCorporate DebtPPPLFSecuritized Debt ObligationsNon-Recourse Secured BorrowingsRecourse Secured Borrowing 0.1x2.4x0.8x1.0x0.6xDebt Balance Leverage Ratio•Totalleverageof4.9x•Recourseleverageratioof1.6x•Majorityofsecuredborrowingssubjecttonon-recourseorlimitedrecourseterms Recourse Leverage by Reporting Segment(1)($ in millions) $1,449$148$206$1,1190.5x1.8x1.3x0.6x-2.00.02.04.06.0 8.0 10.0$0$500$1,000$1,500SBCSBLResidentialCorporate Debt Recourse Leverage1. Recourse leverage by reporting segment is based on the segment recourse debt balance over invested equity in the segment and excludes guaranteed loan financings $306$4,430$1,545$1,803$1,119 |
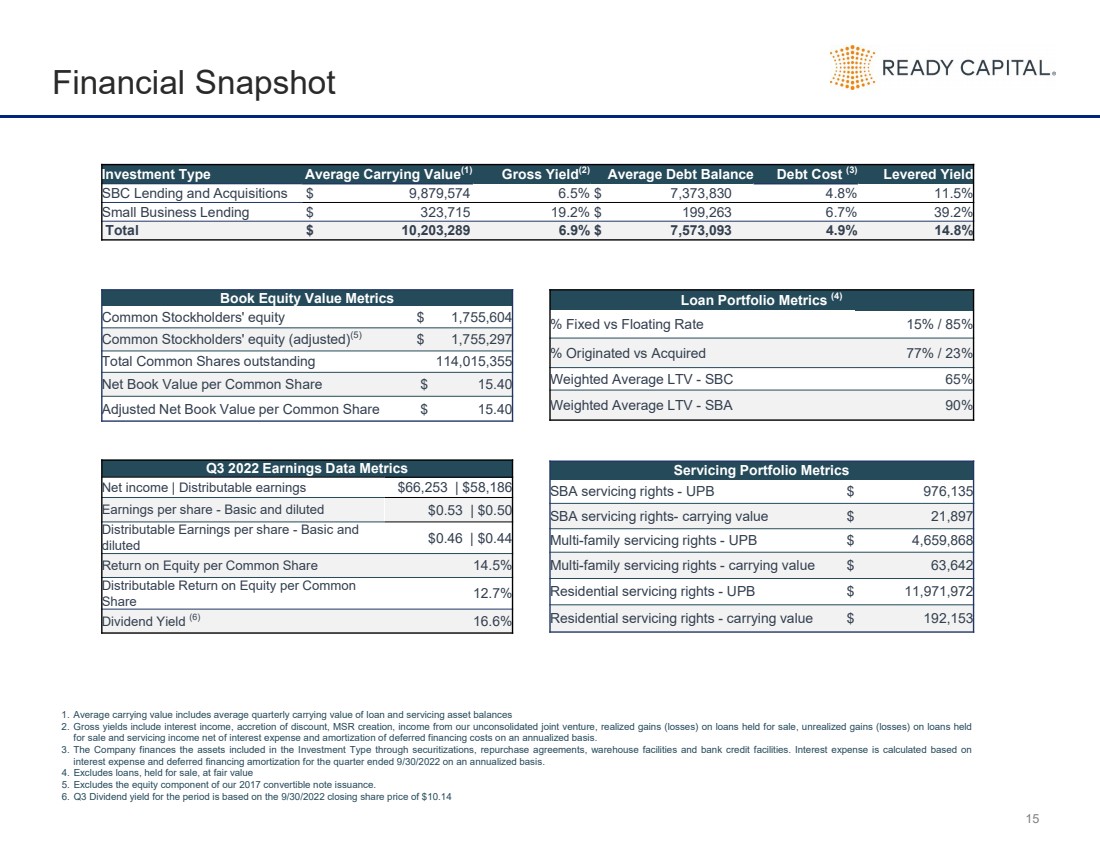
15Financial Snapshot Investment Type Average Carrying Value (1) Gross Yield(2) Average Debt Balance Debt Cost (3) Levered Yield SBC Lending and Acquisitions $ 9,879,574 6.5%$ 7,373,830 4.8% 11.5% Small Business Lending $ 323,715 19.2%$ 199,263 6.7% 39.2% Total $ 10,203,289 6.9% $ 7,573,093 4.9% 14.8% Book Equity Value Metrics Common Stockholders' equity $ 1,755,604 Common Stockholders' equity (adjusted) (5) $ 1,755,297 Total Common Shares outstanding 114,015,355 Net Book Value per Common Share $ 15.40 Adjusted Net Book Value per Common Share $ 15.40 Loan Portfolio Metrics (4)% Fixed vs Floating Rate 15% / 85% % Originated vs Acquired 77% / 23% Weighted Average LTV -SBC 65% Weighted Average LTV -SBA 90% Q3 2022 Earnings Data Metrics Net income | Distributable earnings $66,253 | $58,186 Earnings per share -Basic and diluted $0.53 | $0.50 Distributable Earnings per share -Basic and diluted $0.46 | $0.44 Return on Equity per Common Share 14.5% Distributable Return on Equity per Common Share 12.7% Dividend Yield (6) 16.6% Servicing Portfolio MetricsSBA servicing rights -UPB $ 976,135 SBA servicing rights-carrying value $ 21,897 Multi-family servicing rights -UPB $ 4,659,868 Multi-family servicing rights -carrying value $ 63,642 Residential servicing rights -UPB $ 11,971,972 Residential servicing rights -carrying value $ 192,153 1.Averagecarryingvalueincludesaveragequarterlycarryingvalueofloanandservicingassetbalances2.Grossyieldsincludeinterestincome,accretionofdiscount,MSRcreation,incomefromourunconsolidatedjointventure,realizedgains(losses)onloansheldforsale,unrealizedgains(losses)onloansheldforsaleandservicingincomenetofinterestexpenseandamortizationofdeferredfinancingcostsonanannualizedbasis.3.TheCompanyfinancestheassetsincludedintheInvestmentTypethroughsecuritizations,repurchaseagreements,warehousefacilitiesandbankcreditfacilities.Interestexpenseiscalculatedbasedoninterestexpenseanddeferredfinancingamortizationforthequarterended9/30/2022onanannualizedbasis.4.Excludesloans,heldforsale,atfairvalue5.Excludestheequitycomponentofour2017convertiblenoteissuance.6.Q3Dividendyieldfortheperiodisbasedonthe9/30/2022closingsharepriceof$10.14 |
APPENDIXAdditional Financial Information |
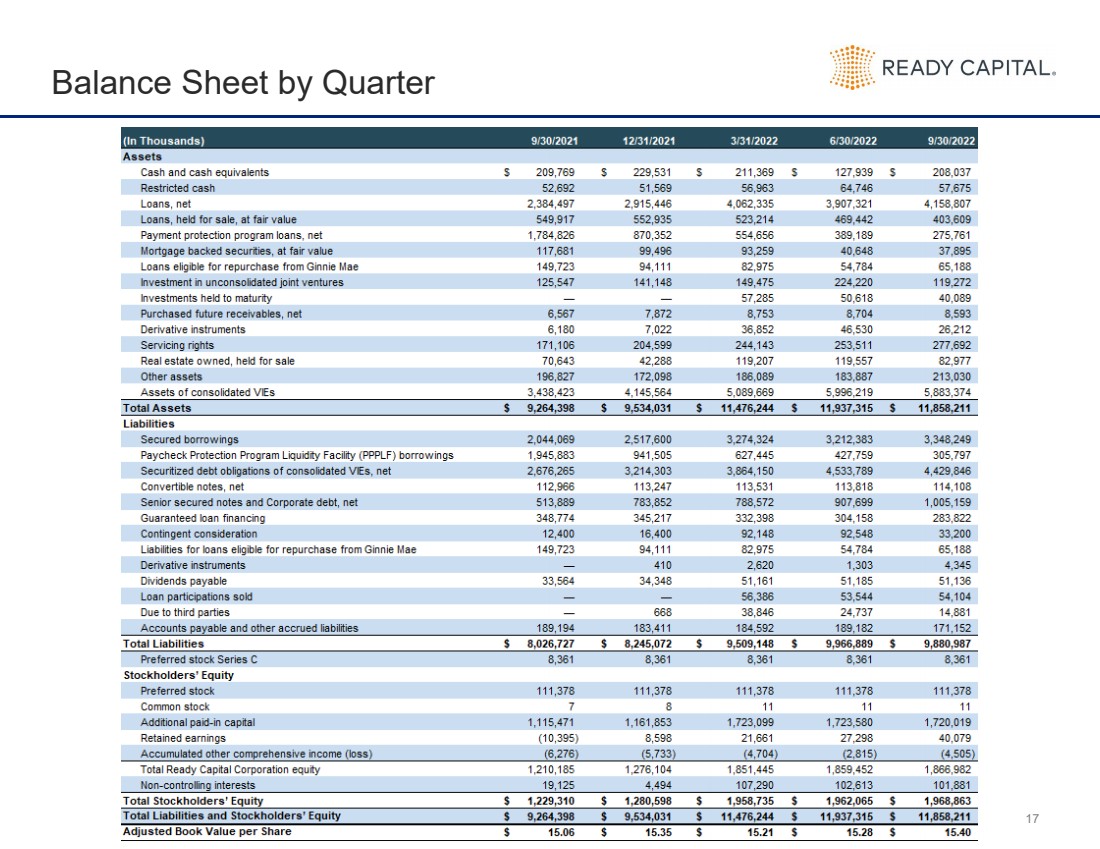
17Balance Sheet by Quarter |
18Statement of Income by Quarter |
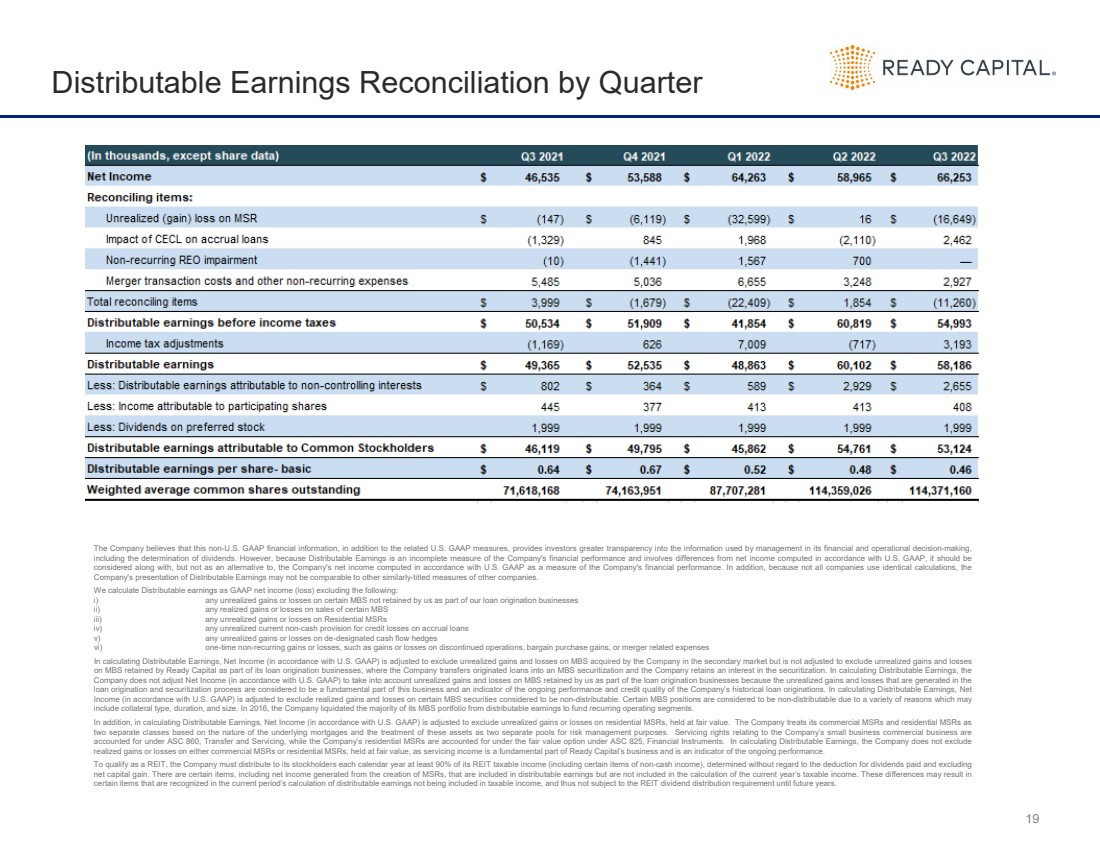
19Distributable Earnings Reconciliation by QuarterTheCompanybelievesthatthisnon-U.S.GAAPfinancialinformation,inadditiontotherelatedU.S.GAAPmeasures,providesinvestorsgreatertransparencyintotheinformationusedbymanagementinitsfinancialandoperationaldecision-making,includingthedeterminationofdividends.However,becauseDistributableEarningsisanincompletemeasureoftheCompany'sfinancialperformanceandinvolvesdifferencesfromnetincomecomputedinaccordancewithU.S.GAAP,itshouldbeconsideredalongwith,butnotasanalternativeto,theCompany'snetincomecomputedinaccordancewithU.S.GAAPasameasureoftheCompany'sfinancialperformance.Inaddition,becausenotallcompaniesuseidenticalcalculations,theCompany'spresentationofDistributableEarningsmaynotbecomparabletoothersimilarly-titledmeasuresofothercompanies.WecalculateDistributableearningsasGAAPnetincome(loss)excludingthefollowing:i)anyunrealizedgainsorlossesoncertainMBSnotretainedbyusaspartofourloanoriginationbusinessesii)anyrealizedgainsorlossesonsalesofcertainMBSiii)anyunrealizedgainsorlossesonResidentialMSRsiv)anyunrealizedcurrentnon-cashprovisionforcreditlossesonaccrualloansv)anyunrealizedgainsorlossesonde-designatedcashflowhedgesvi)one-timenon-recurringgainsorlosses,suchasgainsorlossesondiscontinuedoperations,bargainpurchasegains,ormergerrelatedexpensesIncalculatingDistributableEarnings,NetIncome(inaccordancewithU.S.GAAP)isadjustedtoexcludeunrealizedgainsandlossesonMBSacquiredbytheCompanyinthesecondarymarketbutisnotadjustedtoexcludeunrealizedgainsandlossesonMBSretainedbyReadyCapitalaspartofitsloanoriginationbusinesses,wheretheCompanytransfersoriginatedloansintoanMBSsecuritizationandtheCompanyretainsaninterestinthesecuritization.IncalculatingDistributableEarnings,theCompanydoesnotadjustNetIncome(inaccordancewithU.S.GAAP)totakeintoaccountunrealizedgainsandlossesonMBSretainedbyusaspartoftheloanoriginationbusinessesbecausetheunrealizedgainsandlossesthataregeneratedintheloanoriginationandsecuritizationprocessareconsideredtobeafundamentalpartofthisbusinessandanindicatoroftheongoingperformanceandcreditqualityoftheCompany’shistoricalloanoriginations.IncalculatingDistributableEarnings,NetIncome(inaccordancewithU.S.GAAP)isadjustedtoexcluderealizedgainsandlossesoncertainMBSsecuritiesconsideredtobenon-distributable.CertainMBSpositionsareconsideredtobenon-distributableduetoavarietyofreasonswhichmayincludecollateraltype,duration,andsize.In2016,theCompanyliquidatedthemajorityofitsMBSportfoliofromdistributableearningstofundrecurringoperatingsegments. Inaddition,incalculatingDistributableEarnings,NetIncome(inaccordancewithU.S.GAAP)isadjustedtoexcludeunrealizedgainsorlossesonresidentialMSRs,heldatfairvalue.TheCompanytreatsitscommercialMSRsandresidentialMSRsastwoseparateclassesbasedonthenatureoftheunderlyingmortgagesandthetreatmentoftheseassetsastwoseparatepoolsforriskmanagementpurposes.ServicingrightsrelatingtotheCompany’ssmallbusinesscommercialbusinessareaccountedforunderASC860,TransferandServicing,whiletheCompany’sresidentialMSRsareaccountedforunderthefairvalueoptionunderASC825,FinancialInstruments.IncalculatingDistributableEarnings,theCompanydoesnotexcluderealizedgainsorlossesoneithercommercialMSRsorresidentialMSRs,heldatfairvalue,asservicingincomeisafundamentalpartofReadyCapital’sbusinessandisanindicatoroftheongoingperformance.ToqualifyasaREIT,theCompanymustdistributetoitsstockholderseachcalendaryearatleast90%ofitsREITtaxableincome(includingcertainitemsofnon-cashincome),determinedwithoutregardtothedeductionfordividendspaidandexcludingnetcapitalgain.Therearecertainitems,includingnetincomegeneratedfromthecreationofMSRs,thatareincludedindistributableearningsbutarenotincludedinthecalculationofthecurrentyear’staxableincome.Thesedifferencesmayresultincertainitemsthatarerecognizedinthecurrentperiod’scalculationofdistributableearningsnotbeingincludedintaxableincome,andthusnotsubjecttotheREITdividenddistributionrequirementuntilfutureyears. |
'=,L?VV_V>=8MX8XM4O[X173H &D6.5/
M++>N-[#/I]*;X8^$GQL_9?\ %7B _!?3=$^(OPXUVZ:]ATN\OXX)+&0]0KM(
M@X&!D%L@#(!%>8>--%^)]S^VM\#]9^)]QIL>O:G>K+;Z%I!+P:9;12<)NR=S
M,=[$@GIU/0 S],****8@HHHH **** "BBB@ HHHH **** "BBB@ HHHH ***
M* "BBB@ HHHH **** "BBB@ HHHH **** "BBB@ HHHH **** "BBB@ HHHH
M *S?$6D?V]HUQ8_:[JP\W;_I%E)Y7F5YBORXGX=\\:NAZ'_ &.+W-Y=WGVFX>X_TJ7?Y6[^!/1!C@5J[%]*7:,5])3P\8/F
MU;O?5]U9V[;?>>).M*2Y;)+;03 XXH ]J7:*-HKI,!,=>*"..E+M%&T4 )CG
MI2X]J-HHP* $ XZ4F/:G;11M% "8YZ4F/:G8%&T4 )C@\48YZ4NT48% "8YZ
M4 >U+M%&T4 )CIQ1CGI2[11M% " >U!'M2[11@4 -Q[4N.>E+M%&T4 (1QTI
M,>U.P*-HH 6BBB@ HHHH **** "BBB@ HHHH **** "BBB@ HHHH **** "B
MBB@ HHHH **** "BBB@ HHHH **** "BBB@ HHHH **** "BBB@ HHHH ***
M* ,'QYX,T_XB>"];\,:J'.G:M:26<_EG#!74C(]QG(^E?)/@WX)?M1_ K0E\
M'>!?%O@O7_"=NSKI]QKD,J7-K&S$X*JA'4DXRX]..*^U** /GO\ 9D_9AU'X
M1:[XC\;>-?$2^+?B+XD(^WZA$A6"%,@^7$" 2,@
=N_;QNQG'%4*Z:6&C24
MX_S-_B93JN3B^Q[C^T7\+_&=[^T7XF@CT?4-8N-?U66]TN>TA:9+^"9R\4D3
M $,I5EY!XZ'I7TEKWB#0]-\2_&M-7TZ'Q8NA^ -&TS6K5+QX5NKN&2W253-'
M\V5; )'="*^--"^.GQ&\,>&F\/:1XZ\1:9H9!7^S[34YHX5!ZA5#84'N!C-<
MO8^(M5TRVU&VL]3O+2WU*,17L,%PZ)=(!90#AQN .&R,@&N.6#J58QC-KW
M4DK7UU3^6W3[S95XP;<5O_D_\SZBU[6-!U_]ECQ%J?PA\*6?A6%[F"U\;Z22&.,8C1&))55 4#@=J'@&V
MTI::[W;UMO?>UONT&L2E9V[?KMVW^\^@?V9?@SX?\:>,$\,>)M"^(FC^)TDG
M$^JZ//':6VGPB(DF=9+=G7HRDE@#N KN?A/&L/A']F.-#N5?']^H)[@36]?-
M^O\ Q\^)7BK0/[#UGQ]XDU31]NQK*[U2:2)U]&4M\P]CFN._BYXV^)_V8>+?%FL>(UMO]2FI7LDR1'N55B0"?4?5?&EE*VBK+=Q10?Z+(J%3;NKX15
M"\G![\UQO[2<,.M? 3X7Z_%X
)=5\1W%NNR%]3NWG\
MI>X7<3MSWQUI_5*K48N5K-NZO=7OHKZ/1V3>W;LO;05VEO\ CL?6OQLMM+\6
M?LQ^)-3A^(/AC4+&W\4P-IMEI4=ZL%O#'9M'#81"2!?G"?-DX4_,2V3BOEWP
M7\-/%FO3ZO\ V=I-Q*=-TW^UKW3Y6:"2XL@R[BJ9#2*<@_+GCGM7*KKNI+HK
M:.-0NAI#3BZ:P$[>09@NT2&/.W?M.-V,XXK4MOB/XLL_$%AKL'B;5X]:L(DM
M[345OI?M%O$@VI&C[MRJ!P%!P!QBMJ.&J8>G*$)7N[Z_+L1.K&I)2DC[5^'E
MY:>+M>_9H\2VNB#P1;)KE[IMKX9MV9K5XU42->0F3,IWLVUF=GR5VKG[J2
M*_T.Q^/SLK77AW0KK0YV)Y.L0N+6S8_[1AFCD_[8FOE/6OBSXU\1^*K;Q-J?
MBW6[WQ#:X^SZI-?RFY@QT\N3=E.I^Z1U-8Q\3ZP=%GT?^UK[^R)[@7
:-:>)K>/]_9L+>Y('6)C\I/T8X_X'[5\SU]]^
M*M#C\3>&M3TJ3&V[MWA!/\+$?*?P.#^%? TL3P2O'(I5T)5E/8CJ*_F_Q#RV
M.%S&&,@K*JM?\4=']Z:^=S]ZX&Q[Q.!EA9O6F]/\+U7XW_ ;1117Y4?I(444
M4 %?0/[)FL;;WQ!I3-]^..Z1?3:2K'_QY/RKY^KU#]FZ_-G\5+&(-@74$T)]
MP$+_ ,T%?6<*8EX7.\--=9-X(Y#X&!D8KT2B@#+U?POHVOZ6NF:II%CJ6G+C;9W=LDL(
MQTPC CCZ4V'PEH=O9V%I%HVGQ6MA*)K2!+5 EM(,X>-0,(PR>1@\FM:B@"E_
M8FG?;;J\^P6OVR[B6&XN/)7S)HUSM1VQEE&XX!X&3ZUFZ+\/O"WANZ6ZTGPU
MI&EW*[]LUE810N-V-V"J@\X&?7 K?HH PK/P)X:T[6Y-9M/#VE6NL2$E]0AL
MHDN'SUS(%W'/UJR?"VBMIU[IYTBP-A?.\EU:FV3RKAW.7:1<88L>I(.>]:E%
M &6/"^C+K46L#2+ :M%#]GCOQ;)YZ1?W!)C<%]LXK4HHH *HWFAZ;J-_97UW
MI]K=7MBS-:W,T*O);EAAC&Q&5)'!QC-7J* *4NB:=/JT&J2V%K)J=O&T,-Z\
M*F:-&^\JOC(!P,@'!IB^']+1=15=-LU7426O0($ NB5VDR\?/\H ^;/'%:%%
M &'JW@7PWKVGVECJ?A[2M1L;-0MM;7=E%+' $5E(4 #CTJXGA_2X[BQG
M73;-9[&-HK240(&MT8 ,L9QE00 "!C.!6A10!A0^!/#5OKS:Y%X>TJ/6F)+:
MDEE$+DD]