DocumentSUPPLEMENTAL
FINANCIAL
INFORMATION
| | |
| YEAR ENDED DECEMBER 31, 2021 |
| | | | | |
| Table of Contents | |
| Page |
| Company Overview | |
| Financial and Portfolio Overview | |
| Financial and Operating Results | |
| Financial Summary | |
| Consolidated Balance Sheets | |
| Consolidated Statements of Operations | |
| Reconciliation of Non-GAAP Measures | |
| Debt Summary | |
| Portfolio Summary | |
| Property Summary | |
| Top Ten Tenants by Annualized Base Rent and Lease Expiration Schedule | |
| Leasing Summary | |
| Definitions | |
Forward-Looking Statements
This document contains forward-looking statements that are within the meaning of Section 27A of the Securities Act of 1933, as amended, and Section 21E of the Securities Exchange Act of 1934, as amended, and such statements are intended to be covered by the safe harbor. These forward-looking statements are based on current expectations, forecasts and assumptions that involve risks and uncertainties that could cause actual outcomes and results to differ materially. These risks include, without limitation: the ongoing adverse effect of the COVID-19 pandemic, and federal, state, and/or local regulatory guidelines and private business actions to control it, on the financial condition, operating results and cash flows of Wheeler Real Estate Investment Trust, Inc. (the "Company" or "WHLR"), the Company’s tenants and their customers, the use of and demand for retail space, the real estate market in which the Company operates, the U.S. economy, the global economy and the financial markets; general and economic business conditions, including those affecting the ability of individuals to spend in retail shopping centers and/or the rate and other terms on which we are able to lease our properties; tenant bankruptcies; availability, terms and deployment of capital; general volatility of the capital markets and the market price of our common and preferred stock; the degree and nature of our competition; changes in governmental regulations, accounting rules, tax rates and similar matters; adverse economic or real estate developments in our markets of Virginia, Florida, Georgia, Alabama, South Carolina, North Carolina, Oklahoma, Kentucky, Tennessee, West Virginia, New Jersey and Pennsylvania; litigation risks; lease-up risks; increases in the Company’s financing and other costs as a result of changes in interest rates and other factors, including the expected discontinuation of the London Interbank Offered Rate (“LIBOR”); changes in our ability to obtain and maintain financing; damage to the Company’s properties from catastrophic weather and other natural events, and the physical effects of climate change; information technology security breaches; the Company’s ability and willingness to maintain its qualification as a REIT in light of economic, market, legal, tax and other considerations; the ability of our operating partnership, Wheeler REIT, L.P., and each of our other partnerships and limited liability companies to be classified as partnerships or disregarded entities for federal income tax purposes; the impact of e-commerce on our tenants’ business; and inability to generate sufficient cash flows due to market conditions, competition, uninsured losses, changes in tax or other applicable laws. When used in this presentation, the words "continue," "may," "approximately," "potentially," or similar expressions, are intended to identify forward-looking statements.
| | | | | |
WHLR | Financial & Operating Data | 2 |
Currently, one of the Company's most significant risk factors is the coronavirus pandemic, or COVID-19. The extent to which COVID-19 continues to impact the financial condition, results of operations, cash flows and performance of the Company and its tenants, the real estate market and the global economy and financial markets will depend on future developments, which are highly uncertain and cannot be predicted with confidence, including the scope, severity and duration of the pandemic, the actions taken to contain the pandemic or mitigate its impact, and the direct and indirect economic effects of the pandemic and containment measures, among others. Statements regarding the impact and severity of COVID-19 may be forward-looking.
The forward-looking statements are based on management's beliefs, assumption and expectation of future performance, taking into account all information currently available to the Company. Forward-looking statements are not predictions of future events. For a description of the risks and uncertainties that could impact the Company's future results, performance or transactions, see the reports filed by the Company with the Securities and Exchange Commission, including its quarterly reports on Form 10-Q and annual reports on Form 10-K. The Company disclaims any responsibility to update or revise any forward-looking statements, whether as a result of new information, future events or otherwise.
| | | | | |
WHLR | Financial & Operating Data | 3 |
Company Overview
Headquartered in Virginia Beach, VA, Wheeler Real Estate Investment Trust, Inc. (NASDAQ: WHLR) is a fully-integrated, self-managed commercial real estate investment company focused on owning and operating income-producing retail properties with a primary focus on grocery-anchored centers. WHLR’s portfolio contains well-located, potentially dominant retail properties in secondary and tertiary markets that generate attractive, risk-adjusted returns. WHLR’s common stock, Series B convertible preferred stock, Series D cumulative convertible preferred stock, and 7% Senior Subordinated Convertible Notes due 2031, trade publicly on NASDAQ under the symbols “WHLR”, “WHLRP”, "WHLRD", and "WHLRL", respectively.
| | | | | | | | |
| Corporate Headquarters | | |
| Wheeler Real Estate Investment Trust, Inc. | | |
| Riversedge North | | |
2529 Virginia Beach Boulevard
Virginia Beach, VA 23452 | | |
Phone: (757) 627-9088
Toll Free: (866) 203-4864 | | |
| Website: www.whlr.us | | |
| | |
| Executive Management | | |
| M. Andrew Franklin - CEO and President | | |
| Crystal Plum - CFO | | |
| | |
| | |
| Board of Directors | | |
Stefani D. Carter (Chair) | Michelle D. Bergman | |
Saverio M. Flemma | Paula J. Poskon | |
E. J. Borrack | Joseph D. Stilwell | |
Kerry G. Campbell | | |
| | |
| Investor Relations Representative | | |
Mary Jensen - IRRealized, LLC mjensen@whlr.us
Office: (757) 627-9088 Cell: (310) 526-1707 | | |
| | |
| Stock Transfer Agent and Registrar | | |
Computershare Trust Company, N.A.
250 Royall Street
Canton, MA 02021
www.computershare.com | | |
| | | | | |
WHLR | Financial & Operating Data | 4 |
Financial and Portfolio Overview
For the Three Months Ended December 31, 2021
| | | | | |
Financial Results | |
| Net loss attributable to Wheeler REIT common stockholders (in 000s) | $ | (7,540) | |
| Net loss per basic and diluted shares | $ | (0.78) | |
Funds from operations available to common stockholders and Operating Partnership (OP) unitholders (FFO) (in 000s) (1) | $ | (3,422) | |
| FFO per common share and OP unit | $ | (0.34) | |
Adjusted FFO (AFFO) (in 000s) (1) | $ | 1,888 | |
| AFFO per common share and OP unit | $ | 0.19 | |
| |
Assets and Leverage | |
| Investment Properties, net of $67.6 million accumulated depreciation (in 000s) | $ | 386,730 | |
| Cash and Cash Equivalents (in 000s) | $ | 22,898 | |
| Total Assets (in 000s) | $ | 465,281 | |
Debt to Total Assets(3) | 74.42 | % |
| Debt to Gross Asset Value | 60.58 | % |
| |
Market Capitalization | |
| Common shares outstanding | 9,720,532 | |
| OP units outstanding | 215,343 | |
| Total common shares and OP units | 9,935,875 | |
| | | | | | | | | | | | | | | | | |
| Shares Outstanding at December 31, 2021 | | Fourth Quarter stock price range | | Stock price as of December 31, 2021 |
| Common Stock | 9,720,532 | | | $1.74-$2.96 | | $ | 1.94 | |
| Series B preferred shares | 1,872,448 | | | $5.25-$10.85 | | $ | 6.73 | |
| Series D preferred shares | 3,152,392 | | | $12.56-$17.00 | | $ | 15.21 | |
| | | | | |
Total debt (in 000s)(3) | 346,262 | |
Common Stock market capitalization (as of December 31, 2021 closing stock price, in 000s) | 18,858 | |
| |
Portfolio Summary | |
| Total Leasable Area (GLA) in sq. ft. | 5,478,855 | |
| Occupancy Rate | 91.6 | % |
Leased Rate (2) | 94.2 | % |
| Annualized Base Rent (in 000s) | $ | 48,232 | |
| Total number of leases signed or renewed during the fourth quarter of 2021 | 50 | |
| Total sq. ft. leases signed or renewed during the fourth quarter of 2021 | 317,641 | |
(1) See page 22 for the Company's definition of this non-GAAP measurement and reasons for using it.
(2) Reflects leases executed through January 5, 2022 that commence subsequent to the end of current period.
(3) Includes debt associated with assets held for sale.
| | | | | |
WHLR | Financial & Operating Data | as of 12/31/2021 unless otherwise stated | 5 |
Financial and Operating Results
Today, WHLR reported its financial and operating results for the three and twelve months ended December 31, 2021. For the three months ended December 31, 2021 and 2020, WHLR's net loss attributable to WHLR's common stock, $0.01 par value per share ("Common Stock") stockholders was ($0.78) per share and ($0.14) per share, respectively. For the years ended December 31, 2021 and 2020, WHLR's net loss attributable to WHLR's Common Stock stockholders was ($1.36) per share and ($0.96) per share, respectively.
2021 FOURTH QUARTER HIGHLIGHTS
(all comparisons to the same prior year period unless otherwise noted)
LEASING
•The Company's real estate portfolio was 94.2% leased as of December 31, 2021, a 530 basis point increase from 88.9% December 31, 2020.
•The Company's real estate portfolio was 91.6% occupied as of December 31, 2021, a 450 basis point increase from 87.1% at December 31, 2020.
•The Company invested $6.1 million in capital expenditures into the properties during the year ended December 31, 2021.
•Quarter-To-Date Leasing Activity
•Executed 36 lease renewals totaling 199,093 square feet at a weighted-average increase of $0.67 per square foot, representing an increase of 6.13% over in-place rental rates.
•Signed 14 new leases totaling 118,548 square feet with a weighted-average rental rate of $7.08 per square foot.
•The Company’s gross leasable area ("GLA"), which is subject to leases that expire over the next twelve months and includes month-to-month leases, decreased to approximately 6.16% at December 31, 2021, compared to 6.97% at December 31, 2020. At December 31, 2021, 51.18% of this expiring GLA is subject to renewal options (a lease expiration schedule can be found on page 19 and provides additional details on the Company's leases).
•As of December 31, 2021, the Company signed leases representing $829 thousand of annualized base rent ("ABR"). Rent will commence on these leases over the next ten months.
OPERATIONS
•Total revenue increased by 1.88% or $288 thousand primarily due to changes described below in the same store section, partially offset by the decrease from sold properties of $259 thousand.
•Total operating expenses increased by 12.58% or $1.2 million primarily a result of an increase in corporate general and administrative ("CG&A") expense, impairment expense, higher property operating expenses, partially offset by a decrease in depreciation and amortization. The increase in CG&A expense is primarily due to $703 thousand increase in professional fees associated with property and corporate legal fees along with costs associated with a Special Meeting of Common Stockholders and $151 thousand increase in corporate administration primarily related to office rent expense for the Company's corporate headquarters that had a sale leaseback in December 2020.
FINANCIAL
•Funds from operations ("FFO") of ($3.4) million, or ($0.34) per share of the Company's Common Stock and common unit ("Common Unit") in our operating partnership, Wheeler REIT, L.P., as compared to FFO of $2.6 million, or $0.26 per share.
•Adjusted Funds from Operations ("AFFO") of $0.19 per share of the Company's Common Stock and Common Unit in our operating partnership, Wheeler REIT, L.P., as compared to $0.24 per share.
SAME STORE
•Same store Net Operating Income ("NOI") increased by 1.91% and by 2.63% on a cash basis. Same store results were impacted by a 3.70% increase in revenue due to higher occupancy including three new anchor spaces. Additionally, same store property expenses increased by 7.67% primarily driven by increases in management fee allocation, grounds and landscaping and real estate taxes.
CAPITAL MARKETS
| | | | | |
WHLR | Financial & Operating Data | as of 12/31/2021 unless otherwise stated | 6 |
•On October 12, 2021, the Backstop Parties and their assignee elected to exercise their “accordion right” in full and purchased from the Company an additional $3.0 million in aggregate principal amount of the Company’s 7.00% senior subordinated convertible notes due 2031 (the “Convertible Notes”).
•On November 3, 2021, common stockholders of the Company voted to amend the Company’s charter ("Charter") to remove the cumulative dividend rights of the Series A Preferred and Series B Preferred.
•The principal balance of $35.0 million on the $35.0 million, 8.00% financing agreement with Wilmington Savings Fund Society, FSB, as administrative agent and collateral agent (the “Wilmington Financing Agreement”) was paid in full on December 21, 2021. The Wilmington Warrant Agreement and the Wilmington Registration Rights Agreement remain.
•Interest related to the Convertible Notes was $886 thousand during the year ended December 31, 2021 and paid with 113,709 shares of Series D Cumulative Convertible Preferred Stock, which when adjusted for the VWAP discount represents interest expense or paid-in-kind interest of $1.6 million.
•Recognized a non-operating gain of $3.5 million due to the change in fair market value of the derivative liabilities.
•Recognized $100 thousand in impairment expense on Walnut Hill Plaza, which is held for sale.
•At December 31 2021, assets held for sale, total $2.0 million, and include Walnut Hill Plaza.
DISPOSITIONS
•On November 17, 2021, the Company sold Columbia Fire House for $4.3 million, generating a loss of $88 thousand and net proceeds of $3.9 million.
2021 YEAR-TO-DATE HIGHLIGHTS
LEASING
•Year-To-Date Leasing Activity
•Executed 138 lease renewals totaling 619,160 square feet at a weighted-average increase of $0.32 per square foot, representing an increase of 3.05% over in-place rental rates.
•Signed 76 new leases totaling 436,170 square feet with a weighted-average rental rate of $8.30 per square foot, including 6 anchors representing 209,560 square feet.
OPERATIONS
•Total revenue increased by 0.50% or $307 thousand.
•Total operating expenses increased by 2.93% or $1.2 million primarily a result of increases in impairment on assets held for sale and CG&A expense, partially offset by a decrease in depreciation and amortization.
FINANCIAL
•Net loss attributable to WHLR's Common Stock stockholders of $13.2 million, or ($1.36) per share.
•FFO of ($2.5) million, or $(0.25) per share of the Company's Common Stock and Common Unit in our operating partnership, Wheeler REIT, L.P., as compared to FFO of $8.7 million, or $0.87 per share.
•AFFO of $0.68 per share of the Company's Common Stock and Common Unit in our operating partnership, Wheeler REIT, L.P., as compared to $0.87.
SAME STORE
•Same store NOI remained relatively consistent and increased by 1.05% on a cash basis. Same store results were impacted by a 1.58% increase in revenue due to a decrease in provision for credit losses a result of the Company's proactive tenant outreach during the pandemic and collection initiatives returning collections to pre-pandemic levels and increase in rental revenue a result of increased occupancy. These positive impacts were partially offset by a decrease in above (below) market lease amortization related to leases becoming fully amortized. Additionally, same store property expenses increased by 5.18% primarily driven by increases in management fee allocation, grounds and landscaping, real estate taxes and utilities, partially offset by a decrease in insurance expense.
CAPITAL MARKETS
•The Company paid in full the $25.0 million, 13.50% Powerscourt Financing Agreement with proceeds from the Wilmington Financing Agreement providing a go forward annual interest savings of $575 thousand. The Wilmington Financing Agreement matures on March 12, 2026. The Powerscourt Warrant Agreement and Powerscourt Registration Rights Agreement remain. In conjunction with the Wilmington Financing Agreement, the Company issued to the underlying holders, warrants to purchase an aggregate of 1,061,719 shares of the
| | | | | |
WHLR | Financial & Operating Data | as of 12/31/2021 unless otherwise stated | 7 |
Company’s Common Stock at various exercise prices. This is recognized as a warrant liability with an initial fair value of $2.0 million.
•On July 22, 2021, the Company commenced the rights offering (the “Rights Offering”) for the purchase of up to $30.0 million in aggregate principal amount of the Company’s Convertible Notes. On August 13, 2021, the Rights Offering expired. Pursuant to the Rights Offering, the Company distributed to holders of its common stock, as of 5:00 p.m. New York City time on June 1, 2021 (the “Record Date”), non-transferable subscription rights to purchase Convertible Notes. Each holder of the Company’s common stock as of the Record Date received one right for each eight shares of the Company’s common stock owned, and each right entitled a holder to purchase $25.00 principal amount of Convertible Notes. The Rights Offering was made pursuant to an effective registration statement filed with the U.S. Securities and Exchange Commission. The aggregate principal amount of Convertible Notes issued in the Rights Offering was $30.0 million, increasing to $33.0 million through the Backstop Parties’ and their assignee’s exercise of their “accordion right”.
•The Wilmington Financing Agreement's principal balance of $35.0 million was paid in full on December 21, 2021. The Wilmington Warrant Agreement and the Wilmington Registration Rights Agreement remain.
•The Company identified certain embedded derivatives related to the conversion features of the Convertible Notes and the embedded derivative liabilities were assigned a value of $5.9 million.
•Loans payable decreased by $7.7 million and were impacted by:
•$25.0 million paydown of the Powerscourt Financing Agreement;
•$6.8 million paydown with the sales of Berkley Shopping Center and Rivergate Shopping Center Out Parcel;
•$3.8 million to one time principal payment and final payment on the Columbia Fire Station loan;
•$225 thousand paydown on the JANAF Bravo loan upon refinancing, new loan matures in 2024; and
•$6.1 million in monthly principal payments; partially offset by
•$33.0 million increase from the Convertible Notes;
•$1.4 million funds from Rivergate loan refinancing, new loan matures in 2031.
•Interest expense was $33.03 million and $17.09 million for the years ended December 31, 2021 and 2020, representing an increase of 93.23%. Loan amortization costs accounted for $11.6 million of the increase, primarily attributable to the write-off of debt issuance costs related to the Powerscourt Financing Agreement and Wilmington Financing Agreement. Interest expense on the Convertible Notes accounted for $1.6 million, which includes the adjustment to fair value with the remaining increase of $2.7 million a result of the Powerscourt and Wilmington Financing Agreements and defeasance resulting from the sale of Berkley Shopping Center.
•Recognized $2.3 million in impairment expense related to Columbia Fire Station and Walnut Hill Plaza.
OTHER
•The Company recognized non-operating other income of $552 thousand in Paycheck Protection Program Promissory Note forgiveness.
•Effective July 5, 2021, Daniel Khoshaba resigned as the President and Chief Executive Officer of the Company and as a member of the Board of Directors and as a member of the Executive Committee of our Board of Directors. Upon Mr. Khoshaba’s cessation of employment with the Company, all of his rights under that certain Stock Appreciation Rights Agreement, dated August 4, 2020, by and between Mr. Khoshaba and the Company (the “SAR Agreement”), were forfeited for no consideration.
•The Company recognized non-operating expenses of $185 thousand due to legal settlement costs.
BALANCE SHEET
•Cash and cash equivalents totaled $22.9 million, compared to $7.7 million at December 31, 2020.
•Restricted cash totaled $17.5 million, compared to $35.1 million at December 31, 2020. The funds at December 31, 2021 are held in lender reserves primarily for the purpose of tenant improvements, lease commissions, real estate taxes and insurance expenses.
•Debt totaled $346.3 million (including debt associated with assets held for sale), compared to $353.9 million at December 31, 2020.
•WHLR's weighted-average interest rate on property level debt was 4.68% with a term of 3.50 years (including debt associated with assets held for sale), compared to 4.69% with a term of 3.66 years at December 31,
| | | | | |
WHLR | Financial & Operating Data | as of 12/31/2021 unless otherwise stated | 8 |
2020. WHLR's weighted-average interest rate on all debt was 4.90% with a term of 4.13 years (including debt associated with assets held for sale), compared to 5.31% with a term of 3.56 years at December 31, 2020.
•Net investment properties totaled $386.7 million compared to $392.7 million as of December 31, 2020.
DIVIDENDS
•On November 3, 2021, common stockholders of the Company voted to amend the Company’s Charter to remove the cumulative dividend rights of the Series A Preferred and Series B Preferred.
•The total cumulative dividends in arrears for Series D Preferred (per share $8.30) as of December 31, 2021 is $26.2 million, of which $8.2 million is attributable to the year ended December 31, 2021.
TENDER OFFER
•The Company through “modified Dutch auction” tender offers on the Series D Preferred accepted for purchase 387,097 shares at a purchase price of $15.50 per share, for an aggregate cost of $6.0 million on March 12, 2021 and 103,513 shares of Series D Preferred at a purchase price of $18.00 per share, for an aggregate cost of $1.86 million on May 15, 2021, both excluding fees and expenses.
SUBSEQUENT EVENTS
•On January 11, 2022, the Company sold Walnut Hill Plaza for a contract price of $2.0 million, resulting in a paydown of $1.8 million on the Walnut Hill Plaza Loan. On February 17, 2022, the Company paid the remaining loan balance of $1.3 million in full.
DISPOSITIONS
•The Company sold Berkley Shopping Center, Berkley Land Parcel, Tulls Creek Land Parcel, Rivergate Shopping Center Out Parcel and Columbia Fire Station for $12.4 million, generating a gain of $2.1 million and net proceeds of $11.5 million.
ADDITIONAL INFORMATION
The enclosed information should be read in conjunction with the Company's filings with the Securities and Exchange Commission, including, but not limited to, its quarterly and annual filings on Forms 10-Q and 10-K.
These documents are or will be available upon filing via the U.S. Securities and Exchange Commission website (www.sec.gov) or through WHLR’s website at www.whlr.us.
| | | | | |
WHLR | Financial & Operating Data | as of 12/31/2021 unless otherwise stated | 9 |
Consolidated Balance Sheets
$ in 000s, except par value and share data
| | | | | | | | | | | |
| | December 31, |
| | 2021 | | 2020 |
| ASSETS: | | | |
| Investment properties, net | $ | 386,730 | | | $ | 392,664 | |
| Cash and cash equivalents | 22,898 | | | 7,660 | |
| Restricted cash | 17,521 | | | 35,108 | |
| Rents and other tenant receivables, net | 9,233 | | | 9,153 | |
| | | |
| Assets held for sale | 2,047 | | | 13,072 | |
| Above market lease intangibles, net | 2,424 | | | 3,547 | |
| Operating lease right-of-use assets | 12,455 | | | 12,745 | |
| Deferred costs and other assets, net | 11,973 | | | 15,430 | |
| Total Assets | $ | 465,281 | | | $ | 489,379 | |
| LIABILITIES: | | | |
| Loans payable, net | $ | 333,283 | | | $ | 334,266 | |
| Liabilities associated with assets held for sale | 3,381 | | | 13,124 | |
| Below market lease intangibles, net | 3,397 | | | 4,554 | |
| Derivative liabilities | 4,776 | | | 594 | |
| Operating lease liabilities | 13,040 | | | 13,200 | |
| Accounts payable, accrued expenses and other liabilities | 11,054 | | | 11,229 | |
| Total Liabilities | 368,931 | | | 376,967 | |
| Series D Cumulative Convertible Preferred Stock (no par value, 6,000,000 and 4,000,000 shares authorized, respectively, 3,152,392 and 3,529,293 shares issued and outstanding, respectively; $104.97 million and $109.13 million aggregate liquidation value, respectively) | 92,548 | | | 95,563 | |
| | | |
| EQUITY: | | | |
| Series A Preferred Stock (no par value, 4,500 shares authorized, 562 shares issued and outstanding) | 453 | | | 453 | |
| Series B Convertible Preferred Stock (no par value, 5,000,000 authorized, 1,872,448 and 1,875,748 shares issued and outstanding, respectively; $46.81 million and $46.90 million aggregate liquidation preference, respectively) | 41,189 | | | 41,174 | |
| Common Stock ($0.01 par value, 200,000,000 and 18,750,000 shares authorized, respectively, 9,720,532 and 9,703,874 shares issued and outstanding, respectively) | 97 | | | 97 | |
| Additional paid-in capital | 234,229 | | | 234,061 | |
| Accumulated deficit | (274,107) | | | (260,867) | |
| Total Stockholders’ Equity | 1,861 | | | 14,918 | |
| Noncontrolling interests | 1,941 | | | 1,931 | |
| Total Equity | 3,802 | | | 16,849 | |
| Total Liabilities and Equity | $ | 465,281 | | | $ | 489,379 | |
| | | | | |
WHLR | Financial & Operating Data | as of 12/31/2021 unless otherwise stated | 10 |
Consolidated Statements of Operations
$ in 000s, except share and per share data
| | | | | | | | | | | | | | | | | | | | | | | |
| | Three Months Ended December 31, | | Years Ended December 31, |
| | 2021 | | 2020 | | 2021 | | 2020 |
| REVENUE: | | | | | | | |
| Rental revenues | $ | 15,422 | | | $ | 15,119 | | | $ | 60,368 | | | $ | 60,039 | |
| Other revenues | 162 | | | 177 | | | 942 | | | 964 | |
| Total Revenue | 15,584 | | | 15,296 | | | 61,310 | | | 61,003 | |
| OPERATING EXPENSES: | | | | | | | |
| Property operations | 5,045 | | | 4,770 | | | 19,618 | | | 18,886 | |
| | | | | | | |
| Depreciation and amortization | 3,764 | | | 3,831 | | | 14,797 | | | 17,291 | |
| Impairment of assets held for sale | 100 | | | — | | | 2,300 | | | 600 | |
| Corporate general & administrative | 2,195 | | | 1,262 | | | 7,140 | | | 5,831 | |
| Total Operating Expenses | 11,104 | | | 9,863 | | | 43,855 | | | 42,608 | |
| (Loss) gain on disposal of properties | (88) | | | 49 | | | 2,055 | | | 23 | |
| Operating Income | 4,392 | | | 5,482 | | | 19,510 | | | 18,418 | |
| Interest income | 25 | | | — | | | 34 | | | 1 | |
| Interest expense | (13,215) | | | (4,306) | | | (33,028) | | | (17,093) | |
| Net changes in fair value of derivative liabilities | 3,465 | | | — | | | 3,768 | | | — | |
| Other income | — | | | — | | | 552 | | | — | |
| Other expense | — | | | — | | | (185) | | | (1,039) | |
| Net (Loss) Income Before Income Taxes | (5,333) | | | 1,176 | | | (9,349) | | | 287 | |
| Income tax expense | — | | | — | | | (2) | | | — | |
| Net (Loss) Income | (5,333) | | | 1,176 | | | (9,351) | | | 287 | |
| Less: Net income attributable to noncontrolling interests | 20 | | | 24 | | | 92 | | | 42 | |
| Net (Loss) Income Attributable to Wheeler REIT | (5,353) | | | 1,152 | | | (9,443) | | | 245 | |
| Preferred Stock dividends - undeclared | (2,187) | | | (2,538) | | | (8,837) | | | (10,258) | |
| | | | | | | |
| Deemed contribution related to preferred stock redemption | — | | | — | | | 5,040 | | | 726 | |
| Net Loss Attributable to Wheeler REIT Common Stockholders | $ | (7,540) | | | $ | (1,386) | | | $ | (13,240) | | | $ | (9,287) | |
| | | | | | | |
| Loss per share: | | | | | | | |
| Basic and Diluted | $ | (0.78) | | | $ | (0.14) | | | $ | (1.36) | | | $ | (0.96) | |
| Weighted-average number of shares: | | | | | | | |
| Basic and Diluted | 9,719,239 | | | 9,703,397 | | | 9,711,944 | | | 9,698,274 | |
| | | | | | | |
| | | | | |
WHLR | Financial & Operating Data | as of 12/31/2021 unless otherwise stated | 11 |
Reconciliation of Non-GAAP Measures
FFO and AFFO (1)
$ in 000s, except share, unit and per share data
| | | | | | | | | | | | | | | | | | | | | | | | | | |
| Three Months Ended December 31, | | Years Ended December 31, |
| 2021 | | 2020 | | 2021 | | 2020 |
| Net (Loss) Income | $ | (5,333) | | | $ | 1,176 | | | $ | (9,351) | | | $ | 287 | |
| Depreciation and amortization of real estate assets | 3,764 | | | 3,831 | | | 14,797 | | | 17,291 | |
| Impairment of assets held for sale | 100 | | | — | | | 2,300 | | | 600 | |
| Loss (gain) on disposal of properties | 88 | | | (49) | | | (2,055) | | | (23) | |
| FFO | (1,381) | | | 4,958 | | | 5,691 | | | 18,155 | |
Preferred stock dividends - undeclared (3) | (2,187) | | | (2,538) | | | (8,837) | | | (10,258) | |
| Preferred stock redemption | | — | | | — | | | 70 | | | 96 | |
| Preferred stock accretion adjustments | 146 | | | 168 | | | 600 | | | 677 | |
| FFO available to common stockholders and common unitholders | (3,422) | | | 2,588 | | | (2,476) | | | 8,670 | |
| | | | | | | |
| Capital related costs | 95 | | | 105 | | | 438 | | | 291 | |
Other non-recurring and non-cash expenses (2) | (13) | | | (5) | | | 352 | | | 1,085 | |
| Net changes in fair value of derivative liabilities | (3,465) | | | — | | | (3,768) | | | — | |
| Share based compensation | 14 | | | — | | | 14 | | | — | |
| Straight-line rental revenue, net straight-line expense | (155) | | | (271) | | | (1,026) | | | (971) | |
| Loan cost amortization | 7,510 | | | 301 | | | 12,710 | | | 1,097 | |
| Paid-in-kind interest | 1,610 | | | — | | | 1,610 | | | — | |
| Above (below) market lease amortization | (15) | | | (18) | | | 13 | | | (461) | |
| Recurring capital expenditures and tenant improvement reserves | (271) | | | (277) | | | (1,096) | | | (1,112) | |
| AFFO | $ | 1,888 | | | $ | 2,423 | | | $ | 6,771 | | | $ | 8,599 | |
| | | | | | | |
| Weighted Average Common Shares | 9,719,239 | | | 9,703,397 | | | 9,711,944 | | | 9,698,274 | |
| Weighted Average Common Units | 216,636 | | | 224,906 | | | 219,636 | | | 230,029 | |
| Total Common Shares and Units | 9,935,875 | | | 9,928,303 | | | 9,931,580 | | | 9,928,303 | |
| FFO per Common Share and Common Units | $ | (0.34) | | | $ | 0.26 | | | $ | (0.25) | | | $ | 0.87 | |
| AFFO per Common Share and Common Units | $ | 0.19 | | | $ | 0.24 | | | $ | 0.68 | | | $ | 0.87 | |
(1) See page 22 for the Company's definition of this non-GAAP measurement and reasons for using it.
(2) Other non-recurring expenses are described in "Management's Discussion and Analysis of Financial Condition and Results of Operations" included in our Annual Report on Form 10-K for the year ended December 31, 2021.
(3) Restated the 2020 values as a result of the common stockholders of the Company vote to amend the Company’s Charter to remove the cumulative dividend rights of the Series A Preferred and Series B Preferred on November 3, 2021.
| | | | | |
WHLR | Financial & Operating Data | as of 12/31/2021 unless otherwise stated | 12 |
Reconciliation of Non-GAAP Measures (continued)
Property Net Operating Income (1)
$ in 000s
| | | | | | | | | | | | | | | | | | | | | | | | | | | | | | | | | | | |
| | Three Months Ended December 31, |
| | Same Store | | Non-same Store | | Total |
| | 2021 | | 2020 | | 2021 | | 2020 | | 2021 | | 2020 |
| | | | | | | | | | | |
| Net (Loss) Income | $ | (5,242) | | | $ | 1,122 | | | $ | (91) | | | $ | 54 | | | $ | (5,333) | | | $ | 1,176 | |
| Adjustments: | | | | | | | | | | | |
| | | | | | | | | | | |
| Net changes in fair value of derivative liabilities | (3,465) | | | — | | | — | | | — | | | (3,465) | | | — | |
| Interest expense | 13,215 | | | 4,173 | | | — | | | 133 | | | 13,215 | | | 4,306 | |
| Interest income | (25) | | | — | | | — | | | — | | | (25) | | | — | |
| Loss (gain) on disposal of properties | — | | | — | | | 88 | | | (49) | | | 88 | | | (49) | |
| Corporate general & administrative | 2,183 | | | 1,215 | | | 12 | | | 47 | | | 2,195 | | | 1,262 | |
| Impairment of assets held for sale | 100 | | | — | | | — | | | — | | | 100 | | | — | |
| | | | | | | | | | | |
| Depreciation and amortization | 3,764 | | | 3,831 | | | — | | | — | | | 3,764 | | | 3,831 | |
| | | | | | | | | | | |
| Other non-property revenue | (8) | | | (16) | | | — | | | — | | | (8) | | | (16) | |
| Property Net Operating Income | $ | 10,522 | | | $ | 10,325 | | | $ | 9 | | | $ | 185 | | | $ | 10,531 | | | $ | 10,510 | |
| | | | | | | | | | | |
| Property revenues | $ | 15,549 | | | $ | 14,994 | | | $ | 27 | | | $ | 286 | | | $ | 15,576 | | | $ | 15,280 | |
| Property expenses | 5,027 | | | 4,669 | | | 18 | | | 101 | | | 5,045 | | | 4,770 | |
| | | | | | | | | | | |
| Property Net Operating Income | $ | 10,522 | | | $ | 10,325 | | | $ | 9 | | | $ | 185 | | | $ | 10,531 | | | $ | 10,510 | |
| | | | | | | | | | | | | | | | | | | | | | | | | | | | | | | | | | | |
| | Years Ended December 31, |
| | Same Store | | Non-same Store | | Total |
| | 2021 | | 2020 | | 2021 | | 2020 | | 2021 | | 2020 |
| | | | | | | | | | | |
| Net (Loss) Income | $ | (8,201) | | | $ | 1,280 | | | $ | (1,150) | | | $ | (993) | | | $ | (9,351) | | | $ | 287 | |
| Adjustments: | | | | | | | | | | | |
| | | | | | | | | | | |
| Income tax expense | 2 | | | — | | | — | | | — | | | 2 | | | — | |
| Other expense | 185 | | | 1,039 | | | — | | | — | | | 185 | | | 1,039 | |
| Other income | (552) | | | — | | | — | | | — | | | (552) | | | — | |
| Net changes in fair value of derivative liabilities | (3,768) | | | — | | | — | | | — | | | (3,768) | | | — | |
| Interest expense | 31,978 | | | 16,607 | | | 1,050 | | | 486 | | | 33,028 | | | 17,093 | |
| Interest income | (34) | | | (1) | | | — | | | — | | | (34) | | | (1) | |
| Gain on disposal of properties | — | | | — | | | (2,055) | | | (23) | | | (2,055) | | | (23) | |
| Corporate general & administrative | 7,079 | | | 5,762 | | | 61 | | | 69 | | | 7,140 | | | 5,831 | |
| Impairment of assets held for sale | 100 | | | — | | | 2,200 | | | 600 | | | 2,300 | | | 600 | |
| | | | | | | | | | | |
| Depreciation and amortization | 14,797 | | | 17,141 | | | — | | | 150 | | | 14,797 | | | 17,291 | |
| | | | | | | | | | | |
| | | | | | | | | | | |
| Other non-property revenue | (36) | | | (272) | | | — | | | — | | | (36) | | | (272) | |
| Property Net Operating Income | $ | 41,550 | | | $ | 41,556 | | | $ | 106 | | | $ | 289 | | | $ | 41,656 | | | $ | 41,845 | |
| | | | | | | | | | | |
| Property revenues | $ | 60,948 | | | $ | 59,999 | | | $ | 326 | | | $ | 732 | | | $ | 61,274 | | | $ | 60,731 | |
| Property expenses | 19,398 | | | 18,443 | | | 220 | | | 443 | | | 19,618 | | | 18,886 | |
| Property Net Operating Income | $ | 41,550 | | | $ | 41,556 | | | $ | 106 | | | $ | 289 | | | $ | 41,656 | | | $ | 41,845 | |
(1) See page 23 for the Company's definition of this non-GAAP measurement and reasons for using it.
| | | | | |
WHLR | Financial & Operating Data | as of 12/31/2021 unless otherwise stated | 13 |
Reconciliation of Non-GAAP Measures (continued)
EBITDA (4)
$ in 000s
| | | | | | | | | | | | | | | | | | | | | | | | | | |
| Three Months Ended December 31, | | Years Ended December 31, |
| 2021 | | 2020 | | 2021 | | 2020 |
Net (Loss) Income | $ | (5,333) | | | $ | 1,176 | | | $ | (9,351) | | | $ | 287 | |
Add back: | Depreciation and amortization (1) | 3,749 | | | 3,813 | | | 14,810 | | | 16,830 | |
| Interest Expense (2) | 13,215 | | | 4,306 | | | 33,028 | | | 17,092 | |
| Income tax expense | — | | | — | | | 2 | | | — | |
EBITDA | 11,631 | | | 9,295 | | | 38,489 | | | 34,209 | |
| Adjustments for items affecting comparability: | | | | | | | |
| | | | | | | | |
| Capital related costs | 95 | | | 105 | | | 438 | | | 291 | |
| Change in FMV of derivative liabilities | (3,465) | | | — | | | (3,768) | | | — | |
| Other non-recurring and non-cash expenses (3) | (8) | | | (5) | | | (361) | | | 1,085 | |
| | | | | | | | |
| Impairment of assets held for sale | 100 | | | — | | | 2,300 | | | 600 | |
| Loss (gain) on disposal of properties | 88 | | | (49) | | | (2,055) | | | (23) | |
Adjusted EBITDA | $ | 8,441 | | | $ | 9,346 | | | $ | 35,043 | | | $ | 36,162 | |
(1) Includes above (below) market lease amortization.
(2) Includes loan cost amortization.
(3) Other non-recurring expenses are described in "Management's Discussion and Analysis of Financial Condition and Results of Operations" included in our Annual Report on Form 10-K for the period ended December 31, 2021.
(4) See page 22 for the Company's definition of this non-GAAP measurement and reasons for using it.
| | | | | |
WHLR | Financial & Operating Data | as of 12/31/2021 unless otherwise stated | 14 |
Debt Summary
$ in 000s
Loans Payable: $346.26 million
Weighted Average Interest Rate: 4.90%
| | | | | | | | | | | | | | | | | | | | | | | | | | | | | | | | |
| Property/Description | | Monthly Payment | | Interest
Rate | | Maturity | | December 31, 2021 | | December 31, 2020 |
| Litchfield Market Village | | $ | 46,057 | | | 5.50 | % | | November 2022 | | $ | 7,312 | | | $ | 7,418 | |
| Twin City Commons | | $ | 17,827 | | | 4.86 | % | | January 2023 | | 2,843 | | | 2,915 | |
| Walnut Hill Plaza | | $ | 26,850 | | | 5.50 | % | | March 2023 | | 3,145 | | | 3,287 | |
| New Market | | $ | 48,747 | | | 5.65 | % | | June 2023 | | 6,291 | | | 6,508 | |
| Benefit Street Note (3) | | $ | 53,185 | | | 5.71 | % | | June 2023 | | 6,914 | | | 7,145 | |
| Deutsche Bank Note (2) | | $ | 33,340 | | | 5.71 | % | | July 2023 | | 5,488 | | | 5,567 | |
| JANAF | | $ | 333,159 | | | 4.49 | % | | July 2023 | | 47,065 | | | 48,875 | |
| First National Bank (6) (7) | | $ | 24,656 | | | LIBOR + 350 basis points | | August 2023 | | 789 | | | 1,045 | |
| Lumber River (7) | | $ | 10,723 | | | LIBOR + 350 basis points | | September 2023 | | 1,296 | | | 1,367 | |
| Tampa Festival | | $ | 50,797 | | | 5.56 | % | | September 2023 | | 7,753 | | | 7,920 | |
| Forrest Gallery | | $ | 50,973 | | | 5.40 | % | | September 2023 | | 8,060 | | | 8,226 | |
| South Carolina Food Lions Note (5) | | $ | 68,320 | | | 5.25 | % | | January 2024 | | 11,259 | | | 11,473 | |
| JANAF Bravo | | $ | 35,076 | | | 5.00 | % | | May 2024 | | 5,936 | | | 6,263 | |
| Cypress Shopping Center | | $ | 34,360 | | | 4.70 | % | | July 2024 | | 6,031 | | | 6,163 | |
| Port Crossing | | $ | 34,788 | | | 4.84 | % | | August 2024 | | 5,778 | | | 5,909 | |
| Freeway Junction | | $ | 41,798 | | | 4.60 | % | | September 2024 | | 7,431 | | | 7,582 | |
| Harrodsburg Marketplace | | $ | 19,112 | | | 4.55 | % | | September 2024 | | 3,267 | | | 3,343 | |
| Bryan Station | | $ | 23,489 | | | 4.52 | % | | November 2024 | | 4,226 | | | 4,312 | |
| Crockett Square | | Interest only | | 4.47 | % | | December 2024 | | 6,338 | | | 6,338 | |
| Pierpont Centre | | $ | 39,435 | | | 4.15 | % | | February 2025 | | 7,861 | | | 8,001 | |
| Shoppes at Myrtle Park | | $ | 33,180 | | | 4.45 | % | | February 2025 | | 5,757 | | | 5,892 | |
| Folly Road | | $ | 41,482 | | | 4.65 | % | | March 2025 | | 7,063 | | | 7,223 | |
| Alex City Marketplace | | Interest only | | 3.95 | % | | April 2025 | | 5,750 | | | 5,750 | |
| Butler Square | | Interest only | | 3.90 | % | | May 2025 | | 5,640 | | | 5,640 | |
| Brook Run Shopping Center | | Interest only | | 4.08 | % | | June 2025 | | 10,950 | | | 10,950 | |
| Beaver Ruin Village I and II | | Interest only | | 4.73 | % | | July 2025 | | 9,400 | | | 9,400 | |
| Sunshine Shopping Plaza | | Interest only | | 4.57 | % | | August 2025 | | 5,900 | | | 5,900 | |
| Barnett Portfolio (4) | | Interest only | | 4.30 | % | | September 2025 | | 8,770 | | | 8,770 | |
| Fort Howard Shopping Center | | Interest only | | 4.57 | % | | October 2025 | | 7,100 | | | 7,100 | |
| Conyers Crossing | | Interest only | | 4.67 | % | | October 2025 | | 5,960 | | | 5,960 | |
| Grove Park Shopping Center | | Interest only | | 4.52 | % | | October 2025 | | 3,800 | | | 3,800 | |
| Parkway Plaza | | Interest only | | 4.57 | % | | October 2025 | | 3,500 | | | 3,500 | |
| Winslow Plaza | | $ | 24,295 | | | 4.82 | % | | December 2025 | | 4,483 | | | 4,553 | |
| JANAF BJ's | | $ | 29,964 | | | 4.95 | % | | January 2026 | | 4,725 | | | 4,844 | |
| Tuckernuck | | $ | 32,202 | | | 5.00 | % | | March 2026 | | 5,052 | | | 5,193 | |
| Chesapeake Square | | $ | 23,857 | | | 4.70 | % | | August 2026 | | 4,192 | | | 4,279 | |
| Berkley/Sangaree/Tri-County | | Interest only | | 4.78 | % | | December 2026 | | 6,176 | | | 9,400 | |
| Riverbridge | | Interest only | | 4.48 | % | | December 2026 | | 4,000 | | | 4,000 | |
| Franklin Village | | $ | 45,336 | | | 4.93 | % | | January 2027 | | 8,277 | | | 8,404 | |
| Village of Martinsville | | $ | 89,664 | | | 4.28 | % | | July 2029 | | 15,589 | | | 15,979 | |
| Laburnum Square | | Interest only | | 4.28 | % | | September 2029 | | 7,665 | | | 7,665 | |
| Rivergate | | $ | 100,222 | | | 4.25 | % | | September 2031 | | 18,430 | | | 21,164 | |
| Convertible Notes | | Interest only | | 7.00 | % | | December 2031 | | 33,000 | | | — | |
| Columbia Fire Station | | Interest only | | 14.00 | % | | July 2021 | | — | | | 3,893 | |
| Powerscourt Financing Agreement | | Interest only | | 13.50 | % | | March 2023 | | — | | | 25,000 | |
Total Principal Balance (1) | | | | | | | | 346,262 | | | 353,916 | |
Unamortized debt issuance cost (1) | | | | | | | | (9,834) | | | (6,812) | |
| Total Loans Payable, including assets held for sale | | | | | | 336,428 | | | 347,104 | |
| Less loans payable on assets held for sale, net loan amortization costs | | | | 3,145 | | | 12,838 | |
| Total Loans Payable, net | | | | | | | | $ | 333,283 | | | $ | 334,266 | |
(1) Includes loans payable on assets held for sale.
(2) Collateralized by LaGrange Marketplace, Ridgeland and Georgetown.
(3) Collateralized by Ladson Crossing, Lake Greenwood Crossing and South Park.
(4) Collateralized by Cardinal Plaza, Franklinton Square, and Nashville Commons.
(5) Collateralized by Clover Plaza, South Square, St. George, Waterway Plaza and Westland Square.
(6) Collateralized by Surrey Plaza and Amscot Building.
(7) Certain loans bear interest at a variable interest rate equal to LIBOR or another index rate, subject to a floor, in each case plus or minus a specified margin.
| | | | | |
WHLR | Financial & Operating Data | as of 12/31/2021 unless otherwise stated | 15 |
Debt Summary (continued)
Total Debt
$ in 000s
| | | | | | | | | | | | | | |
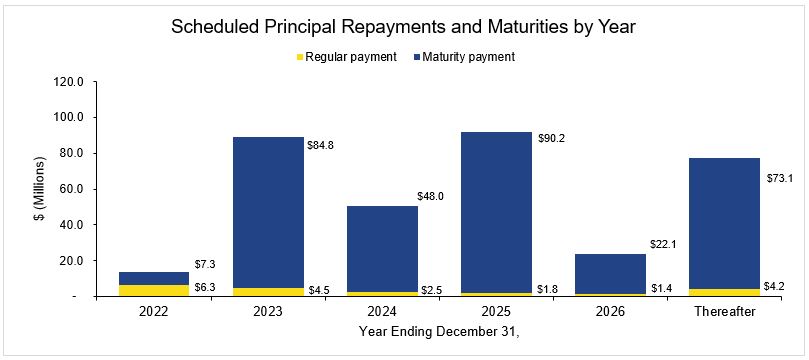
| Scheduled principal repayments and maturities by year | | Amount | | % Total Principal Payments and Maturities |
| December 31, 2022 | | $ | 13,567 | | | 3.92 | % |
| December 31, 2023 | | 89,288 | | | 25.79 | % |
| December 31, 2024 | | 50,490 | | | 14.58 | % |
| December 31, 2025 | | 92,016 | | | 26.57 | % |
| December 31, 2026 | | 23,531 | | | 6.80 | % |
| Thereafter | | 77,370 | | | 22.34 | % |
| Total principal repayments and debt maturities | | $ | 346,262 | | | 100.00 | % |
| | | | |
| | | | | |
WHLR | Financial & Operating Data | as of 12/31/2021 unless otherwise stated | 16 |
Property Summary
| | | | | | | | | | | | | | | | | | | | | | | | | | | | | | | | |
Property | | Location | | Number of
Tenants (1) | Total Leasable
Square Feet | Percentage
Leased (1) | Percentage Occupied | Total SF Occupied | Annualized
Base Rent (in 000's) (2) | Annualized Base Rent per Occupied Sq. Foot |
| Alex City Marketplace | | Alexander City, AL | | 19 | | 151,843 | | 100.0 | % | 100.0 | % | 151,843 | | $ | 1,201 | | $ | 7.91 | |
| Amscot Building | | Tampa, FL | | 1 | | 2,500 | | 100.0 | % | 100.0 | % | 2,500 | | 83 | | 33.00 | |
| Beaver Ruin Village | | Lilburn, GA | | 30 | | 74,038 | | 96.8 | % | 96.8 | % | 71,648 | | 1,250 | | 17.44 | |
| Beaver Ruin Village II | | Lilburn, GA | | 4 | | 34,925 | | 100.0 | % | 100.0 | % | 34,925 | | 460 | | 13.16 | |
| Brook Run Shopping Center | | Richmond, VA | | 19 | | 147,738 | | 87.8 | % | 48.2 | % | 71,237 | | 877 | | 12.32 | |
| Brook Run Properties (3) | | Richmond, VA | | — | | — | | — | % | — | % | — | | — | | — | |
| Bryan Station | | Lexington, KY | | 10 | | 54,277 | | 100.0 | % | 100.0 | % | 54,277 | | 597 | | 11.00 | |
| Butler Square | | Mauldin, SC | | 16 | | 82,400 | | 98.2 | % | 98.2 | % | 80,950 | | 855 | | 10.57 | |
| Cardinal Plaza | | Henderson, NC | | 9 | | 50,000 | | 100.0 | % | 100.0 | % | 50,000 | | 502 | | 10.03 | |
| Chesapeake Square | | Onley, VA | | 14 | | 108,982 | | 99.1 | % | 99.1 | % | 108,016 | | 823 | | 7.62 | |
| Clover Plaza | | Clover, SC | | 10 | | 45,575 | | 100.0 | % | 100.0 | % | 45,575 | | 378 | | 8.30 | |
| Courtland Commons (3) | | Courtland, VA | | — | | — | | — | % | — | % | — | | — | | — | |
| Conyers Crossing | | Conyers, GA | | 14 | | 170,475 | | 100.0 | % | 100.0 | % | 170,475 | | 940 | | 5.51 | |
| Crockett Square | | Morristown, TN | | 4 | | 107,122 | | 100.0 | % | 100.0 | % | 107,122 | | 970 | | 9.06 | |
| Cypress Shopping Center | | Boiling Springs, SC | | 17 | | 80,435 | | 41.2 | % | 41.2 | % | 33,175 | | 452 | | 13.62 | |
| Darien Shopping Center | | Darien, GA | | 1 | | 26,001 | | 100.0 | % | 100.0 | % | 26,001 | | 140 | | 5.38 | |
| Devine Street | | Columbia, SC | | 1 | | 38,464 | | 89.1 | % | 89.1 | % | 34,264 | | 180 | | 5.25 | |
| Edenton Commons (3) | | Edenton, NC | | — | | — | | — | % | — | % | — | | — | | — | |
| Folly Road | | Charleston, SC | | 5 | | 47,794 | | 100.0 | % | 100.0 | % | 47,794 | | 731 | | 15.30 | |
| Forrest Gallery | | Tullahoma, TN | | 27 | | 214,451 | | 91.1 | % | 80.8 | % | 173,289 | | 1,285 | | 7.42 | |
| Fort Howard Shopping Center | | Rincon, GA | | 19 | | 113,652 | | 95.1 | % | 95.1 | % | 108,120 | | 1,046 | | 9.68 | |
| Freeway Junction | | Stockbridge, GA | | 17 | | 156,834 | | 97.1 | % | 97.1 | % | 152,249 | | 1,304 | | 8.56 | |
| Franklin Village | | Kittanning, PA | | 25 | | 151,821 | | 100.0 | % | 98.7 | % | 149,821 | | 1,274 | | 8.50 | |
| Franklinton Square | | Franklinton, NC | | 15 | | 65,366 | | 100.0 | % | 100.0 | % | 65,366 | | 591 | | 9.05 | |
| Georgetown | | Georgetown, SC | | 2 | | 29,572 | | 100.0 | % | 100.0 | % | 29,572 | | 267 | | 9.04 | |
| Grove Park Shopping Center | | Orangeburg, SC | | 15 | | 93,265 | | 100.0 | % | 100.0 | % | 93,265 | | 745 | | 7.99 | |
| Harbor Point (3) | | Grove, OK | | — | | — | | — | % | — | % | — | | — | | — | |
| Harrodsburg Marketplace | | Harrodsburg, KY | | 8 | | 60,048 | | 91.0 | % | 91.0 | % | 54,648 | | 451 | | 8.25 | |
| JANAF (4) | | Norfolk, VA | | 118 | | 798,086 | | 95.3 | % | 93.1 | % | 743,314 | | 8,715 | | 11.73 | |
| Laburnum Square | | Richmond, VA | | 19 | | 109,405 | | 95.3 | % | 95.3 | % | 104,305 | | 950 | | 9.11 | |
| Ladson Crossing | | Ladson, SC | | 16 | | 52,607 | | 100.0 | % | 100.0 | % | 52,607 | | 535 | | 10.17 | |
| LaGrange Marketplace | | LaGrange, GA | | 13 | | 76,594 | | 96.9 | % | 96.9 | % | 74,194 | | 433 | | 5.84 | |
| Lake Greenwood Crossing | | Greenwood, SC | | 8 | | 43,618 | | 100.0 | % | 100.0 | % | 43,618 | | 362 | | 8.30 | |
| Lake Murray | | Lexington, SC | | 5 | | 39,218 | | 100.0 | % | 100.0 | % | 39,218 | | 255 | | 6.50 | |
| Litchfield Market Village | | Pawleys Island, SC | | 21 | | 86,740 | | 90.8 | % | 90.8 | % | 78,797 | | 960 | | 12.19 | |
| Lumber River Village | | Lumberton, NC | | 11 | | 66,781 | | 98.2 | % | 98.2 | % | 65,581 | | 452 | | 6.89 | |
| Moncks Corner | | Moncks Corner, SC | | 1 | | 26,800 | | 100.0 | % | 100.0 | % | 26,800 | | 323 | | 12.07 | |
| Nashville Commons | | Nashville, NC | | 11 | | 56,100 | | 92.0 | % | 92.0 | % | 51,600 | | 584 | | 11.32 | |
| New Market Crossing | | Mt. Airy, NC | | 11 | | 117,076 | | 90.3 | % | 90.3 | % | 105,738 | | 951 | | 8.99 | |
| Parkway Plaza | | Brunswick, GA | | 4 | | 52,365 | | 81.7 | % | 81.7 | % | 42,785 | | 353 | | 8.25 | |
| Pierpont Centre | | Morgantown, WV | | 17 | | 111,162 | | 97.2 | % | 97.2 | % | 108,001 | | 996 | | 9.22 | |
| Port Crossing | | Harrisonburg, VA | | 7 | | 65,365 | | 100.0 | % | 100.0 | % | 65,365 | | 847 | | 12.96 | |
| Ridgeland | | Ridgeland, SC | | 1 | | 20,029 | | 100.0 | % | 100.0 | % | 20,029 | | 140 | | 7.00 | |
| Riverbridge Shopping Center | | Carrollton, GA | | 10 | | 91,188 | | 94.7 | % | 94.7 | % | 86,388 | | 692 | | 8.01 | |
| Rivergate Shopping Center | | Macon, GA | | 24 | | 193,960 | | 87.0 | % | 87.0 | % | 168,816 | | 2,450 | | 14.51 | |
| Sangaree Plaza | | Summerville, SC | | 10 | | 66,948 | | 100.0 | % | 100.0 | % | 66,948 | | 707 | | 10.56 | |
| Shoppes at Myrtle Park | | Bluffton, SC | | 13 | | 56,601 | | 97.3 | % | 97.3 | % | 55,084 | | 653 | | 11.86 | |
| South Lake | | Lexington, SC | | 10 | | 44,318 | | 97.3 | % | 97.3 | % | 43,118 | | 239 | | 5.54 | |
| South Park | | Mullins, SC | | 4 | | 60,734 | | 96.9 | % | 96.9 | % | 58,834 | | 381 | | 6.48 | |
| South Square | | Lancaster, SC | | 6 | | 44,350 | | 81.0 | % | 81.0 | % | 35,900 | | 302 | | 8.40 | |
| St. George Plaza | | St. George, SC | | 7 | | 59,174 | | 96.3 | % | 96.3 | % | 56,999 | | 396 | | 6.95 | |
| Sunshine Plaza | | Lehigh Acres, FL | | 23 | | 111,189 | | 100.0 | % | 100.0 | % | 111,189 | | 1,089 | | 9.80 | |
| Surrey Plaza | | Hawkinsville, GA | | 3 | | 42,680 | | 96.5 | % | 96.5 | % | 41,180 | | 247 | | 6.00 | |
| | | | | |
WHLR | Financial & Operating Data | as of 12/31/2021 unless otherwise stated | 17 |
Property Summary (continued)
| | | | | | | | | | | | | | | | | | | | | | | | | | | | | | | | |
Property | | Location | | Number of Tenants (1) | Total Leasable Square Feet | Percentage Leased (1) | Percentage Occupied | Total SF Occupied | Annualized Base Rent (in 000's) (2) | Annualized Base Rent per Occupied Sq. Foot |
| Tampa Festival | | Tampa, FL | | 19 | | 137,987 | | 97.7 | % | 64.6 | % | 89,166 | | $ | 910 | | $ | 10.21 | |
| Tri-County Plaza | | Royston, GA | | 6 | | 67,577 | | 88.8 | % | 88.8 | % | 59,977 | | 420 | | 7.00 | |
| Tuckernuck | | Richmond, VA | | 16 | | 93,624 | | 98.0 | % | 98.0 | % | 91,745 | | 971 | | 10.58 | |
| Twin City Commons | | Batesburg-Leesville, SC | | 5 | | 47,680 | | 100.0 | % | 100.0 | % | 47,680 | | 478 | | 10.03 | |
| Village of Martinsville | | Martinsville, VA | | 20 | | 290,902 | | 96.6 | % | 96.6 | % | 280,946 | | 2,177 | | 7.74 | |
| Walnut Hill Plaza | | Petersburg, VA | | 6 | | 87,239 | | 38.1 | % | 38.1 | % | 33,225 | | 279 | | 8.41 | |
| Waterway Plaza | | Little River, SC | | 10 | | 49,750 | | 100.0 | % | 100.0 | % | 49,750 | | 499 | | 10.02 | |
| Westland Square | | West Columbia, SC | | 10 | | 62,735 | | 95.7 | % | 95.7 | % | 60,065 | | 443 | | 7.38 | |
| Winslow Plaza | | Sicklerville, NJ | | 18 | | 40,695 | | 100.0 | % | 100.0 | % | 40,695 | | 641 | | 15.75 | |
Total Portfolio | | | | 785 | | 5,478,855 | | 94.2 | % | 91.6 | % | 5,015,789 | | $ | 48,232 | | $ | 9.62 | |
| | | | | | | | | | |
(1) Reflects leases executed through January 5, 2022 that commence subsequent to the end of the current reporting period.
(2) Annualized based rent per occupied square foot, assumes base rent as of the end of the current reporting period, excludes the impact of tenant concessions and rent abatements.
(3) This information is not available because the property is undeveloped.
(4) Square footage is net of the Company's on-premise management office and net of building square footage whereby the Company only leases the land.
| | | | | |
WHLR | Financial & Operating Data | as of 12/31/2021 unless otherwise stated | 18 |
Top Ten Tenants by Annualized Base Rent
Total Tenants : 785
| | | | | | | | | | | | | | | | | | | | | | | | | | | | | | | | | | | |
| Tenants | | Annualized Base Rent
($ in 000s) | | % of Total Annualized Base Rent | | Total Occupied Square Feet | | Percent Total Leasable Square Foot | | Base Rent Per Occupied Square Foot |
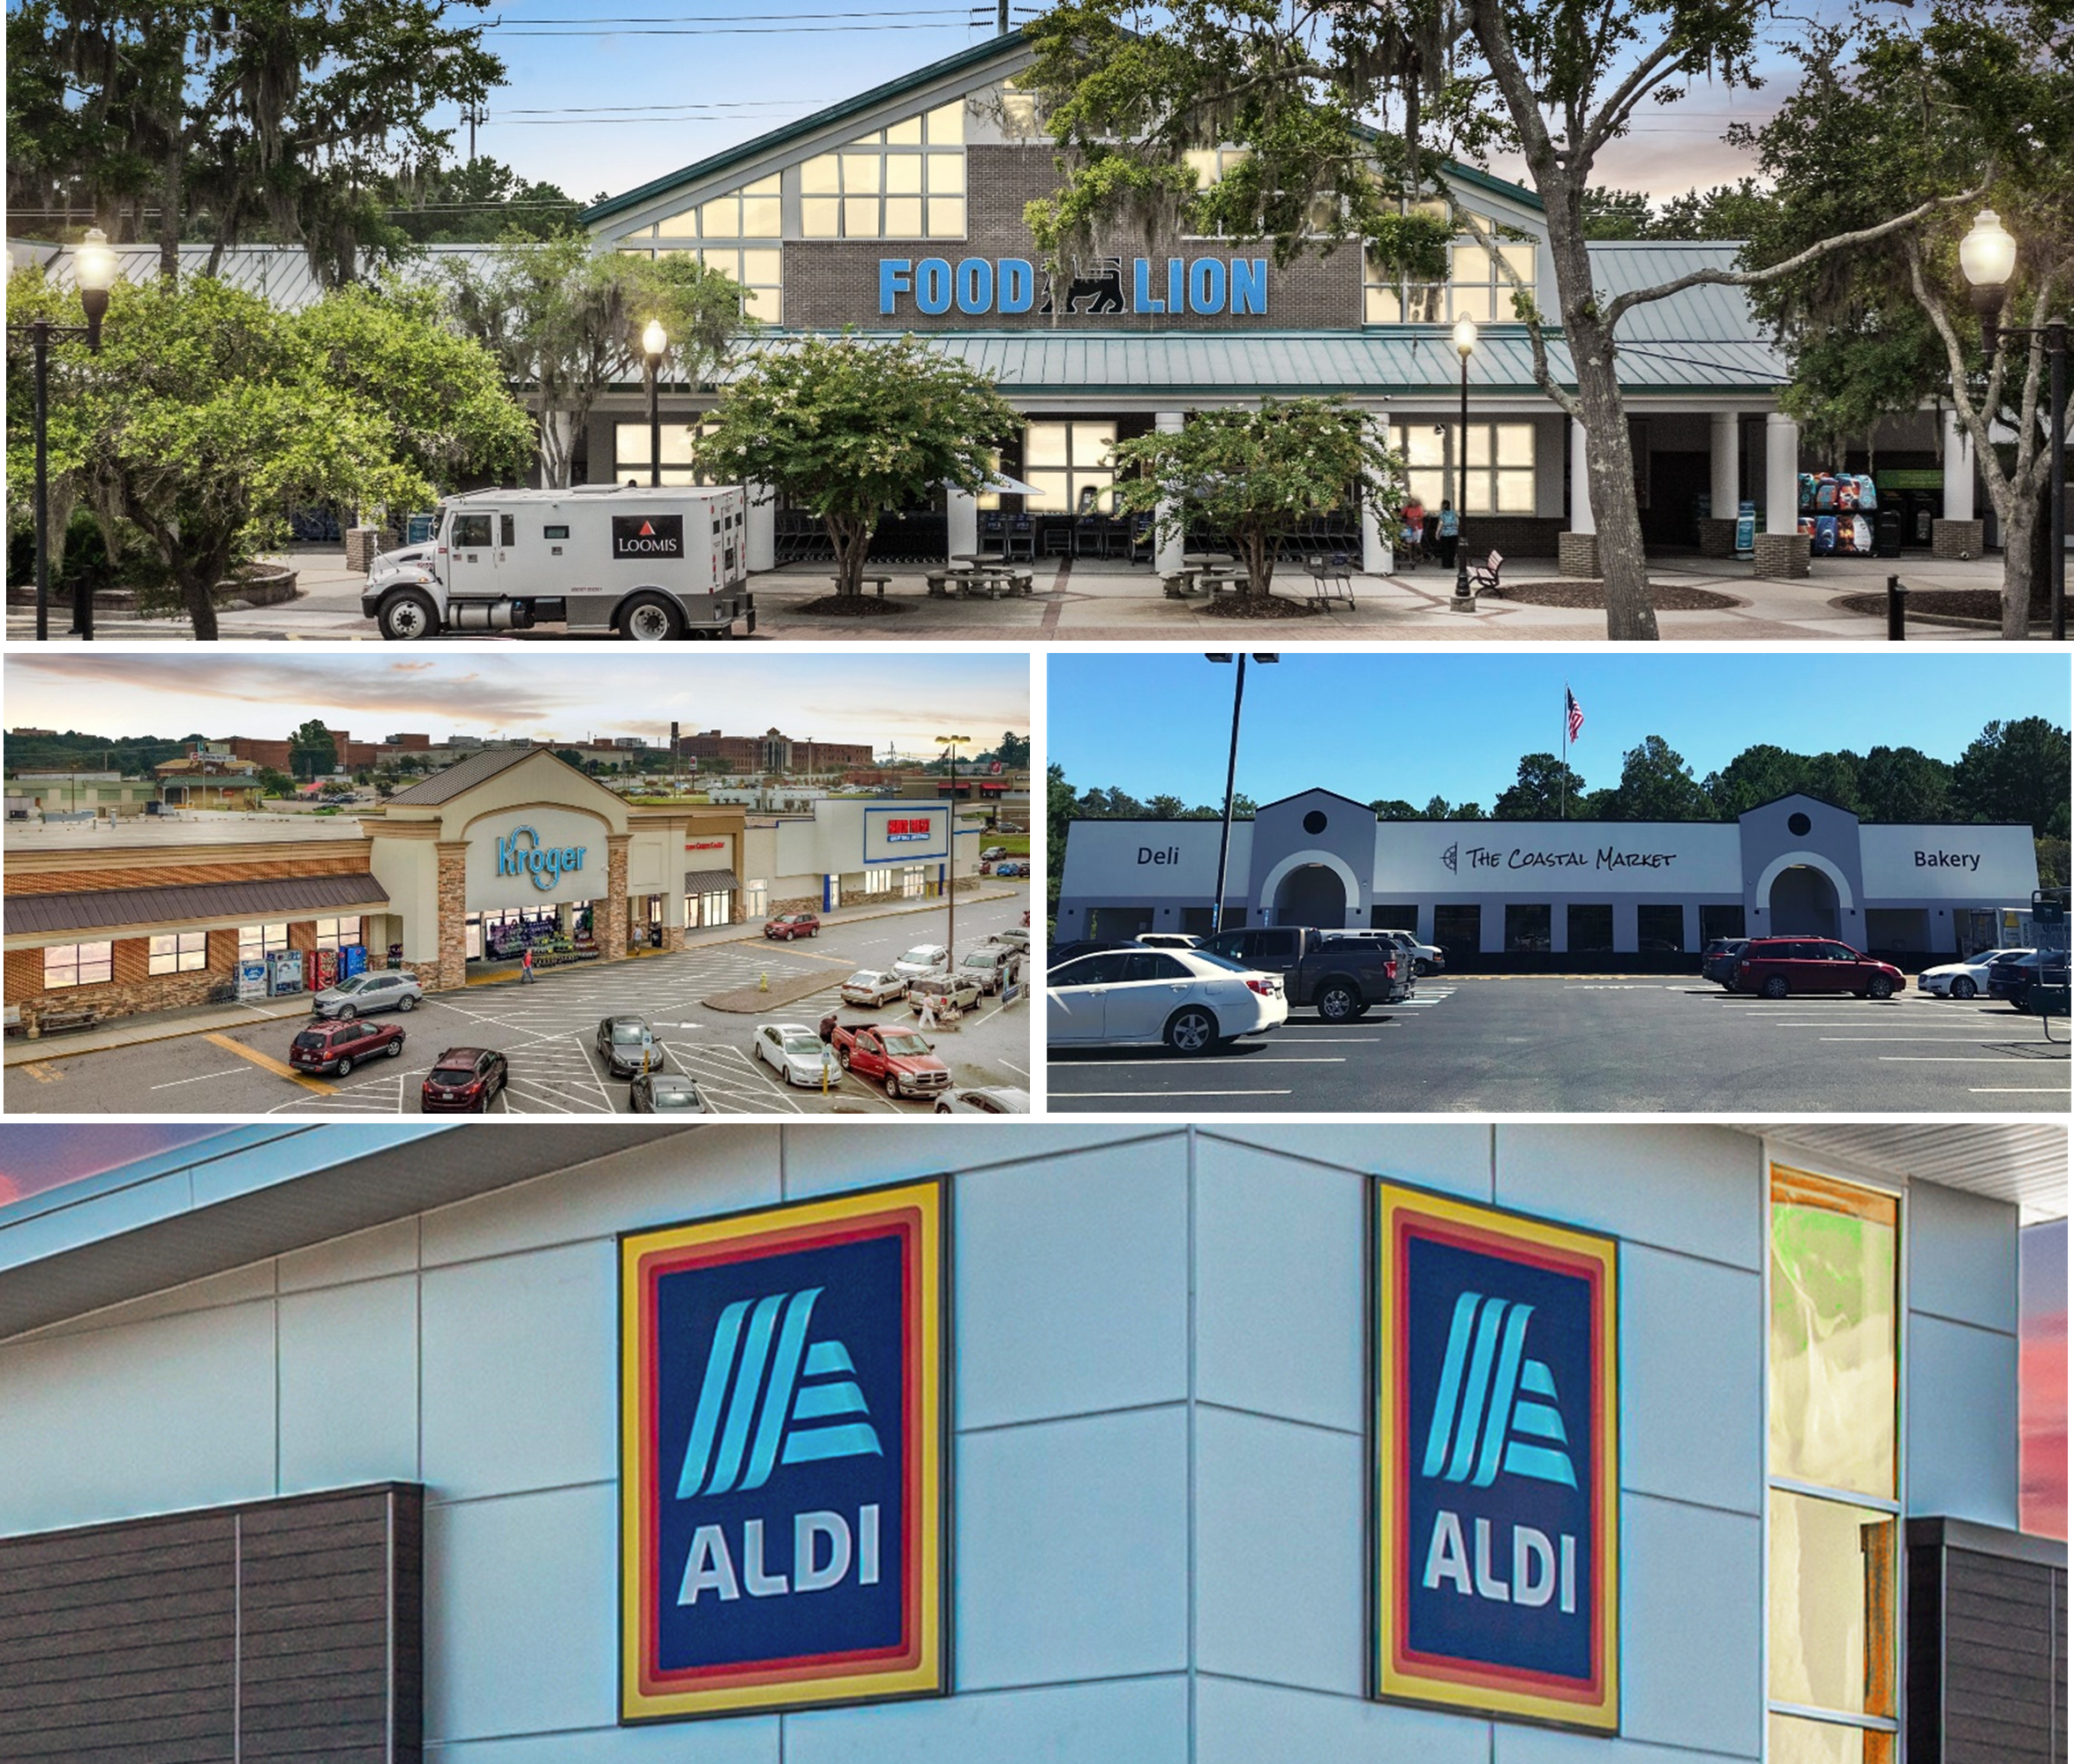
| Food Lion | | $ | 4,428 | | | 9.18 | % | | 551,469 | | | 10.07 | % | | $ | 8.03 | |
| Kroger Co. (1) | | 1,948 | | | 4.04 | % | | 226,010 | | | 4.13 | % | | 8.62 | |
| Piggly Wiggly | | 1,488 | | | 3.09 | % | | 202,968 | | | 3.70 | % | | 7.33 | |
| Dollar Tree (2) | | 1,192 | | | 2.47 | % | | 148,605 | | | 2.71 | % | | 8.02 | |
| Lowes Foods (3) | | 1,181 | | | 2.45 | % | | 130,036 | | | 2.37 | % | | 9.08 | |
| Winn Dixie | | 887 | | | 1.84 | % | | 133,575 | | | 2.44 | % | | 6.64 | |
| Planet Fitness | | 837 | | | 1.74 | % | | 100,427 | | | 1.83 | % | | 8.33 | |
| Hobby Lobby | | 717 | | | 1.49 | % | | 114,298 | | | 2.09 | % | | 6.27 | |
| Big Lots | | 679 | | | 1.41 | % | | 105,674 | | | 1.93 | % | | 6.43 | |
| BJ'S Wholesale Club | | 651 | | | 1.35 | % | | 147,400 | | | 2.69 | % | | 4.42 | |
| | | $ | 14,008 | | | 29.06 | % | | 1,860,462 | | | 33.96 | % | | $ | 7.53 | |
(1) Kroger 4 / Harris Teeter 1
(2) Dollar Tree 9 / Family Dollar 6
(3) Lowes Foods 1 / KJ's Market 2
Lease Expiration Schedule
| | | | | | | | | | | | | | | | | | | | | | | | | | | | | | | | | | | | | | | | | | | | |
| Lease Expiration Period | | Number of Expiring Leases | | Total Expiring Square Footage | | % of Total Expiring Square Footage | | % of Total Occupied Square Footage Expiring | | Expiring Annualized Base Rent (in 000s) | | % of Total Annualized Base Rent | | Expiring Base Rent Per Occupied
Square Foot |
| Available | | — | | | 463,066 | | | 8.45 | % | | — | % | | $ | — | | | — | % | | $ | — | |
| MTM | | 7 | | | 13,489 | | | 0.25 | % | | 0.27 | % | | 211 | | | 0.44 | % | | 15.64 | |
| 2022 | | 105 | | | 323,894 | | | 5.91 | % | | 6.46 | % | | 3,439 | | | 7.13 | % | | 10.62 | |
| 2023 | | 131 | | | 817,131 | | | 14.91 | % | | 16.29 | % | | 7,107 | | | 14.74 | % | | 8.70 | |
| 2024 | | 141 | | | 749,944 | | | 13.69 | % | | 14.95 | % | | 7,358 | | | 15.26 | % | | 9.81 | |
| 2025 | | 120 | | | 867,537 | | | 15.83 | % | | 17.30 | % | | 8,517 | | | 17.66 | % | | 9.82 | |
| 2026 | | 121 | | | 830,542 | | | 15.16 | % | | 16.56 | % | | 8,207 | | | 17.02 | % | | 9.88 | |
| 2027 | | 59 | | | 325,704 | | | 5.94 | % | | 6.49 | % | | 3,639 | | | 7.54 | % | | 11.17 | |
| 2028 | | 22 | | | 335,606 | | | 6.13 | % | | 6.69 | % | | 2,376 | | | 4.93 | % | | 7.08 | |
| 2029 | | 20 | | | 150,962 | | | 2.76 | % | | 3.01 | % | | 1,479 | | | 3.07 | % | | 9.80 | |
| 2030 | | 15 | | | 249,357 | | | 4.55 | % | | 4.97 | % | | 1,997 | | | 4.14 | % | | 8.01 | |
| 2031 & thereafter | | 44 | | | 351,623 | | | 6.42 | % | | 7.01 | % | | 3,902 | | | 8.07 | % | | 11.10 | |
| Total | | 785 | | | 5,478,855 | | | 100.00 | % | | 100.00 | % | | $ | 48,232 | | | 100.00 | % | | $ | 9.62 | |
| | | | | |
WHLR | Financial & Operating Data | as of 12/31/2021 unless otherwise stated | 19 |
Leasing Summary
Anchor Lease Expiration Schedule (1)
| | | | | | | | | | | | | | | | | | | | | | | | | | | | | | | | | | | |
| No Option | | Option |
| Lease Expiration Period | Number of Expiring Leases | Expiring Occupied Square Footage | Expiring Annualized Based Rent (in 000s) | % of Total Annualized Base Rent | Expiring Base Rent per Square Foot | | Number of Expiring Leases | Expiring Occupied Square Footage | Expiring Annualized Based Rent (in 000s) | % of Total Annualized Base Rent | Expiring Base Rent per Square Foot |
| Available | — | | 174,013 | | $ | — | | — | % | $ | — | | | — | | — | | $ | — | | — | % | $ | — | |
| Month-to-Month | | | — | | — | % | — | | | | | — | | — | % | — | |
| 2022 | | | — | | — | % | — | | | 2 | | 71,203 | | 435 | | 2.37 | % | 6.11 | |
| 2023 | 2 | | 43,392 | | 329 | | 17.64 | % | 7.58 | | | 14 | | 490,775 | | 3,022 | | 16.47 | % | 6.16 | |
| 2024 | 1 | | 32,000 | | 125 | | 6.70 | % | 3.91 | | | 9 | | 351,977 | | 2,331 | | 12.71 | % | 6.62 | |
| 2025 | 2 | | 84,633 | | 619 | | 33.19 | % | 7.31 | | | 12 | | 472,936 | | 3,777 | | 20.59 | % | 7.99 | |
| 2026 | 1 | | 20,152 | | 97 | | 5.20 | % | 4.81 | | | 13 | | 435,435 | | 3,498 | | 19.07 | % | 8.03 | |
| 2027 | 2 | | 45,759 | | 323 | | 17.31 | % | 7.06 | | | 2 | | 57,345 | | 447 | | 2.44 | % | 7.79 | |
| 2028 | | | — | | — | % | — | | | 7 | | 280,841 | | 1,637 | | 8.92 | % | 5.83 | |
| 2029 | 1 | | 21,213 | | 317 | | 17.00 | % | 14.94 | | | 2 | | 45,700 | | 307 | | 1.67 | % | 6.72 | |
| 2030 | | | — | | 0.01 | % | — | | | 3 | | 216,346 | | 1,359 | | 7.41 | % | 6.28 | |
| 2031+ | 1 | | 20,858 | | 55 | | 2.95 | % | 2.64 | | | 6 | | 194,199 | | 1,530 | | 8.35 | % | 7.88 | |
| Total | 10 | | 442,020 | | $ | 1,865 | | 100.00 | % | $ | 6.96 | | | 70 | | 2,616,757 | | $ | 18,343 | | 100.00 | % | $ | 7.01 | |
(1) Anchors defined as leases occupying 20,000 square feet or more.
Non-anchor Lease Expiration Schedule
| | | | | | | | | | | | | | | | | | | | | | | | | | | | | | | | | | | |
| No Option | | Option |
| Lease Expiration Period | Number of Expiring Leases | Expiring Occupied Square Footage | Expiring Annualized Based Rent (in 000s) | % of Total Annualized Base Rent | Expiring Base Rent per Square Foot | | Number of Expiring Leases | Expiring Occupied Square Footage | Expiring Annualized Based Rent (in 000s) | % of Total Annualized Base Rent | Expiring Base Rent per Square Foot |
| Available | — | | 289,053 | | $ | — | | — | % | $ | — | | | — | | — | | $ | — | | — | % | $ | — | |
| Month-to-Month | 5 | | 9,389 | | 159 | | 1.19 | % | 16.93 | | | 2 | | 4,100 | | 52 | | 0.35 | % | 12.68 | |
| 2022 | 67 | | 155,307 | | 1,676 | | 12.55 | % | 10.79 | | | 36 | | 97,384 | | 1,328 | | 9.05 | % | 13.64 | |
| 2023 | 67 | | 136,374 | | 1,779 | | 13.32 | % | 13.05 | | | 48 | | 146,590 | | 1,977 | | 13.48 | % | 13.49 | |
| 2024 | 81 | | 183,923 | | 2,430 | | 18.19 | % | 13.21 | | | 50 | | 182,044 | | 2,472 | | 16.85 | % | 13.58 | |
| 2025 | 66 | | 159,974 | | 2,109 | | 15.79 | % | 13.18 | | | 40 | | 149,994 | | 2,012 | | 13.72 | % | 13.41 | |
| 2026 | 64 | | 175,450 | | 2,265 | | 16.96 | % | 12.91 | | | 43 | | 199,505 | | 2,347 | | 16.00 | % | 11.76 | |
| 2027 | 30 | | 93,095 | | 1,167 | | 8.74 | % | 12.54 | | | 25 | | 129,505 | | 1,703 | | 11.61 | % | 13.15 | |
| 2028 | 10 | | 29,649 | | 431 | | 3.23 | % | 14.54 | | | 5 | | 25,116 | | 308 | | 2.10 | % | 12.26 | |
| 2029 | 7 | | 23,850 | | 241 | | 1.80 | % | 10.10 | | | 10 | | 60,199 | | 614 | | 4.19 | % | 10.20 | |
| 2030 | 6 | | 13,895 | | 238 | | 1.78 | % | 17.13 | | | 6 | | 19,116 | | 400 | | 2.73 | % | 20.92 | |
| 2031+ | 16 | | 60,278 | | 862 | | 6.45 | % | 14.30 | | | 21 | | 76,288 | | 1,454 | | 9.92 | % | 19.06 | |
| Total | 419 | | 1,330,237 | | $ | 13,357 | | 100.00 | % | $ | 12.83 | | | 286 | | 1,089,841 | | $ | 14,667 | | 100.00 | % | $ | 13.46 | |
| | | | | |
WHLR | Financial & Operating Data | as of 12/31/2021 unless otherwise stated | 20 |
Leasing Summary
Leasing Renewals, New Leases and Expirations
| | | | | | | | | | | | | | | | | | | | | | | |
| Three Months Ended December 31, | | Twelve Months Ended December 31, |
| 2021 | | 2020 | | 2021 | | 2020 |
Renewals(1): | | | | | | | |
| Leases renewed with rate increase (sq feet) | 137,644 | | | 88,506 | | | 402,875 | | | 616,548 | |
| Leases renewed with rate decrease (sq feet) | 1,400 | | | 34,802 | | | 67,743 | | | 123,935 | |
| Leases renewed with no rate change (sq feet) | 60,049 | | | 158,183 | | | 148,542 | | | 404,428 | |
| Total leases renewed (sq feet) | 199,093 | | | 281,491 | | | 619,160 | | | 1,144,911 | |
| | | | | | | |
| Leases renewed with rate increase (count) | 33 | | | 16 | | | 104 | | | 127 | |
| Leases renewed with rate decrease (count) | 1 | | | 7 | | | 11 | | | 24 | |
| Leases renewed with no rate change (count) | 2 | | | 15 | | | 23 | | | 53 | |
| Total leases renewed (count) | 36 | | | 38 | | | 138 | | | 204 | |
| | | | | | | |
| Option exercised (count) | 6 | | | 5 | | | 22 | | | 22 | |
| | | | | | | |
| Weighted average on rate increases (per sq foot) | $ | 0.97 | | | $ | 1.15 | | | $ | 0.85 | | | $ | 1.12 | |
| Weighted average on rate decreases (per sq foot) | $ | (0.15) | | | $ | (2.18) | | | $ | (2.18) | | | $ | (1.43) | |
| Weighted average rate on all renewals (per sq foot) | $ | 0.67 | | | $ | 0.09 | | | $ | 0.32 | | | $ | 0.45 | |
| | | | | | | |
| Weighted average change over prior rates | 6.13 | % | | 1.02 | % | | 3.05 | % | | 4.63 | % |
| | | | | | | |
New Leases(1) (2): | | | | | | | |
| New leases (sq feet) | 118,548 | | | 130,624 | | | 436,170 | | | 333,279 | |
| New leases (count) | 14 | | | 24 | | | 76 | | | 72 | |
| Weighted average rate (per sq foot) | $ | 7.08 | | | $ | 7.69 | | | $ | 8.30 | | | $ | 9.03 | |
| | | | | | | |
| Gross Leasable Area ("GLA") expiring during the next 12 months, including month-to-month leases | | 6.16 | % | | 6.97 | % |
(1) Lease data presented is based on average rate per square foot over the renewed or new lease term.
(2) The Company does not include ground leases entered into for the purposes of new lease sq feet and weighted average rate (per sq foot) on new leases.
| | | | | |
WHLR | Financial & Operating Data | as of 12/31/2021 unless otherwise stated | 21 |
Definitions
Funds from Operations (FFO): an alternative measure of a REIT's operating performance, specifically as it relates to results of operations and liquidity. FFO is a measurement that is not in accordance with accounting principles generally accepted in the United States (GAAP). Wheeler computes FFO in accordance with standards established by the Board of Governors of NAREIT in its March 1995 White Paper (as amended in November 1999 and December 2018). As defined by NAREIT, FFO represents net income (computed in accordance with GAAP), excluding gains (or losses) from sales of property, plus real estate related depreciation and amortization (excluding amortization of loan origination costs), plus impairment of real estate related long-lived assets and after adjustments for unconsolidated partnerships and joint ventures.
Most industry analysts and equity REITs, including Wheeler, consider FFO to be an appropriate supplemental measure of operating performance because, by excluding gains or losses on dispositions and excluding depreciation, FFO is a helpful tool that can assist in the comparison of the operating performance of a company’s real estate between periods, or as compared to different companies. Management uses FFO as a supplemental measure to conduct and evaluate the business because there are certain limitations associated with using GAAP net income alone as the primary measure of our operating performance. Historical cost accounting for real estate assets in accordance with GAAP implicitly assumes that the value of real estate assets diminishes predictably over time, while historically real estate values have risen or fallen with market conditions.
Adjusted FFO (AFFO): Management believes that the computation of FFO in accordance with NAREIT’s definition includes certain items that are not indicative of the operating performance of the Company’s real estate assets. These items include, but are not limited to, non-recurring expenses, legal settlements, acquisition costs and capital raise costs. Management uses AFFO, which is a non-GAAP financial measure, to exclude such items. Management believes that reporting AFFO in addition to FFO is a useful supplemental measure for the investment community to use when evaluating the operating performance of the Company on a comparative basis. The Company also presents Pro Forma AFFO which shows the impact of certain activities assuming they occurred at the beginning of the year.
Earnings Before Interest, Taxes, Depreciation and Amortization (EBITDA): another widely-recognized non-GAAP financial measure that the Company believes, when considered with financial statements prepared in accordance with GAAP, is useful to investors and lenders in understanding financial performance and providing a relevant basis for comparison among other companies, including REITs. While EBITDA should not be considered as a substitute for net income attributable to the Company’s common stockholders, net operating income, cash flow from operating activities, or other income or cash flow data prepared in accordance with GAAP, the Company believes that EBITDA may provide additional information with respect to the Company’s performance or ability to meet its future debt service requirements, capital expenditures and working capital requirements. The Company computes EBITDA by excluding interest expense, net loss attributable to noncontrolling interests, depreciation and amortization and impairment of long-lived assets and notes receivable, from income from continuing operations. The Company also presents Adjusted EBITDA which excludes affecting the comparability of the periods presented, including but not limited to, costs associated with acquisitions and capital related activities.
| | | | | |
WHLR | Financial & Operating Data | as of 12/31/2021 unless otherwise stated | 22 |
Net Operating Income (NOI): The Company believes that NOI is a useful measure of the Company's property operating performance. The Company defines NOI as property revenues (rental and other revenues) less property and related expenses (property operation and maintenance and real estate taxes). Because NOI excludes general and administrative expenses, depreciation and amortization, interest expense, interest income, provision for income taxes, gain or loss on sale or capital expenditures and leasing costs, it provides a performance measure, that when compared year over year, reflects the revenues and expenses directly associated with owning and operating commercial real estate properties and the impact to operations from trends in occupancy rates, rental rates and operating costs, providing perspective not immediately apparent from net income. The Company uses NOI to evaluate its operating performance since NOI allows the Company to evaluate the impact of factors, such as occupancy levels, lease structure, lease rates and tenant base, have on the Company's results, margins and returns. NOI should not be viewed as a measure of the Company's overall financial performance since it does not reflect general and administrative expenses, depreciation and amortization, impairment of impairment of long-lived assets, involuntary conversion, interest expense, interest income, provision for income taxes, gain or loss on sale or disposition of assets, and the level of capital expenditures and leasing costs necessary to maintain the operating performance of the Company's properties. Other REITs may use different methodologies for calculating NOI, and accordingly, the Company's NOI may not be comparable to that of other REITs.
| | | | | |
WHLR | Financial & Operating Data | as of 12/31/2021 unless otherwise stated | 23 |