| Label | Element | Value | ||||||
|---|---|---|---|---|---|---|---|---|
| Risk/Return: | rr_RiskReturnAbstract | |||||||
| Registrant Name | dei_EntityRegistrantName | Lincoln Advisors Trust | ||||||
| Prospectus Date | rr_ProspectusDate | Jan. 28, 2013 | ||||||
|
Presidential Protected Profile 2040 Fund
|
||||||||
| Risk/Return: | rr_RiskReturnAbstract | |||||||
| Risk/Return [Heading] | rr_RiskReturnHeading | PresidentialSM Protected Profile 2040 Fund (Class A, Class C, and Class I) |
||||||
| Objective [Heading] | rr_ObjectiveHeading | Investment Objective | ||||||
| Objective, Primary [Text Block] | rr_ObjectivePrimaryTextBlock | The investment objective of the Fund is to seek the highest total return over time with an increased emphasis on capital preservation as the target date approaches. Thereafter, an emphasis will be placed on high current income | ||||||
| Objective, Secondary [Text Block] | rr_ObjectiveSecondaryTextBlock | with a secondary focus on capital appreciation. | ||||||
| Expense [Heading] | rr_ExpenseHeading | Fees and Expenses | ||||||
| Expense Narrative [Text Block] | rr_ExpenseNarrativeTextBlock | This table describes the fees and expenses that you may pay if you buy and hold shares of the Fund. You may qualify for sales charge discounts if you and your family invest, or agree to invest in the future, at least $50,000 in Class A shares of eligible funds; more information about these and other discounts is available in the “Classes of Fund Shares” section on page 12 of the Fund’s Prospectus or from your financial advisor. Unless you are eligible for a waiver, if you sell (redeem) your Class C shares during the first year, you will pay a CDSC of 0.50%. | ||||||
| Shareholder Fees Caption [Text] | rr_ShareholderFeesCaption | Shareholder Fees (fees paid directly from your investment) | ||||||
| Operating Expenses Caption [Text] | rr_OperatingExpensesCaption | Annual Fund Operating Expenses (expenses that you pay each year as a percentage of the value of your investment) | ||||||
| Fee Waiver or Reimbursement over Assets, Date of Termination | rr_FeeWaiverOrReimbursementOverAssetsDateOfTermination | January 28, 2014 | ||||||
| Portfolio Turnover [Heading] | rr_PortfolioTurnoverHeading | Portfolio Turnover | ||||||
| Portfolio Turnover [Text Block] | rr_PortfolioTurnoverTextBlock | The Fund pays transaction costs, such as commissions, when it buys and sells securities (or “turns over” its portfolio). A higher portfolio turnover rate may indicate higher transaction costs and may result in higher taxes when Fund shares are held in a taxable account. These costs, which are not reflected in annual fund operating expenses or in the example, affect the Fund’s performance. During the most recent fiscal year, the Fund's portfolio turnover rate was 29% of the average value of its portfolio. | ||||||
| Portfolio Turnover, Rate | rr_PortfolioTurnoverRate | 29.00% | ||||||
| Expense Breakpoint Discounts [Text] | rr_ExpenseBreakpointDiscounts | You may qualify for sales charge discounts if you and your family invest, or agree to invest in the future, at least $50,000 in Class A shares of eligible funds; more information about these and other discounts is available in the “Classes of Fund Shares” section on page 12 of the Fund’s Prospectus or from your financial advisor. Unless you are eligible for a waiver, if you sell (redeem) your Class C shares during the first year, you will pay a CDSC of 0.50%. | ||||||
| Expense Breakpoint, Minimum Investment Required [Amount] | rr_ExpenseBreakpointMinimumInvestmentRequiredAmount | 50,000 | ||||||
| Expenses Restated to Reflect Current [Text] | rr_ExpensesRestatedToReflectCurrent | The expenses that comprise the Shareholder Service Fee were not charged for the entire previous year. Therefore, the 0.15% is a restated amount that represents the expenses that would have been incurred had the expenses been charged for the entire year. | ||||||
| Expenses Not Correlated to Ratio Due to Acquired Fund Fees [Text] | rr_ExpensesNotCorrelatedToRatioDueToAcquiredFundFees | The Total Annual Fund Operating Expenses do not correlate to the ratio of expenses to the average net assets appearing in the Financial Highlights table which reflects only the operating expenses of the Fund and does not include AFFE. | ||||||
| Expense Example [Heading] | rr_ExpenseExampleHeading | Example | ||||||
| Expense Example Narrative [Text Block] | rr_ExpenseExampleNarrativeTextBlock | This example is intended to help you compare the cost of investing in the Fund with the cost of investing in other mutual funds. The example assumes that you invest $10,000 in the Fund’s shares for the time periods indicated and then redeem all your shares at the end of those periods (except where otherwise noted). The example also assumes that the Fund provides a return of 5% a year and that operating expenses remain the same. The figures reflect the expense limitation for the first year. Your actual costs may be higher or lower than this example. | ||||||
| Strategy [Heading] | rr_StrategyHeading | Principal Investment Strategies | ||||||
| Strategy Narrative [Text Block] | rr_StrategyNarrativeTextBlock | The Fund operates under a “fund of funds” structure. The Fund, under normal circumstances, will invest 80% or more of its assets in underlying funds, including exchange traded funds (“underlying funds”). The Fund does not currently expect to invest in underlying funds advised by the adviser, although it may do so in the future. A significant portion of the Fund’s assets will be invested in underlying funds that employ a passive investment style, i.e., index funds. The Fund’s largest allocation will be to underlying funds that primarily invest in domestic and foreign equity securities, including large-, medium- and small-cap equities and both growth and value equity securities. The foreign equity securities held by the underlying funds will be from issuers in both developed and emerging markets. A significantly smaller allocation will be made to underlying funds that primarily invest in domestic and global fixed income securities, including mortgage-backed bonds. The Fund will also employ an actively managed risk-management overlay (“protection sub-strategy”) using up to 20% of its net assets. The protection sub-strategy consists of using hedging instruments (short positions in exchanged-traded futures contracts) to manage overall portfolio volatility and to protect the majority of the Fund’s portfolio securities. Futures contracts can be purchased or sold by the Fund for less than their contract value, allowing an efficient use of Fund assets for the protection sub-strategy. “Volatility” in this context means variance in the Fund's investment returns. The adviser will seek to hedge currency risk involved in foreign futures contracts. The adviser selects individual futures contracts on equity indices of domestic and foreign markets that it believes will have prices that are negatively correlated to the Fund’s equity exposure. The Fund will sell (short) futures contracts on these indices to decrease the Fund's aggregate economic exposure to equities based on the adviser's evaluation of market volatility and downside equity market risk. The short futures contracts increase in value as equity markets decline. The adviser will regularly adjust the level of exchange-traded futures contracts to manage the Fund's overall net risk level. The Fund's target volatility will adjust over time in relation to the target date. The protection sub-strategy would allow for more volatility of the Fund's returns the further the Fund is from the target date, but seeks to more tightly control the volatility of the Fund's returns as the investor reaches retirement and as the investor ages. Even in periods of low volatility in the equity markets, the adviser will continue to use the hedging techniques to preserve gains after favorable market conditions and reduce losses in adverse market conditions. The Fund’s investment in exchange-traded futures and their resulting costs will limit the upside participation of the Fund in strong, increasing markets relative to unhedged funds. In situations of extreme market volatility, the exchange-traded futures could potentially reduce the Fund’s net economic exposure to equity securities to 0%. The Fund is designed for investors planning to retire close to the year 2040 (target date). The target date refers to the approximate year an investor in the Fund would plan to retire and likely stop making new investments in the Fund. Before investing in the Fund, an investor should consider, in addition to age and retirement date, other factors such as the investor’s risk tolerance, personal circumstances, and complete financial situation. The adviser invests the Fund in underlying funds in accordance with an asset allocation between equity securities and fixed income securities. Over time, the asset allocation model will change according to a predetermined “glide path” shown in the chart below. As the glide path shows, the Fund’s asset mix becomes more conservative as time elapses. In addition, the Fund's target volatility of returns under the protection sub-strategy also becomes more conservative as time elapses. These features reflect the desire to gradually reduce investment risk and volatility both as the retirement date approaches, as well as through the retirement years in an effort to preserve capital during retirement. 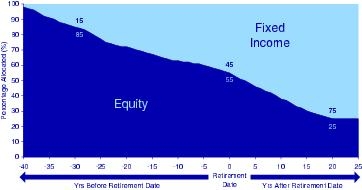 The Fund’s current investment strategy, under normal circumstances, will be to invest at least 80% of its assets in underlying funds. Approximately 81% of these underlying funds will invest primarily in equity securities and 19% will invest primarily in fixed income securities. At the target date, at least 80% of the Fund’s assets are anticipated to be invested in underlying funds. Approximately 55% of these assets at the target date will be in underlying funds that invest primarily in equity securities and 45% in underlying funds that invest primarily in fixed income securities. As part of the adviser’s protection sub-strategy, the portion of the Fund not invested in underlying funds will be invested in exchange-traded futures contracts, cash collateral to support these contracts and/or high-quality short-term money market investments. The Fund’s aggregate economic exposure to equities at the target date may vary between a low of 0% in extreme market conditions and a high of 55% in more benign markets. Under normal market conditions, the adviser expects the Fund’s aggregate economic exposure to equities at the target date to be between 35% and 55%. After the Fund reaches its designated retirement year, it will continue to be managed according to an asset allocation model that becomes increasingly conservative over time, until approximately twenty years after retirement (landing date) when the Fund is expected to maintain a static allocation of approximately 25% of its assets in underlying funds that invest primarily in equity securities. At the landing date, as a result of the protection sub-strategy, the Fund's net economic exposure to equities may vary between a low of 0% in extreme market conditions and a high of 25% in more benign markets. Under normal market conditions, the adviser expects the Fund's aggregate economic exposure to equities at the landing date to be between 15% and 25%. On at least an annual basis, the adviser will reassess and make any necessary revisions in the Fund’s asset allocation model, including revising the asset class weightings in the model. At that time, the level of exchange-traded futures held will be adjusted for any changes to the asset allocation model. This will ensure that the Fund's overall risk level remains aligned with the protection sub-strategy and the current level of the adviser’s assessment of overall market risk and general economic climate. The maximum amount of change to the model’s asset class allocations that would be made in one year is plus or minus 10%. On a quarterly basis, the adviser will evaluate the need to add, remove and/or re-weight the underlying funds in the Fund’s asset allocation model. The adviser will also periodically rebalance the weightings in the underlying funds to the asset allocation model. In general, the adviser does not anticipate making frequent changes in the asset allocation model and will not attempt to time the market. The amount of exchange-traded futures in the Fund will fluctuate daily based upon market conditions. During extreme market conditions, exchange-traded futures could reduce or even eliminate the Fund’s equity exposure that is shown in the chart above. The Fund is non-diversified for purposes of the Investment Company Act of 1940 (“1940 Act”), and as a result may invest a greater percentage of its assets in a particular issuer than a diversified fund. However, through the underlying funds, the Fund owns a diversified mix of equity securities (stocks) and fixed income securities (bonds). |
||||||
| Risk [Heading] | rr_RiskHeading | Principal Risks | ||||||
| Risk Narrative [Text Block] | rr_RiskNarrativeTextBlock | All mutual funds carry a certain amount of risk. Accordingly, loss of money is a risk of investing in the Fund. Because the Fund invests its assets in shares of underlying funds, the Fund is exposed to the same investments as those made by the underlying funds. By investing in the Fund, therefore, you indirectly assume the same types of risks as investing directly in the underlying funds. The Fund's investment performance is affected by each underlying fund's investment performance, and the Fund's ability to achieve its investment objective depends, in large part, on each underlying fund's ability to meet its investment objective. The following risks reflect the Fund's principal risks, which include the underlying funds' principal risks.
|
||||||
| Risk Lose Money [Text] | rr_RiskLoseMoney | Accordingly, loss of money is a risk of investing in the Fund. | ||||||
| Risk Nondiversified Status [Text] | rr_RiskNondiversifiedStatus |
|
||||||
| Bar Chart and Performance Table [Heading] | rr_BarChartAndPerformanceTableHeading | Fund Performance | ||||||
| Performance Narrative [Text Block] | rr_PerformanceNarrativeTextBlock | The following bar chart and table provide some indication of the risks of choosing to invest in the Fund. The information shows: (a) how the Fund's Class A shares varied during the year; and (b) how the Fund's average annual returns for the one year and lifetime periods compare with those of a broad measure of market performance. Information also has been provided for the PresidentialSM Protected Profile 2040 Composite, an unmanaged index compiled by the adviser, which is currently constructed as follows: 18% Barclays Capital U.S. Aggregate Bond Index, 1% Barclays Capital U.S. TIPS Index, 29% MSCI EAFE Index (net dividends), 3% MSCI Emerging Markets Index (net dividends) and 49% Wilshire 5000 Total Market IndexSM. The bar chart shows performance of the Fund's Class A shares, but does not reflect the impact of sales charges (loads). If it did, returns would be lower than those shown. Performance in the Average Annual Total Returns table reflects the impact of sales charges. The Fund's past performance, before and after taxes, is not necessarily an indication of how the Fund will perform in the future. Performance for the Fund is updated daily, monthly, and quarterly and may be obtained at: www.lfg.com/presidential. | ||||||
| Performance Information Illustrates Variability of Returns [Text] | rr_PerformanceInformationIllustratesVariabilityOfReturns | The following bar chart and table provide some indication of the risks of choosing to invest in the Fund. The information shows: (a) how the Fund's Class A shares varied during the year; and (b) how the Fund's average annual returns for the one year and lifetime periods compare with those of a broad measure of market performance. | ||||||
| Performance Availability Website Address [Text] | rr_PerformanceAvailabilityWebSiteAddress | www.lfg.com/presidential | ||||||
| Performance Past Does Not Indicate Future [Text] | rr_PerformancePastDoesNotIndicateFuture | The Fund's past performance, before and after taxes, is not necessarily an indication of how the Fund will perform in the future. | ||||||
| Bar Chart [Heading] | rr_BarChartHeading | Annual Total Returns | ||||||
| Bar Chart Does Not Reflect Sales Loads [Text] | rr_BarChartDoesNotReflectSalesLoads | The bar chart shows performance of the Fund's Class A shares, but does not reflect the impact of sales charges (loads). If it did, returns would be lower than those shown. | ||||||
| Bar Chart Closing [Text Block] | rr_BarChartClosingTextBlock | During the periods shown above in the chart, the Fund's highest return for a quarter occurred in the first quarter of 2012 at: 7.54%. The Fund's lowest return for a quarter occurred in the second quarter of 2012 at: (3.69%). |
||||||
| Performance Table Heading | rr_PerformanceTableHeading | Average Annual Total Returns For the period eneded 12/31/12 |
||||||
| Performance Table Does Reflect Sales Loads | rr_PerformanceTableDoesReflectSalesLoads | Performance in the Average Annual Total Returns table reflects the impact of sales charges. | ||||||
| Performance Table Uses Highest Federal Rate | rr_PerformanceTableUsesHighestFederalRate | The after-tax returns shown are calculated using the highest individual federal marginal income tax rates in effect during the periods presented and do not reflect the impact of state and local taxes. | ||||||
| Performance Table Not Relevant to Tax Deferred | rr_PerformanceTableNotRelevantToTaxDeferred | Actual after-tax returns depend on the investor’s individual tax situation and may differ from the returns shown. After-tax returns are not relevant for shares held in tax-deferred investment vehicles such as employer-sponsored 401(k) plans and individual retirement accounts (IRAs). | ||||||
| Performance Table One Class of after Tax Shown [Text] | rr_PerformanceTableOneClassOfAfterTaxShown | After-tax performance is presented only for Class A shares. The after-tax returns for other classes may vary. | ||||||
| Performance Table Narrative | rr_PerformanceTableNarrativeTextBlock | After-tax performance is presented only for Class A shares. The after-tax returns for other classes may vary. Actual after-tax returns depend on the investor’s individual tax situation and may differ from the returns shown. After-tax returns are not relevant for shares held in tax-deferred investment vehicles such as employer-sponsored 401(k) plans and individual retirement accounts (IRAs). The after-tax returns shown are calculated using the highest individual federal marginal income tax rates in effect during the periods presented and do not reflect the impact of state and local taxes. | ||||||
|
Presidential Protected Profile 2040 Fund | Class A
|
||||||||
| Risk/Return: | rr_RiskReturnAbstract | |||||||
| Maximum Sales Charge (Load) Imposed on Purchases | rr_MaximumSalesChargeImposedOnPurchasesOverOfferingPrice | 5.75% | ||||||
| Maximum Deferred Sales Charge (Load) | rr_MaximumDeferredSalesChargeOverOfferingPrice | none | ||||||
| Maximum Sales Charge (Load) Imposed on Reinvested Dividends | rr_MaximumSalesChargeOnReinvestedDividendsAndDistributionsOverOther | none | ||||||
| Redemption Fee | rr_RedemptionFeeOverRedemption | none | ||||||
| Exchange Fee | rr_ExchangeFeeOverRedemption | none | ||||||
| Management Fee | rr_ManagementFeesOverAssets | 0.40% | ||||||
| Distribution and/or Service (12b-1 fees) | rr_DistributionAndService12b1FeesOverAssets | 0.25% | ||||||
| Shareholder Service Fee | rr_Component1OtherExpensesOverAssets | 0.15% | [1] | |||||
| Other Expenses | rr_OtherExpensesOverAssets | 7.06% | ||||||
| Acquired Fund Fees and Expenses (AFFE) | rr_AcquiredFundFeesAndExpensesOverAssets | 0.17% | ||||||
| Total Annual Fund Operating Expenses | rr_ExpensesOverAssets | 8.03% | [2] | |||||
| Less Fee Waiver and Expense Reimbursement | rr_FeeWaiverOrReimbursementOverAssets | 6.96% | [3] | |||||
| Total Annual Fund Operating Expenses (After Expense Reimbursement) | rr_NetExpensesOverAssets | 1.07% | ||||||
| 1 year | rr_ExpenseExampleYear01 | 678 | ||||||
| 3 years | rr_ExpenseExampleYear03 | 2,204 | ||||||
| 5 years | rr_ExpenseExampleYear05 | 3,638 | ||||||
| 10 years | rr_ExpenseExampleYear10 | 6,862 | ||||||
| 2012 | rr_AnnualReturn2012 | 9.24% | ||||||
| Highest Quarterly Return, Label | rr_HighestQuarterlyReturnLabel | highest return | ||||||
| Highest Quarterly Return, Date | rr_BarChartHighestQuarterlyReturnDate | Mar. 31, 2012 | ||||||
| Highest Quarterly Return | rr_BarChartHighestQuarterlyReturn | 7.54% | ||||||
| Lowest Quarterly Return, Label | rr_LowestQuarterlyReturnLabel | lowest return | ||||||
| Lowest Quarterly Return, Date | rr_BarChartLowestQuarterlyReturnDate | Jun. 30, 2012 | ||||||
| Lowest Quarterly Return | rr_BarChartLowestQuarterlyReturn | (3.69%) | ||||||
| 1 year | rr_AverageAnnualReturnYear01 | 2.95% | ||||||
| Lifetime | rr_AverageAnnualReturnSinceInception | 1.85% | ||||||
| Since inception | rr_AverageAnnualReturnInceptionDate | Nov. 02, 2011 | ||||||
|
Presidential Protected Profile 2040 Fund | Class C
|
||||||||
| Risk/Return: | rr_RiskReturnAbstract | |||||||
| Maximum Sales Charge (Load) Imposed on Purchases | rr_MaximumSalesChargeImposedOnPurchasesOverOfferingPrice | none | ||||||
| Maximum Deferred Sales Charge (Load) | rr_MaximumDeferredSalesChargeOverOfferingPrice | 0.50% | ||||||
| Maximum Sales Charge (Load) Imposed on Reinvested Dividends | rr_MaximumSalesChargeOnReinvestedDividendsAndDistributionsOverOther | none | ||||||
| Redemption Fee | rr_RedemptionFeeOverRedemption | none | ||||||
| Exchange Fee | rr_ExchangeFeeOverRedemption | none | ||||||
| Management Fee | rr_ManagementFeesOverAssets | 0.40% | ||||||
| Distribution and/or Service (12b-1 fees) | rr_DistributionAndService12b1FeesOverAssets | 0.50% | ||||||
| Shareholder Service Fee | rr_Component1OtherExpensesOverAssets | 0.15% | [1] | |||||
| Other Expenses | rr_OtherExpensesOverAssets | 7.06% | ||||||
| Acquired Fund Fees and Expenses (AFFE) | rr_AcquiredFundFeesAndExpensesOverAssets | 0.17% | ||||||
| Total Annual Fund Operating Expenses | rr_ExpensesOverAssets | 8.28% | [2] | |||||
| Less Fee Waiver and Expense Reimbursement | rr_FeeWaiverOrReimbursementOverAssets | 6.96% | [3] | |||||
| Total Annual Fund Operating Expenses (After Expense Reimbursement) | rr_NetExpensesOverAssets | 1.32% | ||||||
| 1 year | rr_ExpenseExampleYear01 | 184 | ||||||
| 3 years | rr_ExpenseExampleYear03 | 1,796 | ||||||
| 5 years | rr_ExpenseExampleYear05 | 3,349 | ||||||
| 10 years | rr_ExpenseExampleYear10 | 6,810 | ||||||
| 1 year | rr_ExpenseExampleNoRedemptionYear01 | 134 | ||||||
| 3 years | rr_ExpenseExampleNoRedemptionYear03 | 1,796 | ||||||
| 5 years | rr_ExpenseExampleNoRedemptionYear05 | 3,349 | ||||||
| 10 years | rr_ExpenseExampleNoRedemptionYear10 | 6,810 | ||||||
| 1 year | rr_AverageAnnualReturnYear01 | 8.48% | ||||||
| Lifetime | rr_AverageAnnualReturnSinceInception | 6.90% | ||||||
| Since inception | rr_AverageAnnualReturnInceptionDate | Nov. 02, 2011 | ||||||
|
Presidential Protected Profile 2040 Fund | Class I
|
||||||||
| Risk/Return: | rr_RiskReturnAbstract | |||||||
| Maximum Sales Charge (Load) Imposed on Purchases | rr_MaximumSalesChargeImposedOnPurchasesOverOfferingPrice | none | ||||||
| Maximum Deferred Sales Charge (Load) | rr_MaximumDeferredSalesChargeOverOfferingPrice | none | ||||||
| Maximum Sales Charge (Load) Imposed on Reinvested Dividends | rr_MaximumSalesChargeOnReinvestedDividendsAndDistributionsOverOther | none | ||||||
| Redemption Fee | rr_RedemptionFeeOverRedemption | none | ||||||
| Exchange Fee | rr_ExchangeFeeOverRedemption | none | ||||||
| Management Fee | rr_ManagementFeesOverAssets | 0.40% | ||||||
| Distribution and/or Service (12b-1 fees) | rr_DistributionAndService12b1FeesOverAssets | none | ||||||
| Shareholder Service Fee | rr_Component1OtherExpensesOverAssets | 0.15% | [1] | |||||
| Other Expenses | rr_OtherExpensesOverAssets | 7.06% | ||||||
| Acquired Fund Fees and Expenses (AFFE) | rr_AcquiredFundFeesAndExpensesOverAssets | 0.17% | ||||||
| Total Annual Fund Operating Expenses | rr_ExpensesOverAssets | 7.78% | [2] | |||||
| Less Fee Waiver and Expense Reimbursement | rr_FeeWaiverOrReimbursementOverAssets | 6.96% | [3] | |||||
| Total Annual Fund Operating Expenses (After Expense Reimbursement) | rr_NetExpensesOverAssets | 0.82% | ||||||
| 1 year | rr_ExpenseExampleYear01 | 84 | ||||||
| 3 years | rr_ExpenseExampleYear03 | 1,660 | ||||||
| 5 years | rr_ExpenseExampleYear05 | 3,150 | ||||||
| 10 years | rr_ExpenseExampleYear10 | 6,527 | ||||||
| 1 year | rr_AverageAnnualReturnYear01 | 9.52% | ||||||
| Lifetime | rr_AverageAnnualReturnSinceInception | 7.43% | ||||||
| Since inception | rr_AverageAnnualReturnInceptionDate | Nov. 02, 2011 | ||||||
|
Presidential Protected Profile 2040 Fund | return after taxes on distributions | Class A
|
||||||||
| Risk/Return: | rr_RiskReturnAbstract | |||||||
| 1 year | rr_AverageAnnualReturnYear01 | 2.72% | ||||||
| Lifetime | rr_AverageAnnualReturnSinceInception | 1.34% | ||||||
| Since inception | rr_AverageAnnualReturnInceptionDate | Nov. 02, 2011 | ||||||
|
Presidential Protected Profile 2040 Fund | return after taxes on distributions and sale of Fund shares | Class A
|
||||||||
| Risk/Return: | rr_RiskReturnAbstract | |||||||
| 1 year | rr_AverageAnnualReturnYear01 | 2.04% | ||||||
| Lifetime | rr_AverageAnnualReturnSinceInception | 1.32% | ||||||
| Since inception | rr_AverageAnnualReturnInceptionDate | Nov. 02, 2011 | ||||||
|
Presidential Protected Profile 2040 Fund | Wilshire 5000 Total Market Index℠ (reflects no deduction for {fees, expenses, or taxes})
|
||||||||
| Risk/Return: | rr_RiskReturnAbstract | |||||||
| 1 year | rr_AverageAnnualReturnYear01 | 16.06% | ||||||
| Lifetime | rr_AverageAnnualReturnSinceInception | 17.10% | ||||||
| Since inception | rr_AverageAnnualReturnInceptionDate | Nov. 02, 2011 | ||||||
|
Presidential Protected Profile 2040 Fund | Presidential ℠ Protected Profile 2040 Composite (reflects no deduction for {fees, expenses, or taxes})
|
||||||||
| Risk/Return: | rr_RiskReturnAbstract | |||||||
| 1 year | rr_AverageAnnualReturnYear01 | 14.51% | ||||||
| Lifetime | rr_AverageAnnualReturnSinceInception | 13.69% | ||||||
| Since inception | rr_AverageAnnualReturnInceptionDate | Nov. 02, 2011 | ||||||
|
||||||||

