UNITED STATES SECURITIES AND EXCHANGE COMMISSION
WASHINGTON, D.C. 20549
FORM 10-K
(Mark One)
ANNUAL REPORT PURSUANT TO SECTION 13 OR 15(d) OF THE SECURITIES EXCHANGE ACT OF 1934 | |||||
For the fiscal year ended | |||||
or | |||||
TRANSITION REPORT PURSUANT TO SECTION 13 OR 15(d) OF THE SECURITIES EXCHANGE ACT OF 1934 | |||||
For the transition period from to
Commission file number: 1-35229
(Exact name of registrant as specified in its charter)
(State or other jurisdiction of incorporation or organization) | (I.R.S. Employer Identification No.) | |
(Address of principal executive offices and zip code)
(914 ) 323-5700
(Registrant's telephone number, including area code)
Securities registered pursuant to Section 12(b) of the Act: | ||
Title of each class | Trading Symbol(s) | Name of each exchange on which registered |
Securities registered pursuant to Section 12(g) of the Act: None | ||
Indicate by check mark if the registrant is a well-known seasoned issuer, as defined in Rule 405 of the Securities Act. Yes þ No ¨
Indicate by check mark if the registrant is not required to file reports pursuant to Section 13 or Section 15(d) of the Act. Yes ¨ No þ
Indicate by check mark whether the registrant (1) has filed all reports required to be filed by Section 13 or 15(d) of the Securities Exchange Act of 1934 during the preceding 12 months (or for such shorter period that the registrant was required to file such reports), and (2) has been subject to such filing requirements for the past 90 days. Yes þ No ¨
Indicate by check mark whether the registrant has submitted electronically, if any, every Interactive Data File required to be submitted pursuant to Rule 405 of Regulation S-T (§232.405 of this chapter) during the preceding 12 months (or for such shorter period that the registrant was required to submit and post such files). Yes þ No ¨
Indicate by check mark whether the registrant is a large accelerated filer, an accelerated filer, a non-accelerated filer, a smaller reporting company, or an emerging growth company. See definitions of “large accelerated filer,” “accelerated filer,” “smaller reporting company,” and "emerging growth company" in Rule 12b-2 of the Exchange Act. (Check one):
If an emerging growth company, indicate by check mark if the registrant has elected not to use the extended transition period for complying with any new or revised financial accounting standards provided pursuant to Section 13(a) of the Exchange Act. ☐
Indicate by check mark whether the registrant is a shell company (as defined in Rule 12b-2 of the Act). Yes ☐ No ☑
The aggregate market value of the common stock of the registrant held by non-affiliates of the registrant as of June 30, 2019 was approximately $14.0 billion. As of February 21, 2020, there were 180,222,582 outstanding shares of the registrant’s common stock, par value $0.01 per share.
DOCUMENTS INCORPORATED BY REFERENCE
Portions of the registrant’s definitive proxy statement for its 2020 Annual Meeting of Shareowners, to be held in May 2020, are incorporated by reference into Part II and Part III of this Report.
Xylem Inc.
ANNUAL REPORT ON FORM 10-K
For the fiscal year ended December 31, 2019
Table of Contents
ITEM | PAGE | |
PART I | ||
1 | ||
1A. | ||
1B. | ||
2 | ||
3 | ||
4 | ||
* | ||
PART II | ||
5 | ||
6 | ||
7 | ||
7A. | ||
8 | ||
9 | ||
9A. | ||
9B. | ||
PART III | ||
10 | ||
11 | ||
12 | ||
13 | ||
14 | ||
PART IV | ||
15 | ||
16 | ||
* | Included pursuant to Instruction 3 of Item 401(b) of Regulation S-K. |
2
PART I
The following discussion should be read in conjunction with the consolidated financial statements, including the notes, included elsewhere in this Annual Report on Form 10-K (this "Report"). Except as otherwise indicated or unless the context otherwise requires, “Xylem,” “we,” “us,” “our” and “the Company” refer to Xylem Inc. and its subsidiaries. References in the consolidated financial statements to "ITT" or the "former parent" refer to ITT Corporation (now ITT LLC) and its consolidated subsidiaries (other than Xylem Inc.) as of the applicable periods.
Forward-Looking Statements
This Report contains information that may constitute “forward-looking statements" within the meaning of the Private Securities Litigation Act of 1995. Forward-looking statements by their nature address matters that are, to different degrees, uncertain. Generally, the words “anticipate,” “estimate,” “expect,” “project,” “intend,” “plan,” “forecast,” “believe,” “target,” “will,” “could,” “would,” “should” and similar expressions identify forward-looking statements. However, the absence of these words or similar expressions does not mean that a statement is not forward-looking. These forward-looking statements include any statements that are not historical in nature, including any statements about the capitalization of the Company, the Company’s restructuring and realignment plans, future strategic plans and other statements that describe the Company’s business strategy, outlook, objectives, plans, intentions or goals. All statements that address operating or financial performance, events or developments that we expect or anticipate will occur in the future - including statements relating to orders, revenues, operating margins and earnings per share growth, and statements expressing general views about future operating results - are forward-looking statements. Forward-looking statements involve known and unknown risks, uncertainties and other important factors that could cause actual results to differ materially from those expressed or implied in, or reasonably inferred from, such forward-looking statements.
Factors that could cause results to differ materially from those anticipated include: overall economic and business conditions; geopolitical and other risks associated with our international operations, including military actions, protectionism, economic sanctions or trade barriers including tariffs and embargoes that could affect customer markets and our business, and non-compliance with laws, including foreign corrupt practice laws, data privacy, export and import laws and competition laws; actual or potential pandemics; potential for unexpected cancellations or delays of customer orders in our reported backlog; our exposure to fluctuations in foreign currency exchange rates; disruption, competition and pricing pressures in the markets we serve; industrial, governmental and private sector spending; the strength of housing and related markets; weather conditions; ability to retain and attract talent and key members of management; our relationship with and the performance of our supply chain including channel partners; our ability to successfully identify, complete and integrate acquisitions; our ability to borrow or to refinance our existing indebtedness and availability of liquidity sufficient to meet our needs; uncertainty from the expected discontinuance of LIBOR and transition to any other interest rate benchmark; changes in the value of goodwill or intangible assets; risks relating to product defects, product security, product liability and recalls; claims or investigations by governmental or regulatory bodies; cybersecurity attacks, breaches or other disruptions of information technology systems on which we rely; our sustainability initiatives; litigation and contingent liabilities; and other factors set forth under “Item 1A. Risk Factors” and with subsequent filings we make with the Securities and Exchange Commission (“SEC”).
All forward-looking statements made herein are based on information currently available to the Company as of the date of this Report. The Company undertakes no obligation to publicly update or revise any forward-looking statements, whether as a result of new information, future events or otherwise, except as required by law.
3
ITEM 1. BUSINESS
Business Overview
Xylem, with 2019 revenues of $5.2 billion and approximately 16,300 employees, is a leading global water technology company. We design, manufacture and service highly engineered products and solutions ranging across a wide variety of critical applications primarily in the water sector, but also in electric and gas. Our broad portfolio of products, services and solutions addresses customer needs across the water cycle, from the delivery, measurement and use of drinking water to the collection, testing, analysis and treatment of wastewater to the return of water to the environment.
We have differentiated market positions in core application areas including transport, treatment, test, smart metering, infrastructure assessment services, digital solutions, condition assessment and leak detection, commercial and residential building services and industrial processing. Setting us apart is a unique set of global assets that include:
• | Market leading brands, some of which have been in use for more than 100 years |
• | Far-reaching global distribution networks consisting of direct sales forces and independent channel partners serving a diverse customer base in approximately 150 countries |
• | A substantial global installed base that provides for steady recurring revenue |
• | A strong financial position and cash generation profile that enables us to fund strategic organic and inorganic growth initiatives, and consistently return capital to shareholders |
Key pillars of our long-term strategy include: (1) accelerate profitable growth; (2) increase profitability by driving continuous improvement initiatives; (3) develop leadership and talent; (4) focus on execution and accountability; and (5) create social value in everything we do.
Company History and Certain Relationships
On October 31, 2011, ITT Corporation ("ITT") completed the Spin-off (the “Spin-off”) of Xylem, formerly ITT’s water equipment and services businesses. The Spin-off was completed pursuant to a Distribution Agreement, dated as of October 25, 2011 (the “Distribution Agreement”), among ITT (now ITT LLC), Exelis Inc., acquired by Harris Inc. on May 29, 2015 (“Exelis”), and Xylem.
Our Industry
Our planet faces serious water challenges. Less than 1% of the total water available on earth is fresh water, and these supplies are under threat due to factors such as the draining of aquifers, increased pollution and the effects of climate change. Demand for fresh water is rising rapidly due to population growth, industrial expansion, and increased agricultural development, with consumption estimated to double every 20 years. By 2025, more than 30% of the world’s population is expected to live in areas without adequate water supply. Even in developed countries with sufficient clean water supply, existing water supply infrastructure is aging and often inefficient. In the United States, deteriorating pipe systems, theft or inaccurate meters result in approximately one out of every six gallons of treated water being lost prior to reaching the end customer. This problem of "non-revenue" water is a major financial challenge of many utilities globally, especially in developing markets where non-revenue water can represent 10% to 60% or more of net water produced. These and other challenges create opportunities for growth in the global water industry. We estimate the total addressable market size to be approximately $560 billion.
Global water needs cannot be met without streamlining the water industry’s cost structure with technologies that fundamentally change the provision and management of water. We compete in areas that are pivotal to improving water affordability and resilience while reducing the impact of water scarcity. Water affordability refers to the more efficient delivery, use and treatment of clean water and wastewater. Resilience refers to the management of water-related risks and the resilience of water infrastructure. Water scarcity refers to the management of limited supplies of water due to climate change, overpopulation and pollution. Our customers often face all three of these challenges, ranging from inefficient and aging water distribution networks and energy-intensive or unreliable wastewater management systems (which require improvements in “water affordability”); droughts and pollution which limit the amount of water readily available (causing "water scarcity”); or exposure to natural disasters such as floods or droughts (which require improvements in “resilience”). Additionally, we also provide solutions to enhance communications and efficiency, improve safety and conserve resources to customers in the water, electric, gas, and lighting sectors. Delivering value in these areas creates significant opportunity for the Company. We estimate our total served market size to be approximately $61 billion.
4
The Global Water Industry Value Chain
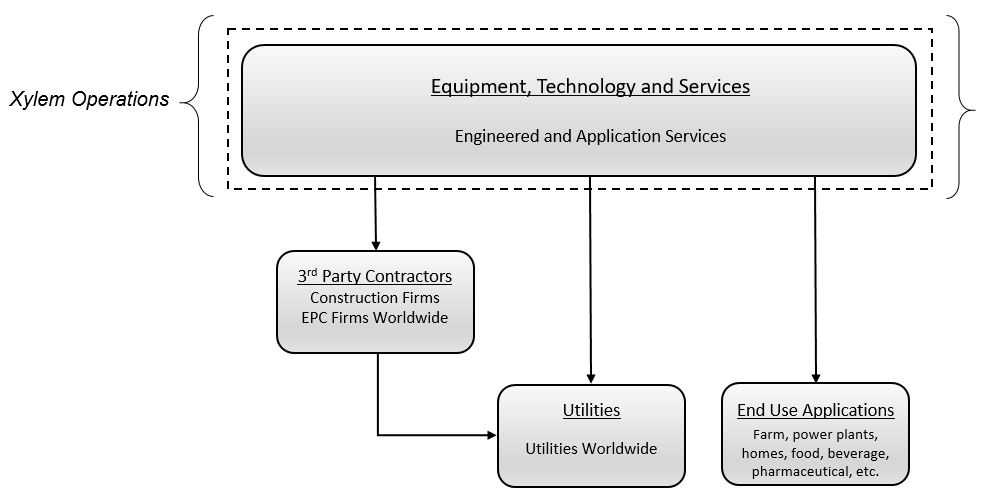
The water industry value chain includes Equipment, Technology and Services companies, like Xylem, which address the unique challenges and demands of a diverse customer base. This customer base includes water and wastewater utilities that supply, treat and monitor clean water or transport, treat and analyze wastewater or storm water through an infrastructure network, and engineering, procurement and construction or (EPC) firms and third party contractors, which work with utilities to design and build water and wastewater infrastructure networks, as depicted below. Utilities and other customers require products, solutions, services, technology and application expertise from their Equipment, Technology and Services providers to address trends such as rising pollution, stricter regulations, increasing operational costs and the increased outsourcing of process knowledge. In addition to utilities, Equipment, Technology and Service companies also provide distinct technologies and application expertise to a wide array of entities, including farms, mines, power plants, industrial facilities (such as food and beverage and pharmaceutical manufacturers) and residential and commercial customers seeking to address similar trends.
Water Industry Supply Chain
Business Strategy
Our strategy is to enhance shareholder value by providing distinctive solutions for our customers' most important water scarcity, affordability and resilience challenges, enabling us to grow revenue, organically and through strategic acquisitions, as we streamline our cost structure. Key elements of our strategy are summarized below:
• | Accelerate Profitable Growth. To accelerate growth, we continue to focus on several priorities: |
• | Emerging Markets - We seek to accelerate our growth, particularly in priority emerging markets through increased focus on product localization and channel development. |
• | Innovation & Technology - We seek to enhance our innovation efforts with increased focus on smart, digitally enabled technologies and innovation that can significantly improve customers’ productivity, quality and resilience. |
• | Commercial Leadership - We are strengthening our capabilities by simplifying and modernizing our commercial processes and supporting information technology systems. |
• | Mergers and Acquisitions - We continue to evaluate and, where appropriate, act upon attractive acquisition candidates to accelerate our growth, including into adjacent markets. |
• | Drive Continuous Improvement. We seek to embed continuous improvement into our culture and simplify our organization to make the Company more agile, more profitable and create room to reinvest in growth. To accomplish this, we will continue to strengthen our lean six sigma and global procurement capabilities, |
5
while also continuing to optimize our cost structure through business simplification, which aims to eliminate structural, process and product complexity.
• | Develop Leadership and Talent. We continue to invest in attracting, developing and retaining world-class talent with a focus on leadership and talent development programs. We will continue to align individual performance with the objectives of the Company, its shareholders and its stakeholders. |
• | Focus on Execution and Accountability. We seek to ensure the impact of these strategic focus areas by holding our people accountable and streamlining our performance management and goal deployment systems. |
• | Create social value in everything we do. We seek to have a positive impact on communities through the combination of sustainable practices, corporate social responsibility and employee, customer, and stakeholder engagement. |
Business Segments, Distribution and Competitive Landscape
We have three reportable business segments that are aligned around the critical market applications they provide: Water Infrastructure, Applied Water, and Measurement & Control Solutions. See Note 22, “Segment and Geographic Data,” in our consolidated financial statements for financial information about segments and geographic areas.
The table and descriptions below provide an overview of our business segments.
Market Applications | 2019 Revenue (in millions) | % Revenue | Major Products | Primary Brands | |||||||||
Water Infrastructure | Transport | $ | 1,780 | 82 | % | • Water and wastewater pumps • Filtration, disinfection and biological treatment equipment • Mobile dewatering equipment | • Flygt • Godwin • Leopold • Sanitaire • Wedeco | ||||||
Treatment | 397 | 18 | % | ||||||||||
$ | 2,177 | 100 | % | ||||||||||
Applied Water | Building Services | $ | 848 | 55 | % | • Pumps • Valves • Heat exchangers • Controls • Dispensing equipment systems | • A-C Fire Pump • Bell & Gossett • Flojet • Goulds Water Technology • Jabsco • Lowara • Standard Xchange | ||||||
Industrial Water | 693 | 45 | % | ||||||||||
$ | 1,541 | 100 | % | ||||||||||
Measurement & Control Solutions | Water | $ | 768 | 50 | % | • Smart meters • Networked communication devices • Data analytics • Test equipment • Controls • Sensor devices • Software & managed services • Critical infrastructure services | • EmNet • Pure • Sensus • Smith Blair • Visenti • WTW • YSI | ||||||
Energy | 337 | 22 | % | ||||||||||
Test | 327 | 21 | % | ||||||||||
Software as a Service/Other | 99 | 7 | % | ||||||||||
$ | 1,531 | 100 | % | ||||||||||
Water Infrastructure
Our Water Infrastructure segment primarily supports the process that collects water from a source, treats it and distributes it to users, and then treats and returns the wastewater responsibly to the environment through two closely linked applications: Transport and Treatment. The Transport application also includes sales and rental of
6
specialty dewatering pumps and related equipment and services, which provide the safe removal or draining of groundwater and surface water from construction sites or other industrial sites and bypass pumping for the repair of aging utility infrastructure, as well as emergency water transport and removal during severe weather events.
The customer base consists of two primary end markets: utility and industrial. The utility market includes public, private and public-private entities that support water, wastewater and storm water networks. The industrial market includes customers who require similar water and wastewater infrastructure networks to support various industrial operations.
Water Infrastructure sells primarily through direct channels with remaining sales through indirect channels and service capabilities. Both utility and industrial facility customers increasingly require our teams’ global but locally proficient expertise to use our equipment in their specific applications. Several trends are increasing demand for this application expertise: (i) the increase in both the type and amount of contaminants found in the water supply, (ii) increasing environmental regulations, (iii) the need to increase system efficiencies to optimize energy and other operational costs, (iv) the retirement of an aging water industry workforce that has not been systematically renewed at utilities and other end-user customers, and (v) the build-out of water infrastructure in the emerging markets. We estimate our served market size in this sector to be approximately $18 billion.
Given the highly fragmented nature of the water industry, the Water Infrastructure segment competes with a large number of businesses. We differentiate ourselves in the market by focusing on product and service performance, quality and reliability, innovation, speed to market with new or disruptive technologies, application expertise, brand reputation, energy efficiency, product life-cycle cost, timeliness of delivery, proximity of service centers, effectiveness of our distribution channels and price. In the sale or rental of products and provision of services, we benefit from our large installed base, which requires maintenance, repair and replacement parts due to the critical application and nature of the products and the conditions under which they operate. Timeliness of delivery, quality and the proximity of service centers are important customer considerations when selecting a provider for after-market products and services as well as equipment rentals. In geographic regions where we are locally positioned to provide a quick response, customers have historically relied on us, rather than our competitors, for after-market products relating to our highly engineered and customized solutions. Our key competitors in the Water Infrastructure segment include KSB Inc., Sulzer Ltd., Evoqua Water Technologies, United Rentals, Trojan (Danaher Corporation) and Grundfos, among others.
Applied Water
Applied Water encompasses the uses of water in two primarily applications: Building Services and Industrial Water. These applications serve a diverse set of end markets including: residential, commercial and industrial. Residential consumers represent the end users in the residential market, while owners and managers of properties such as apartment buildings, retail stores, institutional buildings, restaurants, schools, hospitals and hotels are examples of end users in the commercial market. The industrial market includes OEMs, exploration and production firms, and developers and managers of industrial facilities, such as electrical power generators, chemical manufacturers, machine shops, clothing manufacturers, food and beverage companies and car washes.
In the Applied Water segment, end markets vary widely and, as a result, specialized distribution partners are often preferred. As such, the Applied Water segment provides the majority of its sales through strong indirect channels with the remaining sales going through our global direct sales channels. We have long-standing relationships with many of the leading independent distributors in the markets we serve and we provide incentives to distributors, such as specialized loyalty and training programs.
We estimate our served market size in this sector to be approximately $19 billion. Population growth, urbanization and regulatory requirements are macro growth drivers of these markets, driving the need for housing, food, community services and retail goods within growing city centers.
Competition in the Applied Water segment focuses on brand equity, application expertise, product delivery, performance and energy efficiency, quality and price. We compete by offering a wide variety of innovative and high-quality products, coupled with world-class application expertise. We believe our distribution through well-established channels and our reputation for quality significantly enhance our market position. Our ability to deliver innovative product offerings has enabled us to compete effectively, to cultivate and maintain customer relationships and to serve and expand into many niche and new markets. Our key competitors in the Applied Water segment include Grundfos, Wilo SE, Pentair plc and Franklin Electric Co., Inc.
7
Measurement & Control Solutions
Measurement & Control Solutions develops advanced technology solutions that enable intelligent use and conservation of critical water and energy resources. The segment delivers communications, smart metering, measurement and control technologies and critical infrastructure technologies that allow customers to more effectively use their distribution networks for the delivery, monitoring and control of critical resources such as water, electricity and natural gas. We also provide analytical instrumentation used to measure and analyze water quality, flow and level in clean water, wastewater, surface water and coastal environments. Additionally, we offer software and services including cloud-based analytics, remote monitoring and data management, leak detection, condition assessment, asset management and pressure monitoring solutions. We also offer smart lighting solutions that improve efficiency and public safety efforts across communities.
At the heart of our leading technologies is automation, data management and decision support. Communications networks automate and optimize meter reading, monitor flow rates and detect and enable rapid response to changing and unsafe conditions. In short, they provide insight into operations and enable our customers to manage the entire scope of their operations remotely through their networks. At the center of our offering is the FlexNet communication network, which provides a common communications platform and infrastructure for essential metering services. This two-way communication technology remotely connects a wide variety of smart points in a given network with protocols, frequently on Federal Communications Commission ("FCC") licensed spectrum in the United States, that enable reliable, resilient and secure transmissions. These technologies allow our customers to remotely and continuously monitor their water, gas or electric distribution infrastructure, prioritize and manage maintenance and use data to optimize all aspects of their networks. Our Advanced Infrastructure Analytics complement these offerings with intelligent solutions that help utility decision-makers manage and maintain their networks more effectively in real time.
The majority of our sales in the United States is conducted through strong, long-standing relationships with leading distributors and dedicated channel partners for water, gas and electric markets. Internationally, direct sales are often made in markets without established distribution channels; however, some distribution channels are used in more developed markets. A more direct sales approach, with key account management, is employed for large utilities and government programs.
We estimate our served market size in this sector to be approximately $24 billion. Macro growth drivers include increasing regulation, aging infrastructure and worldwide movement towards smart grid implementation. Water scarcity and conservation, as well as the need to prevent revenue loss (via inaccurate meter readings, leaks or theft) are among the drivers of smart meter and leak detection technologies.
Our Sensus-branded meters are well positioned in the smart metering sector, the fastest growing sector of the global meter industry. We set ourselves apart in the industry by focusing on our communication network, innovation, new product development and service offerings that deliver tangible savings of non-revenue water through improved meter accuracy, reduced theft and identification of leaks. Our Pure Technologies’ equipment and services are also well positioned in the leak detection sector which is attracting considerable attention as aging infrastructure and increased regulatory scrutiny exert pressure on operating budgets. Our key competitors in the Measurement & Control Solutions segment include Itron, Badger Meter, Landis+Gyr, Neptune (Roper), Elster (Honeywell), Echologics (Mueller Water Products), Hach (Danaher Corporation) and Teledyne.
Geographic Profile
The table below illustrates the annual revenue and percentage of revenue by geographic area for each of the three years ended December 31.
Revenue | ||||||||||||||||||||
(in millions) | 2019 | 2018 | 2017 | |||||||||||||||||
$ Amount | % of Total | $ Amount | % of Total | $ Amount | % of Total | |||||||||||||||
United States | $ | 2,554 | 49 | % | $ | 2,424 | 47 | % | $ | 2,161 | 46 | % | ||||||||
Europe | 1,380 | 26 | % | 1,449 | 28 | % | 1,335 | 28 | % | |||||||||||
Asia Pacific | 659 | 13 | % | 660 | 13 | % | 611 | 13 | % | |||||||||||
Other | 656 | 12 | % | 674 | 12 | % | 600 | 13 | % | |||||||||||
Total | $ | 5,249 | $ | 5,207 | $ | 4,707 | ||||||||||||||
In addition to the traditional markets of the United States and western Europe, opportunities in emerging markets within Asia Pacific, eastern Europe, Latin America and other countries are growing. Revenue derived from emerging markets comprised approximately 20% of our revenue in each of the last three years.
8
Supply and Seasonality
We have a global manufacturing and assembly footprint, with production facilities in Europe, North America, Latin America, Asia and the Middle East. Our inventory management and distribution practices seek to minimize inventory holding periods by striving to take delivery of the inventory and manufacturing as close as possible to the sale or distribution of products to our customers. All of our businesses require various parts and raw materials, the availability and prices of which may fluctuate. Parts and raw materials commonly used in our products include motors, fabricated parts, castings, bearings, seals, batteries, PCBs and electronic components, as well as steel, brass, nickel, copper, aluminum and plastics. While we may recover some cost increases through operational improvements, we are still exposed to some pricing risk, including increased pricing risk due to duty and tariff assessments by the United States on foreign imports. We attempt to control costs through fixed-priced contracts with suppliers and various other programs, such as our global procurement initiative.
Our business relies on third-party suppliers, contract manufacturing and commodity markets to secure raw materials, parts and components used in our products. We typically acquire materials and components through a combination of blanket and scheduled purchase orders to support our materials requirements. For many of our products we have existing alternate sources of supply, or such sources may be readily available.
We may experience price volatility or supply constraints for materials that are not available from multiple sources. From time to time, we acquire certain inventory in anticipation of supply constraints or enter into longer-term pricing commitments with suppliers to improve the priority, price and availability of supply. There have been no raw material shortages in the past several years that have had a significant adverse impact on our business as a whole.
Our business segments experience a modest level of seasonality in their operations. This seasonality is dependent on factors such as customers' capital spending as well as climate change and weather conditions, including heavy flooding, droughts and fluctuations in temperatures, all of which can positively or negatively impact portions of our business.
Customers
Our business is not dependent on any single customer or a few customers, the loss of which would have a material adverse effect on our Company. No individual customer accounted for more than 10% of our consolidated revenues in 2019, 2018 or 2017.
Backlog
Backlog includes orders on hand as well as contractual customer agreements at the end of the period. Delivery schedules vary from customer to customer based on their requirements. Annual or multi-year contracts are subject to rescheduling and cancellation by customers due to the long-term nature of the contracts. As such, beginning total backlog, plus orders, minus revenues, will not equal ending total backlog due to contract adjustments, foreign currency fluctuations and other factors. Typically, large projects require longer lead production cycles and deployment schedules and delays can occur from time to time. Total backlog was $1,801 million at December 31, 2019 and $1,689 million at December 31, 2018. We anticipate that approximately 60% of the backlog at December 31, 2019 will be recognized as revenue during 2020.
Research and Development
Research and development (“R&D”) is a key foundation of our growth strategy and we focus on the design and development of products and application know-how that anticipate customer needs and emerging trends. Our engineers are involved in new product development as well as improvement of existing products to increase customer value. Our businesses invest substantial resources into R&D. We anticipate we will continue to develop and invest in our R&D capabilities to promote a steady flow of innovative, high-quality and reliable products and integrated solutions to further strengthen our position in the markets we serve. In addition to investments made in software development, which were capitalized, we incurred $191 million, $189 million, and $181 million as a result of R&D investment spending in 2019, 2018 and 2017, respectively.
We have R&D and product development capabilities around the world. R&D activities are initially conducted in our technology centers, located in conjunction with some of our major manufacturing facilities to ensure an efficient and robust development process. We have several global technical centers and local development teams around the world where we are supporting global needs and accelerating the customization of our products and solutions to address local needs. In some cases, our R&D activities are conducted at our piloting and testing facilities and at strategic customer sites. These piloting and testing facilities enable us to serve our strategic markets globally. As
9
part of expanding our bandwidth and to increase our access to technology, we have built innovation eco-system partnerships with academic institutions, start-up accelerators and venture capital organizations.
Capitalized Software
We capitalize software developed for sale to external customers, which is included within "Other intangible assets, net" on our Consolidated Balance Sheets. As of December 31, 2019 and 2018 we had net capitalized software for sale to external customers of $165 million and $128 million, respectively.
Intellectual Property
We generally seek patent protection for those inventions and improvements that we believe will improve our competitive position. We believe that our patents and applications are important for maintaining the competitive differentiation of our products and improving our return on R&D investments. While we own, control or license a significant number of patents, trade secrets, proprietary information, trademarks, trade names, copyrights and other intellectual property rights which, in the aggregate, are of material importance to our business, management believes that our business, as a whole, as well as each of our core business segments, is not materially dependent on any one intellectual property right or related group of such rights.
Patents, patent applications and license agreements expire or terminate over time by operation of law, in accordance with their terms or otherwise. As the portfolio of our patents, patent applications and license agreements has evolved over time, we do not expect the expiration of any specific patent to have a material adverse effect on our financial position or results of operations.
Environmental Matters and Regulation
Our global operations are subject to various laws and regulations governing the environment, such as those promulgated by the United States Environmental Protection Agency and similar state and foreign environmental agencies, including the discharge of pollutants and the management and disposal of hazardous substances. While environmental laws and regulations are subject to change, such changes can be difficult to predict reliably and the timing of potential changes is uncertain. Management does not believe, based on current circumstances, that compliance costs pursuant to such regulations will have a material adverse effect on our financial position or results of operations. However, the effect of future legislative or regulatory changes could be material to our financial condition or results of operations.
We continue to be dedicated to environmental and sustainability programs to minimize the use of natural resources, and reduce the utilization and generation of hazardous materials from our processes and to remediate identified environmental concerns. As to the latter, we are currently engaged in site investigations and remediation activities to address environmental cleanup from past operations at current and former manufacturing facilities. We do not anticipate these liabilities will have a material adverse effect on our consolidated financial position or results of operations. At December 31, 2019, we had estimated and accrued $3 million related to environmental matters.
Sustainability
At Xylem, sustainability is at the center of who we are and what we do. As a leading global water technology company, we address one of the world’s most urgent sustainability challenges - responsible stewardship of our shared water resources. Technology is playing an increasingly important role in helping the world solve water issues. We have a long history of innovation and we are focusing on the powerful capabilities of smart technology, integrated management and data analytics.
We believe our financial performance and commitment to sustainability go hand in hand. Xylem approaches business sustainability as a way to generate economic value while also creating value for society, thus meeting the needs of both. Accordingly, in 2019, we evolved our approach to leverage sustainability in our decision-making toward long-term value for our shareholders, customers, employees and communities in which we operate and announced an ambitious new slate of 2025 sustainability goals. These new goals can be found in our 2018 Sustainability Report, which is published using the Global Reporting Initiative (GRI) framework.
In setting our 2025 Sustainability goals, we also aligned them with the United Nations Sustainable Development Goals (UNSDGs), not only to substantiate our contribution to achieving global objectives, but also to be transparent in our communication to stakeholders by providing details on our responsibility to build a sustainable future. While Xylem embraces all 17 of the UNSDGs, we have a special focus on SDG6: Clean Water and Sanitation.
10
Employees
As of December 31, 2019, Xylem had approximately 16,300 employees worldwide. We have approximately 5,600 employees in the United States, of whom approximately 17% are represented by labor unions. In certain foreign countries, our employees are represented by work councils. We believe that our facilities are in favorable labor markets with ready access to adequate numbers of workers and believe our relations with our employees are good.
Available Information
We are required to file annual, quarterly and current reports, proxy statements and other information with the SEC. Our annual reports on Form 10-K, quarterly reports on Form 10-Q, current reports on Form 8-K, proxy statements and amendments to those reports are available free of charge on our website www.xylem.com as soon as reasonably practicable after such reports are electronically filed with or furnished to the SEC. The information on our website is not, and shall not be deemed to be, a part hereof or incorporated into this or any of our other filings with the SEC.
In addition, the public may read or copy any materials filed with the SEC, free of charge, at www.sec.gov.
11
ITEM 1A. RISK FACTORS
In evaluating our business, the following discussion of significant factors, events, and uncertainties that make an investment in our securities risky should be carefully considered, along with all of the other information in this Report and in our other filings with the SEC. The events and consequences discussed in these risk factors could, in circumstances that we may not be able to accurately predict, recognize, or control, have a material adverse effect on our business, financial condition, cash flow, results of operations or market price of our common stock.
These risk factors do not identify all the risks we face. We operate in a continually changing business, economic and geopolitical environment and as a result new risk factors may emerge from time to time. We could also be affected by factors, events, or uncertainties that are not presently known to us or that we currently do not consider to present significant risks. In addition, the global economic and geopolitical climate amplifies many of these risks.
Risks Related to our Business
Failure to compete successfully in our markets and disruptive technologies could adversely affect our business.
We offer our technologies, products and services in competitive markets. We believe the principal points of competition in our markets are product and service performance, quality and reliability, innovation, speed to market with new or disruptive technologies and business models, application expertise, brand reputation, energy efficiency, product security, product life cycle cost, timeliness of delivery, proximity of service centers, effectiveness of our distribution channels, price and customers’ experience in conducting business with us. Maintaining and improving our competitive position will require successful management of these factors in a business environment with increasingly rapid rates of change and disruption, including our continued investment in talent, manufacturing, technology and innovation, research and development, engineering, sales and marketing, customer service and support, and our distribution networks. Our future growth rate depends upon a number of factors, including our ability to: (i) develop and maintain competitive products, services, business models and customer experience to address emerging trends and customer needs in our target markets, (ii) defend our market share against an ever-expanding number of competitors, many of which are new and non-traditional competitors from outside our industry such as major technology firms, or those out of emerging markets, (iii) enhance our product and service offerings by adding innovative features or disruptive technologies that differentiate them from those of our competitors and prevent commoditization, (iv) develop, manufacture and bring compelling new products and services to market quickly and cost-effectively, and (v) attract, develop and retain individuals with the requisite innovation and technical expertise and understanding of customers’ needs to develop new technologies and introduce new products and services.
We may not be successful in maintaining our competitive position. Our competitors or third parties from outside our industry may develop disruptive technologies, products and services more quickly than us or that are superior to ours, may develop new or more efficient or effective methods or business models to provide technologies, products and services, or may adapt more quickly than we do to new trends, disruptive technologies or evolving customer requirements. The failure of our technologies, products or services to maintain and gain market acceptance due to more attractive offerings, as well as customers’ slower-than-expected adoption of and investment in our new and innovative technologies could significantly reduce our revenues or market share and adversely affect our competitive standing and prospects. Pricing pressures also could cause us to adjust the prices of certain products to stay competitive, which could adversely affect our market share and financial performance. Failure to continue competing successfully or to win large contracts could adversely affect our business, financial condition, cash flow or results of operations.
Our business, products and services could be adversely affected by cyber threats or other interruptions in information technology, communications networks and operations.
Our business operations rely on information technology and communications networks, some of which are operated by third parties including, increasingly, cloud-based service providers, to process, transmit and store our electronic information, including sensitive data such as confidential business information and personal data relating to employees, customers or other business partners. We have, or operate through, a concentration of operations on certain sites, such as production and shared service centers. We also rely on third parties’ information technology systems to manage or support a variety of critical business processes and activities. Regardless of protection measures, essentially all systems are susceptible to damage, disruption or shut-down due to cybersecurity attacks, including ransomware, denial-of-service, computer viruses and security breaches, as well as human error or malfeasance, equipment or system failure, including due to maintenance, obsolescence or age, vandalism, natural disasters, fire, power or communication outages, shutdown, telecommunication or utility failure and other events. In
12
any such circumstances, our system redundancy and other business continuity and disaster recovery planning and response may be ineffective or inadequate.
In addition, we offer certain services and products, including pumps, controllers and meters, used by third parties for operational purposes or to collect data, which are digitally-enabled or connect to and are part of the “Internet of Things” (IoT). Cybersecurity attacks may target hardware, software and information installed, stored or transmitted by our products after they have been purchased and incorporated into third-parties’ products, facilities or infrastructure. While we attempt to provide security measures to safeguard our products and services from cyber threats, the potential for an attack remains. A successful attack may result in the misappropriation, destruction, unauthorized access to or disclosure of third parties' confidential information, damage, disruption or shut-down of third parties’ operations, recall of our products or increased costs for security and remediation, as well as possible damage to our brand reputation.
Like many multinational corporations, we, and some third parties upon which we rely, have experienced cybersecurity attacks on information technology networks and systems, products and services in the past and may experience them in the future, likely with more frequency and involving a broader range of devices and modes of attack. To date, none have resulted in any material adverse impact to our business, operations, products, services or customers. We have adopted measures designed to mitigate potential risks associated with cybersecurity threats, breaches or other disruptions or damage to our information technology networks and systems, products and services but the unpredictability of the timing, nature and scope of such disruptions and threats could impact our business, operations, products and services. Disruption to any of the information technology and communications networks on which we rely, or an attack on our products and services, could interfere with our operations, disrupt our supply chain and service to our customers, interrupt production and shipments, result in theft or compromise of our and our customers’ intellectual property and trade secrets, damage employee, customer and business partner relationships, negatively impact our reputation, result in legal claims and proceedings or regulatory enforcement actions, and increase our costs for security and remediation, any of which could have a material adverse effect on our competitive position, results of operations, cash flows or financial condition.
Although we continue to assess these risks, implement controls and perform business continuity and disaster recovery planning, we cannot be sure that cybersecurity attacks or other interruptions with material adverse effects will not occur.
Our results of operations and financial condition are subject to global economic, geopolitical and financial market conditions.
We compete around the world in various geographic and product markets. In 2019, 49%, 24% and 20% of our total revenue was from customers located in the United States, western Europe and emerging markets, respectively. We expect revenue from these markets to be significant for the foreseeable future. Important factors impacting our businesses include the overall strength of these economies and our customers’ confidence in both local and global macro-economic conditions; instability and uncertainties from the global geopolitical environment; industrial and private sector spending, federal, state, local and municipal governmental fiscal and trade policies; the strength of the residential and commercial real estate markets; interest rates; availability of commercial financing for our customers and end-users; the availability of funding for our public sector customers; and unemployment rates. A slowdown or prolonged downturn in the global economy or our markets has in the past, and could have in the future a material adverse effect on our business, financial condition, cash flow and results of operations.
We are exposed to economic, geopolitical and other risks associated with our international sales and operations.
In 2019, 51% of our total revenue was from customers outside the United States, with 20% of total revenue generated in emerging markets. We expect our sales from international operations and export sales to continue to be a significant portion of our revenue. We have placed a particular emphasis on increasing our growth and presence in emerging markets. Many of our manufacturing operations, employees and suppliers are located outside of the United States. Both our international operations and sales are subject, in varying degrees, to risks inherent in doing business outside the United States. These risks include the following:
• | changes in trade protection measures, including embargoes, tariffs and other trade barriers, and import and export regulations and licensing requirements; |
• | instability and uncertainties arising from the global geopolitical environment, including economic nationalism, populism, and increasing protectionism and anti-global sentiment; |
• | changes in tax laws and potential negative consequences from the interpretation, application and enforcement by governmental tax authorities of tax laws and policies; |
13
• | unanticipated changes in other laws and regulations or in how such provisions are interpreted or administered; |
• | potential disruptions in our global supply chain; |
• | possibility of unfavorable circumstances arising from host country laws or regulations, including those related to infrastructure and data transmission, security and privacy; |
• | theft, compromise or misappropriation of technology or intellectual property; |
• | currency exchange rate fluctuations and restrictions on currency repatriation; |
• | disruption of operations from labor and political disturbances; |
• | regional safety and security considerations; |
• | the transition away from LIBOR to the Secured Overnight Financing Rate, SOFR, as a benchmark reference for short-term interests; |
• | increased costs and risks in developing, staffing and simultaneously managing a number of global operations as a result of distance as well as language and cultural differences; and |
• | threat, outbreak, uncertainty or escalation of insurrection, armed conflict, terrorism, pandemics or war. |
Changes in the geopolitical or economic environments in the countries and regions in which we operate could have a material adverse effect on our financial condition, results of operations or cash flows. For example, changes in United States policy regarding international trade, including import and export regulation and international trade agreements, could negatively impact our business. The United States tariffs imposed on certain goods imported from China and certain other countries has resulted in retaliatory tariffs by China and other countries. Additional tariffs imposed by the United States on a broader range of imports from China or other countries' goods, or further retaliatory trade measures taken by China or other countries in response, could result in a continued increase in supply chain costs that we may not be able to offset or may otherwise adversely impact our financial condition and results of operations.
Additionally, we continue to monitor the potential impacts Brexit on our results of operations and financial condition. Volatility in foreign currencies is expected to continue as the United Kingdom executes its exit from the European Union. If the United Kingdom and the European Union cannot conclude an agreement on their future relationship before the end of the transition period (referred to as a “hard Brexit”), trade would be based on World Trade Organization rules which would likely lead to increased costs from re-imposition of tariffs on trade between the United Kingdom and European Union, increased transportation costs, shipping delays because of the need for customs inspections and procedures and shortages of certain goods. The United Kingdom will also need to negotiate its own trade treaties with countries all over the world, which could take years to complete. In the case of a “hard Brexit”, our exposure to disruptions to our supply chain, increased costs, the imposition of tariffs and currency devaluation in the United Kingdom could result in a material impact to our consolidated revenue, earnings and cash flow.
Further, any payment of distributions, loans or advances to us by our foreign subsidiaries could be subject to restrictions on, or taxation of, dividends or repatriation of earnings under applicable local law, monetary transfer restrictions and foreign currency exchange regulations in the jurisdictions in which our subsidiaries operate. In addition to the general risks that we face outside the United States, our operations in emerging markets could involve additional uncertainties for us, including risks that governments may impose withholding or other taxes on remittances and other payments to us, or the amount of any such taxes may increase; governments may seek to nationalize our assets; or governments may impose or increase investment barriers or other restrictions affecting our business. In addition, emerging markets pose other uncertainties, including the difficulty of enforcing agreements, challenges collecting receivables, protecting our intellectual property and other assets, pressure on the pricing of our products and services, higher business conduct risks, ability to hire and retain qualified talent and risks of political instability. We cannot predict the impact such events might have on our business, financial condition, cash flow and results of operations.
Our business could be adversely affected by inflation, tariffs and other manufacturing and operating cost increases.
Our operating costs are subject to fluctuations, particularly due to changes in prices for commodities, parts, raw materials, energy and related utilities, freight, and cost of labor which may be driven by prevailing price levels, exchange rates, changes in trade protection measures including tariffs, and other economic factors. In order to remain competitive, we may not be able to recover all or a portion of these higher costs from our customers through
14
product price increases. Further, in a declining price environment, our operating margins may contract because we account for inventory using the first-in, first-out method. Actions we take to mitigate volatility in manufacturing and operating costs may not be successful and, as a result, our business, financial condition, cash flow and results of operations could be materially and adversely affected.
A material disruption to any of our facilities or operations, or that of third parties upon which we rely, may adversely affect our business.
Our facilities and operations rely on a complex global supply chain consisting of suppliers, contract manufacturers and logistics providers. In addition, our business relies on certain third parties to supply critical business processes and activities, including in the areas of Finance, Human Resources, Procurement and Information Technology. If our facilities or operations of third parties upon which we rely in our supply chain and critical business operations were to be disrupted as a result of a significant equipment or system failure, natural disaster, power, water or communications outage, fire, explosion, critical supply failure, terrorism, cybersecurity attack, political disruption, outbreak of pandemics, insurrection, armed conflict or war, labor dispute, work stoppage or slowdown, technology failure, adverse weather conditions or other reason, our financial performance, operations and business could be adversely affected. Interruptions could cause an inability to meet customer demand or contractual commitments, increase our costs, reduce our sales, and impact our business processes and activities, including our ability to timely report financial results. We also have or operate through a concentration of operations on certain sites, such as production and shared services centers, where business interruptions could cause material damage and costs. Any interruption in capability may be lengthy and have lasting effects, require a significant amount of management and other employees' time and focus, and require us to make substantial expenditures to remedy the situation, which could negatively affect our operations, business processes and activities, profitability and financial condition. Any recovery under our insurance policies may not offset the lost sales or increased costs that may be experienced during a disruption of operations or any resultant longer-term loss of suppliers, sales or customers, which could adversely affect our business, financial condition, cash flow and results of operations.
Our business could be adversely affected by the availability of products, parts and raw materials from our supply chain or the inability of suppliers to meet delivery requirements.
Our business relies on third-party suppliers, including contract manufacturing, and commodity markets to secure select finished goods and raw materials, parts and components used in our products, and we expect that reliance to increase. Parts and raw materials commonly used in our products include motors, fabricated parts, castings, bearings, seals, batteries, PCBs and electronic components, as well as steel, brass, nickel, copper, aluminum and plastics. We are exposed to the availability of these parts, materials and finished goods, which may be subject to curtailment or change due to, among other things, changes in the strategy or production planning of suppliers including decisions to exit production of key components upon which we rely, interruptions in production by suppliers, labor disputes, the impaired financial condition of a particular supplier, suppliers’ capacity allocations to other purchasers, changes in trade protection measures including tariffs, exchange rates and prevailing price levels, ability to meet regulatory requirements, weather emergencies, effects of pandemics or acts of war or terrorism. Any delay in our suppliers’ abilities to provide us with necessary materials could impair our ability to deliver products to our customers and, accordingly, could have a material adverse effect on our business, financial condition or results of operations.
We may not achieve some or all of the expected benefits of our restructuring and realignment plans and our restructuring and realignment may adversely affect our business.
In recent fiscal years, we have initiated restructuring and realignment plans in an effort to optimize our cost structure and improve our operational efficiency and effectiveness. In 2017, we undertook steps to advance a multi-year effort to transform many of our support functions and related technologies, including Finance, Human Resources and Procurement. Challenges with the enabling technologies and delays in implementing planned restructuring and realignment activities have resulted in delayed realization of some the expected operational and financial benefits from such actions. As such, we may not be able to obtain all of the cost savings and benefits that were initially anticipated in connection with our restructuring and realignment plans. Additionally, as a result of these plans, we may experience a loss of continuity, loss of accumulated knowledge or inefficiency during transitional periods and ongoing operations. Realignment and restructuring require a significant amount of management and other employees' time and focus, which may divert attention from operating and growing our business.
The successful implementation and execution of our restructuring and realignment actions are critical to achieving our expected cost savings as well as effectively competing in the marketplace and positioning us for future growth. Factors that may impede a successful implementation include the retention of key employees, the impact of
15
regulatory matters including tax, matters involving certain third-party service providers selected to assist us, including staffing, technology and the service providers’ compliance with the Company's internal controls over financial reporting, and adverse economic market conditions. If our restructuring and realignment actions are not executed successfully, it could have a material adverse effect on the effectiveness of our internal controls over financial reporting as well as our competitive position, business, financial condition, cash flow and results of operations.
Our strategy includes acquisitions, and we may not be able to execute acquisitions of suitable candidates or integrate acquisitions successfully.
As part of our growth strategy, we plan to continue to pursue the acquisition of other companies, assets, technologies, product lines and customer channels that either complement or expand our existing business. We may not be able to identify suitable candidates, negotiate appropriate acquisition terms, obtain financing that may be needed to consummate acquisitions, complete proposed acquisitions, successfully integrate acquired businesses into our existing operations or expand into new markets. In addition, we cannot make assurances that any acquisition will perform as planned, be accretive to earnings, or prove to be beneficial to our operations or cash flow.
Acquisitions involve a number of risks and present financial, managerial and operational challenges, including: diversion of management attention from existing businesses and operations; integration of technology, operations personnel, and financial and other systems; potentially insufficient cybersecurity controls; insufficient internal controls over financial or compliance activities or financial reporting; the failure to realize expected synergies; the assumption of liabilities normally assumed with an acquisition as well as the possibility that we become exposed to substantial undisclosed liabilities or new material risks associated with the acquired businesses; and the loss of key employees of the acquired businesses. Failure to successfully execute our growth strategy via acquisitions and successfully integrate these acquisitions could adversely affect our competitive position, business, financial condition or results of operations.
Failure to comply with laws, regulations and policies, including but not limited to the U.S. Foreign Corrupt Practices Act, other applicable anti-corruption legislation and data privacy and security laws, could result in fines, criminal penalties and an adverse effect on our business and reputation.
Given our global operations, we are subject to regulation under a wide variety of U.S. federal and state and non-U.S. laws, regulations and policies, including laws related to anti-corruption, trade regulations, including export and import compliance, anti-trust and money laundering. The U.S. Foreign Corrupt Practices Act (the "FCPA"), the U.K. Bribery Act of 2010 and similar anti-bribery laws in other jurisdictions generally prohibit companies and their intermediaries from making improper payments to government officials or other persons for the purpose of obtaining or retaining business. Our policies mandate compliance with these anti-bribery laws. We operate in many parts of the world that are recognized as having governmental and commercial corruption and in certain circumstances, strict compliance with anti-bribery laws may conflict with local customs and practices. We cannot assure you that our internal control policies and procedures will always protect us from improper conduct of our employees or business partners. In the event that we believe or have reason to believe that our employees or business partners have or may have violated applicable laws, regulations or policies, including anti-corruption laws, we are required to investigate the relevant facts and circumstances, which can be expensive and require significant time and attention from senior management. Any such violation could result in substantial fines, sanctions, civil and/or criminal penalties, termination of relationships with business partners and curtailment of operations in certain jurisdictions, and as a result might materially and adversely affect our business, results of operations or financial condition. In addition, actual or alleged violations could damage our reputation and ability to do business.
Additionally, to conduct our operations, we regularly move data across borders, and consequently we are subject to a variety of continuously evolving and developing laws and regulations in the United States, such as the California Consumer Protection Act, and abroad regarding privacy, data protection and data security. The scope of the laws that may be applicable to us is often uncertain and may be conflicting, particularly with respect to foreign laws. For example, the European Union’s General Data Protection Regulation (“GDPR”) greatly increases the jurisdictional reach of European Union law and adds a broad array of requirements for handling personal data, including the enforcement of data subject rights and public disclosure of significant data breaches. Other countries, such as China, have enacted or are enacting data localization and security laws that require data to stay within their borders. All of these evolving legal and operational requirements impose significant costs of compliance that are likely to increase over time. Any such violation could result in substantial fines, sanctions or civil penalties, damage to our reputation and might materially and adversely affect our business, results of operations or financial condition.
16
Our business is subject to foreign currency exchange rates fluctuations.
We conduct approximately 51% of our business in various locations outside the United States. We are exposed to fluctuations in foreign currency transaction exchange rates, particularly with respect to the Euro, Swedish Krona, Polish Zloty, Canadian Dollar, British Pound and Australian Dollar. Change in the value of currencies of the countries in which we do business relative to the value of the U.S. Dollar or Euro could affect our ability to sell products competitively and control our cost structure, which could have a material adverse effect on our business, financial condition and results of operations. Additionally, we are subject to foreign exchange translation risk due to changes in the value of foreign currencies in relation to our reporting currency, the U.S. dollar. The translation risk is primarily concentrated in the exchange rate between the U.S. Dollar and the Euro, Chinese Yuan, British Pound, Canadian Dollar, Swedish Krona and Australian Dollar. As the U.S. Dollar fluctuates against other currencies in which we transact business, revenue and income can be impacted. For instance, our 2019 revenue decreased by 2.4% due to unfavorable foreign currency impacts. Strengthening of the U.S. Dollar relative to the Euro and the currencies of the other countries in which we do business, could materially and adversely affect our sales growth in future periods. Refer to Item 7A. "Quantitative and Qualitative Disclosures about Market Risk" for additional information on foreign exchange risk.
Failure to retain our existing senior management, engineering, technology, sales and other key personnel or the inability to attract and retain new qualified personnel could negatively impact our ability to operate or grow our business.
Our success will continue to depend to a significant extent on our ability to retain or attract employees in senior management, engineering, technology, sales, project management and other key personnel. The ability to attract or retain employees will depend on our ability to offer attractive compensation, benefits, training and development opportunities and build an inclusive and diverse culture in an increasingly competitive environment for talent, particularly in the fields of technology, innovation and data science. We will need to continue to develop qualified talent to support business growth and succession planning and to replace departing employees, all of which are important to our long-term success. A failure in effective succession planning, transfer of knowledge and smooth transitions involving key employees could hinder our strategic planning and execution. A failure to retain or attract highly-skilled personnel could adversely affect our reputation, ability to meet the needs of our customers, operating results or ability to operate or grow our business.
Product defects, unanticipated use or inadequate disclosures with respect to our products could adversely affect our business, reputation and financial statements.
Defects or inadequacies in manufacturing, design, software, security or service of our products (including such defects in products or components that we source from third parties), unanticipated use of, or inadequate disclosure of risks relating to the use of our products could create product safety, product security, regulatory or environmental risks, including personal injury, death, property or environmental damage. These events could lead to recalls, safety or security alerts relating to our products, result in the removal of a product from the market and result in liability claims being brought against us. Although we have liability insurance, we cannot be certain that this insurance coverage will continue to be available to us at a reasonable cost or will be adequate to cover any liability claims. Manufacturing, design, software, security or service defects or inadequacies may also result in contractual damages or credits being issued, which could impact our profitability. Recalls, removals and liability and quality claims can result in significant costs, as well as negative publicity and damage to our reputation that could reduce demand for our products and have a material adverse effect on our business, financial condition and results of operations.
Our financial results can be difficult to predict.
Our business is impacted by a substantial amount of short cycle, and book-and-bill business, which we have limited insight into, particularly for the business that we transact through our distributors. We are also impacted by large projects, whose timing can change based upon customer requirements due to a number of factors affecting the project beyond our knowledge or control, such as funding, readiness of the project and regulatory approvals. Accordingly, our financial results for any given period can be difficult to predict.
Changes in our effective tax rates and tax expenses may adversely affect our financial results.
We sell our products in approximately 150 countries and 51% of our revenue was generated outside the United States in 2019. Given the global nature of our business, a number of factors may increase our effective tax rates and tax expense, including:
• | the geographic mix of jurisdictions in which profits are earned and taxed; |
• | the statutory tax rates and tax laws in the jurisdictions in which we conduct business; |
17
• | the resolution of tax issues arising from tax examinations by various tax authorities; and |
• | the valuation of our deferred tax assets and liabilities. |
Xylem is regularly examined by various tax authorities throughout the world and the resolutions of these examinations do not typically have a significant impact on our effective tax rates and tax expenses but they could. Additionally, in December 2017, the United States enacted tax reform legislation (“Tax Act”). The legislation implements many new U.S. domestic and international tax provisions. Many aspects of the Tax Act have been clarified through regulations, however several aspects remain unclear and additional clarifying guidance is expected to be issued (by the Internal Revenue Service (“IRS”), the U.S. Treasury Department or via a technical correction law change), although it may not be clarified for some time. In addition, many U.S. states have not yet updated their laws to take into account the new federal legislation. As a result, there may be further impacts of the new law on our results of operations and financial condition. It is possible that the Tax Act, or interpretations under it, could change and could have an adverse effect on us, and such effect could be material.
Our indebtedness may affect our business and may restrict our operational flexibility.
As of December 31, 2019, our total outstanding indebtedness was $2,316 million as described under “Liquidity and Capital Resources." Our indebtedness could:
• | increase our vulnerability to general adverse economic and industry conditions; |
• | limit our ability to obtain additional financing or borrow additional funds; |
• | limit our ability to pay future dividends; |
• | limit our flexibility in planning for, or reacting to, changes in our business and the industry in which we operate; |
• | require that a substantial portion of our cash flow from operations be used for the payment of interest on our indebtedness instead of funding working capital, capital expenditures, acquisitions or other general corporate purposes; and |
• | increase the amount of interest expense that we must pay because some of our borrowings are at variable interest rates, which, as interest rates increase, would result in higher interest expense. |
In addition, there can be no assurance that future borrowings or equity financing will be available to us on favorable terms or at all for the payment or refinancing of our indebtedness. If we incur additional debt or raise equity through the issuance of preferred stock, the terms of the debt or preferred stock issued may give the holders rights, preferences and privileges senior to those of holders of our common stock, particularly in the event of liquidation. The terms of the debt may also impose additional and more stringent restrictions on our operations than we currently have.
Our ability to make scheduled principal payments of, to pay interest on, or to refinance our indebtedness and to satisfy our other debt obligations will depend on our future operating performance, which may be affected by factors beyond our control. If we are unable to service our indebtedness, our business, financial condition and results of operations would be materially adversely affected.
We face risks related to legal and regulatory proceedings.
We are subject to various laws, ordinances, regulations and other requirements of government authorities in foreign countries and in the United States, any violation of which could potentially create substantial liability for us and damage our reputation. Changes in laws, ordinances, regulations or other government policies, the nature, timing, and effect of which are uncertain, may significantly increase our expenses and liabilities.
From time to time we are involved in legal and regulatory proceedings that are incidental to the operation of our businesses (or the business operations of previously owned entities). These proceedings may seek remedies relating to environmental matters, tax, intellectual property, acquisitions or divestitures, product liability and personal injury claims, privacy, employment, labor and pension matters, government contract issues and commercial or contractual disputes. Our continuing transition to connected or digital technologies and solutions has increased our exposure to intellectual property litigation and we expect that this risk will continue to increase as we execute on our innovation and technology priorities.
It is not possible to predict with certainty the outcome of claims, investigations, regulatory proceedings and lawsuits, and we could in the future incur judgments, fines or penalties or enter into settlements and claims that could have an adverse effect on our reputation as well as an adverse effect on our business, results of operations and financial condition in any particular period. Additionally, we may be required to change or cease operations at one or more
18
facilities if a regulatory agency determines that we have failed to comply with laws, regulations or orders applicable to our business.
The global and diverse nature of our operations, coupled with the increase in regulation and enforcement in many regions of the globe, means that legal and compliance risks will continue to exist and additional legal and regulatory proceedings and other contingencies, the outcome of which cannot be predicted with certainty, will arise from time to time. In addition, subsequent developments in legal and regulatory proceedings may affect our assessments and estimates of loss contingencies recorded as a reserve and require us to make payments in excess of our reserves, which could have an adverse effect on our results of operations and financial condition.
Weather conditions and climate changes may adversely affect, or cause volatility in, our financial results.
The unpredictable nature of weather conditions, including heavy flooding, droughts and fluctuations in temperatures or weather patterns, including as a result of climate change, can positively or negatively impact portions of our business and may result in volatility for certain portions of our business, as well as the operations of certain of our customers and suppliers. For example, heavy rain events due to climate change may increase demand for some of our XylemVue solutions that may help customers minimize water and storm water overflows. Within the dewatering space, pumps provided through our Godwin and Flygt brands are used to remove excess or unwanted water. Heavy flooding due to weather conditions drives increased demand for these applications. On the other hand, drought conditions drive higher demand for pumps used in agricultural and turf irrigation applications, such as those provided by our Goulds Water Technology and Lowara brands. Fluctuations in temperatures result in varying levels of demand for products used in residential and commercial hydronic applications where homes and buildings are heated and cooled with HVAC units such as those provided by our Bell & Gossett brand.
If we do not or cannot adequately protect our intellectual property, if third parties infringe or misappropriate our intellectual property rights, or if third parties claim that we are infringing or misappropriating their intellectual property rights, we may suffer competitive injury, expend significant resources enforcing our rights or defending against such claims, or be prevented from selling products or services.
We own numerous patents, trademarks, copyrights, trade secrets and other intellectual property and licenses to intellectual property owned by others, which in the aggregate are important to our business. Our intellectual property rights may provide us with competitive advantage because they may help us differentiate our technologies, products and services, including our growing portfolio of data analytics and digitally-enabled offerings. The intellectual property rights that we have or obtain, however, may not provide us with a significant competitive advantage because they may not be sufficiently broad or may be challenged, invalidated, circumvented, misappropriated, independently developed, or designed-around, particularly given our international operations in countries where laws governing intellectual property rights are not highly developed, protected or enforced. Our failure to obtain or maintain intellectual property rights that convey competitive advantage, adequately protect our intellectual property or detect or prevent circumvention, misappropriation or unauthorized use of such property and the cost of enforcing our intellectual property rights could adversely impact our business, financial condition and results of operations.
From time to time, we receive notices from third parties alleging intellectual property infringement or misappropriation. Any dispute or litigation regarding intellectual property could be costly and time-consuming due to the complexity and the uncertainty of intellectual property litigation. Our intellectual property portfolio may not be useful in asserting a counterclaim, or negotiating a license, in response to a claim of infringement or misappropriation. In addition, as a result of such claims of infringement or misappropriation, we could lose our rights to critical technology, be unable to license critical technology or sell critical products and services, be required to pay substantial damages or license fees with respect to the infringed rights or be required to redesign our products at substantial cost, any of which could adversely impact our competitive position, financial condition and results of operations. Even if we successfully defend against claims of infringement or misappropriation, we may incur significant costs and diversion of management attention and resources, which could adversely affect our business, financial condition and results of operations.
A significant portion of our products and offerings in our Measurement & Control Solutions segment are affected by the availability and regulation of radio spectrum and could be affected by interference with the radio spectrum that we use.
A significant portion of the offerings in our Measurement & Control Solutions segment use radio spectrum, which is subject to government regulation. To the extent we introduce new products designed for use in the United States or another country into a new market, such products may require significant modification or redesign in order to meet frequency requirements and other regulatory specifications. In some countries, limitations on frequency availability or the cost of making necessary modifications may preclude us from selling our products in those countries. The
19
regulations that govern our use of the radio spectrum may change and the changes may require us to modify our products or seek new partnerships, either directly or due to interference caused by new consumer products allowed under the regulations. The inability to modify our products to meet such requirements, the possible delays in completing such modifications, and the cost of such modifications all could have a material adverse effect on our business, financial condition, and results of operations. In addition, suitable partners for co-development may not be able to be secured by us.
In the United States, our products are primarily designed to use licensed spectrum in the 900MHz range. If the FCC does not renew our existing spectrum licenses, our business could be adversely affected. In addition, there may be insufficient available frequencies in some markets to sustain or develop our planned operations at a commercially feasible price or at all.
Outside of the United States, certain of our products require the use of radio frequency and are subject to regulations. In some jurisdictions, radio station licenses may be granted for a fixed term and must be periodically renewed. Our advanced and smart metering systems offering transmits to (and receives information from, if applicable) handheld, mobile, or fixed network reading devices in licensed bands made available to us through strategic partnerships and are reliant to some extent on the licensed spectrum continuing to be available through our partners or our customers. We may be unable to find partners or customers that have access to sufficient frequencies in some markets to sustain or develop our planned operations or to find partners or customers that have access to sufficient frequencies in the relevant markets at a commercially feasible price or at all.
We may incur impairment charges for our goodwill and other indefinite-lived intangible assets which would negatively impact our operating results.
We have a significant amount of goodwill and purchased intangible assets on our balance sheet as a result of acquisitions we have completed. As of December 31, 2019, the net carrying value of our goodwill and other indefinite-lived intangible assets totaled approximately $3 billion. In accordance with generally accepted accounting principles, we evaluate these assets for impairment at least annually, or more frequently if interim indicators suggest that a potential impairment could exist. Significant negative industry or economic trends, disruptions to our business, inability to effectively integrate acquired businesses, unexpected significant changes or planned changes in use of the assets, failure of the FCC to renew licenses, divestitures and market capitalization declines may impair our goodwill and other indefinite-lived intangible assets. Any material charges relating to such impairments could adversely affect our results of operations and financial condition.
We cannot make assurances that we will pay dividends on our common stock or continue to repurchase our common stock under Board approved share repurchase plans, and likewise our indebtedness could limit our ability to pay dividends or make share repurchases.
The timing, declaration, amount and payment of future dividends to our shareholders fall within the discretion of our Board of Directors and will depend on many factors, including our financial condition, cash flows, results of operations and capital requirements, as well as applicable law, regulatory constraints, industry practice and other business considerations that our Board of Directors considers relevant. There can be no assurance that we will pay a dividend in the future or continue to pay dividends.
Further, the timing and amount of the repurchase of our common stock under Board approved share repurchase plans has similar dependencies as the payment of dividends and accordingly, there can be no assurances that we will repurchase our common stock.
Additionally, if we cannot generate sufficient cash flows from operations to meet our debt payment obligations, then our ability to pay dividends, if so determined by the Board of Directors, or make share repurchases will be impaired and we may be required to attempt to restructure or refinance our debt, raise additional capital or take other actions such as selling assets, reducing or delaying capital expenditures, reducing our dividend or delaying or curtailing share repurchases. There can be no assurance, however, that any such actions could be effected on satisfactory terms, if at all, or would be permitted by the terms of our debt or our other credit and contractual arrangements.
Developments in environmental laws and regulations could impact our financial condition or results of operations.
Our operations, product and service offerings are subject to and affected by many federal, state, local and foreign environmental laws and regulations, including those enacted in response to climate change concerns. In addition, we could be affected by future environmental laws or regulations. Compliance with current and future environmental laws and regulations currently requires and is expected to continue to require operating and capital expenditures.
20
Environmental laws and regulations may authorize substantial fines and criminal sanctions as well as facility shutdowns to address violations, and may require the installation of costly pollution control equipment or operational changes to limit emissions or discharges. We also incur, and expect to continue to incur, costs to comply with current environmental laws and regulations.
Developments such as the adoption of new environmental laws and regulations, stricter enforcement of existing laws and regulations, violations by us of such laws and regulations, discovery of previously unknown or more extensive contamination, litigation involving environmental impacts, our inability to recover costs associated with any such developments, or financial insolvency of other responsible parties could in the future have a material adverse effect on our financial condition and results of operations.
The level of returns on postretirement benefit plan assets, changes in interest rates and other factors could affect our earnings and cash flows in future periods.
Certain members of our current and retired employee population are covered by pension and other employee-related defined benefit plans (collectively, postretirement benefit plans). We may experience significant fluctuations in costs related to our postretirement benefit plans as a result of macro-economic factors, such as interest rates, that are beyond our control. The cost of our postretirement plans is incurred over long periods of time and involves factors and uncertainties during those periods which can be volatile and unpredictable, including rates of return on postretirement benefit plan assets, discount rates used to calculate liabilities and expenses and rates of future compensation increases. Management develops each assumption using relevant plan and Company experience and expectations in conjunction with market-related data. Our liquidity, financial position (including shareholders’ equity) and results of operations could be materially affected by significant changes in key economic indicators, actuarial experience, financial market volatility, future legislation and other governmental regulatory actions.
We make contributions to fund our postretirement benefit plans when considered necessary or advantageous to do so. The macro-economic factors discussed above, including the return on postretirement benefit plan assets and the minimum funding requirements established by local government funding or taxing authorities, or established by other agreement, may influence future funding requirements. A significant decline in the fair value of our plan assets, or other adverse changes to our overall pension and other employee-related benefit plans, could require us to make significant funding contributions and affect cash flows in future periods.
21
Risks Related to Ownership of our Common Stock
The market price of our common stock may fluctuate significantly.
We cannot predict the prices at which our common stock may trade. The market price of our common stock may fluctuate widely, depending on many factors, some of which may be beyond our control, including:
• | actual or anticipated fluctuations in our operating results due to factors related to our business; |
• | success or failure of our business strategy; |
• | our quarterly or annual earnings, or those of other companies in our industry; |
• | our ability to obtain financing as needed; |
• | stock repurchases or dividends; |
• | announcements by us or our competitors of significant new business awards or product and service offerings; |
• | announcements by us or our competitors of significant acquisitions or divestitures; |
• | changes in accounting standards, policies, guidance, interpretations or principles; |
• | changes in earnings estimates by securities analysts or our ability to meet those estimates; |
• | our ability to execute transformation, restructuring and realignment actions; |
• | the operating and stock price performance of other comparable companies; |
• | natural or environmental disasters or climate change considerations that investors believe may affect us; |
• | overall market fluctuations; |
• | uncertainty or instability arising from the global geopolitical environment or events or actual or potential global pandemics; |
• | fluctuations in foreign currency impacts; |
• | fluctuations in the budgets or spending of federal, state and local governmental entities around the world; |
• | results from any material litigation, governmental or regulatory body investigation, or tax examination; |
• | changes in laws and regulations affecting our business; |
• | impact of trade protection measures including tariffs; and |
• | general economic conditions and other external factors. |
Stock markets in general have experienced volatility that has often been unrelated to the operating performance of a particular company. These broad market fluctuations could adversely affect the trading price of our common stock.
Risks Related to our 2011 Spin-Off from ITT Corporation (now ITT LLC)
Our Spin-off from ITT may expose us to potential liabilities.
Pursuant to the Distribution Agreement and certain other agreements with ITT (now ITT LLC) and Exelis (acquired by Harris Inc.), ITT and Exelis agreed to indemnify us for certain liabilities, and we agreed to indemnify ITT and Exelis for certain liabilities. Indemnities that we may be required to provide ITT and Exelis may be significant and could negatively impact our business. Third parties could also seek to hold us responsible for any of the liabilities that ITT or Exelis agreed to retain. Further, there can be no assurance that the indemnities from ITT and Exelis will be sufficient to protect us against the full amount of such liabilities, or that ITT and Exelis will be able to fully satisfy their indemnification obligations. Moreover, even if we ultimately were to succeed in recovering from ITT and Exelis any amounts for which we are held liable, we may be temporarily required to bear these losses ourselves. Each of these risks could negatively affect our business, results of operations, cash flow and financial condition.
ITEM 1B. UNRESOLVED STAFF COMMENTS.
None.
22
ITEM 2. PROPERTIES
We have approximately 380 locations in more than 55 countries. These properties total approximately 12 million square feet, of which more than 340 locations, or approximately 6.4 million square feet, are leased. We consider the offices, plants, warehouses and other properties that we own or lease to be in good condition and generally suitable for the purposes for which they are used. The following table shows our significant locations by segment:
Location | State or Country | Principal Business Activity | Approx. Square Feet | Owned or Leased | |||||
Water Infrastructure | |||||||||
Emmaboda | Sweden | Administration and Manufacturing | 1,197,000 | Owned | |||||
Stockholm | Sweden | Administration and Research & Development | 182,000 | Leased | |||||
Bridgeport | NJ | Administration and Manufacturing | 136,000 | Leased | |||||
Shenyang | China | Manufacturing | 125,000 | Owned | |||||
Yellow Springs | OH | Administration and Manufacturing | 112,000 | Owned | |||||
Quenington | UK | Manufacturing | 86,000 | Leased | |||||
Applied Water | |||||||||
Morton Grove | IL | Administration and Manufacturing | 530,000 | Owned | |||||
Montecchio | Italy | Administration and Manufacturing | 379,000 | Owned | |||||
Nanjing | China | Manufacturing | 363,000 | Owned | |||||
Auburn | NY | Manufacturing | 273,000 | Owned | |||||
Stockerau | Austria | Administration | 234,000 | Owned | |||||
Strzelin | Poland | Manufacturing | 185,000 | Owned | |||||
Cheektowaga | NY | Manufacturing | 147,000 | Owned | |||||
Vadodara | India | Manufacturing and Research & Development | 133,000 | Leased | |||||
Measurement & Control Solutions | |||||||||
Ludwigshafen | Germany | Manufacturing | 318,000 | Owned | |||||
Texarkana | AR | Manufacturing | 254,000 | Owned | |||||
Uniontown | PA | Manufacturing | 240,000 | Leased | |||||
DuBois | PA | Manufacturing | 197,000 | Owned | |||||
Durham | NC | Administration and Research & Development | 154,000 | Leased | |||||
DuBois | PA | Manufacturing | 137,000 | Leased | |||||
Regional Selling Locations | |||||||||
Dubai | United Arab Emirates | Manufacturing | 144,000 | Owned | |||||
Nottinghamshire | United Kingdom | Sales Office | 139,000 | Leased | |||||
Nanterre | France | Sales Office | 139,000 | Leased | |||||
Langenhagen | Germany | Sales Office | 134,000 | Leased | |||||
Corporate Headquarters | |||||||||
Rye Brook | NY | Administration | 67,000 | Leased | |||||
ITEM 3. LEGAL PROCEEDINGS
From time to time we are involved in legal and regulatory proceedings that are incidental to the operation of our businesses (or the business operations of previously-owned entities). These proceedings may seek remedies relating to environmental matters, tax, intellectual property matters, acquisitions or divestitures, product liability and personal injury claims, privacy, employment, labor and pension matters, government contract issues and commercial or contractual disputes. See Note 20, "Commitments and Contingencies", of the consolidated financial statements included in Item 8 of Part II of this 10-K for information regarding certain legal and regulatory proceedings we are involved in.
23
ITEM 4. MINE SAFETY DISCLOSURES
Not applicable.
INFORMATION ABOUT OUR EXECUTIVE OFFICERS
The following information is provided regarding the executive officers of Xylem as of February 6, 2020:
NAME | AGE | CURRENT TITLE | OTHER BUSINESS EXPERIENCE DURING PAST 5 YEARS | |||
Patrick K. Decker | 55 | President and Chief Executive Officer (2014) | • President and Chief Executive Officer, Harsco Corp. (diversified, worldwide industrial company) (2012) | |||
E. Mark Rajkowski | 61 | Senior VP and Chief Financial Officer (2016) | • Senior VP and Chief Financial Officer, MeadWestvaco Corp. (worldwide packaging company) (2004) | |||
David Flinton | 49 | Senior VP and Chief Innovation, Technology & Products Officer (2019), Acting President, Water Infrastructure and Europe Commercial Team (2019) | • Senior VP and President, Dewatering (2015) | |||
Pak Steven Leung | 63 | Senior VP and President, Emerging Markets (2015) | • VP, Global Sales, Valves and Controls, Pentair Plc (diversified, worldwide industrial manufacturing company) (2013) | |||
Geri McShane | 46 | VP, Controller and Chief Accounting Officer (2019) | • Controller, Accounting and Reporting (2016) | |||
Kenneth Napolitano | 57 | Senior VP and President, Applied Water Systems and Americas Commercial Team (2017) | • Senior VP and President, Applied Water Systems (2012) | |||
Colin R. Sabol | 52 | Senior VP and President, Measurement & Control Solutions (2017) | • Senior VP and President, Analytics and Treatment (2015) • Senior VP and President, Dewatering (2013) | |||
Kairus Tarapore | 58 | Senior VP and Chief Human Resources Officer (2015) | • Senior VP and Chief Administrative Officer, Babcock & Wilcox Company (energy and environmental technologies and services) (2013) | |||
Claudia S. Toussaint | 56 | Senior VP, General Counsel, Chief Sustainability Officer and Corporate Secretary (2014) | • Senior VP, General Counsel and Secretary, Barnes Group Inc. (international industrial and aerospace manufacturing) (2012) | |||
Note: Date in parentheses indicates the year in which the position was assumed.
24
BOARD OF DIRECTORS
The following information is provided regarding the Board of Directors of Xylem as of February 6, 2020:
NAME | TITLE | |
Markos I. Tambakeras | Chairman, Xylem Inc., Former Chairman, President and Chief Executive Officer, Kennametal, Inc. | |
Jeanne Beliveau-Dunn | Former Vice President and General Manager, Cisco Systems, Inc. | |
Curtis J. Crawford, Ph.D. | President and Chief Executive Officer, XCEO, Inc. | |
Patrick K. Decker | President and Chief Executive Officer, Xylem Inc. | |
Robert F. Friel | Former Chairman, President and Chief Executive Officer, PerkinElmer, Inc. | |
Jorge M. Gomez | Executive Vice President, Chief Financial Officer, Dentsply Sirona, Inc. | |
Victoria D. Harker | Chief Financial Officer, TEGNA, Inc. | |
Sten E. Jakobsson | Former President and Chief Executive Officer, ABB AB | |
Steven R. Loranger | Former Chairman, President and Chief Executive Officer, ITT Corporation | |
Surya N. Mohapatra, Ph.D. | Former Chairman, President and Chief Executive Officer, Quest Diagnostics Incorporated | |
Jerome A. Peribere | Former President and Chief Executive Officer, Sealed Air Corporation | |
25
PART II
ITEM 5. MARKET FOR THE REGISTRANT’S COMMON EQUITY, RELATED STOCKHOLDER MATTERS AND ISSUER PURCHASES OF EQUITY SECURITIES
Market Price and Dividends
Our common stock trades publicly on the New York Stock Exchange under the trading symbol “XYL”. As of January 31, 2020, there were 10,046 holders of record of our common stock.
Dividends are declared and paid on the common stock at the discretion of our Board of Directors and depend on our profitability, financial condition, capital needs, future prospects and other factors deemed relevant by our Board. Therefore, there can be no assurance as to what level of dividends, if any, will be paid in the future. In the first quarter of 2020, we declared a dividend of $0.26 per share to be paid on March 26, 2020 for shareholders of record on February 27, 2020.
There were no unregistered offerings of our common stock during 2019.
Fourth Quarter 2019 Share Repurchase Activity
The following table summarizes our purchases of our common stock for the quarter ended December 31, 2019:
(in millions, except per share amounts) | ||||||||
Period | Total Number of Shares Purchased | Average Price Paid per Share (a) | Total Number of Shares Purchased as Part of Publicly Announced Plans or Programs (b) | Approximate Dollar Value of Shares That May Yet Be Purchased Under the Plans or Programs (b) | ||||
10/1/19 - 10/31/19 | — | — | — | $338 | ||||
11/1/19 - 11/30/19 | — | — | — | $338 | ||||
12/1/19 - 12/31/19 | — | — | — | $338 | ||||
(a) | Average price paid per share is calculated on a settlement basis. |
(b) | On August 24, 2015, our Board of Directors authorized the repurchase of up to $500 million in shares with no expiration date. The program's objective is to deploy our capital in a manner that benefits our shareholders and maintains our focus on growth. There were no shares repurchased under this program during the three months ended December 31, 2019. There are up to $338 million in shares that may still be purchased under this plan as of December 31, 2019. |
26
PERFORMANCE GRAPH
CUMULATIVE TOTAL RETURN
The following graph compares the relative performance of our common stock, the S&P 500 Index and the S&P 500 Industrials Index. This graph covers the period from December 31, 2014 through December 31, 2019 and assumes that $100 was invested on December 31, 2014 in our common stock, the S&P 500 and the S&P 500 Industrials with the reinvestment of any dividends.
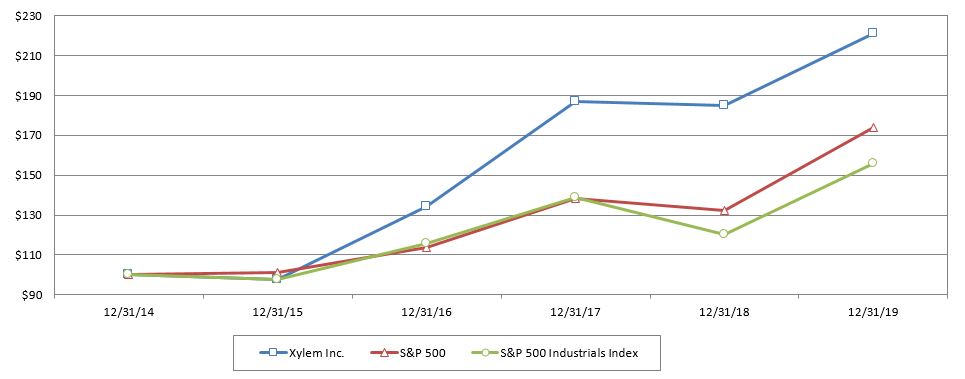
XYL | S&P 500 | S&P 500 Industrials Index | ||||||
December 31, 2014 | 100 | 100 | 100 | |||||
December 31, 2015 | 97 | 101 | 97 | |||||
December 31, 2016 | 134 | 113 | 116 | |||||
December 31, 2017 | 187 | 138 | 139 | |||||
December 31, 2018 | 185 | 132 | 120 | |||||
December 31, 2019 | 221 | 174 | 156 | |||||
The graph is not, and is not intended to be, indicative of future performance of our common stock.
This performance graph shall not be deemed “filed” with the SEC or subject to the liabilities of Section 18 of the Securities Exchange Act of 1934, and should not be deemed incorporated by reference into any of our prior or subsequent filings under the Securities Act of 1933 or the Securities Exchange Act of 1934, except as shall be expressly set forth by specific reference in such filing.
27
ITEM 6. SELECTED FINANCIAL DATA
The following table sets forth selected consolidated financial data for the five years ended December 31, 2019. This selected consolidated financial data should be read in conjunction with “Management’s Discussion and Analysis of Financial Condition and Results of Operations” and the consolidated financial statements and the notes thereto included in this Report.
Year Ended December 31, | |||||||||||||||||||
(in millions, except per share data) | 2019 (a) (b) | 2018 (b) | 2017 (c) | 2016 (c) | 2015 | ||||||||||||||
Results of Operations Data: | |||||||||||||||||||
Revenue | $ | 5,249 | $ | 5,207 | $ | 4,707 | $ | 3,771 | $ | 3,653 | |||||||||
Gross profit | 2,046 | 2,026 | 1,847 | 1,462 | 1,407 | ||||||||||||||
Gross margin | 39.0 | % | 38.9 | % | 39.2 | % | 38.8 | % | 38.5 | % | |||||||||
Operating income | 486 | 654 | 552 | 408 | 454 | ||||||||||||||
Operating margin | 9.3 | % | 12.6 | % | 11.7 | % | 10.8 | % | 12.4 | % | |||||||||
Net income attributable to Xylem | 401 | 549 | 331 | 260 | 340 | ||||||||||||||
Per Share Data: | |||||||||||||||||||
Earnings per share: | |||||||||||||||||||
Basic | $ | 2.23 | $ | 3.05 | $ | 1.84 | $ | 1.45 | $ | 1.88 | |||||||||
Diluted | 2.21 | 3.03 | 1.83 | 1.45 | 1.87 | ||||||||||||||
Basic shares outstanding | 180.0 | 179.8 | 179.6 | 179.1 | 180.9 | ||||||||||||||
Diluted shares outstanding | 181.2 | 181.1 | 180.9 | 180.0 | 181.7 | ||||||||||||||
Cash dividends per share | $ | 0.96 | $ | 0.84 | $ | 0.72 | $ | 0.62 | $ | 0.56 | |||||||||
Balance Sheet Data (at period end): | |||||||||||||||||||
Cash and cash equivalents | $ | 724 | $ | 296 | $ | 414 | $ | 308 | $ | 680 | |||||||||
Working capital* | 919 | 988 | 873 | 878 | 810 | ||||||||||||||
Total assets | 7,710 | 7,222 | 6,860 | 6,474 | 4,657 | ||||||||||||||
Total debt | 2,316 | 2,308 | 2,200 | 2,368 | 1,274 | ||||||||||||||
* | The Company calculates Working capital as follows: net accounts receivable + inventories - accounts payable - customer advances. |
(a) | The amounts shown for the year ended December 31, 2019 include a goodwill impairment charge of $148 million related to the AIA goodwill reporting unit. Refer to Note 12 to the Consolidated Financial Statements for further information regarding goodwill. |
(b) | The amounts shown for the years ended December 31, 2019 and December 31, 2018 reflect the acquisitions of both Pure Technologies Ltd. and Sensus. Refer to Note 3 to the Consolidated Financial Statements for further information regarding acquisitions. |
(c) | The amounts shown for the years ended December 31, 2017 and December 31, 2016 reflect the the acquisition of Sensus. |
28
ITEM 7. MANAGEMENT’S DISCUSSION AND ANALYSIS OF FINANCIAL CONDITION AND RESULTS OF OPERATIONS
The following discussion should be read in conjunction with our consolidated financial statements and the notes thereto. This discussion summarizes the significant factors affecting our results of operations and the financial condition of our business. Except as otherwise indicated or unless the context otherwise requires, “Xylem,” “we,” “us,” “our” and “the Company” refer to Xylem Inc. and its subsidiaries.
This section of this Form 10-K generally discusses 2019 and 2018 items and year-to-year comparisons between 2019 and 2018. Discussions of 2017 items and year-to-year comparisons between 2018 and 2017 that are not included in this Form 10-K can be found in “Management’s Discussion and Analysis of Financial Condition and Results of Operations” in Part II, Item 7 of the Company’s Annual Report on Form 10-K for the fiscal year ended December 31, 2018.
Overview
Xylem is a leading global water technology company. We design, manufacture and service highly engineered products and solutions ranging across a wide variety of critical applications in utility, industrial, residential and commercial building services settings. Our broad portfolio of solutions addresses customer needs across the water cycle, from the delivery, measurement and use of drinking water to the collection, test, treatment and analysis of wastewater to the return of water to the environment. Our product and service offerings are organized into three reportable segments that are aligned around the critical market applications they provide: Water Infrastructure, Applied Water and Measurement & Control Solutions.
• | Water Infrastructure serves the water infrastructure sector with pump systems that transport water from aquifers, lakes, rivers and seas; with filtration, ultraviolet and ozone systems that provide treatment, making the water fit to use; and pumping solutions that move the wastewater and storm water to treatment facilities where our mixers, biological treatment, monitoring and control systems provide the primary functions in the treatment process. We also provide sales and rental of specialty dewatering pumps and related equipment and services. Additionally, our offerings use monitoring and control, smart and connected technologies to allow for remote monitoring of performance and enable products to self-optimize pump operations maximizing energy efficiency and minimizing unplanned downtime and maintenance for our customers. In the Water Infrastructure segment, we provide the majority of our sales directly to customers along with strong applications expertise, while the remaining amount is through distribution partners. |
• | Applied Water serves the water usage applications sector with water pressure boosting systems for heating, ventilation and air conditioning, and for fire protection systems to the residential and commercial building services markets. In addition, our pumps, heat exchangers and controls provide cooling to power plants and manufacturing facilities, circulation for food and beverage processing, as well as boosting systems for agricultural irrigation. In the Applied Water segment, we provide the majority of our sales through long-standing relationships with many of the leading independent distributors in the markets we serve, with the remainder going directly to customers. |
• | Measurement & Control Solutions primarily serves the utility infrastructure solutions and services sector by delivering communications, smart metering, measurement and control technologies and critical infrastructure technologies that allow customers to more effectively use their distribution networks for the delivery, monitoring and control of critical resources such as water, electricity and natural gas. We also provide analytical instrumentation used to measure and analyze water quality, flow and level in clean water, wastewater, surface water and coastal environments. Additionally, we offer software and services including cloud-based analytics, remote monitoring and data management, leak detection, condition assessment, asset management and pressure monitoring solutions. We also offer smart lighting solutions that improve efficiency and public safety efforts across communities. In the Measurement & Control Solutions segment, we generate our sales through a combination of long-standing relationships with leading distributors and dedicated channel partners as well as direct sales depending on the regional availability of distribution channels and the type of product. |
29
Key Performance Indicators and Non-GAAP Measures
Management reviews key performance indicators including revenue, gross margins, segment operating income and margins, orders growth, working capital and backlog, among others. In addition, we consider certain non-GAAP (or "adjusted") measures to be useful to management and investors evaluating our operating performance for the periods presented, and to provide a tool for evaluating our ongoing operations, liquidity and management of assets. This information can assist investors in assessing our financial performance and measures our ability to generate capital for deployment among competing strategic alternatives and initiatives, including, but not limited to, dividends, acquisitions, share repurchases and debt repayment. Excluding revenue, Xylem provides guidance only on a non-GAAP basis due to the inherent difficulty in forecasting certain amounts that would be included in GAAP earnings, such as discrete tax items, without unreasonable effort. These adjusted metrics are consistent with how management views our business and are used to make financial, operating and planning decisions. These metrics, however, are not measures of financial performance under GAAP and should not be considered a substitute for revenue, operating income, net income, earnings per share (basic and diluted) or net cash from operating activities as determined in accordance with GAAP. We consider the following items to represent non-GAAP measures as well as the related reconciling items to the most directly comparable measure calculated and presented in accordance with GAAP. The non-GAAP measures may not be comparable to similarly titled measures reported by other companies, to be key performance indicators:
• | "organic revenue" and "organic orders" defined as revenue and orders, respectively, excluding the impact of fluctuations in foreign currency translation and contributions from acquisitions and divestitures. Divestitures include sales of insignificant portions of our business that did not meet the criteria for classification as a discontinued operation. The period-over-period change resulting from foreign currency translation impacts is determined by translating current period and prior period activity using the same currency conversion rate. |
• | "constant currency" defined as financial results adjusted for foreign currency translation impacts by translating current period and prior period activity using the same currency conversion rate. This approach is used for countries whose functional currency is not the U.S. dollar. |
• | "adjusted net income" and "adjusted earnings per share" defined as net income and earnings per share, respectively, adjusted to exclude, as applicable, restructuring and realignment costs, special charges, tax-related special items and gains and losses from the sale of a business. A reconciliation of adjusted net income is provided below. |
(in millions, except per share data) | 2019 | 2018 | ||||||||||||
Net income & Earnings per share | $ | 401 | $ | 2.21 | $ | 549 | $ | 3.03 | ||||||
Restructuring and realignment, net of tax of $19 and $12 | 63 | 0.35 | 36 | 0.20 | ||||||||||
Special charges, net of tax of $6 and $1 | 172 | 0.95 | 12 | 0.07 | ||||||||||
Tax-related special items | (88 | ) | (0.48 | ) | (75 | ) | (0.42 | ) | ||||||
(Gain) loss from sale of business, net of tax benefit of $0 | (1 | ) | (0.01 | ) | — | — | ||||||||
Adjusted net income & Adjusted earnings per share | $ | 547 | $ | 3.02 | $ | 522 | $ | 2.88 | ||||||
▪ | "adjusted operating expenses" and "adjusted gross profit" defined as operating expenses and gross profit, respectively, adjusted to exclude restructuring and realignment costs and special charges. |
▪ | "adjusted operating income" defined as operating income, adjusted to exclude restructuring and realignment costs and special charges, and "adjusted operating margin" defined as adjusted operating income divided by total revenue. |
▪ | “realignment costs” defined as costs not included in restructuring costs that are incurred as part of actions taken to reposition our business, including items such as professional fees, severance, relocation, travel, facility set-up and other costs. |
▪ | "Sensus acquisition related costs" defined as costs incurred by the Company associated with the acquisition of Sensus that are being reported within operating income. These costs include integration costs, acquisition costs, costs related to the recognition of the backlog intangible asset amortization recorded in purchase accounting. |
30
▪ | “special charges" defined as costs incurred by the Company, such as acquisition and integration related costs not included in "Sensus acquisition related costs", non-cash impairment charges and other special non-operating items, such as pension adjustments. |
▪ | "tax-related special items" defined as tax items, such as tax return versus tax provision adjustments, tax exam impacts, tax law change impacts, excess tax benefits/losses and other discrete tax adjustments. |
▪ | "free cash flow" defined as net cash from operating activities, as reported in the Statement of Cash Flows, less capital expenditures as well as adjustments for other significant items that impact current results which management believes are not related to our ongoing operations and performance. Our definition of "free cash flow" does not consider certain non-discretionary cash payments, such as debt. The following table provides a reconciliation of free cash flow. |
(in millions) | 2019 | 2018 | ||||||
Net cash provided by operating activities | $ | 839 | $ | 586 | ||||
Capital expenditures | (226 | ) | (237 | ) | ||||
Free cash flow | $ | 613 | $ | 349 | ||||
Cash paid for Sensus acquisition related costs | — | 1 | ||||||
Free cash flow, excluding Sensus acquisition related costs | $ | 613 | $ | 350 | ||||
Net cash used in investing activities | $ | (231 | ) | $ | (643 | ) | ||
Net cash used by financing activities | $ | (177 | ) | $ | (40 | ) | ||
▪ | “EBITDA” defined as earnings before interest, taxes, depreciation and amortization expense and "Adjusted EBITDA" reflects the adjustment to EBITDA to exclude share-based compensation charges, restructuring and realignment costs, gain or loss from sale of businesses and special charges. |
(in millions) | 2019 | 2018 | ||||||
Net Income | $ | 401 | $ | 549 | ||||
Income tax expense | 15 | 36 | ||||||
Interest expense (Income), net | 62 | 78 | ||||||
Depreciation | 117 | 117 | ||||||
Amortization | 140 | 144 | ||||||
EBITDA | $ | 735 | $ | 924 | ||||
Share-based compensation | 29 | 30 | ||||||
Restructuring and realignment | 82 | 47 | ||||||
Special charges | 178 | 12 | ||||||
(Gain) loss from sale of business | (1 | ) | — | |||||
Adjusted EBITDA | $ | 1,023 | $ | 1,013 | ||||
31
Executive Summary
Xylem reported revenue of $5,249 million for 2019, an increase of $42 million, or 0.8%, from $5,207 million reported in 2018. On a constant currency basis, revenue increased by $166 million, or 3.2%, primarily consisting of organic revenue growth of $188 million, or 3.6%, driven by growth in all end markets and across all segments. A net decrease in revenue related to acquisition and divestiture impacts of $22 million partially offset the organic revenue growth during the year.
Operating income for 2019 was $486 million, reflecting a decrease of $168 million, or 25.7%, compared to $654 million in 2018. Operating margin was 9.3% for 2019 versus 12.6% for 2018, a decrease of 330 basis points. Operating margin was negatively impacted by increased special charges of $147 million, consisting entirely of non-cash impairment charges, and increased restructuring and realignment costs of $34 million during the year. Excluding the impact of these items, adjusted operating income was $727 million, with an adjusted operating margin of 13.9% in 2019 as compared to adjusted operating income of $714 million with an adjusted operating margin of 13.7% in 2018. The slight increase in adjusted operating margin was primarily due to cost reductions from our global procurement and productivity initiatives, including restructuring savings, improved price realization and favorable volume impacts. These impacts were partially offset by cost inflation, unfavorable mix, increased spending on strategic investments and increased cost of quality.
Additional financial highlights for 2019 include the following:
• | Net income attributable to Xylem of $401 million, or $2.21 per diluted share ($547 million or $3.02 per diluted share on an adjusted basis, up 4.8% from 2018) |
• | Cash from operating activities of $839 million, and free cash flow, excluding Sensus acquisition related costs, of $613 million up 75% from 2018 |
• | Orders of $5,339 million, down 1.8% from $5,437 million in 2018 (up 0.9% on an organic basis) |
• | Dividends paid to shareholders increased 14% in 2019. |
2020 Business Outlook
We anticipate total revenue growth of approximately 1% in 2020, with organic revenue growth anticipated to be in the range of 1% to 3%. The following is a summary of our 2019 organic revenue performance and 2020 organic revenue outlook by end market.
• | Utilities increased approximately 6% for 2019 on an organic basis driven by strength in the United States, the emerging markets and western Europe, partially offset by weakness in Canada. For 2020, we expect organic growth in the low-single-digit range driven by healthy water and wastewater spending in the United States, smart meter and infrastructure analytics growth opportunities and steady low-single-digit growth in Europe. We also anticipate a healthy infrastructure investment focus in the emerging markets will continue in China, India and Africa. |
• | Industrial increased by approximately 1% for 2019 on an organic basis driven by strength in the United States, Europe and the Middle East and Africa, partially offset by weakness in Latin America and Canada. For 2020, we expect organic revenue to remain relatively flat driven by soft growth within the North America Dewatering business during the first half of the year, as oil and gas markets continue to be soft. We anticipate mixed market conditions outside of the United States with modest strength in Asia Pacific offset by softness in the Middle East due to geopolitical and economic uncertainty. We anticipate that Europe will remain relatively flat during the year. |
• | In the commercial markets, organic growth was approximately 3% for 2019 driven by strength in the emerging markets and North America, partially offset by weakness in western Europe. For 2020, we expect organic growth in the low-single-digit range as we anticipate that soft overall market conditions will recover during the second half of the year driven by continued strength in the United States and solid market conditions in Europe. The emerging markets will also continue to drive organic growth, led by initiatives in the China and India building markets. |
• | In residential markets, organic growth was approximately 2% in 2019 driven by strength in the United States and Asia Pacific, partially offset by weakness in western Europe and the Middle East and Africa. For 2020, we expect low-single-digit growth primarily driven by the United States housing market and a strong outlook in Europe. We also anticipate modest growth opportunities for a second water supply in China and other countries within Asia. |
32
We will continue to strategically execute restructuring and realignment actions primarily to reposition our European and North American businesses in an effort to optimize our cost structure and improve our operational efficiency and effectiveness. During 2019, we incurred $53 million and $29 million in restructuring and realignment costs, respectively. We realized approximately $6 million of incremental net savings in 2019 from actions initiated in 2018, and an additional $16 million of net savings from our 2019 actions. As a result of our 2018 and 2019 actions we expect to realize approximately $25 million of incremental net savings in 2020 and beyond. During 2020, we currently expect to incur between $35 million and $45 million in restructuring and realignment costs.
We plan to continue to take actions and focus spending in 2020 on actions that allow us to make progress on our top strategic priorities. The priority of accelerating profitable growth encompasses our initiatives to drive commercial leadership, grow in emerging markets and strengthen innovation and technology through creation of new centers of excellence, a streamlined approach to product development and strategic acquisitions. The priority of driving continuous improvement is an area where we will continue to work to create new opportunities to unlock savings by eliminating waste and increasing efficiencies, which is supported by efforts to expand and further deepen our talent pool. We plan to continue to deploy capital in smart, disciplined ways to develop and acquire solutions to address our customers’ challenges. Finally, we continue to work to improve cash performance and generate capital to return to our shareholders.
33
Results of Operations
(in millions) | 2019 | 2018 | 2019 v. 2018 | ||||||||
Revenue | $ | 5,249 | $ | 5,207 | 0.8 | % | |||||
Gross profit | 2,046 | 2,026 | 1.0 | % | |||||||
Gross margin | 39.0 | % | 38.9 | % | 10 | bp | |||||
Restructuring and realignment costs | 5 | 5 | — | % | |||||||
Adjusted gross profit | 2,051 | 2,031 | 1.0 | % | |||||||
Adjusted gross margin | 39.1 | % | 39.0 | % | 10 | bp | |||||
Total operating expenses | 1,560 | 1,372 | 13.7 | % | |||||||
Expense to revenue ratio | 29.7 | % | 26.3 | % | 340 | bp | |||||
Restructuring and realignment costs | (77 | ) | (43 | ) | 79.1 | % | |||||
Special charges | (159 | ) | (12 | ) | NM | ||||||
Adjusted operating expenses | 1,324 | 1,317 | 0.5 | % | |||||||
Adjusted operating expenses to revenue ratio | 25.2 | % | 25.3 | % | (10 | )bp | |||||
Operating income | 486 | 654 | (25.7 | )% | |||||||
Operating margin | 9.3 | % | 12.6 | % | (330 | )bp | |||||
Interest and other non-operating expense (income), net | 71 | 69 | 2.9 | % | |||||||
Gain (loss) from sale of business | 1 | — | NM | ||||||||
Income tax expense | 15 | 36 | (58.3 | )% | |||||||
Tax rate | 3.7 | % | 6.1 | % | (240 | )bp | |||||
Net income | $ | 401 | $ | 549 | (27.0 | )% | |||||
NM Not Meaningful
2019 versus 2018
Revenue
Revenue generated for 2019 was $5,249 million, an increase of $42 million, or 0.8%, compared to $5,207 million in 2018. On a constant currency basis, revenue grew 3.2% during 2019. This increase in revenue at constant currency was primarily driven by an increase in organic revenue of $188 million reflecting strong organic growth in the United States and the emerging markets, with the exception of Latin America, partially offset by declines in Canada and western Europe. A net decrease in revenue related to acquisition and divestiture impacts of $22 million partially offset organic growth during the year.
The following table illustrates the impact from organic growth, recent acquisitions and divestitures, and foreign currency translation in relation to revenue during 2019:
Water Infrastructure | Applied Water | Measurement & Control Solutions | Total Xylem | ||||||||||||||||||||
(in millions) | $ Change | % Change | $ Change | % Change | $ Change | % Change | $ Change | % Change | |||||||||||||||
2018 Revenue | $ | 2,176 | $ | 1,534 | $ | 1,497 | $ | 5,207 | |||||||||||||||
Organic Growth | 71 | 3.3 | % | 36 | 2.3 | % | 81 | 5.4 | % | 188 | 3.6 | % | |||||||||||
Acquisitions/(Divestitures) | — | — | % | — | — | % | (22 | ) | (1.5 | )% | (22 | ) | (0.4 | )% | |||||||||
Constant Currency | 71 | 3.3 | % | 36 | 2.3 | % | 59 | 3.9 | % | 166 | 3.2 | % | |||||||||||
Foreign currency translation (a) | (70 | ) | (3.2 | )% | (29 | ) | (1.9 | )% | (25 | ) | (1.7 | )% | (124 | ) | (2.4 | )% | |||||||
Total change in revenue | 1 | — | % | 7 | 0.5 | % | 34 | 2.3 | % | 42 | 0.8 | % | |||||||||||
2019 Revenue | $ | 2,177 | $ | 1,541 | $ | 1,531 | $ | 5,249 | |||||||||||||||
(a) | Foreign currency translation impact for the year primarily due to the weakening in value of various currencies against the U.S. Dollar, the largest being the Euro, the Chinese Yuan, the British Pound, the Swedish Krona and the Australian Dollar. |
34
Water Infrastructure
Water Infrastructure revenue slightly increased $1 million to $2,177 million in 2019 (3.3% increase on a constant currency basis) compared to 2018. Revenue was negatively impacted by $70 million of foreign currency translation, with the change at constant currency coming entirely from organic growth during the year of $71 million. Organic growth for the year was driven by strength in the utility end market, particularly in the United States, where we benefited from healthy order intake and strong market conditions across both applications. The utility end market also saw growth in Asia Pacific and western Europe driven by strong project deployments during the year. The industrial end market has remained relatively flat during the year with organic growth in the emerging markets and the United States, where we benefited from solid order intake and a strong mining market over the first half of the year, which was partially offset by declines in western Europe due to the timing of project deployments in the prior year. Organic growth in both end markets also benefited from price realization during the year.
From an application perspective, organic revenue growth for the year was primarily driven by our transport application. The transport application had strong organic revenue growth driven by project deliveries and price realization in the United States and the emerging markets. Organic growth from the global dewatering application was also up modestly for the year, with strong growth in first half of the year, coming from strength in construction and mining in the United States and Australia, being offset by rental revenue declines in North America in the second half of the year driven by a sharp drop off in oil and gas. Organic revenue from our treatment application also contributed to the segment's growth driven by project deliveries in the United States and Asia Pacific where we benefited from strong order intake coming into the year. This organic growth was partially offset by declines in the Middle East and Latin America, primarily due to the lapping of large treatment project deliveries in these regions in the prior year.
Applied Water
Applied Water revenue increased $7 million, or 0.5%, in 2019 (2.3% increase on a constant currency basis) compared to 2018. Revenue was negatively impacted by $29 million of foreign currency translation, with the change at constant currency coming entirely from organic growth during the year of $36 million. Organic growth for the year was primarily driven by strength in the commercial end market, as well as prudent growth in the industrial and residential end markets.
From an application perspective, organic revenue growth during the year was led by strength in the building services application in the commercial market which was driven by market expansion in the emerging markets, primarily in the Middle East & Africa, and product localization in China, partially offset by softness in western Europe. The industrial water application had modest organic growth during the year, primarily driven by market growth in western Europe, coupled with customers stocking orders due to geopolitical concerns, and strength in the United States, partially offset by some declines in the emerging market regions. Organic growth in building services application in the residential market came primarily from healthy market growth in the United States and strong second water supply business in China, which was partially offset by declines in western Europe and the Middle East. Organic growth within the segment also benefited from price realization during the year.
Measurement & Control Solutions
Measurement & Control Solutions revenue increased $34 million, or 2.3%, in 2019 (3.9% increase on a constant currency basis) compared to 2018. Revenue was negatively impacted by $25 million of foreign currency translation during the year. Revenue growth at constant currency was made up of organic revenue growth of $81 million, or 5.4%, which was partially offset by $22 million of reduced revenue related to the net acquisition and divestiture impacts during the year. Organic revenue growth for the year was driven by strength in the utility end market, primarily in the United States and the Middle East, partially offset by declines in the United Kingdom.
From an application perspective, organic revenue from the water metrology application contributed the majority of the organic growth for the segment, with large project deployments in the United States, the Middle East and western Europe during the year. The energy application also contributed to the organic growth during the year as gas project deployments more than offset the timing of a large electric project deployment in the prior year in the United States . This organic growth was partially offset by a decline in the software as a service ("SaaS") and other application primarily due to the timing of a large software sale in the prior year in the United Kingdom. The test application remained relatively flat as compared to the prior year.
35
Orders/Backlog
An order represents a legally enforceable, written document that includes the scope of work or services to be performed or equipment to be supplied to a customer, the corresponding price and the expected delivery date for the applicable products or services to be provided. An order often takes the form of a customer purchase order (“P.O.”) or a signed quote from a Xylem business. Orders received during 2019 decreased by $98 million, or 1.8%, to $5,339 million (0.6% increase on a constant currency basis). Order intake during the year was negatively impacted by $129 million of foreign currency translation. The order growth on a constant currency basis primarily consisted of organic order growth of $48 million, or 0.9%, over the prior year. Net acquisition and divestiture activity of $17 million negatively impacted order growth during the year.
The following table illustrates the impact from organic growth, recent acquisitions and divestitures, and foreign currency translation in relation to orders during 2019:
Water Infrastructure | Applied Water | Measurement & Control Solutions | Total Xylem | ||||||||||||||||||||
(in millions) | $ Change | % Change | $ Change | % Change | $ Change | % Change | $ Change | % Change | |||||||||||||||
2018 Orders | $ | 2,255 | $ | 1,557 | $ | 1,625 | $ | 5,437 | |||||||||||||||
Organic Growth | 53 | 2.4 | % | 28 | 1.8 | % | (33 | ) | (2.0 | )% | 48 | 0.9 | % | ||||||||||
Acquisitions/(Divestitures) | — | — | % | — | — | % | (17 | ) | (1.0 | )% | (17 | ) | (0.3 | )% | |||||||||
Constant Currency | 53 | 2.4 | % | 28 | 1.8 | % | (50 | ) | (3.1 | )% | 31 | 0.6 | % | ||||||||||
Foreign currency translation (a) | (74 | ) | (3.3 | )% | (29 | ) | (1.9 | )% | (26 | ) | (1.6 | )% | (129 | ) | (2.4 | )% | |||||||
Total change in orders | (21 | ) | (0.9 | )% | (1 | ) | (0.1 | )% | (76 | ) | (4.7 | )% | (98 | ) | (1.8 | )% | |||||||
2019 Orders | $ | 2,234 | $ | 1,556 | $ | 1,549 | $ | 5,339 | |||||||||||||||
(a) | Foreign currency translation impact for the year primarily due to the weakening in value of various currencies against the U.S. Dollar, the largest being the Euro, the Chinese Yuan, the British Pound, the Swedish Krona and the Australian Dollar. |
Water Infrastructure
Water Infrastructure segment orders decreased $21 million, or 0.9%, to $2,234 million (2.4% increase on a constant currency basis). Order intake during the year was negatively impacted by $74 million of foreign currency translation. The order increase on a constant currency basis was driven by organic order growth in the transport application. Transport organic order growth was primarily driven by a large smart city project order secured in India during the second half of the year and strong market conditions, coupled with some price realization, in Europe, China and North America. Organic orders for the treatment application declined during the year, primarily driven by project timing in North America and India due to the timing of large project orders in the prior year, partially offset by strong order intake in the Middle East during the year.
Applied Water
Applied Water segment orders slightly decreased $1 million to $1,556 million (1.8% increase on a constant currency basis). Order intake during the year was negatively impacted by $29 million of foreign currency translation. The order increase on a constant currency basis was driven by strong organic order growth in the United States and China across both applications, which were partially offset by a reduction of orders in the Middle East.
Measurement & Control Solutions
Measurement & Control Solutions segment orders decreased $76 million, or 4.7%, to $1,549 million (3.1% decrease on a constant currency basis). Order intake during the year was negatively impacted by $26 million of foreign currency translation. The order decrease on a constant currency basis was driven by an organic decline of $33 million, or 2.0%, which followed a difficult comparison to the prior year organic order growth of 18%, and $17 million of the net acquisition and divestiture impacts on the year. The decrease in organic orders during the year was driven by the energy application decline in North America, which had a significant electric deployment order in the prior year that did not repeat. Water application orders grew organically during the year driven by strong order intake within the AIA platform, partially offset by the lapping of large prior year orders for metrology projects, coupled with some softening market conditions, in North America and the Middle East. SaaS and other experienced modest organic growth during the year, driven by order strength in North America, largely offset by the lapping of a
36
large UK software order in the prior year. Organic orders for the test application declined during the quarter driven by project timing and soft market conditions in Europe.
Backlog
Backlog includes orders on hand as well as contractual customer agreements at the end of the period. Delivery schedules vary from customer to customer based on their requirements. Annual or multi-year contracts are subject to rescheduling and cancellation by customers due to the long-term nature of the contracts. As such, beginning total backlog, plus orders, minus revenues, will not equal ending total backlog due to contract adjustments, foreign currency fluctuations, and other factors. Typically, large projects require longer lead production cycles and deployment schedules and delays can occur from time to time. Total backlog was $1,801 million at December 31, 2019 and $1,689 million at December 31, 2018, an increase of 6.6%. We anticipate that approximately 60% of our total backlog at December 31, 2019 will be recognized as revenue during 2020. This is down from prior years due to the changing profile of our backlog which includes a greater portion of large multi-year projects.
Gross Margin
Gross margin as a percentage of consolidated revenue increased 10 basis points to 39.0% in 2019 as compared to 38.9% in 2018. The slight gross margin increase was primarily driven by cost reductions from global procurement and productivity improvement initiatives and price realization, which were partially offset by cost inflation and unfavorable mix.
Operating Expenses
(in millions) | 2019 | 2018 | Change | |||||||
Selling, general and administrative expenses ("SG&A") | $ | 1,158 | $ | 1,161 | (0.3 | )% | ||||
SG&A as a % of revenue | 22.1 | % | 22.3 | % | (20 | )bp | ||||
Research and development expenses ("R&D") | 191 | 189 | 1.1 | % | ||||||
R&D as a % of revenue | 3.6 | % | 3.6 | % | — | |||||
Restructuring and asset impairment charges | 63 | 22 | 186.4 | % | ||||||
Operating expenses | $ | 1,412 | $ | 1,372 | 2.9 | % | ||||
Expense to revenue ratio | 26.9 | % | 26.3 | % | 60 | bp | ||||
Selling, General and Administrative ("SG&A") Expenses
SG&A expenses decreased by $3 million (decrease of 0.3%) to 22.1% of revenue in 2019, as compared to 22.3% of revenue in 2018. The improvement in SG&A as a percent of revenue for the year was primarily driven by cost reductions from global procurement and productivity improvement initiatives, including restructuring savings, which were partially offset by cost inflation and additional investment in strategic growth initiatives.
Research and Development ("R&D") Expenses
R&D expense was $191 million, or 3.6% of revenue, in 2019 as compared to $189 million, or 3.6% of revenue, in 2018. Additionally, we capitalized R&D on external sale software of $59 million in 2019 as compared to $60 million in 2018. Our increased spending on R&D is driven by development needs to drive new product growth.
Restructuring and Asset Impairment Charges
Restructuring
During 2019, we incurred restructuring costs of $20 million, $5 million and $28 million in our Water Infrastructure, Applied Water and Measurement & Control Solutions segments, respectively. We incurred these charges related to actions taken in 2019 primarily as a continuation of our efforts to reposition our European and North American businesses to optimize our cost structure and improve our operational efficiency and effectiveness. The charges included the reduction of headcount and consolidation of facilities within our Measurement & Control Solutions and Water Infrastructure segments, as well as headcount reductions within our Applied Water segment.
During 2018, we recognized restructuring costs of $9 million, $2 million and $9 million in our Water Infrastructure, Applied Water and Measurement & Control Solutions, respectively. These charges were incurred primarily in an effort to reposition our European and North American businesses to optimize our cost structure and improve our operational efficiency and effectiveness. The charges included the reduction of headcount and consolidation of facilities within our Measurement & Control Solutions and Water Infrastructure segments, as well as headcount reductions within our Applied Water segment.
37
The following is a rollforward of employee position eliminations associated with restructuring activities for the years ended December 31, 2019 and 2018:
2019 | 2018 | |||||
Planned reductions - January 1 | 69 | 47 | ||||
Additional planned reductions | 674 | 206 | ||||
Actual reductions and reversals | (547 | ) | (184 | ) | ||
Planned reductions - December 31 | 196 | 69 | ||||
The following table presents expected restructuring spend:
(in millions) | Water Infrastructure | Applied Water | Measurement & Control Solutions | Corporate | Total | |||||||||||||||
Actions Commenced in 2019: | ||||||||||||||||||||
Total expected costs | $ | 19 | $ | 5 | $ | 28 | $ | — | $ | 52 | ||||||||||
Costs incurred during 2019 | 18 | 5 | 27 | — | 50 | |||||||||||||||
Total expected costs remaining | $ | 1 | $ | — | $ | 1 | $ | — | $ | 2 | ||||||||||
Actions Commenced in 2018: | ||||||||||||||||||||
Total expected costs | $ | 8 | $ | 1 | $ | 7 | $ | — | $ | 16 | ||||||||||
Costs incurred during 2018 | 7 | 1 | 7 | — | 15 | |||||||||||||||
Costs incurred during 2019 | 1 | — | — | — | 1 | |||||||||||||||
Total expected costs remaining | $ | — | $ | — | $ | — | $ | — | $ | — | ||||||||||
Actions Commenced in 2017: | ||||||||||||||||||||
Total expected costs | $ | 12 | $ | 7 | $ | 4 | $ | — | $ | 23 | ||||||||||
Costs incurred during 2017 | 5 | 4 | 2 | — | 11 | |||||||||||||||
Costs incurred during 2018 | 2 | 1 | 1 | — | 4 | |||||||||||||||
Costs incurred during 2019 | 1 | — | 1 | — | 2 | |||||||||||||||
Total expected costs remaining | $ | 4 | $ | 2 | $ | — | $ | — | $ | 6 | ||||||||||
The Water Infrastructure, Applied Water, and Measurement & Control Solutions actions commenced in 2019 consist primarily of severance charges. The Applied Water actions are complete, the Water Infrastructure actions are expected to continue through Q1 2020, and the Measurement & Control Solutions actions are expected to continue through the fourth quarter of 2020. The Water Infrastructure, Applied Water, and Measurement & Control Solutions actions commenced in 2018 consist primarily of severance charges and are complete. The Water Infrastructure, Applied Water, Measurement & Control Solutions and Corporate actions commenced in 2017 consist primarily of severance charges and are expected to continue through 2021. As a result of the actions initiated in 2019, we achieved savings of approximately $15 million in 2019 and estimate annual future net savings beginning in 2020 of approximately $39 million, resulting in $24 million of incremental savings from the 2019 actions.
Asset Impairment
During the first and third quarter of 2019 we determined that certain assets within our Measurement & Control Solutions segment, including customer relationships, internally developed software, proprietary technology, and plant property & equipment, were impaired. Accordingly we recognized an impairment charge of $10 million during the year. Refer to Note 12, "Goodwill and Other Intangible Assets," for additional information.
During the fourth quarter of 2018 we determined that certain software assets within our Water Infrastructure segment were impaired. Accordingly we recognized an impairment charge of $2 million.
Goodwill Impairment Charge
During the third quarter of 2019, the Company recorded a goodwill impairment charge of $148 million related to the Advanced Infrastructure Analytics (“AIA”) goodwill reporting unit. The impairment resulted from a downward revision of forecasted future cash flows. Factors that contributed to the revised forecast in the third quarter include lower
38
than expected results as compared to prior forecasts, largely as a result of slower-than-expected conversion of pipeline opportunities to revenue. Additionally, we have continued to invest in the AIA platform ahead of the adoption curve, which has also impacted the near-term profitability of the business. These factors drove a decrease in the fair value, based on a discounted cash flow valuation, of the AIA reporting unit that was below its carrying value as of July 1, 2019, requiring an impairment charge. Refer to Note 12, "Goodwill and Other Intangible Assets," for additional information.
Operating Income
Operating income was $486 million (operating margin of 9.3%) during 2019, a decrease of $168 million, or 25.7%, when compared to operating income of $654 million (operating margin of 12.6%) during the prior year. Operating margin for the year was negatively impacted by increased special charges of $147 million, consisting entirely of non-cash impairment charges, and increased restructuring and realignment costs of $34 million as compared to the prior year. Excluding these special charges and restructuring and realignment costs, adjusted operating income was $727 million (adjusted operating margin of 13.9%) for 2019 as compared to adjusted operating income of $714 million (adjusted operating margin of 13.7%) during the prior year. The slight increase in adjusted operating margin was primarily due to cost reductions from our global procurement and productivity initiatives, including restructuring savings, improved price realization and favorable volume impacts. These impacts were partially offset by cost inflation, unfavorable mix, increased spending on strategic investments and increased cost of quality.
The table below provides a reconciliation of total and each segment's operating income to adjusted operating income, and a calculation of the corresponding adjusted operating margin:
(In millions) | 2019 | 2018 | Change | ||||||||
Water Infrastructure | |||||||||||
Operating income | $ | 365 | $ | 359 | 1.7 | % | |||||
Operating margin | 16.8 | % | 16.5 | % | 30 | bp | |||||
Restructuring and realignment costs | 31 | 20 | 55.0 | % | |||||||
Special charges | — | 2 | NM | ||||||||
Adjusted operating income | $ | 396 | $ | 381 | 3.9 | % | |||||
Adjusted operating margin | 18.2 | % | 17.5 | % | 70 | bp | |||||
Applied Water | |||||||||||
Operating income | $ | 241 | $ | 236 | 2.1 | % | |||||
Operating margin | 15.6 | % | 15.4 | % | 20 | bp | |||||
Restructuring and realignment costs | 13 | 10 | 30.0 | % | |||||||
Adjusted operating income | $ | 254 | $ | 246 | 3.3 | % | |||||
Adjusted operating margin | 16.5 | % | 16.0 | % | 50 | bp | |||||
Measurement & Control Solutions | |||||||||||
Operating (loss) income | $ | (67 | ) | $ | 118 | (156.8 | ) | % | |||
Operating margin | (4.4 | )% | 7.9 | % | (1,230 | ) | bp | ||||
Restructuring and realignment costs | 38 | 18 | 111.1 | % | |||||||
Special charges | 159 | 5 | NM | ||||||||
Adjusted operating income | $ | 130 | $ | 141 | (7.8 | ) | % | ||||
Adjusted operating margin | 8.5 | % | 9.4 | % | (90 | ) | bp | ||||
Corporate and other | |||||||||||
Operating loss | $ | (53 | ) | $ | (59 | ) | (10.2 | ) | % | ||
Special charges | — | 5 | NM | % | |||||||
Adjusted operating loss | $ | (53 | ) | $ | (54 | ) | (1.9 | ) | % | ||
Total Xylem | |||||||||||
Operating income | $ | 486 | $ | 654 | (25.7 | ) | % | ||||
Operating margin | 9.3 | % | 12.6 | % | (330 | ) | bp | ||||
Restructuring and realignment costs | 82 | 48 | 70.8 | % | |||||||
Special charges | 159 | 12 | 1,225.0 | % | |||||||
Adjusted operating income | $ | 727 | $ | 714 | 1.8 | % | |||||
Adjusted operating margin | 13.9 | % | 13.7 | % | 20 | bp | |||||
NM Not Meaningful
39
Water Infrastructure
Operating income for our Water Infrastructure segment increased $6 million, or 1.7%, during 2019 as compared to the prior year, with operating margin also increasing from 16.5% to 16.8%. Operating margin was negatively impacted year-over-year by increased restructuring and realignment costs of $11 million and positively impacted by special charges of $2 million incurred in 2018 that did not recur in 2019. Excluding these items, adjusted operating income increased $15 million, or 3.9%, with adjusted operating margin increasing from 17.5% to 18.2%. The increase in adjusted operating margin was primarily due to cost reductions from our global procurement and productivity initiatives, price realization and favorable volume, which were partially offset by cost inflation, unfavorable mix, increased cost of quality and increased spending on strategic investments.
Applied Water
Operating income for our Applied Water segment increased $5 million, or 2.1%, during 2019 as compared to the prior year, with operating margin also increasing from 15.4% to 15.6%. Operating margin was negatively impacted by increased restructuring and realignment costs of $3 million in 2019. Excluding these restructuring and realignment costs, adjusted operating income increased $8 million, or 3.3%, with adjusted operating margin increasing from 16.0% to 16.5%. The increase in adjusted operating margin was primarily due to cost reductions from our global procurement and productivity initiatives and price realization, which were partially offset by cost inflation, including tariffs, increased cost of quality, unfavorable mix, unfavorable volume and increased spending on strategic investments.
Measurement & Control Solutions
Operating income for our Measurement & Control Solutions segment decreased $185 million, or 156.8%, during 2019 as compared to the prior year, with operating margin also decreasing from 7.9% to (4.4)%. Operating margin was negatively impacted by increased special charges of $154 million, consisting entirely of non-cash impairment charges, and increased restructuring and realignment costs of $20 million during the year. Excluding these items, adjusted operating income decreased $11 million, or 7.8%, with adjusted operating margin decreasing from 9.4% to 8.5%. The decrease in adjusted operating margin was primarily due to cost inflation, increased spending on strategic investments and unfavorable mix impacts. Purchase accounting impacts from acquisitions also negatively affected operating margin. These impacts were partially offset by cost reductions from our global procurement and productivity initiatives, favorable volume impacts and price realization.
Corporate and other
Operating loss for corporate and other decreased $6 million, or 10.2%, compared to the prior year, primarily due to $5 million of special charges incurred during 2018 that did not recur. Excluding these costs, adjusted operating expense decreased $1 million, or 1.9%, compared to the prior year.
Interest Expense
Interest expense was $67 million and $82 million for 2019 and 2018, respectively. The decrease in interest expense for the year is primarily driven by the impact of cross currency swaps during the year and, to a lesser extent, additional interest expense that was incurred during 2018 related to debt to fund our acquisition of Pure Technologies Ltd., which was repaid during 2019. See Note 13, "Derivative Financial Instruments" of our consolidated financial statements for a description of our cross currency swaps. See Note 15, "Credit Facilities and Debt" of our consolidated financial statements for a description of our credit facilities and long-term debt and related interest.
Income Tax Expense
The income tax provision for 2019 was $15 million at an effective tax rate of 3.7% as compared to $36 million at an effective tax rate of 6.1% in 2018. The 2019 effective tax rate differs from that of 2018 primarily due to the income tax benefit that resulted from changes in tax law in Switzerland partially offset by the tax impact of the goodwill impairment charge on income before taxes in 2019.
40
Other Comprehensive (Loss) Income
Other comprehensive loss was $38 million in 2019 as compared to a loss of $111 million in 2018. Foreign currency translation contributed favorable impacts during the year of $113 million driven the strengthening of the British Pound, the Canadian Dollar and the South African Rand as compared to the U.S. Dollar in 2019 versus the weakening of these currencies in the prior year. Additionally, the weakening of the Euro, Chinese Yuan and the Australian Dollar as compared to the U.S. Dollar was less negative in 2019 than the weakening of these currencies in the prior year. These favorable currency translation impacts were partially offset by the movement in our Euro net investment hedges during the quarter. The tax impact on the foreign currency translation related to the Euro net investment hedges also contributed to the net favorable foreign currency translation movement during the year. Partially offsetting these favorable drivers was the increased loss in postretirement benefit plans during the year, primarily actuarial losses.
Liquidity and Capital Resources
The following table summarizes our sources and uses of cash:
Year Ended December 31, | |||||||||||
(in millions) | 2019 | 2018 | Change | ||||||||
Operating activities | $ | 839 | $ | 586 | $ | 253 | |||||
Investing activities | (231 | ) | (643 | ) | 412 | ||||||
Financing activities | (177 | ) | (40 | ) | (137 | ) | |||||
Foreign exchange (a) | (3 | ) | (21 | ) | 18 | ||||||
Total | $ | 428 | $ | (118 | ) | $ | 546 | ||||
(a) | 2019 impact is primarily due to the strengthening of the Chinese Yuan, the Canadian Dollar, the Indian Rupee, the South African Rand, the Russian Ruble and various other currencies against the U.S. Dollar. |
Sources and Uses of Liquidity
Operating Activities
During 2019, net cash provided by operating activities was $839 million, compared to $586 million in 2018. The $253 million year-over-year increase was primarily driven by improvement in working capital levels due to the improved management of inventory and collection of receivables, increase in cash from earnings and decreased payments for post-retirement obligations during the period, which were partially offset by an increase in cash tax payments.
Investing Activities
Cash used in investing activities was $231 million in 2019, compared to $643 million in 2018. This decrease in cash used of $412 million was mainly driven by the $433 million spent on 2018 acquisitions, primarily the acquisition of Pure Technologies Ltd., versus the $18 million spent for acquisition activity during the current year and modestly lower spending on capital expenditures compared to the prior year. This decrease is partially offset by $22 million of proceeds received for a divested business in 2018.
Financing Activities
Cash used by financing activities was $177 million in 2019, compared to $40 million in 2018. The increase in cash used during the year was primarily due to higher levels of short-term debt related to acquisition financing in 2018 and an increase in dividends paid of $22 million during the period as compared to the prior year. These drivers are partially offset by the higher net repayment of $120 million of long-term debt in the prior year and a decrease in share repurchase activity of $19 million as compared to the prior year.
Funding and Liquidity Strategy
Our ability to fund our capital needs depends on our ongoing ability to generate cash from operations and access to bank financing and the capital markets. Historically, we have generated operating cash flow sufficient to fund our primary cash needs centered on operating activities, working capital, capital expenditures, strategic investments and dividends. If our cash flows from operations are less than we expect, we may need to incur debt or issue equity. From time to time, we may need to access the long-term and short-term capital markets to obtain financing. Our access to, and the availability of, financing on acceptable terms and conditions in the future will be impacted by many factors, including: (i) our credit ratings or absence of a credit rating, (ii) the liquidity of the overall capital
41
markets, and (iii) the current state of the economy. There can be no assurance that such financing will be available to us on acceptable terms or that such financing will be available at all.
We monitor our global funding requirements and seek to meet our liquidity needs on a cost effective basis. Based on our current global cash positions, cash flows from operations and access to the commercial paper markets, we believe there is sufficient liquidity to meet our funding requirements. In addition, our existing committed credit facilities and access to the public debt markets would provide further liquidity if required.
We anticipate that our present sources of funds, including funds from operations and additional borrowings, will provide us with sufficient liquidity and capital resources to meet our liquidity and capital needs in both the United States and outside of the United States over the next twelve months.
Credit Facilities & Long-Term Contractual Commitments
See Note 15, "Credit Facilities and Debt" of our consolidated financial statements for a description of our credit facilities and long-term debt.
Non-U.S. Operations
For 2019 and 2018, we generated 51% and 53% of our revenue from non-U.S. operations, respectively. As we continue to grow our operations in the emerging markets and elsewhere outside of the United States, we expect to continue to generate significant revenue from non-U.S. operations and expect that a substantial portion of our cash will be predominately held by our foreign subsidiaries. We expect to manage our worldwide cash requirements considering available funds among the many subsidiaries through which we conduct business and the cost effectiveness with which those funds can be accessed. We may transfer cash from certain international subsidiaries to the U.S. and other international subsidiaries when we believe it is cost effective to do so. We continually review our domestic and foreign cash profile, expected future cash generation and investment opportunities and reassess whether there is a need to repatriate funds held internationally to support our U.S. operations. As of December 31, 2019, we have provided a deferred tax liability of $9 million for net foreign withholding taxes and state income taxes on $505 million of earnings expected to be repatriated to the U.S. parent in the future.
Contractual Obligations
The following table summarizes our contractual commitments as of December 31, 2019:
(in millions) | 2020 | 2021 - 2022 | 2023 - 2024 | Thereafter | Total | ||||||||||||||
Debt obligations (1) | $ | 276 | $ | 600 | $ | 557 | $ | 900 | $ | 2,333 | |||||||||
Interest payments (1) (2) | 76 | 122 | 80 | 418 | 696 | ||||||||||||||
Lease obligations (3) | 65 | 87 | 50 | 62 | 264 | ||||||||||||||
Purchase obligations (4) | 95 | 7 | — | — | 102 | ||||||||||||||
Other long-term obligations reflected on the balance sheet | 1 | 23 | 23 | 8 | 55 | ||||||||||||||
Total commitments | $ | 513 | $ | 839 | $ | 710 | $ | 1,388 | $ | 3,450 | |||||||||
In addition to the amounts presented in the table above, we have recorded liabilities for net investment hedges of $24 million and employee severance indemnities of $16 million. These amounts have been excluded from the contractual obligations table due to an inability to reasonably estimate the timing or amounts of such payments in individual years. Further, benefit payments which reflect expected future service related to the Company's pension and other postretirement employee benefit obligations are presented in Note 16, “Postretirement Benefit Plans” of the consolidated financial statements and deferred income tax liabilities and uncertain tax positions are presented in Note 7, "Income Taxes" of the consolidated financial statements, and as such, these obligations are not included in the above table. Finally, estimated environmental payments and workers' compensation and general liability reserves are excluded from the table above. We estimate, based on historical experience, that we will spend approximately $2 million to $3 million per year on environmental investigation and remediation and approximately $5 million to $6 million per year on workers' compensation and general liability. At December 31, 2019, we had estimated and accrued $3 million and $20 million related to environmental matters, and workers' compensation and general liability, respectively.
(1) | Refer to Note 15, “Credit Facilities and Debt,” of the consolidated financial statements for discussion of the use and availability of debt and revolving credit agreements. Amounts represent principal payments of short-term and long-term debt including current maturities and exclude unamortized discounts. |
(2) | Amounts represent estimates of future interest payments on short-term and long-term debt outstanding as of December 31, 2019. |
(3) | Refer to Note 11, "Leases" of the consolidated financial statements for further lease discussion. |
42
(4) | Represents unconditional purchase agreements that are enforceable and legally binding and that specify all significant terms to purchase goods or services, including fixed or minimum quantities to be purchased; fixed, minimum or variable price provisions; and the approximate timing of the transaction. Purchase agreements that are able to cancel without penalty have been excluded. |
Off-Balance Sheet Arrangements
As of December 31, 2019, we have issued guarantees for the debt and other obligations of consolidated subsidiaries in the normal course of business. We have determined that none of these arrangements has a material current effect or is reasonably likely to have a material future effect on our consolidated financial statements, financial condition, changes in financial condition, revenues or expenses, liquidity, capital expenditures or capital resources.
We obtain certain stand-by letters of credit, bank guarantees and surety bonds from third-party financial institutions in the ordinary course of business when required under contracts or to satisfy insurance related requirements. As of December 31, 2019, the amount of surety bonds, bank guarantees, stand-by letters of credit, and insurance letters of credit was $340 million.
Critical Accounting Estimates
The preparation of financial statements in conformity with GAAP requires management to make estimates and assumptions that affect the reported amounts of assets, liabilities, revenue and expenses, and the disclosure of contingent liabilities. Management bases its estimates on historical experience and on various other assumptions that it believes to be reasonable under the circumstances, the results of which form the basis for making judgments about the carrying values of assets and liabilities that are not readily apparent from other sources.
Significant accounting policies used in the preparation of the Consolidated Financial Statements are discussed in Note 1, “Summary of Significant Accounting Policies,” of the consolidated financial statements. Accounting estimates and assumptions discussed in this section are those that we consider most critical to an understanding of our financial statements because they are inherently uncertain, involve significant judgments, include areas where different estimates reasonably could have been used, and changes in the estimate that are reasonably possible could materially impact the financial statements. Management believes that the accounting estimates employed and the resulting balances are reasonable; however, actual results in these areas could differ from management’s estimates under different assumptions or conditions.
Revenue Recognition. Xylem adopted the new guidance on recognizing revenue from contracts with customers as of January 1, 2018. In accordance with this new guidance Xylem recognizes revenue in a manner that depicts the transfer of promised goods and services to customers in an amount that reflects the consideration to which it expects to be entitled to for providing those goods and services. For each arrangement with a customer, we identify the contract, the associated performance obligations within the contract, determine the transaction price of that contract, allocate the transaction price to each performance obligation and recognize revenue as each performance obligation is satisfied.
The satisfaction of performance obligations in a contract is based upon when the customer obtains control over the asset. Depending on the nature of the performance obligation, control transfers either at a particular point in time, or over time which determines the recognition pattern of revenue.
For product sales, other than long-term construction-type contracts, we recognize revenue once control has passed at a point in time, which is generally when products are shipped. In instances where contractual terms include a provision for customer acceptance, revenue is recognized when either (i) we have previously demonstrated that the product meets the specified criteria based on either seller or customer specified objective criteria or (ii) upon formal acceptance received from the customer where the product has not been previously demonstrated to meet customer specified objective criteria. We recognize revenue on product sales to channel partners, including resellers, distributors or value-added solution providers at the point in time when the risks and rewards, possession, and title have transferred to the customer, which usually occurs at the point of delivery.
Revenue from performance obligations related to services is recognized over time, as the performance obligations are satisfied. In these instances, the customer consumes the benefit of the service as Xylem performs.
Certain businesses also enter into long-term construction-type sales contracts where revenue is recognized over time. In these instances, revenue is recognized using a measure of progress that applies an input method based on costs incurred in relation to total estimated costs. We also recognize revenue for certain of these arrangements using the output method and measure progress based on shipments of product where control has transferred to the customer.
43
For all contracts with customers, we determine the transaction price in the arrangement and allocate the transaction price to each performance obligation identified in the contract. Judgment is required to determine the appropriate unit of account, and we separate out the performance obligations if they are capable of being distinct and if they are distinct within the context of the contract. The transaction price is adjusted for our estimate of variable consideration which may include a right of return, discounts, rebates, penalties and retainage. To estimate variable consideration, we apply the expected value or the most likely amount method, based on whichever method most appropriately predicts the amount of consideration we expect to be entitled to. The method applied is typically based on historical experience and known trends. We constrain the amounts of variable consideration that are included in the transaction price, to the extent that it is probable that a significant reversal in the amount of cumulative revenue recognized will not occur or when uncertainties around the variable consideration are resolved.
The adoption of the new revenue guidance did not provide materially different results from historical revenue guidance.
Income Taxes. Deferred tax assets and liabilities are determined based on temporary differences between the financial reporting and tax bases of assets and liabilities, applying enacted tax rates in effect for the year in which we expect the differences will reverse. Based on the evaluation of available evidence, we recognize future tax benefits, such as net operating loss carryforwards, to the extent that we believe it is more likely than not we will realize these benefits. We periodically assess the likelihood that we will be able to recover our deferred tax assets and reflect any changes to our estimate of the amount we are more likely than not to realize in the valuation allowance, with a corresponding adjustment to earnings or other comprehensive income, as appropriate.
In assessing the need for a valuation allowance, we look to the future reversal of existing taxable temporary differences, taxable income in carryback years and the feasibility of tax planning strategies and estimated future taxable income. The valuation allowance can be affected by changes to tax laws, changes to statutory tax rates and changes to future taxable income estimates.
Due to the Tax Act, we have recorded net foreign withholding taxes and state income taxes on earnings that are expected to be repatriated to the U.S. parent. We have not recorded any deferred taxes on the amounts that the Company currently does not intend to repatriate as the determination of any deferred taxes on this amount is not practicable.
The calculation of our tax liabilities involves dealing with uncertainties in the application of complex tax regulations in a multitude of jurisdictions across our global operations. We recognize potential liabilities and record tax liabilities for anticipated tax audit issues in the U.S. and other tax jurisdictions based on our estimate of whether, and to the extent to which, additional taxes will be due. Furthermore, we recognize the tax benefit from an uncertain tax position only if it is more likely than not that the tax position will be sustained on examination by the taxing authorities or upon completion of the litigation process, based on the technical merits of the position. The tax benefits recognized in the financial statements from such a position are measured based on the largest benefit that has a greater than 50% likelihood of being realized upon ultimate resolution.
We adjust our liability for uncertain tax positions in light of changing facts and circumstances; however, due to the complexity of some of these uncertainties, the ultimate resolution may result in a payment that is materially different from our current estimate of the tax liabilities. If our estimate of tax liabilities proves to be less than the ultimate assessment, an additional tax expense would result. If a payment of these amounts ultimately proves to be less than the recorded amounts, the reversal of the liabilities would result in tax benefits being recognized in the period when we determine the liabilities are no longer necessary.
Business Combinations. We record acquisitions using the purchase method of accounting. All of the assets acquired, liabilities assumed, contractual contingencies and contingent consideration is recorded at fair value as of the acquisition date. The excess of the purchase price over the estimated fair values of the net tangible and intangible assets acquired is recorded as goodwill. The application of the purchase method of accounting for business combinations requires management to make significant estimates and assumptions in the determination of the fair value of assets acquired and liabilities assumed, in order to properly allocate purchase price consideration between assets that are depreciated and amortized from goodwill. These assumptions and estimates include a market participant’s use of the asset and the appropriate discount rates for a market participant. Our estimates are based on historical experience, information obtained from the management of the acquired companies and, when appropriate, includes assistance from independent third-party appraisal firms. Significant assumptions and estimates include, but are not limited to, the cash flows that an asset is expected to generate in the future, the cost to build/recreate certain technology, the appropriate weighted-average cost of capital, and the cost savings expected to be derived from acquiring an asset. These estimates are inherently uncertain and
44
unpredictable. In addition, unanticipated events and circumstances may occur which may affect the accuracy or validity of such estimates.
Goodwill and Intangible Assets. We review goodwill and indefinite-lived intangible assets for impairment annually and whenever events or changes in circumstances indicate the carrying value of an asset may not be recoverable. We also review the carrying value of our finite-lived intangible assets for potential impairment when impairment indicators arise. We conduct our annual impairment test as of the first day of the fourth quarter. For goodwill, the estimated fair value of each reporting unit is compared to the carrying value of the net assets assigned to that reporting unit. If the estimated fair value of the reporting unit exceeds its carrying value, goodwill is not impaired. If the carrying value of the reporting unit exceeds its estimated fair value, then an impairment charge is recognized for that excess up to the amount of recorded goodwill. We estimate the fair value of our reporting units using an income approach. We estimate the fair value of our intangible assets with indefinite lives using either the income approach or the market approach. Under the income approach, we calculate fair value based on the present value of estimated future cash flows. Under the market approach, we calculate fair value based on recent sales and selling prices of similar assets.
Determining the fair value of a reporting unit or an indefinite-lived intangible asset is judgmental in nature and involves the use of significant estimates and assumptions, particularly related to future operating results and cash flows. These estimates and assumptions include, but are not limited to, revenue growth rates and operating margins used to calculate projected future cash flows, risk-adjusted discount rates, assumed royalty rates, future economic and market conditions and identification of appropriate market comparable data. In addition, the identification of reporting units and the allocation of assets and liabilities to the reporting units when determining the carrying value of each reporting unit also require judgment. Goodwill is tested for impairment at either the operating segment identified in Note 22, “Segment and Geographic Data,” of the consolidated financial statements, or one level below. The fair value of our reporting units and indefinite-lived intangible assets is based on estimates and assumptions that are believed to be reasonable. Significant changes to these estimates and assumptions could adversely impact our conclusions. Actual future results may differ from those estimates.
In the third quarter of 2019, the Company revised its forecasted future cash flows for the AIA business. Factors that contributed to the revised forecast in the third quarter include lower than expected results as compared to prior forecasts, largely as a result of slower-than-expected conversion of pipeline opportunities to revenue. Additionally, we have continued to invest in the AIA platform ahead of the adoption curve, which has also impacted the near term profitability of the business. Based on these factors we determined that there were indicators that the AIA reporting unit’s goodwill may be impaired, and accordingly, we performed an interim goodwill impairment test as of July 1, 2019. The results of the impairment test showed that the fair value of the AIA reporting unit was lower than the carrying value, resulting in a $148 million goodwill impairment charge. As of December 31, 2019 the remaining goodwill balance in our AIA reporting unit after recording the goodwill impairment charge was $171 million.
Also, during the third quarter of 2019, due to the factors discussed above, we assessed whether the carrying amounts of the AIA reporting unit’s long-lived assets may not be recoverable and therefore impaired. Our assessment resulted in an impairment charge of $7 million, related to customer relationships, proprietary technology, software and property, plant and equipment. The charge was calculated using an income approach.
If we do not achieve our forecasts, given that the fair value and the carrying value of the AIA reporting unit were the same at July 1, 2019, it is possible that the goodwill of the AIA reporting unit could be deemed to be impaired in a future period.
During the fourth quarter of 2019, we performed our annual impairment assessment and determined that the estimated fair values of our goodwill reporting units were substantially in excess of each of their carrying values. However, future goodwill impairment tests could result in a charge to earnings. We will continue to evaluate goodwill on an annual basis as of the beginning of our fourth quarter and whenever events and changes in circumstances require us to do so. We determined that no impairment of the indefinite-lived intangibles existed as of the measurement date in 2019. However, future indefinite-lived intangible impairment tests could result in a charge to earnings. We will continue to evaluate indefinite-lived intangibles on an annual basis as of the beginning of our fourth quarter and whenever events and changes in circumstances indicate there may be a potential impairment.
Postretirement Plans. Company employees around the world participate in numerous defined benefit plans. The determination of projected benefit obligations and the recognition of expenses related to these plans are dependent on various assumptions. These major assumptions primarily relate to discount rates, expected long-term rates of return on plan assets, rate of future compensation increases, mortality, health care inflation and years of service (some of which are disclosed in Note 16, “Postretirement Benefit Plans,” of the consolidated financial statements) and other factors. Actual results that differ from our assumptions are accumulated and amortized on a straight-line
45
basis only to the extent they exceed 10% of the higher of the market-related value or projected benefit obligation, over the average remaining service period of active plan participants, or for plans with all or substantially all inactive participants, over the average remaining life expectancy.
Significant Assumptions
Management develops each assumption using relevant Company experience, in conjunction with market-related data for each individual country in which such plans exist. All assumptions are reviewed annually with third-party consultants and adjusted as necessary. The table included below provides the weighted average assumptions used to estimate our defined benefit pension obligations and costs as of and for the years ended 2019 and 2018.
2019 | 2018 | ||||||||||
U.S. | Int’l | U.S. | Int’l | ||||||||
Benefit Obligation Assumptions | |||||||||||
Discount rate | 3.25 | % | 1.80 | % | 4.50 | % | 2.60 | % | |||
Rate of future compensation increase | NM | 2.94 | % | NM | 2.92 | % | |||||
Net Periodic Benefit Cost Assumptions | |||||||||||
Discount rate | 4.50 | % | 2.60 | % | 3.75 | % | 2.43 | % | |||
Expected long-term return on plan assets | 7.75 | % | 6.96 | % | 8.00 | % | 7.23 | % | |||
Rate of future compensation increase | NM | 2.92 | % | NM | 2.93 | % | |||||
NM | Not meaningful. The pension benefits for future service for all the U.S. pension plans are based on years of service and not impacted by future compensation increases. |
We determine the expected long-term rate of return on plan assets by evaluating both historical returns and estimates of future returns. Specifically, the Company analyzes the estimated future returns based on independent estimates of asset class returns and evaluates historical broad market returns over long-term timeframes based on the strategic asset allocation, which is detailed in Note 16, “Postretirement Benefit Plans,” of the consolidated financial statements.
Based on the approach described above, the chart below shows weighted average actual returns versus the weighted average expected long-term rates of return for our pension plans that were utilized in the calculation of the net periodic pension cost for each respective year.
2019 | 2018 | ||||
Expected long-term rate of return on plan assets | 7.09 | % | 7.34 | % | |
Actual rate of return on plan assets | 12.59 | % | (3.85 | )% | |
For the recognition of net periodic pension cost, the calculation of the expected return on plan assets is generally derived by applying the expected long-term rate of return to the market-related value of plan assets. The market-related value of plan assets is based on average asset values at the measurement date over the last five years. The use of fair value, rather than a calculated value, could materially affect net periodic pension cost. The weighted average expected long-term rate of return for all of our plan assets to be used in determining net periodic benefit costs for 2020 is estimated at 3.46%. We estimate that every 25 basis point change in the expected return on plan assets impacts the expense by $1 million.
The discount rate reflects our expectation of the present value of expected future cash payments for benefits at the measurement date. A decrease in the discount rate increases the present value of benefit obligations and increases pension expense. We base the discount rate assumption on current investment yields of high-quality fixed income investments during the retirement benefits maturity period. The pension discount rate was determined by considering an interest rate yield curve comprising AAA/AA bonds, with maturities between zero and 30 years, developed by the plan’s actuaries. Annual benefit payments are then discounted to present value using this yield curve to develop a single-point discount rate matching the plan’s characteristics. Our weighted average discount rate for all pension plans effective January 1, 2020, is 1.97%. We estimate that every 25 basis point change in the discount rate impacts the expense by $1 million.
The rate of future compensation increase assumption reflects our long-term actual experience and future and near-term outlook. Effective January 1, 2020, our expected rate of future compensation is 3.04% for all pension plans. The estimated impact of a 25 basis point change in the expected rate of future compensation is less than $1 million.
The assumed rate of future increases in the per capita cost of health care (the health care trend rate) is 6.53% for 2020, decreasing ratably to 4.50% in 2028. An increase or decrease in the health care trend rates by one percent
46
per year would impact the aggregate annual service and interest components by less than $1 million, and impact the benefit obligation by approximately $3 million.
We currently anticipate making contributions to our pension and postretirement benefit plans in the range of $15 million to $25 million during 2020, of which $5 million is expected to be made in the first quarter.
Funded Status
Funded status is derived by subtracting the respective year-end values of the projected benefit obligations from the fair value of plan assets. We estimate that every 25 basis point change in the discount rate impacts the funded status by approximately $33 million.
Fair Value of Plan Assets
The plan assets of our pension plans comprise a broad range of investments, including domestic and foreign equity securities, interests in private equity and hedge funds, fixed income investments, insurance contracts, and cash and cash equivalents.
A portion of our pension benefit plan assets portfolio comprises investments in private equity and hedge funds. The private equity and hedge fund investments are generally measured at net asset value. However, in certain instances, the values reported by the asset managers were not current at the measurement date. Accordingly, we made estimate adjustments to the last reported value where necessary to measure the assets at fair value at the measurement date. These adjustments consider information received from the asset managers, as well as general market information. The adjustment recorded at December 31, 2019 and 2018 for these assets represented less than one percent of total plan assets in each respective year. Asset values for other positions were generally measured using market observable prices. We estimate that a 5% change in asset values will impact funded status by approximately $28 million.
New Accounting Pronouncements
See Note 2, “Recently Issued Accounting Pronouncements,” of the consolidated financial statements for a complete discussion of recent accounting pronouncements.
47
ITEM 7A. QUANTITATIVE AND QUALITATIVE DISCLOSURES ABOUT MARKET RISK
We are exposed to market risk, primarily related to foreign currency exchange rates and interest rates. These exposures are actively monitored by management. Our exposure to foreign exchange rate risk is due to certain costs, revenue and borrowings being denominated in currencies other than one of our subsidiaries' functional currency. Similarly, we are exposed to market risk as the result of changes in interest rates which may affect the cost of our financing. It is our policy and practice to use derivative financial instruments only to the extent necessary to manage exposures.
Foreign Currency Exchange Rate Risk
We conduct approximately 51% of our business in various locations outside the United States.
Our economic foreign currency risk primarily relates to receipts from customers, payments to suppliers and intercompany transactions denominated in foreign currencies. We may use derivative financial instruments to offset risk related to receipts from customers and payments to suppliers, when it is believed that the exposure will not be limited by our normal operating and financing activities. We enter into currency forward contracts periodically in order to manage the exchange rate fluctuation risk on certain intercompany transactions associated with third-party sales and purchases. These risks are also mitigated by natural hedges including the presence of manufacturing facilities outside the United States, global sourcing and other spending which occurs in foreign countries. Our principal foreign currency transaction exposures primarily relate to the Euro, Swedish Krona, Polish Zloty, Canadian Dollar, British Pound, and Australian Dollar. We estimate that a hypothetical 10% movement in foreign currency exchange rates would not have a material economic impact to Xylem’s financial position and results of operations.
Additionally, we are subject to foreign exchange translation risk due to changes in the value of foreign currencies in relation to our reporting currency, the U.S. Dollar. The translation risk is primarily concentrated in the exchange rate between the U.S. Dollar and the Euro, Chinese Yuan, British Pound, Canadian Dollar, Swedish Krona and Australian Dollar. As the U.S. Dollar strengthens against other currencies in which we transact business, revenue and income will generally be negatively impacted, and if the U.S. Dollar weakens, revenue and income will generally be positively impacted. We expect to continue to generate significant revenue from non-U.S. operations and we expect our cash will be predominately held by our foreign subsidiaries. We expect to manage our worldwide cash requirements considering available funds among the many subsidiaries through which we conduct business and the cost effectiveness with which those funds can be accessed. We may transfer cash from certain international subsidiaries to the U.S. and other international subsidiaries when it is cost effective to do so, though we continually review our domestic and foreign cash profile, expected future cash generation and investment opportunities and reassess whether there is a need to repatriate funds held internationally to support our U.S. operations. We also hedge our investment in certain foreign subsidiaries via the use of cross currency swaps and the designation of our 2.25% Senior Notes of €500 million aggregate principal amount due March 2023 as a net investment hedge. Accordingly, we estimate that a 10% movement of the U.S. Dollar to various foreign currency exchange rates we translate from, in aggregate would not have a material economic impact on our financial position and results of operations.
Effective July 1, 2018, Argentina was determined to be a highly inflationary economy, and as such we evaluated the impact of revaluing our monetary assets and liabilities under the applicable guidance and do not expect it to have a material impact.
Interest Rate Risk
As of December 31, 2019, our long-term debt portfolio is primarily comprised of four series of fixed-rate senior notes that total $2.1 billion. The senior notes are not exposed to interest rate risk as the bonds are at a fixed rate until maturity. Based on the current interest rate market we do not anticipate material risk associated with our debt refinancing within the target time frame of maturity.
Commodity Price Exposures
For a discussion of risks relating to commodity prices, refer to “Item 1A. Risk Factors.”
48
ITEM 8. FINANCIAL STATEMENTS AND SUPPLEMENTARY DATA
INDEX TO CONSOLIDATED FINANCIAL STATEMENTS
Page No. | |
Audited Consolidated Financial Statements: | |
Notes to Consolidated Financial Statements: | |
49
REPORT OF INDEPENDENT REGISTERED PUBLIC ACCOUNTING FIRM
To the Stockholders and the Board of Directors of
Xylem Inc.
Rye Brook, New York
Opinion on the Financial Statements
We have audited the accompanying consolidated balance sheets of Xylem Inc. and subsidiaries (the "Company") as of December 31, 2019 and 2018, the related consolidated statements of income, comprehensive income, stockholders’ equity, and cash flows, for each of the three years in the period ended December 31, 2019, and the related notes (collectively referred to as the "financial statements"). In our opinion, the financial statements present fairly, in all material respects, the financial position of the Company as of December 31, 2019 and 2018, and the results of its operations and its cash flows for each of the three years in the period ended December 31, 2019, in conformity with accounting principles generally accepted in the United States of America.
We have also audited, in accordance with the standards of the Public Company Accounting Oversight Board (United States) (PCAOB), the Company's internal control over financial reporting as of December 31, 2019, based on criteria established in Internal Control - Integrated Framework (2013) issued by the Committee of Sponsoring Organizations of the Treadway Commission and our report dated February 28, 2020, expressed an unqualified opinion on the Company's internal control over financial reporting.
Basis for Opinion
These financial statements are the responsibility of the Company's management. Our responsibility is to express an opinion on the Company's financial statements based on our audits. We are a public accounting firm registered with the PCAOB and are required to be independent with respect to the Company in accordance with the U.S. federal securities laws and the applicable rules and regulations of the Securities and Exchange Commission and the PCAOB.
We conducted our audits in accordance with the standards of the PCAOB. Those standards require that we plan and perform the audit to obtain reasonable assurance about whether the financial statements are free of material misstatement, whether due to error or fraud. Our audits included performing procedures to assess the risks of material misstatement of the financial statements, whether due to error or fraud, and performing procedures that respond to those risks. Such procedures included examining, on a test basis, evidence regarding the amounts and disclosures in the financial statements. Our audits also included evaluating the accounting principles used and significant estimates made by management, as well as evaluating the overall presentation of the financial statements. We believe that our audits provide a reasonable basis for our opinion.
Critical Audit Matter
The critical audit matter communicated below is a matter arising from the current-period audit of the financial statements that was communicated or required to be communicated to the audit committee and that (1) relates to accounts or disclosures that are material to the financial statements and (2) involved our especially challenging, subjective, or complex judgments. The communication of critical audit matters does not alter in any way our opinion on the financial statements, taken as a whole, and we are not, by communicating the critical audit matter below, providing a separate opinion on the critical audit matter or on the accounts or disclosures to which it relates.
Goodwill - Advanced Infrastructure Analytics Reporting Unit - Refer to Note 12 to the financial statements
Critical Audit Matter Description
During the third quarter of 2019, the Company recorded a goodwill impairment charge of $148 million related to the Advanced Infrastructure Analytics (“AIA”) reporting unit. The impairment resulted from a downward revision of forecasted future cash flows. The Company’s measurement of the goodwill impairment resulted from the comparison of the fair value of the AIA reporting unit to its carrying value.
To determine the fair value of the AIA reporting unit, the Company used the income approach. Under the income approach, the fair value of the AIA reporting unit was based on the discounted value of the estimated cash flows that the reporting unit is expected to generate. Cash flow projections were based on management’s estimates of
50
revenue growth rates and operating margins, taking into consideration industry and market conditions. The discount rate was based on the weighted average cost of capital for the AIA reporting unit.
Given the significant judgments made by management to estimate the fair value of AIA, performing audit procedures to evaluate the reasonableness of management’s estimates and assumptions related to the selection of the discount rate, and forecasts of future revenue required a high degree of auditor judgment and an increased extent of effort, including the need to involve our fair value specialists
How the Critical Audit Matter Was Addressed in the Audit
Our audit procedures related to forecasts of future revenue and operating margin and selection of the discount rate for AIA included the following, among others:
• | We tested the effectiveness of controls over management’s goodwill impairment evaluation, including those over the determination of the fair value of the AIA reporting unit and the measurement of the goodwill impairment, such as controls related to management’s forecasts of future revenue, and the selection of the discount rate. |
• | We evaluated the reasonableness of management’s revenue forecasts by comparing the forecasts to: |
– | Historical revenues. |
– | Internal communications to management and the Board of Directors. |
– | Information included in industry reports and certain peer company data. |
• | We also evaluated the reasonableness of management’s revenue forecasts by comparing the actual growth in sales orders received to management’s forecasted growth in sales and we tested the existence, accuracy and completeness of the underlying sales orders. |
• | With the assistance of our fair value specialists, we evaluated the reasonableness of the (1) valuation methodology, (2) discount rate, and (3) long-term revenue growth rate, including testing the source information underlying the determination of the discount rate and long-term revenue growth rate, testing the mathematical accuracy of the calculation, and developing a range of independent estimates and comparing those to the discount rate and long-term revenue growth rate selected by management. |
• | Our fair value specialists also assisted in evaluating the reasonableness of the AIA fair value by considering comparable revenue valuation multiples of peer companies. |
• | We evaluated developments in AIA’s business from the third quarter of 2019, the period in which the impairment charge was recorded, through December 31, 2019 to determine if events or circumstances have occurred that would more likely than not further reduce the fair value of the business. |
/s/ Deloitte & Touche LLP
Stamford, Connecticut
February 28, 2020
We have served as the Company's auditor since 2010.
51
XYLEM INC. AND SUBSIDIARIES
CONSOLIDATED INCOME STATEMENTS
(In Millions, except per share data)
Year Ended December 31, | 2019 | 2018 | 2017 | ||||||||
Revenue | $ | $ | $ | ||||||||
Cost of revenue | |||||||||||
Gross profit | |||||||||||
Selling, general and administrative expenses | |||||||||||
Research and development expenses | |||||||||||
Restructuring and asset impairment charges | |||||||||||
Goodwill impairment charge | |||||||||||
Operating income | |||||||||||
Interest expense | |||||||||||
Other non-operating (expense) income, net | ( | ) | |||||||||
Gain (loss) on sale of businesses | ( | ) | |||||||||
Income before taxes | |||||||||||
Income tax expense | |||||||||||
Net income | |||||||||||
Less: Net loss attributable to non-controlling interests | ( | ) | |||||||||
Net income attributable to Xylem | $ | $ | $ | ||||||||
Earnings per share: | |||||||||||
Basic | $ | $ | $ | ||||||||
Diluted | $ | $ | $ | ||||||||
Weighted average number of shares: | |||||||||||
Basic | |||||||||||
Diluted | |||||||||||
See accompanying notes to consolidated financial statements.
52
XYLEM INC. AND SUBSIDIARIES
CONSOLIDATED STATEMENTS OF COMPREHENSIVE INCOME
(In Millions)
Year Ended December 31, | 2019 | 2018 | 2017 | ||||||||
Net income | $ | $ | $ | ||||||||
Other comprehensive (loss) income, before tax: | |||||||||||
Foreign currency translation adjustment | ( | ) | |||||||||
Net change in derivative hedge agreements: | |||||||||||
Unrealized (loss) gain | ( | ) | ( | ) | |||||||
Amount of loss (gain) reclassified into net income | ( | ) | |||||||||
Net change in postretirement benefit plans: | |||||||||||
Net loss | ( | ) | ( | ) | ( | ) | |||||
Prior service credit | |||||||||||
Amortization of prior service credit cost | ( | ) | ( | ) | ( | ) | |||||
Amortization of net actuarial loss into net income | |||||||||||
Settlement | |||||||||||
Foreign currency translation adjustment | ( | ) | ( | ) | |||||||
Other comprehensive (loss) income, before tax | ( | ) | ( | ) | |||||||
Income tax (benefit) expense related to other comprehensive loss | ( | ) | ( | ) | |||||||
Other comprehensive (loss) income, net of tax | ( | ) | ( | ) | |||||||
Comprehensive income | $ | $ | $ | ||||||||
Less: comprehensive gain (loss) attributable to noncontrolling interests | ( | ) | |||||||||
Comprehensive income attributable to Xylem | $ | $ | $ | ||||||||
See accompanying notes to consolidated financial statements.
53
XYLEM INC. AND SUBSIDIARIES
CONSOLIDATED BALANCE SHEETS
(In Millions, except per share amounts)
December 31, | 2019 | 2018 | |||||
ASSETS | |||||||
Current assets: | |||||||
Cash and cash equivalents | $ | $ | |||||
Receivables, less allowances for discounts, returns and doubtful accounts of $35 and $35 in 2019 and 2018, respectively | |||||||
Inventories | |||||||
Prepaid and other current assets | |||||||
Total current assets | |||||||
Property, plant and equipment, net | |||||||
Goodwill | |||||||
Other intangible assets, net | |||||||
Other non-current assets | |||||||
Total assets | $ | $ | |||||
LIABILITIES AND STOCKHOLDERS’ EQUITY | |||||||
Current liabilities: | |||||||
Accounts payable | $ | $ | |||||
Accrued and other current liabilities | |||||||
Short-term borrowings and current maturities of long-term debt | |||||||
Total current liabilities | |||||||
Long-term debt, net | |||||||
Accrued postretirement benefits | |||||||
Deferred income tax liabilities | |||||||
Other non-current accrued liabilities | |||||||
Total liabilities | |||||||
Commitment and Contingencies (Note 20) | |||||||
Stockholders’ equity: | |||||||
Common stock — par value $0.01 per share: | |||||||
Authorized 750.0 shares, issued 193.9 and 192.9 shares in 2019 and 2018, respectively | |||||||
Capital in excess of par value | |||||||
Retained earnings | |||||||
Treasury stock – at cost 13.7 shares and 13.2 shares in 2019 and 2018, respectively | ( | ) | ( | ) | |||
Accumulated other comprehensive loss | ( | ) | ( | ) | |||
Total stockholders’ equity | |||||||
Non-controlling interest | |||||||
Total equity | |||||||
Total liabilities and stockholders’ equity | $ | $ | |||||
See accompanying notes to consolidated financial statements.
54
XYLEM INC. AND SUBSIDIARIES
CONSOLIDATED STATEMENTS OF CASH FLOWS (In Millions)
Year Ended December 31, | 2019 | 2018 | 2017 | ||||||||
Operating Activities | |||||||||||
Net income | $ | $ | $ | ||||||||
Adjustments to reconcile net income to net cash provided by operating activities: | |||||||||||
Depreciation | |||||||||||
Amortization | |||||||||||
Deferred income taxes | ( | ) | ( | ) | ( | ) | |||||
Share-based compensation | |||||||||||
Restructuring and asset impairment charges | |||||||||||
Goodwill impairment charge | |||||||||||
(Gain)/loss from sale of businesses | ( | ) | |||||||||
Other, net | |||||||||||
Payments for restructuring | ( | ) | ( | ) | ( | ) | |||||
Contributions to postretirement benefit plans | ( | ) | ( | ) | ( | ) | |||||
Changes in assets and liabilities (net of acquisitions): | |||||||||||
Changes in receivables | ( | ) | ( | ) | ( | ) | |||||
Changes in inventories | ( | ) | |||||||||
Changes in accounts payable | |||||||||||
Changes in accrued liabilities | ( | ) | |||||||||
Changes in accrued taxes | ( | ) | |||||||||
Net changes in other assets and liabilities | ( | ) | |||||||||
Net Cash — Operating activities | |||||||||||
Investing Activities | |||||||||||
Capital expenditures | ( | ) | ( | ) | ( | ) | |||||
Proceeds from the sale of property, plant and equipment | |||||||||||
Acquisitions of businesses and assets, net of cash acquired | ( | ) | ( | ) | ( | ) | |||||
Proceeds from sale of businesses | |||||||||||
Cash received from investments | |||||||||||
Cash paid for investments | ( | ) | ( | ) | ( | ) | |||||
Cash received from cross currency swaps | |||||||||||
Other, net | |||||||||||
Net Cash — Investing activities | ( | ) | ( | ) | ( | ) | |||||
Financing Activities | |||||||||||
Short-term debt issued, net | |||||||||||
Short-term debt repaid, net | ( | ) | ( | ) | ( | ) | |||||
Long-term debt issued, net | |||||||||||
Long-term debt repaid, net | ( | ) | |||||||||
Repurchase of common stock | ( | ) | ( | ) | ( | ) | |||||
Proceeds from exercise of employee stock options | |||||||||||
Dividends paid | ( | ) | ( | ) | ( | ) | |||||
Other, net | ( | ) | |||||||||
Net Cash — Financing activities | ( | ) | ( | ) | ( | ) | |||||
Effect of exchange rate changes on cash | ( | ) | ( | ) | |||||||
Net change in cash and cash equivalents | ( | ) | |||||||||
Cash and cash equivalents at beginning of year | |||||||||||
Cash and cash equivalents at end of year | $ | $ | $ | ||||||||
Supplemental disclosure of cash flow information: | |||||||||||
Cash paid during the year for: | |||||||||||
Interest | $ | $ | $ | ||||||||
Income taxes (net of refunds received) | $ | $ | $ | ||||||||
See accompanying notes to consolidated financial statements.
55
XYLEM INC. AND SUBSIDIARIES
CONSOLIDATED STATEMENTS OF CHANGES IN STOCKHOLDERS’ EQUITY
(In Millions, except per share amounts)
Common Stock | Capital in Excess of Par Value | Retained Earnings | Accumulated Other Comprehensive Income (Loss) | Treasury Stock | Non-Controlling Interest | Total | |||||||||||||||||||||
Balance at December 31, 2016 | $ | $ | $ | $ | ( | ) | $ | ( | ) | $ | $ | ||||||||||||||||
Cumulative effect of change in accounting principle | ( | ) | ( | ) | |||||||||||||||||||||||
Net income | ( | ) | |||||||||||||||||||||||||
Other comprehensive income, net | |||||||||||||||||||||||||||
Dividends declared ($.72 per share) | ( | ) | ( | ) | |||||||||||||||||||||||
Stock incentive plan activity | ( | ) | |||||||||||||||||||||||||
Repurchase of common stock | ( | ) | ( | ) | |||||||||||||||||||||||
Balance at December 31, 2017 | $ | $ | $ | $ | ( | ) | $ | ( | ) | $ | $ | ||||||||||||||||
Cumulative effect of change in accounting principle | ( | ) | ( | ) | |||||||||||||||||||||||
Net income | |||||||||||||||||||||||||||
Other comprehensive loss, net | ( | ) | ( | ) | ( | ) | |||||||||||||||||||||
Dividends declared ($.84 per share) | ( | ) | ( | ) | |||||||||||||||||||||||
Stock incentive plan activity | ( | ) | |||||||||||||||||||||||||
Repurchase of common stock | ( | ) | ( | ) | |||||||||||||||||||||||
Balance at December 31, 2018 | $ | $ | $ | $ | ( | ) | $ | ( | ) | $ | $ | ||||||||||||||||
Sale of business | ( | ) | ( | ) | |||||||||||||||||||||||
Net income | |||||||||||||||||||||||||||
Other comprehensive loss, net | ( | ) | ( | ) | |||||||||||||||||||||||
Distribution to minority shareholders | ( | ) | ( | ) | |||||||||||||||||||||||
Dividends declared ($.96 per share) | ( | ) | ( | ) | |||||||||||||||||||||||
Stock incentive plan activity | ( | ) | |||||||||||||||||||||||||
Repurchase of common stock | ( | ) | ( | ) | |||||||||||||||||||||||
Balance at December 31, 2019 | $ | $ | $ | $ | ( | ) | $ | ( | ) | $ | $ | ||||||||||||||||
See accompanying notes to consolidated financial statements.
56
XYLEM INC. AND SUBSIDIARIES
NOTES TO CONSOLIDATED FINANCIAL STATEMENTS
Note 1. Summary of Significant Accounting Policies
Xylem Inc. (“Xylem” or the “Company”) is a leading equipment and service provider for water and wastewater applications with a broad portfolio of products and services addressing the full cycle of water, from collection, distribution and use to the return of water to the environment.
Xylem operates in three segments, Water Infrastructure, Applied Water and Measurement & Control Solutions. See Note 22, "Segment and Geographic Data" for further segment background information.
On October 31, 2011 (the "Distribution Date"), ITT Corporation (“ITT”) completed the Spin-off (the “Spin-off”) of Xylem, formerly ITT’s water equipment and services businesses. The Spin-off was completed pursuant to the Distribution Agreement, dated as of October 25, 2011 (the “Distribution Agreement”), among ITT (now ITT LLC), Exelis Inc., acquired by Harris Inc. on May 29, 2015, (“Exelis”) and Xylem. Xylem Inc. was incorporated in Indiana on May 4, 2011 in connection with the Spin-off.
Hereinafter, except as otherwise indicated or unless the context otherwise requires, “Xylem,” “we,” “us,” “our” and “the Company” refer to Xylem Inc. and its subsidiaries. References in the notes to the consolidated financial statements to “ITT” or “ former parent” refers to ITT Corporation (now ITT LLC) and its consolidated subsidiaries (other than Xylem Inc.).
Basis of Presentation
The consolidated financial statements reflect our financial position and results of operations in conformity with accounting principles generally accepted in the United States of America (“GAAP”). All intercompany transactions between our businesses have been eliminated.
Use of Estimates
The preparation of financial statements in conformity with GAAP requires management to make estimates and assumptions that affect the reported amounts of assets and liabilities, the disclosure of contingent assets and liabilities at the date of the financial statements, and the reported amounts of revenue and expenses during the reporting period. Estimates are revised as additional information becomes available. Estimates and assumptions are used for, but not limited to, postretirement obligations and assets, revenue recognition, income tax contingency accruals and valuation allowances, valuation of intangible assets, goodwill and indefinite lived intangible impairment testing and contingent liabilities. Actual results could differ from these estimates.
Consolidation Principles
We consolidate companies in which we have a controlling financial interest or when Xylem is considered the primary beneficiary of a variable interest entity. We account for investments in companies over which we have the ability to exercise significant influence but do not hold a controlling financial interest under the equity method, and we record our proportionate share of income or losses in the Consolidated Income Statements. Equity method investments are reviewed for impairment when events or circumstances indicate the investment may be other than temporarily impaired. This requires significant judgment, including an assessment of the investee’s financial condition, the possibility of subsequent rounds of financing, and the investee’s historical and projected results of operations. If the actual results of operations for the investee are significantly different from projections, we may incur future charges for the impairment of these investments.
Foreign Currency Translation
The national currencies of our foreign companies are generally the functional currencies. Balance sheet accounts are translated at the exchange rate in effect at the end of each period; income statement accounts are translated at the average rates of exchange prevailing during the period. Gains and losses on foreign currency translations are reflected in the cumulative translation adjustments component of stockholders’ equity. Net gains or losses from foreign currency transactions are reported currently in selling, general and administrative expenses.
Revenue Recognition
Xylem adopted the new guidance on recognizing revenue from contracts with customers as of January 1, 2018. In accordance with this new guidance Xylem recognizes revenue in a manner that depicts the transfer of promised goods and services to customers in an amount that reflects the consideration to which it expects to be entitled to for
57
providing those goods and services. For each arrangement with a customer, we identify the contract, the associated performance obligations within the contract, determine the transaction price of that contract, allocate the transaction price to each performance obligation and recognize revenue as each performance obligation is satisfied.
The satisfaction of performance obligations in a contract is based upon when the customer obtains control over the asset. Depending on the nature of the performance obligation, control transfers either at a particular point in time, or over time which determines the recognition pattern of revenue.
For product sales, other than long-term construction-type contracts, we recognize revenue once control has passed at a point in time, which is generally when products are shipped. In instances where contractual terms include a provision for customer acceptance, revenue is recognized when either (i) we have previously demonstrated that the product meets the specified criteria based on either seller or customer specified objective criteria or (ii) upon formal acceptance received from the customer where the product has not been previously demonstrated to meet customer specified objective criteria. We recognize revenue on product sales to channel partners, including resellers, distributors or value-added solution providers at the point in time when control is transferred which is determined based on when the risks and rewards, possession, and title have transferred to the customer, which usually occurs at the point of delivery.
Revenue from performance obligations related to services is recognized over time, as the performance obligations are satisfied. In these instances, the customer consumes the benefit of the service as Xylem performs.
Certain businesses also enter into long-term construction-type sales contracts where revenue is recognized over time. In these instances, revenue is recognized using a measure of progress that applies an input method based on costs incurred in relation to total estimated costs. We also recognize revenue for certain of these arrangements using the output method and measure progress based on shipments of product where control has transferred to the customer.
If shipping and handling activities are performed after a customer obtains control of a good, we account for the shipping and handling activities as activities to fulfill a promise to transfer a good. Shipping and handling related costs are accrued as revenue is recognized.
For all contracts with customers, we determine the transaction price in the arrangement and allocate the transaction price to each performance obligation identified in the contract. Judgment is required to determine the appropriate unit of account, and we separate out the performance obligations if they are capable of being distinct and if they are distinct within the context of the contract. We base our allocation of the transaction price to the performance obligations on the relative standalone selling prices for the goods or services contained in a particular performance obligation. The standalone selling prices are determined first by reference to observable prices. In the event observable prices are not available, we estimate the stand-alone selling price by maximizing observable inputs and applying an adjusted market assessment approach, expected cost plus margin approach, or a residual approach in limited situations. Revenue in these instances is recognized on individual performance obligations within the same contract as they are satisfied.
The transaction price is adjusted for our estimate of variable consideration which may include a right of return, discounts, rebates, penalties and retainage. To estimate variable consideration, we apply the expected value or the most likely amount method, based on whichever method most appropriately predicts the amount of consideration we expect to receive. The method applied is typically based on historical experience and known trends. We constrain the amounts of variable consideration that are included in the transaction price, to the extent that it is probable that a significant reversal in the amount of cumulative revenue recognized will not occur or when uncertainties around the variable consideration are resolved.
We exclude from the measurement of the transaction price all taxes assessed by a governmental authority that are both imposed on and concurrent with specific revenue-producing transaction and collected from a customer, for example sales, use, value added and some excise taxes.
For all contracts with customers, payment received for our products and services may not necessarily follow the same pattern of revenue recognition to which it relates and are dictated by the terms and conditions of our contracts with customers. Payments received for product sales typically occur following delivery and the satisfaction of the performance obligation based upon the terms outlined in the contracts. Payments received for services typically occur following the services being rendered. For long-term construction-type projects, payments are typically made throughout the contract as progress is made.
In limited situations, contracts with customers include financing components where payment terms exceed one year, however, we believe that the financing effects are not significant to Xylem. In addition, we apply a practical
58
expedient and do not adjust the promised amount of consideration in a contract for the effects of significant financing components when we expect payment terms to be one year or less from the time the goods or services are transferred until ultimate payment.
We offer standard warranties for our products to ensure that our products comply with agreed-upon specifications in our contracts. Standard warranties do not give rise to performance obligations and represent assurance-type warranties. In certain instances, product warranty terms are adjusted to account for the specific nature of the contract. In these instances, we assess the warranties to determine whether they represent service-type warranties, and should be accounted for as a separate performance obligation in the contract.
Costs to obtain a contract include incremental costs that the Company has incurred which it expects to recover. Incremental costs only include costs that the Company would not have incurred had the contract not been obtained. Costs that would have been incurred regardless of whether or not the contract was obtained are expensed as incurred, unless they are explicitly chargeable to the customer whether or not the contract is obtained.
Costs to obtain contracts are capitalized when incurred. The costs to obtain contracts are then amortized in a manner that is consistent with the pattern of transfer of the related goods or services provided in the contract. The Company elects to apply the practical expedient to expense costs to obtain contracts when the associated amortization period of those costs would be one year or less.
For annual periods prior to January 1, 2018, revenue is recognized when persuasive evidence of an arrangement exists, the price is fixed or determinable, collectability is reasonably assured and delivery has occurred or services have been rendered. For product sales, other than long-term construction-type contracts, we recognize revenue at the time title, and risks and rewards of ownership pass, which is generally when products are shipped. Certain contracts with customers require delivery, installation, testing, certification or other acceptance provisions to be satisfied before revenue is recognized. We recognize revenue on product sales to channel partners, including resellers, distributors or value-added solution providers at the time of sale when the channel partners have economic substance apart from Xylem and Xylem has completed its obligations related to the sale. Revenue from the rental of equipment is recognized over the rental period. Service revenue is recognized as services are performed.
For agreements that contain multiple deliverables, we recognize revenue based on the relative selling price if the deliverable has stand-alone value to the customer and, in arrangements that include a general right of return relative to the delivered element, performance of the undelivered element is considered probable and substantially in the Company’s control. The selling price for a deliverable is based on vendor-specific objective evidence of selling price (“VSOE”), if available, third-party evidence of selling price (“TPE”) if VSOE is not available, or best estimated selling price, if neither VSOE nor TPE is available.
The deliverables in our arrangements with multiple elements include various products and may include related services, such as installation and start-up services. Generally, these elements are satisfied within the same reporting period although certain contracts may be completed over 6 months. We allocate arrangement consideration based on the relative selling prices of the separate units of accounting determined in accordance with the hierarchy described above. For deliverables that are sold separately, we establish VSOE based on the price when the deliverable is sold separately. We establish TPE, generally for services, based on prices similarly situated customers pay for similar services from third-party vendors. For those deliverables for which we are unable to establish VSOE or TPE, we estimate the selling price considering various factors including market and pricing trends, geography, product customization, and profit objectives. Revenue for multiple element arrangements is recognized when the appropriate revenue recognition criteria for the individual deliverable have been satisfied.
Certain businesses enter into long-term construction-type sales contracts for which revenue is recognized under the percentage-of-completion method based upon percentage of costs incurred to total estimated costs.
Shipping and Handling Costs
Shipping and handling costs are recorded as a component of cost of revenue.
Share-Based Compensation
Share-based awards issued to employees and members of the Board of Directors include non-qualified stock options, restricted stock unit awards and performance share unit awards. Compensation costs resulting from share-based payment transactions are recognized primarily within selling, general and administrative expenses, at fair value over the requisite service period (typically three years) on a straight-line basis. The calculated compensation cost is adjusted based on an estimate of awards ultimately expected to vest. For performance awards, the calculated compensation cost is adjusted based on an estimate of awards ultimately expected to vest and our
59
assessment of the probable outcome of the performance condition. The fair value of a non-qualified stock option is determined on the date of grant using a binomial lattice pricing model incorporating multiple and variable assumptions over time, including assumptions such as employee exercise patterns, stock price volatility and changes in dividends. The fair value of restricted stock unit awards is determined using the closing price of our common stock on date of grant. The fair value of Return on Invested Capital ("ROIC") performance share units at 100% target is determined using the closing price of our common stock on date of grant. The fair value of Total Shareholder Return ("TSR") performance share units is calculated on the date of grant using a Monte Carlo simulation model utilizing several key assumptions, including expected Company and peer company share price volatility, correlation coefficients between peers, the risk-free rate of return, the expected dividend yield and other award design features.
Research and Development
We conduct research and development activities, which consist primarily of the development of new products, product applications, and manufacturing processes. To the extent these activities are related to developing software that is sold to our customers, we capitalize the applicable development costs. All other research and development costs are charged to expense as incurred.
Exit and Disposal Costs
We periodically initiate management-approved restructuring activities to achieve cost savings through reduced operational redundancies and to position ourselves strategically in the market in response to prevailing economic conditions and associated customer demand. Costs associated with restructuring actions can include severance, infrastructure charges to vacate facilities or consolidate operations, contract termination costs and other related charges. For involuntary separation plans, a liability is recognized when it is probable and reasonably estimable. For voluntary separation plans, a liability is recognized when the employee irrevocably accepts the voluntary termination. For one-time termination benefits, such as additional severance pay or benefit payouts, and other exit costs, such as lease termination costs, the liability is measured and recognized initially at fair value in the period in which the liability is incurred, with subsequent changes to the liability recognized as adjustments in the period of change.
Deferred Financing Costs
Deferred financing costs represent costs incurred in conjunction with our debt financing activities and are capitalized in long-term debt and amortized over the life of the related financing arrangements. If the debt is retired early, the related unamortized deferred financing costs are written off in the period the debt is retired and are recorded in the results of operations under the caption “interest expense.”
Income Taxes
Income taxes are calculated using the asset and liability method. Deferred tax assets and liabilities are determined based on temporary differences between the financial reporting and tax bases of assets and liabilities, applying enacted tax rates in effect for the year in which we expect the differences will reverse.
We maintain valuation allowances when it is more likely than not that all or a portion of a deferred asset will not be realized. The valuation allowance is intended in part to provide for the uncertainty regarding the ultimate utilization of our U.S. capital loss carryforwards, U.S. foreign tax credit carryovers, and foreign net operating loss carryforwards. In determining whether a valuation allowance is warranted, we consider all positive and negative evidence and all sources of taxable income such as prior earnings history, expected future earnings, carryback and carryforward periods and tax strategies to estimate if sufficient future taxable income will be generated to realize the deferred tax asset. The assessment of the adequacy of our valuation allowance is based on our estimates of taxable income by jurisdiction in which we operate and the period over which our deferred tax assets will be recoverable. In the event that actual results differ from these estimates, or we adjust these estimates in future periods for current trends or expected changes in our estimating assumptions, we may need to modify the level of valuation allowance that could materially impact our business, financial condition and results of operations.
Due to the U.S. Tax Cuts and Jobs Act (the "Tax Act"), we have recorded net foreign withholding taxes and state income taxes on earnings that are expected to be repatriated to the U.S. parent. We have not recorded any deferred taxes on the amounts that the Company currently does not intend to repatriate as the determination of any deferred taxes on this amount is not reasonably estimable.
Tax benefits are recognized for an uncertain tax position when, in management’s judgment, it is more likely than not that the position will be sustained upon examination by a taxing authority. For a tax position that meets the more-likely-than-not recognition threshold, the tax benefit is measured as the largest amount that is judged to have a
60
greater than 50% likelihood of being realized upon ultimate settlement with a taxing authority. The liability associated with unrecognized tax benefits is adjusted periodically due to changing circumstances and when new information becomes available. Such adjustments are recognized in the period in which they are identified. The effective tax rate includes the net impact of changes in the liability for unrecognized tax benefits and subsequent adjustments as considered appropriate by management. While it is often difficult to predict the final outcome or the timing of resolution of any particular tax matter, we believe our liability for unrecognized tax benefits is adequate. We classify interest relating to unrecognized tax benefits as a component of other non-operating (expense) income, net and tax penalties as a component of income tax expense in our Consolidated Income Statements.
Earnings Per Share
We present two calculations of earnings per share (“EPS”). “Basic” EPS equals net income divided by weighted average shares outstanding during the period. “Diluted” EPS equals net income divided by the sum of weighted average common shares outstanding during the period plus potentially dilutive shares. Potentially dilutive common shares that are anti-dilutive are excluded from diluted EPS.
Cash Equivalents
We consider all liquid investments purchased with an original maturity of three months or less to be cash equivalents.
Receivables and Allowance for Doubtful Accounts and Discounts
Receivables primarily comprise uncollected amounts owed to us from transactions with customers and are presented net of allowances for doubtful accounts, returns and early payment discounts.
We determine our allowance for doubtful accounts using a combination of factors to reduce our trade receivable balances to their estimated net realizable amount. We maintain an allowance for doubtful accounts based on a variety of factors, including the length of time receivables are past due, macroeconomic trends and conditions, significant one-time events, historical experience and the financial condition of customers. In addition, we record a specific reserve for individual accounts when we become aware of specific customer circumstances, such as in the case of bankruptcy filings or deterioration in the customer’s operating results or financial position. The past due or delinquency status of a receivable is based on the contractual payment terms of the receivable. If circumstances related to the specific customer change, we adjust estimates of the recoverability of receivables as appropriate. We determine our allowance for early payment discounts primarily based on historical experience with customers.
Credit risk with respect to accounts receivable is generally diversified due to the large number of entities comprising our customer base and their dispersion across many different geographical regions. We perform ongoing credit evaluations of the financial condition of our third-party distributors, resellers and other customers and require collateral, such as letters of credit and bank guarantees, in certain circumstances. As of December 31, 2019 and 2018 we do not believe we have any significant concentrations of credit risk.
Inventories
Inventories, which include the costs of material, labor and overhead, are stated at the lower of cost or net realizable value. Estimated losses from obsolete and slow-moving inventories are recorded to reduce inventory values to their estimated net realizable value. Our manufacturing operations recognize costs of sales using standard costs with full overhead absorption, which generally approximates actual cost.
Property, Plant and Equipment
These assets are recorded at historical cost and are depreciated using the straight-line method of depreciation over the estimated useful lives as follows:
Estimated Life | |
Buildings and improvements | 5 to 40 years |
Machinery and equipment | 2 to 10 years |
Furniture and fixtures | 3 to 7 years |
Equipment held for lease or rental | 2 to 10 years |
Leasehold improvements are depreciated over the shorter of their estimated useful life or the term of the lease. Costs related to maintenance and repairs that do not prolong the assets' useful lives are expensed as incurred.
61
Leases
Xylem adopted ASC 842 - Leases as of January 1, 2019. We determine if an arrangement is a lease at inception. We have recorded right of use (“ROU”) assets and liabilities for lease arrangements that are reasonably certain to extend beyond 12 months. ROU assets represent our right to use an underlying asset for the lease term and lease liabilities represent our obligation to make lease payments under the lease. ROU assets and liabilities are recognized at lease commencement date based on the present value of lease payments over the lease term. The implicit rate within our leases is generally not determinable, and we use our incremental borrowing rate at the lease commencement date to determine the net present value of lease payments. The determination of the appropriate incremental borrowing rate requires judgment. We determine the appropriate incremental borrowing rate for each lease using our current borrowing rate, adjusted for various factors including geographic region, level of collateralization and term, to align with the term of the underlying lease.
Lease expense for lease payments is recognized on a straight-line basis over the lease term. Many of our leases are subject to payment adjustments to reflect annual changes in price indexes, such as the Consumer Price Index. While associated lease liabilities are not re-measured as a result of changes in the applicable price indexes, changes to required lease payments are treated as variable lease payments and recognized in the period in which the obligation for those payments was incurred.
Leases with a lease term of 12 months or less, including renewal options that are reasonably certain to be exercised, that also do not include an option to purchase the underlying asset that is reasonably certain of exercise, are not recorded on the balance sheet. Instead, lease payments for these leases are recognized as a lease cost on a straight-line basis over the lease term.
We elected the package of practical expedients, which among other things, does not require reassessment of lease classification. Additionally, we have made an accounting policy election whereby we chose not to separate non-lease components from lease components in agreements in all leases which we are the lessee.
For annual periods prior to January 1, 2019 lease assets and liabilities are generally not recorded on the balance sheet. Instead, lease payments for these leases are recognized as a lease cost on a straight-line basis over the lease term.
Goodwill and Intangible Assets
Goodwill represents purchase consideration paid in a business combination that exceeds the values assigned to the net assets of acquired businesses. Intangible assets include customer relationships, proprietary technology, brands and trademarks, patents, software and other intangible assets. Intangible assets with a finite life are amortized on a straight-line basis over an estimated economic useful life which ranges from 1 to 25 years and is included in cost of revenue or selling, general and administrative expense. Certain of our intangible assets, namely certain brands and trademarks, as well as Federal Communications Commission ("FCC") licenses, have an indefinite life and are not amortized.
Long-Lived Asset Impairment
Long-lived assets, including intangible assets with finite lives, are amortized and tested for impairment whenever events or changes in circumstances indicate their carrying value may not be recoverable. We assess the recoverability of long-lived assets based on the undiscounted future cash flow the assets are expected to generate and recognize an impairment loss when estimated undiscounted future cash flows expected to result from the use of the asset plus net proceeds expected from disposition of the asset, if any, are less than the carrying value of the asset. When an impairment is identified, we reduce the carrying amount of the asset to its estimated fair value based on a discounted cash flow approach or, when available and appropriate, to comparable market values.
Goodwill and indefinite-lived intangible assets are not amortized, but rather are tested for impairment annually (or more frequently if impairment indicators arise, such as changes to the reporting unit structure, significant adverse changes in the business climate or an adverse action or assessment by a regulator). We conduct our annual impairment testing on the first day of our fourth quarter. For goodwill, the estimated fair value of each reporting unit is compared to the carrying value of the net assets assigned to that reporting unit. If the estimated fair value of the reporting unit exceeds its carrying value, goodwill is not impaired. If the carrying value of the reporting unit exceeds its estimated fair value, then an impairment charge is recognized for that excess up to the amount of recorded goodwill. We estimate the fair value of our reporting units using an income approach. We estimate the fair value of our intangible assets with indefinite lives using either the income approach or the market approach. Under the income approach, we calculate fair value based on the present value of estimated future cash flows. Under the market approach, we calculate fair value based on recent sales and selling prices of similar assets.
62
Product Warranties
For assurance-type warranties, we accrue for the estimated cost of product warranties at the time revenue is recognized and record it as a component of cost of revenue. Our product warranty liability reflects our best estimate of probable liability under the terms and conditions of our product warranties offered to customers. We estimate the liability based on our standard warranty terms, the historical frequency of claims and the cost to replace or repair our products under warranty. Factors that impact our warranty liability include the number of units sold, the length of warranty term, historical and anticipated rates of warranty claims and cost per claim. We also record a warranty liability for specific matters. We assess the adequacy of our recorded warranty liabilities quarterly and adjust amounts as necessary.
For service-type warranties (i.e. non-standard warranties) costs incurred to fulfill the extended or service warranty are recognized/recorded as the costs are incurred.
Postretirement Benefit Plans
The determination of defined benefit pension and postretirement plan obligations and their associated costs requires the use of actuarial computations to estimate participant plan benefits to which the employees will be entitled. The significant assumptions primarily relate to discount rates, expected long-term rates of return on plan assets, rate of future compensation increases, mortality, years of service and other factors. We develop each assumption using relevant company experience in conjunction with market-related data for each individual country in which such plans exist. All actuarial assumptions are reviewed annually with third-party consultants and adjusted as necessary. For the recognition of net periodic postretirement cost, the calculation of the expected return on plan assets is generally derived by applying the expected long-term rate of return on the market-related value of plan assets. The market-related value of plan assets is based on average asset values at the measurement date over the last five years. Actual results that differ from our assumptions are accumulated and amortized on a straight-line basis only to the extent they exceed 10% of the higher of the market-related value or the projected benefit obligation, over the average remaining service period of active participants, or for plans with all or substantially all inactive participants, over the average remaining life expectancy. The fair value of plan assets is determined based on market prices or estimated fair value at the measurement date.
We consider changes to a plan’s benefit formula that eliminate the accrual for future service but continue to allow for future salary increases (i.e. “soft freeze”) to be a curtailment.
Business Combinations
We allocate the purchase price of acquisitions to the tangible and intangible assets acquired, liabilities assumed, and non-controlling interests in the acquiree based on their estimated fair value at the acquisition date. The excess of the acquisition price over those estimated fair values is recorded as goodwill. Changes to the acquisition date provisional fair values prior to the expiration of the measurement period, a period not to exceed 12 months from date of acquisition, are recorded as an adjustment to the associated goodwill. Acquisition-related expenses and restructuring costs, if any, are recognized separately from the business combination and are expensed as incurred.
Derivative Financial Instruments
We record all derivatives on the balance sheet at fair value. The accounting for changes in the fair value of derivatives depends on whether we have elected to designate a derivative in a hedging relationship and apply hedge accounting and whether the hedging relationship has satisfied the criteria necessary to apply hedge accounting. Derivatives designated and qualifying as a hedge of the exposure to changes in the fair value of an asset, liability, or firm commitment attributable to a particular risk are considered fair value hedges. Derivatives designated and qualifying as a hedge of the exposure to variability in expected future cash flows, including forecasted transactions, are considered cash flow hedges. Derivatives may also be designated as hedges of the foreign currency exposure of a net investment in a foreign operation. Hedge accounting generally provides for the matching of the timing of gain or loss recognition on the hedging instrument with the recognition of the changes in the fair value of the hedged asset or liability that are attributable to the hedged risk in a fair value hedge or the earnings effect of the hedged forecasted transactions in a cash flow hedge. We may enter into derivative contracts that are intended to hedge certain risks economically, even though hedge accounting does not apply or we elect not to apply hedge accounting.
During the fourth quarter of 2018 we adopted new accounting guidance that eliminates the concept of ineffectiveness for cash flow and net investment hedges. Prior to this adoption, the effective portion of changes in the fair value of derivatives designated and that qualify as cash flow hedges of foreign exchange risk was recorded in other comprehensive income ("OCI") and was subsequently reclassified into either revenue or cost of revenue (hedge of sales classified into revenue and hedge of purchases classified into cost of revenue) in the period that the
63
hedged forecasted transaction affects earnings. Any ineffective portion of the change in fair value of the derivative was recognized directly in selling, general and administrative expenses. Our policy was to de-designate cash flow hedges at the time forecasted transactions are recognized as assets or liabilities on a business unit’s balance sheet and report subsequent changes in fair value through selling, general and administrative expenses where the gain or loss due to movements in currency rates on the underlying asset or liability is revalued. If it became probable that the originally forecasted transaction would not occur, the gain or loss related to the hedge recorded within accumulated other comprehensive income ("AOCI") was immediately recognized into net income.
Prior to the adoption of the new guidance, changes in the fair value of derivatives designated and that qualify as net investment hedges of foreign exchange risk were recorded in OCI. Amounts in AOCI were reclassified into earnings at the time the hedged net investment is sold or substantially liquidated. Effectiveness of derivatives designated as net investment hedges was assessed using the forward method.
Subsequent to adopting the new hedge guidance, changes in the fair value of derivatives designated and that qualify as cash flow hedges of foreign exchange risk are recorded in other comprehensive income ("OCI") and are subsequently reclassified into either revenue or cost of revenue (hedge of sales classified into revenue and hedge of purchases classified into cost of revenue) in the period that the hedged forecasted transaction affects earnings. Our policy is to de-designate cash flow hedges at the time forecasted transactions are recognized as assets or liabilities on a business unit’s balance sheet and report subsequent changes in fair value through selling, general and administrative expenses where the gain or loss due to movements in currency rates on the underlying asset or liability is revalued. If it becomes probable that the originally forecasted transaction will not occur, the gain or loss related to the hedge recorded within accumulated other comprehensive income ("AOCI") is immediately recognized into net income.
Subsequent to adopting the new hedge guidance effectiveness of derivatives designated as net investment hedges is assessed using the spot method. The changes in the fair value of these derivatives due to movements in spot exchange rates are recorded in OCI. Amounts in AOCI are reclassified into earnings at the time the hedged net investment is sold or substantially liquidated. Furthermore, we recognize interest income based on the interest rate differential embedded in the derivative instrument.
Commitments and Contingencies
We record accruals for commitments and loss contingencies for those which are both probable and for which the amount can be reasonably estimated. In addition, legal fees are accrued for cases where a loss is probable and the related fees can be reasonably estimated. Significant judgment is required to determine both probability and the estimated amount of loss. We review these accruals quarterly and adjust the accruals to reflect the impact of negotiations, settlements, rulings, advice of legal counsel, and other current information.
Accruals for environmental matters are recorded on a site-by-site basis when it is probable that a liability has been incurred and the amount of the liability can be reasonably estimated, based on current law and existing technologies. Our estimated liability is reduced to reflect the anticipated participation of other potentially responsible parties in those instances where it is probable that such parties are legally responsible and financially capable of paying their respective shares of the relevant costs. These accruals are reviewed quarterly and are adjusted as assessment and remediation efforts progress or as additional technical or legal information becomes available. Actual costs to be incurred at identified sites in future periods may vary from the estimates, given inherent uncertainties in evaluating environmental exposures. Accruals for environmental liabilities are primarily included in other non-current liabilities at undiscounted amounts and exclude claims for recoveries from insurance companies or other third parties.
Concentrations of Credit Risk
Financial instruments that potentially subject us to significant concentrations of credit risk consist principally of cash and cash equivalents, and accounts receivable from trade customers. We maintain cash and cash equivalents and derivative contracts with various financial institutions. These financial institutions are located in many different geographical regions, and our policy is designed to limit exposure with any one institution. As part of our cash and risk management processes, we perform periodic evaluations of the relative credit standing of the financial institutions. We have not sustained any material credit losses during the previous three years from instruments held at financial institutions. We may utilize forward contracts to protect against the effects of foreign currency fluctuations. Such contracts involve the risk of non-performance by the counterparty. Credit risk with respect to accounts receivable is generally diversified due to the large number of entities comprising our customer base and their dispersion across many different industries and geographic regions. We perform ongoing credit evaluations of the financial condition of our third-party distributors, resellers and other customers and require collateral, such as letters of credit and bank guarantees, in certain circumstances.
64
Substantially all of the cash and cash equivalents, including foreign cash balances, at December 31, 2019 and 2018 were uninsured. Foreign cash balances at December 31, 2019 and 2018 were $510 million and $274 million, respectively.
Fair Value Measurements
We determine fair value as the price that would be received to sell an asset or paid to transfer a liability in an orderly transaction between market participants at the measurement date. We use a hierarchical structure to prioritize the inputs to valuation techniques used to measure fair value into three broad levels defined as follows:
• | Level 1 inputs are quoted prices (unadjusted) in active markets for identical assets or liabilities. |
• | Level 2 inputs are other than quoted prices included within Level 1 that are observable for the asset or liability, either directly or indirectly. Level 2 inputs include quoted prices (in non-active markets or in active markets for similar assets or liabilities), inputs other than quoted prices that are observable, and inputs that are derived principally from or corroborated by observable market data by correlation or other means. |
• | Level 3 inputs are unobservable inputs for the assets or liabilities. |
The fair value hierarchy is based on maximizing the use of observable inputs and minimizing the use of unobservable inputs when measuring fair value. Classification within the fair value hierarchy is based on the lowest level input that is significant to the fair value measurement.
NAV Practical Expedient is the measurement of fair value using the net asset value ("NAV") per share (or its equivalent) as an alternative to the fair value hierarchy as discussed above.
Note 2. Recently Issued Accounting Pronouncements
Pronouncements Not Yet Adopted
In June 2016, the FASB issued guidance amending the accounting for the impairment of financial instruments, including trade receivables. Under current guidance, credit losses are recognized when the applicable losses have a probable likelihood of occurring and this assessment is based on past events and current conditions. The amended guidance eliminates the “probable” threshold and requires an entity to use a broader range of information, including forecast information when estimating expected credit losses. Generally, this should result in a more timely recognition of credit losses. This guidance is effective for interim and annual periods beginning after December 15, 2019 with early adoption permitted for interim and annual periods beginning after December 15, 2018. The requirements of the amended guidance should be applied using a modified retrospective approach except for debt securities, which require a prospective transition approach. The guidance will not have a material impact on our financial condition and results of operations.
Recently Adopted Pronouncements
In August 2018, the Financial Accounting Standards Board (“FASB”) issued guidance regarding the accounting for implementation costs of a hosting arrangement that is a service contract. The guidance establishes the requirement to capitalize certain implementation costs incurred in a hosting arrangement that is a service contract, effectively aligning with the requirement to capitalize certain implementation costs incurred to develop or obtain internal-use software. This guidance is effective for interim and annual periods beginning after December 15, 2019 with early adoption permitted. The requirements of the amended guidance may be applied using either a retrospective or prospective approach. We adopted this guidance prospectively as of April 1, 2019. This guidance did not have a material impact on our financial condition and results of operations.
In February 2016, the FASB issued guidance amending the accounting for leases. Specifically, the amended guidance requires all lessees to record a lease liability at lease inception, with a corresponding right of use ("ROU") asset, except for short-term leases. Lessor accounting is not fundamentally changed. This amended guidance is effective for interim and annual periods beginning after December 15, 2018 using a modified retrospective approach. Early adoption was permitted. We adopted this guidance as of January 1, 2019 using the modified retrospective approach whereby prior comparative periods were not retrospectively restated in the consolidated financial statements. The adoption of the standard resulted in the recognition of ROU assets and lease liabilities of $267 million and $265 million, respectively, as well as deferred tax assets and deferred tax liabilities of $68 million, as of January 1, 2019, the date of initial application. The guidance did not have a material impact on our consolidated Income Statements and Statements of Cash Flow. See Note 11, "Leases" for further details.
65
In August 2017, the FASB issued amended guidance on hedging activities. The amendment better aligns a company’s risk management activities and financial reporting for hedging relationships through changes to both the designation and measurement guidance for qualifying for hedging relationships and the presentation of hedge results. Specifically, the guidance:
(1) | Eliminates the concept of recognizing periodic hedge ineffectiveness for cash flow and net investment hedges; |
(2) | Eliminates the benchmark interest rate concept of variable - rate instruments in cash flow hedges and allows companies to designate the contractually specified interest rate as the hedged risk; |
(3) | Requires a company to present the earnings effect of the hedging instrument in the same income statement line item in which the earnings effect of the hedged item is reported; and |
(4) | Provides the ability to perform subsequent hedge effectiveness tests qualitatively. |
This guidance is effective for fiscal years beginning after December 15, 2018, including interim periods within those annual periods. Early adoption is permitted with the effect of adoption reflected as of the beginning of the fiscal year of adoption. For cash flow and net investment hedges existing at the date of adoption, a cumulative-effect adjustment related to eliminating the separate measurement of ineffectiveness is required. Other presentation and disclosure guidance is required only prospectively. We adopted this guidance in the fourth quarter of 2018. The adoption resulted in the recognition of $2 million of interest income as a result of our transition from the forward rate method to the spot rate method in accounting for our net investment hedges.
In February 2018, the FASB issued new guidance on the reclassification of certain tax effects in Accumulated Other Comprehensive Income ("AOCI"). The guidance allows a reclassification from AOCI to retained earnings for stranded tax effects resulting from the Tax Cuts and Jobs Act (the “Tax Act”). This guidance is effective for fiscal years beginning after December 15, 2018, including interim periods within those annual periods. Early adoption is permitted. The guidance may be applied either in the period of adoption or retrospectively to each period (or periods) in which the effect of the change in the U.S. federal corporate income tax rate in the Tax Act is recognized. We early adopted this guidance effective the first quarter of 2018, and elected to reclassify the income tax effects of the Tax Act from AOCI to retained earnings. As a result of adopting the guidance, AOCI was reduced by $17 million and retained earnings increased by $17 million. This amount includes the effect of the change in the US federal corporate income tax rate.
In March 2017, the FASB issued amended guidance on the presentation of net periodic benefit costs. The amendment requires that an employer report the service cost component in the same line item or items as other compensation costs arising from services rendered by the pertinent employees during the period. The other components are required to be presented in the income statement separately and outside a subtotal of income from operations, if one is presented. The amendment also requires entities to disclose the income statement lines that contain the other components if they are not appropriately described. This guidance is effective retrospectively for periods beginning after December 15, 2017, including interim periods within those annual periods. Early adoption is permitted. We adopted this guidance effective the first quarter of 2018. The prior period consolidated income statements and segment results have been retrospectively adjusted in accordance with the new guidance. The impact to the presentation between operating income and other non-operating income within Xylem's Consolidated Income Statements was approximately $4 million for the year ended December 31, 2017.
In May 2014, the FASB issued guidance on recognizing revenue from contracts with customers. The guidance outlines a single comprehensive model to use in accounting for revenue arising from contracts with customers and supersedes most current revenue recognition guidance, including industry-specific guidance. The core principle of the model is that an entity recognizes revenue to portray the transfer of goods and services to customers in an amount that reflects the consideration to which the entity expects to be entitled in exchange for those goods or services. The standard also expands disclosure requirements regarding revenue recognition. This guidance is effective for interim and annual reporting periods beginning after December 15, 2017 and may be applied retrospectively to each prior period presented or using a modified retrospective approach with the cumulative effect recognized as of the date of initial application. Early adoption is permitted for interim and annual reporting periods beginning after December 15, 2016. We adopted this guidance as of January 1, 2018 using the modified retrospective transition method. The adoption of the guidance did not have a material impact on our financial condition and results of operations. See Note 4, "Revenue", for further details.
66
Note 3. Acquisitions and Divestitures
2019 Acquisitions
During the twelve months ended December 31, 2019 we spent approximately $18 million, net of cash received on acquisition activity.
2018 Acquisitions and Divestitures
Pure Technologies Ltd.
On January 31, 2018, we acquired all the issued and outstanding shares of Pure Technologies Ltd. (“Pure”), a leader in intelligent leak detection and condition assessment solutions for water distribution networks for approximately $420 million, net of cash received. Acquisition costs of $4 million were reflected as a component of selling, general and administrative expenses in our Consolidated Income Statement for the year ended December 31, 2018.
Pure’s results of operations were consolidated with the Company effective February 1, 2018 and are reflected in the Measurement & Control Solutions segment.
The Pure purchase price allocation as of January 31, 2018 is shown in the following table:
(in millions) | Amount | ||
Cash | $ | ||
Receivables | |||
Inventories | |||
Prepaid and other current assets | |||
Property, plant and equipment | |||
Intangible assets | |||
Other long-term assets | |||
Accounts payable | ( | ) | |
Accrued and other current liabilities | ( | ) | |
Deferred income tax liabilities | ( | ) | |
Other non-current accrued liabilities | ( | ) | |
Total identifiable net assets | |||
Goodwill | |||
Total consideration | $ | ||
The fair values of Pure's assets and liabilities were determined based on estimates and assumptions which management believes are reasonable.
Goodwill arising from the acquisition consists largely of synergies and economies of scale expected from combining the operations of Pure and Xylem. All of the goodwill was assigned to the Measurement & Control Solutions segment and is not deductible for tax purposes.
The estimate of the fair value of Pure identifiable intangible assets was determined primarily using the “income approach,” which requires a forecast of all of the expected future cash flows either through the use of the multi-period excess earnings method or the relief-from-royalty method. Some of the more significant assumptions inherent in the development of intangible asset values include: the amount and timing of projected future cash flows, the discount rate selected to measure the risks inherent in the future cash flows, the assessment of the intangible asset’s life cycle, as well as other factors.
67
The following table summarizes key information underlying identifiable intangible assets related to the Pure acquisition:
Category | Life | Amount (in millions) | ||||
Customer Relationships | 17 - 18 years | $ | ||||
Technology | 3 - 10 years | |||||
Tradenames | 20 years | |||||
Internally Developed Software | 3 years | |||||
Total | $ | |||||
The following table summarizes, on an unaudited pro forma basis, the condensed combined results of operations of the Company for the years ended December 31, 2018 and 2017, respectively, assuming the acquisition of Pure was made on January 1, 2017:
(in millions) | Year Ended December 31, | |
2018 | 2017 | |
Revenue | $ | $ |
Net income | $ | $ |
The foregoing unaudited pro forma results are for informational purposes only and are not necessarily indicative of the actual results of operations that might have occurred had the acquisition occurred on January 1, 2017, nor are they necessarily indicative of future results. The pro forma financial information includes the impact of purchase accounting and other nonrecurring items directly attributable to the acquisition, which include:
• | Amortization expense of acquired intangibles |
• | Adjustments to the depreciation of property, plant and equipment reflecting the impact of the calculated fair value of those assets in accordance with purchase accounting |
• | Adjustments to interest expense to remove historical Pure interest costs and reflect Xylem's current debt profile |
• | The related tax impact of the above referenced adjustments |
The pro forma results do not include any cost savings or operational synergies that may be generated or realized due to the acquisition of Pure.
During the eleven month period ended December 31, 2018 Pure had revenue and an operating loss of $96 million and $2 million, respectively.
Other Acquisition Activity
During the twelve months ended December 31, 2018 we spent approximately $13 million, net of cash received on other acquisition activity.
Divestiture
During the third quarter we divested our Precision Die Casting business for approximately $22 million, net of cash assumed. The sale resulted in an immaterial gain, which is reflected in gain from sale of business in our Consolidated Income Statement. The business, which was part of our Measurement & Controls Solutions segment, provided aluminum die casting products primarily to customers in the automotive sector. The business reported 2017 annual revenue of approximately $32 million.
68
2017 Acquisitions and Divestitures
Acquisition Activity
During 2017 we spent approximately $33 million on acquisition activity, including the acquisition of EmNet LLC (“EmNet”), a developer of software and data analytics solutions for municipalities.
Divestitures
On October 31, 2017, we divested our Flowtronex and Water Equipment Technologies (WET) businesses for $6 million. The sale resulted in a gain of approximately $1 million, which is reflected in gain from sale of business in our Consolidated Income Statement. The business, which was part of our Applied Water segment, provided turf and reverse osmosis packages to customers in the agricultural and industrial sectors. The business reported approximately $9 million of revenue in the first 10 months of 2017.
On February 17, 2017, we divested our United Kingdom and Poland based membranes business for approximately $10 million. The sale resulted in a gain of $5 million, which is reflected in gain from sale of business in our Consolidated Income Statement. The business, which was part of our Applied Water segment, provided membrane filtration products primarily to customers in the municipal water and industrial sectors. The business reported 2016 annual revenue of approximately $8 million.
Assets Held for Sale
Note 4. Revenue
Disaggregation of Revenue
The following table illustrates the sources of revenue:
Year Ended December 31, | |||||||
(in millions) | 2019 | 2018 | |||||
Revenue from contracts with customers | $ | $ | |||||
Lease Revenue | |||||||
Total | $ | $ | |||||
69
The following table reflects revenue from contracts with customers by application:
Year Ended December 31, | |||||||
(in millions) | 2019 | 2018 | |||||
Water Infrastructure | |||||||
Transport | $ | $ | |||||
Treatment | |||||||
Applied Water | |||||||
Building Services | |||||||
Industrial Water | |||||||
Measurement and Control Solutions | |||||||
Water | |||||||
Energy | |||||||
Software as a Service/Other | |||||||
Test | |||||||
Total | $ | $ | |||||
The following table reflects revenue from contracts with customers by geographical region:
Year Ended December 31, | |||||||
(in millions) | 2019 | 2018 | |||||
Water Infrastructure | |||||||
United States | $ | $ | |||||
Europe | |||||||
Asia Pacific | |||||||
Other | |||||||
Applied Water | |||||||
United States | |||||||
Europe | |||||||
Asia Pacific | |||||||
Other | |||||||
Measurement and Control Solutions | |||||||
United States | |||||||
Europe | |||||||
Asia Pacific | |||||||
Other | |||||||
Total | $ | $ | |||||
Contract Balances
We receive payments from customers based on a billing schedule as established in our contracts. Contract assets relate to costs incurred to perform in advance of scheduled billings. Contract liabilities relate to payments received
70
in advance of performance under the contracts. Change in contract assets and liabilities are due to our performance under the contract.
The table below provides contract assets, contract liabilities, and significant changes in contract assets and liabilities.
(in millions) | Contract Assets (a) | Contract Liabilities | ||||
Balance at 1/1/2018 | $ | $ | ||||
Additions, net | ||||||
Revenue recognized from opening balance | — | ( | ) | |||
Billings | ( | ) | — | |||
Other | ( | ) | ( | ) | ||
Balance at 1/1/2019 | $ | $ | ||||
Additions, net | ||||||
Revenue recognized from opening balance | — | ( | ) | |||
Billings | ( | ) | — | |||
Other | ( | ) | ||||
Balance at 12/31/2019 | $ | $ | ||||
(a) | Excludes receivable balances which are disclosed on the balance sheet |
Performance obligations
Delivery schedules vary from customer to customer based upon their requirements. Typically, large projects require longer lead production cycles and delays can occur from time to time. As of December 31, 2019, the aggregate amount of the transaction price allocated to performance obligations that are unsatisfied or partially unsatisfied for contracts with performance obligations, amount to $392 million. We expect to recognize the majority of revenue upon the completion of satisfying these performance obligations in the following 60 months. The Company elects to apply the practical expedient to exclude from this disclosure revenue related to performance obligations that are part of a contract whose original expected duration is less than one year.
Note 5. Restructuring and Asset Impairment Charges
From time to time, the Company will incur costs related to restructuring actions in order to optimize our cost base and more strategically position ourselves based on the economic environment and customer demand. During 2019, 2018 and 2017, the costs incurred primarily relate to an effort to reposition our European and North American businesses to optimize our cost structure and improve our operational efficiency and effectiveness. In 2019 and 2018 the charges included the reduction of headcount and consolidation of facilities within our Measurement & Control Solutions and Water Infrastructure segments, as well as headcount reductions within our Applied Water segment. In 2017 the charges included the reduction of headcount and consolidation of facilities within our Applied Water, Water Infrastructure, and Measurement & Control Solutions segments.
71
The following table presents the components of restructuring expense and asset impairment charges incurred during each of the previous three years:
Year Ended December 31, | ||||||||||||
(in millions) | 2019 | 2018 | 2017 | |||||||||
By component: | ||||||||||||
Severance and other charges | $ | $ | $ | |||||||||
Lease related charges | ||||||||||||
Other restructuring charges | ||||||||||||
Reversal of restructuring accruals | ( | ) | ( | ) | ( | ) | ||||||
Total restructuring charges | ||||||||||||
Asset impairment charges | ||||||||||||
Total restructuring and asset impairment charges | $ | $ | $ | |||||||||
By segment: | ||||||||||||
Water Infrastructure | $ | $ | $ | |||||||||
Applied Water | ||||||||||||
Measurement & Control Solutions | ||||||||||||
Corporate and other | ||||||||||||
Restructuring
The following table displays a roll-forward of the restructuring accruals, presented on our Consolidated Balance Sheets within "accrued and other current liabilities" and "other non-current accrued liabilities," for the years ended December 31, 2019 and 2018:
(in millions) | 2019 | 2018 | ||||||
Restructuring accruals - January 1 | $ | $ | ||||||
Restructuring charges | ||||||||
Cash payments | ( | ) | ( | ) | ||||
Foreign currency and other | ( | ) | ( | ) | ||||
Restructuring accruals - December 31 | $ | $ | ||||||
By segment: | ||||||||
Water Infrastructure | $ | $ | ||||||
Applied Water | ||||||||
Measurement & Control Solutions | ||||||||
Regional selling locations (a) | ||||||||
(a) | Regional selling locations consist primarily of selling and marketing organizations that incurred restructuring expense which was allocated to the segments. The liabilities associated with restructuring expense were not allocated to the segments. |
72
The following table presents expected restructuring spend:
(in millions) | Water Infrastructure | Applied Water | Measurement & Control Solutions | Corporate | Total | |||||||||||||||
Actions Commenced in 2019: | ||||||||||||||||||||
Total expected costs | $ | $ | $ | $ | $ | |||||||||||||||
Costs incurred during 2019 | ||||||||||||||||||||
Total expected costs remaining | $ | $ | $ | $ | $ | |||||||||||||||
Actions Commenced in 2018: | ||||||||||||||||||||
Total expected costs | $ | $ | $ | $ | $ | |||||||||||||||
Costs incurred during 2018 | ||||||||||||||||||||
Costs incurred during 2019 | ||||||||||||||||||||
Total expected costs remaining | $ | $ | $ | $ | $ | |||||||||||||||
Actions Commenced in 2017: | ||||||||||||||||||||
Total expected costs | $ | $ | $ | $ | $ | |||||||||||||||
Costs incurred during 2017 | ||||||||||||||||||||
Costs incurred during 2018 | ||||||||||||||||||||
Costs incurred during 2019 | ||||||||||||||||||||
Total expected costs remaining | $ | $ | $ | $ | $ | |||||||||||||||
The Water Infrastructure, Applied Water, and Measurement & Control Solutions actions commenced in 2019 consist primarily of severance charges. The Applied Water actions are complete, the Water Infrastructure actions are expected to continue through Q1 2020, and the Measurement & Control Solutions actions are expected to continue through the fourth quarter of 2020. The Water Infrastructure, Applied Water, and Measurement & Control Solutions actions commenced in 2018 consist primarily of severance charges and are complete. The Water Infrastructure, Applied Water, Measurement & Control Solutions and Corporate actions commenced in 2017 consist primarily of severance charges and are expected to continue through 2021.
Asset Impairment
During the first and third quarter of 2019 we determined that certain assets within our Measurement & Control Solutions segment, including customer relationships, internally developed software, proprietary technology, and plant property & equipment, were impaired. Accordingly we recognized an impairment charge of $10 million during the year.
During the fourth quarter of 2018 we determined that certain assets within our Water Infrastructure segment, including certain software, were impaired. Accordingly we recognized an impairment charge of $2 million. Refer to Note 12, "Goodwill and Other Intangible Assets," for additional information.
Note 6. Other Non-Operating (Expense) Income, Net
The components of other non-operating income, net are as follows:
Year Ended December 31, | |||||||||||
(in millions) | 2019 | 2018 | 2017 | ||||||||
Interest income | $ | $ | $ | ||||||||
Income from joint ventures | |||||||||||
Other (expense) income – net | ( | ) | |||||||||
Total other non-operating (expense) income, net | $ | ( | ) | $ | $ | ||||||
73
Note 7. Income Taxes
The source of pre-tax income and the components of income tax expense are as follows:
Year Ended December 31, | |||||||||||
(in millions) | 2019 | 2018 | 2017 | ||||||||
Income components: | |||||||||||
Domestic | $ | $ | $ | ||||||||
Foreign | |||||||||||
Total pre-tax income | $ | $ | $ | ||||||||
Income tax expense components: | |||||||||||
Current: | |||||||||||
Domestic – federal | $ | $ | $ | ||||||||
Domestic – state and local | |||||||||||
Foreign | |||||||||||
Total Current | |||||||||||
Deferred: | |||||||||||
Domestic – federal | $ | $ | $ | ( | ) | ||||||
Domestic – state and local | ( | ) | |||||||||
Foreign | ( | ) | ( | ) | ( | ) | |||||
Total Deferred | ( | ) | ( | ) | ( | ) | |||||
Total income tax provision | $ | $ | $ | ||||||||
Effective income tax rate | % | % | % | ||||||||
Reconciliations between taxes at the U.S. federal income tax rate and taxes at our effective income tax rate on earnings before income taxes are as follows:
Year Ended December 31, | ||||||||
2019 | 2018 | 2017 | ||||||
Tax provision at U.S. statutory rate | % | % | % | |||||
Increase (decrease) in tax rate resulting from: | ||||||||
State income taxes | ||||||||
Uncertain tax positions | ||||||||
Valuation allowance | ( | ) | ||||||
Tax exempt interest | ( | ) | ( | ) | ( | ) | ||
Foreign tax rate differential | ( | ) | ||||||
Impact of foreign earnings, net | ( | ) | ||||||
Tax incentives | ( | ) | ( | ) | ( | ) | ||
Intercompany sale of assets | ||||||||
Other – net | ( | ) | ( | ) | ||||
Rate change | ( | ) | ( | ) | ||||
Goodwill impairment | ||||||||
Federal R&D tax credit | ( | ) | ( | ) | ( | ) | ||
Stock compensation | ( | ) | ( | ) | ( | ) | ||
Effective income tax rate | % | % | % | |||||
Certain prior year amounts included within the table of rate reconciliation above have been reclassified for consistency with the current year presentation. These reclassifications had no effect on the reported consolidated balance sheets, consolidated statements of income, comprehensive income, stockholders’ equity, or cash flow. Additional line items have been included as of December 31, 2019 and for consistency the prior year balances have been adjusted to conform with the current year presentation.
We operate under tax incentives, which are effective through December 2023 and may be extended if certain additional requirements are satisfied. The tax incentives are conditional upon our meeting and maintaining certain
74
employment thresholds. The inability to meet the thresholds would have a prospective impact and at this time we continue to believe we will meet the requirements.
Deferred tax assets and liabilities are determined based on temporary differences between the financial reporting and tax bases of assets and liabilities, applying enacted tax rates in effect for the year in which we expect the differences will reverse.
The following is a summary of the components of the net deferred tax assets and liabilities recognized in the Consolidated Balance Sheets:
December 31, | |||||||
(in millions) | 2019 | 2018 | |||||
Deferred tax assets: | |||||||
Employee benefits | $ | $ | |||||
Accrued expenses | |||||||
Loss and other tax credit carryforwards | |||||||
Inventory | |||||||
Lease Liabilities | — | ||||||
Other | |||||||
Valuation allowance | ( | ) | ( | ) | |||
Net deferred tax asset | $ | $ | |||||
Deferred tax liabilities: | |||||||
Intangibles | $ | $ | |||||
Investment in foreign subsidiaries | |||||||
Property, plant, and equipment | |||||||
Lease right-of-use assets | — | ||||||
Other | |||||||
Total deferred tax liabilities | $ | $ | |||||
Management assesses all available positive and negative evidence, including prudent and feasible tax planning strategies, and estimates if sufficient future taxable income will be generated to realize existing deferred tax assets. On the basis of this evaluation, as of December 31, 2019, a valuation allowance of $191 million has been established to reduce the deferred income tax asset related to certain U.S. and foreign net operating losses and U.S. and foreign capital loss carryforwards.
A reconciliation of the change in valuation allowance on deferred tax assets is as follows:
(in millions) | 2019 | 2018 | 2017 | ||||||||
Valuation allowance — January 1 | $ | $ | $ | ||||||||
Change in assessment (a) | ( | ) | ( | ) | |||||||
Current year operations | ( | ) | |||||||||
Foreign currency and other (b) | ( | ) | |||||||||
Valuation allowance — December 31 | $ | $ | $ | ||||||||
(a) | Decrease in assessment in 2019 is primarily attributable to profitability of certain jurisdictions. Increase in assessment in 2018 is primarily attributable to loss positions in various jurisdictions. |
(b) |
Deferred taxes are classified in the Consolidated Balance Sheets as follows:
December 31, | |||||||
(in millions) | 2019 | 2018 | |||||
Non-current assets | $ | $ | |||||
Non-current liabilities | ( | ) | ( | ) | |||
Total net deferred tax liabilities | $ | ( | ) | $ | ( | ) | |
75
Tax attributes available to reduce future taxable income begin to expire as follows:
(in millions) | December 31, 2019 | First Year of Expiration | |||
U.S. net operating loss | $ | December 31, 2024 | |||
State net operating loss | December 31, 2020 | ||||
State excess interest expense | Indefinitely | ||||
State tax credits | Indefinitely | ||||
Foreign net operating loss | December 31, 2020 | ||||
Foreign tax credits | December 31, 2030 | ||||
The Company has provided a deferred tax liability of $9 million for net foreign withholding taxes and state income taxes on $505 million of earnings expected to be repatriated to the U.S. parent, as of December 31, 2019. The Company currently does not intend to repatriate approximately $1.3 billion taxed under the Tax Act. The amount of deferred tax that would be recorded if such amounts were repatriated is not reasonably estimable.
Unrecognized Tax Benefits
We recognize tax benefits from uncertain tax positions only if it is more likely than not that the tax position will be sustained on examination by the taxing authorities or upon the completion of the litigation process, based on the technical merits of the position. The tax benefits recognized in the consolidated financial statements from such positions are measured based on the largest benefit that has a greater than 50% likelihood of being realized upon ultimate resolution. A reconciliation of the beginning and ending amount of unrecognized tax benefits is as follows:
(in millions) | 2019 | 2018 | 2017 | ||||||||
Unrecognized tax benefits — January 1 | $ | $ | $ | ||||||||
Current year tax positions | |||||||||||
Prior year tax positions | ( | ) | |||||||||
Acquisitions | |||||||||||
Settlements | ( | ) | ( | ) | |||||||
Unrecognized tax benefits — December 31 | $ | $ | $ | ||||||||
The amount of unrecognized tax benefits at December 31, 2019 which, if ultimately recognized, will reduce our effective tax rate is $129 million. We believe that it is reasonably possible that unrecognized tax benefits will be reduced by approximately $4 million within the next 12 months as a result of the expiration of certain statute of limitations.
We classify interest relating to unrecognized tax benefits as a component of other non-operating (expense) income, net and tax penalties as a component of income tax expense in our Consolidated Income Statements. The amount of accrued interest relating to unrecognized tax benefits as of December 31, 2019 and 2018 was $8 million and $7 million.
During 2019, Xylem’s Swedish subsidiary received a tax assessment for the 2013 tax year related to the tax treatment of an intercompany transfer of certain intellectual property that was made in connection with a reorganization of our European businesses. The assessment asserts an aggregate amount of approximately $80 million for tax, penalties and interest. Xylem filed an appeal with the Administrative Court of Stockholm. Management, in consultation with external legal advisors, believes it is more likely than not that Xylem will prevail on the proposed assessment and is vigorously defending our position through litigation. As of December 31, 2019, we have not recorded any unrecognized tax benefits related to this uncertain tax position.
The following table summarizes our earliest open tax years by major jurisdiction:
Jurisdiction | Earliest Open Year | |
Italy | 2013 | |
Luxembourg | 2016 | |
Sweden | 2013 | |
Germany | 2009 | |
United Kingdom | 2013 | |
United States | 2016 | |
Switzerland | 2017 | |
76
Note 8. Earnings Per Share
The following is a reconciliation of the shares used in calculating basic and diluted earnings per share.
Year Ended December 31, | |||||||||||
2019 | 2018 | 2017 | |||||||||
Net income attributable to Xylem (in millions) | $ | $ | $ | ||||||||
Shares (in thousands): | |||||||||||
Weighted average common shares outstanding | |||||||||||
Add: Participating securities (a) | |||||||||||
Weighted average common shares outstanding — Basic | |||||||||||
Plus incremental shares from assumed conversions: (b) | |||||||||||
Dilutive effect of stock options | |||||||||||
Dilutive effect of restricted stock units and performance share units | |||||||||||
Weighted average common shares outstanding — Diluted | |||||||||||
Basic earnings per share | $ | $ | $ | ||||||||
Diluted earnings per share | $ | $ | $ | ||||||||
(a) | Restricted stock awards containing rights to non-forfeitable dividends that participate in undistributed earnings with common shareholders are considered participating securities for purposes of computing earnings per share. |
(b) |
Year Ended December 31, | ||||||||
(in thousands) | 2019 | 2018 | 2017 | |||||
Stock options | ||||||||
Restricted stock units | ||||||||
Performance share units | ||||||||
Note 9. Inventories
The components of total inventories are summarized as follows:
December 31, | |||||||
(in millions) | 2019 | 2018 | |||||
Finished goods | $ | $ | |||||
Work in process | |||||||
Raw materials | |||||||
Total inventories | $ | $ | |||||
77
Note 10. Property, Plant and Equipment
The components of total property, plant and equipment, net are as follows:
December 31, | |||||||
(in millions) | 2019 | 2018 | |||||
Land, buildings and improvements | $ | $ | |||||
Machinery and equipment | |||||||
Equipment held for lease or rental | |||||||
Furniture and fixtures | |||||||
Construction work in progress | |||||||
Other | |||||||
Total property, plant and equipment, gross | |||||||
Less accumulated depreciation | |||||||
Total property, plant and equipment, net | $ | $ | |||||
Depreciation expense was $117 million, $117 million, and $109 million for 2019, 2018, and 2017, respectively.
Note 11. Leases
As discussed in Note 2, “Recently Issued Accounting Pronouncements,” Xylem adopted the new guidance on accounting for leases.
Leasing Arrangements
We lease certain offices, manufacturing buildings, transportation equipment, machinery, computers and other equipment. Our most significant lease liabilities relate to real estate leases. These leases include renewal, termination or purchase options, and we have assessed these to determine whether it is reasonably certain for us to exercise any of the previously mentioned options. All periods relating to options that are reasonably certain to be exercised have been included in the lease term of the respective leases.
We did not identify any events or conditions during the twelve month period ended December 31, 2019 to indicate that a reassessment or re-measurement of our existing leases was required. There also were no impairment indicators identified during the twelve month period ended December 31, 2019 that required an impairment test for the Company’s ROU assets.
Our current lease liabilities of $61 million are included in "Accrued and other current liabilities" and our non-current lease liabilities of $185 million are included in "Other non-current accrued liabilities" as of December 31, 2019. Our ROU asset balances are included in "Other non-current assets". The net balance of our ROU assets as of December 31, 2019 was $241 million. These balances include an immaterial amount related to finance leases.
The components of our lease cost were as follows:
Year Ended | |||
(in millions) | December 31, 2019 | ||
Lease cost | |||
Operating lease cost | $ | ||
Short-term lease cost | |||
Variable lease cost | |||
Total lease cost | $ | ||
78
The supplemental cash flow information related to leases are as follows:
Year Ended | |||
(in millions) | December 31, 2019 | ||
Cash paid for amounts included in the measurement of lease liabilities: | |||
Operating cash flows from operating leases | $ | ||
Right-of-use assets obtained in exchange for lease obligations: | |||
Operating leases | $ | ||
Information relating to the lease term and discount rate are as follows:
Year Ended | |
December 31, 2019 | |
Weighted-average remaining lease term (years) | |
Operating leases | |
Weighted-average discount rate | |
Operating leases | |
As of December 31, 2019, the maturities of operating lease liabilities were as follows:
(in millions) | |||
2020 | $ | ||
2021 | |||
2022 | |||
2023 | |||
2024 | |||
Thereafter | |||
Total lease payments | |||
Less: Imputed interest | ( | ) | |
Total | $ | ||
Disclosures related to periods prior to adoption of the New Lease Standard as reported and provided in our 2018 Annual Report.
We lease certain offices, manufacturing buildings, machinery, computers and other equipment. We often pay maintenance, insurance and tax expense related to leased assets. Total rent expense for the two years ended December 31, 2018 was as follows:
(in millions) | Total | |
2018 | ||
2017 | ||
79
As of December 31, 2018, we were obligated to make minimum future rental payments under operating leases as follows:
(in millions) | |||
2019 | $ | ||
2020 | |||
2021 | |||
2022 | |||
2023 | |||
Thereafter | |||
Total lease payments | |||
Lessor arrangements
In addition to manufacturing and selling equipment, we also lease out equipment to customers in exchange for consideration. These arrangements are generally short term in nature and predominantly involve the rental of pumps and accessories within the Water Infrastructure segment. Rental arrangements generally do not provide the customer the right to purchase the equipment as Xylem’s strategy is to rent these items over their useful lives. Customers may be billed based on daily, weekly or monthly rates depending on the expected rental period. We assessed that these arrangements constitute a lease under ASC 842, and have recognized them as operating leases. In situations where arrangements contain both the sale of products and a leasing component, contract consideration is allocated based on relative standalone selling price.
Total revenue from lease arrangements was $247 million for the twelve month period ended December 31, 2019. Our gross assets available for rent and related accumulated amortization were $256 million and $166 million, respectively, as of December 31, 2019. Depreciation expense for these assets were $28 million for the twelve month period ended December 31, 2019.
Note 12. Goodwill and Other Intangible Assets
Goodwill
Changes in the carrying value of goodwill by reportable segment during the years ended December 31, 2019 and 2018 are as follows:
(in millions) | Water Infrastructure | Applied Water | Measurement & Control Solutions | Total | |||||||||||
Balance as of December 31, 2017 | $ | $ | $ | $ | |||||||||||
Activity in 2018 | |||||||||||||||
Divested/acquired | |||||||||||||||
Foreign currency and other | ( | ) | ( | ) | ( | ) | ( | ) | |||||||
Balance as of December 31, 2018 | $ | $ | $ | $ | |||||||||||
Activity in 2019 | |||||||||||||||
Acquired | |||||||||||||||
Impairment | ( | ) | ( | ) | |||||||||||
Foreign currency and other | ( | ) | ( | ) | ( | ) | ( | ) | |||||||
Balance as of December 31, 2019 | $ | $ | $ | $ | |||||||||||
During the third quarter of 2019, the Company recorded a goodwill impairment charge of $148 million related to the Advanced Infrastructure Analytics (“AIA”) goodwill reporting unit. The impairment resulted from a downward revision of forecasted future cash flows. Factors that contributed to the revised forecast in the third quarter include lower than expected results as compared to prior forecasts, largely as a result of slower-than-expected conversion of pipeline opportunities to revenue. Additionally, we have continued to invest in the AIA platform ahead of the adoption curve, which has also impacted the near-term profitability of the business. These factors drove the decrease in forecasted cash flows, and as such, the calculated fair value of the AIA reporting unit below its carrying value as of the July 1, 2019.
80
To determine the fair value of the AIA reporting unit, the Company used the income approach. Under the income approach, the fair value of the AIA reporting unit was based on the present value of the estimated cash flows that the reporting unit is expected to generate over its remaining life. Cash flow projections were based on management’s estimates of revenue growth rates and operating margins, taking into consideration industry and market conditions. The discount rate was based on the weighted average cost of capital appropriate for the AIA reporting unit.
During the fourth quarter of 2019, we performed our annual impairment assessment and determined that the estimated fair values of our goodwill reporting units were in excess of each of their carrying values. However, future goodwill impairment tests could result in a charge to earnings. We will continue to evaluate goodwill on an annual basis as of the beginning of our fourth quarter and whenever events and changes in circumstances indicate there may be a potential impairment.
Other Intangible Assets
Information regarding our other intangible assets is as follows:
(in millions) | December 31, 2019 | December 31, 2018 | |||||||||||||||||||||
Carrying Amount | Accumulated Amortization | Net Intangibles | Carrying Amount | Accumulated Amortization | Net Intangibles | ||||||||||||||||||
Customer and distributor relationships | $ | $ | ( | ) | $ | $ | $ | ( | ) | $ | |||||||||||||
Proprietary technology and patents | ( | ) | ( | ) | |||||||||||||||||||
Trademarks | ( | ) | ( | ) | |||||||||||||||||||
Software | ( | ) | ( | ) | |||||||||||||||||||
Other | ( | ) | ( | ) | |||||||||||||||||||
Indefinite-lived intangibles | — | — | |||||||||||||||||||||
Other intangibles | $ | $ | ( | ) | $ | $ | $ | ( | ) | $ | |||||||||||||
We determined that no impairment of the indefinite-lived intangibles existed as of the measurement date of our impairment assessment in 2019 or 2018. Future impairment tests could result in a charge to earnings. We will continue to evaluate the indefinite-lived intangible assets on an annual basis as of the beginning of our fourth quarter and whenever events and changes in circumstances indicate there may be a potential impairment.
Customer and distributor relationships, proprietary technology and patents, trademarks, software and other are amortized over weighted average lives of approximately 14 years, 14 years, 13 years, 6 years and 3 years, respectively.
Total amortization expense for intangible assets was $140 million, $144 million, and $125 million for 2019, 2018 and 2017, respectively.
Estimated amortization expense for each of the five succeeding years is as follows:
(in millions) | |||
2020 | $ | ||
2021 | |||
2022 | |||
2023 | |||
2024 | |||
During the third quarter of 2019, the Company also assessed whether the carrying amounts of the AIA reporting unit’s long-lived assets may not be recoverable based on the revised forecasted cash flows, and therefore impaired. Our assessment resulted in an impairment charge of $7 million, primarily related to customer relationships, proprietary technology, software and property, plant and equipment. The charge was calculated using an income approach, which is considered a Level 3 input for fair value measurement, and is reflected in “Restructuring and asset impairment charges” in our Consolidated Income Statements.
81
During the first quarter of 2019, we determined that the intended use of a finite lived customer relationship within the test application of our Measurement & Control Solutions segment had changed. Accordingly we recorded a $3 million impairment charge. The charge was also calculated using the income approach and is reflected in “Restructuring and asset impairment charges” in our Consolidated Income Statements.
Note 13. Derivative Financial Instruments
Risk Management Objective of Using Derivatives
We are exposed to certain risks arising from both our business operations and economic conditions, and we principally manage our exposures to these risks through management of our core business activities. Certain of our foreign operations expose us to fluctuations of interest rates and exchange rates that may impact revenue, expenses, cash receipts, cash payments, and the value of our stockholders' equity. We enter into derivative financial instruments to protect the value or fix the amount of certain cash flows in terms of the functional currency of the business unit with that exposure and reduce the volatility in stockholders' equity.
Cash Flow Hedges of Foreign Exchange Risk
We are exposed to fluctuations in various foreign currencies against our functional currencies. We use foreign currency derivatives, including currency forward agreements, to manage our exposure to fluctuations in the various exchange rates. Currency forward agreements involve fixing the foreign currency exchange rate for delivery of a specified amount of foreign currency on a specified date.
Certain business units with exposure to foreign currency exchange risks have designated certain currency forward agreements as cash flow hedges of forecasted intercompany inventory purchases and sales. Our principal currency exposures relate to the Euro, Swedish Krona, British Pound, Canadian Dollar, Polish Zloty, and Australian Dollar. We had foreign exchange contracts with purchase notional amounts totaling $0 million and $506 million as of December 31, 2019 and 2018, respectively. As of December 31, 2018, our most significant foreign currency derivatives included contracts to sell U.S. Dollar and purchase Euro, purchase Swedish Krona and sell Euro, sell British Pound and purchase Euro, purchase Polish Zloty and sell Euro, purchase U.S. Dollar and sell Canadian Dollar and to sell Canadian Dollar and purchase Euro. The purchase notional amounts associated with these currency derivatives were $191 million, $168 million, $52 million, $37 million, $29 million and $22 million, respectively. We entered into new foreign exchange contracts as of the first quarter of 2020.
Hedges of Net Investments in Foreign Operations
We are exposed to changes in foreign currencies impacting our net investments held in foreign subsidiaries.
Cross Currency Swaps
Beginning in 2015, we entered into cross currency swaps to manage our exposure to fluctuations in the Euro-U.S. Dollar exchange rate. During the second quarter of 2019 we entered into additional cross currency swaps. The total notional amount of derivative instruments designated as net investment hedges was $714 million and $426 million as of December 31, 2019 and 2018, respectively.
Foreign Currency Denominated Debt
On March 11, 2016, we issued 2.250 % Senior Notes of €500 million aggregate principal amount due March 2023. We designated the entirety of the outstanding balance, or $554 million and $566 million as of December 31, 2019 and 2018, respectively, net of unamortized discount, as a hedge of a net investment in certain foreign subsidiaries.
82
The table below presents the effect of our derivative financial instruments on the Consolidated Income Statements and Consolidated Statements of Comprehensive Income:
Year Ended December 31, | ||||||||||||
(in millions) | 2019 | 2018 | 2017 | |||||||||
Derivatives in Cash Flow Hedges | ||||||||||||
Foreign Exchange Contracts | ||||||||||||
Amount of (loss) gain recognized in OCI (a) | $ | ( | ) | $ | ( | ) | $ | |||||
Amount of loss (gain) reclassified from OCI into revenue (a) | ( | ) | ||||||||||
Amount of loss reclassified from OCI into cost of revenue (a) | ||||||||||||
Derivatives in Net Investment Hedges | ||||||||||||
Cross Currency Swaps | ||||||||||||
Amount of gain (loss) recognized in OCI (a) | $ | $ | $ | ( | ) | |||||||
Amount income recognized in Interest Expense | ||||||||||||
Foreign Currency Denominated Debt | ||||||||||||
Amount of gain (loss) recognized in OCI (a) | $ | $ | $ | ( | ) | |||||||
(a) | Effective portion |
As of December 31, 2019, $3 million of the net losses on cash flow hedges is expected to be reclassified into earnings in the next 12 months.
As of December 31, 2019, no gains or losses on the net investment hedges are expected to be reclassified into earnings over the next 12 months.
The ineffective portion of the change in fair value of a cash flow hedge was not material for 2019, 2018, and 2017.
The net investment hedges did not experience any ineffectiveness in 2019, 2018 and 2017.
The fair values of our derivative assets and liabilities are measured on a recurring basis using Level 2 inputs and are determined through the use of models that consider various assumptions including yield curves, time value and other measurements.
The fair values of our derivative contracts currently included in our hedging program were as follows:
December 31, | |||||||
(in millions) | 2019 | 2018 | |||||
Derivatives designated as hedging instruments | |||||||
Assets | |||||||
Cash Flow Hedges | |||||||
Other current assets | $ | $ | |||||
Net Investment Hedges | |||||||
Other non-current assets | |||||||
Liabilities | |||||||
Cash Flow Hedges | |||||||
Other current liabilities | ( | ) | |||||
Net Investment Hedges | |||||||
Other non-current liabilities | ( | ) | ( | ) | |||
The fair value of our long-term debt, due in 2023, designated as a net investment hedge was $591 million and $599 million as of December 31, 2019 and 2018, respectively.
83
Note 14. Accrued and Other Current Liabilities
The components of total accrued and other current liabilities are as follows:
December 31, | |||||||
(in millions) | 2019 | 2018 | |||||
Compensation and other employee-benefits | $ | $ | |||||
Customer-related liabilities | |||||||
Accrued warranty costs | |||||||
Lease liabilities | — | ||||||
Accrued taxes | |||||||
Other accrued liabilities | |||||||
Total accrued and other current liabilities | $ | $ | |||||
Note 15. Credit Facilities and Debt
Total debt outstanding is summarized as follows:
December 31, | |||||||
(in millions) | 2019 | 2018 | |||||
4.875% Senior Notes due 2021 (a) | $ | $ | |||||
2.250% Senior Notes due 2023 (a) | |||||||
3.250% Senior Notes due 2026 (a) | |||||||
4.375% Senior Notes due 2046 (a) | |||||||
Commercial paper | |||||||
Term loan | |||||||
Debt issuance costs and unamortized discount (b) | ( | ) | ( | ) | |||
Total debt | |||||||
Less: short-term borrowings and current maturities of long-term debt | |||||||
Total long-term debt | $ | $ | |||||
(a) | The fair value of our Senior Notes (as defined below) was determined using quoted prices in active markets for identical securities, which are considered Level 1 inputs. The fair value of our Senior Notes due 2021 (as defined below) was $ |
(b) | The debt issuance costs and unamortized discount is recognized as a reduction in the carrying value of the Senior Notes in the Consolidated Balance Sheets and is being amortized to interest expense in our Consolidated Income Statements over the expected remaining terms of the Senior Notes. |
Senior Notes
On September 20, 2011, we issued 4.875 % Senior Notes of $600 million aggregate principal amount due October 2021 (the "Senior Notes due 2021"). On March 11, 2016, we issued 2.250 % Senior Notes of €500 million aggregate principal amount due March 2023 (the "Senior Notes due 2023"). On October 11, 2016, we issued 3.250 % Senior Notes of $500 million aggregate principal amount due October 2026 (the “Senior Notes due 2026”) and 4.375 % Senior Notes of $400 million aggregate principal amount due October 2046 (the “Senior Notes due 2046” and, together with the Senior Notes due 2021, the Senior Notes due 2023 and the Senior Notes due 2026, the “Senior Notes”).
The Senior Notes include covenants that restrict our ability, subject to exceptions, to incur debt secured by liens and engage in sale and leaseback transactions, as well as provide for customary events of default (subject, in certain cases, to receipt of notice of default and/or customary grace and cure periods). We may redeem the Senior Notes, as applicable, in whole or in part, at any time at a redemption price equal to the principal amount of the Senior Notes to be redeemed, plus a make-whole premium. We may also redeem the Senior Notes in certain other circumstances, as set forth in the applicable Senior Notes indenture.
84
If a change of control triggering event (as defined in the applicable Senior Notes indenture) occurs, we will be required to make an offer to purchase the Senior Notes at a price equal to 101 % of their principal amount plus accrued and unpaid interest to the date of repurchase.
Interest on the Senior Notes due 2021 is payable on April 1 and October 1 of each year. Interest on the Senior Notes due 2023 is payable on March 11 of each year. Interest on the Senior Notes due 2026 and the Senior Notes due 2046 is payable on May 1 and November 1 of each year beginning on May 1, 2017. As of December 31, 2019, we were in compliance with all covenants for the Senior Notes.
Credit Facilities
2015 Five-Year Revolving Credit Facility
Effective March 27, 2015, Xylem entered into a five-year revolving credit facility (the "2015 Credit Facility") with Citibank, N.A., as administrative agent, and a syndicate of lenders. The 2015 Credit Facility provides for an aggregate principal amount of up to $600 million of: (i) revolving extensions of credit (the "revolving loans") outstanding at any time and (ii) the issuance of letters of credit in a face amount not in excess of $100 million outstanding at any time. The 2015 Credit Facility provides for increases of up to $200 million for a possible maximum total of $800 million in aggregate principal amount at our request and with the consent of the institutions providing such increased commitments. On March 5, 2019 Xylem terminated the 2015 Credit Facility among the Company, certain lenders and Citibank, N.A. as Administrative Agent.
2019 Five-Year Revolving Credit Facility
On March 5, 2019, Xylem entered into a five-year revolving credit facility (the “2019 Credit Facility”) with Citibank, N.A., as Administrative Agent, and a syndicate of lenders. The 2019 Credit Facility provides for an aggregate principal amount of up to $800 million (available in U.S. Dollars and in Euros), with increases of up to $200 million for a maximum aggregate principal amount of $1 billion at the request of Xylem and with the consent of the institutions providing such increased commitments.
Interest on all loans under the 2019 Credit Facility is payable either quarterly or at the expiration of any LIBOR or EURIBOR interest period applicable thereto. Borrowings accrue interest at a rate equal to, at Xylem's election, a base rate or an adjusted LIBOR or EURIBOR rate plus an applicable margin. The 2019 Credit Facility includes customary provisions for implementation of replacement rates for LIBOR-based and EURIBOR-based loans. The 2019 Credit Facility also includes a pricing grid that determines the applicable margin based on Xylem's credit rating, with a further adjustment depending on Xylem's annual Sustainalytics Environmental, Social and Governance score. Xylem will also pay quarterly fees to each lender for such lender’s commitment to lend accruing on such commitment at a rate based on our credit rating, whether such commitment is used or unused, as well as a quarterly letter of credit fee accruing on the letter of credit exposure of such lender during the preceding quarter at a rate based on the credit rating of Xylem (as adjusted for the Sustainalytics Environmental, Social and Governance score).
The 2019 Credit Facility requires that Xylem maintain a consolidated total debt to consolidated EBITDA ratio, which will be based on the last four fiscal quarters, and in addition a number of customary covenants, including limitations on the incurrence of secured debt and debt of subsidiaries, liens, sale and lease-back transactions, mergers, consolidations, liquidations, dissolutions and sales of assets. The 2019 Credit Facility also contains customary events of default. Finally, Xylem has the ability to designate subsidiaries that can borrow under the 2019 Credit Facility, subject to certain requirements and conditions set forth in the 2019 Credit Facility. As of December 31, 2019, the 2019 Credit Facility was undrawn and we are in compliance with all covenants.
Commercial Paper
U.S. Dollar Commercial Paper Program
Our U.S. Dollar commercial paper program generally serves as a means of short-term funding with a $600 million maximum issuing balance and a combined limit of $800 million inclusive of the 2019 Credit Facility. As of December 31, 2019 and 2018, none of the Company's $600 million U.S. Dollar commercial paper program was outstanding. We have the ability to continue borrowing under this program going forward in in future periods.
Euro Commercial Paper Program
On June 3, 2019 Xylem entered into a Euro commercial paper program with ING Bank N.V., as administrative
agent, and a syndicate of dealers. The Euro commercial paper program provides for a maximum issuing balance
of up to €500 million (approximately $557 million) which may be denominated in a variety of currencies. The
85
maximum issuing balance may be increased in accordance with the agreement. As of December 31, 2019, $276 million of the Company's Euro commercial paper program was outstanding at a weighted average
interest rate of (0.22 )%. We have the ability to continue borrowing under this program going forward in future
periods.
Term Loan Facility
On January 26, 2018, the Company’s subsidiary, Xylem Europe GmbH (the “borrower”) entered into a 12-month €225 million (approximately $251 million) term loan facility (the “Term Facility”) at an interest rate of 0.45 % in which the terms are set forth in a term loan agreement, among the borrower, the Company, as parent guarantor and ING Bank. The Company has entered into a parent guarantee in favor of ING Bank also dated January 26, 2018 to secure all present and future obligations of the borrower under the Term Loan Agreement. The Term Facility was used to partially fund the acquisition of Pure Technologies Ltd in 2018 and the maturity date has since been extended through February 2020. As of December 31, 2019 and December 31, 2018, $0 million and $257 million were outstanding under the Term Facility, respectively.
Note 16. Postretirement Benefit Plans
Defined contribution plans – Xylem and certain of our subsidiaries maintain various defined contribution savings plans, which allow employees to contribute a portion of their pre-tax and/or after-tax income in accordance with specified guidelines. Several of the plans require us to match a percentage of the employee contributions up to certain limits, generally between 3.0 % – 7.0 % of employee eligible pay. Matching obligations, the majority of which were funded in cash in connection with the plans, and other company contributions are as follows:
(in millions) | Defined Contribution | ||
2019 | $ | ||
2018 | |||
2017 | |||
The Xylem Stock Fund, an investment option under the defined contribution plan in which Company employees participate is considered an Employee Stock Ownership Plan. As a result, participants in the Xylem Stock Fund may receive dividends in cash or may reinvest such dividends into the Xylem Stock Fund. Company employees held approximately 302 thousand and 328 thousand shares of Xylem Inc. common stock in the Xylem Stock Fund at December 31, 2019 and 2018, respectively.
Defined benefit pension plans and other postretirement plans – We historically have maintained qualified and nonqualified defined benefit retirement plans covering certain current and former employees, including hourly and union plans as well as salaried plans, which generally require up to 5 years of service to be vested and for which the benefits are determined based on years of credited service and either specified rates, final pay, or final average pay. The other postretirement benefit plans are all unfunded plans in the U.S. and Canada.
During 2019 and 2018, we made several amendments to plans that had no material impact to the Company's financial statements.
86
Amounts recognized in the Consolidated Balance Sheets for pension and other employee-related benefit plans (collectively, postretirement plans) reflect the funded status of the postretirement benefit plans. The following table provides a summary of the funded status of our postretirement plans, the presentation of such balances and a summary of amounts recorded within accumulated other comprehensive income:
(in millions) | December 31, 2019 | December 31, 2018 | |||||||||||||||||||||
Pension | Other | Total | Pension | Other | Total | ||||||||||||||||||
Fair value of plan assets | $ | $ | $ | $ | $ | $ | |||||||||||||||||
Projected benefit obligation | ( | ) | ( | ) | ( | ) | ( | ) | ( | ) | ( | ) | |||||||||||
Funded status | $ | ( | ) | $ | ( | ) | $ | ( | ) | $ | ( | ) | $ | ( | ) | $ | ( | ) | |||||
Amounts recognized in the balance sheet | |||||||||||||||||||||||
Other non-current assets | $ | $ | $ | $ | $ | $ | |||||||||||||||||
Accrued and other current liabilities | ( | ) | ( | ) | ( | ) | ( | ) | ( | ) | ( | ) | |||||||||||
Accrued postretirement benefits | ( | ) | ( | ) | ( | ) | ( | ) | ( | ) | ( | ) | |||||||||||
Net amount recognized | $ | ( | ) | $ | ( | ) | $ | ( | ) | $ | ( | ) | $ | ( | ) | $ | ( | ) | |||||
Accumulated other comprehensive income (loss): | |||||||||||||||||||||||
Net actuarial losses | $ | ( | ) | $ | ( | ) | $ | ( | ) | $ | ( | ) | $ | ( | ) | $ | ( | ) | |||||
Prior service credit | ( | ) | ( | ) | |||||||||||||||||||
Total | $ | ( | ) | $ | ( | ) | $ | ( | ) | $ | ( | ) | $ | ( | ) | $ | ( | ) | |||||
The unrecognized amounts recorded in accumulated other comprehensive income will be subsequently recognized as expense on a straight-line basis only to the extent they exceed 10% of the higher of the market-related value or the projected benefit obligation, over the average remaining service period of active participants, or for plans with all or substantially all inactive participants, over the average remaining life expectancy. Actuarial gains and losses incurred in future periods and not recognized as expense in those periods will be recognized as increases or decreases in other comprehensive income, net of tax.
The net actuarial loss included in accumulated other comprehensive income at the end of 2019 and expected to be recognized in net periodic benefit cost during 2020 is $18 million ($14 million, net of tax). The prior service credit included in accumulated other comprehensive income to be recognized in 2020 is $3 million ($2 million, net of tax).
The Company has initiated the process for a full buy-out of its largest defined benefit plan in the UK. In order to prepare for a buy-out, the plan's assets were converted to cash, cash equivalents or other highly liquid assets as of the third quarter 2019. In addition, the Company completed an enhanced transfer value ("ETV") exercise for the deferred vested participants of the plan. The ETV offered the participants an enhanced lump sum to transfer their full pension rights out of the plan. Lump sum payments of $21 million were paid out of the plan assets, and the Company recorded a settlement charge of $8 million during the third quarter. Prior to the settlement accounting, the plan was re-measured as of July 31, 2019, resulting in an increase in the plan's projected benefit obligation of $37 million, an increase in plan assets of $26 million and an increase to losses in accumulated other comprehensive income of $11 million. The assumptions used to re-measure the plan were developed in the same manner as at December 31, 2018. However, due to the recent change in the investment assets, the expected rate of return on assets for this plan was changed from 7.25 % to 0.70 %. The discount rate used in the re-measurement was 2.00 %, down from 3.00 % at December 31, 2018. The Company recorded incremental net periodic benefit cost of $3 million in the third quarter and $5 million in the fourth quarter as a result of the re-measurement and the investment change.
87
The benefit obligation, fair value of plan assets, funded status, and amounts recognized in the consolidated financial statements for our defined benefit domestic and international pension plans were:
Domestic Plans | International Plans | ||||||||||||||
December 31, | December 31, | ||||||||||||||
(in millions) | 2019 | 2018 | 2019 | 2018 | |||||||||||
Change in benefit obligation: | |||||||||||||||
Benefit obligation at beginning of year | $ | $ | $ | $ | |||||||||||
Service cost | |||||||||||||||
Interest cost | |||||||||||||||
Benefits paid | ( | ) | ( | ) | ( | ) | ( | ) | |||||||
Actuarial loss (gain) | ( | ) | ( | ) | |||||||||||
Plan amendments, settlements and curtailments | ( | ) | |||||||||||||
Foreign currency translation/other | ( | ) | ( | ) | |||||||||||
Benefit obligation at end of year | $ | $ | $ | $ | |||||||||||
Change in plan assets: | |||||||||||||||
Fair value of plan assets at beginning of year | $ | $ | $ | ||||||||||||
Employer contributions | |||||||||||||||
Actual return on plan assets | ( | ) | ( | ) | |||||||||||
Benefits paid | ( | ) | ( | ) | ( | ) | ( | ) | |||||||
Plan amendments, settlements and curtailments | ( | ) | |||||||||||||
Foreign currency translation/other | ( | ) | ( | ) | |||||||||||
Fair value of plan assets at end of year | $ | $ | $ | $ | |||||||||||
Unfunded status of the plans | $ | ( | ) | $ | ( | ) | $ | ( | ) | $ | ( | ) | |||
The following table provides a rollforward of the projected benefit obligation for the other postretirement employee benefit plans:
(in millions) | 2019 | 2018 | |||||
Change in benefit obligation: | |||||||
Benefit obligation at beginning of year | $ | $ | |||||
Service cost | |||||||
Interest cost | |||||||
Benefits paid | ( | ) | ( | ) | |||
Actuarial gain/(loss) | ( | ) | |||||
Plan Amendment and other | ( | ) | |||||
Benefit obligation at the end of year | $ | $ | |||||
The accumulated benefit obligation (“ABO”) for all the defined benefit pension plans was $919 million and $829 million at December 31, 2019 and 2018, respectively.
For defined benefit pension plans in which the ABO was in excess of the fair value of the plans’ assets, the projected benefit obligation, ABO and fair value of the plans’ assets were as follows:
December 31, | |||||||
(in millions) | 2019 | 2018 | |||||
Projected benefit obligation | $ | $ | |||||
Accumulated benefit obligation | |||||||
Fair value of plan assets | |||||||
88
The components of net periodic benefit cost for our defined benefit pension plans are as follows:
Year Ended December 31, | |||||||||||
(in millions) | 2019 | 2018 | 2017 | ||||||||
Domestic defined benefit pension plans: | |||||||||||
Service cost | $ | $ | $ | ||||||||
Interest cost | |||||||||||
Expected return on plan assets | ( | ) | ( | ) | ( | ) | |||||
Amortization of net actuarial loss | |||||||||||
Net periodic benefit cost | $ | $ | $ | ||||||||
International defined benefit pension plans: | |||||||||||
Service cost | $ | $ | $ | ||||||||
Interest cost | |||||||||||
Expected return on plan assets | ( | ) | ( | ) | ( | ) | |||||
Amortization of net actuarial loss | |||||||||||
Settlement | |||||||||||
Net periodic benefit cost | $ | $ | $ | ||||||||
Total net periodic benefit cost | $ | $ | $ | ||||||||
The components of net periodic benefit cost other than the service cost component are included in the line item "other non-operating income (expense), net" in the Consolidated Income Statements.
Other changes in plan assets and benefit obligations recognized in other comprehensive loss, as they pertain to our defined benefit pension plans are as follows:
Year Ended December 31, | |||||||||||
(in millions) | 2019 | 2018 | 2017 | ||||||||
Domestic defined benefit pension plans: | |||||||||||
Net (gain) loss | $ | $ | $ | ||||||||
Prior service cost | |||||||||||
Amortization of net actuarial loss | ( | ) | ( | ) | ( | ) | |||||
(Gains) losses recognized in other comprehensive loss | $ | $ | ( | ) | $ | ||||||
International defined benefit pension plans: | |||||||||||
Net (gain) loss | $ | $ | $ | ||||||||
Prior service credit | |||||||||||
Amortization of net actuarial loss | ( | ) | ( | ) | ( | ) | |||||
Settlement | ( | ) | ( | ) | ( | ) | |||||
Foreign Exchange | ( | ) | |||||||||
(Gains) losses recognized in other comprehensive loss | $ | $ | $ | ||||||||
Total (gains) losses recognized in other comprehensive loss | $ | $ | $ | ||||||||
Total (gains) losses recognized in comprehensive income | $ | $ | $ | ||||||||
The components of net periodic benefit cost for other postretirement employee benefit plans are as follows:
Year Ended December 31, | |||||||||||
(in millions) | 2019 | 2018 | 2017 | ||||||||
Service cost | $ | $ | $ | ||||||||
Interest cost | |||||||||||
Amortization of prior service credit | ( | ) | ( | ) | ( | ) | |||||
Amortization of net actuarial loss | |||||||||||
Net periodic benefit cost | $ | $ | $ | ||||||||
89
Other changes in benefit obligations recognized in other comprehensive loss, as they pertain to other postretirement employee benefit plans are as follows:
Year Ended December 31, | |||||||||||
(in millions) | 2019 | 2018 | 2017 | ||||||||
Net loss (gain) | $ | ( | ) | $ | $ | ( | ) | ||||
Prior service credit | ( | ) | ( | ) | |||||||
Amortization of prior service credit | |||||||||||
Amortization of net actuarial loss | ( | ) | ( | ) | ( | ) | |||||
Foreign Exchange/Other | ( | ) | |||||||||
Losses (gains) recognized in other comprehensive loss | $ | $ | $ | ( | ) | ||||||
Total losses (gains) recognized in comprehensive income | $ | $ | $ | ( | ) | ||||||
Assumptions
The following table provides the weighted-average assumptions used to determine projected benefit obligations and net periodic benefit cost, as they pertain to our pension plans.
2019 | 2018 | 2017 | |||||||||||||||
U.S. | Int’l | U.S. | Int’l | U.S. | Int’l | ||||||||||||
Benefit Obligation Assumptions | |||||||||||||||||
Discount rate | % | % | % | % | % | % | |||||||||||
Rate of future compensation increase | NM | % | NM | % | NM | % | |||||||||||
Net Periodic Benefit Cost Assumptions | |||||||||||||||||
Discount rate | % | % | % | % | % | % | |||||||||||
Expected long-term return on plan assets | % | % | % | % | % | % | |||||||||||
Rate of future compensation increase | NM | % | NM | % | NM | % | |||||||||||
NM | Not meaningful. The pension benefits for future service for all the U.S. pension plans are based on years of service and not impacted by future compensation increases. |
Management develops each assumption using relevant company experience in conjunction with market-related data for each individual country in which plans exist. Assumptions are reviewed annually and adjusted as necessary.
The expected long-term rate of return on assets reflects the expected returns for each major asset class in which the plans hold investments, the weight of each asset class in the target mix, the correlations among asset classes and their expected volatilities. The assets of the pension plans are held by a number of independent trustees, managed by several investment institutions and are accounted for separately in the Company’s pension funds.
Our expected return on plan assets is estimated by evaluating both historical returns and estimates of future returns. Specifically, we analyze the plans’ actual historical annual return on assets, net of fees, over the past 15, 20 and 25 years; estimate future returns based on independent estimates of asset class returns; and evaluate historical broad market returns over long-term timeframes based on our asset allocation range. For the U.S. Master Trust which has only existed since 2011, historical returns were estimated using a constructed portfolio that reflects the Company’s strategic asset allocation and the historical compound geometric returns of each asset class for the longest time period available. Based on this approach, the weighted average expected long-term rate of return for all of our plan assets to be used in determining net periodic benefit costs for 2020 is estimated at 3.46 %.
90
The table below provides the weighted average actual rate of return generated on all of our plan assets during each of the years presented as compared to the weighted average expected long-term rates of return utilized in calculating the net periodic benefit costs.
2019 | 2018 | 2017 | ||||||
Expected long-term rate of return on plan assets | % | % | % | |||||
Actual rate of return (loss) on plan assets | % | ( | )% | % | ||||
The assumed rate of future increases in the per capita cost of health care (the health care trend rate) is 6.53 % for 2020, decreasing ratably to 4.50 % in 2028. An increase or decrease in the health care trend rates by one percent per year would impact the aggregate annual service and interest components by less than $1 million, and impact the benefit obligation by approximately $3 million.
Investment Policy
The investment strategy for managing worldwide postretirement benefit plan assets is to seek an optimal rate of return relative to an appropriate level of risk for each plan. Investment strategies vary by plan, depending on the specific characteristics of the plan, such as plan size and design, funded status, liability profile and legal requirements. In general, the plans are managed closely to their strategic allocations.
During 2019 the Company updated its investment policy for the Xylem UK Pension Plan (the "UK Plan"), its largest defined benefit plan in the UK, to prepare for a full buy-out. As of the third quarter, the UK Plan's assets were converted to cash, cash equivalents or other highly liquid assets. At December 31, 2019, the assets of the UK Plan were held in cash or cash equivalents, hedging instruments and government bonds for $272 million, $35 million and $11 million, respectively.
The following table provides the actual asset allocations of plan assets as of December 31, 2019 and 2018, and the related asset target allocation ranges by asset category.
2019 | 2018 | Target Allocation Ranges | |||||
Equity securities | % | % | 15-60% | ||||
Fixed income | % | % | 10-50% | ||||
Hedge funds | % | % | 0-40% | ||||
Private equity | % | % | 0-30% | ||||
Cash, insurance contracts and other | % | % | 0-60% | ||||
Fair Value of Plan Assets
In measuring plan assets at fair value, the fair value hierarchy is applied which categorizes and prioritizes the inputs used to estimate fair value into three levels. See Note 1 "Summary of Significant Accounting Policies" for further detail on fair value hierarchy.
In certain instances, fair value is estimated using quoted market prices obtained from external pricing services. In obtaining such data from the pricing service, we have evaluated the methodologies used to develop the estimate of fair value in order to assess whether such valuations are representative of fair value, including net asset value ("NAV"). Additionally, in certain circumstances, the NAV reported by an asset manager may be adjusted when sufficient evidence indicates NAV is not representative of fair value.
The following is a description of the valuation methodologies and inputs used to measure fair value for major categories of investments.
• | Equity securities — Equities (including common and preferred shares, domestic listed and foreign listed, closed end mutual funds and exchange traded funds) are generally valued at the closing price reported on the major market on which the individual securities are traded at the measurement date. Equity securities held by the Company that are publicly traded in active markets are classified within Level 1 of the fair value hierarchy. Those equities that are held in proprietary funds pooled with other investor accounts measured at fair value using the NAV per share practical expedient are not classified in the fair value hierarchy. |
• | Fixed income — United States government securities are generally valued using quoted prices of securities with similar characteristics. Corporate bonds and notes are generally valued by using pricing models (e.g. |
91
discounted cash flows), quoted prices of securities with similar characteristics or broker quotes. Fixed income securities listed on active markets are classified in Level 1. Fixed income held in proprietary funds pooled with other investor accounts measured at fair value using the NAV per share practical expedient are not classified in the fair value hierarchy. Hedging instruments are collateralized daily with either cash or government bonds, have daily liquidity and pricing based on observable inputs from over-the-counter markets, and are classified as Level 2.
• | Hedge funds — Hedge funds are pooled funds that employ a range of investment strategies including equity and fixed income, credit driven, macro and multi-oriented strategies. The valuation of limited partnership interests in hedge funds may require significant management judgment. Generally, hedge funds are valued using the NAV reported by the asset manager, and are adjusted when it is determined that NAV is not representative of fair value. In making such an assessment, a variety of factors is reviewed, including, but not limited to, the timeliness of NAV as reported by the asset manager and changes in general economic and market conditions subsequent to the last NAV reported by the asset manager. All of the hedge funds held have lockups and/or gates. Hedge funds have unfunded commitments of $ |
• | Private equity — Private equity includes a diversified range of strategies, including buyout funds, distressed funds, venture and growth equity funds and mezzanine funds with long-term commitments, and redemptions beginning no earlier than 2019. The valuation of limited partnership interests in private equity funds may require significant management judgment. Generally, private equity is valued using the NAV reported by the asset manager, and is adjusted when it is determined that NAV is not representative of fair value. In making such an assessment, a variety of factors is reviewed, including, but not limited to, the timeliness of NAV as reported by the asset manager and changes in general economic and market conditions subsequent to the last NAV reported by the asset manager. Private equity is not liquid and has unfunded commitments of $ |
• | Cash, insurance contracts and other — Primarily comprised of insurance contracts and cash. Insurance contracts are valued at contract value, which approximates fair value, and is calculated using the prior year balance adjusted for investment returns and cash flows and are generally classified as Level 3. Insurance contracts are held by certain foreign pension plans. Cash and cash equivalents are held in accounts with brokers or custodians for liquidity and investment collateral and are classified as Level 1. |
92
The following table provides the fair value of plan assets held by our pension benefit plans by asset class:
2019 | 2018 | ||||||||||||||||||||||||||||||
(in millions) | Level 1 | Level 2 | Level 3 | NAV Practical Expedient | Total | Level 1 | Level 2 | Level 3 | NAV Practical Expedient | Total | |||||||||||||||||||||
Equity securities | |||||||||||||||||||||||||||||||
Global stock funds/securities | $ | $ | $ | $ | $ | $ | $ | $ | $ | $ | |||||||||||||||||||||
Index funds | |||||||||||||||||||||||||||||||
Diversified Growth and Income Funds | — | — | — | — | — | — | |||||||||||||||||||||||||
Fixed income | |||||||||||||||||||||||||||||||
Corporate bonds | |||||||||||||||||||||||||||||||
Government bonds | |||||||||||||||||||||||||||||||
Hedging Instruments | — | — | — | — | |||||||||||||||||||||||||||
Diversified Growth and Income Funds | — | — | — | — | — | — | |||||||||||||||||||||||||
Hedge funds | |||||||||||||||||||||||||||||||
Private equity | — | — | — | — | — | — | |||||||||||||||||||||||||
Insurance contracts and other | |||||||||||||||||||||||||||||||
Cash & Cash Equivalents | |||||||||||||||||||||||||||||||
Total plan assets subject to leveling | $ | $ | $ | $ | $ | $ | $ | $ | $ | $ | |||||||||||||||||||||
The following table presents a reconciliation of the beginning and ending balances of fair value measurement within our pension plans using significant unobservable inputs (Level 3):
(in millions) | Insurance Contracts and Other | |||
Balance, December 31, 2017 | $ | |||
Purchases, sales, settlements | ( | ) | ||
Currency impact | ||||
Balance, December 31, 2018 | $ | |||
Purchases, sales, settlements | ||||
Currency impact | ||||
Balance, December 31, 2019 | $ | |||
Contributions and Estimated Future Benefit Payments
Funding requirements under governmental regulations are a major consideration in making contributions to our postretirement plans. We made contributions of $19 million and $41 million to our pension and postretirement defined benefit plans during 2019 and 2018, respectively. A discretionary contribution was made to the U.S. Plan in the third quarter of 2018 for $19 million to increase the funding ratio and reduce regulatory fees. We currently anticipate making contributions to our pension and postretirement defined benefit plans in the range of $15 million to $25 million during 2020, of which approximately $5 million is expected to be made in the first quarter.
93
The following benefit payments, which reflect expected future service, as appropriate, are expected to be paid as follows:
(in millions) | Pension | Other Benefits | |||||
2020 | $ | $ | |||||
2021 | |||||||
2022 | |||||||
2023 | |||||||
2024 | |||||||
Years 2025 - 2029 | |||||||
Note 17. Stock-Based Compensation Plans
Our stock-based compensation program is a broad-based program designed to attract and retain employees while also aligning employees’ interests with the interests of our shareholders. In addition, members of our Board of Directors participate in our stock-based compensation program in connection with their service on our board. Share-based awards issued to employees include non-qualified stock options, restricted stock unit awards and performance share unit awards. Under the 2011 Omnibus Incentive Plan, the number of shares initially available for awards was 18 million. As of December 31, 2019, there were approximately 6 million shares of common stock available for future grants.
Total share-based compensation costs recognized for 2019, 2018 and 2017 were $29 million, $30 million, and $21 million, respectively. The unamortized compensation expense at December 31, 2019 related to our stock options, restricted share units and performance share units was $6 million, $22 million and $10 million, respectively, and is expected to be recognized over a weighted average period of 1.8, 1.8 and 1.3 years, respectively.
The amount of cash received from the exercise of stock options was $13 million for 2019 with a tax benefit of $13 million realized associated with stock option exercises and vesting of restricted stock units. We classify as an operating activity the cash flows attributable to excess tax benefits arising from stock option exercises and restricted stock unit vestings.
Stock Option Grants
Options are awarded with a contractual term of ten years and generally vest over a three-year period and are exercisable within the contractual term, except in certain instances of death, retirement or disability. The exercise price per share is the fair market value of the underlying common stock on the date each option is granted. At December 31, 2019, there were options to purchase an aggregate of 2.0 million shares of common stock. The following is a summary of the changes in outstanding stock options for 2019:
Share units (in thousands) | Weighted Average Exercise Price / Share | Weighted Average Remaining Contractual Term (Years) | Aggregate Intrinsic Value (in millions) | |||||||||
Outstanding at January 1, 2019 | $ | 6.5 | ||||||||||
Granted | $ | |||||||||||
Exercised | ( | ) | $ | |||||||||
Forfeited and expired | ( | ) | $ | |||||||||
Outstanding at December 31, 2019 | $ | 6.3 | $ | |||||||||
Options exercisable at December 31, 2019 | $ | 5.3 | $ | |||||||||
Vested and non-vested expected to vest as of December 31, 2019 | $ | 6.2 | $ | |||||||||
The amount of non-vested options outstanding was 0.6 million, 0.7 million and 0.9 million at a weighted average fair value of $69.30 , $58.00 and $42.84 as of December 31, 2019, 2018 and 2017, respectively. The total intrinsic value of options exercised (which is the amount by which the stock price exceeded the exercise price of the options on the date of exercise) during 2019, 2018 and 2017 was $15 million, $9 million and $14 million, respectively.
94
The fair value of each option grant was estimated on the date of grant using the binomial lattice pricing model which incorporates multiple and variable assumptions over time, including assumptions such as employee exercise patterns, stock price volatility and changes in dividends. The following are weighted-average assumptions used for 2019, 2018, and 2017:
2019 | 2018 | 2017 | |||||||||
Dividend yield | % | % | % | ||||||||
Volatility | % | % | % | ||||||||
Risk-free interest rate | % | % | % | ||||||||
Expected term (in years) | 5.4 | 5.1 | 5.1 | ||||||||
Weighted-average fair value per option | $ | $ | $ | ||||||||
Expected volatility is calculated based on a weighted analysis of historic and implied volatility measures for a set of peer companies and Xylem. We use historical data to estimate option exercise and employee termination behavior within the valuation model. Employee groups and option characteristics are considered separately for valuation purposes. The expected term represents an estimate of the period of time options are expected to remain outstanding. The risk-free rate is based on the U.S. Treasury yield curve in effect at the time of option grant.
Restricted Stock Unit Grants
Restricted shares granted to employees in 2019, 2018 and 2017 vest over a three-year period. Restricted shares granted to employees prior to 2017 generally become fully vested upon the third anniversary of the date of grant. Prior to the time a restricted share becomes fully vested, the awardees cannot transfer, pledge, hypothecate or encumber such shares. Prior to the time a restricted share is fully vested, the awardees do not have certain rights of a stockholder, such as the right to vote and receive dividends; however, dividends accrue during the vesting period and are paid upon vesting. If an employee leaves prior to vesting, whether through resignation or termination for cause, the restricted stock unit and related accrued dividends are forfeited. If an employee retires, a pro rata portion of the restricted stock unit may vest in accordance with the terms of the grant agreements. Restricted stock units granted to Board members become fully vested upon the day prior to the next annual meeting. The fair value of the restricted share unit awards is determined using the closing price of our common stock on date of grant.
Our restricted stock units activity was as follows for 2019:
Share Units (in thousands) | Weighted Average Grant Date Fair Value / Share | |||||
Outstanding at January 1, 2019 | $ | |||||
Granted | ||||||
Vested | ( | ) | ||||
Forfeited | ( | ) | ||||
Outstanding at December 31, 2019 | ||||||
Performance Share Units
Performance share units granted under the long-term incentive plan vest based upon performance by the Company over a three-year period against targets approved by the Compensation Committee of the Company's Board of Directors prior to the grant date. For the performance periods, the performance share units were granted at a target of 100 % with actual payout contingent upon the achievement of a pre-set, three-year adjusted Return on Invested Capital and cumulative adjusted net income performance target for ROIC performance share units and a relative TSR performance for TSR performance share units. The calculated compensation cost for ROIC performance share units is adjusted based on an estimate of awards ultimately expected to vest and our assessment of the probable outcome of the performance condition.
ROIC Performance Share Unit Grants
The fair value of the ROIC performance share unit awards is determined using the closing price of our common stock on date of grant.
95
Our ROIC performance share unit activity was as follows for 2019:
Share units (in thousands) | Weighted Average Grant Date Fair Value / Share | |||||
Outstanding at January 1, 2019 | $ | |||||
Granted | ||||||
Adjustment for Performance Condition Achieved (a) | ||||||
Vested | ( | ) | ||||
Forfeited | ( | ) | ||||
Outstanding at December 31, 2019 | ||||||
(a) Represents an increase in the number of original ROIC performance share units awarded based on the final performance criteria achievement at the end of the performance period of such awards.
TSR Performance Share Unit Grants
The following is a summary of our TSR performance share unit grants for 2019:
Share units (in thousands) | Weighted Average Grant Date Fair Value / Share | |||||
Outstanding at January 1, 2019 | $ | |||||
Granted | ||||||
Adjustment for Performance Condition Achieved (a) | ||||||
Vested | ( | ) | ||||
Forfeited | ( | ) | ||||
Outstanding at December 31, 2019 | ||||||
(a) Represents an increase in the number of original TSR performance share units awarded based on the final market condition achievement at the end of the performance period of such awards.
The fair value of TSR performance share units were calculated on the date of grant using a Monte Carlo simulation model utilizing several key assumptions, including expected Company and peer company share price volatility, correlation coefficients between peers, the risk-free rate of return, the expected dividend yield and other award design features. The following are weighted-average key assumptions for 2019 grants.
Volatility | % | |
Risk-free interest rate | % | |
Note 18. Capital Stock
The Company has the authority to issue an aggregate of 750 million shares of common stock having a par value of $0.01 per share. The stockholders of Xylem common stock are entitled to receive dividends as declared by the Xylem Board of Directors. Dividends declared were $0.96 , $0.84 and $0.72 during 2019, 2018 and 2017, respectively.
The changes in shares of common stock outstanding for the three years ended December 31 are as follows:
(share units in thousands) | 2019 | 2018 | 2017 | |||||
Beginning Balance, January 1 | ||||||||
Stock incentive plan net activity | ||||||||
Repurchase of common stock | ( | ) | ( | ) | ( | ) | ||
Ending Balance, December 31 | ||||||||
96
For the years ended December 31, 2019 and December 31, 2018 the Company repurchased 0.5 million shares of common stock for $40 million and repurchased 0.8 million shares of common stock for $59 million, respectively. Repurchases include both share repurchase programs approved by the Board of Directors and repurchases in relation to settlement of employee income tax withholding obligations due as a result of the vesting of restricted stock units. The detail of repurchases by each program are as follows:
On August 24, 2015, our Board of Directors authorized the repurchase of up to $500 million in shares with no expiration date. The program's objective is to deploy our capital in a manner that benefits our shareholders and maintains our focus on growth. For the year ended December 31, 2019 we repurchased 0.3 million shares for $25 million. For the year ended December 31, 2018 we repurchased 0.7 million shares for $50 million. There are up to $338 million in shares that may still be purchased under this plan as of December 31, 2019.
On August 18, 2012, the Board of Directors authorized the repurchase of up to 2.0 million shares of common stock with no expiration date. The program's objective is to offset dilution associated with various Xylem employee stock plans by acquiring shares in the open market from time to time. For the year ended December 31, 2017 we repurchased 0.3 million shares for $13 million. As of June 2017, we have exhausted the authorized amount to repurchase shares under this plan.
Aside from the aforementioned repurchase programs, we repurchased 0.2 million and 0.1 million shares for $15 million and $9 million during 2019 and 2018, respectively, in relation to settlement of employee income tax withholding obligations due as a result of the vesting of restricted stock units. These repurchases are included in the stock incentive plan net activity in the above table.
Note 19. Accumulated Other Comprehensive Loss
The following table provides the components of accumulated other comprehensive loss for 2019, 2018 and 2017:
(in millions) | Foreign Currency Translation | Postretirement Benefit Plans | Derivative Instruments | Total | |||||||||||
Balance at January 1, 2017 | $ | ( | ) | $ | ( | ) | $ | ( | ) | $ | ( | ) | |||
Foreign currency translation adjustment | |||||||||||||||
Income tax impact on foreign currency translation adjustment | |||||||||||||||
Changes in postretirement benefit plans | ( | ) | ( | ) | |||||||||||
Income tax expense on changes in postretirement benefit plans | |||||||||||||||
Foreign currency translation adjustment for postretirement benefit plans | ( | ) | ( | ) | |||||||||||
Amortization of prior service cost and net actuarial loss on postretirement benefit plans into other non-operating income (expense), net | |||||||||||||||
Income tax impact on amortization of postretirement benefit plan items | ( | ) | ( | ) | |||||||||||
Unrealized loss on derivative hedge agreements | |||||||||||||||
Reclassification of unrealized (gain) loss on foreign exchange agreements into revenue | ( | ) | ( | ) | |||||||||||
Reclassification of unrealized (gain) loss on foreign exchange agreements into cost of revenue | — | ||||||||||||||
Balance at December 31, 2017 | $ | ( | ) | $ | ( | ) | $ | $ | ( | ) | |||||
97
(in millions) | Foreign Currency Translation | Postretirement Benefit Plans | Derivative Instruments | Total | |||||||||||
Cumulative effect of change in accounting principle | ( | ) | ( | ) | ( | ) | |||||||||
Foreign currency translation adjustment | ( | ) | ( | ) | |||||||||||
Income tax impact on foreign currency translation adjustment | ( | ) | ( | ) | |||||||||||
Changes in postretirement benefit plans | ( | ) | ( | ) | |||||||||||
Foreign currency translation adjustment for postretirement benefit plans | |||||||||||||||
Income tax expense on changes in postretirement benefit plans | |||||||||||||||
Amortization of prior service cost and net actuarial loss on postretirement benefit plans into other non-operating income (expense), net | |||||||||||||||
Income tax impact on amortization of postretirement benefit plan items | ( | ) | ( | ) | |||||||||||
Unrealized loss on derivative hedge agreements | ( | ) | ( | ) | |||||||||||
Reclassification of unrealized (gain) loss on foreign exchange agreements into cost of revenue | |||||||||||||||
Balance at December 31, 2018 | $ | ( | ) | $ | ( | ) | $ | ( | ) | $ | ( | ) | |||
Foreign currency translation adjustment | |||||||||||||||
Income tax impact on foreign currency translation adjustment | ( | ) | — | ( | ) | ||||||||||
Changes in postretirement benefit plans | ( | ) | ( | ) | |||||||||||
Settlement charge released into other non-operating income (expense), net | |||||||||||||||
Foreign currency translation adjustment for postretirement benefit plans | ( | ) | ( | ) | |||||||||||
Income tax expense on changes in postretirement benefit plans, including settlement | |||||||||||||||
Amortization of prior service cost and net actuarial loss on postretirement benefit plans into other non-operating income (expense), net | |||||||||||||||
Income tax impact on amortization of postretirement benefit plan items | ( | ) | ( | ) | |||||||||||
Unrealized loss on derivative hedge agreements | ( | ) | ( | ) | |||||||||||
Reclassification of unrealized loss on foreign exchange agreements into revenue | |||||||||||||||
Reclassification of unrealized loss on foreign exchange agreements into cost of revenue | |||||||||||||||
Balance at December 31, 2019 | $ | ( | ) | $ | ( | ) | $ | ( | ) | $ | ( | ) | |||
Note 20. Commitments and Contingencies
Legal Proceedings
From time to time we are involved in legal and regulatory proceedings that are incidental to the operation of our businesses (or the business operations of previously-owned entities). These proceedings may seek remedies relating to environmental matters, tax, intellectual property matters, acquisitions or divestitures, product liability and personal injury claims, privacy, employment, labor and pension matters, government contract issues and commercial or contractual disputes.
98
From time to time, claims may be asserted against Xylem alleging injury caused by any of our products resulting from asbestos exposure. We believe there are numerous legal defenses available for such claims and would defend ourselves vigorously. Pursuant to the Distribution Agreement among ITT Corporation (now ITT LLC), Exelis and Xylem, ITT Corporation (now ITT LLC) has an obligation to indemnify, defend and hold Xylem harmless for asbestos product liability matters, including settlements, judgments, and legal defense costs associated with all pending and future claims that may arise from past sales of ITT’s legacy products. We believe ITT Corporation (now ITT LLC) remains a substantial entity with sufficient financial resources to honor its obligations to us.
See Note 7 "Income Taxes" of our Consolidated Financial Statements for a description of a pending tax litigation matter.
Although the ultimate outcome of any legal matter cannot be predicted with certainty, based on present information, including our assessment of the merits of the particular claims, we do not believe it is reasonably possible that any asserted or unasserted legal claims or proceedings, individually or in aggregate, will have a material adverse effect on our results of operations, or financial condition.
We have estimated and accrued $5 million and $7 million as of December 31, 2019 and 2018, respectively, for these general legal matters.
Indemnifications
As part of our 2011 spin-off from our former parent, ITT Corporation (now ITT LLC), Exelis Inc. and Xylem will indemnify, defend and hold harmless each of the other parties with respect to such parties’ assumed or retained liabilities under the Distribution Agreement and breaches of the Distribution Agreement or related spin agreements. The former parent’s indemnification obligations include asserted and unasserted asbestos and silica liability claims that relate to the presence or alleged presence of asbestos or silica in products manufactured, repaired or sold prior to October 31, 2011, the Distribution Date, subject to limited exceptions with respect to certain employee claims, or in the structure or material of any building or facility, subject to exceptions with respect to employee claims relating to Xylem buildings or facilities. The indemnification associated with pending and future asbestos claims does not expire. Xylem has not recorded a liability for material matters for which we expect to be indemnified by the former parent or Exelis Inc. through the Distribution Agreement and we are not aware of any claims or other circumstances that would give rise to material payments from us under such indemnifications. On May 29, 2015, Harris Inc. acquired Exelis. As the parent of Exelis, Harris Inc. is responsible for Exelis’ indemnification obligations under the Distribution Agreement.
Guarantees
We obtain certain stand-by letters of credit, bank guarantees, surety bonds and insurance letters of credit from third-party financial institutions in the ordinary course of business when required under contracts or to satisfy insurance related requirements. As of December 31, 2019 and December 31, 2018, the amount of surety bonds, bank guarantees, stand-by letters of credit, and insurance letters of credit was $340 million and $275 million, respectively.
Environmental
In the ordinary course of business, we are subject to federal, state, local, and foreign environmental laws and regulations. We are responsible, or are alleged to be responsible, for ongoing environmental investigation and remediation of sites in various countries. These sites are in various stages of investigation and/or remediation and in many of these proceedings our liability is considered de minimis. We have received notification from the United States Environmental Protection Agency, and from similar state and foreign environmental agencies, that a number of sites formerly or currently owned and/or operated by Xylem or for which we are responsible under the Distribution Agreement, and other properties or water supplies that may be or have been impacted from those operations, contain disposed or recycled materials or wastes and require environmental investigation and/or remediation. These sites include instances where we have been identified as a potentially responsible party under federal and state environmental laws and regulations.
99
Accruals for environmental matters are recorded on a site-by-site basis when it is probable that a liability has been incurred and the amount of the liability can be reasonably estimated, based on current law and existing technologies. Our accrued liabilities for these environmental matters represent our best estimates related to the investigation and remediation of environmental media such as water, soil, soil vapor, air and structures, as well as related legal fees. These estimates, and related accruals, are reviewed quarterly and updated for progress of investigation and remediation efforts and changes in facts and legal circumstances. Liabilities for these environmental expenditures are recorded on an undiscounted basis. We have estimated and accrued $3 million and $4 million as of December 31, 2019 and 2018, respectively, for environmental matters.
It is difficult to estimate the final costs of investigation and remediation due to various factors, including incomplete information regarding particular sites and other potentially responsible parties, uncertainty regarding the extent of investigation or remediation and our share, if any, of liability for such conditions, the selection of alternative remedial approaches, and changes in environmental standards and regulatory requirements. We believe the total amount accrued is reasonable based on existing facts and circumstances.
Warranties
We warrant numerous products, the terms of which vary widely. In general, we warrant products against defect and specific non-performance. Warranty expense was $25 million, $20 million, and $28 million for 2019, 2018 and 2017, respectively. The table below provides changes in the combined current and non-current product warranty accruals over each period.
(in millions) | 2019 | 2018 | 2017 | ||||||||
Warranty accrual – January 1 | $ | $ | $ | ||||||||
Net charges for product warranties in the period | |||||||||||
Settlement of warranty claims | ( | ) | ( | ) | ( | ) | |||||
Foreign currency and other | ( | ) | |||||||||
Warranty accrual – December 31 | $ | $ | $ | ||||||||
Note 21. Related Party Transactions
Sales to and purchases from unconsolidated entities for 2019, 2018 and 2017 are as follows:
(in millions) | 2019 | 2018 | 2017 | |||||||||
Sales to unconsolidated affiliates | $ | $ | $ | |||||||||
Purchases from unconsolidated affiliates | ||||||||||||
100
Note 22. Segment and Geographic Data
Our business has three reportable segments: Water Infrastructure, Applied Water and Measurement & Control Solutions. When determining the reportable segments, the Company aggregated operating segments based on their similar economic and operating characteristics. The Water Infrastructure segment focuses on the transportation and treatment of water, offering a range of products including water, wastewater and storm water pumps, treatment equipment, and controls and systems. The Applied Water segment serves many of the primary uses of water and focuses on the residential, commercial and industrial markets. The Applied Water segment's major products include pumps, valves, heat exchangers, controls and dispensing equipment. The Measurement & Control Solutions segment focuses on developing advanced technology solutions that enable intelligent use and conservation of critical water and energy resources as well as analytical instrumentation used in the testing of water. The Measurement & Control Solutions segment's major products include smart metering, networked communications, measurement and control technologies, critical infrastructure technologies, software and services including cloud-based analytics, remote monitoring and data management, leak detection and pressure monitoring solutions and testing equipment.
Additionally, we have Regional selling locations, which consist primarily of selling and marketing organizations and related support services, that offer products and services across our reportable segments. Corporate and other consists of corporate office expenses including compensation, benefits, occupancy, depreciation, and other administrative costs, as well as charges related to certain matters, such as environmental matters, that are managed at a corporate level and are not included in the business segments in evaluating performance or allocating resources.
101
The accounting policies of each segment are the same as those described in the summary of significant accounting policies (see Note 1, "Summary of Significant Accounting Policies"). The following tables contain financial information for each reportable segment:
Year Ended December 31, | |||||||||||
(in millions) | 2019 | 2018 | 2017 | ||||||||
Revenue: | |||||||||||
Water Infrastructure | $ | $ | $ | ||||||||
Applied Water | |||||||||||
Measurement & Control Solutions | |||||||||||
Total | $ | $ | $ | ||||||||
Operating income: | |||||||||||
Water Infrastructure | $ | $ | $ | ||||||||
Applied Water | |||||||||||
Measurement & Control Solutions | ( | ) | |||||||||
Corporate and other | ( | ) | ( | ) | ( | ) | |||||
Total operating income | |||||||||||
Interest expense | |||||||||||
Other non-operating (expense) income, net | ( | ) | |||||||||
Gain (loss) on sale of businesses | ( | ) | |||||||||
Income before taxes | $ | $ | $ | ||||||||
Depreciation and amortization: | |||||||||||
Water Infrastructure | $ | $ | $ | ||||||||
Applied Water | |||||||||||
Measurement & Control Solutions | |||||||||||
Regional selling locations (a) | |||||||||||
Corporate and other | |||||||||||
Total | $ | $ | $ | ||||||||
Capital expenditures: | |||||||||||
Water Infrastructure | $ | $ | $ | ||||||||
Applied Water | |||||||||||
Measurement & Control Solutions | |||||||||||
Regional selling locations (b) | |||||||||||
Corporate and other | |||||||||||
Total | $ | $ | $ | ||||||||
(a) | Depreciation and amortization expense incurred by the Regional selling locations was included in an overall allocation of Regional selling location costs to the segments; however, a certain portion of that expense was not specifically identified to a segment. That expense is captured in this Regional selling location line. |
(b) | Represents capital expenditures incurred by the Regional selling locations not allocated to the segments. |
The following table illustrates revenue by product category, net of intercompany revenue:
Year Ended December 31, | |||||||||||
(in millions) | 2019 | 2018 | 2017 | ||||||||
Pumps, accessories, parts and service | $ | $ | $ | ||||||||
Other (a) | |||||||||||
Total | $ | $ | $ | ||||||||
(a) | Other includes treatment equipment, analytical instrumentation, heat exchangers, valves, controls and smart meters. |
102
The following table contains the total assets for each reportable segment as of December 31, 2019, 2018 and 2017:
Total Assets | |||||||||||
(in millions) | 2019 | 2018 | 2017 | ||||||||
Water Infrastructure | $ | $ | $ | ||||||||
Applied Water | |||||||||||
Measurement & Control Solutions | |||||||||||
Regional selling locations (a) | |||||||||||
Corporate and other (b) | |||||||||||
Total | $ | $ | $ | ||||||||
(a) | The Regional selling locations have assets that consist primarily of cash, accounts receivable and inventory which are not allocated to the segments. |
(b) |
Geographical Information
Revenue is attributed to countries based upon the location of the customer. Property, Plant & Equipment is attributed to countries based upon the location of the assets:
Revenue | |||||||||||
Year Ended December 31, | |||||||||||
(in millions) | 2019 | 2018 | 2017 | ||||||||
United States | $ | $ | $ | ||||||||
Europe | |||||||||||
Asia Pacific | |||||||||||
Other | |||||||||||
Total | $ | $ | $ | ||||||||
Property, Plant & Equipment | |||||||||||
December 31, | |||||||||||
(in millions) | 2019 | 2018 | 2017 | ||||||||
United States | $ | $ | $ | ||||||||
Europe | |||||||||||
Asia Pacific | |||||||||||
Other | |||||||||||
Total | $ | $ | $ | ||||||||
Note 23. Valuation and Qualifying Accounts
The table below provides changes in the allowance for doubtful accounts over each period:
(in millions) | 2019 | 2018 | 2017 | ||||||||
Balance at beginning of year | $ | $ | $ | ||||||||
Additions charged to expense | |||||||||||
Deductions/other | ( | ) | ( | ) | ( | ) | |||||
Balance at end of year | $ | $ | $ | ||||||||
103
Note 24. Quarterly Financial Data (Unaudited)
Our quarterly financial periods end on the Saturday closest to the last day of the calendar quarter, except
for the fourth quarter which ends on December 31.
2019 Quarter Ended | ||||||||||||||||
(in millions, except per share amounts) | Dec. 31 | Sept. 30 | June 30 | Mar. 31 | ||||||||||||
Revenue | $ | $ | $ | $ | ||||||||||||
Gross profit | ||||||||||||||||
Operating income | ||||||||||||||||
Net income attributable to Xylem | $ | $ | $ | $ | ||||||||||||
Earnings per share: | ||||||||||||||||
Basic | $ | $ | $ | $ | ||||||||||||
Diluted | $ | $ | $ | $ | ||||||||||||
2018 Quarter Ended | ||||||||||||||||
(in millions, except per share amounts) | Dec. 31 | Sept. 30 | June 30 | Mar. 31 | ||||||||||||
Revenue | $ | $ | $ | $ | ||||||||||||
Gross profit | ||||||||||||||||
Operating income | ||||||||||||||||
Net income attributable to Xylem | $ | $ | $ | $ | ||||||||||||
Earnings per share: | ||||||||||||||||
Basic | $ | $ | $ | $ | ||||||||||||
Diluted | $ | $ | $ | $ | ||||||||||||
ITEM 9. CHANGES IN AND DISAGREEMENTS WITH ACCOUNTANTS ON ACCOUNTING AND FINANCIAL DISCLOSURE
None.
ITEM 9A. CONTROLS AND PROCEDURES
Evaluation of Disclosure Controls and Procedures
Our management, with the Chief Executive Officer ("CEO") and Chief Financial Officer ("CFO") of the Company, has evaluated the effectiveness of the design and operation of our disclosure controls and procedures as of the end of the year ended December 31, 2019 pursuant to Rule 13a-15(b) and 15d-15(e) of the Securities Exchange Act of 1934 (“the Exchange Act”). Based upon that evaluation, our CEO and our CFO concluded that our disclosure controls and procedures as of the year ended December 31, 2019 were effective, in all material respects, and designed to provide reasonable assurance that the information required to be disclosed by us in the reports we file or submit under the Exchange Act is (1) recorded, processed, summarized and reported, within the time periods specified in the SEC's rules and forms and (2) accumulated and communicated to our management, including our CEO and CFO, as appropriate to allow timely decisions regarding required disclosures.
Management's Annual Report on Internal Control Over Financial Reporting
As required by the SEC's rules and regulations for the implementation of Section 404 of the Sarbanes-Oxley Act, the Company's management is responsible for establishing and maintaining adequate internal control over financial reporting as defined in Rules 13a-15(f) and 15d-15(f) under the Exchange Act. The Company's internal control over financial reporting is a process designed to provide reasonable assurance regarding the reliability of financial reporting and the preparation of financial statements for external purposes in accordance with GAAP.
The Company's management, including the CEO and CFO, conducted an assessment of the effectiveness of our internal control over financial reporting as of December 31, 2019 based on the framework established in Internal Control - Integrated Framework issued by the Committee of Sponsoring Organization of the Treadway Commission (2013). This assessment included an evaluation of the design of our internal control over financial reporting and
104
testing of the operational effectiveness of those controls. Based on our assessment, the Company's management has concluded that our internal control over financial reporting was effective as of December 31, 2019.
The effectiveness of the Company's internal control over financial reporting as of December 31, 2019 has been audited by Deloitte & Touche LLP, an independent registered public accounting firm, as stated in their report which appears following Item 9B of this Annual Report on Form 10-K.
Changes in Internal Control Over Financial Reporting
In the ordinary course of business, the Company reviews its internal control over financial reporting and makes changes to systems and processes to improve such controls and increase efficiency, while ensuring that an effective internal control environment is maintained.
Starting in 2017, the Company undertook steps to advance a multi-year effort to transform many of our support functions and related technologies, including Finance, Human Resources and Procurement. In connection with these restructuring and transformation plans, we continue to centralize certain accounting functions within shared service centers operated by an outsourced provider. This initiative is not in response to any identified deficiency or weakness in the Company’s internal control over financial reporting. In response to this process, the Company has and will continue to align and streamline the design and operation of its financial control environment.
Other than as described in the preceding paragraph, there have been no changes in our internal control over financial reporting (as defined in Rule 13a-15(f) under the 1934 Act) during the fiscal quarter ended December 31, 2019 that have materially affected, or are reasonably likely to materially affect, our internal control over financial reporting.
ITEM 9B. OTHER INFORMATION
None
105
REPORT OF INDEPENDENT REGISTERED PUBLIC ACCOUNTING FIRM
To the Stockholders and the Board of Directors of
Xylem Inc.
Rye Brook, New York
Opinion on Internal Control over Financial Reporting
We have audited the internal control over financial reporting of Xylem Inc. and subsidiaries (the "Company") as of
December 31, 2019, based on criteria established in Internal Control - Integrated Framework (2013) issued by the Committee of Sponsoring Organizations of the Treadway Commission (COSO). In our opinion, the Company maintained, in all material respects, effective internal control over financial reporting as of December 31, 2019, based on criteria established in Internal Control - Integrated Framework (2013) issued by COSO.
We have also audited, in accordance with the standards of the Public Company Accounting Oversight Board (United States) (PCAOB), the consolidated financial statements as of and for the year ended December 31, 2019, of the Company and our report dated February 28, 2020, expressed an unqualified opinion on those financial statements.
Basis for Opinion
The Company’s management is responsible for maintaining effective internal control over financial reporting and for its assessment of the effectiveness of internal control over financial reporting, included in the accompanying Management’s Report on Internal Control over Financial Reporting. Our responsibility is to express an opinion on the Company’s internal control over financial reporting based on our audit. We are a public accounting firm registered with the PCAOB and are required to be independent with respect to the Company in accordance with the U.S. federal securities laws and the applicable rules and regulations of the Securities and Exchange Commission and the PCAOB.
We conducted our audit in accordance with the standards of the PCAOB. Those standards require that we plan and perform the audit to obtain reasonable assurance about whether effective internal control over financial reporting was maintained in all material respects. Our audit included obtaining an understanding of internal control over financial reporting, assessing the risk that a material weakness exists, testing and evaluating the design and operating effectiveness of internal control based on the assessed risk, and performing such other procedures as we considered necessary in the circumstances. We believe that our audit provides a reasonable basis for our opinion.
Definition and Limitations of Internal Control over Financial Reporting
A company’s internal control over financial reporting is a process designed to provide reasonable assurance regarding the reliability of financial reporting and the preparation of financial statements for external purposes in accordance with generally accepted accounting principles. A company’s internal control over financial reporting includes those policies and procedures that (1) pertain to the maintenance of records that, in reasonable detail, accurately and fairly reflect the transactions and dispositions of the assets of the company; (2) provide reasonable assurance that transactions are recorded as necessary to permit preparation of financial statements in accordance with generally accepted accounting principles, and that receipts and expenditures of the company are being made only in accordance with authorizations of management and directors of the company; and (3) provide reasonable assurance regarding prevention or timely detection of unauthorized acquisition, use, or disposition of the company’s assets that could have a material effect on the financial statements.
Because of its inherent limitations, internal control over financial reporting may not prevent or detect misstatements. Also, projections of any evaluation of effectiveness to future periods are subject to the risk that controls may become inadequate because of changes in conditions, or that the degree of compliance with the policies or procedures may deteriorate.
/s/ Deloitte & Touche LLP
Stamford, Connecticut
February 28, 2020
106
PART III
ITEM 10. DIRECTORS, EXECUTIVE OFFICERS AND CORPORATE GOVERNANCE
The information required by this Item is incorporated herein by reference to the information in our Definitive Proxy Statement to be filed with the SEC in connection with our 2020 Annual Meeting of Shareholders (the “2020 Proxy Statement”) under the captions “Proposal 1 - Election of Directors,” "Board Composition and Refreshment," "Board Committees - Audit Committee," "Audit Committee Report" and “Delinquent Section 16(a) Reports.”
The information called for by Item 10 with respect to executive officers is set forth in Part I of this Report under the caption “Information about our Executive Officers” and is incorporated by reference in this section.
We have adopted corporate governance principles and charters for each of our board committees. The principles address director qualification standards, responsibilities, access to management and independent advisors, compensation, orientation and continuing education, succession planning and board and committee self-evaluation. The corporate governance principles and board committee charters are available on the Company’s website at www.xylem.com/en-us/investors/. A copy of the corporate governance principles and board committee charters are also available to any shareholder who requests a copy from the Company’s Corporate Secretary at our Principal Executive Offices.
We have also adopted a written code of conduct which is applicable to all of our directors, officers and employees, including the Company’s Chief Executive Officer and Chief Financial Officer and other executive officers identified pursuant to this Item 10. In accordance with the SEC’s rules and regulations, a copy of the Code of Conduct has been posted to our website and it is also available to any shareholder who requests a copy from the Company's Corporate Secretary. We intend to disclose any changes in our Code of Conduct and waivers of the Code of Conduct on our website at www.xylem.com within four business days following the date of the amendment or waiver.
ITEM 11. EXECUTIVE COMPENSATION
The information required by this Item is incorporated herein by reference to the information in our 2020 Proxy Statement set forth under captions “Compensation Discussion and Analysis," "Director Compensation," "Board Committees - Leadership Development and Compensation Committee" and “Leadership Development and Compensation Committee Report.”
ITEM 12. SECURITY OWNERSHIP OF CERTAIN BENEFICIAL OWNERS AND MANAGEMENT AND RELATED STOCKHOLDER MATTERS
The information required by this Item is incorporated herein by reference to the information in our 2020 Proxy Statement set forth under the captions “Stock Ownership - Certain Beneficial Owners," "Stock Ownership - Directors and Executive Officers" and "Equity Compensation Plan Information."
ITEM 13. CERTAIN RELATIONSHIPS AND RELATED TRANSACTIONS, AND DIRECTOR INDEPENDENCE
The information required by this Item is incorporated herein by reference to the information in our 2020 Proxy Statement set forth under the captions "Corporate Governance - Director Independence" and “Corporate Governance Policies and Practices - Related Party Transactions.”
ITEM 14. PRINCIPAL ACCOUNTING FEES AND SERVICES
The information required by this Item is incorporated herein by reference to the information in our 2020 Proxy Statement set forth under the captions “Proposal 2 - Fees of Audit and Other Services Fees” and "Proposal 2 - Pre-Approval of Audit and Non-Audit Services."
107
PART IV
ITEM 15. EXHIBITS, FINANCIAL STATEMENT SCHEDULES
(a) | (1) | The Index to Consolidated Financial Statements of the Registrant under Item 8 of this Report is incorporated herein by reference as the list of Financial Statements required as part of this Report. |
(2) | Financial Statement Schedules — All financial statement schedules have been omitted because they are not applicable or the required information is shown in the financial statements or notes thereto. | |
(3) | Exhibits — See exhibits listed under Part (b) below. | |
EXHIBIT INDEX
Exhibit Number | Description | Location | |
Distribution Agreement, dated as of October 25, 2011, among ITT Corporation, Exelis Inc. and Xylem Inc. | Incorporated by reference to Exhibit 10.1 of ITT Corporation’s Form 10-Q Quarterly Report filed on October 28, 2011 (CIK No. 216228, File No. 1-5672). | ||
Fourth Amended and Restated Articles of Incorporation of Xylem Inc. | Incorporated by reference to Exhibit 3.1 of Xylem Inc.’s Form 8-K filed on May 15, 2017 (CIK No. 1524472, File No. 1-35229). | ||
Fourth Amended and Restated By-laws of Xylem Inc. | Incorporated by reference to Exhibit 3.1 of Xylem Inc.’s Form 8-K filed on May 15, 2017 (CIK No. 1524472, File No. 1-35229). | ||
Indenture, dated as of September 20, 2011, between Xylem Inc., ITT Corporation, as initial guarantor, and Union Bank, N.A., as trustee. | Incorporated by reference to Exhibit 4.2 of ITT Corporation’s Form 8-K Current Report filed on September 21, 2011 (CIK No. 216228, File No. 1-5672). | ||
Senior Indenture, dated March 11, 2016, by and between the Company and Deutsche Bank Trust Company Americas, as trustee. | Incorporated by reference to Exhibit 4.1 of Xylem Inc.’s Form 8-K filed on March 11, 2016 (CIK No. 1524472, File No. 1-35229). | ||
First Supplemental Indenture, dated March 11, 2016, by and between the Company and Deutsche Bank Trust Company Americas, as trustee. | Incorporated by reference to Exhibit 4.2 of Xylem Inc.’s Form 8-K filed on March 11, 2016 (CIK No. 1524472, File No. 1-35229) | ||
Second Supplemental Indenture, dated March 11, 2016, by and between the Company and Deutsche Bank Trust Company Americas, as trustee. | Incorporated by reference to Exhibit 4.3 of Xylem Inc.’s Form 8-K filed on March 11, 2016 (CIK No. 1524472, File No. 1-35229). | ||
Third Supplemental Indenture, dated October 11, 2016, by and between the Company and Deutsche Bank Trust Company Americas, as trustee. | Incorporated by reference to Exhibit 4.1 of Xylem Inc.’s Form 8-K filed on October 11, 2016 (CIK No. 1524472, File No. 1-35229). | ||
Form of Xylem Inc. 4.875% Senior Notes due 2021. | Incorporated by reference to Exhibit 4.6 of Xylem Inc.'s Form S-4 Registration Statement filed on May 24, 2012 (CIK No. 1524472, File No. 333-181643). | ||
Form of Xylem Inc. 2.250% Senior Notes due 2023. | Incorporated by reference to Exhibit 4.3 of Xylem Inc.’s Current Report on Form 8-K dated March 11, 2016 (CIK No. 1524472, File No. 1-35229). | ||
Form of Xylem Inc. 3.250% Senior Notes due 2026. | Incorporated by reference to Exhibit 4.1 of Xylem Inc.’s Form 8-K filed on October 11, 2016 (CIK No. 1524472, File No. 1-35229). | ||
Form of Xylem Inc. 4.375% Senior Notes due 2046. | Incorporated by reference to Exhibit 4.1 of Xylem Inc.’s Form 8-K filed on October 11, 2016 (CIK No. 1524472, File No. 1-35229). | ||
108
Exhibit Number | Description | Location | |
Description of securities registered under Section 12 of the Exchange Act | Filed herein. | ||
# | Form of Xylem 2011 Omnibus Incentive Plan Non-Qualified Stock Option Award Agreement (2015). | Incorporated by reference to Exhibit 10.1 of Xylem Inc.’s Form 10-K Annual Report filed on February 26, 2015 (CIK No. 1524472, File No. 1-35229). | |
Tax Matters Agreement, dated as of October 25, 2011, among ITT Corporation, Exelis Inc. and Xylem Inc. | Incorporated by reference to Exhibit 10.3 of ITT Corporation’s Form 10-Q Quarterly Report filed on October 28, 2011 (CIK No. 216228, File No. 1-5672). | ||
# | Xylem 2011 Omnibus Incentive Plan (Amended as of February 24, 2016). | Incorporated by reference to Exhibit 10.6 of Xylem Inc.'s Form 10-K filed on February 26, 2016 (CIK No. 1524472, File No. 1-35229). | |
# | Form of Xylem Non-Qualified Stock Option Award Agreement (Amended as of February 24, 2016). | Incorporated by reference to Exhibit 10.7 of Xylem Inc.'s Form 10-K filed on February 26, 2016 (CIK No. 1524472, File No. 1-35229). | |
# | Form of Xylem Restricted Stock Unit Agreement (Amended as of February 24, 2016). | Incorporated by reference to Exhibit 10.8 of Xylem Inc.'s Form 10-K filed on February 26, 2016 (CIK No. 1524472, File No. 1-35229). | |
# | Form of Xylem Performance Share Unit Agreement (Amended as of February 24, 2016). | Incorporated by reference to Exhibit 10.9 of Xylem Inc.'s Form 10-K filed on February 26, 2016 (CIK No. 1524472, File No. 1-35229). | |
# | Xylem Retirement Savings Plan. | Incorporated by reference to Exhibit 10.1 of Xylem Inc.’s Form 10-Q filed on July 30, 2013 (CIK No. 1524472, File No. 1-35229). | |
# | Xylem Supplemental Retirement Savings Plan. | Incorporated by reference to Exhibit 10.11 of Xylem Inc.’s Form 10-Q Quarterly Report filed on November 21, 2011 (CIK No. 1524472, File No. 1-35229). | |
# | Xylem Deferred Compensation Plan. | Incorporated by reference to Exhibit 10.12 of Xylem Inc.'s Form 10-K Annual Report filed on February 23, 2017 (CIK No. 1524472, File No. 1-35229). | |
# | Xylem Deferred Compensation Plan for Non-Employee Directors. | Incorporated by reference to Exhibit 10.13 of Xylem Inc.’s Form 10-Q Quarterly Report filed on November 21, 2011 (CIK No. 1524472, File No. 1-35229). | |
# | Form of Non-Employee Director Restricted Stock Unit Award Agreement. | Incorporated by reference to Exhibit 10.1 of Xylem Inc.’s Form 10-Q Quarterly Report filed on July 30, 2015 (CIK No. 1524472, File No. 1-35229). | |
# | Xylem Special Senior Executive Severance Pay Plan (Amended as of February 24, 2016). | Incorporated by reference to Exhibit 10.15 of Xylem Inc.'s Form 10-K filed on February 26, 2016 (CIK No. 1524472, File No. 1-35229). | |
# | Xylem Senior Executive Severance Pay Plan (Amended as of May 10, 2017). | Incorporated by reference to Exhibit 10.1 of Xylem Inc.'s Form 10-Q filed on August 1, 2017 (CIK No. 1524472, File No. 1-35229). | |
# | Form of Xylem 2011 Omnibus Incentive Plan 2011 Non-Qualified Stock Option Award Agreement — Founders Grant. | Incorporated by reference to Exhibit 10.17 of Xylem Inc.’s Form 10-Q Quarterly Report filed on November 21, 2011 (CIK No. 1524472, File No. 1-35229). | |
# | Form of Xylem 2011 Omnibus Incentive Plan Non-Qualified Stock Option Award Agreement — General Grant. | Incorporated by reference to Exhibit 10.18 of Xylem Inc.’s Form 10-Q Quarterly Report filed on November 21, 2011 (CIK No. 1524472, File No. 1-35229). | |
# | Xylem Annual Incentive Plan for Executive Officers (Amended as of February 24, 2016). | Incorporated by reference to Exhibit 10.16 of Xylem Inc.'s Form 10-K filed on February 26, 2016 (CIK No. 1524472, File No. 1-35229). | |
109
Exhibit Number | Description | Location | |
# | Form of Director’s Indemnification Agreement. | Incorporated by reference to Exhibit 10.16 of Xylem Inc.'s Form 10-K filed on February 26, 2016 (CIK No. 1524472, File No. 1-35229). | |
# | Form of Xylem 2011 Omnibus Incentive Plan Non-Qualified Stock Option Award Agreement (2013). | Incorporated by reference to Exhibit 10.1 of Xylem Inc.'s Form 10-Q Quarterly Report filed on April 30, 2013 (CIK No. 1524472, File No. 1-35229). | |
# | Letter Agreement between Xylem Inc. and Patrick K. Decker. | Incorporated by reference to Exhibit 10.1 of Xylem Inc.'s Form 10-Q Quarterly Report filed on April 29, 2014 (CIK No. 1524472, File No. 1-35229). | |
# | Form of Xylem Restricted Stock Unit Agreement (Amended as of February 21, 2018). | Incorporated by reference to Exhibit 10.31 of Xylem Inc.'s Form 10-K filed on February 23, 2018 (CIK No. 1524472, File No. 1-35229 | |
# | Form of Xylem Performance Share Unit Agreement (Amended as of February 21, 2018). | Incorporated by reference to Exhibit 10.32 of Xylem Inc.'s Form 10-K filed on February 23, 2018 (CIK No. 1524472, File No. 1-35229 | |
Five-Year Revolving Credit Facility Agreement, dated as of March 5, 2019 among Xylem Inc. and the Lenders party thereto. | Incorporated by reference to Exhibit 10.34 of Xylem Inc.’s Form 8-K filed on March 5, 2019 (CIK No. 1524472, File No. 1-35229). | ||
Subsidiaries of the Registrant. | Filed herewith. | ||
Consent of Independent Registered Public Accounting Firm. | Filed herewith. | ||
Certification pursuant to Rule 13a-14(a)/15d-14(a) of the Securities Exchange Act of 1934, as adopted pursuant to Section 302 of the Sarbanes-Oxley Act of 2002. | Filed herewith. | ||
Certification pursuant to Rule 13a-14(a)/15d-14(a) of the Securities Exchange Act of 1934, as adopted pursuant to Section 302 of the Sarbanes-Oxley Act of 2002. | Filed herewith. | ||
Certification Pursuant to 18 U.S.C. Section 1350, as adopted pursuant to Section 906 of the Sarbanes-Oxley Act of 2002. | This Exhibit is intended to be furnished in accordance with Regulation S-K Item 601(b) (32) (ii) and shall not be deemed to be filed for purposes of Section 18 of the Securities Exchange Act of 1934 or incorporated by reference into any filing under the Securities Act of 1933 or the Securities Exchange Act of 1934, except as shall be expressly set forth by specific reference. | ||
Certification Pursuant to 18 U.S.C. Section 1350, as adopted pursuant to Section 906 of the Sarbanes-Oxley Act of 2002. | This Exhibit is intended to be furnished in accordance with Regulation S-K Item 601(b) (32) (ii) and shall not be deemed to be filed for purposes of Section 18 of the Securities Exchange Act of 1934 or incorporated by reference into any filing under the Securities Act of 1933 or the Securities Exchange Act of 1934, except as shall be expressly set forth by specific reference. | ||
101.0 | The following materials from Xylem Inc.’s Annual Report on Form 10-K for the year ended December 31, 2019, formatted in Inline Extensible Business Reporting Language (Inline XBRL): (i) Consolidated Income Statements, (ii) Consolidated Statements of Comprehensive Income, (iii) Consolidated Balance Sheets, (iv) Consolidated Statements of Cash Flows, (v) Consolidated Statement of Stockholder's Equity and (vi) Notes to Consolidated Financial Statements. | The instance document does not appear in the interactive data file because its XBRL tags are embedded within the Inline XBRL document. | |
110
Exhibit Number | Description | Location | |
104.0 | The cover page from Xylem Inc.'s Annual Report on Form 10-K for the year ended December 31, 2019, formatted in Inline XBRL and contained in Exhibit 101.0. | ||
#Management contract or compensatory plan or arrangement
111
ITEM 16. FORM 10-K SUMMARY
None
SIGNATURES
Pursuant to the requirements of Section 13 or 15(d) of the Securities Exchange Act of 1934, the Registrant has duly caused this Report to be signed on its behalf by the undersigned, thereunto duly authorized.
XYLEM INC. | |
(Registrant) | |
/s/ Geri McShane | |
Geri McShane | |
Vice President, Controller and Chief Accounting Officer | |
February 28, 2020
112
Pursuant to the requirements of the Securities Exchange Act of 1934, this Report has been signed below by the following persons on behalf of the Registrant and in the capacities and on the dates indicated:
February 28, 2020 | /s/ Patrick K. Decker | |
Patrick K. Decker | ||
President and Chief Executive Officer | ||
(Principal Executive Officer) | ||
February 28, 2020 | /s/ E. Mark Rajkowski | |
E. Mark Rajkowski | ||
Senior Vice President and Chief Financial Officer | ||
February 28, 2020 | /s/ Geri McShane | |
Geri McShane | ||
Vice President, Controller and Chief Accounting Officer | ||
February 28, 2020 | /s/ Markos I. Tambakeras | |
Markos I. Tambakeras, Chairman | ||
February 28, 2020 | /s/ Curtis J. Crawford | |
Curtis J. Crawford, Director | ||
February 28, 2020 | /s/ Robert F. Friel | |
Robert F. Friel, Director | ||
February 28, 2020 | /s/ Jorge M. Gomez | |
Jorge M. Gomez, Director | ||
February 28, 2020 | /s/ Victoria D. Harker | |
Victoria D. Harker, Director | ||
February 28, 2020 | /s/ Sten E. Jakobsson | |
Sten E. Jakobsson, Director | ||
February 28, 2020 | /s/ Steven R. Loranger | |
Steven R. Loranger, Director | ||
February 28, 2020 | /s/ Surya N. Mohapatra | |
Surya N. Mohapatra, Director | ||
February 28, 2020 | /s/ Jerome A. Peribere | |
Jerome A. Peribere, Director | ||
113