UNITED STATES
SECURITIES AND EXCHANGE COMMISSION
WASHINGTON, D.C. 20549
FORM
CURRENT REPORT
PURSUANT TO SECTION 13 OR 15(d) OF
THE SECURITIES EXCHANGE ACT OF 1934
Date of Report (Date of earliest event reported)
(Exact Name of Registrant as Specified in Its Charter)
(State or Other Jurisdiction of Incorporation) |
(Commission File Number) |
(IRS Employer Identification No.) |
(Address of Principal Executive Offices) (Zip Code)
(Registrant’s Telephone Number, Including Area Code)
Check the appropriate box below if the Form 8-K filing is intended to simultaneously satisfy the filing obligation of the registrant under any of the following provisions (see General Instruction A.2. below):
Written communications pursuant to Rule 425 under the Securities Act (17 CFR 230.425) |
Soliciting material pursuant to Rule 14a-12 under the Exchange Act (17 CFR 240.14a-12) |
Pre-commencement communications pursuant to Rule 14d-2(b) under the Exchange Act (17 CFR 240.14d-2(b)) |
Pre-commencement communications pursuant to Rule 13e-4(c) under the Exchange Act (17 CFR 240.13e-4(c)) |
Indicate by check mark whether the registrant is an emerging growth company as defined in as defined in Rule 405 of the Securities Act of 1933 (§230.405 of this chapter) or Rule 12b-2 of the Securities Exchange Act of 1934 (§240.12b-2 of this chapter).
Emerging growth company
If an emerging growth company, indicate by check mark if the registrant has elected not to use the extended transition period for complying with any new or revised financial accounting standards provided pursuant to Section 13(a) of the Exchange Act. ☐
Securities registered pursuant to Section 12(b) of the Act: | ||
Title of Each Class | Trading Symbol | Name of Each Exchange on Which Registered |
Item 2.02 |
Results of Operations and Financial Condition |
On February 26, 2021, Plymouth Industrial REIT, Inc. (the “Company”) issued a press release (the “Earnings Release”) announcing, among other things, earnings for the three months and year ended December 31, 2020. The text of the Earnings Release is included as Exhibit 99.1 to this Current Report.
The Earnings Release is furnished pursuant to Item 2.02 and shall not be deemed "filed" for purposes of Section 18 of the Securities Exchange Act of 1934, as amended (the "Exchange Act"), or subject to the liabilities of that Section. The information in this Current Report shall not be incorporated by reference in any filing under the Securities Act of 1933, as amended, or the Exchange Act, except as shall be expressly set forth by specific reference in such filing.
Item 7.01 | Regulation FD Disclosure. |
On February 26, 2021, the Company disclosed a supplemental analyst package in connection with its earnings conference call for the three months and year ended December 31, 2020, which took place on February 26, 2021. A copy of the supplemental analyst package is attached hereto as Exhibit 99.2.
The supplemental analyst package is furnished pursuant to Item 7.01 and shall not be deemed “filed” for purposes of Section 18 of the Exchange Act, or subject to the liabilities of that Section. The information in this Current Report shall not be incorporated by reference in any filing under the Securities Act of 1933, as amended, or the Exchange Act, except as shall be expressly set forth by specific reference in such filing.
Item 9.01 | Financial Statements and Exhibits. |
(d) Exhibits:
Exhibit No. | Description | |
99.1 | Press Release dated February 26, 2021 | |
99.2 | Supplemental Analyst Package – Fourth Quarter 2020 | |
104 | Cover Page Interactive Data File (formatted as in line XBRL) |
SIGNATURES
Pursuant to the requirements of the Securities Exchange Act of 1934, the Company has duly caused this report to be signed on its behalf by the undersigned hereunto duly authorized.
PLYMOUTH INDUSTRIAL REIT, INC. | ||||||
Date: February 26, 2021 | By: |
/s/ Jeffrey E. Witherell | ||||
Jeffrey E. Witherell | ||||||
Chief Executive Officer |
Exhibit 99.1
Contact:
Tripp Sullivan
SCR Partners
(615) 942-7077
TSullivan@scr-ir.com
PLYMOUTH INDUSTRIAL REIT REPORTS FOURTH QUARTER 2020 RESULTS
BOSTON, February 26, 2021 – Plymouth Industrial REIT, Inc. (NYSE: PLYM) (the “Company”) today announced its consolidated financial results for the fourth quarter ended December 31, 2020 and other recent developments.
Fourth Quarter and Subsequent Highlights
· Reported results for the fourth quarter of 2020 reflect a net loss attributable to common stockholders of $6.0 million, or $(0.24) per weighted average common share; net operating income (“NOI”) of $19.9 million; Core Funds from Operations (“Core FFO”) of $0.42 per weighted average common share and units; and Adjusted FFO (“AFFO”) of $0.38 per weighted average common share and units.
· Same store NOI (“SS NOI”) increased 3.7% on a cash basis for the fourth quarter compared with the same period in 2019 and increased 3.4% excluding early termination income. SS NOI increased 1.6% on a GAAP basis for the fourth quarter compared with the same period in 2019 and increased 1.2% excluding early termination income.
· Collected approximately 99.6% of its rent for the fourth quarter. To date in 2021, collected 99.2% for January and 95.8% for February 2021. All previous rent deferments granted in 2020 have been collected, and no additional deferments have been granted to date in 2021.
· Commenced leases totaling 558,000 square feet with a 0.4% decrease in rental rates on a cash basis from leases greater than six months.
· | Completed the acquisition of a 314,736-square-foot industrial building in Mansfield, Ohio for $10.5 million in October. |
· | Completed the acquisition of a 10-building industrial portfolio in Akron and Canton, Ohio for $94.0 million in November. |
· | Formed a $150 million equity joint venture with Madison International Realty in October and completed its first investment in Memphis, Tennessee in December with the purchase of a 28-building industrial portfolio for $86.0 million. |
· | Improved the capital structure in October with a new unsecured credit facility comprised of a four-year $200 million revolving credit facility and a five-year $100 million term loan at lower borrowing costs. |
· | Utilized the ATM program to generate net proceeds of approximately $46.2 million during the fourth quarter and to date in the first quarter of 2021, increasing total outstanding common shares by approximately 13% since September 30, 2020. |
· | Declared a regular quarterly cash dividend for the fourth quarter of 2020 of $0.20 per share for the common stock and a regular quarterly cash dividend of $0.46875 per share for the 7.50% Series A Cumulative Redeemable Preferred Stock (“the Preferred Stock”). |
· | Issued guidance for 2021 with a range of net loss of $(0.29) to $(0.25) per weighted average common share and unit, Core FFO of $1.70 to $1.74 per weighted average common share and unit and AFFO of $1.43 to $1.48 per weighted average common share and unit. |
· | Issued guidance for the first quarter of 2021 with a range of net loss of $(0.11) to $(0.09) per weighted average common share and unit, Core FFO of $0.37 to $0.39 per weighted average common share and unit and AFFO of $0.28 to $0.30 per weighted average common share and unit. |
· | Enhanced the quarterly supplemental information with additional information discussing value creation, replacement cost, rent collections, net asset value components, the unconsolidated joint venture, and relevant features of the Series B Preferred Stock. |
Jeff Witherell, Chairman and Chief Executive Officer of Plymouth Industrial REIT, noted, “This was a successful year for Plymouth made possible by the strength of our portfolio, the fundamentals in our markets and the real estate operating experience of our team. Despite the challenges of COVID, we have extended our presence and leveraged scale in target markets and have experienced little to no impact from the pandemic on occupancy or rent collections. The leasing pace we set early in 2020 has continued to date with nearly 45% of our 2021 leasing expirations already addressed. We have made the right moves to strengthen our balance sheet and, based on our guidance for this year, believe we are positioned to provide FFO and AFFO growth moving forward.”
Financial Results for the Fourth Quarter of 2020
Net loss attributable to common stockholders for the quarter ended December 31, 2020 was $6.0 million, or $(0.24) per weighted average common share outstanding, compared with net loss attributable to common stockholders of $5.9 million, or $(0.44) per weighted average common share, for the same period in 2019. The decrease in net loss per weighted average common share was primarily due to an increase in net operating income, offset by an increase in interest and depreciation expense associated with acquisition activity. Weighted average common shares outstanding for the quarters ended December 31, 2020 and 2019 were 24.8 million and 13.4 million, respectively.
Consolidated total revenues for the quarter ended December 31, 2020 were $30.0 million, compared with $22.5 million for the same period in 2019.
NOI for the quarter ended December 31, 2020 was $19.9 million compared with $14.5 million for the same period in 2019. Same store NOI (“SS NOI”) – Cash basis for the quarter ended December 31, 2020 was $10.3 million excluding early termination income compared with $9.9 million for the same period in 2019, an increase of 3.4%. SS NOI – GAAP basis excluding early termination income for the quarter ended December 31, 2020 was $10.7 million compared with $10.6 million for the same period in 2019, an increase of 1.2%. The year-over-year improvement in SS NOI – GAAP basis was primarily due to an increase in rental income from leasing activity, offset by an increase in operating expenses.
EBITDAre for the quarter ended December 31, 2020 was $16.9 million compared with $12.5 million for the same period in 2019.
Core FFO for the quarter ended December 31, 2020 (defined as FFO less dividends paid (or declared) to holders of preferred stock and excluding certain non-cash operating expenses such as impairment on real estate lease, unrealized appreciation/(depreciation) of warrants and loss on extinguishment of debt) was $10.7 million compared with $7.0 million for the same period in 2019, primarily as a result of the contribution from acquisitions. The Company reported Core FFO for the quarter ended December 31, 2020 of $0.42 per weighted average common share and unit compared with $0.48 per weighted average common share and unit for the same period in 2019. The increase in weighted average share count offset the contribution of acquisitions and the improvement in same store NOI. Weighted average common shares and units outstanding for the fourth quarters ended December 31, 2020 and 2019 were 25.6 million and 14.6 million, respectively. As of December 31, 2020, the Company had a total of 26.0 million common shares and units outstanding. As of February 22, 2021, there are 28.7 million common shares and units outstanding.
AFFO for the quarter ended December 31, 2020 was $9.9 million, or $0.38 per weighted average common share and unit, compared with $5.7 million, or $0.39 per weighted average common share and unit, for the same period in 2019, primarily driven by the change in Core FFO and a decrease in recurring capital expenditures.
See “Non-GAAP Financial Measures” for complete definitions of NOI, EBITDAre, FFO, Core FFO and AFFO and the financial tables accompanying this press release for reconciliations of net income to NOI, EBITDAre, FFO, Core FFO and AFFO.
Investment Activity
On December 18, 2020 Plymouth MIR JV LLC, a joint venture between affiliates of Plymouth Industrial REIT, Inc. and Madison International Realty (“Madison”) closed on the purchase of a portfolio of industrial buildings in metropolitan Memphis for $86 million. The Joint Venture, which is owned 20% by Plymouth and 80% by Madison, funded the acquisition on a pro rata ownership basis with $30 million in cash and a $56 million secured mortgage that carries a seven-year term at a fixed interest rate of 3.15%. The portfolio is comprised of 28 industrial buildings located in Memphis and Olive Branch, Mississippi totaling 2.3 million square feet. The buildings are 96% leased to 53 tenants, and the acquisition is projected to provide an initial yield of approximately 7.7%.
On November 24, 2020, the Company acquired a portfolio of industrial buildings in Akron and Canton, Ohio totaling 2.1 million square feet for approximately $94 million. The portfolio is comprised of 10 industrial buildings that are 98% leased to 15 tenants and is projected to provide an annual initial yield of approximately 7.5%. The acquisition brings the company’s scale in the Cleveland metropolitan area to 3.6 million square feet and increases the size of its Ohio portfolio to 7.5 million square feet.
On October 23, 2020, the Company acquired an industrial property in Mansfield, Ohio totaling 314,736 square feet for $10.5 million. The building is 100% leased to two tenants and is projected to provide an initial yield of approximately 9.0%.
Leasing Activity
As of December 31, 2020, the Company had real estate investments comprised of 141 industrial buildings totaling 23.3 million square feet with occupancy of 96.4%. During 2020, the Company entered into a small number of rent deferral concessions representing approximately 1.5%, or $1.25 million, of annualized base rent, which is defined as the annualized monthly contractual base rent per the leases, excluding any rent abatements. As of December 31, 2020, the Company had collected all but $145,000 of this deferred contractual rent. Subsequent to year end, the Company collected the balance of the deferred rent and no other deferral concessions have been granted to date in 2021.
Leases commencing during the fourth quarter of 2020 totaled an aggregate of 608,000 square feet, of which 558,000 square feet was associated with leases of at least six months. These leases included 383,000 square feet of renewal leases and 175,000 square feet of new leases, and the Company will experience a 0.4% decrease in rental rates on a cash basis from these leases.
During the twelve months ended December 31, 2020, leases for space totaling 2,930,000 square feet either was subject to renewal or expired. Of this space, 1,939,000 square feet was renewed and 601,000 square feet was leased to new tenants. Additionally, 238,000 square feet of previously vacant square feet was leased to new tenants. The leases greater than six months included 1,881,000 square feet of renewal leases and 764,000 square feet of new leases, and the Company will experience an 8.7% increase in rental rates on a cash basis from these leases.
Capital Markets Activity and Liquidity
On October 8, 2020, the Company entered into a new $300 million unsecured credit facility, comprised of a four-year $200 million revolving credit facility and a five-year $100 million term loan, providing expanded line capacity and greater capital structure flexibility with lower borrowing costs. The new unsecured credit facility has an accordion feature enabling the Company to increase the total borrowing capacity under the credit facility and term loan up to an aggregate of $500 million, subject to certain conditions.
During the fourth quarter of 2020, the Company issued approximately 558,900 common shares through its ATM program at an average price of $13.58 per share, raising approximately $7.4 million in net proceeds. To date in the first quarter of 2021, the Company issued approximately 2,659,000 common shares through its ATM program at an average price of $14.86 per share, raising approximately $38.8 million in net proceeds.
During the fourth quarter of 2020, the Company repurchased approximately 16,000 shares of its Series A 7.5% Preferred Stock for approximately $416,000.
As of February 24, 2020, the Company’s current cash balance was approximately $15.8 million, excluding operating expense escrows of approximately $5.3 million, and it has approximately $135 million of availability under the unsecured line of credit.
Quarterly Distributions to Stockholders
On December 1, 2020 the Company announced the Board of Directors declared a regular quarterly cash dividend of $0.46875 per share for the Series A Preferred Stock for the fourth quarter of 2020. The dividend was paid on December 31, 2020 to stockholders of record on December 15, 2020.
On December 15, 2020 the Company announced the Board of Directors declared a regular quarterly cash dividend of $0.20 per share for the Preferred Stock for the fourth quarter of 2020. The dividend was paid on January 29, 2021 to stockholders of record on December 31, 2020.
Guidance for 2021
The Company expects its results for 2021 to be in a range of a net loss of $(0.29) to $(0.25) per weighted average common share and operating unit outstanding, Core FFO of $1.70 to $1.74 per weighted average common share and unit and AFFO of $1.43 to $1.48 per weighted average common share and unit.
The Company expects its results for the first quarter of 2021 to be in a range of a net loss of $(0.11) to $(0.09) per weighted average common share and unit, Core FFO of $0.37 to $0.39 per weighted average common share and unit and AFFO of $0.28 to $0.30 per weighted average common share and unit.
See “Non-GAAP Financial Measures” for a complete definition of Core FFO and AFFO and the financial table accompanying this press release for reconciliations of net income to Core FFO and AFFO.
A reconciliation of projected net loss per weighted average common share and unit outstanding to projected Core FFO per weighted average common share and unit and AFFO per weighted average common share and unit is provided as follows:
Full Year 2021 Range | ||||||||
Low | High | |||||||
Net loss | $ | (0.29 | ) | $ | (0.25 | ) | ||
Add: Real estate depreciation & amortization | 2.17 | 2.17 | ||||||
Add: Real estate depreciation & amortization attributable to JV | 0.05 | 0.05 | ||||||
Less: Preferred stock dividends | (0.23 | ) | (0.23 | ) | ||||
Core FFO | 1.70 | 1.74 | ||||||
Amortization of debt related costs | 0.06 | 0.06 | ||||||
Stock compensation | 0.06 | 0.06 | ||||||
Straight-line rent | (0.09 | ) | (0.09 | ) | ||||
Above/below market lease rents | (0.06 | ) | (0.06 | ) | ||||
Recurring capital expenditures | (0.24 | ) | (0.23 | ) | ||||
AFFO | $ | 1.43 | $ | 1.48 | ||||
First Quarter 2021 Range | ||||||||
Low | High | |||||||
Net loss | $ | (0.11 | ) | $ | (0.09 | ) | ||
Add: Real estate depreciation & amortization | 0.53 | 0.53 | ||||||
Add: Real estate depreciation & amortization attributable to JV | 0.01 | 0.01 | ||||||
Less: Preferred stock dividends | (0.06 | ) | (0.06 | ) | ||||
Core FFO | 0.37 | 0.39 | ||||||
Amortization of debt related costs | 0.01 | 0.01 | ||||||
Stock compensation | 0.02 | 0.02 | ||||||
Straight-line rent | (0.02 | ) | (0.02 | ) | ||||
Above/below market lease rents | (0.02 | ) | (0.02 | ) | ||||
Recurring capital expenditures | (0.08 | ) | (0.08 | ) | ||||
AFFO | $ | 0.28 | $ | 0.30 |
The Company’s guidance for net loss, Core FFO and AFFO for 2021 is based on the following assumptions.
• | Total revenues of $132.8 million to $133.5 million for the year; $30.8 million to $31.0 million for the first quarter |
• | Net operating income of $88.8 million to $89.6 million for the year; $20.1 million to $20.5 million for the first quarter |
• | EBITDAre of $76.8 million to $77.3 million for the year; $17.4 million to $17.5 million for the first quarter |
• | General and administrative expenses of $12.2 million to $11.9 million for the year; $3.0 million to $2.9 million for the first quarter, including non-cash expenses of $1.62 million and $0.44 million, respectively |
• | Recurring capital expenditures of $6.85 million to $6.55 million for the year; $2.35 million $2.25 million for the first quarter |
• | SS NOI on a cash basis of $58.6 million to $59.2 million, representing a 3.0% to 3.4% increase for the year; $14.1 million to $14.3 million for the first quarter |
• | Same store occupancy of 95.5% to 97.0% for the year; 95.5% to 96.5% for the first quarter |
• | 28,550,000 weighted average common shares and operating partnership units outstanding for the year; 28,030,000 weighted average outstanding for the first quarter (28,721,000 currently outstanding) |
• | The completion of approximately $147 million in acquisitions ($42 million of which is expected to be completed by March 31, 2021, and the balance by June 30, 2021) |
Other than noted above, this guidance excludes the potential impact of additional acquisitions or dispositions, if completed.
Earnings Conference Call and Webcast
The Company will host a conference call and live audio webcast, both open for the general public to hear, later today at 9:00 a.m. Eastern Time. The number to call for this interactive teleconference is (412) 717-9587. A replay of the call will be available through March 5, 2021, by dialing (412) 317-0088 and entering the replay access code, 10152286.
The live audio webcast of the Company’s quarterly conference call will be available online in the Investor Relations section of the Company’s website at ir.plymouthreit.com. The online replay will be available approximately one hour after the end of the call and archived for approximately 90 days.
About Plymouth
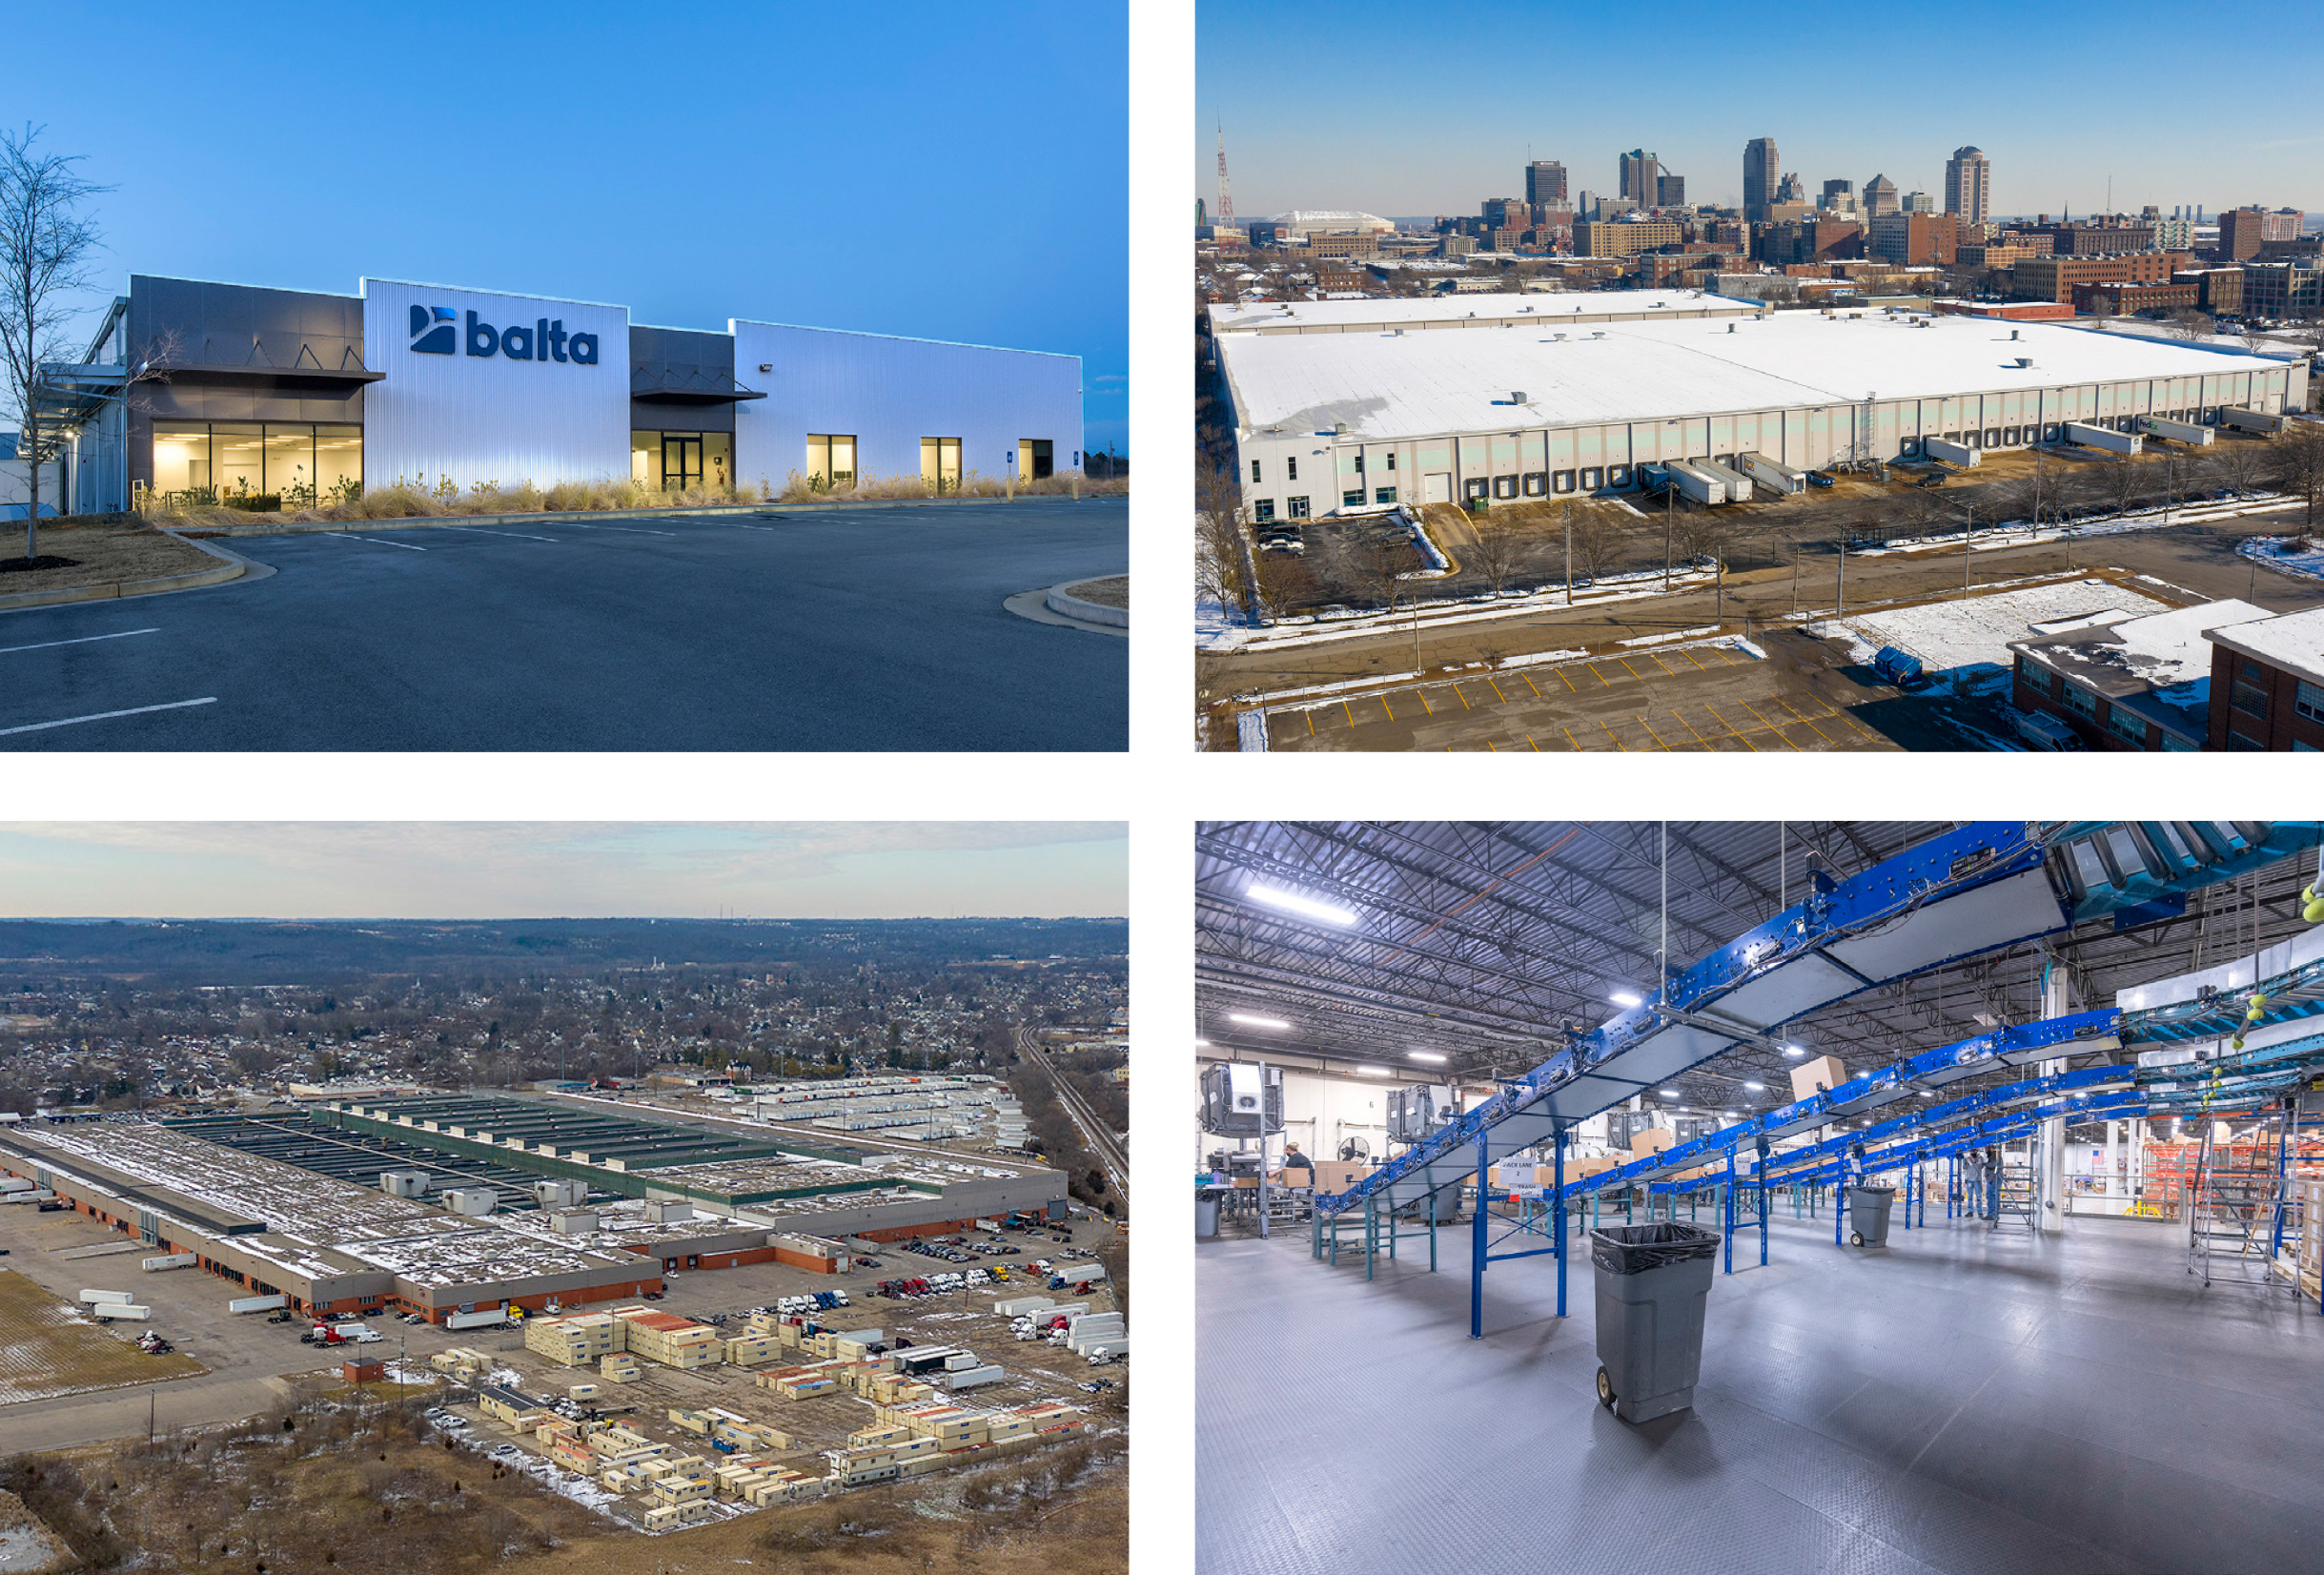
Plymouth Industrial REIT, Inc. (NYSE: PLYM) is a real estate investment trust focused on the acquisition, ownership, management, redevelopment and development of single and multi-tenant industrial properties, including distribution centers, warehouses, light industrial and small bay industrial properties, located in primary and secondary markets, as well as select sub-markets, with access to large pools of skilled labor in the main industrial, distribution and logistics corridors of the United States.
Forward-Looking Statements
This press release includes “forward-looking statements” that are made pursuant to the safe harbor provisions of Section 27A of the Securities Act of 1933 and of Section 21E of the Securities Exchange Act of 1934. The forward-looking statements in this release do not constitute guarantees of future performance. Investors are cautioned that statements in this press release, which are not strictly historical statements, including, without limitation, statements regarding management's plans, objectives and strategies, constitute forward-looking statements. Such forward-looking statements are subject to a number of known and unknown risks and uncertainties that could cause actual results to differ materially from those anticipated by the forward-looking statement, many of which may be beyond our control, including, without limitation, those factors described under the captions “Cautionary Note Regarding Forward-Looking Statements” and “Risk Factors” in the Company’s Annual Report on Form 10-K and Quarterly Reports on Form 10-Q filed with the Securities and Exchange Commission. Forward-looking statements generally can be identified by the use of forward-looking terminology such as “may,” “plan,” “seek,” “will,” “expect,” “intend,” “estimate,” “anticipate,” “believe” or “continue” or the negative thereof or variations thereon or similar terminology. Any forward-looking information presented herein is made only as of the date of this press release, and we do not undertake any obligation to update or revise any forward-looking information to reflect changes in assumptions, the occurrence of unanticipated events, or otherwise.
Exhibit 99.2
Fourth Quarter 2020
Supplemental
Plymouth Industrial REIT, Inc. | |||||||||||||
Table of Contents | |||||||||||||
Introduction | |||||||||||||
Executive Summary | 2 | ||||||||||||
Management, Board of Directors, Investor Relations, and Equity Coverage | 2 | ||||||||||||
Portfolio Statistics | 3 | ||||||||||||
Acquisition Activity | 3 | ||||||||||||
Select Recent Acquisitions | 4 | ||||||||||||
Value Creation | 5 | ||||||||||||
Replacement Cost Analysis | 5 | ||||||||||||
Rent Collections and Deferrals | 6 | ||||||||||||
Guidance | 7 | ||||||||||||
Financial Information | |||||||||||||
Same Store Net Operating Income (NOI) | 8 | ||||||||||||
Consolidated Statements of Operations | 9 | ||||||||||||
Consolidated NOI | 10 | ||||||||||||
Earnings Before Interest, Taxes, Depreciation and Amortization for Real Estate (EBITDAre) | 11 | ||||||||||||
Funds from Operations (FFO), Core FFO & Adjusted Funds from Operations (AFFO) | 11 | ||||||||||||
Consolidated Balance Sheets | 12 | ||||||||||||
Capital Structure and Debt Summary | 13 | ||||||||||||
Capital Markets Activity | 13 | ||||||||||||
Unconsolidated Joint Venture | 14 | ||||||||||||
Net Asset Value Components | 15 | ||||||||||||
Operational & Portfolio Information | |||||||||||||
Leasing Activity | 16 | ||||||||||||
Lease Expiration Schedule | 16 | ||||||||||||
Leased Square Feet and Annualized Base Rent by Tenant Industry | 17 | ||||||||||||
Leased Square Feet and Annualized Base Rent by Type | 18 | ||||||||||||
Top 10 Tenants by Annualized Base Rent | 19 | ||||||||||||
Lease Segmentation by Size | 19 | ||||||||||||
Rentable Square Feet and Annualized Base Rent by Market | 20 | ||||||||||||
Total Acquisition Cost by Market | 20 | ||||||||||||
Appendix | |||||||||||||
Glossary | 21 | ||||||||||||
Forward-Looking Statements: This Supplemental Information contains forward-looking statements within the meaning of the U.S. federal securities laws. We make statements in this Supplemental Information that are forward-looking statements, which are usually identified by the use of words such as “anticipates,” “believes,” “estimates,” “expects,” “intends,” “may,” “plans” “projects,” “seeks,” “should,” “will,” and variations of such words or similar expressions. Our forward-looking statements reflect our current views about our plans, intentions, expectations, strategies and prospects, which are based on the information currently available to us and on assumptions we have made. Although we believe that our plans, intentions, expectations, strategies and prospects as reflected in or suggested by our forward-looking statements are reasonable, we can give no assurance that our plans, intentions, expectations, strategies or prospects will be attained or achieved and you should not place undue reliance on these forward-looking statements. Additionally, unforeseen factors emerge from time to time, and we cannot predict which factors will arise or their ultimate impact on our business or the extent to which any such factor, or combination of factors, may cause actual results to differ materially from those contained in any forward-looking statements. One of these factors is the outbreak of the novel coronavirus (COVID-19), the impact of which is difficult to fully assess at this time due to, among other factors, uncertainty regarding the severity and duration of the outbreak domestically and internationally and the effectiveness of efforts to contain the spread of the virus and its resulting direct and indirect impact on the U.S. economy and economic activity. Furthermore, actual results may differ materially from those described in the forward-looking statements and may be affected by a variety of risks and factors. Any forward-looking statement speaks only as of the date on which it is made. New risks and uncertainties arise over time, and it is not possible for us to predict those events or how they may affect us. Except as required by law, we are not obligated to, and do not intend to, update or revise any forward-looking statements, whether as a result of new information, future events or otherwise. |
Definitions and Reconciliations: For definitions of certain terms used throughout this Supplemental Information, including certain non-GAAP financial measures, refer to the Glossary on pages 21-22. For reconciliations of the non-GAAP financial measures to the most directly comparable U.S. GAAP measures, refer to pages 10-11. | |||||||||||||
4Q 2020 Supplemental
Page 1
Plymouth Industrial REIT, Inc. | ||||||||||
Executive Summary | ||||||||||
Company overview: Plymouth Industrial REIT, Inc. (NYSE: PLYM) is a full service, vertically integrated, self-administered and self-managed REIT focused on the acquisition, ownership, management, redevelopment and development of single and multi-tenant industrial properties, including distribution centers, warehouses, light industrial and small bay industrial properties, located in primary and secondary markets, as well as select sub-markets, with access to large pools of skilled labor in the main industrial, distribution and logistics corridors of the United States. We seek to acquire properties that provide income and growth that enable us to leverage our real estate operating expertise to enhance shareholder value through proactive asset management, prudent property repositioning and disciplined capital deployment. | ||||||||||
Management, Board of Directors, Investor Relations, and Equity Coverage | ||||||||
Corporate | Investor Relations | Transfer Agent | ||||||
20 Custom House Street, 11th Floor | Tripp Sullivan | Continental Stock Transfer & Trust Company | ||||||
Boston, Massachusetts 02110 | SCR Partners | 1 State Street, 30th Floor | ||||||
617.340.3814 | 615.942.7077 | New York, NY 10004 | ||||||
www.plymouthreit.com | IR@plymouthreit.com | 212.509.4000 | ||||||
Executive and Senior Management | ||||||||
Jeffrey E. Witherell | Pendleton P. White, Jr. | Daniel C. Wright | James M. Connolly | |||||
Chief Executive Officer | President and Chief Investment | Executive Vice President | Executive Vice President | |||||
and Chairman | Officer | and Chief Financial Officer | Asset Management | |||||
Board of Directors | ||||||||
Martin Barber | Philip S. Cottone | Richard J. DeAgazio | John W. Guinee III | |||||
Independent Director | Independent Director | Independent Director | Independent Director | |||||
David G. Gaw | Pendleton P. White, Jr. | Jeffery E. Witherell | ||||||
Independent Director | President and Chief Investment | Chief Executive Officer | ||||||
Officer | and Chairman | |||||||
Equity Research Coverage1 | ||||||||
Baird | JMP Securities | Piper Sandler & Co. | ||||||
Dave Rodgers | Aaron Hecht | Alexander Goldfarb | ||||||
216.737.7341 | 415.835.3963 | 212.466.7937 | ||||||
Berenberg Capital Markets | KeyBanc Capital Markets | Wedbush Securities | ||||||
Connor Siversky | Craig Mailman | Henry Coffey | ||||||
646.949.9037 | 917.368.2316 | 212.833.1382 | ||||||
D.A. Davidson & Co. | National Securities Corp. | |||||||
Barry Oxford | Guarav Mehta | |||||||
646.885.5423 | 212.417.8008 |
Investor Conference Call and Webcast: The Company will hold a conference call and live audio webcast, both open for the general public to hear, on February 26, 2021 at 9:00 a.m. Eastern Time. The number to call for this interactive teleconference is (412) 717-9587. A replay of the call will be available through March 5, 2021 by dialing (412) 317-0088 and entering the replay access code, 10152286. |
|||||||||
1) The analysts listed provide research coverage on the Company. Any opinions, estimates or forecasts regarding the Company's performance made by these analysts are theirs alone and do not represent opinions, estimates or forecasts by the Company or its management. The Company does not by reference above imply its endorsement of or concurrence with such information, conclusions or recommendations. | |||||||||
4Q 2020 Supplemental
Page 2
Plymouth Industrial REIT, Inc. | |||||||||||||
Portfolio Statistics | |||||||||||||
Unaudited ($ in thousands, except Cost/SF) as of 12/31/2020 | |||||||||||||
Portfolio Snapshot | Portfolio Growth | |
Number of Properties | 107 | |
Number of Buildings | 141 | |
Square Footage | 23,272 | |
Occupancy | 96.4% | |
Weighted Average (WA) Lease Term Remaining (yrs.) | 3.8 | |
Total Annualized Base Rent (ABR)1 | $94,095 | |
Rental Rate Increase - Cash basis2 | 8.7% |
Acquisition Activity | |||||||||||||
Investment Highlights | |||||||||||||
● | Our recent acquisitions are located in markets with access to large pools of skilled labor in the main industrial, distribution and logistics corridors of the U.S. | Acquisitions - Q4 2020 | $104,500 | ||||||||||
Square Footage Acquired - Q4 2020 | 2,428,359 | ||||||||||||
● | Added high-quality tenants and enlarged tenant / industry diversification | Acquisitions - FY 2020 | $243,568 | ||||||||||
● | Increased our scale in key markets of Chicago/South Bend, Indianapolis, Jacksonville/Savannah, Atlanta, Cleveland, Columbus, Cincinnati and Memphis | Square Footage Acquired - FY 2020 | 5,473,596 | ||||||||||
WA Occupancy at Acquisition - FY 2020 | 98.1% | ||||||||||||
● | Expanded the portfolio through the executed JV partnership with Madison that acquired a 28-property portfolio of industrial buildings totaling 2.3 million square feet in metropolitan Memphis for $86 million with a projected initial yield of 7.7% | WA Lease Term Remaining (yrs.) - FY 2020 | 4.5 | ||||||||||
Replacement Cost/SF3 - FY 2020 | $78.86 |
Acquisitions | |||||||||||||
Location | Acquisition Date | # of Buildings | Purchase Price4 | Square Footage | Projected Initial Yield5 | Cost per Square Foot6 | |||||||
Chicago, IL | 1/24/2020 | 1 | $ 18,650 | 465,940 | 8.6% | $ 40.03 | |||||||
Indianapolis, IN | 1/27/2020 | 1 | 8,800 | 276,240 | 7.8% | 31.86 | |||||||
Atlanta, GA | 1/28/2020 | 5 | 34,700 | 924,036 | 7.6% | 37.55 | |||||||
Avon, OH | 2/14/2020 | 3 | 15,750 | 406,863 | 8.2% | 38.71 | |||||||
Atlanta, GA | 3/13/2020 | 1 | 10,056 | 117,000 | 8.3% | 85.95 | |||||||
St. Louis, MO | 9/2/2020 | 2 | 27,000 | 487,150 | 7.2% | 55.42 | |||||||
St. Louis, MO | 9/3/2020 | 2 | 3,712 | 79,258 | 7.5% | 46.83 | |||||||
Jacksonville, FL | 9/10/2020 | 1 | 20,400 | 288,750 | 8.8% | 70.65 | |||||||
Mansfield, OH | 10/23/2020 | 1 | 10,500 | 314,736 | 9.0% | 33.36 | |||||||
Akron/Canton, OH | 11/24/2020 | 10 | 94,000 | 2,113,623 | 7.5% | 44.47 | |||||||
Total 2020 Acquisitions | 27 | $ 243,568 | 5,473,596 | 7.8% | $ 46.99 | ||||||||
Multiple | Full Year 2019 | 32 | $ 220,115 | 5,776,928 | 8.4% | $ 42.21 | |||||||
Multiple | Full Year 2018 | 7 | $ 164,575 | 2,903,699 | 8.2% | $ 70.54 | |||||||
Multiple | 20177 | 29 | $ 173,325 | 5,195,563 | 8.4% | $ 33.81 | |||||||
Total Acquisitions Post-IPO8 | 95 | $ 801,583 | 19,349,786 | 8.2% | $ 47.66 | ||||||||
Portfolio statistics and acquisitions include wholly owned properties only. | ||
1) | Annualized base rent is calculated as monthly contracted base rent as of December 31, 2020, multiplied by 12. Excludes rent abatements. |
2) | Based on approximately 2.6 million square feet of new and renewal leases greater than six months in term. Refer to Leasing Activity in this Supplemental Information for additional details. |
3) | Replacement cost is based on the Marshall & Swift valuation methodology for the determination of building costs. Replacement cost includes land reflected at the allocated cost in accordance with GAAP. |
4) | Represents total direct consideration paid rather than GAAP cost basis. |
5) | Weighted based on Purchase Price. |
6) | Calculated as Purchase Price divided by square footage. |
7) | Since our initial public offering in June 2017. |
8) | Excludes the acquisition of a 221,911-square foot industrial building in Kansas City, MO for $8.6 million completed in February 2021. |
4Q 2020 Supplemental
Page 3
Plymouth Industrial REIT, Inc. | |||||||
Select Recent Acquisitions | |||||||
Since the Company's initial public offering in June 2017, the Company has acquired $801.6 million of wholly owned properties totaling 19.3 million square feet in industrial markets with access to large pools of skilled workers in the main industrial, distribution and logistics corridors of the U.S. | |||||||
Unaudited ($ in thousands, except Cost/SF) |
Shadeland Commerce Center | |||
Location | Indianapolis | ||
Acquisition Date | December-19 | ||
# of Buildings | 9 | ||
Purchase Price1 | $49,815 | ||
Square Footage | 1,747,411 | ||
Occupancy | 94.5% | ||
WA Lease Term Remaining | 2.9 years | ||
Projected Initial Yield | 8.1% | ||
Replacement Cost/SF2 | $75.18 | ||
Multi-Tenant % | 78% | ||
Single-Tenant % | 22% | ||
Location Characteristics: Indianapolis is a converging point for five interstates with access to 46% of the country’s population within one day’s drive time making the city attractive for warehousing, distribution and manufacturing (source: JLL) | |||
Market Characteristics: Low vacancy rates; positive supply and demand fundamentals supporting rent growth; robust manufacturing employment | |||
Portfolio Fit: Brings Company's scale in the Indianapolis metro area to 3.5 million square feet and enlarges tenant / industry diversification |
Georgia Industrial Portfolio | |||
Location | Atlanta | ||
Acquisition Date | January-20 | ||
# of Buildings | 5 | ||
Purchase Price1 | $34,700 | ||
Square Footage | 924,036 | ||
Occupancy | 100.0% | ||
WA Lease Term Remaining | 3.7 years | ||
Projected Initial Yield | 7.6% | ||
Replacement Cost/SF2 | $63.11 | ||
Multi-Tenant % | 0% | ||
Single-Tenant % | 100% | ||
Location Characteristics: Atlanta outperformed every other industrial market in the nation in 2020, recording the highest annual net absorption figure in the U.S. (source: Cushman & Wakefield) | |||
Market Characteristics: Low vacancy rates; substantial net absorption gains; stable manufacturing employment pool | |||
Portfolio Fit: Brings Company's scale in Atlanta to over 1.3 million square feet and opens up a new market in Savannah, which was ranked the fastest growing terminal market in the U.S. in 2018 (source: JLL) | |||
1) | Represents total direct consideration paid rather than GAAP cost basis. |
2) | Replacement cost is based on the Marshall & Swift valuation methodology for the determination of building costs. Replacement cost includes land reflected at the allocated cost in accordance with GAAP. |
4Q 2020 Supplemental
Page 4
Plymouth Industrial REIT, Inc. | |||||||||||||
Value Creation | |||||||||||||
Unaudited ($ in thousands, except RSF) | |||||||||||||
Examples of Value Creation | |||||||||||||
Lease Extension | Uncertain Tenancy | Lease Restructure / Extension | ||
Atlanta, GA | Chicago, IL | Chicago, IL | ||
Acquired in December 2017 with two years remaining on single-tenant lease term | Acquired single-tenant building in November of 2017 with less than 2 years remaining on lease term | Acquired 6-building single-tenant portfolio in August of 2017 with 3 years remaining on lease term and no rent escalation | ||
Negotiated early 5-year lease extension at higher rental rate | Executed planned improvements to demise building and utilities, and enlarge parking accommodations | Reduced tenant's footprint to 3 buildings and extended term for 5 years with rent escalations | ||
Exit cap rate ~110bps below stabilized acquisition cap rate1 | Secured leases to 2 new tenants with no downtime at lease rates 20% above underwriting projections | Secured new tenant for other 3 buildings at higher rent for a 10-year term with no downtime | ||
Current NOI performance reflects a 37% premium above acquisition underwriting1 | Exit cap rate ~130bps below stabilized acquisition cap rate1 |
Replacement Cost Analysis | |||||||||||||
Total Rentable | |||||||||||||
Market | Market Type2 | # of Buildings | Square Feet (RSF) | Purchase Price3 | Replacement Cost4 | ||||||||
Atlanta | Primary | 9 | 1,318,002 | $ 62,931 | $ 81,124 | ||||||||
Chicago | Primary | 38 | 6,027,300 | 226,933 | 489,100 | ||||||||
Boston | Secondary | 1 | 200,625 | 10,500 | 20,161 | ||||||||
Cincinnati | Secondary | 8 | 2,073,510 | 79,700 | 132,926 | ||||||||
Cleveland | Secondary | 16 | 3,581,240 | 168,550 | 299,132 | ||||||||
Columbus | Secondary | 9 | 1,951,723 | 61,400 | 130,190 | ||||||||
Indianapolis | Secondary | 14 | 3,468,401 | 104,740 | 245,919 | ||||||||
Jacksonville | Secondary | 24 | 1,966,154 | 135,650 | 172,492 | ||||||||
Memphis | Secondary | 15 | 1,773,894 | 53,475 | 104,940 | ||||||||
Philadelphia | Secondary | 1 | 156,634 | 9,700 | 10,569 | ||||||||
St. Louis | Secondary | 6 | 754,463 | 39,637 | 52,228 | ||||||||
Total | 141 | 23,271,946 | $ 953,216 | $ 1,738,781 | |||||||||
1) | Based on acquisition yield and current NOIs at estimated capitalization rates as of December 31, 2020. | ||||||||||||
2) | Primary markets means the following two metropolitan areas in the U.S., each generally consisting of more than 300 million square feet of industrial space: Chicago and Atlanta. Secondary markets means non-primary markets, each generally consisting of between 100 million and 300 million square feet of industrial space, including the following metropolitan areas in the U.S.: Boston, Cincinnati, Cleveland, Columbus, Indianapolis, Jacksonville, Kansas City, Memphis, Milwaukee, Philadelphia, South Florida, and St. Louis. Our definitions of primary and secondary markets may vary from the definitions of these terms used by investors, analysts or other industrial REITs. | ||||||||||||
3) | Represents total direct consideration paid rather than GAAP cost basis. | ||||||||||||
4) | Replacement cost is based on the Marshall & Swift valuation methodology for the determination of building costs. Replacement cost includes land reflected at the allocated cost in accordance with GAAP. | ||||||||||||
4Q 2020 Supplemental
Page 5
Plymouth Industrial REIT, Inc. | |||||||||
Rent Collections and Deferrals | |||||||||
We continue to experience substantial rent collection throughout the COVID-19 pandemic. Collection of original contracted rents, including those deferred, as of the current quarter ended was 99.6%. Subsequent to the period end, we have collected all outstanding rent deferments. | |||||||||
Unaudited ($ in thousands) | |||||||||
% of Tenant | % of Tenant | Total Revised | |||||||
Contractual Base | Contractual Base | Contractual Base | |||||||
Rent Collections | Rent Collected1 | Rent Deferred | Rent Collected | ||||||
First Quarter 2020 | 99.9% | 0.0% | 99.9% | ||||||
Second Quarter 2020 | 95.2% | 4.7% | 99.9% | ||||||
Third Quarter 2020 | 99.2% | 0.4% | 99.6% | ||||||
Fourth Quarter 2020 | 99.6% | 0.0% | 99.6% | ||||||
Rent Deferrals2 | Granted3 | Collected | Outstanding | ||||||
First Quarter 2020 | $ - | $ - | $ - | ||||||
Second Quarter 2020 | 1,161 | - | 1,161 | ||||||
Third Quarter 2020 | 89 | 410 | 840 | ||||||
Fourth Quarter 2020 | - | 695 | 145 | ||||||
Total4 | $ 1,250 | $ 1,105 | $ 145 | ||||||
1) | Cash receipts based on contractual base rent receivables through February 16, 2021. | |||||||
2) | Rent deferrals required full repayment of rent amounts within twelve months from the date of the deferment. The average deferment period, weighted by the total deferred rent amount, was five months. | |||||||
3) | Rent deferments were granted during the second quarter of 2020; amounts shown as granted relate to the period in which the contractual base rent was due. No new rent deferments were granted during the third or fourth quarters of 2020. | |||||||
4) | The total outstanding rental deferral amounts as of the year ended December 31, 2020 have been paid consistent with the deferral terms and fully collected in the subsequent period. | |||||||
4Q 2020 Supplemental
Page 6
Plymouth Industrial REIT, Inc. |
Guidance |
Unaudited (in thousands, except per-share amounts) |
First Quarter 2021 Range1 | Full Year 2021 Range1 | |||||||||
Low | High | Low | High | |||||||
Net loss | $ (0.11) | $ (0.09) | $ (0.29) | $ (0.25) | ||||||
Depreciation and amortization | 0.53 | 0.53 | 2.17 | 2.17 | ||||||
Depreciation and amortization from unconsolidated joint venture | 0.01 | 0.01 | 0.05 | 0.05 | ||||||
Preferred stock dividend | (0.06) | (0.06) | (0.23) | (0.23) | ||||||
Core FFO | $ 0.37 | $ 0.39 | $ 1.70 | $ 1.74 | ||||||
Amortization of debt related costs | 0.01 | 0.01 | 0.06 | 0.06 | ||||||
Stock compensation | 0.02 | 0.02 | 0.06 | 0.06 | ||||||
Straight line rent | (0.02) | (0.02) | (0.09) | (0.09) | ||||||
Above/below market lease rents | (0.02) | (0.02) | (0.06) | (0.06) | ||||||
Recurring capital expenditures | (0.08) | (0.08) | (0.24) | (0.23) | ||||||
AFFO attributable to common stockholders and unit holders | $ 0.28 | $ 0.30 | $ 1.43 | $ 1.48 | ||||||
Weighted average common shares and units outstanding | 28,030 | 28,030 | 28,550 | 28,550 | ||||||
2021 Guidance Assumptions | Low | High | Low | High | ||||||
Total Revenue | $ 30,800 | $ 31,000 | $ 132,800 | $ 133,500 | ||||||
NOI | $ 20,100 | $ 20,500 | $ 88,800 | $ 89,600 | ||||||
EBITDAre | $ 17,400 | $ 17,500 | $ 76,800 | $ 77,300 | ||||||
General & Administrative2 | $ 3,000 | $ 2,900 | $ 12,200 | $ 11,900 | ||||||
Recurring Capital Expenditures | $ 2,350 | $ 2,250 | $ 6,850 | $ 6,550 | ||||||
Same Store Cash NOI3 | $ 14,100 | $ 14,300 | $ 58,600 | $ 59,150 | ||||||
Same Store Occupancy3 | 95.5% | 96.5% | 95.5% | 97.0% | ||||||
1) | Assumes the completion of approximately $42 million and an additional $105 million of acquisitions by periods ending March 31, 2021 and June 30, 2021, respectively. There can be no assurance that we will compete such acquisitions within the forecasted timeframes. |
2) | Includes non-cash stock compensation of $0.44 and $1.62 million in the first quarter and full year 2021, respectively. |
3) | The Same Store Portfolio consists of 108 buildings aggregating 17,093,547 rentable square feet. The Same Store performance reflects an annual NOI cash basis increase of 3.0%-3.4%. |
4Q 2020 Supplemental
Page 7
Plymouth Industrial REIT, Inc. | ||||||||||
Same Store Net Operating Income (NOI) | ||||||||||
Unaudited ($ in thousands) | ||||||||||
Same Store Portfolio Statistics | ||||||||||
Square footage | 11,740,879 | Includes: wholly owned properties for the period Jan. 1, 2019 to Dec. 31, 2020; determined and set once per year for the following twelve months (refer to Glossary for Same Store definition) | ||||||||
Number of properties | 53 | |||||||||
Number of buildings | 76 | |||||||||
Percentage of total portfolio square footage | 50.5% | Excludes: wholly owned properties classified as repositioning or lease-up during 2019 or 2020 (3 properties representing approximately 281,000 of rentable square feet) and unconsolidated joint venture properties | ||||||||
Occupancy at period end | 97.9% | |||||||||
Same Store NOI - GAAP Basis | |||||||||
Three Months Ended December 31, | |||||||||
2020 | 2019 | $ Change | % Change | ||||||
Rental revenue | $ 16,964 | $ 16,616 | $ 348 | 2.1% | |||||
Property expenses | 6,229 | 6,050 | 179 | 3.0% | |||||
Same Store NOI - GAAP Basis | $ 10,735 | $ 10,566 | $ 169 | 1.6% | |||||
Same Store NOI excluding early termination income - GAAP Basis | $ 10,697 | $ 10,566 | $ 131 | 1.2% | |||||
Twelve Months Ended December 31, | |||||||||
2020 | 2019 | $ Change | % Change | ||||||
Rental revenue | $ 67,274 | $ 65,958 | $ 1,316 | 2.0% | |||||
Property expenses | 24,613 | 24,181 | 432 | 1.8% | |||||
Same Store NOI - GAAP Basis | $ 42,661 | $ 41,777 | $ 884 | 2.1% | |||||
Same Store NOI excluding early termination income - GAAP Basis | $ 42,514 | $ 41,670 | $ 844 | 2.0% |
Same Store NOI - Cash Basis | |||||||||
Three Months Ended December 31, | |||||||||
2020 | 2019 | $ Change | % Change | ||||||
Rental revenue | $ 16,540 | $ 15,989 | $ 551 | 3.4% | |||||
Property expenses | 6,229 | 6,050 | 179 | 3.0% | |||||
Same Store NOI - Cash Basis | $ 10,311 | $ 9,939 | $ 372 | 3.7% | |||||
Same Store NOI excluding early termination income - Cash Basis | $ 10,273 | $ 9,939 | $ 334 | 3.4% | |||||
Twelve Months Ended December 31, | |||||||||
2020 | 2019 | $ Change | % Change | ||||||
Rental revenue | $ 65,451 | $ 63,615 | $ 1,836 | 2.9% | |||||
Property expenses | 24,613 | 24,181 | 432 | 1.8% | |||||
Same Store NOI - Cash Basis | $ 40,838 | $ 39,434 | $ 1,404 | 3.6% | |||||
Same Store NOI excluding early termination income - Cash Basis | $ 40,691 | $ 39,327 | $ 1,364 | 3.5% |
4Q 2020 Supplemental
Page 8
Plymouth Industrial REIT, Inc. | |||||||||
Consolidated Statements of Operations | |||||||||
Unaudited ($ thousands, except per-share amounts) | |||||||||
Three Months Ended December 31, | Full Year Ended December 31, | ||||||||
2020 | 2019 | 2020 | 2019 | ||||||
Revenues: | |||||||||
Rental revenue | $ 23,169 | $ 17,271 | $ 85,025 | $ 57,387 | |||||
Tenant recoveries | 6,783 | 5,212 | 24,811 | 17,903 | |||||
Management fee revenue1 | 15 | - | 15 | - | |||||
Total revenues | $ 29,967 | $ 22,483 | $ 109,851 | $ 75,290 | |||||
Operating expenses: | |||||||||
Property | 10,058 | 8,021 | 38,159 | 27,237 | |||||
Depreciation and amortization | 14,826 | 11,074 | 56,428 | 37,381 | |||||
General and administrative | 2,984 | 2,009 | 10,362 | 7,481 | |||||
Total operating expenses | $ 27,868 | $ 21,104 | $ 104,949 | $ 72,099 | |||||
Other income (expense): | |||||||||
Interest expense | (4,622) | (3,887) | (18,931) | (14,948) | |||||
Impairment on real estate lease | - | - | (311) | - | |||||
Unrealized (appreciation)/depreciation of warrants | - | - | (103) | (181) | |||||
Earnings (loss) in investment of unconsolidated joint venture2 | (19) | - | (19) | - | |||||
Total other income (expense) | $ (4,641) | $ (3,887) | $ (19,364) | $ (15,129) | |||||
Net loss | $ (2,542) | $ (2,508) | $ (14,462) | $ (11,938) | |||||
Less: Loss attributable to non-controlling interest | (65) | (177) | (649) | (1,518) | |||||
Net loss attributable to Plymouth Industrial REIT, Inc. | $ (2,477) | $ (2,331) | $ (13,813) | $ (10,420) | |||||
Less: Preferred stock dividends | 1,605 | 1,565 | 6,444 | 6,263 | |||||
Less: Series B Preferred Stock accretion to redemption value | 1,854 | 1,900 | 7,416 | 7,601 | |||||
Less: Loss on extinguishment of Series A Preferred Stock | 34 | - | 34 | - | |||||
Less: Amount allocated to participating securities | 38 | 62 | 182 | 239 | |||||
Net loss attributable to common stockholders | $ (6,008) | $ (5,858) | $ (27,889) | $ (24,523) | |||||
Net loss basic and diluted per share attributable to common stockholders | $ (0.24) | $ (0.44) | $ (1.52) | $ (2.88) | |||||
Weighted-average common shares outstanding basic & diluted | 24,783 | 13,416 | 18,382 | 8,503 | |||||
1) | Represents management fee revenue earned from the unconsolidated joint venture. |
2) | Represents our share of earnings/(losses) related to our investment in an unconsolidated joint venture. Refer to Unconsolidated Joint Venture in this Supplement Information for additional details. |
4Q 2020 Supplemental
Page 9
Plymouth Industrial REIT, Inc. | ||||||
Consolidated NOI | ||||||
Unaudited ($ in thousands) | ||||||
Three Months Ended December 31, | ||||||
2020 | 2019 | |||||
Net loss | $ (2,542) | $ (2,508) | ||||
General and administrative | 2,984 | 2,009 | ||||
Depreciation and amortization | 14,826 | 11,074 | ||||
Interest expense | 4,622 | 3,887 | ||||
Equity in earnings of unconsolidated joint venture1 | 19 | - | ||||
Other Income2 | (15) | - | ||||
Net Operating Income | $ 19,894 | $ 14,462 | ||||
Twelve Months Ended December 31, | ||||||
2020 | 2019 | |||||
Net loss | $ (14,462) | $ (11,938) | ||||
General and administrative | 10,362 | 7,481 | ||||
Depreciation and amortization | 56,428 | 37,381 | ||||
Interest expense | 18,931 | 14,948 | ||||
Impairment on real estate lease3 | 311 | - | ||||
Unrealized appreciation/(depreciation) of warrants4 | 103 | 181 | ||||
Equity in earnings of unconsolidated joint venture1 | 19 | - | ||||
Other Income2 | (15) | - | ||||
Net Operating Income | $ 71,677 | $ 48,053 | ||||
1) | Represents our share of earnings/(losses) related to our investment in an unconsolidated joint venture. Refer to Unconsolidated Joint Venture in this Supplement Information for additional details. | |||||
2) | Represents management fee revenue earned from the unconsolidated joint venture. | |||||
3) | Represents a non-cash impairment against the carrying value of the right-of-use asset associated with the primary lease for our prior headquarters. | |||||
4) | Represents the change in the fair market value of our common stock warrants. | |||||
4Q 2020 Supplemental
Page 10
Plymouth Industrial REIT, Inc. | ||||||||
Non-GAAP Measurements | ||||||||
Unaudited ($ thousands, except per-share amounts) | ||||||||
Earnings Before Interest, Taxes, Depreciation and Amortization for Real Estate (EBITDAre) | ||||||||
Three Months Ended December 31, | Twelve Months Ended December 31, | |||||||
2020 | 2019 | 2020 | 2019 | |||||
Net loss | $ (2,542) | $ (2,508) | $ (14,462) | $ (11,938) | ||||
Depreciation and amortization | 14,826 | 11,074 | 56,428 | 37,381 | ||||
Interest expense | 4,622 | 3,887 | 18,931 | 14,948 | ||||
Unrealized appreciation/(depreciation) of warrants | - | - | 103 | - | ||||
EBITDAre | $ 16,906 | $ 12,453 | $ 61,000 | $ 40,391 | ||||
Stock based compensation amortization | 383 | 330 | 1,439 | 1,205 | ||||
Impairment on real estate lease1 | - | - | 311 | - | ||||
Pro forma effect of acquisitions2 | 1,331 | 1,338 | 2,628 | 2,681 | ||||
Adjusted EBITDA | $ 18,620 | $ 14,121 | $ 65,378 | $ 44,277 | ||||
Funds from Operations (FFO), Core FFO & Adjusted Funds from Operations (AFFO) | ||||||||
Three Months Ended December 31, | Twelve Months Ended December 31, | |||||||
2020 | 2019 | 2020 | 2019 | |||||
Net loss | $ (2,542) | $ (2,508) | $ (14,462) | $ (11,938) | ||||
Depreciation and amortization | 14,826 | 11,074 | 56,428 | 37,381 | ||||
Depreciation and amortization from unconsolidated joint venture | 64 | - | 64 | - | ||||
FFO | $ 12,348 | $ 8,566 | $ 42,030 | $ 25,443 | ||||
Preferred stock - Series A dividends | (949) | (956) | (3,817) | (3,823) | ||||
Preferred stock - Series B dividends | (656) | (609) | (2,627) | (2,440) | ||||
Unrealized (appreciation)/depreciation of warrants | - | - | 103 | 181 | ||||
Impairment on real estate lease1 | - | - | 311 | - | ||||
Core FFO | $ 10,743 | $ 7,001 | $ 36,000 | $ 19,361 | ||||
Amortization of debt related costs | 416 | 247 | 1,467 | 1,030 | ||||
Non-cash interest expense | 227 | 34 | 148 | 266 | ||||
Stock compensation | 383 | 330 | 1,439 | 1,205 | ||||
Straight line rent | (510) | (518) | (1,963) | (1,296) | ||||
Above/below market lease rents | (640) | (429) | (2,075) | (1,488) | ||||
Recurring capital expenditures3 | (759) | (921) | (3,263) | (3,143) | ||||
AFFO | $ 9,860 | $ 5,744 | $ 31,753 | $ 15,935 | ||||
Weighted average common shares and units outstanding | 25,627 | 14,599 | 19,327 | 9,698 | ||||
Core FFO attributable to common stockholders and unit holders per share | $ 0.42 | $ 0.48 | $ 1.86 | $ 2.00 | ||||
AFFO attributable to common stockholders and unit holders per share | $ 0.38 | $ 0.39 | $ 1.64 | $ 1.64 | ||||
Refer to Glossary in this Supplemental Information for definitions of non-GAAP financial measures. |
1) | Represents a non-cash impairment against the carrying value of the right-of-use asset associated with the primary lease for our prior headquarters. | ||||||||
2) | Represents the estimated impact of wholly owned and joint venture acquisitions as if they had been acquired on the first day of each respective quarter in which the acquisitions occurred. We have made a number of assumptions in such estimates and there can be no assurance that we would have generated the projected levels of EBITDA had we owned the acquired properties as of the beginning of the respective periods. | ||||||||
3) | Excludes non-recurring capital expenditures of $1,949 and $1,349 for the three months ended December 31, 2020 and 2019, respectively, and $5,427 and $4,579 for the years ended December 31, 2020 and 2019 respectively. Non-recurring capital expenditures are those capital items made with respect to a property for upgrades or renovation, and include expenditures for items that were identified at the time such property was acquired by the Company. |
4Q 2020 Supplemental
Page 11
Plymouth Industrial REIT, Inc. | |||||||||
Consolidated Balance Sheets | |||||||||
Unaudited ($ in thousands) |
December 31, 2020 | December 31, 2019 | |||||||
ASSETS | ||||||||
Real estate properties: | ||||||||
Land | $ | 159,681 | $ | 127,439 | ||||
Building and improvements | 727,000 | 528,349 | ||||||
Less accumulated depreciation | (98,283 | ) | (63,877 | ) | ||||
Total real estate properties, net | $ | 788,398 | $ | 591,911 | ||||
Cash, cash held in escrow and restricted cash | 32,054 | 22,398 | ||||||
Deferred lease intangibles, net | 66,116 | 57,088 | ||||||
Investment in unconsolidated joint venture1 | 6,683 | — | ||||||
Other assets | 27,019 | 14,084 | ||||||
Total assets | $ | 920,270 | $ | 685,481 | ||||
LIABILITIES, PREFERRED STOCK AND EQUITY | ||||||||
Secured debt, net | $ | 328,908 | $ | 397,458 | ||||
Unsecured debt, net2 | 189,254 | — | ||||||
Accounts payable, accrued expenses and other liabilities | 49,335 | 36,284 | ||||||
Deferred lease intangibles, net | 11,350 | 8,314 | ||||||
Financing lease liability3 | 2,207 | — | ||||||
Total liabilities | $ | 581,054 | $ | 442,056 | ||||
Preferred stock - Series A | $ | 48,485 | $ | 48,868 | ||||
Preferred stock - Series B4 | $ | 87,209 | $ | 79,793 | ||||
Equity: | ||||||||
Common stock | $ | 253 | $ | 141 | ||||
Additional paid in capital | 360,752 | 256,259 | ||||||
Accumulated deficit | (162,250 | ) | (148,403 | ) | ||||
Total stockholders' equity | 198,755 | 107,997 | ||||||
Non-controlling interest | 4,767 | 6,767 | ||||||
Total equity | $ | 203,522 | $ | 114,764 | ||||
Total liabilities, preferred stock and equity | $ | 920,270 | $ | 685,481 |
1) | Represents a noncontrolling equity interest in a single joint venture we entered into during October, 2020. Our investment in the joint venture is accounted for under the equity method of accounting. Refer to Investment in Unconsolidated Joint Venture in this Supplemental Information for additional details. | ||||
2) | Includes borrowings under line of credit. Refer to Debt Summary in this Supplemental Information for additional details. | ||||
3) | As of December 31, 2020, we have a single finance lease in which we are the sublessee for a ground lease with a remaining lease term of approximately 35 years. Refer to our 2020 Annual Report on Form 10-K for expanded disclosure. | ||||
4) | Refer to Glossary in this Supplemental Information for relevant features of the Preferred stock - Series B. |
4Q 2020 Supplemental
Page 12
Plymouth Industrial REIT, Inc. | ||||||||
Capital Structure and Debt Summary | ||||||||
Unaudited ($ in thousands) as of 12/31/2020 |
Debt Summary | |||||||
Secured Debt: | Maturity Date | Interest Rate | Commitment | Principal Balance | |||
Lincoln Life Mortgage1 | January-22 | 3.41% | $ 9,600 | $ 9,289 | |||
AIG Loan | November-23 | 4.08% | 120,000 | 117,087 | |||
Ohio National Life Mortgage1 | August-24 | 4.14% | 21,000 | 20,250 | |||
Allianz Loan | April-26 | 4.07% | 63,115 | 63,115 | |||
JPMorgan Chase Loan1 | January-27 | 5.23% | 13,900 | 13,440 | |||
Nationwide Loan | October-27 | 2.97% | 15,000 | 15,000 | |||
Minnesota Life Loan | May-28 | 3.78% | 21,500 | 20,870 | |||
Transamerica Loan | August-28 | 4.35% | 78,000 | 72,960 | |||
Total / Weighted Average Secured Debt | 4.10% | $ 342,115 | $ 332,011 | ||||
Unsecured Debt: | |||||||
KeyBank Revolving Credit Facility2 | October-24 | 1.95%3 | $ 200,000 | $ 90,000 | |||
KeyBank Term Loan2 | October-25 | 1.95%3 | 100,000 | 100,000 | |||
Total / Weighted Average Unsecured Debt | 1.95% | $ 300,000 | $ 190,000 | ||||
As of December 31, | |||||||
2020 | 2019 | ||||||
Total Debt4 | $ 522,011 | $ 401,077 | |||||
Less: Cash | 32,054 | 22,398 | |||||
Net Debt | $ 489,957 | $ 378,679 | |||||
Capitalization | |||||||
As of December 31, | |||||||
2020 | 2019 | ||||||
Common Shares and Units Outstanding5 | 25,951 | 15,017 | |||||
High Closing Price | $ 21.11 | $ 19.65 | |||||
Low Closing Price | $ 7.90 | $ 13.16 | |||||
Closing Price (as of period end) | $ 15.00 | $ 18.39 | |||||
Market Value of Common Shares6 | $ 389,265 | $ 276,163 | |||||
Preferred Stock - Series A7 | 50,600 | 51,000 | |||||
Preferred Stock - Series B7 | 97,230 | 96,574 | |||||
Total Market Capitalization6,8 | $ 1,059,106 | $ 824,814 | |||||
Dividend / Share (annualized) | $ 0.80 | $ 1.50 | |||||
Dividend Yield (annualized) | 5.3% | 8.2% | |||||
Total Debt-to-Total Market Capitalization | 49.3% | 48.6% | |||||
Secured Debt as a % of Total Debt | 65.5% | 100.0% | |||||
Unsecured Debt as a % of Total Debt | 34.5% | 0.0% | |||||
Net Debt-to-Annualized Adjusted EBITDA (quarter annualized) | 6.7x | 6.7x | |||||
Net Debt plus Preferred-to-Annualized Adjusted EBITDA (quarter annualized)7 | 8.7x | 9.3x | |||||
Weighted Average Maturity of Total Debt (Years) | 4.9 | 5.4 | |||||
Capital Markets Activity | ||||
Common Shares | Avg. Price | Offering | Period | Net Proceeds |
593,705 | $ 18.62 | ATM | Q1 2020 | $ 10,814 |
1,060,300 | $ 12.03 | ATM | Q2 2020 | $ 12,536 |
8,625,000 | $ 12.85 | Follow-On | Q3 2020 | $ 104,420 |
558,900 | $ 13.58 | ATM | Q4 2020 | $ 7,385 |
2,658,756 | $ 14.86 | ATM | Q1 2021 | $ 38,800 |
Refer to Glossary in this Supplemental Information for definitions of non-GAAP financial measures, including Net debt and Net debt plus preferred-to-Adjusted EBITDA.
1) | Debt assumed at acquisition. |
2) | On October 8, 2020, the Company entered into a new $300 million unsecured credit facility, comprised of $200 million revolving credit facility and $100 million term loan. The new unsecured revolving credit facility has an accordion feature enabling the Company to increase the total borrowing capacity under the credit facility and term loan up to an aggregate of $500 million, subject to certain conditions. Refer to our 2020 Annual Report on Form 10-K for expanded disclosure. |
3) | The 1-month LIBOR rate as of December 31, 2020 was 0.14%. The spread over the applicable rate for the KeyBank Term Loan and the revolving line of credit with KeyBank is based on the Company’s total leverage ratio. |
4) | Total Debt is not adjusted for the amortization of debt issuance costs or fair market premiums or discounts. Total Debt does not include the Company's pro rata share of unconsolidated joint venture debt. |
5) | Common shares and units outstanding were 25,344 and 607 for the year ended 2020, and 14,141 and 876 for year ended 2019, respectively. |
6) | Based on closing price as of last trading day of the quarter and common shares and units as of the period ended. |
7) | Preferred Stock is calculated at its liquidation preference as of the end of the period. |
8) | Market value of shares and units plus total debt and preferred stock as of period end. |
4Q 2020 Supplemental
Page 13
Plymouth Industrial REIT, Inc. | |||||||||||
Unconsolidated Joint Venture | |||||||||||
In October 2020, the Company announced the formation of a $150 million equity joint venture with Madison International Realty to pursue the acquisition of value-add and opportunistic industrial properties in key markets. The joint venture's first acquisition on December 17, 2020 was a portfolio of infill industrial buildings in metropolitan Memphis for $86 million. The acquisition is projected to provide an initial yield of approximately 7.7%. |
Unaudited ($ in thousands) as of 12/31/2020 |
Unconsolidated Joint Venture Portfolio Statistics | Madison International Realty Joint Venture | ||||||||
Number of Properties | 16 | Partnership | Total Equity | ||||||
Number of Buildings | 28 | Joint Venture Members | Interests | Commitment | |||||
Square Footage | 2,320,773 | Plymouth (Managing Member) | 20% | $ 30,000 | |||||
Occupancy | 95.4% | Madison | 80% | 120,000 | |||||
Weighted Average Lease Term Remaining (in years) | 2.8 | $ 150,000 | |||||||
Multi-Tenant % | 41% | Partner Equity Deployed | $ 33,328 | ||||||
Single-Tenant % | 59% | Annualized Asset Mgmt. Fee to PLYM | $ 333 | ||||||
Targeted | Total | Remaining | |||||||
Leverage | Potential Investment | Potential Investment | |||||||
60% | $ 375,000 | $ 289,000 | |||||||
65% | $ 428,000 | $ 342,000 |
Balance Sheet Information1 | Selected Quarter-to-Date and Year-to-Date Financial Information1 | ||||||||||
December 31, | Three Months Ended | Year Ended | |||||||||
ASSETS | 2020 | December 31, | December 31, | ||||||||
Real estate properties | $ 87,211 | PLYM Share | 2020 | 2020 | |||||||
Cash, cash held in escrow and restricted cash | 1,657 | Revenues | $ 79 | $ 79 | |||||||
Other Assets | 530 | Net Operating Income | $ 60 | $ 60 | |||||||
Total assets | $ 89,398 | Interest Expense | $ 15 | $ 15 | |||||||
EBITDA | $ 60 | $ 60 | |||||||||
LIABILITIES AND EQUITY | Joint Venture Assets | $ 17,866 | $ 17,866 | ||||||||
Debt2 | $ 55,393 | Joint Venture Debt | $ 11,200 | $ 11,200 | |||||||
Other Liabilities | 677 | ||||||||||
Equity | 33,328 | ||||||||||
Total Liabilities and Equity | $ 89,398 | ||||||||||
Joint Venture Key Terms | |||||||||||
● | We are the Managing Member of the joint venture and receive an annual 1% asset management fee on the total equity investment | ||||||||||
● | Distribution of cash flows: first to Members pro rata until Madison achieves a 12% return; second 10% to Managing Member and 90% to Members pro-rata until Madison achieves a 15% return, thereafter 20% to Managing Member and 80% to Members pro rata | ||||||||||
Additional details on the unconsolidated joint venture can be found in documents filed with or furnished to the SEC. | |
1) | Balance sheet and portfolio information is presented at 100% of the joint venture. Selected financial information is presented at our pro rata share. |
2) | A $56 million mortgage secured by the joint venture properties from Minnesota Life that carries a seven-year term at a fixed interest rate of 3.15%. |
4Q 2020 Supplemental
Page 14
Plymouth Industrial REIT, Inc. | ||||||||||
Net Asset Value Components | ||||||||||
Unaudited ($ in thousands) as of 12/31/2020 | ||||||||||
Net Operating Income | Q4 2020 Acquisitions | |||||||||
Three Months Ended December 31, 2020 |
Market | Acquisition Date |
# of Buildings |
Square
Footage |
Purchase Price |
Projected Initial Yield | ||||
Pro Forma Net Operating Income (NOI)1 | Columbus | 10/23/2020 | 1 | 314,736 | $ 10,500 | 9.0% | ||||
Total Operating NOI | $ 19,894 | Cleveland | 11/24/2020 | 10 | 2,113,623 | $ 94,000 | 7.5% | |||
Pro Forma Effect of New Lease Activity2 | 215 | |||||||||
Pro Forma Effect of Acquisitions3 | 1,064 | |||||||||
Pro Forma Effect of Repositioning / Development4 | 486 | |||||||||
Pro Forma Effect Joint Venture (pro rata share)5 | 267 | |||||||||
Pro Forma NOI | $ 21,926 | |||||||||
Amortization of above / below market lease intangibles, net | (640) | |||||||||
Straight-line rental revenue adjustment | (510) | |||||||||
Pro Forma Cash NOI | $ 20,776 | |||||||||
Other Assets and Liabilities | Developable Land | |||||||||
Cash, cash held in escrow and restricted cash | $ 32,054 | |||||||||
Other assets | $ 27,019 | Market | Owned Land (acres)6 |
Developable GLA (SF)6 |
||||||
Accounts payable, accrued expenses and other liabilities | $ 49,335 | Atlanta | 65 | 340,000 | ||||||
Chicago | 11 | 220,000 | ||||||||
Debt and Preferred Stock | Boston | 8 | 70,000 | |||||||
Cincinnati | 30 | 450,000 | ||||||||
Secured Debt, net | $ 332,011 | Jacksonville | 15 | 165,000 | ||||||
Unsecured Debt, net | $ 190,000 | Memphis | 23 | 475,000 | ||||||
Share of Joint Venture Debt7 | $ 11,200 | 152 | 1,720,000 | |||||||
Preferred Stock - Series A8 | $ 50,600 | |||||||||
Preferred Stock - Series B8 | $ 97,230 | |||||||||
Common shares and units outstanding basic and diluted | 25,627 | |||||||||
We have made a number of assumptions with respect to the pro forma effects and there can be no assurance that we would have generated the projected levels of NOI had we actually owned the acquired properties and / or fully stabilized the repositioning / development properties as of the beginning of the period. |
1) | Refer to Glossary in this Supplemental Information for a definition and discussion of non-GAAP financial measures. |
2) | Represents the estimated incremental base rents from uncommented new leases as if rent commencement had occurred as of the beginning of the period. |
3) | Represents the estimated impact of acquisitions as if they had been acquired at the beginning of the period. |
4) | Represents the estimated impact of properties that are undergoing repositioning or lease-up as if the properties were fully stabilized and rents had commenced as of the beginning of the period. |
5) | Represents our pro rata share impact of joint venture acquisitions as if they had been acquired at the beginning of the period. |
6) | Developable land represents acreage currently owned by us and identified for potential development. The developable gross leasable area (GLA) is based on the developable land area and a land to building ratio. Developable land and GLA are estimated and can change periodically due to changes in site design, road and storm water requirements, parking requirements and other factors. We have made a number of assumptions in such estimates and there can be no assurance that we will develop land that we own. |
7) | Our ownership interest is 20%. |
8) | Preferred Stock is calculated at its liquidation preference as of the end of the period. |
4Q 2020 Supplemental
Page 15
Plymouth Industrial REIT, Inc. |
Leasing Activity and Expirations |
Unaudited as of 12/31/2020 |
Lease Renewals and New Leases1 | ||||||||
Year | Type | Square Footage | Percent | Expiring Rent | New Rent | % Change | Tenant Improvements $/SF/YR | Lease Commissions $/SF/YR |
2019 | Renewals | 1,380,839 | 58.4% | $ 4.17 | $ 4.51 | 8.2% | $ 0.19 | $ 0.14 |
New Leases | 982,116 | 41.6% | $ 2.88 | $ 3.43 | 19.1% | $ 0.27 | $ 0.23 | |
Total | 2,362,955 | 100% | $ 3.22 | $ 3.67 | 14.0% | $ 0.16 | $ 0.17 | |
Q1 2020 | Renewals | 105,582 | 26.9% | $ 6.27 | $ 6.42 | 2.4% | $ 0.17 | $ 0.13 |
New Leases | 286,885 | 73.1% | $ 3.63 | $ 4.74 | 30.6% | $ 0.26 | $ 0.21 | |
Total | 392,467 | 100% | $ 4.34 | $ 5.19 | 19.6% | $ 0.24 | $ 0.19 | |
Q2 2020 | Renewals | 1,290,366 | 95.4% | $ 3.34 | $ 3.58 | 7.2% | $ 0.09 | $ 0.08 |
New Leases | 62,494 | 4.6% | $ 4.17 | $ 5.74 | 37.6% | $ 0.34 | $ 0.08 | |
Total | 1,352,860 | 100% | $ 3.33 | $ 3.63 | 9.0% | $ 0.10 | $ 0.08 | |
Q3 2020 | Renewals | 102,608 | 30.0% | $ 4.50 | $ 4.54 | 0.9% | $ - | $ 0.10 |
New Leases | 239,541 | 70.0% | $ 3.67 | $ 4.44 | 21.0% | $ 0.13 | $ 0.02 | |
Total | 342,149 | 100% | $ 3.92 | $ 4.47 | 14.0% | $ 0.09 | $ 0.04 | |
Q4 2020 | Renewals | 382,790 | 68.6% | $ 4.25 | $ 4.27 | 0.6% | $ 0.28 | $ 0.06 |
New Leases | 175,394 | 31.4% | $ 6.34 | $ 6.22 | -1.9% | $ 0.34 | $ 0.31 | |
Total | 558,184 | 100% | $ 4.91 | $ 4.88 | -0.4% | $ 0.30 | $ 0.13 | |
2020 | Renewals | 1,881,346 | 71.1% | $ 3.75 | $ 3.93 | 4.8% | $ 0.13 | $ 0.08 |
New Leases | 764,314 | 28.9% | $ 4.31 | $ 5.07 | 17.6% | $ 0.24 | $ 0.19 | |
Total | 2,645,660 | 100% | $ 3.92 | $ 4.26 | 8.7% | $ 0.16 | $ 0.11 |
Lease Expiration Schedule |
Year | Square Footage2 | ABR3 | % of ABR Expiring4 |
Available | 845,996 | $ - | - |
2021 | 2,756,002 | 12,209,097 | 13.0% |
2022 | 4,074,052 | 18,843,658 | 20.0% |
2023 | 2,794,592 | 10,876,626 | 11.5% |
2024 | 3,683,266 | 14,242,603 | 15.1% |
2025 | 3,271,696 | 13,547,045 | 14.4% |
Thereafter | 5,846,342 | 24,376,209 | 26.0% |
Total | 23,271,946 | $ 94,095,238 | 100% |
1) | Lease renewals and new lease activity excludes leases with terms less than six months. |
2) | Of the square footage expiring in 2021, 355,389 or 13% has been renewed or re-leased subsequent to December 31, 2020. |
3) | Annualized base rent is calculated as monthly contracted base rent as of December 31, 2020, multiplied by 12. Excludes rent abatements. |
4) | Calculated as annualized base rent set forth in this table divided by total annualized base rent as of December 31, 2020. |
4Q 2020 Supplemental
Page 16
Plymouth Industrial REIT, Inc. | |||||||
Leased Square Feet and Annualized Base Rent by Tenant Industry | |||||||
Unaudited as of 12/31/2020 |
Industry | Total Leased Square Feet | # of Tenants | % Rentable Square Feet | ABR1 | % ABR | ABR Per Square Foot | |
Logistics & Transportation | 5,015,765 | 60 | 22.4% | $ 19,846,633 | 21.1% | $ 3.96 | |
Home & Garden | 1,573,524 | 11 | 7.0% | 4,869,487 | 5.2% | 3.09 | |
Food & Beverage | 1,274,552 | 17 | 5.7% | 5,764,303 | 6.1% | 4.52 | |
Construction | 1,257,393 | 31 | 5.6% | 5,104,613 | 5.4% | 4.06 | |
Telecommunications | 1,148,808 | 10 | 5.1% | 4,252,121 | 4.5% | 3.70 | |
Printing | 1,139,199 | 9 | 5.1% | 3,554,633 | 3.8% | 3.12 | |
Cardboard & Packaging | 1,111,994 | 11 | 5.0% | 3,780,476 | 4.0% | 3.40 | |
Automotive | 1,107,228 | 19 | 4.9% | 4,536,350 | 4.8% | 4.10 | |
Light Manufacturing | 823,849 | 9 | 3.7% | 3,737,627 | 4.0% | 4.54 | |
Wholesale / Retail | 819,616 | 20 | 3.7% | 3,196,764 | 3.4% | 3.90 | |
Plastics | 771,234 | 10 | 3.4% | 3,107,951 | 3.3% | 4.03 | |
Industrial Equipment Components | 701,154 | 18 | 3.1% | 2,687,130 | 2.9% | 3.83 | |
Other Industries* | 5,681,634 | 161 | 25.3% | 29,657,148 | 31.5% | 5.22 | |
Total | 22,425,950 | 386 | 100% | $ 94,095,238 | 100% | $ 4.20 | |
*Other Industries | Total Leased Square Feet | # of Tenants | % Rentable Square Feet | ABR1 | % ABR | ABR Per Square Foot | |
Metal Fabrication/Finishing | 562,731 | 12 | 2.5% | $ 2,592,080 | 2.8% | $ 4.61 | |
Healthcare | 488,705 | 19 | 2.2% | 2,776,968 | 3.0% | 5.68 | |
Storage | 485,357 | 11 | 2.2% | 2,960,392 | 3.1% | 6.10 | |
Technology & Electronics | 484,758 | 15 | 2.1% | 2,470,249 | 2.6% | 5.10 | |
Chemical | 433,722 | 8 | 1.9% | 1,589,769 | 1.7% | 3.67 | |
Education | 402,844 | 7 | 1.8% | 1,984,291 | 2.1% | 4.93 | |
Business Services | 396,846 | 22 | 1.8% | 3,229,420 | 3.4% | 8.14 | |
Plumbing Equipment/Services | 361,374 | 5 | 1.6% | 1,196,125 | 1.3% | 3.31 | |
Appliances | 335,415 | 2 | 1.5% | 1,413,853 | 1.5% | 4.22 | |
Other2 | 1,729,882 | 60 | 7.7% | 9,444,000 | 10.0% | 5.46 | |
Total | 5,681,634 | 161 | 25.3% | $ 29,657,148 | 31.5% | $ 5.22 | |
1) | Annualized base rent is calculated as monthly contracted base rent as of December 31, 2020, multiplied by 12. Excludes rent abatements. |
2) | Includes tenant industries for which the total leased square feet aggregates to less than 300,000 square feet. |
4Q 2020 Supplemental
Page 17
Plymouth Industrial REIT, Inc. | ||||||||
Leased Square Feet and Annualized Base Rent by Type | ||||||||
Unaudited as of 12/31/2020 |
Leased Square Feet and Annualized Base Rent by Lease Type | ||||||||
Lease Type | Total Leased Square Feet |
# of Leases | % Leased Square Feet |
ABR1 | % ABR | ABR Per Square Foot | ||
Triple Net | 15,547,132 | 276 | 69.3% | $ 64,113,803 | 68.1% | $ 4.12 | ||
Modified Net | 3,444,894 | 49 | 15.4% | 14,549,367 | 15.5% | 4.22 | ||
Gross | 3,433,924 | 61 | 15.3% | 15,432,068 | 16.4% | 4.49 | ||
Total | 22,425,950 | 386 | 100% | $ 94,095,238 | 100% | $ 4.20 | ||
Leased Square Feet and Annualized Base Rent by Tenant Type | ||||||||
Tenant Type | Total Leased Square Feet |
# of Leases | % Leased Square Feet |
ABR1 | % ABR | ABR Per Square Foot | ||
Multi-Tenant | 14,022,327 | 327 | 62.5% | $ 62,104,771 | 66.0% | $ 4.43 | ||
Single-Tenant | 8,403,623 | 59 | 37.5% | 31,990,467 | 34.0% | 3.81 | ||
Total | 22,425,950 | 386 | 100% | $ 94,095,238 | 100% | $ 4.20 | ||
Leased Square Feet and Annualized Base Rent by Building Type | ||||||||
Building Type | Total Leased Square Feet |
# of Buildings | % Leased Square Feet |
ABR1 | % ABR | ABR Per Square Foot | ||
Warehouse/Distribution | 14,086,438 | 70 | 62.8% | $ 51,339,506 | 54.5% | $ 3.64 | ||
Warehouse/Light Manufacturing | 5,693,091 | 27 | 25.4% | 23,223,683 | 24.7% | 4.08 | ||
Small Bay Industrial2 | 2,646,421 | 44 | 11.8% | 19,532,049 | 20.8% | 7.38 | ||
Total | 22,425,950 | 141 | 100% | $ 94,095,238 | 100% | $ 4.20 |
1) | Annualized base rent is calculated as monthly contracted base rent as of December 31, 2020, multiplied by 12. Excludes rent abatements. |
2) | Small bay industrial is inclusive of flex space totaling 382,150 leased square feet and annualized base rent of $5,046,660. Small bay industrial is multipurpose space; flex space includes office space that accounts for greater than 50% of the total rentable area. |
4Q 2020 Supplemental
Page 18
Plymouth Industrial REIT, Inc. | ||||||||||
Top 10 Tenants by Annualized Base Rent | ||||||||||
Unaudited as of 12/31/2020 | ||||||||||
Tenant | Market | Industry | # of Leases | Total Leased Square Feet | Expiration | ABR Per Square Foot | ABR1 | % Total ABR | ||
Stonecrop Technologies, LLC | Columbus | Telecommunications | 1 | 527,127 | 3/31/2021 | $ 4.14 | $ 2,180,993 | 2.3% | ||
Archway Marketing Holdings, Inc. | Chicago | Logistics & Transportation | 3 | 503,000 | 3/31/2026 | 3.80 | 1,911,000 | 2.0% | ||
Balta US, Inc. | Jacksonville | Home & Garden | 2 | 629,084 | 12/31/2028 | 2.97 | 1,867,871 | 2.0% | ||
iQor | Memphis | Telecommunications | 2 | 566,281 | 12/31/2024 | 3.15 | 1,783,785 | 1.9% | ||
Pactiv Corporation | Chicago | Food & Beverage | 3 | 439,631 | 8/31/2023 | 3.86 | 1,696,552 | 1.8% | ||
ASC Manufacturing, Ltd. | Cleveland | Light Manufacturing | 1 | 274,464 | 6/30/2022 | 6.08 | 1,667,508 | 1.8% | ||
First Logistics | Chicago | Logistics & Transportation | 1 | 327,194 | 10/31/2024 | 4.95 | 1,619,610 | 1.7% | ||
JobsOhio Beverage System | Cleveland | Food & Beverage | 1 | 350,000 | 3/31/2024 | 4.26 | 1,491,000 | 1.6% | ||
American Plastics, LLC | Cleveland | Plastics | 1 | 405,000 | 12/31/2028 | 3.60 | 1,456,218 | 1.5% | ||
Spartan Logistics | Columbus | Logistics & Transportation | 2 | 340,000 | 10/31/2022 | 4.03 | 1,369,617 | 1.5% | ||
Total Largest Tenants by Annualized Rent | 17 | 4,361,781 | $ 3.91 | $ 17,044,154 | 18.1% | |||||
All Other | 369 | 18,064,169 | $ 4.27 | $ 77,051,084 | 81.9% | |||||
Total Company Portfolio | 386 | 22,425,950 | $ 4.20 | $ 94,095,238 | 100.0% | |||||
Lease Segmentation by Size | ||||||||||
Square Feet | # of Leases | Total Leased Square Feet | Total Rentable Square Feet | Total Leased % | Total Leased % Excluding Repositioning2 | ABR1 | In-Place + Uncommenced ABR3 | % of Total In-Place + Uncommenced ABR | In-Place + Uncommenced ABR Per SF4 | |
< 4,999 | 61 | 144,490 | 199,362 | 72.5% | 72.5% | $ 1,608,050 | $ 1,608,050 | 1.7% | $ 11.13 | |
5,000 - 9,999 | 52 | 363,128 | 460,744 | 78.8% | 78.8% | 2,622,957 | 2,693,531 | 2.9% | 7.13 | |
10,000 - 24,999 | 85 | 1,356,647 | 1,500,711 | 90.4% | 90.4% | 9,551,206 | 9,743,690 | 10.3% | 7.01 | |
25,000 - 49,999 | 75 | 2,625,893 | 2,677,936 | 98.1% | 98.1% | 14,681,324 | 14,681,324 | 15.6% | 5.59 | |
50,000 - 99,999 | 51 | 3,415,157 | 3,802,623 | 89.8% | 95.5% | 15,266,448 | 15,266,448 | 16.2% | 4.47 | |
> 100,000 | 62 | 14,520,635 | 14,630,570 | 99.2% | 100.0% | 50,365,254 | 50,365,254 | 53.4% | 3.47 | |
Total | 386 | 22,425,950 | 23,271,946 | 96.4% | 97.9% | $ 94,095,238 | $ 94,358,296 | 100.0% | $ 4.20 | |
1) | Annualized base rent is calculated as monthly contracted base rent as of December 31, 2020, multiplied by 12. Excludes rent abatements. |
2) | Total Leased % Excluding Repositioning excludes vacant square footage being refurbished or repositioned. |
3) | In-Place + Uncommenced ABR calculated as in-place current annualized base rent as of December 31, 2020 plus annualized base rent for leases signed but not commenced as of December 31, 2020. |
4) | In-Place + Uncommenced ABR per SF is calculated as in-place current rent annualized base rent as of December 31, 2020 plus annualized base rent for leases signed but not commenced as of December 31, 2020, divided by leased square feet plus uncommenced leased square feet. |
4Q 2020 Supplemental
Page 19
Plymouth Industrial REIT, Inc. | |||||||||
Rentable Square Feet and Annualized Base Rent by Market | |||||||||
Unaudited ($ in thousands) as of 12/31/2020 | |||||||||
Primary Markets1 | |||||||||
% Rentable | |||||||||
# of Properties | # of Buildings | Occupancy | Total Rentable Square Feet |
Square Feet | ABR2 | % ABR | |||
Atlanta | 8 | 9 | 99.9% | 1,318,002 | 5.7% | $ 5,335 | 5.7% | ||
Chicago | 37 | 38 | 94.9% | 6,027,300 | 25.9% | 23,659 | 25.1% | ||
Secondary Markets1 | |||||||||
Total Rentable | % Rentable | ||||||||
# of Properties | # of Buildings | Occupancy | Square Feet | Square Feet | ABR2 | % ABR | |||
Boston | 1 | 1 | 100.0% | 200,625 | 0.9% | $ 1,128 | 1.2% | ||
Cincinnati | 8 | 8 | 92.7% | 2,073,510 | 8.9% | 7,038 | 7.5% | ||
Cleveland | 13 | 16 | 98.5% | 3,581,240 | 15.4% | 14,836 | 15.8% | ||
Columbus | 9 | 9 | 97.6% | 1,951,723 | 8.4% | 7,245 | 7.7% | ||
Indianapolis | 14 | 14 | 95.7% | 3,468,401 | 14.9% | 11,922 | 12.7% | ||
Jacksonville | 7 | 24 | 98.4% | 1,966,154 | 8.4% | 12,453 | 13.2% | ||
Memphis | 5 | 15 | 94.6% | 1,773,894 | 7.6% | 6,360 | 6.8% | ||
Philadelphia | 1 | 1 | 99.8% | 156,634 | 0.7% | 929 | 1.0% | ||
St. Louis | 4 | 6 | 99.5% | 754,463 | 3.2% | 3,190 | 3.4% | ||
Total | 107 | 141 | 96.4% | 23,271,946 | 100.0% | $ 94,095 | 100.0% | ||
Total Acquisition Cost by Market | |||||||||
Market | State | # of Buildings | Total Acquisition Cost3 | Gross Real Estate Assets4 | % Gross Real Estate Assets | ||||
Atlanta | GA | 9 | $ 62,931 | $ 55,006 | 6.2% | ||||
Chicago | IL, WI | 38 | 226,933 | 214,539 | 24.3% | ||||
Boston | MA | 1 | 10,500 | 9,238 | 1.0% | ||||
Cincinnati | OH, KY | 8 | 79,700 | 63,352 | 7.2% | ||||
Cleveland | OH | 16 | 168,550 | 157,103 | 17.8% | ||||
Columbus | OH | 9 | 61,400 | 73,914 | 8.4% | ||||
Indianapolis | IN | 14 | 104,740 | 93,345 | 10.6% | ||||
Jacksonville | FL, GA | 24 | 135,650 | 122,769 | 13.8% | ||||
Memphis | MO | 15 | 53,475 | 48,750 | 5.5% | ||||
Philadelphia | PA, NJ | 1 | 9,700 | 8,657 | 1.0% | ||||
St. Louis | MO | 6 | 39,637 | 36,701 | 4.2% | ||||
Total | 141 | $ 953,216 | $ 883,374 | 100.0% | |||||
1) | Primary markets means the following two metropolitan areas in the U.S., each generally consisting of more than 300 million square feet of industrial space: Chicago and Atlanta. Secondary markets means non-primary markets, each generally consisting of between 100 million and 300 million square feet of industrial space, including the following metropolitan areas in the U.S.: Boston, Cincinnati, Cleveland, Columbus, Indianapolis, Jacksonville, Kansas City, Memphis, Milwaukee, Philadelphia, South Florida, and St. Louis. Our definitions of primary and secondary markets may vary from the definitions of these terms used by investors, analysts or other industrial REITs. | ||||||||
2) | Annualized base rent is calculated as monthly contracted base rent as of December 31, 2020, multiplied by 12. Excludes rent abatements. | ||||||||
3) | Represents total direct consideration paid prior to the allocations per U.S. GAAP. | ||||||||
4) | The gross book value of real estate assets as of December 31, 2020 excluding $2,382 in leasehold improvements and assets related to Corporate activities and the finance lease right-of-use asset of $925 related to the ground sublease at 2100 International Parkway. Gross book value of real estate assets excludes depreciation and the allocation of the acquisition cost related to intangible assets and liabilities required by U.S. GAAP. | ||||||||
4Q 2020 Supplemental
Page 20
Plymouth Industrial REIT, Inc. | ||||
Glossary | ||||
This glossary contains additional details for sections throughout this Supplemental Information, as well as explanations and reconciliations of certain non-GAAP financial measures and the reasons why we use these supplemental measures of performance and believe they provide useful information to investors. Additional detail can be found in our most recent annual report on Form 10-K and subsequent quarterly reports on Form 10-Q, as well as other documents filed with or furnished to the SEC from time to time. | ||||
Non-GAAP Financial Measures Definitions:
Net Operating Income (NOI): We consider net operating income, or NOI, to be an appropriate supplemental measure to net income in that it helps both investors and management understand the core operations of our properties. We define NOI as total revenue (including rental revenue and tenant reimbursements) less property-level operating expenses. NOI excludes depreciation and amortization, general and administrative expenses, impairments, gain/loss on sale of real estate, interest expense, and other non-operating items.
Cash Net Operating Income - (Cash NOI): We define Cash NOI as NOI excluding straight-line rent adjustments and amortization of above and below market leases.
EBITDAre and Adjusted EBITDA: We define earnings before interest, taxes, depreciation and amortization for real estate in accordance with the standards established by the National Association of Real Estate Investment Trusts (“NAREIT”). EBITDAre represents net income (loss), computed in accordance with GAAP, before interest expense, tax, depreciation and amortization, gains or losses on the sale of rental property, and loss on impairments. We calculate Adjusted EBITDA by adding or subtracting from EBITDAre the following items: (i) non-cash stock compensation, (ii) gain (loss) on extinguishment of debt, (iii) acquisition expenses (iv) the proforma impacts of acquisition and dispositions and (v) non-cash impairments on real estate lease. We believe that EBITDAre and Adjusted EBITDA is helpful to investors as a supplemental measure of our operating performance as a real estate company as it is a direct measure of the actual operating results of our industrial properties. EBITDAre and Adjusted EBITDA should not be used as a measure of our liquidity and may not be comparable to how other REITs' calculate EBITDAre and Adjusted EBITDA.
Funds From Operations ("FFO"): Funds from operations, or FFO,
is a non-GAAP financial measure that is widely recognized as a measure of REIT operating performance. We consider FFO to be an
appropriate supplemental measure of our operating performance as it is based on a net income analysis of property portfolio performance
that excludes non-cash items such as depreciation. The historical accounting convention used for real estate assets requires straight-line
depreciation of buildings and improvements, which implies that the value of real estate assets diminishes predictably over time.
Since real estate values rise and fall with market conditions, presentations of operating results for a REIT, using historical
accounting for depreciation, could be less informative. In December 2018, NAREIT issued a white paper restating the definition
of FFO. The purpose of the restatement was not to change the fundamental definition of FFO, but to clarify existing NAREIT guidance.
The restated definition of FFO is as follows: Net Income (calculated in accordance with GAAP), excluding: (i) Depreciation and
amortization related to real estate, (ii) Gains and losses from the sale of certain real estate assets, (iii) Gain and losses from
change in control, and (iv) Impairment write-downs of certain real estate assets and investments in entities when the impairment
is directly attributable to decreases in the value of depreciable real estate held by the entity.
We define FFO, consistent with the NAREIT definition. Adjustments for
unconsolidated partnerships and joint ventures will be calculated to reflect FFO on the same basis. Other equity REITs may not
calculate FFO as we do, and, accordingly, our FFO may not be comparable to such other REITs’ FFO. FFO should not be used
as a measure of our liquidity, and is not indicative of funds available for our cash needs, including our ability to pay dividends.
Core Funds from Operations (“Core FFO”): Core FFO represents FFO reduced by dividends paid (or declared) to holders of our preferred stock and excludes certain non-cash operating expenses such as impairment on real estate lease, unrealized appreciation/(depreciation) of warrants and loss on extinguishment of debt. As with FFO, our reported Core FFO may not be comparable to other REITs’ Core FFO, should not be used as a measure of our liquidity, and is not indicative of our funds available for our cash needs, including our ability to pay dividends.
Adjusted Funds from Operations attributable to common stockholders (“AFFO”): Adjusted
funds from operations, or AFFO, is presented in addition to Core FFO. AFFO is defined as Core FFO, excluding certain non-cash operating
revenues and expenses, acquisition and transaction related costs for transactions not completed and recurring capitalized expenditures.
Recurring capitalized expenditures include expenditures required to maintain and re-tenant our properties, tenant improvements
and leasing commissions. AFFO further adjusts Core FFO for certain other non-cash items, including the amortization or accretion
of above or below market rents included in revenues, straight line rent adjustments, non-cash equity compensation and non-cash
interest expense.
We believe AFFO provides a useful supplemental measure of our operating
performance because it provides a consistent comparison of our operating performance across time periods that is comparable for
each type of real estate investment and is consistent with management’s analysis of the operating performance of our properties.
As a result, we believe that the use of AFFO, together with the required GAAP presentations, provide a more complete understanding
of our operating performance. As a result, we believe that the use of AFFO, together with the required GAAP presentations, provide
a more complete understanding of our operating performance.
As with Core FFO, our reported AFFO may not be comparable to other
REITs’ AFFO, should not be used as a measure of our liquidity, and is not indicative of our funds available for our cash
needs, including our ability to pay dividends.
Net Debt and Preferred stock to Adjusted EBITDA: Net debt and preferred stock to Adjusted EBITDA is a non-GAAP financial measure that we believe is useful to investors as a supplemental measure in evaluating balance sheet leverage. Net debt and preferred stock is equal to the sum of total consolidated and our pro rata unconsolidated joint venture debt less cash, cash equivalents, and restricted cash, plus preferred stock calculated at its liquidation preference as of the end of the period.
4Q 2020 Supplemental
Page 21
Plymouth Industrial REIT, Inc. | ||||||||||||||
Glossary | ||||||||||||||
This glossary contains additional details for sections throughout this Supplemental Information, as well as explanations and reconciliations of certain non-GAAP financial measures and the reasons why we use these supplemental measures of performance and believe they provide useful information to investors. Additional detail can be found in our most recent annual report on Form 10-K and subsequent quarterly reports on Form 10-Q, as well as other documents filed with or furnished to the SEC from time to time. | ||||||||||||||
Other Definitions: | ||||||||||||||
GAAP: U.S. generally accepted accounting principles. | ||||||||||||||
Gross Assets: The carrying amount of total assets plus accumulated depreciation and amortization, as reported in the Company’s consolidated financial statements. For gross assets as of December 31, 2020 the calculation is as follows: | ||||||||||||||
Total assets | $ 20,270 | |||||||||||||
Add back accumulated depreciation | 98,283 | |||||||||||||
Add back intangible amortization | 51,896 | |||||||||||||
Gross assets | $ 1,070,449 | |||||||||||||
Joint Venture Financial Information: We present components of balance sheet and operating results information related to our real estate joint venture, which are not presented, or intended to be presented, in accordance with GAAP. We present the proportionate share of certain financial line items by applying our noncontrolling economic interest ownership percentage to each financial item to arrive at the amount of such cumulative noncontrolling interest share of each component presented. In addition, we present components of balance sheet and portfolio information at 100% of the joint venture. We believe this information can help investors estimate the balance sheet and operating results information related to our unconsolidated joint venture. Presenting this information provides a perspective not immediately available from consolidated financial statements and one that can supplement an understanding of the joint venture assets, liabilities, revenues, and expenses included in our consolidated results. Joint venture financial information should not be considered an alternative to our consolidated financial statements, which are prepared in accordance with GAAP. | ||||||||||||||
Lease Type: We define our triple net leases in that the tenant is responsible for all aspects of and costs related to the property and its operation during the lease term. We define our modified net leases in that the landlord is responsible for some property related expenses during the lease term, but the cost of most of the expenses is passed through to the tenant. We define our gross leases in that the landlord is responsible for all aspects of and costs related to the property and its operation during the lease term. | ||||||||||||||
Non-Recurring Capital Expenditures: Non-recurring capital expenditures include capital expenditures of long lived improvements required to upgrade/replace existing systems or items that previously did not exist. Non-recurring capital expenditures also include costs associated with repositioning a property, redevelopment/development and capital improvements known at the time of acquisition. | ||||||||||||||
Occupancy: We define occupancy as the percentage of total leasable square footage as the earlier of lease term commencement or revenue recognition in accordance to GAAP as of the close of the reporting period. | ||||||||||||||
Preferred Stock - Series B: On December 14, 2018, we completed the offering of 4,411,764 shares of the Company’s Series B Convertible Redeemable Preferred Stock at a purchase price of $17.00 per share for an aggregate consideration of $75,000 or $71,800, net of issuance costs. The relevant features of the Series B Preferred Stock ("Series B") are as follows ($ in thousands): | ||||||||||||||
Annual | Liquidation | |||||||||||||
Year | Cash Pay Rate | Cash Dividend | Preference1 | Conversion and Redemption Options2 | ||||||||||
1 - 2019 | 3.25% | $ 2,438 | $ 97,230 | No conversion or redemption options | ||||||||||
2 - 2020 | 3.50% | $ 2,625 | $ 97,230 | No conversion or redemption options | ||||||||||
3 - 2021 | 3.75% | $ 2,813 | $ 97,230 | No conversion or redemption options | ||||||||||
4 - 2022 | 4.00% | $ 3,000 | $ 97,230 | - Commencing 1/1/2022, holders of the Series B have the right to convert at the liquidation preference; - Commencing 1/1/2022, Plymouth can elect to convert up to 100% of Series B upon the 20-day VWAP per share of Plymouth's common stock being greater than $26.35; - Neither option expires |
||||||||||
5 - 2023 | 6.50% | $ 4,875 | $ 105,971 | Commencing 1/1/2023, Plymouth can redeem up to 50% of the Series B at the liquidation preference | ||||||||||
6 - 20243 | 12.00% | $ 9,000 | $ 114,028 | - Commencing 1/1/2024, Plymouth can redeem up to 100% of the Series B at the liquidation preference; - Commencing 12/31/2024, any outstanding shares of Series B will automatically covert into common stock, subject to the 19.99% threshold4 |
||||||||||
1) | Liquidation Preference is defined as the greater of (a) the amount necessary for the holder to achieve a 12% internal rate of return, taking into account dividends paid and (b) $21.89, plus accrued and unpaid dividends. | |||||||||||||
2) | Conversion and Redemption Options grant Plymouth the right to settle the conversion/redemption via: I) Physical Settlement with each share of Series B being converted to a number of common shares equal to the greater of (i) one share of common stock or (ii) the quotient of the liquidation preference divided by the 20-Day VWAP, subject to the 19.99% threshold, or II) Cash Settlement whereby we pay for each share of Series B being converted in cash in an amount equal to the greater of (i) the liquidation preference or (ii) the 20-Day VWAP, or III) Combination Settlement whereby Plymouth shall pay, or deliver, in respect to each share of Series B being converted, a settlement amount equal to either (i) cash equal to the Cash Settlement amount or (ii) number of shares of common stock equal to the Physical Settlement. | |||||||||||||
3) | Effective 1/1/2025, in the event the Series B Preferred Stock has not been settled, the holders obtain certain governance rights, including the option to elect an additional two members to Plymouth's Board of Directors. | |||||||||||||
4) | The 19.99% Threshold requires approval from the shareholders of Plymouth's common stock to approve the conversion of any Series B Preferred Stock into common shares that exceeds 19.99% of the outstanding common shares as of December 14, 2018. | |||||||||||||
Recurring Capital Expenditures: Recurring capitalized expenditures includes capital expenditures required to maintain and re-tenant our buildings, tenant improvements and leasing commissions. | ||||||||||||||
Replacement Cost: is based on the Marshall & Swift valuation methodology for the determination of building costs. The Marshall & Swift building cost data and analysis is widely recognized within the U.S. legal system and has been written into in law in over 30 U.S. states and recognized in the U.S. Treasury Department Internal Revenue Service Publication. Replacement cost includes land reflected at the allocated cost in accordance with Financial Accounting Standards Board ("FASB") ASC 805. | ||||||||||||||
Same Store Portfolio: The Same Store Portfolio is a subset of the consolidated portfolio and includes properties that are wholly owned by us for the period from January 1, 2019 through December 31, 2020. The Same Store Portfolio is evaluated and defined on an annual basis based on the growth and size of the consolidated portfolio. The Same Store Portfolio excludes properties that were or will be classified as repositioning or lease-up during 2019 and 2020. For 2020, the Same Store Portfolio consists of 53 properties aggregating 11,740,879 rentable square feet. Properties that are being repositioned generally are defined as those properties where a significant amount of space is held vacant in order to implement capital improvements that enhance the functionality, rental cash flows, and value of that property. We define a significant amount of space at a property using both the size of the space and its proportion to the properties total square footage as a determinate. Our computation of same store NOI may not be comparable to other REITs. | ||||||||||||||
VWAP: The volume weighted average price of a trading security. | ||||||||||||||
Weighted Average Lease Term Remaining: The average contractual lease term remaining as of the close of the reporting period (in years) weighted by square footage. | ||||||||||||||
4Q 2020 Supplemental
Page 22
\^$I(^>99\ I>U]=GZ6='_HEE7YMMOP,#J(GG8@
M #:KVP_IIM_YUP?\ =Y@)^4?#9_>_7B:T/G'/R9I+[_F/V%F2
M[>T9]T/;_P!9E#\./#/5MR-6U/>S>X(Y> BO\&_\3YW6?DV89\$<2Q0O2]R
MB2H!4LGR3I\&KAR;&SFQ*ZOA,KD3)TZ0S$AQ([9>)Q^3*D+;889;3Y5*4HDD
M7LF&[:RY1HUKBK&A;PE.M-X1C%.4FWN22Q;;Z$=3C[-UO+4VB+L'")*W5>%I
M$?*Z%Y3JNG7PMI;GJ-:NA>P744XH]*,E/(,]IINI97<4M^-&HL/#C$YY&1X\
MZQZ4W>TSD;PK7Z2BTA+8\#?4EK\\E\V_"CH?4^O0N@8HANQO8SZN5&JJG1P2
MQ]# X:1L77T19-RLZPV,XI!.);D9/2,K-"C,B627)R5&@S(^A^QY Q72B5#)
M,ZJ+BIV=U*./ \
M^$I(^>99\ I>U]=GZ6='_HEE7YMMOP,#J(GG8@ -N/8GNW:/NJ<55M/.LG:6
M>QZ-PVD$LW&;34N \^$I(^>99\
MI>U]=GZ6='_HEE7YMMOP,#J(GG8@ -J79'_6H?DV?MZ7X6!J>[*/[P>F_
MQBX^)W)6B"";ZP )*OJO6R;3'>;NVM:-NO'1;+X^VUK.C)=63!WFO\QQB323
M762+P..QZW);)I"C\J"?41?MA6T?5YE3GB_+A*&'<^OQ\*X,/&>#/G )I8I[FL&MAD .9TP #6IW8>7F3\-^'
M^2YUK&ZJ:K>N<9=@NJ]&1[:OA7+-AG679+ 3.651/;D19I5&%P[6:7G6G&?.
ML-I61^,B.Q_@?L!P ( /K-TQN3W%\;81X?%7<
M9]:0WNBO$9..9CL^>1*+H7@5YF_5/_YM6?P^+_M0
M'O2Z^YU/XK]@>_5/_P";5G\/B_[4![TNON=3^*_8'OU3_P#FU9_#XO\ M0'O
M2Z^YU/XK]@>_5/\ ^;5G\/B_[4![TNON=3^*_8.N9#LO7&(QG9N5[ PG&(;"
M/./2\ARNBI8S+9)\?G'7[*?&:;1X/+U,R+IY11RBM[1.LLASS,JBI9=97=Q5
M;V*G1J3;\"C%L_?!M@X'L_&XF9:US;$MA8A8/SHT#*L'R.GRO')TBLFOUMDQ
M#NZ*9/K)+L"PBN,/)0ZHVW6U(5T41D":DL8M-'#-\ESC3]]+*\^M+FRS."BY
M4:]*=&K%3BI1SR[*+*AP;T2K@RK")51C-,#&+.*:FU-MQ3>JKM
MM\;*'F1SBX^
4Y=GD:NGR8-G<8]A.-65^6/,V<=QN;7L9!:QHL*0^PXW(9B
MONK96ATD**S;TU5K*$O-/MO:,YC9GRGY0YGJW3RIK/(NE1MW**E&%2O5C3ZQ
MQ:X9.G!SG&,DXRG&*DG%M%BUH+A/Q,XM3I5MQ\X_ZSU5>SZ56.6&28OCL=G*
M;*A7+ASW*BSRB6G6U_>2HL6#&F
MY%DUU,DV-B^VPPV]-E.K2VVE1(3QA"-."A'S49O6VLL]Y@ZKOM9:DJ*IG.85
MW4J.*:A'8HPITTW)QI4J<8TZ<7*3C"$4Y-K%^SCF=6 CB^L_?J_->?*CP'X
MNMM"#?\ N*]MZS/5@5Z]=U,C[\\NV7R\[<.74
M>-
KQ
M_K3])_6=NCXJLJ$2R^$+Q^H>L^VQ^[SFWXU8_&Z)8RC-FCT "'MZU[_
M *C@[_WO(7]QIH8W,?J/'ZQLW^;G\_5O@RW_ -Z9U^K)_JY\A^4OLS[#]8B[
M8>X/VS]1'R'M\?KPH?F&U_#71(>$T\3 !'%]9^_5^:\^5'@/Q=;:$
M&_\ <5[;UF>Y.P!^N>]_P_&;,C)=A_]:SQ2_\ 4-I_$CLD0+3X1'Q^HSWQ
MVP/W==1^TM/C]J64XSIHC -)GK"_P"JMWI]=>E?C=PX1;WX._"O
M5/5W8I_>'RC\6OOB=HQ5O[O#VR-L':'FZ?(W5[,_;,3LO7VJ3Z9>L>&/G"LSJ5^9>2Y1B^
MIM\DZQ+N<5>YK1EAX8T88^ D^">> 0 _&1'CRX[\24PU)BRF78\F,
M^VAYB1'>0IMYAYIPE-NM.MJ-*DJ(R41]# Y0G.E-5*;<:D6FFG@TUM33[C3W
M,J7.4.KRTCR3W_IUME;$?5^YMF8%";7UZG78KF5Q35KI&9J,T/P(;:TF9]32
MHAURI'@G*/0VC](/+_4'_=FA,FU.VG/,,KM;B7MJU"$Y+Q2DT_ 30_5=-CS<
MBX:;GUO-?\\C6V_)EA4I-1FJ)3YWAN.32B)2:C)+7OW1SWBZ$753ZAE,OEC2
M<>AFK+YP7(Z5ES1RK/:2P=]DT8S[\[>O5CCX>KJ4X^"*),PGG@D (K?K5'
MY.G%K\->4_8*\,?F'F1\)L/^;O\ TWU#^:J/QA&C[U>/]:?I/ZSMT?%5E0B6
M7PA>/U#UGVV/W>:RP;,\ELLLS*\1
M.754D23KC,ZN&[+36Q)TSPRK2>Q'2:6E$2W2-7A22E$.,TW!I;RQ<_3J]I+\
M^#5/\!SK[414B]7/H8_3J]I+\^#5/\!SK[40'5SZ&=8RKU@#M#8E6/V4OF;A
M]OYIE;K<#%<(VOE%G*6@E&EAB+28%,\#SIIZ)\ZIM!&9=5$7E *G-]PB2]]C
MOW8EW"<"J>+'%[%\MQW0,#+:W,<_SW.(T:FR;:=MCR'CQNBK,7B2[#W@P>HL
MI!V"US'CGV$UF*HV8:(RTRJ%^G3X7B]Y%Q NDO?U0WC_ &V1\H.27)>7 D%C
M&K=.P-4UD]Q*VXLC,=J915WSC<1PR)$N14XUKN04E"3,V$V+!KZ>=;ZD6:[V
M)$_\5(P $6OUM;8$C&^W9JW"(JUH5LCE%AD6P)*S2EVHQ7 MCY$ZRXDO(XCW
MY9@K(C]A2"/_ "49>H^=XBN= DFP7M;\M=;<%^<&G.5&U,&R?8N,:I1G4MK%
M<1D5,:YE7F2Z^RC#*::TY=R(M?YNIEY$4HR4XE1*:(T]3(B,<9Q
JS<*TIM*6#A1C/%K%8>755-+NJ2CQ-Q>QQPQ/D6H>9':+UW;SRCEEI&K
MD,:L&G?YQ6HTYTE)I)PM*;JS4TL7C+K8K';2V;>4YX][G8O(O5\;BUQ;UU!X
MC\2:BF9Q-O"L4DQ68"?E'PV?WOUXFM#YQS\F:
M2^_YC]A9DNWM&?=#V_\ 690_#CPSU; 3N;A4H>:GA[+^CH-O\ R"T_E?9H[.M]S3U93X<_S"VC
M>U(/R9N#7!EMDGABI5'4C*6*QIU+B:FL*6*F^ZEU=A>D=88!I_754BDP76F(
MT.%8K6)-"W(]-CU
7V2$_+_ #)/OGA#YQ*XIRU?
MINU3^VPRVXFUWIUHJ/HNG+T"5J,@:Z@ BM^M4?DZ<6OPUY3]@KPQ^8>9'P
MFP_YN_\ 3?4/YJH_&$:/O5X_UI^D_K.W1\565")9?"%X_4/6?;8_=YS;\:L?
MC=$L91FS1Z !#V]:]_U'!W_ +WD+^XTT,;F/U'C]8V;_-S^?JWP9;_[
MTSK]63(R[<^0&9&1'R6V8:3,C(E%_-#61=4F9=%%U(RZEY.I&7M"[8>X/VS]
M8^0]OAK_ #PH?F&U_#71(>$T\3 !'%]9^_5^:\^5'@/Q=;:$&_P#<
M5[;UF>Y.P!^N>]_P_&;,C)=A_]:SQ2_P#4-I_$CLD0+3X1'Q^HSWQVP/W=
M=1^TM/C]J64XSIHC -)GK"_ZJW>GUUZ5^-W#A%O?@[\*]4]7=BG
M]X?*/Q:^^)UR#/VY< PS:G.WBAKG8F.UV78-F6[L'H
\->"G)[GKM*!JGC5K2VS*S7)B)R7*Y#,FNU[KVJDO);