UNITED STATES
SECURITIES AND EXCHANGE COMMISSION
WASHINGTON, D.C. 20549
FORM
CURRENT REPORT
PURSUANT TO SECTION 13 OR 15(d) OF
THE SECURITIES EXCHANGE ACT OF 1934
Date of Report (Date of earliest event reported)
(Exact Name of Registrant as Specified in Its Charter)
(State or Other Jurisdiction of Incorporation) |
(Commission File Number) |
(IRS Employer Identification No.) |
(Address of Principal Executive Offices) (Zip Code)
(Registrant’s Telephone Number, Including Area Code)
Check the appropriate box below if the Form 8-K filing is intended to simultaneously satisfy the filing obligation of the registrant under any of the following provisions (see General Instruction A.2. below):
Written communications pursuant to Rule 425 under the Securities Act (17 CFR 230.425) |
Soliciting material pursuant to Rule 14a-12 under the Exchange Act (17 CFR 240.14a-12) |
Pre-commencement communications pursuant to Rule 14d-2(b) under the Exchange Act (17 CFR 240.14d-2(b)) |
Pre-commencement communications pursuant to Rule 13e-4(c) under the Exchange Act (17 CFR 240.13e-4(c)) |
Indicate by check mark whether the registrant is an emerging growth company as defined in as defined in Rule 405 of the Securities Act of 1933 (§230.405 of this chapter) or Rule 12b-2 of the Securities Exchange Act of 1934 (§240.12b-2 of this chapter).
Emerging growth company
If an emerging growth company, indicate by check mark if the registrant has elected not to use the extended transition period for complying with any new or revised financial accounting standards provided pursuant to Section 13(a) of the Exchange Act. ☐
Securities registered pursuant to Section 12(b) of the Act: | ||
Title of Each Class | Trading Symbol | Name of Each Exchange on Which Registered |
Item 2.02 |
Results of Operations and Financial Condition |
On August 6, 2020, Plymouth Industrial REIT, Inc. (the “Company”) issued a press release (the “Earnings Release”) announcing, among other things, earnings for the six months ended June 30, 2020. The text of the Earnings Release is included as Exhibit 99.1 to this Current Report.
The Earnings Release is furnished pursuant to Item 2.02 and shall not be deemed "filed" for purposes of Section 18 of the Securities Exchange Act of 1934, as amended (the "Exchange Act"), or subject to the liabilities of that Section. The information in this Current Report shall not be incorporated by reference in any filing under the Securities Act of 1933, as amended, or the Exchange Act, except as shall be expressly set forth by specific reference in such filing.
Item 7.01 | Regulation FD Disclosure. |
On August 6, 2020, the Company disclosed a supplemental analyst package in connection with its earnings conference call for the six months ended June 30, 2020, which took place on August 6, 2020. A copy of the supplemental analyst package is attached hereto as Exhibit 99.2.
The supplemental analyst package is furnished pursuant to Item 7.01 and shall not be deemed “filed” for purposes of Section 18 of the Exchange Act, or subject to the liabilities of that Section. The information in this Current Report shall not be incorporated by reference in any filing under the Securities Act of 1933, as amended, or the Exchange Act, except as shall be expressly set forth by specific reference in such filing.
Item 9.01 | Financial Statements and Exhibits. |
(d) Exhibits:
Exhibit No. | Description | |
99.1 | Press Release dated August 6, 2020 | |
99.2 | Supplemental Analyst Package – Second Quarter 2020 | |
104 | The cover page of this Current Report on Form 8-K, formatted in Inline XBRL |
SIGNATURES
Pursuant to the requirements of the Securities Exchange Act of 1934, the Company has duly caused this report to be signed on its behalf by the undersigned hereunto duly authorized.
PLYMOUTH INDUSTRIAL REIT, INC. | ||||||
Date: August 6, 2020 | By: |
/s/ Jeffrey E. Witherell | ||||
Jeffrey E. Witherell | ||||||
Chief Executive Officer |
Exhibit 99.1
Contact:
Tripp Sullivan
SCR Partners
(615) 942-7077
TSullivan@scr-ir.com
PLYMOUTH INDUSTRIAL REIT REPORTS SECOND QUARTER RESULTS
BOSTON, August 6, 2020 – Plymouth Industrial REIT, Inc. (NYSE: PLYM) (the “Company”) today announced its consolidated financial results for the second quarter ended June 30, 2020 and other recent developments.
Second Quarter and Subsequent Highlights
· | Reported results for the second quarter of 2020 reflect a net loss attributable to common stockholders of $7.2 million, or $(0.49) per weighted average common share; net operating income (“NOI”) of $17.1 million; Funds from Operations attributable to common stockholders and unit holders (“FFO”) of $0.51 per weighted average common share and units; and Adjusted FFO (“AFFO”) of $0.45 per weighted average common share and units. |
· | Collected approximately 94% of its rent for the second quarter and 96% in July 2020, which excludes any rent deferment measures granted to tenants. Factoring in rent deferment, Plymouth collected approximately 99% of its expected rent for the second quarter and 97% in July. |
· | Same store NOI (“SS NOI”) was flat on a cash basis for the second quarter compared with the same period in 2019; decreased 0.2% on a cash basis excluding early termination income. |
· | Commenced leases totaling 1.35 million square feet with a 9.0% increase in rental rates on a cash basis from leases greater than six months, including a renewal of the Company’s largest 2020 lease expiration. |
· | Declared a regular quarterly cash dividend for the second quarter of 2020 of $0.20 for the common stock and a regular quarterly cash dividend of $0.46875 per share for the 7.50% Series A Cumulative Redeemable Preferred Stock (“the Preferred Stock”). |
Jeff Witherell, Chairman and Chief Executive Officer of Plymouth Industrial REIT, noted, “The significant challenges brought forth by the global pandemic have given us an opportunity to demonstrate the benefits of a heritage of being strong real estate operators. I am proud of how well our team has been able to lease our properties, collect rent, service our tenants, diligence new acquisition opportunities and collaborate throughout these unprecedented times. Since late April, we have seen leasing activity and rent collections return to a regular pace and the emphasis on preserving liquidity has enabled us to pay down some outstanding borrowings on our credit facility. We are encouraged by the recent trends in our portfolio and the early indications that this performance could be sustained through the second half of the year.
“We are bullish on the long-term fundamentals of the industrial sector and the expected demand created by changes to global supply chains, e-commerce and an emphasis on manufacturing in the United States. While the increasing amount of industry and real estate research points to a rising tide for the entire sector, we believe there will be an historic opportunity to invest in industrial properties in our targeted markets with tenants that will increasingly require access to the skilled blue-collar labor pools in our markets. We have been successful in the past with our approach to capturing these opportunities with disciplined access to capital. That commitment is as strong and relevant today as it was pre-COVID.”
Financial Results for the Second Quarter of 2020
Net loss attributable to common stockholders for the quarter ended June 30, 2020 was $7.2 million, or $(0.49) per weighted average common share outstanding, compared with net loss attributable to common stockholders of $6.0 million, or $(0.88) per weighted average common share, for the same period in 2019. The decrease in net loss per weighted average common share was primarily due to an increase in net operating income, mostly offset by increased interest and depreciation expense associated with acquisitions activity. Weighted average common shares outstanding for the quarters ended June 30, 2020 and 2019 were 14.6 million and 6.8 million, respectively. The year-over-year increase in weighted average common shares reflects the impact of the issuance of 7.1 million shares in 2019 and the first half of 2020.
Consolidated total revenues for the quarter ended June 30, 2020 were $26.1 million, compared with $17.0 million for the same period in 2019.
NOI for the quarter ended June 30, 2020 was $17.1 million compared with $11.0 million for the same period in 2019. Same store NOI (“SS NOI”) – Cash basis for the quarter ended June 30, 2020 was $10.3 million excluding early termination income compared with $10.3 million for the same period in 2019. SS NOI – GAAP basis excluding early termination income for the quarter ended June 30, 2020 was $10.7 million compared with $10.9 million for the same period in 2019, a decrease of 1.9%. The year-over-year decline in SS NOI – GAAP basis was due to both expected and unanticipated vacancies at three properties, offset by new leasing completed. During the first quarter of 2020, the Company received a $336,000 lease termination fee related to one of these moveouts.
EBITDAre for the quarter ended June 30, 2020 was $14.5 million compared with $9.2 million for the same period in 2019.
FFO attributable to common stockholders and unit holders for the quarter ended June 30, 2020 was $8.0 million compared with $4.1 million for the same period in 2019, primarily as a result of the contribution from acquisitions. The Company reported FFO for the quarter ended June 30, 2020 of $0.51 per weighted average common share and unit compared with $0.50 per weighted average common share and unit for the same period in 2019. The increase in weighted average share count was virtually offset by the contribution of acquisitions in addition to same store operations. Weighted average common shares and units outstanding for the second quarters ended June 30, 2020 and 2019 were 15.7 million and 8.0 million, respectively. As of June 30, 2020, the Company had a total of 16.7 million common shares and units outstanding.
AFFO for the quarter ended June 30, 2020 was $7.0 million, or $0.45 per weighted average common share and unit, compared with $3.4 million, or $0.43 per weighted average common share and unit, for the same period in 2019, primarily driven by the change in FFO attributable to common stockholders and unit holders.
See “Non-GAAP Financial Measures” for complete definitions of NOI, EBITDAre, FFO and AFFO and the financial tables accompanying this press release for reconciliations of net income to NOI, EBITDAre, FFO and AFFO.
Capital Markets Activity and Liquidity
During the second quarter of 2020, the Company issued approximately 1.1 million common shares through its ATM program at an average price of $12.03 per share, raising approximately $12.5 million in net proceeds.
As of August 5, 2020, the Company’s current cash balance was approximately $4.5 million, excluding operating expense escrows of approximately $9.1 million, and it has approximately $29.9 million of availability under the secured line of credit. Plymouth is currently in active discussions with KeyBank on refinancing its $100 million term loan that matures in October 2020, the Company’s only material debt maturity until 2023.
Leasing Activity
Leases commencing during the second quarter of 2020 totaled an aggregate of 1.40 million square feet, of which 1.35 million square feet was associated with leases of at least six months. The leases greater than six months included 1.29 million square feet of renewal leases and 62,000 square feet of new leases, and the Company will experience a 9.0% increase in rental rates on a cash basis from these leases.
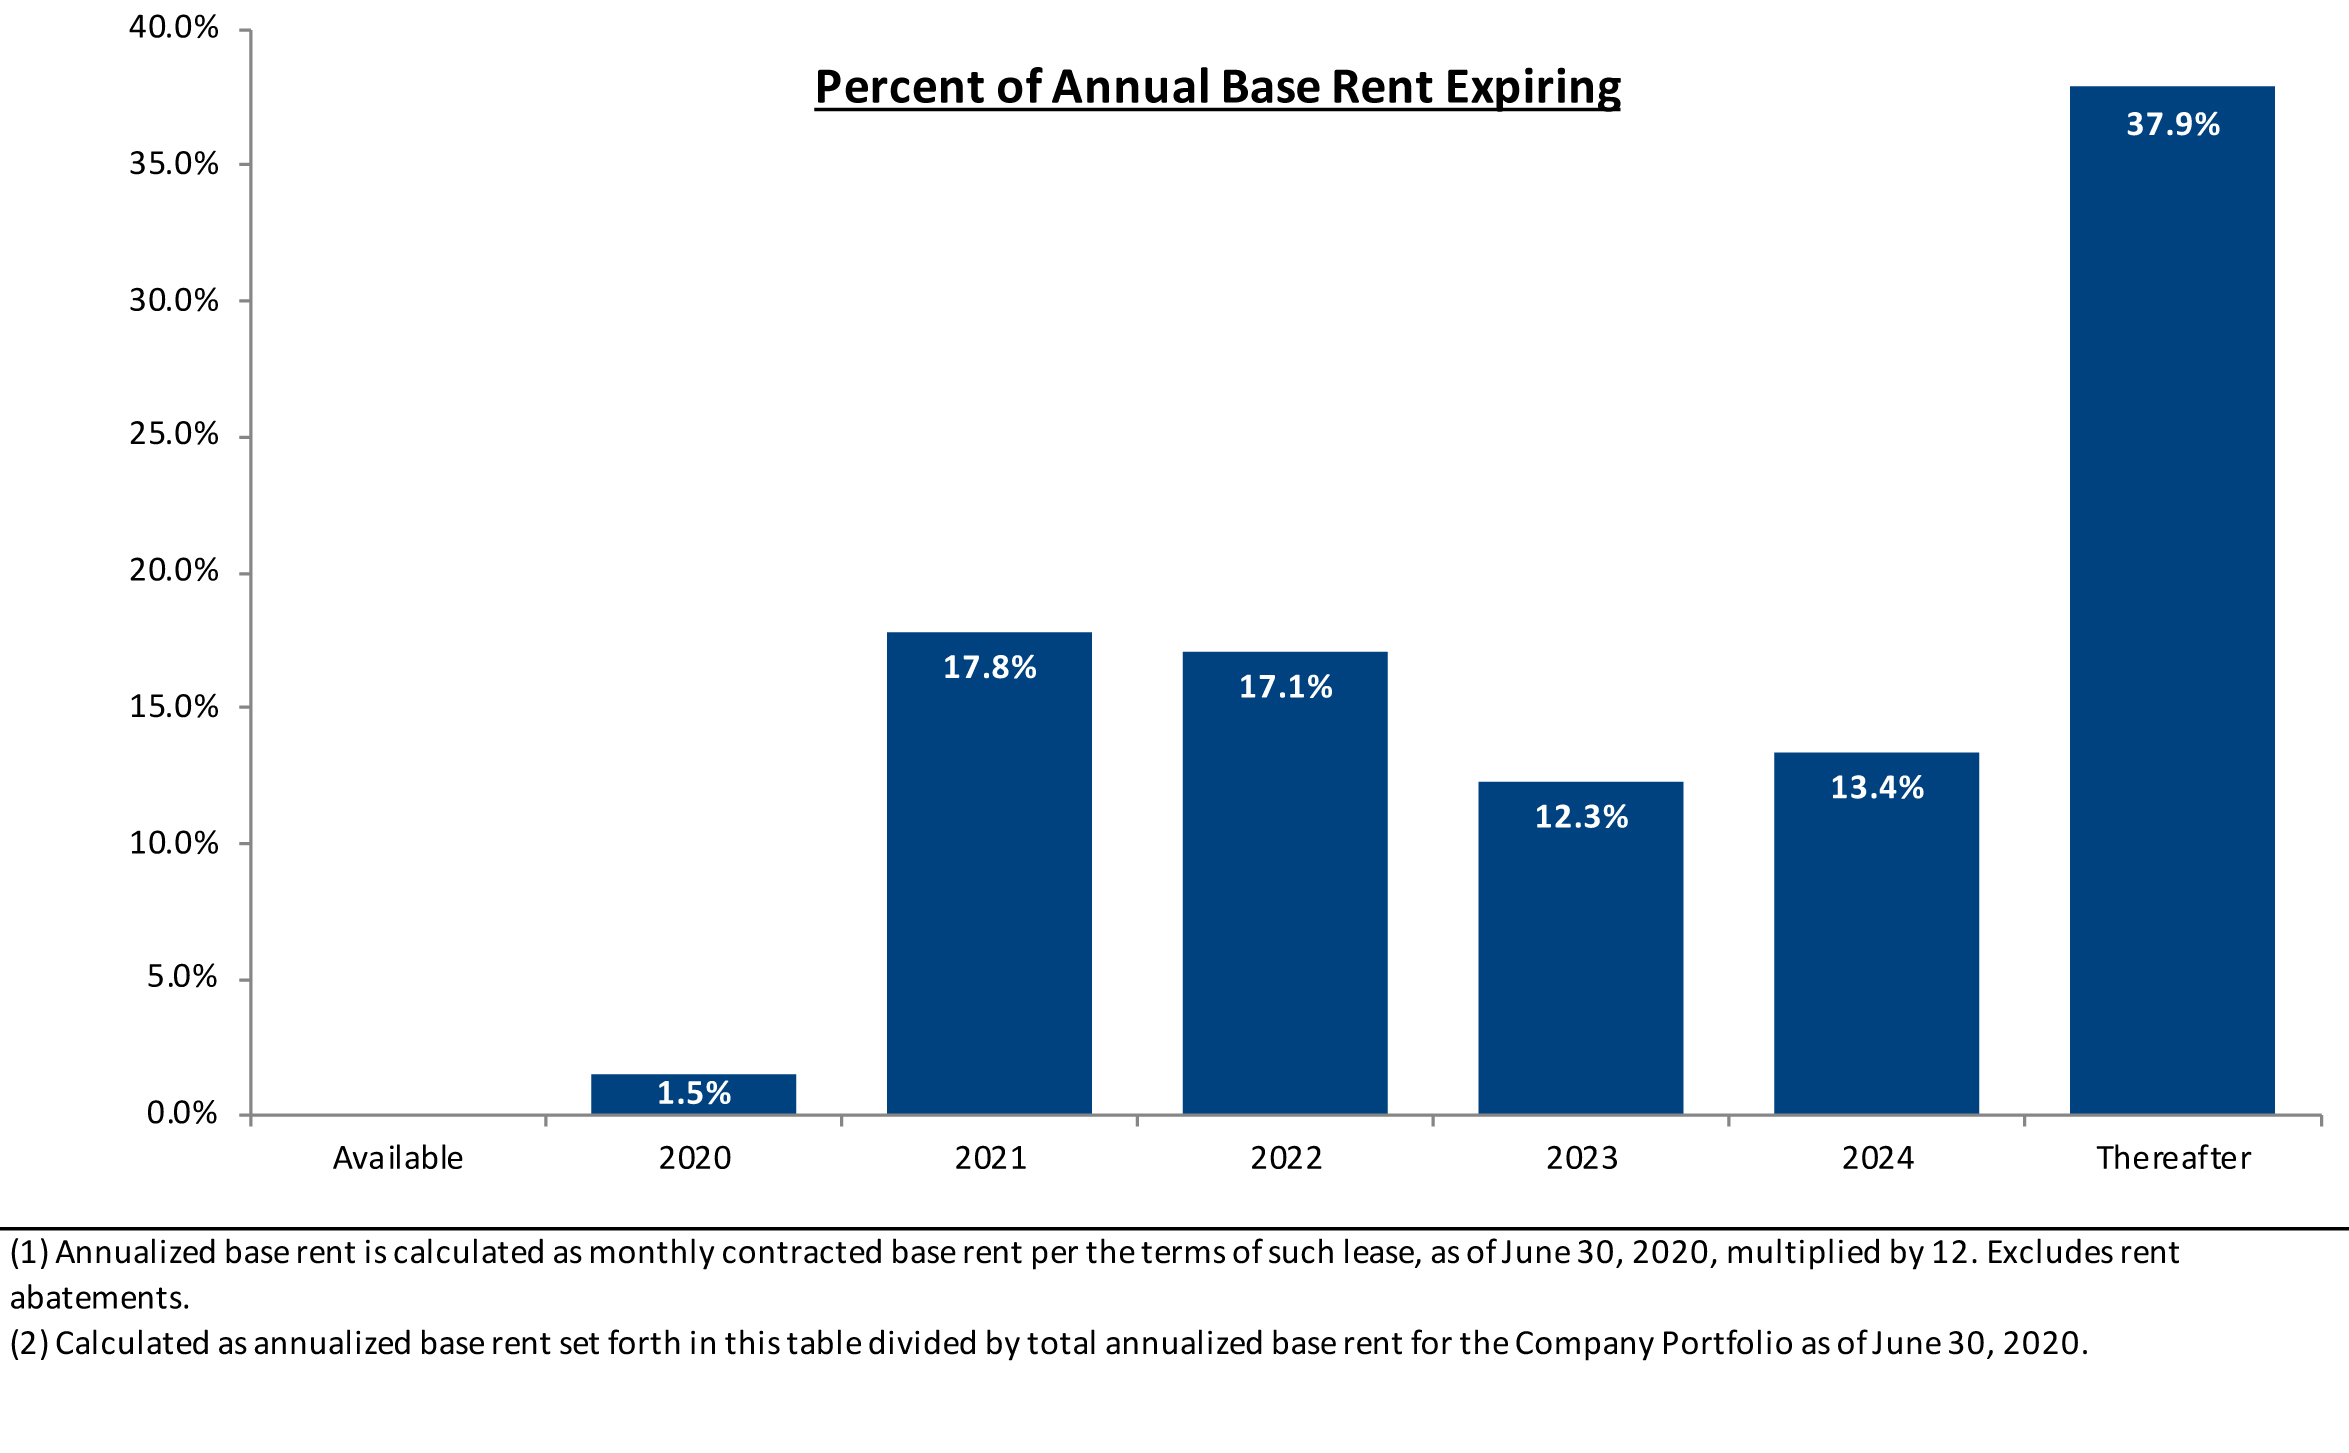
At the beginning of 2019, between its existing portfolio and additional acquisitions completed in 2019, Plymouth initially had 2.8 million square feet that was scheduled to expire in 2020. Expirations during 2020 increased 100,000 square feet due to early terminations bring the total space scheduled to expire in 2020 up to 2.9 million square feet, representing approximately 14.5% of the Company’s total portfolio. Prior to the end of 2019, approximately 1.4 million square feet of such leases were either renewed or leased to new tenants. Through Q2 2020, the Company had renewed or leased to new tenants an additional 850,000 square feet, bringing the total of executed new or renewal leases that were scheduled to expire in 2020 up to 2.25 million square feet, representing approximately 78% of the initial 2020 expirations, plus the Company had leased an additional 100,000 square feet that was previously vacant.
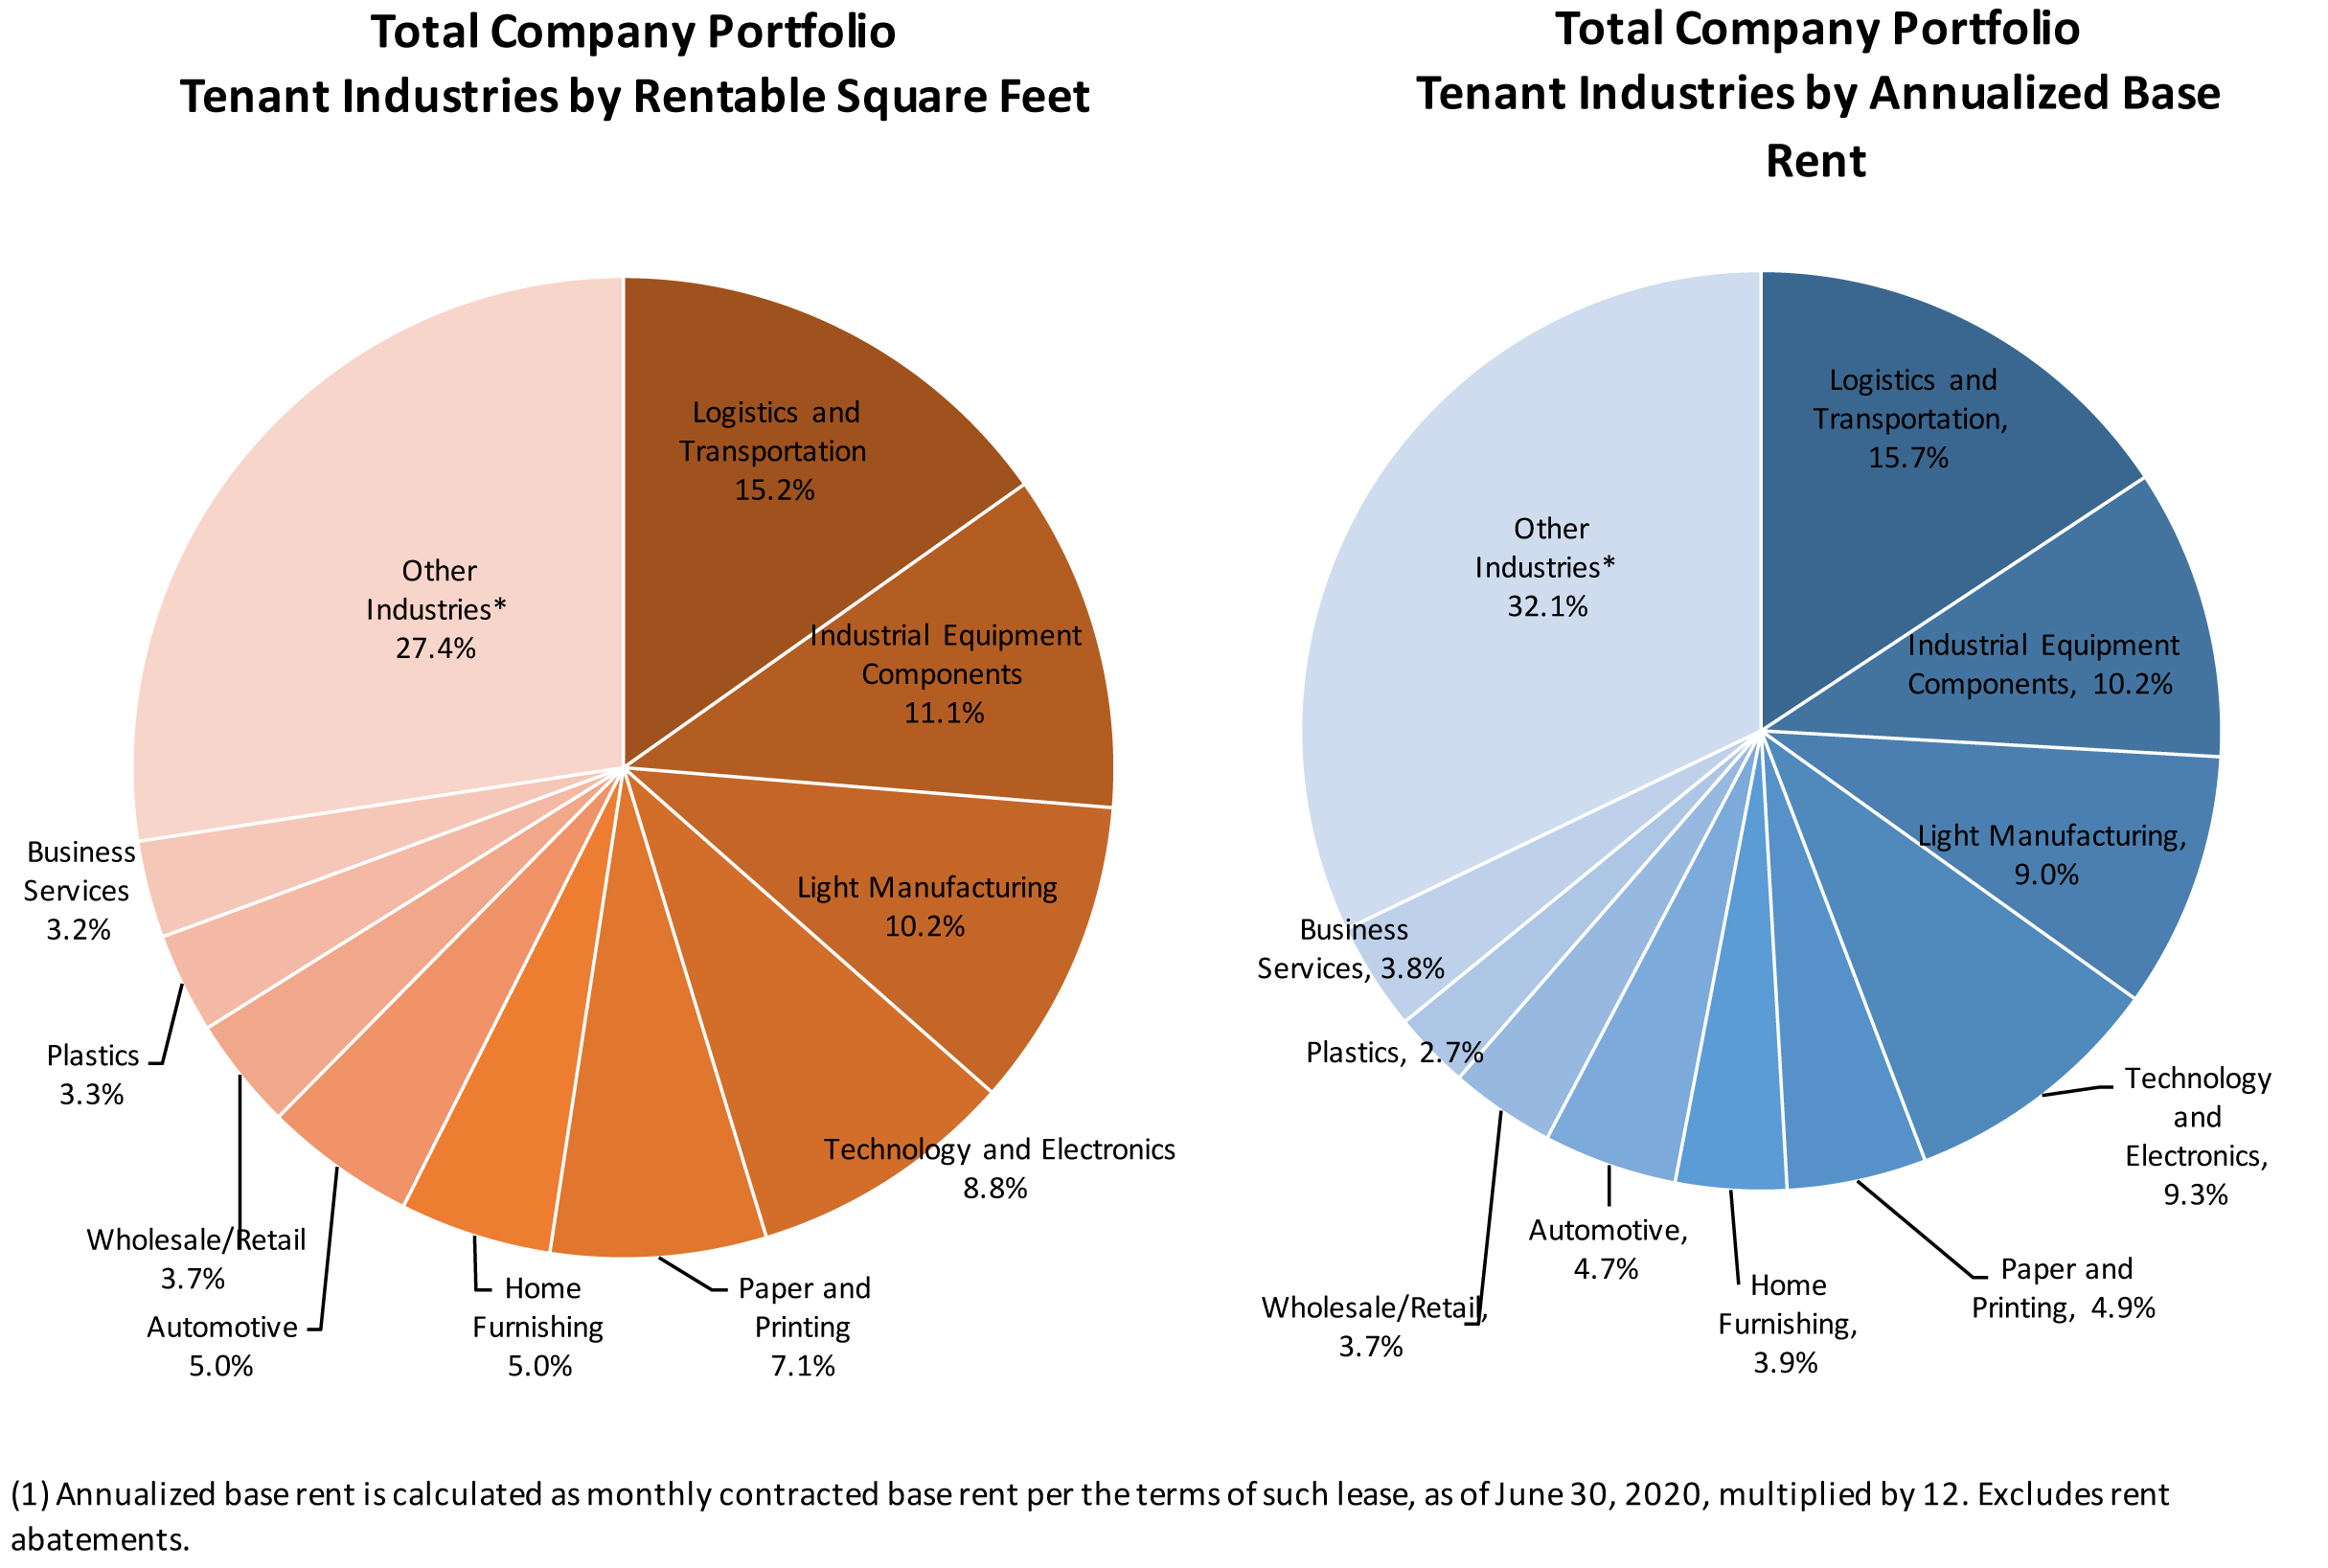
As of June 30, 2020, the Company had real estate investments comprised of 125 industrial buildings totaling 20.0 million square feet with occupancy of 95.1%. The Company has entered into a small number of rent deferral concessions representing approximately 1.6%, or $1.25 million, of annualized base rent, which is defined as the annualized monthly contractual base rent per the leases, excluding any rent abatements, as of June 30, 2020.
Quarterly Distributions to Stockholders
On June 1, 2020, the Company announced the Board of Directors declared a regular quarterly cash dividend of $0.46875 per share for the Preferred Stock for the second quarter of 2020. The dividend was paid on Jun 30, 2020 to stockholders of record on June 15, 2020.
On June 12, 2020, the Company announced the Board of Directors declared a regular quarterly cash dividend of $0.20 per share for the Company’s common stock for the second quarter of 2020. The dividend was paid on July 31, 2020, to stockholders of record on June 30, 2020.
Earnings Conference Call and Webcast
The Company will host a conference call and live audio webcast, both open for the general public to hear, later today at 9:00 a.m. Eastern Time. The number to call for this interactive teleconference is (412) 717-9587. A replay of the call will be available through August 13, 2020, by dialing (412) 317-0088 and entering the replay access code, 10146321.
The live audio webcast of the Company’s quarterly conference call will be available online in the Investor Relations section of the Company’s website at ir.plymouthreit.com. The online replay will be available approximately one hour after the end of the call and archived for approximately 90 days.
About Plymouth
Plymouth Industrial REIT, Inc. is a vertically integrated and self-managed real estate investment trust focused on the acquisition and operation of single and multi-tenant industrial properties located in secondary and select primary markets across the United States. The Company seeks to acquire properties that provide income and growth that enable the Company to leverage its real estate operating expertise to enhance shareholder value through active asset management, prudent property re-positioning and disciplined capital deployment.
Forward-Looking Statements
This press release includes “forward-looking statements” that are made pursuant to the safe harbor provisions of Section 27A of the Securities Act of 1933 and of Section 21E of the Securities Exchange Act of 1934. The forward-looking statements in this release do not constitute guarantees of future performance. Investors are cautioned that statements in this press release, which are not strictly historical statements, including, without limitation, statements regarding management's plans, objectives and strategies, constitute forward-looking statements. Such forward-looking statements are subject to a number of known and unknown risks and uncertainties that could cause actual results to differ materially from those anticipated by the forward-looking statement, many of which may be beyond our control, including, without limitation, those factors described under the captions “Cautionary Note Regarding Forward-Looking Statements” and “Risk Factors” in the Company’s Annual Report on Form 10-K and Quarterly Reports on Form 10-Q filed with the Securities and Exchange Commission. Forward-looking statements generally can be identified by the use of forward-looking terminology such as “may,” “plan,” “seek,” “will,” “expect,” “intend,” “estimate,” “anticipate,” “believe” or “continue” or the negative thereof or variations thereon or similar terminology. Any forward-looking information presented herein is made only as of the date of this press release, and we do not undertake any obligation to update or revise any forward-looking information to reflect changes in assumptions, the occurrence of unanticipated events, or otherwise.
PLYMOUTH INDUSTRIAL REIT, INC. |
CONDENSED CONSOLIDATED BALANCE SHEETS |
UNAUDITED |
(In thousands, except share and per share amounts) |
June 30, | December 31, | |||||||
2020 | 2019 | |||||||
Assets | ||||||||
Real estate properties | $ | 738,024 | $ | 655,788 | ||||
Less accumulated depreciation | (80,452 | ) | (63,877 | ) | ||||
Real estate properties, net | 657,572 | 591,911 | ||||||
Cash | 13,975 | 10,465 | ||||||
Cash held in escrow | 11,444 | 9,453 | ||||||
Restricted cash | 3,827 | 2,480 | ||||||
Deferred lease intangibles, net | 57,328 | 57,088 | ||||||
Other assets | 20,501 | 14,084 | ||||||
Total assets | $ | 764,647 | $ | 685,481 | ||||
Liabilities, Preferred stock and Equity | ||||||||
Liabilities: | ||||||||
Secured debt, net | $ | 397,150 | $ | 318,558 | ||||
Borrowings under line of credit | 70,100 | 78,900 | ||||||
Accounts payable, accrued expenses and other liabilities | 42,598 | 36,284 | ||||||
Deferred lease intangibles, net | 7,888 | 8,314 | ||||||
Total liabilities | 517,736 | 442,056 | ||||||
Preferred stock, par value $0.01 per share, 100,000,000 shares authorized, | ||||||||
Series A; 2,040,000 shares issued and outstanding at June 30, 2020 and December 31, 2019 (aggregate liquidation preference of $51,000 at June 30, 2020 and December 31, 2019) | 48,868 | 48,868 | ||||||
Series B; 4,411,764 shares issued and outstanding at June 30, 2020 and December 31, 2019, (aggregate liquidation preference of $97,230 and $96,574 at June 30, 2020 and December 31, 2019, respectively) | 83,501 | 79,793 | ||||||
Equity: | ||||||||
Common stock, $0.01 par value: 900,000,000 shares authorized; 15,897,644 and 14,141,355 shares issued and outstanding at June 30, 2020 and December 31, 2019, respectively | 159 | 141 | ||||||
Additional paid in capital | 265,774 | 256,259 | ||||||
Accumulated deficit | (156,106 | ) | (148,403 | ) | ||||
Total stockholders' equity | 109,827 | 107,997 | ||||||
Non-controlling interest | 4,715 | 6,767 | ||||||
Total equity | 114,542 | 114,764 | ||||||
Total liabilities, preferred stock and equity | $ | 764,647 | $ | 685,481 |
PLYMOUTH INDUSTRIAL REIT, INC. |
CONDENSED CONSOLIDATED STATEMENTS OF OPERATIONS |
UNAUDITED |
(In thousands, except share and per share amounts) |
For the Three Months | For the Six Months | |||||||||||||||
Ended June 30, | Ended June 30, | |||||||||||||||
2020 | 2019 | 2020 | 2019 | |||||||||||||
Rental revenue | $ | 26,137 | $ | 17,022 | $ | 52,366 | $ | 33,684 | ||||||||
Total revenues | 26,137 | 17,022 | 52,366 | 33,684 | ||||||||||||
Operating expenses: | ||||||||||||||||
Property | 9,026 | 6,034 | 18,037 | 12,296 | ||||||||||||
Depreciation and amortization | 13,520 | 8,476 | 27,617 | 16,908 | ||||||||||||
General and administrative | 2,576 | 1,691 | 5,098 | 3,337 | ||||||||||||
Total operating expenses | 25,122 | 16,201 | 50,752 | 32,541 | ||||||||||||
Other (expense): | ||||||||||||||||
Interest expense | (4,900 | ) | (3,576 | ) | (9,771 | ) | (7,418 | ) | ||||||||
Change in fair value of warrant derivative | — | (102 | ) | — | (181 | ) | ||||||||||
Total other expense, net | (4,900 | ) | (3,678 | ) | (9,771 | ) | (7,599 | ) | ||||||||
Net loss | $ | (3,885 | ) | $ | (2,857 | ) | $ | (8,157 | ) | $ | (6,456 | ) | ||||
Less: loss attributable to non-controlling interest | $ | (209 | ) | $ | (380 | ) | $ | (454 | ) | $ | (1,033 | ) | ||||
Net loss attributable to Plymouth Industrial REIT, Inc. | $ | (3,676 | ) | $ | (2,477 | ) | $ | (7,703 | ) | $ | (5,423 | ) | ||||
Less: Preferred stock dividends | 1,613 | 1,566 | 3,226 | 3,132 | ||||||||||||
Less: Series B preferred stock accretion to redemption value | 1,854 | 1,901 | 3,708 | 3,801 | ||||||||||||
Less: amount allocated to participating securities | 30 | 58 | 106 | 115 | ||||||||||||
Net loss attributable to common stockholders | $ | (7,173 | ) | $ | (6,002 | ) | $ | (14,743 | ) | $ | (12,471 | ) | ||||
Net loss basic and diluted per share attributable to common stockholders | $ | (0.49 | ) | $ | (0.88 | ) | $ | (1.02 | ) | $ | (2.15 | ) | ||||
Weighted-average common shares outstanding basic and diluted | 14,649,290 | 6,835,878 | 14,514,233 | 5,787,600 |
Non-GAAP Financial Measures Definitions
Net Operating Income (NOI): We consider net operating income, or NOI, to be an appropriate supplemental measure to net income in that it helps both investors and management understand the core operations of our properties. We define NOI as total revenue (including rental revenue, tenant reimbursements and other income) less property-level operating expenses. NOI excludes depreciation and amortization, general and administrative expenses, impairments, gain/loss on sale of real estate, interest expense, and other non-operating items.
EBITDAre: We define earnings before interest, taxes, depreciation and amortization for real estate in accordance with the standards established by the National Association of Real Estate Investment Trusts (“NAREIT”). EBITDAre represents net income (loss), computed in accordance with GAAP, before interest expense, tax, depreciation and amortization, gains or losses on the sale of rental property, and loss on impairments. We believe that EBITDAre is helpful to investors as a supplemental measure of our operating performance as a real estate company as it is a direct measure of the actual operating results of our industrial properties.
Funds From Operations attributable to common stockholders (“FFO”): Funds from operations, or FFO, is a non-GAAP financial measure that is widely recognized as a measure of REIT operating performance. We consider FFO to be an appropriate supplemental measure of our operating performance as it is based on a net income analysis of property portfolio performance that excludes non-cash items such as depreciation. The historical accounting convention used for real estate assets requires straight-line depreciation of buildings and improvements, which implies that the value of real estate assets diminishes predictably over time. Since real estate values rise and fall with market conditions, presentations of operating results for a REIT, using historical accounting for depreciation, could be less informative. In December 2018, NAREIT issued a white paper restating the definition of FFO. The purpose of the restatement was not to change the fundamental definition of FFO, but to clarify existing NAREIT guidance. The restated definition of FFO is as follows: Net Income (calculated in accordance with GAAP), excluding: (i) Depreciation and amortization related to real estate, (ii) Gains and losses from the sale of certain real estate assets, (iii) Gain and losses from change in control, and (iv) Impairment write-downs of certain real estate assets and investments in entities when the impairment is directly attributable to decreases in the value of depreciable real estate held by the entity.
We define FFO, consistent with the NAREIT definition. Adjustments for unconsolidated partnerships and joint ventures will be calculated to reflect FFO on the same basis. Other equity REITs may not calculate FFO as we do, and, accordingly, our FFO may not be comparable to such other REITs’ FFO. FFO should not be used as a measure of our liquidity, and is not indicative of funds available for our cash needs, including our ability to pay dividends. FFO attributable to common stockholders and unit holders represents FFO reduced by dividends paid (or declared) to holders of our preferred stock.
Adjusted Funds From Operations attributable to common stockholders (“AFFO”): Adjusted funds from operations, or AFFO, is presented in addition to FFO. AFFO is defined as FFO, excluding certain non-cash operating revenues and expenses, acquisition and transaction related costs for transactions not completed and recurring capitalized expenditures. Recurring capitalized expenditures include expenditures required to maintain and re-tenant our properties, tenant improvements and leasing commissions. AFFO further adjusts FFO for certain other non-cash items, including the amortization or accretion of above or below market rents included in revenues, straight line rent adjustments, impairment losses, non-cash equity compensation and non-cash interest expense.
We believe AFFO provides a useful supplemental measure of our operating performance because it provides a consistent comparison of our operating performance across time periods that is comparable for each type of real estate investment and is consistent with management’s analysis of the operating performance of our properties. As a result, we believe that the use of AFFO, together with the required GAAP presentations, provide a more complete understanding of our operating performance. As a result, we believe that the use of AFFO, together with the required GAAP presentations, provide a more complete understanding of our operating performance.
As with FFO, our reported AFFO may not be comparable to other REITs’ AFFO, should not be used as a measure of our liquidity, and is not indicative of our funds available for our cash needs, including our ability to pay dividends.
PLYMOUTH INDUSTRIAL REIT, INC. |
SUPPLEMENTAL RECONCILIATION OF NON-GAAP DISCLOSURES |
UNAUDITED |
(In thousands, except per share amounts) |
For the Three Months | For the Six Months | |||||||||||||||
Ended June 30, | Ended June 30, | |||||||||||||||
NOI: | 2020 | 2019 | 2020 | 2019 | ||||||||||||
Net loss | $ | (3,885 | ) | $ | (2,857 | ) | $ | (8,157 | ) | $ | (6,456 | ) | ||||
General and administrative | 2,576 | 1,691 | 5,098 | 3,337 | ||||||||||||
Depreciation and amortization | 13,520 | 8,476 | 27,617 | 16,908 | ||||||||||||
Interest expense | 4,900 | 3,576 | 9,771 | 7,418 | ||||||||||||
Change in fair value of warrant derivative | — | 102 | — | 181 | ||||||||||||
NOI | $ | 17,111 | $ | 10,988 | $ | 34,329 | $ | 21,388 | ||||||||
For the Three Months | For the Six Months | |||||||||||||||
Ended June 30, | Ended June 30, | |||||||||||||||
EBITDAre: | 2020 | 2019 | 2020 | 2019 | ||||||||||||
Net loss | $ | (3,885 | ) | $ | (2,857 | ) | $ | (8,157 | ) | $ | (6,456 | ) | ||||
Depreciation and amortization | 13,520 | 8,476 | 27,617 | 16,908 | ||||||||||||
Interest expense | 4,900 | 3,576 | 9,771 | 7,418 | ||||||||||||
EBITDAre | $ | 14,535 | $ | 9,195 | $ | 29,231 | $ | 17,870 | ||||||||
For the Three Months | For the Six Months | |||||||||||||||
Ended June 30, | Ended June 30, | |||||||||||||||
FFO: | 2020 | 2019 | 2020 | 2019 | ||||||||||||
Net loss | $ | (3,885 | ) | $ | (2,857 | ) | $ | (8,157 | ) | $ | (6,456 | ) | ||||
Depreciation and amortization | 13,520 | 8,476 | 27,617 | 16,908 | ||||||||||||
FFO | $ | 9,635 | $ | 5,619 | $ | 19,460 | $ | 10,452 | ||||||||
Preferred stock dividends | (1,613 | ) | (1,566 | ) | (3,226 | ) | (3,132 | ) | ||||||||
FFO attributable to common stockholders and unit holders | $ | 8,022 | $ | 4,053 | $ | 16,234 | $ | 7,320 | ||||||||
Weighted average common shares and units outstanding | 15,675 | 8,037 | 15,564 | 6,983 | ||||||||||||
FFO attributable to common stockholders and unit holders per share | $ | 0.51 | $ | 0.50 | $ | 1.04 | $ | 1.05 | ||||||||
For the Three Months | For the Six Months | |||||||||||||||
Ended June 30, | Ended June 30, | |||||||||||||||
AFFO: | 2020 | 2019 | 2020 | 2019 | ||||||||||||
FFO attributable to common stockholders and unit holders | $ | 8,022 | $ | 4,053 | $ | 16,234 | $ | 7,320 | ||||||||
Amortization of debt related costs | 366 | 273 | 665 | 508 | ||||||||||||
Non-cash interest expense | (174 | ) | (62 | ) | 90 | (93 | ) | |||||||||
Stock compensation | 383 | 305 | 732 | 593 | ||||||||||||
Change in fair value of warrant derivative | — | 102 | — | 181 | ||||||||||||
Straight line rent | (443 | ) | (223 | ) | (961 | ) | (481 | ) | ||||||||
Above/below market lease rents | (438 | ) | (344 | ) | (986 | ) | (685 | ) | ||||||||
Recurring capital expenditure (1) | (719 | ) | (687 | ) | (1,755 | ) | (1,246 | ) | ||||||||
AFFO | $ | 6,997 | $ | 3,417 | $ | 14,019 | $ | 6,097 | ||||||||
Weighted average common shares and units outstanding | 15,675 | 8,037 | 15,564 | 6,983 | ||||||||||||
AFFO per share | $ | 0.45 | $ | 0.43 | $ | 0.90 | $ | 0.87 |
(1) Excludes non-recurring capital expenditures of $401 and $635 for the three months ended June 30, 2020 and 2019, respectively, and $2,151 and $1,688 for the six months ended June 30, 2020 and 2019, respectively.
Exhibit 99.2
Second Quarter 2020
Supplemental
Plymouth Industrial REIT, Inc. | ||||||||||||
Table of Contents | ||||||||||||
Introduction | ||||||||||||
Management, Board of Directors & Investor Contacts | 2 | |||||||||||
Executive Summary | 3 | |||||||||||
Transaction Activity - 2019/2020 | 4 | |||||||||||
Capitalization Analysis | 5 | |||||||||||
Financial Information | ||||||||||||
Consolidated Balance Sheets (unaudited) | 6 | |||||||||||
Consolidated Statements of Operations - GAAP (unaudited) | 7 | |||||||||||
Same Store Net Operating Income (NOI) | 8 | |||||||||||
NOI | 9 | |||||||||||
Earnings Before Interest, Taxes, Depreciation and Amortization for Real Estate (EBITDAre) | 10 | |||||||||||
Funds from Operations (FFO) & Adjusted Funds from Operations (AFFO) | 11 | |||||||||||
Debt Overview | 12 | |||||||||||
Operational & Portfolio Information | ||||||||||||
Building Overview - Square Feet & Occupancy | 13 | |||||||||||
Total Acquisition Cost by Geography | 15 | |||||||||||
Rentable Square Feet and Annualized Base Rent by State | 16 | |||||||||||
Rentable Square Feet and Annualized Base Rent by Building Type | 17 | |||||||||||
Rentable Square Feet and Annualized Base Rent by Tenant Industry | 18 | |||||||||||
Top 10 Tenants by Annualized Base Rent | 20 | |||||||||||
Leasing Activity | 21 | |||||||||||
Lease Expiration Schedule | 22 | |||||||||||
Appendix | ||||||||||||
Glossary | 23 | |||||||||||
Forward looking statements: This supplemental package contains forward-looking statements within the meaning of the U.S. federal securities laws. We make statements in this supplemental package that are forward-looking statements, which are usually identified by the use of words such as “anticipates,” “believes,” “estimates,” “expects,” “intends,” “may,” “plans” “projects,” “seeks,” “should,” “will,” and variations of such words or similar expressions. Our forward-looking statements reflect our current views about our plans, intentions, expectations, strategies and prospects, which are based on the information currently available to us and on assumptions we have made. Although we believe that our plans, intentions, expectations, strategies and prospects as reflected in or suggested by our forward-looking statements are reasonable, we can give no assurance that our plans, intentions, expectations, strategies or prospects will be attained or achieved and you should not place undue reliance on these forward-looking statements. Furthermore, actual results may differ materially from those described in the forward-looking statements and may be affected by a variety of risks and factors. Any forward-looking statement speaks only as of the date on which it is made. New risks and uncertainties arise over time, and it is not possible for us to predict those events or how they may affect us. Except as required by law, we are not obligated to, and do not intend to, update or revise any forward-looking statements, whether as a result of new information, future events or otherwise. | ||||||||||||
Definitions and reconciliations: For definitions of certain terms used throughout this supplemental, including certain non-GAAP financial measures, see the Glossary on page 23. For reconciliations of the non-GAAP financial measures to the most directly comparable GAAP measures, see pages 9-11. |
2Q 2020 Supplemental
1
Plymouth Industrial REIT, Inc. | ||||
Management, Board of Directors & Investor Contacts | ||||
Corporate | ||||
20 Custom House Street, 11th Floor | ||||
Boston, Massachusetts 02110 | ||||
617.340.3814 | ||||
www.plymouthreit.com | ||||
Executive and Senior Management | ||||
Jeffrey E. Witherell | Pendleton P. White, Jr. | Daniel C. Wright | James M. Connolly | |
Chief Executive Officer | President and Chief Investment | Executive Vice President | Executive Vice President | |
and Chairman | Officer | and Chief Financial Officer | Asset Management | |
Board of Directors | ||||
Martin Barber | Philip S. Cottone | Richard J. DeAgazio | ||
Independent Director | Independent Director | Independent Director | ||
David G. Gaw | Pendleton P. White, Jr. | Jeffery E. Witherell | ||
Independent Director | President and Chief Investment | Chief Executive Officer | ||
Officer | and Chairman | |||
Transfer Agent | ||||
Continental Stock Transfer & Trust Company | ||||
1 State Street, 30th Floor | ||||
New York, New York 10004 | ||||
212.509.4000 | ||||
Investor Relations | ||||
Tripp Sullivan | ||||
SCR Partners | ||||
615.942.7077 | ||||
IR@plymouthREI.com |
2Q 2020 Supplemental
2
Plymouth Industrial REIT, Inc. | ||||||
Executive Summary | ||||||
Company overview: Plymouth Industrial REIT, Inc. (NYSE: PLYM) is a vertically integrated and self-managed real estate investment trust focused on the acquisition and operation of single and multi-tenant industrial properties located in secondary and select primary markets across the United States. The Company seeks to acquire properties that provide income and growth that enable the Company to leverage its real estate operating expertise to enhance shareholder value through active asset management, prudent property re-positioning and disciplined capital deployment. | ||||||
Unaudited | ||||||
As of June 30, 2020 | ||||||
Select Portfolio Statistics | ||||||
Number of Properties/Buildings | 96/125 | |||||
Square Footage | 19,988,548 | |||||
Occupancy | 95.1% | |||||
Weighted Average Lease Term Remaining - years | 3.9 | |||||
Balance Sheet ($ in thousands) | ||||||
Cash | $ 29,246 | |||||
Gross Assets | $ 887,401 | |||||
Total Debt | $ 470,721 | |||||
Net Debt (Total Debt less Cash) | $ 441,475 | |||||
Net Debt / Gross Assets | 49.7% | |||||
Three months ended June 30, | Year ended December 31, | |||||
Operating results ($ in thousands) | 27020 | 2019 | 2019 | 2018 | ||
Total Revenue | $ 26,137 | $ 17,022 | $ 75,290 | $ 49,217 | ||
Net Operating Income | $ 17,111 | $ 10,988 | $ 48,053 | $ 31,234 | ||
2019 & YTD 2020 Capital Markets Activity ($ in thousands) | ||||||
Secured 7 year term loan with Allianz Life Insurance Company | 3/21/2019 | $ 63,115 | ||||
Repaid KeyBank Bridge Loan | 3/21/2019 | $ (63,115) | ||||
Issued 278,302 shares of common shares @ average of $16.63 per share | Q1 2019 | $ 4,628 | ||||
Issued 147,017 shares of common shares @ average of $16.79 per share | Q2 2019 | $ 2,469 | ||||
Issued 3,425,000 common shares @ $17.50 per share | Q2 2019 | $ 59,938 | ||||
Amended secured line of credit agreement with KeyBank National | 8/7/2019 | $ 100,000 | ||||
Assumption of mortgage debt as part of the South Park Acquisition | 8/29/2019 | $ 9,577 | ||||
Assumption of mortgage debt as part of the Orange Point Acquisition | 8/30/2019 | $ 21,004 | ||||
Issued 1,194,032 shares of common shares @ average of $18.61 per share | Q3 2019 | $ 22,224 | ||||
Issued 3,450,000 common shares @ $18.00 per share | Q3 2019 | $ 62,100 | ||||
Issued 562,900 common shares @ average of $18.59 per share | Q4 2019 | $ 10,462 | ||||
Issued 593,705 common shares @ average of $18.62 per share | Q1 2020 | $ 11,053 | ||||
Secured term loan with KeyBank National | Q1 2020 | $ 100,000 | ||||
Issued 1,060,300 common shares @ average of $12.03 per share | Q2 2020 | $ 12,760 |
2Q 2020 Supplemental
3
Plymouth Industrial REIT, Inc. | |||||
Transaction Activity - 2019/2020 | |||||
Unaudited ($ in thousands) at 6/30/2020 | |||||
Acquisitions | |||||
Location | Acquisition Date | # of Buildings | Purchase Price (1) | Square Footage | Projected Initial Yield |
Chicago, IL | 1/24/2020 | 1 | $ 18,650 | 465,940 | 8.6% |
Indianapolis, IN | 1/27/2020 | 1 | $ 8,800 | 276,240 | 7.8% |
Atlanta/Savannah, GA | 1/28/2020 | 5 | $ 34,700 | 924,036 | 7.6% |
Avon, OH | 2/14/2020 | 3 | $ 15,750 | 406,863 | 8.2% |
Atlanta, GA | 3/1/2020 | 1 | $ 10,056 | 117,000 | 8.3% |
Total 2020 Acquisitions | 11 | $ 87,956 | 2,190,079 | ||
Cleveland, OH | 12/20/2019 | 1 | $ 16,800 | 405,000 | 8.5% |
Indianapolis, IN | 12/4/2019 | 1 | $ 12,150 | 353,000 | 8.1% |
Indianapolis, IN | 12/4/2019 | 9 | $ 49,815 | 1,747,411 | 8.7% |
Metro St. Louis | 11/21/2019 | 1 | $ 3,525 | 59,055 | 8.4% |
Atlanta, GA | 10/30/2019 | 2 | $ 19,400 | 295,693 | 8.4% |
Multiple, OH | 8/30/2019 | 6 | $ 36,200 | 591,695 | 8.4% |
Memphis, TN | 8/29/2019 | 2 | $ 22,050 | 566,281 | 8.1% |
Chicago, IL | 8/29/2019 | 7 | $ 32,250 | 1,071,129 | 8.25% |
St. Louis, MO | 7/29/2019 | 1 | $ 5,400 | 129,000 | 8.6% |
Indianapolis, IN | 6/10/2019 | 1 | $ 17,100 | 484,879 | 7.7% |
Chicago, IL | 1/5/2019 | 1 | $ 5,425 | 73,785 | 8.9% |
Total 2019 Acquisitions | 32 | $ 220,115 | 5,776,928 | ||
Total - Acquisitions | 43 | $ 308,071 | 7,967,007 | ||
(1) Represents total direct consideration paid rather than GAAP cost basis. |
2Q 2020 Supplemental
4
Plymouth Industrial REIT, Inc. | ||||||||
Capitalization Analysis | ||||||||
Unaudited (in thousands except for per-share data and percentages) |
Three Months Ended | ||||||||
6/30/20 | 3/31/20 | 12/31/19 | 9/30/2019 | 6/30/2019 | ||||
Common Stock Data | ||||||||
Weighted-Average Common Shares Outstanding - Basic & Diluted (1) | 14,649 | 14,393 | 13,416 | 9,081 | 6,836 | |||
High Closing Price | $ 15.92 | $ 21.11 | $ 19.08 | $ 19.65 | $ 19.48 | |||
Low Closing Price | $ 10.12 | $ 7.90 | $ 17.48 | $ 17.54 | $ 16.55 | |||
Average Closing Price | $ 13.27 | $ 17.15 | $ 18.42 | $ 18.60 | $ 17.77 | |||
Closing Price (as of period end) | $ 12.80 | $ 11.16 | $ 18.39 | $ 18.32 | $ 18.94 | |||
Dividends / Share (annualized) (2) | $ 0.80 | $ 1.50 | $ 1.50 | $ 1.50 | $ 1.50 | |||
Dividend Yield (annualized) (3) | 6.3% | 13.4% | 8.2% | 8.2% | 7.9% | |||
Common Shares Outstanding (3) | 15,898 | 14,791 | 14,141 | 13,406 | 8,755 | |||
Market Value of Common Shares (3) | $ 203,494 | $ 165,068 | $ 260,053 | $ 245,598 | $ 165,816 | |||
Total Market Capitalization (3) (4) | $ 800,215 | $ 792,073 | $ 694,833 | $ 584,735 | $ 538,396 | |||
Equity Research Coverage (5) |
D.A. Davidson & Co. | Piper Sandler & Co. | |||
Barry Oxford | Alexander Goldfarb | |||
646.885.5423 | 212.466.7937 | |||
KeyBanc Capital Markets | Wedbush Securities | |||
Craig Mailman | Henry Coffey | |||
917.368.2316 | 212.833.1382 | |||
National Securities Corp. | ||||
Guarav Mehta | ||||
212.417.8008 | ||||
Investor Conference Call and Webcast:
The Company will hold a conference call and live audio webcast, both open for the general public to hear, on August 6, 2020 at
9:00 a.m. Eastern Time. The number to call for this interactive teleconference is (412) 717-9587. A replay of the call will be
available through August 13, 2020 by dialing (412) 317-0088 and entering the replay access code, 10146321.
(1) Audited consolidated financial statements and notes for the year ended December 31, 2019 are available within our 2019 Annual Report on Form 10-K.
(2) Based on annualized dividend declared for the quarter.
(3) Based on closing price and ending shares for the last trading day of the quarter.
(4) Market value of shares plus total debt and preferred stock as of quarter end.
(5) The analysts listed provide research coverage on the Company. Any opinions, estimates or forecasts regarding the Company's performance made by these analysts are theirs alone and do not represent opinions, estimates or forecasts by the Company or its management. The Company does not by reference above imply its endorsement of or concurrence with such information, conclusions or recommendations.
2Q 2020 Supplemental
5
Plymouth Industrial REIT, Inc. | ||||||
Consolidated Balance Sheets (unaudited) | ||||||
(in thousands) |
6/30/2020 | 3/31/2020 | 12/31/19 (1) | 9/30/2019 | 6/30/2019 | ||
Assets: | ||||||
Real estate properties: | ||||||
Land | $ 141,972 | $ 141,972 | $ 127,439 | $ 110,287 | $ 96,139 | |
Building and improvements | 596,052 | 595,178 | 528,349 | 455,107 | 378,595 | |
Less accumulated depreciation | (80,452) | (71,963) | (63,877) | (57,331) | (51,676) | |
Total real estate properties, net | $ 657,572 | $ 665,187 | $ 591,911 | $ 508,063 | $ 423,058 | |
Cash, cash held in escrow and restricted cash | 29,246 | 41,738 | 22,398 | 36,801 | 24,194 | |
Deferred lease intangibles, net | 57,328 | 62,253 | 57,088 | 45,768 | 34,931 | |
Other assets | 20,501 | 22,091 | 14,084 | 11,214 | 10,525 | |
Total assets | $ 764,647 | $ 791,269 | $ 685,481 | $ 601,846 | $ 492,708 | |
Liabilities: | ||||||
Secured Debt, net | $ 467,250 | $ 497,372 | $ 397,458 | $ 319,448 | $ 287,990 | |
Accounts payable, accrued expenses and other liabilities | 42,598 | 42,541 | 36,284 | 32,222 | 26,577 | |
Deferred lease intangibles, net | 7,888 | 8,523 | 8,314 | 7,579 | 6,393 | |
Total liabilities | $ 517,736 | $ 548,436 | $ 442,056 | $ 359,249 | $ 320,960 | |
Preferred Stock - Series A | $ 48,868 | $ 48,868 | $ 48,868 | $ 48,868 | $ 48,868 | |
Preferred Stock - Series B | $ 83,501 | $ 81,647 | $ 79,793 | $ 77,893 | $ 75,993 | |
Equity: | ||||||
Common stock | $ 159 | $ 148 | $ 141 | $ 134 | $ 88 | |
Additional paid in capital | 265,774 | 258,404 | 256,259 | 249,827 | 177,557 | |
Accumulated deficit | (156,106) | (152,430) | (148,403) | (146,072) | (143,406) | |
Total stockholders' equity | 109,827 | 106,122 | 107,997 | 103,889 | 34,239 | |
Non-controlling interest | 4,715 | 6,196 | 6,767 | 11,947 | 12,648 | |
Total equity | $ 114,542 | $ 112,318 | $ 114,764 | $ 115,836 | $ 46,887 | |
Total liabilities, preferred stock and equity | $ 764,647 | $ 791,269 | $ 685,481 | $ 601,846 | $ 492,708 |
(1) Audited consolidated financial statements and notes for the year ended December 31, 2019 are available within our 2019 Annual Report on Form 10-K.
2Q 2020 Supplemental
6
Plymouth Industrial REIT, Inc. | |||||||
Consolidated Statements of Operations - GAAP (unaudited) | |||||||
(in thousands, except per-share amounts) |
Three Months Ended | |||||||
6/30/2020 | 3/31/2020 | 12/31/19 (1) | 9/30/2019 | 6/30/2019 | |||
Revenues: | |||||||
Rental revenue | $ 20,363 | $ 20,361 | $ 17,271 | $ 14,481 | $ 12,906 | ||
Tenant recoveries | 5,774 | 5,868 | 5,212 | 4,642 | 4,116 | ||
Total revenues | $ 26,137 | $ 26,229 | $ 22,483 | $ 19,123 | $ 17,022 | ||
Operating expenses: | |||||||
Property | 9,026 | 9,011 | 8,021 | 6,920 | 6,034 | ||
Depreciation and amortization | 13,520 | 14,097 | 11,074 | 9,399 | 8,476 | ||
General and administrative | 2,576 | 2,522 | 2,009 | 2,135 | 1,691 | ||
Total operating expenses | $ 25,122 | $ 25,630 | $ 21,104 | $ 18,454 | $ 16,201 | ||
Other income (expense): | |||||||
Interest expense | (4,900) | (4,871) | (3,887) | (3,643) | (3,576) | ||
Change in fair value of warrant derivative | - | - | - | - | (102) | ||
Total other income (expense) | $ (4,900) | $ (4,871) | $ (3,887) | $ (3,643) | $ (3,678) | ||
Net loss | $ (3,885) | $ (4,272) | $ (2,508) | $ (2,974) | $ (2,857) | ||
Less: Loss attributable to noncontrolling interest | (209) | (245) | (177) | (308) | (380) | ||
Net loss attributable to Plymouth Industrial REIT, Inc. | $ (3,676) | $ (4,027) | $ (2,331) | $ (2,666) | $ (2,477) | ||
Less: Preferred stock dividends | 1,613 | 1,613 | 1,565 | 1,566 | 1,566 | ||
Less: Series B preferred stock accretion to redemption value | 1,854 | 1,854 | 1,900 | 1,900 | 1,901 | ||
Less: Amount allocated to participating securities | 30 | 76 | 62 | 62 | 58 | ||
Net loss attributable to common stockholders | $ (7,173) | $ (7,570) | $ (5,858) | $ (6,194) | $ (6,002) | ||
Net loss basic and diluted per share attributable to common stockholders | $ (0.49) | $ (0.53) | $ (0.44) | $ (0.68) | $ (0.88) | ||
Weighted-average common shares outstanding basic & diluted | 14,649 | 14,393 | 13,416 | 9,081 | 6,836 |
(1) Audited consolidated financial statements and notes for the year ended December 31, 2019 are available within our 2019 Annual Report on Form 10-K.
2Q 2020 Supplemental
7
Plymouth Industrial REIT, Inc. | ||||||
Same Store Net Operating Income (NOI) | ||||||
Unaudited (in thousands) |
Trailing five quarter same store NOI - GAAP basis | Three Months Ended | ||||
GAAP Basis | 6/30/2020 | 3/31/2020 | 12/31/2019 | 9/30/2019 | 6/30/2019 |
Same store buildings | 83 | 83 | 83 | 83 | 83 |
Revenues: | |||||
Rental income | $ 12,601 | $ 13,138 | $ 13,062 | $ 13,037 | $ 12,736 |
Tenant recoveries | $ 4,092 | $ 4,298 | $ 4,053 | $ 4,215 | $ 4,179 |
Total operating revenues | $ 16,693 | $ 17,436 | $ 17,115 | $ 17,252 | $ 16,915 |
Property expenses | $ 5,979 | $ 6,022 | $ 6,224 | $ 6,352 | $ 6,017 |
Same store net operating income - GAAP basis | $ 10,714 | $ 11,414 | $ 10,891 | $ 10,900 | $ 10,898 |
Same store net operating income excluding early termination income - GAAP basis | $ 10,695 | $ 10,989 | $ 10,891 | $ 10,900 | $ 10,898 |
Trailing five quarter same store NOI - Cash basis | Three Months Ended | ||||
Cash Basis | 6/30/2020 | 3/31/2020 | 12/31/2019 | 9/30/2019 | 6/30/2019 |
Same store buildings | 83 | 83 | 83 | 83 | 83 |
Revenues: | |||||
Rental income | $ 12,217 | $ 12,563 | $ 12,428 | $ 12,458 | $ 12,173 |
Tenant recoveries | 4,092 | 4,298 | 4,053 | 4,215 | 4,179 |
Total operating revenues | $ 16,309 | $ 16,861 | $ 16,481 | $ 16,673 | $ 16,352 |
Property expenses | $ 5,979 | $ 6,022 | $ 6,224 | $ 6,352 | $ 6,017 |
Same store net operating income - Cash basis | $ 10,330 | $ 10,839 | $ 10,257 | $ 10,321 | $ 10,335 |
Same store net operating income excluding early termination income - Cash basis | $ 10,311 | $ 10,414 | $ 10,257 | $ 10,321 | $ 10,335 |
* Our Same Store Portfolio is a subset of our consolidated portfolio and includes buildings that were wholly-owned by us for the entire period presented. The trailing 5 quarters same store portfolio includes properties owned as of April 1, 2019, and still owned as of June 30, 2020. Therefore, we exclude from our Same Store Portfolio any buildings that were acquired or sold during the period from April 1, 2019 through June 30, 2020. The Company's computation of same store NOI may not be comparable to other REITs.
2Q 2020 Supplemental
8
Plymouth Industrial REIT, Inc. | ||||||
NOI | ||||||
Unaudited (in thousands) |
Three Months Ended | ||||||
6/30/2020 | 3/31/2020 | 12/31/2019 | 9/30/2019 | 6/30/2019 | ||
Net loss | $ (3,885) | $ (4,272) | $ (2,508) | $ (2,974) | $ (2,857) | |
General and administrative | 2,576 | 2,522 | 2,009 | 2,135 | 1,691 | |
Depreciation and amortization | 13,520 | 14,097 | 11,074 | 9,399 | 8,476 | |
Interest expense | 4,900 | 4,871 | 3,887 | 3,643 | 3,576 | |
Change in fair value of warrant derivative | - | - | - | - | 102 | |
Net Operating Income | $ 17,111 | $ 17,218 | $ 14,462 | $ 12,203 | $ 10,988 |
2Q 2020 Supplemental
9
Plymouth Industrial REIT, Inc. | ||||||
Earnings Before Interest, Taxes, Depreciation and Amortization for Real Estate (EBITDAre) | ||||||
Three Months Ended | ||||||
6/30/2020 | 3/31/2020 | 12/31/2019 | 9/30/2019 | 6/30/2019 | ||
Net loss | $ (3,885) | $ (4,272) | $ (2,508) | $ (2,974) | $ (2,857) | |
Depreciation and amortization | 13,520 | 14,097 | 11,074 | 9,399 | 8,476 | |
Interest expense | 4,900 | 4,871 | 3,887 | 3,643 | 3,576 | |
EBITDAre | $ 14,535 | $ 14,696 | $ 12,453 | $ 10,068 | $ 9,195 |
2Q 2020 Supplemental
10
Plymouth Industrial REIT, Inc. | ||||||
Funds from Operations (FFO) & Adjusted Funds from Operations (AFFO) | ||||||
Unaudited (in thousands, except per-share amounts) | ||||||
Three Months Ended | ||||||
6/30/2020 | 3/31/2020 | 12/31/2019 | 9/30/2019 | 6/30/2019 | ||
Net loss | $ (3,885) | $ (4,272) | $ (2,508) | $ (2,974) | $ (2,857) | |
Depreciation and amortization | 13,520 | 14,097 | 11,074 | 9,399 | 8,476 | |
FFO | $ 9,635 | $ 9,825 | $ 8,566 | $ 6,425 | $ 5,619 | |
Preferred stock dividends | (1,613) | (1,613) | (1,565) | (1,566) | (1,566) | |
FFO attributable to common stockholders and unit holders | $ 8,022 | $ 8,212 | $ 7,001 | $ 4,859 | $ 4,053 | |
Amortization of debt related costs | 366 | 299 | 247 | 274 | 273 | |
Non-cash interest expense | (174) | 264 | 34 | 325 | (62) | |
Stock compensation | 383 | 349 | 330 | 282 | 305 | |
Change in fair value of warrant derivative | - | — | — | — | 102 | |
Straight line rent | (443) | (518) | (518) | (298) | (223) | |
Above/below market lease rents | (438) | (548) | (429) | (373) | (344) | |
Recurring capital expenditures (1) | (719) | (1,036) | (921) | (976) | (687) | |
AFFO | $ 6,997 | $ 7,022 | $ 5,744 | $ 4,093 | $ 3,417 | |
Weighted average common shares and units outstanding | 15,675 | 15,453 | 14,599 | 10,287 | 8,037 | |
FFO attributable to common stockholders and unit holders per share | $ 0.51 | $ 0.53 | $ 0.48 | $ 0.47 | $ 0.50 | |
AFFO attributable to common stockholders and unit holders per share | $ 0.45 | $ 0.45 | $ 0.39 | $ 0.40 | $ 0.43 | |
(1) Excludes non-recurring capital expenditures of $401, $1,749, $1,349, $1,542, and $635 for the three months ending June 30, March 31, 2020, December 31, September 30, and June 30, 2019, respectively. |
2Q 2020 Supplemental
11
Plymouth Industrial REIT, Inc. | |||||||
Debt Overview | |||||||
Unaudited ($ in thousands) at 6/30/2020 | |||||||
Debt Instrument - Secured Facility | Maturity | Rate | Rate Type | Buildings Encumbered | Balance | % of Total Debt | |
$100.0 million KeyBank Term Loan (2) | October-20 | 2.44% (1) | Floating | 14 | $ 81,000 | 17.2% | |
$100.0 million line of credit | August-23 | 2.43% (1) | Floating | 34 | $ 70,100 | 14.9% | |
$120.0 million AIG Loan | November-23 | 4.08% | Fixed | 22 | $ 118,352 | 25.1% | |
$78.0 million Transamerica Loan | August-28 | 4.35% | Fixed | 17 | $ 73,593 | 15.6% | |
$63.1 million Allianz Loan | April-26 | 4.07% | Fixed | 20 | $ 63,115 | 13.4% | |
$21.5 million Minnesota Life Loan | May-28 | 3.78% | Fixed | 7 | $ 21,074 | 4.5% | |
$13.9 million Fisher Park Mortgage (3) | January-27 | 5.23% | Fixed | 1 | $ 13,552 | 2.9% | |
$9.6 million South Park Mortgage (3) | January-22 | 3.41% | Fixed | 2 | $ 9,399 | 2.0% | |
$21.0 million Orange Point Mortgage (3) | August-24 | 4.14% | Fixed | 6 | $ 20,536 | 4.4% | |
123 | $ 470,721 | 100% | |||||
Fixed Debt ($ in thousands) at 6/30/2020 | |||||||
Total fixed debt | $ 319,621 | ||||||
Weighted average interest rate of fixed debt | 4.15% | ||||||
Balance Sheet ($ in thousands) at 6/30/2020 | |||||||
Cash | $ 29,246 | ||||||
Gross Assets | $ 887,401 | ||||||
Total Debt | $ 470,721 | ||||||
Net Debt | $ 441,475 | ||||||
(1) Interest rate applicable at June 30, 2020. Borrowings under the Line of Credit Agreement and KeyBank Term Loan bear interest at either (1) the base rate (determined from the highest of (a) KeyBank’s prime rate, (b) the federal funds rate plus 0.50% and (c) the one month LIBOR rate plus 1.0% or (2) LIBOR, plus, in either case, a spread between 100 and 150 basis points for base rate loans or a spread between 200 and 250 basis points for LIBOR rate loans, with the amount of such spread depending on our total leverage ratio. | |||||||
(2) The $100 million KeyBank Term Loan is secured by the equity interests of certain of the Company's wholly-owned special purpose entities. | |||||||
(3) Debt assumed at acquisition. |
2Q 2020 Supplemental
12
Plymouth Industrial REIT, Inc. |
Building Overview - Square Feet & Occupancy | ||||||
Unaudited ($ in thousands) at 6/30/2020 |
Building | Market | Included in Same Store Portfolio | Rentable Square Feet | Leased Square Feet | Occupancy | |
32 Dart Road | Atlanta | Y | 194,800 | 194,800 | 100.0% | |
1665 Dogwood Drive SW | Atlanta | Y | 198,000 | 198,000 | 100.0% | |
1715 Dogwood Drive | Atlanta | Y | 100,000 | 100,000 | 100.0% | |
11236 Harland Drive | Atlanta | Y | 32,361 | 32,361 | 100.0% | |
265 Industrial Boulevard | Savannah | 187,205 | 187,205 | 100.0% | ||
338 Industrial Boulevard | Savannah | 309,084 | 309,084 | 100.0% | ||
430 Industrial Boulevard | Savannah | 47,599 | 47,599 | 100.0% | ||
40 Pinyon Road | Atlanta | 60,148 | 60,108 | 99.9% | ||
6739 New Calhoun Highway NE | Atlanta | 320,000 | 320,000 | 100.0% | ||
Peachtree City - Bldg 1 | Atlanta | 260,593 | 260,195 | 99.8% | ||
Peachtree City - Bldg 2 | Atlanta | 35,100 | 35,101 | 100.0% | ||
Peachtree City II | Atlanta | 117,000 | 116,675 | 99.7% | ||
Subtotal - Atlanta/Savannah | 1,861,890 | 1,861,128 | 100.0% | |||
11351 W. 183rd Street | Chicago | Y | 18,768 | - | 0.0% | |
11601 Central Ave | Chicago | Y | 260,000 | 260,000 | 100.0% | |
11746 Austin Ave | Chicago | 162,714 | 128,757 | 79.1% | ||
13040 South Pulaski Ave | Chicago | Y | 388,403 | 388,403 | 100.0% | |
1355 Holmes Road | Chicago | Y | 82,456 | 82,456 | 100.0% | |
13970 West Laurel Drive | Chicago | Y | 70,196 | 70,196 | 100.0% | |
144 Tower Drive | Chicago | Y | 73,785 | 71,709 | 97.2% | |
1455-1645 Greenleaf Ave | Chicago | Y | 150,000 | 150,000 | 100.0% | |
1600 Fleetwood | Chicago | Y | 247,000 | 247,001 | 100.0% | |
16801 Exchange Ave | Chicago | 455,886 | 455,886 | 100.0% | ||
1717 West Harvester Road | Chicago | 465,940 | 465,940 | 100.0% | ||
1750 South Lincoln Drive | Chicago | Y | 499,200 | 499,200 | 100.0% | |
1796 Sherwin Ave | Chicago | Y | 98,879 | 98,879 | 100.0% | |
1875 Holmes Road | Chicago | Y | 134,415 | 134,415 | 100.0% | |
189-191 Seeger Avenue | Chicago | Y | 25,245 | 25,245 | 100.0% | |
2401-2441 Commerce Drive | Chicago | Y | 78,574 | 78,574 | 100.0% | |
28160 North Keith Drive | Chicago | Y | 77,924 | 77,924 | 100.0% | |
3 West College Drive | Chicago | Y | 33,263 | 33,263 | 100.0% | |
330 Armory Drive | Chicago | 98,340 | - | 0.0% | ||
350 Armory Drive | Chicago | 64,310 | 56,140 | 87.3% | ||
3841-3865 Swanson Court | Chicago | Y | 99,625 | 99,625 | 100.0% | |
3940 Stern Street | Chicago | Y | 146,798 | - | 0.0% | |
440 South McLean Boulevard | Chicago | Y | 74,613 | - | 0.0% | |
4915 West 122nd Street | Chicago | 153,368 | 153,368 | 100.0% | ||
6000 W. 73rd Street | Chicago | Y | 148,091 | 148,091 | 100.0% | |
6510 West 73rd Street | Chicago | Y | 306,552 | 306,552 | 100.0% | |
6558 W. 73rd Street | Chicago | Y | 301,000 | 301,000 | 100.0% | |
6751 Sayre Ave | Chicago | Y | 242,690 | 242,690 | 100.0% | |
7200 South Mason Ave | Chicago | Y | 207,345 | 207,345 | 100.0% | |
7207 Mason Avenue | Chicago | 84,195 | 84,195 | 100.0% | ||
7420 Meade Ave | Chicago | 52,344 | 52,344 | 100.0% | ||
5110 South 6th Street | Milwaukee | Y | 58,500 | 58,500 | 100.0% | |
Subtotal - Chicago | 5,360,419 | 4,977,698 | 92.9% | |||
Mosteller Distribution Center | Cincinnati | Y | 358,386 | 358,386 | 100.0% | |
4115 Thunderbird Lane | Cincinnati | Y | 70,000 | 70,000 | 100.0% | |
Fisher Industrial Park | Cincinnati | Y | 1,123,080 | 1,024,084 | 91.2% | |
Cornell Commerce Center | Cincinnati | 165,521 | 158,722 | 95.9% | ||
Enterprise Business Center 1 | Cincinnati | 85,718 | 54,332 | 63.4% | ||
Enterprise Business Center 2 | Cincinnati | 82,832 | 68,647 | 82.9% | ||
Subtotal - Cincinnati | 1,885,537 | 1,734,171 | 92.0% | |||
1200 Chester Industrial Parkway North | Cleveland | 207,160 | 207,160 | 100.0% | ||
1200 Chester Industrial Parkway South | Cleveland | 90,628 | 90,628 | 100.0% | ||
1350 Moore Road | Cleveland | 109,075 | 103,093 | 94.5% | ||
14801 County Rd. 212 | Cleveland | 405,000 | 405,000 | 100.0% | ||
1755 Enterprise Parkway | Cleveland | Y | 255,570 | 200,135 | 78.3% | |
30339 Diamond Parkway | Cleveland | Y | 400,184 | 400,184 | 100.0% | |
Subtotal - Cleveland | 1,467,617 | 1,406,200 | 95.8% | |||
2120-2138 New World Drive | Columbus | Y | 121,200 | 121,200 | 100.0% | |
3100 Creekside Parkway | Columbus | Y | 340,000 | 291,562 | 85.8% | |
3500 Southwest Blvd | Columbus | Y | 527,127 | 527,127 | 100.0% | |
7001 Americana Parkway | Columbus | Y | 54,100 | 54,100 | 100.0% | |
8273 Green Meadows Drive | Columbus | Y | 77,271 | 77,271 | 100.0% | |
8288 Green Meadows Drive | Columbus | Y | 300,000 | 300,000 | 100.0% | |
Graphics Way | Columbus | 73,426 | 73,427 | 100.0% | ||
Orange Point | Columbus | 143,863 | 143,863 | 100.0% | ||
6900-6918 Fairfield Business Drive | Columbus | 39,558 | 39,558 | 100.0% | ||
Subtotal - Columbus | 1,676,545 | 1,628,108 | 97.1% |
2Q 2020 Supplemental
13
Plymouth Industrial REIT, Inc. |
Building Overview - Square Feet & Occupancy | ||||||
Unaudited ($ in thousands) at 6/30/2020 |
Building | Market | Included in Same Store Portfolio | Rentable Square Feet | Leased Square Feet | Occupancy | |
2900 Shadeland | Indianapolis | 933,439 | 923,156 | 98.9% | ||
3035 North Shadeland Ave | Indianapolis | Y | 562,497 | 510,454 | 90.7% | |
3169 North Shadeland Ave | Indianapolis | Y | 44,374 | 41,960 | 94.6% | |
5861 W Cleveland Road | South Bend | Y | 62,550 | 62,550 | 100.0% | |
West Brick Road #1 | South Bend | Y | 51,200 | 51,200 | 100.0% | |
West Brick Road #2 | South Bend | Y | 50,250 | 50,250 | 100.0% | |
4491 N Mayflower Road | South Bend | Y | 77,000 | 77,000 | 100.0% | |
5855 West Carbonmill Road | South Bend | Y | 198,000 | 198,000 | 100.0% | |
4955 Ameritech Drive | South Bend | Y | 228,000 | 228,001 | 100.0% | |
3333 N. Franklin | Indianapolis | 276,240 | 276,240 | 100.0% | ||
4430 Sam Jones Expressway | Indianapolis | 484,879 | 484,879 | 100.0% | ||
6555 E 30th Street | Indianapolis | 314,775 | 308,700 | 98.1% | ||
6575 E 30th Street | Indianapolis | 60,000 | 60,000 | 100.0% | ||
6585 E 30th Street | Indianapolis | 100,000 | - | 0.0% | ||
6635 E 30th Street | Indianapolis | 99,877 | 99,877 | 100.0% | ||
6701 E 30th Street | Indianapolis | 7,820 | 7,820 | 100.0% | ||
6737 E 30th Street | Indianapolis | 87,500 | 87,500 | 100.0% | ||
6751 E 30th Street | Indianapolis | 100,000 | 74,000 | 74.0% | ||
6951 E 30th Street | Indianapolis | 44,000 | 35,200 | 80.0% | ||
7901 W. 21st Street | Indianapolis | 353,000 | 353,000 | 100.0% | ||
Subtotal - Indianapolis/South Bend | 4,135,401 | 3,929,787 | 95.0% | |||
4801-100 Executive Park Court | Jacksonville | Y | 60,000 | 60,000 | 100.0% | |
4801-200 Executive Park Court | Jacksonville | Y | 40,000 | 40,000 | 100.0% | |
4810 Executive Park Court | Jacksonville | Y | 40,000 | 40,000 | 100.0% | |
4815-100 Executive Park Court | Jacksonville | Y | 39,600 | 39,600 | 100.0% | |
4815-200 Executive Park Court | Jacksonville | Y | 50,000 | 35,000 | 70.0% | |
4820 Executive Park Court | Jacksonville | Y | 60,000 | 60,000 | 100.0% | |
4825 Executive Park Court | Jacksonville | Y | 65,000 | 65,000 | 100.0% | |
6601 Executive Park Court | Jacksonville | Y | 80,000 | 80,000 | 100.0% | |
6602-200 Executive Park Court | Jacksonville | Y | 32,000 | 32,000 | 100.0% | |
6631-100 Executive Park Court | Jacksonville | Y | 27,200 | 27,200 | 100.0% | |
6631-200 Executive Park Court | Jacksonville | Y | 44,000 | 44,000 | 100.0% | |
4901 Belfort Rd | Jacksonville | Y | 78,930 | 78,930 | 100.0% | |
7014 A.C. Skinner Parkway | Jacksonville | Y | 85,380 | 85,380 | 100.0% | |
7016 A.C. Skinner Parkway | Jacksonville | Y | 39,350 | 39,350 | 100.0% | |
7018 A.C. Skinner Parkway | Jacksonville | Y | 92,872 | 79,022 | 85.1% | |
7020 A.C. Skinner Parkway | Jacksonville | Y | 42,184 | 42,186 | 100.0% | |
7022 A.C. Skinner Parkway | Jacksonville | Y | 88,200 | 88,200 | 100.0% | |
7251 Salisbury Road | Jacksonville | Y | 65,280 | 65,280 | 100.0% | |
7255 Salisbury Road | Jacksonville | Y | 57,120 | 57,120 | 100.0% | |
7259 Salisbury Road | Jacksonville | Y | 46,400 | 46,400 | 100.0% | |
Subtotal - Jacksonville | 1,133,516 | 1,104,668 | 97.5% | |||
6005 E. Shelby Drive | Memphis | Y | 54,720 | 54,720 | 100.0% | |
6045 E. Shelby Drive | Memphis | Y | 92,350 | 92,350 | 100.0% | |
6075 E. Shelby Drive | Memphis | Y | 55,233 | 55,233 | 100.0% | |
210 American Dr. | Jackson | Y | 638,400 | 638,400 | 100.0% | |
3635 Knight Road | Memphis | Y | 131,904 | 131,904 | 100.0% | |
2813 Business Park Drive (Bldg I) | Memphis | Y | 35,867 | 35,867 | 100.0% | |
2838 Business Park Drive (Bldg H) | Memphis | Y | 60,000 | 6,868 | 11.4% | |
2842 Business Park Drive (Bldg G) | Memphis | Y | 24,500 | 19,828 | 80.9% | |
2847 Business Park Drive (Bldg J) | Memphis | Y | 33,800 | 33,800 | 100.0% | |
2849 Business Park Drive (Bldg E) | Memphis | Y | 18,619 | 6,500 | 34.9% | |
2872 Business Park Drive (Bldg D) | Memphis | Y | 22,500 | 22,500 | 100.0% | |
2890 Business Park Drive (Bldg C) | Memphis | Y | 22,500 | 12,686 | 56.4% | |
2899 Business Park Drive (Bldg B) | Memphis | Y | 17,220 | 3,740 | 21.7% | |
South Park - 4540 Pleasant Hill Road | Memphis | 261,281 | 261,281 | 100.0% | ||
South Park - 4600 Pleasant Hill Road | Memphis | 305,000 | 305,000 | 100.0% | ||
Subtotal - Memphis/Jackson | 1,773,894 | 1,680,677 | 94.7% | |||
7585 Empire Drive | Florence, KY | Y | 148,415 | 148,415 | 100.0% | |
56 Milliken Road | Portland, ME | Y | 200,625 | 200,625 | 100.0% | |
4 East Stow Road | Marlton, NJ | Y | 156,634 | 156,280 | 99.8% | |
Metro St Louis | St Louis, MO | 59,055 | 59,055 | 100.0% | ||
Phantom Drive | St Louis, MO | 129,000 | 125,318 | 97.1% | ||
Subtotal - Others | 693,729 | 689,693 | 99.4% | |||
Total - All Buildings | 19,988,548 | 19,012,130 | 95.1% |
2Q 2020 Supplemental
14
Plymouth Industrial REIT, Inc. | |||||
Total Acquisition Cost by Geography | |||||
Unaudited ($ in thousands) at 6/30/2020 | |||||
Geography | State | Buildings | Total Acquisition Cost (1) | Gross Real Estate Assets (2) | % Gross Real Estate Assets |
Atlanta/Savannah | GA | 12 | $ 81,201 | $ 72,528 | 9.9% |
Chicago | IL, WI | 32 | 206,235 | 189,386 | 25.7% |
Cincinnati | OH | 6 | 61,310 | 59,667 | 8.1% |
Cleveland | OH | 6 | 74,550 | 69,061 | 9.4% |
Columbus | OH | 9 | 65,572 | 63,930 | 8.7% |
Indianapolis/South Bend | IN | 20 | 131,315 | 116,530 | 15.8% |
Jacksonville | FL | 20 | 97,100 | 86,844 | 11.8% |
Memphis/Jackson | TN | 15 | 53,658 | 48,685 | 6.6% |
Other | Various | 5 | 32,925 | 29,529 | 4.0% |
Total | 125 | $ 803,866 | $ 736,160 | 100% |
2Q 2020 Supplemental
15
Plymouth Industrial REIT, Inc. | ||||||||
Rentable Square Feet and Annualized Base Rent by State | ||||||||
Unaudited at 6/30/2020 | ||||||||
State | Number of Properties | Number of Buildings | Occupancy | Total Rentable Square Feet |
% Rentable Square Feet | Annualized Base Rent (1) | % Annualized Base Rent | Annualized Base Rent Per Square Foot |
Illinois | 31 | 31 | 92.8% | 5,301,919 | 26.5% | $ 20,120,838 | 25.6% | $ 4.09 |
Indiana | 19 | 20 | 95.0% | 4,135,401 | 20.7% | 13,959,470 | 17.7% | 3.55 |
Ohio | 21 | 21 | 95.0% | 5,029,699 | 25.2% | 19,181,870 | 24.5% | 4.01 |
Georgia | 11 | 12 | 100.0% | 1,861,890 | 9.3% | 6,676,145 | 8.5% | 3.59 |
Tennessee | 5 | 15 | 94.7% | 1,773,894 | 8.9% | 6,038,675 | 7.7% | 3.59 |
Florida | 3 | 20 | 97.5% | 1,133,516 | 5.7% | 8,933,800 | 11.4% | 8.09 |
Kentucky | 1 | 1 | 92.6% | 148,415 | 0.7% | 449,434 | 0.6% | 3.27 |
Maine | 1 | 1 | 100.0% | 200,625 | 1.0% | 1,117,760 | 1.4% | 5.57 |
Missouri | 2 | 2 | 98.0% | 188,055 | 0.9% | 824,375 | 1.1% | 4.47 |
New Jersey | 1 | 1 | 99.8% | 156,634 | 0.8% | 915,573 | 1.2% | 5.86 |
Wisconsin | 1 | 1 | 100.0% | 58,500 | 0.3% | 204,750 | 0.3% | 3.50 |
Total | 96 | 125 | 95.1% | 19,988,548 | 100% | $ 78,422,690 | 100% | $ 4.12 |
2Q 2020 Supplemental
16
Plymouth Industrial REIT, Inc. | ||||||||
Rentable Square Feet and Annualized Base Rent by Building Type | ||||||||
Unaudited at 6/30/2020 | ||||||||
Property/Building Type | Number of Properties | Number of Buildings | Occupancy | Total Rentable Square Feet | % Rentable Square Feet | Annualized Base Rent (1) |
% Annualized Base Rent | Annualized Base Rent Per Square Foot |
Warehouse/Distribution | 56 | 60 | 97.7% | 12,439,000 | 62.3% | $ 43,404,198 | 55.4% | $ 3.57 |
Warehouse/Light Manufacturing | 23 | 23 | 90.8% | 4,802,949 | 24.0% | 16,895,933 | 21.5% | 3.87 |
Flex Space (2) | 5 | 29 | 91.6% | 1,447,096 | 7.2% | 11,460,514 | 14.6% | 8.65 |
Light manufacturing/Flex (2) | 12 | 13 | 90.7% | 1,299,503 | 6.5% | 6,662,045 | 8.5% | 5.65 |
Total | 96 | 125 | 95.1% | 19,988,548 | 100% | $ 78,422,690 | 100% | $ 4.12 |
2Q 2020 Supplemental
17
Plymouth Industrial REIT, Inc. | |||||||
Rentable Square Feet and Annualized Base Rent by Tenant Industry | |||||||
Unaudited at 6/30/2020 | |||||||
Industry | Total Rentable Square Feet | Number of Tenants | % Rentable Square Feet | Annualized Base Rent (1) | % Annualized Base Rent | Annualized Base Rent Per Square Foot | |
Logistics and Transportation | 2,889,761 | 44 | 15.2% | $ 12,305,844 | 15.7% | $ 4.26 | |
Industrial Equipment Components | 2,114,828 | 26 | 11.1% | 8,003,336 | 10.2% | 3.78 | |
Light Manufacturing | 1,938,791 | 31 | 10.2% | 7,044,489 | 9.0% | 3.63 | |
Technology and Electronics | 1,670,605 | 24 | 8.8% | 7,254,186 | 9.3% | 4.34 | |
Paper and Printing | 1,356,745 | 9 | 7.1% | 3,840,849 | 4.9% | 2.83 | |
Home Furnishing | 959,456 | 4 | 5.0% | 3,077,375 | 3.9% | 3.21 | |
Automotive | 945,328 | 15 | 5.0% | 3,658,944 | 4.7% | 3.87 | |
Wholesale/Retail | 694,122 | 21 | 3.7% | 2,891,381 | 3.7% | 4.17 | |
Plastics | 625,600 | 5 | 3.3% | 2,145,020 | 2.7% | 3.43 | |
Business Services | 602,046 | 16 | 3.2% | 2,989,913 | 3.8% | 4.97 | |
Other Industries* | 5,214,848 | 156 | 27.4% | 25,211,353 | 32.1% | 4.83 | |
Total | 19,012,130 | 351 | 100% | $ 78,422,690 | 100% | $ 4.12 |
2Q 2020 Supplemental
18
Plymouth Industrial REIT, Inc. | |||||||
Rentable Square Feet and Annualized Base Rent by Tenant Industry | |||||||
Unaudited at 6/30/2020 |
*Other Industries | Total Rentable Square Feet |
Number of Tenants | % Rentable Square Feet | Annualized Base Rent (1) | % Annualized Base Rent | Annualized Base Rent Per Square Foot |
Aero Space | 288,370 | 5 | 1.5% | $ 1,413,404 | 1.8% | $ 4.90 |
Appliances | 155,703 | 1 | 0.8% | 730,948 | 0.9% | 4.69 |
Cardboard and Packaging | 492,843 | 6 | 2.6% | 2,263,158 | 2.9% | 4.59 |
Chemical | 153,444 | 3 | 0.8% | 577,740 | 0.7% | 3.77 |
Construction | 349,421 | 16 | 1.8% | 1,891,568 | 2.4% | 5.41 |
Distribution | 121,070 | 8 | 0.6% | 1,165,038 | 1.5% | 9.62 |
Education | 118,177 | 8 | 0.6% | 1,177,790 | 1.5% | 9.97 |
Entertainment | 85,036 | 5 | 0.5% | 583,570 | 0.7% | 6.86 |
Financial Services | 246,033 | 8 | 1.3% | 1,245,108 | 1.6% | 5.06 |
Fitness/Wellness | 129,086 | 11 | 0.7% | 682,974 | 0.9% | 5.29 |
Garden Supply | 513,780 | 2 | 2.7% | 1,164,880 | 1.5% | 2.27 |
Healthcare | 486,912 | 17 | 2.6% | 2,356,017 | 3.0% | 4.84 |
Metal Fabrication/Finishing | 309,917 | 7 | 1.6% | 1,409,821 | 1.8% | 4.55 |
Food & Beverage | 432,014 | 11 | 2.3% | 2,365,410 | 3.0% | 5.48 |
Spiritual | 111,943 | 7 | 0.6% | 651,621 | 0.8% | 5.82 |
Recreation | 112,641 | 5 | 0.6% | 597,443 | 0.8% | 5.30 |
Other | 1,108,458 | 36 | 5.8% | 4,934,863 | 6.3% | 4.45 |
Total | 5,214,848 | 156 | 27.4% | $ 25,211,353 | 32.1% | $ 4.83 |
(1) Annualized base rent is calculated as monthly contracted base rent per the terms of such lease, as of June 30, 2020, multiplied by 12. Excludes rent abatements.
2Q 2020 Supplemental
19
Plymouth Industrial REIT, Inc. | |||||||||
Top 10 Tenants by Annualized Base Rent | |||||||||
Unaudited at 6/30/2020 |
Tenant | MSA | Industry | Number of Leases | Total Leased Square Feet | Expiration | Annualized Base Rent Per Square Foot | Annualized
Base Rent (1) |
% Total Annualized Base Rent |
Stonecrop Technologies, LLC | Columbus | Technology & Electronics | 1 | 527,127 | 3/31/21 | $ 4.14 | $ 2,180,993 | 2.8% |
Corporate Services, Inc | South Bend | Logistics & Transportation | 3 | 503,000 | 3/31/26 | 3.80 | 1,911,000 | 2.4% |
Balta US, Inc. | Atlanta | Home Furnishing | 2 | 629,084 | 10/31/29 | 2.97 | 1,867,871 | 2.4% |
iQor | Memphis | Technology & Electronics | 2 | 566,281 | 12/31/24 | 3.15 | 1,783,785 | 2.3% |
Pactiv Corporation | Chicago | Industrial Equipment Components | 3 | 439,631 | 8/31/23 | 3.77 | 1,656,590 | 2.1% |
First Logistics | Chicago | Logistics & Transportation | 1 | 327,194 | 10/31/24 | 4.85 | 1,586,891 | 2.0% |
American Plastics, LLC | Cleveland | Plastics | 1 | 405,000 | 12/31/28 | 3.60 | 1,456,218 | 1.9% |
Perseus Distribution - Ingram Publisher Services | Memphis | Paper & Printing | 1 | 638,400 | 5/31/27 | 2.24 | 1,432,570 | 1.8% |
Stamar Packaging, Inc | Chicago | Cardboard and Packaging | 1 | 247,000 | 4/30/27 | 5.15 | 1,271,274 | 1.6% |
Mastin & Cain Properties, LLC | Indianapolis | Business Services | 1 | 360,784 | 6/30/21 | 3.35 | 1,209,065 | 1.5% |
Total Largest Tenants by Annualized Rent | 16 | 4,643,501 | $ 3.52 | $ 16,356,257 | 20.8% | |||
All Other | 335 | 14,368,629 | $ 4.32 | $ 62,066,433 | 79.2% | |||
Total Company Portfolio | 351 | 19,012,130 | $ 4.12 | $ 78,422,690 | 100% |
(1) Annualized base rent is calculated as monthly contracted base rent per the terms of such lease, as of June 30, 2020, multiplied by 12. Excludes rent abatements.
2Q 2020 Supplemental
20
Plymouth Industrial REIT, Inc. | ||||||||
Leasing Activity | ||||||||
Year | Type | Square Footage | Percent | Expiring Rent | New Rent | % Change | Tenant Improvements $/SF/YR | Lease Commissions $/SF/YR |
Q1 2019 | Renewals | 545,684 | 98.6% | $ 3.18 | $ 3.63 | 14.2% | $ 0.16 | $ 0.11 |
New Leases | 8,000 | 1.4% | $ 6.30 | $ 6.50 | 3.2% | $ - | $ 0.40 | |
Total | 553,684 | 100% | $ 3.22 | $ 3.67 | 14.0% | $ 0.16 | $ 0.11 | |
Q2 2019 | Renewals | 252,826 | 44.1% | $ 4.87 | $ 4.95 | 1.6% | $ 0.30 | $ 0.11 |
New Leases | 320,232 | 55.9% | $ 2.64 | $ 3.11 | 17.8% | $ 0.27 | $ 0.17 | |
Total | 573,058 | 100% | $ 3.62 | $ 3.92 | 8.3% | $ 0.28 | $ 0.14 | |
Q3 2019 | Renewals | 293,806 | 51.0% | $ 5.34 | $ 5.32 | -0.4% | $ 0.22 | $ 0.17 |
New Leases | 281,979 | 49.0% | $ 2.22 | $ 3.52 | 58.6% | $ 0.22 | $ 0.29 | |
Total | 575,785 | 100% | $ 3.81 | $ 4.44 | 16.5% | $ 0.22 | $ 0.23 | |
Q4 2019 | Renewals | 288,523 | 43.7% | $ 4.26 | $ 4.95 | 16.2% | $ 0.12 | $ 0.18 |
New Leases | 371,905 | 56.3% | $ 3.51 | $ 3.57 | 1.7% | $ 0.31 | $ 0.22 | |
Total | 660,428 | 100% | $ 3.84 | $ 4.17 | 8.6% | $ 0.22 | $ 0.20 | |
Q1 2020 | Renewals | 105,582 | 26.9% | $ 6.27 | $ 6.42 | 2.4% | $ 0.17 | $ 0.13 |
New Leases | 286,885 | 73.1% | $ 3.63 | $ 4.74 | 30.6% | $ 0.26 | $ 0.21 | |
Total | 392,467 | 100% | $ 4.34 | $ 5.19 | 19.6% | $ 0.24 | $ 0.19 | |
Q2 2020 | Renewals | 1,286,366 | 95.4% | $ 3.29 | $ 3.52 | 7.0% | $ 0.09 | $ 0.08 |
New Leases | 62,494 | 4.6% | $ 4.17 | $ 5.74 | 37.6% | $ 0.34 | $ 0.08 | |
Total | 1,348,860 | 100% | $ 3.33 | $ 3.63 | 9.0% | $ 0.10 | $ 0.08 |
2Q 2020 Supplemental
21
Plymouth Industrial REIT, Inc. | ||||||
Lease Expiration Schedule | ||||||
Unaudited ($ in thousands) at 6/30/2020 | ||||||
Year | Square Footage | Annualized Base Rent (ABR) (1) | % of Annual Base Rent Expiring (2) | |||
Available | 976,418 | $ — | — | |||
2020 | 281,453 | 1,164,558 | 1.5% | |||
2021 | 3,196,961 | 13,986,218 | 17.8% | |||
2022 | 2,889,328 | 13,403,202 | 17.1% | |||
2023 | 2,430,985 | 9,629,115 | 12.3% | |||
2024 | 2,903,609 | 10,538,039 | 13.4% | |||
Thereafter | 7,309,794 | 29,701,558 | 37.9% | |||
Total | 19,988,548 | $ 78,422,690 | 100% |
2Q 2020 Supplemental
22
Plymouth Industrial REIT, Inc. | |||
Glossary | |||
Non-GAAP Financial Measures Definitions: | |||
Net Operating Income (NOI): We consider net operating income, or NOI, to be an appropriate supplemental measure to net income in that it helps both investors and management understand the core operations of our properties. We define NOI as total revenue (including rental revenue, tenant reimbursements and other income) less property-level operating expenses. NOI excludes depreciation and amortization, general and administrative expenses, impairments, gain/loss on sale of real estate, interest expense, and other non-operating items. | |||
Cash Net Operating Income - (Cash NOI): We define Cash NOI as NOI excluding straight-line rent adjustments and amortization of above and below market leases. | |||
EBITDAre: We define earnings before interest, taxes, depreciation and amortization for real estate in accordance with the standards established by the National Association of Real Estate Investment Trusts (“NAREIT”). EBITDAre represents net income (loss), computed in accordance with GAAP, before interest expense, tax, depreciation and amortization, gains or losses on the sale of rental property, and loss on impairments. We believe that EBITDAre is helpful to investors as a supplemental measure of our operating performance as a real estate company as it is a direct measure of the actual operating results of our industrial properties. | |||
Funds From Operations attributable to common stockholders and unit holders (“FFO”): Funds from operations, or FFO, is a non-GAAP financial measure that is widely recognized as a measure of REIT operating performance. We consider FFO to be an appropriate supplemental measure of our operating performance as it is based on a net income analysis of property portfolio performance that excludes non-cash items such as depreciation. The historical accounting convention used for real estate assets requires straight-line depreciation of buildings and improvements, which implies that the value of real estate assets diminishes predictably over time. Since real estate values rise and fall with market conditions, presentations of operating results for a REIT, using historical accounting for depreciation, could be less informative. In December 2018, NAREIT issued a white paper restating the definition of FFO. The purpose of the restatement was not to change the fundamental definition of FFO, but to clarify existing NAREIT guidance. The restated definition of FFO is as follows: Net Income (calculated in accordance with GAAP), excluding: (i) Depreciation and amortization related to real estate, (ii) Gains and losses from the sale of certain real estate assets, (iii) Gain and losses from change in control, and (iv) Impairment write-downs of certain real estate assets and investments in entities when the impairment is directly attributable to decreases in the value of depreciable real estate held by the entity. We define FFO consistent with the NAREIT definition. Adjustments for unconsolidated partnerships and joint ventures will be calculated to reflect FFO on the same basis. Other equity REITs may not calculate FFO as we do, and, accordingly, our FFO may not be comparable to such other REITs’ FFO. FFO should not be used as a measure of our liquidity, and is not indicative of funds available for our cash needs, including our ability to pay dividends. FFO attributable to common stockholders and unit holders represents FFO reduced by dividends paid (or declared) to holders of our preferred stock. | |||
Adjusted Funds From Operations attributable to common stockholders and unit holders (“AFFO” or "Core FFO"): Adjusted funds from operations, or AFFO, is presented in addition to FFO. AFFO is defined as FFO, excluding certain non-cash operating revenues and expenses, acquisition and transaction related costs for transactions not completed and recurring capitalized expenditures. Recurring capitalized expenditures include expenditures required to maintain and re-tenant our properties, tenant improvements and leasing commissions. AFFO further adjusts FFO for certain other non-cash items, including the amortization or accretion of above or below market rents included in revenues, straight line rent adjustments, impairment losses, non-cash equity compensation and non-cash interest expense. We believe AFFO provides a useful supplemental measure of our operating performance because it provides a consistent comparison of our operating performance across time periods that is comparable for each type of real estate investment and is consistent with management’s analysis of the operating performance of our properties. As a result, we believe that the use of AFFO, together with the required GAAP presentations, provide a more complete understanding of our operating performance. As with FFO, our reported AFFO may not be comparable to other REITs’ AFFO, should not be used as a measure of our liquidity, and is not indicative of our funds available for our cash needs, including our ability to pay dividends. | |||
Other Definitions: | |||
GAAP: U.S generally accepted accounting principles. | |||
Gross Assets: the carrying amount of total assets plus accumulated depreciation and amortization, as reported in the Company’s consolidated financial statements. For gross assets as of June 30, 2020 the calculation is as follows: |
6/30/2020 | ||
Total Assets | $764,647 | |
Add back accumulated depreciation | $ 80,452 | |
Add back intangible amortization | $ 42,302 | |
Gross assets | $887,401 |
Non-Recurring Capital Expenditures: Non-recurring capital expenditures include capital expenditures of long lived improvements required to upgrade/replace existing systems or items that previously did not exist. |
Occupancy: We define occupany as the percentage of total leasable square footage as the earlier of lease term commencement or revenue recognition in accordance to GAAP as of the close of the reporting period. |
Recurring Capital Expenditures: Recurring capitalized expenditures includes capital expenditures required to maintain and re-tenant our buildings, tenant improvements and leasing commissions. |
Same Store Portfolio: Our Same Store Portfolio is a subset of our consolidated portfolio and includes buildings that were wholly-owned by us for the entire period presented. The trailing 5 quarters same store portfolio includes properties owned as of April 1, 2019, and still owned as of June 30, 2020. Therefore, we exclude from our Same Store Portfolio any buildings that were acquired or sold during the period from April 1, 2019 through June 30, 2020. The Company's computation of same store NOI may not be comparable to other REITs. |
Weighted average lease term remaining: The average contractual lease term remaining as of the close of the reporting period (in years) weighted by square footage. |
2Q 2020 Supplemental
23
\^$I(^>99\ I>U]=GZ6='_HEE7YMMOP,#J(GG8@
M #:KVP_IIM_YUP?\ =Y@)^4?#9_>_7B:T/G'/R9I+[_F/V%F2
M[>T9]T/;_P!9E#\./#/5MR-6U/>S>X(Y> BO\&_\3YW6?DV89\$<2Q0O2]R
MB2H!4LGR3I\&KAR;&SFQ*ZOA,KD3)TZ0S$AQ([9>)Q^3*D+;889;3Y5*4HDD
M7LF&[:RY1HUKBK&A;PE.M-X1C%.4FWN22Q;;Z$=3C[-UO+4VB+L'")*W5>%I
M$?*Z%Y3JNG7PMI;GJ-:NA>P744XH]*,E/(,]IINI97<4M^-&HL/#C$YY&1X\
MZQZ4W>TSD;PK7Z2BTA+8\#?4EK\\E\V_"CH?4^O0N@8HANQO8SZN5&JJG1P2
MQ]# X:1L77T19-RLZPV,XI!.);D9/2,K-"C,B627)R5&@S(^A^QY Q72B5#)
M,ZJ+BIV=U*./ \
M^$I(^>99\ I>U]=GZ6='_HEE7YMMOP,#J(GG8@ -N/8GNW:/NJ<55M/.LG:6
M>QZ-PVD$LW&;34N \^$I(^>99\
MI>U]=GZ6='_HEE7YMMOP,#J(GG8@ -J79'_6H?DV?MZ7X6!J>[*/[P>F_
MQBX^)W)6B"";ZP )*OJO6R;3'>;NVM:-NO'1;+X^VUK.C)=63!WFO\QQB323
M762+P..QZW);)I"C\J"?41?MA6T?5YE3GB_+A*&'<^OQ\*X,/&>#/G )I8I[FL&MAD .9TP #6IW8>7F3\-^'
M^2YUK&ZJ:K>N<9=@NJ]&1[:OA7+-AG679+ 3.651/;D19I5&%P[6:7G6G&?.
ML-I61^,B.Q_@?L!P ( /K-TQN3W%\;81X?%7<
M9]:0WNBO$9..9CL^>1*+H7@5YF_5/_YM6?P^+_M0
M'O2Z^YU/XK]@>_5/_P";5G\/B_[4![TNON=3^*_8'OU3_P#FU9_#XO\ M0'O
M2Z^YU/XK]@>_5/\ ^;5G\/B_[4![TNON=3^*_8.N9#LO7&(QG9N5[ PG&(;"
M/./2\ARNBI8S+9)\?G'7[*?&:;1X/+U,R+IY11RBM[1.LLASS,JBI9=97=Q5
M;V*G1J3;\"C%L_?!M@X'L_&XF9:US;$MA8A8/SHT#*L'R.GRO')TBLFOUMDQ
M#NZ*9/K)+L"PBN,/)0ZHVW6U(5T41D":DL8M-'#-\ESC3]]+*\^M+FRS."BY
M4:]*=&K%3BI1SR[*+*AP;T2K@RK")51C-,#&+.*:FU-MQ3>JKM
MM\;*'F1SBX^
4Y=GD:NGR8-G<8]A.-65^6/,V<=QN;7L9!:QHL*0^PXW(9B
MONK96ATD**S;TU5K*$O-/MO:,YC9GRGY0YGJW3RIK/(NE1MW**E&%2O5C3ZQ
MQ:X9.G!SG&,DXRG&*DG%M%BUH+A/Q,XM3I5MQ\X_ZSU5>SZ56.6&28OCL=G*
M;*A7+ASW*BSRB6G6U_>2HL6#&F
MY%DUU,DV-B^VPPV]-E.K2VVE1(3QA"-."A'S49O6VLL]Y@ZKOM9:DJ*IG.85
MW4J.*:A'8HPITTW)QI4J<8TZ<7*3C"$4Y-K%^SCF=6 CB^L_?J_->?*CP'X
MNMM"#?\ N*]MZS/5@5Z]=U,C[\\NV7R\[<.74
M>-
KQ
M_K3])_6=NCXJLJ$2R^$+Q^H>L^VQ^[SFWXU8_&Z)8RC-FCT "'MZU[_
M *C@[_WO(7]QIH8W,?J/'ZQLW^;G\_5O@RW_ -Z9U^K)_JY\A^4OLS[#]8B[
M8>X/VS]1'R'M\?KPH?F&U_#71(>$T\3 !'%]9^_5^:\^5'@/Q=;:$
M&_\ <5[;UF>Y.P!^N>]_P_&;,C)=A_]:SQ2_\ 4-I_$CLD0+3X1'Q^HSWQ
MVP/W==1^TM/C]J64XSIHC -)GK"_P"JMWI]=>E?C=PX1;WX._"O
M5/5W8I_>'RC\6OOB=HQ5O[O#VR-L':'FZ?(W5[,_;,3LO7VJ3Z9>L>&/G"LSJ5^9>2Y1B^
MIM\DZQ+N<5>YK1EAX8T88^ D^">> 0 _&1'CRX[\24PU)BRF78\F,
M^VAYB1'>0IMYAYIPE-NM.MJ-*DJ(R41]# Y0G.E-5*;<:D6FFG@TUM33[C3W
M,J7.4.KRTCR3W_IUME;$?5^YMF8%";7UZG78KF5Q35KI&9J,T/P(;:TF9]32
MHAURI'@G*/0VC](/+_4'_=FA,FU.VG/,,KM;B7MJU"$Y+Q2DT_ 30_5=-CS<
MBX:;GUO-?\\C6V_)EA4I-1FJ)3YWAN.32B)2:C)+7OW1SWBZ$753ZAE,OEC2
M<>AFK+YP7(Z5ES1RK/:2P=]DT8S[\[>O5CCX>KJ4X^"*),PGG@D (K?K5'
MY.G%K\->4_8*\,?F'F1\)L/^;O\ TWU#^:J/QA&C[U>/]:?I/ZSMT?%5E0B6
M7PA>/U#UGVV/W>:RP;,\ELLLS*\1
M.754D23KC,ZN&[+36Q)TSPRK2>Q'2:6E$2W2-7A22E$.,TW!I;RQ<_3J]I+\
M^#5/\!SK[414B]7/H8_3J]I+\^#5/\!SK[40'5SZ&=8RKU@#M#8E6/V4OF;A
M]OYIE;K<#%<(VOE%G*6@E&EAB+28%,\#SIIZ)\ZIM!&9=5$7E *G-]PB2]]C
MOW8EW"<"J>+'%[%\MQW0,#+:W,<_SW.(T:FR;:=MCR'CQNBK,7B2[#W@P>HL
MI!V"US'CGV$UF*HV8:(RTRJ%^G3X7B]Y%Q NDO?U0WC_ &V1\H.27)>7 D%C
M&K=.P-4UD]Q*VXLC,=J915WSC<1PR)$N14XUKN04E"3,V$V+!KZ>=;ZD6:[V
M)$_\5(P $6OUM;8$C&^W9JW"(JUH5LCE%AD6P)*S2EVHQ7 MCY$ZRXDO(XCW
MY9@K(C]A2"/_ "49>H^=XBN= DFP7M;\M=;<%^<&G.5&U,&R?8N,:I1G4MK%
M<1D5,:YE7F2Z^RC#*::TY=R(M?YNIEY$4HR4XE1*:(T]3(B,<9Q
JS<*TIM*6#A1C/%K%8>755-+NJ2CQ-Q>QQPQ/D6H>9':+UW;SRCEEI&K
MD,:L&G?YQ6HTYTE)I)PM*;JS4TL7C+K8K';2V;>4YX][G8O(O5\;BUQ;UU!X
MC\2:BF9Q-O"L4DQ68"?E'PV?WOUXFM#YQS\F:
M2^_YC]A9DNWM&?=#V_\ 690_#CPSU; 3N;A4H>:GA[+^CH-O\ R"T_E?9H[.M]S3U93X<_S"VC
M>U(/R9N#7!EMDGABI5'4C*6*QIU+B:FL*6*F^ZEU=A>D=88!I_754BDP76F(
MT.%8K6)-"W(]-CU
7V2$_+_ #)/OGA#YQ*XIRU?
MINU3^VPRVXFUWIUHJ/HNG+T"5J,@:Z@ BM^M4?DZ<6OPUY3]@KPQ^8>9'P
MFP_YN_\ 3?4/YJH_&$:/O5X_UI^D_K.W1\565")9?"%X_4/6?;8_=YS;\:L?
MC=$L91FS1Z !#V]:]_U'!W_ +WD+^XTT,;F/U'C]8V;_-S^?JWP9;_[
MTSK]63(R[<^0&9&1'R6V8:3,C(E%_-#61=4F9=%%U(RZEY.I&7M"[8>X/VS]
M8^0]OAK_ #PH?F&U_#71(>$T\3 !'%]9^_5^:\^5'@/Q=;:$&_P#<
M5[;UF>Y.P!^N>]_P_&;,C)=A_]:SQ2_P#4-I_$CLD0+3X1'Q^HSWQVP/W=
M=1^TM/C]J64XSIHC -)GK"_ZJW>GUUZ5^-W#A%O?@[\*]4]7=BG
M]X?*/Q:^^)UR#/VY< PS:G.WBAKG8F.UV78-F6[L'H
\->"G)[GKM*!JGC5K2VS*S7)B)R7*Y#,FNU[KVJDO);