000151029512/312022Q2FALSEP5Y00015102952022-01-012022-06-3000015102952022-07-29xbrli:shares00015102952022-04-012022-06-30iso4217:USD00015102952021-04-012021-06-3000015102952021-01-012021-06-30iso4217:USDxbrli:shares0001510295us-gaap:AccumulatedDefinedBenefitPlansAdjustmentNetGainLossIncludingPortionAttributableToNoncontrollingInterestMember2022-04-012022-06-300001510295us-gaap:AccumulatedDefinedBenefitPlansAdjustmentNetGainLossIncludingPortionAttributableToNoncontrollingInterestMember2021-04-012021-06-300001510295us-gaap:AccumulatedDefinedBenefitPlansAdjustmentNetGainLossIncludingPortionAttributableToNoncontrollingInterestMember2022-01-012022-06-300001510295us-gaap:AccumulatedDefinedBenefitPlansAdjustmentNetGainLossIncludingPortionAttributableToNoncontrollingInterestMember2021-01-012021-06-300001510295us-gaap:AccumulatedDefinedBenefitPlansAdjustmentNetPriorServiceIncludingPortionAttributableToNoncontrollingInterestMember2022-04-012022-06-300001510295us-gaap:AccumulatedDefinedBenefitPlansAdjustmentNetPriorServiceIncludingPortionAttributableToNoncontrollingInterestMember2021-04-012021-06-300001510295us-gaap:AccumulatedDefinedBenefitPlansAdjustmentNetPriorServiceIncludingPortionAttributableToNoncontrollingInterestMember2022-01-012022-06-300001510295us-gaap:AccumulatedDefinedBenefitPlansAdjustmentNetPriorServiceIncludingPortionAttributableToNoncontrollingInterestMember2021-01-012021-06-300001510295mpc:AccumulatedGainLossOtherMember2022-04-012022-06-300001510295mpc:AccumulatedGainLossOtherMember2021-04-012021-06-300001510295mpc:AccumulatedGainLossOtherMember2022-01-012022-06-300001510295mpc:AccumulatedGainLossOtherMember2021-01-012021-06-3000015102952022-06-3000015102952021-12-3100015102952020-12-3100015102952021-06-300001510295us-gaap:CommonStockMember2021-12-310001510295us-gaap:TreasuryStockMember2021-12-310001510295us-gaap:AdditionalPaidInCapitalMember2021-12-310001510295us-gaap:RetainedEarningsMember2021-12-310001510295us-gaap:AccumulatedOtherComprehensiveIncomeMember2021-12-310001510295us-gaap:NoncontrollingInterestMember2021-12-310001510295mpc:RedeemableNoncontrollingInterestMember2021-12-310001510295us-gaap:RetainedEarningsMember2022-01-012022-03-310001510295us-gaap:NoncontrollingInterestMember2022-01-012022-03-3100015102952022-01-012022-03-310001510295mpc:RedeemableNoncontrollingInterestMember2022-01-012022-03-310001510295us-gaap:AccumulatedOtherComprehensiveIncomeMember2022-01-012022-03-310001510295us-gaap:TreasuryStockMember2022-01-012022-03-310001510295us-gaap:CommonStockMember2022-01-012022-03-310001510295us-gaap:AdditionalPaidInCapitalMember2022-01-012022-03-310001510295us-gaap:CommonStockMember2022-03-310001510295us-gaap:TreasuryStockMember2022-03-310001510295us-gaap:AdditionalPaidInCapitalMember2022-03-310001510295us-gaap:RetainedEarningsMember2022-03-310001510295us-gaap:AccumulatedOtherComprehensiveIncomeMember2022-03-310001510295us-gaap:NoncontrollingInterestMember2022-03-3100015102952022-03-310001510295mpc:RedeemableNoncontrollingInterestMember2022-03-310001510295us-gaap:RetainedEarningsMember2022-04-012022-06-300001510295us-gaap:NoncontrollingInterestMember2022-04-012022-06-300001510295mpc:RedeemableNoncontrollingInterestMember2022-04-012022-06-300001510295us-gaap:AccumulatedOtherComprehensiveIncomeMember2022-04-012022-06-300001510295us-gaap:TreasuryStockMember2022-04-012022-06-300001510295us-gaap:CommonStockMember2022-04-012022-06-300001510295us-gaap:AdditionalPaidInCapitalMember2022-04-012022-06-300001510295us-gaap:CommonStockMember2022-06-300001510295us-gaap:TreasuryStockMember2022-06-300001510295us-gaap:AdditionalPaidInCapitalMember2022-06-300001510295us-gaap:RetainedEarningsMember2022-06-300001510295us-gaap:AccumulatedOtherComprehensiveIncomeMember2022-06-300001510295us-gaap:NoncontrollingInterestMember2022-06-300001510295mpc:RedeemableNoncontrollingInterestMember2022-06-300001510295us-gaap:CommonStockMember2020-12-310001510295us-gaap:TreasuryStockMember2020-12-310001510295us-gaap:AdditionalPaidInCapitalMember2020-12-310001510295us-gaap:RetainedEarningsMember2020-12-310001510295us-gaap:AccumulatedOtherComprehensiveIncomeMember2020-12-310001510295us-gaap:NoncontrollingInterestMember2020-12-310001510295mpc:RedeemableNoncontrollingInterestMember2020-12-310001510295us-gaap:RetainedEarningsMember2021-01-012021-03-310001510295us-gaap:NoncontrollingInterestMember2021-01-012021-03-3100015102952021-01-012021-03-310001510295mpc:RedeemableNoncontrollingInterestMember2021-01-012021-03-310001510295us-gaap:AccumulatedOtherComprehensiveIncomeMember2021-01-012021-03-310001510295us-gaap:CommonStockMember2021-01-012021-03-310001510295us-gaap:TreasuryStockMember2021-01-012021-03-310001510295us-gaap:AdditionalPaidInCapitalMember2021-01-012021-03-310001510295us-gaap:CommonStockMember2021-03-310001510295us-gaap:TreasuryStockMember2021-03-310001510295us-gaap:AdditionalPaidInCapitalMember2021-03-310001510295us-gaap:RetainedEarningsMember2021-03-310001510295us-gaap:AccumulatedOtherComprehensiveIncomeMember2021-03-310001510295us-gaap:NoncontrollingInterestMember2021-03-3100015102952021-03-310001510295mpc:RedeemableNoncontrollingInterestMember2021-03-310001510295us-gaap:RetainedEarningsMember2021-04-012021-06-300001510295us-gaap:NoncontrollingInterestMember2021-04-012021-06-300001510295mpc:RedeemableNoncontrollingInterestMember2021-04-012021-06-300001510295us-gaap:AccumulatedOtherComprehensiveIncomeMember2021-04-012021-06-300001510295us-gaap:TreasuryStockMember2021-04-012021-06-300001510295us-gaap:CommonStockMember2021-04-012021-06-300001510295us-gaap:AdditionalPaidInCapitalMember2021-04-012021-06-300001510295us-gaap:CommonStockMember2021-06-300001510295us-gaap:TreasuryStockMember2021-06-300001510295us-gaap:AdditionalPaidInCapitalMember2021-06-300001510295us-gaap:RetainedEarningsMember2021-06-300001510295us-gaap:AccumulatedOtherComprehensiveIncomeMember2021-06-300001510295us-gaap:NoncontrollingInterestMember2021-06-300001510295mpc:RedeemableNoncontrollingInterestMember2021-06-300001510295us-gaap:FairValueInputsLevel2Memberus-gaap:CommercialPaperMember2022-06-300001510295us-gaap:FairValueInputsLevel2Memberus-gaap:CashAndCashEquivalentsMemberus-gaap:CommercialPaperMember2022-06-300001510295us-gaap:FairValueInputsLevel2Memberus-gaap:ShortTermInvestmentsMemberus-gaap:CommercialPaperMember2022-06-300001510295us-gaap:FairValueInputsLevel2Memberus-gaap:CertificatesOfDepositMember2022-06-300001510295us-gaap:FairValueInputsLevel2Memberus-gaap:CertificatesOfDepositMemberus-gaap:CashAndCashEquivalentsMember2022-06-300001510295us-gaap:FairValueInputsLevel2Memberus-gaap:CertificatesOfDepositMemberus-gaap:ShortTermInvestmentsMember2022-06-300001510295us-gaap:USGovernmentDebtSecuritiesMemberus-gaap:FairValueInputsLevel1Member2022-06-300001510295us-gaap:CashAndCashEquivalentsMemberus-gaap:USGovernmentDebtSecuritiesMemberus-gaap:FairValueInputsLevel1Member2022-06-300001510295us-gaap:ShortTermInvestmentsMemberus-gaap:USGovernmentDebtSecuritiesMemberus-gaap:FairValueInputsLevel1Member2022-06-300001510295us-gaap:CorporateDebtSecuritiesMemberus-gaap:FairValueInputsLevel2Member2022-06-300001510295us-gaap:CorporateDebtSecuritiesMemberus-gaap:FairValueInputsLevel2Memberus-gaap:CashAndCashEquivalentsMember2022-06-300001510295us-gaap:CorporateDebtSecuritiesMemberus-gaap:FairValueInputsLevel2Memberus-gaap:ShortTermInvestmentsMember2022-06-300001510295us-gaap:CashAndCashEquivalentsMember2022-06-300001510295us-gaap:ShortTermInvestmentsMember2022-06-300001510295us-gaap:FairValueInputsLevel2Memberus-gaap:CommercialPaperMember2021-12-310001510295us-gaap:FairValueInputsLevel2Memberus-gaap:CashAndCashEquivalentsMemberus-gaap:CommercialPaperMember2021-12-310001510295us-gaap:FairValueInputsLevel2Memberus-gaap:ShortTermInvestmentsMemberus-gaap:CommercialPaperMember2021-12-310001510295us-gaap:FairValueInputsLevel2Memberus-gaap:CertificatesOfDepositMember2021-12-310001510295us-gaap:FairValueInputsLevel2Memberus-gaap:CertificatesOfDepositMemberus-gaap:CashAndCashEquivalentsMember2021-12-310001510295us-gaap:FairValueInputsLevel2Memberus-gaap:CertificatesOfDepositMemberus-gaap:ShortTermInvestmentsMember2021-12-310001510295us-gaap:USGovernmentDebtSecuritiesMemberus-gaap:FairValueInputsLevel1Member2021-12-310001510295us-gaap:CashAndCashEquivalentsMemberus-gaap:USGovernmentDebtSecuritiesMemberus-gaap:FairValueInputsLevel1Member2021-12-310001510295us-gaap:ShortTermInvestmentsMemberus-gaap:USGovernmentDebtSecuritiesMemberus-gaap:FairValueInputsLevel1Member2021-12-310001510295us-gaap:CorporateDebtSecuritiesMemberus-gaap:FairValueInputsLevel2Member2021-12-310001510295us-gaap:CorporateDebtSecuritiesMemberus-gaap:FairValueInputsLevel2Memberus-gaap:CashAndCashEquivalentsMember2021-12-310001510295us-gaap:CorporateDebtSecuritiesMemberus-gaap:FairValueInputsLevel2Memberus-gaap:ShortTermInvestmentsMember2021-12-310001510295us-gaap:CashAndCashEquivalentsMember2021-12-310001510295us-gaap:ShortTermInvestmentsMember2021-12-310001510295mpc:SpeedwayMemberus-gaap:DiscontinuedOperationsDisposedOfBySaleMember2021-05-142021-05-140001510295us-gaap:DiscontinuedOperationsDisposedOfBySaleMember2021-04-012021-06-300001510295us-gaap:DiscontinuedOperationsDisposedOfBySaleMember2021-01-012021-06-300001510295mpc:MarathonPetroleumCorporationMembermpc:MPLXLPMember2022-06-30xbrli:pure0001510295srt:SubsidiariesMember2020-11-020001510295srt:SubsidiariesMember2022-01-012022-06-300001510295srt:SubsidiariesMember2022-04-012022-06-300001510295srt:SubsidiariesMember2021-04-012021-06-300001510295srt:SubsidiariesMember2021-01-012021-06-300001510295srt:SubsidiariesMember2022-06-300001510295us-gaap:AdditionalPaidInCapitalMember2022-01-012022-06-300001510295us-gaap:AdditionalPaidInCapitalMember2021-01-012021-06-300001510295us-gaap:VariableInterestEntityPrimaryBeneficiaryMembermpc:MPLXLPMember2022-06-300001510295us-gaap:VariableInterestEntityPrimaryBeneficiaryMembermpc:MPLXLPMember2021-12-310001510295us-gaap:StockCompensationPlanMember2022-04-012022-06-300001510295us-gaap:StockCompensationPlanMember2021-04-012021-06-300001510295us-gaap:StockCompensationPlanMember2022-01-012022-06-300001510295us-gaap:StockCompensationPlanMember2021-01-012021-06-300001510295mpc:ShareRepurchaseAuthorizationFebruary2022Member2022-02-02mpc:Segment0001510295us-gaap:OperatingSegmentsMembermpc:RefiningAndMarketingMember2022-04-012022-06-300001510295us-gaap:OperatingSegmentsMembermpc:RefiningAndMarketingMember2021-04-012021-06-300001510295us-gaap:OperatingSegmentsMembermpc:RefiningAndMarketingMember2022-01-012022-06-300001510295us-gaap:OperatingSegmentsMembermpc:RefiningAndMarketingMember2021-01-012021-06-300001510295mpc:MidstreamMemberus-gaap:OperatingSegmentsMember2022-04-012022-06-300001510295mpc:MidstreamMemberus-gaap:OperatingSegmentsMember2021-04-012021-06-300001510295mpc:MidstreamMemberus-gaap:OperatingSegmentsMember2022-01-012022-06-300001510295mpc:MidstreamMemberus-gaap:OperatingSegmentsMember2021-01-012021-06-300001510295us-gaap:OperatingSegmentsMember2022-04-012022-06-300001510295us-gaap:OperatingSegmentsMember2021-04-012021-06-300001510295us-gaap:OperatingSegmentsMember2022-01-012022-06-300001510295us-gaap:OperatingSegmentsMember2021-01-012021-06-300001510295us-gaap:CorporateNonSegmentMember2022-04-012022-06-300001510295us-gaap:CorporateNonSegmentMember2021-04-012021-06-300001510295us-gaap:CorporateNonSegmentMember2022-01-012022-06-300001510295us-gaap:CorporateNonSegmentMember2021-01-012021-06-300001510295mpc:RefiningAndMarketingMember2022-04-012022-06-300001510295mpc:RefiningAndMarketingMember2021-04-012021-06-300001510295mpc:RefiningAndMarketingMember2022-01-012022-06-300001510295mpc:RefiningAndMarketingMember2021-01-012021-06-300001510295us-gaap:IntersegmentEliminationMembermpc:RefiningAndMarketingMember2022-04-012022-06-300001510295us-gaap:IntersegmentEliminationMembermpc:RefiningAndMarketingMember2021-04-012021-06-300001510295us-gaap:IntersegmentEliminationMembermpc:RefiningAndMarketingMember2022-01-012022-06-300001510295us-gaap:IntersegmentEliminationMembermpc:RefiningAndMarketingMember2021-01-012021-06-300001510295mpc:MidstreamMember2022-04-012022-06-300001510295mpc:MidstreamMember2021-04-012021-06-300001510295mpc:MidstreamMember2022-01-012022-06-300001510295mpc:MidstreamMember2021-01-012021-06-300001510295mpc:MidstreamMemberus-gaap:IntersegmentEliminationMember2022-04-012022-06-300001510295mpc:MidstreamMemberus-gaap:IntersegmentEliminationMember2021-04-012021-06-300001510295mpc:MidstreamMemberus-gaap:IntersegmentEliminationMember2022-01-012022-06-300001510295mpc:MidstreamMemberus-gaap:IntersegmentEliminationMember2021-01-012021-06-300001510295us-gaap:IntersegmentEliminationMember2022-04-012022-06-300001510295us-gaap:IntersegmentEliminationMember2021-04-012021-06-300001510295us-gaap:IntersegmentEliminationMember2022-01-012022-06-300001510295us-gaap:IntersegmentEliminationMember2021-01-012021-06-300001510295mpc:WatsonCogenerationCompanyMember2022-06-010001510295mpc:WatsonCogenerationCompanyMember2022-06-012022-06-010001510295us-gaap:OperatingSegmentsMembermpc:RefiningAndMarketingMember2022-06-300001510295us-gaap:OperatingSegmentsMembermpc:RefiningAndMarketingMember2021-12-310001510295mpc:MidstreamMemberus-gaap:OperatingSegmentsMember2022-06-300001510295mpc:MidstreamMemberus-gaap:OperatingSegmentsMember2021-12-310001510295us-gaap:CorporateNonSegmentMember2022-06-300001510295us-gaap:CorporateNonSegmentMember2021-12-310001510295us-gaap:FairValueMeasurementsRecurringMemberus-gaap:CommodityContractMemberus-gaap:FairValueInputsLevel1Member2022-06-300001510295us-gaap:FairValueInputsLevel2Memberus-gaap:FairValueMeasurementsRecurringMemberus-gaap:CommodityContractMember2022-06-300001510295us-gaap:FairValueInputsLevel3Memberus-gaap:FairValueMeasurementsRecurringMemberus-gaap:CommodityContractMember2022-06-300001510295us-gaap:FairValueMeasurementsRecurringMemberus-gaap:CommodityContractMember2022-06-300001510295us-gaap:FairValueMeasurementsRecurringMemberus-gaap:EmbeddedDerivativeFinancialInstrumentsMemberus-gaap:FairValueInputsLevel1Member2022-06-300001510295us-gaap:FairValueInputsLevel2Memberus-gaap:FairValueMeasurementsRecurringMemberus-gaap:EmbeddedDerivativeFinancialInstrumentsMember2022-06-300001510295us-gaap:FairValueInputsLevel3Memberus-gaap:FairValueMeasurementsRecurringMemberus-gaap:EmbeddedDerivativeFinancialInstrumentsMember2022-06-300001510295us-gaap:FairValueMeasurementsRecurringMemberus-gaap:EmbeddedDerivativeFinancialInstrumentsMember2022-06-300001510295us-gaap:FairValueMeasurementsRecurringMemberus-gaap:CommodityContractMemberus-gaap:FairValueInputsLevel1Member2021-12-310001510295us-gaap:FairValueInputsLevel2Memberus-gaap:FairValueMeasurementsRecurringMemberus-gaap:CommodityContractMember2021-12-310001510295us-gaap:FairValueInputsLevel3Memberus-gaap:FairValueMeasurementsRecurringMemberus-gaap:CommodityContractMember2021-12-310001510295us-gaap:FairValueMeasurementsRecurringMemberus-gaap:CommodityContractMember2021-12-310001510295us-gaap:FairValueMeasurementsRecurringMemberus-gaap:EmbeddedDerivativeFinancialInstrumentsMemberus-gaap:FairValueInputsLevel1Member2021-12-310001510295us-gaap:FairValueInputsLevel2Memberus-gaap:FairValueMeasurementsRecurringMemberus-gaap:EmbeddedDerivativeFinancialInstrumentsMember2021-12-310001510295us-gaap:FairValueInputsLevel3Memberus-gaap:FairValueMeasurementsRecurringMemberus-gaap:EmbeddedDerivativeFinancialInstrumentsMember2021-12-310001510295us-gaap:FairValueMeasurementsRecurringMemberus-gaap:EmbeddedDerivativeFinancialInstrumentsMember2021-12-310001510295us-gaap:FairValueInputsLevel3Memberus-gaap:CommodityContractMembersrt:MinimumMember2022-06-300001510295us-gaap:FairValueInputsLevel3Memberus-gaap:CommodityContractMembersrt:MaximumMember2022-06-300001510295us-gaap:FairValueInputsLevel3Member2022-06-30iso4217:USDutr:gal0001510295us-gaap:FairValueInputsLevel3Memberus-gaap:EmbeddedDerivativeFinancialInstrumentsMember2022-01-012022-06-300001510295us-gaap:EmbeddedDerivativeFinancialInstrumentsMember2022-01-012022-06-300001510295us-gaap:CarryingReportedAmountFairValueDisclosureMember2022-06-300001510295us-gaap:EstimateOfFairValueFairValueDisclosureMember2022-06-300001510295us-gaap:CarryingReportedAmountFairValueDisclosureMember2021-12-310001510295us-gaap:EstimateOfFairValueFairValueDisclosureMember2021-12-310001510295us-gaap:OtherCurrentAssetsMemberus-gaap:CommodityContractMember2022-06-300001510295us-gaap:OtherCurrentAssetsMemberus-gaap:CommodityContractMember2021-12-310001510295us-gaap:OtherCurrentLiabilitiesMemberus-gaap:CommodityContractMember2022-06-300001510295us-gaap:OtherCurrentLiabilitiesMemberus-gaap:CommodityContractMember2021-12-310001510295us-gaap:CommodityContractMemberus-gaap:OtherNoncurrentLiabilitiesMember2022-06-300001510295us-gaap:CommodityContractMemberus-gaap:OtherNoncurrentLiabilitiesMember2021-12-310001510295srt:CrudeOilMemberus-gaap:ExchangeTradedMember2022-01-012022-06-300001510295srt:CrudeOilMemberus-gaap:ExchangeTradedMemberus-gaap:LongMember2022-06-30utr:bbl0001510295srt:CrudeOilMemberus-gaap:ExchangeTradedMemberus-gaap:ShortMember2022-06-30utr:gal0001510295us-gaap:ExchangeTradedMembersrt:FuelMember2022-01-012022-06-300001510295us-gaap:ExchangeTradedMemberus-gaap:LongMembersrt:FuelMember2022-06-300001510295us-gaap:ExchangeTradedMemberus-gaap:ShortMembersrt:FuelMember2022-06-300001510295us-gaap:ExchangeTradedMembermpc:BlendingproductsMember2022-01-012022-06-300001510295us-gaap:ExchangeTradedMembermpc:BlendingproductsMemberus-gaap:LongMember2022-06-300001510295us-gaap:ExchangeTradedMembermpc:BlendingproductsMemberus-gaap:ShortMember2022-06-300001510295mpc:SoybeanOilMemberus-gaap:ExchangeTradedMember2022-01-012022-06-300001510295mpc:SoybeanOilMemberus-gaap:ExchangeTradedMemberus-gaap:LongMember2022-06-300001510295mpc:SoybeanOilMemberus-gaap:ExchangeTradedMemberus-gaap:ShortMember2022-06-300001510295srt:CrudeOilMemberus-gaap:ExchangeTradedMemberus-gaap:LongMemberus-gaap:OtherContractMember2022-06-300001510295srt:CrudeOilMemberus-gaap:ExchangeTradedMemberus-gaap:ShortMemberus-gaap:OtherContractMember2022-06-300001510295us-gaap:ExchangeTradedMemberus-gaap:LongMemberus-gaap:OtherContractMembersrt:FuelMember2022-06-300001510295us-gaap:ExchangeTradedMemberus-gaap:ShortMemberus-gaap:OtherContractMembersrt:FuelMember2022-06-300001510295us-gaap:SalesMemberus-gaap:CommodityContractMember2022-04-012022-06-300001510295us-gaap:SalesMemberus-gaap:CommodityContractMember2021-04-012021-06-300001510295us-gaap:SalesMemberus-gaap:CommodityContractMember2022-01-012022-06-300001510295us-gaap:SalesMemberus-gaap:CommodityContractMember2021-01-012021-06-300001510295us-gaap:CostOfSalesMemberus-gaap:CommodityContractMember2022-04-012022-06-300001510295us-gaap:CostOfSalesMemberus-gaap:CommodityContractMember2021-04-012021-06-300001510295us-gaap:CostOfSalesMemberus-gaap:CommodityContractMember2022-01-012022-06-300001510295us-gaap:CostOfSalesMemberus-gaap:CommodityContractMember2021-01-012021-06-300001510295us-gaap:OtherIncomeMemberus-gaap:CommodityContractMember2022-04-012022-06-300001510295us-gaap:OtherIncomeMemberus-gaap:CommodityContractMember2021-04-012021-06-300001510295us-gaap:OtherIncomeMemberus-gaap:CommodityContractMember2022-01-012022-06-300001510295us-gaap:OtherIncomeMemberus-gaap:CommodityContractMember2021-01-012021-06-300001510295us-gaap:CommodityContractMember2022-04-012022-06-300001510295us-gaap:CommodityContractMember2021-04-012021-06-300001510295us-gaap:CommodityContractMember2022-01-012022-06-300001510295us-gaap:CommodityContractMember2021-01-012021-06-300001510295srt:ParentCompanyMemberus-gaap:SeniorNotesMember2022-06-300001510295srt:ParentCompanyMemberus-gaap:SeniorNotesMember2021-12-310001510295srt:ParentCompanyMemberus-gaap:NotesPayableOtherPayablesMember2022-06-300001510295srt:ParentCompanyMemberus-gaap:NotesPayableOtherPayablesMember2021-12-310001510295srt:ParentCompanyMember2022-06-300001510295srt:ParentCompanyMember2021-12-310001510295us-gaap:LineOfCreditMembersrt:SubsidiariesMember2022-06-300001510295us-gaap:LineOfCreditMembersrt:SubsidiariesMember2021-12-310001510295srt:SubsidiariesMemberus-gaap:SeniorNotesMember2022-06-300001510295srt:SubsidiariesMemberus-gaap:SeniorNotesMember2021-12-310001510295srt:SubsidiariesMember2021-12-310001510295srt:SubsidiariesMembermpc:SeniorNotesDueMarch2052Memberus-gaap:SeniorNotesMember2022-03-140001510295mpc:MPCRevolvingCreditFacilityDueOctober2023Member2022-06-300001510295mpc:TradeReceivablesSecuritizationDueSeptember2022Member2022-06-300001510295srt:SubsidiariesMembermpc:MPLXRevolvingCreditFacilitydueJuly2024Member2022-06-300001510295mpc:PurchaseCrudeOilFromStrategicPetroleumReserveMembermpc:TradeReceivablesSecuritizationDueSeptember2022Member2022-06-300001510295mpc:MPCRevolvingCreditFacilityDueJuly2027Memberus-gaap:SubsequentEventMember2022-07-070001510295srt:ParentCompanyMembermpc:MPCRevolvingCreditFacilityDueJuly2027Memberus-gaap:SubsequentEventMember2022-07-072022-07-070001510295mpc:MPLXRevolvingCreditFacilityDueJuly2027Membersrt:SubsidiariesMemberus-gaap:SubsequentEventMember2022-07-070001510295mpc:MPLXRevolvingCreditFacilityDueJuly2027Membersrt:SubsidiariesMemberus-gaap:SubsequentEventMemberus-gaap:LetterOfCreditMember2022-07-070001510295mpc:MPLXRevolvingCreditFacilityDueJuly2027Membersrt:SubsidiariesMemberus-gaap:SubsequentEventMember2022-07-072022-07-070001510295mpc:RefinedProductsMembermpc:RefiningAndMarketingMember2022-04-012022-06-300001510295mpc:RefinedProductsMembermpc:RefiningAndMarketingMember2021-04-012021-06-300001510295mpc:RefinedProductsMembermpc:RefiningAndMarketingMember2022-01-012022-06-300001510295mpc:RefinedProductsMembermpc:RefiningAndMarketingMember2021-01-012021-06-300001510295srt:CrudeOilMembermpc:RefiningAndMarketingMember2022-04-012022-06-300001510295srt:CrudeOilMembermpc:RefiningAndMarketingMember2021-04-012021-06-300001510295srt:CrudeOilMembermpc:RefiningAndMarketingMember2022-01-012022-06-300001510295srt:CrudeOilMembermpc:RefiningAndMarketingMember2021-01-012021-06-300001510295mpc:ServicesAndOtherMembermpc:RefiningAndMarketingMember2022-04-012022-06-300001510295mpc:ServicesAndOtherMembermpc:RefiningAndMarketingMember2021-04-012021-06-300001510295mpc:ServicesAndOtherMembermpc:RefiningAndMarketingMember2022-01-012022-06-300001510295mpc:ServicesAndOtherMembermpc:RefiningAndMarketingMember2021-01-012021-06-300001510295mpc:MidstreamMembermpc:RefinedProductsMember2022-04-012022-06-300001510295mpc:MidstreamMembermpc:RefinedProductsMember2021-04-012021-06-300001510295mpc:MidstreamMembermpc:RefinedProductsMember2022-01-012022-06-300001510295mpc:MidstreamMembermpc:RefinedProductsMember2021-01-012021-06-300001510295mpc:MidstreamMembermpc:ServicesAndOtherMember2022-04-012022-06-300001510295mpc:MidstreamMembermpc:ServicesAndOtherMember2021-04-012021-06-300001510295mpc:MidstreamMembermpc:ServicesAndOtherMember2022-01-012022-06-300001510295mpc:MidstreamMembermpc:ServicesAndOtherMember2021-01-012021-06-300001510295us-gaap:PensionPlansDefinedBenefitMemberus-gaap:AccumulatedDefinedBenefitPlansAdjustmentMember2020-12-310001510295us-gaap:AccumulatedDefinedBenefitPlansAdjustmentMemberus-gaap:OtherPostretirementBenefitPlansDefinedBenefitMember2020-12-310001510295mpc:AccumulatedGainLossNetOtherMember2020-12-310001510295us-gaap:PensionPlansDefinedBenefitMemberus-gaap:AccumulatedDefinedBenefitPlansAdjustmentMember2021-01-012021-06-300001510295us-gaap:AccumulatedDefinedBenefitPlansAdjustmentMemberus-gaap:OtherPostretirementBenefitPlansDefinedBenefitMember2021-01-012021-06-300001510295mpc:AccumulatedGainLossNetOtherMember2021-01-012021-06-300001510295us-gaap:PensionPlansDefinedBenefitMemberus-gaap:AccumulatedDefinedBenefitPlansAdjustmentMember2021-06-300001510295us-gaap:AccumulatedDefinedBenefitPlansAdjustmentMemberus-gaap:OtherPostretirementBenefitPlansDefinedBenefitMember2021-06-300001510295mpc:AccumulatedGainLossNetOtherMember2021-06-300001510295us-gaap:PensionPlansDefinedBenefitMemberus-gaap:AccumulatedDefinedBenefitPlansAdjustmentMember2021-12-310001510295us-gaap:AccumulatedDefinedBenefitPlansAdjustmentMemberus-gaap:OtherPostretirementBenefitPlansDefinedBenefitMember2021-12-310001510295mpc:AccumulatedGainLossNetOtherMember2021-12-310001510295us-gaap:PensionPlansDefinedBenefitMemberus-gaap:AccumulatedDefinedBenefitPlansAdjustmentMember2022-01-012022-06-300001510295us-gaap:AccumulatedDefinedBenefitPlansAdjustmentMemberus-gaap:OtherPostretirementBenefitPlansDefinedBenefitMember2022-01-012022-06-300001510295mpc:AccumulatedGainLossNetOtherMember2022-01-012022-06-300001510295us-gaap:PensionPlansDefinedBenefitMemberus-gaap:AccumulatedDefinedBenefitPlansAdjustmentMember2022-06-300001510295us-gaap:AccumulatedDefinedBenefitPlansAdjustmentMemberus-gaap:OtherPostretirementBenefitPlansDefinedBenefitMember2022-06-300001510295mpc:AccumulatedGainLossNetOtherMember2022-06-300001510295us-gaap:PensionPlansDefinedBenefitMember2022-04-012022-06-300001510295us-gaap:PensionPlansDefinedBenefitMember2021-04-012021-06-300001510295us-gaap:PensionPlansDefinedBenefitMember2022-01-012022-06-300001510295us-gaap:PensionPlansDefinedBenefitMember2021-01-012021-06-300001510295us-gaap:OtherPostretirementBenefitPlansDefinedBenefitMember2022-04-012022-06-300001510295us-gaap:OtherPostretirementBenefitPlansDefinedBenefitMember2021-04-012021-06-300001510295us-gaap:OtherPostretirementBenefitPlansDefinedBenefitMember2022-01-012022-06-300001510295us-gaap:OtherPostretirementBenefitPlansDefinedBenefitMember2021-01-012021-06-300001510295us-gaap:OtherPensionPlansDefinedBenefitMember2022-01-012022-06-300001510295us-gaap:PendingLitigationMember2022-01-012022-06-3000015102952020-07-012020-07-3100015102952020-12-152020-12-150001510295us-gaap:GuaranteeOfIndebtednessOfOthersMemberus-gaap:FinancialGuaranteeMembermpc:LoopAndLocapLlcMember2022-06-300001510295mpc:BakkenPipelineSystemMember2022-06-300001510295mpc:BakkenPipelineSystemMemberus-gaap:GuaranteeOfIndebtednessOfOthersMemberus-gaap:FinancialGuaranteeMember2022-06-300001510295mpc:CrowleyOceanPartnersLLCMember2022-06-300001510295us-gaap:GuaranteeOfIndebtednessOfOthersMemberus-gaap:FinancialGuaranteeMembermpc:CrowleyOceanPartnersLLCMember2022-06-300001510295mpc:CrowleyBlueWaterPartnersLLCMember2022-06-300001510295us-gaap:GuaranteeOfIndebtednessOfOthersMemberus-gaap:FinancialGuaranteeMembermpc:CrowleyBlueWaterPartnersLLCMember2022-06-300001510295us-gaap:GuaranteeTypeOtherMember2022-06-300001510295mpc:ShareRepurchaseAuthorizationAugust2022Memberus-gaap:SubsequentEventMember2022-08-020001510295mpc:ShareRepurchaseAuthorizationAugust2022Membersrt:SubsidiariesMemberus-gaap:SubsequentEventMember2022-08-02
UNITED STATES
SECURITIES AND EXCHANGE COMMISSION
Washington, D.C. 20549
FORM 10-Q
(Mark One)
| | | | | |
| ☒ | QUARTERLY REPORT PURSUANT TO SECTION 13 OR 15(d) OF THE SECURITIES EXCHANGE ACT OF 1934 |
For the quarterly period ended June 30, 2022
OR
| | | | | |
| ☐ | TRANSITION REPORT PURSUANT TO SECTION 13 OR 15(d) OF THE SECURITIES EXCHANGE ACT OF 1934 |
For the transition period from to
Commission file number 001-35054
Marathon Petroleum Corporation
(Exact name of registrant as specified in its charter)
| | | | | | | | |
| Delaware | | 27-1284632 |
| (State or other jurisdiction of incorporation or organization) | | (I.R.S. Employer Identification No.) |
| | |
539 South Main Street, Findlay, Ohio 45840-3229
(Address of principal executive offices) (Zip code)
(419) 422-2121
(Registrant’s telephone number, including area code)
| | | | | | | | |
| Securities registered pursuant to Section 12(b) of the Act |
| Title of each class | Trading Symbol(s) | Name of each exchange on which registered |
| Common Stock, par value $.01 | MPC | New York Stock Exchange |
Indicate by check mark whether the registrant (1) has filed all reports required to be filed by Section 13 or 15(d) of the Securities Exchange Act of 1934 during the preceding 12 months (or for such shorter period that the registrant was required to file such reports), and (2) has been subject to such filing requirements for the past 90 days. Yes ☑ No ☐
Indicate by check mark whether the registrant has submitted electronically every Interactive Data File required to be submitted pursuant to Rule 405 of Regulation S-T (§232.405 of this chapter) during the preceding 12 months (or for such shorter period that the registrant was required to submit such files.) Yes ☑ No ☐
Indicate by check mark whether the registrant is a large accelerated filer, an accelerated filer, a non-accelerated filer, a smaller reporting company, or an emerging growth company. See the definitions of “large accelerated filer,” “accelerated filer,” “smaller reporting company,” and “emerging growth company” in Rule 12b-2 of the Exchange Act.
Large Accelerated Filer ☑ Accelerated Filer ☐ Non-accelerated Filer ☐ Smaller reporting company ☐
Emerging growth company ☐
If an emerging growth company, indicate by check mark if the registrant has elected not to use the extended transition period for complying with any new or revised financial accounting standards provided pursuant to Section 13(a) of the Exchange Act ☐
Indicate by check mark whether the registrant is a shell company (as defined in Rule 12b-2 of the Exchange Act) Yes ☐ No ☑
There were 498,624,055 shares of Marathon Petroleum Corporation common stock outstanding as of July 29, 2022.
MARATHON PETROLEUM CORPORATION
FORM 10-Q
FOR THE QUARTERLY PERIOD ENDED JUNE 30, 2022
TABLE OF CONTENTS
Unless otherwise stated or the context otherwise indicates, all references in this Form 10-Q to “MPC,” “us,” “our,” “we” or “the Company” mean Marathon Petroleum Corporation and its consolidated subsidiaries.
GLOSSARY OF TERMS
Throughout this report, the following company or industry specific terms and abbreviations are used:
| | | | | |
| ANS | Alaska North Slope crude oil, an oil index benchmark price |
| ASU | Accounting Standards Update |
| barrel | One stock tank barrel, or 42 U.S. gallons liquid volume, used in reference to crude oil or other liquid hydrocarbons |
| CARB | California Air Resources Board |
| CARBOB | California Reformulated Gasoline Blendstock for Oxygenate Blending |
| CBOB | Conventional Blending for Oxygenate Blending |
| EBITDA | Earnings Before Interest, Tax, Depreciation and Amortization (a non-GAAP financial measure) |
| EPA | U.S. Environmental Protection Agency |
| GAAP | Accounting principles generally accepted in the United States |
| LCM | Lower of cost or market |
| LIFO | Last in, first out, an inventory costing method |
| mbpd | Thousand barrels per day |
| MEH | Magellan East Houston crude oil, an oil index benchmark price |
| MMBtu | One million British thermal units, an energy measurement |
| NGL | Natural gas liquids, such as ethane, propane, butanes and natural gasoline |
| NYMEX | New York Mercantile Exchange |
| PP&E | Property, plant and equipment |
| RFS2 | Revised Renewable Fuel Standard program, as required by the Energy Independence and Security Act of 2007 |
| RIN | Renewable Identification Number |
| SEC | U.S. Securities and Exchange Commission |
| SOFR | Secured overnight financing rate |
| ULSD | Ultra-low sulfur diesel |
| USGC | U.S. Gulf Coast |
| VIE | Variable interest entity |
| WTI | West Texas Intermediate crude oil, an oil index benchmark price |
PART I – FINANCIAL INFORMATION
ITEM 1. FINANCIAL STATEMENTS
MARATHON PETROLEUM CORPORATION
CONSOLIDATED STATEMENTS OF INCOME (Unaudited)
| | | | | | | | | | | | | | | | | | | | | | | |
| Three Months Ended
June 30, | | Six Months Ended
June 30, |
| (In millions, except per share data) | 2022 | | 2021 | | 2022 | | 2021 |
| Revenues and other income: | | | | | | | |
| Sales and other operating revenues | $ | 53,795 | | | $ | 29,615 | | | $ | 91,853 | | | $ | 52,326 | |
| Income from equity method investments | 147 | | | 93 | | | 289 | | | 184 | |
| Net gain on disposal of assets | 39 | | | — | | | 21 | | | 3 | |
| Other income | 257 | | | 119 | | | 459 | | | 196 | |
| Total revenues and other income | 54,238 | | | 29,827 | | | 92,622 | | | 52,709 | |
| | | | | | | |
| Costs and expenses: | | | | | | | |
| Cost of revenues (excludes items below) | 44,207 | | | 27,177 | | | 79,275 | | | 48,261 | |
| Depreciation and amortization | 819 | | | 871 | | | 1,624 | | | 1,715 | |
| Selling, general and administrative expenses | 694 | | | 625 | | | 1,297 | | | 1,200 | |
| Other taxes | 190 | | | 189 | | | 382 | | | 351 | |
| Total costs and expenses | 45,910 | | | 28,862 | | | 82,578 | | | 51,527 | |
| | | | | | | |
| Income from continuing operations | 8,328 | | | 965 | | | 10,044 | | | 1,182 | |
| Net interest and other financial costs | 312 | | | 372 | | | 574 | | | 725 | |
| Income from continuing operations before income taxes | 8,016 | | | 593 | | | 9,470 | | | 457 | |
| Provision for income taxes on continuing operations | 1,799 | | | 5 | | | 2,081 | | | 39 | |
| Income from continuing operations, net of tax | 6,217 | | | 588 | | | 7,389 | | | 418 | |
| Income from discontinued operations, net of tax | — | | | 8,214 | | | — | | | 8,448 | |
| Net income | 6,217 | | | 8,802 | | | 7,389 | | | 8,866 | |
| Less net income attributable to: | | | | | | | |
| Redeemable noncontrolling interest | 21 | | | 21 | | | 42 | | | 41 | |
| Noncontrolling interests | 323 | | | 269 | | | 629 | | | 555 | |
| Net income attributable to MPC | $ | 5,873 | | | $ | 8,512 | | | $ | 6,718 | | | $ | 8,270 | |
| | | | | | | |
Per share data (See Note 8) | | | | | | | |
| Basic: | | | | | | | |
| Continuing operations | $ | 11.03 | | | $ | 0.46 | | | $ | 12.24 | | | $ | (0.27) | |
| Discontinued operations | — | | | 12.63 | | | — | | | 12.98 | |
| Net income per share | $ | 11.03 | | | $ | 13.09 | | | $ | 12.24 | | | $ | 12.71 | |
| | | | | | | |
| Weighted average shares outstanding | 532 | | | 650 | | | 549 | | | 651 | |
| | | | | | | |
| Diluted: | | | | | | | |
| Continuing operations | $ | 10.95 | | | $ | 0.45 | | | $ | 12.15 | | | $ | (0.27) | |
| Discontinued operations | — | | | 12.55 | | | — | | | 12.98 | |
| Net income per share | $ | 10.95 | | | $ | 13.00 | | | $ | 12.15 | | | $ | 12.71 | |
| | | | | | | |
| Weighted average shares outstanding | 536 | | | 654 | | | 553 | | | 651 | |
The accompanying notes are an integral part of these consolidated financial statements.
MARATHON PETROLEUM CORPORATION
CONSOLIDATED STATEMENTS OF COMPREHENSIVE INCOME (Unaudited)
| | | | | | | | | | | | | | | | | | | | | | | |
| Three Months Ended
June 30, | | Six Months Ended
June 30, |
| (Millions of dollars) | 2022 | | 2021 | | 2022 | | 2021 |
| Net income | $ | 6,217 | | | $ | 8,802 | | | $ | 7,389 | | | $ | 8,866 | |
| Defined benefit plans: | | | | | | | |
Actuarial changes, net of tax of $7, $61, $11 and $64, respectively | 21 | | | 183 | | | 33 | | | 192 | |
Prior service, net of tax of $(4), $(2), $(8) and $(5), respectively | (12) | | | (8) | | | (25) | | | (16) | |
Other, net of tax of $—, $(2), $(2) and $(2), respectively | — | | | (4) | | | (6) | | | (4) | |
| Other comprehensive income | 9 | | | 171 | | | 2 | | | 172 | |
| Comprehensive income | 6,226 | | | 8,973 | | | 7,391 | | | 9,038 | |
| Less comprehensive income attributable to: | | | | | | | |
| Redeemable noncontrolling interest | 21 | | | 21 | | | 42 | | | 41 | |
| Noncontrolling interests | 323 | | | 269 | | | 629 | | | 555 | |
| Comprehensive income attributable to MPC | $ | 5,882 | | | $ | 8,683 | | | $ | 6,720 | | | $ | 8,442 | |
The accompanying notes are an integral part of these consolidated financial statements.
MARATHON PETROLEUM CORPORATION
CONSOLIDATED BALANCE SHEETS (Unaudited)
| | | | | | | | | | | |
| (Millions of dollars, except share data) | June 30,
2022 | | December 31,
2021 |
| Assets | | | |
| Cash and cash equivalents | $ | 9,078 | | | $ | 5,291 | |
| Short-term investments | 4,241 | | | 5,548 | |
Receivables, less allowance for doubtful accounts of $39 and $40, respectively | 17,305 | | | 11,034 | |
| Inventories | 11,048 | | | 8,055 | |
| Other current assets | 741 | | | 568 | |
| | | |
| Total current assets | 42,413 | | | 30,496 | |
| Equity method investments | 5,508 | | | 5,409 | |
| Property, plant and equipment, net | 37,062 | | | 37,440 | |
| Goodwill | 8,244 | | | 8,256 | |
| Right of use assets | 1,276 | | | 1,372 | |
| Other noncurrent assets | 2,234 | | | 2,400 | |
| Total assets | $ | 96,737 | | | $ | 85,373 | |
| | | |
| Liabilities | | | |
| Accounts payable | $ | 22,502 | | | $ | 13,700 | |
| Payroll and benefits payable | 619 | | | 911 | |
| Accrued taxes | 2,584 | | | 1,231 | |
| Debt due within one year | 1,087 | | | 571 | |
| Operating lease liabilities | 391 | | | 438 | |
| Other current liabilities | 1,254 | | | 1,047 | |
| | | |
| Total current liabilities | 28,437 | | | 17,898 | |
| Long-term debt | 25,687 | | | 24,968 | |
| Deferred income taxes | 5,542 | | | 5,638 | |
| Defined benefit postretirement plan obligations | 1,133 | | | 1,015 | |
| Long-term operating lease liabilities | 879 | | | 927 | |
| Deferred credits and other liabilities | 1,390 | | | 1,346 | |
| Total liabilities | 63,068 | | | 51,792 | |
| | | |
Commitments and contingencies (see Note 23) | | | |
| Redeemable noncontrolling interest | 965 | | | 965 | |
| | | |
| Equity | | | |
Preferred stock, no shares issued and outstanding (par value $0.01 per share, 30 million shares authorized) | — | | | — | |
| Common stock: | | | |
Issued – 989 million and 984 million shares (par value $0.01 per share, 2 billion shares authorized) | 10 | | | 10 | |
Held in treasury, at cost – 476 million and 405 million shares | (26,000) | | | (19,904) | |
| Additional paid-in capital | 33,378 | | | 33,262 | |
| Retained earnings | 18,983 | | | 12,905 | |
| Accumulated other comprehensive loss | (65) | | | (67) | |
| Total MPC stockholders’ equity | 26,306 | | | 26,206 | |
| Noncontrolling interests | 6,398 | | | 6,410 | |
| Total equity | 32,704 | | | 32,616 | |
| Total liabilities, redeemable noncontrolling interest and equity | $ | 96,737 | | | $ | 85,373 | |
The accompanying notes are an integral part of these consolidated financial statements.
MARATHON PETROLEUM CORPORATION
CONSOLIDATED STATEMENTS OF CASH FLOWS (Unaudited)
| | | | | | | | | | | |
| | Six Months Ended
June 30, |
| (Millions of dollars) | 2022 | | 2021 |
| Operating activities: | | | |
| Net income | $ | 7,389 | | | $ | 8,866 | |
| Adjustments to reconcile net income to net cash provided by operating activities: | | | |
| Amortization of deferred financing costs and debt discount | 33 | | | 41 | |
| Depreciation and amortization | 1,624 | | | 1,715 | |
| Pension and other postretirement benefits, net | 117 | | | (34) | |
| Deferred income taxes | (92) | | | (49) | |
| Net gain on disposal of assets | (21) | | | (3) | |
| Income from equity method investments | (289) | | | (184) | |
| Distributions from equity method investments | 336 | | | 303 | |
| Income from discontinued operations | — | | | (8,448) | |
| Changes in income tax receivable | 11 | | | 20 | |
| Changes in the fair value of derivative instruments | (169) | | | (1) | |
| Changes in: | | | |
| Current receivables | (6,282) | | | (3,947) | |
| Inventories | (2,979) | | | (880) | |
| Current accounts payable and accrued liabilities | 10,106 | | | 4,477 | |
| Right of use assets and operating lease liabilities, net | 2 | | | 4 | |
| All other, net | (277) | | | (79) | |
| Cash provided by operating activities - continuing operations | 9,509 | | | 1,801 | |
| Cash provided by (used in) operating activities - discontinued operations | (44) | | | 33 | |
| Net cash provided by operating activities | 9,465 | | | 1,834 | |
| | | |
| Investing activities: | | | |
| Additions to property, plant and equipment | (993) | | | (606) | |
| Acquisitions, net of cash acquired | (74) | | | — | |
| Disposal of assets | 72 | | | 81 | |
| Investments – acquisitions and contributions | (160) | | | (113) | |
| – redemptions, repayments and return of capital | — | | | 3 | |
| Purchases of short-term investments | (2,581) | | | (5,417) | |
| Sales of short-term investments | 1,075 | | | — | |
| Maturities of short-term investments | 2,811 | | | — | |
| All other, net | 470 | | | 220 | |
| Cash provided by (used in) investing activities - continuing operations | 620 | | | (5,832) | |
| Cash provided by investing activities - discontinued operations | — | | | 21,235 | |
| Net cash provided by investing activities | 620 | | | 15,403 | |
| | | |
| Financing activities: | | | |
| Commercial paper – issued | — | | | 7,414 | |
| – repayments | — | | | (8,437) | |
| Long-term debt – borrowings | 2,385 | | | 10,775 | |
| – repayments | (1,237) | | | (13,056) | |
| Debt issuance costs | (16) | | | — | |
| Issuance of common stock | 167 | | | 53 | |
| Common stock repurchased | (6,177) | | | (984) | |
| | | | | | | | | | | |
| | Six Months Ended
June 30, |
| (Millions of dollars) | 2022 | | 2021 |
| Dividends paid | (643) | | | (760) | |
| Distributions to noncontrolling interests | (599) | | | (613) | |
| | | |
| Repurchases of noncontrolling interests | (135) | | | (310) | |
| All other, net | (41) | | | (36) | |
| Net cash used in financing activities | (6,296) | | | (5,954) | |
| | | |
| Net change in cash, cash equivalents and restricted cash | $ | 3,789 | | | $ | 11,283 | |
| | | |
Cash, cash equivalents and restricted cash balances:(a) | | | |
| Continuing operations - beginning of period | $ | 5,294 | | | $ | 416 | |
| Discontinued operations - beginning of period | — | | | 140 | |
| Less: Discontinued operations - end of period | — | | | — | |
| Continuing operations - end of period | $ | 9,083 | | | $ | 11,839 | |
| | | |
(a)Restricted cash is included in other current assets on our consolidated balance sheets.
The accompanying notes are an integral part of these consolidated financial statements.
MARATHON PETROLEUM CORPORATION
CONSOLIDATED STATEMENTS OF EQUITY AND REDEEMBALE NONCONTROLLING INTEREST
(Unaudited)
| | | | | | | | | | | | | | | | | | | | | | | | | | | | | | | | | | | | | | | | | | | | | | | | | | | | | | | | | | | | | | |
| | MPC Stockholders’ Equity | | | | | | | |
| Common Stock | | Treasury Stock | | Additional Paid-in Capital | | Retained Earnings | | Accumulated Other Comprehensive Income (Loss) | | Non-controlling Interests | | Total Equity | | | Redeemable Non-controlling Interest |
(Shares in millions;
amounts in millions of dollars) | Shares | | Amount | | Shares | | Amount | | | | | | | |
| Balance as of December 31, 2021 | 984 | | | $ | 10 | | | (405) | | | $ | (19,904) | | | $ | 33,262 | | | $ | 12,905 | | | $ | (67) | | | $ | 6,410 | | | $ | 32,616 | | | | $ | 965 | |
| Net income | — | | | — | | | — | | | — | | | — | | | 845 | | | — | | | 306 | | | 1,151 | | | | 21 | |
Dividends declared on common stock ($0.58 per share) | — | | | — | | | — | | | — | | | — | | | (330) | | | — | | | — | | | (330) | | | | — | |
| Distributions to noncontrolling interests | — | | | — | | | — | | | — | | | — | | | — | | | — | | | (290) | | | (290) | | | | (21) | |
| Other comprehensive loss | — | | | — | | | — | | | — | | | — | | | — | | | (7) | | | — | | | (7) | | | | — | |
| Shares repurchased | — | | | — | | | (37) | | | (2,807) | | | — | | | — | | | — | | | — | | | (2,807) | | | | — | |
| Stock-based compensation | 3 | | | — | | | — | | | — | | | 90 | | | — | | | — | | | (1) | | | 89 | | | | — | |
| Equity transactions of MPLX | — | | | — | | | — | | | — | | | (25) | | | — | | | — | | | (63) | | | (88) | | | | — | |
| | | | | | | | | | | | | | | | | | | | |
| Balance as of March 31, 2022 | 987 | | | $ | 10 | | | (442) | | | $ | (22,711) | | | $ | 33,327 | | | $ | 13,420 | | | $ | (74) | | | $ | 6,362 | | | $ | 30,334 | | | | $ | 965 | |
| Net income | — | | | — | | | — | | | — | | | — | | | 5,873 | | | — | | | 323 | | | 6,196 | | | | 21 | |
Dividends declared on common stock ($0.58 per share) | — | | | — | | | — | | | — | | | — | | | (310) | | | — | | | — | | | (310) | | | | — | |
| Distributions to noncontrolling interests | — | | | — | | | — | | | — | | | — | | | — | | | — | | | (267) | | | (267) | | | | (21) | |
| Other comprehensive income | — | | | — | | | — | | | — | | | — | | | — | | | 9 | | | — | | | 9 | | | | — | |
| Shares repurchased | — | | | — | | | (34) | | | (3,285) | | | — | | | — | | | — | | | — | | | (3,285) | | | | — | |
| Stock-based compensation | 2 | | | — | | | — | | | (4) | | | 71 | | | — | | | — | | | 2 | | | 69 | | | | — | |
| Equity transactions of MPLX | — | | | — | | | — | | | — | | | (20) | | | — | | | — | | | (22) | | | (42) | | | | — | |
| | | | | | | | | | | | | | | | | | | | |
| Balance as of June 30, 2022 | 989 | | | $ | 10 | | | (476) | | | $ | (26,000) | | | $ | 33,378 | | | $ | 18,983 | | | $ | (65) | | | $ | 6,398 | | | $ | 32,704 | | | | $ | 965 | |
| | | | | | | | | | | | | | | | | | | | |
| | | | | | | | | | | | | | | | | | | | |
| | | | | | | | | | | | | | | | | | | | |
| | | | | | | | | | | | | | | | | | | | |
| | | | | | | | | | | | | | | | | | | | |
| | | | | | | | | | | | | | | | | | | | |
| | | | | | | | | | | | | | | | | | | | |
| | | | | | | | | | | | | | | | | | | | |
| | | | | | | | | | | | | | | | | | | | |
| | | | | | | | | | | | | | | | | | | | |
| | | | | | | | | | | | | | | | | | | | | | | | | | | | | | | | | | | | | | | | | | | | | | | | | | | | | | | | | | | | | | |
| | MPC Stockholders’ Equity | | | | | | | |
| Common Stock | | Treasury Stock | | Additional Paid-in Capital | | Retained Earnings | | Accumulated Other Comprehensive Income (Loss) | | Non-controlling Interests | | Total Equity | | | Redeemable Non-controlling Interest |
(Shares in millions;
amounts in millions of dollars) | Shares | | Amount | | Shares | | Amount | | | | | | | |
| Balance as of December 31, 2020 | 980 | | | $ | 10 | | | (329) | | | $ | (15,157) | | | $ | 33,208 | | | $ | 4,650 | | | $ | (512) | | | $ | 7,053 | | | $ | 29,252 | | | | $ | 968 | |
| Net income (loss) | — | | | — | | | — | | | — | | | — | | | (242) | | | — | | | 286 | | | 44 | | | | 20 | |
Dividends declared on common stock ($0.58 per share) | — | | | — | | | — | | | — | | | — | | | (379) | | | — | | | — | | | (379) | | | | — | |
| Distributions to noncontrolling interests | — | | | — | | | — | | | — | | | — | | | — | | | — | | | (300) | | | (300) | | | | (20) | |
| | | | | | | | | | | | | | | | | | | | |
| Other comprehensive income | — | | | — | | | — | | | — | | | — | | | — | | | 1 | | | — | | | 1 | | | | — | |
| | | | | | | | | | | | | | | | | | | | |
| Stock-based compensation | 1 | | | — | | | — | | | (1) | | | 18 | | | — | | | — | | | — | | | 17 | | | | — | |
| Equity transactions of MPLX | — | | | — | | | — | | | — | | | (4) | | | — | | | — | | | (120) | | | (124) | | | | — | |
| | | | | | | | | | | | | | | | | | | | |
| Balance as of March 31, 2021 | 981 | | | $ | 10 | | | (329) | | | $ | (15,158) | | | $ | 33,222 | | | $ | 4,029 | | | $ | (511) | | | $ | 6,919 | | | $ | 28,511 | | | | $ | 968 | |
| Net income | — | | | — | | | — | | | — | | | — | | | 8,512 | | | — | | | 269 | | | 8,781 | | | | 21 | |
Dividends declared on common stock ($0.58 per share) | — | | | — | | | — | | | — | | | — | | | (381) | | | — | | | — | | | (381) | | | | — | |
| Distributions to noncontrolling interests | — | | | — | | | — | | | — | | | — | | | — | | | — | | | (272) | | | (272) | | | | (21) | |
| Other comprehensive income | — | | | — | | | — | | | — | | | — | | | — | | | 171 | | | — | | | 171 | | | | — | |
| Shares repurchased | — | | | — | | | (16) | | | (984) | | | — | | | — | | | — | | | — | | | (984) | | | | — | |
| Stock-based compensation | 2 | | | — | | | — | | | (5) | | | 50 | | | — | | | — | | | 2 | | | 47 | | | | — | |
| Equity transactions of MPLX | — | | | — | | | — | | | — | | | (34) | | | — | | | — | | | (114) | | | (148) | | | | — | |
| | | | | | | | | | | | | | | | | | | | |
| Balance as of June 30, 2021 | 983 | | | $ | 10 | | | (345) | | | $ | (16,147) | | | $ | 33,238 | | | $ | 12,160 | | | $ | (340) | | | $ | 6,804 | | | $ | 35,725 | | | | $ | 968 | |
| | | | | | | | | | | | | | | | | | | | |
| | | | | | | | | | | | | | | | | | | | |
| | | | | | | | | | | | | | | | | | | | |
| | | | | | | | | | | | | | | | | | | | |
| | | | | | | | | | | | | | | | | | | | |
| | | | | | | | | | | | | | | | | | | | |
| | | | | | | | | | | | | | | | | | | | |
| | | | | | | | | | | | | | | | | | | | |
| | | | | | | | | | | | | | | | | | | | |
The accompanying notes are an integral part of these consolidated financial statements.
NOTES TO CONSOLIDATED FINANCIAL STATEMENTS (UNAUDITED)
1. DESCRIPTION OF THE BUSINESS AND BASIS OF PRESENTATION
Description of the Business
We are a leading, integrated, downstream energy company headquartered in Findlay, Ohio. We operate the nation's largest refining system. We sell refined products to wholesale marketing customers domestically and internationally, to buyers on the spot market and to independent entrepreneurs who operate branded outlets. We also sell transportation fuel to consumers through direct dealer locations under long-term supply contracts. MPC’s midstream operations are primarily conducted through MPLX LP (“MPLX”), which owns and operates crude oil and light product transportation and logistics infrastructure as well as gathering, processing and fractionation assets. We own the general partner and a majority limited partner interest in MPLX. See Note 5.
Basis of Presentation
All significant intercompany transactions and accounts have been eliminated.
These interim consolidated financial statements are unaudited; however, in the opinion of our management, these statements reflect all adjustments necessary for a fair statement of the results for the periods reported. All such adjustments are of a normal, recurring nature unless otherwise disclosed. These interim consolidated financial statements, including the notes, have been prepared in accordance with the rules of the SEC applicable to interim period financial statements and do not include all of the information and disclosures required by GAAP for complete financial statements. Certain information and disclosures derived from our audited annual financial statements, prepared in accordance with GAAP, have been condensed or omitted from these interim financial statements.
These interim consolidated financial statements should be read in conjunction with the audited consolidated financial statements and notes thereto included in our Annual Report on Form 10-K for the year ended December 31, 2021. The results of operations for the three and six months ended June 30, 2022 are not necessarily indicative of the results to be expected for the full year.
2. ACCOUNTING STANDARDS
Recently Adopted
ASU 2021-10, Government Assistance (Topic 832): Disclosures by Business Entities about Government Assistance
In November 2021, the FASB issued guidance requiring disclosures for certain types of government assistance that have been accounted for by analogy to grant or contribution models. Disclosures will include information about the type of transactions, accounting and the impact on financial statements. We prospectively adopted this standard in the first quarter of 2022. The adoption of this standard did not have a material impact on our financial statements or disclosures.
3. SHORT-TERM INVESTMENTS
Investments Components
The components of investments were as follows:
| | | | | | | | | | | | | | | | | | | | | | | | | | | | | | | | | | | | | | | | | | | | |
| | June 30, 2022 |
| (In millions) | | Fair Value Level | | Amortized Cost | | Unrealized Gains | | Unrealized Losses | | Fair Value | | Cash and Cash Equivalents | | Short-term Investments |
| Available-for-sale debt securities | | | | | | | | | | | | | | |
| Commercial paper | | Level 2 | | $ | 3,300 | | | $ | — | | | $ | (6) | | | $ | 3,294 | | | $ | 583 | | | $ | 2,711 | |
| Certificates of deposit and time deposits | | Level 2 | | 5,313 | | | — | | | (4) | | | 5,309 | | | 3,830 | | | 1,479 | |
| U.S. government securities | | Level 1 | | 23 | | | — | | | — | | | 23 | | | — | | | 23 | |
| Corporate notes and bonds | | Level 2 | | 28 | | | — | | | — | | | 28 | | | — | | | 28 | |
| Total available-for-sale debt securities | | | | $ | 8,664 | | | $ | — | | | $ | (10) | | | $ | 8,654 | | | $ | 4,413 | | | $ | 4,241 | |
| Cash | | | | | | | | | | 4,665 | | | 4,665 | | | — | |
| Total | | | | | | | | | | $ | 13,319 | | | $ | 9,078 | | | $ | 4,241 | |
| | | | | | | | | | | | | | | | | | | | | | | | | | | | | | | | | | | | | | | | | | | | |
| | December 31, 2021 |
| (In millions) | | Fair Value Level | | Amortized Cost | | Unrealized Gains | | Unrealized Losses | | Fair Value | | Cash and Cash Equivalents | | Short-term Investments |
| Available-for-sale debt securities | | | | | | | | | | | | | | |
| Commercial paper | | Level 2 | | $ | 4,905 | | | $ | — | | | $ | (1) | | | $ | 4,904 | | | $ | 868 | | | $ | 4,036 | |
| Certificates of deposit and time deposits | | Level 2 | | 2,024 | | | — | | | — | | | 2,024 | | | 750 | | | 1,274 | |
| U.S. government securities | | Level 1 | | 28 | | | — | | | — | | | 28 | | | — | | | 28 | |
| Corporate notes and bonds | | Level 2 | | 271 | | | — | | | — | | | 271 | | | 61 | | | 210 | |
| Total available-for-sale debt securities | | | | $ | 7,228 | | | $ | — | | | $ | (1) | | | $ | 7,227 | | | $ | 1,679 | | | $ | 5,548 | |
| Cash | | | | | | | | | | 3,612 | | | 3,612 | | | — | |
| Total | | | | | | | | | | $ | 10,839 | | | $ | 5,291 | | | $ | 5,548 | |
Our investment policy includes concentration limits and credit rating requirements which limits our investments to high quality, short term and highly liquid securities.
Unrealized losses on debt investments held from May 14, 2021, which coincides with the sale of Speedway, to June 30, 2022 were not material. Realized gains/losses were not material. All of our available-for-sale debt securities held as of June 30, 2022 mature within one year or less or are readily available for use.
4. DISCONTINUED OPERATIONS
On May 14, 2021, we completed the sale of Speedway, our company-owned and operated retail transportation fuel and convenience store business, to 7-Eleven for cash proceeds of approximately $21.38 billion. After-tax proceeds were approximately $17.22 billion. This transaction resulted in a pretax gain of $11.68 billion ($8.02 billion after income taxes) after deducting the book value of the net assets and certain other adjustments.
The proceeds and related Speedway sale gain may be adjusted in future periods based on provisions of the purchase and sale agreement that allow for adjustments of working capital amounts and other miscellaneous items subsequent to the transaction closing date of May 14, 2021.
Results of operations for Speedway are reflected through the close of the sale. The following table presents Speedway results and the gain on sale as reported in income from discontinued operations, net of tax, within our consolidated statements of income.
| | | | | | | | | | | | | | | |
| | | Three Months Ended | | | | Six Months Ended |
| (In millions) | | | June 30, 2021 |
| Revenues, other income and net gain on disposal of assets: | | | | | | | |
| Revenues and other income | | | $ | 3,081 | | | | | $ | 8,420 | |
| Net gain on disposal of assets | | | 11,682 | | | | | 11,682 | |
| Total revenues, other income and net gain on disposal of assets | | | 14,763 | | | | | 20,102 | |
| | | | | | | |
| Costs and expenses: | | | | | | | |
| Cost of revenues (excludes items below) | | | 2,748 | | | | | 7,654 | |
| Depreciation and amortization | | | 1 | | | | | 3 | |
| Selling, general and administrative expenses | | | 48 | | | | | 121 | |
| Other taxes | | | 24 | | | | | 75 | |
| Total costs and expenses | | | 2,821 | | | | | 7,853 | |
| | | | | | | |
| Income from operations | | | 11,942 | | | | | 12,249 | |
| Net interest and other financial costs | | | 2 | | | | | 6 | |
| Income before income taxes | | | 11,940 | | | | | 12,243 | |
| Provision for income taxes | | | 3,726 | | | | | 3,795 | |
| Income from discontinued operations, net of tax | | | $ | 8,214 | | | | | $ | 8,448 | |
| | | | | | | |
Fuel Supply Agreements
During the second quarter of 2021, we entered into various 15-year fuel supply agreements through which we continue to supply fuel to Speedway.
5. MASTER LIMITED PARTNERSHIP
We own the general partner and a majority limited partner interest in MPLX, which owns and operates crude oil and light product transportation and logistics infrastructure as well as gathering, processing and fractionation assets. We control MPLX through our ownership of the general partner interest. As of June 30, 2022, we owned approximately 64 percent of the outstanding MPLX common units.
Unit Repurchase Program
On November 2, 2020, MPLX announced the board authorization of a unit repurchase program for the repurchase of up to $1.0 billion of MPLX’s outstanding common units held by the public.
Total unit repurchases were as follows for the respective periods:
| | | | | | | | | | | | | | | | | | | | | | | |
| Three Months Ended
June 30, | | Six Months Ended
June 30, |
| (In millions, except per share data) | 2022 | | 2021 | | 2022 | | 2021 |
| Number of common units repurchased | 1 | | | 6 | | | 4 | | | 12 | |
| Cash paid for common units repurchased | $ | 35 | | | $ | 155 | | | $ | 135 | | | $ | 310 | |
| Average cost per unit | $ | 33.74 | | | $ | 27.40 | | | $ | 32.48 | | | $ | 26.02 | |
As of June 30, 2022, MPLX had $202 million remaining under its unit repurchase authorization.
Agreements
We have various long-term, fee-based commercial agreements with MPLX. Under these agreements, MPLX provides transportation, storage, distribution and marketing services to us. With certain exceptions, these agreements generally contain minimum volume commitments. These transactions are eliminated in consolidation but are reflected as intersegment transactions between our Refining & Marketing and Midstream segments. We also have agreements with MPLX that establish fees for operational and management services provided between us and MPLX and for executive management services and certain general and administrative services provided by us to MPLX. These transactions are eliminated in consolidation but are reflected as intersegment transactions between our Corporate and Midstream segments.
Noncontrolling Interest
As a result of equity transactions of MPLX, we are required to adjust non-controlling interest and additional paid-in capital. Changes in MPC’s additional paid-in capital resulting from changes in its ownership interests in MPLX were as follows: | | | | | | | | | | | | | | | | | | | | | | | |
| Three Months Ended
June 30, | | Six Months Ended
June 30, |
| (In millions) | 2022 | | 2021 | | 2022 | | 2021 |
| Decrease due to change in ownership | $ | (13) | | | $ | (41) | | | $ | (50) | | | $ | (76) | |
| Tax impact | (7) | | | 7 | | | 5 | | | 38 | |
| Decrease in MPC's additional paid-in capital, net of tax | $ | (20) | | | $ | (34) | | | $ | (45) | | | $ | (38) | |
6. VARIABLE INTEREST ENTITIES
Consolidated VIE
We control MPLX through our ownership of its general partner. MPLX is a VIE because the limited partners do not have substantive kick-out or participating rights over the general partner. We are the primary beneficiary of MPLX because in addition to our significant economic interest, we also have the ability, through our ownership of the general partner, to control the decisions that most significantly impact MPLX. We therefore consolidate MPLX and record a noncontrolling interest for the interest owned by the public. We also record a redeemable noncontrolling interest related to MPLX’s Series A preferred units.
The creditors of MPLX do not have recourse to MPC’s general credit through guarantees or other financial arrangements, except as noted. MPC has effectively guaranteed certain indebtedness of LOOP LLC (“LOOP”) and LOCAP LLC (“LOCAP”), in which
MPLX holds an interest. See Note 23 for more information. The assets of MPLX can only be used to settle its own obligations and its creditors have no recourse to our assets, except as noted earlier.
The following table presents balance sheet information for the assets and liabilities of MPLX, which are included in our balance sheets. | | | | | | | | | | | |
| (In millions) | June 30,
2022 | | December 31,
2021 |
| Assets | | | |
| Cash and cash equivalents | $ | 298 | | | $ | 13 | |
| Receivables, less allowance for doubtful accounts | 798 | | | 660 | |
| Inventories | 157 | | | 142 | |
| Other current assets | 46 | | | 55 | |
| Equity method investments | 4,099 | | | 3,981 | |
| Property, plant and equipment, net | 19,767 | | | 20,042 | |
| Goodwill | 7,645 | | | 7,657 | |
| Right of use assets | 300 | | | 268 | |
| Other noncurrent assets | 817 | | | 891 | |
| | | |
| Liabilities | | | |
| Accounts payable | $ | 808 | | | $ | 671 | |
| Payroll and benefits payable | 3 | | | 6 | |
| Accrued taxes | 86 | | | 75 | |
| Debt due within one year | 1,000 | | | 499 | |
| Operating lease liabilities | 45 | | | 59 | |
| Other current liabilities | 442 | | | 304 | |
| Long-term debt | 18,775 | | | 18,072 | |
| Deferred income taxes | 14 | | | 10 | |
| Long-term operating lease liabilities | 250 | | | 205 | |
| Deferred credits and other liabilities | 602 | | | 559 | |
7. RELATED PARTY TRANSACTIONS
Transactions with related parties were as follows: | | | | | | | | | | | | | | | | | | | | | | | |
| Three Months Ended
June 30, | | Six Months Ended
June 30, |
| (In millions) | 2022 | | 2021 | | 2022 | | 2021 |
| Sales to related parties | $ | 21 | | | $ | 11 | | | $ | 40 | | | $ | 54 | |
| Purchases from related parties | 297 | | | 219 | | | 579 | | | 422 | |
Sales to related parties, which are included in sales and other operating revenues, consist primarily of refined product sales to certain of our equity affiliates.
Purchases from related parties are included in cost of revenues. We obtain utilities, transportation services and purchase ethanol from certain of our equity affiliates.
8. EARNINGS PER SHARE
We compute basic earnings per share by dividing net income attributable to MPC less income allocated to participating securities by the weighted average number of shares of common stock outstanding. Since MPC grants certain incentive compensation awards to employees and non-employee directors that are considered to be participating securities, we have calculated our earnings per share using the two-class method. Diluted income per share assumes exercise of certain stock-based compensation awards, provided the effect is not anti-dilutive.
| | | | | | | | | | | | | | | | | | | | | | | |
| Three Months Ended
June 30, | | Six Months Ended
June 30, |
| (In millions, except per share data) | 2022 | | 2021 | | 2022 | | 2021 |
| Income from continuing operations, net of tax | $ | 6,217 | | | $ | 588 | | | $ | 7,389 | | | $ | 418 | |
| Less: Net income attributable to noncontrolling interest | 344 | | | 290 | | | 671 | | | 596 | |
| Net income allocated to participating securities | 3 | | | — | | | 3 | | | — | |
| Income (loss) from continuing operations available to common stockholders | 5,870 | | | 298 | | | 6,715 | | | (178) | |
| Income from discontinued operations, net of tax | — | | | 8,214 | | | — | | | 8,448 | |
| Income available to common stockholders | $ | 5,870 | | | $ | 8,512 | | | $ | 6,715 | | | $ | 8,270 | |
| | | | | | | |
| Weighted average common shares outstanding: | | | | | | | |
| Basic | 532 | | | 650 | | | 549 | | | 651 | |
| Effect of dilutive securities | 4 | | | 4 | | | 4 | | | — | |
| Diluted | 536 | | | 654 | | | 553 | | | 651 | |
| | | | | | | |
| Income available to common stockholders per share: | | | | | | | |
| Basic: | | | | | | | |
| Continuing operations | $ | 11.03 | | | $ | 0.46 | | | $ | 12.24 | | | $ | (0.27) | |
| Discontinued operations | — | | | 12.63 | | | — | | | 12.98 | |
| Net income per share | $ | 11.03 | | | $ | 13.09 | | | $ | 12.24 | | | $ | 12.71 | |
| | | | | | | |
| Diluted: | | | | | | | |
| Continuing operations | $ | 10.95 | | | $ | 0.45 | | | $ | 12.15 | | | $ | (0.27) | |
| Discontinued operations | — | | | 12.55 | | | — | | | 12.98 | |
| Net income per share | $ | 10.95 | | | $ | 13.00 | | | $ | 12.15 | | | $ | 12.71 | |
The following table summarizes the shares that were anti-dilutive and, therefore, were excluded from the diluted share calculation.
| | | | | | | | | | | | | | | | | | | | | | | |
| Three Months Ended
June 30, | | Six Months Ended
June 30, |
| (In millions) | 2022 | | 2021 | | 2022 | | 2021 |
| Shares issuable under stock-based compensation plans | — | | | 3 | | | — | | | 8 | |
9. EQUITY
On February 2, 2022, we announced our board of directors approved an incremental $5.0 billion share repurchase authorization. The authorization has no expiration date.
We may utilize various methods to effect the repurchases, which could include open market repurchases, negotiated block transactions, tender offers, accelerated share repurchases or open market solicitations for shares, some of which may be effected through Rule 10b5-1 plans. The timing and amount of future repurchases, if any, will depend upon several factors, including market and business conditions, and such repurchases may be suspended or discontinued at any time.
Total share repurchases were as follows for the respective periods:
| | | | | | | | | | | | | | | | | | | | | | | |
| Three Months Ended
June 30, | | Six Months Ended
June 30, |
| (In millions, except per share data) | 2022 | | 2021 | | 2022 | | 2021 |
| Number of shares repurchased | 34 | | | 16 | | | 71 | | | 16 | |
| Cash paid for shares repurchased | $ | 3,331 | | | $ | 984 | | | $ | 6,177 | | | $ | 984 | |
| Average cost per share | $ | 95.46 | | | $ | 63.00 | | | $ | 85.31 | | | $ | 63.00 | |
As of June 30, 2022, MPC had $4.17 billion remaining under its share repurchase authorizations,
10. SEGMENT INFORMATION
We have two reportable segments: Refining & Marketing and Midstream. Each of these segments is organized and managed based upon the nature of the products and services it offers.
•Refining & Marketing – refines crude oil and other feedstocks, including renewable feedstocks, at our refineries in the Gulf Coast, Mid-Continent and West Coast regions of the United States, purchases refined products and ethanol for resale and distributes refined products, including renewable diesel, through transportation, storage, distribution and marketing services provided largely by our Midstream segment. We sell refined products to wholesale marketing customers domestically and internationally, to buyers on the spot market, to independent entrepreneurs who operate primarily Marathon® branded outlets and through long-term fuel supply contracts with direct dealers who operate locations mainly under the ARCO® brand.
•Midstream – transports, stores, distributes and markets crude oil and refined products principally for the Refining & Marketing segment via refining logistics assets, pipelines, terminals, towboats and barges; gathers, processes and transports natural gas; and gathers, transports, fractionates, stores and markets NGLs. The Midstream segment primarily reflects the results of MPLX.
During the first quarter of 2022, our chief operating decision maker (“CODM”) began to evaluate the performance of our segments using segment adjusted EBITDA. We have modified our presentation of segment performance to be consistent with this change, including prior periods presented for consistent and comparable presentation. Amounts included in income from continuing operations before income taxes and excluded from segment adjusted EBITDA include: (i) depreciation and amortization; (ii) net interest and other financial costs; (iii) turnaround expenses and (iv) other adjustments as deemed necessary. These items are either: (i) believed to be non-recurring in nature; (ii) not believed to be allocable or controlled by the segment; or (iii) are not tied to the operational performance of the segment. Assets by segment are not a measure used to assess the performance of the company by the CODM and thus are not reported in our disclosures.
| | | | | | | | | | | | | | | | | | | | | | | |
| Three Months Ended
June 30, | | Six Months Ended
June 30, |
| (In millions) | 2022 | | 2021 | | 2022 | | 2021 |
| Segment adjusted EBITDA for reportable segments | | | | | | | |
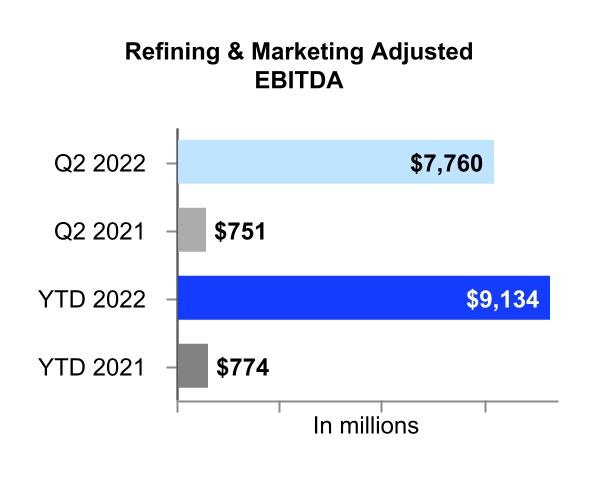
| Refining & Marketing | $ | 7,760 | | | $ | 751 | | | $ | 9,134 | | | $ | 774 | |
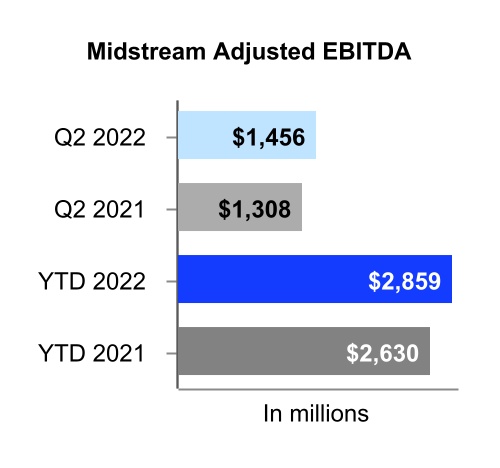
| Midstream | 1,456 | | | 1,308 | | | 2,859 | | | 2,630 | |
| Total reportable segments | $ | 9,216 | | | $ | 2,059 | | | $ | 11,993 | | | $ | 3,404 | |
| | | | | | | |
| Reconciliation of segment adjusted EBITDA for reportable segments to income from continuing operations before income taxes | | | | | | | |
| Total reportable segments | $ | 9,216 | | | $ | 2,059 | | | $ | 11,993 | | | $ | 3,404 | |
| Corporate | (156) | | | (149) | | | (294) | | | (274) | |
| Refining planned turnaround costs | (151) | | | (61) | | | (296) | | | (173) | |
| Storm impacts | — | | | — | | | — | | | (47) | |
| Renewable volume obligation requirements | 238 | | | — | | | 238 | | | — | |
| Litigation | — | | | — | | | 27 | | | — | |
Impairments(a) | — | | | (13) | | | — | | | (13) | |
| | | | | | | |
Depreciation and amortization(b) | (819) | | | (871) | | | (1,624) | | | (1,715) | |
| Net interest and other financial costs | (312) | | | (372) | | | (574) | | | (725) | |
| Income from continuing operations before income taxes | $ | 8,016 | | | $ | 593 | | | $ | 9,470 | | | $ | 457 | |
(a) Impairment of equity method investments.
(b) The three and six months ended June 30, 2021 includes $43 million of impairments of long lived assets.
| | | | | | | | | | | | | | | | | | | | | | | |
| Three Months Ended
June 30, | | Six Months Ended
June 30, |
| (In millions) | 2022 | | 2021 | | 2022 | | 2021 |
| Sales and other operating revenues | | | | | | | |
| Refining & Marketing | | | | | | | |
Revenues from external customers(a) | $ | 52,300 | | | $ | 28,554 | | | $ | 89,092 | | | $ | 50,215 | |
| Intersegment revenues | 47 | | | 30 | | | 83 | | | 58 | |
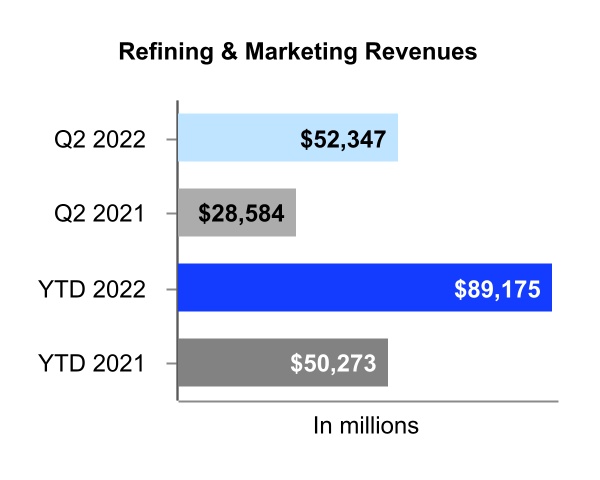
| Refining & Marketing segment revenues | 52,347 | | | 28,584 | | | 89,175 | | | 50,273 | |
| | | | | | | |
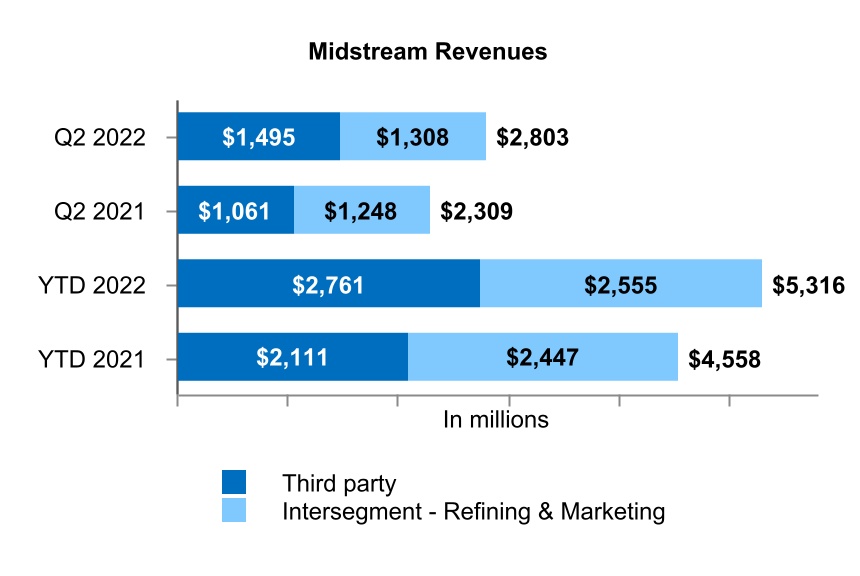
| Midstream | | | | | | | |
Revenues from external customers(a) | 1,495 | | | 1,061 | | | 2,761 | | | 2,111 | |
| Intersegment revenues | 1,308 | | | 1,248 | | | 2,555 | | | 2,447 | |
| Midstream segment revenues | 2,803 | | | 2,309 | | | 5,316 | | | 4,558 | |
| | | | | | | |
| Total segment revenues | 55,150 | | | 30,893 | | | 94,491 | | | 54,831 | |
| Less: intersegment revenues | 1,355 | | | 1,278 | | | 2,638 | | | 2,505 | |
Consolidated sales and other operating revenues(a) | $ | 53,795 | | | $ | 29,615 | | | $ | 91,853 | | | $ | 52,326 | |
(a)Includes related party sales. See Note 7 for additional information.
| | | | | | | | | | | | | | | | | | | | | | | |
| Three Months Ended
June 30, | | Six Months Ended
June 30, |
| (In millions) | 2022 | | 2021 | | 2022 | | 2021 |
| Income (loss) from equity method investments | | | | | | | |
| Refining & Marketing | $ | 6 | | | $ | 14 | | | $ | 18 | | | $ | 19 | |
| Midstream | 141 | | | 92 | | | 271 | | | 178 | |
Corporate(a) | — | | | (13) | | | — | | | (13) | |
| Consolidated income from equity method investments | $ | 147 | | | $ | 93 | | | $ | 289 | | | $ | 184 | |
| | | | | | | |
| Depreciation and amortization | | | | | | | |
| Refining & Marketing | $ | 475 | | | $ | 466 | | | $ | 936 | | | $ | 944 | |
| Midstream | 330 | | | 331 | | | 661 | | | 665 | |
| Corporate | 14 | | | 74 | | | 27 | | | 106 | |
| Consolidated depreciation and amortization | $ | 819 | | | $ | 871 | | | $ | 1,624 | | | $ | 1,715 | |
| | | | | | | |
| Capital expenditures | | | | | | | |
| Refining & Marketing | $ | 315 | | | $ | 176 | | | $ | 559 | | | $ | 310 | |
| Midstream | 222 | | | 178 | | | 505 | | | 316 | |
| Segment capital expenditures and investments | 537 | | | 354 | | | 1,064 | | | 626 | |
| Less investments in equity method investees | 48 | | | 62 | | | 160 | | | 113 | |
| Plus: | | | | | | | |
| Corporate | 15 | | | 23 | | | 38 | | | 44 | |
| Capitalized interest | 25 | | | 16 | | | 48 | | | 30 | |
Consolidated capital expenditures(b) | $ | 529 | | | $ | 331 | | | $ | 990 | | | $ | 587 | |
(a)Impairment of equity method investment.
(b)Includes changes in capital expenditure accruals. See Note 20 for a reconciliation of total capital expenditures to additions to property, plant and equipment for the six months ended June 30, 2022 and 2021 as reported in the consolidated statements of cash flows.
11. NET INTEREST AND OTHER FINANCIAL COSTS
Net interest and other financial costs were as follows: | | | | | | | | | | | | | | | | | | | | | | | |
| Three Months Ended
June 30, | | Six Months Ended
June 30, |
| (In millions) | 2022 | | 2021 | | 2022 | | 2021 |
| Interest income | $ | (18) | | | $ | (2) | | | $ | (23) | | | $ | (3) | |
| Interest expense | 324 | | | 337 | | | 634 | | | 688 | |
| Interest capitalized | (25) | | | (19) | | | (48) | | | (36) | |
Pension and other postretirement non-service costs(a) | 32 | | | 56 | | | 11 | | | 56 | |
| Other financial costs (credits) | (1) | | | — | | | — | | | 20 | |
| Net interest and other financial costs | $ | 312 | | | $ | 372 | | | $ | 574 | | | $ | 725 | |
(a)See Note 22.
12. INCOME TAXES
We recorded a combined federal, state and foreign income tax provision of $1.799 billion and $2.081 billion for the three and six months ended June 30, 2022, respectively, which was higher than the tax computed at the U.S. statutory rate primarily due to state taxes offset by net income attributable to noncontrolling interests.
We recorded a combined federal, state and foreign income tax provision of $5 million and $39 million for the three and six months ended June 30, 2021, respectively, which was lower than the tax computed at the U.S. statutory rate primarily due to income attributable to noncontrolling interests.
13. INVENTORIES
| | | | | | | | | | | |
| (In millions) | June 30,
2022 | | December 31,
2021 |
| Crude oil | $ | 4,174 | | | $ | 2,639 | |
| Refined products | 5,814 | | | 4,460 | |
| Materials and supplies | 1,060 | | | 956 | |
| Total | $ | 11,048 | | | $ | 8,055 | |
Inventories are carried at the lower of cost or market value. Costs of crude oil and refined products are aggregated on a consolidated basis for purposes of assessing whether the LIFO cost basis of these inventories may have to be written down to market values.
14. EQUITY METHOD INVESTMENTS
On June 1, 2022, MPC purchased the remaining 49 percent interest in Watson Cogeneration Company from NRG Energy, Inc. for approximately $59 million. This entity will now be consolidated and included in our consolidated results. It was previously accounted for as an equity method investment.
The excess of the estimated $62 million fair value over the $25 million book value of our 51 percent ownership interest in Watson Cogeneration Company resulted in a $37 million non-cash gain, which is included in the net gain on disposal of assets line of the accompanying consolidated statements of income.
15. PROPERTY, PLANT AND EQUIPMENT
| | | | | | | | | | | | | | | | | | | | | | | | | | | | | | | | | | | | | | |
| | June 30, 2022 | | December 31, 2021 |
| (In millions) | | Gross
PP&E | | Accumulated Depreciation | | Net
PP&E | | Gross
PP&E | | Accumulated Depreciation | | Net
PP&E |
| Refining & Marketing | | $ | 32,147 | | | $ | 16,018 | | | $ | 16,129 | | | $ | 31,089 | | | $ | 14,876 | | | $ | 16,213 | |
| Midstream | | 28,325 | | | 7,904 | | | 20,421 | | | 28,098 | | | 7,384 | | | 20,714 | |
| Corporate | | 1,470 | | | 958 | | | 512 | | | 1,446 | | | 933 | | | 513 | |
| Total | | $ | 61,942 | | | $ | 24,880 | | | $ | 37,062 | | | $ | 60,633 | | | $ | 23,193 | | | $ | 37,440 | |
16. FAIR VALUE MEASUREMENTS
Fair Values—Recurring
The following tables present assets and liabilities accounted for at fair value on a recurring basis as of June 30, 2022 and December 31, 2021 by fair value hierarchy level. We have elected to offset the fair value amounts recognized for multiple derivative contracts executed with the same counterparty, including any related cash collateral as shown below; however, fair value amounts by hierarchy level are presented on a gross basis in the following tables.
| | | | | | | | | | | | | | | | | | | | | | | | | | | | | | | | | | | |
| June 30, 2022 |
| Fair Value Hierarchy | | | | | | |
| (In millions) | Level 1 | | Level 2 | | Level 3 | | Netting and Collateral(a) | | Net Carrying Value on Balance Sheet(b) | | Collateral Pledged Not Offset |
| Assets: | | | | | | | | | | | |
| Commodity contracts | $ | 761 | | | $ | — | | | $ | — | | | $ | (620) | | | $ | 141 | | | $ | 79 | |
| Liabilities: | | | | | | | | | | | |
| Commodity contracts | $ | 622 | | | $ | — | | | $ | — | | | $ | (622) | | | $ | — | | | $ | — | |
| Embedded derivatives in commodity contracts | — | | | — | | | 92 | | | — | | | 92 | | | — | |
| | | | | | | | | | | | | | | | | | | | | | | | | | | | | | | | | | | |
| December 31, 2021 |
| Fair Value Hierarchy | | | | | | |
| (In millions) | Level 1 | | Level 2 | | Level 3 | | Netting and Collateral(a) | | Net Carrying Value on Balance Sheet(b) | | Collateral Pledged Not Offset |
| Assets: | | | | | | | | | | | |
| Commodity contracts | $ | 270 | | | $ | 1 | | | $ | — | | | $ | (235) | | | $ | 36 | | | $ | 34 | |
| Liabilities: | | | | | | | | | | | |
| Commodity contracts | $ | 248 | | | $ | 1 | | | $ | — | | | $ | (249) | | | $ | — | | | $ | — | |
| Embedded derivatives in commodity contracts | — | | | — | | | 108 | | | — | | | 108 | | | — | |
(a)Represents the impact of netting assets, liabilities and cash collateral when a legal right of offset exists. As of June 30, 2022, cash collateral of $2 million was netted with the mark-to-market derivative liabilities. As of December 31, 2021, cash collateral of $14 million was netted with mark-to-market derivative liabilities.
(b)We have no derivative contracts that are covered by master netting arrangements reflected gross on the balance sheet.
Level 3 instruments include embedded derivatives in commodity contracts. The embedded derivative liability relates to a natural gas purchase agreement embedded in a keep‑whole processing agreement. The fair value calculation for these Level 3 instruments at June 30, 2022 used significant unobservable inputs including: (1) NGL prices interpolated and extrapolated due to inactive markets ranging from $0.72 to $1.98 per gallon with a weighted average of $0.98 per gallon and (2) the probability of renewal of 100 percent for the five-year term of the natural gas purchase agreement and the related keep-whole processing agreement. Increases or decreases in the fractionation spread result in an increase or decrease in the fair value of the embedded derivative liability.
The following is a reconciliation of the beginning and ending balances recorded for net liabilities classified as Level 3 in the fair value hierarchy.
| | | | | | | | | | | | | | | | | | | | | | | |
| Three Months Ended
June 30, | | Six Months Ended
June 30, |
| (In millions) | 2022 | | 2021 | | 2022 | | 2021 |
| Beginning balance | $ | 99 | | | $ | 66 | | | $ | 108 | | | $ | 63 | |
| Unrealized and realized (gain)/loss included in net income | (4) | | | 39 | | | (8) | | | 45 | |
| Settlements of derivative instruments | (3) | | | (3) | | | (8) | | | (6) | |
| Ending balance | $ | 92 | | | $ | 102 | | | $ | 92 | | | $ | 102 | |
| | | | | | | |
| The amount of total (gain)/loss for the period included in earnings attributable to the change in unrealized losses relating to liabilities still held at the end of period: | $ | (3) | | | $ | 39 | | | $ | (8) | | | $ | 41 | |
Fair Values – Reported
We believe the carrying value of our other financial instruments, including cash and cash equivalents, receivables, accounts payable and certain accrued liabilities, approximate fair value. Our fair value assessment incorporates a variety of considerations, including the short-term duration of the instruments and the expected insignificance of bad debt expense, which includes an evaluation of counterparty credit risk. The borrowings under our revolving credit facilities, which include variable interest rates, approximate fair value. The fair value of our long-term debt is based on prices from recent trade activity and is categorized in level 3 of the fair value hierarchy. The carrying and fair values of our debt were approximately $26.3 billion and $24.7 billion at June 30, 2022, respectively, and approximately $25.1 billion and $28.1 billion at December 31, 2021, respectively. These carrying and fair values of our debt exclude the unamortized issuance costs which are netted against our total debt.
17. DERIVATIVES
For further information regarding the fair value measurement of derivative instruments, including any effect of master netting agreements or collateral, see Note 16. We do not designate any of our commodity derivative instruments as hedges for accounting purposes.
Derivatives that are not designated as accounting hedges may include commodity derivatives used to hedge price risk on (1) inventories, (2) fixed price sales of refined products, (3) the acquisition of foreign-sourced crude oil, (4) the acquisition of ethanol for blending with refined products, (5) the sale of NGLs, (6) the purchase of natural gas and (7) the purchase of soybean oil.
The following table presents the fair value of derivative instruments as of June 30, 2022 and December 31, 2021 and the line items in the balance sheets in which the fair values are reflected. The fair value amounts below are presented on a gross basis and do not reflect the netting of asset and liability positions permitted under the terms of our master netting arrangements including cash collateral on deposit with, or received from, brokers. We offset the recognized fair value amounts for multiple derivative instruments executed with the same counterparty in our financial statements when a legal right of offset exists. As a result, the asset and liability amounts below will not agree with the amounts presented in our consolidated balance sheets.
| | | | | | | | | | | | | | | | | | | | | | | |
| (In millions) | June 30, 2022 | | December 31, 2021 |
| Balance Sheet Location | Asset | | Liability | | Asset | | Liability |
| Commodity derivatives | | | | | | | |
| Other current assets | $ | 761 | | | $ | 622 | | | $ | 271 | | | $ | 249 | |
Other current liabilities(a) | — | | | 14 | | | — | | | 15 | |
Deferred credits and other liabilities(a) | — | | | 78 | | | — | | | 93 | |
(a) Includes embedded derivatives.
The table below summarizes open commodity derivative contracts for crude oil, refined products, blending products and soybean oil as of June 30, 2022. | | | | | | | | | | | | | | | | | |
| Percentage of contracts that expire next quarter | | Position |
| (Units in thousands of barrels) | | Long | | Short |
Exchange-traded(a) | | | | | |
| Crude oil | 75.6% | | 95,368 | | | 103,520 | |
| Refined products | 89.6% | | 13,539 | | | 15,813 | |
| Blending products | 75.6% | | 2,966 | | | 6,887 | |
| Soybean oil | 84.0% | | 3,738 | | | 4,342 | |
(a) Included in exchange-traded are spread contracts in thousands of barrels: Crude oil - 20,607 long and 21,937 short; Refined products - 1,181 long and 890 short. There are no spread contracts for blending products or soybean oil.
The following table summarizes the effect of all commodity derivative instruments in our consolidated statements of income:
| | | | | | | | | | | | | | | | | | | | | | | |
| Gain (Loss) |
| (In millions) | Three Months Ended
June 30, | | Six Months Ended
June 30, |
| Income Statement Location | 2022 | | 2021 | | 2022 | | 2021 |
| Sales and other operating revenues | $ | — | | | $ | (5) | | | $ | — | | | $ | (15) | |
| Cost of revenues | 17 | | | (168) | | | (325) | | | (233) | |
| Other income | (1) | | | — | | | 1 | | | — | |
| Total | $ | 16 | | | $ | (173) | | | $ | (324) | | | $ | (248) | |
18. DEBT
Our outstanding borrowings at June 30, 2022 and December 31, 2021 consisted of the following: | | | | | | | | | | | |
| (In millions) | June 30,
2022 | | December 31,
2021 |
| Marathon Petroleum Corporation: | | | |
| | | |
| Senior notes | $ | 6,449 | | | $ | 6,449 | |
| Notes payable | 1 | | | 1 | |
| Finance lease obligations | 620 | | | 589 | |
| Total | $ | 7,070 | | | $ | 7,039 | |
| | | |
| MPLX LP: | | | |
| Bank revolving credit facility | — | | | 300 | |
| Senior notes | 20,100 | | | 18,600 | |
| Finance lease obligations | 8 | | | 9 | |
| Total | $ | 20,108 | | | $ | 18,909 | |
| | | |
| Total debt | $ | 27,178 | | | $ | 25,948 | |
| Unamortized debt issuance costs | (140) | | | (129) | |
| Unamortized (discount) premium, net | (264) | | | (280) | |
| Amounts due within one year | (1,087) | | | (571) | |
| Total long-term debt due after one year | $ | 25,687 | | | $ | 24,968 | |
MPLX Senior Notes
On March 14, 2022, MPLX issued $1.5 billion aggregate principal amount of 4.950% senior notes due March 2052 in an underwritten public offering. The net proceeds were used to repay amounts outstanding under the MPC intercompany loan agreement and the MPLX credit agreement.
Available Capacity under our Credit Facilities as of June 30, 2022
| | | | | | | | | | | | | | | | | | | | | | | | | | | | | | | | | | | | | | |
| (Dollars in millions) | | Total
Capacity | | Outstanding
Borrowings | | Outstanding
Letters
of Credit | | Available
Capacity | | Weighted
Average
Interest
Rate | | Expiration |
| MPC, excluding MPLX | | | | | | | | | | | | |
| MPC bank revolving credit facility | | $ | 5,000 | | | $ | — | | | $ | 1 | | | $ | 4,999 | | | — | % | | October 2023 |
MPC trade receivables securitization facility(a) | | 100 | | | — | | | 100 | | | — | | | — | | | September 2022 |
| | | | | | | | | | | | |
| MPLX | | | | | | | | | | | | |
| MPLX bank revolving credit facility | | 3,500 | | | — | | | — | | | 3,500 | | | — | % | | July 2024 |
(a) The committed borrowing and letter of credit issuance capacity of the trade receivables securitization facility is $100 million. In addition, the facility allows for the issuance of letters of credit in excess of the committed capacity at the discretion of the issuing banks. As of June 30, 2022, letters of credit in the total amount of $358 million were issued and outstanding under the facility to secure contracts awarded by the Department of Energy to purchase crude oil from the Strategic Petroleum Reserve. In July 2022, the trade receivables securitization facility was amended to, among other things, extend its term until September 29, 2023.
MPC Bank Revolving Credit Facility
On July 7, 2022, MPC entered into a new five-year revolving credit agreement (the “New MPC Credit Agreement”) to replace its previous $5.0 billion credit facility that was scheduled to expire in October 2023. The New MPC Credit Agreement, among other things, provides for a $5.0 billion unsecured revolving credit facility that matures in July 2027. The financial covenants of the New MPC Credit Agreement are substantially the same as those contained in the previous credit agreement. Borrowings under the New MPC Credit Agreement bear interest, at MPC’s election, at either the Adjusted Term SOFR or the Alternate Base Rate, both as defined in the New MPC Credit Agreement, plus an applicable margin.
MPLX Bank Revolving Credit Facility
On July 7, 2022, MPLX entered into a new five-year revolving credit agreement (the “New MPLX Credit Agreement”) to replace its previous $3.5 billion credit facility that was scheduled to expire in July 2024. The New MPLX Credit Agreement, among other things, provides for a $2.0 billion unsecured revolving credit facility that matures in July 2027. The New MPLX Credit Agreement also provides for letter of credit issuing capacity under the facility of $150 million. Letters of credit issuing capacity is included in, not in addition to, the $2.0 billion borrowing capacity of the New MPLX Credit Agreement. The financial covenants of the New MPLX Credit Agreement are substantially the same as those contained in the previous credit agreement. Borrowings under the MPLX Credit Agreement bear interest, at MPLX’s election, at either the Adjusted Term SOFR or the Alternate Base Rate, both as defined in the MPLX Credit Agreement, plus an applicable margin.
19. REVENUE
The following table presents our revenues from external customers disaggregated by segment and product line.
| | | | | | | | | | | | | | | | | | | | | | | |
| Three Months Ended
June 30, | | Six Months Ended
June 30, |
| (In millions) | 2022 | | 2021 | | 2022 | | 2021 |
| Refining & Marketing: | | | | | | | |
| Refined products | $ | 48,864 | | | $ | 26,528 | | | $ | 82,457 | | | $ | 46,337 | |
| Crude oil | 2,976 | | | 1,866 | | | 5,865 | | | 3,312 | |
| Services and other | 460 | | | 160 | | | 770 | | | 566 | |
| Total revenues from external customers | 52,300 | | | 28,554 | | | 89,092 | | | 50,215 | |
| | | | | | | |
| Midstream: | | | | | | | |
| Refined products | 698 | | | 304 | | | 1,195 | | | 586 | |
| Services and other | 797 | | | 757 | | | 1,566 | | | 1,525 | |
| Total revenues from external customers | 1,495 | | | 1,061 | | | 2,761 | | | 2,111 | |
| | | | | | | |
| Sales and other operating revenues | $ | 53,795 | | | $ | 29,615 | | | $ | 91,853 | | | $ | 52,326 | |
We do not disclose information on the future performance obligations for any contract with expected duration of one year or less at inception. As of June 30, 2022, we do not have future performance obligations that are material to future periods.
Receivables
On the accompanying consolidated balance sheets, receivables, less allowance for doubtful accounts primarily consists of customer receivables. Significant, non-customer balances included in our receivables at June 30, 2022 include matching buy/sell receivables of $7.81 billion.
20. SUPPLEMENTAL CASH FLOW INFORMATION
| | | | | | | | | | | |
| Six Months Ended
June 30, |
| (In millions) | 2022 | | 2021 |
| Net cash provided by operating activities included: | | | |
| Interest paid (net of amounts capitalized) | $ | 519 | | | $ | 649 | |
| Net income taxes paid to (received from) taxing authorities | 1,123 | | | 319 | |
| Non-cash investing and financing activities: | | | |
Book value of equity method investment(a) | 25 | | | — | |
(a) Represents the book value of MPC’s equity method investment in Watson Cogeneration Company at June 1, 2022 prior to MPC buying out the remaining interest in Watson Cogeneration Company. See Note 14 for additional information.
The consolidated statements of cash flows exclude changes to the consolidated balance sheets that did not affect cash. The following is a reconciliation of additions to property, plant and equipment to total capital expenditures:
| | | | | | | | | | | |
| Six Months Ended
June 30, |
| (In millions) | 2022 | | 2021 |
| Additions to property, plant and equipment per the consolidated statements of cash flows | $ | 993 | | | $ | 606 | |
| Decrease in capital accruals | (3) | | | (19) | |
| Total capital expenditures | $ | 990 | | | $ | 587 | |
21. ACCUMULATED OTHER COMPREHENSIVE LOSS
The following table shows the changes in accumulated other comprehensive loss by component. Amounts in parentheses indicate debits. | | | | | | | | | | | | | | | | | | | | | | | |
| (In millions) | Pension Benefits | | Other Benefits | | Other | | Total |
| Balance as of December 31, 2020 | $ | (338) | | | $ | (181) | | | $ | 7 | | | $ | (512) | |
Other comprehensive gain (loss) before reclassifications, net of tax of $44 | 132 | | | 1 | | | (4) | | | 129 | |
| Amounts reclassified from accumulated other comprehensive loss: | | | | | | | |
Amortization of prior service cost (credit)(a) | (23) | | | 1 | | | — | | | (22) | |
Amortization of actuarial loss(a) | 24 | | | 5 | | | — | | | 29 | |
Settlement loss(a) | 49 | | | — | | | — | | | 49 | |
| | | | | | | |
| Tax effect | (11) | | | (2) | | | — | | | (13) | |
| Other comprehensive income (loss) | 171 | | | 5 | | | (4) | | | 172 | |
| Balance as of June 30, 2021 | $ | (167) | | | $ | (176) | | | $ | 3 | | | $ | (340) | |
| | | | | | | | | | | | | | | | | | | | | | | |
| (In millions) | Pension Benefits | | Other Benefits | | Other | | Total |
| Balance as of December 31, 2021 | $ | (117) | | | $ | 49 | | | $ | 1 | | | $ | (67) | |
Other comprehensive gain (loss) before reclassifications, net of tax of $(8) | (19) | | | 3 | | | (6) | | | (22) | |
| Amounts reclassified from accumulated other comprehensive loss: | | | | | | | |
Amortization of prior service credit(a) | (23) | | | (11) | | | — | | | (34) | |
Amortization of actuarial loss(a) | 7 | | | 3 | | | — | | | 10 | |
Settlement loss(a) | 56 | | | — | | | — | | | 56 | |
| | | | | | | |
| Tax effect | (10) | | | 2 | | | — | | | (8) | |
| Other comprehensive income (loss) | 11 | | | (3) | | | (6) | | | 2 | |
| Balance as of June 30, 2022 | $ | (106) | | | $ | 46 | | | $ | (5) | | | $ | (65) | |
(a)These accumulated other comprehensive loss components are included in the computation of net periodic benefit cost. See Note 22.
22. PENSION AND OTHER POSTRETIREMENT BENEFITS
The following summarizes the components of net periodic benefit costs:
| | | | | | | | | | | | | | | | | | | | | | | |
| Three Months Ended
June 30, | | Six Months Ended
June 30, |
| (In millions) | 2022 | | 2021 | | 2022 | | 2021 |
| Pension Benefits | | | | | | | |
| Service cost | $ | 65 | | | $ | 72 | | | $ | 133 | | | $ | 148 | |
| Interest cost | 24 | | | 23 | | | 47 | | | 46 | |
| Expected return on plan assets | (37) | | | (29) | | | (78) | | | (62) | |
| Amortization of prior service credit | (12) | | | (12) | | | (23) | | | (23) | |
| Amortization of actuarial loss | 3 | | | 14 | | | 7 | | | 25 | |
| Settlement loss | 54 | | | 49 | | | 56 | | | 49 | |
| Net periodic pension benefit cost | $ | 97 | | | $ | 117 | | | $ | 142 | | | $ | 183 | |
| | | | | | | |
| Other Benefits | | | | | | | |
| Service cost | $ | 5 | | | $ | 7 | | | $ | 13 | | | $ | 17 | |
| Interest cost | 5 | | | 8 | | | 10 | | | 15 | |
| Amortization of prior service cost (credit) | (6) | | | — | | | (11) | | | 1 | |
| Amortization of actuarial loss | 1 | | | 3 | | | 3 | | | 5 | |
| Net periodic other benefit cost | $ | 5 | | | $ | 18 | | | $ | 15 | | | $ | 38 | |
The components of net periodic benefit cost other than the service cost component are included in net interest and other financial costs on the consolidated statements of income.
During the six months ended June 30, 2022, we did not make contributions to our funded pension plans. Benefit payments related to unfunded pension and other postretirement benefit plans were $9 million and $31 million, respectively, during the six months ended June 30, 2022.
23. COMMITMENTS AND CONTINGENCIES
We are the subject of, or a party to, a number of pending or threatened legal actions, contingencies and commitments involving a variety of matters, including laws and regulations relating to the environment. Some of these matters are discussed below. For matters for which we have not recorded a liability, we are unable to estimate a range of possible loss because the issues involved have not been fully developed through pleadings, discovery or court proceedings. However, the ultimate resolution of some of these contingencies could, individually or in the aggregate, be material.
Environmental Matters
We are subject to federal, state, local and foreign laws and regulations relating to the environment. These laws generally provide for control of pollutants released into the environment and require responsible parties to undertake remediation of hazardous
waste disposal sites and certain other locations including presently or formerly owned or operated retail marketing sites. Penalties may be imposed for noncompliance.
At June 30, 2022 and December 31, 2021, accrued liabilities for remediation totaled $396 million and $401 million, respectively. It is not presently possible to estimate the ultimate amount of all remediation costs that might be incurred or the penalties, if any, that may be imposed. Receivables for recoverable costs from certain states, under programs to assist companies in clean-up efforts related to underground storage tanks at presently or formerly owned or operated retail marketing sites, were $5 million and $6 million at June 30, 2022 and December 31, 2021, respectively.
Governmental and other entities in various states have filed climate-related lawsuits against numerous energy companies, including MPC. The lawsuits allege damages as a result of climate change and the plaintiffs are seeking unspecified damages and abatement under various tort theories. We are currently subject to such proceedings in federal or state courts in California, Delaware, Maryland, Hawaii, Rhode Island and South Carolina. Similar lawsuits may be filed in other jurisdictions. At this early stage, the ultimate outcome of these matters remains uncertain, and neither the likelihood of an unfavorable outcome nor the ultimate liability, if any, can be determined.
We are involved in a number of environmental enforcement matters arising in the ordinary course of business. While the outcome and impact on us cannot be predicted with certainty, management believes the resolution of these environmental matters will not, individually or collectively, have a material adverse effect on our consolidated results of operations, financial position or cash flows.
Other Legal Proceedings
In July 2020, Tesoro High Plains Pipeline Company, LLC (“THPP”), a subsidiary of MPLX, received a Notification of Trespass Determination from the Bureau of Indian Affairs (“BIA”) relating to a portion of the Tesoro High Plains Pipeline that crosses the Fort Berthold Reservation in North Dakota. The notification demanded the immediate cessation of pipeline operations and assessed trespass damages of approximately $187 million. On appeal, the Assistant Secretary - Indian Affairs vacated the BIA’s trespass order and remanded to the Regional Director for the BIA Great Plains Region to issue a new decision based on specified criteria. On December 15, 2020, the Regional Director of the BIA issued a new trespass notice to THPP, finding that THPP was in trespass and assessing trespass damages of approximately $4 million (including interest), which has been paid. The order also required that THPP immediately cease and desist use of the portion of the pipeline that crosses the property at issue. THPP has complied with the Regional Director’s December 15, 2020 notice. In March 2021, THPP received a copy of an order purporting to vacate all orders related to THPP’s alleged trespass issued by the BIA between July 2, 2020 and January 14, 2021. The order directs the Regional Director of the BIA to reconsider the issue of THPP’s alleged trespass and issue a new order, if necessary, after all interested parties have had an opportunity to be heard. On April 23, 2021, THPP filed a lawsuit in the District of North Dakota against the United States of America, the U.S. Department of the Interior and the BIA (together, the “U.S. Government Parties”) challenging the March order purporting to vacate all previous orders related to THPP’s alleged trespass. On February 8, 2022, the U.S. Government Parties filed their answer to THPP’s suit, asserting counterclaims for trespass and ejectment. The U.S. Government parties claim THPP is in continued trespass with respect to the pipeline and seek disgorgement of pipeline profits from June 1, 2013 to present, removal of the pipeline and remediation. We intend to vigorously defend ourselves against these counterclaims. We continue to work towards a settlement of this matter with holders of the property rights at issue.
We are also a party to a number of other lawsuits and other proceedings arising in the ordinary course of business. While the ultimate outcome and impact to us cannot be predicted with certainty, we believe that the resolution of these other lawsuits and proceedings will not, individually or collectively, have a material adverse effect on our consolidated financial position, results of operations or cash flows.
Guarantees
We have provided certain guarantees, direct and indirect, of the indebtedness of other companies. Under the terms of most of these guarantee arrangements, we would be required to perform should the guaranteed party fail to fulfill its obligations under the specified arrangements. In addition to these financial guarantees, we also have various performance guarantees related to specific agreements.
Guarantees related to indebtedness of equity method investees
LOOP and LOCAP
MPC and MPLX hold interests in an offshore oil port, LOOP, and MPLX holds an interest in a crude oil pipeline system, LOCAP. Both LOOP and LOCAP have secured various project financings with throughput and deficiency agreements. Under the agreements, MPC, as a shipper, is required to advance funds if the investees are unable to service their debt. Any such advances are considered prepayments of future transportation charges. The duration of the agreements varies but tends to follow the terms of the underlying debt, which extend through 2037. Our maximum potential undiscounted payments under these agreements for the debt principal totaled $171 million as of June 30, 2022.
Dakota Access Pipeline
MPLX holds a 9.19 percent indirect interest in a joint venture (“Dakota Access”) that owns and operates the Dakota Access Pipeline and Energy Transfer Crude Oil Pipeline projects, collectively referred to as the Bakken Pipeline system or DAPL. In 2020, the U.S. District Court for the District of Columbia (the “D.D.C.”) ordered the U.S. Army Corps of Engineers (“Army Corps”), which granted permits and an easement for the Bakken Pipeline system, to prepare an environmental impact statement (“EIS”) relating to an easement under Lake Oahe in North Dakota. The D.D.C. later vacated the easement. Completion of the EIS may now be delayed as the Army Corps engages with the Standing Rock Sioux Tribe on the tribe’s reasons for withdrawing as a cooperating agency with respect to preparation of the EIS.
In May 2021, the D.D.C. denied a renewed request for an injunction to shut down the pipeline while the EIS is being prepared. In June 2021, the D.D.C. issued an order dismissing without prejudice the tribes’ claims against the Dakota Access Pipeline. The litigation could be reopened or new litigation challenging the EIS, once completed, could be filed. The pipeline remains operational.
MPLX has entered into a Contingent Equity Contribution Agreement whereby it, along with the other joint venture owners in the Bakken Pipeline system, has agreed to make equity contributions to the joint venture upon certain events occurring to allow the entities that own and operate the Bakken Pipeline system to satisfy their senior note payment obligations. The senior notes were issued to repay amounts owed by the pipeline companies to fund the cost of construction of the Bakken Pipeline system. If the pipeline were temporarily shut down, MPLX would have to contribute its 9.19 percent pro rata share of funds required to pay interest accruing on the notes and any portion of the principal that matures while the pipeline is shutdown. MPLX also expects to contribute its 9.19 percent pro rata share of any costs to remediate any deficiencies to reinstate the permit and/or return the pipeline into operation. If the vacatur of the easement permit results in a permanent shutdown of the pipeline, MPLX would have to contribute its 9.19 percent pro rata share of the cost to redeem the bonds (including the 1% redemption premium required pursuant to the indenture governing the notes) and any accrued and unpaid interest. As of June 30, 2022, our maximum potential undiscounted payments under the Contingent Equity Contribution Agreement were approximately $170 million.
Crowley Ocean Partners LLC and Crowley Blue Water Partners LLC
In connection with our 50 percent indirect interest in Crowley Ocean Partners LLC, we have agreed to conditionally guarantee our portion of the obligations of the joint venture and its subsidiaries under a senior secured term loan used to finance the acquisition of four product tankers. MPC’s liability under the guarantee for each vessel is conditioned upon the occurrence of certain events, including if we cease to maintain an investment grade credit rating or the charter for the relevant product tanker ceases to be in effect and is not replaced by a charter with an investment grade company on certain defined commercial terms. During the first quarter of 2022, the guarantee for the debt associated with one of the four vessels became effective upon the expiration of the charter for the relevant vessel. As of June 30, 2022, our maximum potential undiscounted payments under this agreement for debt principal totaled $103 million.
In connection with our 50 percent indirect interest in Crowley Blue Water Partners LLC, we have agreed to provide a conditional guarantee of up to 50 percent of its outstanding debt balance in the event there is no charter agreement in place with an investment grade customer for the entity’s three vessels as well as other financial support in certain circumstances. As of June 30, 2022, our maximum potential undiscounted payments under this arrangement was $104 million.
Other guarantees
We have entered into other guarantees with maximum potential undiscounted payments totaling $98 million as of June 30, 2022, which primarily consist of a commitment to contribute cash to an equity method investee for certain catastrophic events, in lieu of procuring insurance coverage, a commitment to fund a share of the bonds issued by a government entity for construction of public utilities in the event that other industrial users of the facility default on their utility payments and leases of assets containing general lease indemnities and guaranteed residual values.
Contractual Commitments and Contingencies
Certain natural gas processing and gathering arrangements require us to construct natural gas processing plants, natural gas gathering pipelines and NGL pipelines and contain certain fees and charges if specified construction milestones are not achieved for reasons other than force majeure. In certain cases, certain producer customers may have the right to cancel the processing arrangements with us if there are significant delays that are not due to force majeure.
24. SUBSEQUENT EVENTS
On August 2, 2022, we announced our board of directors approved an incremental $5.0 billion share repurchase authorization. The authorization has no expiration date. We may utilize various methods to effect the repurchases, which could include open market repurchases, negotiated block transactions, accelerated share repurchases, tender offers or open market solicitations for shares, some of which may be effected through Rule 10b5-1 plans. The timing of repurchases will depend upon several factors, including market and business conditions, and repurchases may be discontinued at any time.
On August 2, 2022, MPLX announced its board of directors approved an incremental $1.0 billion unit repurchase authorization. This unit repurchase authorization has no expiration date.
ITEM 2. MANAGEMENT’S DISCUSSION AND ANALYSIS OF FINANCIAL CONDITION AND RESULTS OF OPERATIONS
This section should also be read in conjunction with the unaudited consolidated financial statements and accompanying footnotes included under Item 1. Financial Statements and in conjunction with our Annual Report on Form 10-K for the year ended December 31, 2021.
DISCLOSURES REGARDING FORWARD-LOOKING STATEMENTS
This Quarterly Report on Form 10-Q, particularly Management’s Discussion and Analysis of Financial Condition and Results of Operations and Quantitative and Qualitative Disclosures about Market Risk, includes forward-looking statements that are subject to risks, contingencies or uncertainties. You can identify forward-looking statements by words such as “anticipate,” “believe,” “commitment,” “could,” “design,” “estimate,” “expect,” “forecast,” “goal,” “guidance,” “intend,” “may,” “objective,” “opportunity,” “outlook,” “plan,” “policy,” “position,” “potential,” “predict,” “priority,” “project,” “prospective,” “pursue,” “seek,” “should,” “strategy,” “target,” “will,” “would” or other similar expressions that convey the uncertainty of future events or outcomes.
Forward-looking statements include, among other things, statements regarding:
•future financial and operating results;
•environmental, social and governance (“ESG”) goals and targets, including those related to greenhouse gas emissions, diversity and inclusion and ESG reporting;
•future levels of capital, environmental or maintenance expenditures, general and administrative and other expenses;
•the success or timing of completion of ongoing or anticipated capital or maintenance projects;
•business strategies, growth opportunities and expected investments;
•consumer demand for refined products, natural gas and NGLs;
•the timing, amount and form of any future capital return transactions at MPC or MPLX; and
•the anticipated effects of actions of third parties such as competitors, activist investors, federal, foreign, state or local regulatory authorities, or plaintiffs in litigation.
Our forward-looking statements are not guarantees of future performance, and you should not rely unduly on them, as they involve risks, uncertainties and assumptions. Material differences between actual results and any future performance suggested in our forward-looking statements could result from a variety of factors, including the following:
•the continuance or escalation of the military conflict between Russia and Ukraine, and related sanctions and market disruptions;
•general economic, political or regulatory developments, including inflation, changes in governmental policies relating to refined petroleum products, crude oil, natural gas or NGLs, or taxation;
•the magnitude, duration and extent of future resurgences of the COVID-19 pandemic and its effects, including travel restrictions, business and school closures, increased remote work, stay-at-home orders and other actions taken by individuals, governments and the private sector to stem the spread of the virus;
•changes in estimates or projections used to assess fair value of intangible assets, goodwill and property and equipment and/or strategic decisions or other developments with respect to our asset portfolio that cause impairment charges;
•the regional, national and worldwide availability and pricing of refined products, crude oil, natural gas, NGLs and other feedstocks;
•disruptions in credit markets or changes to credit ratings;
•the adequacy of capital resources and liquidity, including availability, timing and amounts of free cash flow necessary to execute business plans and to effect any share repurchases or to maintain or increase the dividend;
•the potential effects of judicial or other proceedings on the business, financial condition, results of operations and cash flows;
•continued or further volatility in and degradation of general economic, market, industry or business conditions as a result of the COVID-19 pandemic, other infectious disease outbreaks, natural hazards, extreme weather events or otherwise;
•compliance with federal and state environmental, economic, health and safety, energy and other policies and regulations and enforcement actions initiated thereunder;
•adverse market conditions or other risks affecting MPLX;
•refining industry overcapacity or under capacity;
•changes in producer customers’ drilling plans or in volumes of throughput of crude oil, natural gas, NGLs, refined products or other hydrocarbon-based products;
•non-payment or non-performance by our customers;
•changes in the cost or availability of third-party vessels, pipelines, railcars and other means of transportation for crude oil, natural gas, NGLs, feedstocks and refined products;
•the price, availability and acceptance of alternative fuels and alternative-fuel vehicles and laws mandating such fuels or vehicles;
•political and economic conditions in nations that consume refined products, natural gas and NGLs, including the United States and Mexico, and in crude oil producing regions, including the Middle East, Russia, Africa, Canada and South America;
•actions taken by our competitors, including pricing adjustments, the expansion and retirement of refining capacity and the expansion and retirement of pipeline capacity, processing, fractionation and treating facilities in response to market conditions;
•completion of pipeline projects within the United States;
•changes in fuel and utility costs for our facilities;
•accidents or other unscheduled shutdowns affecting our refineries, machinery, pipelines, processing, fractionation and treating facilities or equipment, means of transportation, or those of our suppliers or customers;
•acts of war, terrorism or civil unrest that could impair our ability to produce refined products, receive feedstocks or to gather, process, fractionate or transport crude oil, natural gas, NGLs or refined products;
•political pressure and influence of environmental groups and other stakeholders upon policies and decisions related to the production, gathering, refining, processing, fractionation, transportation and marketing of crude oil or other feedstocks, refined products, natural gas, NGLs or other hydrocarbon-based products;
•labor and material shortages;
•the costs, disruption and diversion of management’s attention associated with campaigns commenced by activist investors; and
•personnel changes.
For additional risk factors affecting our business, see the risk factors described in our Annual Report on Form 10-K for the year ended December 31, 2021. We undertake no obligation to update any forward-looking statements except to the extent required by applicable law.
EXECUTIVE SUMMARY
Business Update
Through the first six months of 2022, we continue to see recovery in the environment in which our business operates. The increase in global demand for refined products and global commodity supply constraints have contributed to increased Refining & Marketing margins and Midstream throughputs. We are unable to predict the potential effects that resurgences of COVID-19 or the continuance or escalation of the military conflict between Russia and Ukraine, and related sanctions, may have on our financial position and results. It remains uncertain how long these conditions may last or how severe they may become.
In 2022, data indicates a sharp rise in inflation in the U.S. and globally. Current and future inflationary effects may be driven by, among other things, supply chain disruptions, governmental stimulus or fiscal policies and increasing demand for certain goods and services as recovery from the COVID-19 pandemic continues. We have observed higher costs for feedstocks, labor and materials used in our business. We cannot predict the effect of higher inflation and fuel prices on demand for our products and services.
In response to this business environment, we continue to focus on the following priorities for our businesses:
Strengthen Competitive Position of Assets
We are committed to positioning our assets so that we are a leader in operational, financial, and sustainability performance and are evaluating the strength and fit of assets in our portfolio. Our goal is that each individual asset generates free-cash-flow back to the business and contributes to shareholder returns. With our investments we are focused on high returning projects that we believe will enhance the competitiveness of our portfolio, including our investments in sustainable fuels and technologies that lower our carbon intensity as the global energy mix evolves.
Improve Commercial Performance
We are focused on leveraging advantaged raw material selection, new approaches in the commercial space to be more dynamic amidst changing market conditions, and achieving technology improvements to advance our commercial performance. A near-term focus has been securing advantaged renewable feedstocks as we continue to advance our renewable fuels production capabilities. This includes exploring joint venture opportunities and strategic alliances within the renewable fuels value chain.
Continued Capital Discipline and Focus on Low-Cost Culture
We are committed to achieving operational excellence by reducing costs, improving efficiency, driving operational improvements and being disciplined in capital allocation. This means lowering our costs in all aspects of our business and challenging
ourselves to be disciplined in every dollar we spend across our organization. We look to optimize our portfolio of investment opportunities to ensure efficient deployment of capital focusing on projects with the highest returns.
Commitment to Sustainability
Our approach to sustainability spans the environmental, social and governance dimensions of our business. That means strengthening resiliency by lowering the carbon intensity and conserving natural resources; innovating for the future by investing in renewables and emerging technologies; and embedding sustainability in decision-making and in how we engage our people and many stakeholders. Specifically, we established a 2030 target to reduce our absolute Scope 3 - Category 11 GHG emissions by 15% below 2019 levels. Additionally, MPLX established a new 2030 target to reduce methane emissions intensity by 75% below 2016 levels. The reduction target applies to MPLX’s natural gas gathering and processing operations and represents an expansion of the existing 2025 target, established in 2020, to reduce methane emissions intensity by 50% below 2016 levels.
Strategic Updates
Martinez Renewable Fuels Project Joint Venture
On March 1, 2022, MPC announced it entered into definitive agreements to form a joint venture with Neste for its Martinez renewable fuels project. The partnership will be structured as a 50/50 joint venture with Neste expected to contribute a total of $1 billion, inclusive of half of the total project development costs projected through the completion of the project. MPC will continue to manage project execution and operate the facility once construction is complete. The closing of the joint venture is subject to customary closing conditions and regulatory approvals, including obtaining the necessary permits.
This strategic partnership is expected to advance the current project objectives of delivering low carbon intensity fuels to support California's climate goals. MPC and Neste will leverage their complementary core competencies in the joint venture. MPC brings experience in renewable diesel facility conversion, large capital project execution, and operating expertise in the California market. Neste brings knowledge in sustainable feedstock sourcing and in renewable liquid fuels production. The joint venture reflects both partners' commitment to obtain low carbon intensity feedstocks to achieve the project objectives of providing fuels that meet the demand driven by the Low Carbon Fuel Standard.
MPC received the certification of the Final Environmental Impact Report for the Martinez Renewable Fuels Project on May 3, 2022. In addition, on July 22, 2022, the Bay Area Air Quality Management District air quality permit for Martinez was posted, commencing a 30-day public comment period. The first phase of the facility is currently targeted to be mechanically complete late in the fourth quarter of 2022. Initial production capacity is expected to be 260 million gallons per day of renewable fuels. Pretreatment capabilities are expected to come online in the second half of 2023 and the facility is expected to be capable of producing 730 million gallons per year by the end of 2023. The expected and targeted timelines for achieving the production capacities outlined above are dependent upon the timing of obtaining the air quality permit to operate the facility.
Share Repurchase Authorization
On August 2, 2022, we announced our board of directors approved an incremental $5 billion share repurchase authorization in addition to the incremental $5.0 billion share repurchase authorization announced on February 2, 2022. The authorizations have no expiration date. As of June 30, 2022, MPC had $4.17 billion remaining under its share repurchase authorizations.
Results
During the first quarter of 2022, our CODM began to evaluate the performance of our segments using segment adjusted EBITDA. We have modified our presentation of segment performance to be consistent with this change, including prior periods presented for consistent and comparable presentation. Amounts included in net income and excluded from segment adjusted EBITDA include: (i) depreciation and amortization; (ii) provision for income taxes; (iii) net interest and other financial costs; (iv) noncontrolling interests; (v) turnaround expenses and (vi) other adjustments as deemed necessary. These items are either: (i) believed to be non-recurring in nature; (ii) not believed to be allocable or controlled by the segment; or (iii) are not tied to the operational performance of the segment.
Select results for continuing operations are reflected in the following table.
| | | | | | | | | | | | | | | | | | | | | | | |
| Three Months Ended
June 30, | | Six Months Ended
June 30, |
| (In millions) | 2022 | | 2021 | | 2022 | | 2021 |
| Segment adjusted EBITDA for reportable segments | | | | | | | |
| Refining & Marketing | $ | 7,760 | | | $ | 751 | | | $ | 9,134 | | | $ | 774 | |
| Midstream | 1,456 | | | 1,308 | | | 2,859 | | | 2,630 | |
| Total reportable segments | $ | 9,216 | | | $ | 2,059 | | | $ | 11,993 | | | $ | 3,404 | |
| | | | | | | |
| Reconciliation of segment adjusted EBITDA for reportable segments to income from continuing operations before income taxes | | | | | | | |
| Total reportable segments | $ | 9,216 | | | $ | 2,059 | | | $ | 11,993 | | | $ | 3,404 | |
| Corporate | (156) | | | (149) | | | (294) | | | (274) | |
| Refining planned turnaround costs | (151) | | | (61) | | | (296) | | | (173) | |
| Storm impacts | — | | | — | | | — | | | (47) | |
| Renewable volume obligation requirements | 238 | | | — | | | 238 | | | — | |
| Litigation | — | | | — | | | 27 | | | — | |
| Impairments | — | | | (13) | | | — | | | (13) | |
| | | | | | | |
| Depreciation and amortization | (819) | | | (871) | | | (1,624) | | | (1,715) | |
| Net interest and other financial costs | (312) | | | (372) | | | (574) | | | (725) | |
| Income from continuing operations before income taxes | $ | 8,016 | | | $ | 593 | | | $ | 9,470 | | | $ | 457 | |
The following table includes net income (loss) per diluted share data.
| | | | | | | | | | | | | | | | | | | | | | | | | | |
| | | Three Months Ended
June 30, | | Six Months Ended
June 30, |
| | 2022 | | 2021 | | 2022 | | 2021 |
| Net income (loss) per diluted share | | | | | | | | |
| Continuing operations | $ | 10.95 | | | $ | 0.45 | | | $ | 12.15 | | | $ | (0.27) | |
| Discontinued operations | — | | | 12.55 | | | — | | | 12.98 | |
| Net income attributable to MPC | $ | 10.95 | | | $ | 13.00 | | | $ | 12.15 | | | $ | 12.71 | |
Net income attributable to MPC was $5.87 billion, or $10.95 per diluted share, in the second quarter of 2022 compared to $8.51 billion, or $13.00 per diluted share, for the second quarter of 2021 and $6.72 billion, or $12.15 per diluted share, in the first six months of 2022 compared to $8.27 billion, or $12.71 per diluted share, in the first six months of 2021.
For the second quarter of 2022 and first six months of 2022, the changes were largely due to income from discontinued operations in 2021, due to the sale of the Speedway business on May 14, 2021, and increased operating costs, partially offset increases in average refined product sales prices and volumes in 2022.
See Note 4 to the unaudited consolidated financial statements for additional information on discontinued operations.
Refer to the Results of Operations section for a discussion of consolidated financial results and segment results for the second quarter of 2022 as compared to the second quarter of 2021 and the first six months of 2022 compared to the first six months of 2021.
MPLX
We owned approximately 647 million MPLX common units as of June 30, 2022, with a market value of $18.87 billion based on the June 30, 2022 closing price of $29.15 per common unit. On July 26, 2022, MPLX declared a quarterly cash distribution of $0.7050 per common unit payable on August 12, 2022. As a result, MPC’s portion of this distribution is approximately $457 million.
We received limited partner distributions of $913 million from MPLX in the six months ended June 30, 2022 and $890 million in the six months ended June 30, 2021.
During the six months ended June 30, 2022, MPLX repurchased approximately 4 million MPLX common units at an average cost per unit of $32.48 and paid $135 million of cash. As of June 30, 2022, $202 million remained available under the authorization for future unit repurchases.
See Note 5 to the unaudited consolidated financial statements for additional information on MPLX.
OVERVIEW OF SEGMENTS
Refining & Marketing
Refining & Marketing segment adjusted EBITDA depends largely on our refinery throughputs, Refining & Marketing margin, refining operating costs and distribution costs.
Refining & Marketing margin is the difference between the prices of refined products sold and the costs of crude oil and other charge and blendstocks refined, including the costs to transport these inputs to our refineries and the costs of products purchased for resale. The crack spread is a measure of the difference between market prices for refined products and crude oil, commonly used by the industry as a proxy for the refining margin. Crack spreads can fluctuate significantly, particularly when prices of refined products do not move in the same direction as the cost of crude oil. As a performance benchmark and a comparison with other industry participants, we calculate Gulf Coast, Mid-Continent and West Coast crack spreads that we believe most closely track our operations and slate of products. The following are used for these crack spread calculations:
•The Gulf Coast crack spread uses three barrels of MEH crude producing two barrels of USGC CBOB gasoline and one barrel of USGC ULSD;
•The Mid-Continent crack spread uses three barrels of WTI crude producing two barrels of Chicago CBOB gasoline and one barrel of Chicago ULSD; and
•The West Coast crack spread uses three barrels of ANS crude producing two barrels of LA CARBOB and one barrel of LA CARB Diesel.
Our refineries can process significant amounts of sweet and sour crude oil, which typically can be purchased at a discount to crude oil referenced in our Gulf Coast, Mid-Continent and West Coast crack spreads. The amount of these discounts, which we refer to as the sweet differential and sour differential, can vary significantly, causing our Refining & Marketing margin to differ from blended crack spreads. In general, larger sweet and sour differentials will enhance our Refining & Marketing margin.
Future crude oil differentials will be dependent on a variety of market and economic factors, as well as U.S. energy policy.
The following table provides sensitivities showing an estimated change in annual net income due to potential changes in market conditions. | | | | | | | | |
| (In millions, after-tax) | | |
Blended crack spread sensitivity(a) (per $1.00/barrel change) | $ | 800 | |
Sour differential sensitivity(b) (per $1.00/barrel change) | 375 | |
Sweet differential sensitivity(c) (per $1.00/barrel change) | 375 | |
Natural gas price sensitivity(d) (per $1.00/MMBtu) | 250 | |
(a)Crack spread based on 40 percent MEH, 40 percent WTI and 20 percent ANS with Gulf Coast, Mid-Continent and West Coast product pricing, respectively, and assumes all other differentials and pricing relationships remain unchanged.
(b)Sour crude oil basket consists of the following crudes: ANS, Argus Sour Crude Index, Maya and Western Canadian Select. We assume approximately 50 percent of the crude processed at our refineries in 2022 will be sour crude.
(c)Sweet crude oil basket consists of the following crudes: Bakken, Brent, MEH, WTI-Cushing and WTI-Midland. We assume approximately 50 percent of the crude processed at our refineries in 2022 will be sweet crude.
(d)This is consumption-based exposure for our Refining & Marketing segment and does not include the sales exposure for our Midstream segment.
In addition to the market changes indicated by the crack spreads, the sour differential and the sweet differential, our Refining & Marketing margin is impacted by factors such as:
•the selling prices realized for refined products;
•the types of crude oil and other charge and blendstocks processed;
•our refinery yields;
•the cost of products purchased for resale;
•the impact of commodity derivative instruments used to hedge price risk;
•the potential impact of LCM adjustments to inventories in periods of declining prices; and
•the potential impact of LIFO liquidation charges due to draw-downs from historic inventory levels.
Refining & Marketing segment adjusted EBITDA is also affected by changes in refinery operating costs in addition to committed distribution costs. Changes in operating costs are primarily driven by the cost of energy used by our refineries, including purchased natural gas, and the level of maintenance costs. Distribution costs primarily include long-term agreements with MPLX, which as discussed below include minimum commitments to MPLX, and will negatively impact income from operations in periods when throughput or sales are lower or refineries are idled.
We have various long-term, fee-based commercial agreements with MPLX. Under these agreements, MPLX, which is reported in our Midstream segment, provides transportation, storage, distribution and marketing services to our Refining & Marketing segment. Certain of these agreements include commitments for minimum quarterly throughput and distribution volumes of crude oil and refined products and minimum storage volumes of crude oil, refined products and other products. Certain other agreements include commitments to pay for 100 percent of available capacity for certain marine transportation and refining logistics assets.
Midstream
Our Midstream segment transports, stores, distributes and markets crude oil and refined products, principally for our Refining & Marketing segment. The profitability of our pipeline transportation operations primarily depends on tariff rates and the volumes shipped through the pipelines. The profitability of our marine operations primarily depends on the quantity and availability of our vessels and barges. The profitability of our light product terminal operations primarily depends on the throughput volumes at these terminals. The profitability of our fuels distribution services primarily depends on the sales volumes of certain refined products. The profitability of our refining logistics operations depends on the quantity and availability of our refining logistics assets. A majority of the crude oil and refined product shipments on our pipelines and marine vessels and the refined product throughput at our terminals serve our Refining & Marketing segment and our refining logistics assets and fuels distribution services are used solely by our Refining & Marketing segment. As discussed above in the Refining & Marketing section, MPLX, which is reported in our Midstream segment, has various long-term, fee-based commercial agreements related to services provided to our Refining & Marketing segment. Under these agreements, MPLX has received various commitments of minimum throughput, storage and distribution volumes as well as commitments to pay for all available capacity of certain assets. The volume of crude oil that we transport is directly affected by the supply of, and refiner demand for, crude oil in the markets served directly by our crude oil pipelines, terminals and marine operations. Key factors in this supply and demand balance are the production levels of crude oil by producers in various regions or fields, the availability and cost of alternative modes of transportation, the volumes of crude oil processed at refineries and refinery and transportation system maintenance levels. The volume of refined products that we transport, store, distribute and market is directly affected by the production levels of, and user demand for, refined products in the markets served by our refined product pipelines and marine operations. In most of our markets, demand for gasoline and distillate peaks during the summer driving season, which extends from May through September of each year, and declines during the fall and winter months. As with crude oil, other transportation alternatives and system maintenance levels influence refined product movements.
Our Midstream segment also gathers and processes natural gas and NGLs. NGL and natural gas prices are volatile and are impacted by changes in fundamental supply and demand, as well as market uncertainty, availability of NGL transportation and fractionation capacity and a variety of additional factors that are beyond our control. Our Midstream segment profitability is affected by prevailing commodity prices primarily as a result of processing or conditioning at our own or third‑party processing plants, purchasing and selling or gathering and transporting volumes of natural gas at index‑related prices and the cost of third‑party transportation and fractionation services. To the extent that commodity prices influence the level of natural gas drilling by our producer customers, such prices also affect profitability.
RESULTS OF OPERATIONS
The following discussion includes comments and analysis relating to our results of operations. This discussion should be read in conjunction with Item 1. Financial Statements and is intended to provide investors with a reasonable basis for assessing our historical operations, but should not serve as the only criteria for predicting our future performance.
Consolidated Results of Operations
| | | | | | | | | | | | | | | | | | | | | | | | | | | | | | | | | | | | | | |
| | Three Months Ended
June 30, | | Six Months Ended
June 30, |
| (In millions) | | 2022 | | 2021 | | Variance | | 2022 | | 2021 | | Variance |
| Revenues and other income: | | | | | | | | | | | |
Sales and other operating revenues(a) | $ | 53,795 | | | $ | 29,615 | | | $ | 24,180 | | | $ | 91,853 | | | $ | 52,326 | | | $ | 39,527 | |
| Income from equity method investments | 147 | | | 93 | | | 54 | | | 289 | | | 184 | | | 105 | |
| Net gain (loss) on disposal of assets | 39 | | | — | | | 39 | | | 21 | | | 3 | | | 18 | |
| Other income | 257 | | | 119 | | | 138 | | | 459 | | | 196 | | | 263 | |
| Total revenues and other income | 54,238 | | | 29,827 | | | 24,411 | | | 92,622 | | | 52,709 | | | 39,913 | |
| Costs and expenses: | | | | | | | | | | | |
| Cost of revenues (excludes items below) | 44,207 | | | 27,177 | | | 17,030 | | | 79,275 | | | 48,261 | | | 31,014 | |
| Depreciation and amortization | 819 | | | 871 | | | (52) | | | 1,624 | | | 1,715 | | | (91) | |
| Selling, general and administrative expenses | 694 | | | 625 | | | 69 | | | 1,297 | | | 1,200 | | | 97 | |
| Other taxes | 190 | | | 189 | | | 1 | | | 382 | | | 351 | | | 31 | |
| Total costs and expenses | 45,910 | | | 28,862 | | | 17,048 | | | 82,578 | | | 51,527 | | | 31,051 | |
| Income from continuing operations | 8,328 | | | 965 | | | 7,363 | | | 10,044 | | | 1,182 | | | 8,862 | |
| Net interest and other financial costs | 312 | | | 372 | | | (60) | | | 574 | | | 725 | | | (151) | |
| Income from continuing operations before income taxes | 8,016 | | | 593 | | | 7,423 | | | 9,470 | | | 457 | | | 9,013 | |
| Provision for income taxes on continuing operations | 1,799 | | | 5 | | | 1,794 | | | 2,081 | | | 39 | | | 2,042 | |
| Income from continuing operations, net of tax | 6,217 | | | 588 | | | 5,629 | | | 7,389 | | | 418 | | | 6,971 | |
| Income from discontinued operations, net of tax | — | | | 8,214 | | | (8,214) | | | — | | | 8,448 | | | (8,448) | |
| Net income | 6,217 | | | 8,802 | | | (2,585) | | | 7,389 | | | 8,866 | | | (1,477) | |
| Less net income attributable to: | | | | | | | | | | | |
| Redeemable noncontrolling interest | 21 | | | 21 | | | — | | | 42 | | | 41 | | | 1 | |
| Noncontrolling interests | 323 | | | 269 | | | 54 | | | 629 | | | 555 | | | 74 | |
| Net income attributable to MPC | $ | 5,873 | | | $ | 8,512 | | | $ | (2,639) | | | $ | 6,718 | | | $ | 8,270 | | | $ | (1,552) | |
(a)In accordance with discontinued operations accounting, Speedway sales to retail customers and net results are reflected in Income from discontinued operations, net of tax and Refining & Marketing intercompany sales to Speedway are presented as third party sales through the close of the sale on May 14, 2021.
Second Quarter 2022 Compared to Second Quarter 2021
Net income attributable to MPC decreased $2.64 billion in the second quarter of 2022 compared to the second quarter of 2021 primarily due to income from discontinued operations in the second quarter of 2021, due to the sale of the Speedway business on May 14, 2021, and increased operating costs, partially offset by increases in refined product sales prices and volumes in the second quarter of 2022.
Revenues and other income increased $24.41 billion primarily due to:
•increased sales and other operating revenues of $24.18 billion primarily due to increased Refining & Marketing segment average refined product sales prices of $1.55 per gallon and increased refined product sales volumes of 126 mbpd;
•increased income from equity method investments of $54 million mainly due to increased income from midstream equity affiliates; and
•increased other income of $138 million primarily due to higher income on RIN sales.
Costs and expenses increased $17.05 billion primarily due to
•increased cost of revenues of $17.03 billion mainly due to higher crude oil costs and finished product purchases;
•decreased depreciation and amortization of $52 million primarily due to asset impairments and assets that completed their depreciation life cycle in 2021; and
•increased selling, general and administrative expenses of $69 million primarily due to increased expenses for credit card processing fees, insurance and contract services during the quarter.
Net interest and other financial costs decreased $60 million largely due to pension and other postretirement non-service costs, decreased interest expense due to lower MPC borrowings and increased interest income, partially offset by increased interest expense due to higher MPLX borrowings.
We recorded a combined federal, state and foreign income tax provision of $1.80 billion for the three months ended June 30, 2022, which was higher than the tax computed at the U.S. statutory rate primarily due to state taxes offset by net income attributable to noncontrolling interests. We recorded a combined federal, state and foreign income tax provision of $5 million for the three months ended June 30, 2021, which was lower than the tax computed at the U.S. statutory rate primarily due to income attributable to noncontrolling interests.
Net income attributable to noncontrolling interests increased $54 million primarily due to an increase in MPLX’s net income in the second quarter of 2022.
Six Months Ended June 30, 2022 Compared to Six Months Ended June 30, 2021
Net income attributable to MPC decreased $1.55 billion in the first six months of 2022 compared to the first six months of 2021 primarily due to income from discontinued operations in the first six months of 2021, due to the sale of the Speedway business on May 14, 2021, and increased operating costs, partially offset by increases in average refined product sales prices and volumes in the first six months of 2022.
Revenues and other income increased $39.91 billion primarily due to:
•increased sales and other operating revenues of $39.53 billion primarily due to increased average refined product sales prices of $1.28 per gallon and increased refined product sales volumes of 176 mbpd;
•increased income from equity method investments of $105 million mainly due to increased income from midstream equity affiliates; and
•increased other income of $263 million primarily due to higher income on RIN sales.
Costs and expenses increased $31.05 billion primarily due to:
•increased cost of revenues of $31.01 billion primarily due to higher crude oil costs and finished product purchases;
•decreased depreciation and amortization of $91 million mainly due to asset impairments and assets that completed their depreciation life cycle in 2021; and
•increased selling, general and administrative expenses of $97 million primarily due to increased expenses for credit card processing fees, contract services and insurance in the first six months of 2022.
Net interest and other financial costs decreased $151 million largely due to pension and other postretirement non-service costs, decreased interest expense due to lower MPC borrowings and increased interest income, partially offset by increased interest expense due to higher MPLX borrowings.
We recorded a combined federal, state and foreign income tax expense of $2.08 billion for the six months ended June 30, 2022, which was higher than the tax computed at the U.S. statutory rate primarily due to state taxes offset by net income attributable to noncontrolling interests. We recorded a combined federal, state and foreign income tax provision of $39 million for the six months ended June 30, 2021, which was lower than the tax computed at the U.S. statutory rate primarily due to income attributable to noncontrolling interests.
Net income attributable to noncontrolling interests increased $74 million primarily due to an increase in MPLX’s net income in the first six months of 2022.
Segment Results
We classify our business in the following reportable segments: Refining & Marketing and Midstream. Segment adjusted EBITDA represents adjusted EBITDA attributable to the reportable segments. Amounts included in net income and excluded from segment adjusted EBITDA include: (i) depreciation and amortization; (ii) provision for income taxes; (iii) net interest and other financial costs; (iv) noncontrolling interests; (v) turnaround expenses and (vi) other adjustments as deemed necessary. These items are either: (i) believed to be non-recurring in nature; (ii) not believed to be allocable or controlled by the segment; or (iii) are not tied to the operational performance of the segment.
Refining & Marketing
The following includes key financial and operating data for the second quarter of 2022 compared to the second quarter of 2021 and the six months ended June 30, 2022 compared to the six months ended June 30, 2021.
(a)Includes intersegment sales to Midstream and sales destined for export.
| | | | | | | | | | | | | | | | | | | | | | | | | | |
| | Three Months Ended
June 30, | | Six Months Ended
June 30, |
| | 2022 | | 2021 | | 2022 | | 2021 |
| Refining & Marketing Operating Statistics | | | | | | | | |
Net refinery throughput (mbpd) | | 3,069 | | | 2,854 | | | 2,952 | | | 2,710 | |
Refining & Marketing margin per barrel(a)(b) | | $ | 37.54 | | | $ | 12.45 | | | 26.93 | | | 11.37 | |
| Less: | | | | | | | | |
Refining operating costs per barrel, excluding storm impacts(c) | 5.19 | | | 4.59 | | | 5.20 | | | 4.86 | |
| Distribution costs per barrel | | 4.76 | | | 5.04 | | | 4.77 | | | 5.11 | |
Other income per barrel(d) | | (0.20) | | | (0.08) | | | (0.14) | | | (0.18) | |
| Refining & Marketing adjusted EBITDA per barrel | | $ | 27.79 | | | $ | 2.90 | | | $ | 17.10 | | | $ | 1.58 | |
| Less: | | | | | | | | |
Storm impacts on refining operating cost per barrel(e) | — | | | — | | | — | | | 0.06 | |
| Refining planned turnaround costs per barrel | | 0.54 | | | 0.24 | | | 0.56 | | | 0.35 | |
| Depreciation and amortization per barrel | | 1.70 | | | 1.80 | | | 1.75 | | | 1.93 | |
| Refining & Marketing segment income (loss) per barrel | | $ | 25.55 | | | $ | 0.86 | | | $ | 14.79 | | | $ | (0.76) | |
| Fees paid to MPLX per barrel included in distribution costs above | $ | 3.30 | | | $ | 3.33 | | | $ | 3.38 | | | $ | 3.49 | |
(a)Sales revenue less cost of refinery inputs and purchased products, divided by net refinery throughput.
(b)See “Non-GAAP Measures” section for reconciliation and further information regarding this non-GAAP measure.
(c)Includes refining operating costs and major maintenance costs. Excludes planned turnaround and depreciation and amortization expense.
(d)Includes income (loss) from equity method investments, net gain (loss) on disposal of assets and other income.
(e)Storms in the first quarter of 2021 resulted in higher costs, including maintenance and repairs.
The following information presents certain benchmark prices in our marketing areas and market indicators that we believe are helpful in understanding the results of our Refining & Marketing segment. The benchmark crack spreads below do not reflect the market cost of RINs necessary to meet EPA renewable volume obligations for attributable products under the Renewable Fuel Standard.
| | | | | | | | | | | | | | | | | | | | | | | | | | |
| | Three Months Ended
June 30, | | Six Months Ended
June 30, |
| | 2022 | | 2021 | | 2022 | | 2021 |
Benchmark Spot Prices (dollars per gallon) | | | | | | | | |
| Chicago CBOB unleaded regular gasoline | $ | 3.55 | | | $ | 2.07 | | | $ | 3.07 | | | $ | 1.86 | |
| Chicago ULSD | 3.97 | | | 2.04 | | | 3.41 | | | 1.89 | |
| USGC CBOB unleaded regular gasoline | 3.41 | | | 1.99 | | | 3.05 | | | 1.84 | |
| USGC ULSD | 3.99 | | | 1.95 | | | 3.49 | | | 1.82 | |
| LA CARBOB | | 3.91 | | | 2.22 | | | 3.47 | | | 2.03 | |
| LA CARB diesel | | 4.07 | | | 1.99 | | | 3.56 | | | 1.89 | |
| | | | | | | | |
Market Indicators (dollars per barrel) | | | | | | | | |
| WTI | | $ | 108.52 | | | $ | 66.17 | | | $ | 101.77 | | | $ | 62.22 | |
| MEH | | 109.96 | | | 66.90 | | | 103.36 | | | 63.26 | |
| ANS | | 112.54 | | | 68.51 | | | 104.43 | | | 64.85 | |
| Crack Spreads: | | | | | | | | |
| Mid-Continent WTI 3-2-1 | $ | 38.96 | | | $ | 12.30 | | | $ | 26.05 | | | 10.10 | |
| USGC MEH 3-2-1 | 33.67 | | | 7.96 | | | 24.31 | | | 7.32 | |
| West Coast ANS 3-2-1 | 46.30 | | | 13.42 | | | 36.38 | | | 12.05 | |
Blended 3-2-1(a) | 38.31 | | | 10.79 | | | 27.42 | | | 9.38 | |
| | | | | | | | |
| | | | | | | | | | | | | | | | | | | | | | | | | | |
| | Three Months Ended
June 30, | | Six Months Ended
June 30, |
| | 2022 | | 2021 | | 2022 | | 2021 |
| Crude Oil Differentials: | | | | | | | |
| Sweet | $ | 0.35 | | | $ | (0.27) | | | $ | 0.23 | | | $ | (0.64) | |
| Sour | (5.03) | | | (3.09) | | | (4.95) | | | (3.10) | |
(a) Blended 3-2-1 Mid-Continent/USGC/West Coast crack spread is 40/40/20 percent in 2022 and 2021.
Second Quarter 2022 Compared to Second Quarter 2021
Refining & Marketing segment revenues increased $23.76 billion primarily due to increased average refined product sales prices of $1.55 per gallon and increased refined product sales volumes of 126 mbpd.
Net refinery throughputs increased 215 mbpd during the second quarter of 2022, primarily due to continuing recovery in demand for our products across all our regions.
Refining & Marketing segment adjusted EBITDA increased $7.01 billion primarily due to higher per barrel margins and higher throughput, partially offset by increased refining operating costs, excluding depreciation and amortization, and distribution costs.
Refining & Marketing margin was $37.54 per barrel for the second quarter of 2022 compared to $12.45 per barrel for the second quarter of 2021. Refining & Marketing margin is affected by our performance against the market indicators shown earlier, which use spot market values and an estimated mix of crude purchases and product sales. Based on the market indicators and our crude oil throughput, we estimate a net positive impact of approximately $8 billion on Refining & Marketing margin for the second quarter of 2022 compared to the second quarter of 2021, primarily due to wider crack spreads. Our reported Refining & Marketing margin differs from market indicators due to the mix of crudes purchased and their costs, the effect of market structure on our crude oil acquisition prices, the effect of RIN prices on the crack spread, and other items like refinery yields, other feedstock variances and fuel margin from sales to direct dealers. These factors had an estimated net negative effect of approximately $500 million on Refining & Marketing segment income in the second quarter of 2022 compared to the second quarter of 2021.
For the three months ended June 30, 2022, refining operating costs, excluding depreciation and amortization and storm impacts, increased $255 million, or $0.60 per barrel, compared to the three months ended June 30, 2021 primarily due to an increase in energy costs largely as a result of higher natural gas prices.
Distribution costs, excluding depreciation and amortization, increased $19 million and include fees paid to MPLX of $922 million and $866 million for the second quarter of 2022 and 2021, respectively. On a per barrel basis, distribution costs, excluding depreciation and amortization, decreased $0.28 per barrel due to higher throughput.
Refining planned turnaround costs increased $90 million, or $0.30 per barrel, due to the scope and timing of turnaround activity.
Depreciation and amortization decreased $0.10 per barrel primarily due to higher throughput.
Six Months Ended June 30, 2022 Compared to Six Months Ended June 30, 2021
Refining & Marketing segment revenues increased $38.90 billion primarily due to increased average refined product sales prices of $1.28 per gallon and higher refined product sales volumes, which increased 176 mbpd.
Net refinery throughputs increased 242 mbpd in the first six months of 2022, primarily due to continuing recovery in demand for our products across all our regions.
Refining & Marketing segment adjusted EBITDA increased $8.36 billion primarily driven by higher per barrel margins and higher throughput, partially offset by increased refining operating costs, excluding depreciation and amortization, and distribution costs.
Refining & Marketing margin was $26.93 per barrel for the first six months of 2022 compared to $11.37 per barrel for the first six months of 2021. Refining & Marketing margin is affected by the market indicators shown earlier, which use spot market values and an estimated mix of crude purchases and product sales. Based on the market indicators and our crude oil throughput, we estimate a net positive impact of approximately $10 billion on Refining & Marketing margin for the first six months of 2022 compared to the first six months of 2021, primarily due to wider crack spreads. Our reported Refining & Marketing margin differs from market indicators due to the mix of crudes purchased and their costs, market structure on our crude oil acquisition prices, RIN prices on the crack spread, and other items like refinery yields, other feedstock variances and fuel margin from sales to direct dealers. These factors had an estimated net negative effect of approximately $1 billion on Refining & Marketing segment income in the first six months of 2022 compared to the first six months of 2021.
For the six months ended June 30, 2022, refining operating costs, excluding depreciation and amortization and storm impacts, increased $397 million, or $0.34 per barrel, compared to the six months ended June 30, 2021 primarily due to an increase in energy costs largely as a result of higher natural gas and electricity prices.
Distribution costs, excluding depreciation and amortization, increased $43 million for the first six months of 2022 and include fees paid to MPLX of $1.80 billion and $1.71 billion for the first six months of 2022 and 2021, respectively. On a per barrel basis, distribution costs, excluding depreciation and amortization, decreased $0.34 per barrel due to higher throughput.
Refining planned turnaround costs increased $123 million, or $0.21 per barrel, due to the scope and timing of turnaround activity.
Depreciation and amortization decreased $0.18 per barrel primarily due to higher throughput.
We purchase RINs to satisfy a portion of our RFS2 compliance. Our expenses associated with purchased RINs were $1.07 billion and $633 million in the first six months of 2022 and 2021, respectively, and are included in Refining & Marketing margin. The increase in the first six months of 2022, was primarily due to higher weighted average RIN costs and an increase in RIN obligations.
Supplemental Refining & Marketing Statistics
| | | | | | | | | | | | | | | | | | | | | | | |
| Three Months Ended
June 30, | | Six Months Ended
June 30, |
| 2022 | | 2021 | | 2022 | | 2021 |
| Refining & Marketing Operating Statistics | | | | | | | |
Crude oil capacity utilization percent(a) | 100 | | | 94 | | | 96 | | | 89 | |
Refinery throughputs (mbpd): | | | | | | | |
| Crude oil refined | 2,896 | | | 2,713 | | | 2,761 | | | 2,548 | |
| Other charge and blendstocks | 173 | | | 141 | | | 191 | | | 162 | |
| Net refinery throughput | 3,069 | | | 2,854 | | | 2,952 | | | 2,710 | |
| Sour crude oil throughput percent | 48 | | | 48 | | | 47 | | | 48 | |
| Sweet crude oil throughput percent | 52 | | | 52 | | | 53 | | | 52 | |
Refined product yields (mbpd): | | | | | | | |
| Gasoline | 1,536 | | | 1,436 | | | 1,510 | | | 1,380 | |
| Distillates | 1,123 | | | 984 | | | 1,051 | | | 933 | |
| Propane | 74 | | | 54 | | | 71 | | | 50 | |
| NGLs and petrochemicals | 224 | | | 301 | | | 193 | | | 262 | |
| Heavy fuel oil | 54 | | | 27 | | | 70 | | | 31 | |
| Asphalt | 91 | | | 91 | | | 89 | | | 94 | |
| Total | 3,102 | | | 2,893 | | | 2,984 | | | 2,750 | |
Refined product export sales volumes (mbpd)(b) | 326 | | | 231 | | | 298 | | | 237 | |
(a)Based on calendar-day capacity, which is an annual average that includes down time for planned maintenance and other normal operating activities.
(b)Represents fully loaded export cargoes for each time period. These sales volumes are included in the total sales volume amounts.
Midstream
The following includes key financial and operating data for the second quarter of 2022 compared to the second quarter of 2021 and the six months ended June 30, 2022 compared to the six months ended June 30, 2021.
(a)On owned common-carrier pipelines, excluding equity method investments.
(b)Includes amounts related to MPLX operated unconsolidated equity method investments on a 100 percent basis.
| | | | | | | | | | | | | | | | | | | | | | | | | | |
| | Three Months Ended
June 30, | | Six Months Ended
June 30, |
| Benchmark Prices | | 2022 | | 2021 | | 2022 | | 2021 |
Natural Gas NYMEX HH ($ per MMBtu) | $ | 7.50 | | | $ | 2.97 | | | $ | 6.04 | | | $ | 2.85 | |
C2 + NGL Pricing ($ per gallon)(a) | $ | 1.18 | | | $ | 0.75 | | | $ | 1.16 | | | $ | 0.74 | |
(a)C2 + NGL pricing based on Mont Belvieu prices assuming an NGL barrel of approximately 35 percent ethane, 35 percent propane, 6 percent iso-butane, 12 percent normal butane and 12 percent natural gasoline.
Second Quarter 2022 Compared to Second Quarter 2021
Midstream segment revenue and segment adjusted EBITDA increased $494 million and $148 million, respectively. Results for the quarter benefited from higher revenue, primarily due to higher prices and volumes, increased revenue from terminal activities and higher income from equity affiliates, partially offset by higher operating expenses.
Six Months Ended June 30, 2022 Compared to Six Months Ended June 30, 2021
Midstream segment revenue and segment adjusted EBITDA increased $758 million and $229 million, respectively. Results benefited from higher revenue, primarily due to higher prices and volumes, increased pipeline throughputs, increased revenue from terminal activities and increased income from equity affiliates, partially offset by higher operating expenses in the first six months of 2022.
Corporate
| | | | | | | | | | | | | | | | | | | | | | | | | | |
Key Financial Information (in millions) | | Three Months Ended
June 30, | | Six Months Ended
June 30, |
| | 2022 | | 2021 | | 2022 | | 2021 |
Corporate(a) | $ | (170) | | | $ | (180) | | | (321) | | | (337) | |
(a)Corporate costs consist primarily of MPC’s corporate administrative expenses and costs related to certain non-operating assets, except for corporate overhead expenses attributable to MPLX, which are included in the Midstream segment. Corporate costs include depreciation and amortization of $14 million and $74 million for the second quarter of 2022 and 2021, respectively, and $27 million and $106 million for the six months ended June 30, 2022 and 2021, respectively.
Items not Allocated to Segments
| | | | | | | | | | | | | | | | | | | | | | | | | | |
Key Financial Information (in millions) | | Three Months Ended
June 30, | | Six Months Ended
June 30, |
| | 2022 | | 2021 | | 2022 | | 2021 |
| Items not allocated to segments: | | | | | | | | |
| Renewable volume obligation requirements | $ | 238 | | | $ | — | | | $ | 238 | | | $ | — | |
| Litigation | | — | | | — | | | 27 | | | — | |
| Impairment and idling expenses | | — | | | (13) | | | — | | | (13) | |
| Total items not allocated to segments: | $ | 238 | | | $ | (13) | | | $ | 265 | | | $ | (13) | |
Second Quarter 2022 Compared to Second Quarter 2021
Items not allocated to segments included a $238 million benefit related to retroactive changes in renewable volume obligation requirements published by the EPA for 2020 and 2021 in the second quarter of 2022.
Six Months Ended June 30, 2022 Compared to Six Months Ended June 30, 2021
In the first six months of 2022, total items not allocated to segments primarily included a $238 million benefit related to retroactive changes in renewable volume obligation requirements published by the EPA for 2020 and 2021.
Non-GAAP Financial Measure
Management uses a financial measure to evaluate our operating performance that is calculated and presented on the basis of a methodology other than in accordance with GAAP. We believe this non-GAAP financial measure is useful to investors and analysts to assess our ongoing financial performance because, when reconciled to its most comparable GAAP financial measure, it provides improved comparability between periods through the exclusion of certain items that we believe are not indicative of our core operating performance and that may obscure our underlying business results and trends. This measure should not be considered a substitute for, or superior to, measures of financial performance prepared in accordance with GAAP, and our calculation thereof may not be comparable to similarly titled measures reported by other companies. The non-GAAP financial measure we use is as follows:
Refining & Marketing Margin
Refining & Marketing margin is defined as sales revenue less the cost of refinery inputs and purchased products and excludes other items as reflected in the table below.
Reconciliation of Refining & Marketing income (loss) from operations to Refining & Marketing gross margin and Refining & Marketing margin
| | | | | | | | | | | | | | | | | | | | | | | | | | | | | |
| | | Three Months Ended
June 30, | | Six Months Ended
June 30, |
| (in millions) | | 2022 | | 2021 | | 2022 | | 2021 |
| Refining & Marketing income (loss) from operations | | $ | 7,134 | | | $ | 224 | | | $ | 7,902 | | | $ | (374) | |
| Plus (Less): | | | | | | | | |
| Selling, general and administrative expenses | | 574 | | | 499 | | | 1,082 | | | 955 | |
| Income from equity method investments | | (6) | | | (14) | | | (18) | | | (19) | |
| Net gain on disposal of assets | | (37) | | | — | | | (37) | | | (3) | |
| Other income | | (234) | | | (89) | | | (415) | | | (143) | |
| Refining & Marketing gross margin | | 7,431 | | | 620 | | | 8,514 | | | 416 | |
| Plus (Less): | | | | | | | | |
| Operating expenses (excluding depreciation and amortization) | | 2,554 | | | 2,305 | | | 4,943 | | | 4,580 | |
| Depreciation and amortization | | 475 | | | 466 | | | 936 | | | 944 | |
Gross margin excluded from and other income included in Refining & Marketing margin(a) | | 71 | | | (116) | | | 85 | | | (295) | |
| Other taxes included in Refining & Marketing margin | | (49) | | | (42) | | | (92) | | | (66) | |
| Refining & Marketing margin | | $ | 10,482 | | | $ | 3,233 | | | $ | 14,386 | | | $ | 5,579 | |
(a)Reflects the gross margin, excluding depreciation and amortization, of other related operations included in the Refining & Marketing segment and processing of credit card transactions on behalf of certain of our marketing customers, net of other income.
LIQUIDITY AND CAPITAL RESOURCES
Cash Flows
Our consolidated cash and cash equivalents balance for continuing operations was approximately $9.08 billion at June 30, 2022 compared to $5.29 billion at December 31, 2021. Net cash provided by (used in) operating activities, investing activities and financing activities are presented in the following table. | | | | | | | | | | | | | | |
| | | Six Months Ended
June 30, |
| (In millions) | | 2022 | | 2021 |
| Net cash provided by (used in): | | | |
| Operating activities - continuing operations | $ | 9,509 | | | $ | 1,801 | |
| Operating activities - discontinued operations | (44) | | | 33 | |
| Total operating activities | 9,465 | | | 1,834 | |
| Investing activities - continuing operations | 620 | | | (5,832) | |
| Investing activities - discontinued operations | — | | | 21,235 | |
| Total investing activities | 620 | | | 15,403 | |
| Financing activities | (6,296) | | | (5,954) | |
| Total increase (decrease) in cash | $ | 3,789 | | | $ | 11,283 | |
Operating Activities
Continuing Operations
Net cash provided by continuing operations increased $7.71 billion in the first six months of 2022 compared to the first six months of 2021. The change in net cash provided by continuing operations is primarily due to an increase in operating results and a favorable change in working capital of $1.03 billion when comparing the change in working capital in both periods.
For the first six months of 2022, changes in working capital, excluding changes in short-term debt, were a net $678 million source of cash primarily due to the effects of increasing energy commodity prices and volumes at the end of the period on working capital. Accounts payable increased primarily due to increases in crude prices and volumes. Current receivables increased primarily due to increases in refined product and crude volumes and prices. Inventories increased primarily due to increases in crude and refined product inventories.
For the first six months of 2021, changes in working capital, excluding changes in short-term debt, were a net $347 million use of cash primarily due to the effects of increasing energy commodity prices at the end of the period on working capital. Accounts payable increased primarily due to increases in crude prices and volumes. Current receivables increased primarily due to higher crude and refined product prices and volumes. Inventories increased due to increases in refined product and crude inventories.
Discontinued Operations
Net cash used in discontinued operations reflects the results of the Speedway business. The change from 2021 is due to the sale of Speedway on May 14, 2021. The $44 million use of cash in the first six months of 2022 represents payment of state income tax liabilities.
Investing Activities
Continuing Operations
Net cash provided by continuing operations was $620 million in the first six months of 2022 compared to net cash used by continuing operations of $5.83 billion in the first six months of 2021.
•The change in net cash provided by continuing operations is primarily due to maturities and sales of short-term investments of $2.81 billion and $1.08 billion, respectively, partially offset by purchases of short-term investments of $2.58 billion. The cash provided by maturities and sales of short-term investments was primarily used to fund our return of capital initiatives announced as part of the Speedway sale.
•Additions to property, plant and equipment increased $387 million primarily due to increased capital expenditures in our Refining & Marketing and Midstream segments. See the “Capital Requirements” section for additional information on our capital investment plan.
•Cash used for acquisitions of $74 million include acquisitions in our Refining & Marketing and Midstream segments.
•Cash used for net investments increased $50 million mainly due to increased MPLX contributions to equity method investments, which included the $60 million contribution to its Bakken Pipeline joint venture to fund its share of a debt repayment by the joint venture.
The consolidated statements of cash flows exclude changes to the consolidated balance sheets that did not affect cash. A reconciliation of additions to property, plant and equipment per the consolidated statements of cash flows to reported total capital expenditures and investments follows. | | | | | | | | | | | | | | |
| | | Six Months Ended
June 30, |
| (In millions) | | 2022 | | 2021 |
| Additions to property, plant and equipment per the consolidated statements of cash flows | $ | 993 | | | $ | 606 | |
| | | |
| | | |
| Decrease in capital accruals | (3) | | | (19) | |
| Total capital expenditures | 990 | | | 587 | |
| Investments in equity method investees (excludes acquisitions) | 160 | | | 113 | |
| Total capital expenditures and investments | $ | 1,150 | | | $ | 700 | |
Discontinued Operations
The change in net cash used in discontinued operations is primarily due to the sale of Speedway on May 14, 2021.
Financing Activities
Financing activities were a net $6.30 billion use of cash in the first six months of 2022 compared to a net $5.95 billion use of cash in the first six months of 2021.
•MPC had net borrowings of $1.02 billion under its commercial paper program in the first six months of 2021.
•Long-term debt borrowings and repayments were a net $1.13 billion source of cash in the first six months of 2022 compared to a net $2.28 billion use of cash in the first six months of 2021. During the first six months of 2022, MPLX issued $1.5 billion of senior notes and had net payments of $300 million under its revolving credit facility.
During the first six months of 2021, MPC repaid $1.3 billion of senior notes, borrowed and repaid $3.65 billion under its revolving credit facility and borrowed and repaid $4.65 billion under its trade receivables facility. MPLX redeemed $750 million of senior notes and had net payments of $175 million under its revolving credit facility.
•Cash used in common stock repurchases, including fees and expenses, totaled $6.18 billion in the first six months of 2022 compared to $984 million in the first six months of 2021. See the “Capital Requirements” section for further discussion of our stock repurchases.
•Cash used in dividend payments decreased $117 million primarily due to a reduction of shares resulting from share repurchases in 2022 and 2021.
•Cash used in repurchases of noncontrolling interests was $135 million in the first six months of 2022 compared to $310 million in the first six months of 2021 related to the repurchase of MPLX common units. See Note 5 to the unaudited consolidated financial statements for further discussion of MPLX.
Derivative Instruments
See Item 3. Quantitative and Qualitative Disclosures about Market Risk for a discussion of derivative instruments and associated market risk.
Capital Resources
MPC, Excluding MPLX
We control MPLX through our ownership of the general partner, however, the creditors of MPLX do not have recourse to MPC’s general credit through guarantees or other financial arrangements, except as noted. MPC has effectively guaranteed certain indebtedness of LOOP and LOCAP, in which MPLX holds an interest. Therefore, in the following table, we present the liquidity of MPC, excluding MPLX. MPLX liquidity is discussed in the following section.
Our liquidity, excluding MPLX, totaled $18.02 billion at June 30, 2022 consisting of:
| | | | | | | | | | | | | | | | | | | | | | | | | | |
| | June 30, 2022 |
| (In millions) | | Total Capacity | | Outstanding Borrowings | | Outstanding
Letters
of Credit | | Available
Capacity |
| Bank revolving credit facility | $ | 5,000 | | | $ | — | | | $ | 1 | | | $ | 4,999 | |
Trade receivables facility(a) | 100 | | | — | | | 100 | | | — | |
| Total | $ | 5,100 | | | $ | — | | | $ | 101 | | | $ | 4,999 | |
Cash and cash equivalents and short-term investments(b) | | | | | | | 13,021 | |
| Total liquidity | | | | | | | $ | 18,020 | |
(a)The committed borrowing and letter of credit issuance capacity of the trade receivables securitization facility is $100 million. In addition, the facility allows for the issuance of letters of credit in excess of the committed capacity at the discretion of the issuing banks. As of June 30, 2022, letters of credit in the total amount of $358 million were issued and outstanding under the facility to secure contracts awarded by the Department of Energy to purchase crude oil from the Strategic Petroleum Reserve. In July 2022, the trade receivables securitization facility was amended to, among other things, extend its term until September 29, 2023.
(b)Excludes cash and cash equivalents of MPLX of $298 million.
Because of the alternatives available to us, including internally generated cash flow and access to capital markets and a commercial paper program, we believe that our short-term and long-term liquidity is adequate to fund not only our current operations, but also our near-term and long-term funding requirements, including capital spending programs, the repurchase of shares of our common stock, dividend payments, defined benefit plan contributions, repayment of debt maturities and other amounts that may ultimately be paid in connection with contingencies.
We have a commercial paper program that allows us to have a maximum of $2.0 billion in commercial paper outstanding. We do not intend to have outstanding commercial paper borrowings in excess of available capacity under our bank revolving credit facility. At June 30, 2022, we had no borrowings outstanding under the commercial paper program.
On July 7, 2022, MPC entered into a new five-year revolving credit agreement (the “New MPC Credit Agreement”) to replace its previous $5.0 billion credit facility that was scheduled to expire in October 2023. The New MPC Credit Agreement, among other things, provides for a $5.0 billion unsecured revolving credit facility that matures in July 2027. The financial covenants of the New MPC Credit Agreement are substantially the same as those contained in the previous credit agreement.
The New MPC Credit Agreement and trade receivables facility contain representations and warranties, affirmative and negative covenants and events of default that we consider usual and customary for agreements of these types. The financial covenant included in the New MPC Credit Agreement requires us to maintain, as of the last day of each fiscal quarter, a ratio of Consolidated Net Debt to Total Capitalization (as defined in the New MPC Credit Agreement) of no greater than 0.65 to 1.00.
As of June 30, 2022, we were in compliance with the covenants required by the agreements governing MPC’s previous revolving credit facility and MPC’s trade receivables facility, including the financial covenant with a ratio of Consolidated Net Debt to Total Capitalization of approximately 0.00 to 1.00.
Our intention is to maintain an investment-grade credit profile. As of June 30, 2022, the credit ratings on our senior unsecured debt are as follows.
| | | | | | | | |
| Company | Rating Agency | Rating |
| MPC | Moody’s | Baa2 (stable outlook) |
| Standard & Poor’s | BBB (stable outlook) |
| Fitch | BBB (stable outlook) |
The ratings reflect the respective views of the rating agencies. Although it is our intention to maintain a credit profile that supports an investment grade rating, there is no assurance that these ratings will continue for any given period of time. The ratings may be revised or withdrawn entirely by the rating agencies if, in their respective judgments, circumstances so warrant.
The New MPC Credit Agreement does not contain credit rating triggers that would result in the acceleration of interest, principal or other payments in the event that our credit ratings are downgraded. However, any downgrades of our senior unsecured debt could increase the applicable interest rates, yields and other fees payable thereunder and may limit our flexibility to obtain financing in the future, including to refinance existing indebtedness. In addition, a downgrade of our senior unsecured debt rating to below investment-grade levels could, under certain circumstances, impact our ability to purchase crude oil on an unsecured basis and could result in us having to post letters of credit under existing transportation services or other agreements.
See Note 18 to the unaudited consolidated financial statements for further discussion of our debt.
MPLX
MPLX’s liquidity totaled $5.30 billion at June 30, 2022 consisting of:
| | | | | | | | | | | | | | | | | | | | | | | | | | |
| | June 30, 2022 |
| (In millions) | | Total Capacity | | Outstanding Borrowings | | Outstanding
Letters
of Credit | | Available
Capacity |
MPLX LP - bank revolving credit facility(a) | $ | 3,500 | | | $ | — | | | $ | — | | | $ | 3,500 | |
| MPC intercompany loan agreement | 1,500 | | | — | | | — | | | 1,500 | |
| Total | $ | 5,000 | | | $ | — | | | $ | — | | | $ | 5,000 | |
| Cash and cash equivalents | | | | | | | 298 | |
| Total liquidity | | | | | | | $ | 5,298 | |
(a) The total capacity under this facility decreased to $2.0 billion upon the execution of the New MPLX Credit Agreement on July 7, 2022, as described below.
On March 14, 2022, MPLX issued $1.5 billion aggregate principal amount of 4.950% senior notes due March 2052 in an underwritten public offering. The net proceeds were used to repay amounts outstanding under the MPC intercompany loan agreement and the MPLX credit agreement.
On July 7, 2022, MPLX entered into a new five-year revolving credit agreement (the “New MPLX Credit Agreement”) to replace its previous $3.5 billion credit facility that was scheduled to expire in July 2024. The New MPLX Credit Agreement, among other things, provides for a $2.0 billion unsecured revolving credit facility that matures in July 2027. The New MPLX Credit Agreement also provides for letter of credit issuing capacity under the facility of $150 million. Letters of credit issuing capacity is included in, not in addition to, the $2.0 billion borrowing capacity of the New MPLX Credit Agreement. The financial covenants of the New MPLX Credit Agreement are substantially the same as those contained in the previous credit agreement.
The New MPLX Credit Agreement contains certain representations and warranties, affirmative and restrictive covenants and events of default that we consider to be usual and customary for an agreement of this type. The financial covenant requires MPLX to maintain a ratio of Consolidated Total Debt as of the end of each fiscal quarter to Consolidated EBITDA (both as defined in the MPLX credit agreement) for the prior four fiscal quarters of no greater than 5.0 to 1.0 (or 5.5 to 1.0 during the six-month period following certain acquisitions). Consolidated EBITDA is subject to adjustments for certain acquisitions completed and capital projects undertaken during the relevant period. Other covenants restrict MPLX and/or certain of its subsidiaries from incurring debt, creating liens on assets and entering into transactions with affiliates.
As of June 30, 2022, MPLX was in compliance with the covenants required by the agreement governing MPLX’s previous revolving credit facility, including the financial covenant with a ratio of Consolidated Total Debt to Consolidated EBITDA of 3.54 to 1.0.
Our intention is to maintain an investment-grade credit profile for MPLX. As of June 30, 2022, the credit ratings on MPLX’s senior unsecured debt are as follows.
| | | | | | | | |
| Company | Rating Agency | Rating |
| MPLX | Moody’s | Baa2 (stable outlook) |
| Standard & Poor’s | BBB (stable outlook) |
| Fitch | BBB (stable outlook) |
The ratings reflect the respective views of the rating agencies. Although it is our intention to maintain a credit profile that supports an investment grade rating for MPLX, there is no assurance that these ratings will continue for any given period of time. The ratings may be revised or withdrawn entirely by the rating agencies if, in their respective judgments, circumstances so warrant.
The agreements governing MPLX’s debt obligations do not contain credit rating triggers that would result in the acceleration of interest, principal or other payments in the event that MPLX credit ratings are downgraded. However, any downgrades of MPLX senior unsecured debt to below investment grade ratings could increase the applicable interest rates, yields and other fees
payable under such agreements. In addition, a downgrade of MPLX senior unsecured debt ratings to below investment-grade levels may limit MPLX’s ability to obtain future financing, including to refinance existing indebtedness.
See Note 18 to the unaudited consolidated financial statements for further discussion of MPLX’s debt.
Capital Requirements
Capital Investment Plan
MPC's capital investment plan for 2022 totals approximately $1.7 billion for capital projects and investments, excluding capitalized interest, potential acquisitions and MPLX’s capital investment plan. MPC’s capital investment plan includes all of the planned capital spending for Refining & Marketing and Corporate, as well as a portion of the planned capital investments for Midstream. The remainder of the planned capital spending for Midstream reflects the capital investment plan for MPLX, which totals $900 million. We continuously evaluate our capital investment plan and make changes as conditions warrant.
Capital expenditures and investments for MPC and MPLX are summarized below. | | | | | | | | | | | | | | |
| | | Six Months Ended
June 30, |
| (In millions) | | 2022 | | 2021 |
Capital expenditures and investments:(a) | | | | |
| MPC continuing operations, excluding MPLX | | | | |
| Refining & Marketing | | $ | 559 | | | $ | 310 | |
| Midstream - Other | | 5 | | | 36 | |
Corporate and Other(b) | | 38 | | | 44 | |
| Total MPC continuing operations, excluding MPLX | | $ | 602 | | | $ | 390 | |
| | | | |
| MPC discontinued operations - Speedway | | $ | — | | | $ | 177 | |
| | | | |
| Midstream - MPLX | | $ | 500 | | | $ | 280 | |
(a) Capital expenditures include changes in capital accruals.
(b) Excludes capitalized interest of $48 million and $30 million for the six months ended June 30, 2022 and 2021, respectively.
Capital expenditures and investments in affiliates during the six months ended June 30, 2022, were primarily for Refining & Marketing and Midstream projects. Major Refining & Marketing projects include renewables projects, primarily the Martinez facility conversion, the South Texas Asset Repositioning project and projects that we expect will help us reduce future operating costs.
Major Midstream projects were primarily for MPLX gas gathering, processing and de-ethanization projects in the Bakken, Marcellus, and Southwest regions and the expansion of MPLX crude gathering systems in the Permian and Bakken regions. Spending also included the $60 million contribution to MPLX’s Bakken Pipeline joint venture to fund MPLX’s share of a debt repayment by the joint venture.
Share Repurchases
During the six months ended June 30, 2022, MPC repurchased approximately 71 million shares of its common stock at an average cost per share of $85.31 and paid $6.18 billion of cash.
From January 1, 2012 through June 30, 2022, our board of directors has approved $30.05 billion in total share repurchase authorizations and we have repurchased a total of $25.88 billion of our common stock. As of June 30, 2022, MPC has $4.17 billion remaining under its share repurchase authorizations.
On August 2, 2022, we announced our board of directors approved an incremental $5.0 billion share repurchase authorization. The authorization has no expiration date.
We may utilize various methods to effect the repurchases, which could include open market repurchases, negotiated block transactions, tender offers, accelerated share repurchases or open market solicitations for shares, some of which may be effected through Rule 10b5-1 plans. The timing and amount of future repurchases, if any, will depend upon several factors, including market and business conditions, and such repurchases may be discontinued at any time.
MPLX Unit Repurchases
During the six months ended June 30, 2022, MPLX repurchased approximately 4 million MPLX common units at an average cost per unit of $32.48 and paid $135 million of cash. As of June 30, 2022, $202 million remained available under the authorization for future unit repurchases.
On August 2, 2022, MPLX announced its board of directors approved an incremental $1.0 billion unit repurchase authorization. This unit repurchase authorization has no expiration date.
MPLX may utilize various methods to effect the repurchases, which could include open market repurchases, negotiated block transactions, tender offers, accelerated share repurchases or open market solicitations for shares, some of which may be effected through Rule 10b5-1 plans. The timing and amount of future repurchases, if any, will depend upon several factors, including market and business conditions, and such repurchases may be discontinued at any time.
Cash Commitments
Contractual Obligations
As of June 30, 2022, our purchase commitments primarily consist of obligations to purchase and transport crude oil used in our refining operations. During the first six months of 2022, there were no material changes to our contractual obligations outside the ordinary course of business since December 31, 2021.
Our other contractual obligations primarily consist of long-term debt and pension and post-retirement obligations, for which additional information is included in Notes 18 and 22, respectively, to the unaudited consolidated financial statements, and financing and operating leases.
Other Cash Commitments
On July 27, 2022, our board of directors approved a dividend of $0.58 per share on common stock. The dividend is payable September 12, 2022, to shareholders of record as of the close of business on August 17, 2022.
We may, from time to time, repurchase our senior notes in the open market, in tender offers, in privately-negotiated transactions or otherwise in such volumes, at such prices and upon such other terms as we deem appropriate.
ENVIRONMENTAL MATTERS AND COMPLIANCE COSTS
We have incurred and may continue to incur substantial capital, operating and maintenance, and remediation expenditures as a result of environmental laws and regulations. If these expenditures, as with all costs, are not ultimately reflected in the prices of our products and services, our operating results will be adversely affected. We believe that substantially all of our competitors must comply with similar environmental laws and regulations. However, the specific impact on each competitor may vary depending on a number of factors, including the age and location of its operating facilities, marketing areas, production processes and whether it is also engaged in the petrochemical business or the marine transportation of crude oil and refined products.
As previously disclosed in our Annual Report on Form 10-K for the year ended December 31, 2021, actual expenditures may vary as the number and scope of environmental projects are revised as a result of improved technology or changes in regulatory requirements. During the first quarter the Company identified an additional project to be included in 2022 environmental capital expenditures, bringing the total expenditures anticipated for 2022 to $85 million. This amount is reflected in the Company’s 2022 capital plan.
There have been no additional significant changes to our environmental matters and compliance costs during the six months ended June 30, 2022.
CRITICAL ACCOUNTING ESTIMATES
As of June 30, 2022, there have been no significant changes to our critical accounting estimates since our Annual Report on Form 10-K for the year ended December 31, 2021.
ACCOUNTING STANDARDS NOT YET ADOPTED
We have not identified any recent accounting pronouncements that are expected to have a material impact on our financial condition, results of operations or cash flows upon adoption.
ITEM 3. QUANTITATIVE AND QUALITATIVE DISCLOSURES ABOUT MARKET RISK
For a detailed discussion of our risk management strategies and our derivative instruments, see Item 7A. Quantitative and Qualitative Disclosures about Market Risk in our Annual Report on Form 10-K for the year ended December 31, 2021.
See Notes 16 and 17 to the unaudited consolidated financial statements for more information about the fair value measurement of our derivatives, as well as the amounts recorded in our consolidated balance sheets and statements of income. We do not designate any of our commodity derivative instruments as hedges for accounting purposes.
The following table includes the composition of net losses on our commodity derivative positions as of June 30, 2022 and 2021, respectively. | | | | | | | | | | | | | | |
| | | Six Months Ended
June 30, |
| (In millions) | 2022 | | 2021 |
| Realized loss on settled derivative positions | $ | (458) | | | $ | (172) | |
| Unrealized gain (loss) on open net derivative positions | 134 | | | (76) | |
| Net loss | $ | (324) | | | $ | (248) | |
See Note 17 to the unaudited consolidated financial statements for additional information on our open derivative positions at June 30, 2022.
Sensitivity analysis of the effects on income from operations (“IFO”) of hypothetical 10 percent and 25 percent increases and decreases in commodity prices for open commodity derivative instruments as of June 30, 2022 is provided in the following table. | | | | | | | | | | | | | | | | | | | | | | | | | | |
| | | Change in IFO from a
Hypothetical Price
Increase of | | Change in IFO from a
Hypothetical Price
Decrease of |
| (In millions) | | 10% | | 25% | | 10% | | 25% |
| As of June 30, 2022 | | | | | | | |
| Crude | $ | (98) | | | $ | (244) | | | $ | 98 | | | $ | 244 | |
| Refined products | (37) | | | (92) | | | 37 | | | 92 | |
| Blending products | (30) | | | (75) | | | 30 | | | 75 | |
| Soybean oil | (13) | | | (33) | | | 13 | | | 33 | |
We remain at risk for possible changes in the market value of commodity derivative instruments; however, such risk should be mitigated by price changes in the underlying physical commodity. Effects of these offsets are not reflected in the above sensitivity analysis.
We evaluate our portfolio of commodity derivative instruments on an ongoing basis and add or revise strategies in anticipation of changes in market conditions and in risk profiles. Changes to the portfolio after June 30, 2022 would cause future IFO effects to differ from those presented above.
Sensitivity analysis of the effect of a hypothetical 100-basis-point change in interest rates on long-term debt, including the portion classified as current and excluding finance leases, as of June 30, 2022 is provided in the following table. The fair value of cash and cash equivalents, receivables, accounts payable and accrued interest approximate carrying value and, in addition to short-term investments which are recorded at fair value, are relatively insensitive to changes in interest rates due to the short-term maturity of the instruments. Accordingly, these instruments are excluded from the table.
| | | | | | | | | | | | | | | | | | | | |
| (In millions) | | Fair Value as of June 30, 2022(a) | | Change in
Fair Value(b) | | Change in Net Income for the Six Months Ended June 30, 2022(c) |
| Long-term debt | | | | | |
| Fixed-rate | $ | 24,949 | | | $ | 2,009 | | | n/a |
| Variable-rate | — | | | — | | | $ | — | |
(a)Fair value was based on market prices, where available, or current borrowing rates for financings with similar terms and maturities.
(b)Assumes a 100-basis-point decrease in the weighted average yield-to-maturity at June 30, 2022.
(c)Assumes a 100-basis-point change in interest rates. The change to net income was based on the weighted average balance of debt outstanding for the six months ended June 30, 2022.
At June 30, 2022, our long-term debt was composed of fixed-rate instruments. The fair value of our fixed-rate debt is relatively sensitive to interest rate fluctuations. Our sensitivity to interest rate declines and corresponding increases in the fair value of our debt unfavorably affects our results of operations and cash flows only when we elect to repurchase or otherwise retire fixed-rate debt at prices above carrying value. Interest rate fluctuations generally do not impact the fair value of our variable-rate debt, but may affect our results of operations and cash flows.
See Note 16 to the unaudited consolidated financial statements for additional information on the fair value of our debt.
ITEM 4. CONTROLS AND PROCEDURES
Disclosure Controls and Procedures
An evaluation of the effectiveness of the design and operation of our disclosure controls and procedures (as defined in Rule 13a-15(e) under the Securities Exchange Act of 1934, as amended) was carried out under the supervision and with the participation of our management, including our chief executive officer and chief financial officer. Based upon that evaluation, the chief executive officer and chief financial officer concluded that the design and operation of these disclosure controls and procedures were effective as of June 30, 2022, the end of the period covered by this report.
Changes in Internal Control over Financial Reporting
During the quarter ended June 30, 2022, there were no changes in our internal control over financial reporting that have materially affected, or are reasonably likely to materially affect, our internal control over financial reporting.
PART II – OTHER INFORMATION
ITEM 1. LEGAL PROCEEDINGS
We are the subject of, or a party to, a number of pending or threatened legal actions, contingencies and commitments involving a variety of matters, including laws and regulations relating to the environment. While it is possible that an adverse result in one or more of the lawsuits or proceedings in which we are a defendant could be material to us, based upon current information and our experience as a defendant in other matters, we believe that these lawsuits and proceedings, individually or in the aggregate, will not have a material adverse effect on our consolidated results of operations, financial position or cash flows.
Item 103 of Regulation S-K promulgated by the SEC requires disclosure of certain environmental matters when a governmental authority is a party to the proceedings and such proceedings involve potential monetary sanctions, unless we reasonably believe that the matter will result in no monetary sanctions, or in monetary sanctions, exclusive of interest and costs, of less than $300,000.
There have been no material changes to the legal matters previously disclosed in our Annual Report on Form 10-K for the year ended December 31, 2021, or in our Quarterly Report on Form 10-Q for the quarter ended March 31, 2022.
ITEM 1A. RISK FACTORS
There have been no material changes from the risk factors previously disclosed in our Annual Report on Form 10-K for the year ended December 31, 2021.
ITEM 2. UNREGISTERED SALES OF EQUITY SECURITIES AND USE OF PROCEEDS
The following table sets forth a summary of our purchases during the quarter ended June 30, 2022, of equity securities that are registered by MPC pursuant to Section 12 of the Securities Exchange Act of 1934, as amended. | | | | | | | | | | | | | | | | | | | | | | | |
| | | | | | | Millions of Dollars |
| Period | Total Number
of Shares
Purchased(a) | | Average
Price
Paid per
Share(b) | | Total Number of
Shares Purchased as
Part of Publicly
Announced Plans
or Programs | | Maximum Dollar
Value of Shares that
May Yet Be Purchased
Under the Plans or
Programs(c)(d) |
| 04/01/2022-04/30/2022 | 5,368,022 | | | $ | 87.10 | | | 5,319,004 | | | $ | 6,995 | |
| 05/01/2022-05/31/2022 | 14,338,277 | | | 96.53 | | | 14,337,579 | | | 5,611 | |
| 06/01/2022-06/30/2022 | 14,752,420 | | | 97.42 | | | 14,751,914 | | | 4,174 | |
| Total | 34,458,719 | | | 95.44 | | | 34,408,497 | | | |
(a)The amounts in this column include 49,018, 698 and 506 shares of our common stock delivered by employees to MPC, upon vesting of restricted stock, to satisfy tax withholding requirements in April, May and June, respectively.
(b)Amounts in this column reflect the weighted average price paid for shares repurchased under our share repurchase authorizations and for shares tendered to us in satisfaction of employee tax withholding obligations upon the vesting of restricted stock granted under our stock plans. The weighted average price includes commissions paid to brokers during the quarter.
(c)On April 30, 2018, we announced that our board of directors had approved a $5 billion share repurchase authorization in addition to the remaining authorization pursuant to the May 31, 2017 announcement. On May 14, 2021, we announced that our board of directors had approved an additional $7.1 billion share repurchase authorization. On February 2, 2022, we announced that our board of directors had approved an additional $5 billion share repurchase authorization. On August 2, 2022, we announced that our board of directors had approved an additional $5 billion share repurchase authorization, which is not reflected in this column. These share repurchase authorizations have no expiration date.
(d)Reflects the payment of any commissions paid to brokers during the quarter.
ITEM 6. EXHIBITS | | | | | | | | | | | | | | | | | | | | | | | | | | | | | | | | | | | | | | | | | | | | |
| | | | | | | Incorporated by Reference | | Filed
Herewith | | Furnished
Herewith |
Exhibit Number | | Exhibit Description | | Form | | Exhibit | | Filing
Date | | SEC File
No. | |
| 2.1† | | | | 8-K | | 2.1 | | 8/3/2020 | | 001-35054 | | | | |
| 2.2 | | | | 10-K | | 2.7 | | 2/26/2021 | | 001-35054 | | | | |
| 2.3† | | | | 8-K | | 2.3 | | 5/14/2021 | | 001-35054 | | | | |
| 3.1 | | | | 8-K | | 3.2 | | 5/2/2022 | | 001-35054 | | | | |
| 3.2 | | | | 10-Q | | 3.2 | | 11/2/2021 | | 001-35054 | | | | |
| 10.1 | | Revolving Credit Agreement, dated as of July 7, 2022, by and among Marathon Petroleum Corporation, as borrower, JPMorgan Chase Bank, N.A., as administrative agent, each of JPMorgan Chase Bank, N.A., Wells Fargo Securities, LLC, Barclays Bank PLC, BofA Securities, Inc., Citibank, N.A., Mizuho Bank, Ltd., MUFG Bank, Ltd., RBC Capital Markets, and TD Securities (USA) LLC, as joint lead arrangers and joint bookrunners, Wells Fargo Bank, National Association, as syndication agent, each of Bank of America, N.A., Barclays Bank PLC, Citibank, N.A., Mizuho Bank, Ltd., MUFG Bank, Ltd., Royal Bank of Canada and The Toronto-Dominion Bank, New York Branch, as documentation agents, and the other lenders and issuing banks that are parties thereto | | 8-K | | 10.1 | | 7/12/2022 | | 001-35054 | | | | |
| 10.2 | | Revolving Credit Agreement, dated as of July 7, 2022, by and among MPLX LP, as borrower, Wells Fargo Bank, National Association, as administrative agent, each of Wells Fargo Securities, LLC, JPMorgan Chase Bank, N.A., Barclays Bank PLC, BofA Securities, Inc., Citibank, N.A., Mizuho Bank, Ltd., MUFG Bank, Ltd., RBC Capital Markets and TD Securities (USA) LLC, as joint lead arrangers and joint bookrunners, JPMorgan Chase Bank, N.A., as syndication agent, each of Bank of America, N.A., Barclays Bank PLC, Citibank, N.A., Mizuho Bank, Ltd., MUFG Bank, Ltd., Royal Bank of Canada and The Toronto-Dominion Bank, New York Branch, as documentation agents, and the other lenders and issuing banks that are parties thereto | | 8-K | | 10.2 | | 7/12/2022 | | 001-35054 | | | | |
| 31.1 | | | | | | | | | | | | X | | |
| 31.2 | | | | | | | | | | | | X | | |
| 32.1 | | | | | | | | | | | | | | X |
| 32.2 | | | | | | | | | | | | | | X |
| 101.INS | | Inline XBRL Instance Document - the instance document does not appear in the Interactive Data File because its XBRL tags are embedded with the Inline XBRL document. | | | | | | | | | | | | |
| 101.SCH | | Inline XBRL Taxonomy Extension Schema Document. | | | | | | | | | | X | | |
| 101.PRE | | Inline XBRL Taxonomy Extension Presentation Linkbase Document. | | | | | | | | | | X | | |
| 101.CAL | | Inline XBRL Taxonomy Extension Calculation Linkbase Document. | | | | | | | | | | X | | |
| 101.DEF | | Inline XBRL Taxonomy Extension Definition Linkbase Document. | | | | | | | | | | X | | |
| 101.LAB | | Inline XBRL Taxonomy Extension Label Linkbase Document. | | | | | | | | | | X | | |
| | | | | | | | | | | | | | | | | | | | | | | | | | | | | | | | | | | | | | | | | | | | |
| | | | | | | Incorporated by Reference | | Filed
Herewith | | Furnished
Herewith |
Exhibit Number | | Exhibit Description | | Form | | Exhibit | | Filing
Date | | SEC File
No. | |
| 104 | | Cover Page Interactive Data File (formatted as Inline XBRL and contained in Exhibit 101). | | | | | | | | | | | | |
† The exhibits and schedules have been omitted pursuant to Item 601(b)(2) of Regulation S-K and will be provided to the Securities and Exchange Commission upon request.
SIGNATURES
Pursuant to the requirements of the Securities Exchange Act of 1934, the registrant has duly caused this report to be signed on its behalf by the undersigned thereunto duly authorized.
| | | | | | | | |
| August 2, 2022 | MARATHON PETROLEUM CORPORATION |
| | |
| By: | /s/ C. Kristopher Hagedorn |
| | C. Kristopher Hagedorn
Senior Vice President and Controller |