UNITED STATES
SECURITIES AND EXCHANGE COMMISSION
Washington, D.C. 20549
FORM 10-K
(Mark One)
x ANNUAL REPORT PURSUANT TO SECTION 13 OR 15(d) OF THE SECURITIES EXCHANGE ACT OF 1934
For the fiscal year ended December 31, 2018
¨ TRANSITION REPORT PURSUANT TO SECTION 13 OR 15(d) OF THE SECURITIES EXCHANGE ACT OF 1934
For the transition period from _________to________
Commission File Number: 001-36448
Bankwell Financial Group, Inc.
(Exact Name of Registrant as specified in its Charter)
Connecticut (State or other jurisdiction of Incorporation or organization) | 20-8251355 (I.R.S. Employer Identification No.) | |
220 Elm Street
New Canaan, Connecticut 06840
(203) 652-0166
(Address, including zip code, and telephone number, including area code, of registrant’s principal executive offices)
Securities Registered Pursuant to Section 12(b) of the Act:
Common Stock, no par value per share
(Title of Class)
NASDAQ Global Market
(Name of exchange on which registered)
Securities Registered Pursuant to Section 12(g) of the Exchange Act:
None
Indicate by check mark if the registrant is a well-known seasoned issuer, as defined in Rule 405 of the Securities Act. ¨ Yes þ No
Indicate by check mark if the registrant is not required to file reports pursuant to Section 13 or Section 15(d) of the Act. ¨ Yes þ No
Indicate by check mark whether the registrant (1) has filed all reports required to be filed by Section 13 or 15(d) of the Securities Exchange Act of 1934 during the preceding 12 months (or for such shorter period that the registrant was required to file such reports), and (2) has been subject to such filing requirements for the past 90 days. þ Yes ¨ No
Indicate by check mark whether the registrant has submitted electronically every Interactive Data File required to be submitted pursuant to Rule 405 of Regulation S-T (§232.405 of this chapter) during the preceding 12 months (or for such shorter period that the registrant was required to submit such files). þ Yes ¨ No
Indicate by check mark if disclosure of delinquent filers pursuant to item 405 of Regulation S-K (§229.405 of this chapter) is not contained herein, and will not be contained, to the best of the registrant’s knowledge, in definitive proxy or information statements incorporated by reference in Part III of this Form 10-K or any amendment to this Form 10-K þ
Indicate by check mark whether the registrant is a large accelerated filer, an accelerated filer, a non-accelerated filer, a smaller reporting company, or an emerging growth company. See the definitions of “large accelerated filer,” “accelerated filer,” “smaller reporting company” and “emerging growth company” in Rule 12b-2 of the Exchange Act.
Large accelerated filer ¨ | Accelerated filer þ |
Non-accelerated filer ¨ | Smaller reporting company þ |
Emerging growth company þ | |
If an emerging growth company, indicate by check mark if the registrant has elected not to use the extended transition period for complying with any new or revised financial accounting standards provided pursuant to Section 13(a) of the Exchange Act. þ
Indicate by check mark whether the registrant is a shell company (as defined in Rule 12b-2 of the Exchange Act). Yes ☐ No þ
Aggregate market value of the voting stock held by non-affiliates of the registrant as of June 30, 2018 based on the closing price of the common stock as reported on the NASDAQ Global Market: $196,751,216
As of February 25, 2019, there were 7,849,621 shares of the registrant’s common stock outstanding.
DOCUMENTS INCORPORATED BY REFERENCE
Portions of the Registrant’s definitive proxy statement for its Annual Meeting of Stockholders, expected to be filed pursuant to Regulation 14A within 120 days after the end of the 2018 fiscal year, are incorporated by reference into Part III of this report on form 10-K
1
Bankwell Financial Group, Inc.
Form 10-K
Table of Contents
i
BANKWELL FINANCIAL GROUP, INC.
FORM 10-K
PART 1
Item 1. Business
Cautionary Note Regarding Forward-Looking Statements
This report contains forward-looking statements within the meaning of Section 27A of the Securities Act of 1933 or the Securities Act, and Section 21E of the Exchange Act. These statements are often, but not always, made with the words or phrases such as “may,” “should,” “believe,” “likely result in,” “expect,” “would,” “intend,” “could,” “predict,” “potential,” “continue,” “will,” “anticipate,” “seek,” “estimate,” “plan,” “projection,” and “outlook” or the negative version of those words or other similar words of a forward-looking nature. These forward-looking statements are not historical facts, and are based on current expectations, estimates and projections about our industry, management’s beliefs and certain assumptions made by management, many of which, by their nature, are inherently uncertain and beyond our control. Accordingly, we caution you that any such forward-looking statements are not guarantees of future performance and are subject to risks, assumptions, uncertainties and other factors that could cause the actual results to differ materially from those contemplated by these forward-looking statements. Important factors that may cause actual results to differ from those contemplated by these forward-looking statements include, but are not limited to, those disclosed under “Risk Factors” in Part I Item 1A as well as the following factors:
• | Local, regional and national business or economic conditions may differ from those expected; |
• | Credit risk and resulting losses in our loan portfolio; |
• | Our allowance for loan losses may not be adequate to absorb loan losses; |
• | Changes in real estate values could also increase our credit risk; |
• | Changes in our key management personnel; |
• | Inability to successfully execute our management team’s strategic initiatives; |
• | Our ability to successfully execute our growth initiatives such as branch openings and acquisitions; |
• | Volatility and direction of market interest rates; |
• | Increased competition within our market area which may limit our growth and profitability; |
• | Economic, market, operational, liquidity, credit and interest rate risks associated with our business; |
• | The effects of and changes in trade, monetary and fiscal policies and laws, including the Federal Reserve Board’s interest rate policies; |
• | Changes in accounting policies and practices, as may be adopted by regulatory agencies, the Public Company Accounting Oversight Board or the Financial Accounting Standards Board; |
• | Changes in law and regulatory requirements (including those concerning taxes, banking, securities and insurance); and |
• | Further governmental intervention in the U.S. financial system. |
The foregoing factors should not be construed as exhaustive. If one or more events related to these or other risks or uncertainties materialize, or if our underlying assumptions prove to be incorrect, actual results may differ materially from what we anticipate. Accordingly, you should not place undue reliance on any such forward-looking statements. Any forward-looking statement speaks only as of the date on which it is made, and we do not undertake any obligation to publicly update or review any forward-looking statement, whether as a result of new information, future developments or otherwise. New factors emerge from time to time, and it is not possible for us to predict which will arise. In addition, we cannot assess the impact of each factor on our business or the extent to which any factor, or combination of factors, may cause actual results to differ materially from those contained in any forward-looking statements.
1
General
Bankwell Financial Group, Inc. is a bank holding company, headquartered in New Canaan, Connecticut and offers a broad range of financial services through its banking subsidiary, Bankwell Bank (collectively, we, our, us, the Company or the Bank), a Connecticut state chartered non-member bank founded in 2002. Our primary market is the New York metropolitan area, including Fairfield and New Haven Counties, Connecticut, which we serve from our main banking office located in New Canaan, Connecticut and eleven other branch offices located throughout the Fairfield and New Haven Counties area. As of December 31, 2018, on a consolidated basis, we had total assets of approximately $1.9 billion, net loans of approximately $1.6 billion, total deposits of approximately $1.5 billion, and shareholders’ equity of approximately $174.2 million.
We are committed to being the premier “Hometown” bank in Fairfield and New Haven Counties and surrounding areas. We believe that our market exhibits attractive demographic attributes and presents competitive dynamics, thereby offering long-term opportunities for growth. We have a history of building long-term customer relationships and attracting new customers through what we believe is our superior customer service and our ability to deliver a diverse product offering. In addition, we believe that our strong capital position and extensive local ownership, coupled with a highly respected and experienced executive management team and board of directors, give us credibility with our customers and potential customers in our market. Our focus is on building a franchise with meaningful market share and consistent revenue growth complemented by operational efficiencies that we believe will produce attractive risk-adjusted returns for our shareholders.
Our History and Growth
Bankwell Bank was originally chartered as two separate banks, The Bank of New Canaan (including a separate division, Stamford First Bank) and The Bank of Fairfield, which were subsequently merged and rebranded as “Bankwell Bank.” It was chartered with a commitment to building the premier community bank in the markets we serve. We began operations in April 2002 with an initial capitalization of $8.6 million. On November 5, 2013, we acquired The Wilton Bank, and it was merged into Bankwell Bank. On October 1, 2014, we acquired Quinnipiac Bank and Trust Company and it was merged into Bankwell Bank.
With the efforts of our strong management team, we continued our growth and maintained a strong track record of performance. From December 31, 2014 through December 31, 2018, our total assets grew from $1.1 billion to approximately $1.9 billion; our gross loans outstanding grew from $929.8 million to approximately $1.6 billion and our deposits grew from $835.4 million to approximately $1.5 billion. We believe this growth was driven by our ability to provide superior service to our customers and our financial stability. This loan growth was achieved while maintaining our focus on our strong underwriting standards.
Business Strategy
We are focused on being the “Hometown” bank and banking provider of choice in our highly attractive market areas through:
• | Responsive, Customer-Centric Products and Services and a Community Focus. We offer a broad array of products and services which we customize to allow us to focus on building long-term relationships with our customers through high-quality, responsive and personal customer service. By focusing on the entire customer relationship, we build the trust of our customers which leads to long-term relationships and generates our organic growth. In addition, we are committed to meeting the needs of the communities that we serve. Our employees are involved in many civic and community organizations which we support through sponsorships. As a result, customers and potential customers within our market know about us and frequently interact with our employees which allows us to develop long-term customer relationships without extensive advertising. |
• | Strategic Acquisitions. To complement our organic growth, we focus on strategic acquisitions in or around our existing markets that further our objectives. We believe there are banking institutions that continue to face credit challenges, capital constraints and liquidity issues and that lack the scale and management expertise to manage the increasing regulatory burden and will likely need to partner with an institution like ours. As we evaluate potential acquisitions, we will continue to seek acquisitions that provide meaningful financial benefits, long-term organic growth opportunities and expense reductions, without compromising our risk profile. |
• | Utilization of Efficient and Scalable Infrastructure. We employ a systematic and calculated approach to increasing our profitability and improving our efficiencies. We continually upgrade our operating infrastructure, particularly in the areas of technology, data processing, compliance and personnel. We believe that our scalable infrastructure provides us with an efficient operating platform from which to grow in the near term, while continuing to deliver our high-quality, responsive customer service, which will enhance our ability to grow and increase our returns. |
• | Disciplined Focus on Risk Management. Effective risk management is a key component of our strong corporate culture. We use our strong risk management process to monitor our existing loan and investment securities portfolios, support operational decision-making and improve our ability to generate earning assets with strong credit quality. To maintain our strong credit quality, we use a comprehensive underwriting process and we seek to maintain a diversified loan portfolio and a conservative investment securities portfolio. Board-approved policies contain approval authorities, as appropriate, |
2
and are reviewed at least annually. We have a Risk Management Steering Committee comprised of executive officers who oversee new business initiatives and other activities that warrant oversight of risk and related mitigants. Internal review procedures are performed regarding anti-money laundering and consumer compliance requirements.
Our Competitive Strengths
We believe that we are especially well-positioned to create value for our shareholders as a result of the following competitive strengths:
• | Our Market. Our current market is defined as the New York metropolitan area, including Fairfield and New Haven Counties, Connecticut. The Stamford market area includes numerous affluent suburban communities of professionals who work and commute into New York City, approximately 50 miles from our headquarters, and many small to mid-sized businesses which support these communities. Fairfield County is the wealthiest county in Connecticut based on median household income according to estimates from the United States Census Bureau. We believe that this market has economic and competitive dynamics that are favorable to executing our growth strategy. |
• | Experienced and Respected Management Team with a Proven and Successful Track Record. Our executive management team is comprised of seasoned professionals with significant banking experience, a history of high performance at local financial institutions and success in identifying, acquiring and integrating financial institutions. Our senior management team includes Christopher R. Gruseke, President and Chief Executive Officer (four years with us), Heidi S. DeWyngaert, Executive Vice President, Chief Lending Officer (fourteen years with us), Penko Ivanov, Executive Vice President, Chief Financial Officer (over two years with us), David Dineen, Executive Vice President, Head of Community Banking (three years with us), Christine A. Chivily, Executive Vice President, Chief Risk and Credit Officer (six years with us), and Laura Waitz, Executive Vice President, Chief of Staff (in her second year with us). |
• | Dedicated Board of Directors with Strong Community Involvement. Our Board of Directors is comprised of a group of local business leaders who understand the need for strong community banks that focus on serving the financial needs of their customers. The interests of our executive management team and directors are aligned with those of our shareholders through common stock ownership. By capitalizing on the close community ties and business relationships of our executive management team and directors, we are positioned to continue taking advantage of the market opportunity present in our primary market. |
• | Strong Capital Position. At December 31, 2018, we had a 9.16% tangible common equity ratio, and the Bank had a 10.14% tier 1 leverage ratio and an 11.56% tier 1 risk-based ratio. We believe that our ability to attract and generate capital has facilitated our growth and is an integral component to the execution of our business plan. |
• | Scalable Operating Platform. We provide banking technology, including remote deposit capture, internet banking and mobile banking, to offer our customers maximum flexibility and to create a scalable platform to accommodate our future growth aspirations. We believe that our advanced technology combined with responsive and personal service provides our customers with a superior banking experience. |
Employees
At December 31, 2018, we had a total of 142 full-time employees, 2 part-time employees and no temporary employees. None of our employees are subject to a collective bargaining agreement.
Company Website and Availability of Securities and Exchange Commission Filings
Information regarding the Company is available through the Investor Relations link at www.mybankwell.com. The Company’s annual reports on Form 10-K, quarterly reports on Form 10-Q, current reports on Form 8-K, and any amendments to those reports filed pursuant to Section 13(a) or 15(d) of the Securities Exchange Act of 1934 are available free of charge at www.sec.gov and at www.mybankwell.com under the Investor Relations link. Information on the website is not incorporated by reference and is not a part of this annual report on Form 10-K.
Competition
The financial services industry in our market and the surrounding area is highly competitive. We compete with commercial banks, savings banks, savings associations, money market funds, mortgage brokers, finance companies, credit unions, insurance companies, investment firms and private lenders in various segments of our business. Many of these competitors have more assets, capital and higher lending limits, and more resources than we do and may be able to conduct more intensive and broader-based promotional efforts to reach both commercial and individual customers. Competition for deposit products can depend heavily on pricing because of the ease with which customers can transfer deposits from one institution to another.
We focus our marketing efforts on small to medium-sized businesses and professionals. This focus includes retail, service, wholesale distribution and manufacturing businesses. We attract these customers based on relationships and contacts that our Management and our Board of Directors have within and beyond the market area. We do not expect to compete with large institutions
3
for the primary banking relationships of large corporations. Many of our larger commercial bank competitors have greater name recognition and offer certain services that we do not; however, we believe that our presence in our primary market area and focus on providing superior service to professionals at small to medium sized businesses and individual employees of such businesses are instrumental to our success.
We emphasize personalized banking services and the advantage of local decision-making in our banking businesses, and this emphasis has been well received by the public in our market area. We derive a majority of our business from our local market area which includes our primary market area of the New York metropolitan area, including Fairfield and New Haven Counties, Connecticut.
Lending Activities
General. Our primary lending focus is to serve commercial and middle-market businesses, not-for-profit organizations and consumers with a variety of financial products and services, while maintaining strong and disciplined credit policies and procedures. We offer a wide array of commercial lending products to serve the needs of our customers. Commercial lending products include owner-occupied commercial real estate loans, commercial real estate investment loans, commercial loans (such as business term loans, equipment financing and lines of credit) to small and medium sized businesses and real estate construction and development loans. We focus our lending activities on loans that we originate to borrowers located in our market. We have established an informal, internal lending limit to one relationship of up to 40% of unimpaired capital and allowance for loan losses, if secured by commercial real estate. A relationship in this instance is defined as loans made to different entities but with a shared borrower principal(s). For individual loans, limits are set so as not to exceed the statutory maximum of 15% of unimpaired capital and allowance for loan losses.
We market our lending products and services to qualified borrowers through conveniently located banking offices, relationship networks and high touch personal service. We target our business development and marketing strategy primarily on small to medium sized businesses. Our relationship managers actively solicit the business of companies entering our market areas as well as long-standing businesses operating in the communities we serve. We seek to attract new lending customers through professional service, relationship networks, competitive pricing and innovative structure, including the utilization of federal and state tax incentives. We pride ourselves on smart, proficient underwriting and timely decision making for new loan requests due to our efficient approval structure and local decision-making. We believe this gives us a competitive advantage over larger institutions that are not as nimble.
Total loans before deferred loan fees and the allowance for loan losses were $1.6 billion at December 31, 2018. Since December 31, 2014, total loans have increased $675.0 million from $929.8 million, reflecting strong organic loan growth. The following table summarizes the composition of our loan portfolio for the dates indicated.
At December 31, | ||||||||||||||||||||
2018 | 2017 | 2016 | ||||||||||||||||||
Amount | Percent of Loan Portfolio | Amount | Percent of Loan Portfolio | Amount | Percent of Loan Portfolio | |||||||||||||||
(In thousands) | ||||||||||||||||||||
Real estate loans: | ||||||||||||||||||||
Residential | $ | 178,079 | 11.10 | % | $ | 193,524 | 12.54 | % | $ | 195,729 | 14.33 | % | ||||||||
Commercial | 1,094,066 | 68.18 | 987,242 | 63.98 | 845,322 | 61.89 | ||||||||||||||
Construction | 73,191 | 4.56 | 101,636 | 6.59 | 107,441 | 7.86 | ||||||||||||||
1,345,336 | 83.84 | 1,282,402 | 83.11 | 1,148,492 | 84.08 | |||||||||||||||
Commercial business | 258,978 | 16.14 | 259,995 | 16.85 | 215,914 | 15.81 | ||||||||||||||
Consumer | 412 | 0.02 | 619 | 0.04 | 1,533 | 0.11 | ||||||||||||||
Total loans | $ | 1,604,726 | 100.00 | % | $ | 1,543,016 | 100.00 | % | $ | 1,365,939 | 100.00 | % | ||||||||
4
At December 31, | |||||||||||||
2015 | 2014 | ||||||||||||
Amount | Percent of Loan Portfolio | Amount | Percent of Loan Portfolio | ||||||||||
(In thousands) | |||||||||||||
Real estate loans: | |||||||||||||
Residential | $ | 193,110 | 16.83 | % | $ | 193,197 | 20.78 | % | |||||
Commercial | 697,542 | 60.79 | 521,181 | 56.06 | |||||||||
Construction | 82,273 | 7.17 | 63,229 | 6.80 | |||||||||
972,925 | 84.79 | 777,607 | 83.64 | ||||||||||
Commercial business | 172,853 | 15.06 | 149,259 | 16.05 | |||||||||
Consumer | 1,735 | 0.15 | 2,896 | 0.31 | |||||||||
Total loans | $ | 1,147,513 | 100.00 | % | $ | 929,762 | 100.00 | % | |||||
Commercial loans. We offer a wide range of commercial loans, including business term loans, equipment financing and lines of credit. Our target commercial loan market is small to medium sized businesses, including retail and professional establishments. The terms of these loans vary by purpose and by type of underlying collateral. The commercial loans primarily are underwritten on the basis of the borrower’s ability to service the loan from cash flow. We make equipment loans with conservative margins generally for a term of ten years or less, supported by the useful life of the equipment, at fixed or variable rates, with the loan fully amortizing over the term. Loans to support working capital typically have terms not exceeding two years and usually are secured by accounts receivable, inventory and/or personal guarantees of the principals of the business and at times by the commercial real estate of the borrower. For loans secured by accounts receivable or inventory, principal typically is repaid as the assets securing the loan are converted into cash, and for loans secured with other types of collateral, principal is fully or partially amortized during the loan term with any balloon amount due at maturity. The quality of the commercial borrower’s management and its ability both to properly evaluate changes in the supply and demand characteristics affecting its markets for products and services and to effectively respond to such changes are significant factors in a commercial borrower’s creditworthiness. Risks associated with our commercial loan portfolio include those related to the strength of the borrower’s business, which may be affected not only by local, regional and national market conditions, but also changes in the borrower’s management and other factors beyond the borrower’s control; those related to fluctuations in value of any collateral securing the loan; and those related to terms of the commercial loan, which may include balloon payments that must be refinanced or paid off at the end of the term of the loan. Our commercial loan portfolio presents a higher risk than our consumer real estate and consumer loan portfolios.
Commercial real estate loans. We offer real estate loans for owner-occupied commercial properties as well as commercial property owned by real estate investors. Commercial loans that are secured by owner-occupied commercial real estate and primarily collateralized by operating cash flows are also included in this category of loan throughout this document. Commercial real estate loan terms generally are limited to ten years or less, although payments may be structured on a longer amortization basis of twenty to thirty years. The interest rates on our commercial real estate loans may be fixed or adjustable, although rates typically are not fixed for a period exceeding five to ten years. We generally charge an origination fee for these loans. We often require personal guarantees from the principal owner of the business or real estate supported by a review of the principal owner's personal financial statements. Risks associated with commercial real estate loans include fluctuations in the value of real estate, the overall strength of the economy, new job creation trends, tenant vacancy rates, property use trends, business sector changes, environmental contamination, and the quality of the borrower’s management. We make efforts to limit our risk by analyzing the borrower's cash flow and collateral value as well as all of the sponsors’ investment activities. The real estate securing our existing commercial real estate loans includes a wide variety of property types, such as owner-occupied offices/warehouses/production facilities, office buildings, industrial, mixed-use residential/commercial, retail centers and multifamily properties. Our commercial real estate loan portfolio presents a higher risk than our consumer real estate and consumer loan portfolios.
Construction loans. Our construction portfolio includes loans to small and medium sized businesses to construct owner-used properties, loans to developers of commercial real estate investment properties and residential developments and, to a lesser extent, loans to individual clients for construction of single family homes in our market. Construction and development loans are generally made with a term of one to two years and interest is paid monthly. The ratio of the loan principal to the value of the collateral, as established by independent appraisal, typically will not exceed industry standards. Loan proceeds are disbursed based on the percentage of completion and only after the project has been inspected by an experienced construction lender or third-party inspector. Risks associated with construction loans include fluctuations in the value of real estate, project completion risk, leasing risk and change in market trends. We are also exposed to risk based on the ability of the construction loan borrower to refinance
5
the debt or sell the property upon completion of the project, which may be affected by changes in market trends since the time that we funded the construction loan.
Consumer real estate loans. In the fourth quarter of 2017, management made the strategic decision to no longer originate residential mortgage loans. Prior to this decision we offered first lien one-to-four family mortgage loans, as well as home equity lines of credit, in each case primarily on owner-occupied primary residences. We also originated for sale one-to-four family mortgage loans, which are classified as loans held for sale until sold to investors. Although our consumer real estate loan portfolio presents lower levels of risk than our commercial, commercial real estate and construction loan portfolios, we are exposed to risk based on fluctuations in the value of the real estate collateral securing the loan, as well as changes in the borrower’s financial condition, which could be affected by numerous factors, including divorce, job loss, illness or other personal hardship.
Consumer loans. We may offer consumer loans as an accommodation to our existing customers, but do not market consumer loans to persons who do not have a pre-existing relationship with us. As of December 31, 2018, our consumer loans represented less than 1% of our total loan portfolio. While consumer loans may not remain below 1% of our portfolio, we do not expect our consumer loans to become a material component of our loan portfolio at any time in the foreseeable future. Although we do not engage in any material amount of consumer lending, our consumer loans, which are underwritten primarily based on the borrower’s financial condition and, in many cases, are unsecured credits, subject us to risk based on changes in the borrower’s financial condition, which could be affected by numerous factors, including those discussed above.
Credit Policy and Procedures
General. We adhere to what we believe are disciplined underwriting standards, but also remain cognizant of the need to serve the credit needs of customers in our primary market areas by offering flexible loan solutions in a responsive and timely manner. We also seek to maintain a diversified loan portfolio across customer, product and industry types. However, our lending policies do not provide for any loans that are highly speculative, subprime, or that have high loan-to-value ratios. These components, together with active credit management, are the foundation of our credit culture, which we believe is critical to enhancing the long term value of our organization to our customers, employees, shareholders and communities.
We have a service-driven, relationship-based, business-focused credit culture, rather than a price-driven, transaction-based culture. Accordingly, substantially all of our loans are made to borrowers located or operating in our primary market with whom we have ongoing relationships across various product lines. The limited number of loans secured by properties located in out-of-market areas that we have made are generally to borrowers who are well-known to us. These borrowers typically have strong deposit relationships with the Bank.
Credit concentrations. In connection with the management of our credit portfolio, we actively manage the composition of our loan portfolio, including credit concentrations. We monitor borrower and loan product concentrations on at least a quarterly basis. Loan product concentrations are reviewed annually in conjunction with the portfolio’s credit quality and the business plan for the coming year. All concentrations are monitored by our Chief Risk and Credit Officer and our Directors' Loan Committee. We have also established an informal, internal lending limit to one relationship of up to 40% of unimpaired capital and allowance for loan losses, if secured by commercial real estate. A relationship in this instance is defined as loans made to different entities but with a shared borrower principal(s). For individual loans, limits are set so as not to exceed the statutory maximum of 15% of unimpaired capital and allowance for loan losses. Our top 20 borrowing relationships range in exposure from $16.9 million to $84.9 million and are monitored on an on-going basis.
Loan approval process. We seek to achieve an appropriate balance between prudent and disciplined underwriting on the one hand and flexibility in our decision-making and responsiveness to our customers on the other hand. Our credit approval policies have a tiered approval process, with larger exposures referred to the Bank’s Internal Loan Committee and the Directors’ Loan Committee, as appropriate, based on the size of the loan. Smaller exposures are approved under a three-signature system. Loans with policy exceptions require the next higher level of approval authority, the highest of which is the Directors’ Loan Committee, depending on dollar amount. These authorities are periodically reviewed and updated by our Board of Directors. We believe that our credit approval process provides for thorough underwriting and efficient decision making.
Credit risk management. Credit risk management involves a partnership between our relationship managers and our credit approval, credit administration, portfolio management and collections personnel. Portfolio monitoring and early problem recognition are an important aspect of maintaining our high credit quality standards. Past due reports are reviewed on an ongoing basis and insurance and tax payment monitoring is in place. Our evaluation and compensation program for our relationship managers includes significant goals that we believe motivate the relationship managers to focus on high quality credit consistent with our strategic focus on asset quality.
For 2018, it was our policy to review all non-amortizing commercial loans in excess of $50 thousand and amortizing commercial loans in excess of $750 thousand on an annual basis, or more frequently through the receipt of interim and annual financial statements and borrowing base certificates depending on loan structure and covenants. Our policies require rapid notification of delinquency and prompt initiation of collection actions. Relationship managers, portfolio managers, credit
6
administration personnel and senior management proactively support collection activities in order to maximize accountability and efficiency.
As part of these annual review procedures, we analyze recent financial statements of the collateral property, business and/or borrower to determine the current level of occupancy, revenues and expenses and to investigate any deterioration in the value of the real estate collateral or in the borrower’s or company’s financial condition. Upon completion, we update, confirm or change the risk rating assigned to each loan. Relationship managers and portfolio managers are encouraged to bring potential credit issues to the attention of our Chief Risk and Credit Officer immediately upon any sign of deterioration in the performance of the borrower. We maintain a list of loans that receive additional attention if we believe there may be a potential credit risk via our Watch List report.
Loans that are upgraded or downgraded are reviewed by our Chief Risk and Credit Officer, while Watch List loans undergo a detailed quarterly analysis prepared by the relationship manager or portfolio manager and reviewed by management. This review includes an evaluation of the market conditions, the property’s or company’s trends, the borrower and guarantor status, the level of reserves required and loan accrual status. Additionally, we have an independent, third-party loan review performed semi-annually, which includes the accuracy of our loan grades and our credit administration functions. Finally, we perform an annual stress test of our commercial loan portfolio, in which we evaluate the impact on the portfolio of declining economic conditions, including lower values and decline in net operating income which may result from lower rental rates, lower occupancy rates and higher interest rates. Management reviews these reports and presents them to our loan committees. These asset review procedures provide management with additional information for assessing our asset quality.
Investment Activities
We manage our investment portfolio primarily for liquidity purposes. Our investment portfolio’s primary purpose is to provide adequate liquidity necessary to meet any reasonable decline in deposits and any anticipated increase in the loan portfolio. The majority of these securities are classified as available for sale. The portfolio’s secondary purpose is to generate adequate earnings to provide and contribute to stable income and to generate a profitable return while minimizing risk. Additionally, our investment portfolio may be used to provide adequate collateral for various regulatory or statutory requirements and to manage our interest rate risk. We invest in a variety of high-grade securities, including government agency securities, government guaranteed mortgage backed securities, highly rated corporate bonds and municipal securities. We regularly evaluate the composition of our portfolio as changes occur with respect to the interest rate yield curve. Although we may sell investment securities from time to time to take advantage of changes in interest rate spreads, it is our policy not to sell investment securities unless we can reinvest the proceeds at a similar or higher spread, so as not to take gains to the detriment of future income.
The investment policy is reviewed annually by our Board of Directors. Overall investment goals are established by our Board of Directors, Chief Financial Officer and our asset/liability management committee, or ALCO. Our Board of Directors has delegated the responsibility of monitoring our investment activities to ALCO. Day-to-day activities pertaining to the investment portfolio are conducted within our accounting department under the supervision of our Chief Financial Officer.
Deposits
Deposits are our primary source of funds to support our earning assets. We offer traditional depository products, including checking, savings, money market and certificates of deposit with a variety of rates. Deposits at the Bank are insured by the FDIC up to statutory limits. We have built a network of twelve deposit-taking branch offices and attracted significant transaction account business through our relationship-based approach.
Borrowed Funds
The Bank is a member of the Federal Home Loan Bank of Boston (FHLB), which is part of a twelve district Federal Home Loan Bank System. Members are required to own capital stock of the FHLB, and borrowings are collateralized by qualifying assets not otherwise pledged (principally single family residential mortgage loans and securities). The maximum amount of credit that the FHLB will extend varies from time to time, depending on its policies and the amount of qualifying collateral the member can pledge. We utilize advances from the FHLB as part of our overall funding strategy to meet short-term liquidity needs and, to a lesser degree, manage interest rate risk arising from the difference in asset and liability maturities.
On August 19, 2015, the Company completed a private placement of $25.5 million in aggregate principal amount of fixed rate subordinated notes (the “Notes”) to certain institutional investors. The Notes are non-callable for five years, have a stated maturity of August 15, 2025, and bear interest at a quarterly pay fixed rate of 5.75% per annum to the maturity date or the early redemption date (August 2020 and annually thereafter). The Notes have been structured to qualify for the Company as Tier 2 capital under regulatory guidelines. We used the net proceeds for general corporate purposes, which included maintaining liquidity at the holding company, providing equity capital to the Bank to fund balance sheet growth and our working capital needs.
7
Enterprise Risk Management
We place significant emphasis on risk mitigation as an integral component of our organizational culture. We believe that our emphasis on risk management is manifested in our historically solid asset quality statistics. Risk management with respect to our lending philosophy focuses, among other things, on structuring credits to provide for multiple sources of repayment, coupled with strong underwriting by experienced relationship managers, lending and credit management. We perform quarterly reviews of criticized loans and criticized asset action plans for those borrowers who display deteriorating financial conditions in order to monitor those relationships and implement corrective measures on a timely basis to minimize losses. In addition, we perform an annual stress test of our commercial loan portfolio, in which we evaluate the impact on the portfolio of declining property values and lower net operating incomes as a result of economic conditions, including lower rental rates and lower occupancy rates. The stress test focuses only on the cash flow and valuation of the properties or businesses and ignores the liquidity, net worth and cash flow of any guarantors related to the credits.
We also focus on risk management in other areas throughout our organization. The Chief Risk and Credit Officer oversees the Risk Management function and chairs a Risk Management Steering Committee. We currently outsource our asset/liability calculations to a reputable third party, and on a quarterly basis, that third party runs the full interest rate risk model. Results of the model are reviewed and validated by our ALCO.
Supervision and Regulation
General
The Bank is subject to extensive regulation by the Connecticut Department of Banking, as its chartering agency, and by the FDIC, as its deposit insurer. The Bank’s deposits are insured up to applicable limits by the FDIC through the Deposit Insurance Fund. The Bank is required to file reports with, and is periodically examined by, the FDIC and the Connecticut Department of Banking concerning its activities and financial condition and must obtain regulatory approvals prior to entering into certain transactions, such as mergers with, or acquisitions of, other financial institutions.
The primary goals of the bank regulatory system are to maintain a safe and sound banking system and to facilitate the conduct of sound monetary policy. This system is intended primarily for the protection of the Deposit Insurance Fund and bank depositors, rather than our shareholders and creditors. The banking agencies have broad enforcement power over bank holding companies and banks, including the authority, among other things, to enjoin “unsafe or unsound” practices, require affirmative action to correct any violation or practice, issue administrative orders that can be judicially enforced, direct increases in capital, direct the sale of subsidiaries or other assets, limit dividends and distributions, restrict growth, assess civil money penalties, remove officers and directors, and, with respect to banks, terminate deposit insurance or place the bank into conservatorship or receivership. In general, these enforcement actions may be initiated for violations of laws and regulations or unsafe or unsound practices.
The following discussion is a summary of the material laws, rules and regulations applicable to our operations, but does not purport to be a complete summary of all applicable laws, rules and regulations. These laws, rules and regulations may change from time to time and the regulatory agencies often have broad discretion in interpreting them. Any change in such laws, rules or regulations, whether by the Connecticut Department of Banking, the FDIC or the Federal Reserve Board could have a material adverse impact on the financial markets in general, and our operations and activities, financial condition, results of operations, growth plans and future prospects specifically.
Dodd-Frank Wall Street Reform and Consumer Protection Act
The Dodd-Frank Act has significantly changed the current bank regulatory structure and continues to affect the lending and investment activities and general operations of depository institutions and their holding companies.
The current United States government administration has announced that it intends to slow down the adoption of new Dodd-Frank Act regulations and to consider proposing changes to the legislation. The following summary assumes no changes to the Dodd-Frank Act and regulations adopted to date, other than as noted below in our discussion of the Economic Growth, Regulatory Relief, and Consumer Protection Act.
The Dodd-Frank Act created the Consumer Financial Protection Bureau with extensive powers to implement and enforce consumer protection laws. The Consumer Financial Protection Bureau has broad rulemaking authority for a wide range of consumer protection laws that apply to all banks and savings associations including, among other things, the authority to prohibit “unfair, deceptive or abusive” acts and practices. The Consumer Financial Protection Bureau has examination and enforcement authority over all banks and savings associations with more than $10 billion in assets. Banks and savings associations with $10 billion or less in assets will continue to be examined for compliance with federal consumer protection and fair lending laws by their applicable primary federal bank regulators. The Dodd-Frank Act also weakens the federal preemption available for national banks and federal savings associations and gives state attorneys general certain authority to enforce applicable federal consumer protection laws.
The Dodd-Frank Act made many other changes to banking regulations including authorizing depository institutions, for the first time, to pay interest on business checking accounts, requiring originators of securitized loans to retain a percentage of the
8
risk for transferred loans, establishing regulatory rate-setting for certain debit card interchange fees, establishing a number of reforms for mortgage originations, requiring bank holding companies and banks to be “well capitalized” and “well managed” in order to acquire banks located outside of their home state, requiring any bank holding company electing to be treated as a financial holding company to be “well capitalized” and “well managed” and authorizing national and state banks to establish de novo branches in any state that would permit a bank chartered in that state to open a branch at that location.
The Dodd-Frank Act also broadened the base for the FDIC insurance assessments. The FDIC was required to promulgate rules revising its assessment system so that insurance assessments are based on the average consolidated total assets less tangible equity capital of an insured depository institution instead of deposits. That rule took effect April 1, 2011. The Dodd-Frank Act also permanently increased the maximum amount of deposit insurance for banks, savings institutions and credit unions to $250,000 per depositor, retroactive to January 1, 2008.
The Dodd-Frank Act increased shareholder influence over boards of directors by requiring companies to give shareholders a nonbinding vote on executive compensation and so-called “golden parachute” payments, and by authorizing the SEC to promulgate rules that would allow shareholders to nominate and solicit votes for their own candidates using a company’s proxy materials. It is challenging to predict the full impact the Dodd-Frank Act and its implementing regulations will have on community banks and their holding companies. The legislation and implementing regulations, particularly those provisions relating to the Consumer Financial Protection Bureau, has and is likely to continue to increase our operating and compliance costs.
Economic Growth, Regulatory Relief, and Consumer Protection Act
The Economic Growth, Regulatory Relief, and Consumer Protection Act (the EGRRCPA) became law on May 24, 2018. The EGRRCPA keeps in place fundamental aspects of the current bank regulatory structure, but provides community banks with relief from certain regulatory requirements, including some imposed by the Dodd-Frank Act.
Among other things, the EGRRCPA requires the federal banking agencies to develop regulations establishing a “community bank leverage ratio” for banks and holding companies with less than $10 billion in consolidated assets and a qualifying risk profile. The EGRRCPA defines “community bank leverage ratio” (or CBLR) as the ratio of tangible equity capital to average total consolidated assets. The required regulations must specify a minimum CBLR of not less than 8% and not more than 10%. Qualifying banks that exceed the minimum CBLR will be deemed to be in compliance with generally applicable risk-based capital and leverage requirements and will be considered “well-capitalized” under Section 38 of the Federal Deposit Insurance Act (FDIA). On November 21, 2018, the federal banking agencies issued a notice of proposed rulemaking regarding these provisions of the EGRRCPA. The agencies proposed a minimum CBLR of 9%.
The EGRRCPA provides insured depository institutions and their affiliates with less than $10 billion in total consolidated assets and limited trading activities with an exemption from the Dodd-Frank Act’s “Volcker Rule” (which generally restricts certain banking entities such as the Company and the Bank from engaging in proprietary trading activities and entering into certain relationships with hedge funds and private-equity funds).
The EGRRCPA increased the consolidated assets limit for bank holding companies covered by the Federal Reserve Board’s “Small Bank Holding Company Policy Statement” (the Policy) from $1 billion to $3 billion. In addition to the consolidated assets limit, a covered bank holding company may not be engaged in significant non-banking and off-balance sheet activities and may not have a material amount of debt or equity securities outstanding (other than trust preferred securities) that are registered with the SEC. The Federal Reserve Board retains the authority to exclude any bank holding company from the Policy if such action is warranted for supervisory purposes. The Policy allows covered bank holding companies to operate with higher levels of debt than would normally be permitted. Under the Policy, a covered bank holding company is prohibited from paying dividends if its debt-to-equity ratio exceeds 1:1. In addition, the Federal Reserve Board expects that bank holding companies will retire all debt within 25 years of being incurred and reduce their debt to equity ratio to 30:1 or less within 12 years of incurring the debt. The Policy also directs that each depository institution subsidiary of a covered bank holding company remain well-capitalized. On August 28, 2018, the Federal Reserve Board issued an interim final rule regarding revisions to the Policy prompted by the EGRRCPA.
The EGRRCPA increased the consolidated assets threshold from $1 billion to $3 billion for insured depository institutions that qualify for an 18-month on-site exam cycle.
The EGRRCPA requires the federal banking agencies to promulgate regulations permitting insured depository institutions that have less than $5 billion in total consolidated assets (and satisfy other conditions) to use short-form reports of condition (i.e. call reports) for the first and third quarters of each year. On November 19, 2018, the federal banking agencies issued a notice of proposed rulemaking regarding these provisions of the EGRRCPA.
A number of the provisions included in the EGRRCPA require the federal banking agencies to issue regulations. It will likely take some time before all of these regulations are issued and fully implemented. The Company expects to continue to evaluate the potential impact of the EGRRCPA as it is further implemented by the regulators.
9
Connecticut Banking Laws and Supervision
Connecticut Department of Banking. The Connecticut Department of Banking regulates the internal organization as well as the deposit, lending and investment activities of state-chartered banks, including the Bank. The approval of the Connecticut Department of Banking is required for, among other things, the establishment of branch offices and business combination transactions. The Connecticut Department of Banking conducts periodic examinations of Connecticut chartered banks. The FDIC also regulates many of the areas regulated by the Connecticut Department of Banking, and federal law may limit some of the authority provided to Connecticut chartered banks by Connecticut law.
Lending Activities. Connecticut banking laws grant banks broad lending authority. With certain limited exceptions, loans to any one obligor under this statutory authority may not exceed 15% and fully secured loans may not exceed an additional 10% of a bank’s equity capital and allowance for loan losses.
Dividends. The Bank may pay cash dividends out of its net profits. For purposes of this restriction, “net profits” represents the remainder of all earnings from current operations. Further, the total amount of all dividends declared by a bank in any year may not exceed the sum of a bank’s net profits for the year in question combined with its retained net profits from the preceding two years. Federal law also prevents an institution from paying dividends or making other capital distributions that, if by doing so, would cause it to become “undercapitalized”. Beginning January 1, 2016, the Basel III Capital Rules limit the amount of dividends the Bank can pay if its capital ratios are below the threshold levels of the capital conservation buffer established by the rules. The capital conservation buffer was phased in from January 1, 2016 to January 1, 2019, when the full capital conservation buffer of 2.5% (as a percentage of risk-weighted assets) became effective. The capital conservation buffer is in addition to the minimum risk-based capital requirement. The FDIC may further limit a bank’s ability to pay dividends. Moreover, the federal agencies have issued policy statements that provide that insured banks should generally only pay dividends out of current operating earnings.
Powers. Connecticut law permits Connecticut banks to sell insurance and fixed and variable rate annuities if licensed to do so by the Connecticut Insurance Department. With the prior approval of the Connecticut Department of Banking, Connecticut banks are also authorized to engage in a broad range of activities related to the business of banking, or that are financial in nature or that are permitted under the Bank Holding Company Act or the Home Owners’ Loan Act, both federal statutes, or the regulations promulgated as a result of these statutes. Connecticut banks are also authorized to engage in any activity permitted for a national bank or a federal savings association upon filing notice with the Connecticut Department of Banking unless the Connecticut Department of Banking disapproves the activity.
Assessments. Connecticut banks are required to pay annual assessments to the Connecticut Department of Banking to fund the Connecticut Department of Banking’s operations. The general assessments are paid pro-rata based upon a bank’s asset size.
Enforcement. Under Connecticut law, the Connecticut Department of Banking has extensive enforcement authority over Connecticut banks and, under certain circumstances, affiliated parties, insiders, and agents. The Connecticut Department of Banking’s enforcement authority includes cease and desist orders, fines, receivership, conservatorship, removal of officers and directors, emergency closures, dissolution and liquidation.
Federal Bank Holding Company Regulation
General. As a bank holding company, we are subject to comprehensive regulation and regular examinations by the Federal Reserve Board. The Federal Reserve Board also has extensive enforcement authority over bank holding companies, including, among other things, the ability to assess civil money penalties, to issue cease and desist or removal orders and to require that a bank holding company divest subsidiaries (including its bank subsidiaries). In general, enforcement actions may be initiated for violations of law and regulations and unsafe or unsound practices.
Under Federal Reserve Board policy which has been codified by the Dodd-Frank Act, a bank holding company must serve as a source of strength for its subsidiary bank. Under this policy, the Federal Reserve Board may require, and has required in the past, a bank holding company to contribute additional capital to an undercapitalized subsidiary bank. A bank holding company must obtain Federal Reserve Board approval before: (1) acquiring, directly or indirectly, ownership or control of any voting securities of another bank or bank holding company if, after such acquisition, it would own or control more than 5% of such securities (unless it already owns or controls the majority of such securities); (2) acquiring all or substantially all of the assets of another bank or bank holding company; or (3) merging or consolidating with another bank holding company. Under Connecticut banking law, no person may acquire beneficial ownership of more than 10% of any class of voting securities of a Connecticut chartered bank, or any bank holding company of such a bank, without prior notification of, and lack of disapproval by, the Connecticut Department of Banking.
The Bank Holding Company Act also prohibits a bank holding company, with certain exceptions, from acquiring direct or indirect ownership or control of more than 5% of the voting shares of any company which is not a bank or bank holding company, or from engaging directly or indirectly in activities other than those of banking, managing or controlling banks, or providing services for its subsidiaries. The principal exceptions to these prohibitions involve certain non-bank activities which, by statute
10
or by Federal Reserve Board regulation or order, have been identified as activities closely related to the business of banking or managing or controlling banks. The list of activities permitted by the Federal Reserve Board includes, among other things: (1) operating a savings institution, mortgage company, finance company, credit card company or factoring company; (2) performing certain data processing operations; (3) providing certain investment and financial advice; (4) underwriting and acting as an insurance agent for certain types of credit-related insurance; (5) leasing property on a full-payout, non-operating basis; (6) selling money orders, travelers’ checks and United States savings bonds; (7) real estate and personal property appraising; (8) providing tax planning and preparation services; (9) financing and investing in certain community development activities; and (10) subject to certain limitations, providing securities brokerage services for customers.
Dividends. The Federal Reserve Board has issued a policy statement on the payment of cash dividends by bank holding companies, which expresses the Federal Reserve Board’s view that a bank holding company should pay cash dividends only to the extent that the Bank Holding Company’s net income for the past year is sufficient to cover both the cash dividends and a rate of earnings retention that is consistent with the Bank Holding Company’s capital needs, asset quality and overall financial condition. The Federal Reserve Board also indicated that it would be inappropriate for a bank holding company experiencing serious financial problems to borrow funds to pay dividends. As discussed above, the Federal Reserve Board’s Small Bank Holding Company Policy Statement includes provisions regulating the payment of dividends by companies subject to that policy statement.
Substantially all of our income is derived from, and the principal source of our liquidity is, dividends from the Bank. The ability of the Bank to pay dividends to us is also restricted by federal and state laws, regulations and policies. The Bank may pay cash dividends out of its net profits. For purposes of this restriction, “net profits” represents the remainder of all earnings from current operations. Further, the total amount of all dividends declared by a bank in any year may not exceed the sum of a bank’s net profits for the past two fiscal years, plus the portion of the year in which the dividend is paid.
Under federal law, the Bank may not pay any dividend to us if the Bank is undercapitalized or the payment of the dividend would cause it to become undercapitalized. Beginning January 1, 2016, the Basel III Capital Rules limit the amount of dividends the Bank can pay to us if its capital ratios are below the threshold levels of the capital conservation buffer established by the rules. The capital conservation buffer was phased in from January 1, 2016 to January 1, 2019, when the full capital conservation buffer of 2.5% (as a percentage of risk-weighted assets) became effective. The capital conservation buffer is in addition to the minimum risk-based capital requirement. The FDIC may further restrict the payment of dividends by requiring the Bank to maintain a higher level of capital than would otherwise be required for it to be adequately capitalized for regulatory purposes. Moreover, if, in the opinion of the FDIC, the Bank is engaged in an unsafe or unsound practice (which could include the payment of dividends), the FDIC may require, generally after notice and hearing, it to cease such practice. The FDIC has indicated that paying dividends that deplete a depository institution’s capital base to an inadequate level would be an unsafe banking practice. The FDIC has also issued policy statements providing that insured depository institutions generally should pay dividends only out of current operating earnings.
Redemption. Bank holding companies are required to give the Federal Reserve Board prior written notice of any purchase or redemption of its outstanding equity securities if the gross consideration for the purchase or redemption, when combined with the net consideration paid for all such purchases or redemptions during the preceding 12 months, is equal to 10% or more of the consolidated net worth of the Bank Holding Company. The Federal Reserve Board may disapprove such a purchase or redemption if it determines that the proposal would constitute an unsafe or unsound practice or would violate any law, regulation, Federal Reserve Board order or any condition imposed by, or written agreement with, the Federal Reserve Board. This notification requirement does not apply to any bank holding company that (i) meets the well capitalized standard for commercial banks, (ii) is “well managed” within the meaning of the Federal Reserve Board regulations and (iii) is not subject to any unresolved supervisory issues. As discussed above, the Federal Reserve Board’s Small Bank Holding Company Policy Statement includes provisions regulating stock redemptions by companies subject to that policy statement, including when such notice requirements apply.
Federal Bank Regulation
Safety and Soundness. The federal banking agencies, including the FDIC, have implemented rules and guidelines concerning standards for safety and soundness required pursuant to Section 39 of the Federal Deposit Insurance Corporation Improvement Act, or FDICIA. In general, the standards relate to (1) operational and managerial matters; (2) asset quality and earnings; and (3) compensation. The operational and managerial standards cover (a) internal controls and information systems, (b) internal audit systems, (c) loan documentation, (d) credit underwriting, (e) interest rate exposure, (f) asset growth, and (g) compensation, fees and benefits. Under the asset quality and earnings standards, the Bank is required to establish and maintain systems to (i) identify problem assets and prevent deterioration in those assets, and (ii) evaluate and monitor earnings and ensure that earnings are sufficient to maintain adequate capital reserves. Finally, the compensation standard states that compensation will be considered excessive if it is unreasonable or disproportionate to the services actually performed by the individual being compensated. If an insured state-chartered bank fails to meet any of the standards promulgated by regulation, then such institution will be required to submit a plan within 30 days to the FDIC specifying the steps it will take to correct the deficiency. In the event that an insured state-chartered bank fails to submit or fails in any material respect to implement a compliance plan within the time allowed by the federal banking agency, Section 39 of the FDICIA provides that the FDIC must order the institution to correct the deficiency
11
and may (1) restrict asset growth; (2) require the bank to increase its ratio of tangible equity to assets; (3) restrict the rates of interest that the bank may pay; or (4) take any other action that would better carry out the purpose of prompt corrective action. We believe that the Bank has been and will continue to be in compliance with each of the standards as they have been adopted by the FDICIA.
Capital Requirements. The Federal Reserve Board monitors our capital adequacy, on a consolidated basis, and the FDIC and Connecticut Department of Banking monitor the capital adequacy of the Bank.
The Federal Reserve, the FDIC and the other federal and state bank regulatory agencies establish regulatory capital guidelines for U.S. banking organizations.
As of January 1, 2015, the Company and the Bank became subject to new capital rules set forth by the Federal Reserve, the FDIC and the other federal and state bank regulatory agencies. The new capital rules revise the banking agencies’ leverage and risk-based capital requirements and the method for calculating risk weighted assets to make them consistent with agreements that were reached by the Basel Committee on Banking Supervision and certain provisions of the Dodd-Frank Act (the Basel III Capital Rules).
The Basel III Capital Rules establish a new minimum common equity Tier 1 capital requirement of 4.5% of risk-weighted assets; set the minimum leverage ratio at 4% of total assets; increased the minimum Tier 1 capital to risk-weighted assets requirement from 4% to 6%; and retained the minimum total capital to risk weighted assets requirement at 8.0%. A “well-capitalized” institution must generally maintain capital ratios 200 basis points higher than the minimum guidelines.
The Basel III Capital Rules also change the risk weights assigned to certain assets. The Basel III Capital Rules assigned a higher risk weight (150%) to loans that are more than 90 days past due or are on nonaccrual status and to certain commercial real estate facilities that finance the acquisition, development or construction of real property. The Basel III Capital Rules also alter the risk weighting for other assets, including marketable equity securities that are risk weighted generally at 300%. The Basel III Capital Rules require certain components of accumulated other comprehensive income (loss) to be included for purposes of calculating regulatory capital requirements unless a one-time opt-out is exercised. The Bank did exercise its opt-out option and will exclude the unrealized gain (loss) on investment securities component of accumulated other comprehensive income (loss) from regulatory capital.
The Basel III Capital Rules limit a banking organization’s capital distributions and certain discretionary bonus payments to executive officers if the banking organization does not hold a “capital conservation buffer” of 2.5% in addition to the minimum risk based capital requirement. The “capital conservation buffer” was being phased in from January 1, 2016 to January 1, 2019, when the full capital conservation buffer became effective.
Failure to meet minimum capital requirements can initiate certain mandatory and possibly additional discretionary actions by regulators that, if undertaken, could have a direct material effect on the Company’s consolidated financial statements.
As discussed above, the Economic Growth, Regulatory Relief, and Consumer Protection Act includes simplified capital rules for community banks with less than $10 billion in total consolidated assets and with limited trading activities.
Liquidity. We are required to maintain a sufficient amount of liquid assets to ensure our safe and sound operation.
The final Basel III framework also requires banks and bank holding companies to measure their liquidity against specific liquidity tests. Although similar in some respects to liquidity measures historically applied by banks and banking agencies for management and supervisory purposes, the Basel III framework would require specific liquidity tests by rule.
Transactions with Affiliates. Under current federal law, transactions between depository institutions and their affiliates are governed by Sections 23A and 23B of the Federal Reserve Act, or FRA, and the Federal Reserve Board’s Regulation W. In a holding company context, at a minimum, the parent holding company of a bank and any companies which are controlled by such parent holding company is an affiliate of the bank. Generally, Section 23A limits the extent to which the bank or its subsidiaries may engage in “covered transactions” with any one affiliate to 10% of such bank’s capital stock and surplus, and contains an aggregate limit on all such transactions with all affiliates to 20% of capital stock and surplus. The term “covered transaction” includes, among other things, the making of loans or other extensions of credit to an affiliate and the purchase of assets from an affiliate. Section 23A also establishes specific collateral requirements for loans or extensions of credit to, or guarantees, acceptances on letters of credit issued on behalf of an affiliate. Section 23B requires that covered transactions and a broad list of other specified transactions be on terms substantially the same, or no less favorable, to the bank or its subsidiary as similar transactions with non-affiliates. The Dodd-Frank Act has expanded the definition of covered transactions and increased the timing and other aspects of the collateral requirements associated with covered transactions, including an expansion of the covered transactions to include credit exposures related to derivatives, repurchase agreements and securities lending arrangements and an increase in the amount of time for which collateral requirements regarding covered transactions must be satisfied.
Loans to Insiders. Further, Section 22(h) of the FRA restricts a depository institution with respect to loans to directors, executive officers, and principal shareholders (or insiders). Under Section 22(h), loans to insiders and their related interests may
12
not exceed, together with all other outstanding loans to such persons and affiliated entities, the depository institution’s total unimpaired capital and unimpaired surplus. Loans to insiders above specified amounts must receive the prior approval of the board of directors. Further, under Section 22(h), loans to directors, executive officers and principal shareholders must be made on terms substantially the same as offered in comparable transactions to other persons, except that such insiders may receive preferential loans made under a benefit or compensation program that is widely available to the depository institution’s employees and does not give preference to the insider over the employees. Section 22(g) of the FRA places additional limitations on loans to executive officers. In addition to enhancing restrictions on insider transactions, the Dodd-Frank Act increases the types of transactions with insiders subject to restrictions, including certain asset sales with insiders.
Enforcement. The FDIC has extensive enforcement authority over insured banks, including the Bank. This enforcement authority includes, among other things, the ability to assess civil money penalties, issue cease and desist orders and remove directors and officers. In general, these enforcement actions may be initiated in response to violations of laws and regulations and unsafe or unsound practices.
The FDIC has authority under federal law to appoint a conservator or receiver for an insured bank under limited circumstances. The FDIC is required, with certain exceptions, to appoint a receiver or conservator for an insured state nonmember bank if that bank was “critically undercapitalized” on average during the calendar quarter beginning 270 days after the date on which the institution became “critically undercapitalized.” The FDIC may also appoint itself as conservator or receiver for an insured state non-member institution under specific circumstances on the basis of the institution’s financial condition or upon the occurrence of other events, including: (1) insolvency; (2) substantial dissipation of assets or earnings through violations of law or unsafe or unsound practices; (3) existence of an unsafe or unsound condition to transact business; and (4) insufficient capital, or the incurring of losses that will deplete substantially all of the institution’s capital with no reasonable prospect of replenishment without federal assistance.
Insurance of Deposit Accounts. Deposit accounts at the Bank are insured by the Deposit Insurance Fund, generally up to a maximum of $250,000 per separately insured depositor, pursuant to changes made permanent by the Dodd-Frank Act. The FDIC assesses insured depository institutions to maintain the Deposit Insurance Fund. No institution may pay a dividend if in default of its deposit insurance assessment.
Under the FDIC’s risk-based assessment system, insured depository institutions are assigned to a risk category based on supervisory evaluations, regulatory capital levels and other factors. A depository institution’s assessment rate depends upon the category to which it is assigned and certain adjustments specified by the FDIC, with less risky institutions paying lower assessments.
On February 7, 2011, as required by the Dodd-Frank Act, the FDIC published a final rule to revise the deposit insurance assessment system. The rule, which took effect April 1, 2011, changed the assessment base used for calculating deposit insurance assessments from deposits to average consolidated total assets less average tangible equity capital. Since the new base is larger than the previous base, the FDIC also lowered assessment rates so that the rule would not significantly alter the total amount of revenue collected from the industry. The range of adjusted assessment rates is now 2.5 to 45 basis points of the new assessment base. The rule is expected to benefit smaller financial institutions, which typically rely more on deposits for funding, and shift more of the burden for supporting the Deposit Insurance Fund to larger financial institutions, which are thought to have greater access to nondeposit funding.
The Dodd-Frank Act increased the minimum target Deposit Insurance Fund ratio from 1.15% of estimated insured deposits to 1.35% of estimated insured deposits. The FDIC must seek to achieve the 1.35% ratio by September 30, 2020. In setting the assessments necessary to achieve the 1.35% ratio, the FDIC is supposed to offset the effect of the increased ratio on insured institutions with assets of less than $10 billion. The Dodd-Frank Act eliminated the 1.5% maximum fund ratio, instead leaving it to the discretion of the FDIC. The FDIC has exercised that discretion by establishing a long range fund ratio of 2%.
A material increase in FDIC insurance premiums would likely have an adverse effect on the operating expenses and results of operations of the Bank. Management cannot predict what FDIC insurance assessment rates will be in the future.
Insurance of deposits may be terminated by the FDIC upon a finding that a depository institution has engaged in unsafe or unsound practices, is in an unsafe or unsound condition to continue operations or has violated any applicable law, regulation, rule, order or condition imposed by the FDIC. We are not aware of any current practice, condition or violation that might lead to termination of the Bank’s deposit insurance.
Deposit Operations. In addition to the regulations above, the Bank’s deposit operations are subject to other federal laws applicable to depository accounts, such as the:
• | Truth-In-Savings Act, requiring certain disclosures for consumer deposit accounts; |
• | Right to Financial Privacy Act, which imposes a duty to maintain confidentiality of consumer financial records and prescribes procedures for complying with administrative subpoenas of financial records; |
13
• | Electronic Fund Transfer Act and Regulation E issued by the Consumer Financial Protection Bureau to implement that act, which govern electronic deposits to and withdrawals from deposit accounts and customers’ rights and liabilities arising from the use of automated teller machines and other electronic banking services; and |
• | Rules and regulations of the various federal banking agencies charged with the responsibility of implementing these federal laws. |
Federal Reserve System. The Federal Reserve Board regulations require depository institutions to maintain noninterest earning reserves against their transaction accounts (primarily NOW and regular checking accounts). The Federal Reserve Board regulations generally require that reserves be maintained against aggregate transaction accounts. The Bank is in compliance with these requirements.
Federal Home Loan Bank of Boston (FHLB). The Bank is a member of the FHLB, which is one of the regional Federal Home Loan Banks composing the Federal Home Loan Bank System. Each Federal Home Loan Bank serves as a central credit facility primarily for its member institutions. The Bank, as a member of the FHLB, is required to acquire and hold shares of capital stock in the FHLB.
Community Reinvestment Act (CRA). Under the CRA, as implemented by FDIC regulations, a bank has a continuing and affirmative obligation, consistent with its safe and sound operation, to help meet the credit needs of its entire community, including low and moderate income neighborhoods. The CRA does not establish specific lending requirements or programs for financial institutions nor does it limit an institution’s discretion to develop the types of products and services that it believes are best suited to its particular community. The CRA does require the FDIC, in connection with its examination of a bank, to assess the bank’s record of meeting the credit needs of its community and to take such record into account in its evaluation of certain applications by such bank, including applications to acquire branches and other financial institutions. The CRA requires the FDIC to provide a written evaluation of a bank’s CRA performance utilizing a four-tiered descriptive rating system. In particular, the system focuses on three tests:
• | A lending test, to evaluate the bank’s record of making loans in its assessment areas; |
• | An investment test, to evaluate the bank’s record of investing in community development projects, affordable housing, and programs benefiting low or moderate income individuals and businesses; and |
• | A service test, to evaluate the bank’s delivery of services through its branches, ATMs, and other offices. |
Connecticut has its own statutory counterpart to the CRA which is applicable to the Bank. The Connecticut version is generally similar to the CRA but utilizes a five-tiered descriptive rating system. Connecticut law requires the Connecticut Department of Banking to consider, but not be limited to, a bank’s record of performance under Connecticut law in considering any application by the Bank to establish a branch or other deposit-taking facility, to relocate an office or to merge or consolidate with or acquire the assets and assume the liabilities of any other banking institution. In our most recent evaluation under Connecticut law the Bank received a CRA rating of “satisfactory”.
Consumer Protection and Fair Lending Regulations. We are subject to a variety of federal and Connecticut statutes and regulations that are intended to protect consumers and prohibit discrimination in the granting of credit. These statutes and regulations provide for a range of sanctions for non-compliance with their terms, including imposition of administrative fines and remedial orders, and referral to the Attorney General for prosecution of a civil action for actual and punitive damages and injunctive relief. Certain of these statutes authorize private individual and class action lawsuits and the award of actual, statutory and punitive damages and attorneys’ fees for certain types of violations.
At the federal level, these laws include, among others, the following:
• | Federal Truth-In-Lending Act, governing disclosures of credit terms to consumer borrowers; |
• | Home Mortgage Disclosure Act of 1975, requiring financial institutions to provide information to enable the public and public officials to determine whether a financial institution is fulfilling its obligation to help meet the housing needs of the community it serves; |
• | Equal Credit Opportunity Act, prohibiting discrimination on the basis of race, color, religion or other prohibited factors in extending credit; |
• | Fair Credit Reporting Act of 1978, governing the use of consumer credit reports and the provision of information to credit reporting agencies; |
• | Fair Debt Collection Practices Act, governing the manner in which consumer debts may be collected by collection agencies; |
• | Real Estate Settlement Procedures Act, governing closing costs and settlement procedures and disclosures to consumers related thereto; |
14
• | Service members Civil Relief Act of 2004, governing the repayment terms of, and property rights underlying, secured obligations of persons in military service; and |
• | Rules and regulations of the various federal agencies charged with the responsibility of implementing these federal laws. |
Additional Considerations
Regulatory Enforcement Authority. Federal banking agencies have substantial enforcement authority over the financial institutions that they regulate including, among other things, the ability to assess civil money penalties, to issue cease-and-desist or removal orders and to initiate injunctive actions against banking organizations and institution-affiliated parties, as defined. In general, these enforcement actions may be initiated for violations of laws and regulations and unsafe or unsound practices. Other actions or inactions may provide the basis for enforcement action, including misleading or untimely reports filed with regulatory authorities. Except under certain circumstances, federal law requires public disclosure of final enforcement actions by the federal banking agencies.
Incentive Compensation Guidance. The federal banking agencies have released comprehensive guidance on incentive compensation policies focused on ensuring that financial institutions’ incentive compensation policies do not undermine the safety and soundness of those institutions by encouraging excessive risk taking. The incentive compensation guidance sets expectations for financial institutions concerning their incentive compensation arrangements and related risk management, control and governance processes. All employees that have the ability to materially affect the risk profile of a financial institution, either individually or as part of a group, are covered by the guidance. The guidance is based upon three core concepts: (1) balanced risk-taking incentives; (2) effective controls and risk management compatibility; and (3) strong corporate governance. Deficiencies in compensation practices that are identified may be incorporated into the institution’s supervisory ratings, which can affect the organization’s ability to take certain actions, including the ability to make acquisitions or take other actions. Enforcement actions by the institution’s primary federal banking agency may be initiated if the institution’s incentive compensation programs pose a risk to the safety and soundness of the organization. In addition, beginning January 1, 2016, the Basel III Capital Rules limit discretionary bonus payments to the Bank’s executive officers if its capital ratios are below the threshold levels of the capital conservation buffer established by the rules. The capital conservation buffer was phased in from January 1, 2016 to January 1, 2019, when the full capital conservation buffer of 2.5% (as a percentage of risk-weighted assets) became effective. The capital conservation buffer is in addition to the minimum risk-based capital requirement.
Sarbanes-Oxley Act of 2002. The Sarbanes-Oxley Act of 2002 generally established a comprehensive framework to modernize and reform the oversight of public company auditing, improve the quality and transparency of financial reporting by those companies and strengthen the independence of auditors. Among other things, the legislation (1) created the Public Company Accounting Oversight Board, which is empowered to set auditing, quality control and ethics standards, to inspect registered public accounting firms, to conduct investigations and to take disciplinary actions, subject to SEC oversight and review; (2) strengthened auditor independence from corporate management by, among other things, limiting the scope of consulting services that auditors can offer their public company audit clients; (3) heightened the responsibility of public company directors and senior managers for the quality of the financial reporting and disclosure made by their companies; (4) adopted a number of provisions to deter wrongdoing by corporate management; (5) imposed a number of new corporate disclosure requirements; (6) adopted provisions which generally seek to limit and expose to public view possible conflicts of interest affecting securities analysts; and (7) imposed a range of new criminal penalties for fraud and other wrongful acts, as well as extended the period during which certain types of lawsuits can be brought against a company or its insiders. The Sarbanes-Oxley Act applies generally to all companies that file or are required to file periodic reports with the SEC under the Exchange Act.
Financial Modernization. The Gramm-Leach-Bliley Act, or the GLB Act, permits greater affiliation among banks, securities firms, insurance companies, and other companies under a type of financial services company known as a “financial holding company”. A financial holding company essentially is a bank holding company with significantly expanded powers. Financial holding companies are authorized by statute to engage in a number of financial activities previously impermissible for bank holding companies, including securities underwriting, dealing and market making; sponsoring mutual funds and investment companies; insurance underwriting and agency; and merchant banking activities. The GLB Act also permits the Federal Reserve Board and the Treasury Department to authorize additional activities for financial holding companies if they are “financial in nature” or “incidental” to financial activities. A bank holding company may become a financial holding company if each of its subsidiary banks is well capitalized, well managed, and has at least a “satisfactory” CRA rating. A financial holding company must provide notice to the Federal Reserve Board within 30 days after commencing activities previously determined by statute or by the Federal Reserve Board and Department of the Treasury to be permissible. We have not submitted notice to the Federal Reserve Board of intent to be deemed a financial holding company. However, we are not precluded from submitting a notice in the future should we wish to engage in activities only permitted to financial holding companies.
Privacy Requirements. Under the GLB Act, all financial institutions are required to establish policies and procedures to restrict the sharing of non-public customer data with non-affiliated parties and to protect customer data from unauthorized access. In addition, the Fair Credit Reporting Act of 1970, or FCRA, includes many provisions concerning national credit reporting
15
standards and permits consumers, including customers of the Bank, to opt out of information-sharing for marketing purposes among affiliated companies. The Fair and Accurate Credit Transactions Act of 2004 amended certain provisions of the FCRA and requires banks and other financial institutions to notify their customers if they report negative information about them to a credit bureau or if they are granted credit on terms less favorable than those generally available. The Bank currently has a privacy protection policy in place and believes such policy is in compliance with the regulations.
The Bank Secrecy Act and Related Anti-Money Laundering and Anti-Terrorist Financing Legislation. The Bank Secrecy Act, or the BSA, provides, in part, for the facilitation of information sharing among governmental entities and financial institutions for the purpose of combating terrorism and money laundering by enhancing anti-money laundering and financial transparency laws, as well as enhanced information collection tools and enforcement mechanics for the U.S. government, including: (1) requiring standards for verifying customer identification information at account opening; (2) rules to promote cooperation among financial institutions, regulators, and law enforcement entities in identifying parties that may be involved in terrorism or money laundering; (3) reports filed with the Treasury Department’s Financial Crimes Enforcement Network of transactions exceeding $10,000 in currency; (4) filing suspicious activities reports by financial institutions regarding suspected customer money laundering, terrorism financing, or other violations of U.S. laws and regulations; and (5) requiring enhanced due diligence requirements for financial institutions that administer, maintain, or manage private bank accounts or correspondent accounts for non-U.S. persons.
Title III of the USA PATRIOT Act of 2001 amended the BSA and incorporates anti-terrorist financing provisions into the requirements of the BSA and its implementing regulations. Among other things, the USA PATRIOT Act requires all financial institutions, including us, to institute and maintain a risk-based anti-money laundering compliance program that includes a customer identification program, provides for information sharing with law enforcement and between certain financial institutions by means of an exemption from the privacy provisions of the GLB Act, prohibits U.S. banks and broker-dealers from maintaining accounts with foreign “shell” banks, establishes due diligence and enhanced due diligence requirements for certain foreign correspondent banking and foreign private banking accounts and imposes additional record keeping requirements for certain correspondent banking arrangements. The USA PATRIOT Act also grants broad authority to the Secretary of the Treasury to take actions to combat money laundering, and federal bank regulators are required to evaluate the effectiveness of an applicant in combating money laundering in determining whether to approve any application submitted by a financial institution.
The Office of Foreign Assets Control, or OFAC, which is a division of the Treasury Department, is responsible for helping to ensure that U.S. entities do not engage in transactions with “enemies” of the United States, as defined by various Executive Orders and Acts of Congress. OFAC maintains lists of names of persons and organizations suspected of aiding, harboring or engaging in money laundering, terrorist acts, and other crimes. If the Bank finds a name on any transaction, account or wire transfer that is on an OFAC list, the Bank must freeze such account, file a suspicious activity report and notify OFAC. We have established policies and procedures to ensure compliance with the federal anti-laundering and combating terrorism provisions.
Proposed Legislation and Regulatory Action. New statutes, regulations and guidance are regularly proposed that contain wide-ranging potential changes to the statutes, regulations and competitive relationships of financial institutions operating and doing business in the United States. We cannot predict whether or in what form any proposed regulation or statute will be adopted or the extent to which our business may be affected by any new regulation or statute.
Effect of Governmental Monetary Policies. Our earnings will be affected by domestic economic conditions and the monetary and fiscal policies of the U.S. government and its agencies. The Federal Reserve Board’s monetary policies have had, and are likely to continue to have, an important impact on the operating results of commercial banks through its power to implement national monetary policy in order, among other things, to curb inflation or combat a recession. The monetary policies of the Federal Reserve Board affect the levels of bank loans, investments and deposits through its control over the issuance of U.S. government securities, its regulation of the discount rate applicable to member banks and its influence over reserve requirements to which member banks are subject. We cannot predict the nature or impact of future changes in monetary and fiscal policies.
Taxation
Federal Taxation
General: We are subject to federal income taxation in the same general manner as other corporations, with limited exceptions. The following discussion of federal taxation is intended only to summarize certain pertinent federal income tax matters and is not a comprehensive description of the tax rules applicable to us.
On December 22, 2017 the Tax Cuts and Jobs Act of 2017 was signed into law. As a result, the corporate tax rate was reduced from 35% to 21%. Companies are required to recognize the effect of tax law changes in the period of enactment in accordance with GAAP. As result of the tax law changes the Company recognized a write-down of its deferred tax asset position in the amount of $3.3 million for the year ended December 31, 2017.
Method of Accounting: For Federal income tax purposes, we report income and expenses on the accrual method of accounting and use tax year ending December 31 for filing federal income tax returns.
16
Alternative Minimum Tax: The Internal Revenue Code of 1986, as amended (the “Code”), imposes an alternative minimum tax (“AMT”) at a rate of 20.0% on a base of regular taxable income plus certain tax preferences which we refer to as “alternative minimum taxable income.” The AMT is payable to the extent such alternative minimum taxable income is in excess of an exemption amount and the AMT exceeds the regular income tax. Net operating losses can offset no more than 90.0% of alternative minimum taxable income. Certain AMT payments may be used as credits against regular tax liabilities in future years. We have not been subject to the AMT and have no such amounts available as credits for carryover.
Net Operating Loss Carryovers: For the years ended 2018 and prior a corporation may carry back generated net operating losses to the preceding two taxable years and forward to the succeeding 20 taxable years. For net operating losses arising in tax years after 2018, a corporation may not carryback the net operating loss but may carryforward such losses indefinitely, however the net operating loss deduction in a given year is limited to 80% of taxable income. At December 31, 2018, we had $2.5 million of net operating loss carryforwards for federal income tax purposes. The carryovers were transferred to the Company upon the merger with The Wilton Bank.
Corporate Dividends-Received Deduction: The Company may exclude from its income 100.0% of dividends received from the Bank as a member of the same affiliated group of corporations. The corporate dividends received deduction is 80.0% in the case of dividends received from corporations with which a corporate recipient does not file a consolidated tax return, and corporations which own less than 20.0% of the stock of a corporation distributing a dividend may deduct only 70.0% of dividends received or accrued on their behalf.
The Company and the Bank are not currently under audit with respect to their federal tax returns.
State Taxation
We are subject to the Connecticut corporation business tax. The Connecticut corporation business tax is based on the federal taxable income before net operating loss and special deductions and makes certain modifications to federal taxable income to arrive at Connecticut taxable income. Connecticut taxable income is multiplied by the state tax rate (7.5% for the fiscal years ending December 31, 2018 and 2017) to arrive at Connecticut income tax. We are also subject to state income tax in other states as a result of loan originations made in other states.
In October, 2015, the Company created Bankwell Loan Servicing Group, Inc., a Passive Investment Company (“PIC”) organized for state income tax purposes. The PIC is a wholly-owned subsidiary of the Bank operating in accordance with Connecticut statutes. The PIC’s activities are limited in scope to holding and managing loans that are collateralized by real estate. Income earned by a PIC is determined in accordance with the statutory requirements for a passive investment company and the dividends paid by the PIC to the Bank are not taxable income for Connecticut income tax purposes. As a result of the formation of the PIC, the Bank no longer expects to be subject to Connecticut income taxes. State taxes are being recognized for income taxes on income earned in other states.
The Company and the Bank are not currently under audit with respect to their state tax returns.
17
Item 1A. Risk Factors
Risks Relating to Our Business
As a business operating in the financial services industry, our business and operations may be adversely affected in numerous and complex ways by weak economic conditions.
Our businesses and operations, which primarily consist of lending money to customers in the form of loans, borrowing money from customers in the form of deposits and investing in securities, are sensitive to general business and economic conditions in the United States. If the U.S. economy weakens, our growth and profitability from our lending, deposit and investment operations could be constrained. Uncertainty about the federal fiscal policymaking process, the medium and long term fiscal outlook of the federal government, and future tax rates is a concern for businesses, consumers and investors in the United States. In addition, economic conditions in foreign countries, including uncertainty over the stability of the euro currency, could affect the stability of global financial markets, which could hinder U.S. economic growth. Weak economic conditions are characterized by deflation, fluctuations in debt and equity capital markets, a lack of liquidity and/or depressed prices in the secondary market for mortgage loans, increased delinquencies on mortgage, consumer and commercial loans, residential and commercial real estate price declines and lower home sales and commercial activity. The current economic environment is also characterized by interest rates at historically low levels, which impacts our ability to attract deposits and to generate attractive earnings through our investment portfolio. All of these factors are detrimental to our business, and the interplay between these factors can be complex and unpredictable. Our business is also significantly affected by monetary and related policies of the U.S. federal government and its agencies. Changes in any of these policies are influenced by macroeconomic conditions and other factors that are beyond our control. Adverse economic conditions and government policy responses to such conditions could have a material adverse effect on our business, financial condition, results of operations and prospects.
We may not be able to adequately measure and limit our credit risk, which could lead to unexpected losses.
The business of lending is inherently risky, including risks that the principal of or interest on any loan will not be repaid timely or at all or that the value of any collateral supporting the loan will be insufficient to cover our outstanding exposure. These risks may be affected by the strength of the borrower’s business sector and local, regional and national market and economic conditions. Our risk management practices, such as monitoring the concentration of our loans within specific industries and our credit approval practices, may not adequately reduce credit risk, and our credit administration personnel, policies and procedures may not adequately adapt to changes in economic or any other conditions affecting customers and the quality of the loan portfolio. Finally, many of our loans are made to middle market businesses that may be less able to withstand competitive, economic and financial pressures than larger borrowers. A failure to effectively measure and limit the credit risk associated with our loan portfolio could have a material adverse effect on our business, financial condition, results of operations and future prospects.
Our allowance for loan losses may not be adequate to absorb losses inherent in our loan portfolio, which could have a material adverse effect on our financial condition and results of operations.
We maintain an allowance for loan losses to provide for losses inherent in our loan portfolio. Maintaining an adequate allowance for loan losses is critical to our financial results and condition. The level of our allowance for loan losses reflects management’s continuing evaluation of general economic conditions, diversification and seasoning of the loan portfolio, historic loss experience, identified credit problems, delinquency levels and adequacy of collateral. The determination of the appropriate level of the allowance for loan losses is inherently highly subjective and requires us to make significant estimates of and assumptions regarding current credit risks and future trends, all of which may undergo material changes. Inaccurate management assumptions, continuing deterioration of economic conditions affecting borrowers, new information regarding existing loans, identification of additional problem loans and other factors, both within and outside of our control, may require us to increase our allowance for loan losses. In addition, our regulators, as an integral part of their examination process, review our loans and the adequacy of our allowance for loan losses and may direct us to make additions to our allowance for loan losses based on their judgments about information available to them at the time of their examination. Further, if actual charge-offs in future periods exceed the amounts allocated to our allowance for loan losses, we may need additional provision for loan losses to restore the adequacy of our allowance for loan losses. If we are required to materially increase our level of allowance for loan losses for any reason, such increase could have a material adverse effect on our business, financial condition, results of operations and future prospects.
Our concentration of large loans to certain borrowers may increase our credit risk.
Our growth over the last several years has been partially attributable to our ability to originate and retain loans. A good number of these loans have been made to a small number of borrowers, resulting in a high concentration of large loans to certain borrowers. We have established an informal, internal lending limit to one relationship of up to 40% of unimpaired capital and allowance for loan losses, if secured by commercial real estate. A relationship in this instance is defined as loans made to different entities but with a shared borrower principal(s). For individual loans, limits are set so as not to exceed the statutory maximum of 15% of unimpaired capital and allowance for loan losses. However, we may, under certain circumstances, consider going above our internal limit in situations where we are confident that (1) the loan to value ratio, other characteristics or the structure of the loan is such
18
that it is a lower risk than standard, (2) we will be able to sell to another institution some portion of the relationship debt as either a whole loan or participation, (3) there is sufficient diversification in the ownership structure of the proposed borrowing entity that the involvement of one party to whom we have extended other debt will not significantly negatively impact the proposed loan’s performance in a downturn or (4) the proposed loan is secured by particularly strong collateral, for example, a commercial real estate loan secured by real estate that has strong tenants with long-term leases, thereby reducing the reliance on the principals of the borrowing entity. As of December 31, 2018, our five largest relationships ranged from approximately $36.5 million to $84.9 million, and comprised in the aggregate, approximately 15% of our loan portfolio. In addition to other typical risks related to any loan, such as deterioration of the collateral securing the loans, this high concentration of borrowers presents a risk to our lending operations. If any one of these borrowers becomes unable to repay their loan obligations for any reason, our nonperforming loans and our allowance for loan losses could increase significantly, which could adversely and materially affect our business, financial condition and results of operations.
Our commercial real estate loan, commercial loan and construction loan portfolios expose us to risks that may be greater than the risks related to our other mortgage loans.
Our loan portfolio includes non-owner-occupied commercial real estate loans for individuals and businesses for various purposes, which are secured by commercial properties. These loans typically involve repayment dependent upon income generated, or expected to be generated, by the property securing the loan in amounts sufficient to cover operating expenses and debt service. Commercial real estate loans may be affected to a greater extent than residential loans by adverse conditions in real estate markets or the economy because commercial real estate borrowers’ ability to repay their loans depends on successful leasing of their properties, in addition to the factors affecting residential real estate borrowers. These loans also involve greater risk because they generally are not fully amortizing over the loan period, but have a balloon payment due at maturity. A borrower’s ability to make a balloon payment typically will depend on being able to either refinance the loan or sell the underlying property in a timely manner.
These loans expose a lender to greater credit risk than loans secured by residential real estate because the collateral securing these loans typically cannot be liquidated as easily as residential real estate. Non-owner-occupied commercial real estate loans generally involve relatively large balances to single borrowers or related groups of borrowers. Accordingly, charge-offs on non-owner occupied commercial real estate loans may be larger on a per loan basis than those incurred with our residential or consumer loan portfolios.
Commercial loans are typically based on the borrowers’ ability to repay the loans from the cash flow of their businesses. These loans may involve greater risk because the availability of funds to repay each loan depends substantially on the success of the business itself. In addition, the assets securing the loans have the following characteristics: (a) they depreciate over time, (b) they are difficult to appraise and liquidate, and (c) they fluctuate in value based on the success of the business.
Risk of loss on a construction loan depends largely upon whether our initial estimate of the property’s value at completion of construction equals or exceeds the cost of the property construction (including interest), the availability of permanent takeout financing, the completion of the project and/or the builder’s ability to ultimately lease or sell the property. During the construction phase, a number of factors can result in delays and cost overruns. If estimates of value are inaccurate or if actual construction costs exceed estimates, the value of the property securing the loan may be insufficient to ensure full repayment when completed through a permanent loan or by sale of collateral.
Our underwriting, review and monitoring cannot eliminate all of the risks related to these loans. Unexpected deterioration in the credit quality of our commercial real estate loan, commercial loan or construction loan portfolios would require us to increase our provision for loan losses, which would reduce our profitability and could have a material adverse effect on our business, financial condition, results of operations and future prospects.
Lack of seasoning of our loan portfolio could increase risk of credit defaults in the future.
As a result of our growth over the past recent years, a large portion of loans in our loan portfolio and of our lending relationships are of relatively recent origin. In general, loans do not begin to show signs of credit deterioration or default until they have been outstanding for some period of time, a process referred to as “seasoning.” As a result, a portfolio of older loans will usually behave more predictably than a newer portfolio. Because a large portion of our portfolio is relatively new, the current level of delinquencies and defaults may not represent the level that may prevail as the portfolio becomes more seasoned and may not serve as a reliable basis for predicting the health and nature of our loan portfolio, including net charge-offs and the ratio of nonperforming assets in the future. Our limited experience with these loans does not provide us with a significant payment history pattern with which to judge future collectability. As a result, it may be difficult to predict the future performance of our loan portfolio. If defaults increase, we could experience an increase in delinquencies and charge-offs and we may be required to increase our allowance for loan losses, which could have a material adverse effect on our business, financial condition, results of operations and prospects.
19
A prolonged downturn in the real estate market could result in losses and adversely affect our profitability.
As of December 31, 2018, the majority of our loan portfolio was composed of commercial and consumer real estate loans. The sale of real estate collateral in each case provides an alternate source of repayment in the event of default by the borrower and may deteriorate in value during the time the credit is extended. A decline in real estate values could impair the value of our collateral and our ability to sell the collateral upon any foreclosure, which would likely require us to increase our provision for loan losses. In the event of a default with respect to any of these loans, the amounts we receive upon sale of the collateral may be insufficient to recover the outstanding principal and interest on the loan. If we are required to re-value the collateral securing a loan to satisfy the debt during a period of reduced real estate values or to increase our allowance for loan losses, our profitability could be adversely affected, which could have a material adverse effect on our business, financial condition, results of operations and prospects.
We are subject to interest rate risk that could negatively impact our profitability.
Our profitability, like that of most financial institutions, depends to a large extent on our net interest income, which is the difference between our interest income on interest earning assets, such as loans and investment securities, and our interest expense on interest-bearing liabilities, such as deposits and borrowings.
Interest rates are highly sensitive to many factors that are beyond our control, including general economic conditions and policies of various governmental and regulatory agencies and, in particular, the U.S. Federal Reserve Board, or the Federal Reserve, or the Federal Reserve Board. Changes in monetary policy, including changes in interest rates, could influence not only the interest we receive on loans and securities and the interest we pay on deposits and borrowings, but such changes could also affect our ability to originate loans and obtain deposits, the fair value of our financial assets and liabilities, and the average duration of our assets. If the interest rates paid on deposits and other borrowings increase at a faster rate than the interest rates received on loans and other investments, our net interest income, and therefore net income, could be adversely affected. A continuation of the current levels of interest rates could cause the spread between our loan yields and our deposit rates paid to compress our net interest margin and our net income could be adversely affected. Further, any substantial, unexpected, prolonged change in market interest rates could have a material adverse effect on our business, financial condition, results of operations and future prospects.
In addition, an increase in interest rates could also have a negative impact on our results of operations by reducing the ability of borrowers to repay their current loan obligations. These circumstances could not only result in increased loan defaults, foreclosures and charge-offs, but also necessitate further increases to our allowance for loan losses, each of which could have a material adverse effect on our business, results of operations, financial condition and future prospects.
Our business is concentrated in Fairfield and New Haven Counties, Connecticut and the surrounding areas, and we are more sensitive than our more geographically diversified competitors to adverse changes in the local economy.
We conduct a majority of our operations in the New York metropolitan area, including Fairfield and New Haven Counties, Connecticut. A majority of the real estate loans in our loan portfolio are secured by properties located in the New York metropolitan area, including Fairfield and New Haven Counties. In addition, as of December 31, 2018, the majority of the loans in our loan portfolio (measured by dollar amount) were made to borrowers who live or conduct business in the New York metropolitan area. We compete against a number of financial institutions who maintain significant operations located outside of the New York metropolitan area and outside the State of Connecticut. Accordingly, any regional or local economic downturn, or natural or man-made disaster, that affects Connecticut or the New York metropolitan area or existing or prospective property or borrowers in Connecticut or the New York metropolitan area may affect us and our profitability more significantly and more adversely than our more geographically diversified competitors, which could cause a material adverse effect on our business, financial condition, results of operations and prospects.
Strong competition within our market area could reduce our profits and slow growth.
Competition in the financial services industry in our market and the surrounding area is strong. Numerous commercial banks, savings banks and savings associations maintain offices or are headquartered in or near our primary market area. Commercial banks, savings banks, savings associations, money market funds, mortgage brokers, finance companies, credit unions, insurance companies, investment firms and private lenders compete with us for various segments of our business. These competitors often have far greater resources than we do and are able to conduct more intensive and broader based promotional efforts to reach both commercial and individual customers.
Our ability to compete successfully will depend on a number of factors, including, among other things:
• | Our ability to build and maintain long-term customer relationships while ensuring high ethical standards and safe and sound banking practices; |
• | The scope, relevance and pricing of products and services that we offer; |
• | Customer satisfaction with our products and personalized services; |
20
• | Industry and general economic trends; and |
• | Our ability to keep pace with technological advances and to invest in new technology. |
Increased competition could require us to increase the rates we pay on deposits or lower the rates we offer on loans, which could reduce our profitability. We derive a majority of our business from our primary market area, the New York metropolitan area, including Fairfield and New Haven Counties, Connecticut. Our failure to compete effectively in our primary market could cause us to lose market share and could have a material adverse effect on our business, financial condition, results of operations and future prospects.
We are a community bank and our ability to maintain our reputation is critical to the success of our business.
We are a community bank, and our reputation is one of the most valuable components of our business. We strive to conduct our business in a manner that enhances our reputation. This is done, in part, by recruiting, hiring and retaining employees who share our core values of being an integral part of the communities we serve, delivering superior service to our customers and caring about our customers and associates. If our reputation is negatively affected, by the actions of our employees or otherwise, our business and, therefore, our operating results may be materially adversely affected.
We may not be able to execute our management team’s growth strategy.
As part of our management team’s growth strategy, we pursue a business plan focused on the development and growth of our franchise in our existing market and surrounding areas. In addition to pursuing organic growth, another element of our management team’s strategy will be to acquire other branches, whole financial institutions or related lines of business. We intend to actively seek potential acquisition opportunities. There are numerous risks that may make it difficult for us to execute this growth strategy and we cannot assure you that we will be successful in executing any part of our management team’s strategy or that we will be able to maintain our historical rate of growth. Challenges we will face include obtaining regulatory approvals with respect to acquisitions, assuring that we will not become subject to regulatory actions in the future that could restrict our growth, identifying appropriate targets for acquisitions, negotiating acquisitions on terms that are acceptable to us, and encountering competition for acquisitions from financial institutions and other entities with similar business strategies that have greater financial resources, relevant experience and more personnel than us. Accordingly, there can be no assurance that we will be successful in completing future acquisitions at all or on terms that are acceptable to us. Our ability to grow will be limited if we are unable to successfully make acquisitions in the future.
Some institutions we may acquire may have distressed assets and there can be no assurance that we would be able to realize the value we predict from these assets or that we would make sufficient provision for future losses in the value of, or accurately estimate the future write downs taken in respect of, these assets.
Declines in home prices and/or weak general economic conditions may result in increases in delinquencies and losses in the loan portfolios and other assets of financial institutions that we may acquire in amounts that exceed our initial forecasts developed during the due diligence investigation prior to acquiring those institutions. In addition, the loss reserves of institutions we may acquire may prove inadequate or be negatively affected, and asset values may be impaired, in the future due to factors we cannot predict, including significant deterioration in economic conditions and further declines in collateral values and credit quality indicators. Any of these events could adversely affect the financial condition, liquidity, capital position and value of any institutions that we acquire and of the Bank as a whole.
We may not be able to overcome the integration and other risks associated with acquisitions, which could adversely affect our growth and profitability.
We may from time to time consider acquisition opportunities that we believe complement our activities and have the ability to enhance our profitability. Acquisition activities could be material to our business and involve a number of risks, including the following:
• | Incurring time and expense associated with identifying and evaluating potential acquisitions and negotiating potential transactions, resulting in our attention being diverted from the operation of our existing business; |
• | Using inaccurate estimates and judgments to evaluate credit, operations, management and market risks with respect to the target institution or assets; |
• | Intense competition from other banking organizations and other inquirers for acquisitions; |
• | Potential exposure to unknown or contingent liabilities of banks and businesses we acquire; |
• | The time and expense required to integrate the operations and personnel of the combined businesses; |
• | Experiencing higher operating expenses relative to operating income from the new operations; |
• | Creating an adverse short-term effect on our results of operations; |
21
• | Losing key employees and customers as a result of an acquisition that is poorly received; |
• | Significant problems relating to the conversion of the financial and customer data of the entity; |
• | Inconsistencies in standards, controls, procedures and policies that adversely affect our ability to maintain relationships with clients, customers, depositors and employees or to achieve the anticipated benefits of the acquisition; or |
• | Risks of impairment to goodwill or other than temporary impairment. |
Depending on the condition of any institution or assets or liabilities that we may acquire, that acquisition may, at least in the near term, adversely affect our capital and earnings and, if not successfully integrated with our organization, may continue to have such effects over a longer period. We may not be successful in overcoming these risks or any other problems encountered in connection with pending or potential acquisitions, and any acquisition we may consider will be subject to prior regulatory approval. Our inability to overcome these risks could have an adverse effect on our profitability, return on equity and return on assets, our ability to implement our business strategy and enhance shareholder value, which, in turn, could have a material adverse effect on our business, financial condition, results of operations and prospects. Further, if we experience difficulties with the integration process, the anticipated benefits of the investment or acquisition transaction may not be realized fully or at all or may take longer to realize than expected.
As a result of an investment or acquisition transaction, we may be required to take write-downs or write-offs, restructuring and impairment or other charges that could have a significant negative effect on our financial condition and results of operations, which could cause you to lose some or all of your investment.
We must conduct due diligence investigations of target institutions we intend to acquire. Intensive due diligence is time consuming and expensive due to the operations, accounting, finance and legal professionals who must be involved in the due diligence process. Even if we conduct extensive due diligence on a target institution with which we combine, this diligence may not reveal all material issues that may affect a particular target institution, and factors outside the control of the target institution and outside of our control may later arise. If, during our diligence process, we fail to identify issues specific to a target institution or the environment in which the target institution operates, we may be forced to later write down or write off assets, restructure our operations, or incur impairment or other charges that could result in our reporting losses. These charges may also occur if we are not successful in integrating and managing the operations of the target institution with which we combine. In addition, charges of this nature may cause us to violate net worth or other covenants to which we may be subject as a result of assuming preexisting debt held by a target institution or by virtue of our obtaining debt financing.
Resources could be expended in considering or evaluating potential acquisitions that are not consummated, which could materially and adversely affect subsequent attempts to locate and acquire or merge with another business.
We anticipate that the process of identifying and investigating institutions for potential acquisitions and the negotiation, drafting and execution of relevant agreements, disclosure documents and other instruments will require substantial management time and attention and substantial costs for accountants, attorneys and others. If a decision is made not to complete a specific acquisition transaction, the costs incurred up to that point for the proposed transaction likely would not be recoverable. Furthermore, even if an agreement is reached relating to a specific target institution, we may fail to consummate the transaction for any number of reasons, including those beyond our control. Any such event will result in a loss to us of the related costs incurred, which could materially and adversely affect subsequent attempts to locate and acquire or merge with another institution.
Our lending limit may restrict our growth and prevent us from effectively implementing our business strategy.
We are limited in the amount we can loan to a single borrower by the amount of our capital. Under Connecticut banking law, the total direct or indirect liabilities of any one obligor that are not fully secured, however incurred, to any Connecticut bank, exclusive of such bank’s investment in the investment securities of such obligor, shall not exceed at the time incurred 15% of the equity capital and allowance for loan losses of such bank. The total direct or indirect liabilities of any one obligor that are fully secured, however incurred, to any Connecticut bank, exclusive of such bank’s investment in the investment securities of such obligor, shall not exceed at the time incurred 10% of the equity capital and allowance for loan losses of such bank, provided this limitation shall be separate from and in addition to the limitation on liabilities that are not fully secured. We have also established an informal, internal lending limit to one relationship of up to 40% of unimpaired capital and allowance for loan losses, if secured by commercial real estate. A relationship in this instance is defined as loans made to different entities but with a shared borrower principal(s). For individual loans, limits are set so as not to exceed the statutory maximum of 15% of unimpaired capital and allowance for loan losses. Based upon our current capital levels and our informal, internal limit on loans, the amount we may lend both in the aggregate and to any one borrower is significantly less than that of many of our competitors and may discourage potential borrowers who have credit needs in excess of our lending limit from doing business with us. We accommodate larger loans by selling participations in those loans to other financial institutions, but this strategy may not always be available. If we are unable to compete effectively for loans from our target customers, we may not be able to effectively implement our business strategy, which could have a material adverse effect on our business, financial condition, results of operations and future prospects.
22
We are dependent on our executive management team and other key employees and we could be adversely affected by the unexpected loss of their services.
We are led by an experienced core management team with substantial experience in the market that we serve, and our operating strategy focuses on providing products and services through long-term relationship managers. Accordingly, our success depends in large part on the performance of our key personnel, as well as on our ability to attract, motivate and retain highly qualified senior and middle management. Competition for employees is intense, and the process of locating key personnel with the combination of skills and attributes required to execute our business plan may be lengthy. We believe that retaining the services and skills of our management team is important to our success. The unexpected loss of services of any of our key personnel could have an adverse impact on us because of their skills, knowledge of our market, years of industry experience and the difficulty of promptly finding qualified replacement personnel. If the services of any of our key personnel should become unavailable for any reason, we may not be able to identify and hire qualified persons on terms acceptable to us, which could cause a material adverse effect on our business, financial condition, results of operations and prospects.
The fair value of our investment securities can fluctuate due to factors outside of our control.
Factors beyond our control can significantly influence the fair value of securities in our portfolio and can cause potential adverse changes to the fair value of these securities. These factors include, but are not limited to, rating agency actions with respect to individual securities, defaults by the issuer or with respect to the underlying securities, and changes in market interest rates and continued instability in the capital markets. Any of these factors, among others, could cause other-than-temporary impairments and realized and/or unrealized losses in future periods and declines in other comprehensive income, which could materially and adversely affect our business, results of operations, financial condition and prospects. The process for determining whether impairment of a security is other-than-temporary usually requires complex, subjective judgments about the future financial performance and liquidity of the issuer and any collateral underlying the security in order to assess the probability of receiving all contractual principal and interest payments on the security.
We may be required to repurchase mortgage loans or indemnify buyers against losses in some circumstances, which could harm liquidity, results of operations and financial condition.
When mortgage loans are sold, whether as whole loans or pursuant to a securitization, we are required to make customary representations and warranties to purchasers, guarantors and insurers, including government-sponsored entities, about the mortgage loans and the manner in which they were originated. Whole loan sale agreements require us to repurchase or substitute mortgage loans, or indemnify buyers against losses, in the event we breach these representations or warranties. In addition, we may be required to repurchase mortgage loans as a result of early payment default of the borrower on a mortgage loan. If repurchase and indemnity demands increase and such demands are valid claims and are in excess of our provision for potential losses, our liquidity, results of operations and financial condition may be adversely affected.
Our financial results depend on management’s selection of accounting methods and certain assumptions and estimates.
Our financial condition and results of operations are based on our consolidated financial statements, which have been prepared in accordance with Accounting Principles Generally Accepted in the United States, or GAAP, and with general practices within the financial services industry. The preparation of financial statements in conformity with GAAP requires us to make estimates and assumptions that affect the reported amounts of certain assets and liabilities, disclosure of contingent assets and liabilities and the reported amount of related revenues and expenses. Certain accounting policies inherently are based to a greater extent on estimates, assumptions and judgments of management and, as such, have a greater possibility of producing results that could be materially different than originally reported. They require management to make subjective or complex judgments, estimates or assumptions, and changes in those estimates or assumptions could have a significant impact on our consolidated financial statements. These critical accounting policies include the fair value of acquired assets, the allowance for loan losses, stock-based compensation and derivative instrument valuation. Because of the uncertainty of estimates involved in these matters, we may be required to significantly increase the allowance for loan losses or sustain loan losses that are significantly higher than the reserve provided or otherwise incur charges that could have a material adverse effect on our business, financial condition, results of operations and future prospects.
We may be adversely affected by the soundness of other financial institutions.
Our ability to engage in routine funding transactions could be adversely affected by the actions and commercial soundness of other financial institutions. Financial services companies are interrelated as a result of trading, clearing, counterparty, and other relationships. We have exposure to different industries and counterparties, and through transactions with counterparties in the financial services industry, including broker-dealers, commercial banks, investment banks, and other financial intermediaries. Further, our private banking channel relies on relationships with a number of other financial institutions for referrals. As a result, declines in the financial condition of, or even rumors or questions about, one or more financial institutions, financial service companies or the financial services industry generally, may lead to market-wide liquidity, asset quality or other problems and
23
could lead to losses or defaults by us or by other institutions. These problems, losses or defaults could have a material adverse effect on our business, financial condition, results of operations and future prospects.
We rely on third parties to provide key components of our business infrastructure, and failure of these parties to perform for any reason could disrupt our operations.
Our business depends on the successful and uninterrupted functioning of our information technology and telecommunications systems and third-party servicers. The failure of these systems, or the termination of a third-party software license or service agreement on which any of these systems is based, could interrupt our operations. Because our information technology and telecommunications systems interface with and depend on third-party systems, we could experience service denials if demand for such services exceeds capacity or such third-party systems fail or experience interruptions. If significant, sustained or repeated, a system failure or service denial could compromise our ability to operate effectively, damage our reputation, result in a loss of customer business, and subject us to additional regulatory scrutiny and possible financial liability, any of which could have a material adverse effect on our business, financial condition, results of operations and prospects.
We face various technological risks that could adversely affect our business.
We rely on communication and information systems to conduct business. Potential failures, interruptions or breaches in system security could result in disruptions or failures in our key systems, such as general ledger, deposit or loan systems. The risk of electronic fraudulent activity within the financial services industry, especially in the commercial banking sector due to cyber criminals targeting bank accounts and other customer information is on the rise. We have developed policies and procedures aimed at preventing and limiting the effect of failure, interruption or security breaches, including cyber-attacks of information systems; however, there can be no assurance that these incidences will not occur, or if they do occur, that they will be appropriately addressed. The occurrence of any failures, interruptions or security breaches, including cyber-attacks of our information systems could damage our reputation, result in the loss of business, subject us to increased regulatory scrutiny or subject us to civil litigation and possible financial liability, any of which could have an adverse effect on our results of operation and financial condition.
We are subject to losses due to fraudulent and negligent acts on the part of loan applicants, our borrowers, other vendors and our employees.
When we originate loans, we rely heavily upon information supplied by third parties, including the information contained in the loan application, property appraisal, title information and employment and income documentation. If any of this information is intentionally or negligently misrepresented and such misrepresentation is not detected prior to loan funding, the value of the loan may be significantly lower than expected. Whether a misrepresentation is made by the loan applicant, the borrower, another third party or one of our employees, we generally bear the risk of loss associated with the misrepresentation. A loan subject to a material misrepresentation is typically unsaleable or subject to repurchase if it is sold prior to detection of the misrepresentation, and the persons and entities involved are often difficult to locate and it is often difficult to collect any monetary losses that we have suffered from them. We have controls and processes designed to help us identify misrepresented information in our loan origination operations. We cannot assure you, however, that we have detected or will detect all misrepresented information in our loan originations.
Unauthorized access, cyber-crime and other threats to data security may require significant resources, harm our reputation, and adversely affect our business.
We necessarily collect, use and hold personal and financial information concerning individuals and businesses with which we have a banking relationship. Threats to data security, including unauthorized access and cyber-attacks rapidly emerge and change, exposing us to additional costs for protection or remediation and competing time constraints to secure our data in accordance with customer expectations, statutory and regulatory privacy and other requirements. It is difficult or impossible to defend against every risk being posed by changing technologies, as well as criminal intent on committing cyber-crime. Increasing sophistication of cyber-criminals and terrorists make keeping up with new threats difficult and could result in a breach. Controls employed by our information technology department and our other employees and vendors could prove inadequate. We could also experience a breach due to intentional or negligent conduct on the part of employees or other internal sources, software bugs or other technical malfunctions, or other causes. As a result of any of these threats, our customer accounts may become vulnerable to account takeover schemes or cyber-fraud. Our systems and those of our third-party vendors may also become vulnerable to damage or disruption due to circumstances beyond our or their control, such as from catastrophic events, power anomalies or outages, natural disasters, network failures, and viruses and malware.
A breach of our security that results in unauthorized access to our data could expose us to a disruption or challenges relating to our daily operations as well as to data loss, litigation, damages, fines and penalties, significant increases in compliance costs, and reputational damage, any of which could have a material adverse effect on our business, results of operations, financial condition and future prospects.
24
We are subject to environmental liability risk associated with our lending activities.
In the course of our business, we may purchase real estate, or we may foreclose on and take title to real estate. As a result, we could be subject to environmental liabilities with respect to these properties. We may be held liable to a governmental entity or to third parties for property damage, personal injury, investigation and clean-up costs incurred by these parties in connection with environmental contamination or may be required to investigate or clean up hazardous or toxic substances or chemical releases at a property. The costs associated with investigation or remediation activities could be substantial. In addition, if we are the owner or former owner of a contaminated site, we may be subject to common law claims by third parties based on damages and costs resulting from environmental contamination emanating from the property. Any significant environmental liabilities could cause a material adverse effect on our business, financial condition, results of operations and future prospects.
We may incur impairment to goodwill.
We test our goodwill for impairment at least annually. Significant negative industry or economic trends, reduced estimates of future cash flows or disruptions to our business, could indicate that goodwill might be impaired. Our valuation methodology for assessing impairment requires management to make judgments and assumptions based on historical experience and to rely on projections of future operating performance. Projections of future operating results and cash flows may vary significantly from actual results. Additionally, if our analysis results in impairment to our goodwill, we would be required to record a non-cash charge to earnings in our financial statements during the period in which such impairment is determined to exist. Any such charge could have a material adverse effect on our results of operations.
Uncertainty about the future of LIBOR may adversely affect our business.
LIBOR is used extensively in the United States as a benchmark for various commercial and financial contracts, including adjustable rate mortgages, corporate debt, interest rate swaps and other derivatives. LIBOR is set based on interest rate information reported by certain banks, which may stop reporting such information after 2021. It is uncertain at this time whether LIBOR will change or cease to exist or the extent to which those entering into financial contracts will transition to any other particular benchmark. Other benchmarks may perform differently than LIBOR or alternative benchmarks have performed in the past or have other consequences that cannot currently be anticipated. It is also uncertain what will happen with instruments that rely on LIBOR for future interest rate adjustments and which remain outstanding if LIBOR ceases to exist.
We have derivative contracts and limited loan exposure tied to LIBOR. Although we are not yet able to assess what the ultimate impact of the transition from LIBOR will be, failure to adequately manage the transition could have a material adverse effect on our business, financial condition and results of operations.
Risks Applicable to the Regulation of our Industry
We operate in a highly regulated environment, which could have a material and adverse impact on our operations and activities, financial condition, results of operations, growth plans and future prospects.
Banking is highly regulated under federal and state law. We are subject to extensive regulation and supervision that governs almost all aspects of our operations. As a registered bank holding company, we are subject to supervision, regulation and examination by the Federal Reserve. As a commercial bank chartered under the laws of Connecticut, the Bank is subject to supervision, regulation and examination by the State of Connecticut Department of Banking and the FDIC.
The primary goals of the bank regulatory system are to maintain a safe and sound banking system and to facilitate the conduct of sound monetary policy. This system is intended primarily for the protection of the FDIC’s Deposit Insurance Fund and bank depositors, rather than our shareholders and creditors. The banking agencies have broad enforcement power over bank holding companies and banks, including the authority, among other things, to enjoin “unsafe or unsound” practices, require affirmative action to correct any violation or practice, issue administrative orders that can be judicially enforced, direct increases in capital, direct the sale of subsidiaries or other assets, limit dividends and distributions, restrict growth, assess civil monetary penalties, remove officers and directors, and, with respect to banks, terminate our charter, terminate our deposit insurance or place the Bank into conservatorship or receivership. In general, these enforcement actions may be initiated for violations of laws and regulations or unsafe or unsound practices.
Compliance with the myriad of laws and regulations applicable to our organization can be difficult and costly. In addition, these laws, regulations and policies are subject to continual review by governmental authorities, and changes to these laws, regulations and policies, including changes in interpretation or implementation of these laws, regulations and policies, could affect us in substantial and unpredictable ways and often impose additional compliance costs. Further, any new laws, rules and regulations, such as the Dodd-Frank Act, could make compliance more difficult or expensive. All of these laws and regulations, and the supervisory framework applicable to our industry, could have a material adverse impact on our operations and activities, financial condition, results of operations, growth plans and future prospects.
25
Federal and state regulators periodically examine our business and we may be required to remediate adverse examination findings.
The Federal Reserve, the FDIC and the Connecticut Department of Banking periodically examine our business, including our compliance with laws and regulations. If, as a result of an examination, a regulatory agency were to determine that our financial condition, capital resources, asset quality, earnings prospects, management, liquidity or other aspects of any of our operations had become unsatisfactory, or that we were in violation of any law or regulation, it may take a number of different remedial actions as it deems appropriate. These actions include the power to enjoin “unsafe or unsound” practices, to require affirmative action to correct any conditions resulting from any violation or practice, to issue an administrative order that can be judicially enforced, to direct an increase in our capital, to restrict our growth, to assess civil monetary penalties against our officers or directors, to remove officers and directors and, if it is concluded that such conditions cannot be corrected or there is an imminent risk of loss to depositors, to terminate our deposit insurance and place us into receivership or conservatorship. Any regulatory action against us could have a material adverse effect on our business, results of operations, financial condition and future prospects.
The Bank’s FDIC deposit insurance premiums and assessments may increase.
The deposits of the Bank are insured by the FDIC up to legal limits and, consequently, subject it to the payment of FDIC deposit insurance assessments. The Bank’s regular assessments are determined by its risk classification, which is based on its regulatory capital levels and the level of supervisory concern that it poses. Any future special assessments, increases in assessment rates or required prepayments in FDIC insurance premiums could reduce our profitability or limit our ability to pursue certain business opportunities, which could materially and adversely affect our business, financial condition, results of operations and prospects.
The Bank is subject to further reporting requirements under FDIC regulations.
We are subject to further reporting requirements under the rules of the FDIC for the year ended December 31, 2018 as the Bank’s total assets exceed $1.0 billion, including a requirement for management to prepare a report that contains an assessment by management of the Bank’s effectiveness of internal control structure and procedures for financial reporting as of the end of such fiscal year. In addition, we are required to obtain an independent public accountant’s attestation report concerning our internal control structure over financial reporting. The rules for management to assess the Bank’s internal controls over financial reporting are complex, and require significant documentation, testing and possible remediation. The effort to comply with regulatory requirements relating to internal controls cause us to incur increased expenses and a diversion of management’s time and other internal resources. If the Bank cannot favorably assess the effectiveness of its internal controls over financial reporting, or if its independent registered public accounting firm is unable to provide an unqualified attestation report on the Bank’s internal controls, the price of our common stock as well as investor confidence could be adversely affected and we may be subject to additional regulatory scrutiny.
We are subject to numerous laws designed to protect consumers, including the Community Reinvestment Act, or CRA, and fair lending laws, and failure to comply with these laws could lead to a wide variety of sanctions.
Various laws impose nondiscriminatory lending requirements on financial institutions, including the CRA, the Equal Credit Opportunity Act and the Fair Housing Act. A successful regulatory challenge to an institution’s performance under the CRA or fair lending laws and regulations could result in a wide variety of sanctions, including damages and civil money penalties, injunctive relief, restrictions on mergers and acquisitions activity, restrictions on expansion, and restrictions on entering new business lines. Private parties may also have the ability to challenge an institution’s performance under fair lending laws in private class action litigation. Such actions could have a material adverse effect on our business, financial condition, results of operations and prospects.
We face a risk of noncompliance and enforcement action with the Bank Secrecy Act and other anti-money laundering statutes and regulations.
Financial institutions are required to institute and maintain an effective anti-money laundering program and file suspicious activity and currency transaction reports as appropriate under The Bank Secrecy Act, The USA PATRIOT ACT of 2001 and certain other laws and regulations. Significant civil penalties can be assessed by a variety of regulators and governmental agencies for violations of these laws and regulations. If our policies, procedures and systems are deemed deficient, we would be subject to liability, including fines and regulatory actions, which may include restrictions on our ability to pay dividends and the necessity to obtain regulatory approvals to proceed with certain aspects of our business plan, including our acquisition plans. Failure to maintain and implement adequate programs to combat money laundering and terrorist financing could also have serious reputational consequences for us. Any of these results could materially and adversely affect our business, financial condition, results of operations and prospects.
Item 1B. Unresolved Staff Comments
None.
26
Item 2. Properties
The Bank’s main office is located at 208 Elm Street in New Canaan, Connecticut. The property is leased by us until 2021, with two remaining five-year renewal options. In July 2012, we initially leased additional space adjacent to 208 Elm Street at 220 Elm Street primarily for our executive management offices. The property located at 220 Elm Street was purchased by the Bank in December of 2016.
We also lease office space for each of our branch offices in New Canaan, Stamford, Norwalk, Fairfield and North Haven Connecticut. The leases for our facilities have terms expiring at dates ranging from 2019 to 2030, although certain of the leases contain options to extend beyond these dates. We own the Wilton and Hamden branch offices. We believe that our current facilities are adequate for our current level of operations. Each lease is at market rate based on similar properties in the applicable market area. We believe that we have the necessary infrastructure in place to support our projected growth.
During the second quarter of 2018, the Company opened three additional branch locations, located in Darien, Westport, and Stamford, Connecticut.
Our branch offices are located as follows:
Branch | Address | Owned or Leased | ||
Elm Street | 208 Elm Street New Canaan, CT 06840 | Lease (expires 2021) | ||
Cherry Street | 156 Cherry Street New Canaan, CT 06840 | Lease (expires 2021) | ||
Bedford | 612 Bedford Street Stamford, CT 06901 | Lease (expires 2020) | ||
High Ridge | 1095 High Ridge Road, Stamford, CT 06905 | Lease (expires 2028) | ||
Black Rock | 2220 Black Rock Turnpike Fairfield, CT 06825 | Lease (expires 2024) | ||
Sasco Hill | One Sasco Hill Road Fairfield, CT 06824 | Lease (expires 2024) | ||
Wilton | 47 Old Ridgefield Road Wilton, CT 06897 | Own | ||
Norwalk | 370 Westport Avenue Norwalk, CT 06851 | Lease (expires 2030) | ||
Hamden | 2704 Dixwell Avenue Hamden, CT 06518 | Own | ||
North Haven | 24 Washington Avenue North Haven, CT 06473 | Lease (expires 2019) | ||
Westport | 100 Post Road East, Westport, CT 06880 | Lease (expires 2028) | ||
Darien | 1065 Post Road, Darien, CT 06820 | Lease (expires 2028) | ||
Item 3. Legal Proceedings
From time to time we are a party to various litigation matters incidental to the conduct of our business. We are not presently party to any legal proceedings the resolution of which we believe would have a material adverse effect on our business, future prospects, financial condition, liquidity, results of operation, cash flows or capital levels.
Item 4. Mine Safety Disclosures
Not applicable.
27
PART II
Item 5. | Market for Registrant’s Common Equity, Related Stockholder Matters and Issuer Purchases of Equity Securities |
The Company’s Common Stock has traded on the NASDAQ Global Market under the Symbol “BWFG” since the completion of its initial public offering on May 15, 2014.
There were approximately 280 shareholders of record of BWFG Common Stock as of December 31, 2018. This number does not reflect the number of persons or entities holding stock in nominee name through banks, brokerage firms or other nominees.
The Company’s shareholders are entitled to dividends when and if declared by the Board of Directors, out of funds legally available. The ability of the Company to pay dividends depends, in part, on the ability of the Bank to pay dividends to the Company. In accordance with Connecticut statutes, regulatory approval is required for the Bank to pay dividends in excess of the Bank’s profits retained in the current year plus retained profits from the previous two years. The Bank is also prohibited from paying dividends that would reduce its capital ratios below minimum regulatory requirements.
Issuer Purchases of Equity Securities
On December 19, 2018, the Company's Board of Directors authorized a share repurchase program of up to 400,000 shares of the Company's Common Stock. The Company intends to accomplish the share repurchases through open market transactions, though the Company could accomplish repurchases through other means, such as privately negotiated transactions. The timing, price and volume of repurchases will be based on market conditions, relevant securities laws and other factors. The share repurchase plan does not obligate the Company to acquire any particular amount of Common Stock, and it may be modified or suspended at any time at the Company's discretion. The Company did not repurchase any of its common stock during 2018 or 2017.
Common Stock Performance Graph
The performance graph below compares the Company’s cumulative shareholder return on its common stock since May 15, 2014, the IPO date to the cumulative return of the NASDAQ Composite Index and the NASDAQ Bank Index. Cumulative return assumes the reinvestment of dividends, and is expressed in dollars based on an assumed investment of $100.
There can be no assurance that our stock performance in the future will continue with the same or similar trend depicted in the graph below. We will not make or endorse any predictions as to future stock performance.
28
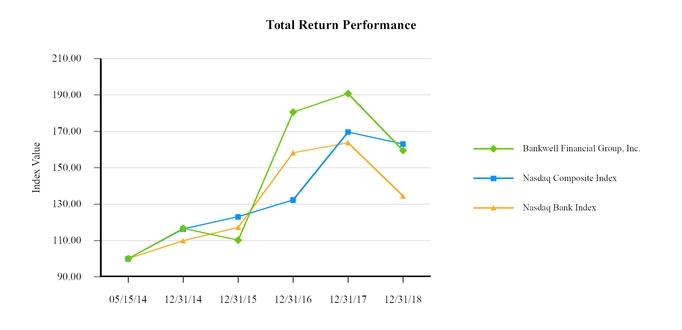
Index | 5/15/2014 | 12/31/2014 | 12/31/2015 | 12/31/2016 | 12/31/2017 | 12/31/2018 | ||||||
Bankwell Financial Group, Inc. | 100.00 | 116.67 | 110.28 | 180.56 | 190.78 | 159.50 | ||||||
Nasdaq Composite Index | 100.00 | 116.39 | 123.05 | 132.29 | 169.65 | 163.06 | ||||||
Nasdaq Bank Index | 100.00 | 109.89 | 117.17 | 158.21 | 163.76 | 134.44 | ||||||
In accordance with the rules of the SEC, this section captioned “Common Stock Performance Graph”, shall not be incorporated by reference into any of our future filings made under the Securities Exchange Act of 1934 or the Securities Act of 1933. The Common Stock Performance Graph, including its accompanying table and footnotes, is not deemed to be soliciting material or to be filed under the Exchange Act or the Securities Act.
Item 6. Selected Financial Data
The following table sets forth selected consolidated financial data as of the dates and for the periods presented. The selected consolidated statement of financial condition data as of December 31, 2018 and 2017 and the selected consolidated statement of income data for the years ended December 31, 2018, 2017 and 2016 have been derived mainly from our audited consolidated financial statements and related notes that we have included elsewhere in this Annual Report. The selected consolidated statement of financial condition data as of December 31, 2016, 2015 and 2014 and the selected consolidated statement of income data for the years ended December 31, 2015 and 2014 have been derived mainly from audited consolidated financial statements that are not presented in this Annual Report.
The selected historical consolidated financial data as of any date and for any period are not necessarily indicative of the results that may be achieved as of any future date or for any future period. You should read the following selected statistical and financial data in conjunction with the more detailed information contained in “Management’s Discussion and Analysis of Financial Condition and Results of Operations” and our consolidated financial statements and the related notes that we have presented elsewhere in this Annual Report.
Net income for the year ended December 31, 2017 was negatively impacted by the Tax Cuts and Jobs Act of 2017 as it relates to legislation that required a re-measurement of our deferred tax asset, which required a $3.3 million write-off recognized as a direct increase to income tax expense. As a result, the performance metrics presented below have been adversely impacted due to the decline in net income driven by this write-off.
29
Selected Financial Data
At or For the Years Ended December 31, | ||||||||||||||||||||
2018 | 2017 | 2016 | 2015 | 2014 | ||||||||||||||||
(Dollars in thousands, except per share data) | ||||||||||||||||||||
Statements of Income: | ||||||||||||||||||||
Interest income | $ | 80,064 | $ | 71,201 | $ | 60,990 | $ | 50,754 | $ | 35,589 | ||||||||||
Interest expense | 23,738 | 16,837 | 11,898 | 7,966 | 3,929 | |||||||||||||||
Net interest income | 56,326 | 54,364 | 49,092 | 42,788 | 31,660 | |||||||||||||||
Provision for loan losses | 3,440 | 1,341 | 3,914 | 3,230 | 2,152 | |||||||||||||||
Net interest income after provision for loan losses | 52,886 | 53,023 | 45,178 | 39,558 | 29,508 | |||||||||||||||
Noninterest income | 3,900 | 4,629 | 2,676 | 3,484 | 3,041 | |||||||||||||||
Noninterest expense | 35,633 | 32,523 | 29,544 | 29,171 | 25,812 | |||||||||||||||
Income before income tax | 21,153 | 25,129 | 18,310 | 13,871 | 6,737 | |||||||||||||||
Income tax expense | 3,720 | 11,299 | 5,960 | 4,841 | 2,169 | |||||||||||||||
Net income | 17,433 | 13,830 | 12,350 | 9,030 | 4,568 | |||||||||||||||
Net income attributable to common shareholders | $ | 17,433 | $ | 13,830 | $ | 12,350 | $ | 8,905 | $ | 4,458 | ||||||||||
Per Share Data: | ||||||||||||||||||||
Basic earnings per share | $ | 2.23 | $ | 1.80 | $ | 1.64 | $ | 1.23 | $ | 0.78 | ||||||||||
Diluted earnings per share | $ | 2.21 | $ | 1.78 | $ | 1.62 | $ | 1.21 | $ | 0.78 | ||||||||||
Book value per share (end of period)(a) | 22.43 | 20.98 | 19.39 | 17.87 | 16.84 | |||||||||||||||
Tangible book value per share (end of period)(a)(b) | 22.06 | 20.59 | 18.98 | 17.43 | 16.35 | |||||||||||||||
Dividend payout ratio(f) | 21.56 | % | 15.54 | % | 13.45 | % | 4.16 | % | — | % | ||||||||||
Shares outstanding (end of period)(a) | 7,764,647 | 7,676,238 | 7,524,069 | 7,372,968 | 7,019,620 | |||||||||||||||
Weighted average shares outstanding–basic | 7,722,175 | 7,572,409 | 7,396,019 | 7,071,550 | 5,577,942 | |||||||||||||||
Weighted average shares outstanding–diluted | 7,775,480 | 7,670,413 | 7,491,052 | 7,140,558 | 5,605,512 | |||||||||||||||
Performance Ratios: | ||||||||||||||||||||
Return on average assets(c) | 0.94 | % | 0.80 | % | 0.85 | % | 0.75 | % | 0.52 | % | ||||||||||
Return on average common shareholders’ equity | 10.19 | % | 8.93 | % | 8.94 | % | 6.67 | % | 5.13 | % | ||||||||||
Return on average shareholders’ equity(c) | 10.19 | % | 8.93 | % | 8.94 | % | 6.76 | % | 4.66 | % | ||||||||||
Average shareholders’ equity to average assets | 9.24 | % | 8.97 | % | 9.47 | % | 11.08 | % | 11.14 | % | ||||||||||
Net interest margin | 3.18 | % | 3.30 | % | 3.54 | % | 3.77 | % | 3.84 | % | ||||||||||
Efficiency ratio(b) | 59.2 | % | 54.9 | % | 56.5 | % | 62.3 | % | 68.7 | % | ||||||||||
Asset Quality Ratios: | ||||||||||||||||||||
Total past due loans to total loans(d) | 0.78 | % | 1.67 | % | 0.47 | % | 0.51 | % | 0.86 | % | ||||||||||
Nonperforming loans to total loans(d) | 0.88 | % | 0.36 | % | 0.22 | % | 0.33 | % | 0.36 | % | ||||||||||
Nonperforming assets to total assets(e) | 0.75 | % | 0.31 | % | 0.20 | % | 0.38 | % | 0.39 | % | ||||||||||
Allowance for loan losses to nonperforming loans | 109.80 | % | 344.90 | % | 612.26 | % | 373.76 | % | 323.02 | % | ||||||||||
Allowance for loan losses to total loans(d) | 0.96 | % | 1.23 | % | 1.32 | % | 1.23 | % | 1.17 | % | ||||||||||
Net charge-offs (recoveries) to average loans(d) | 0.44 | % | 0.03 | % | 0.01 | % | (0.01 | )% | (0.05 | )% | ||||||||||
Statements of Financial Condition: | ||||||||||||||||||||
Total assets | $ | 1,873,665 | $ | 1,796,607 | $ | 1,628,919 | $ | 1,330,372 | $ | 1,099,531 | ||||||||||
Gross portfolio loans(d) | 1,604,726 | 1,543,016 | 1,365,939 | 1,147,513 | 929,762 | |||||||||||||||
Investment securities | 116,584 | 113,767 | 104,610 | 50,807 | 76,463 | |||||||||||||||
Deposits | 1,502,244 | 1,398,405 | 1,289,037 | 1,046,942 | 835,439 | |||||||||||||||
FHLB borrowings | 160,000 | 199,000 | 160,000 | 120,000 | 129,000 | |||||||||||||||
Subordinated debt | 25,155 | 25,103 | 25,051 | 25,000 | — | |||||||||||||||
Total equity | 174,196 | 161,027 | 145,895 | 131,769 | 129,210 | |||||||||||||||
Capital Ratios: | ||||||||||||||||||||
Tier 1 capital to average assets | ||||||||||||||||||||
Bankwell Bank | 10.14 | % | 9.61 | % | 10.10 | % | 10.84 | % | 11.12 | % | ||||||||||
Tier 1 capital to risk-weighted assets | ||||||||||||||||||||
Bankwell Bank | 11.56 | % | 10.99 | % | 11.59 | % | 12.18 | % | 12.47 | % | ||||||||||
Total capital to risk-weighted assets | ||||||||||||||||||||
Bankwell Bank | 12.50 | % | 12.19 | % | 12.85 | % | 13.39 | % | 13.55 | % | ||||||||||
Total shareholders’ equity to total assets | 9.30 | % | 8.96 | % | 8.96 | % | 9.90 | % | 11.75 | % | ||||||||||
Tangible common equity ratio(b) | 9.16 | % | 8.81 | % | 8.78 | % | 9.68 | % | 10.47 | % | ||||||||||
(a) | Excludes preferred stock and unvested restricted stock awards. |
30
(b) | This measure is not a measure recognized under GAAP and is therefore considered to be a non-GAAP financial measure. See “Non-GAAP Financial Measures” for a description of this measure and a reconciliation of this measure to its most directly comparable GAAP measure. |
(c) | Calculated based on net income before preferred stock dividend. |
(d) | Calculated using the principal amounts outstanding on loans. |
(e) | Nonperforming assets consist of nonperforming loans and other real estate owned. |
(f) | The Company paid its first quarterly dividend to shareholders in the fourth quarter of 2015. |
NON-GAAP FINANCIAL MEASURES
We identify “efficiency ratio”, “tangible common equity ratio”, “tangible book value per share”, “total revenue” and “return on average common shareholders’ equity” as “non-GAAP financial measures.” In accordance with the SEC’s rules, we classify a financial measure as being a non-GAAP financial measure if that financial measure excludes or includes amounts, or is subject to adjustments that have the effect of excluding or including amounts, that are included or excluded, as the case may be, in the most directly comparable measure calculated and presented in accordance with generally accepted accounting principles as in effect from time to time in the United States in our statements of income, balance sheet or statements of cash flows. Non-GAAP financial measures do not include operating and other statistical measures or ratios or statistical measures calculated using exclusively either financial measures calculated in accordance with GAAP, operating measures or other measures that are not non-GAAP financial measures or both.
The non-GAAP financial measures that we discuss in this annual report should not be considered in isolation or as a substitute for the most directly comparable or other financial measures calculated in accordance with GAAP. Moreover, the manner in which we calculate the non-GAAP financial measures that we discuss in this annual report may differ from that of other companies reporting measures with similar names. You should understand how such other banking organizations calculate their financial measures similar or with names similar to the non-GAAP financial measures we have discussed in this annual report when comparing such non-GAAP financial measures.
Efficiency ratio is defined as non-interest expenses, less merger and acquisition related expenses, other real estate owned expenses and amortization of intangible assets, divided by our operating revenue, which is equal to net interest income plus non-interest income excluding gains and losses on sales of securities, gains and losses on other real estate owned and gain on bargain purchase. In our judgment, the adjustments made to operating revenue allow investors and analysts to better assess our operating expenses in relation to our core operating revenue by removing the volatility that is associated with certain one-time items and other discrete items that are unrelated to our core business.
Tangible common equity is defined as total shareholders’ equity, excluding preferred stock, less goodwill and other intangible assets. We believe that this measure is important to many investors in the marketplace who are interested in changes from period to period in common shareholders’ equity exclusive of changes in intangible assets. Goodwill, an intangible asset that is recorded in a purchase business combination, has the effect of increasing both common equity and assets while not increasing our tangible common equity or tangible assets.
Tangible common equity ratio is defined as the ratio of tangible common equity divided by total assets less goodwill and other intangible assets. We believe that this measure is important to many investors in the marketplace who are interested in relative changes from period to period in common equity and total assets, each exclusive of changes in intangible assets. We believe that the most directly comparable GAAP financial measure is total shareholders’ equity to total assets.
Tangible book value per share is defined as book value, excluding the impact of goodwill and other intangible assets, if any, divided by shares of our common stock outstanding.
Total revenue is defined as the sum of net interest income before provision of loan losses and noninterest income.
Return on average common shareholders’ equity is defined as net income attributable to common shareholders divided by total average shareholders’ equity less average preferred stock, if any.
The information provided below presents a reconciliation of each of our non-GAAP financial measures to the most directly comparable GAAP financial measure.
31
Years Ended December 31, | |||||||||||||||||||
2018 | 2017 | 2016 | 2015 | 2014 | |||||||||||||||
Efficiency Ratio | |||||||||||||||||||
Noninterest expense | $ | 35,633 | $ | 32,523 | $ | 29,544 | $ | 29,171 | $ | 25,812 | |||||||||
Less: foreclosed real estate expenses | — | 70 | 157 | 168 | 36 | ||||||||||||||
Less: Amortization of Intangibles | 92 | 118 | 151 | 196 | 133 | ||||||||||||||
Less: merger and acquisition expenses | — | — | — | 2 | 1,801 | ||||||||||||||
Adjusted noninterest expense (numerator) | $ | 35,541 | $ | 32,335 | $ | 29,236 | $ | 28,805 | $ | 23,842 | |||||||||
Net interest income | $ | 56,326 | $ | 54,364 | $ | 49,092 | $ | 42,788 | $ | 31,660 | |||||||||
Noninterest income | 3,900 | 4,629 | 2,676 | 3,484 | 3,041 | ||||||||||||||
Adjustments for: gains/(losses) on sales of securities | 222 | 165 | (115 | ) | — | — | |||||||||||||
Adjustments for: (losses) gains on sale of foreclosed real estate | — | (78 | ) | 128 | — | — | |||||||||||||
Adjusted operating revenue (denominator) | $ | 60,004 | $ | 58,906 | $ | 51,755 | $ | 46,272 | $ | 34,701 | |||||||||
Efficiency ratio | 59.2 | % | 54.9 | % | 56.5 | % | 62.3 | % | 68.7 | % | |||||||||
Tangible Common Equity and Tangible Common Equity/Tangible Assets | |||||||||||||||||||
Total shareholders’ equity | $ | 174,196 | $ | 161,027 | $ | 145,895 | $ | 131,769 | $ | 129,210 | |||||||||
Less: preferred stock | — | — | — | — | 10,980 | ||||||||||||||
Common shareholders’ equity | 174,196 | 161,027 | 145,895 | 131,769 | 118,230 | ||||||||||||||
Less: Intangible assets | 2,879 | 2,971 | 3,090 | 3,241 | 3,437 | ||||||||||||||
Tangible Common shareholders’ equity | $ | 171,317 | $ | 158,056 | $ | 142,805 | $ | 128,528 | $ | 114,793 | |||||||||
Total assets | $ | 1,873,665 | $ | 1,796,607 | $ | 1,628,919 | $ | 1,330,372 | $ | 1,099,531 | |||||||||
Less: Intangible assets | 2,879 | 2,971 | 3,090 | 3,241 | 3,437 | ||||||||||||||
Tangible assets | $ | 1,870,786 | $ | 1,793,636 | $ | 1,625,829 | $ | 1,327,131 | $ | 1,096,094 | |||||||||
Tangible common shareholders’ equity to tangible assets | 9.16 | % | 8.81 | % | 8.78 | % | 9.68 | % | 10.47 | % | |||||||||
Tangible Book Value per Share | |||||||||||||||||||
Total shareholders’ equity | $ | 174,196 | $ | 161,027 | $ | 145,895 | $ | 131,769 | $ | 129,210 | |||||||||
Less: preferred stock | — | — | — | — | 10,980 | ||||||||||||||
Common shareholders’ equity | 174,196 | 161,027 | 145,895 | 131,769 | 118,230 | ||||||||||||||
Less: Intangible assets | 2,879 | 2,971 | 3,090 | 3,241 | 3,437 | ||||||||||||||
Tangible common shareholders’ equity | $ | 171,317 | $ | 158,056 | $ | 142,805 | $ | 128,528 | $ | 114,793 | |||||||||
Common shares issued | 7,842,271 | 7,751,424 | 7,620,663 | 7,516,291 | 7,185,482 | ||||||||||||||
Less: shares of unvested restricted stock | 77,624 | 75,186 | 96,594 | 143,323 | 165,862 | ||||||||||||||
Common shares outstanding | 7,764,647 | 7,676,238 | 7,524,069 | 7,372,968 | 7,019,620 | ||||||||||||||
Book value per share | $ | 22.43 | $ | 20.98 | $ | 19.39 | $ | 17.87 | $ | 16.84 | |||||||||
Less: effects of intangible assets | 0.37 | 0.39 | 0.41 | 0.44 | 0.49 | ||||||||||||||
Tangible Book Value per Common Share | $ | 22.06 | $ | 20.59 | $ | 18.98 | $ | 17.43 | $ | 16.35 | |||||||||
Total Revenue | |||||||||||||||||||
Net Interest income | $ | 56,326 | $ | 54,364 | $ | 49,092 | $ | 42,788 | $ | 31,660 | |||||||||
Add: noninterest income | 3,900 | 4,629 | 2,676 | 3,484 | 3,041 | ||||||||||||||
Total Revenue | $ | 60,226 | $ | 58,993 | $ | 51,768 | $ | 46,272 | $ | 34,701 | |||||||||
Noninterest income as a percentage of total revenue | 6.48 | % | 7.85 | % | 5.17 | % | 7.53 | % | 8.76 | % | |||||||||
Return on Average Common Shareholders’ Equity | |||||||||||||||||||
Net Income Attributable to Common Shareholders | $ | 17,433 | $ | 13,830 | $ | 12,350 | $ | 8,905 | $ | 4,458 | |||||||||
Total average shareholders’ equity | $ | 171,024 | $ | 154,929 | $ | 138,131 | $ | 133,553 | $ | 97,921 | |||||||||
Less: average preferred stock | — | — | — | — | 10,980 | ||||||||||||||
Average Common Shareholders’ Equity | 171,024 | 154,929 | 138,131 | 133,553 | 86,941 | ||||||||||||||
Return on Average Common Shareholders’ Equity | 10.19 | % | 8.93 | % | 8.94 | % | 6.67 | % | 5.13 | % | |||||||||
32
Item 7. Management’s Discussion and Analysis of Financial Condition and Results of Operations
This section presents management’s perspective on our financial condition and results of operations. The following discussion and analysis should be read in conjunction with the consolidated financial statements and related notes contained elsewhere in this annual report. To the extent that this discussion describes prior performance, the descriptions relate only to the periods listed, which may not be indicative of future financial outcomes. In addition to historical information, this discussion contains forward looking statements that involve risks, uncertainties and assumptions that could cause results to differ materially from management’s expectations. Factors that could cause such differences are discussed in the sections titled “Cautionary Note Regarding Forward-Looking Statements” and “Risk Factors”. We assume no obligation to update any of these forward-looking statements.
General
Bankwell Financial Group, Inc. is a bank holding company headquartered in New Canaan, Connecticut. Through our wholly owned subsidiary, Bankwell Bank, we serve small and medium-sized businesses and retail customers in the New York metropolitan area and throughout Connecticut with the majority of our loans in Fairfield and New Haven Counties, Connecticut. We have a history of building long-term customer relationships and attracting new customers through what we believe is our strong customer service and our ability to deliver a diverse product offering.
The following discussion and analysis presents our results of operations and financial condition on a consolidated basis. However, because we conduct all of our material business operations through the Bank, the discussion and analysis relates to activities primarily conducted at the Bank.
We generate most of our revenue from interest on loans and investments and fee-based revenues. Our primary source of funding for our loans is deposits. Our largest expenses are interest on these deposits and salaries and related employee benefits. We measure our performance primarily through our net interest margin, efficiency ratio, ratio of allowance for loan losses to total loans, return on average assets and return on average equity, among other metrics, while maintaining appropriate regulatory leverage and risk-based capital ratios.
Executive Overview
We are focused on being the “Hometown” bank and the banking provider of choice in our attractive market area, and to serve as a locally based alternative to our larger competitors. We aim to do this through:
• | Responsive, customer-centric products and services and a community focus; |
• | Strategic acquisitions; |
• | Utilization of efficient and scalable infrastructure; and |
• | Disciplined focus on risk management. |
On August 19, 2015, the Company completed a private placement of $25.5 million in aggregate principal amount of fixed rate subordinated notes (the “Notes”) to certain institutional investors. The Notes are non-callable for five years, have a stated maturity of August 15, 2025, and bear interest at a quarterly pay fixed rate of 5.75% per annum to the maturity date or the early redemption date, August 2020 and annually thereafter.
On November 20, 2015, the Company redeemed $10.98 million (10,980 shares) of preferred stock issued pursuant to the United States Department of Treasury (“Treasury”) under the Small Business Lending Fund Program (the “SBLF”). The shares were redeemed at their liquidation value of $1,000 per share plus accrued dividends through November 20, 2015. The redemption was approved by the Company’s primary federal regulator and was funded with the Company’s surplus capital. With this redemption, the Company has redeemed all of its outstanding SBLF stock.
On January 31, 2018, the Company’s Board of Directors declared a $0.12 per share cash dividend, payable March 8, 2018 to shareholders of record on February 26, 2018. On April 25, 2018 the Company’s Board of Directors declared a $0.12 per share cash dividend, payable May 25, 2018 to shareholders of record on May 15, 2018. On July 26, 2018 the Company’s Board of Directors declared a $0.12 per share cash dividend, payable August 27, 2018 to shareholders of record on August 17, 2018. On October 30, 2018 the Company’s Board of Directors declared a $0.12 per share cash dividend, payable November 26, 2018 to shareholders of record on November 16, 2018.
On June 9, 2018, we opened three de novo branches located in Darien, Westport, and Stamford, Connecticut, increasing our total number of branches to twelve.
The primary measures we use to evaluate and manage our financial results are set forth in the table below. Although we believe these measures are meaningful in evaluating our results and financial condition, they may not be directly comparable to similar measures used by other financial services companies and may not provide an appropriate basis to compare our results or
33
financial condition to the results or financial condition of our competitors. The following table sets forth the key financial measures we use to evaluate the success of our business and our financial position and operating performance.
Net income for the year ended December 31, 2017 was negatively impacted by the Tax Cuts and Jobs Act of 2017 as it relates to legislation that required a re-measurement of our deferred tax asset, which required a $3.3 million write-off recognized as a direct increase to income tax expense. As a result, the performance metrics presented below have been adversely impacted due to the decline in net income driven by this write-off.
Key Financial Measures
Key Financial Measures(a) | |||||||||||
At or For the Years Ended December 31, | |||||||||||
2018 | 2017 | 2016 | |||||||||
(Dollars in thousands, except per share data) | |||||||||||
Selected balance sheet measures: | |||||||||||
Total assets | $ | 1,873,665 | $ | 1,796,607 | $ | 1,628,919 | |||||
Gross portfolio loans | 1,604,726 | 1,543,016 | 1,365,939 | ||||||||
Deposits | 1,502,244 | 1,398,405 | 1,289,037 | ||||||||
FHLB borrowings | 160,000 | 199,000 | 160,000 | ||||||||
Subordinated debt | 25,155 | 25,103 | 25,051 | ||||||||
Total equity | 174,196 | 161,027 | 145,895 | ||||||||
Selected statement of income measures: | |||||||||||
Total revenue(c) | 60,226 | 58,993 | 51,768 | ||||||||
Net interest income before provision for loan losses | 56,326 | 54,364 | 49,092 | ||||||||
Income before income tax expense | 21,153 | 25,129 | 18,310 | ||||||||
Net income | 17,433 | 13,830 | 12,350 | ||||||||
Basic earnings per share | $ | 2.23 | $ | 1.80 | $ | 1.64 | |||||
Diluted earnings per share | $ | 2.21 | $ | 1.78 | $ | 1.62 | |||||
Key Financial Measures(a) | |||||||||||
At or For the Years Ended December 31, | |||||||||||
2018 | 2017 | 2016 | |||||||||
Other financial measures and ratios: | |||||||||||
Return on average assets | 0.94 | % | 0.80 | % | 0.85 | % | |||||
Return on average common shareholders’ equity(c) | 10.19 | % | 8.93 | % | 8.94 | % | |||||
Net interest margin | 3.18 | % | 3.30 | % | 3.54 | % | |||||
Efficiency ratio(c) | 59.2 | % | 54.9 | % | 56.5 | % | |||||
Tangible book value per share (end of period)(c)(d) | $ | 22.06 | $ | 20.59 | $ | 18.98 | |||||
Net charge-offs to average loans(b) | 0.44 | % | 0.03 | % | 0.01 | % | |||||
Nonperforming assets to total assets(e) | 0.75 | % | 0.31 | % | 0.20 | % | |||||
Allowance for loan losses to nonperforming loans | 109.80 | % | 344.90 | % | 612.26 | % | |||||
Allowance for loan losses to total loans(b) | 0.96 | % | 1.23 | % | 1.32 | % | |||||
(a) | We have derived the selected balance sheet measures as of December 31, 2018 and 2017 and the selected statement of income measures for the years ended December 31, 2018, 2017 and 2016 from our audited consolidated financial statements included elsewhere in this annual report. Average balances have been computed using daily averages. Our historical results may not be indicative of our results for any future period. |
(b) | Calculated using the principal amounts outstanding on loans. |
(c) | This measure is not a measure recognized under GAAP and is therefore considered to be a non-GAAP financial measure. See “Non-GAAP Financial Measures” for a description of this measure and a reconciliation of this measure to its most directly comparable GAAP measure. |
(d) | Excludes unvested restricted stock awards. |
34
(e) | Nonperforming assets consist of nonperforming loans and other real estate owned. |
Critical Accounting Policies and Estimates
The discussion and analysis of our results of operations and financial condition are based on our consolidated financial statements, which have been prepared in accordance with GAAP. The preparation of financial statements in conformity with GAAP requires us to make significant estimates and assumptions that affect the reported amounts of assets, liabilities, revenues and expenses. Actual results could differ from our current estimates, as a result of changing conditions and future events.
We believe that accounting estimates related to the initial measurement of the allowance for loan losses, stock-based compensation, derivative instrument valuation, investment securities valuation, evaluation of investment securities for other than temporary impairment and deferred income taxes valuation are particularly critical and susceptible to significant near-term change.
Allowance for Loan Losses
Determining an appropriate level of allowance for loan losses involves a high degree of judgment. We use a methodology to systematically measure the amount of estimated loan loss exposure inherent in the loan portfolio for purposes of establishing a sufficient allowance for loan losses. The methodology includes elements for specific reserves on impaired loans and loss allocations for non-impaired loans.
Loss allocations are identified for individual loans deemed to be impaired in accordance with GAAP. Impaired loans are loans for which it is probable that the Bank will not be able to collect all amounts due according to the contractual terms of the loan agreements, including non-accrual loans and all loans restructured in a troubled debt restructuring. Impaired loans do not include large groups of smaller-balance homogeneous loans that are collectively evaluated for impairment, which consist of most residential mortgage loans, commercial real estate, commercial loans and consumer loans. Impairment is measured on a discounted cash flow method based upon the loan’s contractual effective interest rate, or at the loan’s observable market price, or if the loan is collateral dependent, at the fair value of the collateral less costs to sell. For collateral dependent loans, management may adjust appraised values to reflect estimated market value declines or apply other discounts to appraised values for unobservable factors resulting from its knowledge of circumstances associated with the property.
Loss allocations for non-impaired loans are determined by portfolio segment and are based on the Bank’s and peer banks’ historical loss experiences over an economic cycle adjusted for qualitative factors. Qualitative factors include, but are not limited to, lending policies and procedures, nature and volume of the portfolio, concentrations of credit, lending management and staff, volume and severity of problem loans, quality of review and rating systems, value of underlying collateral, current economic conditions, and competitive and regulatory issues. We analyze historical loss experience over periods deemed to be relevant to the inherent risk of loss in loan portfolios as of the balance sheet date. During 2017, we updated our allowance methodology and underlying loan loss assumptions, incorporating recent industry and product loss trends. This resulted in a non-recurring pretax $1.3 million reduction in the allowance and increase in earnings.
Loss allocations for non-impaired loans are based on an internal rating system and the application of loss allocation factors. The loan rating system is described under the caption “Credit quality indicators” in Note 5 of the Notes to Consolidated Financial Statements. The loan rating system and the related loss allocation factors take into consideration parameters including the borrower’s financial condition, the borrower’s performance with respect to loan terms, and the adequacy of collateral. The loss allocation factors also take into account general and regional economic statistics, trends, and portfolio characteristics such as age of portfolio and the Bank’s experience with a particular loan product. We periodically reassess and adjust the loss allocation factors used in the assignment of loss factors that we believe are not adequately presented in historical loss experience including trends in real estate values, changes in unemployment levels and increases in delinquency levels to appropriately reflect our analysis of migratory loss experience.
Because the methodology is partly based upon peer bank data and trends, current economic data as well as management’s judgment, factors may arise that result in different estimations. Adversely different conditions or assumptions could lead to increases in the allowance. In addition, various regulatory agencies periodically review the allowance for loans losses. Such agencies may require additions to the allowance based on their judgments about information available to them at the time of their examination. As of December 31, 2018, management believes that the allowance is adequate and consistent with asset quality and delinquency indicators.
35
Stock-based Compensation
The Company measures and recognizes compensation cost relating to share-based payment transactions based on the grant-date fair value of the equity instruments issued. The fair value of time-based restricted stock is recorded based on the grant date fair value of the Company’s common stock. The fair value of market-based restricted stock is based on values derived using a Monte Carlo based pricing model. The fair value of stock options is determined using the Black-Scholes Option Pricing model. Stock-based compensation costs are recognized over the requisite service period for the awards. Compensation expense reflects the number of awards expected to vest and is adjusted based on awards that ultimately vest.
Derivative Instrument Valuation
The Company enters into interest rate swap agreements as part of the Company’s interest rate risk management strategy. Management applies the hedge accounting provisions of Accounting Standards Codification (“ASC”) Topic 815, and formally documents at inception all relationships between hedging instruments and hedged items, as well as its risk management objectives and strategies for undertaking the various hedges. Additionally, the Company assesses whether the derivative used in its hedging transaction is expected to be and has been highly effective in offsetting changes in the fair value or cash flows of the hedged item. The Company discontinues hedge accounting when it is determined that a derivative is not expected to be or has ceased to be highly effective as a hedge, and then reflects changes in fair value of the derivative in earnings after termination of the hedge relationship.
The Company has characterized all of its interest rate swaps that qualify under ASC Topic 815 hedge accounting as cash flow hedges. Cash flow hedges are used to minimize the variability in cash flows of assets or liabilities, or forecasted transactions caused by interest rate fluctuations, and are recorded at fair value in other assets within the consolidated balance sheet. Changes in the fair value of these cash flow hedges are initially recorded in accumulated other comprehensive income and subsequently reclassified into earnings when the forecasted transaction affects earnings.
Investment Securities Valuation
Fair values of the Company’s investment securities are based on quoted market prices or dealer quotes, if available. If a quoted market price is not available, fair value is estimated using quoted market prices for similar securities. The Company’s private placement municipal housing authority bonds, classified as held to maturity, have no available quoted market price. The fair value for these securities is estimated using a discounted cash flow model. Due to the judgments and uncertainties involved in the estimation process, the estimates could result in materially different results under different assumptions and conditions.
Evaluation of Investment Securities for Other Than Temporary Impairment
The Company evaluates investment securities within the Company’s available for sale and held to maturity portfolios for other-than-temporary impairment (“OTTI”), at least quarterly. If the fair value of a debt security is below the amortized cost basis of the security, OTTI is required to be recognized if any of the following are met: (1) the Company intends to sell the security; (2) it is “more likely than not” that the Company will be required to sell the security before recovery of its amortized cost basis; or (3) for debt securities, the present value of expected cash flows is not sufficient to recover the entire amortized cost basis. For all impaired debt securities that are intended for sale, or more likely than not will be required to sell, the full amount of the loss is recognized as OTTI through earnings. Credit related OTTI for all other impaired debt securities is recognized through earnings. Non-credit related OTTI for such debt securities is recognized in other comprehensive income, net of applicable taxes. Should actual factors and conditions differ materially from those expected by management, the actual realization of gains or losses on investment securities could differ materially from the amounts recorded in the financial statements.
Deferred Income Taxes
In accordance with ASC Topic 740, “Income Taxes,” certain aspects of accounting for income taxes require significant management judgment, including assessing the realizability of Deferred Tax Assets (DTAs). Such judgments are subjective and involve estimates and assumptions about matters that are inherently uncertain. Should actual factors and conditions differ materially from those used by management, the actual realization of DTAs could differ materially from the amounts recorded in the Consolidated Financial Statements and the accompanying Notes thereto.
DTAs generally represent items for which a benefit has been recognized for financial accounting purposes that cannot be realized for tax purposes until a future period. The realization of DTAs depends upon future sources of taxable income. Valuation allowances are established for those DTAs determined not likely to be realized based on management’s judgment.
36
Emerging Growth Company
The JOBS Act permits us, as an “emerging growth company”, to take advantage of an extended transition period to comply with new or revised accounting standards and not commence complying with new or revised accounting standards until private companies must do so. Under the JOBS Act, we may make an irrevocable election to “opt out” of that extended transition period and comply with new or revised accounting standards when public companies that are not emerging growth companies must commence complying with those standards. We have elected to “opt out” of the extended transition period.
Earnings Overview
2018 Earnings Overview
Our net income for the year ended December 31, 2018 was $17.4 million, an increase of $3.6 million, or 26.1%, compared to the year ended December 31, 2017. Net income available to common shareholders for the year ended December 31, 2018 was $17.4 million, or $2.21 per diluted share, compared to net income available to common shareholders of $13.8 million, or $1.78 per diluted share for the year ended December 31, 2017. Our returns on average shareholders' equity and average assets for the year ended December 31, 2018, were 10.19% and 0.94%, respectively, compared to 8.93% and 0.80%, respectively for the year ended December 31, 2017.
The increase in net income for 2018 compared to 2017 was primarily a result of higher net interest income and income tax expense savings resulting from the tax law change enacted in 2017. Net interest income for the year ended December 31, 2018 was $56.3 million, an increase of $2.0 million compared to the year ended December 31, 2017. Our net interest margin decreased 12 basis points to 3.18% for the year ended December 31, 2018 compared to the year ended December 31, 2017 reflecting higher rates on interest bearing deposits driven by rate increases in our competitive marketplace.
Our efficiency ratio was 59.2% for the year ended December 31, 2018 compared to 54.9% for the year ended December 31, 2017. The increase in the efficiency ratio was driven by slower growth in net interest income and an increase in noninterest expense associated with the opening of three new branches during the second quarter of 2018, as well as a number of non-recurring expenses recognized in the first quarter of 2018 that caused our efficiency ratio to temporarily jump to 62.0%.
2017 Earnings Overview
Our net income for the year ended December 31, 2017 was $13.8 million, an increase of $1.5 million, or 12.0%, compared to the year ended December 31, 2016. Net income available to common shareholders for the year ended December 31, 2017, was $13.8 million, or $1.78 per diluted share, compared to net income available to common shareholders of $12.4 million, or $1.62 per diluted share, for the year ended December 31, 2016. Our returns on average shareholders' equity and average assets for the year ended December 31, 2017, were 8.93% and 0.80%, respectively, compared to 8.94% and 0.85%, respectively for the year ended December 31, 2016. The decrease in returns was entirely attributable to the write-off of the deferred tax asset at year-end 2017 due to the Tax Cuts and Jobs Act of 2017.
The increase in net income for 2017 compared to 2016 was primarily due to an increase of interest and fees on loans as a result of strong organic loan growth. This increase was partially offset by the $3.3 million write-off of the deferred tax asset as a result of the legislation enacted as part of the Tax Cuts and Jobs Act of 2017. Net interest income for the year ended December 31, 2017 was $54.4 million, an increase of $5.3 million compared to the year ended December 31, 2016. Our net interest margin decreased 24 basis points to 3.30% for the year ended December 31, 2017 compared to the year ended December 31, 2016 reflecting an increase in rates on interest bearing deposits driven by promotional rate increases to remain competitive in the market place and to attract additional deposits.
Our efficiency ratio was 54.9% for the year ended December 31, 2017 compared to 56.5% for the year ended December 31, 2016. The improvement in our efficiency ratio was attributable to our focus on expense control and achieving economies of scale.
Results of Operations
Net Interest Income
Net interest income is the difference between interest earned on loans and securities and interest paid on deposits and other borrowings, and is the primary source of our operating income. Net interest income is affected by the level of interest rates, changes in interest rates and changes in the amount and composition of interest-earning assets and interest-bearing liabilities. Included in interest income are certain loan fees, such as deferred origination fees and late charges. We convert tax-exempt income to a FTE basis using the statutory federal income tax rate adjusted for applicable state income taxes net of the related federal tax benefit. The average balances are principally daily averages. Interest income on loans includes the effect of deferred loan fees and costs accounted for as yield adjustments. Premium amortization and discount accretion are included in the respective interest income and interest expense amounts.
37
Year ended December 31, 2018 compared to year ended December 31, 2017
FTE net interest income for the years ended December 31, 2018 and 2017 was $56.6 million and $55.0 million, respectively. Net interest income increased due to higher yields and an increase in earning assets offset by higher rates and volume on interest bearing deposits.
FTE basis interest income for the year ended December 31, 2018 increased by $8.5 million to $80.3 million, or 12%, compared to FTE basis interest income for the year ended December 31, 2017 due primarily to growth in higher yielding interest earning assets, specifically, loan growth and yield increases in our commercial real estate and commercial business portfolios. Average interest earning assets were $1.8 billion for the year ended December 31, 2018, increasing by $115.5 million, or 7%, from the year ended December 31, 2017. The average balance of total loans increased $112.6 million, or 8%, contributing $7.9 million to the increase in interest income. The total average balance of securities for the year ended December 31, 2018 increased by $9.5 million, or 9%, from the year ended December 31, 2017. The total yield in earnings assets increased to 4.45% at December 31, 2018, compared to 4.25% at December 31, 2017. The increase in yield was primarily driven by an increase in rates on loans and an increase in income earned resulting from loan prepayments.
Interest expense for the year ended December 31, 2018, increased by $6.9 million, or 41%, compared to interest expense for 2017 due to an increase in volume and increases in rates on interest bearing deposits driven by rate increases in our competitive marketplace. The weighted average cost of deposits increased 41 basis points to 1.47% due to an increase in market rates and our desire to attract additional deposits. The weighted average cost of borrowed money increased by 11 basis points to 2.21%. Average interest bearing liabilities for the year ended December 31, 2018 increased by $106.9 million, or 8%, from the year ended December 31, 2017, primarily due to higher average balances in money market and savings accounts.
Year ended December 31, 2017 compared to year ended December 31, 2016
FTE net interest income for the years ended December 31, 2017 and 2016 was $55.0 million and $49.7 million, respectively. Net interest income increased due to increases in earning assets offset by higher rates and volume on interest bearing deposits driven by our continued earning asset growth.
FTE basis interest income for the year ended December 31, 2017 increased by $10.2 million to $71.8 million, or 17%, compared to FTE basis interest income for the year ended December 31, 2016 due primarily to growth in interest earning assets, specifically, loan growth in our commercial real estate and commercial business portfolios. Average interest earning assets were $1.7 billion for the year ended December 31, 2017 up by $263.2 million, or 19%, from the year ended December 31, 2016. The average balance of total loans increased $209.8 million, or 17%, contributing $8.8 million to the increase in interest income. The total average balance of securities for the year ended December 31, 2017 increased by $8.9 million, or 9%, from the year ended December 31, 2016. The total yield in earnings assets decreased to 4.25% at December 31, 2017 compared to 4.31% at December 31, 2016. The decrease in yield was primarily driven by a decrease in yields on commercial real estate loans and commercial business loans.
Interest expense for the year ended December 31, 2017 increased by $4.9 million, or 42%, compared to interest expense for 2016 due to an increase in volume and increases in rates on interest bearing deposits driven by promotional rate increases to remain competitive in the market place. The weighted average cost of deposits increased 20 basis points to 1.06% due to an increase in market rates and our desire to attract additional deposits. The weighted average cost of borrowed money decreased by 9 basis points to 2.10%. Average interest bearing liabilities for the year ended December 31, 2017 increased by $258.8 million, or 23%, from the year ended December 31, 2016, primarily due to higher average balances in time deposits, money market accounts and borrowed money.
38
Distribution of Assets, Liabilities and Stockholders’ Equity; Interest Rates and Interest Differential
The following table below presents the average balances and yields earned on interest-earning assets and average balances and weighted average rates paid on our funding liabilities for the years ended December 31, 2018, 2017 and 2016.
Years Ended December 31, | ||||||||||||||||||||||||||||||||
2018 | 2017 | 2016 | ||||||||||||||||||||||||||||||
Average Balance | Interest | Yield/ Rate(5) | Average Balance | Interest | Yield/ Rate(5) | Average Balance | Interest | Yield/ Rate(5) | ||||||||||||||||||||||||
(Dollars in thousands) | ||||||||||||||||||||||||||||||||
Assets: | ||||||||||||||||||||||||||||||||
Cash and fed funds sold | $ | 77,923 | $ | 1,428 | 1.84 | % | $ | 85,308 | $ | 790 | 0.93 | % | $ | 41,838 | $ | 173 | 0.41 | % | ||||||||||||||
Securities(1) | 118,311 | 3,686 | 3.12 | 108,775 | 3,830 | 3.52 | 99,905 | 3,046 | 3.05 | |||||||||||||||||||||||
Loans: | ||||||||||||||||||||||||||||||||
Commercial real estate | 1,014,255 | 47,967 | 4.66 | 907,223 | 41,638 | 4.53 | 772,890 | 36,572 | 4.65 | |||||||||||||||||||||||
Residential real estate | 189,121 | 7,016 | 3.71 | 194,344 | 6,983 | 3.51 | 194,047 | 7,031 | 3.62 | |||||||||||||||||||||||
Construction(2) | 90,773 | 4,667 | 5.07 | 107,752 | 5,195 | 4.75 | 100,611 | 4,602 | 4.50 | |||||||||||||||||||||||
Commercial business | 282,425 | 15,037 | 5.25 | 253,868 | 12,981 | 5.04 | 185,523 | 9,791 | 5.19 | |||||||||||||||||||||||
Consumer | 481 | 28 | 5.88 | 1,227 | 44 | 3.62 | 1,560 | 81 | 5.17 | |||||||||||||||||||||||
Total loans | 1,577,055 | 74,715 | 4.67 | 1,464,414 | 66,841 | 4.50 | 1,254,631 | 58,077 | 4.55 | |||||||||||||||||||||||
Federal Home Loan Bank stock | 9,177 | 517 | 5.63 | 8,486 | 337 | 3.97 | 7,366 | 255 | 3.46 | |||||||||||||||||||||||
Total earning assets | 1,782,466 | $ | 80,346 | 4.45 | % | 1,666,983 | $ | 71,798 | 4.25 | % | 1,403,740 | $ | 61,551 | 4.31 | % | |||||||||||||||||
Other assets | 68,002 | 60,904 | 54,580 | |||||||||||||||||||||||||||||
Total assets | $ | 1,850,468 | $ | 1,727,887 | $ | 1,458,320 | ||||||||||||||||||||||||||
Liabilities and shareholders’ equity: | ||||||||||||||||||||||||||||||||
Interest -bearing liabilities: | ||||||||||||||||||||||||||||||||
NOW | $ | 60,410 | $ | 157 | 0.26 | % | $ | 57,712 | $ | 93 | 0.16 | % | $ | 56,123 | $ | 109 | 0.19 | % | ||||||||||||||
Money market | 482,886 | 6,431 | 1.33 | 404,848 | 3,427 | 0.85 | 317,210 | 1,836 | 0.58 | |||||||||||||||||||||||
Savings | 124,214 | 1,649 | 1.33 | 102,915 | 763 | 0.74 | 72,800 | 315 | 0.43 | |||||||||||||||||||||||
Time | 619,448 | 10,714 | 1.73 | 633,260 | 8,411 | 1.33 | 524,237 | 6,040 | 1.15 | |||||||||||||||||||||||
Total interest-bearing deposits | 1,286,958 | 18,951 | 1.47 | 1,198,735 | 12,694 | 1.06 | 970,370 | 8,300 | 0.86 | |||||||||||||||||||||||
Borrowed money | 213,546 | 4,787 | 2.21 | 194,875 | 4,143 | 2.10 | 164,450 | 3,598 | 2.19 | |||||||||||||||||||||||
Total interest-bearing liabilities | 1,500,504 | $ | 23,738 | 1.58 | % | 1,393,610 | $ | 16,837 | 1.21 | % | 1,134,820 | $ | 11,898 | 1.05 | % | |||||||||||||||||
Noninterest-bearing deposits | 166,566 | 169,250 | 172,098 | |||||||||||||||||||||||||||||
Other liabilities | 12,374 | 10,098 | 13,271 | |||||||||||||||||||||||||||||
Total liabilities | 1,679,444 | 1,572,958 | 1,320,189 | |||||||||||||||||||||||||||||
Shareholders’ equity | 171,024 | 154,929 | 138,131 | |||||||||||||||||||||||||||||
Total liabilities and shareholders’ equity | $ | 1,850,468 | $ | 1,727,887 | $ | 1,458,320 | ||||||||||||||||||||||||||
Net interest income(3) | $ | 56,608 | $ | 54,961 | $ | 49,653 | ||||||||||||||||||||||||||
Interest rate spread | 2.87 | % | 3.04 | % | 3.26 | % | ||||||||||||||||||||||||||
Net interest margin(4) | 3.18 | % | 3.30 | % | 3.54 | % | ||||||||||||||||||||||||||
(1) | Average balances and yields for securities are based on amortized cost. |
(2) | Includes commercial and residential real estate construction loans. |
(3) | The adjustment for securities and loans taxable equivalency was $282 thousand, $597 thousand and $561 thousand, respectively, for the years ended December 31, 2018, 2017 and 2016. Tax exempt income was converted to a fully taxable equivalent basis at a 20 percent tax rate for 2018 and a 30 percent tax rate for 2017 and 2016. |
(4) | Net interest income as a percentage of total earning assets. |
(5) | Yields are calculated using the contractual day count convention for each respective product type. |
39
Effect of changes in interest rates and volume of average earning assets and average interest-bearing liabilities
The following table shows the extent to which changes in interest rates and changes in the volume of average earning assets and average interest-bearing liabilities have affected net interest income. For each category of earning assets and interest-bearing liabilities, information is provided relating to: changes in volume (changes in average balances multiplied by the prior year’s average interest rates); changes in rates (changes in average interest rates multiplied by the prior year’s average balances); and the total change. Changes attributable to both volume and rate have been allocated proportionately based on the relationship of the absolute dollar amount of change in each.
Year Ended December 31, 2018 vs 2017 Increase (Decrease) | Year Ended December 31, 2017 vs 2016 Increase (Decrease) | ||||||||||||||||||||||
Volume | Rate | Total | Volume | Rate | Total | ||||||||||||||||||
(In thousands) | |||||||||||||||||||||||
Interest and dividend income: | |||||||||||||||||||||||
Cash and fed funds sold | $ | (74 | ) | $ | 712 | $ | 638 | $ | 281 | $ | 336 | $ | 617 | ||||||||||
Securities | 319 | (463 | ) | (144 | ) | 286 | 498 | 784 | |||||||||||||||
Loans: | |||||||||||||||||||||||
Commercial real estate | 5,031 | 1,298 | 6,329 | 6,206 | (1,140 | ) | 5,066 | ||||||||||||||||
Residential real estate | (190 | ) | 223 | 33 | 4 | (52 | ) | (48 | ) | ||||||||||||||
Construction | (857 | ) | 329 | (528 | ) | 337 | 256 | 593 | |||||||||||||||
Commercial business | 1,504 | 552 | 2,056 | 3,513 | (323 | ) | 3,190 | ||||||||||||||||
Consumer | (35 | ) | 19 | (16 | ) | (15 | ) | (22 | ) | (37 | ) | ||||||||||||
Total loans | 5,453 | 2,421 | 7,874 | 10,045 | (1,281 | ) | 8,764 | ||||||||||||||||
Federal Home Loan Bank stock | 29 | 151 | 180 | 42 | 40 | 82 | |||||||||||||||||
Total change in interest and dividend income | $ | 5,727 | $ | 2,821 | $ | 8,548 | $ | 10,654 | $ | (407 | ) | $ | 10,247 | ||||||||||
Interest expense: | |||||||||||||||||||||||
Deposits: | |||||||||||||||||||||||
NOW | $ | 5 | $ | 59 | $ | 64 | $ | 3 | $ | (19 | ) | $ | (16 | ) | |||||||||
Money market | 756 | 2,248 | 3,004 | 594 | 997 | 1,591 | |||||||||||||||||
Savings | 184 | 702 | 886 | 164 | 284 | 448 | |||||||||||||||||
Time | (187 | ) | 2,490 | 2,303 | 1,366 | 1,005 | 2,371 | ||||||||||||||||
Total deposits | 758 | 5,499 | 6,257 | 2,127 | 2,267 | 4,394 | |||||||||||||||||
Borrowed money | 411 | 233 | 644 | 654 | (109 | ) | 545 | ||||||||||||||||
Total change in interest expense | 1,169 | 5,732 | 6,901 | 2,781 | 2,158 | 4,939 | |||||||||||||||||
Change in net interest income | $ | 4,558 | $ | (2,911 | ) | $ | 1,647 | $ | 7,873 | $ | (2,565 | ) | $ | 5,308 | |||||||||
Provision for Loan Losses
The provision for loan losses is based on management’s periodic assessment of the adequacy of our allowance for loan losses which, in turn, is based on such interrelated factors as the composition of our loan portfolio and its inherent risk characteristics, the level of nonperforming loans and net charge-offs, both current and historic, local economic and credit conditions, the direction of real estate values, and regulatory guidelines. The provision for loan losses is charged against earnings in order to maintain our allowance for loan losses and reflects management’s best estimate of probable losses inherent in our loan portfolio at the balance sheet date.
The provision for loan losses for the year ended December 31, 2018 was $3.4 million compared to a $1.3 million provision for loan losses for the year ended December 31, 2017. The increase in the provision for loan losses is attributable to a $6.2 million charge-off related to one lending relationship recognized in the fourth quarter of 2018, offset by a reduction in reserve rates driven by improving historical loss trends.
40
Noninterest Income
Noninterest income is a component of our revenue and is comprised primarily of fees generated from loan and deposit relationships with our customers, fees generated from sales and referrals of loans, income earned on bank-owned life insurance and gains on sales of investment securities. The following table compares noninterest income for the years ended December 31, 2018, 2017 and 2016.
Years Ended December 31, | 2018/2017 Change | 2017/2016 Change | |||||||||||||||||||||||
2018 | 2017 | 2016 | $ | % | $ | % | |||||||||||||||||||
(Dollars in thousands) | |||||||||||||||||||||||||
Service charges and fees | $ | 1,090 | $ | 1,007 | $ | 963 | $ | 83 | 8 | % | $ | 44 | 5 | % | |||||||||||
Bank owned life insurance | 1,057 | 1,170 | 693 | (113 | ) | (10 | ) | 477 | 69 | ||||||||||||||||
Gains and fees from sales of loans | 984 | 1,427 | 466 | (443 | ) | (31 | ) | 961 | 206 | ||||||||||||||||
Net gain (loss) on sale of available for sale securities | 222 | 165 | (115 | ) | 57 | 35 | 280 | (243 | ) | ||||||||||||||||
(Loss) gain on sale of foreclosed real estate | — | (78 | ) | 128 | 78 | (100 | ) | (206 | ) | (161 | ) | ||||||||||||||
Other | 547 | 938 | 541 | (391 | ) | (42 | ) | 397 | 73 | ||||||||||||||||
Total noninterest income | $ | 3,900 | $ | 4,629 | $ | 2,676 | $ | (729 | ) | (16 | )% | $ | 1,953 | 73 | % | ||||||||||
Year ended December 31, 2018 compared to year ended December 31, 2017
Noninterest income totaled $3.9 million for the year ended December 31, 2018, compared to $4.6 million for the year ended December 31, 2017. The decrease in noninterest income was primarily driven by a decline in gains and fees from sales of loans and other income.
Gains and fees from sales of loans. The Company recorded $1.0 million in gains and fees from sales of loans for the year ended December 31, 2018, a decrease of $0.4 million compared to the year ended December 31, 2017. The decrease is primarily driven by the absence of refining the model assumptions used in calculating a servicing asset in 2017, partially offset by an increase in the gains realized on the sale of loans in 2018 as compared to 2017.
Other. We recorded other income of $0.5 million for the year ended December 31, 2018, a decrease of $0.4 million compared to the year ended December 31, 2017. The decrease is primarily related to a valuation allowance on servicing assets of $0.2 million recognized in the fourth quarter of 2018 and increased amortization on servicing assets.
Year ended December 31, 2017 compared to year ended December 31, 2016
Noninterest income totaled $4.6 million for the year ended December 31, 2017, compared to $2.7 million for the year ended December 31, 2016. The increase in noninterest income was primarily driven by an increase in gains and fees from the sales of loans, bank owned life insurance and other income.
Gains and fees from sales of loans. During the year ended December 31, 2017, the Company recorded $0.4 million in gains on the sales of $18.0 million of loans and $1.0 million as a result of refining the model assumptions used in calculating a servicing asset. For the year ended December 31, 2016, gains and fees from sales of loans totaled $0.5 million on the sales of $7.4 million of loans.
Bank Owned Life Insurance. Income earned on bank-owned life insurance increased $0.5 million, or 69%, from December 31, 2016 compared to December 31, 2017 due to income earned from the Company’s additional purchase of Bank Owned Life Insurance.
Other. We recorded other income of $0.9 million during the year ended December 31, 2017, an increase of $0.4 million compared to the year ended December 31, 2016. The increase is primarily related to rental income earned from the headquarters building acquired in the fourth quarter of 2016.
41
Noninterest Expense
The following table compares noninterest expense for the years ended December 31, 2018, 2017 and 2016.
Years Ended December 31, | 2018/2017 Change | 2017/2016 Change | |||||||||||||||||||||||
2018 | 2017 | 2016 | $ | % | $ | % | |||||||||||||||||||
(Dollars in thousands) | |||||||||||||||||||||||||
Salaries and employee benefits | $ | 18,973 | $ | 16,284 | $ | 15,655 | $ | 2,689 | 17 | % | $ | 629 | 4 | % | |||||||||||
Occupancy and equipment | 6,790 | 6,165 | 5,811 | 625 | 10 | 354 | 6 | ||||||||||||||||||
Professional services | 2,103 | 2,072 | 1,654 | 31 | 1 | 418 | 25 | ||||||||||||||||||
Data processing | 2,033 | 1,866 | 1,603 | 167 | 9 | 263 | 16 | ||||||||||||||||||
Marketing | 1,587 | 1,193 | 948 | 394 | 33 | 245 | 26 | ||||||||||||||||||
Director fees | 1,044 | 912 | 859 | 132 | 14 | 53 | 6 | ||||||||||||||||||
FDIC insurance | 779 | 1,116 | 660 | (337 | ) | (30 | ) | 456 | 69 | ||||||||||||||||
Amortization of intangibles | 92 | 118 | 151 | (26 | ) | (22 | ) | (33 | ) | (22 | ) | ||||||||||||||
Other | 2,232 | 2,797 | 2,203 | (565 | ) | (20 | ) | 594 | 27 | ||||||||||||||||
Total noninterest expense | $ | 35,633 | $ | 32,523 | $ | 29,544 | $ | 3,110 | 10 | % | $ | 2,979 | 10 | % | |||||||||||
Year ended December 31, 2018 compared to year ended December 31, 2017
Noninterest expense was $35.6 million for the year ended December 31, 2018, compared to $32.5 million for the year ended December 31, 2017. The increase of $3.1 million, or 10%, was primarily driven by an increase in salaries and employee benefits and occupancy and equipment expenses.
Salaries and employee benefits. Salaries and employee benefit costs are the largest component of noninterest expense and include employee payroll expense, equity and non-equity incentive compensation, health insurance, benefit plans and payroll taxes. Salaries and employee benefits increased by $2.7 million, or 17%, for the year ended December 31, 2018 compared to the year ended December 31, 2017, largely reflecting an increase in full time equivalent employees and a reduction in deferred loan origination costs as a result of lower loan volume. The increase in full time equivalent employees is in line with year over year business growth and driven by staffing for the three new branch locations. Average full time equivalent employees totaled 144 at December 31, 2018 compared to 134 at December 31, 2017.
Occupancy and equipment. Rent, depreciation and maintenance costs comprise the majority of occupancy and equipment expenses, which increased by $0.6 million, or 10%, for the year ended December 31, 2018 compared to the year ended December 31, 2017. The increase in occupancy and equipment expense was primarily driven by expenditures associated with the opening of the new branch locations and improvements of existing infrastructure.
Year ended December 31, 2017 compared to year ended December 31, 2016
Noninterest expense was $32.5 million for the year ended December 31, 2017, compared to $29.5 million for the year ended December 31, 2016. The increase of $3.0 million, or 10%, was primarily driven by an increase in salaries and employee benefits, occupancy and equipment expenses, professional services and other expenses related to growth and strategic initiatives.
Salaries and employee benefits. Salaries and employee benefits increased by $0.6 million, or 4%, for the year ended December 31, 2017 compared to the year ended December 31, 2016, largely reflecting an increase in full time equivalent employees. Average full time equivalent employees totaled 134 at December 31, 2017 compared to 124 at December 31, 2016.
Occupancy and equipment. Occupancy and equipment expense increased by $0.4 million, or 6%, for the year ended December 31, 2017, compared to the year ended December 31, 2016. The increase was driven by increases in IT related expenses, one time charges relating to back office consolidation activity and maintenance costs for our headquarters building acquired in the fourth quarter of 2016.
Professional services. Professional services include legal, audit and professional fees paid to external parties. For the year ended December 31, 2017 professional services increased by $0.4 million, or 25%, compared to the year ended December 31, 2016. The increase in the 2017 expense is primarily driven by increased fees paid for internal and external audit, and consulting services to support the overall growth of the business.
42
Income Taxes
Income tax expense for the years ended December 31, 2018, 2017 and 2016 totaled $3.7 million, $11.3 million and $6.0 million, respectively. The effective tax rates for the years ended December 31, 2018, 2017 and 2016, were 17.6%, 45.0% and 32.6%, respectively. The decrease in the effective tax rate for the year ended December 31, 2018 is primarily due to the tax law change enacted in 2017.
Our net deferred tax asset at December 31, 2018, was $4.3 million, compared to $4.9 million, at December 31, 2017. The decrease in the deferred tax asset at December 31, 2018 is primarily a result of a reduction in the allowance for loan losses.
On October 8, 2015, the Bank established a new wholly-owned subsidiary, Bankwell Loan Servicing Group, Inc. (a Passive Investment Company “PIC”). The PIC was organized in accordance with Connecticut statutes to hold and manage certain loans that are collateralized by real estate. Income earned by the PIC is exempt from Connecticut income tax and any dividends paid by the PIC to the Bank are not taxable income for Connecticut income tax purposes. See Note 12 to our Consolidated Financial Statements for further information regarding income taxes.
Financial Condition
Summary
Total assets at December 31, 2018 were $1.9 billion, an increase of $77.1 million, or 4%, from the December 31, 2017 balance of $1.8 billion. This increase was primarily due to continued organic loan growth. Gross loans were $1.6 billion at December 31, 2018, up by $61.7 million from December 31, 2017.
Total liabilities at December 31, 2018 were $1.7 billion, an increase of $63.9 million from the December 31, 2017 balance of $1.6 billion. This increase was primarily due to an increase in deposits. Shareholders’ equity totaled $174.2 million at December 31, 2018, an increase of $13.2 million from December 31, 2017, largely due to net income for the year ended December 31, 2018 of $17.4 million, offset by dividends paid of $3.8 million and a $2.7 million impact to accumulated other comprehensive income driven by fair value marks related to hedge positions involving interest rate swaps. The Bank exceeded the regulatory minimum capital levels to be considered well-capitalized with total risk-based capital of 12.50%, tier 1 risk-based capital of 11.56% and tier 1 capital to average assets ratio of 10.14% at December 31, 2018.
Loan Portfolio
The following table compares the composition of our loan portfolio for the dates indicated:
2018 | 2017 | Change | |||||||||||||||
Total | % | Total | % | Total | |||||||||||||
(In thousands) | |||||||||||||||||
Real estate loans: | |||||||||||||||||
Residential | $ | 178,079 | 11.10 | % | $ | 193,524 | 12.54 | % | $ | (15,445 | ) | ||||||
Commercial | 1,094,066 | 68.18 | 987,242 | 63.98 | 106,824 | ||||||||||||
Construction | 73,191 | 4.56 | 101,636 | 6.59 | (28,445 | ) | |||||||||||
1,345,336 | 83.84 | 1,282,402 | 83.11 | 62,934 | |||||||||||||
Commercial business | 258,978 | 16.14 | 259,995 | 16.85 | (1,017 | ) | |||||||||||
Consumer | 412 | 0.02 | 619 | 0.04 | (207 | ) | |||||||||||
Total loans | $ | 1,604,726 | 100.00 | % | $ | 1,543,016 | 100.00 | % | $ | 61,710 | |||||||
Primary loan categories
Residential real estate. Residential real estate loans decreased by $15.4 million, or 8.0%, at December 31, 2018 compared to December 31, 2017 and amounted to $178.1 million, representing 11% of total loans at December 31, 2018. In the fourth quarter of 2017, management made the strategic decision to no longer originate residential mortgage loans.
Commercial real estate. Commercial real estate loans were $1.1 billion and represented 68% of our total loan portfolio at December 31, 2018, a net increase of $106.8 million, or 11%, from December 31, 2017. Commercial real estate loan growth during these periods largely reflects strong production from experienced relationship managers in the marketplace and their ability to source quality opportunities, and enhanced lending to existing customers. Commercial real estate loans are secured by a variety of property types, including office buildings, retail facilities, commercial mixed use and multi-family dwellings.
Construction. Construction loans were $73.2 million at December 31 2018, down by $28.4 million from December 31, 2017. The balance contains $40.3 million attributable to commercial construction and $32.9 million attributable to residential construction. Construction loans totaled $101.6 million at December 31, 2017, of which $92.7 million were commercial
43
construction and $8.9 million were residential construction. Commercial construction loans consist of commercial development projects, such as condominiums, apartment building and single-family subdivisions as well as office buildings, retail and other income producing properties and land loans, while residential construction loans are primarily to individuals to finance the construction of residential dwellings for personal use.
Commercial business. Commercial business loans were $259.0 million and represented 16% of our total loan portfolio at December 31, 2018, compared to $260.0 million and 17% of the total portfolio at December 31, 2017. Our commercial business loans largely reflect our commitment to this segment, including small business lending. Commercial business loans primarily provide working capital, equipment financing, financing for leasehold improvements and financing for expansion and are generally secured by assignments of corporate assets, real estate and personal guarantees of the business owners.
We evaluate the appropriateness of our underwriting standards in response to changes in national and regional economic conditions, including such matters as market interest rates, energy prices, trends in real estate values, and employment levels. Based on our assessment of these matters, underwriting standards and credit monitoring activities are enhanced from time to time in response to changes in these conditions.
The following table presents an analysis of the maturity of our commercial real estate, commercial construction and commercial business loan portfolios as of December 31, 2018.
December 31, 2018 | |||||||||||||||
Commercial Real Estate | Commercial Construction | Commercial Business | Total | ||||||||||||
(In thousands) | |||||||||||||||
Amounts due: | |||||||||||||||
One year or less | $ | 44,252 | $ | 11,816 | $ | 15,117 | $ | 71,185 | |||||||
After one year: | |||||||||||||||
One to five years | 384,320 | 10,909 | 130,020 | 525,249 | |||||||||||
Over five years | 665,494 | 17,567 | 113,841 | 796,902 | |||||||||||
Total due after one year | 1,049,814 | 28,476 | 243,861 | 1,322,151 | |||||||||||
Total | $ | 1,094,066 | $ | 40,292 | $ | 258,978 | $ | 1,393,336 | |||||||
The following table presents an analysis of the interest rate sensitivity of our commercial real estate, commercial construction and commercial business loan portfolios due after one year as of December 31, 2018.
December 31, 2018 | |||||||||||
Adjustable Interest Rate | Fixed Interest Rate | Total | |||||||||
(In thousands) | |||||||||||
Commercial real estate | $ | 310,382 | $ | 739,432 | $ | 1,049,814 | |||||
Commercial construction | — | 28,476 | 28,476 | ||||||||
Commercial business | 150,392 | 93,469 | 243,861 | ||||||||
Total loans due after one year | $ | 460,774 | $ | 861,377 | $ | 1,322,151 | |||||
Asset Quality
We actively manage asset quality through our underwriting practices and collection operations. Our Board of Directors monitors credit risk management through two committees, the Directors' Loan Committee ("DLC") and the Audit Committee. The DLC has primary oversight responsibility for the credit granting function including approval authority for credit granting policies, review of management’s credit granting activities and approval of large exposure credit requests. The Audit Committee oversees management’s procedures to monitor the credit quality of our loan portfolio and the loan review program. These committees report the results of their respective oversight functions to our Board of Directors. In addition, our Board of Directors receives information concerning asset quality measurements and trends on a monthly basis. While we continue to adhere to prudent underwriting standards, our loan portfolio is not immune to potential negative consequences as a result of general economic weakness, such as a prolonged downturn in the housing market on a regional or national scale. Decreases in real estate values could adversely affect the value of property used as collateral for loans. In addition, adverse changes in the economy could have a negative effect on the ability of borrowers to make scheduled loan payments, which would likely have an adverse impact on earnings.
44
The Company has established credit policies applicable to each type of lending activity in which it engages. The Company evaluates the creditworthiness of each customer and extends credit of up to 80% of the market value of the collateral, depending on the borrower's creditworthiness and the type of collateral. The borrower’s ability to service the debt is monitored on an ongoing basis. Real estate is the primary form of collateral. Other important forms of collateral are business assets, time deposits and marketable securities. While collateral provides assurance as a secondary source of repayment, the Company ordinarily requires the primary source of repayment for commercial loans to be based on the borrower’s ability to generate continuing cash flows. In the fourth quarter of 2017 management made the strategic decision to cease the origination of residential mortgage loans. The Company’s policy for residential lending generally required that, the amount of the loan may not exceed 80% of the original appraised value of the property. In certain situations, the amount may have exceeded 80% LTV either with private mortgage insurance being required for that portion of the residential loan in excess of 80% of the appraised value of the property or where secondary financing is provided by a housing authority program second mortgage, a community’s low/moderate income housing program, or a religious or civic organization.
Credit risk management involves a partnership between our relationship managers and our credit approval, portfolio management, credit administration and collections personnel. Disciplined underwriting, portfolio monitoring and early problem recognition are important aspects of maintaining our high credit quality standards and low levels of nonperforming assets since our inception in 2002.
Acquired Loans. Loans acquired in acquisitions are initially recorded at fair value with no carryover of the related allowance for credit losses. Acquired loans that have evidence of deterioration in credit quality since origination and for which it is probable, at acquisition, that all contractually required payments will not be collected are initially recorded at fair value without recording an allowance for loan losses. Determining the fair value of the loans is determined using market participant assumptions in estimating the amount and timing of principal and interest cash flows initially expected to be collected on the loans and discounting those cash flows at an appropriate market rate of interest.
Under the accounting model for acquired loans, the excess of cash flows expected to be collected over the carrying amount of the loans, referred to as the “accretable yield”, is accreted into interest income over the life of the loans. Accordingly, acquired loans are not subject to classification as nonaccrual in the same manner as originated loans. Rather, acquired loans are considered to be accruing loans because their interest income relates to the accretable yield recognized and not to contractual interest payments. The excess of the loans' contractually required payments over the cash flows expected to be collected is the nonaccretable difference. As such, charge-offs on acquired loans are first applied to the nonaccretable difference and then to any allowance for loan losses recognized subsequent to the acquisition. A decrease in expected cash flows in subsequent periods may indicate that the loan pool is impaired, which would require the establishment of an allowance for loan losses by a charge to the provision for loan losses.
Nonperforming Assets. Nonperforming assets include nonaccrual loans and property acquired through foreclosures or repossession. The following table presents nonperforming assets and additional asset quality data for the dates indicated:
At December 31, | |||||||||||||||||||
2018 | 2017 | 2016 | 2015 | 2014 | |||||||||||||||
(In thousands) | |||||||||||||||||||
Nonaccrual loans: | |||||||||||||||||||
Real estate loans: | |||||||||||||||||||
Residential | $ | 3,812 | $ | 1,590 | $ | 1,612 | $ | 1,365 | $ | — | |||||||||
Commercial | 5,950 | 3,371 | 446 | 1,264 | 3,220 | ||||||||||||||
Commercial business | 4,320 | 520 | 538 | 1,160 | — | ||||||||||||||
Consumer | — | — | 341 | 2 | 142 | ||||||||||||||
Total non accrual loans | 14,082 | 5,481 | 2,937 | 3,791 | 3,362 | ||||||||||||||
Property acquired through foreclosure or repossession, net | — | — | 272 | 1,248 | 950 | ||||||||||||||
Total nonperforming assets | $ | 14,082 | $ | 5,481 | $ | 3,209 | $ | 5,039 | $ | 4,312 | |||||||||
Nonperforming assets to total assets | 0.75 | % | 0.31 | % | 0.20 | % | 0.38 | % | 0.39 | % | |||||||||
Nonperforming loans to total loans | 0.88 | % | 0.36 | % | 0.22 | % | 0.33 | % | 0.36 | % | |||||||||
Total past due loans to total loans | 0.78 | % | 1.67 | % | 0.47 | % | 0.51 | % | 0.86 | % | |||||||||
Nonperforming assets totaled $14.1 million and represented 0.75% of total assets at December 31, 2018, compared to $5.5 million and 0.31% of total assets at December 31, 2017.
Nonperforming loans totaled $14.1 million at December 31, 2018, an increase of $8.6 million from December 31, 2017. There was no foreclosed real estate on the balance sheet at December 31, 2018 or 2017.
45
Nonaccrual Loans. Loans greater than 90 days past due are put on nonaccrual status (excluding certain acquired credit impaired loans). Loans are also placed on nonaccrual status when, in the opinion of management, full collection of principal and interest is doubtful. Interest previously accrued, but uncollected, is reversed against current period income. Subsequent payments are recognized on a cash basis or principal recapture basis depending on a number of factors including probability of collection and if impairment is identified. A nonaccrual loan is restored to accrual status when it is no longer delinquent and collectability of interest and principal is no longer in doubt. At December 31, 2018 and 2017, there were no commitments to lend additional funds to any borrower on nonaccrual status.
Past Due Loans. When a loan is 15 days past due, the Company sends the borrower a late notice. The Company also attempts to contact the borrower by phone if the delinquency is not corrected promptly after the notice has been sent. When the loan is 30 days past due, the Company mails the borrower a letter reminding the borrower of the delinquency, and attempts to contact the borrower personally to determine the reason for the delinquency and ensure the borrower understands the terms of the loan. If necessary, starting on the 90th day of delinquency, the Company may take other appropriate legal action. A summary report of all loans 30 days or more past due is provided to the Board of Directors of the Company periodically. Loans greater than 90 days past due are generally put on nonaccrual status. A nonaccrual loan is restored to accrual status when it is no longer delinquent and collectability of interest and principal is no longer in doubt. A loan is considered to be no longer delinquent when timely payments are made for a period of at least six months (one year for loans providing for quarterly or semi-annual payments) by the borrower in accordance with the contractual terms.
The following table presents past due loans as of December 31, 2018 and 2017:
30–59 Days Past Due | 60–89 Days Past Due | 90 Days or Greater Past Due | Total Past Due | ||||||||||||
(In thousands) | |||||||||||||||
As of December 31, 2018 | |||||||||||||||
Residential real estate | $ | 994 | $ | — | $ | 2,203 | $ | 3,197 | |||||||
Commercial real estate | 668 | 133 | 4,386 | 5,187 | |||||||||||
Commercial business | — | 1 | 4,076 | 4,077 | |||||||||||
Total loans | $ | 1,662 | $ | 134 | $ | 10,665 | $ | 12,461 | |||||||
As of December 31, 2017 | |||||||||||||||
Residential real estate | $ | 1,248 | $ | 2,244 | $ | 1,161 | $ | 4,653 | |||||||
Commercial real estate | 10,028 | 4,116 | 2,074 | 16,218 | |||||||||||
Commercial business | 4,318 | 162 | 481 | 4,961 | |||||||||||
Consumer | 3 | — | 2 | 5 | |||||||||||
Total loans | $ | 15,597 | $ | 6,522 | $ | 3,718 | $ | 25,837 | |||||||
Total delinquencies decreased $13.4 million from December 31, 2017 to December 31, 2018. The decrease in delinquencies is primarily related to a delinquent loan payoff totaling $4.1 million, which occurred in the second quarter of 2018 and a $6.2 million charge-off recognized in the fourth quarter of 2018 attributable to one lending relationship.
Troubled Debt Restructurings (TDR). Loans are considered restructured in a troubled debt restructuring when the borrower is experiencing financial difficulties and the Bank has granted concessions to a borrower due to the borrower’s financial condition that we otherwise would not have considered. These concessions may include modifications of the terms of the debt such as reduction of the stated interest rate other than normal market rate adjustments, extension of maturity dates, or reduction of principal balance or accrued interest. The decision to restructure a loan, rather than aggressively enforcing the collection of the loan, may benefit us by increasing the ultimate probability of collection.
Restructured loans are classified as accruing or non-accruing based on management’s assessment of the collectability of the loan. Loans which are already on nonaccrual status at the time of the restructuring generally remain on nonaccrual status for approximately six months before management considers such loans for return to accruing status. Accruing restructured loans are placed into nonaccrual status if and when the borrower fails to comply with the restructured terms and management deems it unlikely that the borrower will return to a status of compliance in the near term. At December 31, 2018 and December 31, 2017 there were six non-accrual loans identified as TDRs totaling $3.6 million and four non-accrual loans identified as TDRs totaling $0.6 million, respectively.
46
The following table presents information on troubled debt restructured loans:
At December 31, | |||||||||||||||||||
2018 | 2017 | 2016 | 2015 | 2014 | |||||||||||||||
(In thousands) | |||||||||||||||||||
Accruing troubled debt restructured loans: | |||||||||||||||||||
Residential real estate | $ | 2,722 | $ | 2,957 | $ | 69 | $ | 944 | $ | 2,057 | |||||||||
Commercial real estate | 37 | 51 | 402 | 4,518 | 216 | ||||||||||||||
Commercial business | 923 | 1,346 | 893 | 779 | 1,338 | ||||||||||||||
Accruing troubled debt restructured loans | 3,682 | 4,354 | 1,364 | 6,241 | 3,611 | ||||||||||||||
Nonaccrual troubled debt restructured loans: | |||||||||||||||||||
Residential real estate | $ | 3,008 | $ | — | $ | — | $ | — | $ | — | |||||||||
Commercial real estate | 334 | 334 | — | 970 | — | ||||||||||||||
Commercial business | 217 | 219 | 66 | 90 | — | ||||||||||||||
Nonaccrual troubled debt restructured loans | 3,559 | 553 | 66 | 1,060 | — | ||||||||||||||
Total troubled debt restructured loans | $ | 7,241 | $ | 4,907 | $ | 1,430 | $ | 7,301 | $ | 3,611 | |||||||||
As of December 31, 2018 and 2017, loans classified as troubled debt restructurings totaled $7.2 million and $4.9 million, respectively. The $7.2 million balance at December 31, 2018 consisted of 14 loans. The $4.9 million balance at December 31, 2017 consisted of 15 loans.
Potential Problem Loans. We classify certain loans as “special mention”, “substandard”, or “doubtful”, based on criteria consistent with guidelines provided by our banking regulators. Potential problem loans represent loans that are currently performing, but for which known information about possible credit problems of the related borrowers causes management to have doubts as to the ability of such borrowers to comply with the present loan repayment terms and which may result in disclosure of such loans as nonperforming at some time in the future. These loans are not included in the amounts of nonaccrual or restructured loans presented above. We cannot predict the extent to which economic conditions or other factors may impact borrowers and the potential problem loans. Accordingly, there can be no assurance that other loans will not become 90 days or more past due, be placed on nonaccrual, become restructured, or require increased allowance coverage and provision for loan losses. Potential problem loans are assessed for loss exposure using the methods described in Note 5 to our Consolidated Financial Statements under the caption “Credit Quality Indicators”.
We expect the levels of nonperforming assets and potential problem loans to fluctuate in response to changing economic and market conditions, and the relative sizes of the respective loan portfolios, along with our degree of success in resolving problem assets. We take a proactive approach with respect to the identification and resolution of problem loans.
Allowance for Loan Losses
We evaluate the adequacy of the allowance at least quarterly, and in determining our allowance for loan losses, we estimate losses on specific loans, or groups of loans, where the probable loss can be identified and reasonably determined. The balance of our allowance for loan losses is based on internally assigned risk classifications of loans, the Bank’s and peer banks’ historical loss experience, changes in the nature of the loan portfolio, overall portfolio quality, industry concentrations, delinquency trends, current economic factors and the estimated impact of current economic conditions on certain historical loan loss rates. See additional discussion regarding our allowance for loan losses under the caption “Critical Accounting Policies and Estimates.”
Our general practice is to identify problem credits early and recognize full or partial charge-offs as promptly as practicable when it is determined that it is probable that the loan will not be repaid according to its original contractual terms, including principal and interest. Full or partial charge-offs on collateral dependent impaired loans are recognized when the collateral is deemed to be insufficient to support the carrying value of the loan. We do not recognize a recovery when an updated appraisal indicates a subsequent increase in value of the collateral.
Our charge-off policies, which comply with standards established by our banking regulators, are consistently applied from period to period. Charge-offs are recorded on a monthly basis, as incurred. Partially charged-off loans continue to be evaluated on a monthly basis and additional charge-offs or loan loss provisions may be recorded on the remaining loan balance based on the same criteria.
47
The following table presents the activity in our allowance for loan losses and related ratios:
At December 31, | |||||||||||||||||||
2018 | 2017 | 2016 | 2015 | 2014 | |||||||||||||||
(Dollars in thousands) | |||||||||||||||||||
Balance at beginning of period | $ | 18,904 | $ | 17,982 | $ | 14,169 | $ | 10,860 | $ | 8,382 | |||||||||
Charge-offs: | |||||||||||||||||||
Residential real estate | (420 | ) | — | — | — | — | |||||||||||||
Commercial real estate | (5,614 | ) | — | — | — | — | |||||||||||||
Construction | — | — | (7 | ) | — | (100 | ) | ||||||||||||
Commercial business | (815 | ) | (521 | ) | (69 | ) | (15 | ) | — | ||||||||||
Consumer | (77 | ) | (51 | ) | (35 | ) | (15 | ) | (3 | ) | |||||||||
Total charge-offs | (6,926 | ) | (572 | ) | (111 | ) | (30 | ) | (103 | ) | |||||||||
Recoveries: | |||||||||||||||||||
Residential real estate | — | 146 | — | — | — | ||||||||||||||
Commercial real estate | 18 | — | — | — | — | ||||||||||||||
Consumer | 7 | 3 | 10 | 9 | 425 | ||||||||||||||
Commercial Business | 19 | 4 | — | 100 | 4 | ||||||||||||||
Total recoveries | 44 | 153 | 10 | 109 | 429 | ||||||||||||||
Net (charge-offs) recoveries | (6,882 | ) | (419 | ) | (101 | ) | 79 | 326 | |||||||||||
Provision charged to earnings | 3,440 | 1,341 | 3,914 | 3,230 | 2,152 | ||||||||||||||
Balance at end of period | $ | 15,462 | $ | 18,904 | $ | 17,982 | $ | 14,169 | $ | 10,860 | |||||||||
Net charge-offs (recoveries) to average loans | 0.44 | % | 0.03 | % | 0.01 | % | (0.01 | )% | (0.05 | )% | |||||||||
Allowance for loan losses to total loans | 0.96 | % | 1.23 | % | 1.32 | % | 1.23 | % | 1.17 | % | |||||||||
At December 31, 2018, our allowance for loan losses was $15.5 million and represented 0.96% of total loans, compared to $18.9 million and 1.23% of total loans at December 31, 2017. The decrease in the ratio of allowance for loan losses to total loans is driven by improving historical loss trends and a charge-off in the fourth quarter of 2018 of a previously partially reserved loan. For the years ended December 31, 2018, 2017 and 2016, the provision for loan losses charged to earnings totaled $3.4 million, $1.3 million and $3.9 million, respectively. Net charge-offs for the year ended December 31, 2018 were $6.9 million and represented 0.44% of average loans, primarily reflecting $5.6 million of net charge-offs of commercial real estate loans. For the year ended December 31, 2017, net charge-offs were $0.4 million and represented 0.03% of average loans, primarily reflecting $0.5 million of charge-offs of commercial business loans.
The carrying amount of total impaired loans at December 31, 2018 was $19.1 million. This compares to a carrying amount of $14.9 million for total impaired loans at December 31, 2017. The amount of allowance for loan losses related to impaired loans was $0.4 million and $1.0 million, respectively, at December 31, 2018 and 2017.
The following tables present the allocation of the allowance for loan losses and the percentage of the related loan segments to total loans:
At December 31, | ||||||||||||||||||||
2018 | 2017 | 2016 | ||||||||||||||||||
Amount | Percent of Loan Portfolio | Amount | Percent of Loan Portfolio | Amount | Percent of Loan Portfolio | |||||||||||||||
(Dollars in thousands) | ||||||||||||||||||||
Residential real estate | $ | 857 | 11.10 | % | $ | 1,721 | 12.54 | % | $ | 1,802 | 14.33 | % | ||||||||
Commercial real estate | 11,562 | 68.18 | 12,777 | 63.98 | 9,415 | 61.89 | ||||||||||||||
Construction | 140 | 4.56 | 907 | 6.59 | 2,105 | 7.86 | ||||||||||||||
Commercial business | 2,902 | 16.14 | 3,498 | 16.85 | 4,283 | 15.81 | ||||||||||||||
Consumer | 1 | 0.02 | 1 | 0.04 | 377 | 0.11 | ||||||||||||||
Total allowance for loan losses | $ | 15,462 | 100.00 | % | $ | 18,904 | 100.00 | % | $ | 17,982 | 100.00 | % | ||||||||
48
At December 31, | |||||||||||||
2015 | 2014 | ||||||||||||
Amount | Percent of Loan Portfolio | Amount | Percent of Loan Portfolio | ||||||||||
(Dollars in thousands) | |||||||||||||
Residential real estate | $ | 1,618 | 16.83 | % | $ | 1,636 | 20.78 | % | |||||
Commercial real estate | 7,705 | 60.79 | 5,480 | 56.06 | |||||||||
Construction | 1,504 | 7.17 | 1,102 | 6.80 | |||||||||
Commercial business | 3,334 | 15.06 | 2,638 | 16.05 | |||||||||
Consumer | 8 | 0.15 | 4 | 0.31 | |||||||||
Total allowance for loan losses | $ | 14,169 | 100.00 | % | $ | 10,860 | 100.00 | % | |||||
The allocation of the allowance for loan losses at December 31, 2018 reflects our assessment of credit risk and probable loss within each portfolio. We believe that the level of the allowance for loan losses at December 31, 2018 is appropriate to cover probable losses.
Investment Securities
We manage our investment securities portfolio to provide a readily available source of liquidity for balance sheet management, to generate interest income and to implement interest rate risk management strategies. Investments are designated as either marketable equity, available for sale, held to maturity or trading securities at the time of purchase. We do not currently maintain a portfolio of trading securities. Investment securities available for sale may be sold in response to changes in market conditions, prepayment risk, rate fluctuations, liquidity, or capital requirements. Investment securities available for sale are reported at fair value, with any unrealized gains and losses excluded from earnings and reported as a separate component of shareholders’ equity, net of tax, until realized. Investment securities held to maturity are reported at amortized cost. Marketable equity securities are reported at fair value, with any changes in fair value recognized in earnings.
The amortized cost and fair value of investment securities as of the dates indicated are presented in the following table:
At December 31, | |||||||||||||||||||||||
2018 | 2017 | 2016 | |||||||||||||||||||||
Amortized Cost | Fair Value | Amortized Cost | Fair Value | Amortized Cost | Fair Value | ||||||||||||||||||
(In thousands) | |||||||||||||||||||||||
Marketable equity securities | $ | 2,003 | $ | 2,009 | $ | — | $ | — | $ | — | $ | — | |||||||||||
Securities available for sale: | |||||||||||||||||||||||
U.S. Government and agency obligations | 83,815 | 82,136 | 73,024 | 72,774 | 62,457 | 62,698 | |||||||||||||||||
State agency and municipal obligations | 4,023 | 4,007 | 11,959 | 12,277 | 14,495 | 14,763 | |||||||||||||||||
Corporate bonds | 7,061 | 7,011 | 7,096 | 7,137 | 10,167 | 10,290 | |||||||||||||||||
Total securities available for sale | $ | 94,899 | $ | 93,154 | $ | 92,079 | $ | 92,188 | $ | 87,119 | $ | 87,751 | |||||||||||
Securities held to maturity: | |||||||||||||||||||||||
State agency and municipal obligations | 20,328 | 20,890 | 20,465 | 21,717 | 15,710 | 15,710 | |||||||||||||||||
Corporate bonds | 1,000 | 1,000 | 1,000 | 995 | 1,000 | 977 | |||||||||||||||||
Government mortgage-backed securities | 93 | 98 | 114 | 124 | 149 | 164 | |||||||||||||||||
Total securities held to maturity | $ | 21,421 | $ | 21,988 | $ | 21,579 | $ | 22,836 | $ | 16,859 | $ | 16,851 | |||||||||||
At December 31, 2018, the carrying value of our investment securities portfolio totaled $116.6 million and represented 6% of total assets, compared to $113.8 million and 6% of total assets at December 31, 2017. This increase of $2.8 million primarily reflects additional investments in line with our overall balance sheet growth.
The net unrealized loss position on our investment portfolio at December 31, 2018 was $1.2 million and included gross unrealized losses of $1.9 million. The net unrealized gain position on our investment portfolio at December 31, 2017 was $1.4 million and included gross unrealized losses $0.3 million. The gross unrealized losses at December 31, 2018 and 2017 were concentrated in U.S. Government and agency obligations and state agency and municipal obligations. At December 31, 2018, we determined that there had been no deterioration in credit quality subsequent to purchase and believe that all unrealized losses are temporary. All of our investment securities are rated investment grade or deemed to be of investment grade quality.
49
The following tables summarize the amortized cost and weighted average yield of securities in our investment securities portfolio as of December 31, 2018 and 2017, based on remaining period to contractual maturity. Information for mortgage-backed securities is based on the final contractual maturity dates without considering repayments and prepayments.
Due Within 1 Year | Due 1–5 Years | Due 5–10 Years | Due After 10 Years | ||||||||||||||||||||||||
At December 31, 2018 | Amortized Cost | Yield | Amortized Cost | Yield | Amortized Cost | Yield | Amortized Cost | Yield | |||||||||||||||||||
(Dollars In thousands) | |||||||||||||||||||||||||||
Marketable equity securities | $ | — | — | % | $ | — | — | % | $ | — | — | % | $ | 2,003 | 2.09 | % | |||||||||||
Securities available for sale: | |||||||||||||||||||||||||||
U.S. Government and agency obligations | 1,000 | 1.40 | 12,025 | 1.94 | 100 | 2.50 | 70,690 | 2.60 | |||||||||||||||||||
State agency and municipal obligations | — | — | 2,234 | 2.36 | 1,261 | 3.43 | 528 | 2.82 | |||||||||||||||||||
Corporate bonds | — | — | 7,061 | 2.46 | — | — | — | — | |||||||||||||||||||
Total securities available for sale | $ | 1,000 | 1.40 | % | $ | 21,320 | 2.16 | % | $ | 1,361 | 3.36 | % | $ | 71,218 | 2.60 | % | |||||||||||
Securities held to maturity: | |||||||||||||||||||||||||||
State agency and municipal obligations | $ | 3,894 | 4.21 | % | $ | — | — | % | $ | — | — | % | $ | 16,434 | 5.06 | % | |||||||||||
Corporate bonds | 1,000 | 2.23 | — | — | — | — | — | — | |||||||||||||||||||
Government mortgage-backed securities | — | — | — | — | — | — | 93 | 5.35 | |||||||||||||||||||
Total securities held to maturity | $ | 4,894 | 3.81 | % | $ | — | — | % | $ | — | — | % | $ | 16,527 | 5.06 | % | |||||||||||
Due Within 1 Year | Due 1–5 Years | Due 5–10 Years | Due After 10 Years | ||||||||||||||||||||||||
At December 31, 2017 | Amortized Cost | Yield | Amortized Cost | Yield | Amortized Cost | Yield | Amortized Cost | Yield | |||||||||||||||||||
(Dollars In thousands) | |||||||||||||||||||||||||||
Securities available for sale: | |||||||||||||||||||||||||||
U.S. Government and agency obligations | $ | — | —% | $ | 13,000 | 1.90 | % | $ | 100 | 2.50 | % | $ | 59,924 | 2.48 | % | ||||||||||||
State agency and municipal obligations | — | — | 2,873 | 2.70 | 7,386 | 3.54 | 1,700 | 3.36 | |||||||||||||||||||
Corporate bonds | — | — | 7,096 | 2.46 | — | — | — | — | |||||||||||||||||||
Total securities available for sale | $ | — | —% | $ | 22,969 | 2.17 | % | $ | 7,486 | 3.53 | % | $ | 61,624 | 2.50 | % | ||||||||||||
Securities held to maturity: | |||||||||||||||||||||||||||
State agency and municipal obligations | $ | 198 | 4.90 | % | $ | 3,880 | 4.08 | % | $ | — | —% | $ | 16,387 | 5.03 | % | ||||||||||||
Corporate bonds | — | — | 1,000 | 2.23 | — | — | — | — | |||||||||||||||||||
Government mortgage-backed securities | — | — | — | — | — | — | 114 | 5.35 | |||||||||||||||||||
Total securities held to maturity | $ | 198 | 4.90 | % | $ | 4,880 | 3.70 | % | $ | — | —% | $ | 16,501 | 5.04 | % | ||||||||||||
Bank Owned Life Insurance or BOLI
BOLI amounted to $40.7 million as of December 31, 2018. The purchase of life insurance policies results in an income-earning asset on our consolidated balance sheet that provides monthly tax-free income to us. We expect to benefit from the BOLI contracts as a result of the tax-free growth in cash surrender value and death benefits that are expected to be generated over time. BOLI is included in our Consolidated Balance Sheets at its cash surrender value. Increases in the cash surrender value are reported as a component of noninterest income in our Consolidated Statements of Income.
50
Deposit Activities and Other Sources of Funds
Our sources of funds include deposits, brokered certificates of deposit, FHLB borrowings, subordinated debt and proceeds from the sales, maturities and payments of loans and investment securities.
Total deposits represented 80% of our total assets at December 31, 2018. While scheduled loan and securities repayments are a relatively stable source of funds, loan and investment security prepayments and deposit inflows are influenced by prevailing interest rates and local economic conditions and are inherently uncertain.
Deposits
We offer a wide variety of deposit products and rates to consumer and business customers consistent with FDIC regulations. Our pricing committee meets regularly to determine pricing and marketing initiatives. In addition to being an important source of funding for us, deposits also provide an ongoing stream of fee revenue.
We participate in the Certificate of Deposit Account Registry Service, or CDARS, program. We use CDARS to place customer funds into certificate of deposit accounts issued by other participating banks. These transactions occur in amounts that are less than FDIC insurance limits to ensure that deposit customers are eligible for FDIC insurance on the full amount of their deposits. Reciprocal amounts of deposits are received from other participating banks that do the same with their customer deposits, and, we also execute one-way buy transactions. CDARS deposits are considered to be brokered deposits for bank regulatory purposes.
Time deposits may also be generated through the use of a listing service. We subscribe to a listing service, accessible to financial institutions, in which we may advertise our time deposit rates in exchange for a set subscription fee. Interested financial institutions then contact us directly to acquire a time certificate of deposit. There is no third party brokerage service involved in this transaction.
The following table sets forth the composition of our deposits for the dates indicated:
At December 31, | |||||||||||||||||||
2018 | 2017 | ||||||||||||||||||
Amount | Percent | Weighted Average Rate | Amount | Percent | Weighted Average Rate | ||||||||||||||
(Dollars in thousands) | |||||||||||||||||||
Noninterest-bearing demand | $ | 173,198 | 11.53 | % | —% | $ | 172,638 | 12.35 | % | —% | |||||||||
NOW | 61,869 | 4.12 | 0.26 | 58,942 | 4.21 | 0.16 | |||||||||||||
Money market | 471,968 | 31.42 | 1.33 | 451,804 | 32.31 | 0.85 | |||||||||||||
Savings | 180,487 | 12.01 | 1.33 | 83,758 | 5.99 | 0.74 | |||||||||||||
Time | 614,722 | 40.92 | 1.73 | 631,263 | 45.14 | 1.33 | |||||||||||||
Total deposits | $ | 1,502,244 | 100.00 | % | 1.47 | % | $ | 1,398,405 | 100.00 | % | 1.06 | % | |||||||
Total deposits were $1.5 billion at December 31, 2018, an increase of $103.8 million, or 7%, from December 31, 2017.
During 2018, money market accounts increased by $20.2 million, or 4%, reflecting rate promotions for money market accounts. Noninterest bearing demand deposits increased by $0.6 million, or 0.3%, and NOW accounts increased $2.9 million, or 5%. Savings accounts were $180.5 million at December 31, 2018, up by $96.7 million, or 115%, from December 31, 2017. Time deposits decreased by $16.5 million, or 3%, from year-end 2017. Time deposits were $614.7 million at December 31, 2018 compared to $631.3 million at December 31, 2017.
51
At December 31, 2018 and 2017, time deposits, including CDARS and brokered deposits, with a denomination of $100 thousand or more totaled $493.8 million and $507.5 million, respectively, maturing during the periods indicated in the table below:
At December 31, | |||||||
2018 | 2017 | ||||||
(Dollars in thousands) | |||||||
Maturing: | |||||||
Within 3 months | $ | 107,516 | $ | 63,575 | |||
After 3 but within 6 months | 136,494 | 114,511 | |||||
After 6 months but within 1 year | 102,722 | 149,782 | |||||
After 1 year | 147,062 | 179,655 | |||||
Total | $ | 493,794 | $ | 507,523 | |||
The Bank is a member of the FHLB, which is part of a twelve district Federal Home Loan Bank System. Members are required to own capital stock of the FHLB, and borrowings are collateralized by qualifying assets not otherwise pledged (principally single-family residential mortgage loans and securities). The maximum amount of credit that the FHLB will extend varies from time to time, depending on its policies and the amount of qualifying collateral the member can pledge. The Bank had satisfied its collateral requirement at December 31, 2018.
We utilize advances from the FHLB as part of our overall funding strategy, to meet short-term liquidity needs and to a lesser degree manage interest rate risk arising from the difference in asset and liability maturities. Total FHLB advances were $160.0 million at December 31, 2018 compared to $199.0 million at December 31, 2017. The decrease of $39.0 million reflects normal fluctuations in our borrowings.
Advances from the FHLB include short-term advances with original maturity dates of one year or less. The following table sets forth certain information concerning short-term FHLB advances as of and for the periods indicated in the following table:
Year Ended December 31, | |||||||||||
2018 | 2017 | 2016 | |||||||||
(Dollars in thousands) | |||||||||||
As of and for the period ending: | |||||||||||
Average amount outstanding during the period | $ | 163,419 | $ | 144,800 | $ | 114,426 | |||||
Amount outstanding at end of period | 135,000 | 174,000 | 135,000 | ||||||||
Highest month end balance during the period | 174,000 | 175,000 | 150,000 | ||||||||
Weighted average interest rate at end of period | 2.55 | % | 1.44 | % | 0.73 | % | |||||
Weighted average interest rate during the period | 1.76 | % | 1.54 | % | 0.69 | % | |||||
The table above includes short term borrowings in a hedging relationship and excludes one long term FHLB advance of $25 million maturing in 2020.
On August 19, 2015, the Company completed a private placement of $25.5 million in aggregate principal amount of fixed rate subordinated notes (the “Notes”) to certain institutional investors. The Notes are non-callable for five years, have a stated maturity of August 15, 2025, and bear interest at a quarterly pay fixed rate of 5.75% per annum to the maturity date or the early redemption date (August 2020 and annually thereafter).
Derivative Instruments
The Company uses interest rate swap instruments to fix the interest rate on short term FHLB borrowings or Brokered CDs, all of which are designated as cash flow hedges. The hedge strategy converts the rate of interest on short term rolling FHLB advances or Brokered CDs to long term fixed interest rates, thereby protecting the Bank from interest rate variability. At December 31, 2018, the Company held derivative financial instruments with a total notional amount of $225.0 million.
52
Information about derivative instruments at December 31, 2018 and 2017 was as follows:
December 31, 2018:
Notional Amount | Original Maturity | Received | Paid | Fair Value Asset (Liability) | |||||||||
(Dollars in thousands) | |||||||||||||
Cash flow hedge: | |||||||||||||
Interest rate swap | $ | 25,000 | 4.7 years | 3-month LIBOR | 1.62% | $ | 1 | ||||||
Interest rate swap | 25,000 | 5.0 years | 3-month LIBOR | 1.83% | 220 | ||||||||
Interest rate swap | 25,000 | 5.0 years | 3-month LIBOR | 1.48% | 475 | ||||||||
Interest rate swap | 25,000 | 5.0 years | 3-month LIBOR | 1.22% | 828 | ||||||||
Interest rate swap | 25,000 | 7.0 years | 3-month LIBOR | 2.04% | 675 | ||||||||
Interest rate swap | 25,000 | 7.0 years | 3-month LIBOR | 2.04% | 668 | ||||||||
Forward-starting interest rate swap(1) | 25,000 | 15.0 years | 3-month LIBOR | 3.01% | (807 | ) | |||||||
Forward-starting interest rate swap(1) | 25,000 | 15.0 years | 3-month LIBOR | 3.03% | (819 | ) | |||||||
Forward-starting interest rate swap(1) | 25,000 | 15.0 years | 3-month LIBOR | 3.05% | (811 | ) | |||||||
$ | 225,000 | $ | 430 | ||||||||||
(1) The effective date of the forward-starting interest rate swaps listed above are January 2, 2019, January 2, 2020 and August 26, 2020, respectively.
December 31, 2017:
Notional Amount | Original Maturity | Received | Paid | Fair Value Asset (Liability) | |||||||||
(Dollars in thousands) | |||||||||||||
Cash flow hedge: | |||||||||||||
Interest rate swap | $ | 25,000 | 4.7 years | 3-month LIBOR | 1.62% | $ | 62 | ||||||
Interest rate swap | 25,000 | 5.0 years | 3-month LIBOR | 1.83% | 105 | ||||||||
Interest rate swap | 25,000 | 5.0 years | 3-month LIBOR | 1.48% | 398 | ||||||||
Interest rate swap | 25,000 | 5.0 years | 3-month LIBOR | 1.22% | 793 | ||||||||
Interest rate swap | 25,000 | 7.0 years | 3-month LIBOR | 2.04% | 342 | ||||||||
Interest rate swap | 25,000 | 7.0 years | 3-month LIBOR | 2.04% | 334 | ||||||||
$ | 150,000 | $ | 2,034 | ||||||||||
53
Liquidity and Capital Resources
Liquidity Management
Liquidity is defined as the ability to generate sufficient cash flows to meet all present and future funding requirements at reasonable costs. Our primary source of liquidity is deposits. While our generally preferred funding strategy is to attract and retain low cost deposits, our ability to do so is affected by competitive interest rates and terms in the marketplace. Other sources of funding include discretionary use of purchased liabilities (e.g., FHLB term advances and other borrowings), cash flows from our investment securities portfolios, loan sales, loan repayments and earnings. Investment securities designated as available for sale may also be sold in response to short-term or long-term liquidity needs.
The Company’s liquidity position is monitored daily by management. The Asset Liability Committee, or ALCO, establishes guidelines to ensure maintenance of prudent levels of liquidity. ALCO reports to the Company’s Board of Directors.
The Bank has a detailed liquidity funding policy and a contingency funding plan that provide for the prompt and comprehensive response to unexpected demands for liquidity. We employ a stress testing methodology to estimate needs for contingent funding that could result from unexpected outflows of funds in excess of “business as usual” cash flows. The Bank has established unsecured borrowing capacity with the Atlantic Community Bankers Bank (ACBB) (formerly Bankers’ Bank Northeast), Zion’s Bank and Texas Capital Bank and also maintains additional collateralized borrowing capacity with the FHLB in excess of levels used in the ordinary course of business. Additional sources of liquidity include cash, unpledged investment securities and the brokered deposit market.
Capital Resources
Total shareholders’ equity was $174.2 million at December 31, 2018, compared to $161.0 million at December 31, 2017. The $13.2 million, or 8% increase, is primarily a result of net income for the year ended December 31, 2018 of $17.4 million, offset by dividends paid of $3.8 million and a $2.7 million impact to accumulated other comprehensive income driven by fair value marks related to hedge positions involving interest rate swaps. The ratio of total shareholders' equity to total assets was 9.30% at December 31, 2018, which compares to 8.96% at December 31, 2017. Tangible book value per common share at December 31, 2018 and 2017 was $22.06 and $20.59, respectively.
The Bank is subject to various regulatory capital requirements administered by the federal banking agencies. Failure to meet minimum capital requirements can initiate certain mandatory and possibly additional discretionary actions by regulators that, if undertaken, could have a direct material effect on the Company’s financial statements. At December 31, 2018, the Bank met all capital adequacy requirements to which it was subject and exceeded the regulatory minimum capital levels to be considered well-capitalized under the regulatory framework. At December 31, 2018, the Bank’s ratio of total common equity tier 1 capital to risk-weighted assets was 11.56%, total capital to risk-weighted assets was 12.50%, Tier 1 capital to risk-weighted assets was 11.56% and Tier 1 capital to average assets was 10.14%.
In July 2013, the Federal Reserve published Basel III rules establishing a new comprehensive capital framework of U.S. banking organizations. Under the rules, effective January 1, 2015 for the Company and Bank, the minimum capital ratios became a) 4.5% “Common Equity Tier 1” to risk-weighted assets, b) 6.0% Tier 1 capital to risk weighted assets and c) 8.0% total capital to risk-weighted assets. In addition, the new regulations imposed certain limitations on dividends, share buy-backs, discretionary payments on Tier 1 instruments and discretionary bonuses to executive officers if the organization does not maintain a capital conservation buffer for regulatory risk based capital ratios in an amount greater than 2.5% of its risk-weighted assets, in addition to the amount needed to meet its minimum risk-based capital requirements, phased in over a 5 year period until January 1, 2019. As of December 31, 2018, the conservation buffer to be added was 1.875%, increasing to 2.5% on January 1, 2019. The Company has met the increased capital requirements at December 31, 2018 and believes it is well positioned to meet the 2019 requirement.
On January 31, 2018, the Company’s Board of Directors declared a $0.12 per share cash dividend, payable March 8, 2018 to shareholders of record on February 26, 2018. On April 25, 2018, the Company’s Board of Directors declared a $0.12 per share cash dividend, payable May 25, 2018 to shareholders of record on May 15, 2018. On July 26, 2018, the Company’s Board of Directors declared a $0.12 per share cash dividend, payable August 27, 2017 to shareholders of record on August 17, 2018. On October 30, 2018, the Company’s Board of Directors declared a $0.12 per share cash dividend, payable November 26, 2018 to shareholders of record on November 16, 2018. We did not repurchase any of our common stock during the years ended December 31, 2018, 2017, or 2016.
54
Contractual Obligations
The following table summarizes our contractual obligations to make future payments as of December 31, 2018. Payments for borrowings do not include interest. Payments related to leases are based on actual payments specified in the underlying contracts.
Payments Due by Period | |||||||||||||||||||
Total | Less Than 1 Year | 1–3 Years | 4–5 Years | After 5 Years | |||||||||||||||
(in thousands) | |||||||||||||||||||
Contractual Obligations: | |||||||||||||||||||
FHLB advances | $ | 160,000 | $ | 135,000 | $ | 25,000 | $ | — | $ | — | |||||||||
Subordinated Debt | 25,500 | — | — | — | 25,500 | ||||||||||||||
Operating lease agreements | 23,703 | 1,972 | 3,581 | 2,252 | 15,898 | ||||||||||||||
Time deposits with stated maturity dates | 614,722 | 411,818 | 202,067 | 837 | — | ||||||||||||||
Total contractual obligations | $ | 823,925 | $ | 548,790 | $ | 230,648 | $ | 3,089 | $ | 41,398 | |||||||||
Off-Balance Sheet Instruments
In the normal course of business, we are a party to financial instruments with off-balance sheet risk to meet the financing needs of our customers. These financial instruments include commitments to extend credit and involve, to varying degrees, elements of credit and interest rate risk in excess of the amounts recognized in the financial statements. The contractual amounts of these instruments reflect the extent of involvement we have in particular classes of financial instruments.
We enter into contractual commitments to extend credit, normally with fixed expiration dates or termination clauses, at specified rates and for specific purposes. Substantially all of the Bank’s commitments to extend credit are contingent upon customers maintaining specific credit standards at the time of loan funding. The Bank minimizes its exposure to loss under these commitments by subjecting them to credit approval and monitoring procedures.
Commitments to extend credit totaled $266.3 million and $200.3 million, respectively at December 31, 2018 and 2017. The following table summarizes our commitments to extend credit as of the dates indicated. Since commitments associated with letters of credit and commitments to extend credit may expire unused, the amounts shown do not necessarily reflect the actual future cash funding requirements. In addition, borrowers may be required to meet certain performance requirements to continue to draw on these commitments. We manage our liquidity in light of the aggregate amounts of commitments to extend credit and outstanding standby letters of credit in effect from time to time to ensure that we will have adequate sources of liquidity to fund such commitments and honor drafts under such letters of credit.
As of December 31, 2018
Amount of Commitment Expiration per Period | |||||||||||||||||||
Total | Less Than 1 Year | 1–3 Years | 4–5 Years | After 5 Years | |||||||||||||||
(in thousands) | |||||||||||||||||||
Other Commitments: | |||||||||||||||||||
Loan commitments | $ | 190,661 | $ | 100,119 | $ | 37,167 | $ | 23,731 | $ | 29,644 | |||||||||
Undisbursed construction loans | 68,151 | 6,906 | 17,652 | 23,328 | 20,265 | ||||||||||||||
Unused home equity lines of credit | 7,445 | 519 | 578 | 210 | 6,138 | ||||||||||||||
Total other commitments | $ | 266,257 | $ | 107,544 | $ | 55,397 | $ | 47,269 | $ | 56,047 | |||||||||
55
As of December 31, 2017
Amount of Commitment Expiration per Period | |||||||||||||||||||
Total | Less Than 1 Year | 1–3 Years | 4–5 Years | After 5 Years | |||||||||||||||
(in thousands) | |||||||||||||||||||
Other Commitments: | |||||||||||||||||||
Loan commitments | $ | 112,649 | $ | 39,298 | $ | 35,372 | $ | 3,708 | $ | 34,271 | |||||||||
Undisbursed construction loans | 80,064 | 17,569 | 6,441 | 24,876 | 31,178 | ||||||||||||||
Unused home equity lines of credit | 7,573 | 365 | 295 | 343 | 6,570 | ||||||||||||||
Total other commitments | $ | 200,286 | $ | 57,232 | $ | 42,108 | $ | 28,927 | $ | 72,019 | |||||||||
Recently Issued Accounting Pronouncements
See Note 1 to our Consolidated Financial Statements for details of recently issued accounting pronouncements and their expected impact on our financial statements.
Item 7A. Quantitative and Qualitative Disclosures About Market Risk
Asset/Liability Management and Interest Rate Risk
We measure interest rate risk using simulation analysis to calculate earnings and equity at risk. These risk measures are quantified using simulation software from one of the leading firms in the field of asset/liability modeling. Key assumptions relate to the behavior of interest rates and spreads, prepayment speeds and the run-off of deposits. From such simulations, interest rate risk, or IRR, is quantified and appropriate strategies are formulated and implemented. We model IRR by using two primary risk measurement techniques: simulation of net interest income and simulation of economic value of equity. These two measurements are complementary and provide both short-term and long-term risk profiles for the Company. Because both baseline simulations assume that our balance sheet will remain static over the simulation horizon, the results do not reflect adjustments in strategy that ALCO could implement in response to rate shifts. The simulation analyses are updated quarterly.
We use net interest income at risk simulation to measure the sensitivity of net interest income to changes in market rates. This simulation captures underlying product behaviors, such as asset and liability repricing dates, balloon dates, interest rate indices and spreads, rate caps and floors, as well as other behavioral attributes. The simulation of net interest income also requires a number of key assumptions such as: (i) prepayment projections for loans and securities that are projected under each interest rate scenario using internal and external mortgage analytics; (ii) new business loan rates that are based on recent new business origination experience; and (iii) deposit pricing assumptions for non-maturity deposits reflecting the Bank’s limited history, management judgment and core deposit studies. Combined, these assumptions can be inherently uncertain, and as a result, actual results may differ from simulation forecasts due to the timing, magnitude and frequency of interest rate changes, future business conditions, as well as unanticipated changes in management strategies.
We use two sets of standard scenarios to measure net interest income at risk. For the Parallel Ramp Scenarios, rate changes are ramped over a twelve-month horizon based upon a parallel yield curve shift and then maintained at those levels over the remainder of the simulation horizon. Parallel Shock Scenarios assume instantaneous parallel movements in the yield curve compared to a flat yield curve scenario. Simulation analysis involves projecting a future balance sheet structure and interest income and expense under the various rate scenarios. Internal policy regarding internal rate risk simulations currently specifies that for instantaneous parallel shifts of the yield curve, estimated net interest income at risk for the subsequent one-year period should not decline by more than: 6% for a 100 basis point shift; 12% for a 200 basis point shift; and 18% for a 300 basis point shift. Per Company policy, the Bank should not be outside these limits for twelve consecutive months unless the Banks forecasted capital ratios are considered to be "well capitalized". As of December 31, 2018, the Bank has met all minimum regulatory capital requirements to be considered "well capitalized".
The following tables set forth the estimated percentage change in our net interest income at risk over one-year simulation periods beginning December 31, 2018 and 2017:
56
Parallel Ramp
Estimated Percent Change in Net Interest Income | ||||||
At December 31, | ||||||
Rate Changes (basis points) | 2018 | 2017 | ||||
(100) | 3.50 | % | (2.00)% | |||
200 | (8.20 | ) | (4.30 | ) | ||
Parallel Shock
Estimated Percent Change in Net Interest Income | ||||||
At December 31, | ||||||
Rate Changes (basis points) | 2018 | 2017 | ||||
(100) | 5.20 | % | (4.70)% | |||
100 | (7.30 | ) | (3.40 | ) | ||
200 | (15.20 | ) | (7.30 | ) | ||
300 | (22.70 | ) | (11.50 | ) | ||
The net interest income at risk simulation results indicate that as of December 31, 2018, we remain liability sensitive. The liability sensitivity is due to the fact that there are more liabilities than assets subject to repricing as market rates change.
We conduct economic value of equity at risk simulation in tandem with net interest income simulations, to ascertain a longer term view of our interest rate risk position by capturing longer-term re-pricing risk and options risk embedded in the balance sheet. It measures the sensitivity of economic value of equity to changes in interest rates. Economic value of equity at risk simulation values only the current balance sheet and does not incorporate the growth assumptions used in one of the income simulations. As with the net interest income simulation, this simulation captures product characteristics such as loan resets, repricing terms, maturity dates, rate caps and floors. Key assumptions include loan prepayment speeds, deposit pricing elasticity and non-maturity deposit attrition rates. These assumptions can have significant impacts on valuation results as the assumptions remain in effect for the entire life of each asset and liability. All key assumptions are subject to a periodic review.
Base case economic value of equity at risk is calculated by estimating the net present value of all future cash flows from existing assets and liabilities using current interest rates. The base case scenario assumes that future interest rates remain unchanged. Internal policy for economic value of equity at risk simulations should not decline more than 10% for a 100 basis point shift; 20% for a 200 basis point shift; and 30% for a 300 basis point shift. Per Company policy, the Bank should not be outside these limits unless the Banks forecasted capital ratios are considered to be "well capitalized".
The following table sets forth the estimated percentage change in our economic value of equity at risk, assuming various shifts in interest rates:
Parallel Shock
Estimated Percent Change in Economic Value of Equity | ||||||
At December 31, | ||||||
Rate Changes (basis points) | 2018 | 2017 | ||||
(100) | 2.50% | (1.60)% | ||||
100 | (7.80 | ) | (10.10 | ) | ||
200 | (18.60 | ) | (22.90 | ) | ||
300 | (27.40 | ) | (32.80 | ) | ||
While ALCO reviews and updates simulation assumptions and also periodically back-tests the simulation results to ensure that the assumptions are reasonable and current, income simulation may not always prove to be an accurate indicator of interest rate risk or future net interest margin. Over time, the repricing, maturity and prepayment characteristics of financial instruments and the composition of our balance sheet may change to a different degree than estimated. Due to the low current level of market interest rates, the banking industry has experienced relatively strong growth in low-cost FDIC insured core deposits over the past several years. ALCO recognizes that a portion of these increased levels of low-cost balances could shift into higher yielding alternatives in the future, particularly if interest rates rise and as confidence in financial markets strengthens, and has modeled
57
increased amounts of deposit shifts out of these low-cost categories into higher-cost alternatives in the rising rate simulation scenarios presented above.
It should be noted that the static balance sheet assumption does not necessarily reflect our expectation for future balance sheet growth, which is a function of the business environment and customer behavior. Another significant simulation assumption is the sensitivity of core deposits to fluctuations in interest rates. Income simulation results assume that changes in both core savings deposit rates and balances are related to changes in short-term interest rates. Lastly, mortgage-backed securities and mortgage loans involve a level of risk that unforeseen changes in prepayment speeds may cause related cash flows to vary significantly in differing rate environments. Such changes could affect the level of reinvestment risk associated with cash flow from these instruments, as well as their market value. Changes in prepayment speeds could also increase or decrease the amortization of premium or accretion of discounts related to such instruments, thereby affecting interest income.
The Alternative Reference Rates Committee ("ARRC") has proposed that the Secured Overnight Funding Rate ("SOFR") replace USD-LIBOR. ARRC has proposed that the transition to SOFR from USD-LIBOR will take place by the end of 2021. The Company has material contracts that are indexed to USD-LIBOR. Industry organizations are currently working on the transition plan. The Company is currently monitoring this activity and evaluating the risks involved.
Impact of Inflation
Our financial statements and related data contained in this annual report have been prepared in accordance with GAAP, which require the measure of financial position and operating results in terms of historic dollars, without considering changes in the relative purchasing power of money over time due to inflation.
Inflation generally increases the costs of funds and operating overhead, and to the extent loans and other assets bear variable rates, the yields on such assets. Unlike most industrial companies, virtually all of the assets and liabilities of a financial institution are monetary in nature. As a result, interest rates generally have a more significant effect on the performance of a financial institution than the effects of general levels of inflation. In addition, inflation affects a financial institution’s cost of goods and services purchased, the cost of salaries and benefits, occupancy expense and similar items. Inflation and related increases in interest rates generally decrease the market value of investments and loans held and may adversely affect liquidity, earnings and shareholders’ equity.
58
Item 8. Financial Statements and Supplementary Data
The financial statements and supplementary data required by this item are presented in the order shown below:
Consolidated Statements of Comprehensive Income for the years ended December 31, 2018, 2017 and 2016
Consolidated Statements of Shareholders’ Equity for the years ended December 31, 2018, 2017 and 2016
59
Report of Independent Registered Public Accounting Firm
To the Shareholders and the Board of Directors
Bankwell Financial Group, Inc.
Opinion on the Financial Statements
We have audited the accompanying consolidated balance sheets of Bankwell Financial Group, Inc. and its subsidiaries (the Company) as of December 31, 2018 and 2017, the related consolidated statements of income, comprehensive income, shareholders’ equity and cash flows for each of the two years in the period ended December 31, 2018, and the related notes to the consolidated financial statements (collectively, the financial statements). In our opinion, the financial statements present fairly, in all material respects, the financial position of the Company as of December 31, 2018 and 2017, and the results of its operations and its cash flows for each of the two years in the period ended December 31, 2018, in conformity with accounting principles generally accepted in the United States of America.
Basis for Opinion
These financial statements are the responsibility of the Company’s management. Our responsibility is to express an opinion on the Company’s financial statements based on our audits. We are a public accounting firm registered with the Public Company Accounting Oversight Board (United States) (PCAOB) and are required to be independent with respect to the Company in accordance with U.S. federal securities laws and the applicable rules and regulations of the Securities and Exchange Commission and the PCAOB.
We conducted our audits in accordance with the standards of the PCAOB. Those standards require that we plan and perform the audit to obtain reasonable assurance about whether the financial statements are free of material misstatement, whether due to error or fraud. The Company is not required to have, nor were we engaged to perform, an audit of its internal control over financial reporting. As part of our audits, we are required to obtain an understanding of internal control over financial reporting but not for expressing an opinion on the effectiveness of the Company’s internal control over financial reporting. Accordingly, we express no such opinion.
Our audits included performing procedures to assess the risks of material misstatement of the financial statements, whether due to error or fraud, and performing procedures that respond to those risks. Such procedures included examining, on a test basis, evidence regarding the amounts and disclosures in the financial statements. Our audits also included evaluating the accounting principles used and significant estimates made by management, as well as evaluating the overall presentation of the financial statements. We believe that our audits provide a reasonable basis for our opinion.
/s/ RSM US LLP
We have served as the Company's auditor since 2017.
New Haven, Connecticut
March 4, 2019
60
Report of Independent Registered Public Accounting Firm
To the Board of Directors and Shareholders of
Bankwell Financial Group, Inc. and Subsidiary
We have audited the accompanying consolidated statements of income, comprehensive income, changes in shareholders’ equity, and cash flows of Bankwell Financial Group, Inc. and subsidiary (the “Company”) for the year ended December 31, 2016. The Company’s management is responsible for these consolidated financial statements. Our responsibility is to express an opinion on these consolidated financial statements based on our audit.
We conducted our audit in accordance with the standards of the Public Company Accounting Oversight Board (United States). Those standards require that we plan and perform the audit to obtain reasonable assurance about whether the financial statements are free of material misstatement. The Company is not required to have, nor were we engaged to perform, an audit of its internal control over financial reporting. Our audit included consideration of internal control over financial reporting as a basis for designing audit procedures that are appropriate in the circumstances, but not for the purpose of expressing an opinion on the effectiveness of the Company’s internal control over financial reporting. Accordingly, we express no such opinion. An audit also includes examining, on a test basis, evidence supporting the amounts and disclosures in the consolidated financial statements, assessing the accounting principles used and significant estimates made by management, as well as evaluating the overall financial statement presentation. We believe that our audit provides a reasonable basis for our opinion.
In our opinion, the consolidated financial statements referred to above present fairly, in all material respects, the results of operations and cash flows of Bankwell Financial Group, Inc. and subsidiary for the year ended December 31, 2016, in conformity with accounting principles generally accepted in the United States of America.
/s/ Whittlesey PC
Hartford, Connecticut
March 9, 2017
61
Bankwell Financial Group, Inc.
Consolidated Balance Sheets
(In thousands, except share data)
December 31, | |||||||
2018 | 2017 | ||||||
ASSETS | |||||||
Cash and due from banks | $ | 75,411 | $ | 70,545 | |||
Federal funds sold | 2,701 | 186 | |||||
Cash and cash equivalents | 78,112 | 70,731 | |||||
Investment securities | |||||||
Marketable equity securities, at fair value | 2,009 | — | |||||
Available for sale investment securities, at fair value | 93,154 | 92,188 | |||||
Held to maturity investment securities, at amortized cost (fair values of $21,988 and $22,836 at December 31, 2018 and 2017, respectively) | 21,421 | 21,579 | |||||
Total investment securities | 116,584 | 113,767 | |||||
Loans receivable (net of allowance for loan losses of $15,462 and $18,904 at December 31, 2018 and 2017, respectively) | 1,586,775 | 1,520,879 | |||||
Accrued interest receivable | 6,375 | 5,910 | |||||
Federal Home Loan Bank stock, at cost | 8,110 | 9,183 | |||||
Premises and equipment, net | 19,771 | 18,196 | |||||
Bank-owned life insurance | 40,675 | 39,618 | |||||
Goodwill | 2,589 | 2,589 | |||||
Other intangible assets | 290 | 382 | |||||
Deferred income taxes, net | 4,347 | 4,904 | |||||
Other assets | 10,037 | 10,448 | |||||
Total assets | $ | 1,873,665 | $ | 1,796,607 | |||
LIABILITIES AND SHAREHOLDERS’ EQUITY | |||||||
Liabilities | |||||||
Deposits | |||||||
Noninterest bearing deposits | $ | 173,198 | $ | 172,638 | |||
Interest bearing deposits | 1,329,046 | 1,225,767 | |||||
Total deposits | 1,502,244 | 1,398,405 | |||||
Advances from the Federal Home Loan Bank | 160,000 | 199,000 | |||||
Subordinated debentures ($25,500 face, less unamortized debt issuance costs of $345 and $397 at December 31, 2018 and 2017, respectively) | 25,155 | 25,103 | |||||
Accrued expenses and other liabilities | 12,070 | 13,072 | |||||
Total liabilities | 1,699,469 | 1,635,580 | |||||
Commitments and contingencies (Note 11) | |||||||
Shareholders’ equity | |||||||
Common stock, no par value; 10,000,000 shares authorized, 7,842,271 and 7,751,424 shares issued and outstanding at December 31, 2018 and 2017, respectively | 120,527 | 118,301 | |||||
Retained earnings | 54,706 | 41,032 | |||||
Accumulated other comprehensive (loss) income | (1,037 | ) | 1,694 | ||||
Total shareholders’ equity | 174,196 | 161,027 | |||||
Total liabilities and shareholders’ equity | $ | 1,873,665 | $ | 1,796,607 | |||
See Notes to Consolidated Financial Statements
62
Bankwell Financial Group, Inc.
Consolidated Statements of Income
(In thousands, except share and per share amounts)
Year Ended December 31, | |||||||||||
2018 | 2017 | 2016 | |||||||||
Interest and dividend income | |||||||||||
Interest and fees on loans | $ | 74,715 | $ | 66,841 | $ | 58,077 | |||||
Interest and dividends on securities | 3,921 | 3,570 | 2,740 | ||||||||
Interest on cash and cash equivalents | 1,428 | 790 | 173 | ||||||||
Total interest and dividend income | 80,064 | 71,201 | 60,990 | ||||||||
Interest expense | |||||||||||
Interest expense on deposits | 18,951 | 12,694 | 8,300 | ||||||||
Interest expense on borrowings | 4,787 | 4,143 | 3,598 | ||||||||
Total interest expense | 23,738 | 16,837 | 11,898 | ||||||||
Net interest income | 56,326 | 54,364 | 49,092 | ||||||||
Provision for loan losses | 3,440 | 1,341 | 3,914 | ||||||||
Net interest income after provision for loan losses | 52,886 | 53,023 | 45,178 | ||||||||
Noninterest income | |||||||||||
Service charges and fees | 1,090 | 1,007 | 963 | ||||||||
Bank owned life insurance | 1,057 | 1,170 | 693 | ||||||||
Gains and fees from sales of loans | 984 | 1,427 | 466 | ||||||||
Net gain (loss) on sale of available for sale securities | 222 | 165 | (115 | ) | |||||||
(Loss) gain on sale of foreclosed real estate | — | (78 | ) | 128 | |||||||
Other | 547 | 938 | 541 | ||||||||
Total noninterest income | 3,900 | 4,629 | 2,676 | ||||||||
Noninterest expense | |||||||||||
Salaries and employee benefits | 18,973 | 16,284 | 15,655 | ||||||||
Occupancy and equipment | 6,790 | 6,165 | 5,811 | ||||||||
Professional services | 2,103 | 2,072 | 1,654 | ||||||||
Data processing | 2,033 | 1,866 | 1,603 | ||||||||
Marketing | 1,587 | 1,193 | 948 | ||||||||
Director fees | 1,044 | 912 | 859 | ||||||||
FDIC insurance | 779 | 1,116 | 660 | ||||||||
Amortization of intangibles | 92 | 118 | 151 | ||||||||
Other | 2,232 | 2,797 | 2,203 | ||||||||
Total noninterest expense | 35,633 | 32,523 | 29,544 | ||||||||
Income before income tax expense | 21,153 | 25,129 | 18,310 | ||||||||
Income tax expense | 3,720 | 11,299 | 5,960 | ||||||||
Net income | $ | 17,433 | $ | 13,830 | $ | 12,350 | |||||
Earnings Per Common Share: | |||||||||||
Basic | $ | 2.23 | $ | 1.80 | $ | 1.64 | |||||
Diluted | $ | 2.21 | $ | 1.78 | $ | 1.62 | |||||
Weighted Average Common Shares Outstanding: | |||||||||||
Basic | 7,722,175 | 7,572,409 | 7,396,019 | ||||||||
Diluted | 7,775,480 | 7,670,413 | 7,491,052 | ||||||||
Dividends per common share | $ | 0.48 | $ | 0.28 | $ | 0.22 | |||||
See Notes to Consolidated Financial Statements
63
Bankwell Financial Group, Inc.
Consolidated Statements of Comprehensive Income
(In thousands)
Year Ended December 31, | |||||||||||
2018 | 2017 | 2016 | |||||||||
Net income | $ | 17,433 | $ | 13,830 | $ | 12,350 | |||||
Other comprehensive (loss) income: | |||||||||||
Unrealized (losses) gains on securities: | |||||||||||
Unrealized holding losses on available for sale securities | (1,632 | ) | (357 | ) | (109 | ) | |||||
Reclassification adjustment for (gain) loss realized in net income | (222 | ) | (165 | ) | 115 | ||||||
Net change in unrealized (loss) gain | (1,854 | ) | (522 | ) | 6 | ||||||
Income tax effect–benefit (expense) | 390 | 182 | (2 | ) | |||||||
Unrealized (losses) gains on securities, net of tax | (1,464 | ) | (340 | ) | 4 | ||||||
Unrealized (losses) gains on interest rate swaps: | |||||||||||
Unrealized (losses) gains on interest rate swaps designated as cash flow hedges | (1,604 | ) | 1,297 | 1,013 | |||||||
Income tax effect–benefit (expense) | 337 | (454 | ) | (354 | ) | ||||||
Unrealized (losses) gains on interest rate swaps, net of tax | (1,267 | ) | 843 | 659 | |||||||
Total other comprehensive (loss) income, net of tax | (2,731 | ) | 503 | 663 | |||||||
Comprehensive income | $ | 14,702 | $ | 14,333 | $ | 13,013 | |||||
See Notes to Consolidated Financial Statements
64
Bankwell Financial Group, Inc.
Consolidated Statements of Shareholders’ Equity
(In thousands, except share data)
Number of Outstanding Shares | Common Stock | Retained Earnings | Accumulated Other Comprehensive Income (Loss) | Total | ||||||||||||||
Balance at January 1, 2016 | 7,516,291 | $ | 112,579 | $ | 18,963 | $ | 227 | $ | 131,769 | |||||||||
Net income | — | — | 12,350 | — | 12,350 | |||||||||||||
Other comprehensive income, net of tax | — | — | — | 663 | 663 | |||||||||||||
Cash dividends declared ($0.22 per share) | — | — | (1,661 | ) | — | (1,661 | ) | |||||||||||
Stock-based compensation expense | — | 1,188 | — | — | 1,188 | |||||||||||||
Warrants exercised | 11,200 | 200 | — | — | 200 | |||||||||||||
Issuance of restricted stock | 29,935 | — | — | — | — | |||||||||||||
Forfeitures of restricted stock | (883 | ) | — | — | — | — | ||||||||||||
Stock options exercised | 64,120 | 1,106 | — | — | 1,106 | |||||||||||||
Net tax benefit related to stock-based compensation | — | 280 | — | — | 280 | |||||||||||||
Balance at December 31, 2016 | 7,620,663 | 115,353 | 29,652 | 890 | 145,895 | |||||||||||||
Net income | — | — | 13,830 | — | 13,830 | |||||||||||||
Other comprehensive income, net of tax | — | — | — | 503 | 503 | |||||||||||||
Cash dividends declared ($0.28 per share) | — | — | (2,149 | ) | — | (2,149 | ) | |||||||||||
Stock-based compensation expense | — | 917 | — | — | 917 | |||||||||||||
Warrants exercised | 35,000 | 663 | — | — | 663 | |||||||||||||
Issuance of restricted stock | 40,250 | — | — | — | — | |||||||||||||
Forfeitures of restricted stock | (18,227 | ) | — | — | — | — | ||||||||||||
Stock options exercised | 73,738 | 1,368 | — | — | 1,368 | |||||||||||||
Reclass adjustment resulting from tax law change | — | — | (301 | ) | 301 | — | ||||||||||||
Balance at December 31, 2017 | 7,751,424 | 118,301 | 41,032 | 1,694 | 161,027 | |||||||||||||
Net income | — | — | 17,433 | — | 17,433 | |||||||||||||
Other comprehensive loss, net of tax | — | — | — | (2,731 | ) | (2,731 | ) | |||||||||||
Cash dividends declared ($0.48 per share) | — | — | (3,759 | ) | — | (3,759 | ) | |||||||||||
Stock-based compensation expense | — | 1,290 | — | — | 1,290 | |||||||||||||
Warrants exercised | 22,400 | 400 | — | — | 400 | |||||||||||||
Issuance of restricted stock | 44,300 | — | — | — | — | |||||||||||||
Forfeitures of restricted stock | (3,873 | ) | — | — | — | — | ||||||||||||
Stock options exercised | 28,020 | 536 | — | — | 536 | |||||||||||||
Balance at December 31, 2018 | 7,842,271 | $ | 120,527 | $ | 54,706 | $ | (1,037 | ) | $ | 174,196 | ||||||||
See Notes to Consolidated Financial Statements
65
Bankwell Financial Group, Inc.
Consolidated Statements of Cash Flows
(In thousands)
Year Ended December 31, | |||||||||||
2018 | 2017 | 2016 | |||||||||
Cash flows from operating activities | |||||||||||
Net income | $ | 17,433 | $ | 13,830 | $ | 12,350 | |||||
Adjustments to reconcile net income to net cash provided by operating activities: | |||||||||||
Net (accretion) amortization of premiums and discounts on investment securities | (54 | ) | (31 | ) | 1,737 | ||||||
Provision for loan losses | 3,440 | 1,341 | 3,914 | ||||||||
Provision (benefit) for deferred taxes | 1,284 | 3,908 | (1,104 | ) | |||||||
Net (gain) loss on sales of available for sale securities | (222 | ) | (165 | ) | 115 | ||||||
Depreciation and amortization | 1,732 | 1,513 | 1,729 | ||||||||
Amortization of debt issuance costs | 52 | 52 | 51 | ||||||||
Increase in cash surrender value of bank-owned life insurance | (1,057 | ) | (1,170 | ) | (693 | ) | |||||
Loan principal sold from loans originated for sale | — | (3,485 | ) | (3,313 | ) | ||||||
Proceeds from sales of loans originated for sale | — | 4,626 | 3,381 | ||||||||
Originations of loans held for sale | — | — | (254 | ) | |||||||
Net gain on sales of loans | (984 | ) | (1,427 | ) | (466 | ) | |||||
Stock-based compensation | 1,290 | 917 | 1,188 | ||||||||
Net amortization (accretion) of purchase accounting adjustments | 239 | (80 | ) | (136 | ) | ||||||
Loss on sale of premises and equipment | 44 | — | — | ||||||||
Loss on sale and write-downs of foreclosed real estate | — | 128 | 25 | ||||||||
Net change in: | |||||||||||
Deferred loan fees | (745 | ) | (829 | ) | 466 | ||||||
Accrued interest receivable | (465 | ) | (952 | ) | (887 | ) | |||||
Other assets | (1,008 | ) | (1,740 | ) | (3,006 | ) | |||||
Accrued expenses and other liabilities | (1,002 | ) | 4,136 | 2,275 | |||||||
Net cash provided by operating activities | 19,977 | 20,572 | 17,372 | ||||||||
Cash flows from investing activities | |||||||||||
Proceeds from principal repayments on available for sale securities | 9,430 | 5,217 | 770 | ||||||||
Proceeds from principal repayments on held to maturity securities | 180 | 212 | 205 | ||||||||
Net proceeds from sales and calls of available for sale securities | 12,377 | 54,705 | 60,696 | ||||||||
Net proceeds from sales and calls of held to maturity securities | — | 5,690 | — | ||||||||
Purchases of available for sale securities | (24,379 | ) | (64,700 | ) | (110,485 | ) | |||||
Purchases of marketable equity securities | (2,003 | ) | — | — | |||||||
Purchase of held to maturity securities | — | (10,609 | ) | (6,835 | ) | ||||||
Purchase of bank-owned life insurance | — | (5,000 | ) | (9,000 | ) | ||||||
Net increase in loans | (68,923 | ) | (177,549 | ) | (218,603 | ) | |||||
Loan principal sold from loans not originated for sale | (8,980 | ) | (14,264 | ) | (4,069 | ) | |||||
Proceeds from sales of loans not originated for sale | 9,964 | 14,805 | 4,467 | ||||||||
Purchases of premises and equipment | (3,351 | ) | (1,874 | ) | (8,401 | ) | |||||
Net redemption (purchase) of Federal Home Loan Bank stock | 1,073 | (1,239 | ) | (1,389 | ) | ||||||
Proceeds from sale of foreclosed real estate | — | 144 | 951 | ||||||||
Net cash used in investing activities | (74,612 | ) | (194,462 | ) | (291,693 | ) | |||||
Cash flows from financing activities | |||||||||||
Net change in time certificates of deposit | (16,541 | ) | 29,417 | 165,224 | |||||||
Net change in other deposits | 120,380 | 79,967 | 76,930 | ||||||||
Net change in FHLB advances | (39,000 | ) | 39,000 | 40,000 | |||||||
66
Proceeds from exercise of warrants | 400 | 663 | 200 | ||||||||
Proceeds from exercise of options | 536 | 1,368 | 1,106 | ||||||||
Dividends paid on common stock | (3,759 | ) | (2,149 | ) | (1,661 | ) | |||||
Net tax benefit related to stock-based compensation | — | — | 280 | ||||||||
Net cash provided by financing activities | 62,016 | 148,266 | 282,079 | ||||||||
Net increase (decrease) in cash and cash equivalents | 7,381 | (25,624 | ) | 7,758 | |||||||
Cash and cash equivalents: | |||||||||||
Beginning of year | 70,731 | 96,355 | 88,597 | ||||||||
End of period | $ | 78,112 | $ | 70,731 | $ | 96,355 | |||||
Supplemental disclosures of cash flows information: | |||||||||||
Cash paid for: | |||||||||||
Interest | $ | 18,662 | $ | 16,582 | $ | 11,793 | |||||
Income taxes | 3,685 | 8,020 | 8,584 | ||||||||
Noncash investing and financing activities | |||||||||||
Net change in unrealized losses or gains on available-for-sale securities | (1,854 | ) | (522 | ) | 6 | ||||||
Net change in unrealized losses or gains on interest rate swaps | (1,267 | ) | 843 | 659 | |||||||
See Notes to Consolidated Financial Statements
67
Bankwell Financial Group, Inc.
NOTES TO CONSOLIDATED FINANCIAL STATEMENTS
1. Nature of Operations and Summary of Significant Accounting Policies
Bankwell Financial Group, Inc. is a bank holding company headquartered in New Canaan, Connecticut. The Company offers a broad range of financial services through its banking subsidiary, Bankwell Bank (collectively the Company or the Bank). In November 2013, the Bank acquired The Wilton Bank (“Wilton”), which added one branch and approximately $25.1 million in loans and $64.2 million in deposits. In October 2014, the Bank acquired Quinnipiac Bank and Trust Company (“Quinnipiac”) which added two branches and approximately $97.8 million in loans and $100.6 million in deposits.
The Bank is a Connecticut state chartered commercial bank, founded in 2002, whose deposits are insured under the Deposit Insurance Fund administered by the Federal Deposit Insurance Corporation (“FDIC”). The Bank provides a full range of banking services to commercial and consumer customers, primarily concentrated in the New York metropolitan area and throughout Connecticut, with the majority of our loans in Fairfield and New Haven Counties, Connecticut, with branch locations in New Canaan, Stamford, Fairfield, Wilton, Norwalk, Hamden, Westport, Darien and North Haven Connecticut.
Many of the Company’s activities are with customers located in the New York Metropolitan area and throughout Fairfield and New Haven Counties and the surrounding region of Connecticut, and declines in property values in these areas could significantly impact the Company. The Company has significant concentrations in commercial real estate loans. Management does not believe they present any special risk. The Company does not have any significant concentrations in any one industry or customer.
Principles of consolidation
The consolidated financial statements include the accounts of the Company and the Bank, including its wholly owned passive investment company subsidiary. All significant intercompany accounts and transactions have been eliminated in consolidation.
Use of estimates
The accounting and reporting policies of the Company conform to accounting principles generally accepted in the United States of America (“GAAP”) and general practices within the banking industry. In preparing the consolidated financial statements, management is required to make estimates and assumptions that affect the reported amounts of assets and liabilities, and disclosures of contingent assets and liabilities as of the date of the consolidated balance sheet and revenue and expenses for the period. Actual results could differ from those estimates. Material estimates that are particularly susceptible to significant change in the near term relate to the allowance for loan losses, stock-based compensation, derivative instrument valuation, investment securities valuation, evaluation of investment securities for other than temporary impairment and deferred income taxes valuation.
Segments
The Company has one reportable segment. All of the Company’s activities are interrelated, and each activity is dependent and assessed based on how each of the activities of the Company supports the others. For example, lending is dependent upon the ability of the Company to fund itself with deposits and borrowings while managing the interest rate and credit risk. Accordingly, all significant operating decisions are based upon analysis of the Company as one segment or unit.
Basis of consolidated financial statement presentation
The consolidated financial statements have been prepared in accordance with GAAP and general practices within the banking industry. Such policies have been followed on a consistent basis.
Cash and Cash Equivalents and Statement of Cash Flows
Cash and due from banks and federal funds sold are recognized as cash equivalents in the consolidated statements of cash flows. Federal funds sold generally mature in one day. For purposes of reporting cash flows, all highly liquid debt instruments purchased with an original maturity of three months or less are considered to be cash equivalents. Cash flows from loans and deposits are reported net. The balances of cash and due from banks and federal funds sold, at times, may exceed federally insured limits. The Company has not experienced any losses from such concentrations.
Investment Securities
Management determines the appropriate classifications of investment securities at the date individual investment securities are acquired, and the appropriateness of such classifications is reaffirmed at each balance sheet date. The Company’s investments are categorized as marketable equity, available for sale or held to maturity securities. Held to maturity investments are carried at amortized cost. Available for sale securities are carried at fair value, with unrealized gains and losses excluded from earnings and reported in other comprehensive income (loss) as a separate component of capital, net of estimated income taxes. Marketable equity securities are carried at fair value, with any changes in fair value reported in earnings.
Investment securities in the available for sale and held-to-maturity portfolios are reviewed quarterly for other-than-temporary impairment ("OTTI"). If the fair value of a debt security is below amortized cost, other-than-temporary impairment is deemed to
68
exist if the present value of the expected future cash flows is less than the amortized cost basis of the security. OTTI is required to be recognized regardless of the credit loss component if the Company intends to sell the security or if it is “more-likely-than-not” that the Company will be required to sell the security before recovery of its amortized cost basis. The credit loss component of an other-than-temporary impairment write-down is recorded in earnings, while the remaining portion of the impairment loss is recognized in other comprehensive income (loss), provided the Company does not intend to sell the underlying debt security and it is more-likely-than-not that the Company will not be required to sell the debt security prior to recovery.
In determining whether a credit loss exists and the period over which the fair value of the debt security is expected to recover, management considers the following factors: the length of time and extent that fair value has been less than cost, the financial condition and near term prospects of the issuer, any external credit ratings, the level of excess cash flows generated from the underlying collateral supporting the principal and interest payments of the debt securities and the level of credit enhancement provided by the structure.
The sale of a held to maturity security within three months of its maturity date or after collection of at least 85% of the principal outstanding at the time the security was acquired is considered a maturity for purposes of classification and disclosure.
Purchase premiums and discounts are recognized in interest income using the interest method over the terms of the securities. Gains or losses on the sales of securities are recognized at trade date utilizing the specific identification method.
Transfers of debt securities into the held to maturity classification from the available for sale classification are made at fair value on the date of transfer. The unrealized holding gain or loss on the date of transfer is retained in accumulated other comprehensive income and in the carrying value of the held to maturity securities. Such amounts are amortized over the remaining contractual lives of the securities. When transfers of debt securities into the available for sale classification from the held to maturity classification occur, any unrealized holding gains or losses on the transfer date are recognized in other comprehensive income.
Bank Owned Life Insurance
The investment in bank owned life insurance (“BOLI”) represents the cash surrender value of life insurance policies on the lives of certain Bank employees who have provided positive consent allowing the Bank to be the beneficiary of such policies. Increases in the cash value of the policies, as well as insurance proceeds received, are recorded in noninterest income, and are not subject to income taxes. The financial strength of the insurance carrier is reviewed prior to the purchase of BOLI and annually thereafter.
Federal Home Loan Bank Stock
Federal Home Loan Bank of Boston (“FHLB”) stock is a non-marketable equity security that is carried at cost. There are no quoted market prices for this security and the security is not liquid. The Company can sell these securities back to the FHLB at par.
Loans Held For Sale
Loans held for sale are those loans which management has the intent to sell in the foreseeable future, and are carried at the lower of aggregate cost or market value. Net unrealized losses, if any, are recognized by a valuation allowance through a charge to noninterest income. Realized gains and losses on the sale of loans are recognized on the trade date and are determined by the difference between the sale proceeds and the carrying value of the loans.
Loans may be sold with servicing rights released or retained. At the time of the sale, management records a servicing asset for the value of any retained servicing rights, which represents the present value of the differential between the contractual servicing fee and adequate compensation, defined as the fee a sub-servicer would require to assume the role of servicer, after considering the estimated effects of prepayments.
Transfers of financial assets are accounted for as sales when control over the assets has been surrendered. Control over transferred assets is deemed to be surrendered when (1) the assets have been isolated from the Company—put presumptively beyond the reach of the transferor and its creditors, even in bankruptcy or other receivership, (2) the transferee obtains the right (free of conditions that constrain it from taking advantage of that right) to pledge or exchange the transferred assets, and (3) the transferor does not maintain effective control over the transferred assets through either (a) an agreement that both entitles and obligates the transferor to repurchase or redeem the assets before maturity or (b) the ability to unilaterally cause the holder to return specific assets, other than through a cleanup call.
Loans Receivable
Loans receivable that management has the ability and intent to hold for the foreseeable future or until maturity or payoff are stated at their current unpaid principal balances, net of the allowance for loan losses, charge-offs, recoveries, net deferred loan origination fees and unamortized loan premiums.
69
Past due or delinquency status for all loans is based on the number of days past due in accordance with its contractual payment terms.
A loan is considered impaired when it is probable that all contractual principal or interest payments due will not be collected in accordance with the terms of the loan agreement. Impaired loans are measured based on the present value of expected future cash flows discounted at the loan’s effective interest rate or, as a practical expedient, at the loan’s observable market price or the fair value of the collateral, if the loan is collateral dependent. The amount of impairment, if any, and any subsequent changes are recorded as adjustments to the allowance for loan losses.
Impaired loans also include loans modified in troubled debt restructurings where concessions have been granted to borrowers experiencing financial difficulties. These concessions could include a reduction in the interest rate on the loan, payment extensions, forgiveness of principal, forbearance or other actions intended to maximize collection.
Loans greater than 90 days past due are put on nonaccrual status (excluding certain acquired credit impaired loans). Loans are also placed on nonaccrual status when, in the opinion of management, full collection of principal and interest is doubtful. Interest previously accrued, but uncollected, is reversed against current period income. Subsequent payments are recognized on a cash basis or principal recapture basis depending on a number of factors including probability of collection and if impairment is identified. A nonaccrual loan is restored to accrual status when it is no longer delinquent and collectability of interest and principal is no longer in doubt.
Management reviews all nonaccrual loans, other loans past due 90 days or more, and restructured loans for impairment. In most cases, loan payments that are past due less than 90 days are considered minor collection delays and the related loans may not be impaired. Consumer installment loans are considered to be pools of small balance homogeneous loans, which are collectively evaluated for impairment.
Modifications to a loan are considered to be a troubled debt restructuring (“TDR”) when two conditions are met: 1) the borrower is experiencing financial difficulties and 2) the modification constitutes a concession that is not in line with market rates and/or terms. Modified terms are dependent upon the financial position and needs of the individual borrower. Debt may be bifurcated with separate terms for each tranche of the restructured debt. The decision to restructure a loan, versus aggressively enforcing the collection of the loan, may benefit the Company by increasing the ultimate probability of collection.
If a performing loan is restructured into a TDR it remains in performing status. If a nonperforming loan is restructured into a TDR, it continues to be carried in nonaccrual status. Nonaccrual classification may be removed if the borrower demonstrates compliance with the modified terms for a minimum of six months. TDR’s are reported as such for at least one year from the date of restructuring. In years after the restructuring, troubled debt restructured loans are removed from this classification if the restructuring agreement specifies a market rate of interest equal to that which would be provided to a borrower with similar credit at the time of restructuring and the loan is not deemed to be impaired based on the modified terms.
Acquired Loans
Loans that the Company acquires in acquisitions are initially recorded at fair value with no carryover of the related allowance for credit losses. Determining the fair value of acquired loans involves estimating the amount and timing of principal and interest cash flows initially expected to be collected on the loans and discounting those cash flows at an appropriate market rate of interest.
For loans which meet the criteria stipulated in Accounting Standards Codification (“ASC”) 310-30, “Loans and Debt Securities Acquired with Deteriorated Credit Quality”, the Company recognizes an accretable yield, which is defined as the excess of all cash flows expected at acquisition over the initial fair value of the loan, as interest income on a level-yield basis over the expected remaining life of the loan. The excess of the loan’s contractually required payments over the cash flows expected to be collected is the nonaccretable difference. The nonaccretable difference is not recognized as an adjustment of yield, a loss accrual, or a valuation allowance. After the initial acquisition, the Company continues to evaluate whether the timing and the amount of cash to be collected are reasonably estimated. Subsequent significant increases in cash flows the Company expects to collect will first reduce previously recognized valuation allowance and then be reflected prospectively as an increase to the level yield. Subsequent decreases in expected cash flows may result in the loan being considered impaired. Interest income is not recognized to the extent that the net investment in the loan would increase to an amount greater than the estimated payoff amount.
For ASC 310-30 loans, the expected cash flows reflect anticipated prepayments, determined on a loan by loan basis, according to the anticipated collection plan of these loans. Prepayments result in the recognition of the nonaccretable balance as current period yield. Changes in prepayment assumptions may change the amount of interest income and principal expected to be collected. The expected prepayments used to determine the accretable yield are consistent between the cash flows expected to be collected and projections of contractual cash flows so as to not affect the nonaccretable difference.
For loans that do not meet the ASC 310-30 criteria, the Company records interest income on a level yield basis using the contractually required cash flows. The Company subjects loans that do not meet the ASC 310-30 criteria to ASC Topic 450,
70
“Contingencies”, by collectively evaluating these loans for an allowance for loan loss, using the same methodology as loans originated by the Company.
Acquired loans that met the criteria for nonaccrual of interest prior to the acquisition are considered performing upon acquisition, regardless of whether the customer is contractually delinquent, if the Company can reasonably estimate the timing and amount of the expected cash flows on such loans and if the Company expects to fully collect the new carrying value of the loans. As such, the Company may no longer consider the loan to be nonaccrual or nonperforming and may accrue interest on these loans, including the impact of any accretable yield. The Company has determined that it can reasonably estimate future cash flows on the Company’s current portfolio of acquired loans that are past due 90 days or more, and on which the Company is accruing interest and the Company expects to fully collect the carrying value of the loans.
Allowance For Loan Losses (ALLL)
The allowance for loan losses is established as losses are estimated to have occurred through a provision for loan losses charged to earnings. Loan losses are charged against the allowance for loan losses when management believes the non-collectability of a loan balance is confirmed. Subsequent recoveries, if any, are credited to the allowance for loan losses.
The allowance for loan losses is evaluated on a regular basis by management and is based upon management’s periodic review of the collectability of the loans in light of historical experience, the nature and volume of the loan portfolio, adverse situations that may affect the borrower’s ability to repay, estimated value of any underlying collateral and prevailing economic conditions. This evaluation is inherently subjective, as it requires estimates that are susceptible to significant revision as more information becomes available.
The allowance for loan losses consists of specific and general components. The specific component relates to impaired loans that are classified as "doubtful", "substandard" or "special mention". For these loans, an allowance is established when the discounted cash flows, collateral value or observable market price of the impaired loan is lower than the carrying value of that loan. The general component covers non classified loans and is based on historical loss experience, including appropriate peer data, adjusted for qualitative factors.
Management believes the allowance for loan losses is adequate. While management uses available information to recognize losses on loans, future additions to the allowance may be necessary based on changes in economic conditions. In addition, various regulatory agencies, as an integral part of their examination process, periodically review the allowance for loan losses. Such agencies have the authority to require additions to the allowance or charge-offs based on the agencies’ judgments about information available to them at the time of their examination.
Reserve for Unfunded Commitments
The reserve for unfunded commitments provides for probable losses inherent with funding the unused portion of legal commitments to lend. The unfunded reserve calculation includes factors that are consistent with the ALLL methodology for our loan portfolio as well as a draw down factor applied to the various commitments. The reserve for unfunded commitments is included within other liabilities in the accompanying Consolidated Balance Sheets, and changes in the reserve are reported as a component of other expense in the accompanying Consolidated Statements of Income. See Note 11: Commitments and Contingencies for further information.
Interest and Fees on Loans
Interest on loans is accrued and included in income based on contractual rates applied to principal amounts outstanding. Accrual of interest is discontinued when loan payments are 90 days or more past due, based on contractual terms, or when, in the judgment of management, collectability of the loan or loan interest becomes uncertain. When interest accrual is discontinued, all unpaid accrued interest is reversed against interest income. Subsequent recognition of income occurs only to the extent payment is received subject to management’s assessment of the collectability of the remaining interest and principal. A nonaccrual loan is restored to accrual status when it is no longer delinquent and collectability of interest and principal is no longer in doubt.
Loan origination fees, net of direct loan origination costs, are deferred and amortized as an adjustment to the loan’s yield generally over the contractual life of the loan, utilizing the interest method.
Goodwill and Intangibles
Goodwill represents the excess of the purchase price over the fair value of the net assets acquired in a business combination. Intangible assets are assets acquired in a business combination that lack physical substance but can be distinguished from goodwill because the intangible asset is capable of being sold or exchanged on its own or in combination with related contracts, assets or liabilities. Intangible assets are amortized on a straight-line or accelerated basis over estimated lives. Goodwill is not amortized. Goodwill and identifiable intangible assets are evaluated for impairment annually or whenever events or changes in circumstances indicate the carrying value of these assets may not be recoverable. When these assets are evaluated for impairment, if the carrying amount exceeds fair value, an impairment charge is recorded to income. The fair value is based on observable market prices, when
71
practicable. Other valuation techniques may be used when market prices are unavailable, including estimated discounted cash flows. This type of analysis contains uncertainties because it requires management to make assumptions and to apply judgment to estimate industry economic factors and the profitability of future business strategies. In the event of future changes in fair value, the Company may be exposed to an impairment charge that could be material.
Foreclosed Real Estate
Assets acquired through deed in lieu or loan foreclosure are initially recorded at fair value less costs to sell when acquired, establishing a new cost basis. These assets are subsequently accounted for at lower of cost or fair value less estimated costs to sell. If fair value declines subsequent to foreclosure, a valuation allowance is recorded through expense. Operating costs after acquisition are expensed.
Premises and Equipment
Premises and equipment are stated at cost, net of accumulated depreciation and amortization. Leasehold improvements are capitalized and amortized over the shorter of the terms of the related leases or the estimated economic lives of the improvements. Depreciation and amortization is charged to operations using the straight-line method over the estimated useful lives of the related assets which range from three to thirty-nine years. Gains and losses on dispositions are recognized upon realization. Maintenance and repairs are expensed as incurred and improvements are capitalized.
Impairment of Long-Lived Assets
Long-lived assets, including premises and equipment, are reviewed for impairment whenever events or changes in circumstances indicate that the carrying amount of an asset may not be recoverable. If impairment is indicated by that review, the asset is written down to its estimated fair value through a charge to noninterest expense.
Servicing Rights
When loans are sold, on a servicing retained basis, servicing rights are initially recorded at fair value with the income statement effect recorded in service charges and fees income. All classes of servicing assets are subsequently measured using the amortization method which requires servicing rights to be amortized into noninterest income in proportion to, and over the period of, the life of the underlying loans.
Servicing rights are evaluated for impairment based upon the fair value of the rights as compared to carrying amount. Any impairment is reported as a valuation allowance, to the extent that fair value is less than the carrying amount. If the Company later determines that all or a portion of the impairment no longer exists, a reduction of the allowance may be recorded as an increase to income. Changes in the valuation allowance are reported with service charges and fees income on the consolidated statements of income. The fair values of servicing rights are subject to fluctuations as a result of changes in estimated and actual prepayment speeds and default rates and losses.
Loans serviced for others are not included in the accompanying consolidated balance sheets.
Servicing fee income, which is included in service charges and fees on the income statement, is recorded for fees earned for servicing loans. Fees earned for servicing loans are based on a contractual percentage of the outstanding principal amount of the loan and are recorded as income when earned. The amortization of servicing rights is netted against income from service charges and fees.
Income Taxes
The Company recognizes income taxes under the asset and liability method. Under this method, deferred tax assets and liabilities are recognized for the future tax consequences attributable to differences between the financial statement carrying amounts of existing assets and liabilities and their respective tax bases. Deferred tax assets and liabilities are measured using enacted tax rates expected to apply to taxable income in the years in which those temporary differences are expected to be recovered or settled. The effect on deferred tax assets and liabilities of a change in tax rates is recognized in income in the period that includes the enactment date. Deferred tax assets are reduced by a valuation allowance when, in the opinion of management, it is more-likely-than-not that all or some portion of the deferred tax assets will not be realized.
In the ordinary course of business there is inherent uncertainty in quantifying the Company’s income tax positions. Income tax positions and recorded tax benefits assessed for all years are subject to examination based upon management’s evaluation of the facts, circumstances, and information available at the reporting date. For those tax positions where it is more-likely-than-not that a tax benefit will be sustained, we have determined the amount of the tax benefit to be recognized by estimating the largest amount of tax benefit that has a greater than 50% likelihood of being realized upon ultimate settlement with a taxing authority that has full knowledge of all relevant information. The portion of the benefits associated with tax positions taken that exceeds the amount measured as described above is reflected as a liability for unrecognized tax benefits along with any associated interest and penalties that would be payable to the taxing authorities upon examination. The Company has $193 thousand and $393 thousand of liabilities for uncertain tax positions at December 31, 2018 and 2017, respectively. Where applicable, associated interest and
72
penalties have also been recognized. We recognize accrued interest and penalties related to unrecognized tax benefits as a component of income tax expense.
Stock Compensation
The Company measures and recognizes compensation cost relating to share-based payment transactions based on the grant-date fair value of the equity instruments issued. The fair value of time-based restricted stock is recorded based on the grant date fair value of the Company’s common stock. The fair value of market-based restricted stock is based on values derived using a Monte Carlo based pricing model. The fair value of stock options is determined using the Black-Scholes Option Pricing model. Stock-based compensation costs are recognized over the requisite service period for the awards. Compensation expense reflects the number of awards expected to vest and is adjusted based on awards that ultimately vest. The Company recognizes forfeitures as they occur.
Earnings Per Share
Unvested restricted stock awards that contain non-forfeitable rights to dividends, are participating securities, and are included in the computation of EPS pursuant to the two-class method. The two-class method is an earnings allocation formula that determines EPS for each class of common stock and participating security according to dividends declared (or accumulated) and participation rights in undistributed earnings. The Company’s unvested restricted stock awards qualify as participating securities.
Net income is allocated between the common stock and participating securities pursuant to the two-class method. Basic EPS is computed by dividing net income available to common shareholders by the weighted average number of common shares outstanding during the period, excluding participating unvested restricted stock awards.
Diluted EPS is computed in a similar manner, except that the denominator includes the number of additional common shares that would have been outstanding if potentially dilutive common shares were issued using the treasury stock method.
Comprehensive Income
Comprehensive income represents the sum of net income and items of other comprehensive income or loss, including net unrealized gains or losses on securities available for sale and net unrealized gains or losses on derivatives accounted for as cash flow hedges. The Company’s total comprehensive income or loss for the years ended December 31, 2018, 2017 and 2016 is reported in the Consolidated Statements of Comprehensive Income.
Fair Values of Financial Instruments
The Company uses fair value measurements to record fair value adjustments to certain assets and to determine fair value disclosures. Fair value is the price that would be received to sell an asset or paid to transfer a liability in an orderly transaction between market participants at the measurement date. Fair value is best determined based upon quoted market prices. However, in certain instances, there are no quoted market prices for certain assets or liabilities. In cases where quoted market prices are not available, fair values are based on estimates using present value or other valuation techniques. Those techniques are significantly affected by the assumptions used, including the discount rate and estimates of future cash flows. Accordingly, the fair value estimates may not be realized in an immediate settlement of the asset or liability.
Fair value measurements focus on exit prices in an orderly transaction (that is, not a forced liquidation or distressed sale) between market participants at the measurement date under current market conditions. If there has been a significant decrease in the volume and level of activity for the asset or liability, a change in valuation technique or the use of multiple valuation techniques may be appropriate. In such instances, determining the price at which willing market participants would transact at the measurement date under current market conditions depends on the facts and circumstances and requires the use of significant judgment.
Management uses its best judgment in estimating the fair value of the Company’s financial instruments; however, there are inherent weaknesses in any estimation technique. Therefore, for substantially all financial instruments, the fair value estimates presented herein are not necessarily indicative of the amounts the Company could have realized in a sales transaction at either December 31, 2018 or December 31, 2017. The estimated fair value amounts have been measured as of the respective period-ends, and have not been reevaluated or updated for purposes of these consolidated financial statements subsequent to those respective dates. As such, the estimated fair values of these financial instruments subsequent to the respective reporting dates may be different than the amounts reported at each period-end.
Derivative Instruments
The effective portion of unrealized changes in the fair value of derivatives accounted for as cash flow hedges is reported in other comprehensive income and subsequently reclassified to earnings in the same period or periods during which the hedged forecasted transaction affects earnings. The Bank assesses the effectiveness of each hedging relationship by comparing the changes in cash flows of the derivative hedging instrument with the changes in cash flows of the designated hedged item or transaction. The interest rate swap assets are presented in other assets and the interest rate swap liabilities are presented in accrued expenses and other liabilities in the consolidated balance sheets. The hedge strategy converts the rate of interest on short term rolling FHLB
73
advances or Brokered CDs to long term fixed interest rates, thereby protecting the Bank from interest rate variability. The Company does not offset derivative assets and derivative liabilities for financial statement presentation purposes.
Related Party Transactions
Directors and officers of the Company and their affiliates have been customers of and have had transactions with the Company, and it is expected that such persons will continue to have such transactions in the future. Management believes that all deposit accounts, loans, services and commitments comprising such transactions were made in the ordinary course of business, on substantially the same terms, including interest rates and collateral, as those prevailing at the time for comparable transactions with other customers who are not directors or officers. In the opinion of management, the transactions with related parties did not involve more than normal risks of collectability, nor favored treatment or terms, nor present other unfavorable features. Note 21 contains details regarding related party transactions.
Reclassification
Certain prior period amounts have been reclassified to conform to the 2018 financial statement presentation. These reclassifications only changed the reporting categories and did not affect the results of operations or consolidated financial position.
Recent accounting pronouncements
The following section includes changes in accounting principles and potential effects of new accounting guidance and pronouncements.
ASU No. 2014-09, Revenue from Contracts with Customers (Topic 606): This ASU clarifies the principles for recognizing revenue. The guidance notes that an entity should apply the following steps when recognizing revenue: (i) identify the contract(s) with a customer; (ii) identify the performance obligations in the contract; (iii) determine the transaction price; (iv) allocate the transaction price to the performance obligations in the contract; and (v) recognize revenue when (or as) the entity satisfies a performance obligation. In 2016, the FASB issued further implementation guidance regarding revenue recognition. This additional guidance included clarification on certain principal versus agent considerations within the implementation of the guidance as well as clarification related to identifying performance obligations and licensing. The guidance also requires new qualitative and quantitative disclosures, including disaggregation of revenues and descriptions of performance obligations. The guidance along with its updates is effective for fiscal years, and interim periods within those fiscal years, beginning after December 15, 2017. The Company adopted the guidance on January 1, 2018 using the modified retrospective method.
In evaluating this standard, management has determined that the majority of revenue earned by the Company is from revenue streams not included in the scope of this standard and for in-scope revenue streams management determined that a cumulative-effect adjustment to opening retained earnings as a result of adopting this standard is not needed.
The Company recognizes revenue from contracts with customers when it satisfies its performance obligations. The Company’s performance obligations are generally satisfied as services are rendered and can either be satisfied at a point in time or over time. Unsatisfied performance obligations at the report date are not material to our consolidated financial statements.
For the revenue that is within scope of Topic 606, the following is a description of principal activities from which the Company generates its revenue from contracts with customers.
Revenues for the Company in scope under Topic 606 include service charges and fees and gains or losses on the sale of foreclosed real estate. Service charges and fees include revenue that is recognized at a point in time, including ATM fees, wire transfer fees, overdraft charge fees, and stop-payment and returned check fees. Such revenue is derived from transactional information and is recognized as revenue immediately as the transactions occur or upon providing the service to complete the customer’s transaction. In addition, service charges and fees include fee income earned on customer deposit accounts, that is recognized over a period of time, generally monthly, as services are performed and performance obligations are satisfied. Generally, these services are cancellable with little to no notice needed. The revenue generated from service charges and fees totaled $1.1 million and $1.0 million for years ended December 31, 2018 and 2017, respectively. Noninterest income recognized from the gain or loss of foreclosed real estate was immaterial for the year ended December 31, 2017. There was no income recognized from the gain or loss of foreclosed real estate for the year ended December 31, 2018.
ASU No. 2016-01, Financial Instruments – Overall (Subtopic 825-10): “Recognition and Measurement of Financial Assets and Financial Liabilities.” The ASU has been issued to improve the recognition and measurement of financial instruments by requiring 1) equity investments (except those accounted for under the equity method of accounting, or those that result in consolidation of the investee) to be measured at fair value with changes in fair value recognized in net income; 2) separate presentation of financial assets and financial liabilities by measurement category and form of financial asset on the balance sheet or the accompanying notes to the financial statements; 3) the use of the exit price notion when measuring fair value of financial instruments for disclosure purposes; and 4) separate presentation by the reporting organization in other comprehensive income for the portion of the total change in the fair value of a liability resulting from the change in the instrument-specific credit risk (also referred to as “own credit”) when the organization has elected to measure the liability at fair value in accordance with the
74
fair value option for financial instruments. The standard was effective for the Company beginning on January 1, 2018. The adoption of this ASU did not have a material impact on the Company’s financial statements.
ASU No. 2016-02, Leases (Topic 842): The amendments in this ASU require lessees to recognize, on the balance sheet, assets and liabilities for the rights and obligations created by leases. Accounting by lessors will remain largely unchanged. In July 2018, the FASB issued a subsequent update which introduced a new transition method, under this new transition method, an entity initially applies the new leases standard at the adoption date and recognizes a cumulative-effect adjustment to the opening balance of retained earnings in the period of adoption. The guidance will be effective for the Company on January 1, 2019, with early adoption permitted. The Company recognized $0.6 million as a cumulative-effect adjustment to the opening balance of retained earnings at the time of adoption on January 1, 2019. In addition, the impact of the new standard is expected to be immaterial to the Company as it relates to recognizing operating leases on the balance sheet. The Company estimates the right of use asset and lease liability to be approximately $10 million on day 1, depending on the final discount rate utilized.
ASU No. 2016-13, Financial Instruments—Credit Losses (Topic 326): “Measurement of Credit Losses on Financial Instruments.” The ASU changes the impairment model for most financial assets and certain other instruments. For trade and other receivables, held-to-maturity debt securities, loans and other instruments, entities will be required to use a new forward-looking “expected loss” model that will replace today’s “incurred loss” model and can result in the earlier recognition of credit losses. For available-for-sale debt securities with unrealized losses, entities will measure credit losses in a manner similar to current practice, except that the losses will be recognized as an allowance. The amendments in this update will be effective for the Company on January 1, 2020, including interim periods within that fiscal year. Early adoption is permitted as of the fiscal years beginning after December 15, 2018, including interim periods within those fiscal years. Management is currently working with third party consultants and continues to evaluate the impact of its pending adoption of this guidance on the Company’s financial statements.
ASU No. 2016-15, Statement of Cash Flows (Topic 230): “Classification of Certain Cash Receipts and Cash Payments.” This ASU changes how certain cash receipts and cash payments are presented and classified in the statement of cash flows under Topic 230, Statement of Cash Flows, and other Topics. The amendments address the classification of the following eight items in the statement of cash flows; debt prepayment or debt extinguishment costs, settlement of zero-coupon debt instruments or other debt instruments with coupon interest rates that are insignificant in relation to the effective interest rate of the borrowing, contingent consideration payments made after a business combination, proceeds from the settlement of insurance claims, proceeds from the settlement of corporate-owned life insurance policies, including bank-owned life insurance policies, distributions received from equity method investees, beneficial interests in securitization transactions and separately identifiable cash flows and application of the Predominance Principle. The amendments in this update were effective for fiscal years beginning after December 15, 2017, and interim periods within those fiscal years. The adoption of this ASU did not have a material impact on the Company’s financial statements.
ASU No. 2016-18, Statement of Cash Flows (Topic 230): “Restricted Cash.” This ASU provide guidance on the presentation of restricted cash or restricted cash equivalents in the statement of cash flows. The amendments in this update require that a statement of cash flows explain the change during the period in the total of cash, cash equivalents, and amounts generally described as restricted cash or restricted cash equivalents. Therefore, amounts generally described as restricted cash and restricted cash equivalents should be included with cash and cash equivalents when reconciling the beginning-of-period and end-of-period total amounts shown on the statement of cash flows. The amendments in this update were effective for public business entities for fiscal years beginning after December 15, 2017, and interim periods within those fiscal years. The adoption of this ASU did not have a material impact on the Company’s financial statements.
ASU No. 2017-04, Intangibles – Goodwill and Other (Topic 350): “Simplifying the Test for Goodwill Impairment.” This ASU simplifies the test for goodwill impairment by eliminating step 2 from the goodwill impairment test. In computing the implied fair value of goodwill under Step 2, an entity was required to perform procedures to determine the fair value at the impairment testing date of its assets and liabilities (including unrecognized assets and liabilities) following the procedure that would be required in determining the fair value of assets acquired and liabilities assumed in a business combination. Instead, under the amendments in this update, an entity should perform its annual, or interim, goodwill impairment test by comparing the fair value of a reporting unit with its carrying amount. An entity should recognize an impairment charge for the amount by which the carrying amount exceeds the reporting unit’s fair value; however, the loss recognized should not exceed the total amount of goodwill allocated to that reporting unit. In addition, this ASU also eliminated the requirements for any reporting unit with a zero or negative carrying amount to perform a qualitative assessment and, if it fails that qualitative test, to perform Step 2 of the goodwill impairment test. Therefore, the same impairment assessment applies to all reporting units. An entity is required to disclose the amount of goodwill allocated to each reporting unit with a zero or negative carrying amount of net assets. An entity still has the option to perform the qualitative assessment for a reporting unit to determine if the quantitative impairment test is necessary. The amendments will be effective for the Company for its annual or any interim goodwill impairment tests in fiscal years beginning after December 15, 2019. Early adoption is permitted for interim or annual goodwill impairment tests performed on testing dates after January 1, 2017. The Company does not expect the application of this guidance to have a material impact on the Company’s financial statements.
75
ASU No. 2017-08, Receivables – Nonrefundable Fees and Other Costs (subtopic 310-20): “Premium Amortization on Purchased Callable Debt Securities.” The amendments in this update shorten the amortization period for certain callable debt securities held at a premium. Specifically, the amendments require the premium to be amortized to the earliest call date. The amendments do not require an accounting change for securities held at a discount; the discount continues to be amortized to maturity. The amendments were effective for the Company for fiscal years, and interim periods within those fiscal years, beginning after December 15, 2018. Early adoption was permitted, including adoption in an interim period. If an entity early adopted the amendments in an interim period, any adjustments should be reflected as of the beginning of the fiscal year that includes that interim period. The adoption of this ASU did not have a material impact on the Company’s financial statements.
ASU No. 2017-09, Compensation – Stock Compensation (Topic 718): The amendments in this update provide guidance about which changes to the terms or conditions of a share-based payment award require an entity to apply modification accounting in Topic 718. The amendments in this update were effective for all entities for annual periods, and interim periods within those annual periods, beginning after December 15, 2017. The adoption of this ASU did not have a material impact on the Company’s financial statements.
ASU No. 2017-12, Derivatives and Hedging: “Targeted Improvements to Accounting for Hedging Activities” (Topic 815): The purpose of this updated guidance is to better align a company’s financial reporting for hedging activities with the economic objectives of those activities. ASU 2017-12 was effective for public business entities for fiscal years beginning after December 15, 2018, with early adoption, including adoption in an interim period, permitted. This ASU requires a modified retrospective transition method in which the Company will recognize the cumulative effect of the change on the opening balance of each affected component of equity in the statement of financial position as of the date of adoption. The adoption of this ASU did not have a material impact on the Company’s financial statements.
ASU No. 2018-02, Income Statement—Reporting Comprehensive Income (Topic 220): This update requires a reclassification from accumulated other comprehensive income to retained earnings for stranded tax effects resulting from the newly enacted federal corporate tax rate. The amount of the reclassification would be the difference between the historical 35% corporate income tax rate and the newly enacted 21% corporate tax rate. The amendments were effective for all entities for fiscal years beginning after December 15, 2018 and interim periods within those fiscal years. Early adoption of the amendments was permitted including adoption in any interim period, for public business entities for reporting periods for which financial statements have not yet been issued and all other entities for reporting periods for which financial statements have not yet been made available for issuance. An entity would apply the amendments in the update retrospectively to each period in which the effect of the change in the U.S. federal corporate income tax rate in the Tax Cuts and Jobs Act of 2017 is recognized. The Company elected to adopt this update and recorded a $0.3 million reduction to retained earnings and increase to accumulated other comprehensive income as of December 31, 2017.
ASU No. 2018-03, Technical Corrections and Improvements to Financial Instruments – Overall (Subtopic 825-10): The purpose of this update is to clarify certain aspects of the guidance in ASU No. 2016-01 regarding equity securities without a readily determinable fair value, forward contracts and purchased options, presentation requirements for certain fair value option liabilities, fair value option liabilities denominated in a foreign currency, and transition guidance for equity securities without a readily determinable fair value. Public business entities with fiscal years beginning between December 15, 2017 and June 15, 2018, were not required to adopt these amendments until the interim period beginning after June 15, 2018 and public business entities with fiscal years beginning between June 15, 2018 and December 15, 2018 were not required to adopt these amendments before adopting the amendments in update 2016-01. The adoption of this ASU did not have a material impact on the Company’s financial statements.
ASU No. 2018-07, Compensation-Stock Compensation (Topic 718): "Improvements to Nonemployee Share-Based Payment Accounting” (ASU 2018-07). The amendments in this update expand the scope of Topic 718 to include share based payments to nonemployees. An entity is required to apply the requirements of Topic 718 to nonemployee awards except for specific guidance related to option pricing models and the attribution of cost. ASU 2018-07 was effective for public business entities for fiscal years beginning after December 15, 2018, including interim periods in the year of adoption. Early adoption was permitted for any interim or annual period. The adoption of this ASU did not have a material impact on the Company’s financial statements.
ASU No. 2018-13, Fair Value Measurement (Topic 820): "Changes to the Disclosure Requirements for Fair Value Measurement." The amendments in this update modify the disclosure requirements on fair value measurements in Topic 820, Fair Value Measurement. The following disclosure requirements were removed from topic 820 for public entities; (1) The amount of and reasons for transfers between Level 1 and Level 2 of the fair value hierarchy (2) The policy for timing of transfers between levels and (3) The valuation processes for Level 3 fair value measurements. This update also modified and added disclosure requirements to Topic 820, including adding (1) The changes in unrealized gains and losses for the period included in other comprehensive income for recurring Level 3 fair value measurements held at the end of the reporting period and (2) The range and weighted average of significant unobservable inputs used to develop Level 3 fair value measurements. For certain unobservable inputs, an entity may disclose other quantitative information (such as the median or arithmetic average) in lieu of the weighted average if the entity determines that other quantitative information would be a more reasonable and rational method to reflect the distribution of unobservable inputs used to develop Level 3 fair value measurements. ASU 2018-13 will be effective for public
76
business entities for fiscal years beginning after December 15, 2019, including interim periods in the year of adoption. Early adoption is permitted for any interim or annual period. The Company does not expect the application of this guidance to have a material impact on the Company’s financial statements.
2. Shareholders’ Equity
Common stock
The Company has 10,000,000 shares authorized and 7,842,271 shares issued and outstanding at December 31, 2018 and 10,000,000 shares authorized and 7,751,424 shares issued and outstanding at December 31, 2017. The Company's stock is traded on the NASDAQ stock exchange under the ticker symbol BWFG.
Warrants
On October 1, 2014, the Company acquired Quinnipiac Bank and Trust Co. and, in connection therewith, the Company issued 68,600 warrants to former Quinnipiac warrant holders in accordance with the merger agreement. Each warrant was automatically converted into a warrant to purchase 0.56 shares of the Company’s common stock for an exercise price of $17.86. During the first quarter of 2018, all remaining warrants were exercised. The Company does not have any warrants outstanding as of December 31, 2018.
Dividends
The Company’s shareholders are entitled to dividends when and if declared by the Board of Directors, out of funds legally available. The ability of the Company to pay dividends depends, in part, on the ability of the Bank to pay dividends to the Company. In accordance with Connecticut statutes, regulatory approval is required to pay dividends in excess of the Bank’s profits retained in the current year plus retained profits from the previous two years. The Bank is also prohibited from paying dividends that would reduce its capital ratios below minimum regulatory requirements.
The Company did not repurchase any of its common stock during 2018 or 2017.
3. Goodwill and other intangible assets
Information on goodwill for the year ended December 31, 2018 and 2017 is as follows:
Year Ended December 31, 2018 | Year Ended December 31, 2017 | ||||||
(In thousands) | |||||||
Balance, beginning of the period | $ | 2,589 | $ | 2,589 | |||
Impairment | — | — | |||||
Balance, end of the period | $ | 2,589 | $ | 2,589 | |||
The Company tests for goodwill impairment annually as of June 30th. No impairment was required to be recorded on goodwill for 2018 or 2017.
The table below provides information regarding the carrying amounts and accumulated amortization of amortized intangible assets as of the dates set forth below. The remaining net intangible asset as of December 31, 2018 will be amortized over a period of approximately 4 years.
Gross Intangible Asset | Accumulated Amortization | Net Intangible Asset | |||||||||
(In thousands) | |||||||||||
December 31, 2018 | |||||||||||
Core deposit intangible | $ | 1,029 | $ | 739 | $ | 290 | |||||
December 31, 2017 | |||||||||||
Core deposit intangible | $ | 1,029 | $ | 647 | $ | 382 | |||||
77
4. Investment Securities
The amortized cost, gross unrealized gains and losses and fair values of available for sale and held to maturity securities segregated by contractual maturity at December 31, 2018 were as follows:
December 31, 2018 | |||||||||||||||
Amortized Cost | Gross Unrealized | Fair Value | |||||||||||||
Gains | Losses | ||||||||||||||
(In thousands) | |||||||||||||||
Available for sale securities: | |||||||||||||||
U.S. Government and agency obligations | |||||||||||||||
Less than one year | $ | 1,000 | $ | — | $ | (11 | ) | $ | 989 | ||||||
Due from one through five years | 12,025 | — | (161 | ) | 11,864 | ||||||||||
Due from five through ten years | 100 | — | (5 | ) | 95 | ||||||||||
Due after ten years | 70,690 | 7 | (1,509 | ) | 69,188 | ||||||||||
83,815 | 7 | (1,686 | ) | 82,136 | |||||||||||
State agency and municipal obligations | |||||||||||||||
Due from one through five years | 2,234 | 18 | — | 2,252 | |||||||||||
Due from five through ten years | 1,261 | 18 | — | 1,279 | |||||||||||
Due after ten years | 528 | — | (52 | ) | 476 | ||||||||||
4,023 | 36 | (52 | ) | 4,007 | |||||||||||
Corporate bonds | |||||||||||||||
Due from one through five years | 7,061 | — | (50 | ) | 7,011 | ||||||||||
Total available for sale securities | $ | 94,899 | $ | 43 | $ | (1,788 | ) | $ | 93,154 | ||||||
Held to maturity securities: | |||||||||||||||
State agency and municipal obligations | |||||||||||||||
Less than one year | $ | 3,894 | $ | 6 | $ | — | $ | 3,900 | |||||||
Due after ten years | 16,434 | 669 | (113 | ) | 16,990 | ||||||||||
20,328 | 675 | (113 | ) | 20,890 | |||||||||||
Corporate bonds | |||||||||||||||
Less than one year | 1,000 | — | — | 1,000 | |||||||||||
Government-sponsored mortgage backed securities | |||||||||||||||
No contractual maturity | 93 | 5 | — | 98 | |||||||||||
Total held to maturity securities | $ | 21,421 | $ | 680 | $ | (113 | ) | $ | 21,988 | ||||||
78
The amortized cost, gross unrealized gains and losses and fair values of available for sale and held to maturity securities segregated by contractual maturity at December 31, 2017 were as follows:
December 31, 2017 | |||||||||||||||
Amortized Cost | Gross Unrealized | Fair Value | |||||||||||||
Gains | Losses | ||||||||||||||
(In thousands) | |||||||||||||||
Available for sale securities: | |||||||||||||||
U.S. Government and agency obligations | |||||||||||||||
Due from one through five years | $ | 13,000 | $ | — | $ | (82 | ) | $ | 12,918 | ||||||
Due from five through ten years | 100 | — | (4 | ) | 96 | ||||||||||
Due after ten years | 59,924 | 10 | (174 | ) | 59,760 | ||||||||||
73,024 | 10 | (260 | ) | 72,774 | |||||||||||
State agency and municipal obligations | |||||||||||||||
Due from one through five years | 2,873 | 84 | — | 2,957 | |||||||||||
Due from five through ten years | 7,386 | 228 | — | 7,614 | |||||||||||
Due after ten years | 1,700 | 33 | (27 | ) | 1,706 | ||||||||||
11,959 | 345 | (27 | ) | 12,277 | |||||||||||
Corporate bonds | |||||||||||||||
Due from one through five years | 7,096 | 41 | — | 7,137 | |||||||||||
Total available for sale securities | $ | 92,079 | $ | 396 | $ | (287 | ) | $ | 92,188 | ||||||
Held to maturity securities: | |||||||||||||||
State agency and municipal obligations | |||||||||||||||
Less than one year | $ | 198 | $ | 5 | $ | — | $ | 203 | |||||||
Due from one through five years | 3,880 | 20 | — | 3,900 | |||||||||||
Due after ten years | 16,387 | 1,227 | — | 17,614 | |||||||||||
20,465 | 1,252 | — | 21,717 | ||||||||||||
Corporate bonds | |||||||||||||||
Due from one through five years | 1,000 | — | (5 | ) | 995 | ||||||||||
Government-sponsored mortgage backed securities | |||||||||||||||
No contractual maturity | 114 | 10 | — | 124 | |||||||||||
Total held to maturity securities | $ | 21,579 | $ | 1,262 | $ | (5 | ) | $ | 22,836 | ||||||
The gross realized gains on the sale of investment securities totaled $0.2 million for the year ended December 31, 2018. Sales proceeds and calls totaled $12.4 million for the year ended December 31, 2018. The gross realized losses on the sale of investment securities totaled $2.0 thousand for the year ended December 31, 2018. The gross realized gains on the sale of investment securities totaled $0.2 million for the year ended December 31, 2017. There were no gross realized losses on the sale of investment securities for the year ended December 31, 2017. Sales proceeds and calls were $60.4 million for the year ended December 31, 2017.
At December 31, 2018 and December 31, 2017, none of the Company's securities were pledged as collateral with the Federal Home Loan Bank ("FHLB") or any other institution.
As of December 31, 2018, the actual duration of the Company's available for sale securities were significantly shorter than the notional maturities.
79
At December 31, 2018 the Company held marketable equity securities with a fair value and amortized cost of $2.0 million. These securities represent an investment in mutual funds whose primary purpose is to make investments for CRA purposes. The Company did not hold any marketable equity securities at December 31, 2017.
The following table provides information regarding investment securities with unrealized losses, aggregated by investment category and length of time that individual securities had been in a continuous unrealized loss position at December 31, 2018 and 2017:
Length of Time in Continuous Unrealized Loss Position | ||||||||||||||||||||||||||||||||
Less Than 12 Months | 12 Months or More | Total | ||||||||||||||||||||||||||||||
Fair Value | Unrealized Loss | Percent Decline from Amortized Cost | Fair Value | Unrealized Loss | Percent Decline from Amortized Cost | Fair Value | Unrealized Loss | Percent Decline from Amortized Cost | ||||||||||||||||||||||||
(In thousands) | ||||||||||||||||||||||||||||||||
December 31, 2018 | ||||||||||||||||||||||||||||||||
U.S. Government and agency obligations | $ | 4,990 | $ | (38 | ) | 0.75 | % | $ | 72,676 | $ | (1,648 | ) | 2.22 | % | $ | 77,666 | $ | (1,686 | ) | 2.12 | % | |||||||||||
State agency and municipal obligations | 8,212 | (113 | ) | 1.36 | % | 476 | (52 | ) | 9.87 | % | 8,688 | (165 | ) | 1.87 | % | |||||||||||||||||
Corporate bonds | 2,033 | (11 | ) | 0.51 | % | 4,978 | (39 | ) | 0.78 | % | 7,011 | (50 | ) | 0.70 | % | |||||||||||||||||
Total investment securities | $ | 15,235 | $ | (162 | ) | 1.05 | % | $ | 78,130 | $ | (1,739 | ) | 2.18 | % | $ | 93,365 | $ | (1,901 | ) | 2.00 | % | |||||||||||
December 31, 2017 | ||||||||||||||||||||||||||||||||
U.S. Government and agency obligations | $ | 70,419 | $ | (225 | ) | 0.32 | % | $ | 2,064 | $ | (35 | ) | 1.67 | % | $ | 72,483 | $ | (260 | ) | 0.36 | % | |||||||||||
State agency and municipal obligations | 92 | — | 0.16 | % | 656 | (27 | ) | 3.95 | % | 748 | (27 | ) | 3.50 | % | ||||||||||||||||||
Corporate bonds | — | — | — | % | 995 | (5 | ) | 0.50 | % | 995 | (5 | ) | 0.50 | % | ||||||||||||||||||
Total investment securities | $ | 70,511 | $ | (225 | ) | 0.32 | % | $ | 3,715 | $ | (67 | ) | 1.77 | % | $ | 74,226 | $ | (292 | ) | 0.39 | % | |||||||||||
There were twenty-five and fifteen individual investment securities as of December 31, 2018 and December 31, 2017, respectively, in which the fair value of the security was less than the amortized cost of the security.
The U.S. Government and agency obligations owned are either direct obligations of the U.S. Government or guaranteed by the U.S. Government, therefore the contractual cash flows are guaranteed and as a result the securities in this portfolio are not considered other than temporarily impaired.
The Company continually monitors its state agency, municipal and corporate bond portfolios and at this time these portfolios have minimal default risk because state agency, municipal and corporate bonds are all rated investment grade or deemed to be of investment grade quality.
The Company has the intent and ability to retain its investment securities in an unrealized loss position at December 31, 2018 until the decline in value has recovered or the security has matured.
80
5. Loans Receivable and Allowance for Loan Losses
The following table sets forth a summary of the loan portfolio at December 31, 2018 and 2017:
December 31, 2018 | December 31, 2017 | |||||||
(In thousands) | ||||||||
Real estate loans: | ||||||||
Residential | $ | 178,079 | $ | 193,524 | ||||
Commercial | 1,094,066 | 987,242 | ||||||
Construction | 73,191 | 101,636 | ||||||
1,345,336 | 1,282,402 | |||||||
Commercial business | 258,978 | 259,995 | ||||||
Consumer | 412 | 619 | ||||||
Total loans | 1,604,726 | 1,543,016 | ||||||
Allowance for loan losses | (15,462 | ) | (18,904 | ) | ||||
Deferred loan origination fees, net | (2,497 | ) | (3,242 | ) | ||||
Unamortized loan premiums | 8 | 9 | ||||||
Loans receivable, net | $ | 1,586,775 | $ | 1,520,879 | ||||
Lending activities are conducted principally in the New York metropolitan area, including Fairfield and New Haven Counties of Connecticut, and consist of residential and commercial real estate loans, commercial business loans and a variety of consumer loans. Loans may also be granted for the construction of residential homes and commercial properties. All residential and commercial mortgage loans are collateralized by first or second mortgages on real estate.
Risk management
The Company has established credit policies applicable to each type of lending activity in which it engages. The Company evaluates the creditworthiness of each customer and extends credit of up to 80% of the market value of the collateral, depending on the borrower's creditworthiness and the type of collateral. The borrower’s ability to service the debt is monitored on an ongoing basis. Real estate is the primary form of collateral. Other important forms of collateral are business assets, time deposits and marketable securities. While collateral provides assurance as a secondary source of repayment, the Company ordinarily requires the primary source of repayment for commercial loans, to be based on the borrower’s ability to generate continuing cash flows. In the fourth quarter of 2017 management made the strategic decision to no longer originate residential mortgage loans. The Company’s policy for residential lending generally required that, the amount of the loan may not exceed 80% of the original appraised value of the property. In certain situations, the amount may have exceeded 80% LTV either with private mortgage insurance being required for that portion of the residential loan in excess of 80% of the appraised value of the property or where secondary financing is provided by a housing authority program second mortgage, a community’s low/moderate income housing program, or a religious or civic organization.
Credit quality of loans and the allowance for loan losses
Management segregates the loan portfolio into defined segments, which are used to develop and document a systematic method for determining its allowance for loan losses. The portfolio segments are segregated based on loan types and the underlying risk factors present in each loan type. Such risk factors are periodically reviewed by management and revised as deemed appropriate.
The Company’s loan portfolio is segregated into the following portfolio segments:
Residential Real Estate: This portfolio segment consists of the origination of first mortgage loans secured by one-to-four family owner occupied residential properties for personal use located in our market area. This segment also includes home equity loans and home equity lines of credit secured by owner occupied one-to-four family residential properties. Loans of this type were written at a combined maximum of 80% of the appraised value of the property and the Company requires a first or second lien position on the property. These loans can be affected by economic conditions and the values of the underlying properties.
Commercial Real Estate: This portfolio segment includes loans secured by commercial real estate, multi-family dwellings and investor-owned one-to-four family dwellings. Loans secured by commercial real estate generally have larger loan balances and more credit risk than owner occupied one-to-four family mortgage loans.
81
Construction: This portfolio segment includes commercial construction loans for commercial development projects, including condominiums, apartment buildings, and single family subdivisions as well as office buildings, retail and other income producing properties and land loans, which are loans made with land as collateral. In addition, this portfolio includes residential construction loans to individuals to finance the construction of residential dwellings for personal use located in our market area. Construction and land development financing generally involves greater credit risk than long-term financing on improved, owner-occupied or leased real estate. Risk of loss on a construction loan depends largely upon the accuracy of the initial estimate of the value of the property at completion of construction compared to the estimated cost (including interest) of construction and other assumptions. If the estimate of construction cost proves to be inaccurate, the Company may be required to advance additional funds beyond the amount originally committed in order to protect the value of the property. Moreover, if the estimated value of the completed project proves to be inaccurate, the borrower may hold a property with a value that is insufficient to assure full repayment through sale or refinance. Construction loans also expose the Company to the risks that improvements will not be completed on time in accordance with specifications and projected costs and that repayment will depend on the successful operation or sale of the properties, which may cause some borrowers to be unable to continue paying debt service, which exposes the Company to greater risk of non-payment and loss.
Commercial Business: This portfolio segment includes commercial business loans secured by assignments of corporate assets and personal guarantees of the business owners. Commercial business loans generally have higher interest rates and shorter terms than other loans, but they also have increased difficulty of loan monitoring and a higher risk of default since their repayment generally depends on the successful operation of the borrower’s business.
Consumer: This portfolio segment includes loans secured by savings or certificate accounts, or automobiles, as well as unsecured personal loans and overdraft lines of credit. This type of loan entails greater risk than residential mortgage loans, particularly in the case of loans that are unsecured or secured by assets that depreciate rapidly.
Allowance for loan losses
During the fourth quarter of 2018, the Company recognized a charge-off totaling $6.2 million attributable to one lending relationship, affecting the commercial real estate and commercial business segments.
As of December 31, 2017, the Company has changed its methodology to estimate its allowance for loan losses. The change in methodology resulted in an update to the underlying loan loss assumptions, incorporating the most recent industry, peer and product loss trends. This resulted in a non-recurring, pretax $1.3 million reduction in the reserve during the fourth quarter of 2017 and for the year ended December 31, 2017.
The following tables set forth the activity in the Company’s allowance for loan losses for the years ended December 31, 2018, 2017 and 2016, by portfolio segment:
Residential Real Estate | Commercial Real Estate | Construction | Commercial Business | Consumer | Total | ||||||||||||||||||
(In thousands) | |||||||||||||||||||||||
For the Year Ended December 31, 2018 | |||||||||||||||||||||||
Beginning balance | $ | 1,721 | $ | 12,777 | $ | 907 | $ | 3,498 | $ | 1 | $ | 18,904 | |||||||||||
Charge-offs | (420 | ) | (5,614 | ) | — | (815 | ) | (77 | ) | (6,926 | ) | ||||||||||||
Recoveries | — | 18 | — | 19 | 7 | 44 | |||||||||||||||||
(Credits) provisions | (444 | ) | 4,381 | (767 | ) | 200 | 70 | 3,440 | |||||||||||||||
Ending balance | $ | 857 | $ | 11,562 | $ | 140 | $ | 2,902 | $ | 1 | $ | 15,462 | |||||||||||
Residential Real Estate | Commercial Real Estate | Construction | Commercial Business | Consumer | Total | ||||||||||||||||||
(In thousands) | |||||||||||||||||||||||
For the Year Ended December 31, 2017 | |||||||||||||||||||||||
Beginning balance | $ | 1,802 | $ | 9,415 | $ | 2,105 | $ | 4,283 | $ | 377 | $ | 17,982 | |||||||||||
Charge-offs | — | — | — | (521 | ) | (51 | ) | (572 | ) | ||||||||||||||
Recoveries | 146 | — | — | 4 | 3 | 153 | |||||||||||||||||
(Credits) provisions | (227 | ) | 3,362 | (1,198 | ) | (268 | ) | (328 | ) | 1,341 | |||||||||||||
Ending balance | $ | 1,721 | $ | 12,777 | $ | 907 | $ | 3,498 | $ | 1 | $ | 18,904 | |||||||||||
82
Residential Real Estate | Commercial Real Estate | Construction | Commercial Business | Consumer | Total | ||||||||||||||||||
(In thousands) | |||||||||||||||||||||||
For the Year Ended December 31, 2016 | |||||||||||||||||||||||
Beginning balance | $ | 1,618 | $ | 7,705 | $ | 1,504 | $ | 3,334 | $ | 8 | $ | 14,169 | |||||||||||
Charge-offs | — | — | (7 | ) | (69 | ) | (35 | ) | (111 | ) | |||||||||||||
Recoveries | — | — | — | — | 10 | 10 | |||||||||||||||||
Provisions | 184 | 1,710 | 608 | 1,018 | 394 | 3,914 | |||||||||||||||||
Ending balance | $ | 1,802 | $ | 9,415 | $ | 2,105 | $ | 4,283 | $ | 377 | $ | 17,982 | |||||||||||
Loans evaluated for impairment and the related allowance for loan losses as of December 31, 2018 and 2017 were as follows:
Portfolio | Allowance | ||||||
(In thousands) | |||||||
December 31, 2018 | |||||||
Loans individually evaluated for impairment: | |||||||
Residential real estate | $ | 6,534 | $ | 233 | |||
Commercial real estate | 6,383 | — | |||||
Commercial business | 6,155 | 133 | |||||
Consumer | 3 | — | |||||
Subtotal | 19,075 | 366 | |||||
Loans collectively evaluated for impairment: | |||||||
Residential real estate | 171,545 | 624 | |||||
Commercial real estate | 1,087,683 | 11,562 | |||||
Construction | 73,191 | 140 | |||||
Commercial business | 252,823 | 2,769 | |||||
Consumer | 409 | 1 | |||||
Subtotal | 1,585,651 | 15,096 | |||||
Total | $ | 1,604,726 | $ | 15,462 | |||
Portfolio | Allowance | ||||||
(In thousands) | |||||||
December 31, 2017 | |||||||
Loans individually evaluated for impairment: | |||||||
Residential real estate | $ | 4,607 | $ | 8 | |||
Commercial real estate | 7,586 | 876 | |||||
Commercial business | 2,660 | 71 | |||||
Subtotal | 14,853 | 955 | |||||
Loans collectively evaluated for impairment: | |||||||
Residential real estate | 188,917 | 1,713 | |||||
Commercial real estate | 979,656 | 11,901 | |||||
Construction | 101,636 | 907 | |||||
Commercial business | 257,335 | 3,427 | |||||
Consumer | 619 | 1 | |||||
Subtotal | 1,528,163 | 17,949 | |||||
Total | $ | 1,543,016 | $ | 18,904 | |||
83
Credit quality indicators
To measure credit risk for the loan portfolios, the Company employs a credit risk rating system. This risk rating represents an assessed level of the loan’s risk based on the character and creditworthiness of the borrower/guarantor, the capacity of the borrower to adequately service the debt, any credit enhancements or additional sources of repayment, and the quality, value and coverage of the collateral, if any.
The objectives of the Company’s risk rating system are to provide the Board of Directors and senior management with an objective assessment of the overall quality of the loan portfolio, to promptly and accurately identify loans with well-defined credit weaknesses so that timely action can be taken to minimize credit loss, to identify relevant trends affecting the collectability of the loan portfolio and to isolate potential problem areas and to provide essential information for determining the adequacy of the allowance for loan losses. The Company’s credit risk rating system has nine grades, with each grade corresponding to a progressively greater risk of default. Risk ratings of 1 through 5 are "pass" categories and risk ratings of 6 through 9 are criticized asset categories as defined by the regulatory agencies.
A “special mention” (6) credit has a potential weakness which, if uncorrected, may result in a deterioration of the repayment prospects or inadequately protect the Company’s credit position at some time in the future. “Substandard” (7) loans are credits that have a well-defined weakness or weaknesses that jeopardize the full repayment of the debt. An asset rated “doubtful” (8) has all the weaknesses inherent in a substandard asset and which, in addition, make collection or liquidation in full highly questionable and improbable, when considering existing facts, conditions, and values. Loans classified as “loss” (9) are considered uncollectible and of such little value that their continuance as bankable assets is not warranted. This classification does not mean that the loan has absolutely no recovery or salvage value; rather, it is not practical or desirable to defer writing-off this basically worthless asset even though partial recovery may be made in the future.
Risk ratings are assigned as necessary to differentiate risk within the portfolio. They are reviewed on an ongoing basis through the annual loan review process performed by Company personnel, normal renewal activity and the quarterly watchlist and watched asset report process. They are revised to reflect changes in the borrower's financial condition and outlook, debt service coverage capability, repayment performance, collateral value and coverage as well as other considerations. In addition to internal review at multiple points, outsourced loan review opines on risk ratings with regard to the sample of loans their review covers.
84
The following table presents credit risk ratings by loan segment as of December 31, 2018 and 2017:
Commercial Credit Quality Indicators | |||||||||||||||||||||||||||||||
December 31, 2018 | December 31, 2017 | ||||||||||||||||||||||||||||||
Commercial Real Estate | Construction | Commercial Business | Total | Commercial Real Estate | Construction | Commercial Business | Total | ||||||||||||||||||||||||
(In thousands) | |||||||||||||||||||||||||||||||
Pass | $ | 1,084,695 | $ | 73,191 | $ | 237,933 | $ | 1,395,819 | $ | 960,902 | $ | 101,636 | $ | 252,570 | $ | 1,315,108 | |||||||||||||||
Special mention | 2,988 | — | 14,890 | 17,878 | 9,371 | — | 4,019 | 13,390 | |||||||||||||||||||||||
Substandard | 2,516 | — | 2,592 | 5,108 | 16,969 | — | 3,297 | 20,266 | |||||||||||||||||||||||
Doubtful | 3,867 | — | 3,563 | 7,430 | — | — | 109 | 109 | |||||||||||||||||||||||
Loss | — | — | — | — | — | — | — | — | |||||||||||||||||||||||
Total loans | $ | 1,094,066 | $ | 73,191 | $ | 258,978 | $ | 1,426,235 | $ | 987,242 | $ | 101,636 | $ | 259,995 | $ | 1,348,873 | |||||||||||||||
Residential and Consumer Credit Quality Indicators | |||||||||||||||||||||||
December 31, 2018 | December 31, 2017 | ||||||||||||||||||||||
Residential Real Estate | Consumer | Total | Residential Real Estate | Consumer | Total | ||||||||||||||||||
(In thousands) | |||||||||||||||||||||||
Pass | $ | 171,415 | $ | 409 | $ | 171,824 | $ | 188,917 | $ | 619 | $ | 189,536 | |||||||||||
Special mention | 130 | — | 130 | — | — | — | |||||||||||||||||
Substandard | 6,534 | 3 | 6,537 | 4,607 | — | 4,607 | |||||||||||||||||
Doubtful | — | — | — | — | — | — | |||||||||||||||||
Loss | — | — | — | — | — | — | |||||||||||||||||
Total loans | $ | 178,079 | $ | 412 | $ | 178,491 | $ | 193,524 | $ | 619 | $ | 194,143 | |||||||||||
Loan portfolio aging analysis
When a loan is 15 days past due, the Company sends the borrower a late notice. The Company attempts to contact the borrower by phone if the delinquency is not corrected promptly after the notice has been sent.
When the loan is 30 days past due, the Company mails the borrower a letter reminding the borrower of the delinquency, and attempts to contact the borrower personally to determine the reason for the delinquency and ensure the borrower understands the terms of the loan. If necessary, on the subsequent 90th day of delinquency, the Company may take other appropriate legal action. A summary report of all loans 30 days or more past due is provided to the Board of Directors of the Company periodically. Loans greater than 90 days past due are generally put on nonaccrual status. A nonaccrual loan is restored to accrual status when it is no longer delinquent and collectability of interest and principal is no longer in doubt. A loan is considered to be no longer delinquent when timely payments are made for a period of at least six months (one year for loans providing for quarterly or semi-annual payments) by the borrower in accordance with the contractual terms.
85
The following tables set forth certain information with respect to our loan portfolio delinquencies by portfolio segment and amount as of December 31, 2018 and December 31, 2017:
December 31, 2018 | |||||||||||||||||||||||
30–59 Days Past Due | 60–89 Days Past Due | 90 Days or Greater Past Due | Total Past Due | Current | Total Loans | ||||||||||||||||||
(In thousands) | |||||||||||||||||||||||
Originated loans | |||||||||||||||||||||||
Real estate loans: | |||||||||||||||||||||||
Residential real estate | $ | 994 | $ | — | $ | 2,203 | $ | 3,197 | $ | 174,882 | $ | 178,079 | |||||||||||
Commercial real estate | 668 | 133 | 4,386 | 5,187 | 1,088,879 | 1,094,066 | |||||||||||||||||
Construction | — | — | — | — | 73,191 | 73,191 | |||||||||||||||||
Commercial business | — | 1 | 4,076 | 4,077 | 254,901 | 258,978 | |||||||||||||||||
Consumer | — | — | — | — | 412 | 412 | |||||||||||||||||
Total loans | $ | 1,662 | $ | 134 | $ | 10,665 | $ | 12,461 | $ | 1,592,265 | $ | 1,604,726 | |||||||||||
December 31, 2017 | |||||||||||||||||||||||
30–59 Days Past Due | 60–89 Days Past Due | 90 Days or Greater Past Due | Total Past Due | Current | Total Loans | ||||||||||||||||||
(In thousands) | |||||||||||||||||||||||
Real estate loans: | |||||||||||||||||||||||
Residential real estate | $ | 1,248 | $ | 2,244 | $ | 1,161 | $ | 4,653 | $ | 188,871 | $ | 193,524 | |||||||||||
Commercial real estate | 10,028 | 4,116 | 2,074 | 16,218 | 971,024 | 987,242 | |||||||||||||||||
Construction | — | — | — | — | 101,636 | 101,636 | |||||||||||||||||
Commercial business | 4,318 | 162 | 481 | 4,961 | 255,034 | 259,995 | |||||||||||||||||
Consumer | 3 | — | 2 | 5 | 614 | 619 | |||||||||||||||||
Total loans | $ | 15,597 | $ | 6,522 | $ | 3,718 | $ | 25,837 | $ | 1,517,179 | $ | 1,543,016 | |||||||||||
There were no loans delinquent greater than 90 days and still accruing as of December 31, 2018 or December 31, 2017.
Loans on nonaccrual status
The following is a summary of nonaccrual loans by portfolio segment as of December 31, 2018 and 2017:
December 31, | |||||||
2018 | 2017 | ||||||
(In thousands) | |||||||
Residential real estate | $ | 3,812 | $ | 1,590 | |||
Commercial real estate | 5,950 | 3,371 | |||||
Commercial business | 4,320 | 520 | |||||
Total | $ | 14,082 | $ | 5,481 | |||
Lost interest income on loans that would have been recognized if loans on nonaccrual status had been current in accordance with their original terms for the years ended December 31, 2018, 2017 and 2016 was $1.1 million, $0.2 million and $17 thousand, respectively. The amount of actual interest income recognized on these loans was $11 thousand, $0.1 million and $0.1 million for the years ended December 31, 2018, 2017 and 2016, respectively.
At December 31, 2018 and 2017, there were no commitments to lend additional funds to borrowers on nonaccrual status, respectively. Nonaccrual loans with no specific reserve totaled $11.5 million and $3.5 million at December 31, 2018 and 2017, respectively.
86
Impaired loans
An impaired loan is generally one for which it is probable, based on current information, that the Company will not collect all the amounts due in accordance with the contractual terms of the loan. Such loans are individually evaluated for impairment. When the Company classifies a problem loan as impaired, it evaluates whether a specific valuation allowance is required for that portion of the asset that is estimated to be impaired.
The following tables summarize impaired loans by portfolio segment and the average carrying amount and interest income recognized on impaired loans by portfolio segment as of December 31, 2018, 2017 and 2016:
As of and for the Year Ended December 31, 2018 | |||||||||||||||||||
Carrying Amount | Unpaid Principal Balance | Associated Allowance | Average Carrying Amount | Interest Income Recognized | |||||||||||||||
(In thousands) | |||||||||||||||||||
Impaired loans without a valuation allowance: | |||||||||||||||||||
Residential real estate | $ | 4,520 | $ | 4,613 | $ | — | $ | 4,906 | $ | 106 | |||||||||
Commercial real estate | 6,383 | 12,191 | — | 11,713 | 20 | ||||||||||||||
Construction | — | — | — | — | — | ||||||||||||||
Commercial business | 5,212 | 6,051 | — | 4,945 | 297 | ||||||||||||||
Consumer | 3 | 3 | — | 4 | — | ||||||||||||||
Total impaired loans without a valuation allowance | 16,118 | 22,858 | — | 21,568 | 423 | ||||||||||||||
Impaired loans with a valuation allowance: | |||||||||||||||||||
Residential real estate | 2,014 | 2,054 | 233 | 2,049 | |||||||||||||||
Commercial real estate | — | — | — | — | — | ||||||||||||||
Commercial business | 943 | 945 | 133 | 684 | 25 | ||||||||||||||
Total impaired loans with a valuation allowance | 2,957 | 2,999 | 366 | 2,733 | 25 | ||||||||||||||
Total impaired loans | $ | 19,075 | $ | 25,857 | $ | 366 | $ | 24,301 | $ | 448 | |||||||||
As of and for the Year Ended December 31, 2017 | |||||||||||||||||||
Carrying Amount | Unpaid Principal Balance | Associated Allowance | Average Carrying Amount | Interest Income Recognized | |||||||||||||||
(In thousands) | |||||||||||||||||||
Impaired loans without a valuation allowance: | |||||||||||||||||||
Residential real estate | $ | 3,515 | $ | 3,556 | $ | — | $ | 3,530 | $ | — | |||||||||
Commercial real estate | 1,841 | 1,915 | — | 1,916 | 21 | ||||||||||||||
Commercial business | 1,950 | 2,024 | — | 2,109 | 89 | ||||||||||||||
Total impaired loans without a valuation allowance | 7,306 | 7,495 | — | 7,555 | 110 | ||||||||||||||
Impaired loans with a valuation allowance: | |||||||||||||||||||
Residential real estate | 1,092 | 1,092 | 8 | 1,100 | — | ||||||||||||||
Commercial real estate | 5,745 | 5,745 | 876 | 5,854 | 261 | ||||||||||||||
Commercial business | 710 | 712 | 71 | 873 | 47 | ||||||||||||||
Total impaired loans with a valuation allowance | 7,547 | 7,549 | 955 | 7,827 | 308 | ||||||||||||||
Total impaired loans | $ | 14,853 | $ | 15,044 | $ | 955 | $ | 15,382 | $ | 418 | |||||||||
87
As of and for the Year Ended December 31, 2016 | |||||||||||||||||||
Carrying Amount | Unpaid Principal Balance | Associated Allowance | Average Carrying Amount | Interest Income Recognized | |||||||||||||||
(In thousands) | |||||||||||||||||||
Impaired loans without a valuation allowance: | |||||||||||||||||||
Residential real estate | $ | 1,681 | $ | 1,700 | $ | — | $ | 1,692 | $ | 19 | |||||||||
Commercial real estate | 651 | 651 | — | 668 | 29 | ||||||||||||||
Commercial business | 1,123 | 1,177 | — | 1,616 | 112 | ||||||||||||||
Total impaired loans without a valuation allowance | 3,455 | 3,528 | — | 3,976 | 160 | ||||||||||||||
Impaired loans with a valuation allowance: | |||||||||||||||||||
Commercial real estate | 267 | 267 | 8 | 272 | 6 | ||||||||||||||
Commercial business | 759 | 759 | 42 | 823 | 41 | ||||||||||||||
Consumer | 368 | 368 | 368 | 368 | — | ||||||||||||||
Total impaired loans with a valuation allowance | 1,394 | 1,394 | 418 | 1,463 | 47 | ||||||||||||||
Total impaired loans | $ | 4,849 | $ | 4,922 | $ | 418 | $ | 5,439 | $ | 207 | |||||||||
Troubled debt restructurings (TDRs)
Modifications to a loan are considered to be a troubled debt restructuring when both of the following conditions are met: 1) the borrower is experiencing financial difficulties and 2) the modification constitutes a concession that is not in line with market rates and/or terms. Modified terms are dependent upon the financial position and needs of the individual borrower. Troubled debt restructurings are classified as impaired loans.
If a performing loan is restructured into a TDR it remains in performing status. If a nonperforming loan is restructured into a TDR, it continues to be carried in nonaccrual status. Nonaccrual classification may be removed if the borrower demonstrates compliance with the modified terms for a minimum of six months.
Loans classified as TDRs totaled $7.2 million at December 31, 2018 and $4.9 million at December 31, 2017.
The following table presents loans whose terms were modified as TDRs during the periods presented:
Outstanding Recorded Investment | ||||||||||||||||||||||||||||||||
Number of Loans | Pre-Modification | Post-Modification | ||||||||||||||||||||||||||||||
2018 | 2017 | 2016 | 2018 | 2017 | 2016 | 2018 | 2017 | 2016 | ||||||||||||||||||||||||
(Dollars in thousands) | ||||||||||||||||||||||||||||||||
Years ended December 31, | ||||||||||||||||||||||||||||||||
Commercial real estate | 1 | — | 1 | $ | 37 | $ | — | $ | 62 | $ | 29 | $ | — | $ | 62 | |||||||||||||||||
Residential real estate | 3 | 2 | — | 3,394 | 2,957 | — | 3,390 | 2,957 | — | |||||||||||||||||||||||
Commercial business | 1 | 4 | 2 | 608 | 371 | 237 | 608 | 741 | 237 | |||||||||||||||||||||||
Total | 5 | 6 | 3 | $ | 4,039 | $ | 3,328 | $ | 299 | $ | 4,027 | $ | 3,698 | $ | 299 | |||||||||||||||||
At December 31, 2018 and December 31, 2017, there were six non-accrual loans identified as TDRs totaling $3.6 million and four non-accrual loans identified as TDRs totaling $0.6 million, respectively.
88
The following table provides information on how loans were modified as a TDR for the years ended December 31, 2018 and 2017.
December 31, | |||||||||||
2018 | 2017 | 2016 | |||||||||
(In thousands) | |||||||||||
Maturity Concession | $ | — | $ | 638 | $ | 299 | |||||
Maturity and payment concession | 750 | 1,925 | — | ||||||||
Maturity and rate concession | 608 | 1,032 | — | ||||||||
Payment concession | 2,669 | 103 | — | ||||||||
Total | $ | 4,027 | $ | 3,698 | $ | 299 | |||||
One loan previously modified as a TDR, in the amount of $2.0 million re-defaulted during the year ended December 31, 2018. Three loans previously modified as TDRs, in the amount of $1.2 million re-defaulted during the year ended December 31, 2017.
6. Premises and Equipment
At December 31, 2018 and 2017, premises and equipment consisted of the following:
December 31, | |||||||
2018 | 2017 | ||||||
(In thousands) | |||||||
Land | $ | 2,300 | $ | 2,300 | |||
Building | 14,126 | 14,030 | |||||
Leasehold improvements | 6,082 | 4,558 | |||||
Furniture and fixtures | 3,584 | 3,096 | |||||
Equipment | 4,155 | 4,478 | |||||
Automobiles | 67 | 67 | |||||
30,314 | 28,529 | ||||||
Accumulated depreciation and amortization | (10,543 | ) | (10,333 | ) | |||
Premises and equipment, net | $ | 19,771 | $ | 18,196 | |||
For the years ended December 31, 2018, 2017 and 2016, depreciation and amortization expense related to premises and equipment totaled $1.7 million, $1.5 million and $1.7 million, respectively.
89
7. Other Assets
The components of other assets as of December 31, 2018 and 2017 are summarized below:
December 31, 2018 | December 31, 2017 | ||||||
(In thousands) | |||||||
Deferred compensation | $ | 2,618 | $ | 4,097 | |||
Servicing assets, net of valuation allowance | 870 | 1,113 | |||||
Derivative assets | 2,868 | 2,034 | |||||
Other | 3,681 | 3,204 | |||||
Total Other Assets | $ | 10,037 | $ | 10,448 | |||
Deferred compensation
The Company has a non-qualified deferred compensation plan for the Board of Directors that allows for the deferral of fees earned related to services rendered for the Company. The deferred compensation balance declined $1.5 million for the year ended December 31, 2018 compared to the year ended December 31, 2017. The decline was primarily driven by distributions from the plan.
Loan servicing
The Bank sells loans in the secondary market and retains the ability to service many of these loans. The Bank earns fees for the servicing provided. Loans serviced for others are not included in the accompanying consolidated balance sheets. The balance of loans serviced for others was $122.4 million and $122.8 million at December 31, 2018 and 2017, respectively. The risks inherent in servicing assets relate primarily to changes in the timing of prepayments that result from shifts in interest rates. The significant assumptions used in the valuation at year-end 2018 for servicing assets included a discount rate ranging from 10% to 12% and pre-payment speed assumptions ranging from 3% to 15%. The significant assumptions used in the valuation at year-end 2017 for servicing assets included a discount rate ranging from 7% to 12% and pre-payment speed assumptions ranging from 7% to 9%.
The carrying value of loan servicing rights was $0.9 million and $1.1 million as of December 31, 2018 and 2017, respectively.
The following table presents the changes in carrying value for loan servicing assets:
December 31, 2018 | December 31, 2017 | ||||||
(In thousands) | |||||||
Loan Servicing Rights: | |||||||
Balance at beginning of year | $ | 1,113 | $ | — | |||
Servicing rights capitalized | 224 | 1,171 | |||||
Servicing rights amortized | (136 | ) | (58 | ) | |||
Servicing rights disposed | (109 | ) | — | ||||
Change in valuation allowance | (222 | ) | — | ||||
Balance at end of year | $ | 870 | $ | 1,113 | |||
Included in accrued expenses and other liabilities, as of December 31, 2018 and 2017, respectively, are $73 thousand and $83 thousand for loan servicing liabilities related to loans serviced for others for which the Company does not receive a servicing fee.
As of December 31, 2018, the Company established a servicing asset valuation allowance in the amount of $222 thousand. Prior to 2018, the Company was not required to have a servicing asset valuation allowance.
90
8. Deposits
At December 31, 2018 and 2017, deposits consisted of the following:
December 31, | |||||||
2018 | 2017 | ||||||
(In thousands) | |||||||
Noninterest bearing demand deposit accounts | $ | 173,198 | $ | 172,638 | |||
Interest bearing accounts: | |||||||
NOW | 61,869 | 58,942 | |||||
Money market | 471,968 | 451,804 | |||||
Savings | 180,487 | 83,758 | |||||
Time certificates of deposit | 614,722 | 631,263 | |||||
Total interest bearing accounts | 1,329,046 | 1,225,767 | |||||
Total deposits | $ | 1,502,244 | $ | 1,398,405 | |||
Maturities of time certificates of deposit as of December 31, 2018 and 2017 are summarized below:
December 31, | |||||||
2018 | 2017 | ||||||
(In thousands) | |||||||
2018 | $ | — | $ | 391,509 | |||
2019 | 411,818 | 214,383 | |||||
2020 | 171,452 | 24,466 | |||||
2021 | 30,615 | 373 | |||||
2022 | 579 | 532 | |||||
2023 | 258 | — | |||||
Total | $ | 614,722 | $ | 631,263 | |||
The aggregate amount of individual certificate accounts, including brokered deposits with balances of $250,000 or more, were approximately $227.8 million and $197.3 million at December 31, 2018 and 2017, respectively.
Brokered certificate of deposits totaled $91.8 million and $44.3 million at December 31, 2018 and 2017, respectively. Certificates of deposits from national listing services totaled $101.5 million at December 31, 2018 and $163.0 million at December 31, 2017.
The following table summarizes interest expense by account type for the years ended December 31, 2018, 2017 and 2016:
Years Ended December 31, | |||||||||||
2018 | 2017 | 2016 | |||||||||
(In thousands) | |||||||||||
NOW | $ | 157 | $ | 93 | $ | 109 | |||||
Money market | 6,431 | 3,427 | 1,836 | ||||||||
Savings | 1,649 | 763 | 315 | ||||||||
Time certificates of deposit | 10,714 | 8,411 | 6,040 | ||||||||
Total interest expense on deposits | $ | 18,951 | $ | 12,694 | $ | 8,300 | |||||
91
9. Federal Home Loan Bank Advances and Other Borrowings
The following is a summary of FHLB advances with maturity dates and weighted average rates at December 31, 2018 and 2017:
December 31, | |||||||||||||
2018 | 2017 | ||||||||||||
Amount Due | Weighted Average Rate | Amount Due | Weighted Average Rate | ||||||||||
(Dollars in thousands) | |||||||||||||
Year of Maturity: | |||||||||||||
2018 | $ | — | — | % | $ | 174,000 | 1.44 | % | |||||
2019 | 135,000 | 2.55 | — | — | |||||||||
2020 | 25,000 | 1.99 | 25,000 | 1.99 | |||||||||
Total advances | $ | 160,000 | 2.46 | % | $ | 199,000 | 1.51 | % | |||||
$125 million of the above mentioned FHLB advances as of December 31, 2018 are subject to interest rate swap transactions, see note 17.
Interest expense on FHLB advances totaled $3.9 million, $2.0 million and $1.3 million for the years ended December 31, 2018, 2017 and 2016, respectively.
The Bank has additional borrowing capacity at the FHLB up to a certain percentage of the value of qualified collateral. In accordance with agreements with the FHLB, the qualified collateral must be free and clear of liens, pledges and encumbrances. At December 31, 2018, the Company had pledged eligible loans with a book value of $939.8 million as collateral to support borrowing capacity at the FHLB of Boston. As of December 31, 2018 the Company has immediate availability to borrow an additional $385.1 million based on qualified collateral.
At December 31, 2018, the Bank had a secured line of credit with the FHLB and unsecured lines of credit with Atlantic Community Bankers Bank, Zions Bank and Texas Capital Bank. The total line of credit and the amount outstanding at December 31, 2018 is summarized below:
December 31, 2018 | |||||||
Total Line of Credit | Total Outstanding | ||||||
(In Thousands) | |||||||
FHLB | $ | 450 | $ | — | |||
Atlantic Community Bankers Bank | 7,500 | — | |||||
Zions Bank | 25,000 | — | |||||
Texas Capital Bank | 5,000 | — | |||||
Total | $ | 37,950 | $ | — | |||
Federal Home Loan Bank Stock
As a member of the FHLB, the Bank is required to maintain investments in their capital stock. The Bank owned 81,096 shares and 91,827 shares at December 31, 2018 and 2017, respectively. There is no ready market or quoted market values for the stock and as such is classified as restricted stock. The shares have a par value of $100 and are carried on the consolidated balance sheets at cost, and evaluated for impairment, as the stock is only redeemable at par subject to the redemption practices of the FHLB.
The determination of whether the par value will ultimately be recovered is influenced by criteria such as the following: (a) the significance of the decline in net assets of the Federal Home Loan Bank as compared to the capital stock amount and the length of time this situation has persisted; (b) commitments by the Federal Home Loan Bank to make payments required by law or regulation and the level of such payments in relation to the operating performance; (c) the impact of legislative and regulatory changes on the customer base of the Federal Home Loan Bank; and (d) the liquidity position of the Federal Home Loan Bank.
Management evaluated the stock and concluded that the stock was not impaired as of December 31, 2018 or 2017.
92
10. Subordinated Debentures
On August 19, 2015, the Company completed a private placement of $25.5 million in aggregate principal amount of fixed rate subordinated notes (the “Notes”) to certain institutional investors. The Notes are non-callable for five years, have a stated maturity of August 15, 2025, and bear interest at a quarterly pay fixed rate of 5.75% per annum to the maturity date or the early redemption date, August 2020 and annually thereafter.
The Notes have been structured to qualify for the Company as Tier 2 capital under regulatory guidelines. We used the net proceeds for general corporate purposes, which included maintaining liquidity at the holding company, providing equity capital to the Bank to fund balance sheet growth and our working capital needs. The Notes were assigned an investment grade rating of BBB by Kroll Bond Rating Agency, which was reaffirmed in the third quarter of 2018.
11. Commitments and Contingencies
Leases
The Company leases all but three locations, plus certain equipment under operating lease agreements, which expire at various dates through 2029. In addition to rental payments, the leases require payment of property taxes and certain common area maintenance fees.
Total future lease obligations totaled $23.7 million and $21.7 million at December 31, 2018 and 2017, respectively. The lease obligations at December 31, 2018 include a land lease with a municipality related to a building purchased in December, 2016. The land lease has a 98 year and 11 month term which commenced on September 1, 2001. The current lease payment is approximately $173 thousand per year and may be adjusted to fair market value in subsequent years. Future minimum rental commitments under the terms of these leases for the year ended December 31, 2018 was as follows:
2018 | |||
(In thousands) | |||
Period Ending December 31, | |||
2019 | $ | 1,972 | |
2020 | 1,842 | ||
2021 | 1,739 | ||
2022 | 1,118 | ||
2023 | 1,134 | ||
Thereafter | 15,898 | ||
Total | $ | 23,703 | |
Total rental expense approximated $2.0 million, $1.8 million and $2.0 million for the years ended December 31, 2018, 2017 and 2016, respectively.
Legal matters
The Company is involved in various legal proceedings which have arisen in the normal course of business. Management believes that resolution of these matters will not have a material effect on the Company’s financial condition or results of operations.
Off-balance sheet instruments
In the normal course of business, the Company is a party to financial instruments with off-balance sheet risk to meet the financing needs of its customers. These financial instruments include commitments to extend credit and involve, to varying degrees, elements of credit and interest rate risk in excess of the amounts recognized in the financial statements. The contractual amounts of these instruments reflect the extent of involvement the Company has in particular classes of financial instruments.
The contractual amounts of commitments to extend credit represent the amounts of potential accounting loss should the contract be fully drawn upon, the customers default, and the value of any existing collateral becomes worthless. Management uses the same credit policies in making commitments and conditional obligations as it does for on-balance sheet instruments and evaluates each customer’s creditworthiness on a case-by-case basis. Management believes that they control the credit risk of these financial instruments through credit approvals, credit limits, monitoring procedures and the receipt of collateral as deemed necessary.
93
Financial instruments whose contract amounts represented credit risk at December 31, 2018 and 2017 were as follows:
December 31, | |||||||
2018 | 2017 | ||||||
(In thousands) | |||||||
Commitments to extend credit: | |||||||
Loan commitments | $ | 190,661 | $ | 112,649 | |||
Undisbursed construction loans | 68,151 | 80,064 | |||||
Unused home equity lines of credit | 7,445 | 7,573 | |||||
$ | 266,257 | $ | 200,286 | ||||
Commitments to extend credit are agreements to lend to a customer as long as there is no violation of any condition established in the contract or certain milestones in the case of construction loans or otherwise required collateral under borrowing base limits are met. Commitments to extend credit generally have fixed expiration dates or other termination clauses and may require payment of a fee by the borrower. Since these commitments could expire without being drawn upon, the total commitment amounts do not necessarily represent future cash requirements. The amount of collateral obtained, if deemed necessary by the Company upon extension of credit, is based on management’s credit evaluation of the counter party. Collateral held varies, but may include residential and commercial property, deposits and securities.
These commitments subject the Company to potential exposure in excess of amounts recorded in the financial statements, and therefore, management maintains a specific reserve for unfunded credit commitments. This reserve is reported as a component of accrued expenses and other liabilities in the accompanying Consolidated Balance Sheets. The reserve for unfunded commitments totaled $175 thousand at December 31, 2018 and $250 thousand at December 31, 2017.
12. Income Taxes
The components of income tax expense for the years ended December 31, 2018, 2017 and 2016 consisted of:
December 31, | |||||||||||
2018 | 2017 | 2016 | |||||||||
(In thousands) | |||||||||||
Current provision: | |||||||||||
Federal | $ | 2,251 | $ | 6,960 | $ | 6,838 | |||||
State | 185 | 431 | 226 | ||||||||
Total current | 2,436 | 7,391 | 7,064 | ||||||||
Deferred provision (benefit): | |||||||||||
Federal | 1,284 | 3,908 | (1,104 | ) | |||||||
Total income tax expense | $ | 3,720 | $ | 11,299 | $ | 5,960 | |||||
In October, 2015, the Company created Bankwell Loan Servicing Group, Inc., a Passive Investment Company (“PIC”) organized for state income tax purposes. The PIC is a wholly-owned subsidiary of the Bank operating in accordance with Connecticut statutes. The PIC’s activities are limited in scope to holding and managing loans that are collateralized by real estate. Income earned by a PIC is determined in accordance with the statutory requirements for a passive investment company and the dividends paid by the PIC to the Bank are not taxable income for Connecticut income tax purposes. As a result of the formation of the PIC, the Bank no longer expects to be subject to Connecticut income taxes. State taxes are being recognized for income taxes on income earned in other states.
On December 22, 2017, the Tax Cuts and Jobs Act of 2017 was signed into law. As a result, the corporate tax rate was reduced from 35% to 21%. Companies were required to recognize the effect of tax law changes in the period of enactment in accordance with GAAP. As result of the tax law changes the Company recognized a write-down of its deferred tax asset in the amount of $3.3 million for the year ended December 31, 2017.
94
A reconciliation of the anticipated income tax expense, computed by applying the statutory federal income tax rate of 21% for the year ended December 31, 2018 and 35% for the years ended December 31, 2017 and 2016 to the income before income taxes, to the amount reported in the consolidated statements of income for the years ended December 31, 2018, 2017, and 2016 was as follows:
December 31, | |||||||||||
2018 | 2017 | 2016 | |||||||||
(In thousands) | |||||||||||
Income tax expense at statutory federal rate | $ | 4,442 | $ | 8,795 | $ | 6,409 | |||||
State tax expense, net of federal tax effect | 99 | 280 | 147 | ||||||||
Statutory rate reductions | — | 3,270 | — | ||||||||
Income exempt from tax | (403 | ) | (822 | ) | (687 | ) | |||||
Benefits related to stock compensation | (68 | ) | (490 | ) | — | ||||||
Deferred director fees | (100 | ) | — | — | |||||||
Other items, net | (250 | ) | 266 | 91 | |||||||
Income tax expense | $ | 3,720 | $ | 11,299 | $ | 5,960 | |||||
At December 31, 2018 and 2017, the components of deferred tax assets and liabilities were as follows:
December 31, | |||||||
2018 | 2017 | ||||||
(In thousands) | |||||||
Deferred tax assets: | |||||||
Allowance for loan losses | $ | 3,284 | $ | 4,022 | |||
Net operating loss carryforwards | 518 | 555 | |||||
Purchase accounting adjustments | — | 14 | |||||
Deferred fees | 1,152 | 1,162 | |||||
Deferred director fees | 31 | — | |||||
Start-up costs | 118 | 144 | |||||
Depreciation | — | 67 | |||||
Unrealized loss on available for sale securities | 367 | — | |||||
Other | 204 | 88 | |||||
Gross deferred tax assets | 5,674 | 6,052 | |||||
Deferred tax liabilities: | |||||||
Deferred expenses | 628 | 482 | |||||
Servicing rights | 166 | 216 | |||||
Purchase accounting adjustments | 61 | — | |||||
Depreciation | 382 | — | |||||
Unrealized gain on derivatives | 90 | 427 | |||||
Unrealized gain on available for sale securities | — | 23 | |||||
Gross deferred tax liabilities | 1,327 | 1,148 | |||||
Net deferred tax asset | $ | 4,347 | $ | 4,904 | |||
A valuation allowance against deferred tax assets is required if, based on the weight of available evidence, it is more-likely-than-not that some or all of the deferred tax assets will not be realized. Management evaluated its remaining deferred tax assets and believes no valuation allowances are needed at December 31, 2018.
At December 31, 2018, the Company had federal net operating loss carryovers of $2.5 million. The carryovers were transferred to the Company upon the merger with The Wilton Bank. The losses will expire after 2032 and are subject to certain annual limitations which amount to $176 thousand per annum.
95
Management regularly analyzes their tax positions and at December 31, 2018 management has established a reserve for uncertain tax positions in conjunction with the Company's out of state lending activity. The total reserve for uncertain tax positions totaled $193 thousand as of December 31, 2018. The tax years 2015 and subsequent are subject to examination by federal and state taxing authorities. The statute of limitations has expired on the years before 2015. No examinations are currently in process.
The following table reflects a reconciliation of the beginning and ending balances of the Company’s uncertain tax positions:
At December 31, | |||||||||||
2018 | 2017 | 2016 | |||||||||
(In thousands) | |||||||||||
Balance, beginning of year | $ | 393 | $ | 95 | $ | — | |||||
(Reductions) additions relating to potential liability with taxing authorities | (200 | ) | 298 | 95 | |||||||
Balance, end of year | $ | 193 | $ | 393 | $ | 95 | |||||
13. 401(K) Profit Sharing Plan
The Company’s employees are eligible to participate in The Bankwell Financial Group, Inc. and its Subsidiaries and Affiliates 401(k) Plan (the “401k Plan”). The 401k Plan covers substantially all employees who are at least 21 years of age. Under the terms of the 401k Plan, participants can contribute up to a certain percentage of their compensation, subject to federal limitations. The Company matches eligible contributions and may make discretionary matching and/or profit sharing contributions. Participants are immediately vested in their contributions and become fully vested in the Company’s contributions after completing five years of service. The Company expensed $265 thousand, $257 thousand and $227 thousand related to the 401k Plan during the years ended December 31, 2018, 2017 and 2016, respectively.
14. Earnings Per Share (EPS)
Unvested restricted stock awards that contain non-forfeitable rights to dividends, are participating securities, and are included in the computation of EPS pursuant to the two-class method. The two-class method is an earnings allocation formula that determines EPS for each class of common stock and participating security according to dividends declared (or accumulated) and participation rights in undistributed earnings. The Company’s unvested restricted stock awards qualify as participating securities.
Net income is allocated between the common stock and participating securities pursuant to the two-class method. Basic EPS is computed by dividing net income available to common shareholders by the weighted average number of common shares outstanding during the period, excluding participating unvested restricted stock awards.
Diluted EPS is computed in a similar manner, except that the denominator includes the number of additional common shares that would have been outstanding if potentially dilutive common shares were issued using the treasury stock method.
The following is a reconciliation of earnings available to common shareholders and basic weighted average common shares outstanding to diluted weighted average common shares outstanding, reflecting the application of the two-class method:
For the Years Ended December 31, | |||||||||||
2018 | 2017 | 2016 | |||||||||
(In thousands, except per share data) | |||||||||||
Net income | $ | 17,433 | $ | 13,830 | $ | 12,350 | |||||
Dividends to participating securities(1) | (51 | ) | (28 | ) | (27 | ) | |||||
Undistributed earnings allocated to participating securities(1) | (178 | ) | (151 | ) | (211 | ) | |||||
Net income for earnings per share calculation | $ | 17,204 | $ | 13,651 | $ | 12,112 | |||||
Weighted average shares outstanding, basic | 7,722 | 7,572 | 7,396 | ||||||||
Effect of dilutive equity-based awards(2) | 53 | 98 | 95 | ||||||||
Weighted average shares outstanding, diluted | 7,775 | 7,670 | 7,491 | ||||||||
Net earnings per common share: | |||||||||||
Basic earnings per common share | $ | 2.23 | $ | 1.80 | $ | 1.64 | |||||
Diluted earnings per common share | $ | 2.21 | $ | 1.78 | $ | 1.62 | |||||
(1) Represents dividends paid and undistributed earnings allocated to unvested stock-based awards that contain non-forfeitable rights to dividends.
(2) Represents the effect of the assumed exercise of stock options and warrants and the vesting of restricted shares, as applicable, utilizing the treasury stock method.
96
15. Stock Based Compensation Plans
Equity award plans
The Company has stock options or unvested restricted stock outstanding under three equity award plans, which are collectively referred to as the “Plan.” The current plan under which any future issuances of equity awards will be made is the 2012 BNC Financial Group, Inc. Stock Plan, or the “2012 Plan,” amended on June 26, 2013. All equity awards made under the 2012 Plan are made by means of an award agreement, which contains the specific terms and conditions of the grant. To date, all equity awards have been in the form of share options or restricted stock. At December 31, 2018, there were 590,079 shares reserved for future issuance under the 2012 Plan.
Stock options: The Company accounts for stock options based on the fair value at the date of grant and records an expense over the vesting period of such awards on a straight line basis.
There were no options granted during the years ended December 31, 2018, 2017 or 2016.
A summary of the status of outstanding stock options at December 31, 2018 is presented below:
December 31, 2018 | ||||||
Number of Shares | Weighted Average Exercise Price | |||||
Options outstanding at beginning of period | 47,050 | $ | 17.83 | |||
Exercised | (28,020 | ) | 19.14 | |||
Options outstanding at end of period | 19,030 | 15.91 | ||||
Options exercisable at end of period | 19,030 | 15.91 | ||||
Intrinsic value is the amount by which the fair value of the underlying stock exceeds the exercise price of an option on the exercise date. The total intrinsic value of stock options exercised during the years ended December 31, 2018, 2017 and 2016 was $0.4 million, $1.1 million and $0.6 million, respectively.
The range of exercise prices for the 19,030 options exercisable at December 31, 2018 was $11.00 to $17.86 per share. The weighted average remaining contractual life for these options was 3.2 years at December 31, 2018. At December 31, 2018, as all awarded options have vested, all of the outstanding options are exercisable, and the aggregate intrinsic value of these options was$0.2 million.
The following table summarizes information for options, all of which are both outstanding and exercisable, at December 31, 2018:
Range of Exercise Prices | Number of Shares | Weighted- Average Remaining Contractual Life (years) | Weighted- Average Exercise Price | ||||||
$11.00–17.86 | 19,030 | 3.2 | $ | 15.91 | |||||
Restricted stock: Restricted stock provides grantees with rights to shares of common stock upon completion of a service period. Shares of unvested restricted stock are considered participating securities. Restricted stock awards generally vest over one to five years.
97
The following table presents the activity for restricted stock for the year ended December 31, 2018:
December 31, 2018 | ||||||
Number of Shares | Weighted Average Grant Date Fair Value | |||||
Unvested at beginning of period | 75,186 | $ | 26.39 | |||
Granted | 44,300 | (1) | 32.81 | |||
Vested | (37,989 | ) | 24.85 | |||
Forfeited | (3,873 | ) | 27.02 | |||
Unvested at end of period | 77,624 | 30.78 | ||||
(1) | Includes 11,250 shares of performance based restricted stock |
The total fair value of restricted stock awards vested during the year ended December 31, 2018 was $1.1 million.
The Company’s restricted stock expense for the years ended December 31, 2018, 2017 and 2016 was $1.3 million, $0.9 million and $1.2 million, respectively. At December 31, 2018 there was $1.8 million of unrecognized stock compensation expense for restricted stock, expected to be recognized over a weighted average period of 1.7 years.
Performance based restricted stock: On February 20, 2018, the Company issued 11,250 shares of restricted stock with performance and service conditions pursuant to the Company’s 2012 Stock Plan. The awards vest over a 3 year service period, provided certain performance metrics are met. The share quantity, which can range between 0% and 200%, of the grant is dependent on the degree to which the performance metrics are met. The Company records an expense over the vesting period based on (a) the probability that the performance metric will be met and (b) the fair market value of the Company’s stock at the date of the grant.
16. Comprehensive Income
Comprehensive income represents the sum of net income and items of other comprehensive income or loss, including net unrealized gains or losses on securities available for sale and net unrealized gains or losses on derivatives accounted for as cash flow hedges. The Company’s total comprehensive income or loss for the years ended December 31, 2018, 2017 and 2016 is reported in the Consolidated Statements of Comprehensive Income.
The following tables present the changes in accumulated other comprehensive (loss) income by component, net of tax for the years ended December 31, 2018, 2017 and 2016:
Net Unrealized Gain (Loss) on Available for Sale Securities | Net Unrealized Gain (Loss) on Interest Rate Swaps | Total | |||||||||
(In thousands) | |||||||||||
Balance at December 31, 2017 | $ | 85 | $ | 1,609 | $ | 1,694 | |||||
Other comprehensive loss before reclassifications, net of tax | (1,289 | ) | (1,267 | ) | (2,556 | ) | |||||
Amounts reclassified from accumulated other comprehensive income, net of tax | (175 | ) | — | (175 | ) | ||||||
Net other comprehensive loss | (1,464 | ) | (1,267 | ) | (2,731 | ) | |||||
Balance at December 31, 2018 | $ | (1,379 | ) | $ | 342 | $ | (1,037 | ) | |||
98
Net Unrealized Gain (Loss) on Available for Sale Securities | Net Unrealized Gain (Loss) on Interest Rate Swaps | Total | |||||||||
(In thousands) | |||||||||||
Balance at December 31, 2016 | $ | 409 | $ | 481 | $ | 890 | |||||
Other comprehensive (loss) income before reclassifications, net of tax | (232 | ) | 843 | 611 | |||||||
Amounts reclassified from accumulated other comprehensive income, net of tax | (108 | ) | — | (108 | ) | ||||||
Net other comprehensive income | (340 | ) | 843 | 503 | |||||||
Amounts reclassified for tax rate changes | 16 | 285 | 301 | ||||||||
Balance at December 31, 2017 | $ | 85 | $ | 1,609 | $ | 1,694 | |||||
Net Unrealized Gain (Loss) on Available for Sale Securities | Net Unrealized Gain (Loss) on Interest Rate Swaps | Total | |||||||||
(In thousands) | |||||||||||
Balance at December 31, 2015 | $ | 405 | $ | (178 | ) | $ | 227 | ||||
Other comprehensive (loss) income before reclassifications, net of tax | (71 | ) | 659 | 588 | |||||||
Amounts reclassified from accumulated other comprehensive income, net of tax | 75 | — | 75 | ||||||||
Net other comprehensive income | 4 | 659 | 663 | ||||||||
Balance at December 31, 2016 | $ | 409 | $ | 481 | $ | 890 | |||||
The following table provides information for the items reclassified from accumulated other comprehensive income or loss:
Accumulated Other Comprehensive Income (Loss) Components | For the Years Ended December 31, | Associated Line Item in the Consolidated Statements Of Income | ||||||||||||
2018 | 2017 | 2016 | ||||||||||||
(In thousands) | ||||||||||||||
Available-for-sale securities: | ||||||||||||||
Unrealized gains (losses) on investments | $ | 222 | $ | 165 | $ | (115 | ) | Gain (loss) on sale of available for sale securities, net | ||||||
Tax (expense) benefit | (47 | ) | (57 | ) | 40 | Income tax expense | ||||||||
Net of tax | $ | 175 | $ | 108 | $ | (75 | ) | |||||||
17. Derivative Instruments
The Company manages economic risks, including interest rate, liquidity, and credit risk by managing the amount, sources, and duration of its funding along with the use of interest rate derivative financial instruments, namely interest rate swaps. The Company does not use derivatives for speculative purposes. As of December 31, 2018, the Bank was a party to nine interest rate swaps to add stability to interest expense and to manage its exposure to interest rate movements. The notional amount for each swap is $25 million and in each case, the Bank has entered into pay-fixed LIBOR interest rate swaps to convert short term rolling Federal Home Loan Bank advances or brokered CD's to long term fixed rates. As of December 31, 2018, three of the Company's nine interest rate swaps represent forward-starting interest rate swaps on probable future FHLB advances or brokered deposits.
The Company accounts for its interest rate swaps as effective cash flow hedges (see Note 1). None of the interest rate swap agreements contain any credit risk related contingent features. A hedging instrument is expected at inception to be highly effective at offsetting changes in the hedged transactions attributable to the changes in the hedged risk.
Interest rate swaps with a positive fair value are recorded as other assets and interest rate swaps with a negative fair value are recorded as other liabilities on the consolidated balance sheets.
99
Information about derivative instruments for the years ended December 31, 2018 and 2017 were as follows:
December 31, 2018:
Notional Amount | Original Maturity | Received | Paid | Fair Value Asset (Liability) | ||||||||||
(Dollars in thousands) | ||||||||||||||
Cash flow hedge: | ||||||||||||||
Interest rate swap | $ | 25,000 | 4.7 years | 3-month USD LIBOR | 1.62 | % | $ | 1 | ||||||
Interest rate swap | 25,000 | 5.0 years | 3-month USD LIBOR | 1.83 | % | 220 | ||||||||
Interest rate swap | 25,000 | 5.0 years | 3-month USD LIBOR | 1.48 | % | 475 | ||||||||
Interest rate swap | 25,000 | 5.0 years | 3-month USD LIBOR | 1.22 | % | 828 | ||||||||
Interest rate swap | 25,000 | 7.0 years | 3-month USD LIBOR | 2.04 | % | 675 | ||||||||
Interest rate swap | 25,000 | 7.0 years | 3-month USD LIBOR | 2.04 | % | 668 | ||||||||
Forward-starting interest rate swap(1) | 25,000 | 15.0 years | 3-month USD LIBOR | 3.01 | % | (807 | ) | |||||||
Forward-starting interest rate swap(1) | 25,000 | 15.0 years | 3-month USD LIBOR | 3.03 | % | (819 | ) | |||||||
Forward-starting interest rate swap(1) | 25,000 | 15.0 years | 3-month USD LIBOR | 3.05 | % | (811 | ) | |||||||
$ | 225,000 | $ | 430 | |||||||||||
(1) The effective date of the forward-starting interest rate swaps listed above are January 2, 2019, January 2, 2020 and August 26, 2020, respectively.
Accrued interest receivable related to interest rate swaps as of December 31, 2018 totaled $224 thousand and is excluded from the fair value presented in the table above. The fair value of interest rate swaps including accrued interest totaled $654 thousand as of December 31, 2018.
December 31, 2017:
Notional Amount | Original Maturity | Received | Paid | Fair Value Asset (Liability) | ||||||||||
(Dollars in thousands) | ||||||||||||||
Cash flow hedge: | ||||||||||||||
Interest rate swap | $ | 25,000 | 4.7 years | 3-month LIBOR | 1.62 | % | $ | 62 | ||||||
Interest rate swap | 25,000 | 5.0 years | 3-month LIBOR | 1.83 | % | 105 | ||||||||
Interest rate swap | 25,000 | 5.0 years | 3-month LIBOR | 1.48 | % | 398 | ||||||||
Interest rate swap | 25,000 | 5.0 years | 3-month LIBOR | 1.22 | % | 793 | ||||||||
Interest rate swap | 25,000 | 7.0 years | 3-month LIBOR | 2.04 | % | 342 | ||||||||
Interest rate swap | 25,000 | 7.0 years | 3-month LIBOR | 2.04 | % | 334 | ||||||||
$ | 150,000 | $ | 2,034 | |||||||||||
Accrued interest payable related to interest rate swaps as of December 31, 2017 totaled $70 thousand and is excluded from the fair value presented in the table above. The fair value of interest rate swaps including accrued interest totaled $1,964 thousand as of December 31, 2017.
The effective portion of unrealized changes in the fair value of derivatives accounted for as cash flow hedges is reported in other comprehensive income and is subsequently reclassified into earnings in the period that the hedged forecasted transaction affects earnings. Amounts reported in accumulated other comprehensive income related to derivatives will be reclassified to interest expense as interest payments are made on the Company's rolling short term debt or brokered deposits. The Company expects to reclassify $1.1 million as a reduction to interest expense during the next 12 months.
The Company assesses the effectiveness of each hedging relationship by comparing the changes in cash flows of the derivative hedging instrument with the changes in cash flows of the designated hedged item or transaction. The interest rate swap assets are presented in other assets and the interest rate swap liabilities are presented in accrued expenses and other liabilities in the Consolidated Balance Sheets.
100
The Company's cash flow hedge positions consist of interest rate swap transactions as detailed in the table below:
Notional Amount | Effective Date of Hedging Relationship | Duration of Interest Rate Swap | Counterparty | |||
(Dollars in thousands) | ||||||
$25,000 | April 1, 2014 | 4.7 years | Bank of Montreal | |||
25,000 | January 2, 2015 | 5.0 years | Bank of Montreal | |||
25,000 | August 26, 2015 | 5.0 years | Bank of Montreal | |||
25,000 | July 1, 2016 | 5.0 years | Bank of Montreal | |||
25,000 | August 25, 2017 | 7.0 years | Bank of Montreal | |||
25,000 | August 25, 2017 | 7.0 years | FTN Financial Capital Markets | |||
$150,000 | ||||||
This hedge strategy converts the rate of interest on short term rolling FHLB advances or brokered deposits to long term fixed interest rates, thereby protecting the Company from interest rate variability.
Changes in the consolidated statements of comprehensive income related to interest rate derivatives designated as hedges of cash flows were as follows for the years ended December 31, 2018 and 2017:
December 31, 2018 | December 31, 2017 | ||||||
(In thousands) | |||||||
Interest rate swap on FHLB advances and brokered CD's: | |||||||
Unrealized (loss) gain recognized in accumulated other comprehensive income | $ | (1,604 | ) | $ | 1,297 | ||
Income tax benefit (expense) on items recognized in accumulated other comprehensive income | 337 | (454 | ) | ||||
Other comprehensive (loss) income | (1,267 | ) | 843 | ||||
Amount recognized in interest expense on hedged FHLB advances and brokered CD's | $ | 2,552 | $ | 1,909 | |||
The following tables summarize gross and net information about derivative instruments that are offset in the Consolidated Balance Sheets at December 31, 2018 and 2017:
December 31, 2018 | |||||||||||||||||||||||
Gross Amounts Not Offset in the Consolidated Balance Sheets | |||||||||||||||||||||||
Gross Amounts of Recognized Assets | Gross Amounts Offset in the Statement of Financial Position | Net Amounts of Assets presented in the Statement of Financial Position | Financial Instruments | Cash Collateral Received | Net Amount | ||||||||||||||||||
Derivative Assets | $ | 3,091 | $ | — | $ | 3,091 | $ | 2,310 | $ | 60 | $ | 721 | |||||||||||
In addition to cash collateral received the Company has also received investment securities as collateral with a fair market value of $1.2 million as of December 31, 2018.
December 31, 2018 | |||||||||||||||||||||||
Gross Amounts Not Offset in the Consolidated Balance Sheets | |||||||||||||||||||||||
Gross Amounts of Recognized Liabilities | Gross Amounts Offset in the Statement of Financial Position | Net Amounts of Liabilities presented in the Statement of Financial Position | Financial Instruments | Cash Collateral Posted | Net Amount | ||||||||||||||||||
Derivative Liabilities | $ | 2,437 | $ | — | $ | 2,437 | $ | 2,310 | $ | — | $ | 127 | |||||||||||
101
December 31, 2017 | |||||||||||||||||||||||
Gross Amounts Not Offset in the Consolidated Balance Sheets | |||||||||||||||||||||||
Gross Amounts of Recognized Assets | Gross Amounts Offset in the Statement of Financial Position | Net Amounts of Assets presented in the Statement of Financial Position | Financial Instruments | Cash Collateral Received | Net Amount | ||||||||||||||||||
Derivative Assets | $ | 1,964 | $ | — | $ | 1,964 | $ | — | $ | 1,780 | $ | 184 | |||||||||||
In addition to cash collateral received the Company has also received investment securities as collateral with a fair market value of $0.3 million as of December 31, 2017.
18. Fair Value of Financial Instruments
GAAP requires disclosure of fair value information about financial instruments, whether or not recognized in the statements of condition, for which it is practicable to estimate that value. In cases where quoted market prices are not available, fair values are based on estimates using present value or other valuation techniques. Those techniques are significantly affected by the assumptions used, including the discount rates and estimates of future cash flows. In that regard, the derived fair value estimates cannot be substantiated by comparisons to independent markets and, in many cases, could not be realized in immediate settlement of the instrument.
Management uses its best judgment in estimating the fair value of the Company’s financial instruments; however, there are inherent limitations in any estimation technique. Therefore, for substantially all financial instruments, the fair value estimates presented herein are not necessarily indicative of the amounts the Company could have realized in a sales transaction. The estimated fair value amounts have been measured as of the respective period-ends, and have not been reevaluated or updated for purposes of these consolidated financial statements subsequent to those respective dates. As such, the estimated fair values of these financial instruments subsequent to the respective reporting dates may be different than the amounts reported at each period-end.
The Company assumes interest rate risk (the risk that general interest rate levels will change) as a result of its normal operations. As a result, the fair values of the Company’s financial instruments will change when interest rate levels change and that change may be either favorable or unfavorable to the Company. Management attempts to match maturities of assets and liabilities to the extent believed necessary to minimize interest rate risk. However, borrowers with fixed rate obligations are less likely to prepay in a rising rate environment and more likely to prepay in a falling rate environment. Conversely, depositors who are receiving fixed rates are more likely to withdraw funds before maturity in a rising rate environment and less likely to do so in a falling rate environment. Management monitors rates and maturities of assets and liabilities and attempts to minimize interest rate risk.
102
The carrying values, fair values and placement in the fair value hierarchy of the Company’s financial instruments at December 31, 2018 and 2017 were as follows:
December 31, 2018 | |||||||||||||||||||
Carrying Value | Fair Value | Level 1 | Level 2 | Level 3 | |||||||||||||||
(In thousands) | |||||||||||||||||||
Financial Assets: | |||||||||||||||||||
Cash and due from banks | $ | 75,411 | $ | 75,411 | $ | 75,411 | $ | — | $ | — | |||||||||
Federal funds sold | 2,701 | 2,701 | 2,701 | — | — | ||||||||||||||
Marketable equity securities | 2,009 | 2,009 | 2,009 | — | — | ||||||||||||||
Available for sale securities | 93,154 | 93,154 | 9,798 | 83,356 | — | ||||||||||||||
Held to maturity securities | 21,421 | 21,988 | — | 1,098 | 20,890 | ||||||||||||||
Loans receivable, net | 1,586,775 | 1,584,858 | — | — | 1,584,858 | ||||||||||||||
Accrued interest receivable | 6,375 | 6,375 | — | 6,375 | — | ||||||||||||||
FHLB stock | 8,110 | 8,110 | — | 8,110 | — | ||||||||||||||
Servicing asset, net of valuation allowance | 870 | 870 | — | — | 870 | ||||||||||||||
Derivative asset, net | 430 | 430 | — | 430 | — | ||||||||||||||
Financial Liabilities: | |||||||||||||||||||
Demand deposits | $ | 173,198 | $ | 173,198 | $ | — | $ | 173,198 | $ | — | |||||||||
NOW and money market | 533,837 | 533,837 | — | 533,837 | — | ||||||||||||||
Savings | 180,487 | 180,487 | — | 180,487 | — | ||||||||||||||
Time deposits | 614,722 | 616,973 | — | — | 616,973 | ||||||||||||||
Accrued interest payable | 1,381 | 1,381 | — | 1,381 | — | ||||||||||||||
Advances from the FHLB | 160,000 | 159,753 | — | — | 159,753 | ||||||||||||||
Subordinated debentures | 25,155 | 24,211 | — | — | 24,211 | ||||||||||||||
Servicing liability | 73 | 73 | — | — | 73 | ||||||||||||||
103
December 31, 2017 | |||||||||||||||||||
Carrying Value | Fair Value | Level 1 | Level 2 | Level 3 | |||||||||||||||
(In thousands) | |||||||||||||||||||
Financial Assets: | |||||||||||||||||||
Cash and due from banks | $ | 70,545 | $ | 70,545 | $ | 70,545 | $ | — | $ | — | |||||||||
Federal funds sold | 186 | 186 | 186 | — | — | ||||||||||||||
Available for sale securities | 92,188 | 92,188 | 9,861 | 82,327 | — | ||||||||||||||
Held to maturity securities | 21,579 | 22,836 | — | 1,119 | 21,717 | ||||||||||||||
Loans receivable, net | 1,520,879 | 1,494,599 | — | — | 1,494,599 | ||||||||||||||
Accrued interest receivable | 5,910 | 5,910 | — | 5,910 | — | ||||||||||||||
FHLB stock | 9,183 | 9,183 | — | 9,183 | — | ||||||||||||||
Servicing asset | 1,113 | 1,113 | — | — | 1,113 | ||||||||||||||
Derivative asset, net | 2,034 | 2,034 | — | 2,034 | — | ||||||||||||||
Financial Liabilities: | |||||||||||||||||||
Demand deposits | $ | 172,638 | $ | 172,638 | $ | — | $ | 172,638 | $ | — | |||||||||
NOW and money market | 510,746 | 510,746 | — | 510,746 | — | ||||||||||||||
Savings | 83,758 | 83,758 | — | 83,758 | — | ||||||||||||||
Time deposits | 631,263 | 629,532 | — | — | 629,532 | ||||||||||||||
Accrued interest payable | 1,092 | 1,092 | — | 1,092 | — | ||||||||||||||
Advances from the FHLB | 199,000 | 198,932 | — | — | 198,932 | ||||||||||||||
Subordinated debentures | 25,103 | 25,457 | — | — | 25,457 | ||||||||||||||
Service liability | 83 | 83 | — | — | 83 | ||||||||||||||
The following methods and assumptions were used by management in estimating the fair value of its financial instruments:
Cash and due from banks, federal funds sold, accrued interest receivable and accrued interest payable: The carrying amount is a reasonable estimate of fair value.
Marketable equity securities, available for sale securities and held to maturity securities: Fair values are based on quoted market prices or dealer quotes, if available. If a quoted market price is not available, fair value is estimated using quoted market prices for similar securities. The majority of the available for sale securities are considered to be Level 2 as other observable inputs are utilized, such as quoted prices for similar securities. Level 1 investment securities include investments in a U.S. treasury note and in marketable equity securities for which a quoted price is readily available in the market. Level 3 held to maturity securities represent private placement municipal housing authority bonds for which no quoted market price is available. The fair value for these securities is estimated using a discounted cash flow model, using discount rates ranging from 4.7% to 5.1% as of December 31, 2018 and 4.5% to 4.8% as of December 31, 2017. These securities are CRA eligible investments.
FHLB stock: The carrying value of FHLB stock approximates fair value based on the most recent redemption provisions of the FHLB.
Loans receivable: For variable rate loans which reprice frequently and have no significant change in credit risk, fair values are based on carrying values. The fair value of fixed rate loans are estimated by discounting the future cash flows using the rates at which similar loans would be made to borrowers with similar credit ratings and for the same remaining maturities. The fair value methodology includes prepayment, default and loss severity assumptions applied by type of loan. The fair value estimate of the loans includes an expected credit loss.
Derivative asset (liability): The valuation of the Company’s interest rate swaps is obtained from a third-party pricing service and is determined using a discounted cash flow analysis on the expected cash flows of each derivative. The pricing analysis is based on observable inputs for the contractual terms of the derivatives, including the period to maturity and interest rate curves. The Bank also considers the creditworthiness of each counterparty for assets and the creditworthiness of the Bank for liabilities.
Servicing Asset (liability): Servicing assets and liabilities do not trade in an active, open market with readily observable prices. The Company estimates the fair value of servicing assets and liabilities using discounted cash flow models, incorporating numerous assumptions from the perspective of a market participant, including market discount rates.
104
Deposits: The fair value of demand deposits, regular savings and certain money market deposits is the amount payable on demand at the reporting date. The fair value of certificates of deposit and other time deposits is estimated using a discounted cash flow calculation that applies interest rates currently being offered for deposits of similar remaining maturities to a schedule of aggregated expected maturities on such deposits.
Borrowings and Subordinated Debentures: The fair value of the Company’s borrowings and subordinated debentures is estimated using a discounted cash flow calculation that applies discount rates currently offered based on similar maturities. The Bank also considers its own creditworthiness in determining the fair value of its borrowings and subordinated debt. Contractual cash flows for the subordinated debt are reduced based on the estimated rates of default, the severity of losses to be incurred on a default, and the rates at which the subordinated debt is expected to prepay after the call date.
Off-balance-sheet instruments: Loan commitments on which the committed interest rate is less than the current market rate are insignificant at December 31, 2018 and 2017.
19. Fair Value Measurements
The Company is required to account for certain assets at fair value on a recurring or non-recurring basis. As discussed in Note 1, the Company determines fair value in accordance with GAAP, which defines fair value and establishes a framework for measuring fair value. Fair value is defined as the exchange price that would be received for an asset or paid to transfer a liability (exit price) in the principal or most advantageous market for the asset or liability in an orderly transaction between market participants on the measurement date. GAAP establishes a fair value hierarchy which requires an entity to maximize the use of observable inputs and minimize the use of unobservable inputs when measuring fair value. The standard describes three levels of inputs that may be used to measure fair values:
Level 1— Quoted prices (unadjusted) for identical assets or liabilities in active markets that the entity has the ability to access as of the measurement date.
Level 2 — Significant other observable inputs other than Level 1 prices such as quoted prices for similar assets or liabilities; quoted prices in markets that are not active; or other inputs that are observable or can be corroborated by observable market data.
Level 3 — Significant unobservable inputs that reflect a company’s own assumptions about the assumptions that market participants would use in pricing an asset or liability.
Valuation techniques based on unobservable inputs are highly subjective and require judgments regarding significant matters such as the amount and timing of future cash flows and the selection of discount rates that may appropriately reflect market and credit risks. Changes in these judgments often have a material impact on the fair value estimates. In addition, since these estimates are as of a specific point in time they are susceptible to material near-term changes.
Financial instruments measured at fair value on a recurring basis
The following table details the financial instruments carried at fair value on a recurring basis at December 31, 2018 and 2017, and indicates the fair value hierarchy of the valuation techniques utilized by the Company to determine the fair value. The Company had no transfers into or out of Levels 1, 2 or 3 during the years ended December 31, 2018 and 2017, except for the Company's investment in a U.S.Treasury note that was transferred from Level 2 to Level 1 for the year ended December 31, 2017.
105
Fair Value | |||||||||||
Level 1 | Level 2 | Level 3 | |||||||||
(In thousands) | |||||||||||
December 31, 2018 | |||||||||||
Marketable equity securities | $ | 2,009 | $ | — | $ | — | |||||
Available for sale investment securities: | |||||||||||
U.S. Government and agency obligations | 9,798 | 72,338 | — | ||||||||
State agency and municipal obligations | — | 4,007 | — | ||||||||
Corporate bonds | — | 7,011 | — | ||||||||
Derivative asset, net | — | 430 | — | ||||||||
December 31, 2017 | |||||||||||
Available for sale investment securities: | |||||||||||
U.S. Government and agency obligations | $ | 9,861 | $ | 62,913 | $ | — | |||||
State agency and municipal obligations | — | 12,277 | — | ||||||||
Corporate bonds | — | 7,137 | — | ||||||||
Derivative asset, net | — | 2,034 | — | ||||||||
Marketable equity securities and available for sale securities: The fair value of the Company’s investment securities are estimated by using pricing models or quoted prices of securities with similar characteristics (i.e. matrix pricing) and are classified within Level 1 or Level 2 of the valuation hierarchy. The pricing is primarily sourced from third party pricing services, overseen by management.
Derivative assets and liabilities: The Company’s derivative assets and liabilities consist of transactions as part of management’s strategy to manage interest rate risk. The valuation of the Company’s interest rate swaps is obtained from a third-party pricing service and is determined using a discounted cash flow analysis on the expected cash flows of each derivative. The pricing analysis is based on observable inputs for the contractual terms of the derivatives, including the period to maturity and interest rate curves. The Company has determined that the majority of the inputs used to value its interest rate derivatives fall within Level 2 of the fair value hierarchy.
Financial instruments measured at fair value on a nonrecurring basis
Certain assets and liabilities are measured at fair value on a non-recurring basis in accordance with GAAP. These include assets that are measured at the-lower-of-cost-or market that were recognized at fair value below cost at the end of the period as well as assets that are not measured at fair value on an ongoing basis but are subject to fair value adjustments in certain circumstances, such as when there is evidence of impairment.
The following table details the financial instruments carried at fair value on a nonrecurring basis at December 31, 2018 and 2017, and indicates the fair value hierarchy of the valuation techniques utilized by the Company to determine the fair value:
Fair Value | |||||||||||
Level 1 | Level 2 | Level 3 | |||||||||
(In thousands) | |||||||||||
December 31, 2018 | |||||||||||
Impaired loans | $ | — | $ | — | $ | 18,709 | |||||
Servicing asset, net | — | — | 797 | ||||||||
December 31, 2017 | |||||||||||
Impaired loans | $ | — | $ | — | $ | 13,898 | |||||
Servicing asset, net | — | — | 1,030 | ||||||||
106
The following table presents information about quantitative inputs and assumptions for Level 3 financial instruments carried at fair value on a nonrecurring basis at December 31, 2018 and 2017:
Fair Value | Valuation Methodology | Unobservable Input | Range | |||||||
(Dollars in thousands) | ||||||||||
December 31, 2018 | ||||||||||
Impaired loans | $ | 10,188 | Appraisals | Discount to appraised value | 5.00–8.00% | |||||
8,521 | Discounted cash flows | Discount rate | 3.25–8.00% | |||||||
$ | 18,709 | |||||||||
Servicing asset, net | $ | 797 | Discounted cash flows | Discount rate | 10.00-12.00% | (1) | ||||
Prepayment rate | 3.00-15.00% | |||||||||
December 31, 2017 | ||||||||||
Impaired loans | $ | 7,711 | Appraisals | Discount to appraised value | 8.00–24.00% | |||||
7,142 | Discounted cash flows | Discount rate | 3.25–6.75% | |||||||
$ | 14,853 | |||||||||
Servicing asset, net | $ | 1,030 | Discounted cash flows | Discount rate | 7.00-12.00% | |||||
Prepayment rate | 7.00-9.00% | |||||||||
(1) Servicing liabilities totaling $73 thousand were valued using a discount rate of 2.8%.
Impaired loans: Loans are generally not recorded at fair value on a recurring basis. Periodically, the Company records nonrecurring adjustments to the carrying value of loans based on fair value measurements for partial charge-offs of the uncollectible portions of those loans. Nonrecurring adjustments also include certain impairment amounts for collateral-dependent loans calculated in accordance with ASC 310-10 when establishing the allowance for credit losses. Such amounts are generally based on the fair value of the underlying collateral supporting the loan. Collateral is typically valued using appraisals or other indications of value based on recent comparable sales of similar properties or other assumptions. Estimates of fair value based on collateral are generally based on assumptions not observable in the marketplace and therefore such valuations have been classified as Level 3. For those loans where the primary source of repayment is cash flow from operations, adjustments include impairment amounts calculated based on the perceived collectability of interest payments on the basis of a discounted cash flow analysis utilizing a discount rate equivalent to the original note rate.
Foreclosed real estate: The Company classifies property acquired through foreclosure or acceptance of deed-in-lieu of foreclosure as foreclosed real estate and repossessed assets in its financial statements. Upon foreclosure, the property securing the loan is written down to fair value less selling costs. The write-down is based upon differences between the appraised value and the book value. Appraisals are based on observable market data such as comparable sales, however assumptions made in determining comparability are unobservable and therefore these assets are classified as Level 3 within the valuation hierarchy.
Servicing assets and liabilities: When loans are sold, on a servicing retained basis, servicing rights are initially recorded at fair value. All classes of servicing assets are subsequently measured using the amortization method which required servicing rights to be amortized. The fair value of servicing assets and liabilities are not measured on an ongoing basis but are subject to fair value adjustments when and if the assets are deemed to be impaired.
107
20. Regulatory Matters
The Federal Reserve, the FDIC and the other federal and state bank regulatory agencies establish regulatory capital guidelines for U.S. banking organizations.
As of January 1, 2015, the Company and the Bank became subject to new capital rules set forth by the Federal Reserve, the FDIC and the other federal and state bank regulatory agencies. The capital rules revise the banking agencies’ leverage and risk-based capital requirements and the method for calculating risk weighted assets to make them consistent with agreements that were reached by the Basel Committee on Banking Supervision and certain provisions of the Dodd-Frank Act (the Basel III Capital Rules).
The Basel III Capital Rules establish a minimum common equity Tier 1 capital requirement of 4.5% of risk-weighted assets; set the minimum leverage ratio at 4% of total assets; increased the minimum Tier 1 capital to risk-weighted assets requirement from 4% to 6%; and retained the minimum total capital to risk weighted assets requirement at 8.0%. A “well-capitalized” institution must generally maintain capital ratios 100 to 200 basis points higher than the minimum guidelines.
The Basel III Capital Rules also change the risk weights assigned to certain assets. The Basel III Capital Rules assigned a higher risk weight (150%) to loans that are more than 90 days past due or are on nonaccrual status and to certain commercial real estate facilities that finance the acquisition, development or construction of real property. The Basel III Capital Rules also alter the risk weighting for other assets, including marketable equity securities that are risk weighted generally at 300%. The Basel III Capital Rules require certain components of accumulated other comprehensive income (loss) to be included for purposes of calculating regulatory capital requirements unless a one-time opt-out is exercised. The Bank did exercise its opt-out option and will exclude the unrealized gain (loss) on investment securities component of accumulated other comprehensive income (loss) from regulatory capital.
The Basel III Capital Rules limit a banking organization’s capital distributions and certain discretionary bonus payments to executive officers if the banking organization does not hold a “capital conservation buffer” consisting of 2.5% of regulatory risk based capital ratios in addition to the amount necessary to meet its minimum risk-based capital requirements. As of December 31, 2018 the conservation buffer to be added was 1.875%, increasing to 2.5% on January 1, 2019.
Failure to meet minimum capital requirements can initiate certain mandatory and possibly additional discretionary actions by regulators that, if undertaken, could have a direct material effect on the Company’s consolidated financial statements.
As of December 31, 2018, the Bank and Company have met all capital adequacy requirements to which they are subject. There are no conditions or events since then that management believes have changed this conclusion.
The capital amounts and ratios for the Bank and the Company at December 31, 2018 were as follows:
Actual Capital | Minimum Regulatory Capital Required for Capital Adequacy plus Capital Conservation Buffer | Minimum Regulatory Capital to be Well Capitalized Under Prompt Corrective Action Provisions | ||||||||||||||||||
Amount | Ratio | Amount | Ratio | Amount | Ratio | |||||||||||||||
(Dollars in thousands) | ||||||||||||||||||||
Bankwell Bank | ||||||||||||||||||||
December 31, 2018 | ||||||||||||||||||||
Common Equity Tier 1 Capital to Risk-Weighted Assets | $ | 191,128 | 11.56 | % | $ | 105,392 | 6.38 | % | $ | 107,459 | 6.50 | % | ||||||||
Total Capital to Risk-Weighted Assets | 206,593 | 12.50 | % | 163,255 | 9.88 | % | 165,321 | 10.00 | % | |||||||||||
Tier I Capital to Risk-Weighted Assets | 191,128 | 11.56 | % | 130,190 | 7.88 | % | 132,257 | 8.00 | % | |||||||||||
Tier I Capital to Average Assets | 191,128 | 10.14 | % | 75,432 | 4.00 | % | 94,290 | 5.00 | % | |||||||||||
Bankwell Financial Group, Inc. | ||||||||||||||||||||
December 31, 2018 | ||||||||||||||||||||
Common Equity Tier 1 Capital to Risk-Weighted Assets | 172,415 | 10.41 | % | 105,575 | 6.38 | % | N/A | N/A | ||||||||||||
Total Capital to Risk-Weighted Assets | 213,035 | 12.86 | % | 163,537 | 9.88 | % | N/A | N/A | ||||||||||||
Tier I Capital to Risk-Weighted Assets | 172,415 | 10.41 | % | 130,416 | 7.88 | % | N/A | N/A | ||||||||||||
Tier I Capital to Average Assets | 172,415 | 9.13 | % | 75,567 | 4.00 | % | N/A | N/A | ||||||||||||
108
The capital amounts and ratios for the Bank and Company at December 31, 2017 were as follows:
Actual Capital | Minimum Regulatory Capital Required for Capital Adequacy plus Capital Conservation Buffer | Minimum Regulatory Capital to be Well Capitalized Under Prompt Corrective Action Provisions | ||||||||||||||||||
Amount | Ratio | Amount | Ratio | Amount | Ratio | |||||||||||||||
(Dollars in thousands) | ||||||||||||||||||||
Bankwell Bank | ||||||||||||||||||||
December 31, 2017 | ||||||||||||||||||||
Common Equity Tier 1 Capital to Risk-Weighted Assets | $ | 173,728 | 10.99 | % | $ | 90,858 | 5.75 | % | $ | 102,709 | 6.50 | % | ||||||||
Total Capital to Risk-Weighted Assets | 192,632 | 12.19 | % | 146,162 | 9.25 | % | 158,014 | 10.00 | % | |||||||||||
Tier I Capital to Risk-Weighted Assets | 173,728 | 10.99 | % | 114,560 | 7.25 | % | 126,411 | 8.00 | % | |||||||||||
Tier I Capital to Average Assets | 173,728 | 9.61 | % | 72,349 | 4.00 | % | 90,437 | 5.00 | % | |||||||||||
Bankwell Financial Group, Inc. | ||||||||||||||||||||
December 31, 2017 | ||||||||||||||||||||
Common Equity Tier 1 Capital to Risk-Weighted Assets | 155,977 | 9.83 | % | 91,194 | 5.75 | % | N/A | N/A | ||||||||||||
Total Capital to Risk-Weighted Assets | 199,984 | 12.61 | % | 146,703 | 9.25 | % | N/A | N/A | ||||||||||||
Tier I Capital to Risk-Weighted Assets | 155,977 | 9.83 | % | 114,983 | 7.25 | % | N/A | N/A | ||||||||||||
Tier I Capital to Average Assets | 155,977 | 8.59 | % | 72,663 | 4.00 | % | N/A | N/A | ||||||||||||
Regulatory restrictions on dividends
The ability of the Company to pay dividends depends, in part, on the ability of the Bank to pay dividends to the Company. In accordance with Connecticut statutes, regulatory approval is required to pay dividends in excess of the Bank’s profits retained in the current year plus retained profits from the previous two years. The Bank is also prohibited from paying dividends that would reduce its capital ratios below minimum regulatory requirements.
Reserve requirements on cash
The Bank is required to maintain a minimum reserve balance of $16.8 million and $11.1 million in the Federal Reserve Bank at December 31, 2018 and 2017, respectively. The Bank is also required to maintain a minimum reserve balance of $4.5 million and $7.5 million at the Atlantic Community Bankers Bank (formerly Bankers' Bank Northeast) at December 31, 2018 and 2017, respectively. These balances are maintained for clearing purposes in the ordinary course of business and do not represent restricted cash.
21. Related Party Transactions
In the normal course of business, the Company may grant loans to executive officers, directors and members of their immediate families, as defined, and to entities in which these individuals have more than a 10% equity ownership. Such loans are transacted at terms including interest rates, similar to those available to unrelated customers. Changes in loans outstanding to such related parties during the years ending December 31, 2018 and 2017 were as follows:
December 31, | |||||||
2018 | 2017 | ||||||
(In thousands) | |||||||
Balance, beginning of year | $ | 20,721 | $ | 22,471 | |||
Additional loans | 1,702 | 3,067 | |||||
Repayments | (9,417 | ) | (4,831 | ) | |||
Effect of changes in related parties | (4,333 | ) | 14 | ||||
Balance, end of year | $ | 8,673 | $ | 20,721 | |||
Related party deposits aggregated approximately $46.7 million and $45.4 million at December 31, 2018 and 2017, respectively.
During the years ended December 31, 2018 and 2017, the Company paid approximately $60 thousand and $133 thousand, respectively, to related parties for services provided to the Company. The payments were primarily for consulting and legal services.
109
22. Parent Company Only Financial Statements
Bankwell Financial Group, Inc., The Parent Company, operates its wholly-owned subsidiary, Bankwell Bank. The earnings of this subsidiary are recognized by the Parent Company using the equity method of accounting. Accordingly, earnings are recorded as increases in the Parent Company’s investment in the subsidiary and dividends paid reduce the investment in the subsidiary.
Condensed financial statements of the Parent Company only are as follows:
Condensed Statements of Financial Condition
At December 31, | |||||||
2018 | 2017 | ||||||
(Dollars in Thousands) | |||||||
ASSETS | |||||||
Cash and due from banks | $ | 6,349 | $ | 2,494 | |||
Investment in subsidiary | 192,909 | 178,778 | |||||
Premises and equipment, net | 11 | 17 | |||||
Deferred income taxes, net | 129 | 53 | |||||
Other assets | 2,937 | 9,068 | |||||
Total assets | $ | 202,335 | $ | 190,410 | |||
LIABILITIES AND SHAREHOLDERS’ EQUITY | |||||||
Subordinated debentures | $ | 25,155 | $ | 25,103 | |||
Accrued expenses and other liabilities | 2,984 | 4,280 | |||||
Shareholders’ equity | 174,196 | 161,027 | |||||
Total liabilities and shareholders’ equity | $ | 202,335 | $ | 190,410 | |||
Condensed Statements of Income
Year Ended December 31, | |||||||||||
2018 | 2017 | 2016 | |||||||||
(Dollars in Thousands) | |||||||||||
Interest income | $ | 15 | $ | 13 | $ | 23 | |||||
Dividend income from subsidiary | 4,000 | — | — | ||||||||
Total income | 4,015 | 13 | 23 | ||||||||
Expenses | 3,444 | 2,295 | 3,444 | ||||||||
Income (loss) before equity in undistributed earnings of subsidiaries | 571 | (2,282 | ) | (3,421 | ) | ||||||
Equity in undistributed earnings of subsidiaries | 16,862 | 16,112 | 15,771 | ||||||||
Net Income | $ | 17,433 | $ | 13,830 | $ | 12,350 | |||||
110
Condensed Statements of Cash Flows
For the Years Ended December 31, | |||||||||||
2018 | 2017 | 2016 | |||||||||
(Dollars in Thousands) | |||||||||||
Cash flows from operating activities | |||||||||||
Net income | $ | 17,433 | $ | 13,830 | $ | 12,350 | |||||
Adjustments to reconcile net income to net cash used by operating activities: | |||||||||||
Equity in undistributed earnings | (16,862 | ) | (16,112 | ) | (15,771 | ) | |||||
Decrease (increase) in other assets | 6,131 | (5,179 | ) | (1,828 | ) | ||||||
(Increase) decrease in deferred income taxes, net | (76 | ) | 3,010 | 2,385 | |||||||
(Decrease) increase in other liabilities | (1,296 | ) | 380 | 1,620 | |||||||
Stock-based compensation | 1,290 | 917 | 1,188 | ||||||||
Amortization of debt issuance costs | 52 | 52 | 51 | ||||||||
Net cash provided by (used in) operating activities | 6,672 | (3,102 | ) | (5 | ) | ||||||
Cash flows from investing activities | |||||||||||
Decrease in premises and equipment, net | 6 | 37 | 65 | ||||||||
Net cash provided by investing activities | 6 | 37 | 65 | ||||||||
Cash flows from financing activities | |||||||||||
Proceeds from exercise of options & warrants | 936 | 2,031 | 1,106 | ||||||||
Dividends paid on common stock | (3,759 | ) | (2,149 | ) | (1,661 | ) | |||||
Proceeds from issuance of common stock | — | — | 200 | ||||||||
Net tax benefit related to stock-based compensation | — | — | 280 | ||||||||
Net cash used in financing activities | (2,823 | ) | (118 | ) | (75 | ) | |||||
Net increase (decrease) in cash and cash equivalents | 3,855 | (3,183 | ) | (15 | ) | ||||||
Cash and cash equivalents: | |||||||||||
Beginning of year | 2,494 | 5,677 | 5,692 | ||||||||
End of year | $ | 6,349 | $ | 2,494 | $ | 5,677 | |||||
Supplemental disclosures of cash flows information: | |||||||||||
Cash paid for: | |||||||||||
Interest | — | — | — | ||||||||
Income taxes | — | — | — | ||||||||
111
23. Quarterly Financial Information of Bankwell Financial Group, Inc. (Unaudited)
The following tables present selected quarterly financial information (unaudited):
2018 | |||||||||||||||
4th Quarter | 3rd Quarter | 2nd Quarter | 1st Quarter | ||||||||||||
(Dollars in Thousands, except per share amounts) | |||||||||||||||
Total interest income | $ | 21,543 | $ | 20,500 | $ | 19,414 | $ | 18,607 | |||||||
Total interest expense | 7,076 | 6,254 | 5,506 | 4,902 | |||||||||||
Net interest income | 14,467 | 14,246 | 13,908 | 13,705 | |||||||||||
Provision for loan losses | 2,795 | 322 | 310 | 13 | |||||||||||
Noninterest income | 601 | 859 | 1,107 | 1,333 | |||||||||||
Noninterest expense | 8,796 | 8,870 | 8,764 | 9,203 | |||||||||||
Income before income tax expense | 3,477 | 5,913 | 5,941 | 5,822 | |||||||||||
Income tax expense | 216 | 1,056 | 1,226 | 1,222 | |||||||||||
Net income | $ | 3,261 | $ | 4,857 | $ | 4,715 | $ | 4,600 | |||||||
Earnings per common share: | |||||||||||||||
Basic | $ | 0.42 | $ | 0.62 | $ | 0.60 | $ | 0.59 | |||||||
Diluted | $ | 0.41 | $ | 0.62 | $ | 0.60 | $ | 0.59 | |||||||
2017 | |||||||||||||||
4th Quarter | 3rd Quarter | 2nd Quarter | 1st Quarter | ||||||||||||
(Dollars in Thousands, except per share amounts) | |||||||||||||||
Total interest income | $ | 18,729 | $ | 18,348 | $ | 17,688 | $ | 16,436 | |||||||
Total interest expense | 4,815 | 4,487 | 4,047 | 3,488 | |||||||||||
Net interest income | 13,914 | 13,861 | 13,641 | 12,948 | |||||||||||
(Credit) Provision for loan losses | (495 | ) | 398 | 895 | 543 | ||||||||||
Noninterest income | 1,541 | 824 | 998 | 1,266 | |||||||||||
Noninterest expense | 8,579 | 8,129 | 7,581 | 8,234 | |||||||||||
Income before income tax expense | 7,371 | 6,158 | 6,163 | 5,437 | |||||||||||
Income tax expense | 5,275 | 1,895 | 2,394 | 1,735 | |||||||||||
Net income | $ | 2,096 | $ | 4,263 | $ | 3,769 | $ | 3,702 | |||||||
Earnings per common share: | |||||||||||||||
Basic | $ | 0.27 | $ | 0.55 | $ | 0.49 | $ | 0.49 | |||||||
Diluted | $ | 0.27 | $ | 0.55 | $ | 0.49 | $ | 0.48 | |||||||
Note: Due to rounding, quarterly earnings per share may not sum to reported annual earnings per share.
During the fourth quarter of 2018, the Company recognized a $6.2 million charge-off attributable to one lending relationship.
During the fourth quarter of 2017, the Company had changed its methodology to estimate its allowance for loan losses. The change in methodology resulted in an update to the underlying loan loss assumptions, incorporating the most recent industry, peer and product loss trends. This resulted in a non-recurring, pretax $1.3 million reduction in the allowance for loan loss reserve. In addition, On December 22, 2017, the Tax Cuts and Jobs Act of 2017 was signed into law. As a result, the corporate tax rate was reduced from 35% to 21%. Companies were required to recognize the effect of tax law changes in the period of enactment in accordance with GAAP. As result of the tax law changes the Company recognized a write-down of its deferred tax asset in the amount of $3.3 million.
112
24. Subsequent Events
The Company's Board of Directors declared a $0.13 per share cash dividend, payable February 25, 2019 to shareholders of record on February 15, 2019, representing an 8% increase when compared to last quarter's dividend.
Item 9. Changes in and Disagreements with Accountants on Accounting and Financial Disclosure
None.
Item 9A. Controls and Procedures
Disclosure Controls and Procedures
Under the supervision and with the participation of the Company’s management, including the Chief Executive Officer and Chief Financial Officer, the Company has evaluated the effectiveness of the design and operation of Bankwell’s disclosure controls and procedures (as defined in Rule 13a-15(e) and 15d under the Securities Exchange Act of 1934, as amended) as of the end of the period covered by this report. Based upon that evaluation, management, including the Chief Executive Officer and Chief Financial Officer, concluded that Bankwell’s disclosure controls and procedures were effective as of the end of the period covered by this report.
Internal Control over Financial Reporting
Bankwell’s management has issued a report on its assessment of the effectiveness of the Company’s internal control over financial reporting as of December 31, 2018. As of December 31, 2018, senior management concluded that Bankwell maintained effective internal control over financial reporting.
During the year ended December 31, 2017, management identified a material weakness resulting from the aggregation of control deficiencies in management’s review of the allowance for loan losses, including certain process level controls to ensure the completeness and accuracy of loan reports used in the classification of loans as well as the precision of management’s review over the calculation of the allowance for loan losses balance. This material weakness did not result in any misstatement of the Company’s consolidated financial statements for any period presented.
To remediate the material weakness described above, we hired a director of internal audit to supplement internal and external resources dedicated to the documentation and testing of the Company's internal control over financial reporting and updated the end-to-end design of internal controls over the allowance process to ensure greater oversight over the completeness and accuracy of reports used as well as increased precision in the review of the calculation of the allowance for loan losses. During the fourth quarter of fiscal 2018, we successfully completed the testing necessary to conclude that the controls were appropriately designed and operating effectively and have concluded that the material weakness has been fully remediated.
Except for the changes referenced in the prior paragraph, there were no changes made in the Company's internal control over financial reporting that occurred during the fiscal quarter ended December 31, 2018 that have materially affected, or are reasonably likely to materially affect, the Company’s internal control over financial reporting. The report of the Company's management follows.
Management’s Report on Internal Control over Financial Reporting
The management of Bankwell Financial Group and its Subsidiaries is responsible for establishing and maintaining adequate internal control over financial reporting (as defined in Rule 13a-15(f) under the Securities Exchange Act of 1934, as amended). The Company’s internal control over financial reporting is a process designed under the supervision of its Chief Executive Officer and Chief Financial Officer to provide reasonable assurance regarding the reliability of financial reporting and the preparation of financial statements for external purposes in accordance with generally accepted accounting principles.
A material weakness is defined as a deficiency, or a combination of deficiencies, in internal control over financial reporting, such that there is a reasonable possibility that a material misstatement of the Company’s annual or interim financial statements will not be prevented or detected on a timely basis.
Management assessed the effectiveness of the Company’s internal control over financial reporting as of December 31, 2018 based on criteria established in Internal Control-Integrated Framework (2013) issued by the Committee of Sponsoring Organizations of the Treadway Commission (COSO).
Based on management’s assessment, management concluded that, as of December 31, 2018, the Company’s internal control over financial reporting was effective based on criteria established in Internal Control-Integrated Framework (2013) issued by COSO.
In accordance with the rules and regulations of the SEC, management’s report on the design and effectiveness of Bankwell’s system of internal control over financial reporting is not subject to attestation by Bankwell’s independent registered public
113
accounting firm. The SEC rules and regulations applicable to Bankwell only require a report by management. Accordingly, this annual report filed on Form 10-K for the year ended December 31, 2018 does not include an opinion by Bankwell’s independent registered public accounting firm regarding management’s system of internal control over financial reporting.
Item 9b. Other Information
None.
114
PART III
Item 10. Directors, Executive Officers and Corporate Governance
The Company responds to this item by incorporating herein by reference the material responsive to such item in the Company’s definitive proxy statement for its 2019 Annual Meeting of Stockholders, to be filed with the Commission no later than April 30, 2019.
Item 11. Executive Compensation
The Company responds to this item by incorporating herein by reference the material responsive to such item in the Company’s definitive proxy statement for its 2019 Annual Meeting of Stockholders, to be filed with the Commission no later than April 30, 2019.
Item 12. Security Ownership of Certain Beneficial Owners and Management and Related Stockholder Matters
The Company responds to this item by incorporating herein by reference the material responsive to such item in the Company’s definitive proxy statement for its 2019 Annual Meeting of Stockholders, to be filed with the Commission no later than April 30, 2019.
Item 13. Certain Relationships and Related Transactions, and Director Independence
The Company responds to this item by incorporating herein by reference the material responsive to such item in the Company’s definitive proxy statement for its 2019 Annual Meeting of Stockholders, to be filed with the Commission no later than April 30, 2019.
Item 14. Principal Accountant Fees and Services
The Company responds to this item by incorporating herein by reference the material responsive to such item in the Company’s definitive proxy statement for its 2019 Annual Meeting of Stockholders, to be filed with the Commission no later than April 30, 2019.
115
PART IV
Item 15. Exhibits, Financial Statement Schedules
(A)(1) FINANCIAL STATEMENTS
The following consolidated financial statements of the Company are included in Item 8 of this report:
(A)(2) FINANCIAL STATEMENT SCHEDULES
Certain schedules to the consolidated financial statements have been omitted if they were not required by Article 9 of Regulation S-X or if, under the related instructions, they were inapplicable, or the information was contained elsewhere herein.
(A)(3) EXHIBITS
The exhibits listed in the Exhibit Index in this Form 10-K are filed herewith or are incorporated herein by reference to other SEC filings.
116
Exhibit Index
Number | Description | |
Exhibit 3.1 | ||
Exhibit 3.2 | ||
Exhibit 10.1† | ||
Exhibit 10.4† | ||
Exhibit 10.5† | ||
Exhibit 10.6† | ||
Exhibit 10.7† | ||
Exhibit 10.8† | ||
Exhibit 10.9† | ||
Exhibit 10.10† | ||
Exhibit 10.11† | ||
Exhibit 10.14† | ||
Exhibit 10.15† | ||
Exhibit 10.16 | ||
Exhibit 10.17 | ||
Exhibit 10.18† | ||
Exhibit 21.1 | ||
Exhibit 23.2 | ||
Exhibit 23.3 | ||
Exhibit 31.1 | ||
Exhibit 31.2 | ||
Exhibit 32 | ||
101 | The following materials from Bankwell Financial Group, Inc.’s Annual Report on Form 10-K for the period ended December 31, 2018, formatted in extensible Business Reporting Language (XBRL): (i) Consolidated Balance Sheets; (ii) Consolidated Statements of Income; (iii) Consolidated statements of Comprehensive Income; (iv) Consolidated Statements of Shareholders’ Equity; (v) Consolidated Statements of Cash Flows; and (vi) Notes to Consolidated Financial Statements. | |
† Management contract or compensatory plan or arrangement
(1) Filed as part of the Registrant’s Registration Statement on Form S-1 filed on April 4, 2014.
(2) Filed as part of the Registrant’s Amendment No. 1 to Registration Statement on Form S-1 filed on May 5, 2014.
(3) Filed as part of the Registrant’s December 31, 2016 Form 10-K
(4) Filed as part of the Registrant's June 30, 2018 Form 10-Q
Item 16. 10-K Summary
None.
117
SIGNATURES
Pursuant to the requirements of Section 13 or 15(d) of the Securities Exchange Act of 1934, the Registrant has duly caused this report to be signed on its behalf by the undersigned, thereunto duly authorized.
BANKWELL FINANCIAL GROUP, INC. | ||
By: | /s/ Christopher R. Gruseke | |
Christopher R. Gruseke President and Chief Executive Officer | ||
Pursuant to the requirements of the Securities Exchange Act of 1934, this report has been signed below by the following persons on behalf of the registrant and in the capacities and on the dates indicated.
Signature & Title | Date | |
/s/ Christopher R. Gruseke | March 4, 2019 | |
Christopher R. Gruseke President and Chief Executive Officer (principal executive officer) | ||
/s/ Penko Ivanov | March 4, 2019 | |
Penko Ivanov Executive Vice President & Chief Financial Officer (principal financial and accounting officer) | ||
/s/ George P. Bauer | March 4, 2019 | |
George P. Bauer Director | ||
/s/ Gail Brathwaite | March 4, 2019 | |
Gail Brathwaite Director | ||
/s/ Richard Castiglioni | March 4, 2019 | |
Richard Castiglioni Director | ||
/s/ Eric J. Dale | March 4, 2019 | |
Eric J. Dale Director | ||
/s/ Blake S. Drexler | March 4, 2019 | |
Blake S. Drexler Director | ||
/s/ James M. Garnett | March 4, 2019 | |
James M. Garnett Director | ||
/s/ Daniel S. Jones | March 4, 2019 | |
Daniel S. Jones Director | ||
/s/ Todd Lampert | March 4, 2019 | |
Todd Lampert Director | ||
/s/ Victor S. Liss | March 4, 2019 | |
Victor S. Liss Director | ||
/s/ Carl M. Porto | March 4, 2019 | |
Carl M. Porto Director | ||
118