Exhibit 99.1
|
|
UPDATE COMPANY JULY 2019
|
AS & WELLNESS THE LEADING BRAND, GLOBAL HEALTH OUR AND MISSION SUPPORT IS THE TO DESIRE MOTIVATE TO LIVE WELL. 2
|
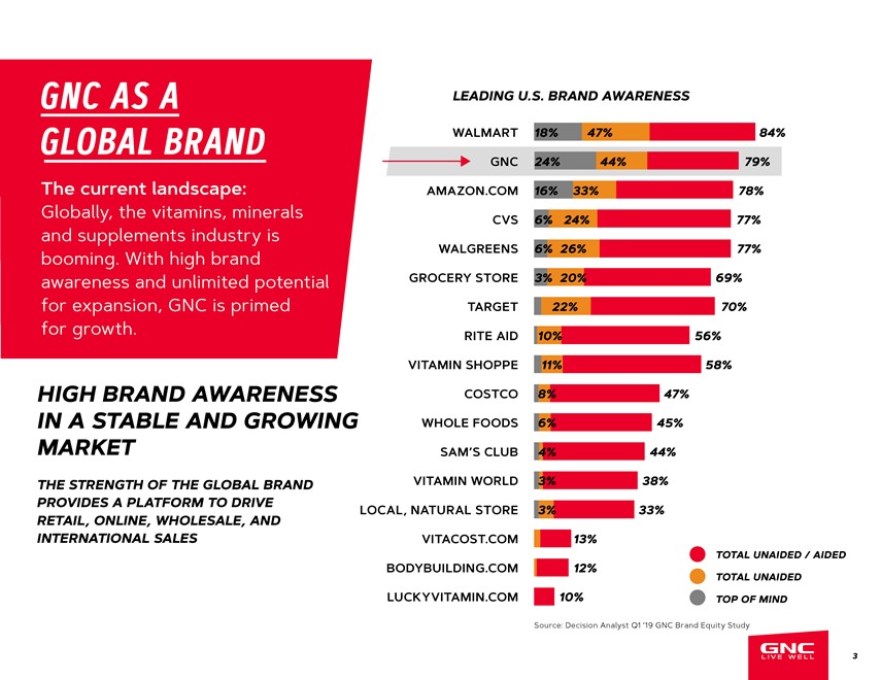
GNC AS A GLOBAL BRAND The current landscape: Globally, the vitamins, minerals and supplements industry is booming. With high brand awareness and unlimited potential for expansion, GNC is primed for growth. HIGH BRAND AWARENESS IN A STABLE AND GROWING MARKET THE STRENGTH OF THE GLOBAL BRAND PROVIDES A PLATFORM TO DRIVE RETAIL, ONLINE, WHOLESALE, AND INTERNATIONAL SALES LEADING U.S. BRAND AWARENESS WALMART 18% 47% 84% GNC 24% 44% 79% AMAZON.COM 16% 33% 78% CVS 6% 24% 77% WALGREENS 6% 26% 77% GROCERY STORE 3% 20% 69% TARGET 22% 70% RITE AID 10% 56% VITAMIN SHOPPE 11% 58% COSTCO 8% 47% WHOLE FOODS 6% 45% SAM’S CLUB 4% 44% VITAMIN WORLD 3% 38% LOCAL, NATURAL STORE 3% 33% VITACOST.COM 13% TOTAL UNAIDED / AIDED BODYBUILDING.COM 12% TOTAL UNAIDED LUCKYVITAMIN.COM 10% TOP OF MIND Source: Decision Analyst Q1 ’19 GNC Brand Equity Study 3
|
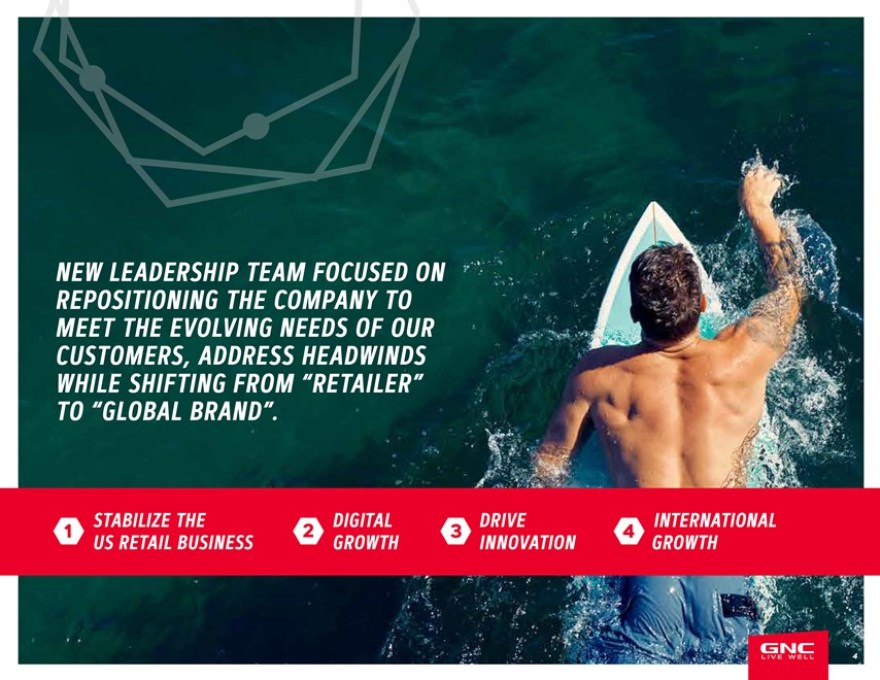
NEW LEADERSHIP TEAM FOCUSED ON REPOSITIONING THE COMPANY TO MEET THE EVOLVING NEEDS OF OUR CUSTOMERS, ADDRESS HEADWINDS WHILE SHIFTING FROM “RETAILER” TO “GLOBAL BRAND”. STABILIZE THE 2 DIGITAL DRIVE INTERNATIONAL 1 3 4 US RETAIL BUSINESS GROWTH INNOVATION GROWTH 4
|
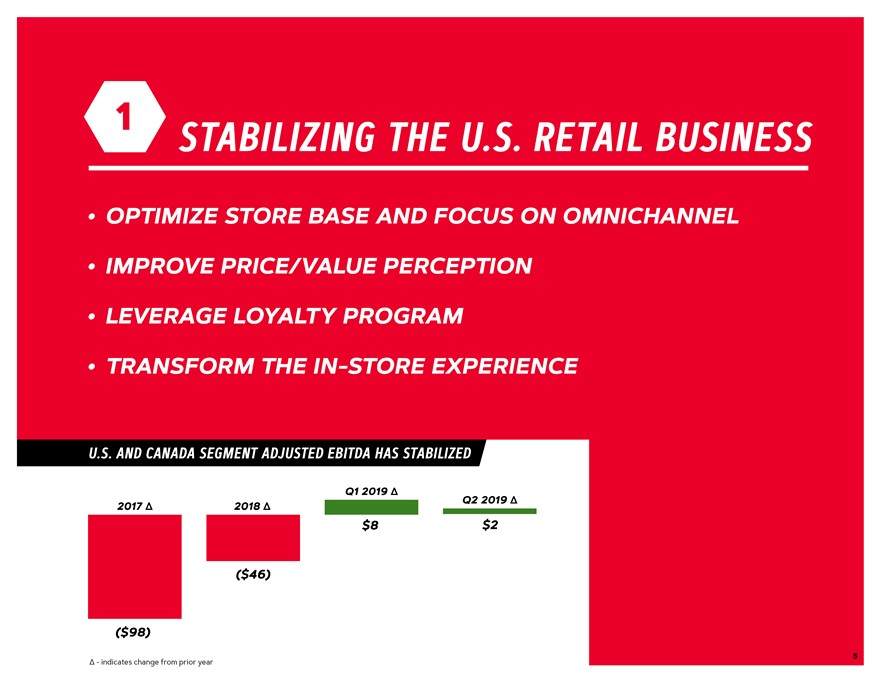
1 STABILIZING THE U.S. RETAIL BUSINESS OPTIMIZE STORE BASE AND FOCUS ON OMNICHANNEL IMPROVE PRICE/VALUE PERCEPTION LEVERAGE LOYALTY PROGRAM TRANSFORM THE IN-STORE EXPERIENCE U.S. AND CANADA SEGMENT ADJUSTED EBITDA HAS STABILIZED Q1 2019 Δ Q2 2019 Δ 2017 Δ 2018 Δ $8 $2 ($46) ($98) 5 Δ—indicates change from prior year
|
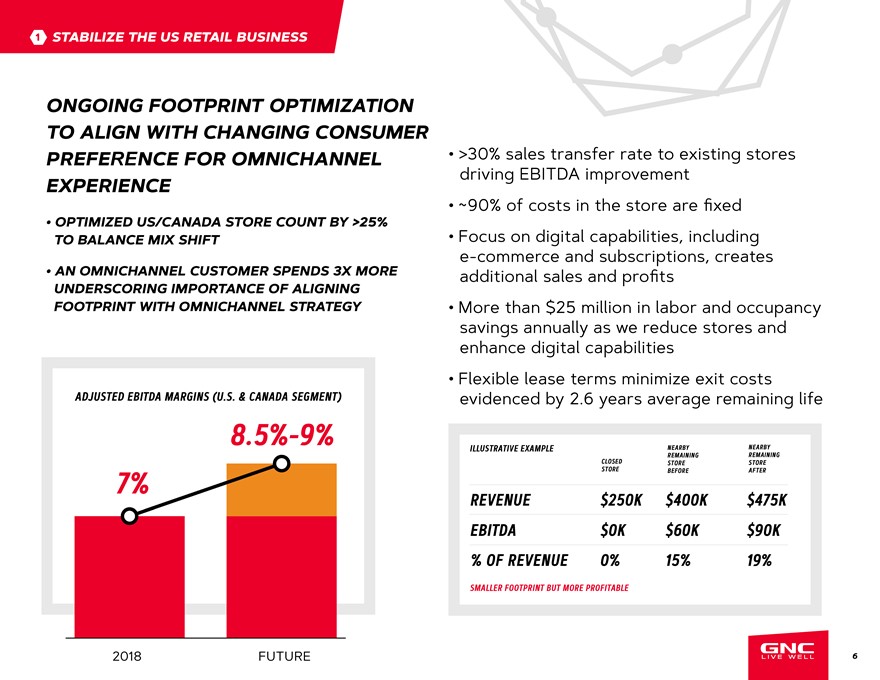
STABILIZE T 1 HE US RETAIL BUSINESS >30% sales transfer rate to existing stores driving EBITDA improvement ~90% of costs in the store are fixed Focus on digital capabilities, including e-commerce and subscriptions, creates additional sales and profits More than $25 million in labor and occupancy savings annually as we reduce stores and enhance digital capabilities Flexible lease terms minimize exit costs evidenced by 2.6 years average remaining life ONGOING FOOTPRINT OPTIMIZATION TO ALIGN WITH CHANGING CONSUMER PREFERENCE FOR OMNICHANNEL EXPERIENCE OPTIMIZED US/CANADA STORE COUNT BY >25% TO BALANCE MIX SHIFT AN OMNICHANNEL CUSTOMER SPENDS 3X MORE UNDERSCORING IMPORTANCE OF ALIGNING FOOTPRINT WITH OMNICHANNEL STRATEGY 7% 8.5%-9% 2018 FUTURE ADJUSTED EBITDA MARGINS (U.S. & CANADA SEGMENT) REVENUE $250K $400K $475K EBITDA $0K $60K $90K % OF REVENUE 0% 15% 19% 6 SMALLER FOOTPRINT BUT MORE PROFITABLE ILLUSTRATIVE EXAMPLE CLOSED STORE NEARBY REMAINING STORE BEFORE NEARBY REMAINING STORE AFTER

|
1 STABILIZE THE US RETAIL BUSINESS CHANGE CONSUMER PRICE/VALUE PERCEPTION IN THE MARKET Price/quality guarantee marketing campaign launched in June 2019 becomes part of evergreen messaging going forward Highlight price competitiveness on GNC brand products relative to PRICE/VALUE COMPARISON comparable premium value products Combat commoditization by reinforcing AMAZON WALMART GNC quality and value of GNC products 30 SERVINGS | $16.97 100 SERVINGS | $59.64 120 SERVINGS | $49.99 $0.57 $0.66 $0.42 PER SERVING PER SERVING PER SERVING* *PROMOTIONAL PRICE RESULTS IN EVEN BETTER VALUE FOR THE CONSUMER 7
|
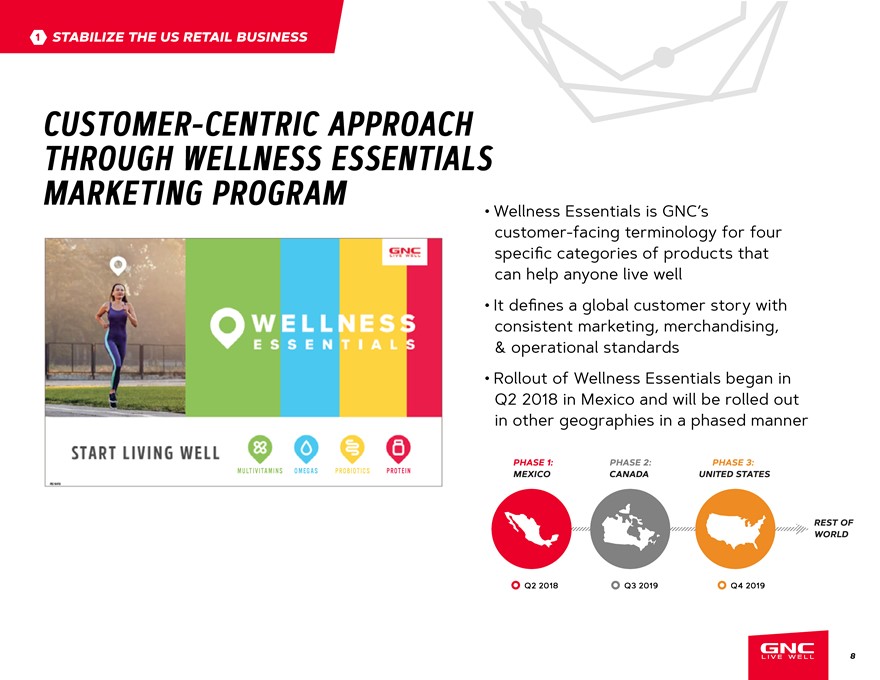
1 STABILIZE THE US RETAIL BUSINESS CUSTOMER-CENTRIC APPROACH THROUGH WELLNESS ESSENTIALS MARKETING PROGRAM Wellness Essentials is GNC’s customer-facing terminology for four specific categories of products that can help anyone live well It defines a global customer story with consistent marketing, merchandising, & operational standards Rollout of Wellness Essentials began in Q2 2018 in Mexico and will be rolled out in other geographies in a phased manner PHASE 1: PHASE 2: PHASE 3: MULT IVI TAMINS OMEG AS PROBIO T IC S PRO T EIN MEXICO CANADA UNITED STATES REST OF WORLD Q2 2018 Q3 2019 Q4 2019 8
|
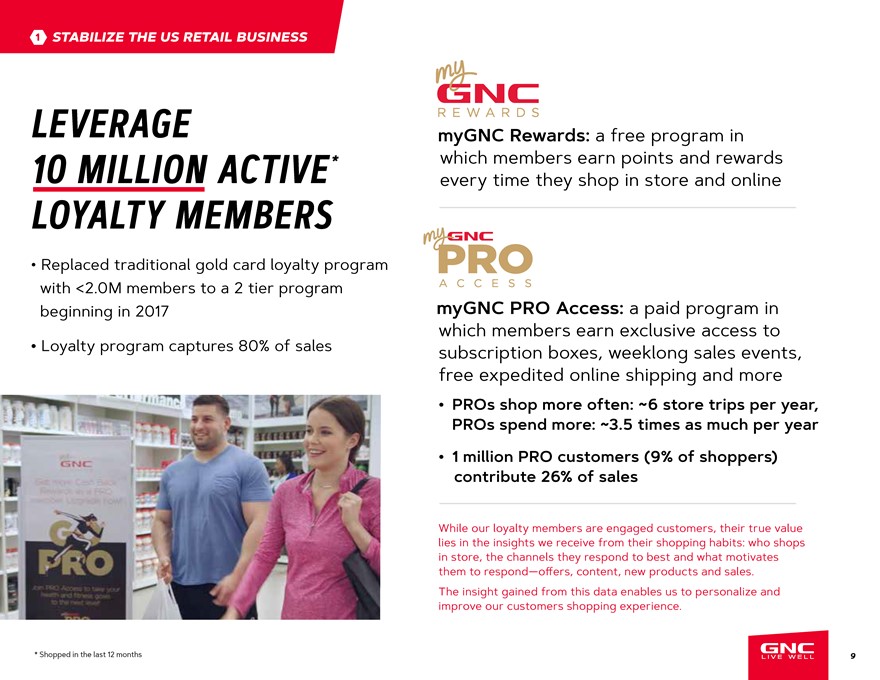
1 STABILIZE THE US RETAIL BUSINESS LEVERAGE myGNC Rewards: a free program in 10 MILLION ACTIVE * which members earn points and rewards every time they shop in store and online LOYALTY MEMBERS Replaced traditional gold card loyalty program with <2.0M members to a 2 tier program beginning in 2017 myGNC PRO Access: a paid program in which members earn exclusive access to Loyalty program captures 80% of sales subscription boxes, weeklong sales events, free expedited online shipping and more PROs shop more often: ~6 store trips per year, PROs spend more: ~3.5 times as much per year 1 million PRO customers (9% of shoppers) contribute 26% of sales While our loyalty members are engaged customers, their true value lies in the insights we receive from their shopping habits: who shops in store, the channels they respond to best and what motivates them to respond—offers, content, new products and sales. The insight gained from this data enables us to personalize and improve our customers shopping experience. * Shopped in the last 12 months 9

|
1 STABILIZE THE US RETAIL BUSINESS TRANSFORMING THE IN-STORE EXPERIENCE GNC is testing new store designs to transform the experience from transactional to personalized and service-driven On-site dietitians and consultants customize plans to shoppers’ goals Smoothie bars create an inviting setting BMI machines (InBody) encourage trial and repeat visits An offline digital experience utilizes data-driven customer dashboards and leverages smart devices, virtual carts and more EARLY RESULTS Increased traffic Lower inventory GNC brand product mix drives higher margins Improved loyalty BMI machine (InBody) 10
|
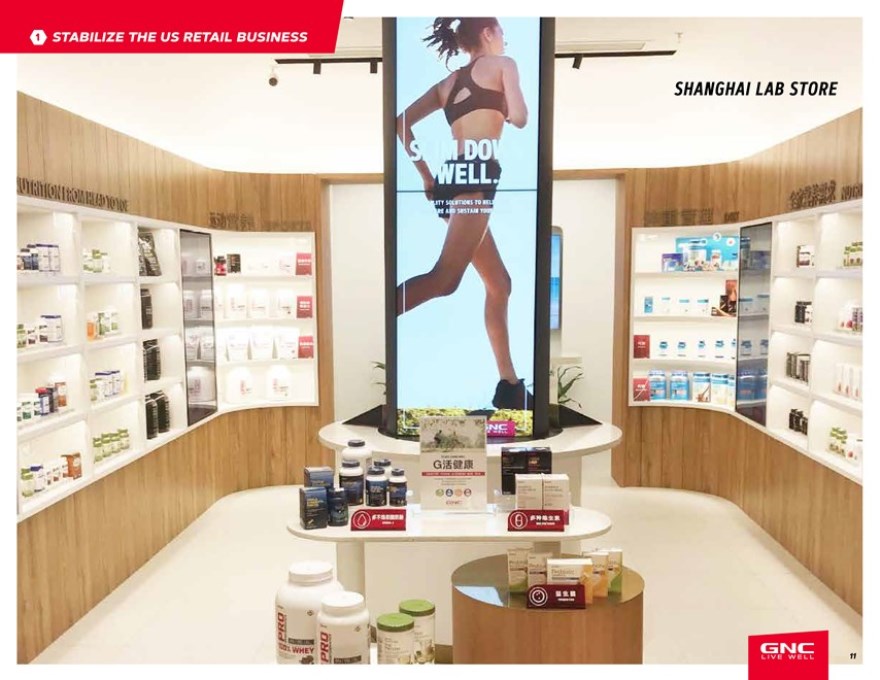
1 STABILIZE THE US RETAIL BUSINESS SHANGHAI LAB STORE 11

|
2 DIGITAL GROWTH DIGITAL MEET OMNICHANNEL FIRST TO CONSUMER NEEDS 12
|
2 DIGITAL GROWTH DRIVEN BY: LAUNCHING NEW DIGITAL TRANSFORMATION TECHNOLOGY IN EARLY 2020 – Making it easier for customers to get their products when and how they want it TARGETING NEW CUSTOMERS DELIVERING MORE PERSONALIZED EXPERIENCES BUILDING OUT DIGITAL TEAM CAPABILITIES 13

|
2 DIGITAL GROWTH TOTAL 500K TOTAL 285K DEVELOPING NEW TECHNOLOGY AND OFFERINGS THAT WILL TRANSFORM HOW CUSTOMERS ADAS SUBSCRIPTIONS OVER TIME SHOP GNC STORE TOTAL TOTAL 200K Creating an easy omnichannel experience 65K 30K for our customers is a priority. STORE STORE 30K 0 WEB WEB WEB CURRENTLY GNC OFFERS THE 30K 35K 85K FOLLOWING SERVICES THAT RIVAL 2017 2018 Current 2020 THE COMPETITION: AUTO-DELIVER & SAVE (”ADAS”) We offer this subscription service to customers shopping in ADAS is less than 2_ of transactions, store and online. Customers who enroll in ADAS save 10_ on but is projected to grow to 3.5_ of recurring subscriptions and receive free shipping. transactions in 2020. Drives higher than average EBITDA margin GNC DELIVERS Customers shopping in brick-and-mortar locations can purchase any of the thousands of additional products we offer on GNC.com and get them shipped for free to their homes. GNC Delivers will relaunch in 2020 with omnichannel capabilities, Weekly subscription including Buy Online and Pick Up In Store. demand is up over 50_ from Q1 14

|
2 DIGITAL GROWTH PLANS TO FURTHER EVOLVE THE OMNICHANNEL CUSTOMER EXPERIENCE IN 2020 BUY ONLINE PICKUP IN STORE Real time inventory visibility for the customer Creates consumer connections SHIP FROM STORE FULFILLMENT Hub existing locations inventory service customer demand with 70% OF SITE TRAFFIC ENHANCED CUSTOMER SERVICE IS MOBILE Centralized customer service, expanded chat and social listening, opinion labs and review systems REFINED WEB DESIGN MOBILE POS CAPABILITIES TO BE MOBILE FOCUSED Mobile POS capabilities bring the experience to the consumer wherever they are: – Marathons – Schools – Health fairs, etc. 15
|
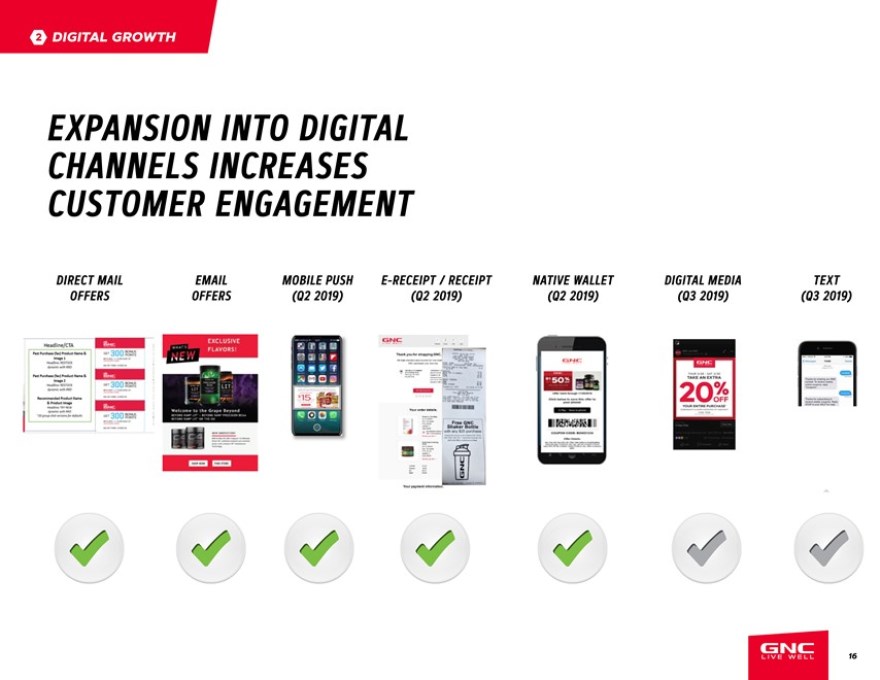
2 DIGITAL GROWTH EXPANSION INTO DIGITAL CHANNELS INCREASES CUSTOMER ENGAGEMENT DIRECT MAIL EMAIL MOBILE PUSH E-RECEIPT / RECEIPT NATIVE WALLET DIGITAL MEDIA TEXT OFFERS OFFERS (Q2 2019) (Q2 2019) (Q2 2019) (Q3 2019) (Q3 2019) 16
|
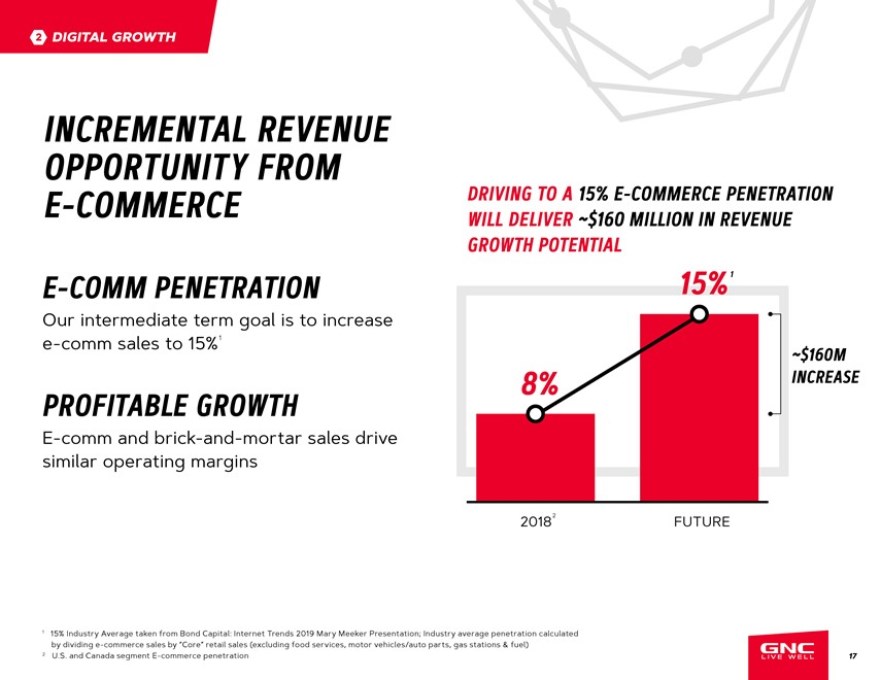
2 DIGITAL GROWTH INCREMENTAL REVENUE OPPORTUNITY FROM E- COMMERCE WILL DRIVING DELIVER TO A ~ 15% $160 E-COMMERCE MILLION IN REVENUE PENETRATION GROWTH POTENTIAL E- COMM PENETRATION 15% 1 Our intermediate term goal is to increase e-comm sales to 15% 1 ~$160M PROFITABLE GROWTH 8% INCREASE E-comm and brick-and-mortar sales drive similar operating margins 20182 FUTURE 1 15% Industry Average taken from Bond Capital: Internet Trends 2019 Mary Meeker Presentation; Industry average penetration calculated by dividing e-commerce sales by “Core” retail sales (excluding food services, motor vehicles/auto parts, gas stations & fuel) 2 U.S. and Canada segment E-commerce penetration 17

|
3 DRIVE INNOVATION We are moving from being a specialty retailer to a GLOBAL BRAND REFOCUS ON BUILDING THE BRAND THROUGH TALENT ACQUISITION AND ORG DESIGN, INCREASED ACCOUNTABILITY, CROSS-CHANNEL BRAND MANAGEMENT AND MARKETING SUPPORT 18
|
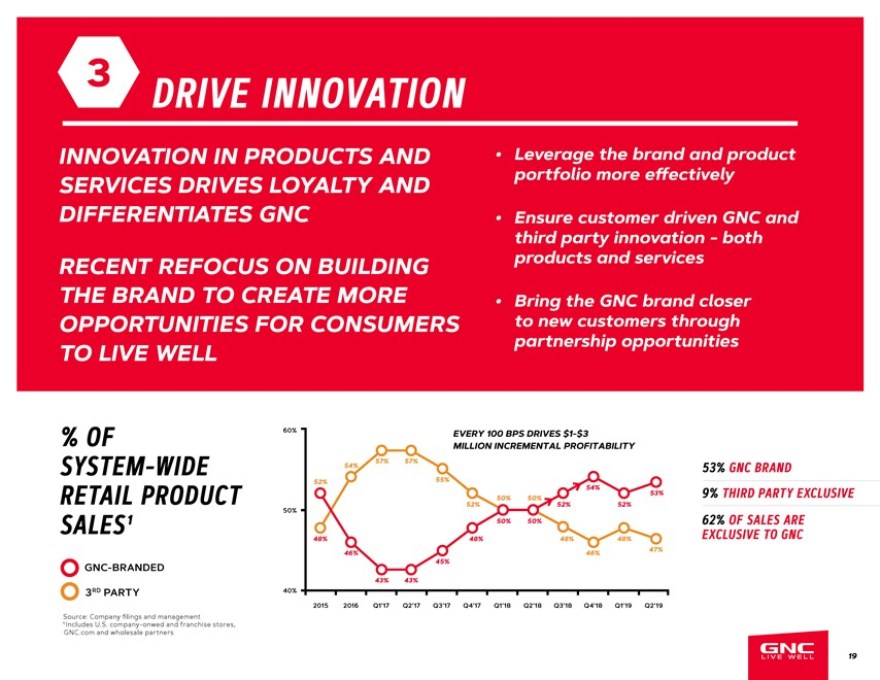
3 DRIVE INNOVATION INNOVATION IN PRODUCTS AND Leverage the brand and product SERVICES DRIVES LOYALTY AND portfolio more effectively DIFFERENTIATES GNC Ensure customer driven GNC and third party innovation—both RECENT REFOCUS ON BUILDING products and services THE BRAND TO CREATE MORE Bring the GNC brand closer OPPORTUNITIES FOR CONSUMERS to new customers through TO LIVE WELL partnership opportunities % OF 60% EVERY 100 BPS DRIVES $1-$3 MILLION INCREMENTAL PROFITABILITY SYSTEM-WIDE 54% 57% 57% 53% GNC BRAND 52% 55% 54% RETAIL PRODUCT 50% 50% 53% 9% THIRD PARTY EXCLUSIVE 52% 52% 52% 50% SALES¹ 50% 50% 62% OF SALES ARE 48% 48% 48% 48% EXCLUSIVE TO GNC 46% 46% 47% GNC-BRANDED 45% 43% 43% 3RD PARTY 40% 2015 2016 Q1’17 Q2’17 Q3’17 Q4’17 Q1’18 Q2’18 Q3’18 Q4’18 Q1’19 Q2’19 Source: Company filings and management ¹ Includes U.S. company-onwed and franchise stores, GNC.com and wholesale partners 19
|
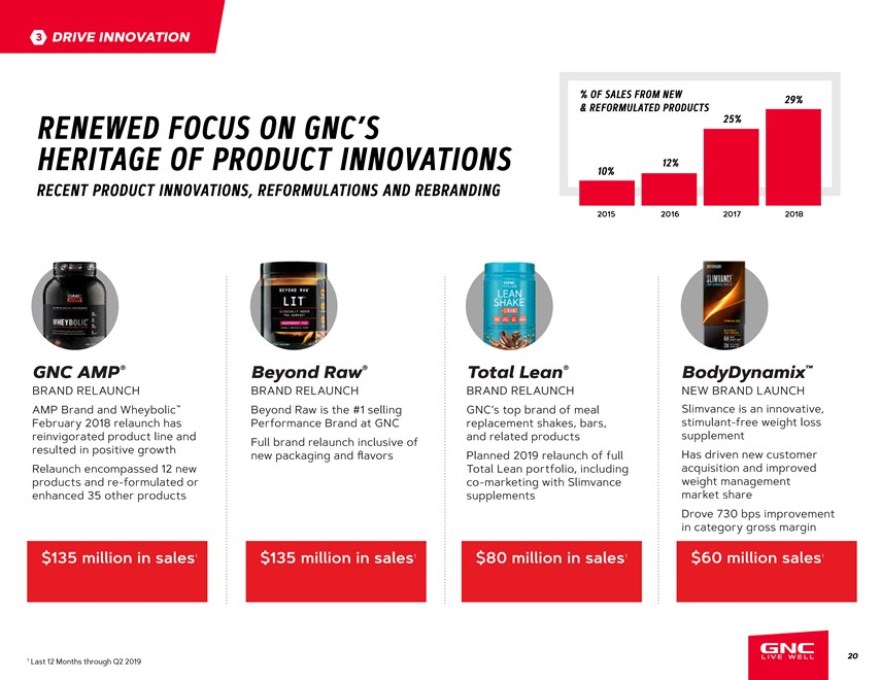
3 DRIVE INNOVATION _ OF SALES FROM NEW 29% & REFORMULATED PRODUCTS RENEWED FOCUS ON GNC’S 25% HERITAGE OF PRODUCT INNOVATIONS 12% 10% RECENT PRODUCT INNOVATIONS, REFORMULATIONS AND REBRANDING 2015 2016 2017 2018 GNC AMP® Beyond Raw® Total Lean® BodyDynamix™ BRAND RELAUNCH BRAND RELAUNCH BRAND RELAUNCH NEW BRAND LAUNCH AMP Brand and Wheybolic™ Beyond Raw is the #1 selling GNC’s top brand of meal Slimvance is an innovative, February 2018 relaunch has Performance Brand at GNC replacement shakes, bars, stimulant-free weight loss reinvigorated product line and Full brand relaunch inclusive of and related products supplement resulted in positive growth new packaging and flavors Planned 2019 relaunch of full Has driven new customer Relaunch encompassed 12 new Total Lean portfolio, including acquisition and improved products and re-formulated or co-marketing with Slimvance weight management enhanced 35 other products supplements market share Drove 730 bps improvement in category gross margin $135 million in sales 1 $135 million in sales 1 $80 million in sales 1 $60 million sales 1 1 Last 12 Months through Q2 2019 20

|
3 DRIVE INNOVATION EMERGING GNC PRODUCT INNOVATIONS EARTH GENIUS ® TAMAFLEX® MYOTOR® MAD PONY® NEW BRAND LAUNCH NEW PRODUCT LAUNCH NEW INGREDIENT LAUNCH NEW BRAND LAUNCH TamaFlex Fast Acting is a MyoTor is newly patented and Mad Pony was created as GNC a more Earth natural, Genius wholesome was created powerful botanical blend for clinically shown to increase as a new, Gen Z and clinically proven joint support upper and lower body strength Millenial-focused lifestyle customer. alternative for the mainstream that can be felt in as little while improving athletic brand featuring a line of as 5 days. TamaFlex brings performance. By bringing on-the-go energy products It has increased GNC private innovation to the joint market, MyoTor to market with exclusive designed to deliver caeine brand share in the Herbs & which has not seen ingredient rights, its Quad-Anabolic along with additional Greens category, brought in newness over the last decade. Targeting and ability to improve nutritional benefits. new customers and helped the maximum number of reps defend against current during exercise are key to customers looking elsewhere remaining an innovative leader. for more natural supplement alternatives. Since Earth Genius launched, TamaFlex sales have grown Launching late 2019 As of Fall 2019, Mad Pony will Herbs & Greens category at an average of 17_ month be brought to market as a comps have increased 440 over month since launch in carbonated energy drink, BPS from -0.7_ to +3.7_ September 2018 with plans to expand the line into other unique products 21
|
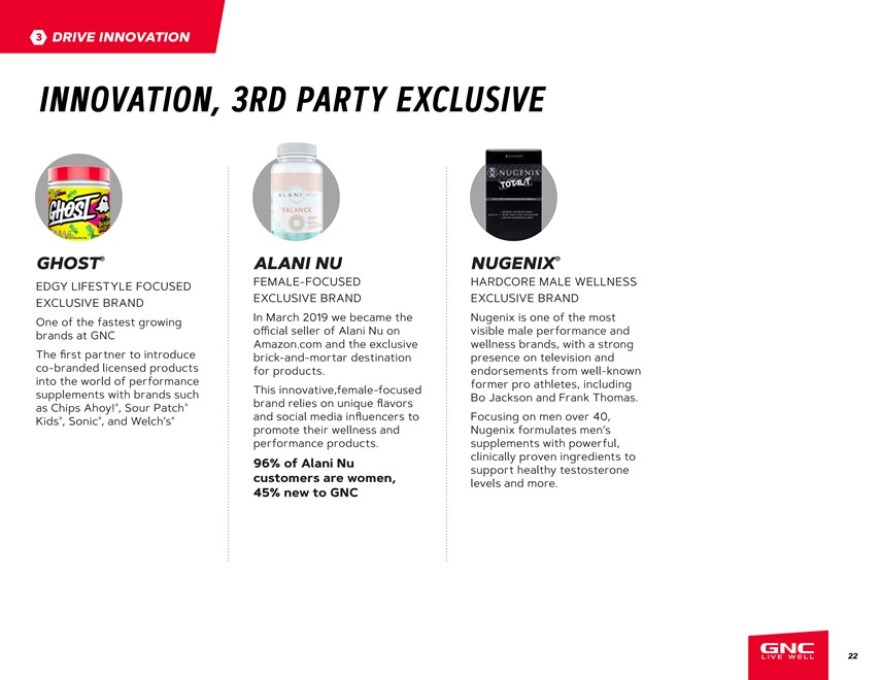
3 DRIVE INNOVATION INNOVATION, 3RD PARTY EXCLUSIVE GHOST® ALANI NU NUGENIX® EDGY LIFESTYLE FOCUSED FEMALE-FOCUSED HARDCORE MALE WELLNESS EXCLUSIVE BRAND EXCLUSIVE BRAND EXCLUSIVE BRAND One of the fastest growing In March 2019 we became the Nugenix is one of the most brands at GNC official seller of Alani Nu on visible male performance and Amazon.com and the exclusive wellness brands, with a strong The first partner to introduce brick-and-mortar destination presence on television and co-branded licensed products for products. endorsements from well-known into the world of performance This innovative,female-focused former pro athletes, including supplements with brands such brand relies on unique flavors Bo Jackson and Frank Thomas. as Chips Ahoy!®, Sour Patch® Kids®, Sonic®, and Welch’s® and social media influencers to Focusing on men over 40, promote their wellness and Nugenix formulates men’s performance products. supplements with powerful, 96% of Alani Nu clinically proven ingredients to support healthy testosterone customers are women, levels and more. 45% new to GNC 22
|
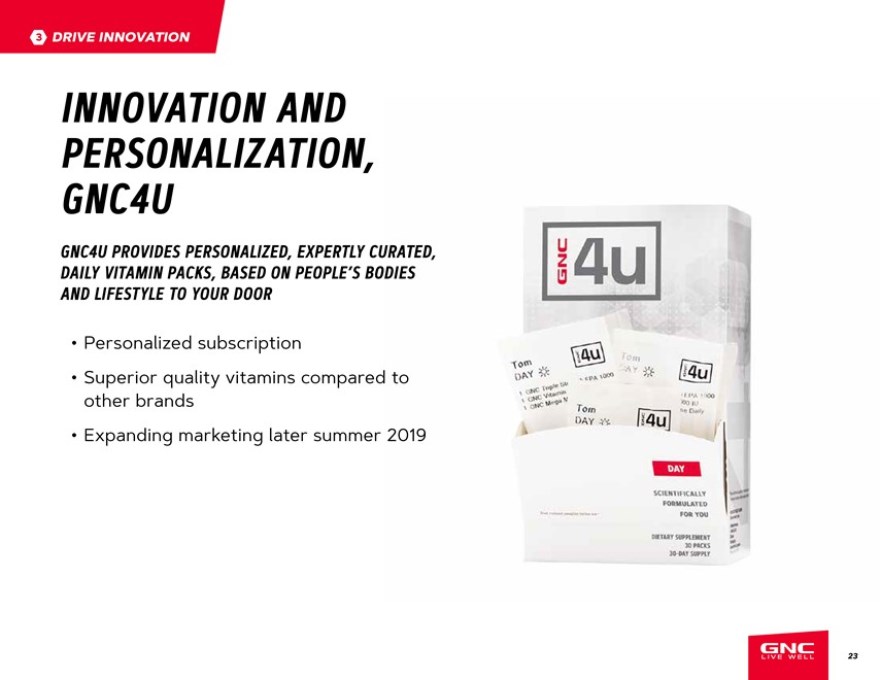
3 DRIVE INNOVATION INNOVATION PERSONALIZATION, AND GNC4U GNC4U PROVIDES PERSONALIZED, EXPERTLY CURATED, DAILY VITAMIN PACKS, BASED ON PEOPLE’S BODIES AND LIFESTYLE TO YOUR DOOR Personalized subscription Superior quality vitamins compared to other brands Expanding marketing later summer 2019 23

|
3 DRIVE INNOVATION LARGE OPPORTUNITY TO INCREASE EXISTING BUILDING NEW STRATEGIC PARTNERSHIPS TO HUDSON NEWS ALBERTSON’S BRING GNC BRAND CLOSER TO THE CONSUMER 2019 PILOTS TOTAL END OF POTENTIAL Q3 ‘19 LOCATIONS DICK’S SPORTING GOODS 77 565 HUDSON NEWS 360 950 ALBERTSON’S 35 2000+ DICK’S SPORTING GOODS 24

|
4 INTERNATIONAL GROWTH INTERNATIONAL IS ON THE RISE DEMAND AND WE’RE READY TO MEET IT 25

|
4 INTERNATIONAL GROWTH SIGNIFICANT WHITE SPACE EXISTS DESPITE GNC’S PRESENCE IN APPROXIMATELY 50 COUNTRIES GROWTH DRIVEN BY STRATEGIC INITIATIVES INCLUDING: Product Innovation: Continuous innovation with international and global brand launches tailored to local needs – Mom, Baby & Kids (MBK), – Endurance – Beauty E-Commerce: Partner with local leading e-commerce platforms to build GNC online presence (e.g., Amazon, Zalando, JD, Tmall etc.) Leverage Strategic Partnerships: Provide additional business model options to extend the brand in international markets, with GNC team providing support Localization: Design products within global brand architecture that are locally made (e.g., Europe, India, Mexico, South Africa) and products and branding well-suited for region-specific distribution (e.g. Olive Young in South Korea) $138BN GLOBAL SUPPLEMENT MARKET REPRESENTS ENORMOUS INTERNATIONAL OPPORTUNITY SUPPLEMENT MARKET 2018 – 2023E ($ IN BN, 2018) CAGR (_) NORTH AMERICA1 $ 46BN 4 ..9_ CHINA $ 25BN 9.1_ TARGETING EUROPE $ 22BN 5.9_ ACTIVELY JAPAN $ 12BN 1 . 8_ LATIN AMERICA $ 7BN 8 . 2_ OTHER APAC $ 23BN 6.5_ (EX. CHINA / JAPAN) MIDDLE EAST & AFRICA $ 2BN 10.5_ TOTAL $ 138BN 6. 2_ 1 Includes supplement market in the U.S. of ~$44bn, Canada of ~$2bn as of 2018 26

|
4 INTERNATIONAL GROWTH COMPANY SEES PATH TO $1 BILLION IN RETAIL SALES OVER THE INTERMEDIATE TERM NEAR-TERM PARTNERSHIP WHITE SPACE GROWTH WITHIN CHINA JOINT OPPORTUNITIES IN WESTERN EUROPE EXISTING PORTFOLIO VENTURE AUSTRALIA WESTERN EUROPE INDIA CHINA PARTNERSHIP WITH FASTEST GROWING LEADING CONSUMER E-COMMERCE HEALTH PRODUCTS MARKET GLOBALLY COMPANY (~50_ P.A.) $3.5BN HEALTH AND 20_+ COMPARABLE WELLNESS MARKET GROWTH IN EACH (6TH LARGEST) OF LAST 2 YEARS BRAZIL GNC CURRENTLY HAS PHILIPPINES LAUNCHED JOINT NO FRANCHISE OR VENTURE WITH HARBIN CORPORATE PRESENCE PHARMACEUTICALS IN TRANSITIONED TO IN WESTERN EUROPE Q1 ‘19 LARGEST SINGLE OUTSIDE OF IRELAND NEW FRANCHISE “WHITE SPACE” PARTNER IN 2018 SEE PAGES 29-31 OPPORTUNITY IN TARGETING ENTRY INTO LATIN AMERICA SELECT COUNTRIES HAS DRIVEN THROUGH IMMEDIATE $3.1BN HEALTH AND GNC-MANAGED TURNAROUND WELLNESS MARKET AMAZON TO DOUBLE-DIGIT (8TH LARGEST) MARKETPLACES BY COMPARABLE EARLY 2020 GROWTH POTENTIAL STRATEGIC PARTNERSHIPS TO JAPAN DISTRIBUTION EXPAND PHYSICAL VIA MEXICO PHARMACY, GROCERY, STRONG AND CONVENIENCE RELATIONSHIP WITH SIGNED LOCAL LOCAL PARTNER (~30 PARTNERSHIP YEARS) TO DEVELOP GNC BRAND NEW LOCAL LOYALTY PROGRAM (“MIVIT”) $12.3BN HEALTH HAS RAPIDLY GROWN AND WELLNESS TO 240K+ MEMBERS MARKET (3RD LARGEST) TARGETING MID-SINGLE DIGIT COMPARABLE GROWTH ON SIGNIFICANT REVENUE 27
|
STRATEGIC PARTNERSHIP STRATEGIC PARTNERING WITH HARBIN AND IVC WILL ENABLE US TO FURTHER EXPAND AS A PARTNERSHIP GLOBAL BRAND 28
|
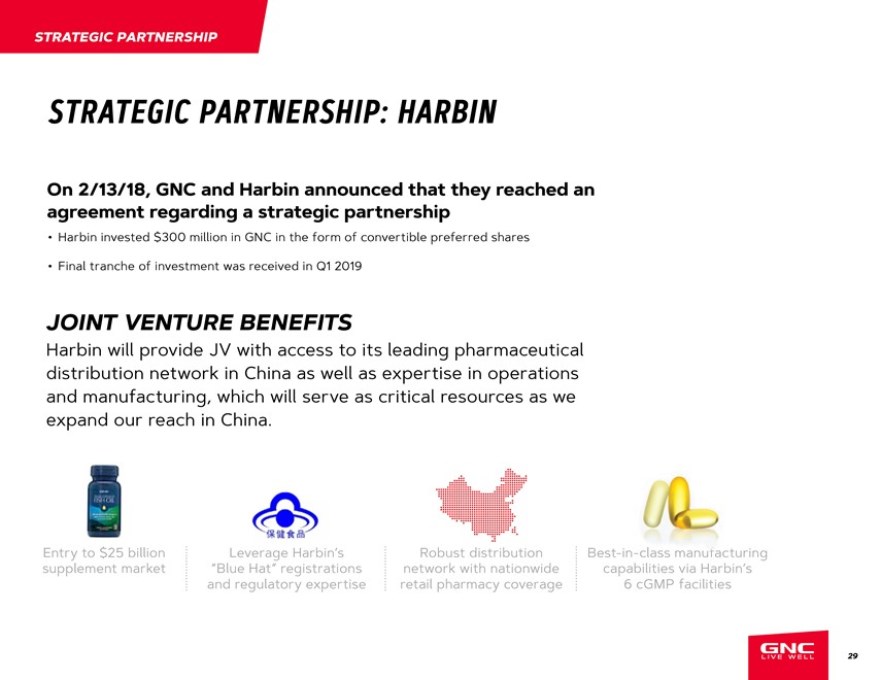
STRATEGIC PARTNERSHIP STRATEGIC PARTNERSHIP: HARBIN On 2/13/18, GNC and Harbin announced that they reached an agreement regarding a strategic partnership Harbin invested $300 million in GNC in the form of convertible preferred shares Final tranche of investment was received in Q1 2019 JOINT VENTURE BENEFITS Harbin will provide JV with access to its leading pharmaceutical distribution network in China as well as expertise in operations and manufacturing, which will serve as critical resources as we expand our reach in China. Entry to $25 billion Leverage Harbin’s Robust distribution Best- uring supplement market “Blue Hat” registrations network with nationwide ca n’s and regulatory expertise retail pharmacy coverage 29

|
STRATEGIC PARTNERSHIP GNC CHINA STRATEGY—SUBSTANTIAL UNTAPPED OPPORTUNITY PROJECTED CHINA JV RETAIL SALES BY 2021: ~$300 MILLION PROVEN BRAND STRENGTH #2 MARKET GLOBALLY AFTER U.S. ($, BILLIONS) 9_ CAGR $39 BRAND $4 52_ ~11_ CAGR $25 AWARENESS $15 GNC already has strong brand recognition in China 2013 2018 2023E despite modest market share position Top-5 consumer awareness among health CHINA HEALTH AND WELLNESS MARKET SALES GROWTH1 supplement brands in China ($, BILLIONS) 2013 – 18E 2018 – 23E Local brand research shows GNC is perceived as a CAGR (_) CAGR (_) TOTAL 10.6 9.1 professional brand ering a broad range of ective health food products SPORTS NUTRITION2 39.6 24.1 WEIGHT MANAGEMENT3 11 .8 14.6 DIETARY SUPPLEMENTS4 10.3 8.3 Source: Euromonitor, Credit Suisse Global Wealth Report 2017, Chinese National Bureau of Statistics, L.E.K. Consulting 1 Sales value is calculated using retail sale price (RSP), Market size is based on Euromonitor data 2 Sports nutrition includes sports protein bars, sports protein powder and sports non-protein products 3 Weight management includes meal replacement, slimming teas, weight loss supplements, and supplement nutrition drinks 30 4 Dietary supplements includes herbal/traditional supplements, non-herbal supplements and combination supplements; 5 Share of RSP value
|
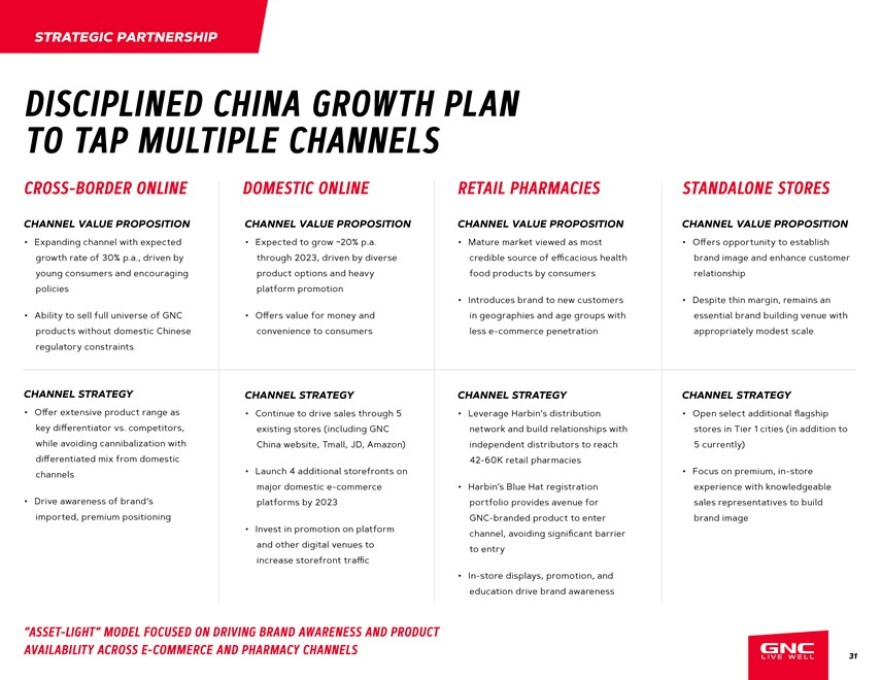
STRATEGIC PARTNERSHIP DISCIPLINED CHINA GROWTH PLAN TO TAP MULTIPLE CHANNELS CROSS-BORDER ONLINE DOMESTIC ONLINE RETAIL PHARMACIES STANDALONE STORES CHANNEL VALUE PROPOSITION CHANNEL VALUE PROPOSITION CHANNEL VALUE PROPOSITION CHANNEL VALUE PROPOSITION Expanding channel with expected Expected to grow ~20_ p.a. Mature market viewed as most Offers opportunity to establish growth rate of 30_ p.a., driven by through 2023, driven by diverse credible source of efficacious health brand image and enhance customer young consumers and encouraging product options and heavy food products by consumers relationship policies platform promotion Introduces brand to new customers Despite thin margin, remains an Ability to sell full universe of GNC value for money and in geographies and age groups with essential brand building venue with products without domestic Chinese convenience to consumers less e-commerce penetration appropriately modest scale regulatory constraints CHANNEL STRATEGY CHANNEL STRATEGY CHANNEL STRATEGY CHANNEL STRATEGY Offer extensive product range as Continue to drive sales through 5 Leverage Harbin’s distribution Open select additional flagship key vs. competitors, existing stores (including GNC network and build relationships with stores in Tier 1 cities (in addition to while avoiding cannibalization with China website, Tmall, JD, Amazon) independent distributors to reach 5 currently) mix from domestic 42-60K retail pharmacies channels Launch 4 additional storefronts on Focus on premium, in-store major domestic e-commerce Harbin’s Blue Hat registration experience with knowledgeable Drive awareness of brand‘s platforms by 2023 portfolio provides avenue for sales representatives to build imported, premium positioning GNC-branded product to enter brand image Invest in promotion on platform channel, avoiding significant barrier and other digital venues to to entry increase storefront In-store displays, promotion, and education drive brand awareness “ASSET-LIGHT” MODEL FOCUSED ON DRIVING BRAND AWARENESS AND PRODUCT AVAILABILITY ACROSS E-COMMERCE AND PHARMACY CHANNELS 31
|
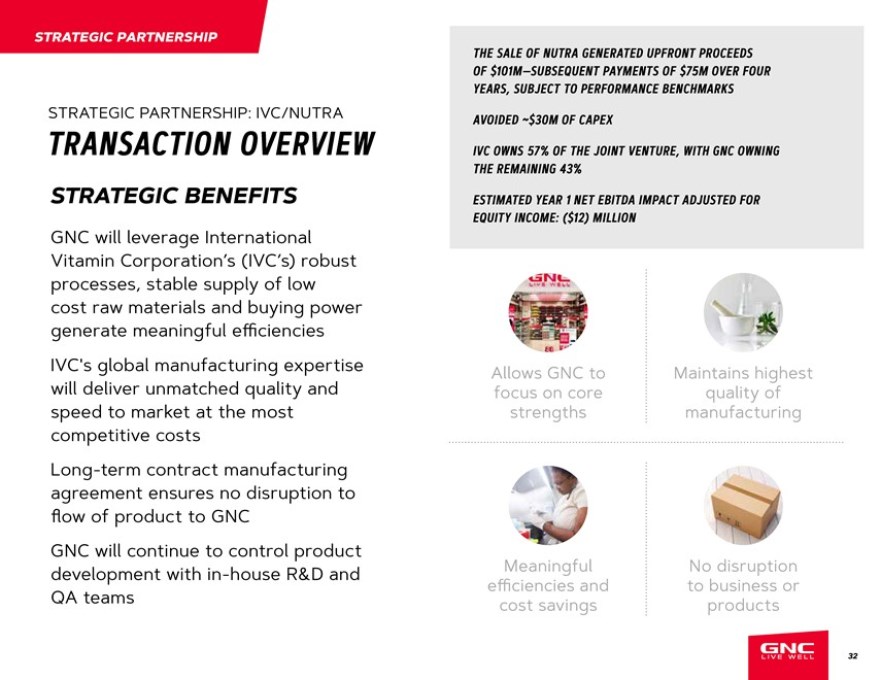
STRATEGIC PARTNERSHIP STRATEGIC PARTNERSHIP: IVC/NUTRA TRANSACTION OVERVIEW STRATEGIC BENEFITS GNC will leverage International Vitamin Corporation’s (IVC’s) robust processes, stable supply of low cost raw materials and buying power generate meaningful efficiencies IVC’s global manufacturing expertise will deliver unmatched quality and speed to market at the most competitive costs Long-term contract manufacturing agreement ensures no disruption to flow of product to GNC GNC will continue to control product development with in-house R&D and QA teams THE SALE OF NUTRA GENERATED UPFRONT PROCEEDS OF $101M—SUBSEQUENT PAYMENTS OF $75M OVER FOUR YEARS, SUBJECT TO PERFORMANCE BENCHMARKS AVOIDED ~$30M OF CAPEX IVC OWNS 57% OF THE JOINT VENTURE, WITH GNC OWNING THE REMAINING 43% ESTIMATED YEAR 1 NET EBITDA IMPACT ADJUSTED FOR EQUITY INCOME: ($12) MILLION Allows GNC to Maintains highest focus on core quality of strengths manufacturing Meaningful No disruption efficiencies and to business or cost savings products 32
|
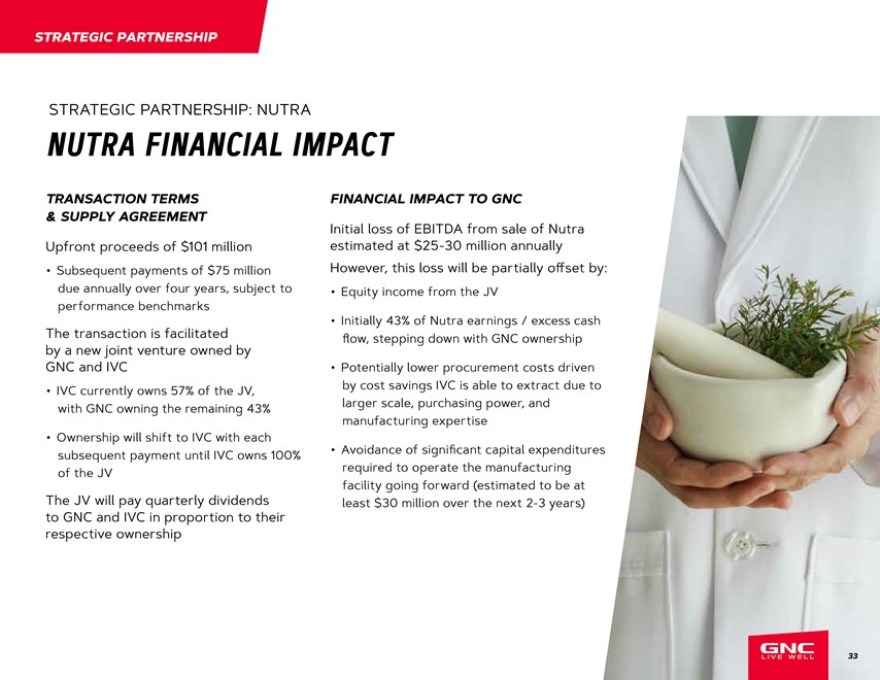
STRATEGIC PARTNERSHIP STRATEGIC PARTNERSHIP: NUTRA NUTRA FINANCIAL IMPACT TRANSACTION TERMS & SUPPLY AGREEMENT Upfront proceeds of $101 million Subsequent payments of $75 million due annually over four years, subject to performance benchmarks The transaction is facilitated by a new joint venture owned by GNC and IVC IVC currently owns 57_ of the JV, with GNC owning the remaining 43_ Ownership will shift to IVC with each subsequent payment until IVC owns 100_ of the JV The JV will pay quarterly dividends to GNC and IVC in proportion to their respective ownership FINANCIAL IMPACT TO GNC Initial loss of EBITDA from sale of Nutra estimated at $25-30 million annually However, this loss will be partially offset by: Equity income from the JV Initially 43_ of Nutra earnings / excess cash flow, stepping down with GNC ownership Potentially lower procurement costs driven by cost savings IVC is able to extract due to larger scale, purchasing power, and manufacturing expertise Avoidance of significant capital expenditures required to operate the manufacturing facility going forward (estimated to be at least $30 million over the next 2-3 years) 33

|
PROGRESS MADE ON CAPITAL STRUCTURE REDUCED DEBT BY 40% IN 6 QUARTERS DEBT $1.5B TO <$900M SINCE Q4 2017 Total leverage ratio improved by 150_ from >5X to ~3.5X Company will maintain ongoing focus on deleveraging 34
|
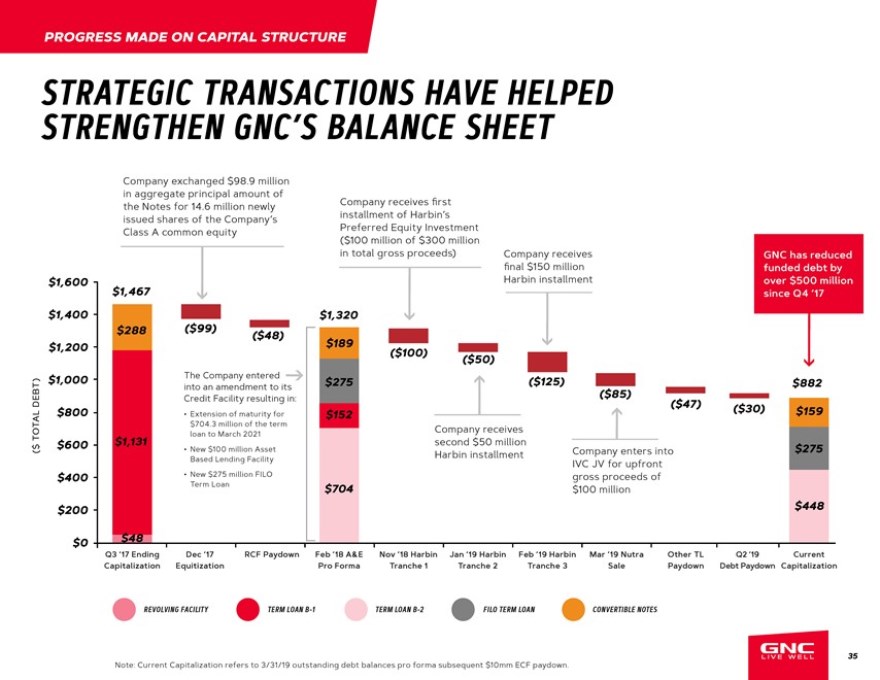
PROGRESS MADE ON CAPITAL STRUCTURE STRATEGIC TRANSACTIONS HAVE HELPED STRENGTHEN GNC’S BALANCE SHEET Company exchanged $98.9 million in aggregate principal amount of the Notes for 14.6 million newly Company receives first issued shares of the Company’s installment of Harbin’s Class A common equity Preferred Equity Investment ($100 million of $300 million in total gross proceeds) Company receives GNC has reduced final $150 million funded debt by $1,600 Harbin installment over $500 million $1,467 since Q4 ‘17 $1,400 $1,320 $288 ($99) ($48) $1,200 $189 ($100) ($50) $1,000 into The Company an amendment entered to its $275 ($125) $882 DEBT) Credit Facility resulting in: ($85) ($47) $800 Extension of maturity for $152 ($30) $159 $704.3 million of the term Company receives TOTAL loan to March 2021 second $50 million ( $ $600 $1,131 New $100 million Asset Harbin installment Company enters into $275 Based Lending Facility IVC JV for upfront $400 New $275 million FILO gross proceeds of Term Loan $704 $100 million $200 $448 $0 $48 Q3 ‘17 Ending Dec ‘17 RCF Paydown Feb ‘18 A&E Nov ‘18 Harbin Jan ‘19 Harbin Feb ‘19 Harbin Mar ‘19 Nutra Other TL Q2 ‘19 Current Capitalization Equitization Pro Forma Tranche 1 Tranche 2 Tranche 3 Sale Paydown Debt Paydown Capitalization REVOLVING FACILITY TERM LOAN B-1 TERM LOAN B-2 FILO TERM LOAN CONVERTIBLE NOTES 35 Note: Current Capitalization refers to 3/31/19 outstanding debt balances pro forma subsequent $10mm ECF paydown.

|
OVERVIEW FINANCIAL 36
|
FINANCIAL OVERVIEW CONTINUED FOCUS ON DELEVERAGING AND IMPROVING EBITDA FTI engaged to assess and help implement cost savings, with a conservative ~$50 million estimated savings over the next 18 months Various other intitiatives in place to improve EBITDA and free cash flow generation FOCUS ON STORE OPTIMIZATION AND COST SAVINGS INITIATIVES GENERATE HIGHER QUALITY REVENUE RESULTING IN IMPROVED PROFITABLITY 37

|
FINANCIAL OVERVIEW IDENTIFIED COST SAVINGS KEY FOCUS AREAS: EXPECTED COST SAVINGS DETAIL AS OF 2Q ‘19, COMPANY IS TRACKING ON OR AHEAD OF BUDGET ACROSS COST SAVINGS INITIATIVES. TWO THIRDS OF 2019 SAVINGS ALREADY REALIZED. FY2019 FY2020 SELECTED INITIATIVES SAVINGS SAVINGS COMPETITIVE BIDDING AND/OR VALUE ENGINEERING OF BULK, Product FORMULATIONS, AND PACKAGING $1.5MM $12MM Related SIMPLIFY PRODUCT PACKAGING E.G., ELIMINATE BOXES AND SHRINK WRAP, REDUCE WEIGHT CONDUCT NETWORK REVIEW TO REDUCE SHIPPING COSTS, INCLUDING Distribution & REDUCTION IN SPECIAL ORDER SHIPMENTS, INBOUND CONSOLIDATION, Transportation AND OUTBOUND DELIVERY CADENCE $3MM $6MM DISTRIBUTION CENTER PRODUCTIVITY AND E-COMMERCE FULFILLMENT OPPORTUNITIES Occupancy REVIEW AND OPTIMIZE LEASES, INCLUDE BASE RENT RENEGOTIATIONS $9MM $10MM CONDUCT CAM AUDITS Salaries RE-ALIGN ORGANIZATION TO NEW FOCUS AREAS $8MM $11MM & Benefits FIELD LABOR HOURS SCHEDULING OPTIMIZATION (ADDITIVE TO STORE OPTIMIZATION) REDUCE SPEND ON LOWER-IMPACT CHANNELS (E.G., TRADITIONAL ADVERTISING, UNPRODUCTIVE CAMPAIGN EVENTS, IN-STORE Marketing MARKETING, AGENCY FEES) $4.5MM $6MM REDIRECT TO HIGHER ROI DIGITAL ADVERTISING, SOCIAL, AND CRM Other REDUCE CONSULTING, IT, PROFESSIONAL, AND TRAVEL-RELATED SG&A SPEND $3MM $5MM Total $29MM $50MM 38
|
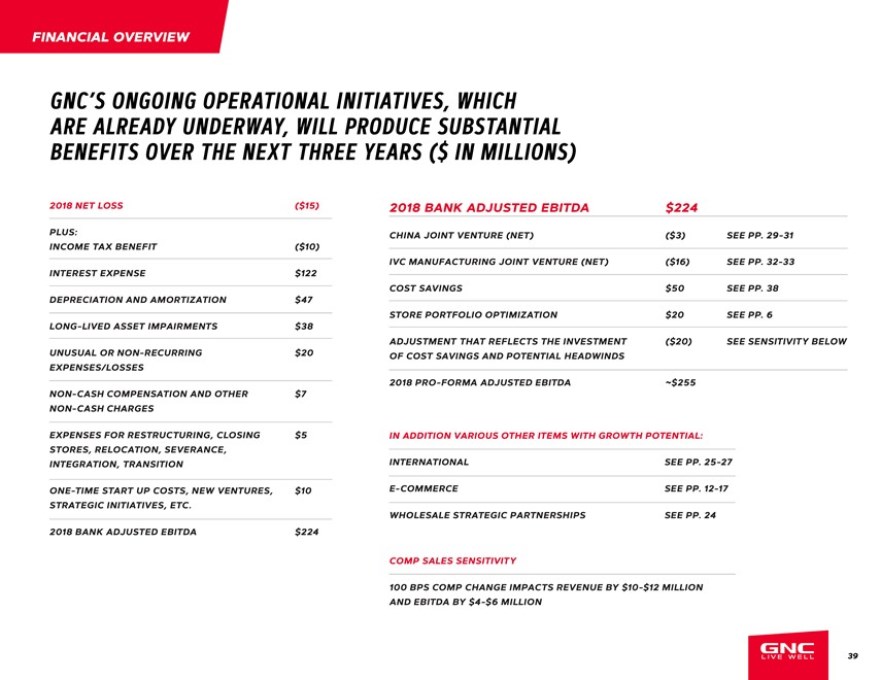
FINANCIAL OVERVIEW GNC’S ONGOING OPERATIONAL INITIATIVES, WHICH ARE ALREADY UNDERWAY, WILL PRODUCE SUBSTANTIAL BENEFITS OVER THE NEXT THREE YEARS ($ IN MILLIONS) 2018 NET LOSS ($15) 2018 BANK ADJUSTED EBITDA $224 PLUS: CHINA JOINT VENTURE (NET) ($3) SEE PP. 29-31 INCOME TAX BENEFIT ($10) IVC MANUFACTURING JOINT VENTURE (NET) ($16) SEE PP. 32-33 INTEREST EXPENSE $122 COST SAVINGS $50 SEE PP. 38 DEPRECIATION AND AMORTIZATION $47 STORE PORTFOLIO OPTIMIZATION $20 SEE PP. 6 LONG -LIVED ASSET IMPAIRMENTS $38 ADJUSTMENT THAT REFLECTS THE INVESTMENT ($20) SEE SENSITIVITY BELOW UNUSUAL OR NON-RECURRING $20 OF COST SAVINGS AND POTENTIAL HEADWINDS EXPENSES/LOSSES 2018 PRO -FORMA ADJUSTED EBITDA ~$255 NON- CASH COMPENSATION AND OTHER $7 NON- CASH CHARGES EXPENSES FOR RESTRUCTURING, CLOSING $5 IN ADDITION VARIOUS OTHER ITEMS WITH GROWTH POTENTIAL: STORES, RELOCATION, SEVERANCE, INTEGRATION, TRANSITION INTERNATIONAL SEE PP. 25-27 ONE-TIME START UP COSTS, NEW VENTURES, $10 E- COMMERCE SEE PP. 12-17 STRATEGIC INITIATIVES, ETC . WHOLESALE STRATEGIC PARTNERSHIPS SEE PP. 24 2018 BANK ADJUSTED EBITDA $224 COMP SALES SENSITIVITY 100 BPS COMP CHANGE IMPACTS REVENUE BY $10 -$12 MILLION AND EBITDA BY $4-$6 MILLION 39

|
FINANCIAL OVERVIEW CAPITALIZATION ($ IN MILLIONS) 30 -JUNE-19 ADJ. ANNUAL INTEREST TRANCHE CCR: B3/CCC+ ($MM) EBITDA, X PRICING EXPENSE MATURITY RATINGS CASH & CASH EQUIVALENTS $96 $100MM ABL REVOLVERą $— L + 150 $0 AUG–22 NR/NR FILO TERM LOAN¹ 275 1.1 L + 700 27 DEC–22 Ba3/B TRANCHE B-2 TERM LOAN¹ 448 1.8 L + 875 50 MAR–21 B3/B- TOTAL SECURED DEBT $723 2.8 NET SECURED DEBT 627 2.5 CONVERTIBLE NOTES 159 0.6 1.500_ 2 AUG–20 NR/NR TOTAL DEBT $882 3.5 $79 NET DEBT 786 3.1 CONVERTIBLE PREFERRED STOCK2 $300 PIK AT 6.5_ PRO FORMA ADJUSTED EBITDA $255 SEE PAGE 39 FOR BRIDGE LIQUIDITY ANALYSIS BORROWING BASE COLLATERAL 3,4 ($MM) ($MM) DOMESTIC FINISHED GOODS INVENTORY $274 CASH & CASH EQUIVALENTS $96 CANADIAN FINISHED GOODS INVENTORY 16 (+) ABL BORROWING BASE CAPACITY4 81 CREDIT/DEBIT CARD RECEIVABLES 3 (-) ABL DRAWN—WHOLESALE RECEIVABLES 9 (-) LETTERS OF CREDIT OUTSTANDING4 (6) DOMESTIC FRANCHISE RECEIVABLES 29 TOTAL LIQUIDITY $171 FOREIGN FRANCHISE RECEIVABLES 17 TOTAL BORROWING BASE COLLATERAL $348 AVAILABILITY RESERVES (7) TOTAL BORROWING BASE COLLATERAL $341 ą Subject to May 2020 springing maturity if Convertible Notes balance is in excess of $50 million 2 Harbin pharmaceutical with $5.35 conversion price 3 As of 6/30/2019 4 As reduced by applicable ABL advance rates 40
|
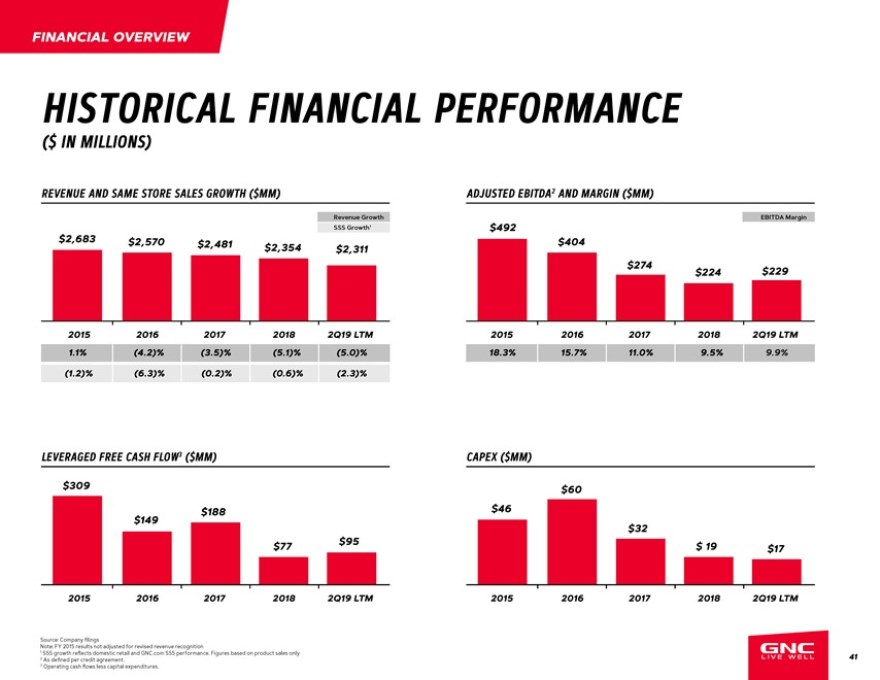
FINANCIAL OVERVIEW HISTORICAL FINANCIAL PERFORMANCE ($ IN MILLIONS) REVENUE AND SAME STORE SALES GROWTH ($MM) ADJUSTED EBITDA2 AND MARGIN ($MM) Revenue Growth EBITDA Margin SSS Growth1 $492 $2,683 $2,570 $2,481 $2,354 $2,311 $404 $274 $224 $229 2015 2016 2017 2018 2Q19 LTM 2015 2016 2017 2018 2Q19 LTM 1.1_ (4.2)_ (3.5)_ (5.1)_ (5.0)_ 18.3_ 15.7_ 11.0_ 9.5_ 9.9_ (1.2)_ (6.3)_ (0.2)_ (0.6)_ (2.3)_ LEVERAGED FREE CASH FLOW3 ($MM) CAPEX ($MM) $309 $60 $149 $188 $46 $32 $77 $95 $ 19 $17 2015 2016 2017 2018 2Q19 LTM 2015 2016 2017 2018 2Q19 LTM Source: Company filings Note: FY 2015 results not adjusted for revised revenue recognition 1 SSS growth reflects domestic retail and GNC.com SSS performance. Figures based on product sales only 41 2 As defined per credit agreement. 3 Operating cash flows less capital expenditures.
|
GNC IS By addressing the aforementioned challenges head-on, we are confident PRIMED that GNC’s high brand recognition in an industry that is growing year over FOR year, combined with recent strategic partnerships and debt reduction, set us on a path for domestic and GROWTH global growth. 42
|
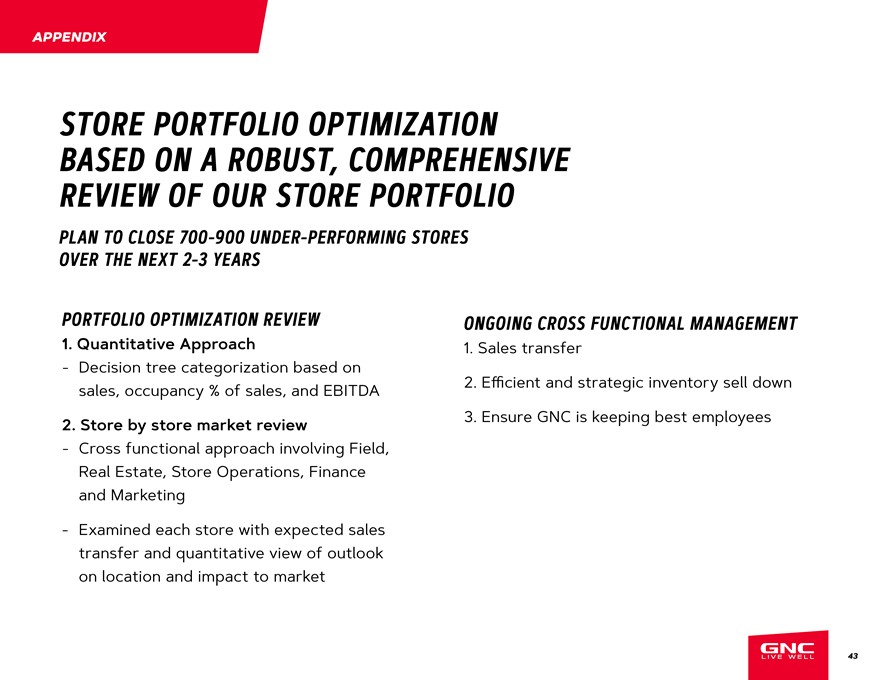
APPENDIX STORE BASED PORTFOLIO ON A ROBUST, OPTIMIZATION COMPREHENSIVE REVIEW OF OUR STORE PORTFOLIO PLAN TO CLOSE 700-900 UNDER-PERFORMING STORES OVER THE NEXT 2-3 YEARS PORTFOLIO OPTIMIZATION REVIEW 1. Quantitative Approach— Decision tree categorization based on sales, occupancy _ of sales, and EBITDA 2. Store by store market review— Cross functional approach involving Field, Real Estate, Store Operations, Finance and Marketing— Examined each store with expected sales transfer and quantitative view of outlook on location and impact to market ONGOING CROSS FUNCTIONAL MANAGEMENT 1. Sales transfer 2. Efficient and strategic inventory sell down 3. Ensure GNC is keeping best employees 43

|
APPENDIX RECONCILIATION TO BANK ADJUSTED EBITDA 2015 2016 2017 2018 LTM Q2 2019 2018 NET INCOME (LOSS) $225 ($281) ($161) ($15) ($20) PLUS1: INCOME TAX EXPENSE (BENEFIT) $123 $57 ($156) ($10) $1 INTEREST EXPENSE $47 $51 $54 $122 $125 DEPRECIATION AND AMORTIZATION $57 $60 $56 $47 $42 LONG -LIVED ASSET IMPAIRMENTS $0 $477 $458 $38 $38 UNUSUAL OR NON-RECURRING $34 $11 $7 $20 $24 EXPENSES/LOSSES NON- CASH COMPENSATION AND OTHER $6 $15 $8 $7 $6 NON- CASH CHARGES EXPENSES FOR RESTRUCTURING, CLOSING $0 $3 $5 $5 $3 STORES, RELOCATION, SEVERANCE, INTEGRATION, TRANSITION ONE-TIME START UP COSTS, NEW VENTURES, $0 $11 $3 $10 $10 STRATEGIC INITIATIVES, ETC . BANK ADJUSTED EBITDA $492 $404 $274 $224 $229 1 Adjustments as permitted by credit agreement. 44