UNITED STATES
SECURITIES AND EXCHANGE COMMISSION
Washington, D.C. 20549
Form 10‑Q |
ý | QUARTERLY REPORT PURSUANT TO SECTION 13 OR 15(d) OF THE SECURITIES EXCHANGE ACT OF 1934 |
For the quarterly period ended March 31, 2019
¨ | TRANSITION REPORT PURSUANT TO SECTION 13 OR 15(d) OF THE SECURITIES EXCHANGE ACT OF 1934 |
For the transition period from to
Commission File No. 001-36847

Invitae Corporation
(Exact name of the registrant as specified in its charter)
Delaware (State or other jurisdiction of incorporation or organization) | 27-1701898 (I.R.S. Employer Identification No.) | |
1400 16th Street, San Francisco, California 94103
(Address of principal executive offices, Zip Code)
(415) 374-7782
(Registrant’s telephone number, including area code)
Indicate by check mark whether the registrant: (1) has filed all reports required to be filed by Section 13 or 15(d) of the Securities Exchange Act of 1934 during the preceding 12 months (or for such shorter period that the registrant was required to file such reports), and (2) has been subject to such filing requirements for the past 90 days. Yes ý No ¨
Indicate by check mark whether the registrant has submitted electronically every Interactive Data File required to be submitted pursuant to Rule 405 of Regulation S-T (§232.405 of this chapter) during the preceding 12 months (or for such shorter period that the registrant was required to submit such files). Yes ý No ¨
Indicate by check mark whether the registrant is a large accelerated filer, an accelerated filer, a non accelerated filer, a smaller reporting company, or an emerging growth company. See the definitions of “large accelerated filer,” “accelerated filer,” “smaller reporting company” and “emerging growth company” in Rule 12b 2 of the Exchange Act.
Large accelerated filer | ¨ | Accelerated filer | ý | |
Non-accelerated filer | ¨ | Smaller reporting company | ¨ | |
Emerging growth company | ý | |||
If an emerging growth company, indicate by check mark if the registrant has elected not to use the extended transition period for complying with any new or revised financial accounting standards provided pursuant to Section 13(a) of the Exchange Act. ý
Indicate by check mark whether the registrant is a shell company (as defined in Rule 12b-2 of the Exchange Act). Yes ¨ No ý
Securities registered pursuant to Section 12(b) of the Act:
Title of each class | Trading Symbol | Name of exchange on which registered | ||
Common Stock, $0.0001 par value per share | NVTA | New York Stock Exchange | ||
The number of shares of the registrant’s common stock outstanding as of April 26, 2019 was 89,840,831.
TABLE OF CONTENTS
Page No. | ||
PART I — Financial Information
ITEM 1. Consolidated Financial Statements.
INVITAE CORPORATION
Condensed Consolidated Balance Sheets
(in thousands)
(unaudited)
March 31, 2019 | December 31, 2018 | ||||||
Assets | |||||||
Current assets: | |||||||
Cash and cash equivalents | $ | $ | |||||
Marketable securities | |||||||
Accounts receivable | |||||||
Prepaid expenses and other current assets | |||||||
Total current assets | |||||||
Property and equipment, net | |||||||
Operating lease assets | — | ||||||
Restricted cash | |||||||
Intangible assets, net | |||||||
Goodwill | |||||||
Other assets | |||||||
Total assets | $ | $ | |||||
Liabilities and stockholders’ equity | |||||||
Current liabilities: | |||||||
Accounts payable | $ | $ | |||||
Accrued liabilities | |||||||
Operating lease obligations | — | ||||||
Finance lease obligations | |||||||
Total current liabilities | |||||||
Operating lease obligations, net of current portion | — | ||||||
Finance lease obligations, net of current portion | |||||||
Debt | |||||||
Other long-term liabilities | |||||||
Total liabilities | |||||||
Commitments and contingencies (Note 8) | |||||||
Stockholders’ equity: | |||||||
Common stock | |||||||
Accumulated other comprehensive income (loss) | ( | ) | |||||
Additional paid-in capital | |||||||
Accumulated deficit | ( | ) | ( | ) | |||
Total stockholders’ equity | |||||||
Total liabilities and stockholders’ equity | $ | $ | |||||
See accompanying notes to unaudited condensed consolidated financial statements.
1
INVITAE CORPORATION
Condensed Consolidated Statements of Operations
(in thousands, except per share amounts)
(unaudited)
Three Months Ended March 31, | |||||||
2019 | 2018 | ||||||
Revenue: | |||||||
Test revenue | $ | $ | |||||
Other revenue | |||||||
Total revenue | |||||||
Cost of revenue | |||||||
Research and development | |||||||
Selling and marketing | |||||||
General and administrative | |||||||
Loss from operations | ( | ) | ( | ) | |||
Other income, net | |||||||
Interest expense | ( | ) | ( | ) | |||
Net loss | $ | ( | ) | $ | ( | ) | |
Net loss per share, basic and diluted | $ | ( | ) | $ | ( | ) | |
Shares used in computing net loss per share, basic and diluted | |||||||
See accompanying notes to unaudited condensed consolidated financial statements.
2
INVITAE CORPORATION
Condensed Consolidated Statements of Comprehensive Loss
(in thousands)
(unaudited)
Three Months Ended March 31, | |||||||
2019 | 2018 | ||||||
Net loss | $ | ( | ) | $ | ( | ) | |
Other comprehensive income: | |||||||
Unrealized income on available-for-sale marketable securities, net of tax | |||||||
Comprehensive loss | $ | ( | ) | $ | ( | ) | |
See accompanying notes to unaudited condensed consolidated financial statements.
3
INVITAE CORPORATION
Condensed Consolidated Statements of Stockholders' Equity
(in thousands)
(unaudited)
Three Months Ended March 31, | |||||||
2019 | 2018 | ||||||
Common stock: | |||||||
Balance, beginning of period | $ | $ | |||||
Common stock issued | — | ||||||
Balance, end of period | |||||||
Accumulated other comprehensive income (loss): | |||||||
Balance, beginning of period | ( | ) | ( | ) | |||
Unrealized income on available-for-sale marketable securities, net of tax | |||||||
Balance, end of period | ( | ) | |||||
Additional paid-in capital: | |||||||
Balance, beginning of period | |||||||
Common stock issued in connection with public offering, net | — | ||||||
Common stock issued on exercise of stock options, net | |||||||
Common stock issued pursuant to exercises of warrants | |||||||
Common stock issued pursuant to business combinations | — | ||||||
Warrants issued pursuant to loan agreement | — | ||||||
Stock-based compensation expense | |||||||
Other | — | ||||||
Balance, end of period | |||||||
Accumulated deficit: | |||||||
Balance, beginning of period | ( | ) | ( | ) | |||
Cumulative effect of accounting change | — | ||||||
Net loss | ( | ) | ( | ) | |||
Balance, end of period | ( | ) | ( | ) | |||
Total stockholders' equity | $ | $ | |||||
See accompanying notes to unaudited condensed consolidated financial statements.
4
INVITAE CORPORATION
Condensed Consolidated Statements of Cash Flows
(in thousands)
(unaudited)
Three Months Ended March 31, | |||||||
2019 | 2018 | ||||||
Cash flows from operating activities: | |||||||
Net loss | $ | ( | ) | $ | ( | ) | |
Adjustments to reconcile net loss to net cash used in operating activities: | |||||||
Depreciation and amortization | |||||||
Stock-based compensation | |||||||
Remeasurements of liabilities associated with business combinations | ( | ) | |||||
Other | |||||||
Changes in operating assets and liabilities: | |||||||
Accounts receivable | ( | ) | |||||
Prepaid expenses and other current assets | ( | ) | ( | ) | |||
Other assets | ( | ) | |||||
Accounts payable | ( | ) | ( | ) | |||
Accrued expenses and other liabilities | ( | ) | |||||
Net cash used in operating activities | ( | ) | ( | ) | |||
Cash flows from investing activities: | |||||||
Purchases of marketable securities | ( | ) | ( | ) | |||
Proceeds from sales of marketable securities | |||||||
Proceeds from maturities of marketable securities | |||||||
Purchases of property and equipment | ( | ) | ( | ) | |||
Net cash provided by (used in) in investing activities | ( | ) | |||||
Cash flows from financing activities: | |||||||
Proceeds from public offerings of common stock, net of issuance costs | |||||||
Proceeds from issuance of common stock | |||||||
Proceeds from debt financing | |||||||
Finance lease principal payments | ( | ) | ( | ) | |||
Net cash provided by financing activities | |||||||
Net increase in cash, cash equivalents and restricted cash | |||||||
Cash, cash equivalents and restricted cash at beginning of period | |||||||
Cash, cash equivalents and restricted cash at end of period | $ | $ | |||||
Supplemental cash flow information of non-cash investing and financing activities: | |||||||
Purchases of property and equipment in accounts payable and accrued liabilities | $ | $ | |||||
Investment in privately-held company in other assets and accrued liabilities | $ | $ | |||||
Warrants issued pursuant to loan and security agreement | $ | $ | |||||
Deferred offering costs included in accounts payable and accrued liabilities | $ | $ | |||||
Common stock issued for acquisition of businesses | $ | $ | |||||
Lease assets obtained in exchange for lease obligations, net | $ | $ | — | ||||
See accompanying notes to unaudited condensed consolidated financial statements.
5
INVITAE CORPORATION
Notes to Condensed Consolidated Financial Statements
1. Organization and description of business
Invitae Corporation ("Invitae," “the Company," "we," "us," and "our") was incorporated in the State of Delaware on January 13, 2010, as Locus Development, Inc. and changed its name to Invitae Corporation in 2012. We utilize an integrated portfolio of laboratory processes, software tools and informatics capabilities to process DNA-containing samples, analyze information about patient-specific genetic variation and generate test reports for clinicians and their patients. Our headquarters and main production facility is located in San Francisco, California. We currently have more than 20,000 genes in production and provide a variety of diagnostic tests that can be used in multiple indications. Our tests include genes associated with hereditary cancer, neurological disorders, cardiovascular disorders, pediatric disorders, metabolic disorders and other hereditary conditions. In addition, and as a result of the acquisitions of Good Start Genetics (“Good Start”) in August 2017 and CombiMatrix Corporation (“CombiMatrix”) in November 2017, our services also include screening and testing in reproductive health, including preimplantation and carrier screening for inherited disorders, prenatal diagnosis, miscarriage analysis and pediatric developmental disorders. To complement these offerings, in the first quarter of 2019, we introduced our Non-invasive Prenatal Screen. Invitae operates in one segment.
Basis of presentation
2. Summary of significant accounting policies
The preparation of financial statements in conformity with U.S. GAAP requires management to make estimates and assumptions that affect the reported amounts of assets and liabilities and disclosure of contingent liabilities as of the date of the financial statements and the reported amounts of revenue and expenses during the reporting period. We base these estimates on historical and anticipated results, trends and various other assumptions that we believe are reasonable under the circumstances, including assumptions as to future events. Actual results could differ materially from those estimates and assumptions.
Significant estimates and assumptions made by management include the determination of:
• | revenue recognition (See Note 3, “Revenue, accounts receivable and deferred revenue” for further information); |
• | the fair value of assets acquired and liabilities assumed for business combinations; |
• | the fair value of goodwill and intangible assets; |
• | the recoverability of long-lived assets; |
• | our incremental borrowing rate used to calculate our lease obligations; |
• | stock-based compensation expense and the fair value of awards issued; and |
• |
6
Significant customers are those that represent 10% or more of our total revenue presented on the statements of operations. For the significant customer, revenue as a percentage of total revenue were as follows:
Three Months Ended March 31, | ||||||
2019 | 2018 | |||||
Medicare | % | % | ||||
Our significant customer and its related accounts receivable balance as a percentage of total accounts receivable was as follows:
March 31, 2019 | December 31, 2018 | ||||
Medicare | % | % | |||
We consider all highly liquid investments with original maturities of three months or less from the date of purchase to be cash equivalents. Cash equivalents consist primarily of amounts invested in money market funds.
March 31, | |||||||
2019 | 2018 | ||||||
Cash and cash equivalents | $ | $ | |||||
Restricted cash | |||||||
Total cash, cash equivalents and restricted cash | $ | $ | |||||
The tangible and identifiable intangible assets acquired and liabilities assumed in a business combination are recorded based on their estimated fair values as of the business combination date, including identifiable intangible assets which either arise from a contractual or legal right or are separable from goodwill. We base the estimated fair value of identifiable intangible assets acquired in a business combination on independent valuations that use information and assumptions provided by our management, which consider our estimates of inputs and assumptions that a market participant would use. Any excess purchase price over the estimated fair value assigned to the net tangible and identifiable intangible assets acquired and liabilities assumed is recorded to goodwill. The use of alternative valuation assumptions, including estimated revenue projections, growth rates, cash flows,
7
discount rates, estimated useful lives and probabilities surrounding the achievement of contingent milestones could result in different purchase price allocations and amortization expense in current and future periods.
In circumstances where an acquisition involves a contingent consideration arrangement that meets the definition of a liability under Financial Accounting Standards Board ("FASB") Accounting Standards Codification (“ASC”) Topic 480, Distinguishing Liabilities from Equity, we recognize a liability equal to the fair value of the contingent payments we expect to make as of the acquisition date. We remeasure this liability each reporting period and record changes in the fair value as a component of operating expenses.
We have not incurred any goodwill impairment losses in any of the periods presented.
We recognize revenue when control of the promised goods or services is transferred to the customer in an amount that reflects the consideration we expect to be entitled to in exchange for those goods or services. All revenues are generated from contracts with customers.
Test revenue is generated primarily from the sale of tests that provide analysis and associated interpretation of the sequencing of parts of the genome.
Other revenue consists primarily of revenue from genome network subscription services which is recognized on a straight-line basis over the subscription term, and revenue from collaboration agreements.
Cost of revenue
8
We evaluate all Accounting Standards Updates (“ASUs”) issued by the FASB for consideration of their applicability. ASUs not included in the disclosures in this report were assessed and determined to be either not applicable or are not expected to have a material impact on our consolidated financial statements.
Recently issued accounting pronouncements not yet adopted
In June 2016, FASB issued ASU 2016-13, Financial Instruments-Credit Losses (Topic 326) which requires measurement and recognition of expected credit losses for financial assets. This guidance will become effective for us beginning in the first quarter of 2020 and must be adopted using a modified retrospective approach, with certain exceptions. We are currently evaluating the effect that adoption of this ASU will have on our consolidated financial statements.
Recently adopted accounting pronouncements – Leases
In February 2016, the FASB issued ASU 2016-02, Leases (Topic 842) and in July 2018 issued ASU 2018-10, Codification Improvements to Topic 842, Leases and ASU 2018-11, Leases (Topic 842): Targeted Improvements (the foregoing ASUs collectively referred to as “Topic 842”). Under the new guidance, lessees are required to recognize a lease liability and a right-of-use asset for all leases at the commencement date and also make expanded disclosures about leasing arrangements.
On January 1, 2019, we adopted Topic 842 using the modified retrospective approach in accordance with Topic 842. Adoption of Topic 842 had a material impact on our consolidated balance sheets, but did not have an impact on our consolidated statements of operations. Prior period amounts were not adjusted and continue to be reported in accordance with our historic accounting under previous lease guidance, ASC 840: Leases. We elected the package of practical expedients permitted under the transition guidance which, among other things, allowed us to carry forward the historical classification of leases in place as of January 1, 2019.
December 31, 2018 | Adjustments Due to the Adoption of Topic 842 | January 1, 2019 | ||||||||||
Property and equipment, net | $ | $ | ( | ) | $ | |||||||
Operating lease assets | $ | — | $ | $ | ||||||||
Other assets | $ | $ | $ | |||||||||
Accrued liabilities | $ | $ | ( | ) | $ | |||||||
Operating lease obligations | $ | — | $ | $ | ||||||||
Operating lease obligations, net of current portion | $ | — | $ | $ | ||||||||
Other long-term liabilities | $ | $ | ( | ) | $ | |||||||
The adjustments due to the adoption of Topic 842 primarily relate to the recognition of operating and finance lease right-of-use assets and operating lease liabilities. Finance lease assets are recorded within other assets on our consolidated balance sheet and were $5.2 million as of implementation of Topic 842 on January 1, 2019 and $4.8 million as of March 31, 2019.
Under Topic 842, we determine if an arrangement is a lease at inception primarily based on the determination of the party responsible for directing the use of an underlying asset within a contract. Operating leases are included in operating lease assets and operating lease obligations in our consolidated balance sheets. Lease assets represent our right to use an underlying asset for the lease term and lease liabilities represent our obligation to make lease payments arising from the lease. Operating lease right-of-use assets and liabilities are recognized at the lease commencement date based on the present value of lease payments over the lease term. In determining the present value of lease payments, we use our incremental borrowing rate based on the information available at the lease commencement date which includes significant assumptions made by us including our estimated credit rating. Operating lease right-of-use assets also include any lease payments made prior to the lease commencement date and exclude any lease incentives paid or payable at the lease commencement date. Lease terms may include options to extend or terminate the lease when it is reasonably certain that we will exercise any such options. Lease expense is recognized on a straight-line basis over the expected lease term.
9
As allowed under Topic 842, we elected to not apply the recognition requirements of Topic 842 to short-term leases, that is, leases with terms of 12 months or less which do not include an option to purchase the underlying asset that we are reasonably certain to exercise. For short-term leases, we recognize lease payments as operating expenses on a straight-line basis over the lease term.
As a result of our election of the package of practical expedients permitted under the Topic 842 transition guidance, for assets related to facilities leases we elected to account for lease and non-lease components, such as common area maintenance charges, as a single lease component.
3. Revenue, accounts receivable and deferred revenue
Test revenue is generated from sales of diagnostic tests to three groups of customers: institutions, such as hospitals, clinics and partners; patients who pay directly; and patients’ insurance carriers. Amounts billed and collected, and the timing of collections, vary based on whether the payer is an institution, an insurance carrier or a patient. Other revenue consists principally of revenue recognized under collaboration and genome network agreements.
Three Months Ended March 31, | |||||||
2019 | 2018 | ||||||
Test revenue: | |||||||
Institutions | $ | $ | |||||
Patient - direct | |||||||
Patient - insurance | |||||||
Total test revenue | |||||||
Other revenue | |||||||
Total revenue | $ | $ | |||||
We recognize revenue related to billings based on estimates of the amount that will ultimately be realized. The estimate of the transaction price of test revenue is based on many factors such as length of payer relationship, historical payment patterns, changes in contract provisions and insurance reimbursement policies. Cash collections for certain diagnostic tests delivered may differ from rates originally estimated. As a result of new information, we updated our estimate of the amounts to be recognized for previously delivered tests which resulted in an additional $0.4 million of test revenue for the three months ended March 31, 2019. This change in estimate decreased our loss from operations by $0.4 million and decreased basic and diluted net loss per share by approximately $0.01 for the three months ended March 31, 2019.
Accounts receivable
The majority of our accounts receivable represents amounts billed to institutions (e.g., hospitals, clinics, partners) and estimated amounts to be collected from third-party insurance payers for diagnostic test revenue recognized. Also included is amounts due under the terms of collaboration and genome network agreements for diagnostic testing and data aggregation reporting services provided and proprietary platform access rights transferred.
Deferred revenues
10
4. Business combinations
Good Start Genetics
5. Goodwill and intangible assets
Goodwill
There were no changes in the carrying amounts of goodwill during the three months ended March 31, 2019.
Intangible Assets
March 31, 2019 | December 31, 2018 | ||||||||||||||||||||||||||
Cost | Accumulated Amortization | Net | Weighted Average Useful Life (in Years) | Cost | Accumulated Amortization | Net | Weighted Average Useful Life (in Years) | ||||||||||||||||||||
Customer relationships | $ | $ | ( | ) | $ | $ | $ | ( | ) | $ | |||||||||||||||||
Developed technology | ( | ) | ( | ) | |||||||||||||||||||||||
Non-compete agreement | ( | ) | ( | ) | |||||||||||||||||||||||
Trade name | ( | ) | ( | ) | |||||||||||||||||||||||
Patent licensing agreement | ( | ) | ( | ) | |||||||||||||||||||||||
Favorable leases | ( | ) | ( | ) | |||||||||||||||||||||||
$ | $ | ( | ) | $ | $ | $ | ( | ) | $ | ||||||||||||||||||
Acquisition-related intangibles included in the above table are finite-lived and are carried at cost less accumulated amortization. Customer relationships are being amortized on an accelerated basis, in proportion to estimated cash flows. All other acquisition-related intangibles are being amortized on a straight-line basis over their estimated lives, which approximates the pattern in which the economic benefits of the intangible assets are realized. Amortization expense was $1.3 million for each of the three months ended March 31, 2019 and 2018. Amortization expense is recorded to cost of revenue, research and development, sales and marketing and general and administrative expense.
2019 (remainder of year) | $ | ||
2020 | |||
2021 | |||
2022 | |||
2023 | |||
Thereafter | |||
Total estimated future amortization expense | $ | ||
11
6. Balance sheet components
Property and equipment, net
March 31, 2019 | December 31, 2018 | ||||||
Leasehold improvements | $ | $ | |||||
Laboratory equipment | |||||||
Equipment under capital lease | |||||||
Computer equipment | |||||||
Software | |||||||
Furniture and fixtures | |||||||
Automobiles | |||||||
Construction-in-progress | |||||||
Total property and equipment, gross | |||||||
Accumulated depreciation and amortization | ( | ) | ( | ) | |||
Total property and equipment, net | $ | $ | |||||
Depreciation expense was $1.6 million and $2.1 million for the three months ended March 31, 2019 and 2018, respectively.
Accrued liabilities
March 31, 2019 | December 31, 2018 | ||||||
Accrued compensation and related expenses | $ | $ | |||||
Liabilities associated with business combinations | |||||||
Liability associated with co-development agreement | |||||||
Deferred revenue | |||||||
Other | |||||||
Total accrued liabilities | $ | $ | |||||
Other long-term liabilities
March 31, 2019 | December 31, 2018 | ||||||
Lease incentive obligation, non-current | $ | $ | |||||
Deferred rent, non-current | — | ||||||
Other non-current liabilities | 150 | ||||||
Total other long-term liabilities | $ | $ | |||||
7. Fair value measurements
Financial assets and liabilities are recorded at fair value. Fair value is defined as the price that would be received to sell an asset or paid to transfer a liability (an exit price) in an orderly transaction between market participants at the reporting date. The authoritative guidance establishes a three-level valuation hierarchy that prioritizes the inputs to valuation techniques used to measure fair value based upon whether such inputs are observable or unobservable. Observable inputs reflect market data obtained from independent sources, while unobservable inputs reflect market assumptions made by the reporting entity.
The three-level hierarchy for the inputs to valuation techniques is summarized as follows:
Level 1—Observable inputs such as quoted prices (unadjusted) for identical instruments in active markets.
12
Level 2—Observable inputs such as quoted prices for similar instruments in active markets, quoted prices for identical or similar instruments in markets that are not active, or model-derived valuations whose significant inputs are observable.
Level 3—Unobservable inputs that reflect the reporting entity’s own assumptions.
March 31, 2019 | |||||||||||||||||||||||||||
Amortized Cost | Unrealized | Estimated Fair Value | |||||||||||||||||||||||||
Gains | Losses | Level 1 | Level 2 | Level 3 | |||||||||||||||||||||||
Financial assets: | |||||||||||||||||||||||||||
Money market funds | $ | $ | — | $ | — | $ | $ | $ | — | $ | — | ||||||||||||||||
Certificates of deposit | — | — | — | — | |||||||||||||||||||||||
Commercial paper | — | — | — | ||||||||||||||||||||||||
Total financial assets | $ | $ | $ | — | $ | $ | $ | $ | — | ||||||||||||||||||
Financial liabilities: | |||||||||||||||||||||||||||
Contingent consideration | $ | — | — | $ | |||||||||||||||||||||||
Total financial liabilities | $ | — | — | $ | |||||||||||||||||||||||
March 31, 2019 | |||
Reported as: | |||
Cash equivalents | $ | ||
Restricted cash | |||
Marketable securities | |||
Total cash equivalents, restricted cash, and marketable securities | $ | ||
Accrued liabilities | $ | ||
13
December 31, 2018 | |||||||||||||||||||||||||||
Amortized Cost | Unrealized | Estimated Fair Value | |||||||||||||||||||||||||
Gains | Losses | Level 1 | Level 2 | Level 3 | |||||||||||||||||||||||
Financial assets: | |||||||||||||||||||||||||||
Money market funds | $ | $ | — | $ | — | $ | $ | $ | — | $ | — | ||||||||||||||||
Certificates of deposit | — | — | — | — | |||||||||||||||||||||||
Commercial paper | — | ( | ) | — | — | ||||||||||||||||||||||
U.S. treasury notes | — | — | — | — | |||||||||||||||||||||||
U.S. government agency securities | — | ( | ) | — | — | ||||||||||||||||||||||
Total financial assets | $ | $ | — | $ | ( | ) | $ | $ | $ | $ | — | ||||||||||||||||
Financial liabilities: | |||||||||||||||||||||||||||
Contingent consideration | $ | — | — | $ | |||||||||||||||||||||||
Total financial liabilities | $ | — | — | $ | |||||||||||||||||||||||
December 31, 2018 | |||
Reported as: | |||
Cash equivalents | $ | ||
Restricted cash | |||
Marketable securities | |||
Total cash equivalents, restricted cash, and marketable securities | $ | ||
Accrued liabilities | $ | ||
There were no transfers between Level 1, Level 2 and Level 3 during the periods presented. The total fair value of investments with unrealized losses at March 31, 2019 was nil. None of the available-for-sale securities held as of March 31, 2019 has been in a continuous unrealized loss position for more than one year. We have not identified any other-than-temporary declines in market value and thus have not recorded any impairment charges on our financial assets during the three months ended March 31, 2019.
At March 31, 2019, the remaining contractual maturities of available-for-sale securities ranged from zero to three months.
Our certificates of deposit, commercial paper, and debt securities of U.S. government agency entities are classified as Level 2 as they are valued based upon quoted market prices for similar instruments in active markets, quoted prices for identical or similar instruments in markets that are not active and model-based valuation techniques for which all significant inputs are observable in the market or can be corroborated by observable market data for substantially the full term of the assets. Where applicable, these models project future cash flows and discount the future amounts to a present value using market-based observable inputs obtained from various third-party data providers, including but not limited to benchmark yields, interest rate curves, reported trades, broker/dealer quotes and reference data.
As of March 31, 2019, we had a contingent obligation of $5.0 million of our common stock calculated using a 30-day trailing average share price to the former owners of AltaVoice in conjunction with our acquisition of AltaVoice in January 2017. The amount of the contingent obligation was dependent upon 2017 and 2018 revenue attributable to AltaVoice. Since revenue attributable to AltaVoice for the combined period of 2017 and 2018 was greater than the $10 million contingent milestone, in April 2019 we issued 0.2 million shares of our common stock to the former owners of AltaVoice which had a fair value on the date of issuance of $5.2 million.
14
8. Commitments and contingencies
Leases
Operating leases
In 2015, we entered into a lease agreement for our headquarters and main production facility in San Francisco, California which commenced in 2016. This lease expires in July 2026 and we may renew the lease for an additional ten years . This optional period was not considered reasonably certain to be exercised and therefore we determined the lease term to be a ten-year period expiring in 2026. In connection with the execution of the lease, we provided a security deposit of approximately $4.6 million which is included in restricted cash in our consolidated balance sheets. We also have other operating leases for office and laboratory space in California and Massachusetts.
As of March 31, 2019, the weighted-average remaining lease term for our operating leases was 6.5 years and the weighted-average discount rate used to determine our operating lease liability was 11.5 %. Cash payments included in the measurement of our operating lease liabilities were $2.4 million for the three months ended March 31, 2019.
Three Months Ended March 31, | |||||||
2019 | 2018 | ||||||
Operating lease costs | $ | $ | |||||
Sublease income | ( | ) | ( | ) | |||
Total operating lease costs | |||||||
Finance lease costs | |||||||
Total lease costs | $ | $ | |||||
2019 (remainder of year) | $ | ||
2020 | |||
2021 | |||
2022 | |||
2023 | |||
Thereafter | |||
Future non-cancelable minimum operating lease payments | |||
Less: minimum payments to be received from non-cancelable subleases | ( | ) | |
Total future non-cancelable minimum operating lease payments, net | |||
Less: imputed interest | ( | ) | |
Total operating lease liabilities | |||
Less: current portion | ( | ) | |
Operating lease obligations, net of current portion | $ | ||
Finance leases
We have entered into various finance lease agreements to obtain laboratory equipment. The terms of our finance leases are generally three years with a weighted-average remaining lease term of 1.4 years as of March 31, 2019 and are typically secured by the underlying equipment. The weighted-average discount rate used to determine the finance lease liability was 6.2 %. The portion of the future payments designated as principal repayment was classified as a finance lease obligation on our consolidated balance sheets. Cash payments included in the measurement of our finance lease liabilities were $0.5 million for the three months ended March 31, 2019.
15
2019 (remainder of year) | $ | ||
2020 | |||
2021 | |||
Total finance lease obligations | |||
Less: interest | ( | ) | |
Present value of net minimum finance lease payments | |||
Less: current portion | ( | ) | |
Finance lease obligations, net of current portion | $ | ||
Debt financing
In November 2018, we entered into a Note Purchase Agreement (the "2018 Note Purchase Agreement") pursuant to which we were eligible to borrow an aggregate principal amount up to $200.0 million over a seven year maturity term which included an initial borrowing of $75.0 million in November 2018. We received net proceeds of $10.3 million after terminating and repaying the balance of our obligations of approximately $64.7 million with our previous lender.
At March 31, 2019, obligations under the 2018 Note Purchase Agreement were $75.0 million which are required to be repaid to the lender in a balloon payment no later than 2025. If we repay prior to the three year anniversary following the initial borrowing, the amount due will be: 117.5 % of the principal amount if payment is made within 12 months after the borrowing; 132.5 % of the principal amount if payment is made between 12 and 24 months after the borrowing; and 145.0 % of the principal amount if payment is made between 24 and 36 months after the borrowing, all less the interest payments we've made since our initial borrowing.
The outstanding principal amount under the 2018 Note Purchase Agreement bears interest at a rate of 8.75 % annually. In addition, beginning on January 1, 2020 and continuing until repayment or maturity of any outstanding principal, we will make quarterly payments of 0.5 % of our annual net revenues subject to a maximum annual amount of such payments of $1.6 million which will be recognized as interest expense. Through the fixed interest charges and the quarterly revenue payments, we are required to pay total amounts to generate an 11 % internal rate of return to the lender on any outstanding principal balances due in a lump-sum upon the repayment or maturity of any outstanding principal. During the three months ended March 31, 2019, the 2018 Note Purchase Agreement bore interest at an average interest rate of 10.6 %.
The 2018 Note Purchase Agreement contains quarterly covenants to achieve certain revenue levels as well as additional covenants, including limits on our ability to dispose of assets, undergo a change of control, merge with or acquire other entities, incur debt, incur liens, pay dividends or other distributions to holders of our capital stock, repurchase stock and make investments, in each case subject to certain exceptions. Our obligations under the 2018 Note Purchase Agreement are secured by a security interest in substantially all of our and certain of our subsidiaries’ assets.
Debt discounts, including debt issuance costs, related to the 2018 Note Purchase Agreement of $0.7 million were recorded as a direct deduction from the debt liability and are being amortized to interest expense over the term of the 2018 Note Purchase Agreement. Future estimated payments under the 2018 Note Purchase Agreement as of March 31, 2019 are as follows (in thousands):
2019 (remainder of year) | $ | ||
2020 | |||
2021 | |||
2022 | |||
2023 | |||
Thereafter | |||
Total remaining payments | |||
Less: debt discount | ( | ) | |
Less: interest | ( | ) | |
Total debt | $ | ||
16
Interest expense related to our debt financings was $2.0 million and $1.2 million for the three months ended March 31, 2019 and 2018, respectively.
Other commitments
In the normal course of business, we enter into various purchase commitments primarily related to service agreements and laboratory supplies. At March 31, 2019, our total future payments under noncancelable unconditional purchase commitments having a remaining term of over one year were $5.6 million.
Guarantees and indemnifications
As permitted under Delaware law and in accordance with our bylaws, we indemnify our directors and officers for certain events or occurrences while the officer or director is or was serving in such capacity. The maximum amount of potential future indemnification is unlimited; however, we maintain director and officer liability insurance. This insurance allows the transfer of the risk associated with our exposure and may enable us to recover a portion of any future amounts paid. We believe the fair value of these indemnification agreements is minimal. Accordingly, we did not record any liabilities associated with these indemnification agreements at March 31, 2019 or December 31, 2018.
Contingencies
9. Stockholders’ equity
Shares Outstanding
Three Months Ended March 31, | |||||
2019 | 2018 | ||||
Convertible preferred stock: | |||||
Shares outstanding, beginning of period | |||||
Conversion into common stock | ( | ) | |||
Shares outstanding, end of period | |||||
Common stock: | |||||
Shares outstanding, beginning of period | |||||
Common stock issued in connection with public offering | |||||
Common stock issued on exercise of stock options, net | |||||
Common stock issued pursuant to vesting of RSUs | |||||
Common stock issued pursuant to exercises of warrants | |||||
Common stock issued pursuant to business combinations | |||||
Common stock issued upon conversion of preferred stock | |||||
Other | |||||
Shares outstanding, end of period | |||||
2018 Sales Agreement
In August 2018, we entered into a Common Stock Sales Agreement (the “2018 Sales Agreement”) with Cowen and Company, LLC (“Cowen”), under which we may offer and sell from time to time at our sole discretion shares of our common stock through Cowen as our sales agent, in an aggregate amount not to exceed $75.0 million. Cowen may sell the shares by any method permitted by law deemed to be an “at the market” offering as defined in Rule 415 of the Securities Act of 1933, including without limitation sales made directly on The New York Stock Exchange, and also may sell the shares in privately negotiated transactions, subject to our prior approval. Per the terms of the
17
agreement, Cowen receives a commission equal to 3 % of the gross proceeds of the sales price of all shares sold through it as sales agent under the 2018 Sales Agreement. In March 2019, we amended the 2018 Sales Agreement to increase the aggregate amount of our common stock to be sold under this agreement not to exceed $175.0 million. During 2018, we sold a total of 4.3 million shares of common stock under the 2018 Sales Agreement for aggregate gross proceeds of $61.1 million and net proceeds of $58.9 million. No shares of our common stock were sold under this agreement during 2019.
Public offerings
In March 2019, we sold, in an underwritten public offering, an aggregate of 10.4 million shares of our common stock at a price of $19.00 per share, for gross proceeds of $196.7 million and net proceeds of $184.5 million.
In April 2018, we sold, in an underwritten public offering, an aggregate of 12.8 million shares of our common stock at a price of $4.50 per share, for gross proceeds of $57.5 million and net proceeds of $53.5 million.
Private placement
10. Stock incentive plans
Stock incentive plans
In 2010, we adopted the 2010 Incentive Plan (the “2010 Plan”). The 2010 Plan provides for the granting of stock-based awards to employees, directors and consultants under terms and provisions established by our Board of Directors. Under the terms of the 2010 Plan, options may be granted at an exercise price not less than fair market value. For employees holding more than 10 % of the voting rights of all classes of stock, the exercise prices for incentive and nonstatutory stock options must be at least 110 % of fair market of the common stock on the grant date, as determined by our Board of Directors. The terms of options granted under the 2010 Plan may not exceed ten years .
In January 2015, we adopted the 2015 Stock Incentive Plan (the “2015 Plan”), which became effective upon the closing of our initial public offering (“IPO”). Shares outstanding under the 2010 Plan were transferred to the 2015 Plan upon effectiveness of the 2015 Plan. The 2015 Plan provides for automatic annual increases in shares available for grant, beginning on January 1, 2016 through January 1, 2025. In addition, shares subject to awards under the 2010 Plan that are forfeited or terminated will be added to the 2015 Plan. The 2015 Plan provides for the grant of incentive stock options, nonstatutory stock options, restricted stock awards, stock units, stock appreciation rights and other forms of equity compensation, all of which may be granted to employees, including officers, non-employee directors and consultants. Additionally, the 2015 Plan provides for the grant of cash-based awards.
Options granted generally vest over a period of four years . Typically, the vesting schedule for options granted to newly hired employees provides that 1/4 of the award vests upon the first anniversary of the employee’s date of hire, with the remainder of the award vesting monthly thereafter at a rate of 1/48 of the total shares subject to the option. All other options typically vest in equal monthly installments over the four-year vesting schedule.
RSUs generally vest over a period of three years . Typically, the vesting schedule for RSUs provides that 1/3 of the award vests upon each anniversary of the grant date.
18
Shares Available For Grant | Stock Options Outstanding | Weighted-Average Exercise Price Per Share | Weighted-Average Remaining Contractual Life (Years) | Aggregate Intrinsic Value | |||||||||||
Balances at December 31, 2018 | $ | $ | |||||||||||||
Additional shares reserved | — | ||||||||||||||
Options cancelled | ( | ) | |||||||||||||
Options exercised | — | ( | ) | ||||||||||||
RSUs granted | ( | ) | — | ||||||||||||
RSUs cancelled | — | ||||||||||||||
Balances at March 31, 2019 | $ | $ | |||||||||||||
Options exercisable at March 31, 2019 | $ | $ | |||||||||||||
Options vested and expected to vest at March 31, 2019 | $ | $ | |||||||||||||
The aggregate intrinsic value is calculated as the difference between the exercise price of the underlying stock options and the fair value of our common stock for stock options that were in-the-money.
The weighted-average fair value of RSUs granted was $14.45 and $7.81 in the three months ended March 31, 2019 and 2018, respectively.
The total grant-date fair value of options to purchase common stock vested was $1.1 million and $1.8 million in the three months ended March 31, 2019 and 2018, respectively.
The intrinsic value of options to purchase common stock exercised was $3.3 million and $0.1 million in the three months ended March 31, 2019 and 2018, respectively.
Number of Shares | Weighted- Average Grant Date Fair Value Per Share | |||||
Balance at December 31, 2018 | $ | |||||
RSUs granted | $ | |||||
RSUs vested | ( | ) | $ | |||
RSUs cancelled | ( | ) | $ | |||
Balance at March 31, 2019 | $ | |||||
2015 employee stock purchase plan
In January 2015, we adopted the 2015 Employee Stock Purchase Plan (the “ESPP”), which became effective upon the closing of the IPO. Employees participating in the ESPP may purchase common stock at 85 % of the lesser of the fair market value of common stock on the purchase date or last trading day preceding the offering date. At March 31, 2019, cash received from payroll deductions pursuant to the ESPP was $2.0 million.
The ESPP provides for automatic annual increases in shares available for grant, beginning on January 1, 2016 and continuing through January 1, 2025. At March 31, 2019, a total of 1.0 million shares of common stock were reserved for issuance under the ESPP.
Stock-based compensation
We use the grant date fair value of our common stock to value both employee and non-employee options when granted. We revalue non-employee options each reporting period using the fair market value of our common stock as of the last day of each reporting period.
19
Three Months Ended March 31, | |||||||
2019 | 2018 | ||||||
Cost of revenue | $ | $ | |||||
Research and development | |||||||
Selling and marketing | |||||||
General and administrative | |||||||
Total stock-based compensation expense | $ | $ | |||||
11. Net loss per share
Three Months Ended March 31, | |||||||
2019 | 2018 | ||||||
Net loss | $ | ( | ) | $ | ( | ) | |
Shares used in computing net loss per share, basic and diluted | |||||||
Net loss per share, basic and diluted | $ | ( | ) | $ | ( | ) | |
March 31, | |||||
2019 | 2018 | ||||
Shares of common stock subject to outstanding options | |||||
Shares of common stock subject to outstanding warrants | |||||
Shares of common stock subject to outstanding RSUs | |||||
Shares of common stock pursuant to ESPP | |||||
Shares of common stock underlying Series A convertible preferred stock | |||||
Total shares of common stock equivalents | |||||
12. Geographic information
Three Months Ended March 31, | |||||||
2019 | 2018 | ||||||
United States | $ | $ | |||||
Canada | |||||||
Rest of world | |||||||
Total revenue | $ | $ | |||||
20
ITEM 2. Management’s Discussion and Analysis of Financial Condition and Results of Operations.
The following discussion of our financial condition and results of operations should be read in conjunction with our condensed consolidated financial statements and the related notes included in Item 1 of Part I of this report, and together with our audited consolidated financial statements and the related notes included in our Annual Report on Form 10-K for the year ended December 31, 2018. Historic results are not necessarily indicative of future results.
This report contains forward‑looking statements within the meaning of the Private Securities Litigation Reform Act of 1995. All statements in this report other than statements of historical fact, including statements identified by words such as “believe,” “may,” “will,” “estimate,” “continue,” “anticipate,” “intend,” “expect” and similar expressions, are forward‑looking statements. Forward‑looking statements include, but are not limited to, statements about:
• | our views regarding the future of genetic testing and its role in mainstream medical practice; |
• | our mission and strategy for our business, products and technology, including our ability to expand our content and develop new content while maintaining attractive pricing, further enhance our genetic testing service and the related user experience, build interest in and demand for our tests and attract potential partners; |
• | the implementation of our business model; |
• | the expected benefits from our acquisitions; |
• | the rate and degree of market acceptance of our tests and genetic testing generally; |
• | our ability to scale our infrastructure and operations in a cost‑effective manner; |
• | the timing of and our ability to introduce improvements to our genetic testing platform and to expand our assay to include additional genes; |
• | our expectations with respect to future hiring; |
• | the timing and results of studies with respect to our tests; |
• | developments and projections relating to our competitors and our industry; |
• | our competitive strengths; |
• | the degree to which individuals will share genetic information generally, as well as share any related potential economic opportunities with us; |
• | our commercial plans, including our sales and marketing expectations; |
• | our ability to obtain and maintain adequate reimbursement for our tests; |
• | regulatory developments in the United States and foreign countries; |
• | our ability to attract and retain key scientific or management personnel; |
• | our expectations regarding our ability to obtain and maintain intellectual property protection and not infringe on the rights of others; |
• | our expectations regarding the time during which we will be an emerging growth company under the JOBS Act; |
• | our ability to obtain funding for our operations and the growth of our business, including potential acquisitions; |
• | our financial performance; |
• | the impact of accounting pronouncements and our critical accounting policies, judgments, estimates and assumptions on our financial results; |
• | our expectations regarding our future revenue, cost of revenue, operating expenses and capital expenditures, and our future capital requirements; and |
• | the impact of tax laws on our business. |
Forward‑looking statements are subject to a number of risks and uncertainties that could cause actual results to differ materially from those expected. These risks and uncertainties include, but are not limited to, those risks discussed in Item 1A of Part II of this report. Although we believe that the expectations and assumptions reflected in the forward‑looking statements are reasonable, we cannot guarantee future results, level of activity, performance or achievements. In addition, neither we nor any other person assumes responsibility for the accuracy and completeness of any of these forward‑looking statements. Any forward‑looking statements in this report speak
21
only as of the date of this report. We expressly disclaim any obligation or undertaking to update any forward‑looking statements.
This report contains statistical data and estimates that we obtained from industry publications and reports. These publications typically indicate that they have obtained their information from sources they believe to be reliable, but do not guarantee the accuracy and completeness of their information. Some data contained in this report is also based on our internal estimates. Although we have not independently verified the third‑party data, we believe it to be reasonable.
In this report, all references to “Invitae,” “we,” “us,” “our,” or “the Company” mean Invitae Corporation.
Invitae and the Invitae logo are trademarks of Invitae Corporation. We also refer to trademarks of other companies and organizations in this report.
Mission and strategy
Our mission is to bring comprehensive genetic information into mainstream medical practice, improving the quality of healthcare for billions of people. Our business model is to aggregate the world’s genetic tests into a single platform, consolidate and grow the genetic testing market, and on that foundation, build a new industry in which a network of customers and partners can work together to continue improving healthcare for every individual in the modernized healthcare system around the world.
Our strategy for long-term growth centers on five key drivers of our business, which we believe work in conjunction to create a flywheel effect extending our leadership position in the new market we are building:
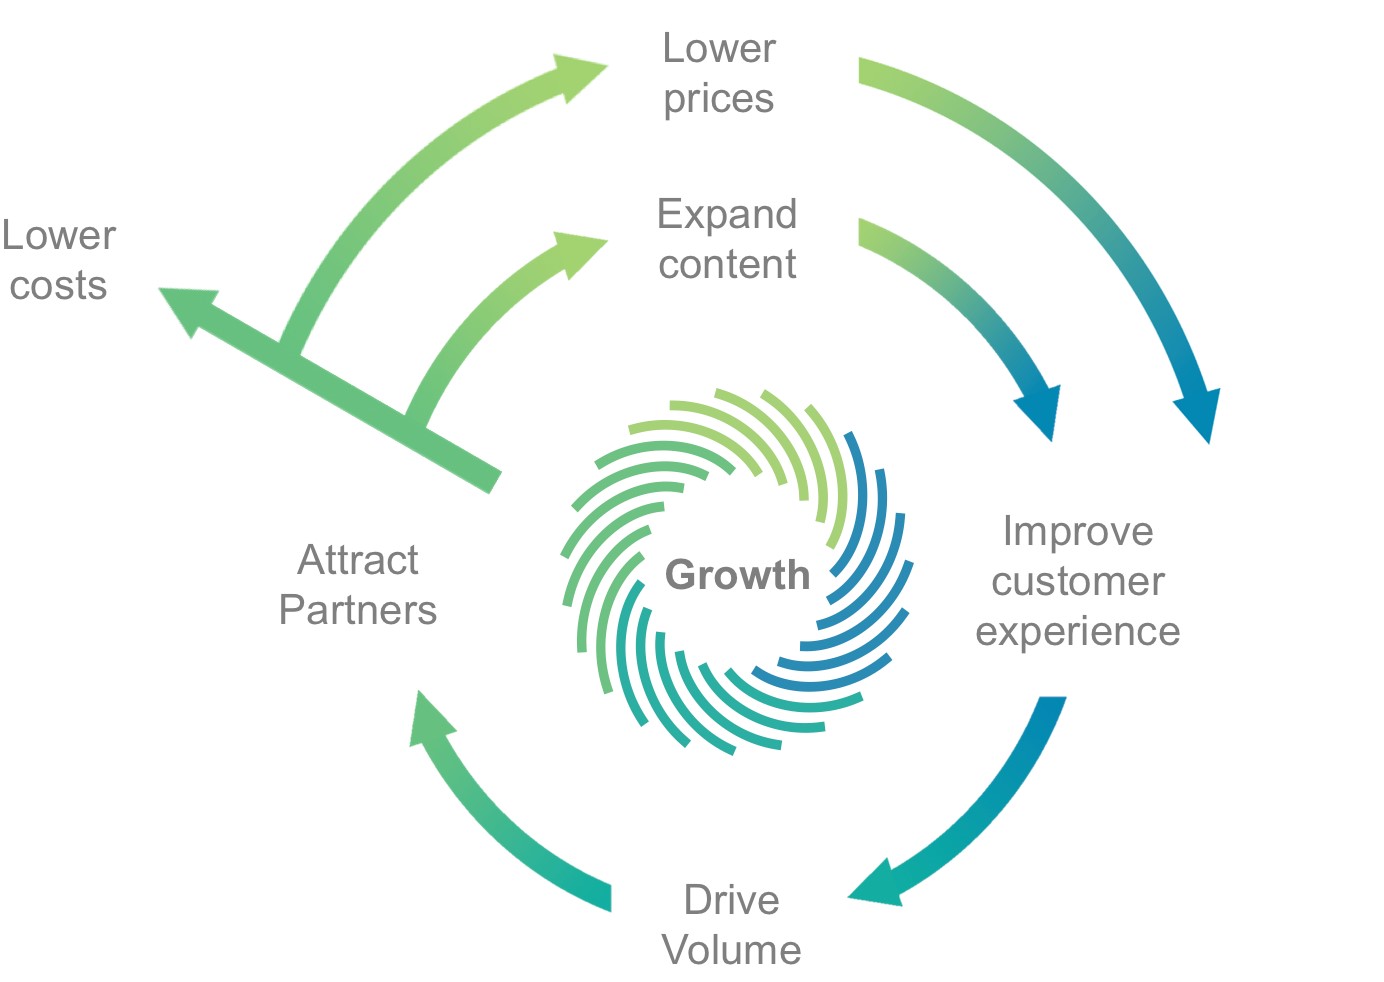
• | Expanding our content offering. We intend to continue steadily adding additional content to the Invitae platform, ultimately leading to affordable access to the personal molecular information relevant in enabling personalized medicine. The breadth and depth of our offering is a core and central contribution to an improved user experience. |
• | Creating a unique user experience. A state-of-the-art interactive platform will enhance our service offering, leverage the uniquely empowering characteristics of online sharing of genetic information and, we believe, enable a superior economic offering to clients. We intend to continue to expend substantial efforts developing, acquiring and implementing technology-driven improvements to our customers’ experience. We believe that an enhanced user experience and the resulting benefits to our brand and reputation will help draw customers to us over and above our direct efforts to do so. |
• | Driving volume. We intend to increase our brand equity and visibility through excellent service and a variety of marketing and promotional techniques, including scientific publications and presentations, sales, marketing, public relations, social media and web technology vehicles. We believe that rapidly increasing volume of customers using our platform helps us to attract partners. |
• | Attracting partners. As we add more customers to our platform, we believe our business becomes particularly attractive to potential partners that can help the patients in our network further benefit from their genetic information or that provide us access to new customers who may wish to join our |
22
network. We believe the cumulative effect of the increased volume brought by these strategic components will allow us to lower the cost of our service.
• | Lowering the costs and price of genetic information. Our goal is to provide customers with a broad menu of genetic content at a reasonable price and rapid turn-around time in order to grow volume and further achieve economies of scale. As we do so and experience further cost savings, we expect that those cost savings will allow us to deliver still more comprehensive information at decreasing prices and further improve the customer experience, allowing us to experience cumulative benefits from all of the efforts outlined above. |
We seek to differentiate our service in the market by establishing an exceptional customer experience. To that end, we believe that elevating the needs of the customer over those of our other stakeholders is essential to our success. Thus, in our decision-making processes, we will strive to prioritize, in order:
1) | the needs of our customers; |
2) | motivating our employees to serve the needs of our customers; and |
3) | our long-term stockholder value. |
We are certain that focusing on customers as our top priority rather than short-term financial goals is the best way to build and operate an organization for maximum long-term value creation.
Business overview
We offer high quality, comprehensive, affordable genetic testing across multiple clinical areas, including hereditary cancer, cardiology, neurology, pediatrics, metabolic conditions and rare diseases. To augment our offering and realize our mission, we have acquired multiple assets including four businesses in 2017, which expanded our suite of genome management offerings and completed our entry into prenatal and perinatal genetic testing. In the first quarter of 2019, we expanded our reproductive offering by introducing our Non-invasive Prenatal Screen.
In 2017, we established a leading position in family health genetic information services through the strategic acquisition of reproductive health testing capabilities. In January 2017, we acquired AltaVoice, formerly PatientCrossroads, a patient-centered data company with a global platform for collecting, curating, coordinating and delivering safeguarded data from patients and clinicians. This acquisition was complemented by the acquisition in June 2017 of Ommdom, Inc. and its product, CancerGene Connect, an end-to-end platform for collecting and managing genetic family histories to deliver personalized genetic risk information. In August 2017, we acquired Good Start Genetics, Inc., or Good Start, a molecular diagnostics company focused on preimplantation and carrier screening for inherited disorders. In November 2017, we completed our acquisition of CombiMatrix Corporation, or CombiMatrix, a company specializing in prenatal diagnosis, miscarriage analysis and pediatric developmental disorders.
We have experienced rapid growth. For the years ended December 31, 2018, 2017 and 2016, our revenue was $147.7 million, $68.2 million and $25.0 million, respectively, and we incurred net losses of $129.4 million, $123.4 million and $100.3 million, respectively. For the three months ended March 31, 2019 and 2018, our revenue was $40.6 million and $27.7 million, respectively, and we incurred net losses of $37.7 million and $36.1 million, respectively. At March 31, 2019, our accumulated deficit was $554.4 million. To meet the demands of scaling our business, we increased our number of employees to 884 at March 31, 2019 from 672 on March 31, 2018. We grew our sales force to 170 at March 31, 2019 from 112 at March 31, 2018. We expect headcount will continue to increase in 2019 as we add to the team to support anticipated growth.
Sales of our tests have grown significantly. In 2018, 2017 and 2016, we generated approximately 292,000, 145,000 and 57,000 billable tests, respectively. In the three months ended March 31, 2019, we generated approximately 87,000 billable tests compared to approximately 59,000 billable tests in the same period in 2018. Approximately 31% of the billable tests we performed in the first three months of 2019 were billable to institutions and patients, and the remainder were billable to third-party payers. Many of the gene tests on our assays are tests for which insurers reimburse. However, when we do not have reimbursement policies or contracts with private insurers, our claims for reimbursement may be denied upon submission, and we must appeal the claims. The appeals process is time consuming and expensive, and may not result in payment. Even if we are successful in achieving reimbursement, we may be paid at lower rates than if we were under contract with the third-party payer. When there is not a contracted rate for reimbursement, there is typically a greater coinsurance or copayment requirement from the patient which may result in further delay or decreased likelihood of collection.
23
We expect to incur operating losses for the near-term future and may need to raise additional capital in order to fund our operations. If we are unable to achieve our revenue growth objectives and successfully manage our costs, we may not be able to achieve profitability.
We believe that the keys to our future growth will be to increase billable test volumes, achieve broad reimbursement coverage for our tests from third-party payers, consistently drive down the price for genetic analysis and interpretation, steadily increase the amount of genetic content we offer, consistently improve the client experience, drive physician and patient utilization of our website for ordering and delivery of results and increase the number of strategic partners working with us to add value for our clients.
Factors affecting our performance
Number of billable tests
The growth in our genetic testing business is tied to the number of tests for which we bill third-party payers, institutions, partners or patients, which we refer to as billable tests. We typically bill for our services following delivery of the billable test report derived from testing samples and interpreting the results. We incur the expenses associated with a test in the period in which the test is processed regardless of when payment is received with respect to that test. We believe the number of billable tests in any period is the most important indicator of the growth in our business, and with time, this will translate into the number of customers we add to the platform and the revenue generated per customer.
Success obtaining and maintaining reimbursement
Our ability to increase the number of billable tests and our revenue will depend in part on our success achieving broad reimbursement coverage and laboratory service contracts for our tests from third-party payers and agreements with institutions and partners. Reimbursement may depend on a number of factors, including a payer’s determination that a test is appropriate, medically necessary and cost-effective, as well as whether we are in contract, where we get paid more consistently and at higher rates. Because each payer makes its own decision as to whether to establish a policy or enter into a contract to reimburse for our testing services, seeking these approvals is a time-consuming and costly process. In addition, clinicians may decide not to order our tests if the cost of the test is not covered by insurance. Because we require an ordering physician to requisition a test, our revenue growth also depends on our ability to successfully promote the adoption of our testing services and expand our base of ordering clinicians. We believe that establishing coverage and obtaining contracts from third-party payers is an important factor in gaining adoption by ordering clinicians. As of March 31, 2019, we have entered into contracts for laboratory services with payers covering approximately 270 million lives, comprised of Medicare, most national health plans, and Medicaid in 44 states, including California (Medi-Cal), our home state.
In cases where we have established reimbursement rates with third-party payers, we face additional challenges in complying with their procedural requirements for reimbursement. These requirements may vary from payer to payer, and it may be time-consuming and require substantial resources to meet these requirements. We may also experience delays in or denials of coverage if we do not adequately comply with these requirements. In addition, we have experienced, and may continue to experience, delays in reimbursement when we transition to being an in-network provider with a payer.
We expect to continue to focus our resources on increasing adoption of, and expanding coverage and reimbursement for, our current tests, tests provided by companies we acquire and any future tests we may develop. However, if we are not able to continue to obtain and maintain adequate reimbursement from third-party payers and institutions and partners for our testing services and expand the base of clinicians ordering our tests, we may not be able to effectively increase the number of billable tests or our revenue.
Ability to lower the costs associated with performing our tests
Reducing the costs associated with performing our genetic tests is both a focus and a strategic objective of ours. Over the long term, we will need to reduce the cost of raw materials by improving the output efficiency of our assays and laboratory processes, modifying our platform-agnostic assays and laboratory processes to use materials and technologies that provide equal or greater quality at lower cost, improving how we manage our materials, porting some tests onto a next generation sequencing platform and negotiating favorable terms for our materials purchases. We also intend to continue to design and implement hardware and software tools that will reduce personnel-related costs for both laboratory and clinical operations/medical interpretation by increasing personnel efficiency and thus lowering labor costs per test.
24
Ability to expand our genetic content
As we reduce our costs, we intend to continue to expand our test menus by steadily releasing additional genetic content for the same or lower prices per test, ultimately leading to affordable whole genome services. The breadth and flexibility of our offering will be a critical factor in our ability to address new markets for genetic testing services. Both of these will be critical to our ability to continue to grow the volume of billable tests we deliver.
Investment in our business and timing of expenses
We plan to continue to invest in our genetic testing and information management business. We deploy state-of-the-art and costly technologies in our genetic testing services, and we intend to continue to scale our infrastructure, including our testing capacity and information systems. We also expect to incur software development costs as we seek to further automate our laboratory processes and our genetic interpretation and report sign-out procedures, scale our customer service capabilities and expand the functionality of our website. We plan to hire additional personnel as necessary to support anticipated growth, including software engineers, sales and marketing personnel, billing personnel, research and development personnel, medical specialists, biostatisticians and geneticists. We will also incur additional costs related to the expansion of our production facilities in San Francisco and Irvine to accommodate growth. In addition, we expect to incur ongoing expenses as a result of operating as a public company. The expenses we incur may vary significantly by quarter, as we focus on building out different aspects of our business.
How we recognize revenue
We generally recognize revenue on an accrual basis, which is when a customer obtains control of the promised goods or services, typically a test report. Accrual amounts recognized are based on estimates of the consideration that we expect to receive and such estimates are adjusted and subsequently recorded until fully settled. Changes to such estimates may increase or decrease revenue recognized in future periods. Revenue from our tests may not be equal to billed amounts due to a number of factors, including differences in reimbursement rates, the amounts of patient copayments, the existence of secondary payers and claims denials.
Financial overview
Revenue
We primarily generate revenue from the sale of our tests, which provide the analysis and associated interpretation of the sequencing of parts of the genome. Clients are billed upon delivery of test results to the physician. Our ability to increase our revenue will depend on our ability to increase our market penetration, obtain contracted reimbursement coverage from third-party payers, sign contracts with institutions and partners, and increase the rate at which we are paid for tests performed.
Cost of revenue
Cost of revenue reflects the aggregate costs incurred in delivering test results to clinicians and includes expenses for materials and supplies, personnel-related costs, equipment and infrastructure expenses associated with testing and allocated overhead including rent, equipment depreciation, amortization of acquired intangibles and utilities. Costs associated with performing our tests are recorded as the patient’s sample is processed. We expect cost of revenue to generally increase in line with the increase in the number of tests we perform. However, we expect that the cost per test will decrease over time due to the efficiencies we expect to gain as test volume increases and from automation and other cost reductions, although the cost per test may fluctuate from quarter to quarter.
Operating expenses
Our operating expenses are classified into three categories: research and development, selling and marketing, and general and administrative. For each category, the largest component is personnel-related costs, which include salaries, employee benefit costs, bonuses, commissions, as applicable, and stock-based compensation expense.
25
Research and development
Research and development expenses represent costs incurred to develop our technology and future tests. These costs are principally for process development associated with our efforts to expand the number of genes we can evaluate in our tests and with our efforts to lower the cost of performing our test. In addition, we incur process development costs to further develop the software we use to operate our laboratory, analyze the data it generates, process customer orders, enable ease of customer ordering, deliver reports and automate our business processes. These costs consist of personnel-related costs, laboratory supplies and equipment expenses, consulting costs and allocated overhead including rent, information technology, equipment depreciation and utilities.
We expense all research and development costs in the periods in which they are incurred. We expect our research and development expenses to increase as we continue our efforts to develop additional tests, make investments to reduce testing costs and work on scaling the business.
Selling and marketing
Selling and marketing expenses consist of personnel-related costs, client service expenses, advertising and marketing expenses, educational and promotional expenses, market research and analysis, and allocated overhead including rent, information technology, equipment depreciation and utilities. We expect our selling and marketing expenses to significantly increase as we expand our salesforce and increase our marketing and advertising.
General and administrative
General and administrative expenses include executive, finance and accounting, billing and collections, legal and human resources functions. These expenses include personnel-related costs; audit, accounting and legal expenses; consulting costs; allocated overhead including rent, information technology, equipment depreciation, utilities; and any losses incurred in relation to our collaboration agreements. We expect our general and administrative expenses to increase as we support continued growth of operations.
Other income, net
Other income, net, primarily consists of income generated from our marketable securities, adjustments to fair value of acquisition liabilities and losses on disposal of assets.
Interest expense
Interest expense is attributable to debt financing and finance leases. See Note 8 “Commitments and contingencies” in the Notes to Condensed Consolidated Financial Statements included elsewhere in this report.
Critical accounting policies and estimates
Management’s discussion and analysis of our financial condition and results of operations is based on our consolidated financial statements, which have been prepared in accordance with U.S. generally accepted accounting principles, or U.S. GAAP. The preparation of these financial statements requires us to make estimates and assumptions that affect the reported amounts of assets and liabilities and the disclosure of contingent assets and liabilities at the date of the financial statements, as well as the reported revenue generated and expenses incurred during the reporting periods. Our estimates are based on our historical experience and on various other factors that we believe are reasonable under the circumstances, the results of which form the basis for making judgments about the carrying value of assets and liabilities that are not readily apparent from other sources. Actual results may differ from these estimates under different assumptions or conditions and any such differences may be material. We believe that the accounting policies discussed below are critical to understanding our historical and future performance, as these policies relate to the more significant areas involving management’s judgments and estimates.
Revenue recognition
We generate test revenue primarily from delivery of test reports generated from our assays. Other revenue consists primarily of revenue from genome network subscription services which we recognize on a straight-line basis over the subscription term, and from revenue from collaboration agreements.
Under ASC 606, Revenue from Contracts with Customers, or ASC 606, we generally recognize revenue on an accrual basis, that is when a customer obtains control of the promised goods or services which for us is delivery of a test report. Accrual amounts are based on an estimate of the consideration that we expect to receive, and such
26
estimates will be adjusted and subsequently recorded until fully settled. The estimate of the consideration that we expect to receive requires significant judgment by management and any adjustments may be material.
Business Combinations — Purchase Accounting
We apply ASC 805, Business Combinations, or ASC 805, which is the accounting guidance related to business combinations. The standard requires recognition of assets acquired, liabilities assumed, and contingent consideration at their fair value on the acquisition date with subsequent changes recognized in earnings; requires acquisition-related expenses and restructuring costs to be recognized separately from the business combination and expensed as incurred; requires in-process research and development to be capitalized at fair value as an indefinite-lived intangible asset until completion or abandonment; and requires that changes in accounting for deferred tax asset valuation allowances and acquired income tax uncertainties after the measurement period be recognized as a component of provision for taxes.
We account for acquisitions of entities that include inputs and processes and have the ability to create outputs as business combinations. The purchase prices of acquisitions are allocated to tangible assets, liabilities and identifiable intangible assets acquired based on their estimated fair values. The excess of purchase prices over those fair values is recorded as goodwill. Acquisition-related expenses are expensed as incurred. While we use our best estimates and assumptions as a part of the process to accurately value assets acquired and liabilities assumed at the business combination date, these estimates and assumptions are inherently uncertain and subject to refinement. Our key assumptions used have included projected revenue, cost of goods sold and operating expenses for our acquired entities, as well as discount rates. As a result, during the measurement period, which may be up to one year from the business combination date, we may record adjustments to the assets acquired and liabilities assumed, with the corresponding offset to goodwill. After the measurement period, we record adjustments to assets acquired or liabilities assumed subsequent to the measurement period in our operating results in the period in which the adjustments are determined.
Goodwill
In accordance with ASC 350, Intangibles – Goodwill and Other, or ASC 350, we do not amortize goodwill or other intangible assets with indefinite lives but rather test them for impairment. ASC 350 requires us to perform an impairment review of our goodwill balance at least annually, which we do in the fourth fiscal quarter each year and whenever events or changes in circumstances indicate that the carrying amount of these assets may not be recoverable.
Leases
We determine if an arrangement is a lease at inception primarily based on the determination of the party responsible for directing the use of an underlying asset within a contract. Operating leases are included in operating lease assets and operating lease obligations in our consolidated balance sheets. Lease assets represent our right to use an underlying asset for the lease term and lease liabilities represent our obligation to make lease payments arising from the lease. Operating lease right-of-use assets and liabilities are recognized at the lease commencement date based on the present value of lease payments over the lease term. In determining the present value of lease payments, we use our incremental borrowing rate based on the information available at the lease commencement date which includes significant assumptions made by us including our estimated credit rating. Operating lease right-of-use assets also include any lease payments made prior to the lease commencement date and exclude any lease incentives paid or payable at the lease commencement date. Lease terms may include options to extend or terminate the lease when it is reasonably certain that we will exercise any such options. Lease expense is recognized on a straight-line basis over the expected lease term.
Stock-based compensation
Stock-based compensation expense is measured at the date of grant and is based on the estimated fair value of the award. Compensation cost is recognized as expense on a straight-line basis over the vesting period for options and restricted stock units, or RSUs. In determining the fair value of stock options and Employee Stock Purchase Plan, or ESPP, purchases, we estimate the grant date fair value, and the resulting stock-based compensation expense, using the Black-Scholes option-pricing model. We estimate the grant date fair value of RSU awards based on the grant date share price.
We account for stock-based compensation arrangements with non-employees using a fair value approach. The fair value of these options is measured using the Black-Scholes option-pricing model reflecting the same assumptions as applied to employee options in each of the reported periods, other than the expected life, which is
27
assumed to be the remaining contractual life of the option. The compensation expenses of these arrangements are subject to remeasurement over the vesting terms as earned.
The Black-Scholes option-pricing model requires the use of highly subjective assumptions, which determine the fair value of stock-based awards. These assumptions include:
Expected term—The expected term represents the period that stock-based awards are expected to be outstanding. We use the simplified method to determine the expected term, which is based on the mid-point between the vesting date and the end of the contractual term.
Expected volatility—Because we were privately held until our initial public offering in February 2015 and did not have any trading history for our common stock, we have estimated expected volatility using our own stock price volatility when available as well as the average volatility for comparable publicly traded life sciences companies, including molecular diagnostics companies, over a period equal to the expected term of stock option grants and RSUs. When selecting comparable publicly traded biopharmaceutical companies, including molecular diagnostics companies, we have selected companies with comparable characteristics to us, including enterprise value, risk profiles, position within the industry and with historical share price information sufficient to meet the expected life of the stock-based awards. We have computed historical volatility data using daily closing prices for the selected companies’ shares during the equivalent period of the calculated expected term of the stock-based awards. We will continue to apply this process until a sufficient amount of historical information regarding the volatility of our own stock price becomes available. We estimate expected volatility for ESPP purchases using our own stock price volatility over the expected six-month term of the ESPP purchase period.
Risk-free interest rate—The risk-free interest rate is based on the U.S. Treasury zero coupon issues in effect at the time of grant for periods corresponding with the expected term of an option.
Dividend yield—We have never paid dividends on our common stock and have no plans to pay dividends on our common stock. Therefore, we used an expected dividend yield of zero.
In addition to the Black-Scholes assumptions, we estimate our forfeiture rate based on an analysis of our actual forfeitures and will continue to evaluate the adequacy of the forfeiture rate based on actual forfeiture experience, analysis of employee turnover behavior and other factors. The impact from any forfeiture rate adjustment would be recognized in full in the period of adjustment and if the actual number of future forfeitures differs from our estimates, we may be required to record adjustments to stock-based compensation in future periods.
Results of operations
Three Months Ended March 31, 2019 and 2018
The following sets forth our consolidated statements of operations data for each of the periods indicated (in thousands, except percentage changes). Our historical results are not necessarily indicative of our results of operations to be expected for any future period.
Three Months Ended March 31, | Dollar Change | % Change | |||||||||||
2019 | 2018 | ||||||||||||
Revenue: | |||||||||||||
Test revenue | $ | 39,619 | $ | 27,053 | $ | 12,566 | 46% | ||||||
Other revenue | 934 | 618 | 316 | 51% | |||||||||
Total revenue | 40,553 | 27,671 | 12,882 | 47% | |||||||||
Cost of revenue | 21,254 | 18,076 | 3,178 | 18% | |||||||||
Research and development | 17,994 | 15,366 | 2,628 | 17% | |||||||||
Selling and marketing | 24,193 | 18,924 | 5,269 | 28% | |||||||||
General and administrative | 13,319 | 11,780 | 1,539 | 13% | |||||||||
Loss from operations | (36,207 | ) | (36,475 | ) | 268 | (1)% | |||||||
Other income, net | 638 | 1,647 | (1,009 | ) | (61)% | ||||||||
Interest expense | (2,108 | ) | (1,292 | ) | (816 | ) | 63% | ||||||
Net loss | $ | (37,677 | ) | $ | (36,120 | ) | $ | (1,557 | ) | 4% | |||
28
Revenue
The increase in total revenue of $12.9 million for the three months ended March 31, 2019 compared to the same period in 2018 was due primarily to increased test volume. Billable test volumes increased to approximately 87,000 in the three months ended March 31, 2019 compared to 59,000 in the same period of 2018. Average revenue per test decreased to $455 per test in the three months ended March 31, 2019 compared to $459 per test in the comparable prior period primarily due to slight changes in payer mix.
Cost of revenue
The increase in the cost of revenue of $3.2 million for the three months ended March 31, 2019 compared to the same period in 2018 was primarily due to costs associated with increased test volume, partially offset by the effect of cost efficiencies. For the three months ended March 31, 2019, the number of samples accessioned increased to approximately 94,000 from approximately 64,000 for the same period in 2018. Cost per sample accessioned was $226 in the three months ended March 31, 2019 compared to $279 for the same period in 2018. The lower cost per sample accessioned in the current period was primarily attributable to increased volume, which together with automation efficiencies, resulted in lower per-sample costs for laboratory materials, labor and equipment depreciation. In addition, per-sample shipping costs were lower in the three months ended March 31, 2019 compared to the same period in 2018.
Research and development
The increase in research and development expense of $2.6 million for the three months ended March 31, 2019 compared to the same period in 2018 was due to the growth of the business and primarily consisted of the following elements as we invest in research and development initiatives as we grow: personnel-related costs increased by $4.8 million, principally reflecting increased headcount, and allocated technology expenses increased by $0.5 million.
These cost increases were partially offset by increased allocations of resources from research and development to cost of revenue, resulting from increased test volumes, which reduced research and development expense by $1.4 million when compared to the prior year period, as well as decreases in depreciation and amortization of $0.6 million and professional fees by $0.5 million.
Selling and marketing
The increase in selling and marketing expense of $5.3 million for the three months ended March 31, 2019 compared to the same period in 2018 was due primarily to the growth of the business and our increased spend on marketing initiatives and principally consisted of the following elements: personnel-related costs increased by $3.8 million primarily reflecting increased headcount; information technology costs increased by $0.5 million; and travel and related costs increased by $0.3 million.
General and administrative
The increase in general and administrative expense of $1.5 million for the three months ended March 31, 2019 compared to the same period in 2018 was due primarily to the growth of the business and principally consisted of the following elements: occupancy costs increased by $0.7 million; personnel-related costs increased by $0.6 million primarily due to increased headcount; right of first refusal payments relating to collaboration agreements increased by $0.5 million; professional fees increased by $0.4 million; and travel and related costs increased by $0.3 million.
These cost increases were partially offset by a decrease of $1.1 million in allocations of technology and facilities-related expenses to other functional areas.
Other income, net
The decrease in other income, net of $1.0 million for the three months ended March 31, 2019 compared to the same period in 2018 was primarily due to a decrease of $1.7 million in net gains on remeasurements of acquisition-related liabilities partially offset by increases in interest income generated on our cash equivalents and marketable securities.
29
Interest expense
The increase in interest expense of $0.8 million for the three months ended March 31, 2019 compared to the same period in 2018 was due principally to increased borrowings under our debt facilities outstanding during the three months ended March 31, 2019 as compared to the same period in 2018.
Liquidity and capital resources
Liquidity and capital expenditures
We have incurred net losses since our inception. For the three months ended March 31, 2019 and 2018, we had net losses of $37.7 million and $36.1 million, respectively, and we expect to incur additional losses in the near term. At March 31, 2019, we had an accumulated deficit of $554.4 million. While our revenue has increased over time, we may never achieve revenue sufficient to offset our expenses.
Since inception, our operations have been financed primarily by net proceeds from sales of our capital stock, fees collected from our customers as well as borrowing from debt facilities.
In November 2018, we entered into a Note Purchase Agreement (the "2018 Note Purchase Agreement") pursuant to which we are eligible to borrow an aggregate principal amount up to $200.0 million over its maturity term of 7 years which included an initial borrowing of $75.0 million in November 2018 which we used to extinguish our previous debt. The outstanding principal amount under the 2018 Note Purchase Agreement bears interest at a rate of 8.75% annually. In addition, beginning on January 1, 2020 and continuing until the maturity date, we will make quarterly payments of 0.5% of our annual net revenues subject to a maximum annual amount of such payments of $1.6 million which will be recognized as interest expense. Through the fixed interest charges and the quarterly revenue payments, we are required to pay total amounts to generate an 11% internal rate of return to the lender on any outstanding principal balances due in a lump-sum upon the repayment or maturity of any outstanding principal.
The 2018 Note Purchase Agreement contains quarterly covenants to achieve certain revenue levels as well as additional covenants, including limits on our ability to dispose of assets, undergo a change of control, merge with or acquire other entities, incur debt, incur liens, pay dividends or other distributions to holders of our capital stock, repurchase stock and make investments, in each case subject to certain exceptions. See more details on the 2018 Note Purchase Agreement in Note 8, “Commitments and contingencies” in the Notes to Condensed Consolidated Financial Statements included elsewhere in this report.
At March 31, 2019 and December 31, 2018, we had $287.1 million and $131.9 million, respectively, of cash, cash equivalents, restricted cash and marketable securities.
Our primary uses of cash are to fund our operations as we continue to grow our business, enter into partnerships and potentially to acquire businesses and technologies. Cash used to fund operating expenses is affected by the timing of when we pay expenses, as reflected in the change in our outstanding accounts payable and accrued expenses.
We have incurred substantial losses since our inception, and we expect to continue to incur losses in the near term. We believe our existing cash, cash equivalents and marketable securities as of March 31, 2019, fees collected from the sale of our tests, and amounts available to us pursuant to the 2018 Note Purchase Agreement, will be sufficient to meet our anticipated cash requirements for the foreseeable future.
We may need additional funding to finance operations prior to achieving profitability or should we make additional acquisitions. We regularly consider fundraising opportunities and will determine the timing, nature and size of future financings based upon various factors, including market conditions and our operating plans. We may in the future elect to finance operations by selling equity or debt securities or borrowing money. We also may elect to finance future acquisitions. If we issue equity securities, dilution to stockholders may result. Any equity securities issued may also provide for rights, preferences or privileges senior to those of holders of our common stock. If we raise funds by issuing debt securities, these debt securities would have rights, preferences and privileges senior to those of holders of our common stock. In addition, the terms of debt securities or borrowings could impose significant restrictions on our operations. If additional funding is required, there can be no assurance that additional funds will be available to us on acceptable terms on a timely basis, if at all. If we are unable to obtain additional funding when needed, we will need to curtail planned activities to reduce costs. Doing so will likely have an unfavorable effect on our ability to execute on our business plan and have an adverse effect on our business, results of operations and future prospects.
30
The following table summarizes our cash flows (in thousands):
Three Months Ended March 31, | |||||||
2019 | 2018 | ||||||
Cash used in operating activities | $ | (28,366 | ) | $ | (32,902 | ) | |
Cash provided by (used in) investing activities | (17,545 | ) | 19,947 | ||||
Cash provided by financing activities | 186,120 | 19,345 | |||||
Net increase in cash, cash equivalents and restricted cash | $ | 140,209 | $ | 6,390 | |||
Cash flows from operating activities
For the three months ended March 31, 2019, cash used in operating activities of $28.4 million principally resulted from our net loss of $37.7 million, partially offset by non-cash charges of $5.2 million for stock-based compensation, and $3.3 million for depreciation and amortization. The net effect on cash of changes in net operating assets was an increase of cash of $0.5 million.
For the three months ended March 31, 2018, cash used in operating activities of $32.9 million principally resulted from our net loss of $36.1 million, partially offset by non-cash charges of $4.4 million for stock-based compensation, $3.4 million for depreciation and amortization and $1.1 million for non-cash remeasurements of liabilities associated with business combinations. The net effect on cash of changes in net operating assets was a use of cash of $5.7 million.
Cash flows from investing activities
For the three months ended March 31, 2019, cash used in investing activities of $17.5 million was due to net purchases of marketable securities of $14.8 million and cash used for purchases of property and equipment of $2.8 million.
For the three months ended March 31, 2018, cash provided by investing activities of $19.9 million was due to proceeds from maturities and sales of marketable securities of $22.0 million offset by cash used for purchases of property and equipment of $1.9 million, and the purchase of a convertible note in the amount of $0.2 million.
Cash flows from financing activities
For the three months ended March 31, 2019, cash provided by financing activities of $186.1 million consisted of net proceeds from the public offering of common stock of $184.5 million and cash received from issuances of common stock totaling $2.1 million, including stock option exercises of $2.0 million and $0.1 million received from exercises of warrants. These cash inflows were partially offset by finance lease payments of $0.5 million.
For the three months ended March 31, 2018, cash provided by financing activities of $19.3 million consisted of net proceeds of $19.8 million from the second term loan under our then-outstanding loan agreement and cash received from issuances of common stock totaling $0.2 million. These cash inflows were partially offset by capital lease obligations payments of $0.7 million.
Contractual obligations
The following table summarizes our contractual obligations, including interest, as of March 31, 2019 (in thousands):
Contractual obligations: | Remainder of 2019 | 2020 and 2021 | 2022 and 2023 | 2024 and beyond | Total | |||||||||||||||
Operating leases | $ | 7,391 | $ | 19,354 | $ | 18,562 | $ | 25,716 | $ | 71,023 | ||||||||||
Finance leases | 1,560 | 1,415 | — | — | 2,975 | |||||||||||||||
Debt | 5,013 | 16,576 | 16,558 | 89,948 | 128,095 | |||||||||||||||
Purchase commitments | 1,795 | 3,830 | — | — | 5,625 | |||||||||||||||
Total | $ | 15,759 | $ | 41,175 | $ | 35,120 | $ | 115,664 | $ | 207,718 | ||||||||||
See Note 8, "Commitments and contingencies" in the Notes to Condensed Consolidated Financial Statements for additional details regarding our leases, debt and purchase commitments.
31
Off-balance sheet arrangements
We have not entered into any off-balance sheet arrangements.
Recent accounting pronouncements
See “Recent accounting pronouncements” in Note 2, “Summary of significant accounting policies” in the Notes to Condensed Consolidated Financial Statements included elsewhere in this report for a discussion of recently adopted accounting pronouncements and accounting pronouncements not yet adopted, and their expected effect on our financial position and results of operations.
ITEM 3. Quantitative and Qualitative Disclosures About Market Risk.
We are exposed to market risks in the ordinary course of our business. These risks primarily relate to interest rates. We had loan obligations under our 2018 Note Purchase Agreement of $74.8 million at March 31, 2019. This loan is subject to a fixed interest rate, plus beginning on January 1, 2020 and continuing until the maturity date, quarterly payments of 0.5% of our annual net revenues subject to a maximum annual amount of such payments of $1.6 million which will be recognized as interest expense. We had finance lease obligations of $2.8 million as of March 31, 2019, which result from various finance lease agreements to obtain laboratory equipment. Our finance lease obligations carry fixed rates of interest. Our cash, cash equivalents, restricted cash and marketable securities totaled $287.1 million at March 31, 2019, and consisted of bank deposits, commercial paper, and money market funds. Such interest-bearing instruments carry a degree of risk; however, because our investments are primarily short-term in duration, we have not been exposed to, nor do we anticipate being exposed to, material risks due to changes in interest rates. At March 31, 2019, a hypothetical 1% (100 basis points) increase or decrease in interest rates would not have resulted in a material change in the fair value of our cash equivalents and portfolio of marketable securities. Fluctuations in the value of our cash equivalents and portfolio of marketable securities caused by a change in interest rates (gains or losses on the carrying value) are recorded in other comprehensive gain (loss) and are realized only if we sell the underlying securities prior to maturity or declines in fair value are determined to be other-than-temporary.
ITEM 4. Controls and Procedures.
(a) Evaluation of disclosure controls and procedures
We maintain “disclosure controls and procedures,” as such term is defined in Rule 13a-15(e) under the Securities Exchange Act of 1934, or Exchange Act, that are designed to ensure that information required to be disclosed by us in reports that we file or submit under the Exchange Act is recorded, processed, summarized and reported within the time periods specified in Securities and Exchange Commission rules and forms, and that such information is accumulated and communicated to our management, including our principal executive officer and principal financial officer, as appropriate, to allow timely decisions regarding required disclosure. In designing and evaluating our disclosure controls and procedures, management recognized that disclosure controls and procedures, no matter how well conceived and operated, can provide only reasonable, not absolute, assurance that the objectives of the disclosure controls and procedures are met. Our disclosure controls and procedures have been designed to meet reasonable assurance standards. Additionally, in designing disclosure controls and procedures, our management necessarily was required to apply its judgment in evaluating the cost-benefit relationship of possible disclosure controls and procedures. The design of any disclosure controls and procedures also is based in part upon certain assumptions about the likelihood of future events, and there can be no assurance that any design will succeed in achieving its stated goals under all potential future conditions.
Based on their evaluation as of the end of the period covered by this Quarterly Report on Form 10-Q, our Chief Executive Officer (our principal executive officer) and Chief Financial Officer (our principal financial officer) have concluded that, as of such date, our disclosure controls and procedures were effective at the reasonable assurance level.
(b) Changes in internal control over financial reporting
During the quarterly period covered by this Quarterly Report on Form 10-Q, there were no changes in our internal control over financial reporting that have materially affected, or are reasonably likely to materially affect, our internal control over financial reporting.
32
PART II — Other Information
ITEM 1. Legal Proceedings.
We are not a party to any material legal proceedings on the date of this report. We may from time to time become involved in legal proceedings arising in the ordinary course of business, and the resolution of any such claims could be material.
ITEM 1A. Risk Factors.
Risks related to our business and strategy
We expect to continue incurring significant losses, and we may not successfully execute our plan to achieve or sustain profitability.
We have incurred substantial losses since our inception. For the three months ended March 31, 2019, our net loss was $37.7 million. For the years ended December 31, 2018, 2017 and 2016, our net losses were $129.4 million, $123.4 million and $100.3 million, respectively. At March 31, 2019, our accumulated deficit was $554.4 million. While our revenue has increased over time, we expect to continue to incur significant losses. In addition, these losses may increase as we focus on scaling our business and operations and expanding our testing capabilities, which may increase our operating expenses. In addition, as a result of the integration of acquired businesses, we may be subject to unforeseen or additional expenditures, costs or liabilities. Our prior losses and expected future losses have had and will continue to have an adverse effect on our stockholders’ equity, working capital and stock price. Our failure to achieve and sustain profitability in the future would negatively affect our business, financial condition, results of operations and cash flows, and could cause the market price of our common stock to decline.
We began operations in January 2010 and commercially launched our initial assay in late November 2013; accordingly, we have a relatively limited operating history upon which you can evaluate our business and prospects. Our limited commercial history makes it difficult to evaluate our current business and makes predictions about our future results, prospects or viability subject to significant uncertainty. Our prospects must be considered in light of the risks and difficulties frequently encountered by companies in their early stage of development, particularly companies in new and rapidly evolving markets such as ours. These risks include an evolving and unpredictable business model and the management of growth. To address these risks, we must, among other things, increase our customer base; implement and successfully execute our business and marketing strategy; identify, acquire and successfully integrate companies, assets or technologies in areas that are complementary to our business strategy; successfully enter into other strategic collaborations or relationships; obtain access to capital on acceptable terms and effectively utilize that capital; identify, attract, hire, retain, motivate and successfully integrate additional employees; continue to expand, automate and upgrade our laboratory, technology and data systems; obtain, maintain and expand coverage and reimbursement by healthcare payers; provide rapid test turnaround times with accurate results at low prices; provide superior customer service; and respond to competitive developments. We cannot assure you that we will be successful in addressing these risks, and the failure to do so could have a material adverse effect on our business, prospects, financial condition and results of operations.
We have acquired and may continue to acquire businesses or assets, form joint ventures or make investments in other companies or technologies that could harm our operating results, dilute our stockholders’ ownership, or cause us to incur debt or significant expense.
As part of our business strategy, we have pursued and may continue to pursue acquisitions of complementary businesses or assets, as well as technology licensing arrangements. We also may pursue strategic alliances that leverage our core technology and industry experience to expand our offerings or distribution, or make investments in other companies. As an organization, we have limited experience with respect to acquisitions as well as the formation of strategic alliances and joint ventures.
In 2017, we established a leading position in family health genetic information services through the strategic acquisition of reproductive health testing capabilities, which included our acquisition of Good Start Genetics, Inc., or Good Start, a molecular diagnostics company focused on preimplantation and carrier screening for inherited disorders, and CombiMatrix Corporation, a company specializing in prenatal diagnosis, miscarriage analysis and pediatric developmental disorders. In 2017 we also acquired AltaVoice, formerly PatientCrossroads, a patient-centered data company with a global platform for collecting, curating, coordinating and delivering safeguarded data from patients and clinicians, and Ommdom, Inc. and its product, CancerGene Connect, an end-to-end platform for collecting and managing genetic family histories to deliver personalized genetic risk information.
33
With respect to our acquired businesses and any acquisitions we may make in the future, we may not be able to integrate these acquisitions successfully into our existing business, and we could assume unknown or contingent liabilities. Any acquisitions by us also could result in significant write-offs or the incurrence of debt and contingent liabilities, any of which could harm our operating results. Furthermore, the loss of customers, payers, partners or suppliers following the completion of any acquisitions by us could harm our business. Changes in services, sources of revenue, and branding or rebranding initiatives may involve substantial costs and may not be favorably received by customers, resulting in an adverse impact on our financial results, financial condition and stock price. Integration of an acquired company or business also may require management’s time and resources that otherwise would be available for ongoing development of our existing business. We may also need to divert cash from other uses in order to fund these integration activities. Ultimately, we may not realize the anticipated benefits of any acquisition, technology license, strategic alliance, joint venture or investment, or these benefits may take longer to realize than we expected.
To finance any acquisitions or investments, we may raise additional funds. If we raise funds by issuing equity securities, dilution to our stockholders could result. Any equity securities issued also may provide for rights, preferences or privileges senior to those of holders of our common stock. If we raise funds by issuing debt securities, these debt securities would have rights, preferences and privileges senior to those of holders of our common stock. The terms of debt securities issued or borrowings could impose significant restrictions on our operations. If we raise funds through collaborations and licensing arrangements, we might be required to relinquish significant rights to our technologies or products, or grant licenses on terms that are not favorable to us. If the price of our common stock is low or volatile, we may not be able to acquire other companies for stock. In addition, our stockholders may experience substantial dilution as a result of additional securities we may issue for acquisitions. Open market sales of substantial amounts of our common stock issued to stockholders of companies we acquire could also depress our share price. Alternatively, we may raise additional funds for our acquisition activities through public or private financings. Additional funds may not be available on terms that are favorable to us, or at all. In addition, our 2018 Note Purchase Agreement limits our ability to merge with or acquire other entities, incur debt, incur liens, pay dividends or other distributions to holders of our capital stock and make investments, in each case subject to certain exceptions.
If third-party payers, including managed care organizations, private health insurers and government health plans do not provide adequate reimbursement for our tests or we are unable to comply with their requirements for reimbursement, our commercial success could be negatively affected.
Our ability to increase the number of billable tests and our revenue will depend on our success achieving reimbursement for our tests from third-party payers. Reimbursement by a payer may depend on a number of factors, including a payer’s determination that a test is appropriate, medically necessary, cost-effective and has received prior authorization.
Since each payer makes its own decision as to whether to establish a policy or enter into a contract to cover our tests, as well as the amount it will reimburse for a test, seeking these approvals is a time-consuming and costly process. In addition, the determination by a payer to cover and the amount it will reimburse for our tests will likely be made on an indication by indication basis. To date, we have obtained policy-level reimbursement approval or contractual reimbursement for some indications for our tests from most of the large commercial third-party payers in the United States, and the Centers for Medicare and Medicaid Services, or CMS, provides reimbursement for our multi-gene tests for hereditary breast cancer-related disorders as well as colon cancer. We believe that establishing adequate reimbursement from Medicare is an important factor in gaining adoption from healthcare providers. Our claims for reimbursement from third-party payers may be denied upon submission, and we must appeal the claims. The appeals process is time consuming and expensive, and may not result in payment. In cases where there is not a contracted rate for reimbursement, there is typically a greater coinsurance or copayment requirement from the patient, which may result in further delay or decreased likelihood of collection.
In cases where we have established reimbursement rates with third-party payers, we face additional challenges in complying with their procedural requirements for reimbursement. These requirements often vary from payer to payer, and we have needed additional time and resources to comply with them. We have also experienced, and may continue to experience, delays in or denials of coverage if we do not adequately comply with these requirements. Our third-party payers have also requested, and in the future may request, audits of the amounts paid to us. We have been required to repay certain amounts to payers as a result of such audits, and we could be adversely affected if we are required to repay other payers for alleged overpayments due to lack of compliance with their reimbursement policies. In addition, we have experienced, and may continue to experience, delays in reimbursement when we transition to being an in-network provider with a payer.
34
We expect to continue to focus our resources on increasing adoption of, and expanding coverage and reimbursement for, our current tests and any future tests we may develop. If we fail to expand and maintain broad adoption of, and coverage and reimbursement for, our tests, our ability to generate revenue could be harmed and our future prospects and our business could suffer.
Our inability to raise additional capital on acceptable terms in the future may limit our ability to develop and commercialize new tests and expand our operations.
We expect capital expenditures and operating expenses to increase over the next several years as we expand our infrastructure, commercial operations, research and development activities and pursue acquisitions. We believe our existing cash and cash equivalents as of March 31, 2019, revenue from sales of our tests and available debt under our 2018 Note Purchase Agreement will be sufficient to meet our anticipated cash requirements for our currently-planned operations for the 12-month period following the filing date of this report. We may need additional funding to finance operations prior to achieving profitability, or should we make additional acquisitions. We may seek to raise additional capital through equity offerings, debt financings, collaborations or licensing arrangements. Additional funding may not be available to us on acceptable terms, or at all. If we raise funds by issuing equity securities, dilution to our stockholders would result. Any equity securities issued also may provide for rights, preferences or privileges senior to those of holders of our common stock. The terms of debt securities issued or borrowings, if available, could impose significant restrictions on our operations. Our obligations under our 2018 Note Purchase Agreement are subject to covenants, including quarterly covenants to achieve certain revenue levels as well as additional covenants, including limits on our ability to dispose of assets, undergo a change in control, merge with or acquire other entities, incur debt, incur liens, pay dividends or other distributions to holders of our capital stock, repurchase stock and make investments, in each case subject to certain exceptions. Our obligations under our 2018 Note Purchase Agreement are secured by a security interest on substantially all of our and certain of our subsidiaries' assets.
The incurrence of additional indebtedness or the issuance of certain equity securities could result in increased fixed payment obligations and could also result in restrictive covenants, such as limitations on our ability to incur additional debt or issue additional equity, limitations on our ability to acquire or license intellectual property rights, and other operating restrictions that could adversely affect our ability to conduct our business. In addition, the issuance of additional equity securities by us, or the possibility of such issuance, may cause the market price of our common stock to decline. In the event that we enter into collaborations or licensing arrangements to raise capital, we may be required to accept unfavorable terms. These agreements may require that we relinquish or license to a third party on unfavorable terms our rights to tests we otherwise would seek to develop or commercialize ourselves, or reserve certain opportunities for future potential arrangements when we might be able to achieve more favorable terms. If we are not able to secure additional funding when needed, we may have to delay, reduce the scope of or eliminate one or more research and development programs, selling and marketing initiatives, or potential acquisitions. In addition, we may have to work with a partner on one or more aspects of our tests or market development programs, which could lower the economic value of those tests or programs to our company.
We face intense competition, which is likely to intensify further as existing competitors devote additional resources to, and new participants enter, the market. If we cannot compete successfully, we may be unable to increase our revenue or achieve and sustain profitability.
With the development of next generation sequencing, the clinical genetics market is becoming increasingly competitive, and we expect this competition to intensify in the future. We face competition from a variety of sources, including:
• | dozens of relatively specialized competitors focused on inherited clinical genetics and gene sequencing, such as Ambry Genetics, Inc., a subsidiary of Konica Minolta Inc., Athena Diagnostics, a subsidiary of Quest Diagnostics Incorporated, Baylor Genetics, Blueprint Genetics, Inc., Centogene AG, Color Genomics, Inc., Connective Tissue Gene Test LLC, a subsidiary of Health Network Laboratories, L.P., Cooper Surgical, Inc., Eurofins Scientific, GeneDx, a subsidiary of OPKO Health, Inc., MNG Laboratories, LLC, Myriad Genetics, Inc., Natera, Inc., Perkin Elmer, Inc., PreventionGenetics, LLC, Progenity, Inc. and Sema4 Genomics; |
• | a few large, established general testing companies with large market share and significant channel power, such as Laboratory Corporation of America Holdings and Quest Diagnostics Incorporated; |
35
• | a large number of clinical laboratories in an academic or healthcare provider setting that perform clinical genetic testing on behalf of their affiliated institutions and often sell and market more broadly; and |
• | a large number of new entrants into the market for genetic information ranging from informatics and analysis pipeline developers to focused, integrated providers of genetic tools and services for health and wellness including Illumina, Inc., which is also one of our suppliers. |
Hospitals, academic medical centers and eventually physician practice groups and individual clinicians may also seek to perform at their own facilities the type of genetic testing we would otherwise perform for them. In this regard, continued development of equipment, reagents, and other materials as well as databases and interpretation services may enable broader direct participation in genetic testing and analysis.
Participants in closely related markets such as clinical trial or companion diagnostic testing could converge on offerings that are competitive with the type of tests we perform. Instances where potential competitors are aligned with key suppliers or are themselves suppliers could provide such potential competitors with significant advantages.
In addition, the biotechnology and genetic testing fields are intensely competitive both in terms of service and price, and continue to undergo significant consolidation, permitting larger clinical laboratory service providers to increase cost efficiencies and service levels, resulting in more intense competition.
We believe the principal competitive factors in our market are:
• | breadth and depth of content; |
• | quality; |
• | reliability; |
• | accessibility of results; |
• | turnaround time of testing results; |
• | price and quality of tests; |
• | coverage and reimbursement arrangements with third-party payers; |
• | convenience of testing; |
• | brand recognition of test provider; |
• | additional value-added services and informatics tools; |
• | client service; and |
• | quality of website content. |
Many of our competitors and potential competitors have longer operating histories, larger customer bases, greater brand recognition and market penetration, higher margins on their tests, substantially greater financial, technological and research and development resources, selling and marketing capabilities, lobbying efforts, and more experience dealing with third-party payers. As a result, they may be able to respond more quickly to changes in customer requirements, devote greater resources to the development, promotion and sale of their tests than we do, sell their tests at prices designed to win significant levels of market share, or obtain reimbursement from more third-party payers and at higher prices than we do. We may not be able to compete effectively against these organizations. Increased competition and cost-saving initiatives on the part of governmental entities and other third-party payers are likely to result in pricing pressures, which could harm our sales, profitability or ability to gain market share. In addition, competitors may be acquired by, receive investments from or enter into other commercial relationships with larger, well-established and well-financed companies as use of next generation sequencing for clinical diagnosis and preventative care increases. Certain of our competitors may be able to secure key inputs from vendors on more favorable terms, devote greater resources to marketing and promotional campaigns, adopt more aggressive pricing policies and devote substantially more resources to website and systems development than we can. In addition, companies or governments that control access to genetic testing through umbrella contracts or regional preferences could promote our competitors or prevent us from performing certain services. In addition, some of our competitors have obtained approval or clearance for certain of their tests from the U.S. Food and Drug Administration, or FDA. If payers decide to reimburse only for tests that are FDA-approved or FDA-cleared, or if they are more likely to reimburse for such tests, we may not be able to compete effectively unless we obtain similar approval or clearance for our tests. If we are unable to compete successfully against current and future competitors,
36
we may be unable to increase market acceptance and sales of our tests, which could prevent us from increasing our revenue or achieving profitability and could cause our stock price to decline.
We may not be able to manage our future growth effectively, which could make it difficult to execute our business strategy.
Our expected future growth could create a strain on our organizational, administrative and operational infrastructure, including laboratory operations, quality control, customer service, marketing and sales, and management. We may not be able to maintain the quality of or expected turnaround times for our tests, or satisfy customer demand as it grows. We will likely need to continue expanding our sales force to facilitate our growth, and we may have difficulties locating, recruiting, training and retaining sales personnel. Our ability to manage our growth properly will require us to continue to improve our operational, financial and management controls, as well as our reporting systems and procedures. As we grow, any failure of our controls or interruption of our production facilities or systems will have a larger impact on our business and financial operations. We plan to implement new enterprise software systems in a number of areas affecting a broad range of business processes and functional areas. The time and resources required to implement these new systems is uncertain, and failure to complete these activities in a timely and efficient manner could adversely affect our operations. Future growth in our business could also make it difficult for us to maintain our corporate culture. If we are unable to manage our growth effectively, it may be difficult for us to execute our business strategy and our business could be harmed.
Security breaches, loss of data and other disruptions could compromise sensitive information related to our business or prevent us from accessing critical information and expose us to liability, which could adversely affect our business and our reputation.
In the ordinary course of our business, we collect and store sensitive data, including protected health information, or PHI, personally identifiable information, credit card information, intellectual property and proprietary business information owned or controlled by ourselves or our customers, payers and other parties. We manage and maintain our applications and data utilizing a combination of on-site systems, managed data center systems and cloud-based data center systems. We also communicate sensitive patient data through our Invitae Family History Tool, Patient Insights Network, or PIN, and CancerGene Connect platform. In addition to storing and transmitting sensitive personal information that is subject to myriad legal protections, these applications and data encompass a wide variety of business-critical information including research and development information, commercial information, and business and financial information. We face a number of risks relative to protecting this critical information, including loss of access risk, inappropriate disclosure, inappropriate modification, and the risk of our being unable to adequately monitor and modify our controls over our critical information. Any technical problems that may arise in connection with our data and systems, including those that are hosted by third-party providers, could result in interruptions in our business and operations. These types of problems may be caused by a variety of factors, including infrastructure changes, human or software errors, viruses, security attacks, fraud, spikes in customer usage and denial of service issues. From time to time, large third-party web hosting providers have experienced outages or other problems that have resulted in their systems being offline and inaccessible. Such outages could materially impact our business and operations.
The secure processing, storage, maintenance and transmission of this critical information are vital to our operations and business strategy, and we devote significant resources to protecting such information. Although we take what we believe to be reasonable and appropriate measures to protect sensitive information from unauthorized access or disclosure, our information technology and infrastructure may be vulnerable to attacks by hackers or viruses or breached due to employee error, malfeasance or other disruptions. Any such breach or interruption could compromise our networks and the information stored there could be accessed by unauthorized parties, altered, publicly disclosed, lost or stolen. Any such access, disclosure or other loss of information could result in legal claims or proceedings, liability under federal or state laws that protect the privacy of personal information, such as but not limited to the Health Insurance Portability and Accountability Act of 1996, or HIPAA, the Health Information Technology for Economic and Clinical Heath Act, or HITECH, state data security and data breach notification laws, and related regulatory penalties. Although we have implemented security measures and a formal, dedicated enterprise security program to prevent unauthorized access to patient data, our Invitae Family History Tool, PIN and CancerGene Connect platform are currently accessible through our online portal and/or through our mobile applications, and there is no guarantee we can protect our online portal or our mobile applications from breach. Unauthorized access, loss or dissemination could also disrupt our operations (including our ability to conduct our analyses, provide test results, bill payers or patients, process claims and appeals, provide customer assistance, conduct research and development activities, collect, process and prepare company financial information, provide information about our tests and other patient and physician education and outreach efforts through our website, and
37
manage the administrative aspects of our business) and damage our reputation, any of which could adversely affect our business.
In addition to security risks, we also face privacy risks. While we have policies that govern our privacy practices and procedures that aim to keep our practices consistent with such policies, such procedures are not invulnerable to human error. Should we inadvertently break the privacy promises we make to patients or consumers, we could receive a complaint from an affected individual or interested privacy regulator, such as the FTC or a state Attorney General. This risk is heightened given the sensitivity of the data we collect.
Penalties for failure to comply with a requirement of HIPAA and HITECH vary significantly, and include civil monetary penalties of up to $1.5 million per calendar year for each provision of HIPAA that is violated. A person who knowingly obtains or discloses individually identifiable health information in violation of HIPAA may face a criminal penalty of up to $50,000 and up to one-year imprisonment. The criminal penalties increase if the wrongful conduct involves false pretenses or the intent to sell, transfer or use identifiable health information for commercial advantage, personal gain or malicious harm. Penalties for unfair or deceptive acts or practices under the FTC Act or state Unfair and Deceptive Acts and Practices, or UDAP, statutes may also vary significantly.
There has been unprecedented activity in the development of data protection regulation around the world. As a result, the interpretation and application of consumer, health-related and data protection laws in the United States, Europe and elsewhere are often uncertain, contradictory and in flux. The European Union’s General Data Protection Regulation, or GDPR, took effect in May 2018. The GDPR applies to any business, regardless of its location, that provides goods or services to residents in the European Union. The GDPR imposes strict requirements on controllers and processors of personal data, including special protections for “sensitive information” which includes health and genetic information of data subjects residing in the European Union. The GDPR also grants individuals various rights in relation to their personal data including the right to access, rectification, objection to processing and deletion, and provides an individual with an express right to seek legal remedies if the individual believes his or her rights have been violated. Failure to comply with the requirements of the GDPR and the related national data protection laws of the member states of the European Union, which may deviate slightly from the GDPR, may result in significant fines.
Additionally, the implementation of GDPR has led other jurisdictions to either amend or propose legislation to amend their existing data privacy and cybersecurity laws to resemble the requirements of GDPR. For example, on June 28, 2018, California adopted the California Consumer Privacy Act of 2018, or CCPA and amended the law in September 2018 to exempt all PHI collected by certain parties subject to HIPAA. The effective date of the CCPA is January 1, 2020; however, legislators have stated that they intend to propose amendments to the CCPA before it goes into effect. The CCPA gives California residents expanded rights to access and delete their personal information, opt out of certain personal information sharing, and receive detailed information about how their personal information is used. The CCPA provides for civil penalties for violations, as well as a private right of action for data breaches that is expected to increase data breach litigation.
It is possible the GDPR, CCPA and other data protection laws may be interpreted and applied in a manner that is inconsistent with our practices. If so, this could result in government-imposed fines or orders requiring that we change our practices, which could adversely affect our business. In addition, these privacy regulations may differ from country to country and state to state, and may vary based on whether testing is performed in the United States or in the local country. Complying with these various laws and regulations could cause us to incur substantial costs or require us to change our business practices and compliance procedures in a manner adverse to our business. We can provide no assurance that we are or will remain in compliance with diverse privacy and security requirements in all of the jurisdictions in which we do business. Failure to comply with privacy and security requirements could result in civil or criminal penalties, which could have a material adverse effect on our business.
We rely on highly skilled personnel in a broad array of disciplines and, if we are unable to hire, retain or motivate these individuals, or maintain our corporate culture, we may not be able to maintain the quality of our services or grow effectively.
Our performance, including our research and development programs and laboratory operations, largely depend on our continuing ability to identify, hire, develop, motivate and retain highly skilled personnel for all areas of our organization, including software developers, geneticists, biostatisticians, certified laboratory scientists and other scientific and technical personnel to process and interpret our genetic tests. In addition, we expect the need to continue to expand our sales force with qualified and experienced personnel. Competition in our industry for qualified employees is intense, and we may not be able to attract or retain qualified personnel in the future due to the competition for qualified personnel among life science and technology businesses as well as universities and public and private research institutions, particularly in the San Francisco Bay Area. In addition, our compensation
38
arrangements, such as our equity award programs, may not always be successful in attracting new employees and retaining and motivating our existing employees. If we are not able to attract and retain the necessary personnel to accomplish our business objectives, we may experience constraints that could adversely affect our ability to scale our business, support our research and development efforts and our clinical laboratory. We believe that our corporate culture fosters innovation, creativity and teamwork. However, as our organization grows, we may find it increasingly difficult to maintain the beneficial aspects of our corporate culture. This could negatively impact our ability to retain and attract employees and our future success.
We need to scale our infrastructure in advance of demand for our tests, and our failure to generate sufficient demand for our tests would have a negative impact on our business and our ability to attain profitability.
Our success depends in large part on our ability to extend our market position, to provide customers with high quality test reports quickly and at a lower price than our competitors, and to achieve sufficient test volume to realize economies of scale. In order to execute our business model, we intend to continue to invest heavily in order to significantly scale our infrastructure, including our testing capacity and information systems, expand our commercial operations, customer service, billing and systems processes and enhance our internal quality assurance program. We expect that much of this growth will be in advance of demand for our tests. Our current and future expense levels are to a large extent fixed and are largely based on our investment plans and our estimates of future revenue. Because the timing and amount of revenue from our tests is difficult to forecast, when revenue does not meet our expectations, we may not be able to adjust our spending promptly or reduce our spending to levels commensurate with our revenue. Even if we are able to successfully scale our infrastructure and operations, we cannot assure you that demand for our tests will increase at levels consistent with the growth of our infrastructure. If we fail to generate demand commensurate with this growth or if we fail to scale our infrastructure sufficiently in advance of demand to successfully meet such demand, our business, prospects, financial condition and results of operations could be adversely affected.
If we are not able to continue to generate substantial demand of our tests, our commercial success will be negatively affected.
Our business model assumes that we will be able to generate significant test volume, and we may not succeed in continuing to drive clinical adoption of our test to achieve sufficient volumes. Inasmuch as detailed genetic data from broad-based testing panels such as our tests have only recently become available at relatively affordable prices, the continued pace and degree of clinical acceptance of the utility of such testing is uncertain. Specifically, it is uncertain how much genetic data will be accepted as necessary or useful, as well as how detailed that data should be, particularly since medical practitioners may have become accustomed to genetic testing that is specific to one or a few genes. Given the substantial amount of additional information available from a broad-based testing panel such as ours, there may be distrust as to the reliability of such information when compared with more limited and focused genetic tests. To generate further demand for our tests, we will need to continue to make clinicians aware of the benefits of our tests, including the price, the breadth of our testing options, and the benefits of having additional genetic data available from which to make treatment decisions. Because broad-based testing panels are relatively new, it may be more difficult or take more time for us to expand clinical adoption of our assay beyond our current customer base. In addition, clinicians in other areas of medicine may not adopt genetic testing for hereditary disease as readily as it has been adopted in hereditary cancer and our efforts to sell our tests to clinicians outside of oncology may not be successful. A lack of or delay in clinical acceptance of broad-based panels such as our tests would negatively impact sales and market acceptance of our tests and limit our revenue growth and potential profitability. Genetic testing is expensive and many potential customers may be sensitive to pricing. In addition, potential customers may not adopt our tests if adequate reimbursement is not available, or if we are not able to maintain low prices relative to our competitors. Also, we plan to introduce patient-initiated testing in 2019, in which we will facilitate the ordering of our genetic tests through an online network of physicians. Since we have limited experience directly marketing to patients, we may not be successful in increasing demand for our tests through this new channel. Patient-initiated testing may also be perceived negatively by our existing customer base of clinicians and genetic counselors, in which case our core business could be harmed.
If we are not able to generate demand for our tests at sufficient volume, or if it takes significantly more time to generate this demand than we anticipate, our business, prospects, financial condition and results of operations could be materially harmed.
39
Our success will depend on our ability to use rapidly changing genetic data to interpret test results accurately and consistently, and our failure to do so would have an adverse effect on our operating results and business, harm our reputation and could result in substantial liabilities that exceed our resources.
Our success depends on our ability to provide reliable, high-quality tests that incorporate rapidly evolving information about the role of genes and gene variants in disease and clinically relevant outcomes associated with those variants. Errors, such as failure to detect genomic variants with high accuracy, or mistakes, such as failure to identify, or incompletely or incorrectly identifying, gene variants or their significance, could have a significant adverse impact on our business.
Hundreds of genes can be implicated in some disorders, and overlapping networks of genes and symptoms can be implicated in multiple conditions. As a result, a substantial amount of judgment is required in order to interpret testing results for an individual patient and to develop an appropriate patient report. We classify variants in accordance with published guidelines as benign, likely benign, variants of uncertain significance, likely pathogenic or pathogenic, and these guidelines are subject to change. In addition, it is our practice to offer support to clinicians and geneticists ordering our tests regarding which genes or panels to order as well as interpretation of genetic variants. We also rely on clinicians to interpret what we report and to incorporate specific information about an individual patient into the physician’s treatment decision.
The marketing, sale and use of our genetic tests could subject us to liability for errors in, misunderstandings of, or inappropriate reliance on, information we provide to clinicians, geneticists or patients, and lead to claims against us if someone were to allege that a test failed to perform as it was designed, if we failed to correctly interpret the test results, if we failed to update the test results due to a reclassification of the variants according to new published guidelines, or if the ordering physician were to misinterpret test results or improperly rely on them when making a clinical decision. In addition, our entry into the reproductive health testing market exposes us to increased liability. A product liability or professional liability claim could result in substantial damages and be costly and time-consuming for us to defend. Although we maintain liability insurance, including for errors and omissions, we cannot assure you that such insurance would fully protect us from the financial impact of defending against these types of claims or any judgments, fines or settlement costs arising out of any such claims. Any liability claim, including an errors and omissions liability claim, brought against us, with or without merit, could increase our insurance rates or prevent us from securing insurance coverage in the future. Additionally, any liability lawsuit could cause injury to our reputation or cause us to suspend sales of our tests. The occurrence of any of these events could have an adverse effect on our reputation and results of operations.
Our industry is subject to rapidly changing technology and new and increasing amounts of scientific data related to genes and genetic variants and their role in disease. Our failure to develop tests to keep pace with these changes could make us obsolete.
In recent years, there have been numerous advances in methods used to analyze very large amounts of genomic information and the role of genetics and gene variants in disease and treatment therapies. Our industry has and will continue to be characterized by rapid technological change, increasingly larger amounts of data, frequent new testing service introductions and evolving industry standards, all of which could make our tests obsolete. Our future success will also depend on our ability to keep pace with the evolving needs of our customers on a timely and cost-effective basis and to pursue new market opportunities that develop as a result of technological and scientific advances. Our tests could become obsolete and our business adversely affected unless we continually update our offerings to reflect new scientific knowledge about genes and genetic variations and their role in diseases and treatment therapies.
Our success will depend in part on our ability to generate sales using our internal sales team and through alternative marketing strategies.
We may not be able to market or sell our current tests and any future tests we may develop effectively enough to drive demand sufficient to support our planned growth. We currently sell our tests primarily through our internal sales force. Historically, our sales efforts have been focused primarily on hereditary cancer and more recently, on reproductive health. Our efforts to sell our tests to clinicians outside of oncology may not be successful, or may be difficult to do successfully without significant additional selling and marketing efforts and expense. We significantly increased the size of our sales force in 2017, 2018, and early 2019. Our future sales will also depend in large part on our ability to develop and substantially expand awareness of our company and our tests through alternative strategies including through education of key opinion leaders, through social media-related and online outreach, education and marketing efforts, and through focused channel partner strategies designed to drive demand for our tests. We also plan to increase our consumer advertising in connection with our introduction of patient-initiated testing in 2019, which could be costly. We have limited experience implementing these types of
40
marketing efforts. We may not be able to drive sufficient levels of revenue using these sales and marketing methods and strategies necessary to support our planned growth, and our failure to do so could limit our revenue and potential profitability.
Outside the United States we use a limited number of distributors to assist with sales, logistics, education and customer support. Sales practices utilized by our distributors that are locally acceptable may not comply with sales practices standards required under U.S. laws that apply to us, which could create additional compliance risk. If our sales and marketing efforts are not successful outside the United States, we may not achieve significant market acceptance for our tests outside the United States, which could adversely impact our business.
Impairment in the value of our goodwill or other intangible assets could have a material adverse effect on our operating results and financial condition.
We record goodwill and intangible assets at fair value upon the acquisition of a business. Goodwill represents the excess of amounts paid for acquiring businesses over the fair value of the net assets acquired. Goodwill and indefinite-lived intangible assets are evaluated for impairment annually, or more frequently if conditions warrant, by comparing the carrying value of a reporting unit to its estimated fair value. Intangible assets with definite lives are reviewed for impairment when events or circumstances indicate that their carrying value may not be recoverable. Declines in operating results, divestitures, sustained market declines and other factors that impact the fair value of a reporting unit could result in an impairment of goodwill or intangible assets and, in turn, a charge to net income. Any such charges could have a material adverse effect on our results of operations or financial condition.
We rely on a limited number of suppliers or, in some cases, sole suppliers, for some of our laboratory instruments, materials and services, and we may not be able to find replacements or immediately transition to alternative suppliers.
We rely on a limited number of suppliers, or, in some cases, sole suppliers, including Illumina, Inc., Integrated DNA Technologies Incorporated, Qiagen N.V., Roche Holdings Ltd. and Twist Bioscience Corporation for certain laboratory substances used in the chemical reactions incorporated into our processes, which we refer to as reagents, as well as sequencers and other equipment and materials which we use in our laboratory operations. We do not have short- or long-term agreements with most of our suppliers, and our suppliers could cease supplying these materials and equipment at any time, or fail to provide us with sufficient quantities of materials or materials that meet our specifications. Our laboratory operations could be interrupted if we encounter delays or difficulties in securing these reagents, sequencers or other equipment or materials, and if we cannot obtain an acceptable substitute. Any such interruption could significantly affect our business, financial condition, results of operations and reputation. We rely on Illumina as the sole supplier of next generation sequencers and associated reagents and as the sole provider of maintenance and repair services for these sequencers. Any disruption in Illumina’s operations could impact our supply chain and laboratory operations as well as our ability to conduct our tests, and it could take a substantial amount of time to integrate replacement equipment into our laboratory operations. We also currently rely on a third party to perform non-invasive prenatal screening, or NIPS, testing on our behalf. In the event of any disruption or termination of these services, it may be difficult to find a replacement NIPS offering, which could harm our business, financial condition, results of operation and reputation.
We believe that there are only a few other manufacturers that are currently capable of supplying and servicing the equipment necessary for our laboratory operations, including sequencers and various associated reagents. The use of equipment or materials provided by these replacement suppliers would require us to alter our laboratory operations. Transitioning to a new supplier would be time consuming and expensive, may result in interruptions in our laboratory operations, could affect the performance specifications of our laboratory operations or could require that we revalidate our tests. We cannot assure you that we will be able to secure alternative equipment, reagents and other materials, and bring such equipment, reagents and materials on line and revalidate them without experiencing interruptions in our workflow. In the case of an alternative supplier for Illumina, we cannot assure you that replacement sequencers and associated reagents will be available or will meet our quality control and performance requirements for our laboratory operations. If we encounter delays or difficulties in securing, reconfiguring or revalidating the equipment and reagents we require for our tests, our business, financial condition, results of operations and reputation could be adversely affected.
If our laboratories in California become inoperable due to disasters or for any other reason, we will be unable to perform our tests and our business will be harmed.
We perform all of our tests at our production facilities in San Francisco and Irvine, California. Our laboratories and the equipment we use to perform our tests would be costly to replace and could require substantial lead time to replace and qualify for use. Our laboratories may be harmed or rendered inoperable by natural or man-
41
made disasters, including earthquakes, flooding, fire and power outages, which may render it difficult or impossible for us to perform our tests for some period of time. This risk is especially high for us since we perform the substantial majority of our tests at our San Francisco laboratory, which is located in an active seismic region, and we do not have a redundant facility to perform the same tests in the event our San Francisco laboratory is inoperable. The inability to perform our tests or the backlog that could develop if our laboratories are inoperable for even a short period of time may result in the loss of customers or harm our reputation. Although we maintain insurance for damage to our property and the disruption of our business, this insurance may not be sufficient to cover all of our potential losses and may not continue to be available to us on acceptable terms, if at all.
The loss of any member or change in structure of our senior management team could adversely affect our business.
Our success depends in large part upon the skills, experience and performance of members of our executive management team and others in key leadership positions. The efforts of these persons will be critical to us as we continue to develop our technologies and test processes and focus on scaling our business. If we were to lose one or more key executives, we may experience difficulties in competing effectively, developing our technologies and implementing our business strategy. All of our executives and employees are at-will, which means that either we or the executive or employee may terminate their employment at any time. We do not carry key man insurance for any of our executives or employees. In addition, we do not have a long-term retention agreement in place with our president and chief executive officer.
Development of new tests is a complex process, and we may be unable to commercialize new tests on a timely basis, or at all.
We cannot assure you that we will be able to develop and commercialize new tests on a timely basis. Before we can commercialize any new tests, we will need to expend significant funds in order to:
• | conduct research and development; |
• | further develop and scale our laboratory processes; and |
• | further develop and scale our infrastructure to be able to analyze increasingly larger and more diverse amounts of data. |
Our testing service development process involves risk, and development efforts may fail for many reasons, including:
• | failure of any test to perform as expected; |
• | lack of validation or reference data; or |
• | failure to demonstrate utility of a test. |
As we develop tests, we will have to make significant investments in development, marketing and selling resources. In addition, competitors may develop and commercialize competing tests faster than we are able to do so.
We depend on our information technology systems, and any failure of these systems could harm our business.
We depend on information technology and telecommunications systems for significant elements of our operations, including our laboratory information management system, our bioinformatics analytical software systems, our database of information relating to genetic variations and their role in disease process and drug metabolism, our clinical report optimization systems, our customer-facing web-based software, our customer reporting, and our Invitae Family History Tool, PIN, and CancerGene Connect platform. We have installed, and expect to expand, a number of enterprise software systems that affect a broad range of business processes and functional areas, including for example, systems handling human resources, financial controls and reporting, customer relationship management, regulatory compliance and other infrastructure operations. In addition, we intend to extend the capabilities of both our preventative and detective security controls by augmenting the monitoring and alerting functions, the network design, and the automatic countermeasure operations of our technical systems. These information technology and telecommunications systems support a variety of functions, including laboratory operations, test validation, sample tracking, quality control, customer service support, billing and reimbursement, research and development activities, scientific and medical curation, and general administrative activities, including financial reporting.
42
Information technology and telecommunications systems are vulnerable to damage from a variety of sources, including telecommunications or network failures, malicious human acts and natural disasters. Moreover, despite network security and back-up measures, some of our servers are potentially vulnerable to physical or electronic break-ins, computer viruses and similar disruptive problems. Despite the precautionary measures we have taken to prevent unanticipated problems that could affect our information technology and telecommunications systems, failures or significant downtime of our information technology or telecommunications systems or those used by our third-party service providers could prevent us from conducting tests, preparing and providing reports to clinicians, billing payers, processing reimbursement appeals, handling physician or patient inquiries, conducting research and development activities, and managing the administrative and financial aspects of our business. Any disruption or loss of information technology or telecommunications systems on which critical aspects of our operations depend could have an adverse effect on our business and results of operations.
Any technical problems that may arise in connection with our data and systems, including those that are hosted by third-party providers, could result in interruptions in our business and operations. These types of problems may be caused by a variety of factors, including infrastructure changes, human or software errors, viruses, security attacks, fraud, spikes in customer usage and denial of service issues. From time to time, large third-party web hosting providers have experienced outages or other problems that have resulted in their systems being offline and inaccessible. Such outages could materially impact our business and operations.
Ethical, legal and social concerns related to the use of genetic information could reduce demand for our tests.
Genetic testing has raised ethical, legal and social issues regarding privacy and the appropriate uses of the resulting information. Governmental authorities could, for social or other purposes, limit or regulate the use of genetic information or genetic testing or prohibit testing for genetic predisposition to certain conditions, particularly for those that have no known cure. Similarly, these concerns may lead patients to refuse to use, or clinicians to be reluctant to order, genomic tests even if permissible. These and other ethical, legal and social concerns may limit market acceptance of our tests or reduce the potential markets for our tests, either of which could have an adverse effect on our business, financial condition or results of operations.
Our international business exposes us to business, regulatory, political, operational, financial and economic risks associated with doing business outside of the United States.
We currently have a limited number of distribution arrangements in several countries outside of the United States. Doing business internationally involves a number of risks, including:
• | multiple, conflicting and changing laws and regulations such as privacy regulations, tax laws, export and import restrictions, employment laws, regulatory requirements, and other governmental approvals, permits and licenses; |
• | failure by us or our distributors to obtain regulatory approvals for the use of our tests in various countries; |
• | complexities and difficulties in obtaining protection and enforcing our intellectual property; |
• | difficulties in staffing and managing foreign operations; |
• | complexities associated with managing multiple payer reimbursement regimes, government payers or patient self-pay systems; |
• | logistics and regulations associated with shipping samples, including infrastructure conditions and transportation delays; |
• | limits on our ability to penetrate international markets if we do not to conduct our tests locally; |
• | natural disasters, political and economic instability, including wars, terrorism and political unrest, outbreak of disease, boycotts, curtailment of trade and other business restrictions; and |
• | regulatory and compliance risks that relate to maintaining accurate information and control over activities that may fall within the purview of the U.S. Foreign Corrupt Practices Act, or FCPA, its books and records provisions, or its anti-bribery provisions. |
Any of these factors could significantly harm our international operations and, consequently, our revenue and results of operations.
In addition, applicable export or import laws and regulations such as prohibitions on the export of samples imposed by countries outside of the United States, or international privacy or data restrictions that are different or more stringent than those of the United States, may require that we build additional laboratories or engage in joint
43
ventures or other business partnerships in order to offer our tests internationally in the future. Any such restrictions would impair our ability to offer our tests in such countries and could have an adverse effect on our business, financial condition and results of operations.
Risks related to government regulation
If the FDA regulates our tests as medical devices, we could incur substantial costs and our business, financial condition and results of operations could be adversely affected.
We provide our tests as laboratory-developed tests, or LDTs. CMS and certain state agencies regulate the performance of LDTs (as authorized by the Clinical Laboratory Improvement Amendments of 1988, or CLIA, and state law, respectively).
Historically, the FDA has exercised enforcement discretion with respect to most LDTs and has not required laboratories that furnish LDTs to comply with the agency’s requirements for medical devices (e.g., establishment registration, device listing, quality systems regulations, premarket clearance or premarket approval, and post-market controls). In recent years, however, the FDA has stated it intends to end its policy of general enforcement discretion and regulate certain LDTs as medical devices. To this end, on October 3, 2014, the FDA issued two draft guidance documents, entitled “Framework for Regulatory Oversight of Laboratory Developed Tests (LDTs)” and “FDA Notification and Medical Device Reporting for Laboratory Developed Tests (LDTs),” respectively, that set forth a proposed risk-based regulatory framework that would apply varying levels of FDA oversight to LDTs. Subsequently, on January 13, 2017, the FDA published a “discussion paper” in which it outlined a substantially revised “possible approach” to the oversight of LDTs. In December 2018, a draft bill titled the “Verifying Accurate Leading-edge IVCT Development Act of 2018,” or VALID Act, was released for discussion. The draft bill proposes a risk-based approach to regulate LDTs and creates a new in vitro clinical test, or IVCT, category of regulated products, which includes LDTs, and a regulatory structure under the FDA. As proposed, the draft bill grandfathers many existing tests from the proposed premarket approval, quality systems, and labeling requirements, respectively, but would require such tests to comply with other regulatory requirements (e.g., registration and notification, adverse event reporting). We cannot predict if this draft bill will be enacted in its current (or any other) form and cannot quantify the effect of this draft bill on our business.
Legislative proposals addressing the FDA’s oversight of LDTs have been introduced in previous Congresses, and we expect that new legislative proposals will be introduced from time-to-time. The likelihood that Congress will pass such legislation and the extent to which such legislation may affect the FDA’s plans to regulate certain LDTs as medical devices is difficult to predict at this time.
If the FDA ultimately regulates certain LDTs (either as medical devices or as part of a new stand-alone regulatory category for IVCTs), whether via individualized enforcement action, or more generally, as outlined in final guidance or final regulation, or as instructed by Congress, our tests may be subject to certain additional regulatory requirements. Complying with the FDA’s requirements can be expensive, time-consuming and subject us to significant or unanticipated delays. Insofar as we may be required to obtain premarket clearance or approval to perform or continue performing an LDT, we cannot assure you that we will be able to obtain such authorization. Even if we obtain regulatory clearance or approval where required, such authorization may not be for the intended uses that we believe are commercially attractive or are critical to the commercial success of our tests. As a result, the application of the FDA’s requirements to our tests could materially and adversely affect our business, financial condition and results of operations.
Failure to comply with applicable FDA regulatory requirements may trigger a range of enforcement actions by the FDA including warning letters, civil monetary penalties, injunctions, criminal prosecution, recall or seizure, operating restrictions, partial suspension or total shutdown of operations, and denial of or challenges to applications for clearance or approval, as well as significant adverse publicity.
In addition, in November 2013, the FDA issued final guidance regarding the distribution of products labeled for research use only. Certain of the reagents and other products we use in our tests are labeled as research use only products. Certain of our suppliers may cease selling research use only products to us and any failure to obtain an acceptable substitute could significantly and adversely affect our business, financial condition and results of operations.
If we fail to comply with federal, state and foreign laboratory licensing requirements, we could lose the ability to perform our tests or experience disruptions to our business.
We are subject to CLIA, a federal law that regulates clinical laboratories that perform testing on specimens derived from humans for the purpose of providing information for the diagnosis, prevention or treatment of disease. CLIA regulations establish specific standards with respect to personnel qualifications, facility administration,
44
proficiency testing, quality control, quality assurance and inspections. CLIA certification is also required in order for us to be eligible to bill state and federal healthcare programs, as well as many private third-party payers, for our tests. We have current CLIA certifications to conduct our tests at our laboratories in San Francisco and Irvine, California. To renew these certifications, we are subject to survey and inspection every two years. Moreover, CLIA inspectors may make random inspections of our clinical reference laboratories.
We are also required to maintain licenses to conduct testing in California. California laws establish standards for day-to-day operation of our clinical reference laboratories in San Francisco and Irvine, including the training and skills required of personnel and quality control. We also maintain out-of-state laboratory licenses to conduct testing on specimens from Maryland, New York, Pennsylvania and Rhode Island.
In addition to having laboratory licenses in New York, our clinical reference laboratories are approved on test-specific bases by the New York State Department of Health, or NYDOH. Other states may adopt similar licensure requirements in the future, which may require us to modify, delay or stop our operations in such jurisdictions. We may also be subject to regulation in foreign jurisdictions as we seek to expand international utilization of our tests or such jurisdictions adopt new licensure requirements, which may require review of our tests in order to offer them or may have other limitations such as restrictions on the transport of samples necessary for us to perform our tests that may limit our ability to make our tests available outside of the United States. Complying with licensure requirements in new jurisdictions may be expensive, time-consuming, and subject us to significant and unanticipated delays.
Failure to comply with applicable clinical laboratory licensure requirements may result in a range of enforcement actions, including license suspension, limitation, or revocation, directed plan of action, onsite monitoring, civil monetary penalties, criminal sanctions, and cancellation of the laboratory’s approval to receive Medicare and Medicaid payment for its services, as well as significant adverse publicity. Any sanction imposed under CLIA, its implementing regulations, or state or foreign laws or regulations governing clinical laboratory licensure, or our failure to renew our CLIA certificate, a state or foreign license, or accreditation, could have a material adverse effect on our business, financial condition and results of operations. Even if we were able to bring our laboratory back into compliance, we could incur significant expenses and potentially lose revenue in doing so.
The College of American Pathologists, or CAP, maintains a clinical laboratory accreditation program. CAP asserts that its program is “designed to go well beyond regulatory compliance” and helps laboratories achieve the highest standards of excellence to positively impact patient care. While not required to operate a CLIA-certified laboratory, many private insurers require CAP accreditation as a condition to contracting with clinical laboratories to cover their tests. In addition, some countries outside the United States require CAP accreditation as a condition to permitting clinical laboratories to test samples taken from their citizens. We have CAP accreditations for our laboratories. Failure to maintain CAP accreditation could have a material adverse effect on the sales of our tests and the results of our operations.
Complying with numerous statutes and regulations pertaining to our business is an expensive and time-consuming process, and any failure to comply could result in substantial penalties.
Our operations are subject to other extensive federal, state, local and foreign laws and regulations, all of which are subject to change. These laws and regulations currently include, among others:
• | HIPAA, which establish comprehensive federal standards with respect to the privacy and security of protected health information and requirements for the use of certain standardized electronic transactions; |
• | amendments to HIPAA under HITECH, which strengthen and expand HIPAA privacy and security compliance requirements, increase penalties for violators and expand vicarious liability, extend enforcement authority to state attorneys general, and impose requirements for breach notification; |
• | the federal Anti-Kickback Statute, which prohibits knowingly and willfully offering, paying, soliciting or receiving remuneration, directly or indirectly, overtly or covertly, in cash or in kind, to induce or in return for the referral of an individual, for the furnishing of or arrangement for the furnishing of any item or service for which payment may be made in whole or in part by a federal healthcare program, or the purchasing, leasing, ordering, arranging for, or recommend purchasing, leasing or ordering, any good, facility, item or service for which payment may be made, in whole or in part, under a federal healthcare program; |
• | the federal physician self-referral law, known as the Stark Law, which prohibits a physician from making a referral to an entity for certain designated health services covered by the Medicare program, including laboratory and pathology services, if the physician or an immediate family member has a financial relationship with the entity unless an exception applies, and prohibits an entity from billing for designated health services furnished pursuant to a prohibited referral; |
45
• | the federal false claims law, which impose liability on any person or entity that, among other things, knowingly presents, or causes to be presented, a false or fraudulent claim for payment to the federal government; |
• | the federal Civil Monetary Penalties Law, which prohibits, among other things, the offering or transfer of remuneration to a Medicare or state healthcare program beneficiary if the person knows or should know it is likely to influence the beneficiary’s selection of a particular provider, practitioner or supplier of services reimbursable by Medicare or a state healthcare program, unless an exception applies; |
• | the HIPAA fraud and abuse provisions, which create |
• | new federal criminal statutes that prohibit, among other things, defrauding health care benefit programs, willfully obstructing a criminal investigation of a healthcare offense and falsifying or concealing a material fact or making any materially false statements in connection with the payment for healthcare benefits, items or services; |
• | other federal and state fraud and abuse laws, such as anti-kickback laws, prohibitions on self-referral, fee-splitting restrictions, insurance fraud laws, anti-markup laws, prohibitions on the provision of tests at no or discounted cost to induce physician or patient adoption, and false claims acts, which may extend to services reimbursable by any third-party payer, including private insurers; |
• | the prohibition on reassignment of Medicare claims, which, subject to certain exceptions, precludes the reassignment of Medicare claims to any other party; |
• | state laws that prohibit other specified practices, such as billing clinicians for testing that they order; waiving coinsurance, copayments, deductibles and other amounts owed by patients; billing a state Medicaid program at a price that is higher than what is charged to one or more other payers; and |
• | similar foreign laws and regulations that apply to us in the countries in which we operate or may operate in the future. |
We have adopted policies and procedures designed to comply with these laws and regulations. In the ordinary course of our business, we conduct internal reviews of our compliance with these laws. Our compliance may also be subject to governmental review. The growth of our business and our expansion outside of the United States may increase the potential of violating these laws or our internal policies and procedures. The risk of our being found in violation of these or other laws and regulations is further increased by the fact that many have not been fully interpreted by the regulatory authorities or the courts, and their provisions are open to a variety of interpretations. Any action brought against us for violation of these or other laws or regulations, even if we successfully defend against it, could cause us to incur significant legal expenses and divert our management’s attention from the operation of our business. If our operations are found to be in violation of any of these laws and regulations, we may be subject to any applicable penalty associated with the violation, including administrative, civil and criminal penalties, damages, fines, individual imprisonment, exclusion from participation in Federal healthcare programs, refunding of payments received by us, and curtailment or cessation of our operations. Any of the foregoing consequences could seriously harm our business and our financial results.
Healthcare policy changes, including legislation reforming the U.S. healthcare system, may have a material adverse effect on our financial condition, results of operations and cash flows.
In March 2010, the Patient Protection and Affordable Care Act, as amended by the Health Care and Education Reconciliation Act, collectively referred to as the Affordable Care Act, was enacted in the United States, which made a number of substantial changes in the way healthcare is financed by both governmental and private insurers. Among other things, the Affordable Care Act requires each medical device manufacturer to pay a sales tax equal to 2.3% of the price for which such manufacturer sells its medical devices, and applied to sales of taxable medical devices from January 1, 2013 through December 31, 2015. The medical device tax has been suspended for 2016 through 2019, but is scheduled to return beginning in 2020. It is unclear at this time when, or if, the provision of our LDTs will trigger the medical device tax if the FDA ends its policy of general enforcement discretion and regulates certain LDTs as medical devices. It is possible, however, that this tax will apply to some or all of our tests or tests that are in development.
Many of the Current Procedure Terminology, or CPT, procedure codes that we use to bill our tests were revised by the American Medical Association, effective January 1, 2013. Moreover, effective January 1, 2015, the AMA released several new codes to report genomic sequencing procedures. In a final determination under the Medicare Clinical Laboratory Fee Schedule, or CLFS, published in November 2014, CMS set the 2015 payment rate for these codes by the gap-fill process. Under the gap-fill process, local Medicare Administrative Contractors, or
46
MACs, establish rates for those codes that each MAC believes meet the criteria for Medicare coverage and considering laboratory charges and discounts to charges, resources, amounts paid by other payers for the tests, and amounts paid by the MAC for similar tests. In 2015, gap-filled payment rates were established for some, but not all, of the above-described codes. For those codes for which local gap-filled rate(s) were established in 2015, a national limitation amount for Medicare was established for 2016. Codes for which local gap-filled rates were not established in 2015 were priced by the local MACs in 2016 insofar as an individual MAC determines that such codes should be covered. Where available, the national limitation amount serves as a cap on the Medicare and Medicaid payment rates for a test procedure.
The AMA also released several CPT codes effective January 1, 2016 that may be appropriate to report certain of our tests. In a November 2015 final determination, CMS set the calendar year 2016 CLFS payment rate for these new codes by the gap-fill process. CMS and the local MACs went through the gap-fill process in 2016 and announced final gap-filled rates for 2017 on September 30, 2016. The calendar year 2017 national limitation amounts for certain codes were significantly less than the rates at which we have historically offered our tests.
In April 2014, Congress passed the Protecting Access to Medicare Act of 2014, or PAMA, which included substantial changes to the way in which clinical laboratory services are paid under Medicare. Under the final rule that implements PAMA, which was promulgated by CMS in June 2016, clinical laboratories must report to CMS private payer rates beginning in 2017 and every three years thereafter for clinical diagnostic laboratory tests that are not advanced diagnostic laboratory tests and every year for advanced diagnostic laboratory tests.
We do not believe that our tests meet the definition of advanced diagnostic laboratory tests, but in the event that we seek designation for one or more of our tests as an advanced diagnostic laboratory test and the tests are determined by CMS to meet these criteria or new criteria developed by CMS, we would be required to report private payer data for those tests annually. Otherwise, we will be required to report private payer rates for our tests on an every three years basis. Laboratories that fail to timely report the required payment information may be subject to substantial civil money penalties.
As set forth in the PAMA final rule, for tests furnished on or after January 1, 2018, Medicare payments for clinical diagnostic laboratory tests are paid based upon these reported private payer rates. For clinical diagnostic laboratory tests that are assigned a new or substantially revised code, initial payment rates for clinical diagnostic laboratory tests that are not advanced diagnostic laboratory tests will be assigned by the cross-walk or gap-fill methodology, similar to prior law. Initial payment rates for new advanced diagnostic laboratory tests will be based on the actual list charge for the laboratory test. The payment rates calculated under PAMA went into effect starting January 1, 2018. Where applicable, reductions to payment rates resulting from the new methodology are limited to 10% per test per year in each of the years 2018 through 2020 and to 15% per test per year in each of 2021 through 2023 (following a second round of private payer rate reporting in 2020 to establish rates for 2021 through 2023).
PAMA also authorized the adoption of new, temporary billing codes and/or unique test identifiers for FDA-cleared or approved tests as well as advanced diagnostic laboratory tests. The CPT® Editorial Panel approved a proposal to create a new section of billing codes to facilitate implementation of this section of PAMA, but it is unclear how these codes would apply to our tests.
In March 2018, CMS published a final national coverage determination, or NCD, for next generation sequencing, or NGS, tests for patients with advanced cancer. The final NCD establishes full coverage for FDA-approved or FDA-cleared NGS-based companion diagnostic assays when offered for their FDA-approved or FDA-cleared use(s), ordered by the patient’s treating physician for Medicare beneficiaries with advanced cancer (recurrent, relapsed, refractory, metastatic, or advanced stage III or IV cancer) who have not have previously been tested with the same test for the same primary diagnosis of cancer or are seeking repeat testing for a new primary cancer diagnosis, and have decided to seek further cancer treatment. The final NCD also gives MACs the authority to establish local coverage for NGS-based assays that are not FDA-approved or FDA-cleared companion diagnostics when offered to patients meeting the above-referenced criteria. It is unclear, however, whether MACs retain the authority to establish local coverage for NGS-based tests provided for patients with cancer that do not meet the above-referenced criteria - e.g., patients with earlier stage cancers or patients with a personal history of cancer - or if such tests are nationally non-covered under the NCD. If CMS interprets the final NCD to exclude coverage for patients with earlier stage cancers or personal history of cancer, MACs will no longer have discretion to cover our current tests when offered to such patients, notwithstanding historical Medicare coverage for such tests. An interpretation of the NCD that results in Medicare non-coverage for our current and future assays would have significant negative impact on our business, financial condition and results of operations. In April 2019, in an effort to clarify the impact of the NCD, CMS announced that it would be re-opening the NCD. CMS requested comments on tests for germline mutations to identify those with hereditary cancer who may benefit from targeted treatments based on results of the test, and explicitly stated that all other tests are beyond the scope of the re-
47
opening. However, the extent to which CMS may eventually reconsider its position with respect to NGS-based germline testing more generally - or the position that CMS may take with respect to such testing - remains unclear at this time.
We cannot predict whether future healthcare initiatives will be implemented at the federal or state level, or how any future legislation or regulation may affect us. For instance, the payment reductions imposed by the Affordable Care Act and the expansion of the federal and state governments’ role in the U.S. healthcare industry as well as changes to the reimbursement amounts paid by payers for our tests and future tests or our medical procedure volumes may reduce our profits and have a materially adverse effect on our business, financial condition, results of operations and cash flows. Notably, Congress enacted legislation in 2017 that eliminates the Affordable Care Act’s “individual mandate” beginning in 2019, which may significantly impact the number of covered lives participating in exchange plans. Moreover, Congress has proposed on several occasions to impose a 20% coinsurance on patients for clinical laboratory tests reimbursed under the clinical laboratory fee schedule, which would increase our billing and collecting costs and decrease our revenue.
If we use hazardous materials in a manner that causes injury, we could be liable for resulting damages.
Our activities currently require the use of hazardous chemicals and biological material. We cannot eliminate the risk of accidental contamination or injury to employees or third parties from the use, storage, handling or disposal of these materials. In the event of contamination or injury, we could be held liable for any resulting damages, and any liability could exceed our resources or any applicable insurance coverage we may have. In 2018, we decommissioned our laboratory in Cambridge, Massachusetts; however, we could be held liable for any damages resulting from our prior use of hazardous chemicals and biological materials at this facility. Additionally, we are subject on an ongoing basis to federal, state and local laws and regulations governing the use, storage, handling and disposal of these materials and specified waste products. The cost of compliance with these laws and regulations may become significant, and our failure to comply may result in substantial fines or other consequences, and either could negatively affect our operating results.
We could be adversely affected by violations of the FCPA and other worldwide anti-bribery laws.
We are subject to the FCPA, which prohibits companies and their intermediaries from making payments in violation of law to non-U.S. government officials for the purpose of obtaining or retaining business or securing any other improper advantage. We use a limited number of independent distributors to sell our tests internationally, which requires a high degree of vigilance in maintaining our policy against participation in corrupt activity, because these distributors could be deemed to be our agents, and we could be held responsible for their actions. Other U.S. companies in the medical device and pharmaceutical fields have faced criminal penalties under the FCPA for allowing their agents to deviate from appropriate practices in doing business with these individuals. We are also subject to similar anti-bribery laws in the jurisdictions in which we operate, including the United Kingdom’s Bribery Act of 2010, which also prohibits commercial bribery and makes it a crime for companies to fail to prevent bribery. These laws are complex and far-reaching in nature, and, as a result, we cannot assure you that we would not be required in the future to alter one or more of our practices to be in compliance with these laws or any changes in these laws or the interpretation thereof. Any violations of these laws, or allegations of such violations, could disrupt our operations, involve significant management distraction, involve significant costs and expenses, including legal fees, and could result in a material adverse effect on our business, prospects, financial condition or results of operations. We could also incur severe penalties, including criminal and civil penalties, disgorgement and other remedial measures.
Risks related to our intellectual property
Litigation or other proceedings or third-party claims of intellectual property infringement or misappropriation may require us to spend significant time and money, and could in the future prevent us from selling our tests or impact our stock price.
Our commercial success will depend in part on our avoiding infringement of patents and proprietary rights of third parties, including for example the intellectual property rights of competitors. As we continue to commercialize our tests in their current or an updated form, launch different and expanded tests, and enter new markets, competitors might claim that our tests infringe or misappropriate their intellectual property rights as part of business strategies designed to impede our successful commercialization and entry into new markets. Our activities may be subject to claims that we infringe or otherwise violate patents or other intellectual property rights owned or controlled by third parties. We cannot assure you that our operations do not, or will not in the future, infringe existing or future patents. We may be unaware of patents that a third party, including for example a competitor in the genetic testing market, might assert are infringed by our business. There may also be patent applications that, if issued as patents, could be asserted against us. Third parties making claims against us for infringement or misappropriation
48
of their intellectual property rights may seek and obtain injunctive or other equitable relief, which could effectively block our ability to perform our tests. Further, if a patent infringement suit were brought against us, we could be forced to stop or delay our development or sales of any tests or other activities that are the subject of such suit. Defense of these claims, regardless of merit, could cause us to incur substantial expenses and be a substantial diversion of our employee resources. Any adverse ruling or perception of an adverse ruling in defending ourselves could have a material adverse impact on our business and stock price. In the event of a successful claim of infringement against us by a third party, we may have to (1) pay substantial damages, possibly including treble damages and attorneys’ fees if we are found to have willfully infringed patents; (2) obtain one or more licenses, which may not be available on commercially reasonable terms (if at all); (3) pay royalties; and/or (4) redesign any infringing tests or other activities, which may be impossible or require substantial time and monetary expenditure, all of which could have a material adverse impact on our cash position and business and financial condition.
If licenses to third-party intellectual property rights are or become required for us to engage in our business, we may be unable to obtain them at a reasonable cost, if at all. Even if such licenses are available, we could incur substantial costs related to royalty payments for licenses obtained from third parties, which could negatively affect our gross margins. Moreover, we could encounter delays in the introduction of tests while we attempt to develop alternatives. Defense of any lawsuit or failure to obtain any of these licenses on favorable terms could prevent us from commercializing tests, which could materially affect our ability to grow and thus adversely affect our business and financial condition.
Developments in patent law could have a negative impact on our business.
Although we view current U.S. Supreme Court precedent to be aligned with our belief that naturally occurring DNA sequences and detection of natural correlations between observed facts (such as patient genetic data) and an understanding of that fact’s implications (such as a patient’s risk of disease associated with certain genetic variations) should not be patentable, it is possible that subsequent determinations by the U.S. Supreme Court or other federal courts could limit, alter or potentially overrule current law. Moreover, from time to time the U.S. Supreme Court, other federal courts, the United States Congress or the U.S. Patent and Trademark Office, or USPTO, may change the standards of patentability, and any such changes could run contrary to, or otherwise be inconsistent with, our belief that naturally occurring DNA sequences and detection of natural correlations between observed facts and an understanding of that fact’s implications should not be patentable, which could result in third parties newly claiming that our business practices infringe patents drawn from categories of patents which we currently view to be invalid as directed to unpatentable subject matter.
Our inability to effectively protect our proprietary technologies, including the confidentiality of our trade secrets, could harm our competitive position.
We currently rely upon trade secret protection and copyright, as well as non-disclosure agreements and invention assignment agreements with our employees, consultants and third-parties, and to a limited extent patent protection, to protect our confidential and proprietary information. Although our competitors have utilized and are expected to continue utilizing similar methods and have aggregated and are expected to continue to aggregate similar databases of genetic testing information, our success will depend upon our ability to develop proprietary methods and databases and to defend any advantages afforded to us by such methods and databases relative to our competitors. If we do not protect our intellectual property adequately, competitors may be able to use our methods and databases and thereby erode any competitive advantages we may have.
We will be able to protect our proprietary rights from unauthorized use by third parties only to the extent that our proprietary technologies are covered by valid and enforceable patents or are effectively maintained as trade secrets. In this regard, we have applied, and we intend to continue applying, for patents covering such aspects of our technologies as we deem appropriate. However, we expect that potential patent coverage we may obtain will not be sufficient to prevent substantial competition. In this regard, we believe it is probable that others will independently develop similar or alternative technologies or design around those technologies for which we may obtain patent protection. In addition, any patent applications we file may be challenged and may not result in issued patents or may be invalidated or narrowed in scope after they are issued. Questions as to inventorship or ownership may also arise. Any finding that our patents or applications are unenforceable could harm our ability to prevent others from practicing the related technology, and a finding that others have inventorship or ownership rights to our patents and applications could require us to obtain certain rights to practice related technologies, which may not be available on favorable terms, if at all. If we initiate lawsuits to protect or enforce our patents, or litigate against third party claims, which would be expensive, and, if we lose, we may lose some of our intellectual property rights. Furthermore, these lawsuits may divert the attention of our management and technical personnel.
49
We expect to rely primarily upon trade secrets and proprietary know-how protection for our confidential and proprietary information, and we have taken security measures to protect this information. These measures, however, may not provide adequate protection for our trade secrets, know-how or other confidential information. Among other things, we seek to protect our trade secrets and confidential information by entering into confidentiality agreements with employees and consultants. There can be no assurance that any confidentiality agreements that we have with our employees and consultants will provide meaningful protection for our trade secrets and confidential information or will provide adequate remedies in the event of unauthorized use or disclosure of such information. Accordingly, there also can be no assurance that our trade secrets will not otherwise become known or be independently developed by competitors. Enforcing a claim that a party illegally disclosed or misappropriated a trade secret can be difficult, expensive and time-consuming, and the outcome is unpredictable. In addition, trade secrets may be independently developed by others in a manner that could prevent legal recourse by us. If any of our confidential or proprietary information, such as our trade secrets, were to be disclosed or misappropriated, or if any such information was independently developed by a competitor, our competitive position could be harmed.
We may not be able to enforce our intellectual property rights throughout the world.
The laws of some foreign countries do not protect proprietary rights to the same extent as the laws of the United States, and many companies have encountered significant challenges in establishing and enforcing their proprietary rights outside of the United States. These challenges can be caused by the absence of rules and methods for the establishment and enforcement of intellectual property rights outside of the United States. In addition, the legal systems of some countries, particularly developing countries, do not favor the enforcement of patents and other intellectual property protection, especially those relating to healthcare. This could make it difficult for us to stop the infringement of our patents, if obtained, or the misappropriation of our other intellectual property rights. For example, many foreign countries have compulsory licensing laws under which a patent owner must grant licenses to third parties. In addition, many countries limit the enforceability of patents against third parties, including government agencies or government contractors. In these countries, patents may provide limited or no benefit. Patent protection must ultimately be sought on a country-by-country basis, which is an expensive and time-consuming process with uncertain outcomes. Accordingly, we may choose not to seek patent protection in certain countries, and we will not have the benefit of patent protection in such countries. Proceedings to enforce our patent rights in foreign jurisdictions could result in substantial costs and divert our efforts and attention from other aspects of our business. Accordingly, our efforts to protect our intellectual property rights in such countries may be inadequate. In addition, changes in the law and legal decisions by courts in the United States and foreign countries may affect our ability to obtain adequate protection for our technology and the enforcement of intellectual property.
Third parties may assert that our employees or consultants have wrongfully used or disclosed confidential information or misappropriated trade secrets.
We employ individuals who were previously employed at universities or genetic testing, diagnostic or other healthcare companies, including our competitors or potential competitors. Although we try to ensure that our employees and consultants do not use the proprietary information or know-how of others in their work for us, we may be subject to claims that we or our employees or consultants have inadvertently or otherwise used or disclosed intellectual property, including trade secrets or other proprietary information, of a former employer or other third parties. Further, we may be subject to ownership disputes in the future arising, for example, from conflicting obligations of consultants or others who are involved in developing our intellectual property. Litigation may be necessary to defend against these claims. If we fail in defending any such claims, in addition to paying monetary damages, we may lose valuable intellectual property rights or personnel. Even if we are successful in defending against such claims, litigation could result in substantial costs and be a distraction to management and other employees.
Risks related to being a public company
We incur increased costs and demands on management as a result of compliance with laws and regulations applicable to public companies, which could harm our operating results.
As a public company, we incur significant legal, accounting and other expenses , including costs associated with public company reporting requirements. In addition, the Sarbanes-Oxley Act of 2002, or the Sarbanes-Oxley Act, as well as rules implemented by the SEC and the New York Stock Exchange, or NYSE, impose a number of requirements on public companies, including with respect to corporate governance practices. The SEC and other regulators have continued to adopt new rules and regulations and make additional changes to existing regulations that require our compliance. In addition, the Dodd-Frank Wall Street Reform and Consumer Protection Act, or the Dodd-Frank Act, enacted in 2010, includes significant corporate governance and executive-compensation-related provisions. Our management and other personnel need to devote a substantial amount of time to these compliance
50
and disclosure obligations. If these requirements divert the attention of our management and personnel from other aspects of our business concerns, they could have a material adverse effect on our business, financial condition and results of operations. Moreover, these rules and regulations applicable to public companies substantially increase our legal, accounting and financial compliance costs, require that we hire additional personnel and make some activities more time-consuming and costly. It may also be more expensive for us to obtain director and officer liability insurance.
If we are unable to maintain effective internal control over financial reporting, investors may lose confidence in the accuracy and completeness of our reported financial information and the market price of our common stock may be negatively affected.
We are required to maintain internal control over financial reporting and to report any material weaknesses in such internal controls. Section 404 of the Sarbanes-Oxley Act requires that we evaluate and determine the effectiveness of our internal control over financial reporting and provide a management report on our internal control over financial reporting. If we have a material weakness in our internal control over financial reporting, we may not detect errors on a timely basis and our financial statements may be materially misstated. We have compiled the system and process documentation necessary to perform the evaluation needed to comply with Section 404 of the Sarbanes-Oxley Act. We need to maintain and enhance these processes and controls as we grow and we have required, and may continue to require, additional personnel and resources to do so.
During the evaluation and testing process, if we identify one or more material weaknesses in our internal controls, our management will be unable to conclude that our internal control over financial reporting is effective. Moreover, when we are no longer an emerging growth company, as described below, our independent registered public accounting firm will be required to issue an attestation report on the effectiveness of our internal control over financial reporting. Even if our management concludes that our internal control over financial reporting is effective, our independent registered public accounting firm may conclude that there are material weaknesses with respect to our internal controls or the level at which our internal controls are documented, designed, implemented or reviewed.
If we are unable to conclude that our internal control over financial reporting is effective, or when we are no longer an emerging growth company, if our auditors were to express an adverse opinion on the effectiveness of our internal control over financial reporting because we had one or more material weaknesses, investors could lose confidence in the accuracy and completeness of our financial disclosures, which could cause the price of our common stock to decline. Internal control deficiencies could also result in the restatement of our financial results in the future.
We are an emerging growth company and have elected to comply with reduced public company reporting requirements applicable to emerging growth companies, which could make our common stock less attractive to investors.
We are an emerging growth company, as defined under the Securities Act. We may remain an emerging growth company until December 31, 2020, although if our revenue exceeds $1.07 billion in any fiscal year before that time, we would cease to be an emerging growth company as of the end of that fiscal year. In addition, if the market value of our common stock that is held by non-affiliates exceeds $700 million as of the last business day of our second fiscal quarter of any fiscal year before the end of that five-year period, we would cease to be an emerging growth company as of December 31 of that year, and we currently expect that we will cease to be an emerging growth company on December 31, 2019. As an emerging growth company, we have chosen to take advantage of exemptions from various reporting requirements applicable to certain other public companies, including not being required to comply with the auditor attestation requirements of Section 404 of the Sarbanes-Oxley Act, reduced financial statement and financial-related disclosures, reduced disclosure obligations regarding executive compensation in our periodic reports and proxy statements, and exemptions from the requirement of holding a nonbinding advisory vote on executive compensation and obtaining stockholder approval of any golden parachute payments not previously approved by our stockholders. We cannot predict whether investors will find our common stock less attractive because we have chosen to rely on any of these exemptions. If investors find our common stock less attractive as a result of any choices to reduce future disclosure we may make, there may be a less active trading market for our common stock and our stock price may be more volatile.
51
Risks related to our common stock
Our stock price is volatile, and you may not be able to sell shares of our common stock at or above the price you paid.
The trading price of our common stock is volatile and could be subject to wide fluctuations in response to various factors, some of which are beyond our control. These factors include:
• | actual or anticipated fluctuations in our operating results; |
• | competition from existing tests or new tests that may emerge; |
• | announcements by us or our competitors of significant acquisitions, strategic partnerships, joint ventures, collaborations or capital commitments; |
• | failure to meet or exceed financial estimates and projections of the investment community or that we provide to the public; |
• | issuance of new or updated research or reports by securities analysts or changed recommendations for our stock; |
• | our focus on long-term goals over short-term results; |
• | the timing of our investments in the growth of our business; |
• | actual or anticipated changes in regulatory oversight of our business; |
• | additions or departures of key management or other personnel; |
• | disputes or other developments related to our intellectual property or other proprietary rights, including litigation; |
• | changes in reimbursement by current or potential payers; |
• | general economic and market conditions; and |
• | issuances of significant amounts of our common stock. |
In addition, the stock market in general, and the market for stock of life sciences companies in particular, has experienced extreme price and volume fluctuations that have often been unrelated or disproportionate to the operating performance of those companies. Broad market and industry factors may seriously affect the market price of our common stock, regardless of our actual operating performance. In addition, in the past, following periods of volatility in the overall market and the market price of a particular company’s securities, securities class action litigation has often been instituted against these companies. This litigation, if instituted against us, could result in substantial costs and a diversion of our management’s attention and resources.
If securities or industry analysts issue an adverse opinion regarding our stock or do not publish research or reports about our company, our stock price and trading volume could decline.
The trading market for our common stock will depend in part on the research and reports that equity research analysts publish about us and our business. We do not control these analysts or the content and opinions included in their reports. Securities analysts may elect not to provide research coverage of our company and such lack of research coverage may adversely affect the market price of our common stock. The price of our common stock could also decline if one or more equity research analysts downgrade our common stock, change their price targets, issue other unfavorable commentary or cease publishing reports about us or our business. If one or more equity research analysts cease coverage of our company, we could lose visibility in the market, which in turn could cause our stock price to decline.
Our ability to use our net operating loss carryforwards and certain other tax attributes may be limited.
At March 31, 2019, our total gross deferred tax assets were $131.9 million. Due to our lack of earnings history and uncertainties surrounding our ability to generate future taxable income, the net deferred tax assets have been fully offset by a valuation allowance. The deferred tax assets were primarily comprised of federal and state tax net operating losses and tax credit carryforwards. Furthermore, under Section 382 of the Internal Revenue Code of 1986, as amended, or the Internal Revenue Code, if a corporation undergoes an “ownership change,” the corporation’s ability to use its pre-change net operating loss carryforwards, or NOLs, and other pre-change tax attributes (such as research tax credits) to offset its future taxable income may be limited. In general, an “ownership change” occurs if there is a cumulative change in our ownership by “5% shareholders” that exceeds 50 percentage points over a rolling three-year period. Our existing NOLs and tax credit carryovers may be subject to limitations
52
arising from previous ownership changes, and if we undergo one or more ownership changes in connection with completed acquisitions, or other future transactions in our stock, our ability to utilize NOLs and tax credit carryovers could be further limited by Section 382 of the Internal Revenue Code. As a result, if we earn net taxable income, our ability to use our pre-change net operating loss and tax credit carryforwards to offset U.S. federal taxable income may be subject to limitations, which could potentially result in increased future tax liability to us. The annual limitation may result in the expiration of certain net operating loss and tax credit carryforwards before their utilization. In addition, the Tax Act limits the deduction for NOLs to 80% of current year taxable income and eliminates NOL carrybacks. Also, at the state level, there may be periods during which the use of NOLs is suspended or otherwise limited, which could accelerate or permanently increase state taxes owed.
We have never paid dividends on our capital stock, and we do not anticipate paying dividends in the foreseeable future.
We have never paid dividends on any of our capital stock and currently intend to retain any future earnings to fund the growth of our business. In addition, our 2018 Note Purchase Agreement limits our ability to pay dividends on our common stock. Any determination to pay dividends in the future will be at the discretion of our board of directors and will depend on our financial condition, operating results, capital requirements, general business conditions and other factors that our board of directors may deem relevant. As a result, capital appreciation, if any, of our common stock will be the sole source of gain for the foreseeable future.
Anti-takeover provisions in our charter documents and under Delaware law could discourage, delay or prevent a change in control and may affect the trading price of our common stock.
Provisions in our restated certificate of incorporation and our amended and restated bylaws may have the effect of delaying or preventing a change of control or changes in our management. Our restated certificate of incorporation and amended and restated bylaws include provisions that:
• | authorize our board of directors to issue, without further action by the stockholders, up to 20,000,000 shares of undesignated preferred stock; |
• | require that any action to be taken by our stockholders be effected at a duly called annual or special meeting and not by written consent; |
• | specify that special meetings of our stockholders can be called only by our board of directors, our chairman of the board or our chief executive officer; |
• | establish an advance notice procedure for stockholder approvals to be brought before an annual meeting of our stockholders, including proposed nominations of persons for election to our board of directors; |
• | establish that our board of directors is divided into three classes, Class I, Class II and Class III, with each class serving staggered terms; |
• | provide that our directors may be removed only for cause; |
• | provide that vacancies on our board of directors may, except as otherwise required by law, be filled only by a majority of directors then in office, even if less than a quorum; and |
• | require a super-majority of votes to amend certain of the above-mentioned provisions as well as to amend our bylaws generally. |
In addition, we are subject to the provisions of Section 203 of the Delaware General Corporation Law regulating corporate takeovers. Section 203 generally prohibits us from engaging in a business combination with an interested stockholder subject to certain exceptions.
Our certificate of incorporation designates the Court of Chancery of the State of Delaware as the sole and exclusive forum for certain types of actions and proceedings that may be initiated by our stockholders, which could limit our stockholders’ ability to obtain a favorable judicial forum for disputes with us or our directors, officers or other employees.
Our certificate of incorporation provides that, unless we consent in writing to the selection of an alternative forum, the Court of Chancery of the State of Delaware shall be the sole and exclusive forum for:
• | any derivative action or proceeding brought on our behalf; |
• | any action asserting a claim of breach of a fiduciary duty owed by any of our directors, officers, or other employees to us or our stockholders; |
53
• | any action asserting a claim arising pursuant to any provision of the Delaware General Corporation Law; or |
• | any action asserting a claim against us governed by the internal affairs doctrine. |
Any person or entity purchasing or otherwise acquiring any interest in shares of our capital stock shall be deemed to have notice of and consented to the provisions of our certificate of incorporation described above. This choice of forum provision may limit a stockholder’s ability to bring a claim in a judicial forum that it finds favorable for disputes with us or our directors, officers or other employees, which may discourage such lawsuits against us and our directors, officers and other employees. Alternatively, if a court were to find these provisions of our certificate of incorporation inapplicable to, or unenforceable in respect of, one or more of the specified types of actions or proceedings, we may incur additional costs associated with resolving such matters in other jurisdictions, which could adversely affect our business, financial condition or results of operations.
54
ITEM 6. Exhibits.
Exhibit Number | Description | |
10.1 | ||
31.1 | ||
31.2 | ||
32.1* | ||
32.2* | ||
101.INS | XBRL Instance Document | |
101.SCH | XBRL Taxonomy Extension Schema | |
101.CAL | XBRL Taxonomy Extension Calculation Linkbase | |
101.DEF | XBRL Taxonomy Extension Definition Linkbase | |
101.LAB | XBRL Taxonomy Extension Label Linkbase | |
101.PRE | XBRL Taxonomy Extension Presentation Linkbase | |
* | In accordance with Item 601(b)(32)(ii) of Regulation S-K and SEC Release No. 34-47986, the certifications furnished in Exhibits 32.1 and 32.2 hereto are deemed to accompany this Form 10-Q and will not be deemed “filed” for purposes of Section 18 of the Securities Exchange Act of 1934 (the “Exchange Act”) or deemed to be incorporated by reference into any filing under the Exchange Act or the Securities Act of 1933 except to the extent that the registrant specifically incorporates it by reference. |
55
SIGNATURES
Pursuant to the requirements of Section 13 or 15(d) of the Securities Exchange Act of 1934, the registrant has duly caused this report to be signed on its behalf by the undersigned, thereunto duly authorized.
INVITAE CORPORATION | ||
By: | /s/ Sean E. George, Ph.D. | |
Sean E. George, Ph.D. | ||
President and Chief Executive Officer | ||
Principal Executive Officer | ||
By: | /s/ Shelly D. Guyer | |
Shelly D. Guyer | ||
Chief Financial Officer | ||
Principal Financial and Accounting Officer | ||
Date: May 7, 2019 | ||
56