UNITED STATES
SECURITIES AND EXCHANGE COMMISSION
Washington, D.C. 20549
FORM N-CSR
CERTIFIED SHAREHOLDER REPORT OF REGISTERED
MANAGEMENT INVESTMENT COMPANIES
Investment Company Act file number 811- 22733
John Hancock Exchange-Traded Fund Trust
(Exact name of registrant as specified in charter)
200 Berkeley Street, Boston, Massachusetts 02116
(Address of principal executive offices) (Zip code)
Salvatore Schiavone
Treasurer
200 Berkeley Street
Boston, Massachusetts 02116
Registrant's telephone number, including area code: 617-663-4497
| Date of fiscal year end: | April 30 | |
| Date of reporting period: | October 31, 2020 |
ITEM 1. REPORTS TO STOCKHOLDERS.
John Hancock
Multifactor ETFs
Semiannual report
10/31/2020

Beginning on January 1, 2021, as permitted by regulations adopted by the Securities and Exchange Commission, paper copies of the fund's shareholder reports like this one will no longer be sent by mail, unless you specifically request paper copies of the reports from the fund or from your financial intermediary. Instead, the reports will be made available on a website, and you will be notified by mail each time a report is posted and provided with a website link to access the report.
If you already elected to receive shareholder reports electronically, you will not be affected by this change, and you do not need to take any action. You may elect to receive shareholder reports and other communications electronically by calling John Hancock Investment Management or by contacting your financial intermediary.
You may elect to receive all reports in paper, free of charge, at any time. You can inform John Hancock Investment Management or your financial intermediary that you wish to continue receiving paper copies of your shareholder reports by following the instructions listed above. Your election to receive reports in paper will apply to all funds held with John Hancock Investment Management or your financial intermediary.

A message to shareholders
Dear shareholder,
Despite heightened fears over the coronavirus (COVID-19), which sent markets tumbling prior to the beginning of the reporting period, global financial markets delivered positive returns for the 6 months ended October 31, 2020. The governments of many nations worked to shore up their economies, and equity markets began to rise from their first-quarter sell-off; this comeback gathered momentum for the remainder of the period.
Of course, it would be a mistake to consider this market turnaround a trustworthy signal of assured or swift economic recovery. Economic growth has slowed as the ongoing spread of COVID-19 continues to create uncertainty among businesses and investors. Lockdowns and curfews in certain parts of the world have been reinstated and consumer spending remains far below prepandemic levels.
From an investment perspective, we continue to think that maintaining a focus on long-term objectives while pursuing a risk-aware strategy is a prudent way forward. Above all, we believe the counsel of a trusted financial professional continues to matter now more than ever. Periods of heightened uncertainty are precisely the time to review your financial goals and follow a plan that helps you make the most of what continues to be a challenging situation.
On behalf of everyone at John Hancock Investment Management, I'd like to take this opportunity to welcome new shareholders and thank existing shareholders for the continued trust you've placed in us.
Sincerely,

Andrew G. Arnott
President and CEO,
John Hancock Investment Management
Head of Wealth and Asset Management,
United States and Europe
This commentary reflects the CEO's views as of this report's period end and are subject to change at any time. Diversification does not guarantee investment returns and does not eliminate risk of loss. All investments entail risks, including the possible loss of principal. For more up-to-date information, you can visit our website at jhinvestments.com.
John Hancock
Multifactor ETFs
Table of contents
| 2 | Multifactor exchange-traded funds (ETFs) at a glance | |
| 4 | John Hancock Multifactor Consumer Discretionary ETF | |
| 5 | John Hancock Multifactor Consumer Staples ETF | |
| 6 | John Hancock Multifactor Developed International ETF | |
| 7 | John Hancock Multifactor Emerging Markets ETF | |
| 8 | John Hancock Multifactor Energy ETF | |
| 9 | John Hancock Multifactor Financials ETF | |
| 10 | John Hancock Multifactor Healthcare ETF | |
| 11 | John Hancock Multifactor Industrials ETF | |
| 12 | John Hancock Multifactor Large Cap ETF | |
| 13 | John Hancock Multifactor Materials ETF | |
| 14 | John Hancock Multifactor Media and Communications ETF | |
| 15 | John Hancock Multifactor Mid Cap ETF | |
| 16 | John Hancock Multifactor Small Cap ETF | |
| 17 | John Hancock Multifactor Technology ETF | |
| 18 | John Hancock Multifactor Utilities ETF | |
| 19 | Premium/discount analysis | |
| 22 | Your expenses | |
| 24 | Funds' investments | |
| 75 | Financial statements | |
| 88 | Financial highlights | |
| 96 | Notes to financial statements | |
| 110 | Continuation of investment advisory and subadvisory agreements | |
| 118 | More information |
Multifactor exchange-traded funds (ETFs) at a glance
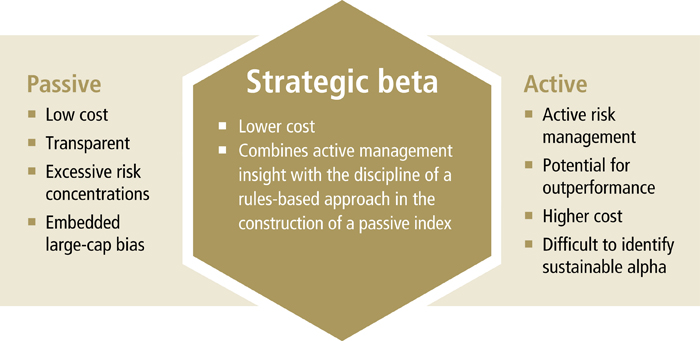
Many traditional indexes and index funds are weighted by market capitalization, a bias that can expose investors to certain risks and potentially reduce returns. Strategic beta strategies such as John Hancock Multifactor ETFs offer a different approach. Each ETF seeks to improve on cap-weighted strategies by tracking an index that combines active management insight with the discipline of a rules-based approach.
STRATEGIC BETA1: STRIKING A BALANCE BETWEEN ACTIVE AND PASSIVE INVESTING
PHILOSOPHY BACKING INDEX DESIGN
According to Dimensional Fund Advisors, subadvisor for all John Hancock Multifactor ETFs, there are four key factors that drive higher expected returns, and these factors guide Dimensional's index construction and semiannual reconstitution.
Market
Equity premium—stocks over bonds
Company size
Small-cap premium—small company stocks over large company stocks
Relative price2
Value premium—value stocks over growth stocks
Profitability3
Profitability premium—stocks of highly profitable companies over
stocks of less profitable companies
To be considered a true factor, a premium must be sensible, persistent across time periods, pervasive across markets, robust in data, and cost effective.
WHY MULTIFACTOR?
Individual factors can be volatile: there's no telling which will be
the best performing from year to year. Adopting a multifactor
approach is one way investors can pursue more consistent—and more
attractive—risk-adjusted returns.
| 1 | Strategic beta (also known as smart beta) defines a set of investment strategies that seek to improve on traditional market-capitalization weighted indexes in order to lower risk and achieve better diversification. |
| 2 | Relative price as measured by the price-to-book ratio; value stocks are those with lower price-to-book ratios. |
| 3 | Profitability is a measure of current profitability, based on information from individual companies' income statements. |
A note about risks
The funds may be subject to various risks as described in the funds'
prospectus. A widespread health crisis such as a global pandemic
could cause substantial market volatility, exchange trading
suspensions and closures, impact the ability to complete redemptions,
and affect fund performance. For example, the novel coronavirus
disease (COVID-19) has resulted in significant disruptions to global
business activity. The impact of a health crisis and other epidemics
and pandemics that may arise in the future, could affect the global
economy in ways that cannot necessarily be foreseen at the present
time. A health crisis may exacerbate other pre-existing political,
social, and economic risks. Any such impact could adversely affect
the funds' performance, resulting in losses to your investment. For
more information, please refer to the "Principal risks" section of
the prospectus.
A note about the performance shown on the following pages
Net asset value (NAV) performance is based on the NAV calculated each
business day. It is calculated in accordance with the standard
formula for valuing investment company shares as of the close of
regular trading hours on the NYSE (see Note 2 to financial
statements). Market price is determined using the bid/ask midpoint at
4 P.M. Eastern time, when the NAV is typically calculated. Your
returns may differ if you traded shares at other times during the day.
The past performance shown here reflects reinvested distributions and the beneficial effect of any expense reductions, and does not guarantee future results. Returns for periods shorter than one year are cumulative. Shares will fluctuate in value and, when redeemed, may be worth more or less than their original cost. Current performance may be lower or higher than the performance cited. For the most recent month-end performance, visit jhinvestments.com/etf.
Multifactor Consumer Discretionary ETF
AVERAGE ANNUAL TOTAL RETURNS (%)
| Average annual total returns (%) | Cumulative total returns (%) | ||||||
| 1-year | 5-year | Since fund inception1 |
6-month | 5-year | Since fund inception1 |
||
| Net asset value | 13.37 | 9.11 | 10.01 | 28.09 | 54.63 | 62.54 | |
| Market price | 13.37 | 9.11 | 10.01 | 28.09 | 54.61 | 62.56 | |
| John Hancock Dimensional Consumer Discretionary Index2 |
13.82 | 9.58 | 10.49 | 28.41 | 58.01 | 66.20 | |
| Russell 1000 Consumer Discretionary Index3 |
26.90 | 14.92 | 16.09 | 26.25 | 100.48 | 113.82 | |
INDUSTRY COMPOSITION (%)
| Specialty retail | 26.7 |
| Hotels, restaurants and leisure | 17.6 |
| Internet and direct marketing retail | 12.6 |
| Textiles, apparel and luxury goods | 8.8 |
| Automobiles | 7.6 |
| Multiline retail | 7.0 |
| Leisure products | 3.2 |
| Household durables | 2.9 |
| Commercial services and supplies | 2.2 |
| Diversified consumer services | 1.9 |
| Other | 9.5 |
| TOTAL | 100.0 |
| As a percentage of net assets. |
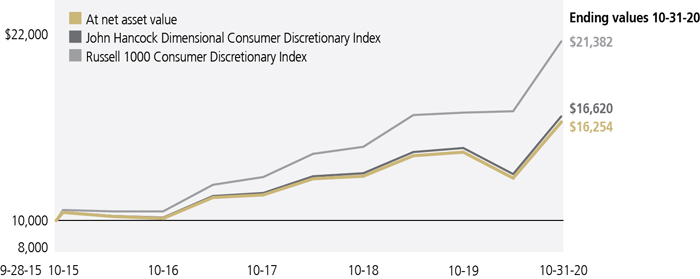
GROWTH OF $10,000
This chart shows what happened to a hypothetical $10,000 investment in John Hancock Multifactor Consumer Discretionary ETF for the period indicated, assuming all distributions were reinvested. For comparison, we've shown the same investment in two separate indexes.
TOP TEN HOLDINGS4 (%)
| Amazon.com, Inc. | 5.4 |
| The Home Depot, Inc. | 4.8 |
| Tesla, Inc. | 3.6 |
| NIKE, Inc., Class B | 3.5 |
| Target Corp. | 3.1 |
| Best Buy Company, Inc. | 3.0 |
| The TJX Companies, Inc. | 2.9 |
| McDonald's Corp. | 2.7 |
| Lowe's Companies, Inc. | 2.6 |
| Booking Holdings, Inc. | 2.3 |
| TOTAL | 33.9 |
The value of a $10,000 investment calculated at market value from inception through period end would be $16,256.
The chart and table above do not reflect the deduction of taxes that a shareholder would pay on fund distributions or the redemption or sale of fund shares.
It is not possible to invest directly in an index. Unlike an index, the fund's total returns are reduced by operating expenses and management fees.
| 1 | From 9-28-15. |
| 2 | The John Hancock Dimensional Consumer Discretionary Index is designed to comprise securities in the consumer discretionary sector within the U.S. universe whose market capitalizations are larger than that of the 1001st largest U.S. company at the time of reconstitution. Stocks that compose the index include those that may be considered medium or smaller capitalization company stocks. The index is reconstituted and rebalanced on a semiannual basis. The consumer discretionary sector is composed of companies in areas such as restaurants, media, consumer retail, leisure equipment and products, hotels, apparel, automobiles, and consumer durable goods. The U.S. universe is defined as a free float-adjusted market-capitalization-weighted portfolio of U.S. operating companies listed on the New York Stock Exchange (NYSE), NYSE MKT LLC, NASDAQ Global Market, or such other securities exchanges deemed appropriate in accordance with the rules-based methodology that is maintained by Dimensional Fund Advisors LP. |
| 3 | Effective 9/21/20, the underlying components of the Russell 1000 Consumer Discretionary Index reflect a new company classification methodology. Consequently, the custom blended benchmark's performance consists of 100% of the prior methodology through 9/18/20 and 100% of the current methodology thereafter. |
| 4 | Listed holdings are a portion of the fund's total and may change at any time. They are not recommendations to buy or sell any security. Data is expressed as a percentage of net assets and excludes cash and cash equivalents. |
The expense ratios of the fund, both net (including any fee waivers and/or expense limitations) and gross (excluding any fee waivers and/or expense limitations), are set forth according to the most recent publicly available prospectus for the fund and may differ from those disclosed in the Financial highlights table in this report. Net expenses reflect contractual expense limitations in effect until August 31, 2021 and are subject to change. Had the contractual fee waivers and expense limitations not been in place, gross expenses would apply. The expense ratios are as follows:
| Gross (%) | 0.74 |
| Net (%) | 0.40 |
Please refer to the most recent prospectus and annual or semiannual report for more information on expenses and any expense limitation arrangements for the fund.
Multifactor Consumer Staples ETF
AVERAGE ANNUAL TOTAL RETURNS (%)
| Average annual total returns (%) | Cumulative total returns (%) | ||||
| 1-year | Since fund inception1 |
6-month | Since fund inception1 |
||
| Net asset value | 6.20 | 6.12 | 8.64 | 31.41 | |
| Market price | 6.23 | 6.13 | 8.72 | 31.48 | |
| John Hancock Dimensional Consumer Staples Index2 |
6.60 | 6.58 | 8.87 | 34.03 | |
| Russell 1000 Consumer Staples Index3 |
2.46 | 4.48 | 7.53 | 22.33 | |
INDUSTRY COMPOSITION (%)
| Food products | 31.0 |
| Food and staples retailing | 21.8 |
| Beverages | 18.8 |
| Household products | 17.4 |
| Tobacco | 6.5 |
| Chemicals | 3.0 |
| Household durables | 0.9 |
| Personal products | 0.5 |
| Short-term investments and other | 0.1 |
| TOTAL | 100.0 |
| As a percentage of net assets. |
GROWTH OF $10,000
This chart shows what happened to a hypothetical $10,000 investment in John Hancock Multifactor Consumer Staples ETF for the period indicated, assuming all distributions were reinvested. For comparison, we've shown the same investment in two separate indexes.

TOP TEN HOLDINGS4 (%)
| Walmart, Inc. | 6.3 |
| The Procter & Gamble Company | 6.3 |
| The Coca-Cola Company | 6.1 |
| PepsiCo, Inc. | 6.0 |
| Costco Wholesale Corp. | 5.6 |
| The Kroger Company | 4.6 |
| Philip Morris International, Inc. | 3.4 |
| The Clorox Company | 3.1 |
| Altria Group, Inc. | 3.1 |
| Archer-Daniels-Midland Company | 3.1 |
| TOTAL | 47.6 |
The value of a $10,000 investment calculated at market value from inception through period end would be $13,148.
The chart and table above do not reflect the deduction of taxes that a shareholder would pay on fund distributions or the redemption or sale of fund shares.
It is not possible to invest directly in an index. Unlike an index, the fund's total returns are reduced by operating expenses and management fees.
| 1 | From 3-28-16. |
| 2 | The John Hancock Dimensional Consumer Staples Index is designed to comprise securities in the consumer staples sector within the U.S. universe whose market capitalizations are larger than that of the 1001st largest U.S. company at the time of reconstitution. Stocks that compose the index include those that may be considered medium or smaller capitalization company stocks. The index is reconstituted and rebalanced on a semiannual basis. The consumer staples sector is composed of companies involved in areas such as the production, manufacture, distribution or sale of food, beverages, tobacco, household goods, or personal products. The U.S. universe is defined as a free float-adjusted market capitalization-weighted portfolio of U.S. operating companies listed on the New York Stock Exchange (NYSE), NYSE MKT LLC, NASDAQ Global Market, or such other securities exchanges deemed appropriate in accordance with the rules-based methodology that is maintained by Dimensional Fund Advisors LP. |
| 3 | Effective 9/21/20, the underlying components of the Russell 1000 Consumer Staples Index reflect a new company classification methodology. Consequently, the custom blended benchmark's performance consists of 100% of the prior methodology through 9/18/20 and 100% of the current methodology thereafter. |
| 4 | Listed holdings are a portion of the fund's total and may change at any time. They are not recommendations to buy or sell any security. Data is expressed as a percentage of net assets and excludes cash and cash equivalents. |
The expense ratios of the fund, both net (including any fee waivers and/or expense limitations) and gross (excluding any fee waivers and/or expense limitations), are set forth according to the most recent publicly available prospectus for the fund and may differ from those disclosed in the Financial highlights table in this report. Net expenses reflect contractual expense limitations in effect until August 31, 2021 and are subject to change. Had the contractual fee waivers and expense limitations not been in place, gross expenses would apply. The expense ratios are as follows:
| Gross (%) | 0.85 |
| Net (%) | 0.40 |
Please refer to the most recent prospectus and annual or semiannual report for more information on expenses and any expense limitation arrangements for the fund.
Multifactor Developed International ETF
AVERAGE ANNUAL TOTAL RETURNS (%)
| Average annual total returns (%) | Cumulative total returns (%) | ||||
| 1 year | Since fund inception1 |
6-month | Since fund inception1 |
||
| Net asset value | -7.59 | 3.42 | 8.60 | 13.93 | |
| Market price | -6.94 | 3.52 | 10.27 | 14.36 | |
| John Hancock Dimensional Developed International Index2 |
-7.00 | 4.16 | 9.01 | 17.12 | |
| MSCI EAFE Index3 | -6.86 | 4.03 | 8.57 | 16.57 | |
SECTOR COMPOSITION (%)
| Industrials | 16.4 |
| Financials | 14.5 |
| Consumer discretionary | 12.5 |
| Health care | 12.0 |
| Materials | 10.1 |
| Consumer staples | 9.7 |
| Information technology | 7.0 |
| Communication services | 6.5 |
| Utilities | 5.2 |
| Real estate | 3.0 |
| Other | 3.1 |
| TOTAL | 100.0 |
| As a percentage of net assets. |
GROWTH OF $10,000
This chart shows what happened to a hypothetical $10,000 investment in John Hancock Multifactor Developed International ETF for the period indicated, assuming all distributions were reinvested. For comparison, we've shown the same investment in two separate indexes.

TOP TEN HOLDINGS4 (%)
| Nestle SA | 1.8 |
| Toyota Motor Corp. | 1.5 |
| Roche Holding AG | 1.1 |
| Novartis AG | 0.9 |
| Orange SA | 0.8 |
| Lonza Group AG | 0.7 |
| AstraZeneca PLC | 0.7 |
| LVMH Moet Hennessy Louis Vuitton SE | 0.7 |
| Cie Generale des Etablissements Michelin SCA | 0.6 |
| Wolters Kluwer NV | 0.6 |
| TOTAL | 9.4 |
The value of a $10,000 investment calculated at market value from inception through period end would be $11,436.
The chart and table above do not reflect the deduction of taxes that a shareholder would pay on fund distributions or the redemption or sale of fund shares.
It is not possible to invest directly in an index. Unlike an index, the fund's total returns are reduced by operating expenses and management fees.
| 1 | From 12-15-16. |
| 2 | The John Hancock Dimensional Developed International Index is designed to comprise a subset of securities of companies associated with developed markets outside of the United States and Canada. The index is reconstituted and rebalanced on a semiannual basis. |
| 3 | The MSCI Europe, Australasia, and Far East (EAFE) Index comprises securities of publicly traded large- and mid-cap stocks of companies in those regions. |
| 4 | Listed holdings are a portion of the fund's total and may change at any time. They are not recommendations to buy or sell any security. Data is expressed as a percentage of net assets and excludes cash and cash equivalents. |
The expense ratios of the fund, both net (including any fee waivers and/or expense limitations) and gross (excluding any fee waivers and/or expense limitations), are set forth according to the most recent publicly available prospectus for the fund and may differ from those disclosed in the Financial highlights table in this report. Net expenses reflect contractual expense limitations in effect until August 31, 2021 and are subject to change. Had the contractual fee waivers and expense limitations not been in place, gross expenses would apply. The expense ratios are as follows:
| Gross (%) | 0.43 |
| Net (%) | 0.39 |
Please refer to the most recent prospectus and annual or semiannual report for more information on expenses and any expense limitation arrangements for the fund.
Multifactor Emerging Markets ETF
AVERAGE ANNUAL TOTAL RETURNS (%)
| Average annual total returns (%) | Cumulative total returns (%) | ||||
| 1-year | Since fund inception1 |
6-month | Since fund inception1 |
||
| Net asset value | -0.02 | 1.21 | 15.56 | 2.54 | |
| Market price | 0.15 | 1.04 | 18.14 | 2.20 | |
| John Hancock Dimensional Emerging Markets Index2 |
1.01 | 1.76 | 16.39 | 3.73 | |
| MSCI Emerging Markets Index3 | 8.25 | 5.02 | 20.96 | 10.80 | |
SECTOR COMPOSITION (%)
| Financials | 22.1 |
| Information technology | 17.3 |
| Consumer discretionary | 15.8 |
| Communication services | 12.1 |
| Materials | 8.1 |
| Consumer staples | 6.4 |
| Energy | 5.8 |
| Industrials | 4.0 |
| Health care | 3.5 |
| Real estate | 2.9 |
| Other | 2.0 |
| TOTAL | 100.0 |
| As a percentage of net assets. |
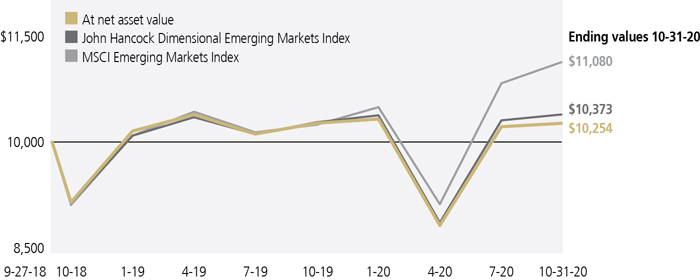
GROWTH OF $10,000
This chart shows what happened to a hypothetical $10,000 investment in John Hancock Multifactor Emerging Markets ETF for the period indicated, assuming all distributions were reinvested. For comparison, we've shown the same investment in two separate indexes.
TOP TEN HOLDINGS4 (%)
| Tencent Holdings, Ltd. | 4.6 |
| Alibaba Group Holding, Ltd., ADR | 4.4 |
| Samsung Electronics Company, Ltd. | 4.2 |
| Taiwan Semiconductor Manufacturing Company, Ltd. | 4.1 |
| China Construction Bank Corp., H Shares | 2.2 |
| Ping An Insurance Group Company of China, Ltd., H Shares | 1.9 |
| JD.com, Inc., ADR | 1.5 |
| Reliance Industries, Ltd. | 1.4 |
| NetEase, Inc., ADR | 1.3 |
| China Mobile, Ltd. | 1.1 |
| TOTAL | 26.7 |
The value of a $10,000 investment calculated at market value from inception through period end would be $10,220.
The chart and table above do not reflect the deduction of taxes that a shareholder would pay on fund distributions or the redemption or sale of fund shares.
It is not possible to invest directly in an index. Unlike an index, the fund's total returns are reduced by operating expenses and management fees.
| 1 | From 9-27-18. |
| 2 | The John Hancock Dimensional Emerging Markets Index is designed to comprise a subset of securities of companies associated with emerging markets, which may include frontier markets (Emerging markets in an earlier stage of development). The index is reconstituted and rebalanced on a semiannual basis. |
| 3 | The MSCI Emerging Markets Index is an unmanaged index designed to measure the performance of developing markets. |
| 4 | Listed holdings are a portion of the fund's total and may change at any time. They are not recommendations to buy or sell any security. Data is expressed as a percentage of net assets and excludes cash and cash equivalents. |
The expense ratios of the fund, both net (including any fee waivers and/or expense limitations) and gross (excluding any fee waivers and/or expense limitations), are set forth according to the most recent publicly available prospectus for the fund and may differ from those disclosed in the Financial highlights table in this report. Net expenses reflect contractual expense limitations in effect until August 31, 2021 and are subject to change. Had the contractual fee waivers and expense limitations not been in place, gross expenses would apply. The expense ratios are as follows:
| Gross (%) | 0.55 |
| Net (%) | 0.49 |
Please refer to the most recent prospectus and annual or semiannual report for more information on expenses and any expense limitation arrangements for the fund.
Multifactor Energy ETF
AVERAGE ANNUAL TOTAL RETURNS (%)
| Average annual total returns (%) | Cumulative total returns (%) | ||||
| 1-year | Since fund inception1 |
6-month | Since fund inception1 |
||
| Net asset value | -48.14 | -14.17 | -20.16 | -50.46 | |
| Market price | -48.38 | -14.25 | -20.50 | -50.68 | |
| John Hancock Dimensional Energy Index2 |
-48.10 | -13.84 | -20.07 | -49.57 | |
| Russell 1000 Energy Index3 | -42.39 | -11.15 | -16.66 | -41.93 | |
INDUSTRY COMPOSITION (%)
| Oil, gas and consumable fuels | 84.0 |
| Energy equipment and services | 12.6 |
| Specialty retail | 2.0 |
| Short-term investments and other | 1.4 |
| TOTAL | 100.0 |
| As a percentage of net assets. |
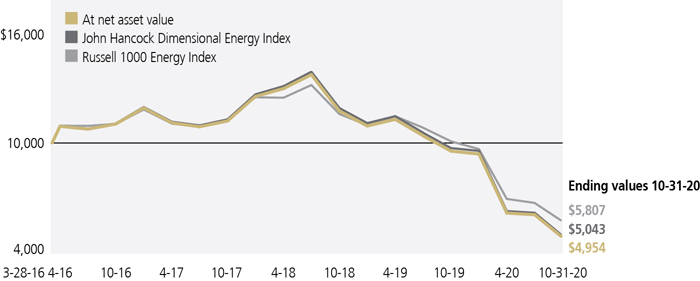
GROWTH OF $10,000
This chart shows what happened to a hypothetical $10,000 investment in John Hancock Multifactor Energy ETF for the period indicated, assuming all distributions were reinvested. For comparison, we've shown the same investment in two separate indexes.
TOP TEN HOLDINGS4 (%)
| Chevron Corp. | 7.6 |
| The Williams Companies, Inc. | 6.8 |
| Kinder Morgan, Inc. | 6.3 |
| Marathon Petroleum Corp. | 6.1 |
| Exxon Mobil Corp. | 6.0 |
| Schlumberger NV | 5.8 |
| ConocoPhillips | 5.5 |
| Valero Energy Corp. | 4.9 |
| EOG Resources, Inc. | 4.9 |
| Halliburton Company | 3.8 |
| TOTAL | 57.7 |
The value of a $10,000 investment calculated at market value from inception through period end would be $4,932.
The chart and table above do not reflect the deduction of taxes that a shareholder would pay on fund distributions or the redemption or sale of fund shares.
It is not possible to invest directly in an index. Unlike an index, the fund's total returns are reduced by operating expenses and management fees.
| 1 | From 3-28-16. |
| 2 | The John Hancock Dimensional Energy Index is designed to comprise securities in the energy sector within the U.S. universe whose market capitalizations are larger than that of the 1001st largest U.S. company at the time of reconstitution. Stocks that compose the index include those that may be considered medium or smaller capitalization company stocks. The index is reconstituted and rebalanced on a semiannual basis. The energy sector is composed of companies involved in areas such as the production, distribution, or sale of alternative fuels, coal, electricity, natural gas, nuclear power, oil, and other forms of energy. The U.S. universe is defined as a free float-adjusted market capitalization-weighted portfolio of U.S. operating companies listed on the New York Stock Exchange (NYSE), NYSE MKT LLC, NASDAQ Global Market, or such other securities exchanges deemed appropriate in accordance with the rules-based methodology that is maintained by Dimensional Fund Advisors LP. |
| 3 | Effective 9/21/20, the underlying components of the Russell 1000 Energy Index reflect a new company classification methodology. Consequently, the custom blended benchmark's performance consists of 100% of the prior methodology through 9/18/20 and 100% of the current methodology thereafter. |
| 4 | Listed holdings are a portion of the fund's total and may change at any time. They are not recommendations to buy or sell any security. Data is expressed as a percentage of net assets and excludes cash and cash equivalents. |
The expense ratios of the fund, both net (including any fee waivers and/or expense limitations) and gross (excluding any fee waivers and/or expense limitations), are set forth according to the most recent publicly available prospectus for the fund and may differ from those disclosed in the Financial highlights table in this report. Net expenses reflect contractual expense limitations in effect until August 31, 2021 and are subject to change. Had the contractual fee waivers and expense limitations not been in place, gross expenses would apply. The expense ratios are as follows:
| Gross (%) | 1.08 |
| Net (%) | 0.40 |
Please refer to the most recent prospectus and annual or semiannual report for more information on expenses and any expense limitation arrangements for the fund.
Multifactor Financials ETF
AVERAGE ANNUAL TOTAL RETURNS (%)
| Average annual total returns (%) | Cumulative total returns (%) | ||||||
| 1-year | 5-year | Since fund inception1 |
6-month | 5-year | Since fund inception1 |
||
| Net asset value | -11.39 | 6.79 | 7.67 | 9.03 | 38.91 | 45.70 | |
| Market price | -11.49 | 6.77 | 7.65 | 8.93 | 38.75 | 45.57 | |
| John Hancock Dimensional Financials Index2 |
-11.07 | 7.27 | 8.15 | 9.27 | 42.01 | 49.02 | |
| Russell 1000 Financial Services Index3 |
-5.78 | 9.03 | 10.02 | 11.85 | 54.05 | 62.67 | |
INDUSTRY COMPOSITION (%)
| Capital markets | 24.6 |
| Insurance | 24.3 |
| Banks | 22.7 |
| IT services | 15.4 |
| Consumer finance | 5.9 |
| Diversified financial services | 4.9 |
| Professional services | 1.6 |
| Thrifts and mortgage finance | 0.4 |
| Software | 0.1 |
| Short-term investments and other | 0.1 |
| TOTAL | 100.0 |
| As a percentage of net assets. |
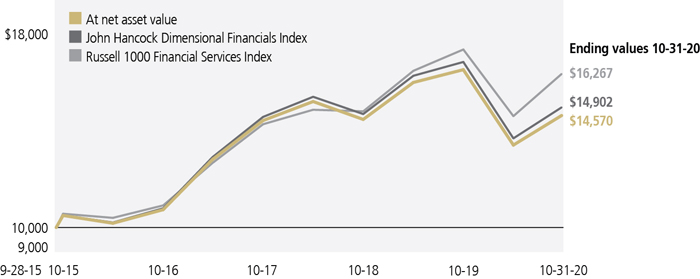
GROWTH OF $10,000
This chart shows what happened to a hypothetical $10,000 investment in John Hancock Multifactor Financials ETF for the period indicated, assuming all distributions were reinvested. For comparison, we've shown the same investment in two separate indexes.
TOP TEN HOLDINGS4 (%)
| JPMorgan Chase & Co. | 4.0 |
| Berkshire Hathaway, Inc., Class B | 3.9 |
| Visa, Inc., Class A | 3.6 |
| Mastercard, Inc., Class A | 3.4 |
| Bank of America Corp. | 3.2 |
| PayPal Holdings, Inc. | 3.0 |
| Morgan Stanley | 1.9 |
| The Charles Schwab Corp. | 1.8 |
| The Travelers Companies, Inc. | 1.7 |
| Citigroup, Inc. | 1.6 |
| TOTAL | 28.1 |
The value of a $10,000 investment calculated at market value from inception through period end would be $14,557.
The chart and table above do not reflect the deduction of taxes that a shareholder would pay on fund distributions or the redemption or sale of fund shares.
It is not possible to invest directly in an index. Unlike an index, the fund's total returns are reduced by operating expenses and management fees.
| 1 | From 9-28-15. |
| 2 | The John Hancock Dimensional Financials Index is designed to comprise securities in the financials sector within the U.S. universe whose market capitalizations are larger than that of the 1001st largest U.S. company at the time of reconstitution. Stocks that compose the index include those that may be considered medium or smaller capitalization company stocks. The index is reconstituted and rebalanced on a semiannual basis. The financials sector is composed of companies in areas such as banking, savings and loans, insurance, consumer finance, investment brokerage, asset management, or other diverse financial services. The U.S. universe is defined as a free float-adjusted market capitalization-weighted portfolio of U.S. operating companies listed on the New York Stock Exchange (NYSE), NYSE MKT LLC, NASDAQ Global Market, or such other securities exchanges deemed appropriate in accordance with the rules-based methodology that is maintained by Dimensional Fund Advisors LP. |
| 3 | Effective 9/21/20, the underlying components of the Russell 1000 Financial Services Index reflect a new company classification methodology. Consequently, the custom blended benchmark's performance consists of 100% of the prior methodology through 9/18/20 and 100% of the current methodology thereafter. |
| 4 | Listed holdings are a portion of the fund's total and may change at any time. They are not recommendations to buy or sell any security. Data is expressed as a percentage of net assets and excludes cash and cash equivalents. |
The expense ratios of the fund, both net (including any fee waivers and/or expense limitations) and gross (excluding any fee waivers and/or expense limitations), are set forth according to the most recent publicly available prospectus for the fund and may differ from those disclosed in the Financial highlights table in this report. Net expenses reflect contractual expense limitations in effect until August 31, 2021 and are subject to change. Had the contractual fee waivers and expense limitations not been in place, gross expenses would apply. The expense ratios are as follows:
| Gross (%) | 0.74 |
| Net (%) | 0.40 |
Please refer to the most recent prospectus and annual or semiannual report for more information on expenses and any expense limitation arrangements for the fund.
Multifactor Healthcare ETF
AVERAGE ANNUAL TOTAL RETURNS (%)
| Average annual total returns (%) | Cumulative total returns (%) | ||||||
| 1-year | 5-year | Since fund inception1 |
6-month | 5-year | Since fund inception1 |
||
| Net asset value | 15.47 | 9.88 | 10.57 | 7.03 | 60.14 | 66.82 | |
| Market price | 15.55 | 9.88 | 10.58 | 7.11 | 60.20 | 66.89 | |
| John Hancock Dimensional Healthcare Index2 |
15.98 | 10.37 | 11.07 | 7.28 | 63.78 | 70.68 | |
| Russell 1000 Healthcare Index3 | 15.92 | 10.61 | 11.67 | 6.82 | 65.58 | 75.42 | |
INDUSTRY COMPOSITION (%)
| Health care equipment and supplies | 26.2 |
| Health care providers and services | 22.3 |
| Pharmaceuticals | 21.1 |
| Biotechnology | 15.8 |
| Life sciences tools and services | 11.6 |
| Health care technology | 2.3 |
| Diversified consumer services | 0.4 |
| Short-term investments and other | 0.3 |
| TOTAL | 100.0 |
| As a percentage of net assets. |
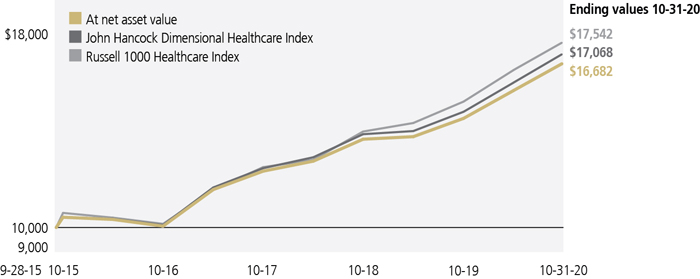
GROWTH OF $10,000
This chart shows what happened to a hypothetical $10,000 investment in John Hancock Multifactor Healthcare ETF for the period indicated, assuming all distributions were reinvested. For comparison, we've shown the same investment in two separate indexes.
TOP TEN HOLDINGS4 (%)
| UnitedHealth Group, Inc. | 5.8 |
| Johnson & Johnson | 5.5 |
| Pfizer, Inc. | 3.8 |
| Merck & Company, Inc. | 3.4 |
| Abbott Laboratories | 2.7 |
| Thermo Fisher Scientific, Inc. | 2.7 |
| Bristol-Myers Squibb Company | 2.2 |
| Medtronic PLC | 2.1 |
| AbbVie, Inc. | 2.1 |
| Amgen, Inc. | 2.0 |
| TOTAL | 32.3 |
The value of a $10,000 investment calculated at market value from inception through period end would be $16,689.
The chart and table above do not reflect the deduction of taxes that a shareholder would pay on fund distributions or the redemption or sale of fund shares.
It is not possible to invest directly in an index. Unlike an index, the fund's total returns are reduced by operating expenses and management fees.
| 1 | From 9-28-15. |
| 2 | The John Hancock Dimensional Healthcare Index is designed to comprise securities in the healthcare sector within the U.S. universe whose market capitalizations are larger than that of the 1001st largest U.S. company at the time of reconstitution. Stocks that compose the index include those that may be considered medium or smaller capitalization company stocks. The index is reconstituted and rebalanced on a semiannual basis. The healthcare sector is composed of companies in areas such as the manufacture of healthcare equipment and supplies, biotechnology, home or long-term healthcare facilities, hospitals, pharmaceuticals, or the provision of basic healthcare services. The U.S. universe is defined as a free float-adjusted market capitalization-weighted portfolio of U.S. operating companies listed on the New York Stock Exchange (NYSE), NYSE MKT LLC, NASDAQ Global Market, or such other securities exchanges deemed appropriate in accordance with the rules-based methodology that is maintained by Dimensional Fund Advisors LP. |
| 3 | Effective 9/21/20, the underlying components of the Russell 1000 Healthcare Index reflect a new company classification methodology. Consequently, the custom blended benchmark's performance consists of 100% of the prior methodology through 9/18/20 and 100% of the current methodology thereafter. |
| 4 | Listed holdings are a portion of the fund's total and may change at any time. They are not recommendations to buy or sell any security. Data is expressed as a percentage of net assets and excludes cash and cash equivalents. |
The expense ratios of the fund, both net (including any fee waivers and/or expense limitations) and gross (excluding any fee waivers and/or expense limitations), are set forth according to the most recent publicly available prospectus for the fund and may differ from those disclosed in the Financial highlights table in this report. Net expenses reflect contractual expense limitations in effect until August 31, 2021 and are subject to change. Had the contractual fee waivers and expense limitations not been in place, gross expenses would apply. The expense ratios are as follows:
| Gross (%) | 0.69 |
| Net (%) | 0.40 |
Please refer to the most recent prospectus and annual or semiannual report for more information on expenses and any expense limitation arrangements for the fund.
Multifactor Industrials ETF
AVERAGE ANNUAL TOTAL RETURNS (%)
| Average annual total returns (%) | Cumulative total returns (%) | ||||
| 1-year | Since fund inception1 |
6-month | Since fund inception1 |
||
| Net asset value | 1.49 | 11.13 | 21.23 | 62.42 | |
| Market price | 1.55 | 11.14 | 21.32 | 62.52 | |
| John Hancock Dimensional Industrials Index2 |
1.86 | 11.63 | 21.51 | 65.84 | |
| Russell 1000 Producer Durables Index3 |
0.73 | 9.95 | 20.72 | 54.63 | |
INDUSTRY COMPOSITION (%)
| Machinery | 22.1 |
| Aerospace and defense | 10.5 |
| Road and rail | 8.9 |
| IT services | 8.3 |
| Electrical equipment | 6.8 |
| Building products | 6.1 |
| Industrial conglomerates | 6.0 |
| Air freight and logistics | 5.5 |
| Household durables | 4.8 |
| Commercial services and supplies | 4.1 |
| Other | 16.9 |
| TOTAL | 100.0 |
| As a percentage of net assets. |
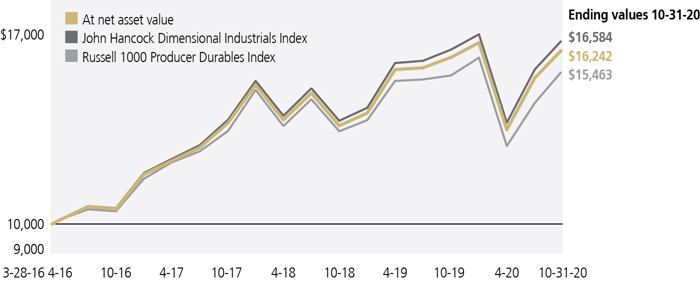
GROWTH OF $10,000
This chart shows what happened to a hypothetical $10,000 investment in John Hancock Multifactor Industrials ETF for the period indicated, assuming all distributions were reinvested. For comparison, we've shown the same investment in two separate indexes.
TOP TEN HOLDINGS4 (%)
| Accenture PLC, Class A | 2.5 |
| Union Pacific Corp. | 2.2 |
| Honeywell International, Inc. | 2.1 |
| Caterpillar, Inc. | 2.0 |
| United Parcel Service, Inc., Class B | 2.0 |
| Cummins, Inc. | 1.9 |
| 3M Company | 1.9 |
| PACCAR, Inc. | 1.8 |
| CSX Corp. | 1.6 |
| Parker-Hannifin Corp. | 1.6 |
| TOTAL | 19.6 |
The value of a $10,000 investment calculated at market value from inception through period end would be $16,252.
The chart and table above do not reflect the deduction of taxes that a shareholder would pay on fund distributions or the redemption or sale of fund shares.
It is not possible to invest directly in an index. Unlike an index, the fund's total returns are reduced by operating expenses and management fees.
| 1 | From 3-28-16. |
| 2 | The John Hancock Dimensional Industrials Index is designed to comprise securities in the industrials sector within the U.S. universe whose market capitalizations are larger than that of the 1001st largest U.S. company at the time of reconstitution. Stocks that compose the index include those that may be considered medium or smaller capitalization company stocks. The index is reconstituted and rebalanced on a semiannual basis. The industrials sector is composed of companies involved in areas such as aerospace and defense, construction and engineering, machinery, building products and equipment, road/rail/air/marine transportation and infrastructure, industrial trading and distribution, and related services. The U.S. universe is defined as a free float-adjusted market-capitalization-weighted portfolio of U.S. operating companies listed on the New York Stock Exchange (NYSE), NYSE MKT LLC, NASDAQ Global Market, or such other securities exchanges deemed appropriate in accordance with the rules-based methodology that is maintained by Dimensional Fund Advisors LP. |
| 3 | Effective 9/21/20, the underlying components of the Russell 1000 Producer Durables Index reflect a new company classification methodology. Consequently, the custom blended benchmark's performance consists of 100% of the prior methodology through 9/18/20 and 100% of the current methodology thereafter. |
| 4 | Listed holdings are a portion of the fund's total and may change at any time. They are not recommendations to buy or sell any security. Data is expressed as a percentage of net assets and excludes cash and cash equivalents. |
The expense ratios of the fund, both net (including any fee waivers and/or expense limitations) and gross (excluding any fee waivers and/or expense limitations), are set forth according to the most recent publicly available prospectus for the fund and may differ from those disclosed in the Financial highlights table in this report. Net expenses reflect contractual expense limitations in effect until August 31, 2021 and are subject to change. Had the contractual fee waivers and expense limitations not been in place, gross expenses would apply. The expense ratios are as follows:
| Gross (%) | 0.88 |
| Net (%) | 0.40 |
Please refer to the most recent prospectus and annual or semiannual report for more information on expenses and any expense limitation arrangements for the fund.
Multifactor Large Cap ETF
AVERAGE ANNUAL TOTAL RETURNS (%)
| Average annual total returns (%) | Cumulative total returns (%) | ||||||
| 1-year | 5-year | Since fund inception1 |
6-month | 5-year | Since fund inception1 |
||
| Net asset value | 6.83 | 10.64 | 11.86 | 14.49 | 65.77 | 76.95 | |
| Market price | 6.90 | 10.66 | 11.88 | 14.76 | 65.93 | 77.12 | |
| John Hancock Dimensional Large Cap Index2 |
7.16 | 10.98 | 12.21 | 14.68 | 68.37 | 79.80 | |
| Russell 1000 Index3 | 10.87 | 11.79 | 13.12 | 14.96 | 74.56 | 87.33 | |
SECTOR COMPOSITION (%)
| Information technology | 23.8 |
| Health care | 14.2 |
| Consumer discretionary | 11.6 |
| Financials | 11.2 |
| Industrials | 11.1 |
| Communication services | 8.6 |
| Consumer staples | 6.4 |
| Utilities | 4.4 |
| Materials | 3.9 |
| Real estate | 3.0 |
| Other | 1.8 |
| TOTAL | 100.0 |
| As a percentage of net assets. |
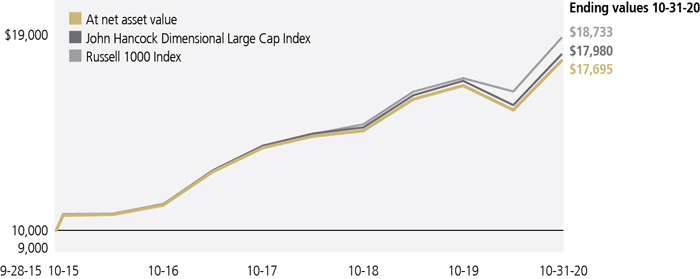
GROWTH OF $10,000
This chart shows what happened to a hypothetical $10,000 investment in John Hancock Multifactor Large Cap ETF for the period indicated, assuming all distributions were reinvested. For comparison, we've shown the same investment in two separate indexes.
TOP TEN HOLDINGS4 (%)
| Apple, Inc. | 3.5 |
| Microsoft Corp. | 3.5 |
| Amazon.com, Inc. | 2.7 |
| Alphabet, Inc., Class A | 1.7 |
| Facebook, Inc., Class A | 1.3 |
| Johnson & Johnson | 0.9 |
| Berkshire Hathaway, Inc., Class B | 0.9 |
| UnitedHealth Group, Inc. | 0.8 |
| The Procter & Gamble Company | 0.8 |
| JPMorgan Chase & Co. | 0.8 |
| TOTAL | 16.9 |
The value of a $10,000 investment calculated at market value from inception through period end would be $17,712.
The chart and table above do not reflect the deduction of taxes that a shareholder would pay on fund distributions or the redemption or sale of fund shares.
It is not possible to invest directly in an index. Unlike an index, the fund's total returns are reduced by operating expenses and management fees.
| 1 | From 9-28-15. |
| 2 | The John Hancock Dimensional Large Cap Index is designed to comprise a subset of securities in the U.S. universe issued by companies whose market capitalizations are larger than that of the 801st largest U.S. company at the time of reconstitution. The index is reconstituted and rebalanced on a semiannual basis. The U.S. universe is defined as a free float-adjusted market capitalization-weighted portfolio of U.S. operating companies listed on the New York Stock Exchange (NYSE), NYSE MKT LLC, NASDAQ Global Market, or such other securities exchanges deemed appropriate in accordance with the rules-based methodology that is maintained by Dimensional Fund Advisors LP. |
| 3 | The Russell 1000 Index comprises 1000 publicly-traded large-cap companies in the United States. |
| 4 | Listed holdings are a portion of the fund's total and may change at any time. They are not recommendations to buy or sell any security. Data is expressed as a percentage of net assets and excludes cash and cash equivalents. |
The expense ratios of the fund, both net (including any fee waivers and/or expense limitations) and gross (excluding any fee waivers and/or expense limitations), are set forth according to the most recent publicly available prospectus for the fund and may differ from those disclosed in the Financial highlights table in this report. Net expenses reflect contractual expense limitations in effect until August 31, 2021 and are subject to change. Had the contractual fee waivers and expense limitations not been in place, gross expenses would apply. The expense ratios are as follows:
| Gross (%) | 0.32 |
| Net (%) | 0.29 |
Please refer to the most recent prospectus and annual or semiannual report for more information on expenses and any expense limitation arrangements for the fund.
Multifactor Materials ETF
AVERAGE ANNUAL TOTAL RETURNS (%)
| Average annual total returns (%) | Cumulative total returns (%) | ||||
| 1-year | Since fund inception1 |
6-month | Since fund inception1 |
||
| Net asset value | 6.40 | 9.01 | 24.38 | 48.66 | |
| Market price | 6.42 | 9.02 | 24.43 | 48.72 | |
| John Hancock Dimensional Materials Index2 |
6.74 | 9.47 | 24.62 | 51.58 | |
| Russell 1000 Materials & Processing Index3 |
9.84 | 10.17 | 24.67 | 56.10 | |
INDUSTRY COMPOSITION (%)
| Chemicals | 51.7 |
| Containers and packaging | 25.0 |
| Metals and mining | 14.5 |
| Construction materials | 6.1 |
| Building products | 1.2 |
| Multi-utilities | 1.0 |
| Software | 0.5 |
| TOTAL | 100.0 |
| As a percentage of net assets. |
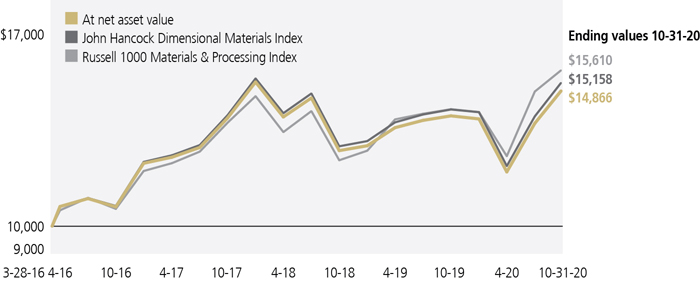
GROWTH OF $10,000
This chart shows what happened to a hypothetical $10,000 investment in John Hancock Multifactor Materials ETF for the period indicated, assuming all distributions were reinvested. For comparison, we've shown the same investment in two separate indexes.
TOP TEN HOLDINGS4 (%)
| PPG Industries, Inc. | 5.2 |
| Linde PLC | 5.2 |
| Air Products & Chemicals, Inc. | 4.4 |
| The Sherwin-Williams Company | 4.4 |
| Newmont Corp. | 4.3 |
| International Paper Company | 4.2 |
| Ball Corp. | 4.0 |
| Dow, Inc. | 3.6 |
| Vulcan Materials Company | 3.6 |
| Freeport-McMoRan, Inc. | 3.6 |
| TOTAL | 42.5 |
The value of a $10,000 investment calculated at market value from inception through period end would be $14,872.
The chart and table above do not reflect the deduction of taxes that a shareholder would pay on fund distributions or the redemption or sale of fund shares.
It is not possible to invest directly in an index. Unlike an index, the fund's total returns are reduced by operating expenses and management fees.
| 1 | From 3-28-16. |
| 2 | The John Hancock Dimensional Materials Index is designed to comprise securities in the materials sector within the U.S. universe whose market capitalizations are larger than that of the 1001st largest U.S. company at the time of reconstitution. Stocks that compose the index include those that may be considered medium or smaller capitalization company stocks. The index is reconstituted and rebalanced on a semiannual basis. The materials sector is composed of companies involved in areas such as chemicals, metals, paper products, containers and packaging, and construction materials. The U.S. universe is defined as a free float-adjusted market capitalization-weighted portfolio of U.S. operating companies listed on the New York Stock Exchange (NYSE), NYSE MKT LLC, NASDAQ Global Market, or such other securities exchanges deemed appropriate in accordance with the rules-based methodology that is maintained by Dimensional Fund Advisors LP. |
| 3 | Effective 9/21/20, the underlying components of the Russell 1000 Materials and Processing Index reflect a new company classification methodology. Consequently, the custom blended benchmark's performance consists of 100% of the prior methodology through 9/18/20 and 100% of the current methodology thereafter. |
| 4 | Listed holdings are a portion of the fund's total and may change at any time. They are not recommendations to buy or sell any security. Data is expressed as a percentage of net assets and excludes cash and cash equivalents. |
The expense ratios of the fund, both net (including any fee waivers and/or expense limitations) and gross (excluding any fee waivers and/or expense limitations), are set forth according to the most recent publicly available prospectus for the fund and may differ from those disclosed in the Financial highlights table in this report. Net expenses reflect contractual expense limitations in effect until August 31, 2021 and are subject to change. Had the contractual fee waivers and expense limitations not been in place, gross expenses would apply. The expense ratios are as follows:
| Gross (%) | 1.04 |
| Net (%) | 0.40 |
Please refer to the most recent prospectus and annual or semiannual report for more information on expenses and any expense limitation arrangements for the fund.
Multifactor Media and Communications ETF
AVERAGE ANNUAL TOTAL RETURNS (%)
| Average annual total returns (%) | Cumulative total returns (%) | ||||
| 1-year | Since fund inception1 |
6-month | Since fund inception1 |
||
| Net asset value | 10.20 | 11.12 | 17.51 | 18.89 | |
| Market price | 10.29 | 11.18 | 17.55 | 19.00 | |
| John Hancock Dimensional Media & Comm Index2 |
10.56 | 11.46 | 17.69 | 19.49 | |
| Russell 1000 Telecommunication Index3 | -11.02 | -2.09 | -6.42 | -3.40 | |
INDUSTRY COMPOSITION (%)
| Media | 33.6 |
| Entertainment | 25.8 |
| Interactive media and services | 21.3 |
| Diversified telecommunication services | 14.1 |
| Wireless telecommunication services | 4.5 |
| Software | 0.6 |
| Short-term investments and other | 0.1 |
| TOTAL | 100.0 |
| As a percentage of net assets. |
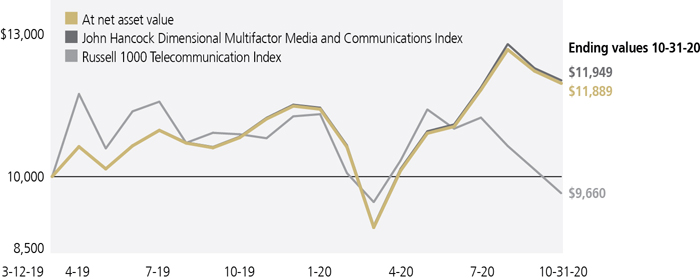
GROWTH OF $10,000
This chart shows what happened to a hypothetical $10,000 investment in John Hancock Multifactor Media and Communications ETF for the period indicated, assuming all distributions were reinvested. For comparison, we've shown the same investment in two separate indexes.
TOP TEN HOLDINGS4 (%)
| Charter Communications, Inc., Class A | 6.2 |
| Verizon Communications, Inc. | 6.1 |
| Comcast Corp., Class A | 5.9 |
| The Walt Disney Company | 5.8 |
| Netflix, Inc. | 5.7 |
| Facebook, Inc., Class A | 5.7 |
| T-Mobile US, Inc. | 4.5 |
| Activision Blizzard, Inc. | 4.2 |
| AT&T, Inc. | 4.1 |
| Liberty Broadband Corp., Series C | 3.3 |
| TOTAL | 51.5 |
The value of a $10,000 investment calculated at market value from inception through period end would be $11,900.
The chart and table above do not reflect the deduction of taxes that a shareholder would pay on fund distributions or the redemption or sale of fund shares.
It is not possible to invest directly in an index. Unlike an index, the fund's total returns are reduced by operating expenses and management fees.
| 1 | From 3-12-19. |
| 2 | The John Hancock Dimensional Media and Communications Index is designed to comprise securities in the media and communications sector within the U.S. Universe whose market capitalizations are larger than that of the 1001st largest U.S. company at the time of reconstitution. |
| 3 | Effective 9/21/20, the underlying components of the Russell 1000 Telecommunication Index reflect a new company classification methodology. Consequently, the custom blended benchmark's performance consists of 100% of the prior methodology through 9/18/20 and 100% of the current methodology thereafter. |
| 4 | Listed holdings are a portion of the fund's total and may change at any time. They are not recommendations to buy or sell any security. Data is expressed as a percentage of net assets and excludes cash and cash equivalents. |
The expense ratios of the fund, both net (including any fee waivers and/or expense limitations) and gross (excluding any fee waivers and/or expense limitations), are set forth according to the most recent publicly available prospectus for the fund and may differ from those disclosed in the Financial highlights table in this report. Net expenses reflect contractual expense limitations in effect until August 31, 2021 and are subject to change. Had the contractual fee waivers and expense limitations not been in place, gross expenses would apply. The expense ratios are as follows:
| Gross (%) | 1.13 |
| Net (%) | 0.40 |
Please refer to the most recent prospectus and annual or semiannual report for more information on expenses and any expense limitation arrangements for the fund.
Multifactor Mid Cap ETF
AVERAGE ANNUAL TOTAL RETURNS (%)
| Average annual total returns (%) | Cumulative total returns (%) | ||||||
| 1-year | 5-year | Since fund inception1 |
6-month | 5-year | Since fund inception1 |
||
| Net asset value | 3.35 | 8.93 | 9.74 | 18.02 | 53.34 | 60.52 | |
| Market price | 3.41 | 8.94 | 9.75 | 18.11 | 53.43 | 60.64 | |
| John Hancock Dimensional Mid Cap Index2 |
3.75 | 9.37 | 10.19 | 18.28 | 56.51 | 63.90 | |
| Russell Midcap Index3 | 4.12 | 8.95 | 9.81 | 17.83 | 53.53 | 61.08 | |
SECTOR COMPOSITION (%)
| Information technology | 19.8 |
| Health care | 15.3 |
| Industrials | 14.7 |
| Consumer discretionary | 12.3 |
| Financials | 12.1 |
| Materials | 6.4 |
| Utilities | 5.3 |
| Real estate | 5.1 |
| Communication services | 3.8 |
| Consumer staples | 3.6 |
| Other | 1.6 |
| TOTAL | 100.0 |
| As a percentage of net assets. |
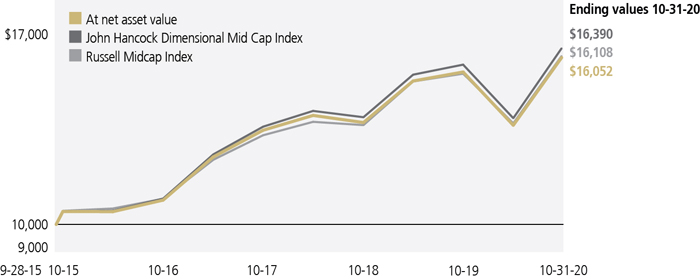
GROWTH OF $10,000
This chart shows what happened to a hypothetical $10,000 investment in John Hancock Multifactor Mid Cap ETF for the period indicated, assuming all distributions were reinvested. For comparison, we've shown the same investment in two separate indexes.
TOP TEN HOLDINGS4 (%)
| Cadence Design Systems, Inc. | 0.5 |
| Align Technology, Inc. | 0.5 |
| Best Buy Company, Inc. | 0.5 |
| Parker-Hannifin Corp. | 0.5 |
| Skyworks Solutions, Inc. | 0.4 |
| Rockwell Automation, Inc. | 0.4 |
| ANSYS, Inc. | 0.4 |
| ResMed, Inc. | 0.4 |
| Ball Corp. | 0.4 |
| Marvell Technology Group, Ltd. | 0.4 |
| TOTAL | 4.4 |
The value of a $10,000 investment calculated at market value from inception through period end would be $16,064.
The chart and table above do not reflect the deduction of taxes that a shareholder would pay on fund distributions or the redemption or sale of fund shares.
It is not possible to invest directly in an index. Unlike an index, the fund's total returns are reduced by operating expenses and management fees.
| 1 | From 9-28-15. |
| 2 | The John Hancock Dimensional Mid Cap Index is designed to comprise a subset of securities in the U.S. universe issued by companies whose market capitalizations are between the 200th and 951st largest U.S. companies at the time of reconstitution. The index is reconstituted and rebalanced on a semiannual basis. The U.S. universe is defined as a free float-adjusted market capitalization-weighted portfolio of U.S. operating companies listed on the New York Stock Exchange (NYSE), NYSE MKT LLC, NASDAQ Global Market, or such other securities exchanges deemed appropriate in accordance with the rules-based methodology that is maintained by Dimensional Fund Advisors LP. |
| 3 | The Russell Midcap Index comprises approximately 800 publicly-traded mid-cap companies in the United States. |
| 4 | Listed holdings are a portion of the fund's total and may change at any time. They are not recommendations to buy or sell any security. Data is expressed as a percentage of net assets and excludes cash and cash equivalents. |
The expense ratios of the fund, both net (including any fee waivers and/or expense limitations) and gross (excluding any fee waivers and/or expense limitations), are set forth according to the most recent publicly available prospectus for the fund and may differ from those disclosed in the Financial highlights table in this report. Net expenses reflect contractual expense limitations in effect until August 31, 2021 and are subject to change. Had the contractual fee waivers and expense limitations not been in place, gross expenses would apply. The expense ratios are as follows:
| Gross (%) | 0.43 |
| Net (%) | 0.42 |
Please refer to the most recent prospectus and annual or semiannual report for more information on expenses and any expense limitation arrangements for the fund.
Multifactor Small Cap ETF
AVERAGE ANNUAL TOTAL RETURNS (%)
| Average annual total returns (%) | Cumulative total returns (%) | ||||
| 1-year | Since fund inception1 |
6-month | Since fund inception1 |
||
| Net asset value | -5.15 | 0.89 | 15.35 | 2.67 | |
| Market price | -5.12 | 0.92 | 15.52 | 2.76 | |
| John Hancock Dimensional Small Cap Index2 |
-4.89 | 1.29 | 15.56 | 3.90 | |
| Russell 2000 Index3 | -0.14 | 2.74 | 18.13 | 8.39 | |
SECTOR COMPOSITION (%)
| Industrials | 17.1 |
| Financials | 17.0 |
| Information technology | 14.6 |
| Consumer discretionary | 14.3 |
| Health care | 12.7 |
| Real estate | 9.0 |
| Utilities | 4.6 |
| Materials | 3.9 |
| Consumer staples | 3.1 |
| Communication services | 1.9 |
| Other | 1.8 |
| TOTAL | 100.0 |
| As a percentage of net assets. |
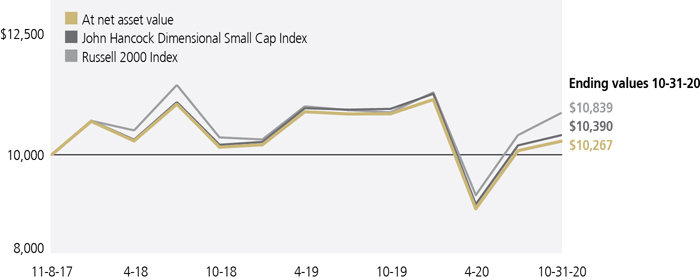
GROWTH OF $10,000
This chart shows what happened to a hypothetical $10,000 investment in John Hancock Multifactor Small Cap ETF for the period indicated, assuming all distributions were reinvested. For comparison, we've shown the same investment in two separate indexes.
TOP TEN HOLDINGS4 (%)
| Tapestry, Inc. | 0.7 |
| Blueprint Medicines Corp. | 0.6 |
| Eaton Vance Corp. | 0.6 |
| Arrowhead Pharmaceuticals, Inc. | 0.6 |
| Hanesbrands, Inc. | 0.6 |
| Invesco, Ltd. | 0.6 |
| CoreLogic, Inc. | 0.6 |
| Arena Pharmaceuticals, Inc. | 0.6 |
| Darling Ingredients, Inc. | 0.6 |
| United Therapeutics Corp. | 0.6 |
| TOTAL | 6.1 |
The value of a $10,000 investment calculated at market value from inception through period end would be $10,276.
The chart and table above do not reflect the deduction of taxes that a shareholder would pay on fund distributions or the redemption or sale of fund shares.
It is not possible to invest directly in an index. Unlike an index, the fund's total returns are reduced by operating expenses and management fees.
| 1 | From 11-8-17. |
| 2 | The John Hancock Dimensional Small Cap Index is designed to comprise a subset of securities in the U.S. universe issued by companies whose market capitalizations are smaller than the 750th largest U.S. company but excluding the smallest 4% of U.S. companies at the time of reconstitution. The index is reconstituted and rebalanced on a semiannual basis. The U.S. universe is defined as a free float-adjusted market capitalization-weighted portfolio of U.S. operating companies listed on the New York Stock Exchange (NYSE), NYSE American, LLC, NASDAQ Global Market, or such other securities exchanges deemed appropriate in accordance with the rules-based methodology that is maintained by Dimensional Fund Advisors LP. |
| 3 | The Russell 2000 Index comprises 2000 publicly-traded small-cap companies in the United States. |
| 4 | Listed holdings are a portion of the fund's total and may change at any time. They are not recommendations to buy or sell any security. Data is expressed as a percentage of net assets and excludes cash and cash equivalents. |
The expense ratios of the fund, both net (including any fee waivers and/or expense limitations) and gross (excluding any fee waivers and/or expense limitations), are set forth according to the most recent publicly available prospectus for the fund and may differ from those disclosed in the Financial highlights table in this report. Net expenses reflect contractual expense limitations in effect until August 31, 2021 and are subject to change. Had the contractual fee waivers and expense limitations not been in place, gross expenses would apply. The expense ratios are as follows:
| Gross (%) | 0.45 |
| Net (%) | 0.42 |
Please refer to the most recent prospectus and annual or semiannual report for more information on expenses and any expense limitation arrangements for the fund.
Multifactor Technology ETF
AVERAGE ANNUAL TOTAL RETURNS (%)
| Average annual total returns (%) | Cumulative total returns (%) | ||||||
| 1-year | 5-year | Since fund inception1 |
6-month | 5-year | Since fund inception1 |
||
| Net asset value | 27.59 | 20.13 | 21.78 | 22.01 | 150.22 | 172.77 | |
| Market price | 27.63 | 20.13 | 21.79 | 22.24 | 150.15 | 172.91 | |
| John Hancock Dimensional Technology Index2 |
28.07 | 20.54 | 22.20 | 22.29 | 154.52 | 177.59 | |
| Russell 1000 Technology Index3 | 38.60 | 23.29 | 25.09 | 24.47 | 184.81 | 212.77 | |
INDUSTRY COMPOSITION (%)
| Software | 36.4 |
| Semiconductors and semiconductor equipment | 32.7 |
| Technology hardware, storage and peripherals | 8.9 |
| Electronic equipment, instruments and components | 8.2 |
| IT services | 7.9 |
| Communications equipment | 4.9 |
| Electrical equipment | 0.5 |
| Interactive media and services | 0.5 |
| TOTAL | 100.0 |
| As a percentage of net assets. |
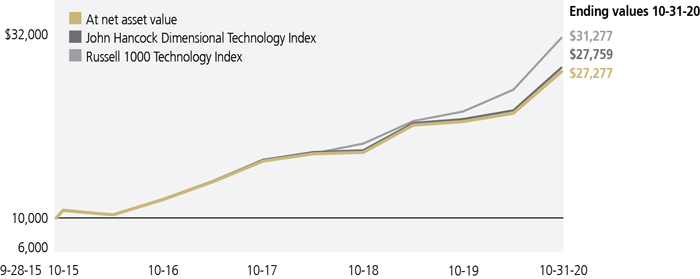
GROWTH OF $10,000
This chart shows what happened to a hypothetical $10,000 investment in John Hancock Multifactor Technology ETF for the period indicated, assuming all distributions were reinvested. For comparison, we've shown the same investment in two separate indexes.
TOP TEN HOLDINGS4 (%)
| Microsoft Corp. | 5.7 |
| Apple, Inc. | 5.3 |
| NVIDIA Corp. | 3.3 |
| Intel Corp. | 3.3 |
| salesforce.com, Inc. | 2.9 |
| Adobe, Inc. | 2.7 |
| Texas Instruments, Inc. | 2.5 |
| Broadcom, Inc. | 2.3 |
| Cisco Systems, Inc. | 2.3 |
| Oracle Corp. | 2.3 |
| TOTAL | 32.6 |
The value of a $10,000 investment calculated at market value from inception through period end would be $27,291.
The chart and table above do not reflect the deduction of taxes that a shareholder would pay on fund distributions or the redemption or sale of fund shares.
It is not possible to invest directly in an index. Unlike an index, the fund's total returns are reduced by operating expenses and management fees.
| 1 | From 9-28-15. |
| 2 | The John Hancock Dimensional Technology Index is designed to comprise securities in the technology sector within the U.S. universe whose market capitalizations are larger than that of the 1001st largest U.S. company at the time of reconstitution. Stocks that compose the index include those that may be considered medium or smaller capitalization company stocks. The index is reconstituted and rebalanced on a semiannual basis. The technology sector is composed of companies in areas such as the creation, development or provision of software, hardware, internet services, database management, information technology consulting and services, data processing, or semi-conductors. The U.S. universe is defined as a free float-adjusted market-capitalization-weighted portfolio of U.S. operating companies listed on the New York Stock Exchange (NYSE), NYSE MKT LLC, NASDAQ Global Market, or such other securities exchanges deemed appropriate in accordance with the rules-based methodology that is maintained by Dimensional Fund Advisors LP. |
| 3 | Effective 9/21/20, the underlying components of the Russell 1000 Technology Index reflect a new company classification methodology. Consequently, the custom blended benchmark's performance consists of 100% of the prior methodology through 9/18/20 and 100% of the current methodology thereafter. |
| 4 | Listed holdings are a portion of the fund's total and may change at any time. They are not recommendations to buy or sell any security. Data is expressed as a percentage of net assets and excludes cash and cash equivalents. |
The expense ratios of the fund, both net (including any fee waivers and/or expense limitations) and gross (excluding any fee waivers and/or expense limitations), are set forth according to the most recent publicly available prospectus for the fund and may differ from those disclosed in the Financial highlights table in this report. Net expenses reflect contractual expense limitations in effect until August 31, 2021 and are subject to change. Had the contractual fee waivers and expense limitations not been in place, gross expenses would apply. The expense ratios are as follows:
| Gross (%) | 0.67 |
| Net (%) | 0.40 |
Please refer to the most recent prospectus and annual or semiannual report for more information on expenses and any expense limitation arrangements for the fund.
Multifactor Utilities ETF
AVERAGE ANNUAL TOTAL RETURNS (%)
| Average annual total returns (%) | Cumulative total returns (%) | ||||
| 1-year | Since fund inception1 |
6-month | Since fund inception1 |
||
| Net asset value | -6.90 | 7.24 | 7.21 | 37.88 | |
| Market price | -6.91 | 7.24 | 7.17 | 37.89 | |
| John Hancock Dimensional Utilities Index2 |
-6.60 | 7.73 | 7.39 | 40.84 | |
| Russell 1000 Utilities Index3 | -0.79 | 7.25 | 10.08 | 37.95 | |
INDUSTRY COMPOSITION (%)
| Electric utilities | 55.6 |
| Multi-utilities | 31.7 |
| Independent power and renewable electricity producers | 4.5 |
| Water utilities | 4.4 |
| Gas utilities | 3.7 |
| Short-term investments and other | 0.1 |
| TOTAL | 100.0 |
| As a percentage of net assets. |
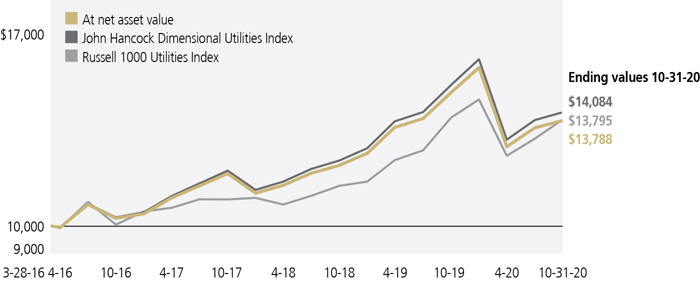
GROWTH OF $10,000
This chart shows what happened to a hypothetical $10,000 investment in John Hancock Multifactor Utilities ETF for the period indicated, assuming all distributions were reinvested. For comparison, we've shown the same investment in two separate indexes.
TOP TEN HOLDINGS4 (%)
| Duke Energy Corp. | 6.4 |
| The Southern Company | 5.1 |
| Public Service Enterprise Group, Inc. | 4.7 |
| PPL Corp. | 4.7 |
| Entergy Corp. | 4.4 |
| Consolidated Edison, Inc. | 4.3 |
| Exelon Corp. | 4.3 |
| NextEra Energy, Inc. | 4.3 |
| WEC Energy Group, Inc. | 4.0 |
| DTE Energy Company | 3.9 |
| TOTAL | 46.1 |
The value of a $10,000 investment calculated at market value from inception through period end would be $13,789.
The chart and table above do not reflect the deduction of taxes that a shareholder would pay on fund distributions or the redemption or sale of fund shares.
It is not possible to invest directly in an index. Unlike an index, the fund's total returns are reduced by operating expenses and management fees.
| 1 | From 3-28-16. |
| 2 | The John Hancock Dimensional Utilities Index is designed to comprise securities in the utilities sector within the U.S. universe whose market capitalizations are larger than that of the 1001st largest U.S. company at the time of reconstitution. Stocks that compose the index include those that may be considered medium or smaller capitalization company stocks. The index is reconstituted and rebalanced on a semiannual basis. The utilities sector is composed of companies involved in areas such as the provision of gas, electric, and water power, energy trading, or the provision of related infrastructure or services. The U.S. universe is defined as a free float-adjusted market capitalization-weighted portfolio of U.S. operating companies listed on the New York Stock Exchange (NYSE), NYSE MKT LLC, NASDAQ Global Market, or such other securities exchanges deemed appropriate in accordance with the rules-based methodology that is maintained by Dimensional Fund Advisors LP. |
| 3 | Effective 9/21/20, the underlying components of the Russell 1000 Utilities Index reflect a new company classification methodology. Consequently, the custom blended benchmark's performance consists of 100% of the prior methodology through 9/18/20 and 100% of the current methodology thereafter. |
| 4 | Listed holdings are a portion of the fund's total and may change at any time. They are not recommendations to buy or sell any security. Data is expressed as a percentage of net assets and excludes cash and cash equivalents. |
The expense ratios of the fund, both net (including any fee waivers and/or expense limitations) and gross (excluding any fee waivers and/or expense limitations), are set forth according to the most recent publicly available prospectus for the fund and may differ from those disclosed in the Financial highlights table in this report. Net expenses reflect contractual expense limitations in effect until August 31, 2021 and are subject to change. Had the contractual fee waivers and expense limitations not been in place, gross expenses would apply. The expense ratios are as follows:
| Gross (%) | 0.79 |
| Net (%) | 0.40 |
Please refer to the most recent prospectus and annual or semiannual report for more information on expenses and any expense limitation arrangements for the fund.
Premium/discount analysis (unaudited)
ETF shares are bought and sold through exchange trading at market price—not net asset value (NAV)—and are not individually redeemed from the fund. Due to various factors, shares may trade at a premium or discount to their NAV in the secondary market, and as a result you may pay more than NAV when you buy shares and receive less than NAV when you sell shares. Additionally, due to various factors, a fund's holdings and returns may deviate from those of its index. These variations may be greater when markets are volatile or subject to unusual conditions.
A premium exists when the closing market price is trading above NAV, while a discount indicates that the closing market price is trading below NAV. The differences are expressed as basis points, with one basis point equaling 1/100 of 1%.
The chart below presents information about the differences between each fund's daily closing market price and the fund's NAV. The closing market price is determined using the bid/ask midpoint as reported on the NYSE Arca, Inc., at 4 P.M. Eastern time, when the NAV is typically calculated.
Data presented represents past performance and cannot be used to predict future results.
PERIOD ENDED
OCTOBER 31, 2020
| Closing Price Below NAV | Closing Price Above or Equal to NAV | ||||||||||
| Basis Point Differential | Number of Days | % of Total Days | Number of Days | % of Total Days | |||||||
| Multifactor Consumer Discretionary ETF | |||||||||||
| 0 - < 25 | 56 | 43.75% | 72 | 56.25% | |||||||
| 25 - < 50 | 0 | 0.00% | 0 | 0.00% | |||||||
| 50 - < 75 | 0 | 0.00% | 0 | 0.00% | |||||||
| 75 - < 100 | 0 | 0.00% | 0 | 0.00% | |||||||
| 100 or Above | 0 | 0.00% | 0 | 0.00% | |||||||
| Total | 56 | 43.75% | 72 | 56.25% | |||||||
| Multifactor Consumer Staples ETF | |||||||||||
| 0 - < 25 | 48 | 37.50% | 80 | 62.50% | |||||||
| 25 - < 50 | 0 | 0.00% | 0 | 0.00% | |||||||
| 50 - < 75 | 0 | 0.00% | 0 | 0.00% | |||||||
| 75 - < 100 | 0 | 0.00% | 0 | 0.00% | |||||||
| 100 or Above | 0 | 0.00% | 0 | 0.00% | |||||||
| Total | 48 | 37.50% | 80 | 62.50% | |||||||
| Multifactor Developed International ETF | |||||||||||
| 0 - < 25 | 26 | 20.31% | 24 | 18.75% | |||||||
| 25 - < 50 | 18 | 14.06% | 10 | 7.81% | |||||||
| 50 - < 75 | 18 | 14.06% | 6 | 4.69% | |||||||
| 75 - < 100 | 7 | 5.47% | 2 | 1.56% | |||||||
| 100 or Above | 15 | 11.72% | 2 | 1.56% | |||||||
| Total | 84 | 65.62% | 44 | 34.37% | |||||||
| Multifactor Emerging Markets ETF | |||||||||||
| 0 - < 25 | 23 | 17.97% | 17 | 13.28% | |||||||
| 25 - < 50 | 19 | 14.84% | 10 | 7.81% | |||||||
| 50 - < 75 | 20 | 15.63% | 5 | 3.91% | |||||||
| 75 - < 100 | 12 | 9.38% | 1 | 0.78% | |||||||
| 100 or Above | 19 | 14.84% | 2 | 1.56% | |||||||
| Total | 93 | 72.66% | 35 | 27.34% | |||||||
| Multifactor Energy ETF | |||||||||||
| 0 - < 25 | 51 | 39.84% | 67 | 52.34% | |||||||
| 25 - < 50 | 3 | 2.34% | 7 | 5.47% | |||||||
| 50 - < 75 | 0 | 0.00% | 0 | 0.00% | |||||||
| 75 - < 100 | 0 | 0.00% | 0 | 0.00% | |||||||
| 100 or Above | 0 | 0.00% | 0 | 0.00% | |||||||
| Total | 54 | 42.18% | 74 | 57.81% | |||||||
PERIOD ENDED
OCTOBER 31, 2020
| Closing Price Below NAV | Closing Price Above or Equal to NAV | ||||||||||
| Basis Point Differential | Number of Days | % of Total Days | Number of Days | % of Total Days | |||||||
| Multifactor Financials ETF | |||||||||||
| 0 - < 25 | 95 | 74.22% | 30 | 23.44% | |||||||
| 25 - < 50 | 3 | 2.34% | 0 | 0.00% | |||||||
| 50 - < 75 | 0 | 0.00% | 0 | 0.00% | |||||||
| 75 - < 100 | 0 | 0.00% | 0 | 0.00% | |||||||
| 100 or Above | 0 | 0.00% | 0 | 0.00% | |||||||
| Total | 98 | 76.56% | 30 | 23.44% | |||||||
| Multifactor Healthcare ETF | |||||||||||
| 0 - < 25 | 81 | 63.28% | 47 | 36.72% | |||||||
| 25 - < 50 | 0 | 0.00% | 0 | 0.00% | |||||||
| 50 - < 75 | 0 | 0.00% | 0 | 0.00% | |||||||
| 75 - < 100 | 0 | 0.00% | 0 | 0.00% | |||||||
| 100 or Above | 0 | 0.00% | 0 | 0.00% | |||||||
| Total | 81 | 63.28% | 47 | 36.72% | |||||||
| Multifactor Industrials ETF | |||||||||||
| 0 - < 25 | 80 | 62.50% | 47 | 36.72% | |||||||
| 25 - < 50 | 0 | 0.00% | 0 | 0.00% | |||||||
| 50 - < 75 | 0 | 0.00% | 1 | 0.78% | |||||||
| 75 - < 100 | 0 | 0.00% | 0 | 0.00% | |||||||
| 100 or Above | 0 | 0.00% | 0 | 0.00% | |||||||
| Total | 80 | 62.50% | 48 | 37.50% | |||||||
| Multifactor Large Cap ETF | |||||||||||
| 0 - < 25 | 78 | 60.94% | 50 | 39.06% | |||||||
| 25 - < 50 | 0 | 0.00% | 0 | 0.00% | |||||||
| 50 - < 75 | 0 | 0.00% | 0 | 0.00% | |||||||
| 75 - < 100 | 0 | 0.00% | 0 | 0.00% | |||||||
| 100 or Above | 0 | 0.00% | 0 | 0.00% | |||||||
| Total | 78 | 60.94% | 50 | 39.06% | |||||||
| Multifactor Materials ETF | |||||||||||
| 0 - < 25 | 31 | 24.22% | 97 | 75.78% | |||||||
| 25 - < 50 | 0 | 0.00% | 0 | 0.00% | |||||||
| 50 - < 75 | 0 | 0.00% | 0 | 0.00% | |||||||
| 75 - < 100 | 0 | 0.00% | 0 | 0.00% | |||||||
| 100 or Above | 0 | 0.00% | 0 | 0.00% | |||||||
| Total | 31 | 24.22% | 97 | 75.78% | |||||||
| Multifactor Media and Communications ETF | |||||||||||
| 0 - < 25 | 31 | 24.22% | 97 | 75.78% | |||||||
| 25 - < 50 | 0 | 0.00% | 0 | 0.00% | |||||||
| 50 - < 75 | 0 | 0.00% | 0 | 0.00% | |||||||
| 75 - < 100 | 0 | 0.00% | 0 | 0.00% | |||||||
| 100 or Above | 0 | 0.00% | 0 | 0.00% | |||||||
| Total | 31 | 24.22% | 97 | 75.78% | |||||||
| Multifactor Mid Cap ETF | |||||||||||
| 0 - < 25 | 32 | 25.00% | 96 | 75.00% | |||||||
| 25 - < 50 | 0 | 0.00% | 0 | 0.00% | |||||||
| 50 - < 75 | 0 | 0.00% | 0 | 0.00% | |||||||
| 75 - < 100 | 0 | 0.00% | 0 | 0.00% | |||||||
| 100 or Above | 0 | 0.00% | 0 | 0.00% | |||||||
| Total | 32 | 25.00% | 96 | 75.00% | |||||||
PERIOD ENDED
OCTOBER 31, 2020
| Closing Price Below NAV | Closing Price Above or Equal to NAV | ||||||||||
| Basis Point Differential | Number of Days | % of Total Days | Number of Days | % of Total Days | |||||||
| Multifactor Small Cap ETF | |||||||||||
| 0 - < 25 | 59 | 46.09% | 69 | 53.91% | |||||||
| 25 - < 50 | 0 | 0.00% | 0 | 0.00% | |||||||
| 50 - < 75 | 0 | 0.00% | 0 | 0.00% | |||||||
| 75 - < 100 | 0 | 0.00% | 0 | 0.00% | |||||||
| 100 or Above | 0 | 0.00% | 0 | 0.00% | |||||||
| Total | 59 | 46.09% | 69 | 53.91% | |||||||
| Multifactor Technology ETF | |||||||||||
| 0 - < 25 | 67 | 52.34% | 60 | 46.88% | |||||||
| 25 - < 50 | 0 | 0.00% | 1 | 0.78% | |||||||
| 50 - < 75 | 0 | 0.00% | 0 | 0.00% | |||||||
| 75 - < 100 | 0 | 0.00% | 0 | 0.00% | |||||||
| 100 or Above | 0 | 0.00% | 0 | 0.00% | |||||||
| Total | 67 | 52.34% | 61 | 47.66% | |||||||
| Multifactor Utilities ETF | |||||||||||
| 0 - < 25 | 75 | 58.59% | 52 | 40.63% | |||||||
| 25 - < 50 | 0 | 0.00% | 1 | 0.78% | |||||||
| 50 - < 75 | 0 | 0.00% | 0 | 0.00% | |||||||
| 75 - < 100 | 0 | 0.00% | 0 | 0.00% | |||||||
| 100 or Above | 0 | 0.00% | 0 | 0.00% | |||||||
| Total | 75 | 58.59% | 53 | 41.41% | |||||||
| Your expenses |
| Account
value on 5-1-2020 |
Ending
value on 10-31-2020 |
Expenses
paid during 10-31-20201 |
Annualized
expense ratio | |
| Multifactor Consumer Discretionary ETF | ||||
| Actual expenses/actual returns | $1,000.00 | $1,280.90 | $2.30 | 0.40% |
| Hypothetical example for comparison purposes | 1,000.00 | 1,023.20 | 2.04 | 0.40% |
| Multifactor Consumer Staples ETF | ||||
| Actual expenses/actual returns | $1,000.00 | $1,086.40 | $2.10 | 0.40% |
| Hypothetical example for comparison purposes | 1,000.00 | 1,023.20 | 2.04 | 0.40% |
| Multifactor Developed International ETF | ||||
| Actual expenses/actual returns | $1,000.00 | $1,086.00 | $2.05 | 0.39% |
| Hypothetical example for comparison purposes | 1,000.00 | 1,023.20 | 1.99 | 0.39% |
| Multifactor Emerging Markets ETF | ||||
| Actual expenses/actual returns | $1,000.00 | $1,155.60 | $2.66 | 0.49% |
| Hypothetical example for comparison purposes | 1,000.00 | 1,022.70 | 2.49 | 0.49% |
| 22 | JOHN HANCOCK MULTIFACTOR ETFS | SEMIANNUAL |
| Account
value on 5-1-2020 |
Ending
value on 10-31-2020 |
Expenses
paid during 10-31-20201 |
Annualized
expense ratio | |
| Multifactor Energy ETF | ||||
| Actual expenses/actual returns | $1,000.00 | $ 798.40 | $1.81 | 0.40% |
| Hypothetical example for comparison purposes | 1,000.00 | 1,023.20 | 2.04 | 0.40% |
| Multifactor Financials ETF | ||||
| Actual expenses/actual returns | $1,000.00 | $1,090.30 | $2.11 | 0.40% |
| Hypothetical example for comparison purposes | 1,000.00 | 1,023.20 | 2.04 | 0.40% |
| Multifactor Healthcare ETF | ||||
| Actual expenses/actual returns | $1,000.00 | $1,070.30 | $2.09 | 0.40% |
| Hypothetical example for comparison purposes | 1,000.00 | 1,023.20 | 2.04 | 0.40% |
| Multifactor Industrials ETF | ||||
| Actual expenses/actual returns | $1,000.00 | $1,212.30 | $2.23 | 0.40% |
| Hypothetical example for comparison purposes | 1,000.00 | 1,023.20 | 2.04 | 0.40% |
| Multifactor Large Cap ETF | ||||
| Actual expenses/actual returns | $1,000.00 | $1,144.90 | $1.57 | 0.29% |
| Hypothetical example for comparison purposes | 1,000.00 | 1,023.70 | 1.48 | 0.29% |
| Multifactor Materials ETF | ||||
| Actual expenses/actual returns | $1,000.00 | $1,243.80 | $2.26 | 0.40% |
| Hypothetical example for comparison purposes | 1,000.00 | 1,023.20 | 2.04 | 0.40% |
| Multifactor Media and Communications ETF | ||||
| Actual expenses/actual returns | $1,000.00 | $1,175.10 | $2.19 | 0.40% |
| Hypothetical example for comparison purposes | 1,000.00 | 1,023.10 | 2.03 | 0.40% |
| Multifactor Mid Cap ETF | ||||
| Actual expenses/actual returns | $1,000.00 | $1,180.20 | $2.31 | 0.42% |
| Hypothetical example for comparison purposes | 1,000.00 | 1,023.10 | 2.14 | 0.42% |
| Multifactor Small Cap ETF | ||||
| Actual expenses/actual returns | $1,000.00 | $1,153.50 | $2.27 | 0.42% |
| Hypothetical example for comparison purposes | 1,000.00 | 1,023.00 | 2.14 | 0.42% |
| Multifactor Technology ETF | ||||
| Actual expenses/actual returns | $1,000.00 | $1,220.10 | $2.24 | 0.40% |
| Hypothetical example for comparison purposes | 1,000.00 | 1,023.20 | 2.04 | 0.40% |
| Multifactor Utilities ETF | ||||
| Actual expenses/actual returns | $1,000.00 | $1,072.10 | $2.09 | 0.40% |
| Hypothetical example for comparison purposes | 1,000.00 | 1,023.20 | 2.04 | 0.40% |
| 1 | Expenses are equal to the annualized expense ratio, multiplied by the average account value over the period, multiplied by 184/365 (to reflect the one-half year period). |
| SEMIANNUAL | JOHN HANCOCK MULTIFACTOR ETFS | 23 |
| Funds' investments |
| 24 | JOHN HANCOCK MULTIFACTOR ETFS | SEMIANNUAL REPORT | SEE NOTES TO FINANCIAL STATEMENTS |
| SEE NOTES TO FINANCIAL STATEMENTS | SEMIANNUAL REPORT | JOHN HANCOCK MULTIFACTOR ETFS | 25 |
| 26 | JOHN HANCOCK MULTIFACTOR ETFS | SEMIANNUAL REPORT | SEE NOTES TO FINANCIAL STATEMENTS |
| SEE NOTES TO FINANCIAL STATEMENTS | SEMIANNUAL REPORT | JOHN HANCOCK MULTIFACTOR ETFS | 27 |
| 28 | JOHN HANCOCK MULTIFACTOR ETFS | SEMIANNUAL REPORT | SEE NOTES TO FINANCIAL STATEMENTS |
| SEE NOTES TO FINANCIAL STATEMENTS | SEMIANNUAL REPORT | JOHN HANCOCK MULTIFACTOR ETFS | 29 |
| 30 | JOHN HANCOCK MULTIFACTOR ETFS | SEMIANNUAL REPORT | SEE NOTES TO FINANCIAL STATEMENTS |
| SEE NOTES TO FINANCIAL STATEMENTS | SEMIANNUAL REPORT | JOHN HANCOCK MULTIFACTOR ETFS | 31 |
| 32 | JOHN HANCOCK MULTIFACTOR ETFS | SEMIANNUAL REPORT | SEE NOTES TO FINANCIAL STATEMENTS |
| SEE NOTES TO FINANCIAL STATEMENTS | SEMIANNUAL REPORT | JOHN HANCOCK MULTIFACTOR ETFS | 33 |
| 34 | JOHN HANCOCK MULTIFACTOR ETFS | SEMIANNUAL REPORT | SEE NOTES TO FINANCIAL STATEMENTS |
| SEE NOTES TO FINANCIAL STATEMENTS | SEMIANNUAL REPORT | JOHN HANCOCK MULTIFACTOR ETFS | 35 |
| 36 | JOHN HANCOCK MULTIFACTOR ETFS | SEMIANNUAL REPORT | SEE NOTES TO FINANCIAL STATEMENTS |
| SEE NOTES TO FINANCIAL STATEMENTS | SEMIANNUAL REPORT | JOHN HANCOCK MULTIFACTOR ETFS | 37 |
| 38 | JOHN HANCOCK MULTIFACTOR ETFS | SEMIANNUAL REPORT | SEE NOTES TO FINANCIAL STATEMENTS |
| SEE NOTES TO FINANCIAL STATEMENTS | SEMIANNUAL REPORT | JOHN HANCOCK MULTIFACTOR ETFS | 39 |
| 40 | JOHN HANCOCK MULTIFACTOR ETFS | SEMIANNUAL REPORT | SEE NOTES TO FINANCIAL STATEMENTS |
| SEE NOTES TO FINANCIAL STATEMENTS | SEMIANNUAL REPORT | JOHN HANCOCK MULTIFACTOR ETFS | 41 |
| Open contracts | Number
of contracts |
Position | Expiration
date |
Notional
basis^ |
Notional
value^ |
Unrealized
appreciation (depreciation) |
| S&P 500 Index Micro E-Mini Futures | 6 | Long | Dec 2020 | $97,143 | $97,965 | $822 |
| $822 |
| 42 | JOHN HANCOCK MULTIFACTOR ETFS | SEMIANNUAL REPORT | SEE NOTES TO FINANCIAL STATEMENTS |
| SEE NOTES TO FINANCIAL STATEMENTS | SEMIANNUAL REPORT | JOHN HANCOCK MULTIFACTOR ETFS | 43 |
| 44 | JOHN HANCOCK MULTIFACTOR ETFS | SEMIANNUAL REPORT | SEE NOTES TO FINANCIAL STATEMENTS |
| SEE NOTES TO FINANCIAL STATEMENTS | SEMIANNUAL REPORT | JOHN HANCOCK MULTIFACTOR ETFS | 45 |
| Open contracts | Number
of contracts |
Position | Expiration
date |
Notional
basis^ |
Notional
value^ |
Unrealized
appreciation (depreciation) |
| S&P 500 Index Micro E-Mini Futures | 8 | Long | Dec 2020 | $137,867 | $130,620 | $(7,247) |
| $(7,247) |
| 46 | JOHN HANCOCK MULTIFACTOR ETFS | SEMIANNUAL REPORT | SEE NOTES TO FINANCIAL STATEMENTS |
| SEE NOTES TO FINANCIAL STATEMENTS | SEMIANNUAL REPORT | JOHN HANCOCK MULTIFACTOR ETFS | 47 |
| 48 | JOHN HANCOCK MULTIFACTOR ETFS | SEMIANNUAL REPORT | SEE NOTES TO FINANCIAL STATEMENTS |
| SEE NOTES TO FINANCIAL STATEMENTS | SEMIANNUAL REPORT | JOHN HANCOCK MULTIFACTOR ETFS | 49 |
| 50 | JOHN HANCOCK MULTIFACTOR ETFS | SEMIANNUAL REPORT | SEE NOTES TO FINANCIAL STATEMENTS |
| SEE NOTES TO FINANCIAL STATEMENTS | SEMIANNUAL REPORT | JOHN HANCOCK MULTIFACTOR ETFS | 51 |
| 52 | JOHN HANCOCK MULTIFACTOR ETFS | SEMIANNUAL REPORT | SEE NOTES TO FINANCIAL STATEMENTS |
| SEE NOTES TO FINANCIAL STATEMENTS | SEMIANNUAL REPORT | JOHN HANCOCK MULTIFACTOR ETFS | 53 |
| 54 | JOHN HANCOCK MULTIFACTOR ETFS | SEMIANNUAL REPORT | SEE NOTES TO FINANCIAL STATEMENTS |
| SEE NOTES TO FINANCIAL STATEMENTS | SEMIANNUAL REPORT | JOHN HANCOCK MULTIFACTOR ETFS | 55 |
| 56 | JOHN HANCOCK MULTIFACTOR ETFS | SEMIANNUAL REPORT | SEE NOTES TO FINANCIAL STATEMENTS |
| SEE NOTES TO FINANCIAL STATEMENTS | SEMIANNUAL REPORT | JOHN HANCOCK MULTIFACTOR ETFS | 57 |
| 58 | JOHN HANCOCK MULTIFACTOR ETFS | SEMIANNUAL REPORT | SEE NOTES TO FINANCIAL STATEMENTS |
| SEE NOTES TO FINANCIAL STATEMENTS | SEMIANNUAL REPORT | JOHN HANCOCK MULTIFACTOR ETFS | 59 |
| 60 | JOHN HANCOCK MULTIFACTOR ETFS | SEMIANNUAL REPORT | SEE NOTES TO FINANCIAL STATEMENTS |
| SEE NOTES TO FINANCIAL STATEMENTS | SEMIANNUAL REPORT | JOHN HANCOCK MULTIFACTOR ETFS | 61 |
| 62 | JOHN HANCOCK MULTIFACTOR ETFS | SEMIANNUAL REPORT | SEE NOTES TO FINANCIAL STATEMENTS |
| SEE NOTES TO FINANCIAL STATEMENTS | SEMIANNUAL REPORT | JOHN HANCOCK MULTIFACTOR ETFS | 63 |
| 64 | JOHN HANCOCK MULTIFACTOR ETFS | SEMIANNUAL REPORT | SEE NOTES TO FINANCIAL STATEMENTS |
| SEE NOTES TO FINANCIAL STATEMENTS | SEMIANNUAL REPORT | JOHN HANCOCK MULTIFACTOR ETFS | 65 |
| 66 | JOHN HANCOCK MULTIFACTOR ETFS | SEMIANNUAL REPORT | SEE NOTES TO FINANCIAL STATEMENTS |
| Open contracts | Number
of contracts |
Position | Expiration
date |
Notional
basis^ |
Notional
value^ |
Unrealized
appreciation (depreciation) |
| S&P 500 Index E-Mini Futures | 14 | Long | Dec 2020 | $2,404,140 | $2,285,675 | $(118,465) |
| $(118,465) |
| SEE NOTES TO FINANCIAL STATEMENTS | SEMIANNUAL REPORT | JOHN HANCOCK MULTIFACTOR ETFS | 67 |
| 68 | JOHN HANCOCK MULTIFACTOR ETFS | SEMIANNUAL REPORT | SEE NOTES TO FINANCIAL STATEMENTS |
| SEE NOTES TO FINANCIAL STATEMENTS | SEMIANNUAL REPORT | JOHN HANCOCK MULTIFACTOR ETFS | 69 |
| 70 | JOHN HANCOCK MULTIFACTOR ETFS | SEMIANNUAL REPORT | SEE NOTES TO FINANCIAL STATEMENTS |
| SEE NOTES TO FINANCIAL STATEMENTS | SEMIANNUAL REPORT | JOHN HANCOCK MULTIFACTOR ETFS | 71 |
| 72 | JOHN HANCOCK MULTIFACTOR ETFS | SEMIANNUAL REPORT | SEE NOTES TO FINANCIAL STATEMENTS |
| SEE NOTES TO FINANCIAL STATEMENTS | SEMIANNUAL REPORT | JOHN HANCOCK MULTIFACTOR ETFS | 73 |
| 74 | JOHN HANCOCK MULTIFACTOR ETFS | SEMIANNUAL REPORT | SEE NOTES TO FINANCIAL STATEMENTS |
| Financial statements |
| Multifactor Consumer Discretionary ETF | Multifactor Consumer Staples ETF | Multifactor Developed International ETF | Multifactor Emerging Markets ETF | |
| Assets | ||||
| Unaffiliated investments, at value | $33,283,180 | $22,706,802 | $421,954,845 | $660,028,857 |
| Affiliated investments, at value | 343,354 | 148,738 | 5,116,137 | 3,589,826 |
| Total investments, at value | 33,626,534 | 22,855,540 | 427,070,982 | 663,618,683 |
| Foreign currency, at value | — | — | 696,843 | 2,163,760 |
| Dividends and interest receivable | 8,412 | 26,706 | 1,711,979 | 802,484 |
| Receivable for securities lending income | 64 | 29 | 2,087 | 6,253 |
| Receivable from affiliates | — | 4,582 | — | — |
| Other assets | 4,628 | 4,301 | 9,785 | 11,995 |
| Total assets | 33,639,638 | 22,891,158 | 429,491,676 | 666,603,175 |
| Liabilities | ||||
| Due to custodian | — | — | — | 256,066 |
| Foreign capital gains tax payable | — | — | — | 601,969 |
| Payable for investments purchased | — | — | 13 | 16 |
| Payable upon return of securities loaned | 344,499 | 148,761 | 5,108,913 | 3,590,685 |
| Payable to affiliates | ||||
| Investment management fees | 291 | — | 115,090 | 211,608 |
| Accounting and legal services fees | 1,991 | 1,252 | 20,731 | 31,936 |
| Trustees' fees | 211 | 193 | 982 | 1,251 |
| Other liabilities and accrued expenses | 45,583 | 45,275 | 99,370 | 217,138 |
| Total liabilities | 392,575 | 195,481 | 5,345,099 | 4,910,669 |
| Net assets | $33,247,063 | $22,695,677 | $424,146,577 | $661,692,506 |
| Net assets consist of | ||||
| Paid-in capital | $30,954,572 | $22,966,745 | $435,230,602 | $664,010,218 |
| Total distributable earnings (loss) | 2,292,491 | (271,068) | (11,084,025) | (2,317,712) |
| Net assets | $33,247,063 | $22,695,677 | $424,146,577 | $661,692,506 |
| Unaffiliated investments, at cost | $29,882,349 | $22,430,060 | $429,872,170 | $654,592,435 |
| Affiliated investments, at cost | $343,360 | $148,742 | $5,116,380 | $3,590,218 |
| Foreign currency, at cost | — | — | $701,846 | $2,164,335 |
| Securities loaned, at value | $345,635 | $139,519 | $7,680,865 | $6,382,442 |
| Net asset value per share | ||||
| Based on net asset values and shares outstanding-the fund has an unlimited number of shares authorized with no par value. | ||||
| Net assets | $33,247,063 | $22,695,677 | $424,146,577 | $661,692,506 |
| Shares outstanding | 870,000 | 760,000 | 16,200,000 | 26,700,000 |
| Net asset value per share | $38.22 | $29.86 | $26.18 | $24.78 |
| SEE NOTES TO FINANCIAL STATEMENTS | SEMIANNUAL | JOHN HANCOCK MULTIFACTOR ETFS | 75 |
| Multifactor Energy ETF | Multifactor Financials ETF | Multifactor Healthcare ETF | Multifactor Industrials ETF | |
| Assets | ||||
| Unaffiliated investments, at value | $9,303,827 | $23,641,869 | $43,357,425 | $35,637,703 |
| Affiliated investments, at value | — | 51,207 | 181,020 | 43,749 |
| Total investments, at value | 9,303,827 | 23,693,076 | 43,538,445 | 35,681,452 |
| Collateral held at broker for futures contracts | 7,200 | — | 9,600 | — |
| Dividends and interest receivable | 32,406 | 38,829 | 29,593 | 22,913 |
| Receivable for fund shares sold | — | — | — | 765,906 |
| Receivable for investments sold | 102,993 | 1,349,687 | — | — |
| Receivable for securities lending income | 9 | 22 | 93 | 47 |
| Receivable from affiliates | 11,728 | 4,011 | — | — |
| Other assets | 4,220 | 4,672 | 4,794 | 4,396 |
| Total assets | 9,462,383 | 25,090,297 | 43,582,525 | 36,474,714 |
| Liabilities | ||||
| Payable for futures variation margin | 6,373 | — | 1,888 | — |
| Payable for investments purchased | — | — | — | 766,536 |
| Payable for fund shares repurchased | — | 1,350,781 | — | — |
| Payable upon return of securities loaned | — | 51,366 | 180,712 | 43,754 |
| Payable to affiliates | ||||
| Investment management fees | — | — | 1,582 | 1,128 |
| Accounting and legal services fees | 1,230 | 1,798 | 2,227 | 1,467 |
| Trustees' fees | 169 | 218 | 228 | 193 |
| Other liabilities and accrued expenses | 46,597 | 47,458 | 47,401 | 47,010 |
| Total liabilities | 54,369 | 1,451,621 | 234,038 | 860,088 |
| Net assets | $9,408,014 | $23,638,676 | $43,348,487 | $35,614,626 |
| Net assets consist of | ||||
| Paid-in capital | $26,149,355 | $29,174,733 | $40,136,361 | $35,940,064 |
| Total distributable earnings (loss) | (16,741,341) | (5,536,057) | 3,212,126 | (325,438) |
| Net assets | $9,408,014 | $23,638,676 | $43,348,487 | $35,614,626 |
| Unaffiliated investments, at cost | $18,472,058 | $27,304,793 | $38,542,064 | $34,235,061 |
| Affiliated investments, at cost | — | $51,213 | $181,026 | $43,751 |
| Securities loaned, at value | $31,072 | $115,308 | $346,385 | $42,040 |
| Net asset value per share | ||||
| Based on net asset values and shares outstanding-the fund has an unlimited number of shares authorized with no par value. | ||||
| Net assets | $9,408,014 | $23,638,676 | $43,348,487 | $35,614,626 |
| Shares outstanding | 860,000 | 700,000 | 1,110,000 | 930,000 |
| Net asset value per share | $10.94 | $33.77 | $39.05 | $38.30 |
| 76 | JOHN HANCOCK MULTIFACTOR ETFS | SEMIANNUAL | SEE NOTES TO FINANCIAL STATEMENTS |
| Multifactor Large Cap ETF | Multifactor Materials ETF | Multifactor Media and Communications ETF | Multifactor Mid Cap ETF | |
| Assets | ||||
| Unaffiliated investments, at value | $894,629,829 | $22,222,771 | $25,262,807 | $1,560,765,290 |
| Affiliated investments, at value | 2,037,238 | 345,867 | — | 11,737,607 |
| Total investments, at value | 896,667,067 | 22,568,638 | 25,262,807 | 1,572,502,897 |
| Collateral held at broker for futures contracts | — | — | — | 168,000 |
| Dividends and interest receivable | 792,112 | 13,675 | 36,703 | 803,373 |
| Receivable for fund shares sold | — | — | — | 3,798,080 |
| Receivable for securities lending income | 914 | 212 | 4 | 4,690 |
| Receivable from affiliates | — | 4,670 | 3,023 | — |
| Other assets | 17,440 | 4,314 | 3,334 | 24,258 |
| Total assets | 897,477,533 | 22,591,509 | 25,305,871 | 1,577,301,298 |
| Liabilities | ||||
| Payable for futures variation margin | — | — | — | 25,898 |
| Payable for investments purchased | — | — | — | 3,793,884 |
| Payable upon return of securities loaned | 2,040,100 | 345,870 | — | 11,740,472 |
| Payable to affiliates | ||||
| Investment management fees | 188,696 | — | — | 496,783 |
| Accounting and legal services fees | 39,638 | 1,178 | 1,119 | 68,111 |
| Trustees' fees | 1,691 | 174 | 87 | 2,308 |
| Other liabilities and accrued expenses | 118,133 | 45,417 | 35,597 | 162,632 |
| Total liabilities | 2,388,258 | 392,639 | 36,803 | 16,290,088 |
| Net assets | $895,089,275 | $22,198,870 | $25,269,068 | $1,561,011,210 |
| Net assets consist of | ||||
| Paid-in capital | $791,701,558 | $22,196,199 | $22,601,037 | $1,494,123,045 |
| Total distributable earnings (loss) | 103,387,717 | 2,671 | 2,668,031 | 66,888,165 |
| Net assets | $895,089,275 | $22,198,870 | $25,269,068 | $1,561,011,210 |
| Unaffiliated investments, at cost | $798,130,056 | $20,280,251 | $23,487,648 | $1,458,062,429 |
| Affiliated investments, at cost | $2,037,364 | $345,870 | — | $11,738,427 |
| Securities loaned, at value | $2,574,625 | $338,162 | $167,167 | $14,491,691 |
| Net asset value per share | ||||
| Based on net asset values and shares outstanding-the fund has an unlimited number of shares authorized with no par value. | ||||
| Net assets | $895,089,275 | $22,198,870 | $25,269,068 | $1,561,011,210 |
| Shares outstanding | 21,825,000 | 640,000 | 860,000 | 41,100,000 |
| Net asset value per share | $41.01 | $34.69 | $29.38 | $37.98 |
| SEE NOTES TO FINANCIAL STATEMENTS | SEMIANNUAL | JOHN HANCOCK MULTIFACTOR ETFS | 77 |
| Multifactor Small Cap ETF | Multifactor Technology ETF | Multifactor Utilities ETF | |
| Assets | |||
| Unaffiliated investments, at value | $479,007,558 | $41,368,441 | $24,081,865 |
| Affiliated investments, at value | 11,337,793 | 319,214 | — |
| Total investments, at value | 490,345,351 | 41,687,655 | 24,081,865 |
| Dividends and interest receivable | 197,068 | 7,632 | 26,025 |
| Receivable for securities lending income | 4,881 | 118 | — |
| Receivable from affiliates | — | — | 6,298 |
| Other assets | 8,468 | 4,875 | 4,313 |
| Total assets | 490,555,768 | 41,700,280 | 24,118,501 |
| Liabilities | |||
| Payable upon return of securities loaned | 11,334,784 | 319,569 | — |
| Payable to affiliates | |||
| Investment management fees | 150,968 | 971 | — |
| Accounting and legal services fees | 22,164 | 2,279 | 1,583 |
| Trustees' fees | 894 | 232 | 201 |
| Other liabilities and accrued expenses | 68,656 | 48,507 | 46,622 |
| Total liabilities | 11,577,466 | 371,558 | 48,406 |
| Net assets | $478,978,302 | $41,328,722 | $24,070,095 |
| Net assets consist of | |||
| Paid-in capital | $522,778,017 | $32,853,819 | $27,521,353 |
| Total distributable earnings (loss) | (43,799,715) | 8,474,903 | (3,451,258) |
| Net assets | $478,978,302 | $41,328,722 | $24,070,095 |
| Unaffiliated investments, at cost | $469,879,279 | $33,386,096 | $25,763,743 |
| Affiliated investments, at cost | $11,338,581 | $319,233 | — |
| Securities loaned, at value | $13,431,425 | $324,903 | — |
| Net asset value per share | |||
| Based on net asset values and shares outstanding-the fund has an unlimited number of shares authorized with no par value. | |||
| Net assets | $478,978,302 | $41,328,722 | $24,070,095 |
| Shares outstanding | 19,175,000 | 640,000 | 780,000 |
| Net asset value per share | $24.98 | $64.58 | $30.86 |
| 78 | JOHN HANCOCK MULTIFACTOR ETFS | SEMIANNUAL | SEE NOTES TO FINANCIAL STATEMENTS |
| Multifactor Consumer Discretionary ETF | Multifactor Consumer Staples ETF | Multifactor Developed International ETF | Multifactor Emerging Markets ETF | |
| Investment income | ||||
| Dividends | $151,997 | $271,936 | $6,736,388 | $12,988,765 |
| Securities lending | 2,780 | 80 | 37,666 | 35,898 |
| Interest | 19 | — | 337 | 760 |
| Less foreign taxes withheld | — | — | (454,284) | (1,738,405) |
| Total investment income | 154,796 | 272,016 | 6,320,107 | 11,287,018 |
| Expenses | ||||
| Investment management fees | 70,210 | 41,398 | 791,648 | 1,507,882 |
| Accounting and legal services fees | 3,079 | 1,695 | 45,158 | 70,327 |
| Transfer agent fees | 4,848 | 4,848 | 4,848 | 5,601 |
| Trustees' fees | 502 | 386 | 4,869 | 6,667 |
| Custodian fees | 31,549 | 31,599 | 74,338 | 228,560 |
| Printing and postage | 10,157 | 9,822 | 16,390 | 17,112 |
| Professional fees | 8,992 | 8,804 | 20,369 | 26,124 |
| Stock exchange listing fees | 4,921 | 4,877 | 4,927 | 6,478 |
| Other | 7,966 | 7,425 | 18,238 | 13,177 |
| Total expenses | 142,224 | 110,854 | 980,785 | 1,881,928 |
| Less expense reductions | (68,319) | (67,286) | (97,433) | (202,695) |
| Net expenses | 73,905 | 43,568 | 883,352 | 1,679,233 |
| Net investment income | 80,891 | 228,448 | 5,436,755 | 9,607,785 |
| Realized and unrealized gain (loss) | ||||
| Net realized gain (loss) on | ||||
| Unaffiliated investments | (937,405) | (146,377) | (9,180,391) | (15,143,257) |
| Affiliated investments | 349 | (6) | 5,173 | 3,793 |
| Futures contracts | (1,392) | (465) | 134,917 | 246,252 |
| Redemptions in kind | 4,023,232 | 471,281 | 16,656,847 | 12,451,738 |
| 3,084,784 | 324,433 | 7,616,546 | (2,441,474) | |
| Change in net unrealized appreciation (depreciation) of | ||||
| Unaffiliated investments | 5,964,179 | 1,090,165 | 25,233,743 | 91,818,127 1 |
| Affiliated investments | (183) | (4) | (3,415) | (3,068) |
| 5,963,996 | 1,090,161 | 25,230,328 | 91,815,059 | |
| Net realized and unrealized gain | 9,048,780 | 1,414,594 | 32,846,874 | 89,373,585 |
| Increase in net assets from operations | $9,129,671 | $1,643,042 | $38,283,629 | $98,981,370 |
| 1 | Net of $601,969 increase in deferred India withholding taxes. |
| SEE NOTES TO FINANCIAL STATEMENTS | SEMIANNUAL | JOHN HANCOCK MULTIFACTOR ETFS | 79 |
| Multifactor Energy ETF | Multifactor Financials ETF | Multifactor Healthcare ETF | Multifactor Industrials ETF | |
| Investment income | ||||
| Dividends | $375,875 | $333,830 | $574,344 | $227,679 |
| Securities lending | 324 | 197 | 517 | 1,018 |
| Interest | 9 | 11 | 19 | 11 |
| Less foreign taxes withheld | — | (121) | — | — |
| Total investment income | 376,208 | 333,917 | 574,880 | 228,708 |
| Expenses | ||||
| Investment management fees | 27,931 | 53,301 | 86,309 | 56,984 |
| Accounting and legal services fees | 1,324 | 2,306 | 4,164 | 2,105 |
| Transfer agent fees | 4,848 | 4,848 | 4,848 | 4,848 |
| Trustees' fees | 289 | 433 | 570 | 403 |
| Custodian fees | 32,012 | 31,552 | 31,595 | 33,057 |
| Printing and postage | 10,148 | 11,167 | 11,518 | 9,781 |
| Professional fees | 9,033 | 8,910 | 9,191 | 8,761 |
| Stock exchange listing fees | 4,877 | 4,921 | 4,921 | 4,877 |
| Other | 6,882 | 7,089 | 7,184 | 7,458 |
| Total expenses | 97,344 | 124,527 | 160,300 | 128,274 |
| Less expense reductions | (67,944) | (68,422) | (69,449) | (68,291) |
| Net expenses | 29,400 | 56,105 | 90,851 | 59,983 |
| Net investment income | 346,808 | 277,812 | 484,029 | 168,725 |
| Realized and unrealized gain (loss) | ||||
| Net realized gain (loss) on | ||||
| Unaffiliated investments | (3,329,063) | (880,818) | (371,839) | (1,098,236) |
| Affiliated investments | 18 | 5 | 23 | 15 |
| Futures contracts | 7,455 | (1,131) | (264) | (372) |
| Redemptions in kind | 71,631 | 712,088 | 1,672,920 | 1,243,562 |
| (3,249,959) | (169,856) | 1,300,840 | 144,969 | |
| Change in net unrealized appreciation (depreciation) of | ||||
| Unaffiliated investments | (86,313) | 2,153,415 | 1,288,132 | 4,500,501 |
| Affiliated investments | (14) | (14) | (68) | (22) |
| Futures | 822 | — | (7,247) | — |
| (85,505) | 2,153,401 | 1,280,817 | 4,500,479 | |
| Net realized and unrealized gain (loss) | (3,335,464) | 1,983,545 | 2,581,657 | 4,645,448 |
| Increase (decrease) in net assets from operations | $(2,988,656) | $2,261,357 | $3,065,686 | $4,814,173 |
| 80 | JOHN HANCOCK MULTIFACTOR ETFS | SEMIANNUAL | SEE NOTES TO FINANCIAL STATEMENTS |
| Multifactor Large Cap ETF | Multifactor Materials ETF | Multifactor Media and Communications ETF | Multifactor Mid Cap ETF | |
| Investment income | ||||
| Dividends | $8,544,786 | $231,120 | $180,486 | $11,285,187 |
| Securities lending | 16,307 | 227 | 5,305 | 62,905 |
| Interest | 249 | 10 | 13 | 441 |
| Less foreign taxes withheld | — | (21) | — | (2,966) |
| Total investment income | 8,561,342 | 231,336 | 185,804 | 11,345,567 |
| Expenses | ||||
| Investment management fees | 1,129,810 | 38,947 | 50,099 | 2,787,683 |
| Accounting and legal services fees | 83,598 | 1,521 | 2,662 | 144,434 |
| Transfer agent fees | 4,848 | 4,848 | 3,976 | 4,848 |
| Trustees' fees | 8,737 | 330 | 329 | 14,620 |
| Custodian fees | 76,469 | 31,789 | 21,049 | 123,858 |
| Printing and postage | 28,720 | 9,412 | 9,156 | 46,508 |
| Professional fees | 26,657 | 9,049 | 8,808 | 39,476 |
| Stock exchange listing fees | 4,921 | 4,877 | 4,895 | 6,573 |
| Other | 16,860 | 6,924 | 5,677 | 20,776 |
| Total expenses | 1,380,620 | 107,697 | 106,651 | 3,188,776 |
| Less expense reductions | (120,448) | (66,700) | (53,916) | (53,026) |
| Net expenses | 1,260,172 | 40,997 | 52,735 | 3,135,750 |
| Net investment income | 7,301,170 | 190,339 | 133,069 | 8,209,817 |
| Realized and unrealized gain (loss) | ||||
| Net realized gain (loss) on | ||||
| Unaffiliated investments | (14,439,236) | (152,742) | (256,662) | (25,701,685) |
| Affiliated investments | 1,308 | (3) | 81 | 4,741 |
| Futures contracts | 98,153 | (816) | 477 | 299 |
| Redemptions in kind | 34,242,817 | — | 1,986,297 | 34,222,310 |
| 19,903,042 | (153,561) | 1,730,193 | 8,525,665 | |
| Change in net unrealized appreciation (depreciation) of | ||||
| Unaffiliated investments | 84,215,771 | 4,193,760 | 2,492,725 | 221,705,820 |
| Affiliated investments | (1,100) | (3) | (29) | (4,456) |
| Futures | (54,691) | — | (400) | (118,465) |
| 84,159,980 | 4,193,757 | 2,492,296 | 221,582,899 | |
| Net realized and unrealized gain | 104,063,022 | 4,040,196 | 4,222,489 | 230,108,564 |
| Increase in net assets from operations | $111,364,192 | $4,230,535 | $4,355,558 | $238,318,381 |
| SEE NOTES TO FINANCIAL STATEMENTS | SEMIANNUAL | JOHN HANCOCK MULTIFACTOR ETFS | 81 |
| Multifactor Small Cap ETF | Multifactor Technology ETF | Multifactor Utilities ETF | |
| Investment income | |||
| Dividends | $4,077,251 | $253,139 | $436,434 |
| Securities lending | 31,442 | 479 | — |
| Interest | 176 | 19 | 11 |
| Less foreign taxes withheld | (3,511) | — | — |
| Total investment income | 4,105,358 | 253,637 | 436,445 |
| Expenses | |||
| Investment management fees | 944,112 | 78,794 | 45,963 |
| Accounting and legal services fees | 48,348 | 3,534 | 2,068 |
| Transfer agent fees | 4,874 | 4,848 | 4,848 |
| Trustees' fees | 5,020 | 534 | 441 |
| Custodian fees | 46,696 | 32,082 | 31,954 |
| Printing and postage | 15,557 | 11,666 | 10,428 |
| Professional fees | 18,507 | 9,053 | 8,888 |
| Stock exchange listing fees | 4,507 | 4,921 | 4,877 |
| Other | 11,207 | 7,193 | 7,476 |
| Total expenses | 1,098,828 | 152,625 | 116,943 |
| Less expense reductions | (82,092) | (69,685) | (68,561) |
| Net expenses | 1,016,736 | 82,940 | 48,382 |
| Net investment income | 3,088,622 | 170,697 | 388,063 |
| Realized and unrealized gain (loss) | |||
| Net realized gain (loss) on | |||
| Unaffiliated investments | (16,736,717) | (127,972) | (590,917) |
| Affiliated investments | 6,387 | 47 | — |
| Futures contracts | 18,669 | (453) | 6,645 |
| Redemptions in kind | 19,548,703 | 2,902,885 | (163,330) |
| 2,837,042 | 2,774,507 | (747,602) | |
| Change in net unrealized appreciation (depreciation) of | |||
| Unaffiliated investments | 62,879,237 | 4,973,581 | 2,039,008 |
| Affiliated investments | (6,275) | (61) | — |
| 62,872,962 | 4,973,520 | 2,039,008 | |
| Net realized and unrealized gain | 65,710,004 | 7,748,027 | 1,291,406 |
| Increase in net assets from operations | $68,798,626 | $7,918,724 | $1,679,469 |
| 82 | JOHN HANCOCK MULTIFACTOR ETFS | SEMIANNUAL | SEE NOTES TO FINANCIAL STATEMENTS |
| Multifactor
Consumer Discretionary ETF |
Multifactor
Consumer Staples ETF |
Multifactor
Developed International ETF | ||||
| Six
months ended 10-31-20 (unaudited) |
Year
ended 4-30-20 |
Six
months ended 10-31-20 (unaudited) |
Year
ended 4-30-20 |
Six
months ended 10-31-20 (unaudited) |
Year
ended 4-30-20 | |
| Increase (decrease) in net assets | ||||||
| From operations | ||||||
| Net investment income | $80,891 | $477,791 | $228,448 | $654,031 | $5,436,755 | $12,787,165 |
| Net realized gain (loss) | 3,084,784 | 1,125,142 | 324,433 | 1,756,687 | 7,616,546 | (2,807,462) |
| Change in net unrealized appreciation (depreciation) | 5,963,996 | (6,052,769) | 1,090,161 | (1,987,459) | 25,230,328 | (66,311,456) |
| Increase (decrease) in net assets resulting from operations | 9,129,671 | (4,449,836) | 1,643,042 | 423,259 | 38,283,629 | (56,331,753) |
| Distributions to shareholders | ||||||
| From earnings | (156,745) | (485,939) | (264,202) | (655,650) | (4,013,184) | (16,526,310) |
| From fund share transactions | ||||||
| Shares issued | 5,814,834 | 11,360,925 | 4,199,338 | 10,343,541 | 25,229,226 | 81,190,244 |
| Shares repurchased | (12,712,013) | (17,415,480) | (2,093,685) | (19,762,263) | (68,390,388) | (87,062,063) |
| Total from fund share transactions | (6,897,179) | (6,054,555) | 2,105,653 | (9,418,722) | (43,161,162) | (5,871,819) |
| Total increase (decrease) | 2,075,747 | (10,990,330) | 3,484,493 | (9,651,113) | (8,890,717) | (78,729,882) |
| Net assets | ||||||
| Beginning of period | 31,171,316 | 42,161,646 | 19,211,184 | 28,862,297 | 433,037,294 | 511,767,176 |
| End of period | $33,247,063 | $31,171,316 | $22,695,677 | $19,211,184 | $424,146,577 | $433,037,294 |
| Share activity | ||||||
| Shares outstanding | ||||||
| Beginning of period | 1,040,000 | 1,250,000 | 690,000 | 1,030,000 | 17,800,000 | 17,800,000 |
| Shares issued | 160,000 | 360,000 | 140,000 | 360,000 | 900,000 | 3,200,000 |
| Shares repurchased | (330,000) | (570,000) | (70,000) | (700,000) | (2,500,000) | (3,200,000) |
| End of period | 870,000 | 1,040,000 | 760,000 | 690,000 | 16,200,000 | 17,800,000 |
| SEE NOTES TO FINANCIAL STATEMENTS | SEMIANNUAL | JOHN HANCOCK MULTIFACTOR ETFS | 83 |
| Multifactor Emerging Markets ETF | Multifactor Energy ETF | Multifactor Financials ETF | ||||
| Six
months ended 10-31-20 (unaudited) |
Year
ended 4-30-20 |
Six
months ended 10-31-20 (unaudited) |
Year
ended 4-30-20 |
Six
months ended 10-31-20 (unaudited) |
Year
ended 4-30-20 | |
| Increase (decrease) in net assets | ||||||
| From operations | ||||||
| Net investment income | $9,607,785 | $20,819,965 | $346,808 | $1,224,730 | $277,812 | $769,139 |
| Net realized gain (loss) | (2,441,474) | (1,990,914) | (3,249,959) | (4,706,274) | (169,856) | 2,265,250 |
| Change in net unrealized appreciation (depreciation) | 91,815,059 | (128,329,801) | (85,505) | (6,660,723) | 2,153,401 | (8,624,156) |
| Increase (decrease) in net assets resulting from operations | 98,981,370 | (109,500,750) | (2,988,656) | (10,142,267) | 2,261,357 | (5,589,767) |
| Distributions to shareholders | ||||||
| From earnings | (5,233,566) | (19,729,767) | (238,612) | (1,221,422) | (289,637) | (867,642) |
| From fund share transactions | ||||||
| Shares issued | 20,179,109 | 72,646,860 | 1,718,099 | 6,544,437 | 1,713,239 | 29,464,818 |
| Shares repurchased | (137,347,337) | (75,885,634) | (4,099,069) | (6,406,805) | (10,404,179) | (40,276,738) |
| Total from fund share transactions | (117,168,228) | (3,238,774) | (2,380,970) | 137,632 | (8,690,940) | (10,811,920) |
| Total decrease | (23,420,424) | (132,469,291) | (5,608,238) | (11,226,057) | (6,719,220) | (17,269,329) |
| Net assets | ||||||
| Beginning of period | 685,112,930 | 817,582,221 | 15,016,252 | 26,242,309 | 30,357,896 | 47,627,225 |
| End of period | $661,692,506 | $685,112,930 | $9,408,014 | $15,016,252 | $23,638,676 | $30,357,896 |
| Share activity | ||||||
| Shares outstanding | ||||||
| Beginning of period | 31,700,000 | 31,600,000 | 1,080,000 | 980,000 | 970,000 | 1,250,000 |
| Shares issued | 800,000 | 3,100,000 | 120,000 | 420,000 | 50,000 | 810,000 |
| Shares repurchased | (5,800,000) | (3,000,000) | (340,000) | (320,000) | (320,000) | (1,090,000) |
| End of period | 26,700,000 | 31,700,000 | 860,000 | 1,080,000 | 700,000 | 970,000 |
| 84 | JOHN HANCOCK MULTIFACTOR ETFS | SEMIANNUAL | SEE NOTES TO FINANCIAL STATEMENTS |
| Multifactor Healthcare ETF | Multifactor Industrials ETF | Multifactor Large Cap ETF | ||||
| Six
months ended 10-31-20 (unaudited) |
Year
ended 4-30-20 |
Six
months ended 10-31-20 (unaudited) |
Year
ended 4-30-20 |
Six
months ended 10-31-20 (unaudited) |
Year
ended 4-30-20 | |
| Increase (decrease) in net assets | ||||||
| From operations | ||||||
| Net investment income | $484,029 | $816,144 | $168,725 | $381,738 | $7,301,170 | $17,091,642 |
| Net realized gain | 1,300,840 | 2,667,740 | 144,969 | 1,373,350 | 19,903,042 | 51,821,676 |
| Change in net unrealized appreciation (depreciation) | 1,280,817 | 2,858,891 | 4,500,479 | (5,760,064) | 84,159,980 | (93,070,290) |
| Increase (decrease) in net assets resulting from operations | 3,065,686 | 6,342,775 | 4,814,173 | (4,004,976) | 111,364,192 | (24,156,972) |
| Distributions to shareholders | ||||||
| From earnings | (517,305) | (1,306,455) | (148,594) | (372,367) | (7,815,001) | (16,652,227) |
| From fund share transactions | ||||||
| Shares issued | 3,070,455 | 10,898,269 | 13,802,954 | 10,999,231 | 119,222,424 | 131,654,328 |
| Shares repurchased | (5,477,265) | (26,389,183) | (5,101,747) | (16,550,559) | (116,896,462) | (223,416,055) |
| Total from fund share transactions | (2,406,810) | (15,490,914) | 8,701,207 | (5,551,328) | 2,325,962 | (91,761,727) |
| Total increase (decrease) | 141,571 | (10,454,594) | 13,366,786 | (9,928,671) | 105,875,153 | (132,570,926) |
| Net assets | ||||||
| Beginning of period | 43,206,916 | 53,661,510 | 22,247,840 | 32,176,511 | 789,214,122 | 921,785,048 |
| End of period | $43,348,487 | $43,206,916 | $35,614,626 | $22,247,840 | $895,089,275 | $789,214,122 |
| Share activity | ||||||
| Shares outstanding | ||||||
| Beginning of period | 1,170,000 | 1,610,000 | 700,000 | 860,000 | 21,825,000 | 24,275,000 |
| Shares issued | 80,000 | 310,000 | 360,000 | 310,000 | 2,875,000 | 3,675,000 |
| Shares repurchased | (140,000) | (750,000) | (130,000) | (470,000) | (2,875,000) | (6,125,000) |
| End of period | 1,110,000 | 1,170,000 | 930,000 | 700,000 | 21,825,000 | 21,825,000 |
| SEE NOTES TO FINANCIAL STATEMENTS | SEMIANNUAL | JOHN HANCOCK MULTIFACTOR ETFS | 85 |
| Multifactor Materials ETF | Multifactor Media and Communications ETF | Multifactor Mid Cap ETF | ||||
| Six
months ended 10-31-20 (unaudited) |
Year
ended 4-30-20 |
Six
months ended 10-31-20 (unaudited) |
Year
ended 4-30-20 |
Six
months ended 10-31-20 (unaudited) |
Year
ended 4-30-20 | |
| Increase (decrease) in net assets | ||||||
| From operations | ||||||
| Net investment income | $190,339 | $366,907 | $133,069 | $231,920 | $8,209,817 | $17,645,935 |
| Net realized gain (loss) | (153,561) | (29,725) | 1,730,193 | (473,910) | 8,525,665 | 10,965,560 |
| Change in net unrealized appreciation (depreciation) | 4,193,757 | (2,701,140) | 2,492,296 | (773,021) | 221,582,899 | (203,734,025) |
| Increase (decrease) in net assets resulting from operations | 4,230,535 | (2,363,958) | 4,355,558 | (1,015,011) | 238,318,381 | (175,122,530) |
| Distributions to shareholders | ||||||
| From earnings | (163,919) | (400,889) | (112,894) | (159,184) | (9,050,254) | (14,393,874) |
| From fund share transactions | ||||||
| Shares issued | 966,816 | 7,172,493 | 5,515,981 | 6,196,500 | 108,829,862 | 719,955,147 |
| Shares repurchased | — | (9,996,413) | (6,842,080) | (6,266,422) | (108,296,178) | (229,422,956) |
| Total from fund share transactions | 966,816 | (2,823,920) | (1,326,099) | (69,922) | 533,684 | 490,532,191 |
| Total increase (decrease) | 5,033,432 | (5,588,767) | 2,916,565 | (1,244,117) | 229,801,811 | 301,015,787 |
| Net assets | ||||||
| Beginning of period | 17,165,438 | 22,754,205 | 22,352,503 | 23,596,620 | 1,331,209,399 | 1,030,193,612 |
| End of period | $22,198,870 | $17,165,438 | $25,269,068 | $22,352,503 | $1,561,011,210 | $1,331,209,399 |
| Share activity | ||||||
| Shares outstanding | ||||||
| Beginning of period | 610,000 | 700,000 | 890,000 | 890,000 | 41,100,000 | 28,150,000 |
| Shares issued | 30,000 | 220,000 | 200,000 | 250,000 | 3,000,000 | 19,975,000 |
| Shares repurchased | — | (310,000) | (230,000) | (250,000) | (3,000,000) | (7,025,000) |
| End of period | 640,000 | 610,000 | 860,000 | 890,000 | 41,100,000 | 41,100,000 |
| 86 | JOHN HANCOCK MULTIFACTOR ETFS | SEMIANNUAL | SEE NOTES TO FINANCIAL STATEMENTS |
| Multifactor Small Cap ETF | Multifactor Technology ETF | Multifactor Utilities ETF | ||||
| Six
months ended 10-31-20 (unaudited) |
Year
ended 4-30-20 |
Six
months ended 10-31-20 (unaudited) |
Year
ended 4-30-20 |
Six
months ended 10-31-20 (unaudited) |
Year
ended 4-30-20 | |
| Increase (decrease) in net assets | ||||||
| From operations | ||||||
| Net investment income | $3,088,622 | $6,131,096 | $170,697 | $692,391 | $388,063 | $917,477 |
| Net realized gain (loss) | 2,837,042 | (23,933,938) | 2,774,507 | 6,359,690 | (747,602) | 3,406,928 |
| Change in net unrealized appreciation (depreciation) | 62,872,962 | (66,707,207) | 4,973,520 | (4,028,292) | 2,039,008 | (5,737,233) |
| Increase (decrease) in net assets resulting from operations | 68,798,626 | (84,510,049) | 7,918,724 | 3,023,789 | 1,679,469 | (1,412,828) |
| Distributions to shareholders | ||||||
| From earnings | (2,503,841) | (5,745,267) | (306,190) | (628,863) | (378,405) | (922,136) |
| From fund share transactions | ||||||
| Shares issued | 36,274,592 | 237,133,023 | 4,421,213 | 13,101,142 | — | 34,715,208 |
| Shares repurchased | (86,836,853) | (122,564,999) | (6,971,712) | (41,017,240) | (2,684,669) | (36,393,455) |
| Total from fund share transactions | (50,562,261) | 114,568,024 | (2,550,499) | (27,916,098) | (2,684,669) | (1,678,247) |
| Total increase (decrease) | 15,732,524 | 24,312,708 | 5,062,035 | (25,521,172) | (1,383,605) | (4,013,211) |
| Net assets | ||||||
| Beginning of period | 463,245,778 | 438,933,070 | 36,266,687 | 61,787,859 | 25,453,700 | 29,466,911 |
| End of period | $478,978,302 | $463,245,778 | $41,328,722 | $36,266,687 | $24,070,095 | $25,453,700 |
| Share activity | ||||||
| Shares outstanding | ||||||
| Beginning of period | 21,275,000 | 16,325,000 | 680,000 | 1,220,000 | 870,000 | 930,000 |
| Shares issued | 1,500,000 | 9,875,000 | 70,000 | 260,000 | — | 1,060,000 |
| Shares repurchased | (3,600,000) | (4,925,000) | (110,000) | (800,000) | (90,000) | (1,120,000) |
| End of period | 19,175,000 | 21,275,000 | 640,000 | 680,000 | 780,000 | 870,000 |
| SEE NOTES TO FINANCIAL STATEMENTS | SEMIANNUAL | JOHN HANCOCK MULTIFACTOR ETFS | 87 |
| Financial Highlights |
| Period ended | 10-31-20 1 | 4-30-20 | 4-30-19 | 4-30-18 | 4-30-17 | 4-30-16 2 |
| Per share operating performance | ||||||
| Net asset value, beginning of period | $29.97 | $33.73 | $30.65 | $28.04 | $25.56 | $24.21 |
| Net investment income3 | 0.08 | 0.41 | 0.37 | 0.32 | 0.51 | 0.18 |
| Net realized and unrealized gain (loss) on investments | 8.32 | (3.76) | 3.11 | 2.58 | 2.45 | 1.24 |
| Total from investment operations | 8.40 | (3.35) | 3.48 | 2.90 | 2.96 | 1.42 |
| Less distributions | ||||||
| From net investment income | (0.15) | (0.41) | (0.40) | (0.29) | (0.48) | (0.07) |
| Net asset value, end of period | $38.22 | $29.97 | $33.73 | $30.65 | $28.04 | $25.56 |
| Total return (%)4 | 28.09 5 | (10.08) | 11.57 | 10.37 | 11.78 | 5.87 5 |
| Ratios and supplemental data | ||||||
| Net assets, end of period (in millions) | $33 | $31 | $42 | $47 | $31 | $15 |
| Ratios (as a percentage of average net assets): | ||||||
| Expenses before reductions | 0.77 6 | 0.73 | 0.73 | 0.85 | 1.07 | 1.27 6 |
| Expenses including reductions | 0.40 6 | 0.40 | 0.47 | 0.50 | 0.50 | 0.50 6 |
| Net investment income | 0.44 6 | 1.23 | 1.17 | 1.08 | 1.93 | 1.22 6 |
| Portfolio turnover (%)7 | 10 | 20 | 42 | 9 | 16 | 5 |
| 1 | Six months ended 10-31-20. Unaudited. |
| 2 | Period from 9-28-15 (commencement of operations) to 4-30-16. |
| 3 | Based on average daily shares outstanding. |
| 4 | Total returns would have been lower had certain expenses not been reduced during the applicable periods. |
| 5 | Not annualized. |
| 6 | Annualized. |
| 7 | Portfolio turnover rate excludes securities received or delivered from in-kind transactions. |
| Period ended | 10-31-20 1 | 4-30-20 | 4-30-19 | 4-30-18 | 4-30-17 | 4-30-16 2 |
| Per share operating performance | ||||||
| Net asset value, beginning of period | $27.84 | $28.02 | $25.35 | $26.48 | $25.14 | $25.12 |
| Net investment income3 | 0.31 | 0.65 | 0.75 | 0.55 | 0.48 | 0.03 |
| Net realized and unrealized gain (loss) on investments | 2.07 | (0.17) | 2.66 | (1.24) | 1.21 | (0.01) |
| Total from investment operations | 2.38 | 0.48 | 3.41 | (0.69) | 1.69 | 0.02 |
| Less distributions | ||||||
| From net investment income | (0.36) | (0.66) | (0.74) | (0.44) | (0.35) | — |
| Net asset value, end of period | $29.86 | $27.84 | $28.02 | $25.35 | $26.48 | $25.14 |
| Total return (%)4 | 8.64 5 | 1.62 | 13.89 | (2.67) | 6.75 | 0.08 5 |
| Ratios and supplemental data | ||||||
| Net assets, end of period (in millions) | $23 | $19 | $29 | $22 | $17 | $5 |
| Ratios (as a percentage of average net assets): | ||||||
| Expenses before reductions | 1.02 6 | 0.83 | 0.91 | 1.07 | 1.18 | 5.96 6 |
| Expenses including reductions | 0.40 6 | 0.40 | 0.47 | 0.50 | 0.50 | 0.50 6 |
| Net investment income | 2.10 6 | 2.27 | 2.87 | 2.05 | 1.86 | 1.49 6 |
| Portfolio turnover (%)7 | 5 | 12 | 14 | 14 | 11 | 0 |
| 1 | Six months ended 10-31-20. Unaudited. |
| 2 | Period from 3-28-16 (commencement of operations) to 4-30-16. |
| 3 | Based on average daily shares outstanding. |
| 4 | Total returns would have been lower had certain expenses not been reduced during the applicable periods. |
| 5 | Not annualized. |
| 6 | Annualized. |
| 7 | Portfolio turnover rate excludes securities received or delivered from in-kind transactions. |
| 88 | JOHN HANCOCK MULTIFACTOR ETFS | SEMIANNUAL | SEE NOTES TO FINANCIAL STATEMENTS |
| Period ended | 10-31-20 1 | 4-30-20 | 4-30-19 | 4-30-18 | 4-30-17 2 |
| Per share operating performance | |||||
| Net asset value, beginning of period | $24.33 | $28.75 | $30.68 | $27.17 | $24.54 |
| Net investment income3 | 0.32 | 0.73 | 0.91 | 0.77 | 0.31 |
| Net realized and unrealized gain (loss) on investments | 1.77 | (4.21) | (2.31) | 3.43 | 2.32 |
| Total from investment operations | 2.09 | (3.48) | (1.40) | 4.20 | 2.63 |
| Less distributions | |||||
| From net investment income | (0.24) | (0.94) | (0.53) | (0.69) | — |
| Net asset value, end of period | $26.18 | $24.33 | $28.75 | $30.68 | $27.17 |
| Total return (%)4 | 8.60 5 | (12.57) | (4.54) | 15.64 | 10.73 5 |
| Ratios and supplemental data | |||||
| Net assets, end of period (in millions) | $424 | $433 | $512 | $68 | $33 |
| Ratios (as a percentage of average net assets): | |||||
| Expenses before reductions | 0.43 6 | 0.52 | 0.55 | 0.80 | 0.99 6 |
| Expenses including reductions | 0.39 6 | 0.45 | 0.45 | 0.45 | 0.45 6 |
| Net investment income | 2.40 6 | 2.46 | 3.28 | 2.60 | 3.02 6 |
| Portfolio turnover (%)7 | 4 | 10 | 17 | 15 | 8 |
| 1 | Six months ended 10-31-20. Unaudited. |
| 2 | Period from 12-15-16 (commencement of operations) to 4-30-17. |
| 3 | Based on average daily shares outstanding. |
| 4 | Total returns would have been lower had certain expenses not been reduced during the applicable periods. |
| 5 | Not annualized. |
| 6 | Annualized. |
| 7 | Portfolio turnover rate excludes securities received or delivered from in-kind transactions. |
| Period ended | 10-31-20 1 | 4-30-20 | 4-30-19 2 |
| Per share operating performance | |||
| Net asset value, beginning of period | $21.61 | $25.87 | $25.00 |
| Net investment income3 | 0.34 | 0.66 | 0.14 |
| Net realized and unrealized gain (loss) on investments | 3.01 | (4.29) | 0.78 |
| Total from investment operations | 3.35 | (3.63) | 0.92 |
| Less distributions | |||
| From net investment income | (0.18) | (0.63) | (0.05) |
| Net asset value, end of period | $24.78 | $21.61 | $25.87 |
| Total return (%)4 | 15.56 5 | (14.44) | 3.71 5 |
| Ratios and supplemental data | |||
| Net assets, end of period (in millions) | $662 | $685 | $818 |
| Ratios (as a percentage of average net assets): | |||
| Expenses before reductions | 0.55 6 | 0.67 | 0.71 6 |
| Expenses including reductions | 0.49 6 | 0.55 | 0.55 6 |
| Net investment income | 2.81 6 | 2.69 | 0.97 6 |
| Portfolio turnover (%)7 | 12 | 22 | 3 |
| 1 | Six months ended 10-31-20. Unaudited. |
| 2 | Period from 9-27-18 (commencement of operations) to 4-30-19. |
| 3 | Based on average daily shares outstanding. |
| 4 | Total returns would have been lower had certain expenses not been reduced during the applicable periods. |
| 5 | Not annualized. |
| 6 | Annualized. |
| 7 | Portfolio turnover rate excludes securities received or delivered from in-kind transactions. |
| SEE NOTES TO FINANCIAL STATEMENTS | SEMIANNUAL | JOHN HANCOCK MULTIFACTOR ETFS | 89 |
| Period ended | 10-31-20 1 | 4-30-20 | 4-30-19 | 4-30-18 | 4-30-17 | 4-30-16 2 |
| Per share operating performance | ||||||
| Net asset value, beginning of period | $13.90 | $26.78 | $31.39 | $27.42 | $27.23 | $24.84 |
| Net investment income3 | 0.32 4 | 1.35 5 | 0.51 | 0.66 6 | 0.42 | — 7 |
| Net realized and unrealized gain (loss) on investments | (3.07) | (12.80) | (4.59) | 3.85 | 0.06 | 2.39 |
| Total from investment operations | (2.75) | (11.45) | (4.08) | 4.51 | 0.48 | 2.39 |
| Less distributions | ||||||
| From net investment income | (0.21) | (1.43) | (0.53) | (0.54) | (0.29) | — |
| Net asset value, end of period | $10.94 | $13.90 | $26.78 | $31.39 | $27.42 | $27.23 |
| Total return (%)8 | (20.16) 9 | (44.93) | (12.84) | 16.69 | 1.73 | 9.63 9 |
| Ratios and supplemental data | ||||||
| Net assets, end of period (in millions) | $9 | $15 | $26 | $37 | $16 | $5 |
| Ratios (as a percentage of average net assets): | ||||||
| Expenses before reductions | 1.32 10 | 1.05 | 0.86 | 1.07 | 1.15 | 5.86 10 |
| Expenses including reductions | 0.40 10 | 0.40 | 0.48 | 0.50 | 0.50 | 0.50 10 |
| Net investment income | 4.72 4,10 | 6.38 5 | 1.72 | 2.35 6 | 1.46 | 0.20 10 |
| Portfolio turnover (%)11 | 18 | 22 | 25 | 16 | 30 | 2 |
| 1 | Six months ended 10-31-20. Unaudited. |
| 2 | Period from 3-28-16 (commencement of operations) to 4-30-16. |
| 3 | Based on average daily shares outstanding. |
| 4 | Net investment income is affected by the timing and frequency of the declaration of dividends by the securities in which the fund invests. |
| 5 | Net investment income (loss) per share and ratio of net investment income (loss) to average net assets reflect a special dividend received by the fund, which amounted to $0.82 and 3.84%, respectively. |
| 6 | Net investment income (loss) per share and ratio of net investment income (loss) to average net assets reflect a special dividend received by the fund, which amounted to $0.16 and 0.58%, respectively. |
| 7 | Less than $0.005 per share. |
| 8 | Total returns would have been lower had certain expenses not been reduced during the applicable periods. |
| 9 | Not annualized. |
| 10 | Annualized. |
| 11 | Portfolio turnover rate excludes securities received or delivered from in-kind transactions. |
| Period ended | 10-31-20 1 | 4-30-20 | 4-30-19 | 4-30-18 | 4-30-17 | 4-30-16 2 |
| Per share operating performance | ||||||
| Net asset value, beginning of period | $31.30 | $38.10 | $36.86 | $31.48 | $25.35 | $24.37 |
| Net investment income3 | 0.34 | 0.70 | 0.57 | 0.45 | 0.38 | 0.21 |
| Net realized and unrealized gain (loss) on investments | 2.48 | (6.64) | 1.21 | 5.30 | 6.10 | 0.85 |
| Total from investment operations | 2.82 | (5.94) | 1.78 | 5.75 | 6.48 | 1.06 |
| Less distributions | ||||||
| From net investment income | (0.35) | (0.86) | (0.54) | (0.37) | (0.35) | (0.08) |
| Net asset value, end of period | $33.77 | $31.30 | $38.10 | $36.86 | $31.48 | $25.35 |
| Total return (%)4 | 9.03 5 | (16.06) | 5.15 | 18.33 | 25.78 | 4.33 5 |
| Ratios and supplemental data | ||||||
| Net assets, end of period (in millions) | $24 | $30 | $48 | $69 | $43 | $19 |
| Ratios (as a percentage of average net assets): | ||||||
| Expenses before reductions | 0.89 6 | 0.72 | 0.66 | 0.75 | 0.99 | 1.19 6 |
| Expenses including reductions | 0.40 6 | 0.40 | 0.47 | 0.50 | 0.50 | 0.50 6 |
| Net investment income | 1.98 6 | 1.86 | 1.57 | 1.26 | 1.32 | 1.41 6 |
| Portfolio turnover (%)7 | 6 | 10 | 9 | 8 | 7 | 11 |
| 1 | Six months ended 10-31-20. Unaudited. |
| 2 | Period from 9-28-15 (commencement of operations) to 4-30-16. |
| 3 | Based on average daily shares outstanding. |
| 4 | Total returns would have been lower had certain expenses not been reduced during the applicable periods. |
| 5 | Not annualized. |
| 6 | Annualized. |
| 7 | Portfolio turnover rate excludes securities received or delivered from in-kind transactions. |
| 90 | JOHN HANCOCK MULTIFACTOR ETFS | SEMIANNUAL | SEE NOTES TO FINANCIAL STATEMENTS |
| Period ended | 10-31-20 1 | 4-30-20 | 4-30-19 | 4-30-18 | 4-30-17 | 4-30-16 2 |
| Per share operating performance | ||||||
| Net asset value, beginning of period | $36.93 | $33.33 | $31.14 | $28.59 | $25.77 | $23.93 |
| Net investment income3 | 0.42 | 0.60 | 0.73 | 0.24 | 0.30 | 0.11 |
| Net realized and unrealized gain (loss) on investments | 2.15 | 3.91 | 1.71 | 2.62 | 2.72 | 1.78 |
| Total from investment operations | 2.57 | 4.51 | 2.44 | 2.86 | 3.02 | 1.89 |
| Less distributions | ||||||
| From net investment income | (0.45) | (0.91) | (0.25) | (0.31) | (0.20) | (0.05) |
| Net asset value, end of period | $39.05 | $36.93 | $33.33 | $31.14 | $28.59 | $25.77 |
| Total return (%)4 | 7.03 5 | 13.70 | 7.89 | 10.04 | 11.78 | 7.89 5 |
| Ratios and supplemental data | ||||||
| Net assets, end of period (in millions) | $43 | $43 | $54 | $41 | $33 | $17 |
| Ratios (as a percentage of average net assets): | ||||||
| Expenses before reductions | 0.71 6 | 0.68 | 0.66 | 0.86 | 1.06 | 1.23 6 |
| Expenses including reductions | 0.40 6 | 0.40 | 0.46 | 0.50 | 0.50 | 0.50 6 |
| Net investment income | 2.13 6 | 1.72 | 2.18 | 0.79 | 1.12 | 0.74 6 |
| Portfolio turnover (%)7 | 4 | 10 | 21 | 11 | 14 | 6 |
| 1 | Six months ended 10-31-20. Unaudited. |
| 2 | Period from 9-28-15 (commencement of operations) to 4-30-16. |
| 3 | Based on average daily shares outstanding. |
| 4 | Total returns would have been lower had certain expenses not been reduced during the applicable periods. |
| 5 | Not annualized. |
| 6 | Annualized. |
| 7 | Portfolio turnover rate excludes securities received or delivered from in-kind transactions. |
| Period ended | 10-31-20 1 | 4-30-20 | 4-30-19 | 4-30-18 | 4-30-17 | 4-30-16 2 |
| Per share operating performance | ||||||
| Net asset value, beginning of period | $31.78 | $37.41 | $33.75 | $30.40 | $25.37 | $25.01 |
| Net investment income3 | 0.21 | 0.52 | 0.59 | 0.33 | 0.35 | 0.01 |
| Net realized and unrealized gain (loss) on investments | 6.52 | (5.64) | 3.69 | 3.33 | 4.94 | 0.35 |
| Total from investment operations | 6.73 | (5.12) | 4.28 | 3.66 | 5.29 | 0.36 |
| Less distributions | ||||||
| From net investment income | (0.21) | (0.51) | (0.62) | (0.31) | (0.26) | — |
| Net asset value, end of period | $38.30 | $31.78 | $37.41 | $33.75 | $30.40 | $25.37 |
| Total return (%)4 | 21.23 5 | (13.92) | 13.16 | 12.04 | 20.95 | 1.45 5 |
| Ratios and supplemental data | ||||||
| Net assets, end of period (in millions) | $36 | $22 | $32 | $32 | $21 | $5 |
| Ratios (as a percentage of average net assets): | ||||||
| Expenses before reductions | 0.86 6 | 0.86 | 0.90 | 0.98 | 1.12 | 5.95 6 |
| Expenses including reductions | 0.40 6 | 0.40 | 0.47 | 0.50 | 0.50 | 0.50 6 |
| Net investment income | 1.13 6 | 1.42 | 1.70 | 0.98 | 1.24 | 0.50 6 |
| Portfolio turnover (%)7 | 9 | 21 | 49 | 3 | 8 | 0 8 |
| 1 | Six months ended 10-31-20. Unaudited. |
| 2 | Period from 3-28-16 (commencement of operations) to 4-30-16. |
| 3 | Based on average daily shares outstanding. |
| 4 | Total returns would have been lower had certain expenses not been reduced during the applicable periods. |
| 5 | Not annualized. |
| 6 | Annualized. |
| 7 | Portfolio turnover rate excludes securities received or delivered from in-kind transactions. |
| 8 | Less than 1%. |
| SEE NOTES TO FINANCIAL STATEMENTS | SEMIANNUAL | JOHN HANCOCK MULTIFACTOR ETFS | 91 |
| Period ended | 10-31-20 1 | 4-30-20 | 4-30-19 | 4-30-18 | 4-30-17 | 4-30-16 2 |
| Per share operating performance | ||||||
| Net asset value, beginning of period | $36.16 | $37.97 | $34.52 | $31.09 | $26.69 | $24.35 |
| Net investment income3 | 0.34 | 0.73 | 0.70 | 0.51 | 0.49 | 0.27 |
| Net realized and unrealized gain (loss) on investments | 4.87 | (1.83) | 3.25 | 3.42 | 4.31 | 2.17 |
| Total from investment operations | 5.21 | (1.10) | 3.95 | 3.93 | 4.80 | 2.44 |
| Less distributions | ||||||
| From net investment income | (0.36) | (0.71) | (0.50) | (0.50) | (0.40) | (0.10) |
| Net asset value, end of period | $41.01 | $36.16 | $37.97 | $34.52 | $31.09 | $26.69 |
| Total return (%)4 | 14.49 5 | (3.04) | 11.74 | 12.69 | 18.13 | 10.01 5 |
| Ratios and supplemental data | ||||||
| Net assets, end of period (in millions) | $895 | $789 | $922 | $401 | $342 | $27 |
| Ratios (as a percentage of average net assets): | ||||||
| Expenses before reductions | 0.32 6 | 0.34 | 0.35 | 0.40 | 0.45 | 0.93 6 |
| Expenses including reductions | 0.29 6 | 0.33 | 0.34 | 0.35 | 0.35 | 0.35 6 |
| Net investment income | 1.68 6 | 1.92 | 1.96 | 1.53 | 1.67 | 1.80 6 |
| Portfolio turnover (%)7 | 4 | 6 | 6 | 5 | 12 | 6 |
| 1 | Six months ended 10-31-20. Unaudited. |
| 2 | Period from 9-28-15 (commencement of operations) to 4-30-16. |
| 3 | Based on average daily shares outstanding. |
| 4 | Total returns would have been lower had certain expenses not been reduced during the applicable periods. |
| 5 | Not annualized. |
| 6 | Annualized. |
| 7 | Portfolio turnover rate excludes securities received or delivered from in-kind transactions. |
| Period ended | 10-31-20 1 | 4-30-20 | 4-30-19 | 4-30-18 | 4-30-17 | 4-30-16 2 |
| Per share operating performance | ||||||
| Net asset value, beginning of period | $28.14 | $32.51 | $34.00 | $30.85 | $26.76 | $25.10 |
| Net investment income3 | 0.30 | 0.58 | 0.55 | 0.44 | 0.44 | 0.04 |
| Net realized and unrealized gain (loss) on investments | 6.52 | (4.31) | (1.54) | 3.13 | 3.97 | 1.62 |
| Total from investment operations | 6.82 | (3.73) | (0.99) | 3.57 | 4.41 | 1.66 |
| Less distributions | ||||||
| From net investment income | (0.27) | (0.64) | (0.50) | (0.42) | (0.32) | — |
| Net asset value, end of period | $34.69 | $28.14 | $32.51 | $34.00 | $30.85 | $26.76 |
| Total return (%)4 | 24.38 5 | (11.77) | (2.76) | 11.62 | 16.58 | 6.63 5 |
| Ratios and supplemental data | ||||||
| Net assets, end of period (in millions) | $22 | $17 | $23 | $23 | $20 | $5 |
| Ratios (as a percentage of average net assets): | ||||||
| Expenses before reductions | 1.05 6 | 1.01 | 1.01 | 1.05 | 1.15 | 5.85 6 |
| Expenses including reductions | 0.40 6 | 0.40 | 0.47 | 0.50 | 0.50 | 0.50 6 |
| Net investment income | 1.86 6 | 1.82 | 1.68 | 1.32 | 1.51 | 1.57 6 |
| Portfolio turnover (%)7 | 8 | 20 | 46 | 10 | 17 | 0 |
| 1 | Six months ended 10-31-20. Unaudited. |
| 2 | Period from 3-28-16 (commencement of operations) to 4-30-16. |
| 3 | Based on average daily shares outstanding. |
| 4 | Total returns would have been lower had certain expenses not been reduced during the applicable periods. |
| 5 | Not annualized. |
| 6 | Annualized. |
| 7 | Portfolio turnover rate excludes securities received or delivered from in-kind transactions. |
| 92 | JOHN HANCOCK MULTIFACTOR ETFS | SEMIANNUAL | SEE NOTES TO FINANCIAL STATEMENTS |
| Period ended | 10-31-20 1 | 4-30-20 | 4-30-19 2 |
| Per share operating performance | |||
| Net asset value, beginning of period | $25.12 | $26.51 | $25.00 |
| Net investment income3 | 0.15 | 0.29 | 0.04 |
| Net realized and unrealized gain (loss) on investments | 4.23 | (1.48) | 1.47 |
| Total from investment operations | 4.38 | (1.19) | 1.51 |
| Less distributions | |||
| From net investment income | (0.12) | (0.20) | — |
| Net asset value, end of period | $29.38 | $25.12 | $26.51 |
| Total return (%)4 | 17.51 5 | (4.60) | 6.05 5 |
| Ratios and supplemental data | |||
| Net assets, end of period (in millions) | $25 | $22 | $24 |
| Ratios (as a percentage of average net assets): | |||
| Expenses before reductions | 0.81 6 | 1.02 | 2.98 6 |
| Expenses including reductions | 0.40 6 | 0.40 | 0.40 6 |
| Net investment income | 1.01 6 | 1.07 | 1.29 6 |
| Portfolio turnover (%)7 | 7 | 19 | 0 |
| 1 | Six months ended 10-31-20. Unaudited. |
| 2 | Period from 3-12-19 (commencement of operations) to 4-30-19. |
| 3 | Based on average daily shares outstanding. |
| 4 | Total returns would have been lower had certain expenses not been reduced during the applicable periods. |
| 5 | Not annualized. |
| 6 | Annualized. |
| 7 | Portfolio turnover rate excludes securities received or delivered from in-kind transactions. |
| Period ended | 10-31-20 1 | 4-30-20 | 4-30-19 | 4-30-18 | 4-30-17 | 4-30-16 2 |
| Per share operating performance | ||||||
| Net asset value, beginning of period | $32.39 | $36.60 | $34.04 | $30.65 | $26.07 | $24.29 |
| Net investment income3 | 0.20 | 0.48 | 0.53 | 0.34 | 0.33 | 0.21 |
| Net realized and unrealized gain (loss) on investments | 5.61 | (4.29) | 2.44 | 3.36 | 4.58 | 1.65 |
| Total from investment operations | 5.81 | (3.81) | 2.97 | 3.70 | 4.91 | 1.86 |
| Less distributions | ||||||
| From net investment income | (0.22) | (0.40) | (0.41) | (0.31) | (0.33) | (0.08) |
| Net asset value, end of period | $37.98 | $32.39 | $36.60 | $34.04 | $30.65 | $26.07 |
| Total return (%)4 | 18.02 5 | (10.56) | 8.98 | 12.11 | 18.96 | 7.70 5 |
| Ratios and supplemental data | ||||||
| Net assets, end of period (in millions) | $1,561 | $1,331 | $1,030 | $332 | $170 | $20 |
| Ratios (as a percentage of average net assets): | ||||||
| Expenses before reductions | 0.42 6 | 0.43 | 0.45 | 0.52 | 0.61 | 1.11 6 |
| Expenses including reductions | 0.42 6 | 0.42 | 0.44 | 0.45 | 0.45 | 0.45 6 |
| Net investment income | 1.09 6 | 1.33 | 1.53 | 1.03 | 1.16 | 1.44 6 |
| Portfolio turnover (%)7 | 10 | 11 | 13 | 11 | 14 | 12 |
| 1 | Six months ended 10-31-20. Unaudited. |
| 2 | Period from 9-28-15 (commencement of operations) to 4-30-16. |
| 3 | Based on average daily shares outstanding. |
| 4 | Total returns would have been lower had certain expenses not been reduced during the applicable periods. |
| 5 | Not annualized. |
| 6 | Annualized. |
| 7 | Portfolio turnover rate excludes securities received or delivered from in-kind transactions. |
| SEE NOTES TO FINANCIAL STATEMENTS | SEMIANNUAL | JOHN HANCOCK MULTIFACTOR ETFS | 93 |
| Period ended | 10-31-20 1 | 4-30-20 | 4-30-19 | 4-30-18 2 |
| Per share operating performance | ||||
| Net asset value, beginning of period | $21.77 | $26.89 | $25.69 | $25.00 |
| Net investment income3 | 0.16 | 0.33 | 0.29 | 0.13 |
| Net realized and unrealized gain (loss) on investments | 3.18 | (5.13) | 1.16 | 0.56 |
| Total from investment operations | 3.34 | (4.80) | 1.45 | 0.69 |
| Less distributions | ||||
| From net investment income | (0.13) | (0.32) | (0.25) | — |
| Net asset value, end of period | $24.98 | $21.77 | $26.89 | $25.69 |
| Total return (%)4 | 15.35 5 | (18.07) | 5.71 | 2.77 5 |
| Ratios and supplemental data | ||||
| Net assets, end of period (in millions) | $479 | $463 | $439 | $39 |
| Ratios (as a percentage of average net assets): | ||||
| Expenses before reductions | 0.46 6 | 0.55 | 0.60 | 0.90 6,7 |
| Expenses including reductions | 0.42 6 | 0.49 | 0.50 | 0.51 6,7 |
| Net investment income | 1.28 6 | 1.30 | 1.13 | 1.05 6 |
| Portfolio turnover (%)8 | 36 | 36 | 33 | 17 |
| 1 | Six months ended 10-31-20. Unaudited. |
| 2 | Period from 11-8-17 (commencement of operations) to 4-30-18. |
| 3 | Based on average daily shares outstanding. |
| 4 | Total returns would have been lower had certain expenses not been reduced during the applicable periods. |
| 5 | Not annualized. |
| 6 | Annualized. |
| 7 | Certain expenses are presented unannualized due to the short reporting period. |
| 8 | Portfolio turnover rate excludes securities received or delivered from in-kind transactions. |
| Period ended | 10-31-20 1 | 4-30-20 | 4-30-19 | 4-30-18 | 4-30-17 | 4-30-16 2 |
| Per share operating performance | ||||||
| Net asset value, beginning of period | $53.33 | $50.65 | $42.87 | $35.10 | $25.86 | $24.42 |
| Net investment income3 | 0.26 | 0.69 | 0.43 | 0.28 | 0.34 | 0.27 |
| Net realized and unrealized gain (loss) on investments | 11.45 | 2.66 | 7.72 | 7.77 | 9.30 | 1.26 |
| Total from investment operations | 11.71 | 3.35 | 8.15 | 8.05 | 9.64 | 1.53 |
| Less distributions | ||||||
| From net investment income | (0.46) | (0.67) | (0.37) | (0.28) | (0.40) | (0.09) |
| Net asset value, end of period | $64.58 | $53.33 | $50.65 | $42.87 | $35.10 | $25.86 |
| Total return (%)4 | 22.01 5 | 6.65 | 19.25 | 23.02 | 37.66 | 6.26 5 |
| Ratios and supplemental data | ||||||
| Net assets, end of period (in millions) | $41 | $36 | $62 | $63 | $42 | $18 |
| Ratios (as a percentage of average net assets): | ||||||
| Expenses before reductions | 0.74 6 | 0.66 | 0.64 | 0.74 | 1.00 | 1.18 6 |
| Expenses including reductions | 0.40 6 | 0.40 | 0.47 | 0.50 | 0.50 | 0.50 6 |
| Net investment income | 0.82 6 | 1.35 | 0.96 | 0.70 | 1.11 | 1.75 6 |
| Portfolio turnover (%)7 | 6 | 21 | 27 | 7 | 18 | 11 |
| 1 | Six months ended 10-31-20. Unaudited. |
| 2 | Period from 9-28-15 (commencement of operations) to 4-30-16. |
| 3 | Based on average daily shares outstanding. |
| 4 | Total returns would have been lower had certain expenses not been reduced during the applicable periods. |
| 5 | Not annualized. |
| 6 | Annualized. |
| 7 | Portfolio turnover rate excludes securities received or delivered from in-kind transactions. |
| 94 | JOHN HANCOCK MULTIFACTOR ETFS | SEMIANNUAL | SEE NOTES TO FINANCIAL STATEMENTS |
| Period ended | 10-31-20 1 | 4-30-20 | 4-30-19 | 4-30-18 | 4-30-17 | 4-30-16 2 |
| Per share operating performance | ||||||
| Net asset value, beginning of period | $29.26 | $31.68 | $27.45 | $27.02 | $24.86 | $24.92 |
| Net investment income3 | 0.48 | 0.87 | 0.84 | 0.77 | 0.71 | 0.02 |
| Net realized and unrealized gain (loss) on investments | 1.58 | (2.40) | 4.05 | 0.34 | 1.94 | (0.08) |
| Total from investment operations | 2.06 | (1.53) | 4.89 | 1.11 | 2.65 | (0.06) |
| Less distributions | ||||||
| From net investment income | (0.46) | (0.89) | (0.66) | (0.68) | (0.49) | — |
| Net asset value, end of period | $30.86 | $29.26 | $31.68 | $27.45 | $27.02 | $24.86 |
| Total return (%)4 | 7.21 5 | (5.16) | 18.21 | 4.14 | 10.79 | (0.27) 5 |
| Ratios and supplemental data | ||||||
| Net assets, end of period (in millions) | $24 | $25 | $29 | $18 | $18 | $5 |
| Ratios (as a percentage of average net assets): | ||||||
| Expenses before reductions | 0.97 6 | 0.77 | 0.87 | 1.16 | 1.18 | 6.05 6 |
| Expenses including reductions | 0.40 6 | 0.40 | 0.46 | 0.50 | 0.50 | 0.50 6 |
| Net investment income | 3.21 6 | 2.66 | 2.86 | 2.78 | 2.77 | 0.95 6 |
| Portfolio turnover (%)7 | 9 | 11 | 19 | 12 | 16 | 0 |
| 1 | Six months ended 10-31-20. Unaudited. |
| 2 | Period from 3-28-16 (commencement of operations) to 4-30-16. |
| 3 | Based on average daily shares outstanding. |
| 4 | Total returns would have been lower had certain expenses not been reduced during the applicable periods. |
| 5 | Not annualized. |
| 6 | Annualized. |
| 7 | Portfolio turnover rate excludes securities received or delivered from in-kind transactions. |
| SEE NOTES TO FINANCIAL STATEMENTS | SEMIANNUAL | JOHN HANCOCK MULTIFACTOR ETFS | 95 |
| Notes to financial statements (unaudited) |
| Fund | Index |
| Multifactor Consumer Discretionary ETF | John Hancock Dimensional Consumer Discretionary Index |
| Multifactor Consumer Staples ETF | John Hancock Dimensional Consumer Staples Index |
| Multifactor Developed International ETF | John Hancock Dimensional Developed International Index |
| Multifactor Emerging Markets ETF | John Hancock Dimensional Emerging Markets Index |
| Multifactor Energy ETF | John Hancock Dimensional Energy Index |
| Multifactor Financials ETF | John Hancock Dimensional Financials Index |
| Multifactor Healthcare ETF | John Hancock Dimensional Healthcare Index |
| Multifactor Industrials ETF | John Hancock Dimensional Industrials Index |
| Multifactor Large Cap ETF | John Hancock Dimensional Large Cap Index |
| Multifactor Materials ETF | John Hancock Dimensional Materials Index |
| Multifactor Media and Communications ETF | John Hancock Dimensional Media and Communications Index |
| Multifactor Mid Cap ETF | John Hancock Dimensional Mid Cap Index |
| Multifactor Small Cap ETF | John Hancock Dimensional Small Cap Index |
| Multifactor Technology ETF | John Hancock Dimensional Technology Index |
| Multifactor Utilities ETF | John Hancock Dimensional Utilities Index |
| 96 | JOHN HANCOCK MULTIFACTOR ETFS | SEMIANNUAL REPORT |
| Total
value at 10-31-20 |
Level
1 quoted price |
Level
2 significant observable inputs |
Level
3 significant unobservable inputs | |
| Multifactor Consumer Discretionary ETF | ||||
| Investments in securities: | ||||
| Assets | ||||
| Common stocks | $33,236,453 | $33,236,453 | — | — |
| Short-term investments | 390,081 | 390,081 | — | — |
| Total investments in securities | $33,626,534 | $33,626,534 | — | — |
| Multifactor Consumer Staples ETF | ||||
| Investments in securities: | ||||
| Assets | ||||
| Common stocks | $22,669,404 | $22,669,404 | — | — |
| Short-term investments | 186,136 | 186,136 | — | — |
| Total investments in securities | $22,855,540 | $22,855,540 | — | — |
| Multifactor Developed International ETF | ||||
| Investments in securities: | ||||
| Assets | ||||
| Common stocks | ||||
| Australia | $27,301,459 | $27,301,459 | — | — |
| Austria | 459,871 | 459,871 | — | — |
| Belgium | 3,846,988 | 3,846,988 | — | — |
| Chile | 296,033 | 296,033 | — | — |
| Czech Republic | 223,296 | 223,296 | — | — |
| Denmark | 10,806,046 | 10,806,046 | — | — |
| Finland | 6,692,744 | 6,692,744 | — | — |
| France | 41,372,372 | 41,372,372 | — | — |
| Germany | 34,678,502 | 34,678,502 | — | — |
| Hong Kong | 13,684,719 | 13,684,719 | — | — |
| Ireland | 5,062,790 | 5,062,790 | — | — |
| Isle of Man | 292,948 | 292,948 | — | — |
| Israel | 1,629,696 | 1,629,696 | — | — |
| Italy | 8,347,451 | 8,347,451 | — | — |
| Japan | 113,172,736 | 113,172,736 | — | — |
| Jordan | 165,063 | 165,063 | — | — |
| Luxembourg | 450,464 | 450,464 | — | — |
| Macau | 217,064 | 217,064 | — | — |
| Mexico | 129,253 | 129,253 | — | — |
| Netherlands | 17,301,815 | 17,301,815 | — | — |
| New Zealand | 1,226,393 | 1,226,393 | — | — |
| Norway | 2,289,225 | 2,289,225 | — | — |
| Portugal | 517,364 | 517,364 | — | — |
| Singapore | 4,955,497 | 4,955,497 | — | — |
| Spain | 8,906,124 | 8,906,124 | — | — |
| Sweden | 14,905,712 | 14,905,712 | — | — |
| Switzerland | 42,278,707 | 42,278,707 | — | — |
| United Arab Emirates | 1,416 | — | $1,416 | — |
| United Kingdom | 56,720,191 | 56,720,191 | — | — |
| United States | 32,632 | 32,632 | — | — |
| SEMIANNUAL REPORT | JOHN HANCOCK MULTIFACTOR ETFS | 97 |
| Total
value at 10-31-20 |
Level
1 quoted price |
Level
2 significant observable inputs |
Level
3 significant unobservable inputs | |
| Multifactor Developed International ETF (continued) | ||||
| Preferred securities | $3,389,535 | $3,389,535 | — | — |
| Rights | 132,647 | 132,647 | — | — |
| Short-term investments | 5,584,229 | 5,584,229 | — | — |
| Total investments in securities | $427,070,982 | $427,069,566 | $1,416 | — |
| Multifactor Emerging Markets ETF | ||||
| Investments in securities: | ||||
| Assets | ||||
| Common stocks | $651,982,615 | $651,982,615 | — | — |
| Preferred securities | 7,929,006 | 7,929,006 | — | — |
| Investment companies | 113,946 | 113,946 | — | — |
| Warrants | 3,274 | 3,274 | — | — |
| Short-term investments | 3,589,842 | 3,589,842 | — | — |
| Total investments in securities | $663,618,683 | $663,618,683 | — | — |
| Multifactor Energy ETF | ||||
| Investments in securities: | ||||
| Assets | ||||
| Common stocks | $9,275,995 | $9,275,995 | — | — |
| Short-term investments | 27,832 | 27,832 | — | — |
| Total investments in securities | $9,303,827 | $9,303,827 | — | — |
| Derivatives: | ||||
| Assets | ||||
| Futures | $822 | $822 | — | — |
| Multifactor Financials ETF | ||||
| Investments in securities: | ||||
| Assets | ||||
| Common stocks | $23,609,426 | $23,609,426 | — | — |
| Short-term investments | 83,650 | 83,650 | — | — |
| Total investments in securities | $23,693,076 | $23,693,076 | — | — |
| Multifactor Healthcare ETF | ||||
| Investments in securities: | ||||
| Assets | ||||
| Common stocks | $43,212,089 | $43,212,089 | — | — |
| Short-term investments | 326,356 | 326,356 | — | — |
| Total investments in securities | $43,538,445 | $43,538,445 | — | — |
| Derivatives: | ||||
| Liabilities | ||||
| Futures | $(7,247) | $(7,247) | — | — |
| Multifactor Industrials ETF | ||||
| Investments in securities: | ||||
| Assets | ||||
| Common stocks | $35,600,614 | $35,600,614 | — | — |
| Short-term investments | 80,838 | 80,838 | — | — |
| Total investments in securities | $35,681,452 | $35,681,452 | — | — |
| Multifactor Large Cap ETF | ||||
| Investments in securities: | ||||
| Assets | ||||
| Common stocks | $894,096,747 | $894,096,747 | — | — |
| 98 | JOHN HANCOCK MULTIFACTOR ETFS | SEMIANNUAL REPORT |
| Total
value at 10-31-20 |
Level
1 quoted price |
Level
2 significant observable inputs |
Level
3 significant unobservable inputs | |
| Multifactor Large Cap ETF (continued) | ||||
| Short-term investments | $2,570,320 | $2,570,320 | — | — |
| Total investments in securities | $896,667,067 | $896,667,067 | — | — |
| Multifactor Materials ETF | ||||
| Investments in securities: | ||||
| Assets | ||||
| Common stocks | $22,186,628 | $22,186,628 | — | — |
| Short-term investments | 382,010 | 382,010 | — | — |
| Total investments in securities | $22,568,638 | $22,568,638 | — | — |
| Multifactor Media and Communications ETF | ||||
| Investments in securities: | ||||
| Assets | ||||
| Common stocks | $25,245,536 | $25,245,536 | — | — |
| Short-term investments | 17,271 | 17,271 | — | — |
| Total investments in securities | $25,262,807 | $25,262,807 | — | — |
| Multifactor Mid Cap ETF | ||||
| Investments in securities: | ||||
| Assets | ||||
| Common stocks | $1,557,256,666 | $1,557,256,666 | — | — |
| Short-term investments | 15,246,231 | 15,246,231 | — | — |
| Total investments in securities | $1,572,502,897 | $1,572,502,897 | — | — |
| Derivatives: | ||||
| Liabilities | ||||
| Futures | $(118,465) | $(118,465) | — | — |
| Multifactor Small Cap ETF | ||||
| Investments in securities: | ||||
| Assets | ||||
| Common stocks | $478,646,727 | $478,646,727 | — | — |
| Short-term investments | 11,698,624 | 11,698,624 | — | — |
| Total investments in securities | $490,345,351 | $490,345,351 | — | — |
| Multifactor Technology ETF | ||||
| Investments in securities: | ||||
| Assets | ||||
| Common stocks | $41,320,610 | $41,320,610 | — | — |
| Short-term investments | 367,045 | 367,045 | — | — |
| Total investments in securities | $41,687,655 | $41,687,655 | — | — |
| Multifactor Utilities ETF | ||||
| Investments in securities: | ||||
| Assets | ||||
| Common stocks | $24,049,348 | $24,049,348 | — | — |
| Short-term investments | 32,517 | 32,517 | — | — |
| Total investments in securities | $24,081,865 | $24,081,865 | — | — |
| SEMIANNUAL REPORT | JOHN HANCOCK MULTIFACTOR ETFS | 99 |
| Fund | Market value of securities on loan | Cash collateral received |
| Multifactor Consumer Discretionary ETF | $345,635 | $344,499 |
| Multifactor Consumer Staples ETF | 139,519 | 148,761 |
| Multifactor Developed International ETF | 7,680,865 | 5,108,913 |
| Multifactor Emerging Markets ETF | 6,382,442 | 3,590,685 |
| Multifactor Energy ETF | 31,072 | — |
| Multifactor Financials ETF | 115,308 | 51,366 |
| Multifactor Healthcare ETF | 346,385 | 180,712 |
| Multifactor Industrials ETF | 42,040 | 43,754 |
| Multifactor Large Cap ETF | 2,574,625 | 2,040,100 |
| Multifactor Materials ETF | 338,162 | 345,870 |
| Multifactor Media and Communications ETF | 167,167 | — |
| Multifactor Mid Cap ETF | 14,491,691 | 11,740,472 |
| Multifactor Small Cap ETF | 13,431,425 | 11,334,784 |
| Multifactor Technology ETF | 324,903 | 319,569 |
| Fund | Non-cash collateral |
| Multifactor Consumer Discretionary ETF | $12,994 |
| Multifactor Developed International ETF | 3,058,860 |
| Multifactor Emerging Markets ETF | 3,044,189 |
| Multifactor Energy ETF | 33,819 |
| Multifactor Financials ETF | 72,598 |
| Multifactor Healthcare ETF | 200,101 |
| Multifactor Large Cap ETF | 658,371 |
| Multifactor Media and Communications ETF | 180,485 |
| Multifactor Mid Cap ETF | 3,762,131 |
| Multifactor Small Cap ETF | 2,882,388 |
| Multifactor Technology ETF | 24,737 |
| 100 | JOHN HANCOCK MULTIFACTOR ETFS | SEMIANNUAL REPORT |
| Fund | Commitment fee |
| Multifactor Consumer Discretionary ETF | $2,462 |
| Multifactor Consumer Staples ETF | 2,436 |
| Multifactor Developed International ETF | 3,285 |
| Multifactor Emerging Markets ETF | 3,777 |
| Multifactor Energy ETF | 2,427 |
| Multifactor Financials ETF | 2,457 |
| Multifactor Healthcare ETF | 2,483 |
| Multifactor Industrials ETF | 2,441 |
| Multifactor Large Cap ETF | 4,020 |
| Multifactor Materials ETF | 2,431 |
| Multifactor Media and Communications ETF | 2,442 |
| Multifactor Mid Cap ETF | 5,066 |
| Multifactor Small Cap ETF | 3,324 |
| Multifactor Technology ETF | 2,475 |
| Multifactor Utilities ETF | 2,448 |
| No Expiration Date | ||
| Fund | Short Term | Long Term |
| Multifactor Consumer Discretionary ETF | $2,009,939 | $2,185,094 |
| Multifactor Consumer Staples ETF | 873,464 | 141,869 |
| Multifactor Developed International ETF | 8,248,408 | 5,837,151 |
| Multifactor Emerging Markets ETF | 8,583,969 | 1,812,018 |
| Multifactor Energy ETF | 3,499,014 | 1,012,194 |
| SEMIANNUAL REPORT | JOHN HANCOCK MULTIFACTOR ETFS | 101 |
| No Expiration Date | ||
| Fund | Short Term | Long Term |
| Multifactor Financials ETF | $1,354,761 | $504,749 |
| Multifactor Healthcare ETF | 1,633,762 | 1,649,061 |
| Multifactor Industrials ETF | 1,027,142 | 905,998 |
| Multifactor Large Cap ETF | 10,081,955 | 7,357,177 |
| Multifactor Materials ETF | 1,016,878 | 879,524 |
| Multifactor Media and Communications ETF | 936,580 | — |
| Multifactor Mid Cap ETF | 35,946,007 | 12,892,570 |
| Multifactor Small Cap ETF | 47,317,665 | 10,356,537 |
| Multifactor Technology ETF | 1,732,501 | 638,057 |
| Multifactor Utilities ETF | 1,193,729 | 32,049 |
| Fund | Aggregate
cost |
Unrealized
appreciation |
Unrealized
(depreciation) |
Net
unrealized appreciation/ (depreciation) |
| Multifactor Consumer Discretionary ETF | $30,256,580 | $5,590,190 | $(2,220,236) | $3,369,954 |
| Multifactor Consumer Staples ETF | 22,581,042 | 1,827,907 | (1,553,409) | 274,498 |
| Multifactor Developed International ETF | 435,578,370 | 50,938,211 | (59,445,599) | (8,507,388) |
| Multifactor Emerging Markets ETF | 659,458,683 | 108,483,388 | (104,323,388) | 4,160,000 |
| Multifactor Energy ETF | 18,527,802 | 76,673 | (9,299,826) | (9,223,153) |
| Multifactor Financials ETF | 27,365,580 | 921,871 | (4,594,375) | (3,672,504) |
| Multifactor Healthcare ETF | 38,749,634 | 6,395,679 | (1,614,115) | 4,781,564 |
| Multifactor Industrials ETF | 34,323,570 | 2,967,502 | (1,609,620) | 1,357,882 |
| Multifactor Large Cap ETF | 800,581,196 | 170,206,243 | (74,120,372) | 96,085,871 |
| Multifactor Materials ETF | 20,630,063 | 2,998,425 | (1,059,850) | 1,938,575 |
| Multifactor Media and Communications ETF | 23,489,562 | 3,450,768 | (1,677,523) | 1,773,245 |
| Multifactor Mid Cap ETF | 1,470,368,124 | 236,583,228 | (134,566,920) | 102,016,308 |
| Multifactor Small Cap ETF | 481,278,154 | 43,939,785 | (34,872,588) | 9,067,197 |
| Multifactor Technology ETF | 33,708,596 | 9,606,537 | (1,627,478) | 7,979,059 |
| Multifactor Utilities ETF | 25,767,802 | 857,525 | (2,543,462) | (1,685,937) |
| 102 | JOHN HANCOCK MULTIFACTOR ETFS | SEMIANNUAL REPORT |
| Fund | Reason | USD Notional range |
| Multifactor Consumer Discretionary ETF | The fund used futures contracts to gain exposure to certain securities markets and manage against changes in certain securities markets. As of October 31, 2020, there were no open futures contracts. | Up to $35,000, as measured during the period. |
| Multifactor Consumer Staples ETF | The fund used futures contracts to gain exposure to certain securities markets and manage against changes in certain securities markets. As of October 31, 2020, there were no open futures contracts. | Up to $83,000, as measured during the period. |
| Multifactor Developed International ETF | The fund used futures contracts to gain exposure to certain securities markets and manage against changes in certain securities markets. As of October 31, 2020, there were no open futures contracts. | Up to $22.1 million, as measured during the period. |
| Multifactor Emerging Markets ETF | The fund used futures contracts to gain exposure to certain securities markets and manage against changes in certain securities markets. As of October 31, 2020, there were no open futures contracts. | Up to $22.4 million, as measured during the period. |
| Multifactor Energy ETF | The fund used futures contracts to gain exposure to certain securities markets and manage against changes in certain securities markets. | Up to $98,000, as measured at each quarter end. |
| Multifactor Financials ETF | The fund used futures contracts to gain exposure to certain securities markets. As of October 31, 2020, there were no open futures contracts and manage against changes in certain securities markets. | Up to $50,000, as measured during the period. |
| Multifactor Healthcare ETF | The fund used futures contracts to gain exposure to certain securities markets and manage against changes in certain securities markets. | Up to $131,000, as measured at each quarter end. |
| Multifactor Industrials ETF | The fund used futures contracts to gain exposure to certain securities markets. As of October 31, 2020, there were no open futures contracts and manage against changes in certain securities markets. As of October 31, 2020, there were no open futures contracts. | Up to $34,000, as measured during the period. |
| Multifactor Large Cap ETF | The fund used futures contracts to gain exposure to certain securities markets and manage against changes in certain securities markets. As of October 31, 2020, there were no open futures contracts. | Up to $290,000, as measured at each quarter end. |
| Multifactor Materials ETF | The fund used futures contracts to gain exposure to certain securities markets and manage against changes in certain securities markets. As of October 31, 2020, there were no open futures contracts. | Up to $83,000, as measured during the period. |
| Multifactor Media and Communications ETF | The fund used futures contracts to gain exposure to certain securities markets and manage against changes in certain securities markets. As of October 31, 2020, there were no open futures contracts. | Up to $15,000, as measured at each quarter end. |
| Multifactor Mid Cap ETF | The fund used futures contracts to gain exposure to certain securities markets and manage against changes in certain securities markets. | Up to $2.3 million, as measured at each quarter end. |
| Multifactor Small Cap ETF | The fund used futures contracts to gain exposure to certain securities markets and manage against changes in certain securities markets. As of October 31, 2020, there were no open futures contracts. | Up to $1.1 million, as measured during the period. |
| Multifactor Technology ETF | The fund used futures contracts to gain exposure to certain securities markets and manage against changes in certain securities markets. As of October 31, 2020, there were no open futures contracts. | Up to $17,000, as measured during the period. |
| Multifactor Utilities ETF | The fund used futures contracts to gain exposure to certain securities markets and manage against changes in certain securities markets. As of October 31, 2020, there were no open futures contracts. | Up to $268,000, as measured during the period. |
| SEMIANNUAL REPORT | JOHN HANCOCK MULTIFACTOR ETFS | 103 |
| Fund | Risk | Statements
of assets and liabilities location |
Financial
instruments location |
Assets
derivatives fair value |
Liabilities
derivatives fair value |
| Multifactor Energy ETF | Equity | Receivable/payable for futures variation margin | Futures 1 | $822 | — |
| $822 | — | ||||
| Multifactor Healthcare ETF | Equity | Receivable/payable for futures variation margin | Futures 1 | — | $(7,247) |
| — | $ (7,247) | ||||
| Multifactor Mid Cap ETF | Equity | Receivable/payable for futures variation margin | Futures 1 | — | $(118,465) |
| — | $(118,465) |
| 1 | Reflects cumulative appreciation/depreciation on futures as disclosed in Funds' investments. Only the period end variation margin is separately disclosed on the Statements of assets and liabilities. |
| Statements of operations location - Net realized gain (loss) on: | ||
| Fund | Risk | Futures contracts |
| Multifactor Consumer Discretionary ETF | Equity | $(1,392) |
| Total | $ (1,392) | |
| Multifactor Consumer Staples ETF | Equity | $(465) |
| Total | $ (465) | |
| Multifactor Developed International ETF | Equity | $134,917 |
| Total | $134,917 | |
| Multifactor Emerging Markets ETF | Equity | $246,252 |
| Total | $246,252 | |
| Multifactor Energy ETF | Equity | $7,455 |
| Total | $ 7,455 | |
| Multifactor Financials ETF | Equity | $(1,131) |
| Total | $ (1,131) | |
| Multifactor Healthcare ETF | Equity | $(264) |
| Total | $ (264) | |
| Multifactor Industrials ETF | Equity | $(372) |
| Total | $ (372) | |
| Multifactor Large Cap ETF | Equity | $98,153 |
| Total | $ 98,153 | |
| Multifactor Materials ETF | Equity | $(816) |
| Total | $ (816) | |
| Multifactor Media and Communications ETF | Equity | $477 |
| Total | $ 477 | |
| Multifactor Mid Cap ETF | Equity | $299 |
| Total | $ 299 | |
| Multifactor Small Cap ETF | Equity | $18,669 |
| Total | $ 18,669 | |
| Multifactor Technology ETF | Equity | $(453) |
| Total | $ (453) | |
| Multifactor Utilities ETF | Equity | $6,645 |
| Total | $ 6,645 |
| 104 | JOHN HANCOCK MULTIFACTOR ETFS | SEMIANNUAL REPORT |
| Statements of operations location - Change in net unrealized appreciation (depreciation) of: | ||
| Fund | Risk | Futures contracts |
| Multifactor Energy ETF | Equity | $822 |
| Total | $ 822 | |
| Multifactor Healthcare ETF | Equity | $(7,247) |
| Total | $ (7,247) | |
| Multifactor Large Cap ETF | Equity | $(54,691) |
| Total | $ (54,691) | |
| Multifactor Media and Communications ETF | Equity | $(400) |
| Total | $ (400) | |
| Multifactor Mid Cap ETF | Equity | $(118,465) |
| Total | $(118,465) |
| SEMIANNUAL REPORT | JOHN HANCOCK MULTIFACTOR ETFS | 105 |
| 106 | JOHN HANCOCK MULTIFACTOR ETFS | SEMIANNUAL REPORT |
| Fund | % by Fund |
| Multifactor Consumer Discretionary ETF | 79% |
| Multifactor Consumer Staples ETF | 69% |
| Multifactor Energy ETF | 62% |
| Multifactor Industrials ETF | 54% |
| Multifactor Materials ETF | 85% |
| Multifactor Media and Communications ETF | 87% |
| Multifactor Utilities ETF | 65% |
| Purchases | Sales and maturities | |||
| Fund | In-kind transactions | Other | In-kind transactions | Other |
| Multifactor Consumer Discretionary ETF | $5,825,383 | $3,611,664 | $12,503,411 | $3,902,915 |
| Multifactor Consumer Staples ETF | 4,191,318 | 1,141,678 | 2,011,607 | 1,264,724 |
| Multifactor Developed International ETF | — | 44,855,827 | 66,691,312 | 19,748,992 |
| Multifactor Emerging Markets ETF | — | 80,110,964 | 76,854,751 | 116,326,101 |
| Multifactor Energy ETF | 1,717,723 | 2,493,982 | 4,096,606 | 2,505,434 |
| Multifactor Financials ETF | 1,709,954 | 1,729,982 | 10,034,045 | 2,117,614 |
| Multifactor Healthcare ETF | 3,041,798 | 1,827,686 | 5,356,983 | 2,374,386 |
| Multifactor Industrials ETF | 13,812,735 | 2,667,564 | 4,997,581 | 2,757,635 |
| Multifactor Large Cap ETF | 97,374,331 | 30,410,437 | 95,023,005 | 31,992,594 |
| Multifactor Materials ETF | 967,108 | 1,585,512 | — | 1,561,148 |
| Multifactor Media and Communications ETF | 5,487,403 | 1,830,557 | 6,653,742 | 1,968,461 |
| Multifactor Mid Cap ETF | 104,405,357 | 146,815,108 | 103,663,064 | 151,080,162 |
| Multifactor Small Cap ETF | 35,593,436 | 172,726,211 | 86,405,581 | 172,028,025 |
| Multifactor Technology ETF | 4,421,572 | 2,387,110 | 6,741,506 | 2,753,453 |
| Multifactor Utilities ETF | — | 2,080,273 | 2,684,350 | 2,064,764 |
| Fund | Affiliated fund | Affiliated Concentration |
| Multifactor Developed International ETF | John Hancock Variable Insurance Trust Managed Volatility Growth Portfolio | 47.42% |
| John Hancock Variable Insurance Trust Managed Volatility Balanced Portfolio | 23.14% | |
| Other affiliated funds | 6.21% | |
| Total | 76.77% | |
| Multifactor Emerging Markets ETF | John Hancock Funds II Multimanager Lifestyle Growth Portfolio | 27.03% |
| John Hancock Variable Insurance Trust Managed Volatility Growth Portfolio | 20.82% | |
| John Hancock Funds II Multimanager Lifestyle Balanced Portfolio | 16.56% |
| SEMIANNUAL REPORT | JOHN HANCOCK MULTIFACTOR ETFS | 107 |
| John Hancock Variable Insurance Trust Managed Volatility Balanced Portfolio | 10.91% | |
| John Hancock Funds II Multimanager Lifestyle Aggressive Portfolio | 10.23% | |
| Other affiliated funds | 7.43% | |
| Total | 92.98% | |
| Multifactor Large Cap ETF | John Hancock Variable Insurance Trust Managed Volatility Growth Portfolio | 23.69% |
| John Hancock Variable Insurance Trust Managed Volatility Balanced Portfolio | 15.13% | |
| Other affiliated funds | 6.68% | |
| Total | 45.50% | |
| Multifactor Mid Cap ETF | John Hancock Variable Insurance Trust Managed Volatility Growth Portfolio | 9.51% |
| John Hancock Variable Insurance Trust Managed Volatility Balanced Portfolio | 5.83% | |
| Other affiliated funds | 13.06% | |
| Total | 28.40% | |
| Multifactor Small Cap ETF | John Hancock Variable Insurance Trust Managed Volatility Growth Portfolio | 28.92% |
| John Hancock Variable Insurance Trust Managed Volatility Balanced Portfolio | 14.79% | |
| John Hancock Funds II Multimanager Lifestyle Growth Portfolio | 13.40% | |
| John Hancock Funds II Multimanager Lifestyle Balanced Portfolio | 9.91% | |
| John Hancock Funds II Multimanager Lifestyle Aggressive Portfolio | 5.31% | |
| Other affiliated funds | 6.10% | |
| Total | 78.43% |
| Dividends and distributions | |||||||||
| Affiliate | Ending
share amount |
Beginning
value |
Cost
of purchases |
Proceeds
from shares sold |
Realized
gain (loss) |
Change
in unrealized appreciation (depreciation) |
Income
distributions received |
Capital
gain distributions received |
Ending
value |
| Multifactor Consumer Discretionary ETF | |||||||||
| John Hancock Collateral Trust* | 34,306 | $645,028 | $5,075,484 | $(5,377,324) | $349 | $(183) | $2,780 | — | $343,354 |
| Multifactor Consumer Staples ETF | |||||||||
| John Hancock Collateral Trust* | 14,861 | — | $1,100,837 | $(952,089) | $(6) | $(4) | $80 | — | $148,738 |
| Multifactor Developed International ETF | |||||||||
| John Hancock Collateral Trust* | 511,174 | $10,542,966 | $38,762,112 | $(44,190,699) | $5,173 | $(3,415) | $37,666 | — | $5,116,137 |
| Multifactor Emerging Markets ETF | |||||||||
| John Hancock Collateral Trust* | 358,674 | $6,738,757 | $20,020,524 | $(23,170,180) | $3,793 | $(3,068) | $35,898 | — | $3,589,826 |
| Multifactor Energy ETF | |||||||||
| John Hancock Collateral Trust* | — | $59,622 | $350,376 | $(410,002) | $18 | $(14) | $324 | — | — |
| Multifactor Financials ETF | |||||||||
| John Hancock Collateral Trust* | 5,116 | $35,481 | $362,886 | $(347,151) | $5 | $(14) | $197 | — | $51,207 |
| Multifactor Healthcare ETF | |||||||||
| John Hancock Collateral Trust* | 18,086 | $183,786 | $2,188,210 | $(2,190,931) | $23 | $(68) | $517 | — | $181,020 |
| 108 | JOHN HANCOCK MULTIFACTOR ETFS | SEMIANNUAL REPORT |
| Dividends and distributions | |||||||||
| Affiliate | Ending
share amount |
Beginning
value |
Cost
of purchases |
Proceeds
from shares sold |
Realized
gain (loss) |
Change
in unrealized appreciation (depreciation) |
Income
distributions received |
Capital
gain distributions received |
Ending
value |
| Multifactor Industrials ETF | |||||||||
| John Hancock Collateral Trust* | 4,371 | $95,357 | $854,728 | $(906,329) | $15 | $(22) | $1,018 | — | $43,749 |
| Multifactor Large Cap ETF | |||||||||
| John Hancock Collateral Trust* | 203,549 | $1,882,757 | $16,906,068 | $(16,751,795) | $1,308 | $(1,100) | $16,307 | — | $2,037,238 |
| Multifactor Materials ETF | |||||||||
| John Hancock Collateral Trust* | 34,557 | — | $662,858 | $(316,985) | $(3) | $(3) | $227 | — | $345,867 |
| Multifactor Media and Communications ETF | |||||||||
| John Hancock Collateral Trust* | — | $150,711 | $4,318,637 | $(4,469,400) | $81 | $(29) | $5,305 | — | — |
| Multifactor Mid Cap ETF | |||||||||
| John Hancock Collateral Trust* | 1,172,752 | $9,727,116 | $72,685,422 | $(70,675,216) | $4,741 | $(4,456) | $62,905 | — | $11,737,607 |
| Multifactor Small Cap ETF | |||||||||
| John Hancock Collateral Trust* | 1,132,805 | $12,670,705 | $72,642,745 | $(73,975,769) | $6,387 | $(6,275) | $31,442 | — | $11,337,793 |
| Multifactor Technology ETF | |||||||||
| John Hancock Collateral Trust* | 31,894 | $149,493 | $3,253,025 | $(3,083,290) | $47 | $(61) | $479 | — | $319,214 |
| * | Refer to the Securities lending note within Note 2 for details regarding this investment. |
| SEMIANNUAL REPORT | JOHN HANCOCK MULTIFACTOR ETFS | 109 |
CONTINUATION OF INVESTMENT ADVISORY AND SUBADVISORY AGREEMENTS
Evaluation of Advisory and Subadvisory Agreements by the Board of Trustees
This section describes the evaluation by the Board of Trustees (the Board) of John Hancock Exchange-Traded Fund Trust (the Trust) of the Advisory Agreement (the Advisory Agreement) with John Hancock Investment Management LLC (the Advisor) and the Subadvisory Agreement (the Subadvisory Agreement) with Dimensional Fund Advisors LP (the Subadvisor) with respect to each of the portfolios of the Trust (the Funds). The Advisory Agreement and Subadvisory Agreement are collectively referred to as the Agreements. Prior to the June 23-25, 2020 telephonic1 meeting at which the Agreements were approved, the Board also discussed and considered information regarding the proposed continuation of the Agreements at a telephonic meeting held on May 26-27, 2020.
Approval of Advisory and Subadvisory Agreements
At a telephonic meeting held on June 23-25, 2020, the Board, including the Trustees who are not parties to any Agreement or considered to be interested persons of the Trust under the Investment Company Act of 1940, as amended (the 1940 Act) (the Independent Trustees), reapproved for an annual period the continuation of the Advisory Agreement between the Trust and the Advisor and the Subadvisory Agreement between the Advisor and the Subadvisor with respect to each of the Funds identified in Appendix A.
In considering the Advisory Agreement and the Subadvisory Agreement with respect to each Fund, the Board received in advance of the meetings a variety of materials relating to each Fund, the Advisor and the Subadvisor, including comparative performance, fee and expense information for peer groups of similar funds prepared by an independent third-party provider of fund data; performance information for the Funds' benchmark indices; and, with respect to the Subadvisor, comparative performance information for comparably managed accounts, as applicable; and other information provided by the Advisor and the Subadvisor regarding the nature, extent and quality of services provided by the Advisor and the Subadvisor under their respective Agreements, as well as information regarding the Advisor's revenues and costs of providing services to the Funds and any compensation paid to affiliates of the Advisor. At the meetings at which the renewal of the Advisory Agreement and Subadvisory Agreement are considered, particular focus is given to information concerning Fund performance, comparability of fees and total expenses, and profitability. However, the Board noted that the evaluation process with respect to the Advisor and the Subadvisor is an ongoing one. In this regard, the Board also took into account discussions with management and information provided to the Board (including its various committees) at prior meetings with respect to the services provided by the Advisor and the Subadvisor to the Funds, including quarterly performance reports prepared by management containing reviews of investment results and prior presentations from the Subadvisor with respect to the Funds they manage. The information received and considered by the Board in connection with the May and June meetings and throughout the year was both written and oral. The Board also considered the nature, quality, and extent of the non-advisory services, if any, to be provided to the Funds by the Advisor and/or its affiliates, including administrative services. The Board considered the Advisory Agreement and the Subadvisory Agreement separately in the course of its review. In doing so, the Board noted the respective roles of the Advisor and Subadvisor in providing services to the Funds. In addition, although the Board approved the renewal of the Agreements for all the Funds at the June meeting, the Board considered each Fund separately.
Throughout the process, the Board asked questions of and requested additional information from management. The Board is assisted by counsel for the Trust and the Independent Trustees are also separately assisted by independent legal counsel throughout the process. The Independent Trustees also received a memorandum from their independent legal counsel discussing the legal standards for their consideration of the proposed continuation of the Agreements and discussed the proposed continuation of the Agreements in private sessions with their independent legal counsel at which no representatives of management were present.
Approval of Advisory Agreement
In approving the Advisory Agreement with respect to each Fund, the Board, including the Independent Trustees, considered a variety of factors, including those discussed below. The Board also considered other factors (including conditions and trends prevailing generally in the economy, the securities markets and the industry) and did not treat any single factor as determinative, and each Trustee may have attributed different weights to different factors. The Board's conclusions may be based in part on its consideration of the advisory and subadvisory arrangements in prior years and on the Board's ongoing regular review of Fund performance and operations throughout the year.
Nature, extent and quality of services. Among the information received by the Board from the Advisor relating to the nature, extent, and quality of services provided to the Funds, the Board reviewed information provided by the Advisor relating to its operations and personnel, descriptions of its organizational and management structure, and information regarding the Advisor's compliance and regulatory history, including its Form ADV. The Board also noted that on a regular basis it receives and reviews information from the Trust's Chief Compliance Officer (CCO) regarding the Funds' compliance policies and procedures established pursuant to Rule 38a-1 under the 1940 Act. The Board observed that the scope of services provided by the Advisor, and of the undertakings required of the Advisor in connection with those services, including maintaining and monitoring its own and the fund's compliance programs, risk management programs, liquidity management programs and cybersecurity programs, had expanded over time as a result of regulatory, market and other developments. The Board considered that the Advisor is responsible for the management of the day-to-day operations of the Funds, including, but not limited to, general supervision of and coordination of the services provided by the
____________________
1 On
March 25, 2020, as a result of health and safety measures put in place to combat
the global COVID-19 pandemic, the Securities and Exchange Commission
issued an exemptive order (the "Order") pursuant to Sections 6(c) and
38(a) of the Investment Company Act of 1940, as amended (the "1940
Act"), that temporarily exempts registered investment management
companies from the in-person voting requirements under the 1940 Act,
subject to certain requirements, including that votes taken pursuant
to the Order are ratified at the next in-person meeting. The Board
determined that reliance on the Order was necessary or appropriate
due to the circumstances related to current or potential effects of
COVID-19 and therefore, the Board's May and June meetings were held
telephonically in reliance on the Order.
Subadvisor, and is also responsible for monitoring and reviewing the activities of the Subadvisor and other third-party service providers, including the Funds' distributor. The Board also considered the significant risks assumed by the Advisor in connection with the services provided to the Funds including entrepreneurial risk in sponsoring new Funds and ongoing risks including investment, operational, enterprise, litigation, regulatory and compliance risks with respect to all Funds.
In considering the nature, extent, and quality of the services provided by the Advisor, the Trustees also took into account their knowledge of the Advisor's management and the quality of the performance of the Advisor's duties, through Board meetings, discussions and reports during the preceding year and through each Trustee's experience as a Trustee of the Trust and of the other trusts in the John Hancock group of funds complex (the John Hancock Fund Complex).
In the course of their deliberations regarding the Advisory Agreement, the Board considered, among other things:
The Board concluded that the Advisor may reasonably be expected to continue to provide a high quality of services under the Advisory Agreement with respect to the Funds.
Investment performance. In considering each Fund's performance, the Board noted that it reviews at its regularly scheduled meetings information about the Funds' performance results. In connection with the consideration of the Advisory Agreement, the Board:
| (a) | reviewed information prepared by management regarding the Funds' performance; | |
| (b) | considered the comparative performance of each Fund's respective benchmark index; | |
| (c) | considered the performance of comparable funds, if any, as included in the report prepared by an independent third-party provider of fund data; and | |
| (d) | took into account the Advisor's analysis of each Fund's performance and its plans and recommendations regarding the Trust's subadvisory arrangements generally and with respect to particular Funds. |
The Board noted that while it found the data provided by the independent third-party generally useful it recognized its limitations, including in particular that the data may vary depending on the end date selected and the results of the performance comparisons may vary depending on the selection of the peer group. The Board reviewed Fund performance against each Fund's respective benchmark and concluded that the performance of certain Funds has generally been in line with or generally outperformed the historical performance of comparable funds based on the median percentile and/or each Fund's respective benchmark with certain exceptions noted in Appendix A. In such cases, the Board concluded that such performance is being monitored and reasonably addressed, where appropriate.
Fees and expenses. The Board reviewed comparative information prepared by an independent third-party provider of fund data, including, among other data, each Fund's contractual and net management fees (and subadvisory fees, to the extent available) and total expenses as compared to similarly situated investment companies deemed to be comparable to the Fund in light of the nature, extent and quality of the management and advisory and subadvisory services provided by the Advisor and the Subadvisor. The Board considered each Fund's ranking within a smaller group of peer funds chosen by the independent third-party provider, as well as the Fund's ranking within broader groups of funds. In comparing each Fund's contractual and net management fees to that of comparable funds, the Board noted that such fees include both advisory and administrative costs.
The Board took into account management's discussion of the Funds' expenses, including actions taken over the past year to reduce management fees for certain of the Funds. The Board also took into account management's discussion with respect to the overall management fee and the fees of the Subadvisor, including the amount of the advisory fee retained by the Advisor after payment of the subadvisory fee, in each case in light of the services rendered for those amounts and the risks undertaken by the Advisor. The Board also noted that the Advisor pays the subadvisory fees of the Funds, and that such fees are negotiated at arm's length with respect to the Subadvisor. The Board also took into account that management had agreed to implement an overall fee waiver across the complex, including each of the Funds, which is discussed further below. The Board also noted management's discussion of the Funds' expenses, as well as any actions taken over the past several years to reduce the Funds' operating expenses. The Board also noted that, in addition, the Advisor is currently waiving fees and/or reimbursing expenses with respect to each Fund. The Board also took into account that management has approved the implementation of breakpoints in each Fund's subadvisory fee schedule. The Board reviewed information provided by the Advisor concerning the investment advisory fees charged by the Advisor or one of its advisory affiliates to other clients (including other funds in the John Hancock Fund Complex) having similar investment mandates, if any. The Board considered any differences between the Advisor's and Subadvisor's services to a Fund and the services they provide to other comparable clients or funds. The Board concluded that the advisory fee paid with respect to each of the Funds is reasonable in light of the nature, extent and quality of the services provided to the Funds under the Advisory Agreement.
Profitability/Fall out benefits. In considering the costs of the services to be provided and the profits to be realized by the Advisor and its affiliates from the Advisor's relationship with the Trust, the Board:
| (a) | reviewed financial information of the Advisor; | |
| (b) | reviewed and considered information presented by the Advisor regarding the net profitability to the Advisor and its affiliates, of each Fund; | |
| (c) | received and reviewed profitability information with respect to the John Hancock Fund Complex as a whole and with respect to each Fund; | |
| (d) | received information with respect to the Advisor's allocation methodologies used in preparing the profitability data and considered that the Advisor hired an independent third-party consultant to provide an analysis of the Advisor's allocation methodologies; | |
| (e) | considered that the John Hancock insurance companies that are affiliates of the Advisor, as shareholders of the Trust directly or through their separate accounts, receive certain tax credits or deductions relating to foreign taxes paid and dividends received by certain Funds of the Trust and noted that these tax benefits, which are not available to participants in qualified retirement plans under applicable income tax law, are reflected in the profitability analysis reviewed by the Board; | |
| (f) | considered that the Advisor also provides administrative services to the Funds on a cost basis pursuant to an administrative services agreement; | |
| (g) | noted that the Advisor also derives reputational and other indirect benefits from providing advisory services to the Funds; | |
| (h) | noted that the subadvisory fees for the Funds are paid by the Advisor and are negotiated at arm's length; | |
| (i) | noted that the Advisor also pays the Subadvisor a license fee in connection with each Fund's use of its Underlying Index; | |
| (j) | considered the Advisor's ongoing costs and expenditures necessary to improve services, meet new regulatory and compliance requirements, and adapt to other challenges impacting the fund industry; and | |
| (k) | considered that the Advisor should be entitled to earn a reasonable level of profits in exchange for the level of services it provides to each Fund and the risks that it assumes as Advisor, including entrepreneurial, operational, reputational, litigation and regulatory risk. |
Based upon its review, the Board concluded that the level of profitability, if any, of the Advisor and its affiliates from their relationship with each Fund was reasonable and not excessive.
Economies of scale. In considering the extent to which a Fund may realize any economies of scale and whether fee levels reflect these economies of scale for the benefit of Fund shareholders, the Board:
| (a) | considered that the Advisor has contractually agreed to waive a portion of its management fee for certain funds of the John Hancock Fund Complex, including the Funds (the participating portfolios) or otherwise reimburse the expenses of the participating portfolios (the reimbursement). This waiver is based upon aggregate net assets of all the participating portfolios. The amount of the reimbursement is calculated daily and allocated among all the participating portfolios in proportion to the daily net assets of each Fund; | |
| (b) | the Board also took into account management's discussion of each Fund's advisory fee structure; and | |
| (c) | considered the effect of the Funds' growth in size on their performance and fees. The Board also noted that if the Funds' assets increase over time, the Funds may realize other economies of scale. |
Approval of Subadvisory Agreement
In making its determination with respect to approval of the Subadvisory Agreement, the Board reviewed:
| (1) | information relating to the Subadvisor's business, including current subadvisory services to the Trust (and other funds in the John Hancock Fund Complex); | |
| (2) | the historical and current performance of each Fund and comparative performance information relating to the Fund's benchmark and comparable funds; | |
| (3) | the subadvisory fee for each Fund, including the approved breakpoints for each of the Funds and to the extent available, comparable fee information prepared by an independent third-party provider of fund data; and | |
| (4) | information relating to the nature and scope of any material relationships and their significance to the Trust's Advisor and Subadvisor. |
Nature, extent and quality of services. With respect to the services provided by the Subadvisor with respect to each Fund, the Board received information provided to the Board by the Subadvisor, including the Subadvisor's Form ADV, as well as took into account information presented throughout the past year. The Board considered the Subadvisor's current level of staffing and its overall resources, as well as received information relating to the Subadvisor's compensation program. The Board reviewed the Subadvisor's history and investment experience, as well as information regarding the qualifications, background, and responsibilities of the Subadvisor's investment and compliance personnel who provide services to the Funds. The Board also considered, among other things, the Subadvisor's compliance program and any disciplinary history. The Board also considered the Subadvisor's risk assessment and monitoring process. The Board reviewed the Subadvisor's regulatory history, including whether it was involved in any regulatory actions or investigations as well as material litigation, and any settlements and amelioratory actions undertaken, as appropriate. The Board noted that the Advisor conducts regular, periodic reviews of the Subadvisor and its operations, including regarding investment processes and organizational and staffing matters. The Board also noted that the Trust's CCO and his staff conduct regular, periodic compliance reviews with the Subadvisor and present reports to the Independent Trustees regarding the same, which includes evaluating the regulatory compliance systems of the Subadvisor and procedures reasonably designed to assure compliance with the federal securities laws. The Board also took into account the financial condition of the Subadvisor.
The Board considered the Subadvisor's investment process and philosophy. The Board took into account that the Subadvisor's responsibilities include the development and maintenance of an investment program for each Fund that is consistent with the Fund's investment objective, the selection of investment securities and the placement of orders for the purchase and sale of such securities, as well as the implementation of compliance controls related to performance of these services. The Board also received information with respect to the Subadvisor's brokerage policies and practices, including with respect to best execution and soft dollars.
Subadvisor compensation. In considering the cost of services to be provided by the Subadvisor and the profitability to the Subadvisor of its relationship with each Fund, the Board noted that the fees under the Subadvisory Agreement are paid by the Advisor and not the Funds.
The Board also relied on the ability of the Advisor to negotiate the Subadvisory Agreement with the Subadvisor, which is not affiliated with the Advisor, and the fees thereunder at arm's length. As a result, the costs of the services to be provided and the profits to be realized by the Subadvisor from its relationship with the Trust were not a material factor in the Board's consideration of the Subadvisory Agreement.
The Board also received information regarding the nature and scope (including their significance to the Advisor and its affiliates and to the Subadvisor) of any material relationships with respect to the Subadvisor, which include arrangements in which the Subadvisor or its affiliates provide advisory, distribution, or management services in connection with financial products sponsored by the Advisor or its affiliates, and may include other registered investment companies, a 529 education savings plan, managed separate accounts and exempt group annuity contracts sold to qualified plans. The Board also received information and took into account any other potential conflicts of interest the Advisor might have in connection with the Subadvisory Agreement.
In addition, the Board considered other potential indirect benefits that the Subadvisor and its affiliates may receive from the Subadvisor's relationship with the Funds, such as the opportunity to provide advisory services to additional funds in the John Hancock Fund Complex and reputational benefits.
Subadvisory fees. The Board considered that the Fund pays an advisory fee to the Advisor and that, in turn, the Advisor pays subadvisory fees to the Subadvisor. As noted above, the Board also considered each Fund's subadvisory fees as compared to similarly situated investment companies deemed to be comparable to the Funds as included in the report prepared by the independent third-party provider of fund data, to the extent available. The Board noted that the limited size of the Lipper peer groups were not sufficient for comparative purposes. The Board also took into account the subadvisory fees paid by the Advisor to the Subadvisor with respect to the Funds to fees charged by each Fund's Subadvisor to manage other subadvised portfolios and portfolios not subject to regulation under the 1940 Act, as applicable.
Subadvisor performance. As noted above, the Board considered each Fund's performance as compared to the Fund's respective peer group median and the benchmark index and noted that the Board reviews information about the Fund's performance results at its regularly scheduled meetings. The Board noted the Advisor's expertise and resources in monitoring the performance, investment style, and risk-adjusted performance of the Subadvisor. The Board was mindful of the Advisor's focus on the Subadvisor's performance. The Board also noted the Subadvisor's long-term performance record for similar accounts, as applicable.
The Board's decision to approve the Subadvisory Agreement with respect to each Fund was based on a number of determinations, including the following:
| (1) | the Subadvisor has extensive experience and demonstrated skills as a manager; | |
| (2) | although not without variation, the performance of certain Funds have generally been in line with or generally outperformed the historical performance of comparable funds, based on the median percentile, and/or each Fund's respective benchmark, with certain exceptions noted in Appendix A; | |
| (3) | the subadvisory fees are reasonable in relation to the level and quality of services being provided under the Subadvisory Agreement; and | |
| (4) | that the subadvisory fees are paid by the Advisor and not the Funds and the Board has approved the implementation of breakpoints to each of the Fund's subadvisory fee schedule. |
Additional information relating to each Fund's fees and expenses and performance that the Board considered in approving the Advisory Agreement and Subadvisory Agreement for a particular Fund is set forth in Appendix A.
* * *
Based on the Board's evaluation of all factors that the Board deemed to be material, including those factors described above, and assisted by the advice of independent legal counsel, the Board, including the Independent Trustees, concluded that renewal of the Advisory Agreement and the Subadvisory Agreement with respect to each Fund would be in the best interest of each of the respective Funds and its shareholders. Accordingly, the Board, and the Independent Trustees voting separately, approved the Advisory Agreement and Subadvisory Agreement with respect to each Fund for an additional one-year period.
APPENDIX A
| Portfolio (subadvisors) | Performance of fund, as of 12.31.2019 |
Fees and expenses | Comments | ||||||||
|
Multifactor Consumer Discretionary ETF (Dimensional Fund Advisors LP) |
Benchmark Index - The fund underperformed for the one- and three-year
periods and for the period since
September 30, 2015. Morningstar Category - The fund outperformed the peer group median
for the one- and three-year periods and for the period since
September 30, 2015. |
Subadvisor fee comparative data not provided due to limited size of
Lipper peer group for this purpose.
Net management fees for this fund are lower than the peer group median. Net total expenses for this fund are equal to the peer group median. |
The Board took into account management's discussion of the fund's performance, including the favorable performance relative to the peer group median for the one- and three-year periods and for the period since September 30, 2015. | ||||||||
|
Multifactor Consumer Staples ETF (Dimensional Fund Advisors LP) |
Benchmark Index - The fund outperformed for the one- and three-year
periods and for the period since
March 31, 2016. Morningstar Category - The fund outperformed the peer group median
for the one-year period and underperformed the peer group median for
the three-year period and for the period since
March 31, 2016. |
Subadvisor fee comparative data not provided due to limited size of
Lipper peer group for this purpose.
Net management fees for this fund are lower than the peer group median. Net total expenses for this fund are lower than the peer group median. |
The Board took into account management's discussion of the fund's performance, including the favorable performance relative to the benchmark index for the one- and three-year periods and for the period since March 31, 2016 and to the peer group median for the one-year period. | ||||||||
|
Multifactor Developed International ETF (Dimensional Fund Advisors LP) |
Benchmark Index - The fund underperformed, for the one- and
three-year periods and for the period since
December 31, 2016. Morningstar Category - The fund underperformed the peer group median
for the one- and three-year periods and for the period since
December 31, 2016. |
Subadvisor fee comparative data not provided due to limited size of
Lipper peer group for this purpose.
Net management fees for this fund are higher than the peer group median. Net total expenses for this fund are higher than the peer group median. |
The Board took into account management's discussion of the factors
that contributed to the Fund's performance relative to the benchmark
index and peer group median for the one- and three-year periods and
the period since
December 31, 2016, including the impact of past and current market conditions on the
fund's strategy and management's plans for the fund.
The Board took into account management's discussion of the fund's expenses. |
||||||||
|
Multifactor Emerging Markets ETF (Dimensional Fund Advisors LP) |
Benchmark Index - The fund underperformed, for the one-year period
and for the period since
September 30, 2018. Morningstar Category - The fund outperformed the peer group median
for the one-year period and underperformed for the period since
September 30, 2018. |
Subadvisor fee comparative data not provided due to limited size of
Lipper peer group for this purpose.
Net management fees for this fund are lower than the peer group median. Net total expenses for this fund are higher than the peer group median. |
The Board took into account management's discussion of the fund's
performance, including the favorable performance relative to the peer
group median for the one-year period.
The Board took into account management's discussion of the fund's expenses. |
||||||||
|
Multifactor Energy ETF (Dimensional Fund Advisors LP) |
Benchmark Index - The fund underperformed for the one- and three-year
periods and for the period since
March 31, 2016. Morningstar Category - The fund outperformed the peer group median
for the one- and three-year periods and for the period since
March 31, 2016. |
Subadvisor fee comparative data not provided due to limited size of
Lipper peer group for this purpose.
Net management fees for this fund are lower than the peer group median. Net total expenses for this fund are lower than the peer group median. |
The Board took into account management's discussion of the fund's
performance, including the favorable performance relative to the peer
group median for the one- and three-year periods and for the period
since
March 31, 2016. |
| Portfolio (subadvisors) | Performance of fund, as of 12.31.2019 |
Fees and expenses | Comments | ||||||||
|
Multifactor Financials ETF (Dimensional Fund Advisors LP) |
Benchmark Index - The fund outperformed for the one-year period and
underperformed for the three-year period and for the period since
September 30, 2015. Morningstar Category - The fund outperformed the peer group median
for the one- and three-year periods and for the period since
September 30, 2015. |
Subadvisor fee comparative data not provided due to limited size of
Lipper peer group for this purpose.
Net management fees for this fund are lower than the peer group median. Net total expenses for this fund are equal to the peer group median. |
The Board took into account management's discussion of the fund's
performance, including the favorable performance relative to the
benchmark for the one-year period and to the peer group median for
the one- and three-year periods and for the period since
September 30, 2015. |
||||||||
|
Multifactor Healthcare ETF (Dimensional Fund Advisors LP) |
Benchmark Index - The fund underperformed for the one- and three-year
periods and for the period since
September 30, 2015. Morningstar Category - The fund underperformed the peer group median
for the one- and three-year periods and outperformed the median for
the period since
September 30, 2015. |
Subadvisor fee comparative data not provided due to limited size of
Lipper peer group for this purpose.
Net management fees for this fund are lower than the peer group median. Net total expenses for this fund are lower than the peer group median. |
The Board took into account management's discussion of the fund's
performance, including the favorable performance relative to the peer
group median for the period since
September 30, 2015. The Board took into account management's discussion of the factors
that contributed to the fund's performance relative to the benchmark
index for the one- and three-year periods and for the period since
September 30, 2015 and relative to the peer group median for the one- and three-year
periods, including the impact of past and current market conditions
on the fund's strategy and management's outlook for the fund.
|
||||||||
|
Multifactor Industrials ETF (Dimensional Fund Advisors LP) |
Benchmark Index - The fund outperformed for the one- and three-year
periods and for the period since
March 31, 2016. Morningstar Category - The fund outperformed the peer group median
for the one- and three-year periods and for the period since
March 31, 2016. |
Subadvisor fee comparative data not provided due to limited size of
Lipper peer group for this purpose.
Net management fees for this fund are lower than the peer group median. Net total expenses for this fund are lower than the peer group median. |
The Board took into account management's discussion of the fund's performance, including the favorable performance relative to the benchmark index and peer group median for the one- and three-year periods and for the period since March 31, 2016. | ||||||||
|
Multifactor Large Cap ETF (Dimensional Fund Advisors LP) |
Benchmark Index - The fund underperformed for the one- and three-year
periods and for the period since
September 30, 2015. Morningstar Category - The fund outperformed the peer group median
for the one-year period and underperformed the median for the
three-year period and for the period since
September 30, 2015. |
Subadvisor fee comparative data not provided due to limited size of
Lipper peer group for this purpose.
Net management fees for this fund are higher than the peer group median. Net total expenses for this fund are higher than the peer group median. |
The Board took into account management's discussion of the fund's
performance, including the favorable performance relative to the peer
group median for the one-year period.
The Board took into account management's discussion of the factors
that contributed to the Fund's performance relative to the benchmark
index for the one- and three-year periods and for the period since
September 30, 2015 and relative to the peer group median for the three-year period and
the period since
September 30, 2015, including the impact of past and current market conditions on the
Fund's strategy and management's plans for the Fund.
The Board took into account management's discussion of the fund's expenses. |
| Portfolio (subadvisors) | Performance of fund, as of 12.31.2019 |
Fees and expenses | Comments | ||||||||
|
Multifactor Materials ETF (Dimensional Fund Advisors LP) |
Benchmark Index - The fund underperformed for the one- and three-year
periods and for the period since
March 31, 2016. Morningstar Category - The fund outperformed the peer group median
for the one- and three-year periods and for the period since
March 31, 2016. |
Subadvisor fee comparative data not provided due to limited size of
Lipper peer group for this purpose.
Net management fees for this fund are lower than the peer group median. Net total expenses for this fund are lower than the peer group median. |
The Board took into account management's discussion of the fund's performance, including the favorable performance relative to the peer group median for the one- and three-year periods and for the period since March 31, 2016. | ||||||||
|
Multifactor Media and Communications ETF (Dimensional Fund Advisors LP) |
Benchmark Index - The fund outperformed for the period since
March 31, 2019. Morningstar Category - The fund outperformed the peer group median
for the period since
March 31, 2019. |
Subadvisor fee comparative data not provided due to limited size of
Lipper peer group for this purpose.
Net management fees for this fund are lower than the peer group median. Net total expenses for this fund are equal to the peer group median. |
The Board took into account management's discussion of the fund's
performance, including the favorable performance relative to the
benchmark index and peer group median for the period since
March 31, 2019. The Board also noted the relatively short performance history of the fund. |
||||||||
|
Multifactor Mid Cap ETF (Dimensional Fund Advisors LP) |
Benchmark Index - The fund underperformed for the one-year period and
outperformed for the three-year period and for the period since
September 30, 2015. Morningstar Category - The fund outperformed the peer group median
for the one- and three-year periods and for the period since
September 30, 2015. |
Subadvisor fee comparative data not provided due to limited size of
Lipper peer group for this purpose.
Net management fees for this fund are equal to the peer group median. Net total expenses for this fund are higher than the peer group median. |
The Board took into account management's discussion of the fund's
performance, including the favorable performance relative to the
benchmark index for the three-year period and for the period since
September 30, 2015 and to the peer group median for the one- and three-year periods and
for the period since
September 30, 2015. The Board took into account management's discussion of the fund's expenses. |
||||||||
|
Multifactor Small Cap ETF (Dimensional Fund Advisors LP) |
Benchmark Index - The fund underperformed for the one-year period and
for the period since
November 30, 2017. Morningstar Category - The fund outperformed the peer group median
for the one-year period and underperformed the peer group median for
the period since
November 30, 2017. |
Subadvisor fee comparative data not provided due to limited size of
Lipper peer group for this purpose.
Net management fees for this fund are higher than the peer group median. Net total expenses for this fund are higher than the peer group median. |
The Board took into account management's discussion of the fund's
performance, including the favorable performance relative to the peer
group median for the one-year period.
The Board took into account management's discussion of the fund's expenses. |
||||||||
|
Multifactor Technology ETF (Dimensional Fund Advisors LP) |
Benchmark Index - The fund underperformed for the one- and three-year
periods and for the period since
September 30, 2015. Morningstar Category - The fund outperformed the peer group median
for the one-year period and underperformed the peer group median for
the three-year period and for the period since
September 30, 2015. |
Subadvisor fee comparative data not provided due to limited size of
Lipper peer group for this purpose.
Net management fees for this fund are lower than the peer group median. Net total expenses for this fund are lower than the peer group median. |
The Board took into account management's discussion of the fund's
performance, including the favorable performance relative to the peer
group median for the one-year period.
The Board took into account management's discussion of the factors
that contributed to the Fund's performance relative to the benchmark
index for the one- and three-year periods and the period since
September 30, 2015 and relative to the peer group median for the three-year period and
the period since
September 30, 2015, including the impact of past and current market conditions on the
Fund's strategy and management's outlook for the Fund.
|
| Portfolio (subadvisors) | Performance of fund, as of 12.31.2019 |
Fees and expenses | Comments | ||||||||
|
Multifactor Utilities ETF (Dimensional Fund Advisors LP) |
Benchmark Index - The fund underperformed for the one-year period and
outperformed for the three-year period and for the period since
March 31, 2016. Morningstar Category - The fund underperformed the peer group median
for the one- and three-year periods and for the period since
March 31, 2016. |
Subadvisor fee comparative data not provided due to limited size of
Lipper peer group for this purpose.
Net management fees for this fund are lower than the peer group median. Net total expenses for this fund are lower than the peer group median. |
The Board took into account management's discussion of the fund's
performance, including favorable performance relative to the
benchmark index for the one- and three-year periods and the period
since
March 31, 2016. The Board took into account management's discussion of the factors
that contributed to the Fund's performance relative to the benchmark
index for the one- year period and relative to the peer group median
for the one- and three-year periods and the period since
March 31, 2016, including the impact of past and current market conditions on the
Fund's strategy and management's outlook for the Fund.
|
|
Trustees Hassell H. McClellan, Chairperson Officers Andrew G. Arnott Charles A. Rizzo Salvatore Schiavone Christopher (Kit) Sechler Trevor Swanberg2 |
Investment advisor John Hancock Investment Management LLC Subadvisor Dimensional Fund Advisors LP Portfolio Managers Joseph F. Hohn Principal distributor Foreside Fund Services, LLC Custodian State Street Bank and Trust Company Transfer agent State Street Bank and Trust Company Legal counsel Dechert LLP |
* Member of the Audit Committee
† Non-Independent Trustee
1 Appointed as Independent Trustee effective as of
September 15, 2020
2 Effective
July 31, 2020
The funds' proxy voting policies and procedures, as well as the funds' proxy voting record for the most recent twelve-month period ended June 30, are available free of charge on the Securities and Exchange Commission (SEC) website at sec.gov or on our website.
All of the funds' holdings as of the end of the third month of every fiscal quarter are filed with the SEC on Form N-PORT within 60 days of the end of the fiscal quarter. The funds' Form N-PORT filings are available on our website and the SEC's website, sec.gov.
We make this information on your funds', as well as monthly portfolio holdings, and other funds' details available on our website at jhinvestments.com/etf or by calling 800-225-6020.
| You can also contact us: | |||
| 800-225-6020 jhinvestments.com/etf |
Regular mail: John Hancock |
||
John Hancock family of funds
|
DOMESTIC EQUITY FUNDS Blue Chip Growth Classic Value Disciplined Value Disciplined Value Mid Cap Equity Income Financial Industries Fundamental All Cap Core Fundamental Large Cap Core New Opportunities Regional Bank Small Cap Core Small Cap Growth Small Cap Value U.S. Global Leaders Growth U.S. Growth GLOBAL AND INTERNATIONAL EQUITY FUNDS Disciplined Value International Emerging Markets Emerging Markets Equity Fundamental Global Franchise Global Equity Global Shareholder Yield Global Thematic Opportunities International Dynamic Growth International Growth International Small Company |
INCOME FUNDS Bond California Tax-Free Income Emerging Markets Debt Floating Rate Income Government Income High Yield High Yield Municipal Bond Income Investment Grade Bond Money Market Short Duration Bond Short Duration Credit Opportunities Strategic Income Opportunities Tax-Free Bond ALTERNATIVE AND SPECIALTY FUNDS Absolute Return Currency Alternative Asset Allocation Alternative Risk Premia Diversified Macro Infrastructure Multi-Asset Absolute Return Seaport Long/Short |
|
ASSET ALLOCATION Balanced Multi-Asset High Income Multi-Index Lifetime Portfolios Multi-Index Preservation Portfolios Multimanager Lifestyle Portfolios Multimanager Lifetime Portfolios Retirement Income 2040 EXCHANGE-TRADED FUNDS John Hancock Multifactor Consumer Discretionary ETF John Hancock Multifactor Consumer Staples ETF John Hancock Multifactor Developed International ETF John Hancock Multifactor Emerging Markets ETF John Hancock Multifactor Energy ETF John Hancock Multifactor Financials ETF John Hancock Multifactor Healthcare ETF John Hancock Multifactor Industrials ETF John Hancock Multifactor Large Cap ETF John Hancock Multifactor Materials ETF John Hancock Multifactor Media and John Hancock Multifactor Mid Cap ETF John Hancock Multifactor Small Cap ETF John Hancock Multifactor Technology ETF John Hancock Multifactor Utilities ETF |
ENVIRONMENTAL, SOCIAL, AND ESG All Cap Core ESG Core Bond ESG International Equity ESG Large Cap Core CLOSED-END FUNDS Financial Opportunities Hedged Equity & Income Income Securities Trust Investors Trust Preferred Income Preferred Income II Preferred Income III Premium Dividend Tax-Advantaged Dividend Income Tax-Advantaged Global Shareholder Yield |
John Hancock Multifactor ETF shares are bought and sold at market price (not NAV), and are not individually redeemed from the fund. Brokerage commissions will reduce returns.
John Hancock ETFs are distributed by Foreside Fund Services, LLC, and are subadvised by Dimensional Fund Advisors LP. Foreside is not affiliated with John Hancock Investment Management Distributors LLC or Dimensional Fund Advisors LP.
Dimensional Fund Advisors LP receives compensation from John Hancock in connection with licensing rights to the John Hancock Dimensional indexes. Dimensional Fund Advisors LP does not sponsor, endorse, or sell, and makes no representation as to the advisability of investing in, John Hancock Multifactor ETFs.
John Hancock Investment Management
A trusted brand
John Hancock Investment Management is a premier asset manager with a
heritage of financial
stewardship dating back to 1862. Helping our shareholders pursue
their financial goals is at the
core of everything we do. It's why we support the role of
professional financial advice and operate
with the highest standards of conduct and integrity.
A better way to invest
We serve investors globally through a unique multimanager approach:
We search the world to find
proven portfolio teams with specialized expertise for every strategy
we offer, then we apply robust
investment oversight to ensure they continue to meet our
uncompromising standards and serve the
best interests of our shareholders.
Results for investors
Our unique approach to asset management enables us to provide a
diverse set of investments backed
by some of the world's best managers, along with strong risk-adjusted
returns across asset classes.
![]()
John Hancock Investment Management LLC n 200 Berkeley Street n Boston, MA 02116 n 800-225-6020 n jhinvestments.com/etf
This report is for the information of the shareholders of John Hancock Multifactor ETFs. It is not authorized for distribution to prospective investors unless preceded or accompanied by a prospectus.
| JHAN-20180615-0136 | ETFSA 10/20 12/2020 |
ITEM 2. CODE OF ETHICS.
Not applicable at this time.
ITEM 3. AUDIT COMMITTEE FINANCIAL EXPERT.
Not applicable at this time.
ITEM 4. PRINCIPAL ACCOUNTANT FEES AND SERVICES.
Not applicable at this time.
ITEM 5. AUDIT COMMITTEE OF LISTED REGISTRANTS.
Not applicable at this time.
ITEM 6. SCHEDULE OF INVESTMENTS.
(a) Not applicable.
(b) Not applicable.
ITEM 7. DISCLOSURE OF PROXY VOTING POLICIES AND PROCEDURES FOR CLOSED-END MANAGEMENT INVESTMENT COMPANIES.
Not applicable.
ITEM 8. PORTFOLIO MANAGERS OF CLOSED-END MANAGEMENT INVESTMENT COMPANIES.
Not applicable.
ITEM 9. PURCHASES OF EQUITY SECURITIES BY CLOSED-END MANAGEMENT INVESTMENT COMPANY AND AFFILIATED PURCHASERS.
Not applicable.
ITEM 10. SUBMISSION OF MATTERS TO A VOTE OF SECURITY HOLDERS.
The registrant has adopted procedures by which shareholders may recommend nominees to the registrant’s Board of Trustees. A copy of the procedures is filed as an exhibit to this Form N-CSR. See attached “John Hancock Funds – Nominating and Governance Committee Charter.”
ITEM 11. CONTROLS AND PROCEDURES.
(a) Based upon their evaluation of the registrant's disclosure controls and procedures as conducted within 90 days of the filing date of this Form N-CSR, the registrant's principal executive officer and principal financial officer have concluded that those disclosure controls and procedures provide reasonable assurance that the material information required to be disclosed by the registrant on this report is recorded, processed, summarized and reported within the time periods specified in the Securities and Exchange Commission's rules and forms.
(b) There were no changes in the registrant's internal control over financial reporting that occurred during the period covered by this report that have materially affected, or are reasonably likely to materially affect, the registrant's internal control over financial reporting.
ITEM 12. DISCLOSURE OF SECURITIES LENDING ACTIVITIES FOR CLOSED-END MANAGEMENT INVESTMENT COMPANIES.
Not applicable.
ITEM 13. EXHIBITS.
(a)(1) Separate certifications for the registrant's principal executive officer and principal financial officer, as required by Section 302 of the Sarbanes-Oxley Act of 2002 and Rule 30a-2(a) under the Investment Company Act of 1940, are attached.
(c)(1) Submission of Matters to a Vote of Security Holders is attached. See attached “John Hancock Funds – Nominating and Governance Committee Charter.”
SIGNATURES
Pursuant to the requirements of the Securities Exchange Act of 1934 and the Investment Company Act of 1940, the registrant has duly caused this report to be signed on its behalf by the undersigned, thereunto duly authorized.
John Hancock Exchange-Traded Fund Trust
| By: | /s/ Andrew Arnott |
| Andrew Arnott | |
| President | |
| Date: | December 4, 2020 |
Pursuant to the requirements of the Securities Exchange Act of 1934 and the Investment Company Act of 1940, this report has been signed below by the following persons on behalf of the registrant and in the capacities and on the dates indicated.
| By: | /s/ Andrew Arnott |
| Andrew Arnott | |
| President | |
| Date: | December 4, 2020 |
| By: | /s/ Charles A. Rizzo |
| Charles A. Rizzo | |
| Chief Financial Officer | |
| Date: | December 4, 2020 |