Exhibit 99.1

Release: | 4:05 P.M. January 18, 2024 |
212-365-6721
IR@MCBankNY.com
Metropolitan Bank Holding Corp. Reports Fourth Quarter and Full Year 2023 Results
Stable performance demonstrates MCB’s ability to execute on its business plan in a challenging economic environment
Financial Highlights
1 Non-GAAP financial measure. See Reconciliation of Non-GAAP Measures on page 13.
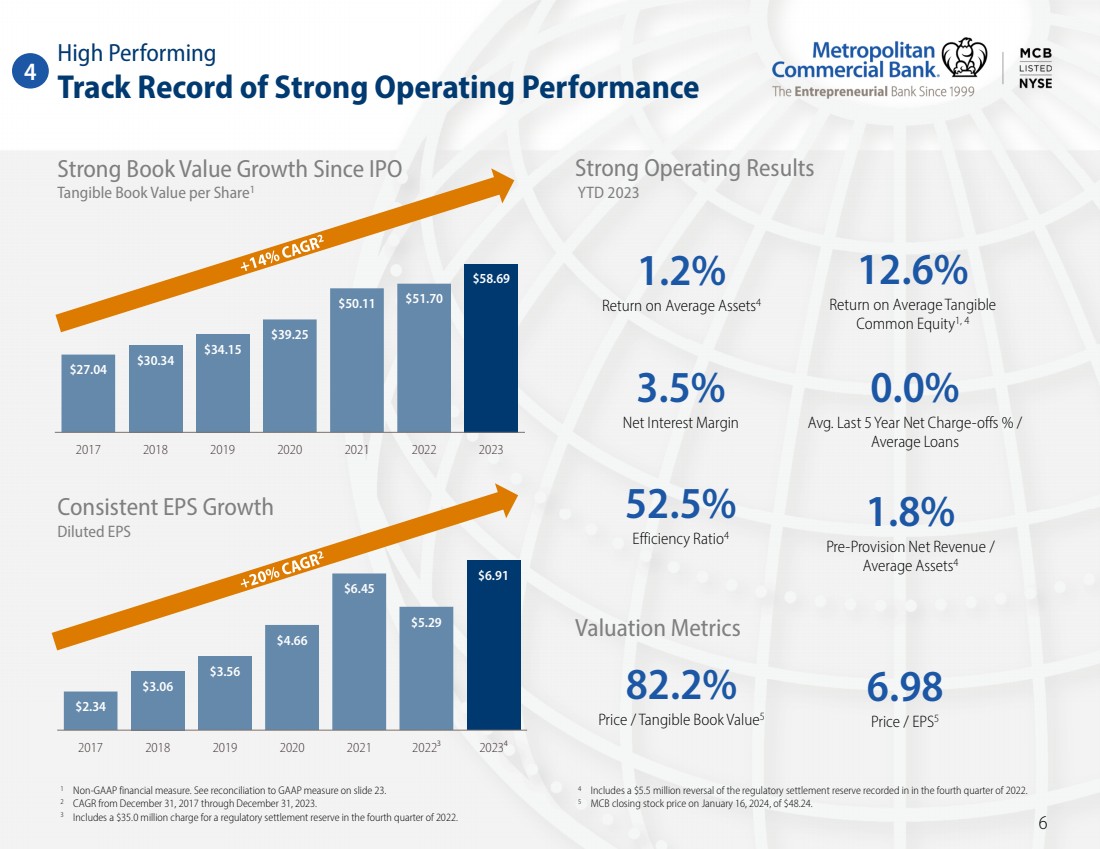
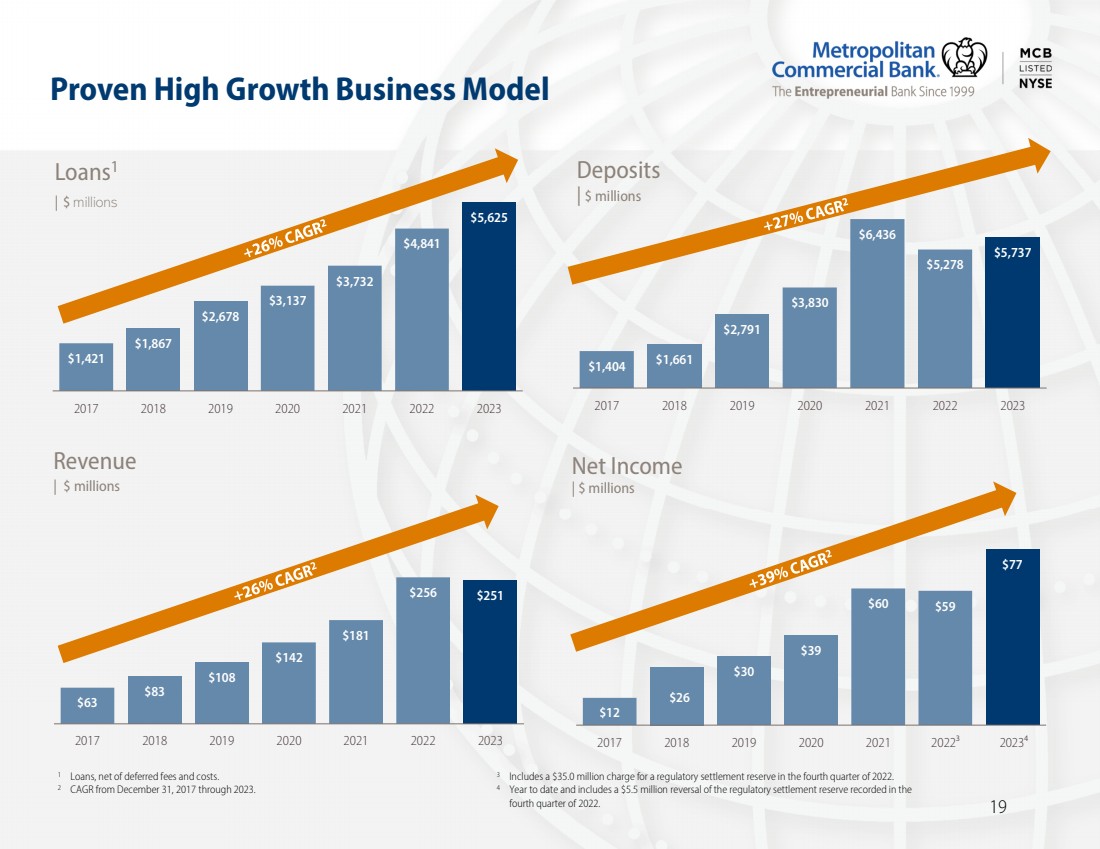
NEW YORK, January 18, 2024 ‒ Metropolitan Bank Holding Corp. (the “Company”) (NYSE: MCB), the holding company for Metropolitan Commercial Bank (the “Bank”), reported net income of $14.6 million, or $1.28 per diluted common share, for the fourth quarter of 2023 compared to a net loss of $7.7 million, or $0.71 per diluted common share, for the fourth quarter of 20222. Net income for the year 2023 was $77.3 million, or $6.91 per diluted common share, compared to net income of $59.4 million, or $5.29 per diluted common share, for the year 20222.
2 The fourth quarter and full year 2022 results include a $35.0 million regulatory settlement reserve. The full year 2023 results include a $5.5 million reversal of the regulatory settlement reserve.
1
Mark DeFazio, President and Chief Executive Officer, commented,
“I am pleased with our performance in 2023. MCB delivered responsible loan growth predominantly funded by core deposits, which was impressive in light of the challenging economic backdrop, persistent inflation, higher interest rates and our exit from the crypto business. We maintain our disciplined approach to lending and remain focused on prudent balance sheet management and liquidity. Our ability to grow appropriately within this environment demonstrates the strength and stability of our franchise.
“As we enter 2024, MCB is well-positioned to grow our business and drive EPS growth while supporting the needs of our clients.”
Balance Sheet
Total cash and cash equivalents were $269.5 million at December 31, 2023, an increase of $92.1 million, or 51.9%, from September 30, 2023 and an increase of $12.0 million from December 31, 2022. The increase from September 30, 2023, primarily reflected the $215.7 million and $184.0 million increase in deposits and wholesale funding, respectively, partially offset by the $270.3 million net deployment into loans.
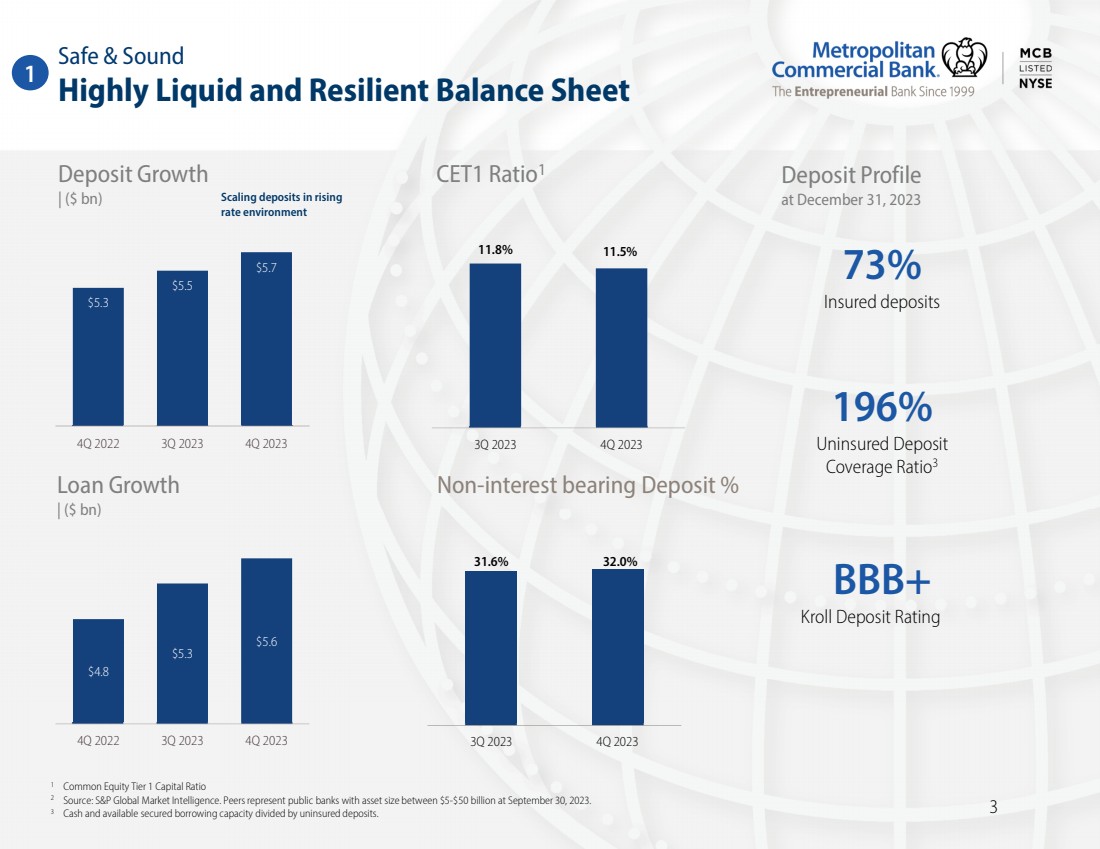
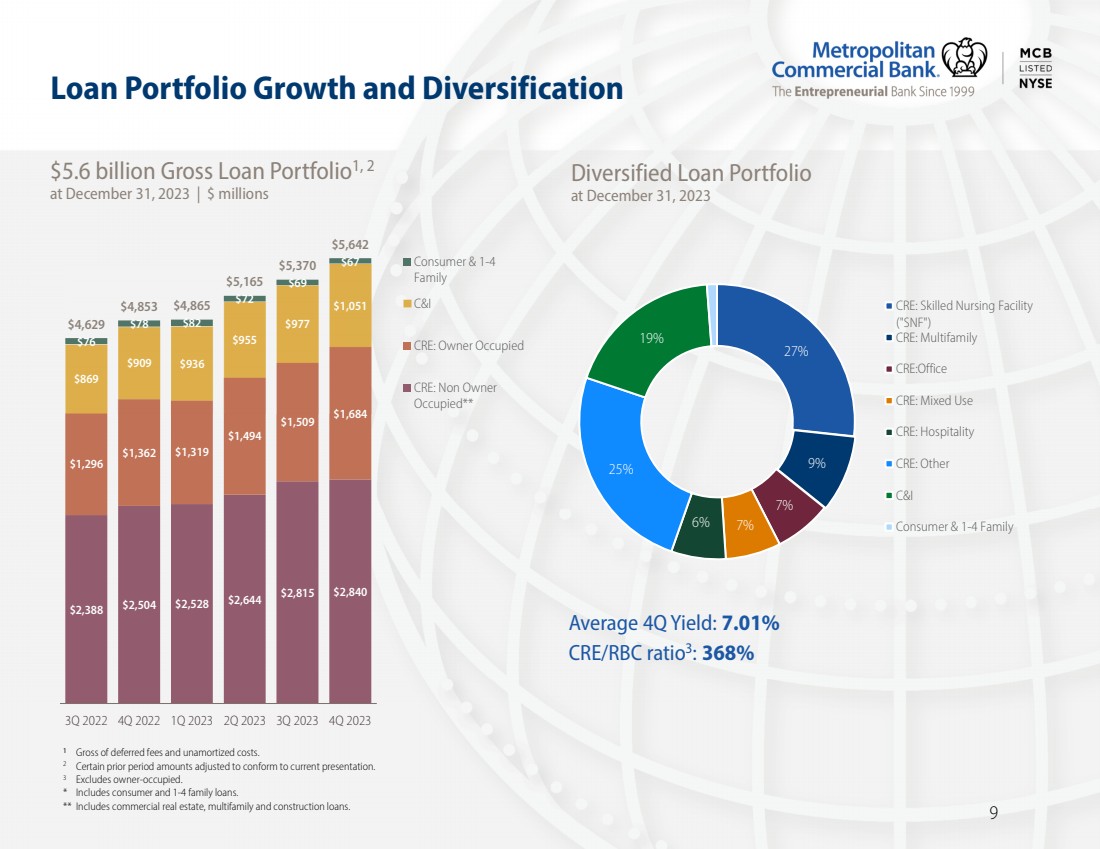
Total loans, net of deferred fees and unamortized costs, were $5.6 billion, an increase of $270.3 million, or 5.0%, from September 30, 2023, and an increase of $784.3 million, or 16.2%, from December 31, 2022. Loan production was $342.5 million for the fourth quarter of 2023 compared to $333.5 million for the prior linked quarter and $411.3 million for the prior year period. The increase in total loans from September 30, 2023, was due primarily to an increase of $145.0 million in commercial real estate (“CRE”) loans (including owner-occupied) and $74.7 million in commercial and industrial (C&I) loans. The increase in total loans from December 31, 2022, was due primarily to an increase of $603.2 million in CRE loans (including owner-occupied) and $142.8 million in C&I loans.
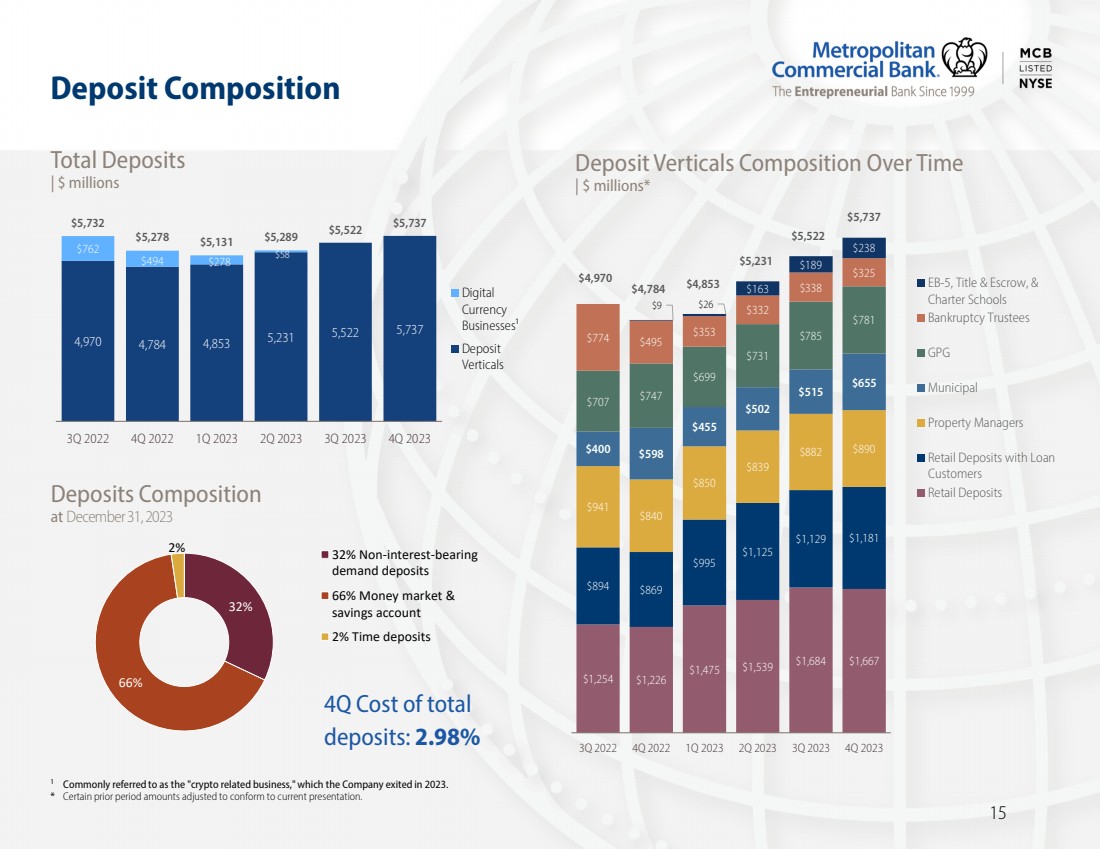
Total deposits were $5.7 billion at December 31, 2023, an increase of $215.7 million, or 3.9% from September 30, 2023, and an increase of $459.4 million or 8.7% from December 31, 2022. The increase from September 30, 2023, was due primarily to an increase of $140.7 million in municipal deposits and $36.5 million in retail deposits. The increase in deposits from December 31, 2022, was due primarily to an increase of $749.2 million in retail deposits and $229.1 million in EB-5, Title and Escrow and Charter School deposits, partially offset by the $491.0 million decrease in crypto-related deposits. Non-interest-bearing demand deposits were 32.0% of total deposits at December 31, 2023, compared to 31.6% at September 30, 2023 and 45.9% at December 31, 2022. The decline from December 31, 2022 primarily reflects the outflow of crypto-related deposits.
Accumulated other comprehensive loss, net of tax, was $52.9 million, a decrease of $7.2 million, from September 30, 2023, and $1.4 million from December 31, 2022. The decreases from September 30, 2023 and December 31, 2022 were due to decreases in unrealized losses on available-for-sale securities due to changes in prevailing market interest rates, partially offset by unrealized losses and reclassification adjustments to net income on cash flow hedges.
At December 31, 2023, cash on deposit with the Federal Reserve Bank of New York and available secured funding capacity totaled $3.1 billion. The Company and the Bank each met all the requirements to be considered “Well-Capitalized” under applicable regulatory guidelines. Total non-owner-occupied commercial real estate loans were 368.1% of total risk-based capital at December 31, 2023, compared to 374.8% and 366.0% at September 30, 2023 and December 31, 2022, respectively.
2
Income Statement
Financial Highlights
|
| Three months ended | | | Year ended | ||||||||||||
| | Dec. 31, | | Sept. 30, | | Dec. 31, | | | Dec. 31, | | Dec. 31, | | |||||
(dollars in thousands, except per share data) | | 2023 | | 2023(1) | | 2022(2) | | | 2023(3) | | 2022(2) | | |||||
Total revenues(4) | | $ | 63,555 | | $ | 60,070 | | $ | 70,249 | | | $ | 250,739 | | $ | 255,751 | |
Net income (loss) | | | 14,568 | | | 22,063 | | | (7,740) | | | | 77,268 | | | 59,425 | |
Diluted earnings (loss) per common share | |
| 1.28 | |
| 1.97 | |
| (0.71) | | |
| 6.91 | |
| 5.29 | |
Return on average assets(5) | |
| 0.84 | % |
| 1.33 | % |
| N.M. | % | |
| 1.19 | % |
| 0.90 | % |
Return on average equity(5) | |
| 9.0 | % |
| 13.9 | % |
| N.M. | % | |
| 12.4 | % |
| 10.3 | % |
Return on average tangible common equity(5), (6) | |
| 9.1 | % |
| 14.1 | % |
| N.M. | % | |
| 12.6 | % |
| 10.4 | % |
(1) | Includes a $3.0 million reversal of the regulatory settlement reserve recorded in the fourth quarter of 2022. |
(2) | Includes a $35.0 million regulatory settlement reserve. |
(3) | Includes a $5.5 million reversal of the regulatory settlement reserve recorded in the fourth quarter of 2022. |
(4) | Total revenues equal net interest income plus non-interest income. |
(5) | For periods less than a year, ratios are annualized. |
(6) | Net income divided by average tangible common equity. Non-GAAP financial measure. See Reconciliation of Non-GAAP Measures on page 13. |
Net Interest Income
Net interest income for the fourth quarter of 2023 was $57.0 million compared to $53.6 million for the prior linked quarter and $63.9 million for the prior year period. The $3.4 million increase from the prior linked quarter was due primarily to loan growth and increases in loan yields, partially offset by the shift from non-interest bearing deposits to interest bearing deposits and borrowings primarily related to the exit from the crypto-related deposit vertical. The $6.9 million decrease from the prior year period was due primarily to the 197 basis point increase in total cost of funds and the shift from non-interest bearing deposits to interest bearing funding primarily related to the exit from the crypto-related deposit vertical, partially offset by the increase in the average balance of loans and loan yields.
Net interest income for the year 2023 was $222.8 million compared to $229.2 million for the prior year. The $6.3 million decrease was due primarily to the 212 basis point increase in total cost of funds and the shift from non-interest bearing deposits to interest bearing funding primarily related to the exit from the crypto-related deposit vertical, partially offset by the increase in the average balance of loans and loan yields.
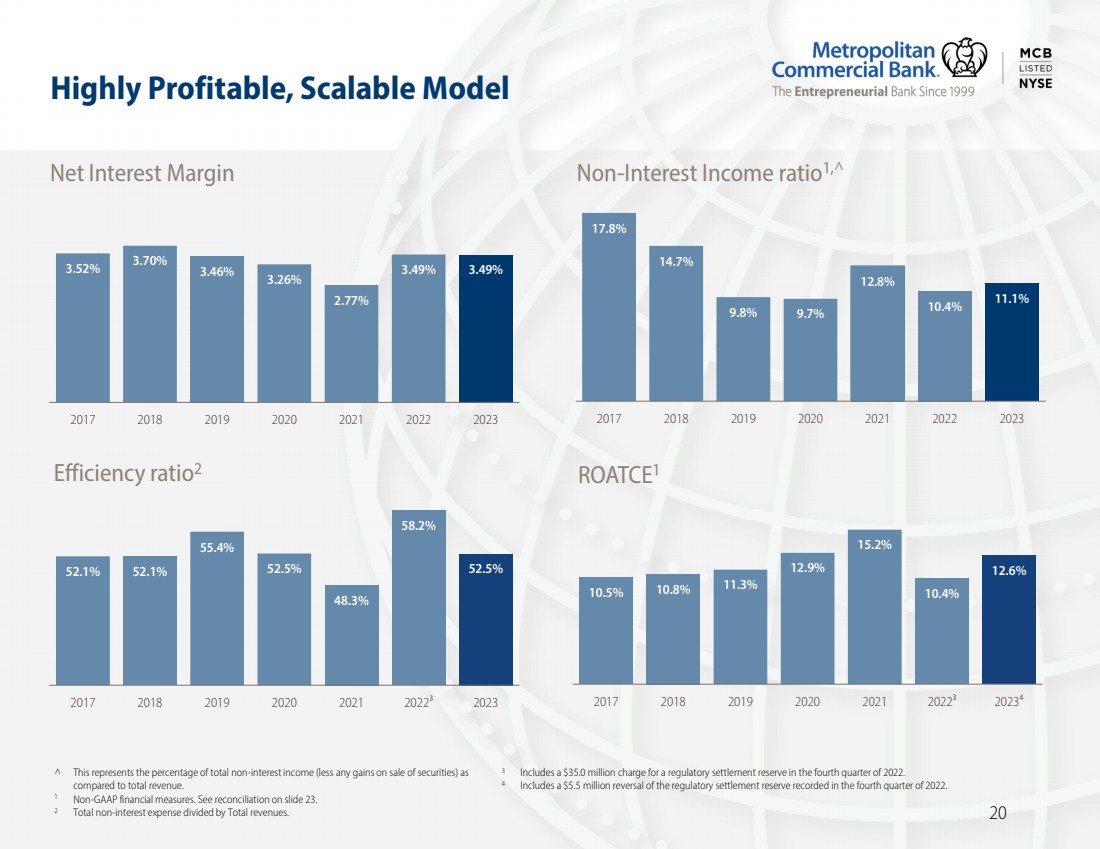
Net Interest Margin
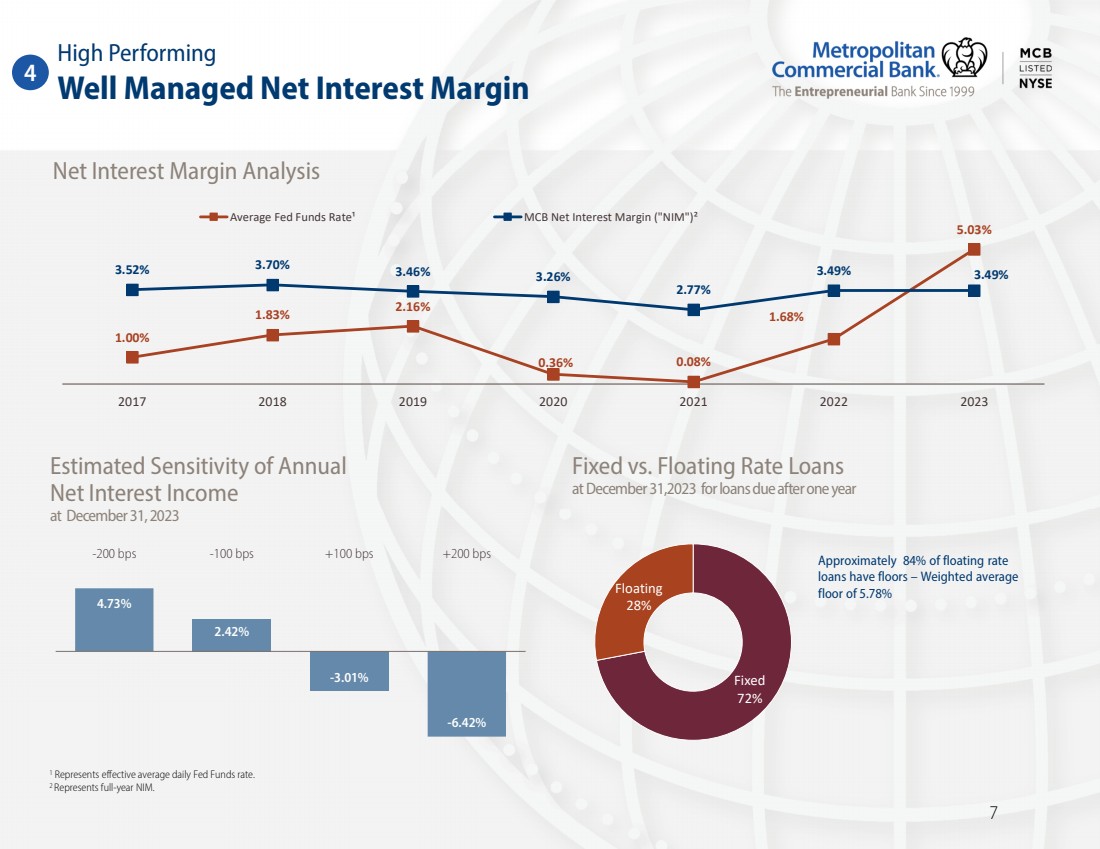
Net interest margin for the fourth quarter of 2023 was 3.36% compared to 3.27% and 4.05% for the prior linked quarter and prior year period, respectively. The 9 basis point increase from the prior linked quarter was due primarily to the increase in the average balance of loans and loan yields, partially offset by the higher cost of funds. The 69 basis point decrease from the prior year period was driven largely by the increase in the average balance of borrowed funds and the shift from non-interest bearing deposits to interest bearing deposits related to the final exit from the crypto-related deposit vertical, partially offset by loan growth and the increase in loan yields. Net interest margin was consistent at 3.49% for the years 2023 and 2022.
Total cost of funds for the fourth quarter of 2023 was 314 basis points compared to 303 basis points and 117 basis points for the prior linked quarter and prior year period, respectively. Total cost of funds for the year 2023 was 265 basis points compared to 53 basis points for the prior year. The increase in the cost of funds reflects the increase in prevailing interest rates and the shift from non-interest bearing deposits to interest bearing funding primarily related to the final exit from the crypto-related deposit vertical.
3
Non-Interest Income
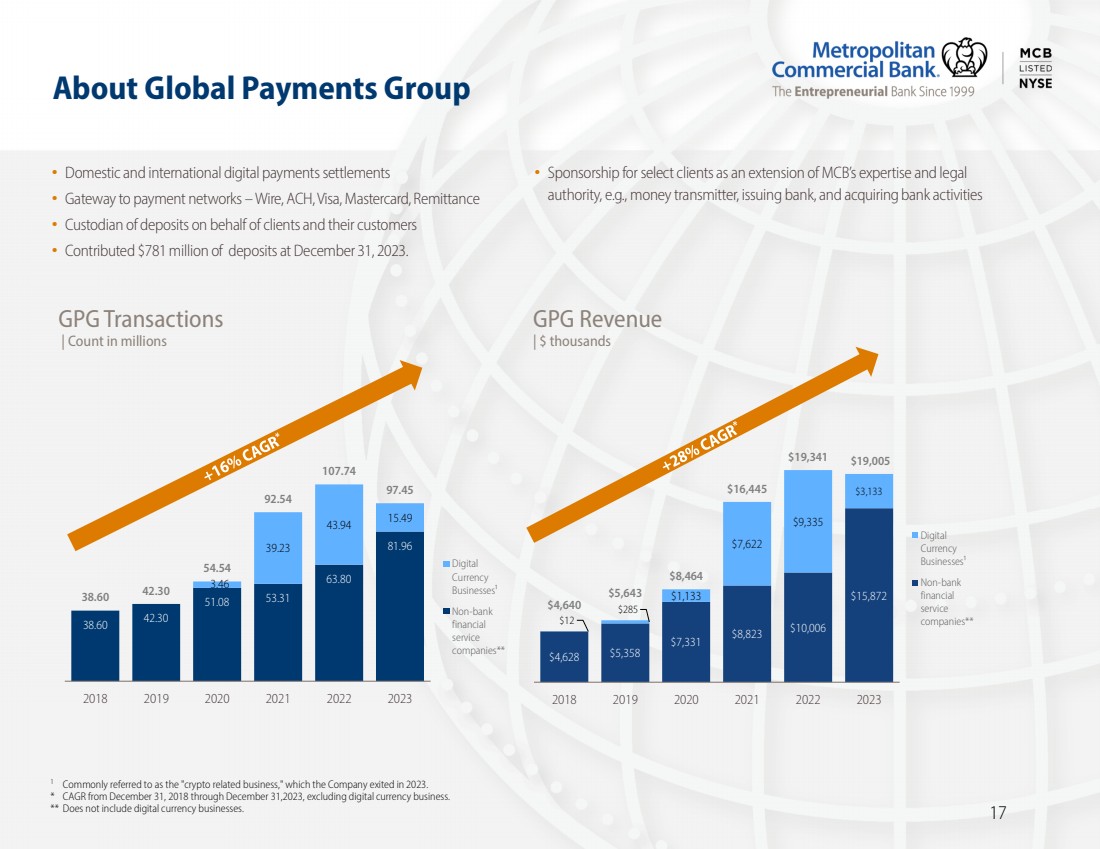
Non-interest income was $6.6 million for the fourth quarter of 2023, an increase of $48,000 from the prior linked quarter and an increase of $211,000 from the prior year period. The increase from the prior linked quarter was driven primarily by an increase in service charges on deposits, partially offset by a decrease in other service charges and fees. The increase from the prior linked period was driven primarily by an increase in service charges on deposits and other service charges and fees, partially offset by lower Global Payments Group revenue.
Non-interest income was $27.9 million for the year 2023, an increase of $1.3 million from the prior year driven primarily by increases in service charges on deposits and other service charges and fees.
Non-Interest Expense
Non-interest expense was $37.1 million for the fourth quarter of 2023, an increase of $6.2 million from the prior linked quarter and a decrease of $29.5 million from the prior year period. The increase from the prior linked quarter was due primarily to the $3.0 million reversal of the regulatory settlement reserve in the third quarter of 2023, a $1.2 million increase in professional fees and a $1.0 million increase in compensation and benefits. The decrease from the prior year period was due primarily to the $35.0 million regulatory settlement reserve recorded in the fourth quarter of 2022.
Non-interest expense was $131.5 million for the year 2023, a decrease of $17.2 million from the prior year driven primarily by the $35.0 million regulatory settlement reserve recorded in the fourth quarter of 2022, partially offset by a $9.7 million increase in compensation and benefits, a $4.5 million increase in FDIC assessments and a $3.6 million increase in professional fees.
Income Tax Expense
The effective tax rate for the year 2023 was 27.7% compared to 38.7% for the prior year, which reflects a discrete tax item related to the exercise of stock options in 2023 and the $5.5 million reversal of the regulatory settlement reserve in 2023. The elevated effective tax rate for the year 2022 reflects the recording of the $35.0 million regulatory settlement reserve and other discrete tax items.
Asset Quality
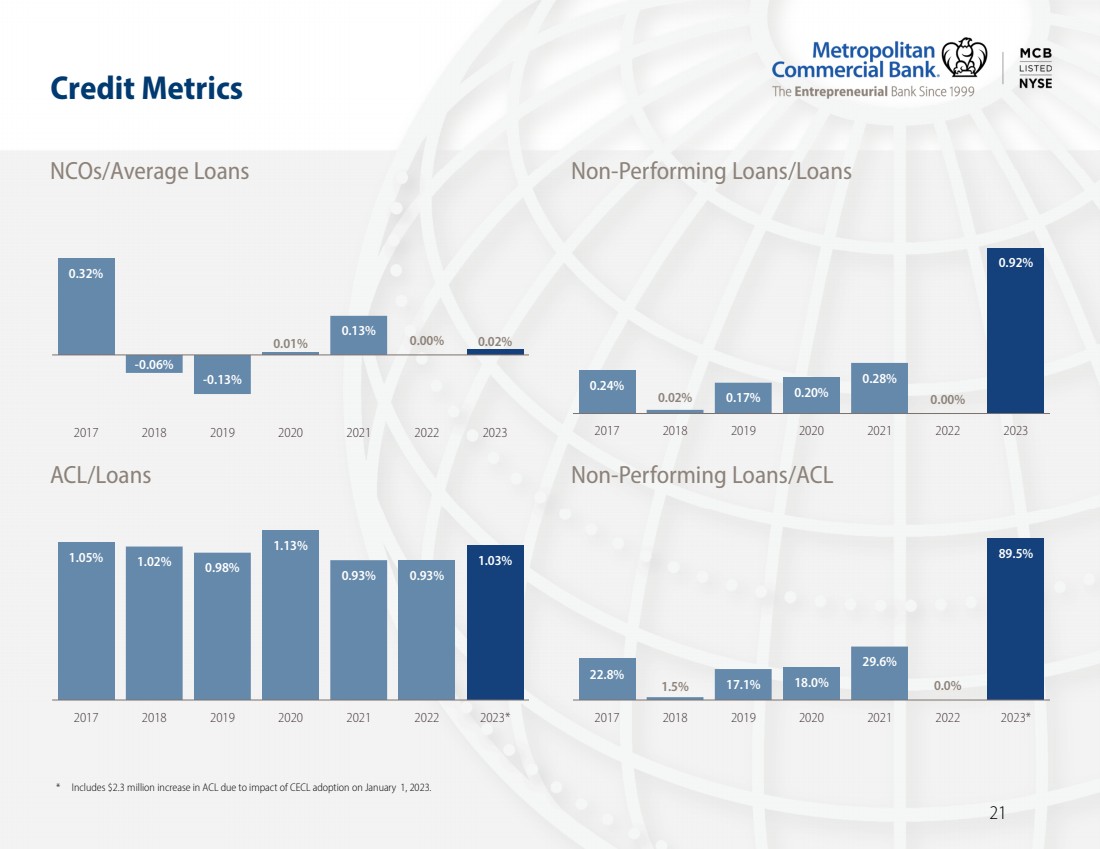
Credit quality remains strong. The ratio of non-performing loans to total loans was 0.92% at December 31, 2023 compared to 0.58% at September 30, 2023 and 0.00% at December 31, 2022, respectively. The allowance for credit losses (“ACL”) was $58.0 million at December 31, 2023, an increase of $5.7 million from September 30, 2023 and an increase of $13.1 million from December 31, 2022. The increase from the prior linked quarter was due primarily to loan growth and a $4.8 million provision on a single multifamily loan, partially offset by modest improvements in certain macroeconomic variables which inform our Current Expected Credit Loss (“CECL”) model. The increase from the prior year period was due primarily to loan growth, the $4.8 million provision on the single multifamily loan and the adoption of ASU No. 2016-13. The Company adopted ASU No. 2016-13, Financial Instruments – Credit Losses (ASC 326) effective January 1, 2023. ASU No. 2016-13 requires the measurement of all expected credit losses for financial assets held at amortized cost to be based on historical experience, current condition, and reasonable and supportable forecasts. Upon adoption, the Company recorded a $2.3 million increase to the ACL for loans, a $777,000 increase to the ACL for loan commitments, and a $2.1 million decrease to retained earnings, net of taxes.
4
Conference Call
The Company will conduct a conference call at 9:00 a.m. ET on Friday, January 19, 2024, to discuss the results. To access the event by telephone, please dial 800-267-6316 (US), 203-518-9783 (INTL), and provide conference ID: MCBQ423 approximately 15 minutes prior to the start time (to allow time for registration).
The call will also be broadcast live over the Internet and accessible at MCB Quarterly Results Conference Call and in the Investor Relations section of the Company’s website at MCB News. To listen to the live webcast, please visit the site at least 15 minutes prior to the start time to register, download and install any necessary audio software. For those unable to join for the live presentation, a replay of the webcast will also be available later that day accessible at MCB Quarterly Results Conference Call.
About Metropolitan Bank Holding Corp.
Metropolitan Bank Holding Corp. (NYSE: MCB) is the parent company of Metropolitan Commercial Bank (the “Bank”), a New York City based full-service commercial bank.
The Bank provides a broad range of business, commercial and personal banking products and services to individuals, small businesses, private and public middle-market and corporate enterprises and institutions, municipalities and local government entities.
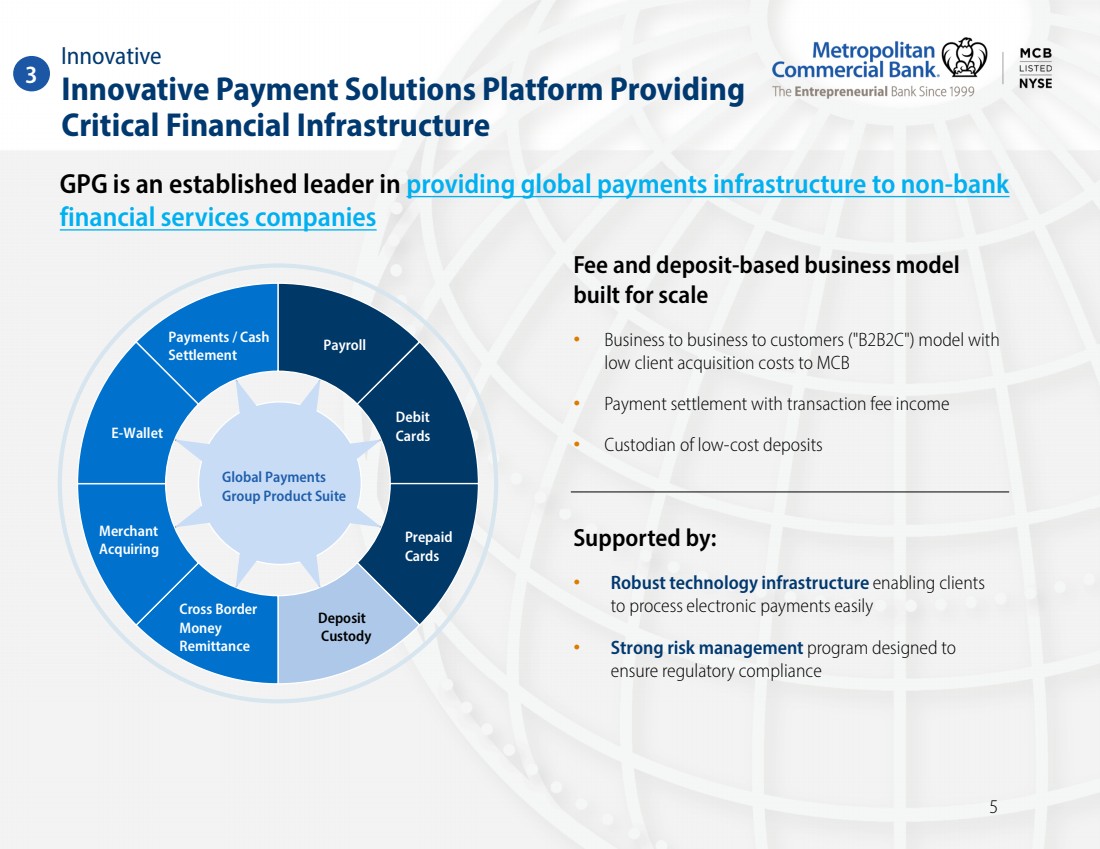
Metropolitan Commercial Bank’s Global Payments Group is an established leader in providing payments services to domestic and international non-bank financial service companies. The Bank continues to grow its presence as a valued, trusted and innovative strategic partner across payments, custodial and money services businesses worldwide.
Metropolitan Commercial Bank’s EB-5 / E-2 International Group delivers banking services and products for United States Citizen and Immigration Services EB-5 Immigrant Investor Program investors, developers, Regional Centers, government agencies, law firms and consulting companies that specialize in EB-5 and E-2.
Metropolitan Commercial Bank was named one of Newsweek's Best Regional Banks and Credit Unions 2024. The Bank was ranked by Independent Community Bankers of America among the top ten successful loan producers for 2023 by loan category and asset size for commercial banks with more than $1 billion in assets. The Bank finished ninth in S&P Global Market Intelligence’s annual ranking of the best-performing community banks with assets between $3 billion and $10 billion for 2022 and eighth among top-performing community banks in the Northeast region for 2022. Kroll affirmed a BBB+ (investment grade) deposit rating on January 25, 2023.
The Bank is a New York State chartered commercial bank, a member of the Federal Reserve System and the Federal Deposit Insurance Corporation, and an equal housing lender.
For more information, please visit the Bank’s website at MCBankNY.com.
Forward-Looking Statement Disclaimer
This release contains “forward-looking statements” within the meaning of the Private Securities Litigation Reform Act of 1995. Examples of forward-looking statements include but are not limited to the Company’s future financial condition and capital ratios, results of operations and the Company’s outlook and business. Forward-looking statements are not historical facts. Such statements may be identified by the use of such words as “may,” “believe,” “expect,” “anticipate,” “plan,” “continue” or similar terminology. These statements relate to future events or our future financial performance and involve risks and uncertainties that are difficult to predict and are generally beyond our control and may cause our actual results, levels of activity, performance or achievements to differ materially from those expressed or implied by these forward-looking statements. Although we believe that the expectations reflected in the forward-looking statements are reasonable, we caution you not to place undue reliance on these forward-looking statements. Factors which may cause our forward-looking statements to be materially inaccurate include, but are not limited to the following: the interest rate policies of the Board of Governors of the Federal Reserve System; inflation;
5
an unexpected deterioration in our loan or securities portfolios; changes in liquidity, including the size and composition of our deposit portfolio, including the percentage of uninsured deposits in the portfolio; further deterioration in the financial condition or stock prices of financial institutions generally; unexpected increases in our expenses; different than anticipated growth and our ability to manage our growth; the lingering effects of the COVID-19 pandemic on our business and results of operation; unanticipated regulatory action or changes in regulations; potential recessionary conditions; unanticipated volatility in deposits; unexpected increases in credit losses or in the level of delinquent, nonperforming, classified and criticized loans; our ability to absorb the amount of actual losses inherent in our existing loan portfolio; an unanticipated loss of key personnel or existing customers; competition from other institutions resulting in unanticipated changes in our loan or deposit rates; an unexpected adverse financial, regulatory or bankruptcy event experienced by our non-bank financial service partners; unanticipated increases in FDIC costs; changes in regulations, legislation or tax or accounting rules, monetary and fiscal policies of the U.S. Government including policies of the U.S. Treasury; impacts related to or resulting from recent bank failures; an unexpected failure to successfully manage our credit risk and the sufficiency of our allowance, the credit and other risks from borrower and depositor concentrations (by geographic area and by industry); the current or anticipated impact of military conflict, terrorism or other geopolitical events; the costs, including possibly incurring fines, penalties or other negative effects (including reputational harm), of any adverse judicial, administrative, or arbitral rulings or proceedings, regulatory enforcement actions, or other legal actions; a failure in or breach of the Company’s operational or security systems or infrastructure, including cyberattacks; the failure to maintain current technologies, or to implement new technologies; the failure to maintain effective internal controls over financial reporting; the failure to retain or attract employees; and unanticipated adverse changes in our customers’ economic conditions or general economic conditions, as well as those discussed under the heading “Risk Factors” in our Annual Report on Form 10-K and Quarterly Reports on Form 10-Q which have been filed with the Securities and Exchange Commission under the Securities Exchange Act of 1934, as amended.
Forward-looking statements speak only as of the date of this release. We do not undertake (and expressly disclaim) any obligation to update or revise any forward-looking statement, except as may be required by law.
6
Consolidated Balance Sheet (unaudited)
| | Dec. 31, | | Sept. 30, | | Jun. 30, | | Mar. 31, | | Dec. 31, | |||||
(in thousands) |
| 2023 | | 2023 | | 2023 | | 2023 | | 2022 | |||||
Assets |
| |
| | | | | | | | |
| | | |
Cash and due from banks | | $ | 31,973 | | $ | 36,438 | | $ | 33,534 | | $ | 32,525 | | $ | 26,780 |
Overnight deposits | |
| 237,492 | |
| 140,929 | |
| 168,242 | |
| 266,978 | | | 230,638 |
Total cash and cash equivalents | |
| 269,465 | |
| 177,367 | |
| 201,776 | |
| 299,503 | | | 257,418 |
Investment securities available-for-sale | |
| 461,207 | |
| 429,850 | |
| 426,068 | |
| 444,169 | | | 445,747 |
Investment securities held-to-maturity | |
| 468,860 | |
| 478,886 | |
| 515,613 | |
| 501,525 | | | 510,425 |
Equity investment securities, at fair value | | | 2,123 | | | 2,015 | |
| 2,066 | |
| 2,087 | | | 2,048 |
Total securities | |
| 932,190 | |
| 910,751 | |
| 943,747 | |
| 947,781 | | | 958,220 |
Other investments | |
| 38,966 | |
| 35,015 | |
| 28,040 | |
| 27,099 | | | 22,110 |
Loans, net of deferred fees and unamortized costs | |
| 5,624,797 | |
| 5,354,487 | |
| 5,149,546 | |
| 4,851,694 | | | 4,840,523 |
Allowance for credit losses | |
| (57,965) | |
| (52,298) | |
| (51,650) | |
| (47,752) | | | (44,876) |
Net loans | |
| 5,566,832 | |
| 5,302,189 | |
| 5,097,896 | |
| 4,803,942 | | | 4,795,647 |
Receivables from global payments business, net | | | 87,648 | |
| 79,892 | |
| 84,919 | |
| 83,787 | | | 85,605 |
Other assets | | | 172,571 | | | 178,145 | | | 165,772 | | | 147,870 | | | 148,337 |
Total assets | | $ | 7,067,672 | | $ | 6,683,359 | | $ | 6,522,150 | | $ | 6,309,982 | | $ | 6,267,337 |
| | | | | | | | | | | | | | | |
Liabilities and Stockholders' Equity | |
| | |
|
| |
|
| |
|
| | | |
Deposits | |
| | |
|
| |
|
| |
|
| | |
|
Non-interest-bearing demand deposits | | $ | 1,837,874 | | $ | 1,746,626 | | $ | 1,730,380 | | $ | 2,122,606 | | $ | 2,422,151 |
Interest-bearing deposits | |
| 3,899,418 | |
| 3,774,963 | |
| 3,558,185 | |
| 3,009,182 | | | 2,855,761 |
Total deposits | |
| 5,737,292 | |
| 5,521,589 | |
| 5,288,565 | |
| 5,131,788 | | | 5,277,912 |
Federal funds purchased | | | 99,000 | | | — | | | 243,000 | | | 195,000 | | | 150,000 |
Federal Home Loan Bank of New York advances | | | 440,000 | | | 355,000 | | | 200,000 | | | 200,000 | | | 100,000 |
Trust preferred securities | |
| 20,620 | |
| 20,620 | |
| 20,620 | |
| 20,620 | | | 20,620 |
Secured borrowings | | | 7,585 | | | 7,621 | | | 7,655 | | | 7,689 | | | 7,725 |
Prepaid third-party debit cardholder balances | |
| 10,178 | |
| 10,297 | |
| 10,772 | |
| 11,102 | | | 10,579 |
Other liabilities | | | 93,976 | | | 133,322 | | | 130,263 | | | 135,896 | | | 124,604 |
Total liabilities | |
| 6,408,651 | |
| 6,048,449 | |
| 5,900,875 | |
| 5,702,095 | | | 5,691,440 |
| | | | | | | | | | | | | | | |
Common stock | |
| 111 | |
| 110 | |
| 110 | |
| 112 | | | 109 |
Additional paid in capital | |
| 395,871 | |
| 393,544 | |
| 392,742 | |
| 394,124 | | | 389,276 |
Retained earnings | |
| 315,975 | |
| 301,407 | |
| 279,344 | |
| 263,783 | | | 240,810 |
Accumulated other comprehensive gain (loss), net of tax effect | |
| (52,936) | |
| (60,151) | |
| (50,921) | |
| (50,132) | | | (54,298) |
Total stockholders’ equity | |
| 659,021 | |
| 634,910 | |
| 621,275 | |
| 607,887 | | | 575,897 |
Total liabilities and stockholders’ equity | | $ | 7,067,672 | | $ | 6,683,359 | | $ | 6,522,150 | | $ | 6,309,982 | | $ | 6,267,337 |
7
Consolidated Statement of Income (unaudited)
|
| Three months ended | | Year ended | |||||||||||
| | Dec. 31, | | Sept. 30, | | Dec. 31, | | Dec. 31, | | Dec. 31, | |||||
(dollars in thousands, except per share data) |
| 2023 | | 2023 | | 2022 |
| 2023 | | 2022 | |||||
Total interest income | | $ | 105,267 | | $ | 97,897 | | $ | 80,554 | | $ | 375,405 | | $ | 260,739 |
Total interest expense | |
| 48,273 | |
| 44,340 | |
| 16,655 | |
| 152,569 | |
| 31,581 |
Net interest income | |
| 56,994 | |
| 53,557 | |
| 63,899 | |
| 222,836 | |
| 229,158 |
Provision for credit losses | |
| 6,541 | |
| 791 | |
| 2,309 | |
| 12,283 | |
| 10,116 |
Net interest income after provision for credit losses | |
| 50,453 | |
| 52,766 | |
| 61,590 | |
| 210,553 | |
| 219,042 |
| |
|
| |
|
| |
|
| |
|
| |
|
|
Non-interest income | |
|
| |
|
| |
|
| |
|
| |
|
|
Service charges on deposit accounts | |
| 1,671 | |
| 1,463 | |
| 1,458 | |
| 6,071 | |
| 5,747 |
Global Payments Group revenue | |
| 4,177 | |
| 4,247 | |
| 4,343 | |
| 19,005 | |
| 19,341 |
Other income | | | 713 | | | 803 | | | 549 | | | 2,827 | | | 1,505 |
Total non-interest income | |
| 6,561 | |
| 6,513 | |
| 6,350 | |
| 27,903 | |
| 26,593 |
| |
|
| |
|
| |
|
| |
|
| |
|
|
Non-interest expense | |
|
| |
|
| |
|
| |
|
| |
|
|
Compensation and benefits | |
| 18,210 | |
| 17,208 | |
| 15,886 | |
| 66,961 | |
| 57,290 |
Bank premises and equipment | |
| 2,317 | |
| 2,396 | |
| 2,247 | |
| 9,344 | |
| 8,855 |
Professional fees | |
| 5,031 | |
| 3,873 | |
| 5,171 | |
| 18,064 | |
| 14,423 |
Technology costs | |
| 974 | |
| 1,171 | |
| 1,186 | |
| 4,940 | |
| 4,713 |
Licensing fees | | | 3,638 | | | 3,504 | | | 2,674 | | | 12,818 | | | 10,477 |
FDIC assessments | | | 2,639 | | | 1,984 | | | 1,030 | | | 9,077 | | | 4,625 |
Regulatory settlement reserve | | | — | | | (3,021) | | | 35,000 | | | (5,521) | | | 35,000 |
Other expenses | |
| 4,338 | |
| 3,809 | |
| 3,465 | |
| 15,855 | |
| 13,354 |
Total non-interest expense | |
| 37,147 | |
| 30,924 | |
| 66,659 | |
| 131,538 | |
| 148,737 |
| |
|
| |
|
| |
|
| |
|
| |
|
|
Net income before income tax expense | |
| 19,867 | |
| 28,355 | |
| 1,281 | |
| 106,918 | |
| 96,898 |
Income tax expense | |
| 5,299 | |
| 6,292 | |
| 9,021 | |
| 29,650 | |
| 37,473 |
Net income (loss) | | $ | 14,568 | | $ | 22,063 | | $ | (7,740) | | $ | 77,268 | | $ | 59,425 |
| |
|
| | |
| |
|
| |
|
| |
|
|
Earnings per common share: | |
| | | |
| |
|
| |
|
| |
|
|
Average common shares outstanding: | | | | | | | | | | | | | | | |
Basic | | | 11,062,729 | | | 11,039,363 | | | 10,932,952 | | | 11,060,110 | | | 10,929,021 |
Diluted | | | 11,366,463 | | | 11,136,873 | | | 11,183,862 | | | 11,129,900 | | | 11,200,184 |
Basic earnings (loss) | | $ | 1.31 | | $ | 1.99 | | $ | (0.71) | | $ | 6.95 | | $ | 5.42 |
Diluted earnings (loss) | | $ | 1.28 | | $ | 1.97 | | $ | (0.71) | | $ | 6.91 | | $ | 5.29 |
8
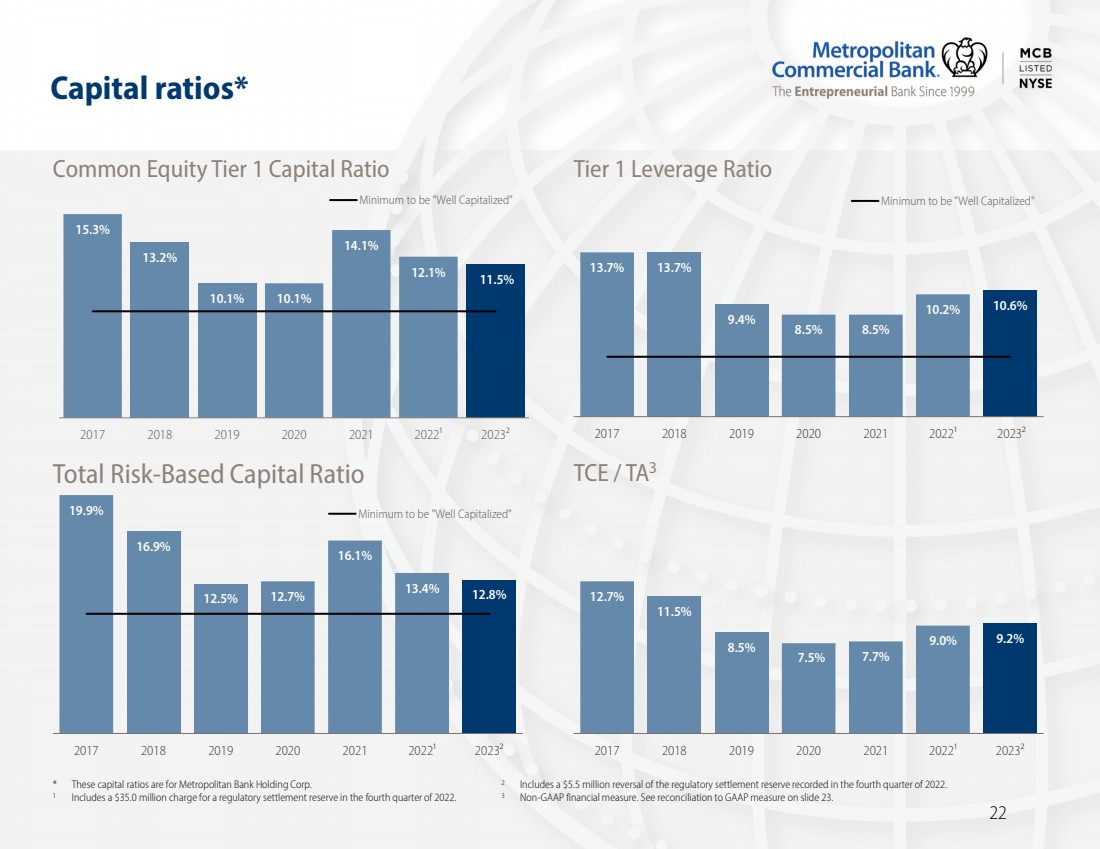
Loan Production, Asset Quality & Regulatory Capital
|
| Dec. 31, | | Sept. 30, | | Jun. 30, | | Mar. 31, | | Dec. 31, | | |||||
| | 2023 | | 2023 | | 2023 | | 2023 |
| 2022 | | |||||
LOAN PRODUCTION (in millions) | | $ | 342.5 | | $ | 333.5 | | $ | 425.4 | | $ | 265.4 | | $ | 411.3 | |
| | | | | | | | | | | | | | | | |
ASSET QUALITY (in thousands) | | | | | | | | | | | | | | | | |
Non-accrual loans: | | | | | | | | | | | | | | | | |
Commercial real estate | | $ | 44,939 | | $ | 24,000 | | $ | 24,000 | | $ | 24,000 | | $ | — | |
Commercial and industrial | | | 6,934 | | | 6,934 | | | — | | | — | | | — | |
Consumer | | | 24 | | | 24 | | | 24 | | | 24 | | | 24 | |
Total non-accrual loans | | $ | 51,897 | | $ | 30,958 | | $ | 24,024 | | $ | 24,024 | | $ | 24 | |
Non-accrual loans to total loans | |
| 0.92 | % |
| 0.58 | % |
| 0.47 | % |
| 0.50 | % |
| — | % |
Allowance for credit losses | | $ | 57,965 | | $ | 52,298 | | $ | 51,650 | | $ | 47,752 | | $ | 44,876 | |
Allowance for credit losses to total loans | |
| 1.03 | % |
| 0.98 | % |
| 1.00 | % |
| 0.98 | % |
| 0.93 | % |
Charge-offs | | $ | (946) | | $ | (129) | | $ | (44) | | $ | (100) | | $ | — | |
Recoveries | | $ | — | | $ | — | | $ | — | | $ | — | | $ | 25 | |
Net charge-offs/(recoveries) to average loans (annualized) | | | 0.07 | % | | 0.01 | % | | — | % | | 0.01 | % | | — | % |
| | | | | | | | | | | | | | | | |
REGULATORY CAPITAL | |
|
| |
|
| |
|
| |
|
| |
|
| |
Tier 1 Leverage: | |
|
| |
|
| |
|
| |
|
| |
|
| |
Metropolitan Bank Holding Corp. | |
| 10.6 | % |
| 10.7 | % |
| 10.8 | % |
| 10.8 | % |
| 10.2 | % |
Metropolitan Commercial Bank | |
| 10.3 | % |
| 10.5 | % |
| 10.5 | % |
| 10.4 | % |
| 10.0 | % |
| | | | | | | | | | | | | | | | |
Common Equity Tier 1 Risk-Based (CET1): | |
|
| |
|
| |
|
| |
|
| |
|
| |
Metropolitan Bank Holding Corp. | |
| 11.5 | % |
| 11.8 | % |
| 11.9 | % |
| 12.3 | % |
| 12.1 | % |
Metropolitan Commercial Bank | |
| 11.6 | % |
| 11.9 | % |
| 11.9 | % |
| 12.3 | % |
| 12.3 | % |
| | | | | | | | | | | | | | | | |
Tier 1 Risk-Based: | |
|
| |
|
| |
|
| |
|
| |
|
| |
Metropolitan Bank Holding Corp. | |
| 11.9 | % |
| 12.2 | % |
| 12.2 | % |
| 12.7 | % |
| 12.5 | % |
Metropolitan Commercial Bank | |
| 11.6 | % |
| 11.9 | % |
| 11.9 | % |
| 12.3 | % |
| 12.3 | % |
| | | | | | | | | | | | | | | | |
Total Risk-Based: | |
|
| |
|
| |
|
| |
|
| |
|
| |
Metropolitan Bank Holding Corp. | |
| 12.8 | % |
| 13.1 | % |
| 13.2 | % |
| 13.6 | % |
| 13.4 | % |
Metropolitan Commercial Bank | |
| 12.5 | % |
| 12.8 | % |
| 12.9 | % |
| 13.2 | % |
| 13.1 | % |
9
Performance Measures
| | Three months ended | | Year ended |
| |||||||||||||||||||||||
| | Dec. 31, | | Sept. 30, | | Dec. 31, | | Dec. 31, | | Dec. 31, | | |||||||||||||||||
(dollars in thousands, except per share data) |
| 2023 | | 2023(1) | | 2022(2) |
| 2023(3) | | 2022(2) |
| |||||||||||||||||
Net income per consolidated statements of income | | $ | 14,568 | | $ | 22,063 | | $ | (7,740) | | $ | 77,268 | | $ | 59,425 | | ||||||||||||
Less: Earnings allocated to participating securities | | | (78) | | | (118) | | | — | | | (365) | | | (141) | | ||||||||||||
Net income (loss) available to common shareholders | | $ | 14,490 | | $ | 21,945 | | $ | (7,740) | | $ | 76,903 | | $ | 59,284 | | ||||||||||||
| | | | | | | | | | | | | | | | | ||||||||||||
Per common share: | |
|
| |
|
| |
|
| |
|
| |
|
| | ||||||||||||
Basic earnings (loss) | | $ | 1.31 | | $ | 1.99 | | $ | (0.71) | | $ | 6.95 | | $ | 5.42 | | ||||||||||||
Diluted earnings (loss) | | $ | 1.28 | | $ | 1.97 | | $ | (0.71) | | $ | 6.91 | | $ | 5.29 | | ||||||||||||
Common shares outstanding: | |
|
| |
|
| |
|
| |
|
| |
|
| | ||||||||||||
Period end | |
| 11,062,729 | |
| 11,062,729 | |
| 10,949,965 | |
| 11,062,729 | |
| 10,949,965 | | ||||||||||||
Average fully diluted | |
| 11,366,463 | |
| 11,136,873 | |
| 11,183,862 | |
| 11,129,900 | |
| 11,200,184 | | ||||||||||||
Return on:(4) | |
|
| |
|
| |
|
| |
|
| |
|
| | ||||||||||||
Average total assets | |
| 0.84 | % |
| 1.33 | % |
| N.M. | % |
| 1.19 | % |
| 0.90 | % | ||||||||||||
Average equity | | | 9.0 | % | | 13.9 | % | | N.M. | % | | 12.4 | % | | 10.3 | % | ||||||||||||
Average tangible common equity(5) | | | 9.1 | % | | 14.1 | % | | N.M. | % | | 12.6 | % | | 10.4 | % | ||||||||||||
Yield on average earning assets(4) | |
| 6.21 | % |
| 5.99 | % |
| 5.12 | % |
| 5.88 | % |
| 3.97 | % | ||||||||||||
Total cost of deposits(4) | | | 2.98 | % | | 2.74 | % | | 1.11 | % | | 2.43 | % | | 0.49 | % | ||||||||||||
Net interest spread(4) | |
| 1.81 | % |
| 1.67 | % |
| 2.79 | % |
| 1.85 | % |
| 2.82 | % | ||||||||||||
Net interest margin(4) | |
| 3.36 | % |
| 3.27 | % |
| 4.05 | % |
| 3.49 | % |
| 3.49 | % | ||||||||||||
Net charge-offs as % of average loans(4) | |
| 0.07 | % |
| 0.01 | % |
| — | % |
| 0.02 | % |
| — | % | ||||||||||||
Efficiency ratio(6) | |
| 58.4 | % |
| 51.5 | % |
| 94.9 | % |
| 52.46 | % |
| 58.16 | % | ||||||||||||
(1) | Includes a $3.0 million reversal of the regulatory settlement reserve recorded in the fourth quarter of 2022. |
(2) | Includes a $35.0 million regulatory settlement reserve. |
(3)Includes a $5.5 million reversal of the regulatory settlement reserve recorded in the fourth quarter of 2022.
(4)For periods less than a year, ratios are annualized.
(5)Net income divided by average tangible common equity. Non-GAAP financial measure. See Reconciliation of Non-GAAP Measures on page 13.
(6)Total non-interest expense divided by total revenues.
10
Interest Margin Analysis
| | Three months ended | | ||||||||||||||||||||||||
| | Dec. 31, 2023 | | | Sept. 30, 2023 | | | Dec. 31, 2022 | | ||||||||||||||||||
| | Average | | | | | Yield / | | | Average | | | | | Yield / | | | Average | | | | | Yield / | | |||
(dollars in thousands) | | Balance | | Interest | | Rate (1) | | | Balance | | Interest | | Rate (1) | | | Balance | | Interest | | Rate (1) | | ||||||
Assets: | | | | | | | | | | | | | | | | | | | | | | | | | | | |
Interest-earning assets: | | |
|
| |
|
|
|
| | |
|
| |
|
| |
| | |
|
| |
|
| | |
Loans (2) | | $ | 5,538,095 | | $ | 97,897 |
| 7.01 | % | | $ | 5,283,114 | | $ | 90,666 |
| 6.80 | % | | $ | 4,796,001 | | $ | 72,560 |
| 5.98 | % |
Available-for-sale securities | |
| 532,970 | |
| 2,430 |
| 1.82 | | |
| 527,673 | |
| 2,261 |
| 1.71 | | |
| 527,523 | |
| 1,979 |
| 1.50 | |
Held-to-maturity securities | |
| 474,475 | |
| 2,217 |
| 1.87 | | |
| 497,682 | |
| 2,412 |
| 1.94 | | |
| 518,822 | |
| 2,422 |
| 1.87 | |
Equity investments | | | 2,401 | | | 14 | | 2.30 | | | | 2,387 | | | 13 |
| 2.20 | | | | 2,351 | | | 10 | | 1.70 | |
Overnight deposits | |
| 139,009 | |
| 1,966 |
| 5.53 | | |
| 124,211 | |
| 1,783 |
| 5.62 | | |
| 362,244 | |
| 3,291 |
| 3.55 | |
Other interest-earning assets | |
| 35,718 | |
| 743 |
| 8.32 | | |
| 36,952 | |
| 762 |
| 8.24 | | |
| 18,689 | |
| 292 |
| 6.26 | |
Total interest-earning assets | |
| 6,722,668 | |
| 105,267 |
| 6.21 | | |
| 6,472,019 | |
| 97,897 |
| 5.99 | | |
| 6,225,630 | |
| 80,554 |
| 5.12 | |
Non-interest-earning assets | |
| 192,237 | |
|
|
|
| | |
| 170,195 | |
|
|
|
| | |
| 101,826 | |
|
|
|
| |
Allowance for credit losses | |
| (53,570) | |
|
|
|
| | |
| (52,357) | |
|
|
|
| | |
| (43,643) | |
|
|
|
| |
Total assets | | $ | 6,861,335 | |
|
|
|
| | | $ | 6,589,857 | |
|
|
|
| | | $ | 6,283,813 | |
|
|
|
| |
Liabilities and Stockholders' Equity: | |
|
| |
|
|
|
| | |
| | | | | | | | |
|
| |
|
|
|
| |
Interest-bearing liabilities: | |
|
| |
|
|
|
| | |
| | | | | | | | |
|
| |
|
|
|
| |
Money market and savings accounts | | $ | 3,891,476 | | | 42,395 |
| 4.32 | | | $ | 3,465,347 | | | 35,969 |
| 4.12 | | | $ | 2,683,653 | | | 15,241 |
| 2.25 | |
Certificates of deposit | |
| 34,179 | |
| 272 |
| 3.16 | | |
| 38,937 | |
| 265 |
| 2.70 | | |
| 49,470 | |
| 207 |
| 1.66 | |
Total interest-bearing deposits | |
| 3,925,655 | |
| 42,667 |
| 4.31 | | |
| 3,504,284 | |
| 36,234 |
| 4.10 | | |
| 2,733,123 | |
| 15,448 |
| 2.24 | |
Borrowed funds | |
| 427,250 | |
| 5,606 |
| 5.25 | | |
| 572,456 | |
| 8,106 |
| 5.66 | | |
| 101,600 | |
| 1,207 |
| 4.75 | |
Total interest-bearing liabilities | |
| 4,352,905 | |
| 48,273 |
| 4.40 | | |
| 4,076,740 | |
| 44,340 |
| 4.32 | | |
| 2,834,723 | |
| 16,655 |
| 2.33 | |
Non-interest-bearing liabilities: | |
|
| |
|
|
|
| | |
|
| |
|
|
|
| | |
|
| |
|
|
|
| |
Non-interest-bearing deposits | |
| 1,748,178 | |
|
|
|
| | |
| 1,734,956 | |
|
|
|
| | |
| 2,792,370 | |
|
|
|
| |
Other non-interest-bearing liabilities | |
| 116,995 | |
|
|
|
| | |
| 146,956 | |
|
|
|
| | |
| 60,951 | |
|
|
|
| |
Total liabilities | |
| 6,218,078 | |
|
|
|
| | |
| 5,958,652 | |
|
|
|
| | |
| 5,688,044 | |
|
|
|
| |
Stockholders' equity | |
| 643,257 | |
|
|
|
| | |
| 631,205 | | | | | | | |
| 595,769 | | | | | | |
Total liabilities and equity | | $ | 6,861,335 | |
|
|
|
| | | $ | 6,589,857 | |
|
|
|
| | | $ | 6,283,813 | |
|
|
|
| |
Net interest income | |
|
| | $ | 56,994 |
|
| | |
| | | $ | 53,557 |
|
| | |
| | | $ | 63,899 |
| | |
Net interest rate spread (3) | |
| | |
|
|
| 1.81 | % | |
| | | | | | 1.67 | % | |
| | | | | | 2.79 | % |
Net interest margin (4) | |
|
| |
|
|
| 3.36 | % | |
|
| |
|
|
| 3.27 | % | |
|
| |
|
|
| 4.05 | % |
Total cost of deposits (5) | | | | | | | | 2.98 | % | | | | | | | | 2.74 | % | | | | | | | | 1.11 | % |
Total cost of funds (6) | | | | | | | | 3.14 | % | | | | | | | | 3.03 | % | | |
| |
|
|
| 1.17 | % |
(1) | Ratios are annualized. |
(2) | Amount includes deferred loan fees and non-performing loans. |
(3) | Determined by subtracting the annualized average cost of total interest-bearing liabilities from the annualized average yield on total interest-earning assets. |
(4) | Determined by dividing annualized net interest income by total average interest-earning assets. |
(5) | Determined by dividing annualized interest expense on deposits by total average interest-bearing and non-interest bearing deposits. |
(6) | Determined by dividing annualized interest expense by the sum of total average interest-bearing liabilities and total average non-interest-bearing deposits. |
11
Interest Margin Analysis, continued
| | Year ended | | |||||||||||||||
| | Dec. 31, 2023 | | | Dec. 31, 2022 |
| ||||||||||||
| | Average | | | | | Yield / | | | Average | | | | | Yield / |
| ||
(dollars in thousands) | | Balance | | Interest | | Rate | | | Balance | | Interest | | Rate |
| ||||
Assets: | | | | | | | | | | | | | | | | | | |
Interest-earning assets: |
| |
|
| |
|
|
|
| | |
|
| |
|
|
| |
Loans (1) | | $ | 5,147,653 | | $ | 345,039 |
| 6.70 | % | | $ | 4,361,412 | | $ | 231,851 |
| 5.32 | % |
Available-for-sale securities | |
| 527,873 | |
| 8,865 |
| 1.68 | | |
| 538,425 | | $ | 6,921 |
| 1.29 | |
Held-to-maturity securities | |
| 499,379 | |
| 9,608 |
| 1.92 | | |
| 495,812 | | $ | 8,682 |
| 1.75 | |
Equity investments | | | 2,381 | | | 52 | | 2.17 | | | | 2,339 | | $ | 32 |
| 1.37 | |
Overnight deposits | |
| 176,813 | |
| 9,319 |
| 5.20 | | |
| 1,156,468 | | $ | 12,314 |
| 1.05 | |
Other interest-earning assets | |
| 33,061 | |
| 2,522 |
| 7.63 | | |
| 16,700 | | $ | 939 |
| 5.62 | |
Total interest-earning assets | |
| 6,387,160 | |
| 375,405 |
| 5.88 | | |
| 6,571,156 | |
| 260,739 |
| 3.97 | |
Non-interest-earning assets | |
| 169,377 | |
|
|
|
| | |
| 90,495 | |
|
|
|
| |
Allowance for credit losses | |
| (49,923) | |
|
|
|
| | |
| (40,020) | |
|
|
|
| |
Total assets | | $ | 6,506,614 | |
|
|
|
| | | $ | 6,621,631 | |
|
|
|
| |
Liabilities and Stockholders' Equity: | |
|
| |
|
|
|
| | |
|
| |
|
|
|
| |
Interest-bearing liabilities: | |
|
| |
|
|
|
| | |
|
| |
|
|
|
| |
Money market and savings accounts | | $ | 3,299,427 | | $ | 127,494 |
| 3.86 | | | $ | 2,652,502 | | $ | 28,694 |
| 1.08 | |
Certificates of deposit | |
| 42,926 | |
| 1,183 |
| 2.76 | | |
| 59,645 | | $ | 590 |
| 0.99 | |
Total interest-bearing deposits | |
| 3,342,353 | |
| 128,677 |
| 3.85 | | |
| 2,712,147 | |
| 29,284 |
| 1.08 | |
Borrowed funds | |
| 445,061 | |
| 23,892 |
| 5.37 | | |
| 45,878 | |
| 2,297 |
| 5.00 | |
Total interest-bearing liabilities | |
| 3,787,414 | |
| 152,569 |
| 4.03 | | |
| 2,758,025 | |
| 31,581 |
| 1.15 | |
Non-interest-bearing liabilities: | |
|
| |
|
|
|
| | |
|
| |
|
|
|
| |
Non-interest-bearing deposits | |
| 1,960,469 | |
|
|
|
| | |
| 3,223,606 | |
|
|
|
| |
Other non-interest-bearing liabilities | |
| 137,725 | |
|
|
|
| | |
| 61,213 | |
|
|
|
| |
Total liabilities | |
| 5,885,608 | |
| |
|
| | |
| 6,042,844 | |
|
|
|
| |
Stockholders' equity | |
| 621,006 | |
|
|
|
| | |
| 578,787 | |
|
|
|
| |
Total liabilities and equity | | $ | 6,506,614 | |
|
|
|
| | | $ | 6,621,631 | |
|
|
|
| |
Net interest income | |
|
| | $ | 222,836 |
|
| | |
|
| | $ | 229,158 |
|
| |
Net interest rate spread (2) | |
|
| |
|
|
| 1.85 | % | |
|
| |
|
|
| 2.82 | % |
Net interest margin (3) | |
|
| |
|
|
| 3.49 | % | |
|
| |
|
|
| 3.49 | % |
Total cost of deposits (4) | | | | | | | | 2.43 | % | | | | | | | | 0.49 | % |
Total cost of funds (5) | |
|
| |
|
|
| 2.65 | % | |
|
| |
|
|
| 0.53 | % |
(1) | Amount includes deferred loan fees and non-performing loans. |
(2) | Determined by subtracting the annualized average cost of total interest-bearing liabilities from the annualized average yield on total interest-earning assets. |
(3) | Determined by dividing annualized net interest income by total average interest-earning assets. |
(4) | Determined by dividing annualized interest expense on deposits by total average interest-bearing and non-interest bearing deposits. |
(5) | Determined by dividing annualized interest expense by the sum of total average interest-bearing liabilities and total average non-interest-bearing deposits. |
12
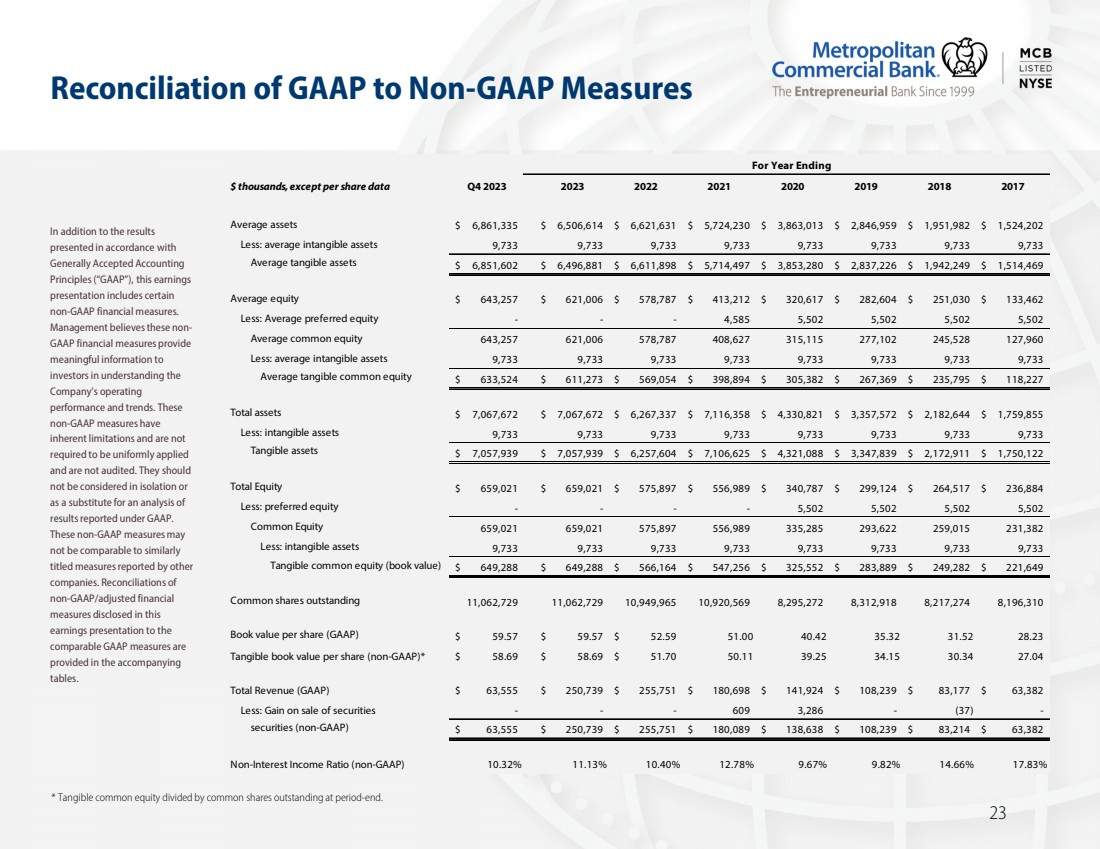
Reconciliation of Non-GAAP Measures
In addition to the results presented in accordance with Generally Accepted Accounting Principles (“GAAP”), this earnings release includes certain non-GAAP financial measures. Management believes these non-GAAP financial measures provide meaningful information to investors in understanding the Company’s operating performance and trends. These non-GAAP measures have inherent limitations and are not required to be uniformly applied and are not audited. They should not be considered in isolation or as a substitute for an analysis of results reported under GAAP. These non-GAAP measures may not be comparable to similarly titled measures reported by other companies. Reconciliations of non-GAAP/adjusted financial measures disclosed in this earnings release to the comparable GAAP measures are provided in the following tables:
| | Quarterly Data | | | Year ended | | ||||||||||||||||||||||
(dollars in thousands, | | Dec. 31, | | | Sept. 30, | | | Jun. 30, | | | Mar. 31, | | | Dec. 31, | | | Dec. 31, | | | Dec. 31, | | |||||||
except per share data) | | 2023 | | | 2023 | | | 2023 | | | 2023 | | | 2022 | | | 2023 | | | 2022 | | |||||||
Average assets | | $ | 6,861,335 | | | $ | 6,589,857 | | | $ | 6,354,597 | | | $ | 6,212,624 | | | $ | 6,283,813 | | | $ | 6,506,614 | | | $ | 6,621,631 | |
Less: average intangible assets | | | 9,733 | | | | 9,733 | | | | 9,733 | | | | 9,733 | | | | 9,733 | | | | 9,733 | | | | 9,733 | |
Average tangible assets (non-GAAP) | | $ | 6,851,602 | | | $ | 6,580,124 | | | $ | 6,344,864 | | | $ | 6,202,891 | | | $ | 6,274,080 | | | $ | 6,496,881 | | | $ | 6,611,898 | |
| | | | | | | | | | | | | | | | | | | | | | | | | | | | |
Average common equity | | $ | 643,257 | | | $ | 631,205 | | | $ | 616,370 | | | $ | 592,521 | | | $ | 595,769 | | | $ | 621,006 | | | $ | 578,787 | |
Less: average intangible assets | |
| 9,733 | | |
| 9,733 | | |
| 9,733 | | |
| 9,733 | | |
| 9,733 | | |
| 9,733 | | |
| 9,733 | |
Average tangible common equity (non-GAAP) | | $ | 633,524 | | | $ | 621,472 | | | $ | 606,637 | | | $ | 582,788 | | | $ | 586,036 | | | $ | 611,273 | | | $ | 569,054 | |
| | | | | | | | | | | | | | | | | | | | | | | | | | | | |
Total assets | | $ | 7,067,672 | | | $ | 6,683,359 | | | $ | 6,522,150 | | | $ | 6,309,982 | | | $ | 6,267,337 | | | $ | 7,067,672 | | | $ | 6,267,337 | |
Less: intangible assets | | | 9,733 | | | | 9,733 | | | | 9,733 | | | | 9,733 | | | | 9,733 | | | | 9,733 | | | | 9,733 | |
Tangible assets (non-GAAP) | | $ | 7,057,939 | | | $ | 6,673,626 | | | $ | 6,512,417 | | | $ | 6,300,249 | | | $ | 6,257,604 | | | $ | 7,057,939 | | | $ | 6,257,604 | |
| | | | | | | | | | | | | | | | | | | | | | | | | | | | |
Common equity | | $ | 659,021 | | | $ | 634,910 | | | $ | 621,275 | | | $ | 607,887 | | | $ | 575,897 | | | $ | 659,021 | | | $ | 575,897 | |
Less: intangible assets | |
| 9,733 | | |
| 9,733 | | |
| 9,733 | | |
| 9,733 | | |
| 9,733 | | |
| 9,733 | | |
| 9,733 | |
Tangible common equity (book value) (non-GAAP) | | $ | 649,288 | | | $ | 625,177 | | | $ | 611,542 | | | $ | 598,154 | | | $ | 566,164 | | | $ | 649,288 | | | $ | 566,164 | |
| | | | | | | | | | | | | | | | | | | | | | | | | | | | |
Common shares outstanding | | | 11,062,729 | | | | 11,062,729 | | | | 10,991,074 | | | | 11,211,274 | | | | 10,949,965 | | | | 11,062,729 | | | | 10,949,965 | |
Book value per share (GAAP) | | $ | 59.57 | | | $ | 57.39 | | | $ | 56.53 | | | $ | 54.22 | | | $ | 52.59 | | | $ | 59.57 | | | $ | 52.59 | |
Tangible book value per share (non-GAAP) (1) | | $ | 58.69 | | | $ | 56.51 | | | $ | 55.64 | | | $ | 53.35 | | | $ | 51.70 | | | $ | 58.69 | | | $ | 51.70 | |
(1) Tangible book value divided by common shares outstanding at period-end.
Explanatory Note
Some amounts presented within this document may not recalculate due to rounding.
13