Exhibit 99.1

Release: 4:05 P.M. January 20, 2022
212-365-6700
IR@MCBankNY.com
Metropolitan Bank Holding Corp. Reports Record Quarterly and
Annual Net Income
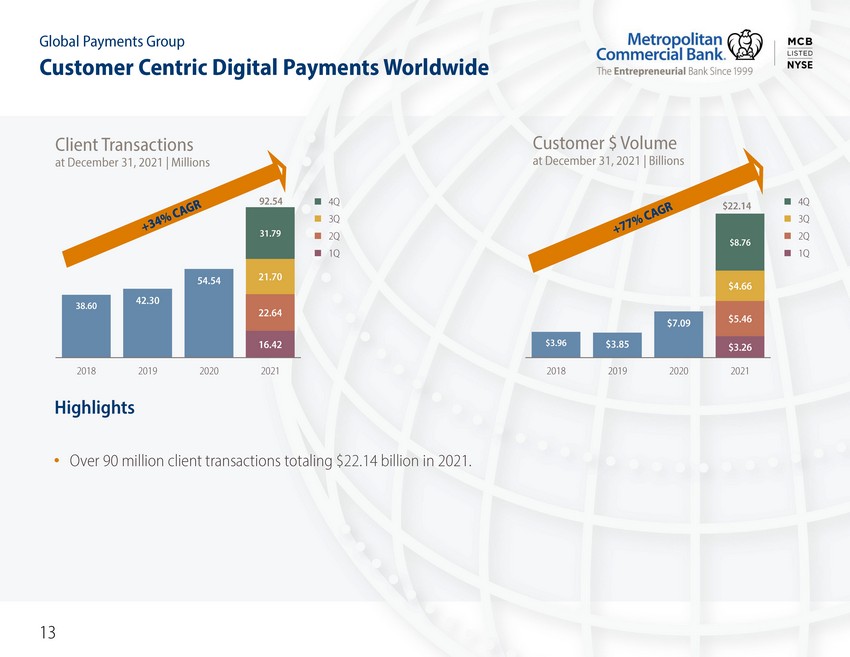
Banking-As-A-Service Revenues Increased 94.3% Year-Over-Year
Tangible Book Value Per Share Increased 27.6% Year-Over-Year1
NEW YORK, January 20, 2022 – Metropolitan Bank Holding Corp. (the “Company”) (NYSE: MCB), the holding company for Metropolitan Commercial Bank (the “Bank”), reported net income of $18.9 million, or $1.69 per diluted common share, for the fourth quarter of 2021 compared to net income of $11.8 million, or $1.39 per diluted common share, for the fourth quarter of 2020. Net income for the year 2021 was $60.6 million, or $6.45 per diluted common share, compared to net income of $39.5 million, or $4.66 per diluted common share, for the year 2020.
Financial Highlights include:
For the Full Year 2021:
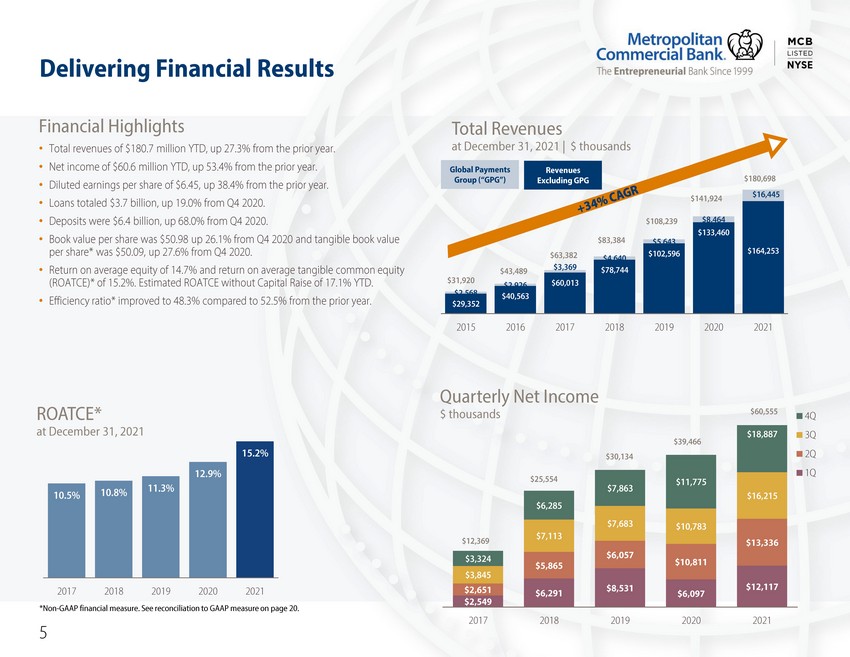
| · | Total revenues of $180.7 million, up 27.3%. |
| · | Net income of $60.6 million, up 53.4%. |
| · | Diluted earnings per share of $6.45, up 38.4%. |
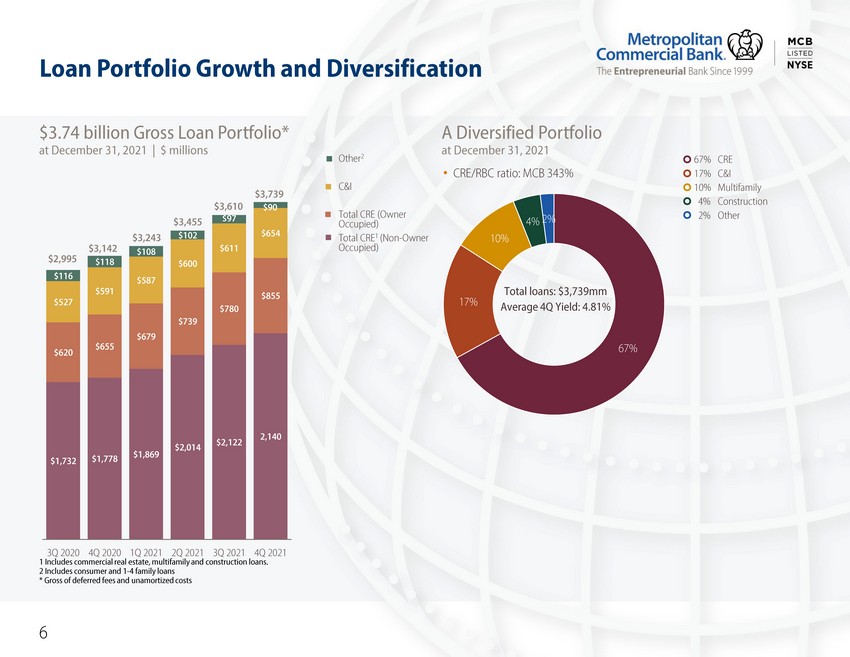
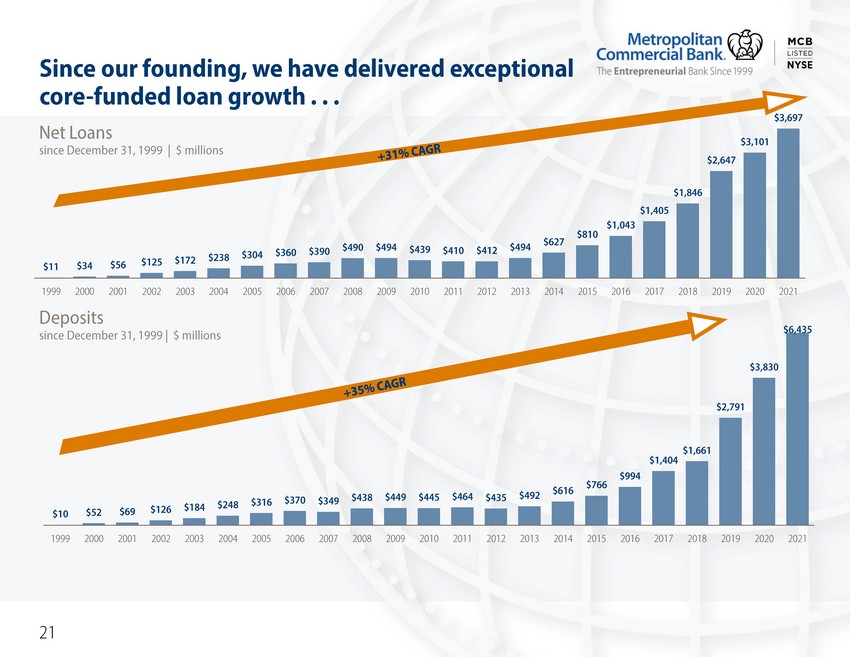
| · | Loans totaled $3.7 billion, up 19.0%. Loan originations of $1.2 billion for 2021 compared to $687 million for 2020. |
| · | Deposits were $6.4 billion, up 68.0%. Non-interest-bearing demand deposits increased to $3.7 billion, up 112.5%. |
| · | Common equity offering at a price of $75.00 per share completed in September 2021, which raised net proceeds of $163 million. |
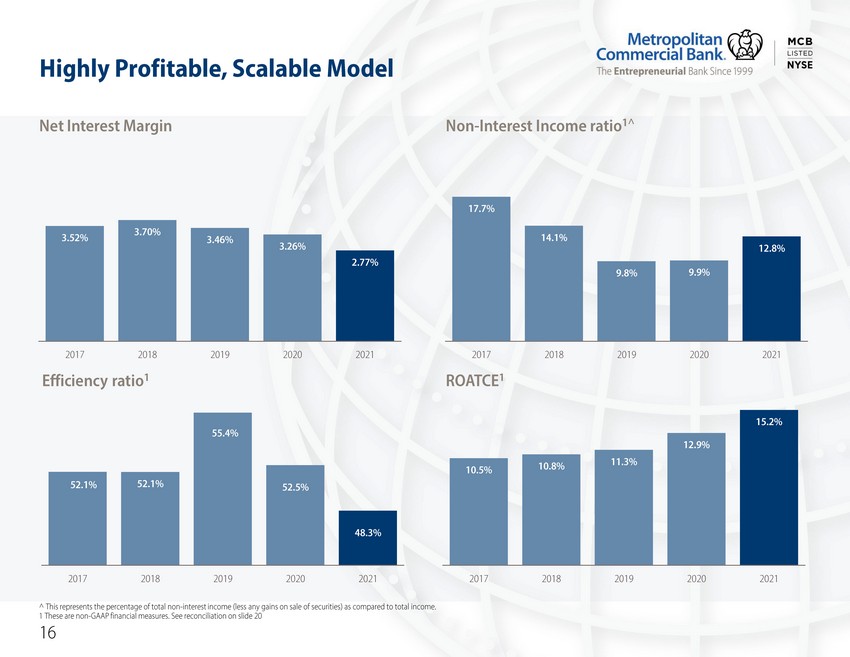
| · | Book value per share was $50.98 per share, up 26.1%, and tangible book value per share1 was $50.09, up 27.6%. |
| · | Return on average equity of 14.7% and return on average tangible common equity (ROATCE)1 of 15.2%. |
| · | Efficiency ratio1 improved to 48.3% compared to 52.5% from the prior year. |
Fourth Quarter of 2021 Compared to the Prior Linked Quarter:
| · | Total revenues of $51.9 million, up 11.1%. |
| · | Net income of $18.9 million, up 16.5%. |
| · | Loans totaled $3.7 billion, up 3.6%. |
| · | Deposits were $6.4 billion, up 17.9%. |
| · | Annualized return on average equity of 13.6% and annualized ROATCE1 of 13.9%. |
1 Non-GAAP financial measure. See Reconciliation of Non-GAAP Measures starting on page 14.
1
Mark DeFazio, President and Chief Executive Officer, commented, “2021 was a breakout year for MCB that underscores our sustained performance. Being recognized in Fortune’s 100 Fastest Growing Companies in 2021 highlights the success we have had in growing both the commercial bank and our Global Payments business, which was evident from the strong growth in loans and deposits as well as the expansion of Global Payments revenues from the banking-as-a-service we provide to our fintech partners. I could not be more proud of the men and women who show up in person every day and make this possible. I would also like to thank our board of directors for their support and guidance.”
Balance Sheet
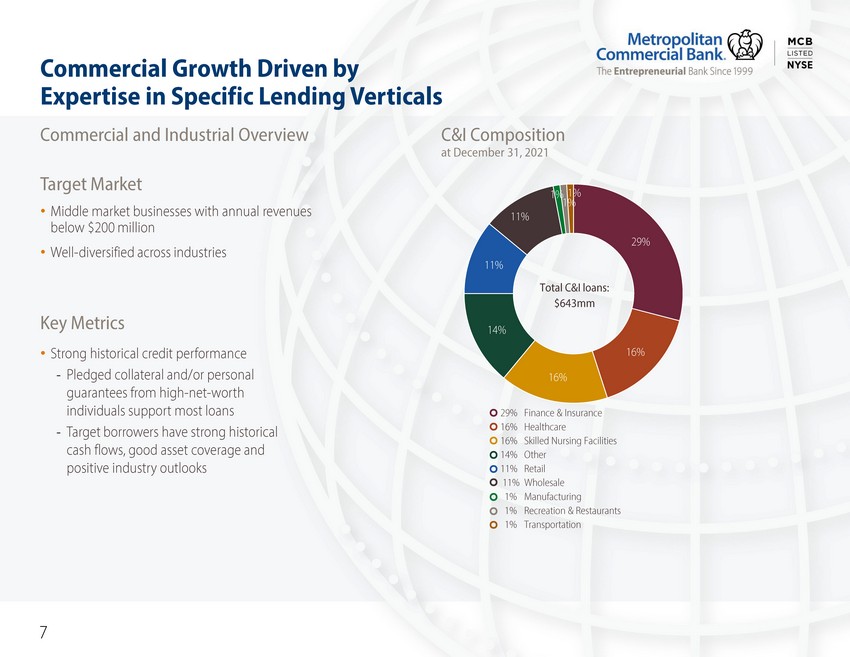
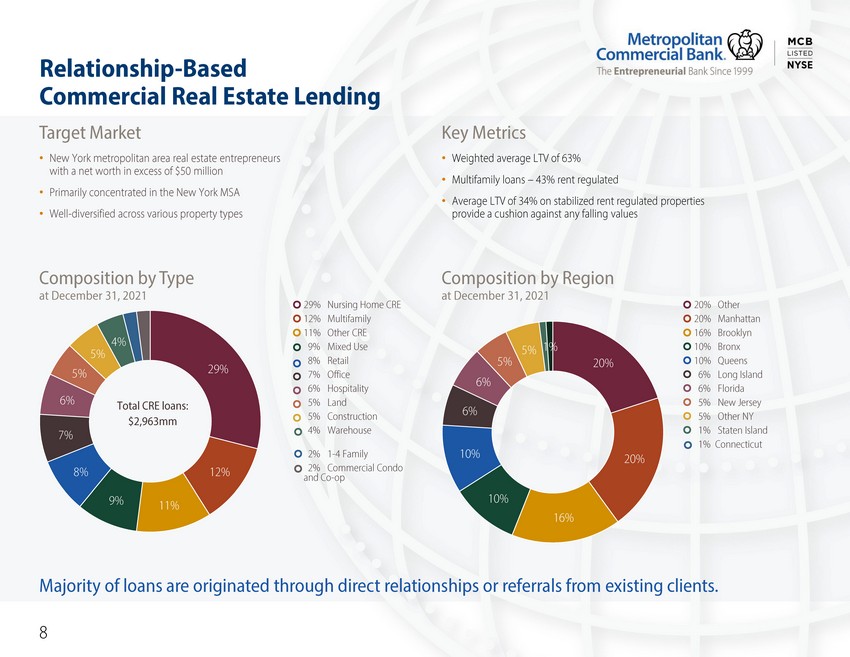
The Company had total assets of $7.1 billion at December 31, 2021, an increase of 15.9% from September 30, 2021. Total loans, net of deferred fees and unamortized costs, increased $129 million, or 3.6%, from the prior linked quarter to $3.7 billion. The increase in total loans was due primarily to an increase of $110 million in commercial real estate (“CRE”) loans (including owner occupied) and $43 million in commercial and industrial loans. Loan production was $411 million for the fourth quarter of 2021, compared to $313 million for the prior linked quarter. Loans of $18 million were transferred to held-for-sale and sold in the fourth quarter.
Total assets increased 64.3% from December 31, 2020. Total loans, net of deferred fees and unamortized costs, increased to $3.7 billion at December 31, 2021, an increase of 19.0%, as compared to $3.1 billion at December 31, 2020. The increase in total loans was due primarily to an increase of $601 million in CRE loans (including owner occupied) and $63 million in commercial and industrial loans. Loan production was $1.2 billion for the year 2021 compared to $687 million for the year 2020.
Total cash and cash equivalents were $2.4 billion at December 31, 2021, an increase of $502 million, or 27.0% from September 30, 2021, and $1.5 billion, or 173.0%, from December 31, 2020. The increase in cash and cash equivalents reflected the strong growth in deposits as well as the cash received from the issuance of common stock during the third quarter of 2021.
Total securities were $951 million at December 31, 2021, an increase of 56.5% from September 30, 2021, and 250.7% from December 31, 2020, due primarily to the deployment of excess liquidity from deposit growth.
Total deposits increased $978 million to $6.4 billion at December 31, 2021, up 17.9% from September 30, 2021. The increase in deposits was due primarily to an increase in non-interest-bearing demand deposits from Global Payments Group clients. Total deposits increased $2.6 billion, up 68.0% from December 31, 2020. The increase in deposits from December 31, 2020, was due to increases of $1.9 billion in non-interest-bearing demand deposits and $663 million in interest-bearing deposits, resulting from increases across most deposit verticals.
Non-interest-bearing demand deposits were 57.0% of total deposits at December 31, 2021, as compared to 51.4% and 45.1% at September 30, 2021, and December 31, 2020, respectively.
The Company and the Bank each met all the requirements to be considered “Well-Capitalized” under applicable regulatory guidelines. Total non-owner-occupied commercial real estate loans were 343.4% of total risk-based capital at December 31, 2021, compared to 412.5% of total risk-based capital at December 31, 2020.
2
Income Statement
Financial Highlights
| (dollars in thousands, except per share data) | Three Months Ended | Twelve Months Ended | ||||||||||||||||||
| Dec 31, | Sept 30, | Dec 31, | Dec 31, | |||||||||||||||||
| 2021 | 2021 | 2020 | 2021 | 2020 | ||||||||||||||||
| Total revenues | $ | 51,867 | $ | 46,683 | $ | 36,840 | $ | 180,698 | $ | 141,924 | ||||||||||
| Net income | 18,887 | 16,215 | 11,775 | 60,555 | 39,466 | |||||||||||||||
| Diluted earnings per common share | 1.69 | 1.77 | 1.39 | 6.45 | 4.66 | |||||||||||||||
| Return on average assets (1) | 1.10 | % | 1.09 | % | 1.13 | % | 1.06 | % | 1.02 | % | ||||||||||
| Return on average equity (1) | 13.57 | % | 16.30 | % | 13.94 | % | 14.65 | % | 12.31 | % | ||||||||||
| Return on average tangible common equity (1), (2) | 13.86 | % | 16.95 | % | 14.61 | % | 15.18 | % | 12.92 | % | ||||||||||
| (1) | For periods less than a year, ratios are annualized. |
| (2) | Non-GAAP financial measure. See Reconciliation of Non-GAAP Measures starting on page 14. |
Net Interest Income
Net interest income for the fourth quarter of 2021 was $44.8 million, an increase of $4.0 million from the prior linked quarter. This increase was primarily due to a higher average balance of $855 million in interest-earning assets, particularly in loans, held-to-maturity securities, and overnight deposits for the fourth quarter of 2021, which increased $128 million, $190 million and $477 million from the prior linked quarter, respectively.
Net interest income for the year 2021 was $157.0 million, an increase of $32.1 million from the prior year. This increase was primarily due to a higher average balance of $1.8 billion in interest-earning assets, particularly in loans and securities, which increased $560 million and $344 million from the prior year, respectively.
Net Interest Margin
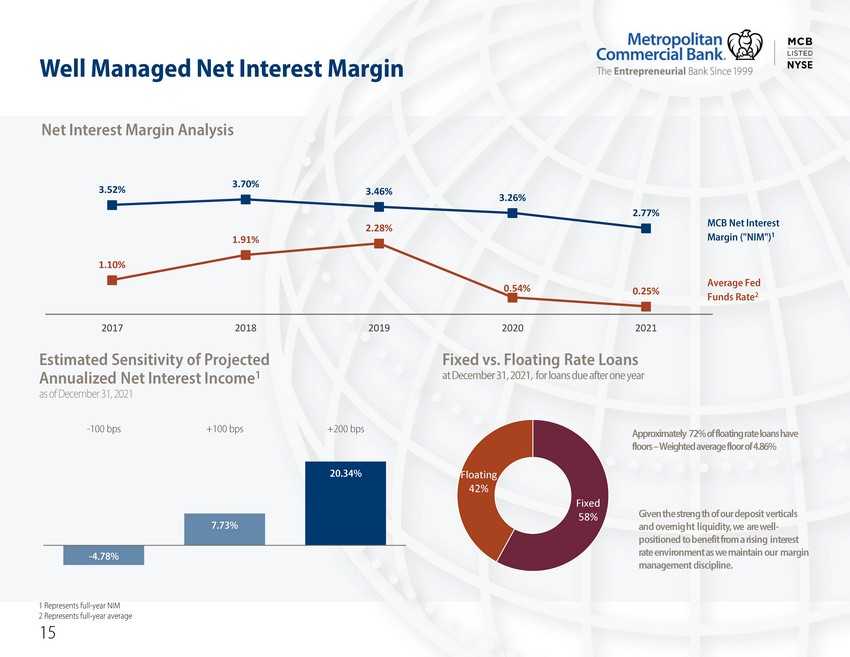
Net interest margin decreased by 11 basis points to 2.59% for the fourth quarter of 2021, as compared to 2.70% for the prior linked quarter, primarily due to the increase in lower yielding overnight deposits driven by deposit growth. This was partially offset by an increase in loan yields which were up on elevated fees from loan payoffs, securities yields which were up due to new securities purchases at higher yields, and a modest decline in the average cost of interest-bearing liabilities.
Net interest margin decreased by 49 basis points to 2.77% for the year 2021, as compared to 3.26% for the prior year primarily due to the increase in lower-yielding overnight deposits driven by deposit growth and the decrease in yields on securities driven by the lower rate environment. This was partially offset by a decrease of 25 basis points in the average cost of interest-bearing liabilities driven by the lower rate environment.
Total cost of funds declined 3 basis points to 28 basis points for the fourth quarter of 2021 as compared to the prior linked quarter, driven by the shift toward non-interest bearing deposits as well as a decrease in cost of interest-bearing deposits.
3
Non-Interest Income
Non-interest income was $7.1 million for the fourth quarter of 2021, an increase of $1.2 million from the prior linked quarter driven primarily by the increase of $1.4 million in Global payments revenue from underlying client transaction volumes.
Non-interest income for the year 2021 increased by $6.7 million, as compared to the prior year, primarily due to an increase of $8.0 million in Global Payments Group revenue. This was partially offset by a decrease of $2.7 million in gain on sale of securities.
Non-Interest Expense
Non-interest expense was $23.3 million for the fourth quarter of 2021, an increase of $1.3 million from the prior linked quarter primarily driven by increased compensation and benefits and technology costs, which were in line with revenue growth and transaction volumes, respectively.
Non-interest expense increased $12.8 million, as compared to the prior year. Drivers included an increase in compensation and benefits costs due to additional full-time employees and an increase in professional fees and technology costs in line with revenue growth. This was partially offset by reduced licensing fees.
The estimated effective tax rate for the year ended December 31, 2021, was 32.4% compared to 31.9% for the year ended December 31, 2020.
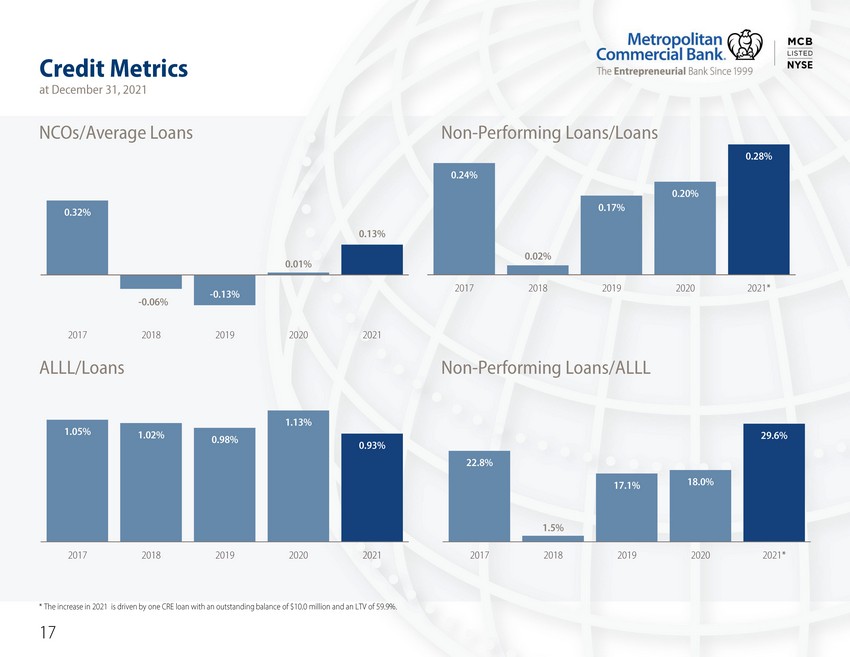
Asset Quality
Credit quality remains strong as non-performing loans to total loans decreased to 0.28% at December 31, 2021, from 0.43% at September 30, 2021. During the fourth quarter of 2021, the Company recorded a provision of $0.5 million, which reflected loan growth and losses on transfers of loans to held for sale of $0.8 million. This was partially offset by a reduction in the provision of $1.4 million related to a reduction in non-performing consumer loans. Additionally, the Company recorded net charge-offs in the fourth quarter of $3.9 million which primarily related to one shared national credit loan of $3.1 million that had been substantially reserved for in 2020, as well as $0.8 million related to the loans transferred to held-for-sale.
The Company recorded a provision of $3.8 million for the full year 2021. Additionally, the Company recorded net charge-offs in 2021 of $4.5 million, which primarily related to one shared national credit loan of $3.1 million and two C&I loans in the amount of $0.9 million, which had been substantially reserved for in 2020, as well as $0.8 million related to the loans transferred to held for sale. Net charge-offs as a percentage of average loans for the full year 2021 were 13 basis points.
COVID-19 related full payment deferrals remained steady at $10.0 million, or 27 basis points of total loans as of December 31, 2021. Principal only deferrals were $39.2 million, or 1.05% of total loans, as of December 31, 2021.
4
Conference Call
The Company will conduct a conference call at 9:00 a.m. Eastern time on Friday, January 21, 2022, to discuss fourth quarter 2021 and full year 2021 results. To access the event by telephone, please dial 866-342-8591 (US), 203-518-9713 (INTL), and provide conference ID: MCBQ421 approximately 15 minutes prior to the start time (to allow time for registration).
The call will also be broadcast live over the Internet and accessible at MCB Quarterly Results Conference Call and in the Investor Relations section of the Company’s website at MCB News. To listen to the live webcast, please visit the site at least 15 minutes prior to the start time to register, download and install any necessary audio software.
For those unable to join for the live presentation, a replay of the webcast will also be available later that day accessible at MCB Quarterly Results Conference Call.
About Metropolitan Bank Holding Corp.
Metropolitan Bank Holding Corp. (NYSE: MCB) is the parent company of Metropolitan Commercial Bank (the “Bank”). The Bank is a New York City based commercial bank which provides a broad range of business, commercial and personal banking products and services to small, middle-market, corporate enterprises, municipalities, and affluent individuals. The Bank’s Global Payments Group is an established leader in BaaS (“Banking-as-a-Service”) that include: domestic and international clients; digital payments settlements; gateway to payment networks; custodian of deposits; regulatory and compliance oversight; global settlement agent for crypto exchanges and a leading national issuer of third-party debit cards. The Bank operates banking centers in New York City and on Long Island in New York State and has been ranked as one of the 100 Fastest-Growing Companies by Fortune. The Bank is a New York State chartered commercial bank and a member of the Federal Reserve System and the Federal Deposit Insurance Corporation, and an equal opportunity lender. For more information, please visit MCBankNY.com.
Forward Looking Statement Disclaimer
This release contains “forward-looking statements” within the meaning of the Private Securities Litigation Reform Act of 1995. Examples of forward-looking statements include but are not limited to the Company’s future financial condition and capital ratios, results of operations and the Company’s outlook and business. Forward-looking statements are not historical facts. Such statements may be identified by the use of such words as “may,” “believe,” “expect,” “anticipate,” “plan,” “continue” or similar terminology. These statements relate to future events or our future financial performance and involve risks and uncertainties that may cause our actual results, levels of activity, performance or achievements to differ materially from those expressed or implied by these forward-looking statements. Although we believe that the expectations reflected in the forward-looking statements are reasonable, we caution you not to place undue reliance on these forward-looking statements. Factors which may cause our forward-looking statements to be materially inaccurate include, but are not limited to an unexpected deterioration in our loan or securities portfolios, unexpected increases in our expenses, greater than anticipated growth and our ability to manage our growth, unanticipated regulatory action or changes in regulations, unexpected changes in interest rates, an unanticipated decrease in deposits, an unanticipated loss of key personnel or existing customers, competition from other institutions resulting in unanticipated changes in our loan or deposit rates, unanticipated increases in FDIC costs, changes in regulations, legislation or tax or accounting rules and unanticipated adverse changes in our customers’ economic conditions or general economic conditions, as well as those discussed under the heading “Risk Factors” in our Annual Report on Form 10-K and Quarterly Reports on Form 10-Q.
| 5 |
Further, given its ongoing and dynamic nature, including the rate of vaccine acceptance and the development of new variants, it is difficult to predict the continued impact of the COVID-19 outbreak on our business. The extent of such impact will depend on future developments, which are highly uncertain, including when the coronavirus can be controlled and abated. As the result of the COVID-19 pandemic and the related adverse local and national economic consequences, we could be subject to any of the following risks, any of which could have a material, adverse effect on our business, financial condition, liquidity, and results of operations: the demand for our products and services may decline, making it difficult to grow assets and income; if the economy worsens, loan delinquencies, problem assets, and foreclosures may increase, resulting in increased charges and reduced income; collateral for loans, especially real estate, may decline in value, which could cause loan losses to increase; our allowance for loan losses may increase if borrowers experience financial difficulties, which will adversely affect our net income; the net worth and liquidity of loan guarantors may decline, impairing their ability to honor commitments to us; our cyber security risks may increase if a significant number of our employees are forced to work remotely; and FDIC premiums may increase if the agency experiences additional resolution costs. Forward-looking statements speak only as of the date of this release. We do not undertake any obligation to update or revise any forward-looking statement.
6
Consolidated Balance Sheet (unaudited)
| (in thousands) | Dec 31, 2021 | Sept 30, 2021 | June 30, 2021 | Mar 31, 2021 | Dec 31, 2020 | |||||||||||||||
| Assets | ||||||||||||||||||||
| Cash and due from banks | $ | 28,864 | $ | 32,660 | $ | 29,651 | $ | 9,432 | $ | 8,692 | ||||||||||
| Overnight deposits | 2,330,486 | 1,824,820 | 1,689,614 | 1,125,589 | 855,613 | |||||||||||||||
| Total cash and cash equivalents | 2,359,350 | 1,857,480 | 1,719,265 | 1,135,021 | 864,305 | |||||||||||||||
| Investment securities available for sale | 566,624 | 603,168 | 543,769 | 479,988 | 266,096 | |||||||||||||||
| Investment securities held to maturity | 382,099 | 2,017 | 2,222 | 2,492 | 2,760 | |||||||||||||||
| Investment securities -- Equity investments | 2,273 | 2,289 | 2,291 | 2,281 | 2,313 | |||||||||||||||
| Total securities | 950,996 | 607,474 | 548,282 | 484,761 | 271,169 | |||||||||||||||
| Other investments | 11,998 | 11,998 | 11,989 | 11,638 | 11,597 | |||||||||||||||
| Loans, net of deferred fees and unamortized costs | 3,731,929 | 3,603,288 | 3,449,490 | 3,237,664 | 3,137,053 | |||||||||||||||
| Allowance for loan losses | (34,729 | ) | (38,121 | ) | (37,377 | ) | (35,502 | ) | (35,407 | ) | ||||||||||
| Net loans | 3,697,200 | 3,565,167 | 3,412,113 | 3,202,162 | 3,101,646 | |||||||||||||||
| Receivables from global payments business, net | 39,864 | 48,302 | 40,091 | 38,356 | 27,259 | |||||||||||||||
| Accrued interest receivable | 15,195 | 13,504 | 14,424 | 13,982 | 13,249 | |||||||||||||||
| Premises and equipment, net | 15,116 | 14,031 | 13,337 | 13,756 | 13,475 | |||||||||||||||
| Prepaid expenses and other assets | 16,906 | 13,565 | 17,959 | 13,392 | 18,388 | |||||||||||||||
| Goodwill | 9,733 | 9,733 | 9,733 | 9,733 | 9,733 | |||||||||||||||
| Total assets | $ | 7,116,358 | $ | 6,141,254 | $ | 5,787,193 | $ | 4,922,801 | $ | 4,330,821 | ||||||||||
| Liabilities and Stockholders' Equity | ||||||||||||||||||||
| Deposits: | ||||||||||||||||||||
| Non-interest-bearing demand deposits | $ | 3,668,673 | $ | 2,803,823 | $ | 2,794,136 | $ | 2,167,899 | 1,726,135 | |||||||||||
| Interest-bearing deposits | 2,766,899 | 2,653,746 | 2,494,137 | 2,258,818 | 2,103,471 | |||||||||||||||
| Total deposits | 6,435,572 | 5,457,569 | 5,288,273 | 4,426,717 | 3,829,606 | |||||||||||||||
| Trust preferred securities | 20,620 | 20,620 | 20,620 | 20,620 | 20,620 | |||||||||||||||
| Subordinated debt, net of issuance cost | 24,712 | 24,698 | 24,684 | 24,670 | 24,657 | |||||||||||||||
| Secured Borrowings | 32,461 | 35,559 | 36,449 | 36,475 | 36,964 | |||||||||||||||
| Accounts payable, accrued expenses and other liabilities | 36,411 | 38,129 | 30,598 | 42,737 | 61,645 | |||||||||||||||
| Accrued interest payable | 746 | 448 | 1,773 | 563 | 712 | |||||||||||||||
| Prepaid third-party debit cardholder balances | 8,847 | 21,577 | 21,201 | 22,802 | 15,830 | |||||||||||||||
| Total liabilities | 6,559,369 | 5,598,600 | 5,423,598 | 4,574,584 | 3,990,034 | |||||||||||||||
| Class B preferred stock | — | 3 | 3 | 3 | 3 | |||||||||||||||
| Common stock | 109 | 106 | 83 | 83 | 82 | |||||||||||||||
| Additional paid in capital | 382,999 | 382,922 | 219,098 | 217,384 | 218,899 | |||||||||||||||
| Retained earnings | 181,385 | 162,498 | 146,283 | 132,947 | 120,830 | |||||||||||||||
| Accumulated other comprehensive gain, net of tax effect | (7,504 | ) | (2,875 | ) | (1,872 | ) | (2,200 | ) | 973 | |||||||||||
| Total stockholders’ equity | 556,989 | 542,654 | 363,595 | 348,217 | 340,787 | |||||||||||||||
| Total liabilities and stockholders’ equity | $ | 7,116,358 | $ | 6,141,254 | $ | 5,787,193 | $ | 4,922,801 | $ | 4,330,821 | ||||||||||
7
Consolidated Statement of Income (unaudited)
| Three Months Ended | Twelve Months Ended | |||||||||||||||||||
| (dollars in thousands, except per share data) | Dec. 31, 2021 | Sep. 30, 2021 | Dec. 31, 2020 | Dec. 31, 2021 | Dec. 31, 2020 | |||||||||||||||
| Total interest income | $ | 49,110 | $ | 45,018 | $ | 36,862 | $ | 173,284 | $ | 143,097 | ||||||||||
| Total interest expense | 4,300 | 4,226 | 3,395 | 16,283 | 18,176 | |||||||||||||||
| Net interest income | 44,810 | 40,792 | 33,467 | 157,001 | 124,921 | |||||||||||||||
| Provision for loan losses | 501 | 490 | 1,795 | 3,816 | 9,488 | |||||||||||||||
| Net interest income after provision for loan losses | 44,309 | 40,302 | 31,672 | 153,185 | 115,433 | |||||||||||||||
| Non-interest income: | ||||||||||||||||||||
| Service charges on deposit accounts (1) | 1,313 | 1,344 | 981 | 4,755 | 3,728 | |||||||||||||||
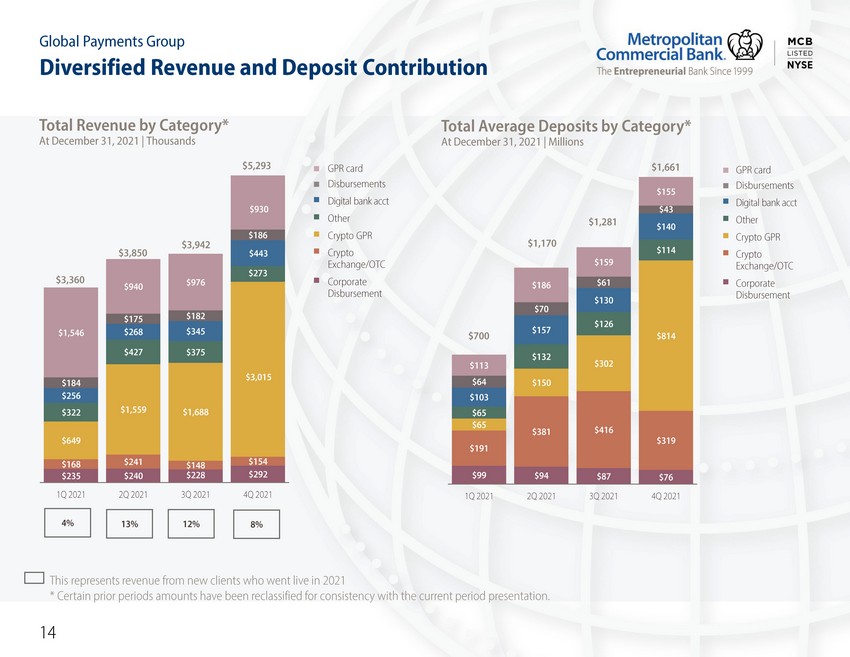
| Global payments revenue (1) | 5,293 | 3,942 | 2,163 | 16,445 | 8,464 | |||||||||||||||
| Other service charges and fees | 468 | 614 | 236 | 1,950 | 1,477 | |||||||||||||||
| Unrealized gain (loss) on equity securities | (17 | ) | (9 | ) | (7 | ) | (62 | ) | 48 | |||||||||||
| Gain (loss) on sale of securities | — | — | — | 609 | 3,286 | |||||||||||||||
| Total non-interest income | 7,057 | 5,891 | 3,373 | 23,697 | 17,003 | |||||||||||||||
| Non-interest expense: | ||||||||||||||||||||
| Compensation and benefits | 12,001 | 11,269 | 9,835 | 45,908 | 39,797 | |||||||||||||||
| Bank premises and equipment | 1,992 | 2,038 | 1,842 | 8,055 | 8,340 | |||||||||||||||
| Professional fees | 1,567 | 1,877 | 1,064 | 6,750 | 4,122 | |||||||||||||||
| Technology costs | 1,736 | 1,090 | 864 | 5,201 | 3,387 | |||||||||||||||
| Licensing fees | 2,265 | 2,201 | 1,950 | 8,606 | 9,653 | |||||||||||||||
| Other expenses | 3,753 | 3,509 | 2,233 | 12,792 | 9,219 | |||||||||||||||
| Total non-interest expense | 23,314 | 21,984 | 17,788 | 87,312 | 74,518 | |||||||||||||||
| Net income before income tax expense | 28,052 | 24,209 | 17,257 | 89,570 | 57,918 | |||||||||||||||
| Income tax expense | 9,165 | 7,994 | 5,482 | 29,015 | 18,452 | |||||||||||||||
| Net income | $ | 18,887 | $ | 16,215 | $ | 11,775 | $ | 60,555 | $ | 39,466 | ||||||||||
| Earnings per common share: | ||||||||||||||||||||
| Average common shares outstanding - basic | 10,780,073 | 8,618,973 | 8,225,083 | 9,011,700 | 8,221,429 | |||||||||||||||
| Average common shares outstanding - diluted | 11,084,262 | 8,893,104 | 8,417,729 | 9,272,822 | 8,398,444 | |||||||||||||||
| Basic earnings | $ | 1.74 | 1.82 | $ | 1.42 | $ | 6.64 | $ | 4.76 | |||||||||||
| Diluted earnings | $ | 1.69 | 1.77 | $ | 1.39 | $ | 6.45 | $ | 4.66 | |||||||||||
| (1) | Certain prior period amounts have been reclassified for consistency with the current period presentation. |
8
Loan Production, Asset Quality & Regulatory Capital
| (dollars in thousands) | Dec 31, 2021 | Sept 30, 2021 | June 30, 2021 | Mar 31, 2021 | Dec 31, 2020 | |||||||||||||||
| LOAN PRODUCTION | $ | 411.0 | $ | 312.9 | $ | 265.4 | $ | 235.7 | $ | 174.0 | ||||||||||
| ASSET QUALITY | ||||||||||||||||||||
| Non-performing loans: | ||||||||||||||||||||
| Non-accrual loans: | ||||||||||||||||||||
| Commercial real estate | $ | 9,984 | $ | 9,984 | $ | — | $ | — | $ | — | ||||||||||
| Commercial and industrial | — | 3,145 | 3,337 | 3,337 | 4,192 | |||||||||||||||
| Consumer | 37 | 1,674 | 1,560 | 1,523 | 1,428 | |||||||||||||||
| Total non-accrual loans | 10,021 | 14,803 | 4,897 | 4,860 | 5,620 | |||||||||||||||
| Total non-performing loans | 10,286 | 15,376 | 5,491 | 5,464 | 6,389 | |||||||||||||||
| Non-accrual loans to total loans | 0.27 | % | 0.41 | % | 0.14 | % | 0.15 | % | 0.18 | % | ||||||||||
| Non-performing loans to total loans | 0.28 | % | 0.43 | % | 0.16 | % | 0.17 | % | 0.20 | % | ||||||||||
| Allowance for loan losses | 34,729 | 38,121 | 37,377 | 35,502 | 35,407 | |||||||||||||||
| Allowance for loan losses to total loans | 0.93 | % | 1.06 | % | 1.08 | % | 1.10 | % | 1.13 | % | ||||||||||
| Charge-offs | (3,909 | ) | (54 | ) | — | (855 | ) | (30 | ) | |||||||||||
| Recoveries | 17 | 308 | — | — | 28 | |||||||||||||||
| Net charge-offs/(recoveries) as to average loans (annualized) | 0.42 | % | (0.03 | )% | — | % | 0.11 | % | — | % | ||||||||||
| REGULATORY CAPITAL | ||||||||||||||||||||
| Tier 1 Leverage: | ||||||||||||||||||||
| Metropolitan Bank Holding Corp. | 8.5 | % | 9.4 | % | 6.8 | % | 7.8 | % | 8.5 | % | ||||||||||
| Metropolitan Commercial Bank | 8.4 | % | 9.3 | % | 7.3 | % | 8.2 | % | 9.0 | % | ||||||||||
| Common Equity Tier 1 Risk-Based (CET1): | ||||||||||||||||||||
| Metropolitan Bank Holding Corp. | 14.1 | % | 14.1 | % | 9.7 | % | 9.9 | % | 10.1 | % | ||||||||||
| Metropolitan Commercial Bank | 14.4 | % | 14.6 | % | 11.1 | % | 11.3 | % | 11.6 | % | ||||||||||
| Tier 1 Risk-Based: | ||||||||||||||||||||
| Metropolitan Bank Holding Corp. | 14.6 | % | 14.8 | % | 10.5 | % | 10.7 | % | 10.9 | % | ||||||||||
| Metropolitan Commercial Bank | 14.4 | % | 14.6 | % | 11.1 | % | 11.3 | % | 11.6 | % | ||||||||||
| Total Risk-Based: | ||||||||||||||||||||
| Metropolitan Bank Holding Corp. | 16.1 | % | 16.5 | % | 12.2 | % | 12.4 | % | 12.7 | % | ||||||||||
| Metropolitan Commercial Bank | 15.2 | % | 15.6 | % | 12.2 | % | 12.4 | % | 12.7 | % | ||||||||||
9
Performance Measures
| Three Months Ended | Twelve Months Ended | |||||||||||||||||||
| (dollars in thousands, except per share data) | Dec 31, 2021 | Sept 30, 2021 | Dec 31, 2020 | Dec 31, 2021 | Dec 31, 2020 | |||||||||||||||
| Net income available to common shareholders | 18,718 | 15,661 | 11,690 | 59,816 | 39,122 | |||||||||||||||
| Per common share: | ||||||||||||||||||||
| Basic earnings | $ | 1.74 | $ | 1.82 | $ | 1.42 | $ | 6.64 | $ | 4.76 | ||||||||||
| Diluted earnings | $ | 1.69 | $ | 1.77 | $ | 1.39 | $ | 6.45 | $ | 4.66 | ||||||||||
| Common shares outstanding: | ||||||||||||||||||||
| Period end | 10,925,029 | 10,644,193 | 8,295,272 | 10,925,029 | 8,295,272 | |||||||||||||||
| Average fully diluted | 11,084,262 | 8,893,104 | 8,417,729 | 9,272,822 | 8,398,444 | |||||||||||||||
| Return on: (1) | ||||||||||||||||||||
| Average total assets | 1.10 | % | 1.09 | % | 1.13 | % | 1.06 | % | 1.02 | % | ||||||||||
| Average equity | 13.57 | % | 16.30 | % | 13.94 | % | 14.65 | % | 12.31 | % | ||||||||||
| Average tangible common equity (2) | 13.86 | % | 16.95 | % | 14.61 | % | 15.18 | % | 12.92 | % | ||||||||||
| Yield on average earning assets | 2.85 | % | 2.99 | % | 3.54 | % | 3.05 | % | 3.73 | % | ||||||||||
| Cost of interest-bearing deposits | 0.54 | % | 0.57 | % | 0.56 | % | 0.57 | % | 0.75 | % | ||||||||||
| Net interest spread | 2.24 | % | 2.35 | % | 2.90 | % | 2.41 | % | 2.83 | % | ||||||||||
| Net interest margin | 2.59 | % | 2.70 | % | 3.21 | % | 2.77 | % | 3.26 | % | ||||||||||
| Net charge-offs as % of average loans (1) | 0.42 | % | (0.03 | )% | 0.00 | % | 0.13 | % | 0.01 | % | ||||||||||
| Efficiency ratio (2) | 44.95 | % | 47.09 | % | 48.28 | % | 48.32 | % | 52.51 | % | ||||||||||
| (1) | For periods less than a year, ratios are annualized. |
| (2) | Non-GAAP financial measure. See Reconciliation of Non-GAAP Measures starting on page 14. |
10
Interest Margin Analysis
| Three Months Ended | ||||||||||||||||||||||||
| Dec 31, 2021 | Sep 30, 2021 | |||||||||||||||||||||||
| Average | Average | |||||||||||||||||||||||
| Outstanding | Yield/Rate | Outstanding | Yield/Rate | |||||||||||||||||||||
| (dollars in thousands) | Balance | Interest | (annualized) | Balance | Interest | (annualized) | ||||||||||||||||||
| Assets: | ||||||||||||||||||||||||
| Interest-earning assets: | ||||||||||||||||||||||||
| Loans (1) | $ | 3,694,362 | $ | 45,724 | 4.81 | % | $ | 3,566,852 | $ | 42,730 | 4.65 | % | ||||||||||||
| Available-for-sale securities | 599,175 | 1,656 | 1.11 | % | 538,115 | 1,454 | 1.06 | % | ||||||||||||||||
| Held-to-maturity securities | 191,795 | 716 | 1.49 | % | 2,120 | 9 | 1.66 | % | ||||||||||||||||
| Equity investments - non-trading | 2,322 | 6 | 0.96 | % | 2,316 | 6 | 1.01 | % | ||||||||||||||||
| Overnight deposits | 2,215,042 | 857 | 0.15 | % | 1,738,102 | 666 | 0.15 | % | ||||||||||||||||
| Other interest-earning assets | 11,998 | 151 | 4.98 | % | 11,991 | 153 | 5.06 | % | ||||||||||||||||
| Total interest-earning assets | 6,714,694 | 49,110 | 2.85 | % | 5,859,496 | 45,018 | 2.99 | % | ||||||||||||||||
| Non-interest-earning assets | 105,083 | 95,181 | ||||||||||||||||||||||
| Allowance for loan and lease losses | (38,464 | ) | (38,129 | ) | ||||||||||||||||||||
| Total assets | $ | 6,781,313 | $ | 5,916,548 | ||||||||||||||||||||
| Liabilities and Stockholders' Equity: | ||||||||||||||||||||||||
| Interest-bearing liabilities: | ||||||||||||||||||||||||
| Money market, savings and other interest-bearing accounts | $ | 2,691,693 | $ | 3,614 | 0.53 | % | $ | 2,501,757 | $ | 3,524 | 0.56 | % | ||||||||||||
| Certificates of deposit | 80,197 | 176 | 0.87 | % | 82,628 | 192 | 0.92 | % | ||||||||||||||||
| Total interest-bearing deposits | 2,771,890 | 3,790 | 0.54 | % | 2,584,385 | 3,716 | 0.57 | % | ||||||||||||||||
| Borrowed funds | 45,324 | 510 | 4.49 | % | 45,309 | 510 | 4.40 | % | ||||||||||||||||
| Total interest-bearing liabilities | 2,817,214 | 4,300 | 0.61 | % | 2,629,694 | 4,226 | 0.64 | % | ||||||||||||||||
| Non-interest-bearing liabilities: | ||||||||||||||||||||||||
| Non-interest-bearing deposits | 3,337,477 | 2,814,335 | ||||||||||||||||||||||
| Other non-interest-bearing liabilities | 74,496 | 77,732 | ||||||||||||||||||||||
| Total liabilities | 6,229,187 | 5,521,761 | ||||||||||||||||||||||
| Stockholders' equity | 552,126 | 394,787 | ||||||||||||||||||||||
| Total liabilities and equity | $ | 6,781,313 | $ | 5,916,548 | ||||||||||||||||||||
| Net interest income | $ | 44,810 | $ | 40,792 | ||||||||||||||||||||
| Net interest rate spread (2) | 2.24 | % | 2.35 | % | ||||||||||||||||||||
| Net interest-earning assets | $ | 3,897,480 | $ | 3,229,802 | ||||||||||||||||||||
| Net interest margin (3) | 2.59 | % | 2.70 | % | ||||||||||||||||||||
| Ratio of interest earning assets to interest bearing liabilities | 2.38 | x | 2.23 | x | ||||||||||||||||||||
| Total cost of funds (4) | 0.28 | % | 0.31 | % | ||||||||||||||||||||
| (1) | Amount includes deferred loan fees and non-performing loans. |
| (2) | Determined by subtracting the annualized average cost of total interest-bearing liabilities from the annualized average yield on total interest-earning assets. |
| (3) | Determined by dividing annualized net interest income by total average interest-earning assets. |
| (4) | Determined by dividing annualized interest expense by the sum of total average interest-bearing liabilities and total average non-interest-bearing deposits. |
11
| Three Months Ended | ||||||||||||||||||||||||
| Dec 31, 2021 | Dec 31, 2020 | |||||||||||||||||||||||
| Average | Average | |||||||||||||||||||||||
| Outstanding | Yield/Rate | Outstanding | Yield/Rate | |||||||||||||||||||||
| (dollars in thousands) | Balance | Interest | (annualized) | Balance | Interest | (annualized) | ||||||||||||||||||
| Assets: | ||||||||||||||||||||||||
| Interest-earning assets: | ||||||||||||||||||||||||
| Loans (1) | $ | 3,694,362 | $ | 45,724 | 4.81 | % | $ | 3,070,850 | $ | 35,843 | 4.62 | % | ||||||||||||
| Available-for-sale securities | 599,175 | 1,656 | 1.11 | % | 230,080 | 573 | 0.97 | % | ||||||||||||||||
| Held-to-maturity securities | 191,795 | 716 | 1.49 | % | 2,906 | 12 | 1.65 | % | ||||||||||||||||
| Equity investments - non-trading | 2,322 | 6 | 0.96 | % | 2,294 | 9 | 1.46 | % | ||||||||||||||||
| Overnight deposits | 2,215,042 | 857 | 0.15 | % | 806,602 | 280 | 0.14 | % | ||||||||||||||||
| Other interest-earning assets | 11,998 | 151 | 4.98 | % | 11,336 | 145 | 5.09 | % | ||||||||||||||||
| Total interest-earning assets | 6,714,694 | 49,110 | 2.85 | % | 4,124,068 | 36,862 | 3.54 | % | ||||||||||||||||
| Non-interest-earning assets | 105,083 | 63,962 | ||||||||||||||||||||||
| Allowance for loan and lease losses | (38,464 | ) | (34,122 | ) | ||||||||||||||||||||
| Total assets | $ | 6,781,313 | $ | 4,153,908 | ||||||||||||||||||||
| Liabilities and Stockholders' Equity: | ||||||||||||||||||||||||
| Interest-bearing liabilities: | ||||||||||||||||||||||||
| Money market, savings and other interest-bearing accounts | $ | 2,691,693 | $ | 3,614 | 0.53 | % | $ | 1,962,417 | $ | 2,554 | 0.52 | % | ||||||||||||
| Certificates of deposit | 80,197 | 176 | 0.87 | % | 94,546 | 327 | 1.38 | % | ||||||||||||||||
| Total interest-bearing deposits | 2,771,890 | 3,790 | 0.54 | % | 2,056,963 | 2,881 | 0.56 | % | ||||||||||||||||
| Borrowed funds | 45,324 | 510 | 4.49 | % | 45,268 | 514 | 4.44 | % | ||||||||||||||||
| Total interest-bearing liabilities | 2,817,214 | 4,300 | 0.61 | % | 2,102,231 | 3,395 | 0.64 | % | ||||||||||||||||
| Non-interest-bearing liabilities: | ||||||||||||||||||||||||
| Non-interest-bearing deposits | 3,337,477 | 1,636,417 | ||||||||||||||||||||||
| Other non-interest-bearing liabilities | 74,496 | 79,320 | ||||||||||||||||||||||
| Total liabilities | 6,229,187 | 3,817,968 | ||||||||||||||||||||||
| Stockholders' equity | 552,126 | 335,940 | ||||||||||||||||||||||
| Total liabilities and equity | $ | 6,781,313 | $ | 4,153,908 | ||||||||||||||||||||
| Net interest income | $ | 44,810 | $ | 33,467 | ||||||||||||||||||||
| Net interest rate spread (2) | 2.24 | % | 2.90 | % | ||||||||||||||||||||
| Net interest-earning assets | $ | 3,897,480 | $ | 2,021,837 | ||||||||||||||||||||
| Net interest margin (3) | 2.59 | % | 3.21 | % | ||||||||||||||||||||
| Ratio of interest earning assets to interest bearing liabilities | 2.38 | x | 1.96 | x | ||||||||||||||||||||
| Total cost of funds (4) | 0.28 | % | 0.36 | % | ||||||||||||||||||||
| (1) | Amount includes deferred loan fees and non-performing loans. |
| (2) | Determined by subtracting the annualized average cost of total interest-bearing liabilities from the annualized average yield on total interest-earning assets. |
| (3) | Determined by dividing annualized net interest income by total average interest-earning assets. |
| (4) | Determined by dividing annualized interest expense by the sum of total average interest-bearing liabilities and total average non-interest-bearing deposits. |
12
| Year Ended | ||||||||||||||||||||||||
| Dec 31, 2021 | Dec 31, 2020 | |||||||||||||||||||||||
| Average | Average | |||||||||||||||||||||||
| Outstanding | Outstanding | |||||||||||||||||||||||
| (dollars in thousands) | Balance | Interest | Yield/Rate | Balance | Interest | Yield/Rate | ||||||||||||||||||
| Assets: | ||||||||||||||||||||||||
| Interest-earning assets: | ||||||||||||||||||||||||
| Loans (1) | $ | 3,448,468 | $ | 164,528 | 4.77 | % | $ | 2,888,180 | $ | 136,497 | 4.73 | % | ||||||||||||
| Available-for-sale securities | 489,922 | 5,066 | 1.03 | % | 192,472 | 3,108 | 1.59 | % | ||||||||||||||||
| Held-to-maturity securities | 50,110 | 746 | 1.49 | % | 3,282 | 59 | 1.77 | % | ||||||||||||||||
| Equity investments - non-trading | 2,312 | 26 | 1.13 | % | 2,279 | 41 | 1.77 | % | ||||||||||||||||
| Overnight deposits | 1,669,754 | 2,310 | 0.14 | % | 732,130 | 2,546 | 0.35 | % | ||||||||||||||||
| Other interest-earning assets | 11,897 | 608 | 5.11 | % | 16,467 | 846 | 5.14 | % | ||||||||||||||||
| Total interest-earning assets | 5,672,463 | 173,284 | 3.05 | % | 3,834,810 | 143,097 | 3.73 | % | ||||||||||||||||
| Non-interest-earning assets | 89,002 | 59,584 | ||||||||||||||||||||||
| Allowance for loan and lease losses | (37,235 | ) | (31,381 | ) | ||||||||||||||||||||
| Total assets | $ | 5,724,230 | $ | 3,863,013 | ||||||||||||||||||||
| Liabilities and Stockholders' Equity: | ||||||||||||||||||||||||
| Interest-bearing liabilities: | ||||||||||||||||||||||||
| Money market, savings and other interest-bearing accounts | $ | 2,394,616 | $ | 13,392 | 0.56 | % | $ | 1,798,109 | $ | 12,420 | 0.69 | % | ||||||||||||
| Certificates of deposit | 83,313 | 849 | 1.02 | % | 98,483 | 1,824 | 1.85 | % | ||||||||||||||||
| Total interest-bearing deposits | 2,477,929 | 14,241 | 0.57 | % | 1,896,592 | 14,244 | 0.75 | % | ||||||||||||||||
| Borrowed funds | 45,303 | 2,042 | 4.51 | % | 129,460 | 3,932 | 2.99 | % | ||||||||||||||||
| Total interest-bearing liabilities | 2,523,232 | 16,283 | 0.65 | % | 2,026,052 | 18,176 | 0.90 | % | ||||||||||||||||
| Non-interest-bearing liabilities: | ||||||||||||||||||||||||
| Non-interest-bearing deposits | 2,708,547 | 1,443,094 | ||||||||||||||||||||||
| Other non-interest-bearing liabilities | 79,239 | 73,250 | ||||||||||||||||||||||
| Total liabilities | 5,311,018 | 3,542,396 | ||||||||||||||||||||||
| Stockholders' equity | 413,212 | 320,617 | ||||||||||||||||||||||
| Total liabilities and equity | $ | 5,724,230 | $ | 3,863,013 | ||||||||||||||||||||
| Net interest income | $ | 157,001 | $ | 124,921 | ||||||||||||||||||||
| Net interest rate spread (2) | 2.41 | % | 2.83 | % | ||||||||||||||||||||
| Net interest-earning assets | $ | 3,149,231 | $ | 1,808,758 | ||||||||||||||||||||
| Net interest margin (3) | 2.77 | % | 3.26 | % | ||||||||||||||||||||
| Ratio of interest earning assets to interest bearing liabilities | 2.25 | x | 1.89 | x | ||||||||||||||||||||
| Total cost of funds (4) | 0.31 | % | 0.52 | % | ||||||||||||||||||||
| (1) | Amount includes deferred loan fees and non-performing loans. |
| (2) | Determined by subtracting the average cost of total interest-bearing liabilities from the average yield on total interest-earning assets. |
| (3) | Determined by dividing net interest income by total average interest-earning assets. |
| (4) | Determined by dividing interest expense by the sum of total average interest-bearing liabilities and total average non-interest-bearing deposits. |
13
Reconciliation of Non-GAAP Measures
In addition to the results presented in accordance with Generally Accepted Accounting Principles ("GAAP"), this earnings release includes certain non-GAAP financial measures. Management believes these non-GAAP financial measures provide meaningful information to investors in understanding the Company’s operating performance and trends. These non-GAAP measures have inherent limitations and are not required to be uniformly applied and are not audited. They should not be considered in isolation or as a substitute for an analysis of results reported under GAAP. These non-GAAP measures may not be comparable to similarly titled measures reported by other companies. Reconciliations of non-GAAP/adjusted financial measures disclosed in this earnings release to the comparable GAAP measures are provided in the following table:
| Quarterly Data | Annual Data | |||||||||||||||||||||||||||
| (dollars in thousands, except per share data) | Dec 31, 2021 | Sept 30, 2021 | June 30, 2021 | Mar 31, 2021 | Dec 31, 2020 | Dec 31, 2021 | Dec 31, 2020 | |||||||||||||||||||||
| Average assets | $ | 6,781,313 | $ | 5,916,548 | $ | 5,504,686 | $ | 4,669,051 | $ | 4,153,908 | $ | 5,724,230 | $ | 3,863,013 | ||||||||||||||
| Less: average intangible assets | 9,733 | 9,733 | 9,733 | 9,733 | 9,733 | 9,733 | 9,733 | |||||||||||||||||||||
| Average tangible assets | $ | 6,771,580 | $ | 5,906,815 | $ | 5,494,953 | $ | 4,659,318 | $ | 4,144,175 | $ | 5,714,497 | $ | 3,853,280 | ||||||||||||||
| Average equity | $ | 552,126 | $ | 394,787 | $ | 357,097 | $ | 346,785 | $ | 335,940 | $ | 413,212 | $ | 320,617 | ||||||||||||||
| Less: Average preferred equity | 1,834 | 5,502 | 5,502 | 5,502 | 5,502 | 4,585 | 5,502 | |||||||||||||||||||||
| Average common equity | $ | 550,292 | $ | 389,285 | $ | 351,595 | $ | 341,283 | $ | 330,438 | $ | 408,627 | $ | 315,115 | ||||||||||||||
| Less: average intangible assets | 9,733 | 9,733 | 9,733 | 9,733 | 9,733 | 9,733 | 9,733 | |||||||||||||||||||||
| Average tangible common equity | $ | 540,559 | $ | 379,552 | $ | 341,862 | $ | 331,550 | $ | 320,705 | $ | 398,894 | $ | 305,382 | ||||||||||||||
| Return on average tangible common equity (1), (2) | 13.86 | % | 16.95 | % | 15.65 | % | 14.82 | % | 14.61 | % | 15.18 | % | 12.92 | % | ||||||||||||||
| Total assets | $ | 7,116,358 | $ | 6,141,254 | $ | 5,787,193 | $ | 4,922,801 | $ | 4,330,821 | $ | 7,116,358 | $ | 4,330,821 | ||||||||||||||
| Less: intangible assets | 9,733 | 9,733 | 9,733 | 9,733 | 9,733 | 9,733 | 9,733 | |||||||||||||||||||||
| Tangible assets | $ | 7,106,625 | $ | 6,131,521 | $ | 5,777,460 | $ | 4,913,068 | $ | 4,321,088 | $ | 7,106,625 | $ | 4,321,088 | ||||||||||||||
| Total equity | $ | 556,989 | $ | 542,654 | $ | 363,595 | $ | 348,217 | $ | 340,787 | $ | 556,989 | $ | 340,787 | ||||||||||||||
| Less: preferred equity | — | 5,502 | 5,502 | 5,502 | 5,502 | — | 5,502 | |||||||||||||||||||||
| Common equity | $ | 556,989 | $ | 537,152 | $ | 358,093 | $ | 342,715 | $ | 335,285 | $ | 556,989 | $ | 335,285 | ||||||||||||||
| Less: intangible assets | 9,733 | 9,733 | 9,733 | 9,733 | 9,733 | 9,733 | 9,733 | |||||||||||||||||||||
| Tangible common equity (book value) | $ | 547,256 | $ | 527,419 | $ | 348,360 | $ | 332,982 | $ | 325,552 | $ | 547,256 | $ | 325,552 | ||||||||||||||
| Common shares outstanding | 10,925,029 | 10,644,193 | 8,344,193 | 8,345,032 | 8,295,272 | 10,925,029 | 8,295,272 | |||||||||||||||||||||
| Book value per share (GAAP) | $ | 50.98 | $ | 50.46 | $ | 42.92 | $ | 41.07 | $ | 40.42 | $ | 50.98 | $ | 40.42 | ||||||||||||||
| Tangible book value per share (non-GAAP) (3) | $ | 50.09 | $ | 49.55 | $ | 41.75 | $ | 39.90 | $ | 39.25 | $ | 50.09 | $ | 39.25 | ||||||||||||||
| Total revenue (GAAP) (4) | $ | 51,867 | $ | 46,683 | $ | 43,129 | $ | 39,017 | $ | 33,467 | $ | 180,698 | $ | 141,924 | ||||||||||||||
| Gain on sale of securities | $ | — | $ | — | $ | 609 | $ | — | $ | — | $ | 609 | $ | 3,286 | ||||||||||||||
| Revenue excluding gain on sale of | ||||||||||||||||||||||||||||
| securities (non-GAAP) | $ | 51,867 | $ | 46,683 | $ | 42,520 | $ | 39,017 | $ | 33,467 | $ | 180,089 | $ | 138,638 | ||||||||||||||
(1) For periods less than a year, ratios are annualized.
(2) Net income divided by average tangible common equity.
(3) Tangible book value divided by common shares outstanding at period-end.
(4) Total revenue equals net interest income plus non-interest income.
14
Reconciliation of Non-GAAP Measures, continued
| Quarterly Data | Annual Data | |||||||||||||||||||||||||||
| (dollars in thousands) | Dec 31, 2021 | Sept 30, 2021 | June 30, 2021 | Mar 31, 2021 | Dec 31, 2020 | Dec 31, 2021 | Dec 31, 2020 | |||||||||||||||||||||
| Total non-interest expense (GAAP) | $ | 23,314 | $ | 21,984 | $ | 21,689 | $ | 20,323 | $ | 17,788 | 87,312 | $ | 74,518 | |||||||||||||||
| Total Revenue (GAAP) | $ | 51,867 | $ | 46,683 | $ | 43,129 | $ | 39,017 | $ | 36,840 | 180,698 | $ | 141,924 | |||||||||||||||
| Efficiency ratio (non-GAAP) | 44.9 | % | 47.1 | % | 50.3 | % | 52.1 | % | 48.3 | % | 48.3 | % | 52.5 | % | ||||||||||||||
Explanatory Note
Some amounts presented within this document may not recalculate due to rounding.
15