UNITED STATES
SECURITIES AND EXCHANGE COMMISSION
Washington, D.C. 20549
FORM 10-K
(Mark One)
x | ANNUAL REPORT PURSUANT TO SECTION 13 OR 15(d) OF THE SECURITIES | |
EXCHANGE ACT OF 1934 | ||
For the fiscal year ended December 31, 2015
OR | ||
o | TRANSITION REPORT PURSUANT TO SECTION 13 OR 15(d) OF THE SECURITIES | |
EXCHANGE ACT OF 1934 | ||
For the transition period from _________ to __________
Commission file number: 001-36416

NEW YORK REIT, INC.
(Exact name of registrant as specified in its charter)
Maryland | 27-1065431 | |
(State or other jurisdiction of incorporation or organization) | (I.R.S. Employer Identification No.) | |
405 Park Ave., 14th Floor, New York, NY | 10022 | |
(Address of principal executive offices) | (Zip Code) | |
(212) 415-6500 |
(Registrant's telephone number, including area code) |
Securities registered pursuant to section 12(b) of the Act: None |
Securities registered pursuant to section 12 (g) of the Act: Common stock, $0.01 par value per share (Title of class) |
Indicate by check mark if the registrant is a well-known seasoned issuer, as defined in Rule 405 of the Securities Act. Yes o No x
Indicate by check mark if the registrant is not required to file reports pursuant to Section 13 or Section 15(d) of the Act. Yes o No x
Indicate by check mark whether the registrant (1) has filed all reports required to be filed by Section 13 or 15(d) of the Securities Exchange Act of 1934 during the preceding 12 months (or for such shorter period that the registrant was required to file such reports), and (2) has been subject to such filing requirements for the past 90 days. x Yes ¨ No
Indicate by check mark whether the registrant submitted electronically and posted on its corporate Web Site, if any, every Interactive Data File required to be submitted and posted pursuant to Rule 405 of Regulation S-T during the preceding 12 months (or for such shorter period that the registrant was required to submit and post such files). x Yes ¨ No
Indicate by check mark if disclosure of delinquent filers pursuant to Item 405 of Regulation S-K is not contained herein, and will not be contained, to the best of registrant's knowledge, in definitive proxy or information statements incorporated by reference in Part III of this Form 10-K or any amendment to this Form 10-K. ¨
Indicate by check mark whether the registrant is a large accelerated filer, an accelerated filer, a non-accelerated filer, or a smaller reporting company. See definition of "large accelerated filer," "accelerated filer," and "smaller reporting company" in Rule 12b-2 of the Exchange Act.
Large accelerated filer x | Accelerated filer o |
Non-accelerated filer o (Do not check if a smaller reporting company) | Smaller reporting company o |
Indicate by check mark whether the registrant is a shell company (as defined in Rule 12b-2 of the Exchange Act). ¨ Yes x No
The aggregate market value of the shares of common stock held by non-affiliates of the registrant was $1.6 billion based on the closing sale price on the New York Stock Exchange for such stock as of June 30, 2015, the last business day of the registrant's most recently completed second fiscal quarter.
As of February 12, 2016, the registrant had 165,045,217 shares of common stock, $0.01 par value per share, outstanding.
DOCUMENTS INCORPORATED BY REFERENCE: None
NEW YORK REIT, INC.
FORM 10-K
Year Ended December 31, 2015
Page | ||
i
Forward-Looking Statements
Certain statements included in this Annual Report on Form 10-K are forward-looking statements. Those statements include statements regarding the intent, belief or current expectations of New York REIT, Inc. (the "Company," "we" "our" or "us") and members of our management team, as well as the assumptions on which such statements are based, and generally are identified by the use of words such as "may," "will," "seeks," "anticipates," "believes," "estimates," "expects," "plans," "intends," "should" or similar expressions. Actual results may differ materially from those contemplated by such forward-looking statements. Further, forward-looking statements speak only as of the date they are made, and we undertake no obligation to update or revise forward-looking statements to reflect changed assumptions, the occurrence of unanticipated events or changes to future operating results over time, unless required by law.
The following are some of the risks and uncertainties, although not all risks and uncertainties, that could cause our actual results to differ materially from those presented in our forward-looking statements:
• | Our board continues to explore and evaluate strategic alternatives to enhance stockholder value and there can be no assurance regarding the form or substance of any potential transaction or transactions that may be identified or consummated as a result of this process or how long the process may take; |
• | All of our executive officers are also officers, managers or holders of a direct or indirect interest in New York Recovery Advisors, LLC (our "Advisor") and other entities affiliated with AR Global Investments, LLC (the successor business to AR Capital, LLC, "AR Global"); as a result, our executive officers, our Advisor and its affiliates face conflicts of interest, including significant conflicts created by our Advisor’s compensation arrangements with us and other investor entities advised by AR Global affiliates, and conflicts in allocating time among these entities and us, which could negatively impact our operating results; |
• | We depend on tenants for revenue, and, accordingly, our revenue is dependent upon the success and economic viability of our tenants; |
• | We may not be able to achieve our rental rate objectives on new and renewal leases and our expenses could be greater, which may impact our results of operations; |
• | Our properties may be adversely affected by economic cycles and risks inherent to the New York metropolitan statistical area (“MSA”), especially New York City; |
• | We may be unable to pay or maintain cash dividends or increase dividends over time. Amounts paid to our stockholders may be a return of capital and not a return on a stockholder's investment; |
• | We are obligated to pay fees, which may be substantial, to our Advisor and its affiliates, including fees payable upon the sale of properties; |
• | We may fail to continue to qualify to be treated as a real estate investment trust for U.S. federal income tax purposes (“REIT”); |
• | Because investment opportunities that are suitable for us may also be suitable for other AR Global-advised programs or investors, our Advisor and its affiliates may face conflicts of interest relating to the purchase of properties and other investments and such conflicts may not be resolved in our favor, meaning that we could invest in less attractive assets, which could reduce the investment return to our stockholders; |
• | We are party to an investment opportunity allocation agreement (the "Allocation Agreement") with another program that is sponsored by American Realty Capital III, LLC (our "Sponsor"), pursuant to which we may not have the first opportunity to acquire all properties identified by our Advisor and its affiliates; and |
• | We may be adversely affected by changes in general economic, business and political conditions, including the possibility of intensified international hostilities, acts of terrorism, and changes in conditions of United States or international lending, capital and financing markets. |
All forward-looking statements should be read with the risks noted in Part I, Item 1A of this Annual Report on Form 10-K.
ii
PART I
Item 1. Business.
Organization
We are a New York City focused REIT that seeks to provide stockholders with an opportunity to participate in one of the world's most dynamic real estate markets by primarily owning income-producing commercial real estate in New York City. We were incorporated on October 6, 2009 as a Maryland corporation that qualified as a REIT beginning with the taxable year ended December 31, 2010.
We focus on acquiring and owning office and retail properties in Manhattan, the largest and most liquid real estate market in the United States. We purchased our first property and commenced active operations in June 2010. As of December 31, 2015, we owned 22 properties located in New York City. As of December 31, 2015, our properties aggregated 3.4 million rentable square feet, had an occupancy of 95.2% and a weighted-average remaining lease term of 9.6 years. Our portfolio primarily consisted of office and retail properties, representing 82% and 10%, respectively, of rentable square feet as of December 31, 2015. We have acquired multifamily, industrial, hotel and other types of real properties to add diversity to our portfolio. Properties other than office and retail spaces represented 8% of rentable square feet. Additionally, we have in the past acquired preferred equity positions in entities owning New York City real estate and may in the future also originate or acquire first mortgage loans or mezzanine loans secured by or related to New York City real estate.
Substantially all of our business is conducted through New York Recovery Operating Partnership, L.P., a Delaware limited partnership (the "OP"). We have no direct employees. Our Advisor manages our affairs on a day-to-day basis. New York Recovery Properties, LLC (our "Property Manager") manages our properties, unless services are performed by a third party for specific properties. The Advisor and Property Manager are under common control with AR Global, the parent of our Sponsor, as a result of which they are related parties and have received or will continue to receive compensation, fees and expense reimbursements for services related to the investment and management of our assets.
Realty Capital Securities, LLC (our "Former Dealer Manager") served as the dealer manager of our initial public offering, which was ongoing from September 2010 to December 2013 (our "IPO") and, together with its affiliates, continued to provide us with various services through December 31, 2015. RCS Capital Corporation, the parent company of the Former Dealer Manager and certain of its affiliates that provided services to us, filed for Chapter 11 bankruptcy protection in January 2016, prior to which it was also under common control with AR Global, the parent of our Sponsor.
Strategic Alternatives
As previously disclosed, on October 1, 2015, we announced that we have retained the Eastdil Secured division of Wells Fargo Securities as strategic advisor to identify and evaluate potential strategic transactions at the entity or asset level. Our board continues to explore and evaluate strategic alternatives to enhance stockholder value.
Initiatives to Increase Liquidity and Create Long-Term Value for our Stockholders
During the second quarter of 2015, we announced several initiatives designed to increase our liquidity and create long-term value for our stockholders. These initiatives include 1) increasing Cash NOI by leasing currently vacant space, stabilizing revenue at the Viceroy Hotel and releasing currently below-market expiring space at market rates; 2) considering joint venture partners in our top five assets to unlock excess value; 3) exploring the sale of five non-core assets in the Brooklyn and Queens boroughs of New York City; and 4) realizing internal growth opportunities by repositioning office and basement space to retail space at 1440 Broadway as well as converting the lobby to rentable retail space.
During the fourth quarter of 2015, we signed five new leases for our pro rata share of 125,727 rentable square feet which, on a weighted-average basis, increased initial cash rents by 23% over prior escalated rents. We continue to market our vacant spaces at 256 W. 38th Street, 229 W. 36th Street, 350 Bleecker Street and 1440 Broadway.
During the fourth quarter of 2015, we sold one of our five non-core assets, 163 Washington Avenue in Brooklyn, New York for $37.7 million. We also entered into agreements of purchase and sale on our Duane Reade property in Queens, New York ("Duane Reade"), our property located at 1623 Kings Highway in Brooklyn, New York ("1623 Kings Highway") and our Foot Locker property in Brooklyn, New York ("Foot Locker"). The sales of Duane Reade and 1623 Kings Highway closed in February 2016 for contract sales prices of $12.6 million and $17.0 million, respectively, exclusive of closing costs. At closing, we repaid the mortgage notes payable securing Duane Reade and 1623 Kings Highway of $8.4 million and $7.3 million, respectively.
We repaid $150.0 million in advances on the revolving portion of our unsecured credit facility (the “Credit Facility”) with Capital One, National Association ("Capital One") during the year ended December 31, 2015. As of December 31, 2015, the outstanding balance of the term loan and revolving components of our Credit Facility was $305.0 million and $180.0 million, respectively, with a combined weighted average interest rate of 2.4%.
1
During the third quarter of 2015, we obtained a mortgage note payable of up to $325.0 million, secured by our property located at 1440 Broadway. As of December 31, 2015, the mortgage note payable outstanding was $305.0 million, and up to $20.0 million is available in the future as additional advances, subject to customary funding conditions to pay, among other things, for certain tenant allowances, capital expenditures and leasing costs that have been approved by the lender.
Investment Objectives
Our investment objectives include capital preservation, income generation and asset appreciation. We achieve our objectives through:
• | Focus on New York City — Acquisition of high-quality commercial real estate in New York City, and, in particular, properties located in Manhattan; |
• | Focus on Income Producing Properties — Acquisition of income producing commercial real estate with an emphasis on office and retail properties with 80% or greater occupancy at the time of purchase; |
• | Maintain Low Leverage - Stabilize at a leverage level of not more than 40% to 50% loan-to-enterprise value; |
• | Pay Monthly Dividends - Pay monthly dividends; and |
• | Maximize Total Returns - Maximize total returns to our stockholders through a combination of appreciation and current income. |
Acquisitions and Investment Policies
Investing in Real Property
To date, we have acquired a portfolio of properties located in New York City that we believe provides us with a solid foundation. All of our properties were acquired during the 2010-2014 time period so we have no legacy assets relating back to acquisitions that suffered from the recession.
The following table presents information about the property type and geographic diversity of the properties we owned as of December 31, 2015. The amounts shown in the table below include our proportionate share of our investment in a 48.9% equity interest in WWP Holdings, LLC, an unconsolidated joint venture, which we refer to herein as "Worldwide Plaza."
As of December 31, 2015 | Total | Manhattan | Brooklyn | Queens | |||||||||
Total square feet by property type: | |||||||||||||
Office | 2,779,259 | 2,749,768 | 29,491 | — | |||||||||
Retail (1) | 328,101 | 260,429 | 57,905 | 9,767 | |||||||||
Hotel | 128,612 | 128,612 | — | — | |||||||||
Parking (2) | 120,589 | 120,589 | — | — | |||||||||
Storage | 17,677 | 17,677 | — | — | |||||||||
Total owned square feet (end of period) (2) | 3,374,238 | 3,277,075 | 87,396 | 9,767 | |||||||||
Total | Manhattan | Brooklyn | Queens | ||||||||||
% of total square feet by property type: | |||||||||||||
Office | 82 | % | 84 | % | 34 | % | — | % | |||||
Retail (1) | 10 | % | 8 | % | 66 | % | 100 | % | |||||
Hotel | 4 | % | 4 | % | — | % | — | % | |||||
Parking (2) | 3 | % | 3 | % | — | % | — | % | |||||
Storage | 1 | % | 1 | % | — | % | — | % | |||||
Total owned square feet (end of period) (2) | 100 | % | 97.1 | % | 2.6 | % | 0.3 | % | |||||
________________________________
(1) | Includes 105,514 square feet of stand-alone retail and 222,587 square feet of retail associated with our office portfolio. |
(2) | Excludes 15,055 square foot parking garage at 416 Washington Street, which is being operated under a management agreement with a third party. |
2
The following table lists the tenants whose annualized cash rent represented greater than 10% of our total annualized cash rent for all portfolio properties as of December 31, 2015, 2014 and 2013, respectively:
December 31, | ||||||||
Property Portfolio | Tenant | 2015 | 2014 | 2013 | ||||
Worldwide Plaza(1) | Cravath, Swaine & Moore, LLP | 16% | 16% | 18% | ||||
Worldwide Plaza(1) | Nomura Holdings America, Inc. | 11% | 11% | 12% | ||||
________________________
(1) | Annualized cash rent reflects our 48.9% pro rata share of Worldwide Plaza |
The termination, delinquency or non-renewal of any of the above tenants would have a material adverse effect on our revenues. No other tenant represents more than 10% of our annualized cash rent for the periods presented.
Joint Ventures
We may acquire or enter into joint ventures from time to time, if we determine that doing so would be the most cost-effective and efficient means of raising and investing capital. Equity investments may be subject to existing mortgage financing and other indebtedness or such financing or indebtedness may be incurred in connection with acquiring investments. Any such financing or indebtedness will have priority over our equity interest in such property, such as secured mortgage notes payable encumbering Worldwide Plaza.
Investing in Equity Securities
We may make equity investments in other REITs and other real estate companies that operate assets meeting our investment objectives. We may purchase the common or preferred stock of these entities or options to acquire their stock. We may target a public company that owns commercial real estate or real estate-related assets when we believe its stock is trading at a discount to that company’s net asset value. We may eventually seek to acquire or gain a controlling interest in the companies that we target.
Financing Strategies / Offerings
We may use debt financing to fund property improvements, tenant improvements, leasing commissions and other working capital needs. The form of our indebtedness varies in terms of duration (long or short term), secured or unsecured, or fixed or variable rate. We will not enter into interest rate swaps or caps, or similar hedging transactions or derivative arrangements, for speculative purposes. We have entered into interest rate swaps and caps in the past and may continue to do so in the future in order to manage or mitigate our interest rate risks on variable rate debt.
We seek to maintain a strong balance sheet with conservative leverage. We intend to stabilize our leverage at 50% or less of combined enterprise value (which we define as debt outstanding, including our portion of debt from our investment in Worldwide Plaza of $1.3 billion, plus fully diluted shares outstanding multiplied by our share price, which equaled $3.2 billion as of December 31, 2015). As of December 31, 2015, our combined debt to enterprise value was 40.3% and our combined debt had a weighted average interest rate equal to 3.5% per annum.
Tax Status
We elected and qualified to be taxed as a REIT under Sections 856 through 860 of the Internal Revenue Code of 1986, as amended (the "Code"), effective for our taxable year ended December 31, 2010. We believe that, commencing with such taxable year, we have been organized and operated in a manner so that we qualify for taxation as a REIT under the Code. We intend to continue to operate in such a manner, but no assurance can be given that we will operate in a manner so as to remain qualified for taxation as a REIT. In order to continue to qualify for taxation as a REIT we must, among other things, distribute annually at least 90% of our REIT taxable income (which does not equal net income as calculated in accordance with generally accepted accounting principles ("GAAP")) determined without regard for the deduction for dividends paid and excluding net capital gains, and must comply with a number of other organizational and operational requirements. If we continue to qualify for taxation as a REIT, we generally will not be subject to federal corporate income tax on that portion of our REIT taxable income that we distribute to our stockholders. Even if we qualify for taxation as a REIT, we may be subject to certain state and local taxes on our income and properties as well as federal income and excise taxes on our undistributed income.
Competition
The New York City real estate market is highly competitive. With respect to the assets that we own, we compete for tenants based on a number of factors that include location, rental rates, security, suitability of the property's design to prospective tenants' needs and the manner in which the property is operated and marketed. The number of competing properties in the New York City market could have a material effect on our occupancy levels, rental rates and on property operating expenses.
3
To the extent we engage in additional acquisition activities, we compete with many other entities including other REITs, specialty finance companies, savings and loan associations, banks, mortgage bankers, insurance companies, mutual funds, institutional investors, investment banking firms and lenders. We also may compete with other entities advised or sponsored by affiliates of our Sponsor for properties or tenants. Many of these competitors have substantially greater marketing budgets and financial resources than we do.
Competition from these and other third party real estate investors may limit the number of suitable investment opportunities available. It also may result in higher prices, lower yields and a narrower spread of yields over our borrowing costs, making it more difficult for us to acquire new investments on attractive terms. In addition, the number of competing properties in the New York MSA could have a material effect on our occupancy levels, rental rates and on the operating expenses of certain of our properties.
Regulations
Our investments are subject to various federal, state and local laws, ordinances and regulations, including, among other things, zoning regulations, land use controls, environmental controls relating to air and water quality, noise pollution and indirect environmental impacts such as increased motor vehicle activity. We believe that we have all permits and approvals necessary under current law to operate our investments.
Environmental
As an owner of real estate, we are subject to various environmental laws of federal, state and local governments. Compliance with existing laws has not had a material adverse effect on our financial condition or results of operations, and management does not believe it will have such an impact in the future. However, we cannot predict the impact of unforeseen environmental contingencies or new or changed laws or regulations on properties in which we hold an interest, or on properties that may be acquired directly or indirectly in the future. We hire third parties to conduct Phase I environmental reviews of the real property that we intend to purchase.
Employees
We have no direct employees. The employees of our Advisor and its affiliates perform a full range of real estate services for us, including acquisitions, property management, accounting, legal, asset management, transfer agent and investor relations services.
We are dependent on these affiliates for services that are essential to us, including capital markets activities, asset acquisition decisions, property management and other general administrative responsibilities. In the event that any of these companies were unable to provide these services to us, we would be required to provide such services ourselves or obtain such services from other sources.
Financial Information About Industry Segments
Our current business consists of owning, managing, operating, leasing, acquiring, investing in and disposing of real estate assets. All of our consolidated revenues are from our consolidated real estate properties. We internally evaluate operating performance on an individual property level and view all of our real estate assets as one industry segment; accordingly, all of our properties are aggregated into one reportable segment. See our consolidated financial statements beginning on page F-1 for our revenues from tenants, net income or loss, total assets and other financial information.
Available Information
We electronically file Annual Reports on Form 10-K, Quarterly Reports on Form 10-Q, Current Reports on Form 8-K, proxy statements and all amendments to those filings with the SEC. You may read and copy any materials we file with the SEC at the SEC's Public Reference Room at 100 F Street, NE, Washington, D.C. 20549, or you may obtain information by calling the SEC at 1-800-SEC-0330. The SEC maintains an internet address at http://www.sec.gov that contains reports, proxy statements and information statements, and other information, which you may obtain free of charge. In addition, copies of our filings with the SEC may be obtained from our website at www.nyrt.com. Access to these filings is free of charge. We are not incorporating our website or any information from the website into this Annual Report on Form 10-K.
Item 1A. Risk Factors.
Set forth below are the risk factors that we believe are material to our investors. The occurrence of any of the risks discussed in this Annual Report on Form 10-K could have a material adverse effect on our business, financial condition, results of operations and ability to pay dividends.
4
Risks Related to Our Properties and Operations
The outcome of exploring strategic alternatives is uncertain and exposes us to certain risks.
As previously disclosed, on October 1, 2015, we announced that we have retained the Eastdil Secured division of Wells Fargo Securities as strategic advisor to identify and evaluate potential strategic transactions at the entity or asset level. Our board continues to explore and evaluate strategic alternatives to enhance stockholder value. There can be no assurance regarding the form or substance of any potential transaction or transactions that may be identified or consummated as a result of this process or how long the process may take. Our ability to identify and consummate a potential transaction or transactions is dependent upon a number of factors that may be beyond our control, including, among other factors, market conditions, industry trends and the interest of third parties in our company as a whole or our assets individually. In addition, any potential transaction or transactions may be subject to conditions including, if we pursue a sale of all or substantially all of our assets or a merger or business combination with a third party, stockholder approval. There can be no assurance we would be able to obtain the necessary approval.
Further, the process of exploring strategic alternatives is time-consuming, requires our management to divert their focus from our day-to-day business, and results in us incurring expenses outside the normal course of operations, including expenses for our financial and legal advisors.
All of our properties are located in the New York MSA, making us dependent upon the economic climate in New York City than if our investments were geographically diversified and subjecting us to significant competitive pressure.
All of the real estate assets we own are located in the New York MSA. We are subject to risks generally inherent in concentrating investments in a certain geography. These risks resulting from a lack of diversification may become even greater in the event of a downturn in the commercial real estate industry and could significantly adversely affect the value of our properties. A downturn in New York City’s economy, in a submarket within New York City or in the overall national economy could, for example, result in reduced demand for office or lodging space. Likewise, declines in the financial services or media sectors may have a disproportionate adverse effect on the New York City real estate market. These adverse effects could be more pronounced than if we diversified our investments outside of New York City.
Moreover, the New York City real estate market is highly competitive. With respect to the assets that we own, we compete for tenants based on a number of factors that include location, rental rates, security, suitability of the property’s design to prospective tenants’ needs and the manner in which the property is operated and marketed. The number of competing properties in the New York City market could have a material effect on our occupancy levels, rental rates and on property operating expenses. To the extent we engage in additional acquisition activities, we compete with many other entities including other REITs, specialty finance companies, savings and loan associations, banks, mortgage bankers, insurance companies, mutual funds, institutional investors, investment banking firms and lenders. We also may compete with other entities advised or sponsored by affiliates of our Sponsor for properties or tenants. Many of these competitors have substantially greater marketing budgets and financial resources than we do.
Competition from these and other third party real estate investors may limit the number of suitable investment opportunities available. It also may result in higher prices, lower yields and a narrower spread of yields over our borrowing costs, making it more difficult for us to acquire new investments on attractive terms. In addition, the number of competing properties in the New York MSA could have a material effect on our occupancy levels, rental rates and on the operating expenses of certain of our properties.
Our ability to meet capital needs we may have in the future depends on our ability to raise additional capital.
To qualify as a REIT, we must distribute to our stockholders, on an annual basis, at least 90% of our REIT taxable income, determined without regard for the deduction for dividends paid and excluding net capital gains. Thus, our ability to fund any capital needs we may have in the future from cash flows from operations will be limited. Consequently, we may need to rely on third-party sources to fund any capital needs in the future, and to fund the exercise of our option to purchase the balance of the equity interest in Worldwide Plaza. Failure to exercise this option will subject us to a fee equal to $25.0 million. The loan securing Worldwide Plaza includes provisions which could restrict our exercise of the option unless we prepay the loan or meet certain tests, including net worth tests, in order to assume the existing loan securing Worldwide Plaza. While we currently believe we meet such tests, there can be no assurance that we will meet them at the time that we desire to exercise the option, and the cost to prepay the loan securing Worldwide Plaza is likely to be significant.
Our access to third-party sources of capital depends, in part, on:
• | general market conditions; |
• | the market’s perception of our growth potential; |
• | our ability to access the capital markets quickly, which may be limited due to our ineligibility to use our currently effective shelf registration statement on Form S-3 through April 2016; |
5
• | our current debt levels; |
• | our current and expected future earnings; |
• | our cash flow and cash dividends; and |
• | the market price per share of our common stock. |
We may be unable to renew leases or re-lease space as leases expire and achieve our rental rate objectives on new and renewal leases.
We may be unable to renew expiring leases on terms and conditions that are as, or more, favorable as the terms and conditions of the expiring leases. In addition, vacancies may occur at one or more of our properties due to a default by a tenant on its lease or expiration of a lease. Vacancies may reduce the value of a property as a result of reduced cash flow generated by the property.
Tenant credit concentrations make us more susceptible to adverse events with respect to those tenants.
As of December 31, 2015, the following tenants represented 5% or more of our total annualized cash rents:
Tenant | Percentage of Annualized Cash Rent | |
Cravath, Swaine & Moore, LLP | 16.0% | |
Nomura Holding America Inc. | 10.6% | |
Twitter, Inc. | 8.1% | |
Macy's, Inc. | 6.1% | |
The financial failure of any or all of these tenants is likely to have a material adverse effect on our results of operations and our financial condition. In addition, the value of our properties are driven in part by the credit quality of the underlying tenants, and an adverse change in the tenants' financial conditions or a decline in the credit rating of such tenants may result in a decline in the value of our properties.
If a tenant declares bankruptcy, we may be unable to collect balances due under relevant leases.
Any of our tenants, or any guarantor of a tenant's lease obligations, could be subject to a bankruptcy proceeding pursuant to Title 11 of the bankruptcy laws of the United States. A bankruptcy filing by one of our tenants or any guarantor of a tenant's lease obligations would bar all efforts by us to collect pre-bankruptcy debts from these entities or their properties, unless we receive an enabling order from the bankruptcy court. There is no assurance the tenant or its trustee would agree to assume the lease. If a lease is rejected by a tenant in bankruptcy, we would have a general unsecured claim for damages and it is unlikely we would receive any payments from the tenant.
A tenant or lease guarantor bankruptcy could delay efforts to collect past due balances under the relevant leases, and could ultimately preclude full collection of these sums. A tenant or lease guarantor bankruptcy could cause a decrease or cessation of rental payments, which could adversely affect our financial condition and ability to pay dividends.
Our properties may be subject to impairment charges.
We periodically evaluate our real estate investments for impairment indicators. The judgment regarding the existence of impairment indicators is based on factors such as market conditions, tenant performance and legal structure. For example, the early termination of, or default under, a lease by a major tenant may lead to an impairment charge. If we determine that an impairment has occurred, we would be required to make a downward adjustment to the net carrying value of the property. Impairment charges also indicate a potential permanent adverse change in the fundamental operating characteristics of the impaired property. There is no assurance that these adverse changes will be reversed in the future and the decline in the impaired property’s value could be permanent.
6
Our real estate investments are relatively illiquid and subject to some restrictions on sale, and therefore we may not be able to dispose of properties at the time of our choosing or on favorable terms.
Investments in real properties are relatively illiquid. We may not be able to quickly alter our portfolio or generate capital by selling properties. The real estate market is affected by many factors, such as general economic conditions, availability of financing, interest rates and other factors, including supply and demand, that are beyond our control. If we need or desire to sell a real estate investment or real estate investments, we cannot predict whether we will be able to do so at a price or on the terms and conditions acceptable to us. We cannot predict the length of time needed to find a willing purchaser and to close the sale of a property or other real estate investment. In some circumstances, sales of a real estate investment or real estate investments may result in losses. Further, we may be required to invest capital to correct defects or to make improvements before a property can be sold. We cannot assure you that we will have funds available to correct these defects or to make these improvements. Upon sales of properties or assets, we may become subject to contractual indemnity obligations and incur material liabilities and expenses, including tax liabilities, change of control costs, prepayment penalties, required debt repayments, transfer taxes and other transaction costs. See "—Risks Associated with Debt Financing and Investments — Covenants in the instruments governing our existing indebtedness could limit our operational flexibility or result in covenant breaches” and “—Risks Associated with Debt Financing and Investments — Our available capacity under our Credit Facility depends on our borrowing base properties."
Moreover, applicable provisions of the Code impose restrictions on the ability of a REIT to dispose of properties that are not applicable to other types of real estate companies. Thus, we may be unable to realize our investment objectives by selling or otherwise disposing of or refinancing a property at attractive prices within any given period of time or may otherwise be unable to complete any exit strategy.
We would need to raise additional capital to make acquisitions.
While we are not currently pursuing acquisitions of assets while we consider strategic alternatives, we have limited capital available to acquire properties. To the extent we do acquire properties, our acquisition activities may be exposed to, and their success may be adversely affected by, the following risks:
• | we may acquire properties that are not accretive and we may not successfully manage and lease those properties to meet our expectations; |
• | we may be unable to generate sufficient cash from operations, or obtain the necessary debt or equity financing to consummate an acquisition or, if obtainable, financing may not be on satisfactory terms; |
• | we may need to spend more than budgeted amounts to make necessary improvements or renovations to acquired properties; |
• | agreements for the acquisition of properties are typically subject to customary conditions to closing, including satisfactory completion of due diligence investigations, and we may spend significant time and money on potential acquisitions that we do not consummate; |
• | the process of acquiring or pursuing the acquisition of a new property may divert the attention of our management team from our existing business operations; |
• | we may be unable to quickly and efficiently integrate new acquisitions, particularly acquisitions of portfolios of properties, into our existing operations; |
• | market conditions may result in future vacancies and lower-than expected rental rates; and |
• | we may acquire properties without recourse, or with only limited recourse, for liabilities, whether known or unknown, such as cleanup of environmental contamination, claims by tenants, vendors or other persons against the former owners of the properties and claims for indemnification by general partners, directors, officers and others indemnified by the former owners of the properties. |
We rely on our Advisor to acquire properties on our behalf. Because the management personnel of our Advisor may also be engaged in the process of acquiring properties for other entities formed and managed by affiliates of our Advisor, we could suffer delays in locating suitable investments or may miss out on opportunities. If our Advisor is unable to obtain further suitable investments, we will not be able to continue to increase our asset base.
We are dependent on our Advisor to provide us with executive officers and key personnel and our operating performance may be impacted by any adverse changes in the financial health of our Advisor.
We have no employees. Personnel and services that we require are provided to us under contracts with our Advisor. We depend on our Advisor to manage our operations and acquire and manage our portfolio of real estate assets. Our Advisor makes all decisions with respect to the management of our company, subject to the supervision of, and any guidelines established by, our board of directors.
7
Our success depends to a significant degree upon the contributions of our executive officers, including our chief executive officer, Michael A. Happel, our interim chief financial officer, Nicholas Radesca, our chief investment officer, Patrick O'Malley, and other key personnel of our Advisor and our Property Manager. Our executive officers are also executive officers of a non-traded REIT with similar investment objectives to ours which is sponsored and advised by entities under common control with our Sponsor and our Advisor. Competition for such skilled personnel is intense, and we cannot assure you that our Advisor will be successful in attracting and retaining such skilled personnel capable of meeting the needs of our business. We cannot guarantee that all, or any particular one of these key personnel, will continue to provide services to us or our Advisor, and the loss of any of these key personnel could cause our operating results could suffer. Further, we have not and do not intend to separately maintain key person life insurance on any of our Advisor’s key personnel. Moreover, any adverse changes in the financial health of our Advisor or our Property Manager could negatively impact their ability to supply us with the key personnel necessary for successful operations.
We also depend on these key personnel to maintain relationships with firms that have special expertise in certain services or detailed knowledge regarding real properties in the five boroughs of New York City, particularly in Manhattan. If we lose or are unable to obtain the services of highly skilled professionals capable of establishing or maintaining appropriate strategic relationships, our ability to acquire additional properties could be adversely affected and our results of operations could suffer.
In addition, our Advisor depends upon the fees and other compensation that it receives from us in connection with the management of our business and sale of our properties to conduct its operations. Any adverse changes in the financial condition of, or our relationship with, our Advisor could hinder its ability to successfully manage our operations and our portfolio of investments. Additionally, changes in ownership or management practices, the occurrence of adverse events affecting our Advisor or its affiliates or other companies advised by our Advisor and its affiliates could create adverse publicity and adversely affect us and our relationship with lenders, tenants or counterparties.
Our operating results are affected by economic and regulatory changes that have an adverse impact on the real estate market in general. These changes may impact our profitability and ability to realize growth in the value of our real estate properties.
Our operating results are subject to risks generally incident to the ownership of real estate, including:
• | changes in general economic or local conditions; |
• | changes in supply of or demand for similar or competing properties in an area; |
• | changes in interest rates and availability of mortgage funds that may render the sale of a property difficult or unattractive; |
• | increases in operating expenses; |
• | vacancies and inability to lease or sublease space; |
• | changes in tax, real estate, environmental and zoning laws; and |
• | periods of high interest rates and tight money supply. |
Uninsured losses relating to real property or excessively expensive premiums for insurance coverage could reduce our cash flows and the return on our stockholders’ investments.
Our general liability coverage, property insurance coverage and umbrella liability coverage on all our properties may not be adequate to insure against liability claims and provide for the costs of defense. Similarly, we may not have adequate coverage against the risk of direct physical damage or to reimburse us on a replacement cost basis for costs incurred to repair or rebuild each property. Moreover, there are types of losses, generally catastrophic in nature, such as losses due to wars, acts of terrorism, earthquakes, floods, hurricanes, pollution or environmental matters that are uninsurable or not economically insurable, or may be insured subject to limitations, such as large deductibles or co-payments. Insurance risks associated with such catastrophic events could sharply increase the premiums we pay for coverage against property and casualty claims.
This risk is particularly relevant with respect to potential acts of terrorism. The Terrorism Risk Insurance Act of 2002 (the "TRIA"), under which the U.S. federal government bears a significant portion of insured losses caused by terrorism, will expire on December 31, 2020, and there can be no assurance that Congress will act to renew or replace the TRIA following its expiration. In the event that the TRIA is not renewed or replaced, terrorism insurance may become difficult or impossible to obtain at reasonable costs or at all, which may result in adverse impacts and additional costs to us.
8
Changes in the cost or availability of insurance due to the non-renewal of the TRIA or for other reasons could expose us to uninsured casualty losses. If any of our properties incurs a casualty loss that is not fully insured, the value of our assets will be reduced by any such uninsured loss, which may reduce the value of our stockholders’ investments. In addition, other than any working capital reserve or other reserves we may establish, we have no source of funding to repair or reconstruct any uninsured property. Also, to the extent we must pay unexpectedly large amounts for insurance, we could suffer reduced earnings that would result in lower dividends to stockholders.
Additionally, mortgage lenders insist in some cases that commercial property owners purchase coverage against terrorism as a condition for providing mortgage loans. Accordingly, to the extent terrorism risk insurance policies are not available at reasonable costs, if at all, our ability to finance or refinance our properties could be impaired. In such instances, we may be required to provide other financial support, either through financial assurances or self-insurance, to cover potential losses. We may not have adequate, or any, coverage for such losses.
Terrorist attacks and other acts of violence, civilian unrest, or war may affect the markets in which we operate our business and our profitability.
Our properties are located in the New York MSA which has experienced, and remains susceptible to, terrorist attacks. In addition, any kind of terrorist activity or violent criminal acts, including terrorist acts against public institutions or buildings or modes of public transportation (including airlines, trains or buses) could have a negative effect on our business. More generally, any terrorist attack, other act of violence or war, including armed conflicts, could result in increased volatility in, or damage to, the worldwide financial markets and economy.
Costs of complying with governmental laws and regulations, including those relating to environmental matters and discovery of previously undetected environmentally hazardous conditions may adversely affect our operating results.
Under various federal, state and local environmental laws, ordinances and regulations (including those of foreign jurisdictions), a current or previous owner or operator of real property may be liable for the cost of removal or remediation of hazardous or toxic substances on, under or in such property. The costs of removal or remediation could be substantial. Such laws often impose liability whether or not the owner or operator knew of, or was responsible for, the presence of such hazardous or toxic substances. Environmental laws also may impose restrictions on the manner in which property may be used or businesses may be operated, and these restrictions may require substantial expenditures. Environmental laws provide for sanctions for noncompliance and may be enforced by governmental agencies or, in certain circumstances, by private parties. Certain environmental laws and common law principles could be used to impose liability for release of and exposure to hazardous substances, including asbestos-containing materials into the air, and third parties may seek recovery from owners or operators of real properties for personal injury or property damage associated with exposure to released hazardous substances.
In addition, when excessive moisture accumulates in buildings or on building materials, mold growth may occur, particularly if the moisture problem remains undiscovered or is not addressed over a period of time. Some molds may produce airborne toxins or irritants. Concern about indoor exposure to mold has been increasing, as exposure to mold may cause a variety of adverse health effects and symptoms, including allergic or other reactions. As a result, the presence of significant mold at any of our projects could require us to undertake a costly remediation program to contain or remove the mold from the affected property or development project, which would adversely affect our operating results.
The cost of defending against claims of liability, of compliance with environmental regulatory requirements, of remediating any contaminated property, or of paying personal injury claims could materially adversely affect our business, assets or results of operations and, consequently, amounts available for distribution to our stockholders.
Environmental laws also may impose liens on property or restrictions on the manner in which property may be used or businesses may be operated, and these restrictions may require substantial expenditures or prevent us or our Property Manager and its assignees from operating such properties. Some of these laws and regulations have been amended so as to require compliance with new or more stringent standards as of future dates. Compliance with new or more stringent laws or regulations or stricter interpretation of existing laws may require us to incur material expenditures. Future laws, ordinances or regulations may impose material environmental liability.
Joint venture investments could be adversely affected by our lack of sole decision-making authority, our reliance on the financial condition of co-venturers and disputes between us and our co-venturers.
Our largest investment, representing 1.0 million of the 3.4 million rentable square feet in our portfolio as of December 31, 2015, is our 48.9% equity interest in the joint venture that owns Worldwide Plaza. We may enter into other partnerships and co-ownership arrangements (including preferred equity investments) in which we may not be in a position to exercise sole decision-making authority. Our interest in Worldwide Plaza (including our option to purchase the remaining 51.1% interest in Worldwide Plaza) is subject to significant transfer restrictions, which could adversely affect our ability to sell our interest on the most favorable terms without obtaining the consent of our joint venture partner or, in certain circumstances, lender.
9
These investments are subject to the potential risk of impasses on decisions, such as a sale, because neither we nor the co-venturer would have full control over the joint venture. For example, under the Worldwide Plaza joint venture, our joint venture partner is the manager of the joint venture and is responsible for day-to-day management of Worldwide Plaza, although we have consent rights over all major decisions, such as the approval of the annual budget and any decision to sell or encumber the property. Investments in joint ventures may also, under certain circumstances, involve risks not present were a third party not involved, including the possibility that partners or co-venturers might become bankrupt or fail to fund their required capital contributions. Co-venturers may have economic or other business interests or goals which are inconsistent with our business interests or goals, and may be in a position to take actions contrary to our policies or objectives. Disputes between us and co-venturers may result in litigation or arbitration that would increase our expenses and prevent our officers or directors from focusing their time and effort on our business. Consequently, actions by or disputes with co-venturers might result in subjecting properties owned by the joint venture to additional risk. In addition, we may in certain circumstances be liable for the actions of our co-venturers.
Potential changes in U.S. accounting standards regarding operating leases may make the leasing of our properties less attractive to our potential tenants, which could reduce overall demand for our leasing services.
Under current authoritative accounting guidance for leases, a lease is classified by a tenant as a capital lease if the significant risks and rewards of ownership are considered to reside with the tenant. Under capital lease accounting for a tenant, both the leased asset and liability are reflected on their balance sheet. If the lease does not meet any of the criteria for a capital lease, the lease is considered an operating lease by the tenant, and the obligation does not appear on the tenant's balance sheet; rather, the contractual future minimum payment obligations are only disclosed in the footnotes thereto. The Financial Accounting Standards Board ("FASB") and the International Accounting Standards Board ("IASB") conducted a joint project to re-evaluate lease accounting and have jointly released exposure drafts of a proposed accounting model that would significantly change lease accounting. In March 2014, the FASB and IASB deliberated aspects of the joint project, including the lessee and lessor accounting models, lease term, and exemptions and simplifications. The final standards were released in February 2016. Changes to the accounting guidance could affect both our accounting for leases as well as that of our current and potential tenants. These changes may affect how the real estate leasing business is conducted. For example, if the accounting standards regarding the financial statement classification of operating leases are revised, then companies may be less willing to enter into leases in general or desire to enter into leases with shorter terms because the apparent benefits to their balance sheets could be reduced or eliminated. This in turn could make it more difficult for us to enter into leases on terms we find favorable.
There are costs associated with complying with the Americans with Disabilities Act of 1990 (the "Disabilities Act").
Our properties are subject to the Disabilities Act. Under the Disabilities Act, all places of public accommodation are required to comply with federal requirements related to access and use by disabled persons. The Disabilities Act has separate compliance requirements for "public accommodations" and "commercial facilities" that generally require that buildings and services, including restaurants and retail stores, be made accessible and available to people with disabilities. The Disabilities Act's requirements could require removal of access barriers and could result in the imposition of injunctive relief, monetary penalties, or, in some cases, an award of damages. There can be no assurance that we will be able to acquire properties in compliance with the Disabilities Act or allocate the burden on the seller or other third party, such as a tenant, to ensure compliance with the Disabilities Act. However, there can be no assurance that we will be able to acquire properties or allocate responsibilities in this manner.
Our business could suffer in the event our Advisor or any other party that provides us with services essential to our operations experiences system failures or cyber-incidents or a deficiency in cybersecurity.
Despite system redundancy, the implementation of security measures and the existence of a disaster recovery plan for the internal information technology systems of our Advisor and other parties that provide us with services essential to our operations are vulnerable to damages from any number of sources, including computer viruses, unauthorized access, energy blackouts, natural disasters, terrorism, war and telecommunication failures. Any system failure or accident that causes interruptions in our operations could result in a material disruption to our business.
A cyber-incident is considered to be any adverse event that threatens the confidentiality, integrity or availability of information resources. More specifically, a cyber-incident is an intentional attack or an unintentional event that can result in third parties gaining unauthorized access to systems to disrupt operations, corrupt data or steal confidential information. As reliance on technology in our industry has increased, so have the risks posed to the systems of our Advisor and other parties that provide us with services essential to our operations, both internal and those that have been outsourced. In addition, the risk of a cyber-incident, including by computer hackers, foreign governments and cyber terrorists, has generally increased as the number, intensity and sophistication of attempted attacks and intrusions from around the world have increased. Even the most well protected information, networks, systems and facilities remain potentially vulnerable because the techniques used in such attempted attacks and intrusions evolve and generally are not recognized until launched against a target, and in some cases are designed not to be detected and, in fact, may not be detected.
10
The remediation costs and lost revenues experienced by a victim of a cyber-incident may be significant and significant resources may be required to repair system damage, protect against the threat of future security breaches or to alleviate problems, including reputational harm, loss of revenues and litigation, caused by any breaches.
In addition, a security breach or other significant disruption involving the IT networks and related systems of our Advisor or any other party that provides us with services essential to our operations could:
• | result in misstated financial reports, violations of loan covenants, missed reporting deadlines and/or missed permitting deadlines; |
• | affect our ability to properly monitor our compliance with the rules and regulations regarding our qualification as a REIT; |
• | result in the unauthorized access to, and destruction, loss, theft, misappropriation or release of, proprietary, confidential, sensitive or otherwise valuable information (including information about guests at our hotel or tenants), which others could use to compete against us or for disruptive, destructive or otherwise harmful purposes and outcomes; |
• | result in our inability to maintain the building systems relied upon by our tenants for the efficient use of their leased space; |
• | require significant management attention and resources to remedy any damages that result; |
• | subject us to claims for breach of contract, damages, credits, penalties or termination of leases or other agreements; or |
• | adversely impact our reputation among our tenants, guests at our hotel and investors generally. |
Although our Advisor and other parties that provide us with services essential to our operations intend to continue to implement industry-standard security measures, there can be no assurance that those measures will be sufficient, and any material adverse effect experienced by our Advisor and other parties that provide us with services essential to our operations could, in turn, have an adverse impact on us.
Any hedging strategies we utilize may not be successful in mitigating our risks.
We have entered into hedging transactions to manage risk of interest rate changes with respect to borrowings made or to be made to acquire or own real estate assets. To the extent that we use derivative financial instruments in connection with these risks, we are exposed to credit, basis and legal enforceability risks. Derivative financial instruments may include interest rate swap contracts, interest rate cap or floor contracts, futures or forward contracts, options or repurchase agreements. In this context, credit risk is the failure of the counterparty to perform under the terms of the derivative contract. If the fair value of a derivative contract is positive, the counterparty owes us, which creates credit risk for us. Basis risk occurs when the index upon which the contract is based is more or less variable than the index upon which the hedged asset or liability is based, thereby making the hedge less effective. Finally, legal enforceability risks encompass general contractual risks, including the risk that the counterparty will breach the terms of, or fail to perform its obligations under, the derivative contract. We may not be able to manage these risks effectively.
Risks Related to Conflicts of Interest
Our Sponsor, Advisor, executive officers and other key personnel face conflicts of interest relating to the purchase and leasing of properties, and these conflicts may not be resolved in our favor, which could adversely affect our investment opportunities.
To the extent we seek out additional investment opportunities, we rely on the executive officers and other key professionals at our Advisor and our Property Manager to identify suitable investment opportunities for us. Several of the other key professionals of our Advisor are also the key professionals at the parent of our Sponsor and their other public programs, and our executive officers are also executive officers of American Realty Capital New York City REIT, Inc. ("ARC NYCR"), which is a non-traded REIT sponsored by the parent of our Sponsor that has investment objectives similar to ours. The Allocation Agreement provides that acquisitions of properties identified for acquisition by our Advisor or the advisor to ARC NYCR requires rotation among us and this entity depending on which one of us has sufficient capital to acquire all or some of the property acquisitions and which of us most recently made a property acquisition. As a result, we may not be able to acquire a property that we desire because of this agreement.
In addition, other programs sponsored by the parent of our Sponsor that are not parties to the Allocation Agreement own properties, or may seek to acquire properties, in the New York MSA. Thus, a conflict could arise between us and one or more of these programs sponsored by the parent of our Sponsor to acquire or sell a property, lease vacant space or renew existing leases. Conflicts of interest also may exist at such time as we or our affiliates managing properties on our behalf seek to employ developers, contractors or building managers, as well as under other circumstances. Also, we may acquire properties from, or sell properties to, other programs sponsored by the parent of our Sponsor.
11
Our officers and directors face conflicts of interest related to the positions they hold with our Advisor, our Property Manager and other affiliated entities, which could hinder our ability to successfully implement our business strategy.
Certain of our executive officers, including Michael A. Happel, our chief executive officer and president, Nicholas Radesca, our interim chief financial officer, and Patrick O'Malley, our chief investment officer, also are officers of our Advisor, our Property Manager and other affiliated entities, including the advisor and property manager of ARC NYCR, which is a non-traded REIT sponsored by our Sponsor that has investment objectives similar to ours. Some of our directors also are directors of other non-traded REITs sponsored by affiliates of the parent of our Sponsor. As a result, these individuals owe fiduciary duties to these other entities and their stockholders, which may result in them taking actions or making decisions that conflict with the duties that they owe to us and our stockholders.
These conflicts could result in actions or inactions that are detrimental to our business. Conflicts with our business and interests are most likely to arise from involvement in activities related to (a) allocation of investments and management time and services between us and the other entities, (b) our purchase of properties from, or sale of properties, to entities sponsored by affiliates of our Advisor, (c) the timing and terms of the investment in or sale of an asset, (d) investments with entities sponsored by affiliates of our Advisor, (e) compensation to our Advisor and its affiliates including our Property Manager, and (f) any decision to sell our company or sell all, or substantially all, of our assets.
Moreover, the management of multiple REITs by certain of the officers and other key personnel of our Advisor may significantly reduce the amount of time they are able to spend on our activities.
Our Advisor and its affiliates face conflicts of interest relating to the structure of the fees they receive, which could result in actions that are not necessarily in the long-term best interests of our stockholders.
Under our advisory agreement, the partnership agreement of our OP, and the OPP (as defined herein), our Advisor and its affiliates are entitled to certain fees and other compensation which, because the Advisor does not maintain a significant equity interest in us and is entitled to receive substantial minimum compensation regardless of performance, may result in its interests not being wholly aligned with those of our stockholders. For example, our Advisor could be motivated to recommend riskier or more speculative investments with the hope that doing so will result in us generating the specified levels of total return that would entitle our Advisor to certain incentive fees and compensation as well as increase the number of LTIP units (as defined herein) that the Advisor would earn. In addition, our advisory agreement, property management agreement and other agreements with our Advisor and its affiliates include covenants and conditions that are subject to interpretation and could result in disagreements.
Moreover, the OPP provides for early calculation of earned LTIP units and for the accelerated vesting of any earned LTIP units in the event the Advisor is terminated or in the event of a change in control of our company, which could motivate our Advisor to recommend a transaction that would result in a change in control under the OPP when such a transaction would not otherwise be in the best interests of our stockholders.
See Item 13. Certain Relationships and Related Transactions, and Director Independence — 2014 Advisor Multi-Year Outperformance Agreement.
Risks Related to our Corporate Structure and Common Stock
We may be unable to pay or maintain dividends from cash available from operations or increase dividends over time.
Many factors affect our ability to pay dividends to our stockholders. We have not generated and may not in the future generate operating cash flows sufficient to continue to pay dividends to our stockholders at the current rate. During 2015, our dividends were paid from a combination of cash flow from our operations, proceeds from the redemption of our preferred equity investment and distributions in respect of our interest in Worldwide Plaza, but we have in the past been, and may again in the future be, required to borrow funds to fund dividends. During 2016, we do not expect to have sufficient cash flow from operations to pay dividends at our current rate. We expect to be able to pay dividends from a combination of cash flow from operations and cash on hand. Actual cash available for dividends may vary substantially from our estimates. If our cash flow from operations and cash on hand are not sufficient, we may need to borrow funds, potentially at higher rates, or depend on our Advisor or our Property Manager to waive fees or reimbursement of certain expenses, which they are not required to do, to fund our operations and any dividends to our stockholders. There is no assurance that we will be able to obtain funds from such sources, or pay or maintain our current level of dividends.
Moreover, our failure to meet the market’s expectations with regard to future earnings and cash dividends likely would adversely affect the market price of our common stock.
12
The trading price of our common stock has been volatile and may fluctuate.
The trading price of our common stock has been volatile and may continue to fluctuate widely as a result of a number of factors, many of which are outside our control. In addition, the stock market is subject to fluctuations in the share prices and trading volumes that affect the market prices of the shares of many companies. These broad market fluctuations have in the past and may in the future adversely affect the market price of our common stock. Among the factors that could affect the price of our common stock are:
• | our financial condition and performance; |
• | the financial condition of our tenants, including the extent of tenant bankruptcies or defaults; |
• | actual or anticipated quarterly fluctuations in our operating results and financial condition; |
• | our dividend policy; |
• | the reputation of REITs and real estate investments generally and the attractiveness of REIT equity securities in comparison to other equity securities, including securities issued by other real estate companies, and fixed income securities; |
• | our reputation and the reputation of our Sponsor, Advisor and their affiliates; |
• | uncertainty and volatility in the equity and credit markets; |
• | fluctuations in interest rates; |
• | uncertainty related to our strategic alternatives process; |
• | changes in revenue or earnings estimates or publication of research reports and recommendations by financial analysts or actions taken by rating agencies with respect to our securities or those of other REITs; |
• | future sales of our common stock, or the perception that such sales could occur; |
• | failure to meet analysts’ revenue or earnings estimates; |
• | speculation in the press or investment community; |
• | strategic actions by us or our competitors, such as acquisitions or restructurings; |
• | the extent of institutional investor interest in us; |
• | the extent of short-selling of our common stock and the shares of our competitors; |
• | fluctuations in the stock price and operating results of our competitors; |
• | general financial and economic market conditions and, in particular, developments related to market conditions for REITs and other real estate related companies; |
• | domestic and international economic factors unrelated to our performance; and |
• | all other risk factors addressed elsewhere in this Annual Report on Form 10-K. |
A significant decline in our stock price could result in substantial losses for our stockholders.
We depend on our OP and its subsidiaries for cash flow and are structurally subordinated in right of payment to the obligations of our OP and its subsidiaries.
Our only significant asset is the general partnership interests we own in our OP and assets held by us for the use and benefit of our OP. We conduct, and intend to continue conducting, all of our business operations through our OP. Accordingly, we rely on distributions from our OP and its subsidiaries of their net earnings and cash flows. The limited partnership units of the OP entitled "OP Units" ("OP units") owned by our Advisor and its affiliates and employees are also entitled to distributions from the OP in the same amount as dividends paid on shares of our common stock. Until such time as the limited partnership units of the OP entitled "LTIP Units" ("LTIP units") held by our Advisor are fully earned in accordance with the provisions of the OPP, the LTIP units are entitled to distributions equal to 10% of the distributions made on the OP units. After the LTIP units are fully earned, they are entitled to a catch-up distribution and then the same distributions as the OP units.
13
There is no assurance that our OP or its subsidiaries will be able to, or be permitted to, pay distributions to us that will enable us to pay dividends to our stockholders or distributions to holders of OP units and holders of LTIP units from cash flows from operations or otherwise pay any other obligations. Each of our OP's subsidiaries is a distinct legal entity and, under certain circumstances, legal and contractual restrictions may limit our ability to obtain cash from these entities. In addition, because we are a holding company, stockholder claims will be structurally subordinated to all existing and future liabilities and obligations of our OP and its subsidiaries. Therefore, in the event of our bankruptcy, liquidation or reorganization, our assets and those of our OP and its subsidiaries will be able to satisfy stockholder claims as stockholders only after all of our and our OP's and its subsidiaries liabilities and obligations have been paid in full.
Existing stockholders’ interests will be diluted if we issue additional shares.
Existing stockholders do not have preemptive rights to any shares issued by us in the future. Our charter currently authorizes us to issue 350 million shares of stock, of which 300 million shares are classified as common stock and 50 million are classified as preferred stock. Our board of directors may amend our charter from time to time to increase or decrease the aggregate number of authorized shares of stock, or the number of authorized shares of any class or series of stock, or may classify or reclassify any unissued shares into the classes or series of stock without the necessity of obtaining stockholder approval. Except for preferred stock, all of our shares may be issued in the discretion of our board of directors. Existing stockholders likely will suffer dilution of their equity investment in us, if we: (a) sell additional shares in the future; (b) sell securities that are convertible into shares of our common stock; (c) issue shares of our common stock in a private offering of securities to institutional investors; (d) issue restricted share awards to our directors; or (e) issue shares to our Advisor or its affiliates, successors or assigns, in payment of an outstanding fee obligation as set forth under our advisory agreement or other agreements.
In addition, we may issue shares of our common stock in connection with an exchange of OP units. The holders of outstanding OP units generally may, subject to certain restrictions, exchange OP units for the cash value of a corresponding number of shares of our common stock or, at the election of our OP, a corresponding number of shares of our common stock. Following redemptions of OP units that resulted in issuance of 2,515,406 shares of common stock during February 2016 to individual members and employees of the Advisor, the Advisor and its affiliates, including certain of our current and former directors and executive officers, owned 1,662,684 OP units. As of December 31, 2015, individual members of our Advisor, including our chief executive officer, and William M. Kahane, one of our directors, also owned 8,880,579 LTIP units, which were issued to our Advisor in connection with the listing of our common stock in April 2014 (the "Listing"). LTIP units are convertible into OP units subject to being earned and vested and several other conditions. We may also issue OP units to sellers of properties acquired by us.
If we issue preferred stock, the holders thereof will, upon liquidation, be entitled to receive distributions of liquidation proceeds prior to distribution to the holders of our common stock. Additionally, any preferred stock including convertible preferred stock or other securities convertible, exercisable or exchangeable for common stock that we issue in the future may have rights, preferences and privileges more favorable than those of our common stock and will result in dilution to owners of our common stock if converted, exercised or exchanged for common stock. Any preferred stock, if issued, could have a preference on liquidating distributions or a preference on dividend payments that could limit our ability pay dividends to the holders of our common stock. Because our decision to issue securities in any future offering will depend on market conditions and other factors beyond our control, we cannot predict or estimate the amount, timing or nature of our future offerings. Thus, our stockholders bear the risk of our future offerings reducing the value of our common stock and diluting the interest of existing stockholders.
Our rights and the rights of our stockholders to recover claims against our officers, directors and our Advisor are limited, which could reduce recoveries against them if they cause us to incur losses.
Maryland law provides that a director has no liability in that capacity if he or she performs his or her duties in good faith, in a manner he or she reasonably believes to be in the corporation's best interests and with the care that an ordinarily prudent person in a like position would use under similar circumstances. In addition, subject to certain limitations set forth therein or under Maryland law, our charter provides that no director or officer will be liable to us or our stockholders for monetary damages and requires us to indemnify our directors, our officers and our Advisor and our Advisor's affiliates and permits us to indemnify our employees and agents. We and our stockholders also may have more limited rights against our directors, officers, employees and agents, and our Advisor and its affiliates, than might otherwise exist under common law, which could reduce recoveries against them. In addition, we may be obligated to fund the defense costs incurred by our directors, officers, employees and agents, or our Advisor and its affiliates in some cases.
14
The limit on the number of shares a person may own may discourage a takeover that could otherwise result in a premium price to our stockholders.
Our charter, with certain exceptions, authorizes our directors to take such actions as are necessary and desirable to preserve our qualification as a REIT. Unless exempted by our board of directors, no person may own more than 9.8% in value of the aggregate of the outstanding shares of our stock or more than 9.8% (in value or number, whichever is more restrictive) of any class or series of the outstanding shares of our stock. This restriction may have the effect of delaying, deferring or preventing a change in control of our company, including an extraordinary transaction (such as a merger, tender offer or sale of all or substantially all our assets) that might provide a premium price for holders of our common stock. Similarly, this restriction further limits a stockholder's ability to sell shares.
Maryland law prohibits certain business combinations, which may make it more difficult for us to be acquired.
Under Maryland law, "business combinations" between a Maryland corporation and an interested stockholder or an affiliate of an interested stockholder are prohibited for five years after the most recent date on which the interested stockholder becomes an interested stockholder. These business combinations include a merger, consolidation, share exchange or, in circumstances specified in the statute, an asset transfer or issuance or reclassification of equity securities. An interested stockholder is defined as:
• | any person who beneficially owns 10% or more of the voting power of the corporation's outstanding voting stock; or |
• | an affiliate or associate of the corporation who, at any time within the two-year period prior to the date in question, was the beneficial owner of 10% or more of the voting power of the then-outstanding stock of the corporation. |
A person is not an interested stockholder under the statute if the board of directors approved in advance the transaction by which he or she otherwise would have become an interested stockholder. However, in approving a transaction, the board of directors may provide that its approval is subject to compliance, at or after the time of approval, with any terms and conditions determined by the board of directors.
After the five-year prohibition, any business combination between the Maryland corporation and an interested stockholder generally must be recommended by the board of directors of the corporation and approved by the affirmative vote of at least:
• | 80% of the votes entitled to be cast by holders of outstanding shares of voting stock of the corporation; and |
• | two-thirds of the votes entitled to be cast by holders of voting stock of the corporation other than shares held by the interested stockholder with whom or with whose affiliate the business combination is to be effected or held by an affiliate or associate of the interested stockholder. |
These super-majority vote requirements do not apply if the corporation's common stockholders receive a minimum price, as defined under Maryland law, for their shares in the form of cash or other consideration in the same form as previously paid by the interested stockholder for its shares. The business combination statute permits various exemptions from its provisions, including business combinations that are exempted by the board of directors prior to the time that the interested stockholder becomes an interested stockholder. Pursuant to the statute, our board of directors has exempted any business combination involving our Advisor or any affiliate of our Advisor. Consequently, the five-year prohibition and the super-majority vote requirements will not apply to business combinations between us and our Advisor or any affiliate of our Advisor. As a result, our Advisor and any of its affiliates may be able to enter into business combinations with us that may not be in the best interest of our stockholders, without compliance with the super-majority vote requirements and the other provisions of the statute. The business combination statute may discourage others from trying to acquire control of us and increase the difficulty of consummating any offer.
Maryland law limits the ability of a third-party to buy a large stake in us and exercise voting power in electing directors, which may discourage a takeover that could otherwise result in a premium price to our stockholder.
The Maryland Control Share Acquisition Act provides that "control shares" of a Maryland corporation acquired in a "control share acquisition" have no voting rights except to the extent approved by the affirmative vote of stockholders entitled to cast two-thirds of the votes entitled to be cast on the matter. Shares of stock owned by the acquirer, by officers or by employees who are directors of the corporation, are excluded from shares entitled to vote on the matter. "Control shares" are voting shares of stock which, if aggregated with all other shares of stock owned by the acquirer or in respect of which the acquirer can exercise or direct the exercise of voting power (except solely by virtue of a revocable proxy), would entitle the acquirer to exercise voting power in electing directors within specified ranges of voting power. Control shares do not include shares the acquiring person is then entitled to vote as a result of having previously obtained stockholder approval. A "control share acquisition" means the acquisition of issued and outstanding control shares. The control share acquisition statute does not apply (a) to shares acquired in a merger, consolidation or share exchange if the corporation is a party to the transaction, or (b) to acquisitions approved or exempted by the charter or bylaws of the corporation. Our bylaws contain a provision exempting from the Control Share Acquisition Act any and all acquisitions of our stock by any person. There can be no assurance that this provision will not be amended or eliminated at any time in the future.
15
Office Industry Risks
Declines in overall activity in the New York MSA may adversely affect the performance of our office properties.
A total of 82% of our properties measured by rentable square feet as of December 31, 2015 were comprised of commercial office properties located in the New York MSA. Rental income from office properties fluctuates with general market and economic conditions. Our office properties may be adversely affected by market or economic challenges experienced by the U.S. economy or real estate industry as a whole. Because our portfolio includes commercial office buildings located in the New York MSA, which has a relatively large number of financial and professional services sector, significant job losses in the financial and professional services sector, which may decrease demand for office space, causing market rental rates and property values to be negatively impacted.
We also may experience a decrease in occupancy and rental rates accompanied by increases in the cost of re-leasing space (including for tenant improvements) and in uncollectible receivables. Early lease terminations may significantly contribute to a decline in occupancy of our office properties and may adversely affect our profitability. While lease termination fees increase current period income, future rental income may be diminished because, during periods in which market rents decline, it is unlikely that we will collect from replacement tenants the full contracted amount which had been payable under the terminated leases.
The loss of anchor tenants for our office properties could adversely affect our profitability.
A lease termination by a tenant that occupies a large area of space in one of our office properties (commonly referred to as an anchor tenant) could impact leases of other tenants. Other tenants may be entitled to modify the terms of their existing leases in the event of a lease termination by an anchor tenant or the closure of the business of an anchor tenant that leaves its space vacant, even if the anchor tenant continues to pay rent. Any such modifications or conditions could be unfavorable to us as the property owner and could decrease rents or expense recoveries. In the event of default by an anchor tenant, we may experience delays and costs in enforcing our rights as landlord to recover amounts due to us under the terms of our agreements with those parties.
We may be adversely affected by certain trends that reduce demand for office real estate.
Some businesses are rapidly evolving to increasingly permit employee telecommuting, flexible work schedules, open workplaces and teleconferencing. These practices enable businesses to reduce their space requirements. A continuation of the movement towards these practices could over time erode the overall demand for office space and, in turn, place downward pressure on occupancy, rental rates and property valuations.
Retail Industry Risks
Retail conditions may adversely affect our income.
A total of 10% of our property holdings measured by rentable square feet as of December 31, 2015 is comprised of commercial retail properties located in the New York MSA. A retail property's revenues and value may be adversely affected by a number of factors, many of which apply to real estate investment generally, but which also include trends in the retail industry and perceptions by retailers or shoppers of the safety, convenience and attractiveness of the retail property. In addition, to the extent that the investing public has a negative perception of the retail sector, the value of our common stock may be negatively impacted.
Some of our leases provide for base rent plus contractual base rent increases. We also have leases that include provisions for the tenant to pay contingent rental income based on a percent of the tenant's sales upon the achievement of certain sales thresholds or other targets which may be monthly, quarterly or annual targets. Under those leases which contain contingent rent clauses, our revenue from tenants may increase as the sales of our tenants increase. Generally, retailers face declining revenues during downturns in the economy. As a result, the portion of our revenue which we derive from contingent rent leases could decline in a general economic downturn.
16
Our revenue will be impacted by the success and economic viability of our anchor retail tenants. Our reliance on single or significant tenants in certain buildings may decrease our ability to lease vacated space.
In the retail sector, any tenant occupying a large portion of the gross leasable area of a retail center, a tenant of any of the triple-net single-user retail properties outside the primary geographical area of investment, commonly referred to as an anchor tenant, or a tenant that is our anchor tenant at more than one retail center, may become insolvent, may suffer a downturn in business, or may decide not to renew its lease. Any of these events would result in a reduction or cessation in rental payments to us and would adversely affect our results of operation and financial condition. A lease termination by an anchor tenant could result in lease terminations or reductions in rent by other tenants whose leases permit cancellation or rent reduction if another tenant's lease is terminated. We may own properties where the tenants may have rights to terminate their leases if certain other tenants are no longer open for business. These "co-tenancy" provisions also may exist in some leases where we own a portion of a retail property and one or more of the anchor tenants leases space in that portion of the center not owned or controlled by us. If such tenants were to vacate their space, tenants with co-tenancy provisions would have the right to terminate their leases with us or seek a rent reduction from us. In such event, we may be unable to re-lease the vacated space. Similarly, the leases of some anchor tenants may permit the anchor tenant to transfer its lease to another retailer. The transfer to a new anchor tenant could cause customer traffic in the retail center to decrease and thereby reduce the income generated by that retail center. A lease transfer to a new anchor tenant could also allow other tenants to make reduced rental payments or to terminate their leases at the retail center. If we are unable to re-lease the vacated space to a new anchor tenant, we may incur additional expenses in order to re-model the space to be able to re-lease the space to more than one tenant.
Competition with other retail channels may reduce our profitability.
Our retail tenants face potentially changing consumer preferences and increasing competition from other forms of retailing, such as retailing conducted through internet websites (which we refer to as e-commerce), discount shopping centers, outlet centers, upscale neighborhood strip centers, catalogues and other forms of direct marketing, discount shopping clubs and telemarketing. Other retail centers within the market area of our properties may compete with our properties for customers, affecting their tenants' cash flows and thus affecting their ability to pay rent. In addition, some of our tenants' rent payments may be based on the amount of sales revenue that they generate. If these tenants experience competition, the amount of their rent may decrease and our cash flow will decrease.
E-commerce can have an impact on our business.
The use of the internet by consumers continues to gain popularity. The migration towards e-commerce is expected to continue. This increase in internet sales could result in a downturn in the business of our current tenants in their "brick and mortar" locations and could affect the way future tenants lease space.
While we devote considerable effort and resources to analyze and respond to tenant trends, preferences and consumer spending patterns, we cannot predict with certainty what future tenants will want, what future retail spaces will look like and how much revenue will be generated at traditional "brick and mortar" locations. If we are unable to anticipate and respond promptly to trends in the market, our occupancy levels and financial results could suffer.
Lodging Industry Risks
Our hotel is subject to all the risks common to the hotel industry and subject to market conditions that affect all hotel properties.
One of the properties we own is a hotel located in New York City that is subject to all the risks of the hotel industry, particularly the hotel industry in the New York MSA, which may include:
• | increases in supply of hotel rooms that exceed increases in demand; |
• | increases in energy costs and other travel expenses that reduce business and leisure travel; |
• | reduced business and leisure travel due to continued geo-political uncertainty, including terrorism, or for other reasons; |
• | reduced business and leisure travel from other countries to the United States due to the strength of the U.S. Dollar as compared to the currencies of other countries; |
• | adverse effects of declines in general and local economic activity; |
17
• | increased competition from other existing hotels in our markets and with alternative lodging companies, such as Airbnb; |
• | new hotels entering our markets, which may adversely affect the occupancy levels and average daily rates of our lodging properties; |
• | an increase in internet bookings, which may enable internet booking intermediaries to obtain higher commissions, reduced room rates or other significant contract concessions from our third-party hotel property manager; |
• | increases in operating costs due to inflation and other factors that may not be offset by increased room rates; |
• | unavailability of labor; |
• | changes in, and the related costs of compliance with, governmental laws and regulations, fiscal policies and zoning ordinances; |
• | inability to adapt to dominant trends in the hotel industry or introduce new concepts and products that take advantage of opportunities created by changing consumer spending patterns and demographics; and |
• | adverse effects of international, national, regional and local economic and market conditions. |
In addition, the hotel industry may be adversely affected by factors outside of our control, such as extreme weather conditions or natural disasters, terrorist attacks or alerts, outbreaks of contagious diseases, airline strikes, economic factors and other considerations affecting travel.
As a REIT, we cannot directly or indirectly operate our lodging property.
We cannot and do not directly or indirectly operate our lodging property and instead must rely on the ability of a third-party hotel management company to operate our lodging property successfully. In order for us to satisfy certain REIT qualification rules, we cannot directly or indirectly operate any lodging property or actively participate in the decisions affecting its daily operations. Any lodging properties that we own or may acquire are or will be leased to one or more taxable REIT subsidiaries ("TRSs"), which enter into hotel management agreements with third-party hotel management companies to operate the properties that we lease to a TRS. We cannot and do not control these third-party hotel management companies, who are responsible for maintenance and other day-to-day management including, but not limited to, the implementation of significant operating decisions. Thus, even if we believe our lodging property is being operated inefficiently or in a manner that does not result in satisfactory operating results, we may not be able to require the third-party hotel management company to change its method of operation. Any negative publicity or other adverse developments that affect that operator generally may adversely affect the performance of our lodging property.
We rely on a third-party hotel management company to establish and maintain adequate internal controls over financial reporting at our lodging property. We do not, however, control the design or implementation of or changes to these internal controls. We may not be able to require the third-party hotel management company to change its internal control structure. This could require us to implement extensive and possibly inefficient controls at a parent level in an attempt to mitigate such deficiencies. If such controls are not effective, the accuracy of the results of our operations that we report could be affected. Accordingly, our ability to conclude that, as a company, our internal controls are effective is significantly dependent upon the effectiveness of internal controls that our third-party hotel management company has implemented at our lodging property. It is possible that we could have a significant deficiency or material weakness as a result of the ineffectiveness of the internal controls at our lodging property.
If we replace a third-party hotel management company, we may be required by the terms of the relevant management agreement to pay substantial termination fees, and we may experience significant disruptions at the affected lodging properties. We may not be able to make arrangements with a third-party hotel management company with substantial prior lodging experience in the future and could experience disruptions in our operations.
Our use of the TRS structure increases our expenses.
A TRS structure subjects us to the risk of increased lodging operating expenses. The performance of any TRS is based on the operations of the applicable lodging property. Our operating risks include not only changes in hotel revenues and changes to our TRSs' ability to pay the rent due to us under the leases, but also increased hotel operating expenses, including, but not limited to, the following cost elements:
• | wage and benefit costs; |
• | repair and maintenance expenses; |
• | energy costs; |
• | property taxes; |
• | insurance costs; and |
18
• | other operating expenses. |
There are risks associated with employing hotel employees.
We are generally subject to risks associated with the employment of hotel employees. The lodging properties we acquire are leased to one or more TRSs, which enter into hotel management agreements with third-party hotel management companies to operate the lodging properties that we lease to a TRS. Hotel operating revenues and expenses for these properties are included in our consolidated results of operations. As a result, although we do not directly employ or manage the labor force at our lodging properties, we are subject to many of the costs and risks generally associated with the hotel labor force. Our third-party property manager is responsible for hiring and maintaining the labor force at each our lodging properties and for establishing and maintaining the appropriate processes and controls over such activities. From time to time, the operations of our lodging properties may be disrupted through strikes, public demonstrations or other labor actions and related publicity. We may also incur increased legal costs and indirect labor costs as a result of the aforementioned disruptions, or contract disputes or other events. Our third-party property manager may be targeted by union actions or adversely impacted by the disruption caused by organizing activities.
Risks Associated with Debt Financing and Investments
We have outstanding debt, and the amount of debt and its cost may increase and refinancing may not be available on acceptable terms.
Our business is subject to risks normally associated with debt financing. The total principal amount of our combined outstanding indebtedness, which generally comprises mortgage loans on our properties, our pro rata share of Worldwide Plaza's indebtedness and the term loan and revolving components of our Credit Facility with Capital One, was $1.3 billion as of December 31, 2015. We rely on both secured and unsecured, variable rate and non-variable rate debt to finance acquisitions and development activities and for working capital. We have also funded a portion of the dividends that we have paid in the past with the proceeds from borrowings. We may also borrow if we need funds to satisfy the REIT tax qualification requirement that we distribute at least 90% of our annual REIT taxable income to our stockholders. We also may borrow if we otherwise deem it necessary or advisable to assure that we maintain our qualification as a REIT.
We may be unable to obtain debt financing or refinance existing indebtedness upon maturity. Our substantial indebtedness and the cash flow associated with serving our indebtedness could have important consequences, including the risks that:
• | our cash flow could be insufficient to pay dividends at expected levels and meet required payments of principal and interest; |
• | our debt financing contains prepayment penalties, assumption fees or other provisions that restrict our ability to transfer assets; |
• | we might be required to use a substantial portion of our cash flow from operations to pay our indebtedness, thereby reducing the availability of our cash flow to fund our business, including acquisitions, capital expenditures and other general corporate purposes; |
• | our ability to obtain additional financing for working capital, capital expenditures, satisfaction of debt service requirements, acquisitions and general corporate or other purposes could be limited; |
• | our debt service obligations could limit our flexibility in planning for, or reacting to, changes in our business or market conditions and place us at a competitive disadvantage compared to our competitors who may be better positioned to take advantage of opportunities that our leverage prevents us from exploiting; |
• | we may not be able to refinance existing indebtedness (which requires substantial principal payments at maturity) and, if we can, the terms of such refinancing might not be as favorable as the terms of existing indebtedness; |
• | if principal payments due at maturity cannot be refinanced, extended or paid with proceeds of other capital transactions, such as new equity capital, our cash flow will not be sufficient in all years to repay all maturing debt; and |
• | prevailing interest rates or other factors at the time of refinancing (such as the possible reluctance of lenders to make commercial real estate loans) may result in higher interest rates, which could adversely affect net income, cash flow and our ability to service debt and pay dividends to stockholders. |
19
In addition, incurring mortgage debt increases the risk of loss since defaults on indebtedness secured by a property may result in lenders initiating foreclosure actions. In that case, we could lose the property securing the loan that is in default, thus reducing the value of an investment in our common stock. For U.S. federal income tax purposes, a foreclosure of any of our properties would be treated as a sale of the property for a purchase price equal to the outstanding balance of the debt secured by the mortgage. If the outstanding balance of the debt secured by the mortgage exceeds our tax basis in the property, we would recognize taxable income on foreclosure, but would not receive any cash proceeds. In such event, we may be unable to pay the amount of dividends required in order to maintain our REIT status. We may give full or partial guarantees to lenders of mortgage debt to the entities that own our properties. If we provide a guaranty on behalf of an entity that owns one of our properties, we will be responsible to the lender for satisfaction of the debt if it is not paid by such entity. If any mortgages contain cross-collateralization or cross-default provisions, a default on a single property could affect multiple properties. If any of our properties are foreclosed upon due to a default, our ability to pay cash dividends to our stockholders will be adversely affected which could result in our losing our REIT status and would result in a decrease in the value of an investment in our common stock.
Covenants in the instruments governing our existing indebtedness could limit our operational and financial flexibility or result in covenant breaches.
Our Credit Facility contains certain financial and operating covenants that limit our financial and operational flexibility. The operating covenants limit our ability to incur secured and unsecured debt, sell all or substantially all of our assets, make restricted payments (including dividends to our stockholders), engage in mergers and consolidations, enter into transactions with affiliates and take certain other actions. In addition, our Credit Facility requires us to meet certain financial covenants, including the maintenance of certain financial ratios (such as specified debt to equity and debt service coverage ratios) as well as the maintenance of a minimum net worth. Additionally, we may be restricted from selling additional properties without amending or repaying our Credit Facility because of requirements in our Credit Facility as to the minimum number of properties in our borrowing base.
The mortgage loans we have, or may in the future enter into, include, and may include, other financial and operating covenants, including transfer restrictions. The mortgages relating to many of the properties we have acquired include restrictions, such as prepayment penalties or assumption fees, that could affect our ability to sell properties or the net proceeds we would realize upon a sale.
These covenants may restrict our ability to pursue certain business initiatives or certain acquisition transactions that would otherwise be in our best interest and adversely affect our ability to complete sales of our assets. In the event that we fail to satisfy our covenants, we would be in default under our unsecured Credit Facility and may be required to repay our indebtedness with capital from other sources. Under such circumstances, other sources of debt or equity capital may not be available to us, or may be available only on unattractive terms.
Our available capacity under our Credit Facility depends on our borrowing base properties.
As of December 31, 2015, the outstanding balance of the term loan and revolving components of our Credit Facility was $305.0 million and $180.0 million, respectively. While the aggregate commitments under the Credit Facility allow for total borrowings of up to $705.0 million with a $305.0 million term loan and a $400.0 million revolving loan and contain an “accordion feature” to allow us, under certain circumstances and to the extent agreed to by our lenders, to increase the aggregate loan borrowings to up to $1.0 billion of total borrowings, the actual availability of borrowings under our Credit Facility for any period is based on requirements outlined in our Credit Facility with respect to the pool of eligible unencumbered assets that comprise our borrowing base properties. The unused borrowing capacity, based on the debt service coverage ratio of the borrowing base properties as of December 31, 2015, was $63.0 million.
All but two of our properties not otherwise subject to mortgage loans collateralize the borrowing base of our Credit Facility and have mortgages recorded for that purpose. If the financial results of the borrowing base properties deteriorate, or if their values decline, the maximum availability under the Credit Facility may decline and we may be required to make mandatory repayments of principal outstanding to avoid a default under the Credit Facility, absent an amendment or waiver. Dispositions of borrowing base properties will have a similar effect.
If we are unable to borrow under our Credit Facility due to a decrease in the available capacity or for any other reason, we may be prevented from acquiring additional properties, funding our working capital needs or our dividends to our stockholders, and other sources of debt or equity capital may not be available to us, or may be available only on unattractive terms. A decrease in the available capacity under our Credit Facility could have an adverse effect on our results of operations.
20
Increases in interest rates could increase the amount of our debt payments and adversely affect our ability to pay dividends to our stockholders.
We have incurred substantial indebtedness, of which $710.0 million outstanding as of December 31, 2015, among other things, bears interest at variable interest rates. We have not entered into any swaps, and have purchased LIBOR caps on only $305.0 million of this variable rate indebtedness, to minimize the impact of increases in interest rates on this variable rate indebtedness. Accordingly, increases in interest rates would increase our interest costs, which could reduce our cash flows and our ability to pay dividends to our stockholders. In addition, if we need to repay existing debt during periods of rising interest rates, we could be required to liquidate one or more of our investments in properties at times that may not permit realization of the maximum return on such investments.
U.S. Federal Income Tax Risks
Our failure to remain qualified as a REIT would subject us to U.S. federal income tax and potentially state and local tax, and would adversely affect our operations.
We have elected to be taxed as a REIT commencing with our taxable year ended December 31, 2010 and intend to operate in a manner that would allow us to continue to qualify as a REIT. However, we may terminate our REIT qualification, if our board of directors determines that not qualifying as a REIT is in our best interests, or inadvertently. Our qualification as a REIT depends upon our satisfaction of certain asset, income, organizational, distribution, stockholder ownership and other requirements on a continuing basis. The REIT qualification requirements are extremely complex and interpretation of the U.S. federal income tax laws governing qualification as a REIT is limited. Furthermore, any opinion of our counsel, including tax counsel, as to our eligibility to qualify or remain qualified as a REIT is not binding on the Internal Revenue Service ( the "IRS") and is not a guarantee that we will qualify, or continue to qualify, as a REIT. Accordingly, we cannot be certain that we will be successful in operating so we can qualify or remain qualified as a REIT. Our ability to satisfy the asset tests depends on our analysis of the characterization and fair market values of our assets, some of which are not susceptible to a precise determination, and for which we will not obtain independent appraisals. Our compliance with the REIT income or quarterly asset requirements also depends on our ability to successfully manage the composition of our income and assets on an ongoing basis. Accordingly, if certain of our operations were to be recharacterized by the IRS, such recharacterization would jeopardize our ability to satisfy all requirements for qualification as a REIT. Furthermore, future legislative, judicial or administrative changes to the U.S. federal income tax laws could be applied retroactively, which could result in our disqualification as a REIT.
If we fail to continue to qualify as a REIT for any taxable year, and we do not qualify for certain statutory relief provisions, we will be subject to U.S. federal income tax on our taxable income at corporate rates. In addition, we would generally be disqualified from treatment as a REIT for the four taxable years following the year of losing our REIT qualification. Losing our REIT qualification would reduce our net earnings available for investment or distribution to stockholders because of the additional tax liability. In addition, dividends to stockholders would no longer qualify for the dividends paid deduction, and we would no longer be required to pay dividends. If this occurs, we might be required to borrow funds or liquidate some investments in order to pay the applicable tax.
Even if we qualify as a REIT, in certain circumstances, we may incur tax liabilities that would reduce our cash available for other purposes.
Even if we qualify and maintain our status as a REIT, we may be subject to U.S. federal, state and local income taxes. For example, net income from the sale of properties that are "dealer" properties sold by a REIT (a "prohibited transaction" under the Code) will be subject to a 100% tax. We may not distribute sufficient dividends to avoid excise taxes applicable to REITs. We also may decide to retain net capital gain we earn from the sale or other disposition of our property and pay U.S. federal income tax directly on such income. In that event, our stockholders would be treated as if they earned that income and paid the tax on it directly. However, stockholders that are tax-exempt, such as charities or qualified pension plans, would have no benefit from their deemed payment of such tax liability unless they file U.S. federal income tax returns and thereon seek a refund of such tax. We also will be subject to corporate tax on any undistributed REIT taxable income. We also may be subject to state and local taxes on our income or property, including franchise, payroll and transfer taxes, either directly or at the level of our OP or at the level of the other companies through which we indirectly own our assets, such as our TRSs, which are subject to full U.S. federal, state, local and foreign corporate-level income taxes. Any taxes we pay directly or indirectly will reduce our cash available for other purposes.
21
To qualify as a REIT we must meet annual distribution requirements, which may force us to forgo otherwise attractive opportunities or borrow funds during unfavorable market conditions. This could delay or hinder our ability to meet our investment objectives.
In order to qualify as a REIT, we must distribute annually to our stockholders at least 90% of our REIT taxable income (which does not equal net income, as calculated in accordance with GAAP), determined without regard to the deduction for dividends paid and excluding net capital gain. We will be subject to U.S. federal income tax on our undistributed REIT taxable income and net capital gain and to a 4% nondeductible excise tax on any amount by which dividends we pay with respect to any calendar year are less than the sum of (a) 85% of our ordinary income, (b) 95% of our capital gain net income and (c) 100% of our undistributed income from prior years. These requirements could cause us to distribute amounts that otherwise would be spent on investments in real estate assets and it is possible that we might be required to borrow funds, possibly at unfavorable rates, or sell assets to fund these distributions. It is possible that we might not always be able to pay distributions sufficient to meet the annual distribution requirements and to avoid U.S. federal income and excise taxes on our earnings while we qualify as a REIT.
Certain of our business activities are potentially subject to the prohibited transaction tax.
For so long as we qualify as a REIT, our ability to dispose of property during the first few years following acquisition may be restricted to a substantial extent as a result of our REIT qualification. Under applicable provisions of the Code regarding prohibited transactions by REITs, while we qualify as a REIT, we will be subject to a 100% penalty tax on any gain recognized on the sale or other disposition of any property (other than foreclosure property) that we own, directly or indirectly through any subsidiary entity, including our OP, but generally excluding TRSs, that is deemed to be inventory or property held primarily for sale to customers in the ordinary course of a trade or business. Whether property is inventory or otherwise held primarily for sale to customers in the ordinary course of a trade or business depends on the particular facts and circumstances surrounding each property. We intend to avoid the 100% prohibited transaction tax by (a) conducting activities that may otherwise be considered prohibited transactions through a TRS (but such TRS would incur corporate rate income taxes with respect to any income or gain recognized by it), (b) conducting our operations in such a manner so that no sale or other disposition of an asset we own, directly or indirectly through any subsidiary, will be treated as a prohibited transaction, or (c) structuring certain dispositions of our properties to comply with the requirements of the prohibited transaction safe harbor available under the Code for properties that, among other requirements, have been held for at least two years. Despite our present intention, no assurance can be given that any particular property we own, directly or through any subsidiary entity, including our OP, but generally excluding TRSs will not be treated as inventory or property held primarily for sale to customers in the ordinary course of a trade or business.
Our TRSs are subject to corporate-level taxes and our dealings with our TRSs may be subject to 100% excise tax.
A REIT may own up to 100% of the stock of one or more TRSs. Both the subsidiary and the REIT must jointly elect to treat the subsidiary as a TRS. A corporation of which a TRS directly or indirectly owns more than 35% of the voting power or value of the stock will automatically be treated as a TRS. Overall, no more than 25% (20% for taxable years beginning after December 31, 2017) of the gross value of a REIT's assets may consist of stock or securities of one or more TRSs.
A TRS may hold assets and earn income that would not be qualifying assets or income if held or earned directly by a REIT, including gross income from operations pursuant to management contracts. We will lease any "qualified lodging facilities" we own to one or more TRSs which in turn contract with independent third-party hotel management companies to operate such "qualified lodging facilities" on behalf of such TRSs. We may use our TRSs generally for other activities as well, such as to hold properties for sale in the ordinary course of a trade or business or to hold assets or conduct activities that we cannot conduct directly as a REIT. A TRS will be subject to applicable U.S. federal, state, local and foreign income tax on its taxable income. In addition, the rules, which are applicable to us as a REIT, also impose a 100% excise tax on certain transactions between a TRS and its parent REIT that are not conducted on an arm's-length basis.
If our leases to our TRSs are not respected as true leases for U.S. federal income tax purposes, we would fail to qualify as a REIT.
To qualify as a REIT, we must satisfy two gross income tests, under which specified percentages of our gross income must be derived from certain sources, such as "rents from real property." In order for rent to qualify as "rents from real property" for purposes of the REIT gross income tests, the leases must be respected as true leases for U.S. federal income tax purposes and not be treated as service contracts, joint ventures or some other type of arrangement. If our leases are not respected as true leases for U.S. federal income tax purposes, we would fail to qualify as a REIT.
22
If our OP failed to qualify as a partnership or is not otherwise disregarded for U.S. federal income tax purposes, we would cease to qualify as a REIT.
We intend to maintain the status of our OP as a partnership or a disregarded entity for U.S. federal income tax purposes. However, if the IRS were to successfully challenge the status of our OP as a partnership or disregarded entity for such purposes, it would be taxable as a corporation. In such event, this would reduce the amount of distributions that our OP could make to us. This also would result in our failing to qualify as a REIT, and becoming subject to a corporate level tax on our income. This substantially would reduce our cash available to pay dividends and the yield on an investment in our common stock. In addition, if any of the partnerships or limited liability companies through which our OP owns its properties, in whole or in part, loses its characterization as a partnership and is otherwise not disregarded for U.S. federal income tax purposes, it would be subject to taxation as a corporation, thereby reducing distributions to the OP. Such a recharacterization of an underlying property owner could also threaten our ability to maintain our REIT qualification.
We may choose to pay dividends in our own stock, in which case the stockholder may be required to pay U.S. federal income taxes in excess of the cash dividends received by them.
In connection with our qualification as a REIT, we are required to distribute annually to our stockholders at least 90% of our REIT taxable income (which does not equal net income, as calculated in accordance with GAAP), determined without regard to the deduction for dividends paid and excluding net capital gain. In order to satisfy this requirement, we may pay dividends that are payable in cash and/or shares of our common stock (which could account for up to 80% of the aggregate amount of such dividends) at the election of each stockholder. Taxable stockholders receiving such dividends will be required to include the full amount of such dividends as ordinary dividend income to the extent of our current or accumulated earnings and profits, as determined for U.S. federal income tax purposes. As a result, U.S. stockholders may be required to pay U.S. federal income taxes with respect to such dividends in excess of the cash portion of the dividend received. Accordingly, U.S. stockholders receiving a dividend of our shares may be required to sell shares received in such dividend or may be required to sell other stock or assets owned by them, at a time that may be disadvantageous, in order to satisfy any tax imposed on such dividend. If a U.S. stockholder sells the stock that it receives as part of the dividend in order to pay this tax, the sales proceeds may be less than the amount included in income with respect to the dividend, depending on the market price of our stock at the time of the sale. Furthermore, with respect to certain non-U.S. stockholders, we may be required to withhold U.S. tax with respect to such dividend, including in respect of all or a portion of such dividend that is payable in stock, by withholding or disposing of part of the shares included in such dividend and using the proceeds of such disposition to satisfy the withholding tax imposed.
Various tax aspects of such a taxable cash/stock dividend are uncertain and have not yet been addressed by the IRS. No assurance can be given that the IRS will not impose requirements in the future with respect to taxable cash/stock dividends, including on a retroactive basis, or assert that the requirements for such taxable cash/stock dividends have not been met.
The taxation of amounts paid to our stockholders may be taxable as ordinary income, which may reduce the anticipated return from an investment in our common stock.
Amounts that we pay to our stockholders generally referred to herein as "dividends" will generally be taxable as ordinary income if paid out of current and accumulated earnings and profits (and not designated as capital gain dividends or qualified dividend income). However, a portion of amounts paid to our stockholders may (1) be designated by us as capital gain dividends generally taxable as long-term capital gain to the extent that they are attributable to net capital gain recognized by us, (2) be designated by us as qualified dividend income generally to the extent they are attributable to dividends we receive from our TRSs, or (3) constitute a return of capital generally to the extent that the payment exceeds our accumulated earnings and profits as determined for U.S. federal income tax purposes. A return of capital is not taxable, but has the effect of reducing the basis of a stockholder's investment in our common stock.
Dividends payable by REITs generally do not qualify for the reduced tax rates available for some dividends.
Currently, the maximum tax rate applicable to qualified dividend income payable to U.S. stockholders that are individuals, trusts and estates is 20%. Dividends payable by REITs, however, generally are not eligible for this reduced rate. Although this does not adversely affect the taxation of REITs or dividends payable by REITs, the more favorable rates applicable to regular corporate qualified dividends could cause investors who are individuals, trusts and estates to perceive investments in REITs to be relatively less attractive than investments in the stocks of non-REIT corporations that pay dividends, which could adversely affect the value of the shares of REITs, including our common stock. Tax rates could be changed in future legislation.
23
Complying with REIT requirements may limit our ability to hedge our liabilities effectively and may cause us to incur tax liabilities.
The REIT provisions of the Code may limit our ability to hedge our liabilities. Any income from a hedging transaction we enter into to manage risk of interest rate changes, price changes or currency fluctuations with respect to borrowings made or to be made to acquire or carry real estate assets or in certain cases to hedge previously acquired hedges entered into to manage risks associated with property that has been disposed of or liabilities that have been extinguished, if properly identified under applicable Treasury Regulations, does not constitute "gross income" for purposes of the 75% or 95% gross income tests. To the extent that we enter into other types of hedging transactions, the income from those transactions will likely be treated as non-qualifying income for purposes of both of the gross income tests. As a result of these rules, we may need to limit our use of advantageous hedging techniques or implement those hedges through a TRS. This could increase the cost of our hedging activities because our TRSs would be subject to tax on gains or expose us to greater risks associated with changes in interest rates than we would otherwise want to bear. In addition, losses in a TRS generally will not provide any tax benefit, except for being carried forward against future taxable income of such TRS.
Complying with REIT requirements may force us to forego and/or liquidate otherwise attractive investment opportunities.
To qualify as a REIT, we must ensure that we meet the REIT gross income tests annually and that at the end of each calendar quarter, at least 75% of the value of our assets consists of cash, cash items, government securities and qualified REIT real estate assets, including certain mortgage loans and certain kinds of mortgage-related securities. The remainder of our investment in securities (other than government securities and qualified real estate assets) generally cannot include more than 10% of the outstanding voting securities of any one issuer or more than 10% of the total value of the outstanding securities of any one issuer. In addition, in general, no more than 5% of the value of our assets can consist of the securities of any one issuer (other than government securities and qualified real estate assets) and no more than 25% (20% for taxable years beginning after December 31, 2017) of the value of our total assets can be represented by securities of one or more TRSs. If we fail to comply with these requirements at the end of any calendar quarter, we must correct the failure within 30 days after the end of the calendar quarter or qualify for certain statutory relief provisions to avoid losing our REIT qualification and suffering adverse tax consequences. As a result, we may be required to liquidate assets from our portfolio or not make otherwise attractive investments in order to maintain our qualification as a REIT. These actions could have the effect of reducing our income and amounts available for distribution to our stockholders.
The ability of our board of directors to revoke our REIT qualification without stockholder approval may subject us to U.S. federal income tax and reduce dividends to our stockholders.
Our charter provides that our board of directors may revoke or otherwise terminate our REIT election, without the approval of our stockholders, if it determines that it is no longer in our best interest to continue to qualify as a REIT. While we have elected to be taxed as a REIT, we may terminate our REIT election if we determine that qualifying as a REIT is no longer in our best interests. If we cease to be a REIT, we would become subject to U.S. federal income tax on our taxable income and would no longer be required to distribute most of our taxable income to our stockholders.
We may be subject to adverse legislative or regulatory tax changes that could increase our tax liability, reduce our operating flexibility and reduce the market price of our common stock.
In recent years, numerous legislative, judicial and administrative changes have been made in the provisions of U.S. federal income tax laws applicable to investments similar to an investment in shares of our common stock. Additional changes to the tax laws are likely to continue to occur, and there can be no assurance that any such changes will not adversely affect the taxation of a stockholder. Any such changes could have an adverse effect on an investment in our shares or on the market value or the resale potential of our assets. Stockholders are urged to consult with their tax advisor with respect to the impact of recent legislation on their investment in our shares and the status of legislative, regulatory or administrative developments and proposals and their potential effect on an investment in our shares.
Although REITs generally receive better tax treatment than entities taxed as regular corporations, it is possible that future legislation would result in a REIT having fewer tax advantages, and it could become more advantageous for a company that invests in real estate to elect to be treated for U.S. federal income tax purposes as a corporation. As a result, our charter provides our board of directors with the power, under certain circumstances, to revoke or otherwise terminate our REIT election and cause us to be taxed as a regular corporation, without the vote of our stockholders. Our board of directors has fiduciary duties to us and our stockholders and could only cause such changes in our tax treatment if it determines in good faith that such changes are in the best interest of our stockholders.
24
The share ownership restrictions of the Code for REITs and the 9.8% share ownership limit in our charter may inhibit market activity in our shares of stock and restrict our business combination opportunities.
In order to qualify as a REIT, five or fewer individuals, as defined in the Code, may not own, actually or constructively, more than 50% in value of our issued and outstanding shares of stock at any time during the last half of each taxable year, other than the first year for which a REIT election is made. Attribution rules in the Code determine if any individual or entity actually or constructively owns our shares of stock under this requirement. Additionally, at least 100 persons must beneficially own our shares of stock during at least 335 days of a taxable year for each taxable year, other than the first year for which a REIT election is made. To help ensure that we meet these tests, among other purposes, our charter restricts the acquisition and ownership of our shares of stock.
Our charter, with certain exceptions, authorizes our directors to take such actions as are necessary and desirable to preserve our qualification as a REIT while we so qualify. Unless exempted by our board of directors, for so long as we qualify as a REIT, our charter prohibits, among other limitations on ownership and transfer of shares of our stock, any person from beneficially or constructively owning (applying certain attribution rules under the Code) more than 9.8% in value of the aggregate of our outstanding shares of stock and more than 9.8% (in value or in number of shares, whichever is more restrictive) of any class or series of our shares of stock. Our board of directors may not grant an exemption from these restrictions to any proposed transferee whose ownership in excess of the 9.8% ownership limit would result in the termination of our qualification as a REIT. These restrictions on transferability and ownership will not apply, however, if our board of directors determines that it is no longer in our best interest to continue to qualify as a REIT or that compliance with the restrictions is no longer required in order for us to continue to qualify as a REIT.
These ownership limits could delay or prevent a transaction or a change in control that might involve a premium price for our common stock or otherwise be in the best interest of the stockholders.
Recharacterization of sale-leaseback transactions may cause us to lose our REIT status.
If we enter into sale-leaseback transactions, we will use commercially reasonable efforts to structure any such sale- leaseback transaction such that the lease will be characterized as a "true lease" for tax purposes, thereby allowing us to be treated as the owner of the property for U.S. federal income tax purposes. The IRS may, however, challenge the characterization. In the event that any sale-leaseback transaction is challenged and recharacterized as a financing transaction or loan for U.S. federal income tax purposes, deductions for depreciation and cost recovery relating to the property would be disallowed. If a sale-leaseback transaction were so recharacterized, we might fail to satisfy the REIT qualification "asset tests" or "income tests" and, consequently, lose our REIT status effective with the year of recharacterization. Alternatively, the amount of our REIT taxable income could be recalculated which might also cause us to fail to meet the distribution requirement for a taxable year.
Non-U.S. stockholders will be subject to U.S. federal withholding tax and may be subject to U.S. federal income tax on dividends received from us and upon the disposition of our shares.
Subject to certain exceptions, amounts paid by us to our stockholders will be treated as dividends of ordinary income to the extent of our current or accumulated earnings and profits. These dividends ordinarily will be subject to U.S. withholding tax at a 30% rate, or such lower rate as may be specified by an applicable income tax treaty, unless the dividends are treated as "effectively connected" with the conduct by the non-U.S. stockholder of a U.S. trade or business. Pursuant to the Foreign Investment in Real Property Tax Act of 1980 ("FIRPTA") capital gain dividends attributable to sales or exchanges of "U.S. real property interests" ("USRPIs") generally will be taxed to a non-U.S. stockholder (other than a qualified pension plan, entities wholly owned by a qualified pension plan and certain foreign publicly traded entities) as if such gain were effectively connected with a U.S. trade or business. However, a capital gain dividend will not be treated as effectively connected income if (a) the dividend is received with respect to a class of stock that is regularly traded on an established securities market located in the United States and (b) the non-U.S. stockholder does not own more than 10% of the class of our stock at any time during the one- year period ending on the date the dividend is received.
Gain recognized by a non-U.S. stockholder upon the sale or exchange of our common stock generally will not be subject to U.S. federal income taxation unless such stock constitutes a USRPI under FIRPTA. Our common stock will not constitute a USRPI so long as we are a "domestically-controlled qualified investment entity". A domestically-controlled qualified investment entity includes a REIT if at all times during a specified testing period, less than 50% in value of such REIT's stock is held directly or indirectly by non-U.S. stockholders. We believe, but cannot assure you, that we will be a domestically- controlled qualified investment entity.
Even if we do not qualify as a domestically-controlled qualified investment entity at the time a non-U.S. stockholder sells or exchanges our common stock, gain arising from such a sale or exchange would not be subject to U.S. taxation under FIRPTA as a sale of a USRPI if (a) our common stock is "regularly traded," as defined by applicable Treasury regulations, on an established securities market, and (b) such non-U.S. stockholder owned, actually and constructively, 10% or less of our common stock at any time during the five-year period ending on the date of the sale.
25
Potential characterization of dividends or gain on sale may be treated as unrelated business taxable income to tax- exempt investors.
If (a) we are a "pension-held REIT," (b) a tax-exempt stockholder has incurred (or is deemed to have incurred) debt to purchase or hold our common stock, or (c) a holder of common stock is a certain type of tax-exempt stockholder, dividends on, and gains recognized on the sale of, common stock by such tax-exempt stockholder may be subject to U.S. federal income tax as unrelated business taxable income under the Code.
Item 1B. Unresolved Staff Comments.
Not applicable.
26
Item 2. Properties
General
As of December 31, 2015, we owned 22 properties located in the New York MSA. The following table presents certain additional information about the properties we owned at December 31, 2015, including our pro rata share of our investment in Worldwide Plaza:
Property | Ownership | Rentable Square Feet(1) | Percent Occupied(2) | Annualized Cash Rent (in thousands)(3) | Annualized Cash Rent Per Square Foot | Number of Leases | |||||||||||||
Manhattan Office Properties - Office | |||||||||||||||||||
Design Center | 100.0% | 81,082 | 100.0 | % | $ | 4,130 | $ | 50.94 | 17 | ||||||||||
416 Washington Street | 100.0% | 1,565 | 100.0 | % | 58 | 37.10 | 1 | ||||||||||||
256 West 38th Street | 100.0% | 89,763 | 66.7 | % | 2,418 | 40.38 | 9 | ||||||||||||
229 West 36th Street | 100.0% | 129,436 | 90.3 | % | 5,179 | 44.33 | 7 | ||||||||||||
218 West 18th Street | 100.0% | 165,670 | 100.0 | % | 9,337 | 56.36 | 7 | ||||||||||||
50 Varick Street | 100.0% | 158,574 | 100.0 | % | 7,623 | 48.07 | 1 | ||||||||||||
333 West 34th Street | 100.0% | 317,040 | 100.0 | % | 14,402 | 45.43 | 3 | ||||||||||||
1440 Broadway | 100.0% | 711,800 | 84.7 | % | 32,854 | 54.47 | 11 | ||||||||||||
One Worldwide Plaza | 48.9% | 878,614 | 100.0 | % | 58,485 | 66.57 | 9 | ||||||||||||
245-249 West 17th Street | 100.0% | 214,666 | 100.0 | % | 14,842 | 69.14 | 1 | ||||||||||||
Manhattan Office Properties - Office Total | 2,748,210 | 94.5 | % | 149,328 | 57.50 | 66 | |||||||||||||
Manhattan Office Properties - Retail | |||||||||||||||||||
256 West 38th Street | 100.0% | 27,280 | 100.0 | % | 1,179 | 43.22 | 3 | ||||||||||||
229 West 36th Street | 100.0% | 20,132 | 100.0 | % | 1,012 | 50.28 | 1 | ||||||||||||
333 West 34th Street | 100.0% | 29,688 | 100.0 | % | 1,446 | 48.72 | 1 | ||||||||||||
1440 Broadway | 100.0% | 37,619 | 95.5 | % | 5,004 | 139.27 | 7 | ||||||||||||
One Worldwide Plaza | 48.9% | 123,213 | 100.0 | % | 5,009 | 40.65 | 20 | ||||||||||||
245-249 West 17th Street | 100.0% | 66,628 | 100.0 | % | 5,552 | 83.33 | 3 | ||||||||||||
Manhattan Office Properties - Retail Total | 304,560 | 99.4 | % | 19,202 | 63.40 | 35 | |||||||||||||
Sub-Total/Weighted Average Manhattan Office Properties - Office and Retail | 3,052,770 | 95.0 | % | 168,530 | 58.12 | 101 | |||||||||||||
Manhattan Stand Alone Retail | |||||||||||||||||||
367-387 Bleecker Street | 100.0% | 9,724 | 100.0 | % | 2,733 | 281.02 | 5 | ||||||||||||
33 West 56th Street (garage) | 100.0% | 12,856 | 100.0 | % | 460 | 35.81 | 1 | ||||||||||||
416 Washington Street | 100.0% | 7,436 | 100.0 | % | 469 | 63.12 | 2 | ||||||||||||
One Jackson Square | 100.0% | 8,392 | 100.0 | % | 1,676 | 199.72 | 4 | ||||||||||||
350 West 42nd Street | 100.0% | 42,774 | 100.0 | % | 1,769 | 41.36 | 4 | ||||||||||||
350 Bleecker Street | 100.0% | 14,511 | 84.6 | % | 733 | 59.68 | 2 | ||||||||||||
Sub-Total/Weighted Average Manhattan Stand Alone Retail | 95,693 | 97.7 | % | 7,840 | 83.89 | 18 | |||||||||||||
Outer-Borough Properties | |||||||||||||||||||
Foot Locker(4) | 100.0% | 6,118 | 100.0 | % | 497 | 81.14 | 1 | ||||||||||||
Duane Reade(4) | 100.0% | 9,767 | 100.0 | % | 1,094 | 112.02 | 1 | ||||||||||||
1100 Kings Highway | 100.0% | 61,318 | 100.0 | % | 2,807 | 45.78 | 5 | ||||||||||||
1623 Kings Highway(4) | 100.0% | 19,960 | 100.0 | % | 1,132 | 56.71 | 3 | ||||||||||||
Sub-Total/Weighted Average Outer-Borough Properties | 97,163 | 100.0 | % | 5,530 | 56.91 | 10 | |||||||||||||
Portfolio Total | 3,245,626 | 95.2 | % | $ | 181,900 | $ | 58.86 | 129 | |||||||||||
__________________
(1) | Does not include 128,612 square feet at the Viceroy Hotel, antenna leases at Worldwide Plaza or 15,055 square feet at the garage at 416 Washington Street, which is being operated under a management contract with a third party. |
(2) | Inclusive of leases signed but not yet commenced. |
(3) | Cash rent at the end of the reporting period, including operating expense reimbursements, excluding electric. Real estate tax reimbursements are typically multiplied by two because they are paid semi-annually. Free rent periods are excluded from annualized cash rent. |
27
(4) | Held for sale as of December 31, 2015. In November 2015, we entered into agreements to sell Duane Reade and 1623 Kings Highway. In December 2015, we entered into an agreement to sell Foot Locker. The sales of Duane Reade and 1623 Kings Highway were completed in February 2016. See Item 7. Management's Discussion and Analysis of Financial Condition and Results of Operations — Subsequent Events. |
Future Minimum Lease Payments
The following table presents future minimum base rent payments, on a cash basis, due to us over the next ten years and thereafter at the properties we owned as of December 31, 2015, excluding Worldwide Plaza. These amounts exclude contingent rental payments, as applicable, that may be collected from certain tenants based on provisions related to sales thresholds and increases in annual rent based on exceeding certain economic indexes among other items.
(In thousands) | Future Minimum Base Rent Payments | |||
2016 | $ | 104,174 | ||
2017 | 106,823 | |||
2018 | 104,931 | |||
2019 | 96,911 | |||
2020 | 97,330 | |||
2021 | 95,970 | |||
2022 | 90,556 | |||
2023 | 86,331 | |||
2024 | 74,583 | |||
2025 | 48,439 | |||
Thereafter | 166,473 | |||
Total | $ | 1,072,521 | ||
Future Lease Expirations Table
The following is a summary of lease expirations for the next ten years at the properties we owned as of December 31, 2015, including our pro rata share of Worldwide Plaza:
Year of Expiration | Number of Leases Expiring | Expiring Annualized Cash Rent(1) | Expiring Annualized Cash Rent as a Percentage of the Total Portfolio(1) | Leased Rentable Square Feet(2) | Percent of Portfolio Leased Rentable Square Feet Expiring | ||||||||||
(In thousands) | |||||||||||||||
2016 | 10 | $ | 6,488 | 3 | % | 102,541 | 3 | % | |||||||
2017 | 17 | 7,296 | 3 | % | 106,379 | 3 | % | ||||||||
2018 | 17 | 9,440 | 4 | % | 159,320 | 5 | % | ||||||||
2019 | 6 | 1,238 | 1 | % | 32,077 | 1 | % | ||||||||
2020 | 8 | 6,153 | 3 | % | 83,945 | 2 | % | ||||||||
2021 | 10 | 6,469 | 3 | % | 155,631 | 5 | % | ||||||||
2022 | 16 | 11,839 | 6 | % | 198,477 | 6 | % | ||||||||
2023 | 3 | 3,894 | 2 | % | 58,632 | 2 | % | ||||||||
2024 | 12 | 49,352 | 23 | % | 613,731 | 18 | % | ||||||||
2025 | 9 | 34,476 | 16 | % | 420,328 | 12 | % | ||||||||
Total | 108 | $ | 136,645 | 64 | % | 1,931,061 | 57 | % | |||||||
_________________
(1) | Expiring annualized cash rent represents contractual cash base rents at the time of lease expiration added to current reimbursements from tenants, excluding electric reimbursements and free rent. |
(2) | Excludes 122,896 square feet of the Viceroy Hotel (which excludes space leased to the hotel restaurant tenant). Total vacant square footage at December 31, 2015 was 155,087 square feet. |
28
Tenant Concentration
The following table lists the tenant whose rented square footage is greater than 10% of the total portfolio rentable square footage as of December 31, 2015:
Tenant | Rented Square Feet(1) | Rented Square Feet as a % of Total Portfolio | Lease Expiration | Remaining Lease Term(2) | Renewal Options | Annualized Cash Rent(1) (3) | ||||||||||
(In thousands) | ||||||||||||||||
Nomura Holdings America, Inc. | 400,934 | 11.9% | Sep. 2033 | 17.8 | (4) | $ | 19,330 | |||||||||
________________________________
(1) | Rentable square feet and annualized cash rent reflect our 48.9% pro rata share of Worldwide Plaza. |
(2) | Remaining lease term in years as of December 31, 2015. |
(3) | Annualized cash rent as of December 31, 2015 includes operating expense reimbursements, excluding electric charges and free rent. |
(4) | Nomura Holdings America, Inc. has up to four options to renew its lease. The first two options are for renewal terms of five or ten years each and the second two options are for five years each. In total, the renewal options allow for a maximum of 20 years of extended term. |
Significant Portfolio Properties
The rentable square feet or annualized cash rent of Worldwide Plaza and the properties located at 1440 Broadway, 333 West 34th Street and 245-249 West 17th Street represent a significant portion of our total portfolio. The tenant concentrations of Worldwide Plaza and the properties located at 1440 Broadway, 333 West 34th Street and 245-249 West 17th Street are summarized below:
Worldwide Plaza
The following table lists tenants at Worldwide Plaza whose rented square footage or annualized cash rent is greater than 10% of the total rentable square footage or annualized cash rent of Worldwide Plaza as of December 31, 2015:
Tenant | Rented Square Feet(1) | Rented Square Feet as a % of Total Worldwide Plaza | Lease Expiration | Remaining Lease Term(2) | Renewal Options | Annualized Cash Rent(1) (3) | |||||||||
(In thousands) | |||||||||||||||
Nomura Holdings America, Inc. | 400,934 | 40.0% | Sep. 2033 | 17.8 | (4) | $ | 19,330 | ||||||||
Cravath Swaine & Moore, LLP | 301,779 | 30.1% | Aug. 2024 | 8.7 | None | $ | 29,273 | ||||||||
_____________________________
(1) | Rented square feet and annualized cash rent reflect our 48.9% pro rata share of the building. |
(2) | Remaining lease term in years as of December 31, 2015. |
(3) | Annualized cash rent as of December 31, 2015 includes operating expense reimbursements, excluding electric charges and free rent. |
(4) | Nomura Holdings America, Inc. has up to four options to renew its lease. The first two options are for renewal terms of five or ten years each and the second two options are for five years each. In total, the renewal options allow for a maximum of 20 years of extended term. |
29
1440 Broadway
The following table lists tenants at 1440 Broadway whose rented square footage is greater than 10% of the total rentable square footage of 1440 Broadway as of December 31, 2015:
Tenant | Rented Square Feet | Rented Square Feet as a % of Total 1440 Broadway | Lease Expiration | Remaining Lease Term(1) | Renewal Options | Annualized Cash Rent(2) | |||||||||
(In thousands) | |||||||||||||||
Macy's Inc. | 203,196 | 27.1% | Jan. 2024 | 8.1 | None | $ | 11,064 | ||||||||
Ford Foundation | 104,525 | 13.9% | Dec. 2018 | 3.0 | None | $ | 6,481 | ||||||||
_____________________________
(1) | Remaining lease term in years as of December 31, 2015. |
(2) | Annualized cash rent as of December 31, 2015 includes operating expense reimbursements, excluding electric charges and free rent. |
333 West 34th Street
The following table lists tenants at 333 West 34th Street whose rented square footage is greater than 10% of the total rentable square footage of 333 West 34th Street as of December 31, 2015:
Tenant | Rented Square Feet | Rented Square Feet as a % of Total 333 West 34th Street | Lease Expiration | Remaining Lease Term(1) | Renewal Options | Annualized Cash Rent(2) | |||||||||
(In thousands) | |||||||||||||||
The Segal Company (Eastern States) Inc. | 144,307 | (3) | 41.6% | Feb. 2025 | 9.2 | None | $ | 8,701 | |||||||
Metropolitan Transportation Authority (MTA) | 130,443 | (4) | 37.6% | Jan. 2021 | (5) | 5.1 | None | $ | 4,079 | ||||||
Godiva Chocolatier, Inc. | 42,290 | 12.2% | Feb. 2027 | 11.2 | None | $ | 1,621 | ||||||||
_____________________________
(1) | Remaining lease term in years as of December 31, 2015. |
(2) | Annualized cash rent as of December 31, 2015 includes operating expense reimbursements, excluding electric charges and free rent. |
(3) | The Metropolitan Transportation Authority (MTA) is contractually obligated to surrender 17,503 rentable square feet of the 5th floor to The Segal Company (Eastern States), Inc. by December 31, 2016. |
(4) | Includes 17,503 rentable square feet to be surrendered to the Segal Company (Eastern States), Inc. in 2016. |
(5) | Early termination at the tenant's option available at any time in exchange for a termination payment. |
30
245-249 West 17th Street
The following table lists tenants at 245-249 West 17th Street whose rented square footage is greater than 10% of the total rentable square footage of 245-249 West 17th Street as of December 31, 2015:
Tenant | Rented Square Feet | Rented Square Feet as a % of Total 245-249 West 17th Street | Lease Expiration | Remaining Lease Term(1) | Renewal Options | Annualized Cash Rent(2) | |||||||||
(In thousands) | |||||||||||||||
Twitter, Inc. | 214,666 | 76.3% | Apr. 2025 | 9.3 | 2 - 5 year | $ | 14,842 | ||||||||
Room & Board, Inc. | 60,161 | 21.4% | Oct. 2034 | 18.8 | 1 - 5 year | $ | 4,658 | ||||||||
_____________________________
(1) | Remaining lease term in years as of December 31, 2015. |
(2) | Annualized cash rent as of December 31, 2015 includes operating expense reimbursements, excluding electric charges and free rent. |
Property Financing
Our mortgage notes payable, excluding our share of the mortgage note payable encumbering Worldwide Plaza, as of December 31, 2015 consist of the following:
Outstanding Loan Amount | |||||||||||||
Portfolio | Encumbered Properties | December 31, 2015 | Effective Interest Rate | Interest Rate | Maturity | ||||||||
(In thousands) | |||||||||||||
Design Center | 1 | $ | 19,798 | 4.4 | % | Fixed | Dec. 2021 | ||||||
Foot Locker | 1 | 3,250 | 4.6 | % | Fixed | Jun. 2016 | |||||||
Duane Reade(2) | 1 | 8,400 | 3.6 | % | Fixed | Nov. 2016 | |||||||
1100 Kings Highway | 1 | 20,200 | 3.4 | % | (1) | Fixed | Aug. 2017 | ||||||
1623 Kings Highway(2) | 1 | 7,288 | 3.3 | % | (1) | Fixed | Nov. 2017 | ||||||
256 West 38th Street | 1 | 24,500 | 3.1 | % | (1) | Fixed | Dec. 2017 | ||||||
1440 Broadway(5) | 1 | 305,000 | 3.9 | % | (3) | Variable | Oct. 2019 | ||||||
7 | $ | 388,436 | 3.8 | % | (4) | ||||||||
______________________
(1) | Fixed through an interest rate swap agreement. |
(2) | Subsequent to December 31, 2015, we repaid the mortgages securing Duane Reade and 1623 Kings Highway as a result of the sale of the properties. |
(3) | LIBOR portion is capped through an interest rate cap agreement. |
(4) | Calculated on a weighted average basis for all mortgages outstanding as of December 31, 2015. |
(5) | Total commitments of $325.0 million; additional $20.0 million available, subject to lender approval, to fund certain tenant allowances, capital expenditures and leasing costs. |
Our remaining properties, with the exception of 367-369 Bleecker Street and 387 Bleecker Street (which excludes 382-384 Bleecker Street), that are not subject to mortgage loans collateralize the borrowing base of our Credit Facility and have mortgages recorded for that purpose.
Item 3. Legal Proceedings.
The information related to litigation and regulatory matters contained in “Note 13 — Commitments and Contingencies” of our notes to the consolidated financial statements included in this Annual Report on Form 10-K is incorporated by reference into this Item 3. Except as set forth therein, as of the end of the period covered by this Annual Report on Form 10-K, we are not a party to, and none of our properties are subject to, any material pending legal proceedings.
Item 4. Mine Safety Disclosure.
Not applicable.
31
PART II
Item 5. Market for Registrant's Common Equity, Related Stockholder Matters and Issuer Purchases of Equity Securities.
Our common stock is currently traded on the New York Stock Exchange ("NYSE") under the symbol "NYRT." Set forth below is a line graph comparing the cumulative total stockholder return on our common stock, based on the closing market price of the common stock and reinvested dividends, with the FTSE National Association of Real Estate Investment Trusts ("NAREIT") Equity Index and the New York Stock Exchange Index ("NYSE Index") for the period commencing April 15, 2014, the date on which we listed our shares on the NYSE and ending December 31, 2015. The graph assumes an investment of $100 on April 15, 2014.
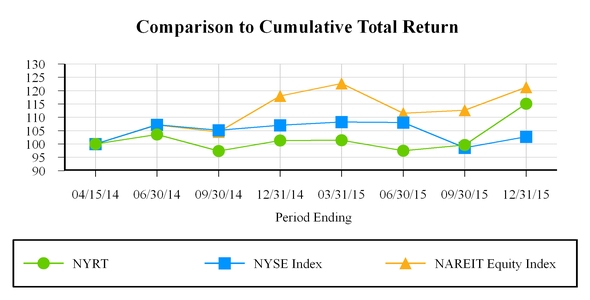
For each calendar quarter indicated, the following table reflects high and low sales prices for the common stock as reported by the NYSE and the amounts paid to our stockholders in respect of these shares to which we refer as "dividends."
First Quarter | Second Quarter | Third Quarter | Fourth Quarter | |||||||||||||
2015: | ||||||||||||||||
High | $ | 10.85 | $ | 10.61 | $ | 10.44 | $ | 11.90 | ||||||||
Low | $ | 9.82 | $ | 8.87 | $ | 9.39 | $ | 10.28 | ||||||||
Dividends paid per share | $ | 0.115 | $ | 0.115 | $ | 0.115 | $ | 0.115 | ||||||||
2014: | ||||||||||||||||
High | N/A | $ | 12.32 | $ | 11.05 | $ | 11.41 | |||||||||
Low | N/A | $ | 9.51 | $ | 9.87 | $ | 10.22 | |||||||||
Dividends paid per share | $ | 0.149 | $ | 0.130 | $ | 0.115 | $ | 0.115 | ||||||||
Holders
As of February 12, 2016, we had 165.0 million shares of common stock outstanding held by a total of 1,104 stockholders of record.
32
Dividends
We have elected to qualify as a REIT commencing with our taxable year ended December 31, 2010. As a REIT, we are required to distribute annually at least 90% of our REIT taxable income to our stockholders, determined without regard for the deduction for dividends paid and excluding net capital gains. The amount actually paid to our stockholders is determined by our board of directors and is dependent on a number of factors, including the amount of funds available, financial condition, capital expenditure requirements, the restricted payments covenant in our Credit Facility with Capital One, as applicable, and annual distribution requirements needed to qualify and maintain our status as a REIT under the Code. During the year ended December 31, 2015, we were in compliance with this covenant.
From December 2010 to April 2014, our board of directors approved and we declared and paid monthly dividends at an annualized rate equal to $0.605 per share of common stock to stockholders of record at the close of business each day during the applicable period at a per share rate of $0.0016575342 per day. In April 2014, our board of directors approved a change in this rate and we began paying monthly dividends at an annualized rate equal to $0.46 per share of common stock, beginning with the April 2014 payment. Our board of directors may reduce the amount of dividends or distributions paid or suspend payments at any time. Dividend payments are made to stockholders of record at the close of business on the 8th day of each month, and paid on the 15th day of such month. Future dividend payments are dependent on the availability of funds.
The following table details, from a U.S. federal income tax perspective, the portion of amounts paid to stockholders treated as a return of capital and capital gain dividends per share per annum for the years ended December 31, 2015 and 2014:
Year Ended December 31, | ||||||||||||||
2015 | 2014 | |||||||||||||
Return of capital | $ | 0.45 | 98.0 | % | $ | 0.51 | 100.0 | % | ||||||
Capital gain dividends | 0.01 | 2.0 | % | — | — | % | ||||||||
Total | $ | 0.46 | 100.0 | % | $ | 0.51 | 100.0 | % | ||||||
The following table reflects dividends and distributions paid in cash and reinvested through the DRIP to common stockholders as well as dividends and distributions on unvested restricted stock, LTIP units, OP units and Class B units, during the years ended December 31, 2015 and 2014:
(In thousands) | Total Dividends Paid | Total Dividends Declared | ||||||
2015: | ||||||||
1st Quarter 2015 | $ | 19,247 | $ | 19,244 | ||||
2nd Quarter 2015 | 19,419 | 19,452 | ||||||
3rd Quarter 2015 | 19,332 | 19,307 | ||||||
4th Quarter 2015(1) | 19,312 | 19,314 | ||||||
Total 2015 | $ | 77,310 | $ | 77,317 | ||||
2014: | ||||||||
1st Quarter 2014 | $ | 25,950 | $ | 26,165 | ||||
2nd Quarter 2014 | 22,104 | 13,074 | ||||||
3rd Quarter 2014 | 18,950 | 18,967 | ||||||
4th Quarter 2014 | 19,031 | 19,016 | ||||||
Total 2014 | $ | 86,035 | $ | 77,222 | ||||
_________________
(1) | Excludes distributions paid to our non-controlling partner in 163 Washington Avenue as a result of the sale of the property in October 2015. |
33
During 2015, our dividends were paid from a combination of cash available from our operations, proceeds from the redemption of our preferred equity investment and distributions in respect of our interest in Worldwide Plaza. During 2016, we do not expect to have sufficient cash flow from operations to pay dividends at our current rate. We expect to be able to pay dividends from a combination of cash flow from operations and cash on hand. Actual cash available for dividends may vary substantially from our estimates. If our cash flow from operations and cash on hand are not sufficient, we may need to borrow funds, potentially at higher rates, or depend on our Advisor or our Property Manager to waive fees or reimbursement of certain expenses, which they are not required to do, to fund our operations and any dividends to our stockholders. There is no assurance that we will be able to obtain funds from such sources, or pay or maintain our current level of dividends. See Item 7. Management's Discussion and Analysis of Financial Condition and Results of Operations — Dividends.
Recent Sales of Unregistered Securities
We did not sell any equity securities that were not registered under the Securities Act during the year ended December 31, 2015 except with respect to which information has been included in a Quarterly Report on Form 10-Q or in a Current Report on Form 8-K.
Purchases of Equity Securities by the Issuer and Affiliated Purchasers
We did not repurchase any shares of our common stock during the year ended December 31, 2015.
Item 6. Selected Financial Data.
The following selected financial data as of December 31, 2015, 2014, 2013, 2012 and 2011 and for the years ended December 31, 2015, 2014, 2013, 2012 and 2011 should be read in conjunction with the accompanying consolidated financial statements and related notes thereto and "Item 7. Management's Discussion and Analysis of Financial Condition and Results of Operations" below:
December 31, | ||||||||||||||||||||
Balance sheet data (In thousands) | 2015 | 2014 | 2013 | 2012 | 2011 | |||||||||||||||
Total real estate investments, at cost | $ | 1,822,903 | $ | 1,888,366 | $ | 1,542,805 | $ | 360,857 | $ | 125,626 | ||||||||||
Total assets | 2,071,755 | 2,120,835 | 2,048,305 | 367,850 | 136,964 | |||||||||||||||
Mortgage notes payable | 388,436 | 172,242 | 172,716 | 185,569 | 75,250 | |||||||||||||||
Credit Facility | 485,000 | 635,000 | 305,000 | 19,995 | — | |||||||||||||||
Notes payable | — | — | — | — | 5,933 | |||||||||||||||
Total liabilities | 979,486 | 925,158 | 599,046 | 225,419 | 85,773 | |||||||||||||||
Total equity | 1,092,269 | 1,195,677 | 1,449,259 | 142,431 | 51,191 | |||||||||||||||
Year Ended December 31, | ||||||||||||||||||||
Operating data (In thousands, except share and per share data) | 2015 | 2014 | 2013 | 2012 | 2011 | |||||||||||||||
Total revenues | $ | 174,521 | $ | 155,567 | $ | 55,887 | $ | 15,422 | $ | 7,535 | ||||||||||
Operating expenses | 195,415 | 227,540 | 65,105 | 16,787 | 6,888 | |||||||||||||||
Operating income (loss) | (20,894 | ) | (71,973 | ) | (9,218 | ) | (1,365 | ) | 647 | |||||||||||
Total other expenses | (19,375 | ) | (22,312 | ) | (10,093 | ) | (5,007 | ) | (3,912 | ) | ||||||||||
Net loss | (40,269 | ) | (94,285 | ) | (19,311 | ) | (6,372 | ) | (3,265 | ) | ||||||||||
Net loss (income) attributable to non-controlling interests | 1,188 | 1,257 | 32 | 33 | (154 | ) | ||||||||||||||
Net loss attributable to stockholders | $ | (39,081 | ) | $ | (93,028 | ) | $ | (19,279 | ) | $ | (6,339 | ) | $ | (3,419 | ) | |||||
Other data: | ||||||||||||||||||||
Cash flows provided by operations | $ | 37,725 | $ | 6,535 | $ | 9,428 | $ | 3,030 | $ | 263 | ||||||||||
Cash flows provided by (used in) investing activities | 61,907 | (327,835 | ) | (1,309,508 | ) | (145,753 | ) | (25,736 | ) | |||||||||||
Cash flows provided by (used in) financing activities | (23,540 | ) | 110,435 | 1,528,103 | 137,855 | 35,346 | ||||||||||||||
Per share data: | ||||||||||||||||||||
Net loss per common share - basic and diluted | $ | (0.24 | ) | $ | (0.56 | ) | $ | (0.26 | ) | $ | (0.52 | ) | $ | (2.31 | ) | |||||
Dividends and distributions declared per common share | $ | 0.460 | $ | 0.490 | $ | 0.605 | $ | 0.605 | $ | 0.605 | ||||||||||
Weighted-average number of common shares outstanding, basic and diluted | 162,165,580 | 166,959,316 | 73,074,872 | 12,187,623 | 2,070,184 | |||||||||||||||
34
Item 7. Management's Discussion and Analysis of Financial Condition and Results of Operations.
The following discussion and analysis should be read in conjunction with the accompanying financial statements. The following information contains forward-looking statements, which are subject to risks and uncertainties. Should one or more of these risks or uncertainties materialize, actual results may differ materially from those expressed or implied by the forward-looking statements. Please see "Forward-Looking Statements" elsewhere in this report for a description of these risks and uncertainties.
Significant Accounting Estimates and Critical Accounting Policies
Set forth below is a summary of the significant accounting estimates and critical accounting policies that management believes are important to the preparation of our consolidated financial statements. Certain of our accounting estimates are particularly important for an understanding of our financial position and results of operations and require the application of significant judgment by our management. As a result, these estimates are subject to a degree of uncertainty. These significant accounting estimates and critical accounting policies include:
Revenue Recognition
Our revenues, which are derived primarily from rental income, include rents that each tenant pays in accordance with the terms of each lease reported on a straight-line basis over the initial term of the lease. Because many of our leases provide for rental increases at specified intervals, GAAP require us to record a receivable, and include in revenues on a straight-line basis, unbilled rent receivables that we will only receive if the tenant makes all rent payments required through the expiration of the initial term of the lease. We defer the revenue related to lease payments received from tenants in advance of their due dates. When we acquire a property, the acquisition date is considered to be the commencement date for purposes of this calculation.
Rental revenue recognition commences when the tenant takes possession or controls the physical use of the leased space. For the tenant to take possession, the leased space must be substantially ready for its intended use. To determine whether the leased space is substantially ready for its intended use, we evaluate whether we own or the tenant owns the tenant improvements. When we are the owner of tenant improvements, rental revenue recognition begins when the tenant takes possession of the finished space, which is when such improvements are substantially complete. When we conclude that the tenant is the owner of tenant improvements, rental revenue recognition begins when the tenant takes possession of or controls the space.
When we conclude that we are the owner of tenant improvements, we capitalize the cost to construct the tenant improvements, including costs paid for or reimbursed by the tenants. When we conclude that the tenant is the owner of tenant improvements for accounting purposes, we record our contribution towards those improvements as a lease incentive, which is included in deferred leasing costs, net on the consolidated balance sheets and amortized as a reduction to rental income on a straight-line basis over the term of the lease.
We continually review receivables related to rent and unbilled rent receivables and determine collectability by taking into consideration the tenant's payment history, the financial condition of the tenant, business conditions in the industry in which the tenant operates and economic conditions in the area in which the property is located. In the event that the collectability of a receivable is in doubt, we will record an increase in our allowance for uncollectible accounts or record a direct write-off of the receivable in our consolidated statements of operations.
We own certain properties with leases that include provisions for the tenant to pay contingent rental income based on a percent of the tenant's sales upon the achievement of certain sales thresholds or other targets which may be monthly, quarterly or annual targets. As the lessor to the aforementioned leases, we defer the recognition of contingent rental income until the specified target that triggered the contingent rental income is achieved, or until such sales upon which percentage rent is based are known. If we own certain properties with leases that include these provisions, contingent rental income will be included in rental income on the consolidated statements of operations and comprehensive loss.
Cost recoveries from tenants are included in operating expense reimbursement in the period the related costs are incurred, as applicable.
Our hotel revenues are recognized as earned and are derived from room rentals and other sources such as charges to guests for telephone service, movie and vending commissions, meeting and banquet room revenue and laundry services.
Investments in Real Estate
We evaluate the inputs, processes and outputs of each asset acquired to determine if the transaction is a business combination or asset acquisition. If an acquisition qualifies as a business combination, the related transaction costs are recorded as an expense in the consolidated statement of operations. If an acquisition qualifies as an asset acquisition, the related transaction costs are generally capitalized and subsequently amortized over the useful life of the acquired assets.
35
In business combinations, we allocate the purchase price of acquired properties to tangible and identifiable intangible assets or liabilities and non-controlling interests based on their respective estimated fair values. Tangible assets may include land, land improvements, buildings, fixtures and tenant improvements. Intangible assets or liabilities may include the value of in-place leases, above- and below-market leases and other identifiable intangible assets or liabilities based on lease or property specific characteristics.
The fair value of the tangible assets of an acquired property with an in-place operating lease is determined by valuing the property as if it were vacant, and the “as-if-vacant” value is then allocated to the tangible assets based on the fair value of the tangible assets. The fair value of in-place leases is determined by considering estimates of carrying costs during the expected lease-up periods, current market conditions, as well as costs to execute similar leases. The fair value of above- or below-market leases is recorded based on the present value of the difference between the contractual amount to be paid pursuant to the in-place lease and our estimate of the comparable fair market lease rate, measured over the remaining term of the lease. The fair value of other intangible assets, such as real estate tax abatements, are recorded based on the present value of the expected benefit and amortized over the expected useful life including any below-market fixed rate renewal options for below-market leases.
Fair values of assumed mortgages, if applicable, are recorded as debt premiums or discounts based on the present value of the estimated cash flows, which is calculated to account for either above- or below-market interest rates.
Non-controlling interests in property owning entities are recorded based on the fair value of units issued at the date of acquisition, as determined by the terms of the applicable agreement.
We utilize a number of sources in making our estimates of fair values for purposes of allocating purchase price including real estate valuations prepared by independent valuation firms. We also consider information and other factors including: market conditions, the industry in which the tenant operates, characteristics of the real estate such as location, size, demographics, value and comparative rental rates, tenant credit profile and the importance of the location of the real estate to the operations of the tenant’s business.
Disposals of real estate investments that represent a strategic shift in operations that will have a major effect on our operations and financial results are presented as discontinued operations in the consolidated statements of operations and comprehensive loss for all periods presented; otherwise, we continue to report the results of these properties' operations within continuing operations. Properties that are intended to be sold will be designated as "held for sale" on the consolidated balance sheets at the lesser of carrying amount or fair value less estimated selling costs for all periods presented when they meet specific criteria to be presented as held for sale. Properties are no longer depreciated when they are classified as held for sale.
Depreciation and Amortization
Depreciation is computed using the straight-line method over the estimated useful lives of up to 40 years for buildings, 15 years for land improvements, five to seven years for fixtures and improvements, and the shorter of the useful life or the remaining lease term for tenant improvements and leasehold interests.
Acquired above-market leases are amortized as a reduction of rental income over the remaining terms of the respective leases. Acquired below-market leases are amortized as an increase to rental income over the remaining terms of the respective leases and expected below-market renewal option periods.
Acquired above-market ground leases are amortized as a reduction of property operating expense over the remaining term of the respective leases. Acquired below-market ground leases are amortized as an increase to property operating expense over the remaining term of the respective leases and expected below-market renewal option period.
The value of in-place leases, exclusive of the value of above- and below-market in-place leases, is amortized to depreciation and amortization expense over the remaining periods of the respective leases.
Assumed mortgage premiums or discounts, if applicable, are amortized as a reduction or increase to interest expense over the remaining term of the respective mortgages.
36
Impairment of Long Lived Assets
When circumstances indicate the carrying value of a property may not be recoverable, we review the asset for impairment. This review is based on an estimate of the future undiscounted cash flows, excluding interest charges, expected to result from the property’s use and eventual disposition. These estimates consider factors such as expected future operating income, market and other applicable trends and residual value, as well as the effects of leasing demand, competition and other factors. If such estimated cash flows are less than the carrying value of a property, an impairment loss is recorded to the extent that the carrying value exceeds the estimated fair value of the property for properties to be held and used. For properties held for sale, the impairment loss is based on the adjustment to estimated fair value less estimated cost to dispose of the asset. Generally, we determine estimated fair value for properties held for sale based on the agreed-upon selling price of an asset. These assessments may result in the immediate recognition of an impairment loss, resulting in a reduction of net income (loss).
Derivative Instruments
We use derivative financial instruments to hedge the interest rate risk associated with a portion of our borrowings. The principal objective of such agreements is to minimize the risks and costs associated with our operating and financial structure as well as to hedge specific anticipated transactions.
We record all derivatives on the balance sheet at fair value. The accounting for changes in the fair value of derivatives depends on the intended use of the derivative, whether we have elected to designate a derivative in a hedging relationship and apply hedge accounting and whether the hedging relationship has satisfied the criteria necessary to apply hedge accounting. Derivatives designated and qualifying as a hedge of the exposure to changes in the fair value of an asset, liability, or firm commitment attributable to a particular risk, such as interest rate risk, are considered fair value hedges. Derivatives designated and qualifying as a hedge of the exposure to variability in expected future cash flows, or other types of forecasted transactions, are considered cash flow hedges. Hedge accounting generally provides for the matching of the timing of gain or loss recognition on the hedging instrument with the recognition of the changes in the fair value of the hedged asset or liability that is attributable to the hedged risk in a fair value hedge or the earnings effect of the hedged forecasted transactions in a cash flow hedge.
We may enter into derivative contracts that are intended to economically hedge certain of our risk, even though hedge accounting does not apply or we elect not to apply hedge accounting. If we designate a qualifying derivative as a hedge, changes in the value of the derivative are reflected in accumulated other comprehensive loss on the accompanying consolidated balance sheets. If a derivative does not qualify as a hedge, or if we elect not to apply hedge accounting, changes in the value of the derivative are reflected in other income (loss) on the accompanying consolidated statements of operations and comprehensive loss.
Recently Issued Accounting Pronouncements
In May 2014, the FASB issued revised guidance relating to revenue recognition. Under the revised guidance, an entity is required to recognize revenue when it transfers promised goods or services to customers in an amount that reflects the consideration to which the entity expects to be entitled in exchange for those goods or services. The revised guidance was to become effective for fiscal years, and interim periods within those fiscal years, beginning after December 15, 2016. Early adoption was not permitted under GAAP. The revised guidance allows entities to apply the full retrospective or modified retrospective transition method upon adoption. In July 2015, the FASB deferred the effective date of the revised guidance by one year to annual reporting periods beginning after December 15, 2017, although entities will be allowed to early adopt the guidance as of the original effective date. We have not yet selected a transition method and are currently evaluating the impact of the new guidance.
In February 2015, the FASB amended the accounting for consolidation of certain legal entities. The amendments modify the evaluation of whether certain legal entities are variable interest entities ("VIEs") or voting interest entities, eliminate the presumption that a general partner should consolidate a limited partnership, affect the consolidation analysis of reporting entities that are involved with VIEs (particularly those that have fee arrangements and related party relationships) and provide a scope exception from consolidation guidance for reporting entities with interests in legal entities. The revised guidance is effective for fiscal years, and for interim periods within those fiscal years, beginning after December 15, 2015. Early adoption is permitted, including adoption in an interim period. We do not anticipate that the revised guidance will have a material impact to our financial position, results of operations or cash flows.
37
In April 2015, the FASB amended the presentation of debt issuance costs on the balance sheet. The amendments require that debt issuance costs related to a recognized debt liability be presented on the balance sheet as a direct deduction from the carrying amount of that debt liability. In August 2015, the FASB added that, for line of credit arrangements, the SEC staff would not object to an entity deferring and presenting debt issuance costs as an asset and subsequently amortizing the deferred debt issuance costs ratably over the term of the line, regardless of whether or not there are any outstanding borrowings. The revised guidance is effective for fiscal years, and for interim periods within those fiscal years, beginning after December 15, 2015. Early adoption is permitted for financial statements that have not previously been issued. The revised guidance is not expected to have a significant impact on our financial position, results of operations or cash flows.
In September 2015, the FASB issued an update that eliminates the requirement to adjust provisional amounts from a business combination and the related impact on earnings by restating prior period financial statements for measurement period adjustments. The new guidance requires that the cumulative impact of measurement period adjustments on current and prior periods, including the prior period impact on depreciation, amortization and other income statement items and their related tax effects, shall be recognized in the period the adjustment amount is determined. The cumulative adjustment would be reflected within the respective financial statement line items affected. The revised guidance is effective for fiscal years, and for interim periods within those fiscal years, beginning after December 15, 2015. Early adoption is permitted. We have elected to adopt the new guidance as of September 30, 2015. The adoption of this guidance had no impact on our consolidated financial position, results of operations or cash flows.
In January 2016, the FASB issued an update that amends the recognition and measurement of financial instruments. The new guidance significantly revises an entity’s accounting related to equity investments and the presentation of certain fair value changes for financial liabilities measured at fair value. Among other things, it also amends the presentation and disclosure requirements associated with the fair value of financial instruments. The revised guidance is effective for fiscal years, and for interim periods within those fiscal years, beginning after December 15, 2017. Early adoption is not permitted for most of the amendments in the update. We are currently evaluating the impact of the new guidance.
Results of Operations
Occupancy and Leasing
As of December 31, 2015, our combined portfolio, including Worldwide Plaza, was 95.2% leased, which is comparable to 94.9% as of December 31, 2014. Our 2015 Same Store (defined below), was 95.0% leased as of December 31, 2015 compared with 94.6% as of December 31, 2014. Occupancy is inclusive of leases signed but not yet commenced. See "Item 7. Management's Discussion and Analysis of Financial Condition and Results of Operations — Significant Accounting Estimates and Critical Accounting Policies" for accounting policies relating to revenue recognition.
• | During the year ended December 31, 2015, one of our tenants at 256 W. 38th Street rejected their lease in bankruptcy and approximately 47,000 square feet at that building became vacant. We subsequently re-leased approximately 17,000 square feet. This lease commenced in January 2016. |
• | During the fourth quarter of 2015, approximately 184,000 square feet of space became vacant at 1440 Broadway. We re-leased 104,000 square feet in that same quarter and expect this lease to commence in April 2016. |
• | As of December 31, 2014, Worldwide Plaza was 93.2% leased. During the year ended December 31, 2015, the remaining vacant space at Worldwide Plaza was leased, and Worldwide Plaza was 100% occupied as of December 31, 2015. |
We continue to market the remaining vacant space in our portfolio.
Although ending occupancy was largely unchanged year-over-year, we re-leased our expiring spaces at increases per square foot of 52% and 62% on a cash and straight-line basis, respectively, over prior rents.
38
The following is a summary of our quarterly leasing activity for the year ended December 31, 2015:
Q4 2015 | Q3 2015 | Q2 2015 | Q1 2015 | Total | |||||||||||||||||
Leasing activity: | |||||||||||||||||||||
Leases executed | 5 | 1 | 7 | 1 | 14 | ||||||||||||||||
Total square feet leased | 129,889 | 2,811 | 185,247 | 22,185 | 340,132 | ||||||||||||||||
Company's share of square feet leased | 125,727 | 2,811 | 114,548 | 22,185 | 265,271 | ||||||||||||||||
Initial rent | $ | 62.14 | $ | 158.42 | $ | 56.51 | $ | 157.76 | $ | 66.08 | |||||||||||
Weighted average lease term (years) | 4.2 | 10.0 | 12.9 | 15.5 | 10.1 | ||||||||||||||||
Replacement leases:(1) | |||||||||||||||||||||
Replacement leases executed | 4 | — | 3 | 1 | 8 | ||||||||||||||||
Square feet | 123,002 | — | 30,579 | 5,058 | 158,639 | ||||||||||||||||
Cash basis: | |||||||||||||||||||||
Initial rent | $ | 67.09 | $ | — | $ | 48.70 | $ | 356.79 | 107.45 | ||||||||||||
Prior escalated rent (2) | $ | 54.62 | $ | — | $ | 36.64 | $ | 250.90 | 70.46 | ||||||||||||
Percentage increase (decrease) | 23 | % | — | % | 33 | % | 42 | % | 52 | % | |||||||||||
GAAP basis: | |||||||||||||||||||||
Initial rent | $ | 69.61 | $ | — | $ | 51.75 | $ | 381.19 | 114.35 | ||||||||||||
Prior escalated rent (2) | $ | 54.66 | $ | — | $ | 40.69 | $ | 249.32 | 70.75 | ||||||||||||
Percentage increase (decrease) | 27 | % | — | % | 27 | % | 53 | % | 62 | % | |||||||||||
Tenant improvements on replacement leases per square foot | $ | 17.40 | $ | — | $ | 98.62 | $ | 78.88 | $ | 39.82 | |||||||||||
Leasing commissions on replacement leases per square foot | $ | 11.92 | $ | — | $ | 31.61 | $ | 178.40 | $ | 27.85 | |||||||||||
(1) | Replacement leases are for space that was leased during the period that was previously leased to another expired or terminated tenant at some time during the prior twelve months. |
(2) | Prior escalated rent is calculated as total annualized income less electric charges. It includes base rent, excluding recoveries. |
39
Lease Expirations
The following is a summary of lease expirations for the next five years, as of December 31, 2015:
Total | 2016 | 2017 | 2018 | 2019 | 2020 | Thereafter | |||||||||||||||||||||||
Combined:(1) | |||||||||||||||||||||||||||||
Leases expiring | 137 | 10 | 17 | 17 | 6 | 8 | 79 | ||||||||||||||||||||||
Expiring Annualized Cash Rent (in thousands)(2)(3) | $ | 214,905 | $ | 6,488 | $ | 7,296 | $ | 9,440 | $ | 1,238 | $ | 6,153 | $ | 184,290 | |||||||||||||||
Expiring square feet(3) | 3,096,255 | 102,541 | 106,379 | 159,320 | 32,077 | 83,945 | 2,611,993 | ||||||||||||||||||||||
% of total square feet expiring | 100.0 | % | 3.3 | % | 3.4 | % | 5.1 | % | 1.0 | % | 2.7 | % | 84.5 | % | |||||||||||||||
Annualized Cash Rent per square foot(2) (3) | $ | 69.41 | $ | 63.28 | $ | 68.58 | $ | 59.25 | $ | 38.62 | $ | 73.30 | $ | 70.56 | |||||||||||||||
Consolidated properties: | |||||||||||||||||||||||||||||
Leases expiring | 103 | 7 | 16 | 13 | 5 | 7 | 55 | ||||||||||||||||||||||
Expiring Annualized Cash Rent (in thousands)(2)(3) | $ | 142,792 | $ | 6,436 | $ | 6,284 | $ | 9,096 | $ | 1,227 | $ | 5,805 | $ | 113,944 | |||||||||||||||
Expiring square feet(3)(4) | 2,094,428 | 102,394 | 89,959 | 157,487 | 32,077 | 82,800 | 1,629,711 | ||||||||||||||||||||||
% of total square feet expiring | 100.0 | % | 4.9 | % | 4.3 | % | 7.5 | % | 1.5 | % | 4.0 | % | 77.8 | % | |||||||||||||||
Annualized Cash Rent per square foot(2) (3)(4) | $ | 68.18 | $ | 62.86 | $ | 69.85 | $ | 57.75 | $ | 38.27 | $ | 70.10 | $ | 69.92 | |||||||||||||||
Unconsolidated joint ventures: | |||||||||||||||||||||||||||||
Leases expiring | 34 | 3 | 1 | 4 | 1 | 1 | 24 | ||||||||||||||||||||||
Expiring Annualized Cash Rent (in thousands)(2)(4) | $ | 72,113 | $ | 52 | $ | 1,012 | $ | 344 | $ | 11 | $ | 348 | $ | 70,346 | |||||||||||||||
Expiring square feet(5) | 1,001,827 | 147 | 16,420 | 1,833 | — | 1,145 | 982,282 | ||||||||||||||||||||||
% of total square feet expiring | 100.0 | % | — | % | 1.6 | % | 0.2 | % | — | % | 0.1 | % | 98.1 | % | |||||||||||||||
Annualized Cash Rent per square foot(2)(4) | $ | 71.98 | $ | 354.97 | $ | 61.61 | $ | 187.58 | $ | — | $ | 304.17 | $ | 71.61 | |||||||||||||||
_________________
(1) | Combined reflects 100% of consolidated properties plus our pro rata share of unconsolidated properties. |
(2) | Expiring annualized cash rent represents contractual cash base rents at the time of lease expiration and reimbursements from tenants, excluding electric reimbursements and free rent. |
(3) | Excludes 122,896 square feet of the hotel (which excludes 5,716 square feet leased to the hotel restaurant tenant). Total vacant square footage at December 31, 2015 was 155,087 square feet. |
(4) | Reflects our pro rata share of our unconsolidated joint venture. |
Comparison of Year Ended December 31, 2015 to Year Ended December 31, 2014
For the year ended December 31, 2015, net loss attributable to stockholders was $39.1 million compared to $93.0 million and $19.3 million, respectively, for the years ended December 31, 2014 and 2013.
As of December 31, 2015, we owned 22 properties. Between January 1, 2014 and December 31, 2015, we acquired one property, 245-249 West 17th Street (our "2014 Acquisition") and sold one property, 163 Washington Avenue, (our "2015 Disposition"). Additionally, our preferred equity investment in 123 William Street ("123 William Street") was redeemed in March 2015. We consider properties that have been owned for the entire current and prior periods to be our same store properties. Our "2015 Same Store" excludes the activity related to our 2014 Acquisition, 2015 Disposition and 123 William Street.
40
Rental Income
Rental income increased $11.9 million to $129.1 million for the year ended December 31, 2015, from $117.2 million for the year ended December 31, 2014. The increase in rental income was primarily driven by our 2014 Acquisition, which resulted in an increase in rental income of $15.4 million for the year ended December 31, 2015. We experienced a net decrease in rental income at our 2015 Same Store of $3.2 million primarily related to lease modifications and terminations at 229 W. 36th Street, 256 W. 38th Street and 1440 Broadway as well as a reduction in rental income related to a fully amortized below-market lease at 333 W. 34th Street. The net decrease in our 2015 Same Store was partially offset by increased rental revenue at 50 Varick Street, due to a lease modification, and 218 W. 18th Street and the Design Center due to lease commencements. The decrease in rental revenue associated with our 2015 Disposition was $0.4 million.
Operating Expense Reimbursements and Other Revenue
Operating expense reimbursements and other revenue increased $3.7 million to $19.3 million for the year ended December 31, 2015 from $15.6 million for the year ended December 31, 2014, primarily due to $1.4 million in operating expense reimbursements related to our 2014 Acquisition and higher recoveries of $2.3 million in our 2015 Same Store due to lease commencements. The increase also related to a fee paid by a tenant upon the expiration of its lease at 1440 Broadway in lieu of restoring the space to its original condition prior to vacating.
Pursuant to many of our lease agreements, tenants are required to pay their pro rata share of certain property operating expenses, in addition to base rent, whereas under certain other lease agreements, the tenants are directly responsible for all operating costs of the respective properties. Therefore, operating expense reimbursements are directly affected by changes in property operating expenses.
Property Operating Expenses
Property operating expenses increased $6.6 million to $43.8 million for the year ended December 31, 2015, from $37.2 million for the year ended December 31, 2014. The increase in property operating expenses primarily related to real estate taxes, utilities, maintenance and security associated with our 2014 Acquisition, which resulted in an increase of $3.3 million in property operating expenses for the year ended December 31, 2015. Property operating expenses increased $2.7 million in our 2015 Same Store for the year ended December 31, 2015, primarily related to increased real estate taxes, utilities, security and maintenance expenses. Property operating expenses also increased year over year because the Advisor did not absorb any expenses during the year ended December 31, 2015. During the prior year, the Advisor absorbed $0.6 million. The increase in property operating expenses was partially offset by a $0.1 million decrease related to our 2015 Disposition.
Hotel Operations
Hotel revenues increased $3.4 million to $26.1 million for the year ended December 31, 2015, from $22.7 million for the year ended December 31, 2014. Hotel operating expenses increased $1.7 million to $25.4 million for the year ended December 31, 2015, from $23.7 million for the year ended December 31, 2014. The increase in hotel revenues and hotel operating expenses related primarily to increased average occupancy at the Viceroy Hotel of 80.5% for the year ended December 31, 2015, compared to 68.8% during the year ended December 31, 2014 as well as revenue per available room (commonly referred to in the hotel industry as "RevPAR") of $276.70 for the year ended December 31, 2015, compared to $241.39 for the year ended December 31, 2014.
Operating Fees Incurred from the Advisor
Operating fees incurred from the Advisor were $12.5 million for the year ended December 31, 2015, compared to $8.4 million for the year ended December 31, 2014. Operating fees incurred from the Advisor represent asset management fees earned by the Advisor. Prior to the Listing, we issued to the Advisor restricted performance based Class B units for prior asset management services, which vested as of the Listing. As such, the increase was related to paying asset management fees in cash for a full year.
Our Property Manager is entitled to fees for the management of our properties. Property management fees increase in direct correlation with gross revenues. Our Property Manager elected to waive these fees for the years ended December 31, 2015 and 2014. For the years ended December 31, 2015 and 2014, we would have incurred property management fees of $2.6 million and $1.7 million, respectively, had these fees not been waived.
Acquisition and Transaction Related Expenses
Acquisition and transaction related expenses of $3.8 million for the year ended December 31, 2015 primarily related to the debt refinancing transactions which we entered into during the third quarter 2015, litigation at Worldwide Plaza and professional fees incurred related to the exploration of a possible strategic transaction. Acquisition and transaction related expenses of $16.1 million for the year ended December 31, 2014 included $4.4 million in acquisition fees and expense reimbursements for the purchase of our 2014 Acquisition as well as costs associated with our Listing.
41
Vesting of Asset Management Fees
Vesting of asset management fees expense of $11.5 million for the year ended December 31, 2014 related to the vesting of Class B units previously issued to the Advisor for asset management services. The performance condition related to these Class B units was satisfied upon completion of the Listing, as such this expense did not recur for the year ended December 31, 2015. On April 15, 2014, the Class B units were converted to OP units on a one-to-one basis.
Value of Listing Note
Value of Listing Note (as defined in Note 9 — Subordinated Listing Distribution to our consolidated financial statements expense of $33.5 million for the year ended December 31, 2014 represents the final value of the Listing Note, which was determined and fully expensed in the fourth quarter of 2014. As such, this expense did not recur for the year ended December 31, 2015.
General and Administrative Expenses
General and administrative expenses increased $15.0 million to $27.3 million for the year ended December 31, 2015 from $12.3 million for the year ended December 31, 2014.
Equity-based compensation expenses, which are not settled in cash, contributed a large portion of the year-over-year increase in total general and administrative expenses. These expenses increased $7.7 million for the year ended December 31, 2015 compared to the prior year, due to a full year of amortization of the fair value of the OPP and a higher year-over-year fair value of the OPP, which was adopted in conjunction with the Listing. The valuation of our OPP is largely dependent on the trading price of shares of our common stock in the absolute sense and relative to the share prices of our peer group. Because we are required under GAAP to remeasure the OPP quarterly, our equity-based compensation expenses tend to be volatile. See Note 16 — Share-Based Compensation to the accompanying notes to our consolidated financial statements.
The increase in remaining general and administrative expenses, which are settled in cash, was largely associated with a $5.5 million increase in legal and professional fees primarily related to the audit of our 2014 financial statements being recognized in full during 2015 due to our change of auditors in February 2015, the engagement of internal auditors and the recognition of expenses incurred relating to the audit of our 2015 financial statements. Additionally, beginning in the third quarter of 2015, our Advisor began requesting reimbursement for general and administrative expenses, which amounted to $0.8 million during the year ended December 31, 2015. Our Advisor elected to absorb $1.4 million of general and administrative expenses for the year ended December 31, 2014, which did not recur for the year ended December 31, 2015. The increases in other general and administrative expenses were partially offset by decreases in transfer agent and proxy costs of $1.5 million for the year ended December 31, 2015 compared to the year ended December 31, 2014 as a result of the Advisor renegotiating their service contracts.
Depreciation and Amortization Expense
Depreciation and amortization expense decreased $2.1 million to $82.7 million for the year ended December 31, 2015, compared to $84.8 million for the year ended December 31, 2014. The decrease in depreciation and amortization expense related primarily to a decrease of $7.3 million in depreciation and amortization expense in our 2015 Same Store primarily related to lease modifications and terminations at 229 W. 36th Street, 333 W. 34th Street and 1440 Broadway as well as $0.4 million in depreciation and amortization expense related to our 2015 Disposition. These decreases were partially offset by $5.7 million in depreciation and amortization expense related to our 2014 Acquisition.
Interest Expense
Interest expense increased $5.7 million to $29.4 million for the year ended December 31, 2015 from $23.7 million for the year ended December 31, 2014. The increase in interest expense is partially related to a higher weighted average Credit Facility balance outstanding of $597.5 million during the year ended December 31, 2015, compared to $439.2 million during the year ended December 31, 2014. In the third quarter of 2015, we entered into several financing transactions, including the issuance of a mortgage note payable secured by our property located at 1440 Broadway, which contributed $3.4 million to the increase in interest expense. In connection with these third quarter financing transactions, we also repaid four mortgage notes payable and settled through legal defeasance two mortgage notes payable before the scheduled maturity dates to allow for their inclusion in the borrowing base of our Credit Facility and accelerated $1.1 million of expense for the write-off of financing costs related to those mortgages. Additionally, financing costs incurred of $4.0 million and $6.5 million, relating to the Credit Facility and the 1440 Broadway mortgage, respectively, were deferred and are being amortized to interest expense over the respective maturity dates of the debt instruments to which they are allocated.
42
Income (Loss) from Unconsolidated Joint Venture
Income (loss) from unconsolidated joint venture was $1.9 million of income for the year ended December 31, 2015 and $1.5 million of loss for the year ended December 31, 2014, which represents our preferred distribution, net of our pro rata share of the net income or loss of Worldwide Plaza and the amortization of the difference in basis between our investment and the book value of Worldwide Plaza's net assets. Income from unconsolidated joint venture increased in part due to increasing occupancy at Worldwide Plaza to 100.0% as of December 31, 2015 from 93.3% as of December 31, 2014 and 91.2% as of October 31, 2013, the date we acquired our interest in Worldwide Plaza.
Income from Preferred Equity Investment, Investment Securities and Interest
Income from preferred equity investment, investment securities and interest decreased $1.8 million to $1.1 million for the year ended December 31, 2015 from $2.9 million for the year ended December 31, 2014. The primary driver for the decrease was a decline in income related to our preferred equity investment in 123 William Street, which was redeemed in March 2015, of $1.9 million for the year ended December 31, 2015. The decline was partially offset by a gain on the sale of investment securities of $0.1 million for the year ended December 31, 2015.
Gain on Sale of Real Estate Investment, Net
Gain on sale of real estate investment, net of $7.5 million for the year ended December 31, 2015 related primarily to the gain we recognized on the sale of our 2015 Disposition of $8.4 million partially offset by an impairment charge on Duane Reade of $0.9 million, recognized as a result of reclassifying the assets of that property to held-for-sale at the lower of carrying amount or fair value less cost to sell.
Gain (Loss) on Derivative Instruments
Loss on derivative instruments of $0.6 million for the year ended December 31, 2015 related primarily to missed forecast derivative losses recognized upon the early repayment of the mortgages securing One Jackson Square and 229 West 36th Street and the resulting cancellation of the interest rate swaps on those mortgages. Mark-to-market adjustments on our 1440 Broadway interest rate caps, which do not qualify for hedge accounting, further contributed to the loss on derivative instruments for the year ended December 31, 2015. We recognized approximately $1,000 of gain on derivative instruments for the year ended December 31, 2014.
Net Loss Attributable to Non-Controlling Interests
The net loss attributable to non-controlling interests during the year ended December 31, 2015 and 2014 was $1.2 million and $1.3 million, respectively.The decrease of $0.1 million in net loss attributable to non-controlling is primarily related to our 2015 Disposition and the repayment of our partner in that property as well as lower allocable net loss.
Comparison of Year Ended December 31, 2014 to Year Ended December 31, 2013
As of December 31, 2014, we owned 24 properties and real estate-related assets. As of January 1, 2013, we owned 16 properties (our "2014 Same Store"). We acquired eight properties and real estate related assets from January 1, 2013 to December 31, 2014 (our "2013/2014 Acquisitions"). Accordingly, our results of operations for the year ended December 31, 2014 as compared to the year ended December 31, 2013, reflect significant increases in most categories.
Rental Income
Rental income increased $67.7 million to $117.2 million for the year ended December 31, 2014, from $49.5 million for the year ended December 31, 2013. The increase in rental income was primarily driven by our 2013/2014 Acquisitions, which resulted in an increase in rental income of $66.9 million for the year ended December 31, 2014, compared to the year ended December 31, 2013, as well as lease termination fees of $1.6 million related to a partial lease termination and modification at 229 West 36th Street. This was partially offset by a net decrease in rental income in our 2014 Same Store of $0.8 million primarily due to net leasing activity at 416 Washington Street as a result of damage caused by Hurricane Sandy. The terminated space at 416 Washington Street was re-leased in September 2014, resulting in a fully occupied property as of December 31, 2014. We also began self-managing the garage at 416 Washington Street in December 2013 through a third-party national operator. Parking revenue associated with self-management is higher than the rental income we would have received; however, this parking revenue is included in operating expense reimbursements and other revenue.
Operating Expense Reimbursements and Other Revenue
Operating expense reimbursements and other revenue increased $11.5 million to $15.6 million for the year ended December 31, 2014 from $4.1 million for the year ended December 31, 2013, primarily due to our 2013/2014 Acquisitions, which resulted in an increase of $10.6 million in operating expense reimbursements. Operating expense reimbursements and other revenue at our 2014 Same Store increased $0.9 million for the year ended December 31, 2014, primarily related to parking revenue due to the switch to self-managing the garage at 416 Washington Street in December 2013 and an increase in property operating expenses.
43
Pursuant to many of our lease agreements, tenants are required to pay their pro rata share of certain property operating expenses, in addition to base rent, whereas under certain other lease agreements, the tenants are directly responsible for all operating costs of the respective properties. Therefore, operating expense reimbursements are directly affected by changes in property operating expenses.
Property Operating Expenses
Property operating expenses increased $24.7 million to $37.2 million for the year ended December 31, 2014, from $12.5 million for the year ended December 31, 2013. The increase in property operating expenses primarily related to real estate taxes, utilities, maintenance and ground rent associated with our 2013/2014 Acquisitions, which resulted in an increase of $24.6 million for the year ended December 31, 2014. Property operating expenses increased $0.6 million in our 2014 Same Store, primarily related to increased real estate taxes, utilities, security and maintenance expenses. This increase was partially offset by absorption of certain property operating costs of $0.6 million by the Advisor during the year ended December 31, 2014. The Advisor did not absorb any property operating expenses during the year ended December 31, 2013.
Hotel Revenue and Operating Expenses
Hotel revenues increased $20.4 million to $22.7 million for the year ended December 31, 2014 from $2.3 million for the year ended December 31, 2013. Hotel operating expenses increased $21.3 million to $23.7 million for the year ended December 31, 2014, from $2.4 million for the year ended December 31, 2013. The increase in hotel revenues and hotel operating expenses related to a full year of operations at the Viceroy Hotel, which we purchased in November 2013.
Operating Fees Incurred from the Advisor
Operating fees to affiliates were $8.4 million for the year ended December 31, 2014. Operating fees incurred from the Advisor represent asset management fees earned by the Advisor. Prior to the Listing, we issued the Advisor restricted performance based Class B units for prior asset management services, which vested as of the Listing. As such, there were no operating fees incurred from the Advisor for the year ended December 31, 2013.
Our Property Manager is entitled to fees for the management of our properties. Property management fees increase in direct correlation with gross revenues. Our Property Manager elected to waive these fees for the years ended December 31, 2014 and 2013. For the years ended December 31, 2014 and 2013, we would have incurred property management fees of $1.7 million and $0.8 million, respectively, had these fees not been waived.
Acquisition and Transaction Related Expenses
Acquisition and transaction related expenses of $16.1 million for the year ended December 31, 2014 included $4.4 million relating to our acquisition of our 2014 Acquisition as well as Listing-related costs. Listing-related costs mainly consisted of $8.9 million of investment banking, advisory and other services provided by the Former Dealer Manager and its affiliates, as well as $2.8 million of other third party fees and expenses.
Acquisition and transaction related expense of $17.4 million for the year ended December 31, 2013 included $17.8 million for the purchase of seven properties during the period, partially offset by a reimbursement by the Advisor of $2.5 million for expenses and legal reimbursements paid on previous acquisitions.
Vesting of Asset Management Fees
Vesting of asset management fees expense of $11.5 million for the year ended December 31, 2014 related to the vesting of Class B units previously issued to the Advisor for asset management services. The performance condition related to these Class B units was satisfied upon completion of the Listing. On April 15, 2014, the Class B units were converted to OP units on a one-to-one basis.
Value of Listing Note
Value of listing promote expense of $33.5 million for the year ended December 31, 2014 represented the final value of the Listing Note. See Note 9 — Subordinated Listing Distribution of the notes to our consolidated financial statements.
44
General and Administrative Expenses
General and administrative expenses increased $11.3 million to $12.3 million for the year ended December 31, 2014 from $1.0 million for the year ended December 31, 2013, primarily related to an increase in equity-based compensation and professional fees to support our larger real estate portfolio and operations as a traded REIT subsequent to Listing. At the time the IPO ended in December 2013, we began to expense, as incurred, professional fees relating to stockholder services, because these costs no longer related to fulfilling subscriptions and offering costs. General and administrative expenses included equity-based compensation expense of $7.6 million for the year ended December 31, 2014 consisting of the amortization of the fair value of the OPP, which was adopted in conjunction with the Listing and board member equity-based compensation. Prior to the Listing, board member equity-based compensation was $0.1 million for the year ended December 31, 2013. Additionally, the Advisor elected to absorb $1.4 million and $1.5 million, respectively, of general and administrative expenses for the years ended December 31, 2014 and 2013.
Depreciation and Amortization Expense
Depreciation and amortization expense increased $53.0 million to $84.8 million for the year ended December 31, 2014, compared to $31.8 million for the year ended December 31, 2013. The increase in depreciation and amortization expense related mainly to our 2013/2014 Acquisitions, which resulted in additional expense of $55.1 million as well as $0.6 million related to the acceleration of depreciation on tenant improvements as a result of a partial lease termination and modification at 229 West 36th Street. The increase was partially offset by a $2.7 million decrease in depreciation and amortization expense relating to prior period tenant lease expirations and terminations, net of additional depreciation and amortization related to capital expenditures.
Interest Expense
Interest expense increased $13.0 million to $23.7 million for the year ended December 31, 2014 from $10.7 million for the year ended December 31, 2013 partly as a result of a higher weighted average balance outstanding on our Credit Facility of $439.2 million during the year ended December 31, 2014, compared to $63.7 million during the year ended December 31, 2013, as well as the associated increased amortization of deferred financing costs resulting from expanding our Credit Facility. Additionally, we expensed $3.6 million of financing costs during the year ended December 31, 2014 as a result of amendments to our Credit Facility.
Loss from Unconsolidated Joint Venture
Loss from unconsolidated joint venture was $1.5 million for the year ended December 31, 2014, which represents our preferred distribution, net of our pro rata share of the net loss of Worldwide Plaza and the amortization of the difference in basis between our investment and the book value of Worldwide Plaza's net assets, which we acquired in October 2013. During our period of ownership from October 31, 2013 to December 31, 2013, we had loss from unconsolidated joint venture of $0.1 million.
Income from Preferred Equity Investment, Investment Securities and Interest
Income from preferred equity investment, investment securities and interest increased $2.2 million to $2.9 million for the year ended December 31, 2014 from $0.7 million for the year ended December 31, 2013, which primarily represents income earned on our preferred equity investment in 123 William Street, acquired in October 2013, and our investments in redeemable preferred stock and equity securities.
Net Loss Attributable to Non-Controlling Interests
The net loss attributable to non-controlling interests during the year ended December 31, 2014 and 2013 was $1.3 million and approximately $32,000, respectively, which represents the net loss attributable to non-controlling interests for the period. The increase in net loss attributable to non-controlling interests was primarily driven by the increase in OP units resulting from the Listing, including the vesting of Class B units which were converted to OP units as well as the settlement of the Listing Note and subsequent conversion to OP units.
Cash Flows for the Year Ended December 31, 2015
For the year ended December 31, 2015, net cash provided by operating activities was $37.7 million, which represents an increase of $31.2 million over the $6.5 million of net cash provided by operating activities for the year ended December 31, 2014. The increase is primarily a result of strong leasing activity throughout the year ended December 31, 2015 and contractual rent escalations within our existing leases. The increase in cash provided by operating activities also related to a lower amount of prepaid expenses and other assets as well as accounts payable and accrued expenses that were relatively unchanged year-over-year, as opposed to the large cash outflow experienced in 2014 for the payment of prior year accrued capital expenditures (see below the discussion of cash flows for the year ended December 31, 2014).
45
The level of cash flows used in or provided by operating activities is affected by the timing of interest payments and the amount of borrowings outstanding during the period, as well as the receipt of scheduled rent payments and the level of property operating expenses. Notwithstanding a net loss of $40.3 million, net cash provided by operating activities included adjustments for depreciation and amortization of tangible and intangible real estate assets, equity-based compensation and other non-cash charges of $88.0 million, which resulted in cash inflows of $47.7 million. Net cash provided by operating activities also reflected an increase in accrued ground rent of $3.2 million, which results from recording rental expenses on a straight-line basis, a decrease in tenant and other receivables of $1.0 million and a decrease in prepaid expenses and other assets of $0.3 million. These cash inflows were partially offset by an increase in unbilled rent receivables of $13.7 million recorded in accordance with accounting for rental income on a straight-line basis, a decrease in deferred rent of $0.7 million and a decrease in accounts payable and accrued expenses of $0.1 million.
Net cash provided by investing activities during the year ended December 31, 2015 of $61.9 million primarily related to our 2015 Disposition as well and the redemption of our preferred equity investment of $70.9 million, distributions received from our investment in Worldwide Plaza of $12.1 million, acquisition funds released from escrow of $4.7 million and proceeds from the sale of investment securities of $4.6 million. These cash inflows were partially offset by capital expenditures for building and tenant improvements of $30.3 million and the purchase of investment securities of $0.1 million.
Net cash used in financing activities of $23.5 million during the year ended December 31, 2015 primarily related to repayments on our Credit Facility of $150.0 million, regularly scheduled principal payments on mortgage notes payable as well as full repayments of four mortgage notes payable and settlements through legal defeasance of two mortgage notes payable before the scheduled maturity dates of $88.8 million to facilitate including the underlying properties in the borrowing base of our Credit Facility in connection with a series of debt restructuring transactions we undertook at the end of the third quarter of 2015, dividends to common stockholders of $74.7 million, payments of financing costs of $10.8 million and payments of $0.5 million to secure interest rate caps for our mortgage notes payable on 1440 Broadway. Net cash used in financing activities also included $3.2 million of distributions to non-controlling interests such as OP unit and participating LTIP unit holders as well as the repayment of our non-controlling partner related to our 2015 Disposition. These cash outflows were partially offset by proceeds from mortgage notes payable of $305.0 million secured by 1440 Broadway.
Cash Flows for the Year Ended December 31, 2014
For the year ended December 31, 2014, net cash provided by operating activities was $6.5 million. The level of cash flows used in or provided by operating activities is affected by the volume of acquisition activity, the timing of interest payments and the amount of borrowings outstanding during the period, as well as the receipt of scheduled rent payments and the level of property operating expenses. Cash flows provided by operating activities during the year ended December 31, 2014 included $16.1 million of transaction costs relating to the Listing and the acquisition of 245-249 West 17th Street. Cash flows provided by operating activities included a net loss adjusted for non-cash items, resulting in a cash inflow of $43.4 million (net loss of $94.3 million adjusted for depreciation and amortization of tangible and intangible real estate assets and other non-cash charges of $137.7 million) and an increase in accrued ground rent of $4.3 million, which resulted from recording rental expenses on a straight-line basis. These cash inflows were partially offset by an increase in unbilled rent receivables of $19.6 million recorded in accordance with accounting for rental income on a straight-line basis, a decrease in accounts payable and accrued expenses of $8.7 million, primarily due to payments of prior year accrued tenant improvements at our 50 Varick Street property and fees paid to our Former Dealer Manager for services rendered in 2013 related to exploring our liquidity event, an increase in prepaid expenses and other assets of $6.6 million, primarily due to prepaid real estate taxes, insurance and deferred leasing costs, a decrease in deferred rent of $3.4 million and an increase in tenant and other receivables of $2.8 million, primarily due to amounts related to our preferred equity investment and other tenant receivables.
Net cash used in investing activities during the year ended December 31, 2014 of $327.8 million primarily related to $316.2 million for the acquisition of 245-249 W 17th Street, acquisition funds held in escrow of $4.7 million, $11.8 million of capital expenditures and $3.1 million in purchases of additional investment securities. These cash outflows were partially offset by distributions from our unconsolidated joint venture in Worldwide Plaza of $8.0 million.
Net cash provided by financing activities of $110.4 million during the year ended December 31, 2014 primarily related to proceeds from our line of credit of $330.0 million, proceeds from the issuance of common stock of $11.3 million and a $0.8 million contribution from the Advisor for OP units. These inflows were partially offset by the Tender Offer (as defined in Note 14 — Related Party Transactions and Arrangements to our consolidated financial statements) and other repurchases of common stock, including associated fees and expenses of $154.3 million, dividends to stockholders of $66.1 million, deferred financing costs paid of $7.3 million to expand our Credit Facility, offering costs paid of $1.5 million, $0.8 million of distributions to OP unit holders, redemption of OP units of $0.7 million, principal payments related to mortgage notes payable of $0.5 million and increases to restricted cash of $0.5 million.
46
Cash Flows for the Year Ended December 31, 2013
For the year ended December 31, 2013, net cash provided by operating activities was $9.4 million. The level of cash flows used in or provided by operating activities is affected by the volume of acquisition activity, the timing of interest payments and the amount of borrowings outstanding during the period, as well as the receipt of scheduled rent payments. Cash flows provided by operating activities during the year ended December 31, 2013 included $17.4 million of acquisition and transaction costs. Cash flows provided by operating activities included a net loss adjusted for non-cash items, resulting in a cash inflow of $12.9 million (net loss of $19.3 million adjusted for depreciation and amortization of tangible and intangible real estate assets and other non-cash charges of $32.2 million) and an increase in accounts payable and accrued expenses of $7.3 million primarily due to fees owed to our Former Dealer Manager of $2.1 million for services rendered related to exploring our liquidity event, operating costs associated with acquisitions and accrued tenant improvements, an increase in deferred rent of $7.1 million, an increase in accrued ground rent of $0.5 million, which results from recording rental expenses on a straight-line basis and a decrease in due from affiliated entities of $0.3 million. These cash inflows were partially offset by an increase in unbilled rent receivables of $9.0 million recorded in accordance with accounting for rental income on a straight-line basis, an increase in prepaid expenses and other assets of $8.6 million primarily due to prepaid real estate taxes, insurance and deferred leasing costs and an increase in tenant and other receivables of $1.2 million.
Net cash used in investing activities during the year ended December 31, 2013 of $1.3 billion primarily related to the acquisition of seven properties and real estate-related assets. Cash used in investing activities also included $12.1 million for capital expenditures and tenant improvements and $1.3 million for the purchase of investment securities. These cash outflows were partially offset by distributions from our unconsolidated joint venture in Worldwide Plaza of $2.1 million.
Net cash provided by financing activities of $1.5 billion during the year ended December 31, 2013 related to proceeds, net of receivables and repurchases, from the issuance of common stock of $1.5 billion and proceeds net of repayments on our Credit Facility of $285.0 million. These inflows were partially offset by payments related to offering costs of $148.2 million, repayments of mortgage notes payable of $72.9 million, dividends to stockholders of $17.8 million, payments related to financing costs of $7.6 million, increases to restricted cash of $0.2 million, payments to non-controlling interest holders of $1.0 million and payments of dividends to non-controlling interest holders of $0.1 million.
Non-GAAP Financial Measures
This section includes non-GAAP financial measures, including Funds from Operations, Core Funds from Operations, Adjusted Funds from Operations, Adjusted Earnings before Interest, Taxes and Depreciation and Amortization, Net Operating Income, Cash Net Operating Income and Adjusted Cash Net Operating Income. A description of these non-GAAP measures and reconciliations to the most directly comparable GAAP measure, which is net income (loss), is provided below.
Funds from Operations, Core Funds from Operations and Adjusted Funds from Operations
Due to certain unique operating characteristics of real estate companies, as discussed below, the National Association of Real Estate Investment Trusts (“NAREIT”), an industry trade group, has promulgated a measure known as funds from operations (“FFO”), which we believe to be an appropriate supplemental measure to reflect the operating performance of a REIT. The use of FFO is recommended by the REIT industry as a supplemental performance measure but is not equivalent to our net income or loss as determined under GAAP.
We define FFO, a non-GAAP measure, consistent with the standards set forth in the White Paper on FFO approved by the Board of Governors of NAREIT, as revised in February 2004 (the “White Paper”). The White Paper defines FFO as net income or loss computed in accordance with GAAP, but excluding gains or losses from sales of property and real estate related impairments, plus real estate related depreciation and amortization, and after adjustments for unconsolidated partnerships and joint ventures.
47
The historical accounting convention used for real estate assets requires straight-line depreciation of buildings and improvements, which implies that the value of a real estate asset diminishes predictably over time, especially if not adequately maintained or repaired and renovated as required by relevant circumstances or as requested or required by lessees for operational purposes in order to maintain the value disclosed. We believe that, because real estate values historically rise and fall with market conditions, including inflation, interest rates, the business cycle, unemployment and consumer spending, presentations of operating results for a REIT using historical accounting for depreciation and certain other items may be less informative. Historical accounting for real estate involves the use of GAAP. Any other method of accounting for real estate such as the fair value method cannot be construed to be any more accurate or relevant than the comparable methodologies of real estate valuation found in GAAP. Nevertheless, we believe that the use of FFO, which excludes the impact of real estate related depreciation and amortization, among other things, provides a more complete understanding of our performance to investors and to management, and when compared year over year, reflects the impact on our operations from trends in occupancy rates, rental rates, operating costs, general and administrative expenses, and interest costs, which may not be immediately apparent from net income (loss). However, FFO, core funds from operations ("Core FFO") and adjusted funds from operations (“AFFO”), as described below, should not be construed to be more relevant or accurate than the current GAAP methodology in calculating net income (loss) or in its applicability in evaluating our operating performance. In calculating FFO, Core FFO and AFFO, other REITs may not define FFO in accordance with the current NAREIT definition (as we do) or may interpret the current NAREIT definition differently than we do and/or calculate Core FFO and/or AFFO differently than we do. Consequently, our presentation of FFO, Core FFO and AFFO may not be comparable to other similarly titled measures presented by other REITs.
We consider FFO, Core FFO and AFFO useful indicators of our performance. Because FFO calculations exclude such factors as depreciation and amortization of real estate assets and gains or losses from sales of operating real estate assets (which can vary among owners of identical assets in similar conditions based on historical cost accounting and useful-life estimates), FFO facilitates comparisons of operating performance between periods and between other REITs in our peer group.
Changes in the accounting and reporting promulgations under GAAP (for acquisition fees and expenses from a capitalization/depreciation model to an expensed-as-incurred model) that were put into effect in 2009 and other changes to GAAP accounting for real estate subsequent to the establishment of NAREIT's definition of FFO have prompted an increase in cash-settled expenses, specifically acquisition fees and expenses for all industries as items that are expensed under GAAP, that are typically accounted for as operating expenses.
Core FFO is FFO, excluding acquisition and transaction related costs and other costs that are considered to be not "core" to our business and comparable from period to period, such as gains on sales of securities and investments, miscellaneous revenue, gains, losses and expenses related to the early extinguishment of debt and other non-core expenses. The purchase of properties, and the corresponding expenses associated with that process, has been a key operational feature of our business. In evaluating investments in real estate, we differentiate the costs to acquire the investment from the operations derived from the investment. By excluding expensed acquisition and transaction related costs and non-core revenues and expenses, we believe Core FFO provides useful supplemental information that is comparable for each type of real estate investment and is consistent with management's analysis of the investing and operating performance of our properties.
We exclude certain income or expense items from AFFO that we consider more reflective of investing activities, other non-cash income and expense items and the income and expense effects of other activities that are not a fundamental attribute of our business plan. These items include unrealized gains and losses, which may not ultimately be realized, such as gains or losses on derivative instruments and gains or losses on contingent valuation rights. We also exclude distributions on Class B units as the related shares are assumed to have converted to common stock in our calculation of fully diluted weighted average shares of common stock. In addition, by excluding non-cash income and expense items such as equity-based compensation expenses, amortization of above-market and below-market lease intangibles, amortization of deferred financing costs and straight-line rent from AFFO, we believe we provide useful information regarding income and expense items which have no cash impact and do not provide liquidity to the company or require capital resources of the company. Similarly, we include items such as free rent credits paid by sellers in our calculation of AFFO because these funds are paid to us during the free rent period and therefore impact our liquidity. By providing AFFO, we believe we are presenting useful information that assists investors and analysts to better assess the sustainability of our ongoing operating performance without the impacts of transactions that are not related to the ongoing profitability of our portfolio of properties. We also believe that AFFO is a recognized measure of sustainable operating performance by the REIT industry. Investors are cautioned that AFFO should only be used to assess the sustainability of our operating performance excluding these activities, as it excludes certain costs that have a negative effect on our operating performance during the periods in which these costs are incurred.
48
In calculating AFFO, we exclude certain expenses, which under GAAP are characterized as operating expenses in determining operating net income. These expenses are paid in cash by us, and therefore impact our liquidity. All paid and accrued merger, acquisition and transaction related fees and certain other expenses negatively impact our operating performance during the period in which expenses are incurred or properties are acquired will also have negative effects on returns to investors, the ability to fund dividends or distributions in the future, and cash flows generated by us, unless earnings from operations or net sales proceeds from the disposition of other properties are generated to cover the purchase price of the property and certain other expenses. AFFO that excludes such costs and expenses would only be comparable to companies that did not have such activities. Further, under GAAP, certain contemplated non-cash fair value and other non-cash adjustments are considered operating non-cash adjustments to net income in determining cash flow from operating activities. In addition, we view fair value adjustments as items which are unrealized and may not ultimately be realized. We view both gains and losses from fair value adjustments as items which are not reflective of ongoing operations and are therefore typically adjusted for when assessing operating performance. Excluding income and expense items detailed above from our calculation of AFFO provides information consistent with management's analysis of the operating performance of the properties. Additionally, fair value adjustments, which are based on the impact of current market fluctuations and underlying assessments of general market conditions, but can also result from operational factors such as rental and occupancy rates, may not be directly related or attributable to our current operating performance. By excluding such changes that may reflect anticipated and unrealized gains or losses, we believe AFFO provides useful supplemental information.
As a result, we believe that the use of FFO, Core FFO and AFFO, together with the required GAAP presentations, provide a more complete understanding of our performance relative to our peers and a more informed and appropriate basis on which to make decisions involving operating, financing, and investing activities.
The table below reflects the items deducted from or added to net loss in our calculation of FFO, Core FFO and AFFO during the period presented. We have calculated our FFO, Core FFO and AFFO based on our net loss, which is before adjusting for the net loss (income) attributable to our non-controlling interests, and all adjustments are made based on our gross adjustments, without excluding the portion of the adjustments attributable to our non-controlling interests, other than adjustments related to the unconsolidated joint venture.
49
Three Months Ended | Year Ended | |||||||||||||||||||
(In thousands) | March 31, 2015 | June 30, 2015 | September 30, 2015 | December 31, 2015 | December 31, 2015 | |||||||||||||||
Net loss (in accordance with GAAP)(1) | $ | (8,777 | ) | $ | (9,239 | ) | $ | (13,509 | ) | $ | (8,744 | ) | $ | (40,269 | ) | |||||
Gain on sale of real estate investment, net | — | — | — | (7,523 | ) | (7,523 | ) | |||||||||||||
Depreciation and amortization, net of adjustments related to joint venture(2) | 21,671 | 22,140 | 20,477 | 18,398 | 82,686 | |||||||||||||||
Depreciation and amortization related to unconsolidated joint venture(3) | 6,431 | 6,443 | 6,478 | 6,512 | 25,864 | |||||||||||||||
FFO | 19,325 | 19,344 | 13,446 | 8,643 | 60,758 | |||||||||||||||
Acquisition and transaction-related(4) | 125 | 96 | 2,850 | 700 | 3,771 | |||||||||||||||
Gain on sale of investment securities | (48 | ) | — | (54 | ) | (7 | ) | (109 | ) | |||||||||||
Non-core other income | (158 | ) | — | — | (1,795 | ) | (1,953 | ) | ||||||||||||
Non-core general and administrative expense(5) | 500 | 1,500 | — | — | 2,000 | |||||||||||||||
Non-core write-off of below-market lease(2) | (947 | ) | — | — | — | (947 | ) | |||||||||||||
Non-core straight-line rent bad debt expense | 529 | 8 | — | 19 | 556 | |||||||||||||||
Non-core derivative losses | — | — | 423 | — | 423 | |||||||||||||||
Non-core deferred financing costs(6) | — | — | 1,060 | 40 | 1,100 | |||||||||||||||
Core FFO | 19,326 | 20,948 | 17,725 | 7,600 | 65,599 | |||||||||||||||
Non-cash compensation expense(7) | 248 | 2,189 | 4,081 | 8,727 | 15,245 | |||||||||||||||
Deferred financing costs | 1,138 | 1,162 | 1,179 | 2,457 | 5,936 | |||||||||||||||
Seller free rent credit | 3,679 | 872 | 197 | — | 4,748 | |||||||||||||||
Amortization of market lease intangibles | (2,124 | ) | (1,842 | ) | (1,843 | ) | (1,610 | ) | (7,419 | ) | ||||||||||
Mark-to-market adjustments on derivatives | 4 | — | 117 | 34 | 155 | |||||||||||||||
Straight-line rent | (5,870 | ) | (2,856 | ) | (2,525 | ) | (2,431 | ) | (13,682 | ) | ||||||||||
Straight-line ground rent | 987 | 787 | 719 | 686 | 3,179 | |||||||||||||||
Tenant improvements - second generation | — | — | — | (43 | ) | (43 | ) | |||||||||||||
Leasing commissions - second generation | (3 | ) | (3 | ) | (12 | ) | (194 | ) | (212 | ) | ||||||||||
Building improvements - second generation | (9 | ) | (51 | ) | (201 | ) | (962 | ) | (1,223 | ) | ||||||||||
Proportionate share of straight-line rent related to unconsolidated joint venture | (714 | ) | (773 | ) | (988 | ) | (884 | ) | (3,359 | ) | ||||||||||
AFFO | $ | 16,662 | $ | 20,433 | $ | 18,449 | $ | 13,380 | $ | 68,924 | ||||||||||
(1) | During the fourth quarter of 2015, we identified certain immaterial errors impacting interest expense in our previously issued quarterly financial statements. Interest expense and net loss were understated by $0.3 million for each of the quarters ended March 31, 2015, June 30, 2015 and September 30, 2015. Quarterly amounts in the table above have been revised to reflect the corrected amounts. |
(2) | During the fourth quarter of 2015, we reclassified the write-off of a terminated below-market lease from depreciation and amortization expense to revenue, which impacted the first quarter of 2015. Depreciation and amortization for the quarter ended March 31, 2015 has been revised to reflect this reclassification. The impact of the below-market lease write-off was deemed to be non-core to our business and is now being included in the reconciliation to Core FFO. |
(3) | Proportionate share of depreciation and amortization related to unconsolidated joint venture and amortization of difference in basis. |
(4) | Acquisition and transaction-related expenses for the third quarter of 2015 primarily represent costs associated with mortgage payoffs and our Credit Facility amendment. For the fourth quarter of 2015, these costs are primarily related to litigation at Worldwide Plaza and professional fees related to the exploration of strategic transactions. |
(5) | Represents our estimate of non-core audit fees. |
(6) | Represents deferred financing costs that were written off as a result of paying off mortgages in advance of their scheduled maturity dates. |
(7) | During the second quarter of 2015, we excluded equity-based compensation from our calculation of Core FFO for the first time. During the third quarter of 2015, we reverted to our previous practice of excluding the impact of non-cash compensation expense from the reconciliation to Core FFO to the reconciliation to AFFO for all periods presented. |
50
Adjusted Earnings before Interest, Taxes, Depreciation and Amortization, Net Operating Income, Cash Net Operating Income and Adjusted Cash Net Operating Income.
We believe that earnings before interest, taxes, depreciation and amortization adjusted for acquisition and transaction-related expenses, other non-cash items and including our pro rata share from unconsolidated joint ventures ("Adjusted EBITDA") is an appropriate measure of our ability to incur and service debt. Adjusted EBITDA should not be considered as an alternative to cash flows from operating activities, as a measure of our liquidity or as an alternative to net income as an indicator of our operating activities. Other REITs may calculate Adjusted EBITDA differently and our calculation should not be compared to that of other REITs.
Net operating income ("NOI") is a non-GAAP financial measure equal to net income (loss), the most directly comparable GAAP financial measure, less discontinued operations, interest, other income and income from preferred equity investments and investments securities, plus corporate general and administrative expense, acquisition and transaction-related expenses, depreciation and amortization, other non-cash expenses and interest expense. NOI is adjusted to include our pro rata share of NOI from unconsolidated joint ventures. Cash NOI is NOI presented on a cash basis, which is NOI after eliminating the effects of straight-lining of rent and the amortization of above and below market leases. Adjusted Cash NOI is Cash NOI after eliminating the effects of free rent.
We use NOI, Cash NOI and Adjusted Cash NOI internally as performance measures and believe NOI, Cash NOI and Adjusted Cash NOI provide useful information to investors regarding our financial condition and results of operations because it reflects only those income and expense items that are incurred at the property level. Therefore, we believe NOI, Cash NOI and Adjusted Cash NOI are useful measures for evaluating the operating performance of our real estate assets and to make decisions about resource allocations. Further, we believe NOI, Cash NOI and Adjusted Cash NOI are useful to investors as performance measures because, when compared across periods, NOI, Cash NOI and Adjusted Cash NOI reflect the impact on operations from trends in occupancy rates, rental rates, operating costs and acquisition activity on an unlevered basis. NOI, Cash NOI and Adjusted Cash NOI exclude certain components from net income in order to provide results that are more closely related to a property's results of operations. For example, interest expense is not linked to the operating performance of a real estate asset and Cash NOI is not affected by whether the financing is at the property level or corporate level. In addition, depreciation and amortization, because of historical cost accounting and useful life estimates, may distort operating performance at the property level. NOI, Cash NOI and Adjusted Cash NOI presented by us may not be comparable to NOI, Cash NOI and Adjusted Cash NOI reported by other REITs that define NOI, Cash NOI and Adjusted Cash NOI differently. We believe that in order to facilitate a clear understanding of our operating results, NOI, Cash NOI and Adjusted Cash NOI should be examined in conjunction with net income (loss) as presented in our consolidated financial statements. NOI, Cash NOI and Adjusted Cash NOI should not be considered as an alternative to net income (loss) as an indication of our performance or to cash flows as a measure of our liquidity.
51
The table below reflects the reconciliation of net loss to Adjusted EBITDA, NOI, Cash NOI and Adjusted Cash NOI during the period presented. We have calculated our Adjusted EBITDA, NOI, Cash NOI and Adjusted Cash NOI based on our net loss, which is before adjusting for the net loss (income) attributable to our non-controlling interests, and all adjustments are made based on our gross adjustments, without excluding the portion of the adjustments attributable to our non-controlling interests, other than adjustments related to the unconsolidated joint venture as noted in the table below.
Three Months Ended | Year Ended | |||||||||||||||||||
(In thousands) | March 31, 2015 | June 30, 2015 | September 30, 2015 | December 31, 2015 | December 31, 2015 | |||||||||||||||
Net loss (in accordance with GAAP)(1) | $ | (8,777 | ) | $ | (9,239 | ) | $ | (13,509 | ) | $ | (8,744 | ) | $ | (40,269 | ) | |||||
Acquisition and transaction-related | 125 | 96 | 2,850 | 700 | 3,771 | |||||||||||||||
Depreciation and amortization(1) | 21,680 | 22,154 | 20,484 | 18,398 | 82,716 | |||||||||||||||
Interest expense(2) | 6,249 | 6,347 | 7,495 | 9,271 | 29,362 | |||||||||||||||
Gain on sale of real estate investment, net | — | — | — | (7,523 | ) | (7,523 | ) | |||||||||||||
Loss on derivatives | 4 | — | 540 | 34 | 578 | |||||||||||||||
Adjustments related to unconsolidated joint venture(3) | 11,264 | 11,324 | 11,418 | 11,453 | 45,459 | |||||||||||||||
Adjusted EBITDA | 30,545 | 30,682 | 29,278 | 23,589 | 114,094 | |||||||||||||||
General and administrative | 3,950 | 5,203 | 6,519 | 11,673 | 27,345 | |||||||||||||||
Asset management fee incurred from the Advisor | 3,144 | 3,101 | 3,121 | 3,099 | 12,465 | |||||||||||||||
Income from preferred equity investment, investment securities and interest | (930 | ) | (8 | ) | (141 | ) | (24 | ) | (1,103 | ) | ||||||||||
Preferred return on unconsolidated joint venture | (3,851 | ) | (3,894 | ) | (3,936 | ) | (4,055 | ) | (15,736 | ) | ||||||||||
Proportionate share of other adjustments related to unconsolidated joint venture | 1,883 | 1,905 | 1,924 | 1,983 | 7,695 | |||||||||||||||
NOI | 34,741 | 36,989 | 36,765 | 36,265 | 144,760 | |||||||||||||||
Amortization of above/below market lease assets and liabilities(1) | (3,071 | ) | (1,842 | ) | (1,843 | ) | (1,610 | ) | (8,366 | ) | ||||||||||
Straight-line rent | (5,341 | ) | (2,848 | ) | (2,525 | ) | (2,412 | ) | (13,126 | ) | ||||||||||
Straight-line ground rent | 987 | 787 | 719 | 686 | 3,179 | |||||||||||||||
Proportionate share of adjustments related to unconsolidated joint venture | (714 | ) | (773 | ) | (988 | ) | (884 | ) | (3,359 | ) | ||||||||||
Cash NOI | 26,602 | 32,313 | 32,128 | 32,045 | 123,088 | |||||||||||||||
Free rent | 4,498 | 1,880 | 1,808 | 1,336 | 9,522 | |||||||||||||||
Adjusted Cash NOI | $ | 31,100 | $ | 34,193 | $ | 33,936 | $ | 33,381 | $ | 132,610 | ||||||||||
_________________
(1) | During the fourth quarter of 2015, we reclassified the write-off of a terminated below-market lease from depreciation and amortization expense to revenue, which impacted the first quarter of 2015. Depreciation and amortization for the quarter ended March 31, 2015 and amortization of above/below market lease assets and liabilities have been revised to reflect this reclassification. |
(2) | During the fourth quarter of 2015, we identified certain immaterial errors impacting interest expense in our previously issued quarterly financial statements. Interest expense and net loss were understated by $0.3 million for each of the quarters ended March 31, 2015, June 30, 2015 and September 30, 2015. Quarterly amounts in the table above have been revised to reflect the corrected amounts. |
(3) | Proportionate share of adjustments related to unconsolidated joint venture and amortization of difference in basis. |
52
Liquidity and Capital Resources
As of December 31, 2015, we had cash and cash equivalents of $98.6 million. In the normal course of business, our principal demands for funds are to pay or fund operating expenses, capital expenditures, dividends and distributions to our stockholders and OP unit and LTIP unitholders, and principal and interest payments on our outstanding indebtedness. We have met these demands primarily through cash flows from operations, borrowings under our Credit Facility, preferred distributions from Worldwide Plaza and the sale or redemption of certain assets. Future sources of capital could also include proceeds from secured or unsecured financings from banks or other lenders, proceeds from offerings, proceeds from the sale of properties and undistributed funds from operations. Our principal sources and uses of funds are further described below.
Principal Sources of Funds
Cash Flows from Operating Activities
Our cash flows from operating activities is primarily dependent upon the occupancy level of our portfolio, the net effective rental rates achieved on our leases, the collectability of rent, operating escalations and recoveries from our tenants and the level of operating and other costs, including general and administrative expenses. We expect to continue to increase the amount of cash flow generated from operating activities in future periods through additional stabilization of our current investment portfolio. Furthermore, we anticipate increased cash flow through future leasing activity and the contractual rent escalations included in a majority of our current leases during the primary term of the lease.
Availability of Funds from Credit Facility
On April 14, 2014, we entered into our Credit Facility with Capital One. The Credit Facility allows for total borrowings of up to $705.0 million with a $305.0 million term loan and a $400.0 million revolving loan which mature on August 20, 2018 and August 20, 2016, respectively. We have two one-year options to extend the revolving loan to August 20, 2018 subject to customary conditions and fees, which we intend to exercise. The Credit Facility contains an "accordion feature" to allow us, under certain circumstances, and with consent of our lenders, to increase the aggregate loan borrowings to up to $1.0 billion of total borrowings. The actual availability of borrowings under our Credit Facility for any period is based on requirements outlined in our Credit Facility with respect to the pool of eligible unencumbered assets that comprise our borrowing base properties. The unused borrowing capacity, based on the debt service coverage ratio of the borrowing base properties as of December 31, 2015, was $63.0 million.
On August 27, 2015, we entered into an amendment pursuant to which certain changes were made under the Credit Facility primarily to increase the borrowing base capacity including, among other changes, (i) the ability to add the Viceroy Hotel as a borrowing base asset, (ii) reducing the debt service coverage ratio test from 1.4 to 1.3 for draw downs on the Credit Facility, (iii) increasing the amount of dividends we are permitted to pay relative to our Modified Funds From Operations (as defined in the Credit Facility) for the twelve months commencing June 30, 2015 from 95% to 100%, and (iv) increasing the amount we can spend to repurchase shares of common stock during a fiscal year from $65.0 million to $100.0 million.
We repaid $150.0 million in advances on the revolving portion of our Credit Facility during the year ended December 31, 2015. As of December 31, 2015, the outstanding balance of the term loan and revolving components of the Credit Facility was $305.0 million and $180.0 million, respectively, with a combined weighted average interest rate of 2.4%.
The Credit Facility requires interest only payments, with all principal outstanding being due on the maturity dates. The Credit Facility may be prepaid at any time, in whole or in part, without premium or penalty. In the event of a default, the lenders have the right to terminate their obligations under the Credit Facility and to accelerate the payment on any unpaid principal amount of all outstanding loans.
The Credit Facility requires us to meet certain financial and non-financial covenants, including the maintenance of certain financial ratios (such as specified debt to equity and debt service coverage ratios) as well as the maintenance of a minimum net worth. We were in compliance with all financial and non-financial covenants under the Credit Facility as of December 31, 2015. We continuously monitor our compliance with all covenants. Certain covenants may restrict our ability to obtain additional borrowings under the Credit Facility or alternative sources of capital, such as the minimum debt service coverage ratio that we must maintain.
We view a mix of secured and unsecured financing sources as an efficient and accretive means to acquire properties and manage our working capital needs. Our interest expense in future periods will vary based, in part, on our level of future borrowings and the cost of these borrowings.
Strategic Alternatives
As previously disclosed, on October 1, 2015, we announced that we have retained the Eastdil Secured division of Wells Fargo Securities as strategic advisor to identify and evaluate potential strategic transactions at the entity or asset level. Our board continues to explore and evaluate strategic alternatives to enhance stockholder value.
53
Initiatives to Increase Liquidity and Create Long-Term Value for our Stockholders
During the second quarter of 2015, we announced several initiatives designed to increase our liquidity and create long-term value for our stockholders. These initiatives include 1) increasing Cash NOI by leasing currently vacant space, stabilizing revenue at the Viceroy Hotel and releasing currently below-market expiring space at market rates; 2) considering joint venture partners in our top five assets to unlock excess value; 3) exploring the sale of five non-core assets in the Brooklyn and Queens boroughs of New York City; and 4) realizing internal growth opportunities by repositioning office and basement space to retail space at 1440 Broadway as well as converting the lobby to rentable retail space.
During the fourth quarter of 2015, we signed five new leases for our pro rata share of 125,727 rentable square feet which, on a weighted-average basis, increased initial cash rents by 23% over prior escalated rents. We continue to market our vacant spaces at 256 W. 38th Street, 229 W. 36th Street, 350 Bleecker Street and 1440 Broadway.
During the fourth quarter of 2015, we sold one of our five non-core assets, 163 Washington Avenue in Brooklyn, New York for $37.7 million. We also entered into agreements of purchase and sale on our Duane Reade, 1623 Kings Highway and Foot Locker properties. The sales of Duane Reade and 1623 Kings Highway closed in February 2016 for contract sales prices of $12.6 million and $17.0 million, respectively, exclusive of closing costs. At closing, we repaid the mortgage notes payable securing Duane Reade and 1623 Kings Highway of $8.4 million and $7.3 million, respectively.
We continue to explore the sale of our property located at 1100 Kings Highway in Brooklyn, New York and to focus on our retail repositioning efforts at 1440 Broadway.
Other Sources of Funds
On March 27, 2015, the owner of 123 William Street, the property in which we held our $35.1 million preferred equity investment, sold the property to ARC NYCR, which is advised by entities under common control with our Advisor. The sponsor of ARC NYCR is also our Sponsor. On that date, we received the entire principal balance plus accrued and unpaid income. Cash received from the sale of our preferred equity investment has increased our liquidity and the funds available for dividends to our stockholders and other working capital requirements.
During the year ended December 31, 2015, we received $12.1 million in preferred distributions from our investment in Worldwide Plaza. We expect to continue to receive cash distributions from Worldwide Plaza in accordance with our investment agreement.
During the third quarter of 2015, we obtained a mortgage note payable of up to $325.0 million, secured by our property located at 1440 Broadway. As of December 31, 2015, the mortgage note payable outstanding was $305.0 million, and up to $20.0 million is available in the future as additional advances, subject to customary funding conditions to pay, among other things, for certain tenant allowances, capital expenditures and leasing costs that have been approved by the lender.
Principal Use of Funds
Capital Expenditures
As of December 31, 2015, we owned 22 properties. In connection with the leasing of our properties, we have entered into and will continue to enter into agreements with our tenants to provide allowances for tenant improvements. These allowances require us to fund capital expenditures up to amounts specified in our lease agreements. We intend to fund tenant improvement allowances with cash on hand and cash flows from operations.
Repurchase of Common Stock
On June 22, 2015, our board of directors authorized us to repurchase up to $150.0 million of our common stock. We may opportunistically repurchase shares during periods of favorable market conditions to increase stockholder value. Any repurchases made in the future would be funded with cash on hand, cash flow from operations and excess cash from the sale of non-core assets. As of December 31, 2015, we had not repurchased any shares pursuant to this initiative.
Worldwide Plaza Option
We expect to exercise our purchase option, which will be in the amount of $1.4 billion less the amount of mortgage debt outstanding, for the remaining interest in Worldwide Plaza during the option exercise period commencing in January 2017 and fund the purchase option using cash on hand and future mortgage financing secured by Worldwide Plaza. Failure to exercise this option will subject us to a fee equal to $25.0 million. In addition, the loan securing Worldwide Plaza includes provisions which could restrict our exercise of the option unless we prepay the loan or meet certain tests, including net worth tests. While we believe we currently meet such tests, there can be no assurance that we will meet them at the time that we desire to exercise the option.
54
Joint Ventures with ARC NYCR
On October 1, 2015, we announced that we intend to enter into joint venture agreements with ARC NYCR, which is intended to better align interests between us and ARC NYCR and to facilitate the continued growth and diversification of both portfolios with reduced need to raise additional equity capital. Any joint venture agreement will require approval by our board of directors and the board of directors of ARC NYCR. We have suspended efforts to form a joint venture agreement with ARC NYCR due to our ongoing evaluation of strategic alternatives.
Dividends
We are required to distribute annually at least 90% of our annual REIT taxable income, determined without regard for the deduction for dividends paid and excluding net capital gains. During the year ended December 31, 2015, we declared and paid a dividend rate equal to $0.46 per share per annum. Payments were made to stockholders of record at the close of business on the 8th day of each month, and payable on the 15th day of such month. For U.S. Federal income tax purposes, amounts paid to our stockholders may be a return of capital and not a return on a stockholder's investment.
During the year ended December 31, 2015, dividends paid totaled $77.3 million, inclusive of $2.6 million of distributions paid on OP units and participating LTIP units. During the year ended December 31, 2015, cash used to pay our dividends was primarily generated from cash flows provided by operations, proceeds from the return of our preferred equity investment in 123 William Street and proceeds from Worldwide Plaza. We expect to fund dividend payments over the next twelve months primarily from cash flows from operations, distributions in respect of our interest in Worldwide Plaza, the proceeds received from the investment securities we sold during the year ended December 31, 2015 and proceeds from the sale of non-core assets, two of which occurred during the first quarter of 2016.
The following table shows the sources for the payment of dividends for the periods presented:
Three Months Ended | Year Ended | ||||||||||||||||||||||||||||||||||
March 31, 2015 | June 30, 2015 | September 30, 2015 | December 31, 2015 | December 31, 2015 | |||||||||||||||||||||||||||||||
(Dollars in thousands) | Percentage of Distributions | Percentage of Distributions | Percentage of Distributions | Percentage of Distributions | Percentage of Distributions | ||||||||||||||||||||||||||||||
Distributions: | |||||||||||||||||||||||||||||||||||
Dividends paid in cash | $ | 18,654 | $ | 18,651 | $ | 18,711 | $ | 18,691 | $ | 74,707 | |||||||||||||||||||||||||
Other(1) | 593 | 768 | 621 | 621 | 2,603 | ||||||||||||||||||||||||||||||
Total dividends | $ | 19,247 | $ | 19,419 | $ | 19,332 | $ | 19,312 | $ | 77,310 | |||||||||||||||||||||||||
Source of dividend coverage: | |||||||||||||||||||||||||||||||||||
Cash flows provided by operations | $ | 14,446 | 75.1 | % | $ | 1,886 | 9.7 | % | $ | 16,912 | 87.5 | % | $ | 4,481 | 23.2 | % | $ | 37,725 | 48.8 | % | |||||||||||||||
Proceeds from return of preferred equity investment | 4,801 | 24.9 | % | 17,533 | 90.3 | % | 2,420 | 12.5 | % | 10,346 | 53.6 | % | 35,100 | 45.4 | % | ||||||||||||||||||||
Distributions in respect of our interest in Worldwide Plaza | — | — | % | — | — | % | — | — | % | 4,485 | 23.2 | % | 4,485 | 5.8 | % | ||||||||||||||||||||
Total sources of dividends | $ | 19,247 | 100.0 | % | $ | 19,419 | 100.0 | % | $ | 19,332 | 100.0 | % | $ | 19,312 | 100.0 | % | $ | 77,310 | 100.0 | % | |||||||||||||||
Cash flows provided by operations (GAAP basis) | $ | 14,446 | $ | 1,886 | $ | 16,912 | $ | 4,481 | $ | 37,725 | |||||||||||||||||||||||||
Net loss attributable to stockholders (in accordance with GAAP)(2) | $ | (8,516 | ) | $ | (8,982 | ) | $ | (13,075 | ) | $ | (8,508 | ) | $ | (39,081 | ) | ||||||||||||||||||||
__________________
(1) | Includes distributions on OP units and participating LTIP units but excludes distributions paid to our non-controlling partner in 163 Washington Avenue as a result of the sale of the property in October 2015. |
(2) | During the fourth quarter of 2015, we identified certain immaterial errors impacting interest expense in our previously issued quarterly financial statements. Interest expense and net loss were understated by $0.3 million for each of the quarters ended March 31, 2015, June 30, 2015 and September 30, 2015. Quarterly amounts in the table above have been revised to reflect the corrected amounts. |
55
Future dividend payments are dependent on the availability of funds. Our board of directors may reduce the amount of dividends or distributions paid or suspend dividend payments at any time and therefore dividend payments are not assured. We have not generated and may not in the future generate operating cash flows sufficient to continue to pay dividends to our stockholders at the current rate. We have in the past been, and may again in the future be, required to borrow funds to fund dividends. During 2016, we do not expect to have sufficient cash flow from operations to pay dividends at our current rate. We expect to be able to pay dividends from a combination of cash flow from operations and cash on hand. Actual cash available for dividends may vary substantially from our estimates. If our cash flow from operations and cash on hand are not sufficient, we may need to borrow funds, potentially at higher rates, or depend on our Advisor or our Property Manager to waive fees or reimbursement of certain expenses, which they are not required to do, to fund our operations and any dividends to our stockholders. There is no assurance that we will be able to obtain funds from such sources, or pay or maintain our current level of dividends.
Loan Obligations
As of December 31, 2015, we had consolidated mortgage notes payable of $388.4 million, excluding $427.9 million of unconsolidated mortgage debt relating to our pro rata share of Worldwide Plaza's total mortgage debt of $875.0 million. As of December 31, 2015, the consolidated mortgage notes payable had a weighted average interest rate of 3.8% and our pro rata share of unconsolidated mortgage debt relating to Worldwide Plaza had a weighted average interest rate of 4.6%.
The payment terms of our mortgage loan obligations require principal and interest amounts payable monthly and our Credit Facility is interest-only with all unpaid principal and interest due at maturity. Our loan agreements require us to comply with specific reporting covenants. As of December 31, 2015, we were in compliance with the debt covenants under our loan agreements.
Our mortgage loans securing Foot Locker and Duane Reade are scheduled to mature in 2016. The mortgage loan securing Duane Reade was repaid in advance of its scheduled maturity date upon the sale of the property in February 2016. Foot Locker is currently under contract and we expect to repay that mortgage at closing of the sale of the property. The revolving portion of our Credit Facility is also scheduled to mature in 2016. We intend to exercise our two, one-year, extension options, which will extend the maturity date of the revolving portion of the Credit Facility to August 2018.
Contractual Obligations
Debt Obligations
The following is a summary of our contractual debt obligations as of December 31, 2015:
Years Ended December 31, | ||||||||||||||||||||
(In thousands) | Total | 2016 | 2017 — 2018 | 2019 — 2020 | Thereafter | |||||||||||||||
Principal payments due: | ||||||||||||||||||||
Mortgage notes payable | $ | 388,436 | $ | 12,068 | $ | 59,236 | $ | 312,910 | $ | 4,222 | ||||||||||
Credit Facility | 485,000 | 180,000 | 305,000 | — | — | |||||||||||||||
$ | 873,436 | $ | 192,068 | $ | 364,236 | $ | 312,910 | $ | 4,222 | |||||||||||
Interest payments due: | ||||||||||||||||||||
Mortgage notes payable | $ | 53,969 | $ | 16,250 | $ | 26,464 | $ | 11,154 | $ | 101 | ||||||||||
Credit Facility | 22,814 | 10,186 | 12,628 | — | — | |||||||||||||||
$ | 76,783 | $ | 26,436 | $ | 39,092 | $ | 11,154 | $ | 101 | |||||||||||
Lease Obligations
We entered into lease agreements with the owners of the ground leases at 350 Bleecker Street and the Viceroy Hotel. The following table reflects the minimum base rental cash payments due from us over the next five years and thereafter under these arrangements. These amounts exclude contingent rent payments, as applicable, that may be payable based on provisions related to increases in annual rent based on exceeding certain economic indexes, among other items.
Years Ended December 31, | ||||||||||||||||||||
(In thousands) | Total | 2016 | 2017 — 2018 | 2019 — 2020 | Thereafter | |||||||||||||||
Capital lease obligations | $ | 3,834 | $ | 86 | $ | 172 | $ | 172 | $ | 3,404 | ||||||||||
Operating lease obligations | 271,925 | 4,958 | 9,994 | 10,692 | 246,281 | |||||||||||||||
Total lease obligations | $ | 275,759 | $ | 5,044 | $ | 10,166 | $ | 10,864 | $ | 249,685 | ||||||||||
56
Election as a REIT
We elected and qualified to be taxed as a REIT under the Code, effective for our taxable year ended December 31, 2010. We believe that, commencing with such taxable year, we have been organized and operated in a manner so that we qualify for taxation as a REIT under the Code. We intend to continue to operate in such a manner, but no assurance can be given that we will operate in a manner so as to remain qualified for taxation as a REIT. In order to continue to qualify for taxation as a REIT we must, among other things, distribute annually at least 90% of our REIT taxable income (which does not equal net income as calculated in accordance with GAAP) determined without regard for the deduction for dividends paid and excluding net capital gains, and must comply with a number of other organizational and operational requirements. If we continue to qualify for taxation as a REIT, we generally will not be subject to federal corporate income tax on that portion of our REIT taxable income that we distribute to our stockholders. Even if we qualify for taxation as a REIT, we may be subject to certain state and local taxes on our income and properties as well as federal income and excise taxes on our undistributed income.
Inflation
Many of our leases contain provisions designed to mitigate the adverse impact of inflation. These provisions generally increase rental rates during the terms of the leases either at fixed rates or indexed escalations (based on the Consumer Price Index or other measures). We may be adversely impacted by inflation on the leases that do not contain indexed escalation provisions. In addition, our net leases require the tenant to pay its allocable share of operating expenses, which may include common area maintenance costs, real estate taxes and insurance. This may reduce our exposure to increases in costs and operating expenses resulting from inflation.
Related-Party Transactions and Agreements
We have entered into agreements with affiliates of our Sponsor, whereby we have paid or may in the future pay certain fees or reimbursements to our Advisor, its affiliates and entities under common control with our Advisor in connection with acquisition and financing activities, asset and property management services and reimbursement of operating and offering related costs. See Note 14 — Related Party Transactions and Arrangements to our consolidated financial statements included in this report and "Item 13. Certain Relationships and Related Transactions, and Director Independence" for a discussion of our various related party transactions.
Off-Balance - Sheet Arrangements
We have no off-balance-sheet arrangements that have or are reasonably likely to have a current or future effect on our financial condition, changes in financial condition, revenues or expenses, results of operations, liquidity, capital expenditures or capital resources that are material to investors.
Subsequent Events
On February 1, 2016, we issued 2,515,406 shares of our common stock upon redemption of 2,515,406 OP units held by certain individuals who are members of the Advisor and Sponsor.
On February 2, 2016, we closed on the sale of our Duane Reade property and repaid the mortgage securing that property.
On February 17, 2016, we closed on the sale of our property located at 1623 Kings Highway and repaid the mortgage securing that property.
Item 7A. Quantitative and Qualitative Disclosures About Market Risk.
The market risk associated with financial instruments and derivative financial instruments is the risk of loss from adverse changes in market prices or interest rates. Our long-term debt, which consists of secured financings and our Credit Facility, bears interest at fixed rates and variable rates. Our interest rate risk management objectives are to limit the impact of interest rate changes on earnings and cash flows and to lower our overall borrowing costs. From time to time, we may enter into interest rate hedge contracts such as swaps, caps, collars and treasury lock agreements in order to mitigate our interest rate risk with respect to various debt instruments. We do not hold or issue these derivative contracts for trading or speculative purposes. We do not have any foreign operations and thus we are not exposed to foreign currency fluctuations.
57
As of December 31, 2015, our debt consisted of both fixed and variable-rate debt. We had fixed-rate secured mortgage notes payable and fixed-rate loans under our Credit Facility, with an aggregate carrying value of $163.4 million and a fair value of $167.8 million. Changes in market interest rates on our fixed-rate debt impact the fair value of the notes, but it has no impact on interest due on the notes. For instance, if interest rates rise 100 basis points and our fixed rate debt balance remains constant, we expect the fair value of our obligation to decrease, the same way the price of a bond declines as interest rates rise. The sensitivity analysis related to our fixed–rate debt assumes an immediate 100 basis point move in interest rates from their December 31, 2015 levels, with all other variables held constant. A 100 basis point increase in market interest rates would result in a decrease in the fair value of our fixed-rate debt by $1.7 million. A 100 basis point decrease in market interest rates would result in an increase in the fair value of our fixed-rate debt by $1.7 million.
As of December 31, 2015, our variable-rate debt had a carrying and fair value of $710.0 million. Interest rate volatility associated with this variable-rate debt affects interest expense incurred and cash flow. The sensitivity analysis related to our variable-rate debt assumes an immediate 100 basis point move in interest rates from their December 31, 2015 levels, with all other variables held constant. A 100 basis point increase or decrease in variable interest rates on our variable-rate debt would increase or decrease our interest expense by $7.1 million annually.
These amounts were determined by considering the impact of hypothetical interest rates changes on our borrowing costs, and assuming no other changes in our capital structure. As the information presented above includes only those exposures that existed as of December 31, 2015, it does not consider exposures or positions arising after that date. The information represented herein has limited predictive value. Future actual realized gains or losses with respect to interest rate fluctuations will depend on cumulative exposures, hedging strategies employed and the magnitude of the fluctuations.
Item 8. Financial Statements and Supplementary Data.
The information required by this Item 8 is hereby incorporated by reference to our Consolidated Financial Statements beginning on page F-1 of this Annual Report on Form 10-K.
Item 9. Changes in and Disagreements With Accountants on Accounting and Financial Disclosure.
None.
Item 9A. Controls and Procedures.
Evaluation of Disclosure Controls and Procedures
In accordance with Rules 13a-15(b) and 15d-15(e) of the Securities Exchange Act of 1934, as amended (the "Exchange Act"), our management, under the supervision and with the participation of our Chief Executive Officer and Interim Chief Financial Officer, carried out an evaluation of the effectiveness of our disclosure controls and procedures (as defined in Rule 13a-15(e) and Rule 15d-15(e) of the Exchange Act) as of the end of the period covered by this Annual Report on Form 10-K. Based on such evaluation, our Chief Executive Officer and Interim Chief Financial Officer have concluded, as of the end of such period, that our disclosure controls and procedures are effective in recording, processing, summarizing and reporting, on a timely basis, information required to be disclosed by us in our reports that we file or submit under the Exchange Act.
Management's Annual Report on Internal Control over Financial Reporting
Management is responsible for establishing and maintaining adequate internal control over financial reporting, as such term is defined in Rule 13a-15(f) promulgated under the Exchange Act and as set forth below. Under Rule 13a-15(c), management must evaluate, with the participation of the Chief Executive Officer and Interim Chief Financial Officer, the effectiveness, as of the end of each calendar year, of our internal control over financial reporting. The term internal control over financial reporting is defined as a process designed by, or under the supervision of, the issuer's principal executive and principal financial officers, or persons performing similar functions, and effected by the issuer's board of directors, management and other personnel, to provide reasonable assurance regarding the reliability of financial reporting and the preparation of financial statements for external purposes in accordance with generally accepted accounting principles and includes those policies and procedures that:
1) | Pertain to the maintenance of records that in reasonable detail accurately and fairly reflect the transactions and dispositions of the assets of the issuer; |
2) | Provide reasonable assurance that transactions are recorded as necessary to permit preparation of financial statements in accordance with generally accepted accounting principles, and that receipts and expenditures of the issuer are being made only in accordance with authorizations of management and directors of the issuer; and |
3) | Provide reasonable assurance regarding prevention or timely detection of unauthorized acquisition, use or disposition of the issuer's assets that could have a material effect on the financial statements. |
58
Because of its inherent limitations, internal control over financial reporting may not prevent or detect misstatements. Projections of any evaluation of effectiveness to future periods are subject to the risk that controls may become inadequate because of changes in conditions or that the degree of compliance with the policies or procedures may deteriorate.
In the course of preparing this Annual Report on Form 10-K and the consolidated financial statements included herein, our management conducted an evaluation of the effectiveness of our internal control over financial reporting as of December 31, 2015 using the criteria issued by the Committee of Sponsoring Organizations of the Treadway Commission (COSO) in the Internal Control-Integrated Framework (2013). Based on that evaluation, management concluded that our internal control over financial reporting was effective as of December 31, 2015.
KPMG LLP, an independent registered public accounting firm, was engaged to audit the consolidated financial statements included in this Annual Report on Form 10-K and their audit report is included on Page F-2 of this Annual Report on Form 10-K. KPMG LLP was also engaged to audit the effectiveness of our internal control over financial reporting as of December 31, 2015 and issued an unqualified audit report regarding their assessment of the effectiveness of internal control over financial reporting is included on page F-4 in this Annual Report on Form 10-K.
Changes in Internal Control Over Financial Reporting
We completed the execution of our remediation plan with respect to our material weaknesses identified in our Annual Report on Form 10-K for the year ended December 31, 2014 during the quarter ended June 30, 2015. No change occurred in our internal control over financial reporting (as defined in Rule 13a-15(f) and 15d-15(f) of the Exchange Act) during the three months ended December 31, 2015 that has materially affected, or is reasonably likely to materially affect, our internal control over financial reporting.
Item 9B. Other Information.
None.
59
PART III
Item 10. Directors, Executive Officers and Corporate Governance.
Directors and Executive Officers of the General Partner
The following table presents certain information as of the date of this Annual Report concerning each of our directors and executive officers serving, and chosen to serve, in such capacity:
Name | Age | Principal Occupation and Positions Held | ||
Michael A. Happel | 53 | Chief Executive Officer and President | ||
Nicholas Radesca | 50 | Interim Chief Financial Officer, Treasurer and Secretary | ||
Patrick O'Malley | 44 | Chief Investment Officer | ||
Randolph C. Read | 63 | Non-Executive Chairman of the Board of Directors | ||
Robert H. Burns | 86 | Independent Director, Compensation Committee Chair | ||
William M. Kahane | 67 | Director | ||
Keith Locker | 54 | Independent Director | ||
James Nelson | 66 | Independent Director, Conflicts Committee Chair | ||
P. Sue Perrotty | 62 | Independent Director, Audit Committee Chair and Nominating and Corporate Governance Committee Chair | ||
Michael A. Happel
Michael A. Happel has served as our chief executive officer, and the chief executive officer of the Advisor and the Property Manager since December 2014, as our president and the president of the Advisor and the Property Manager since March 2014. Mr. Happel also previously served as our treasurer and secretary and the treasurer and secretary of the Advisor and the Property Manager from November 2014 until December 2014. Prior to that time, Mr. Happel served as our executive vice president, chief investment officer and as an observer to the board of directors since our formation in October 2009 and as the executive vice president and chief investment officer of the Advisor and Property Manager since their formation in November 2009. Mr. Happel has also served as chief executive officer of ARC NYCR and ARC NYCR’s advisor and property manager since December 2014, as secretary of ARC NYCR and ARC NYCR’s advisor and property manager since November 2014 and as president of ARC NYCR and ARC NYCR’s advisor and property manager since their formation in December 2013. Mr. Happel has served as president of American Realty Capital New York City REIT II, Inc. ("ARC NYCR II"), the ARC NYCR II advisor and the ARC NYCR II property manager from August 2014 until the dissolution and liquidation of those entities in January 2016 and as chief executive officer and secretary of ARC NYCR II, the ARC NYCR II advisor and the ARC NYCR II property manager from January 2015 until the dissolution and liquidation of those entities in January 2016. Mr. Happel has over 25 years of experience successfully investing in real estate, including office, retail, multifamily, industrial, and hotel properties, as well as real estate companies. From 1988 to 2002, he worked at Morgan Stanley & Co., specializing in real estate and becoming co-head of acquisitions for the Morgan Stanley Real Estate Funds (“MSREF”), in 1994. While at MSREF, he was involved in acquiring over $10 billion of real estate and related assets in MSREF I and MSREF II. As stated in a report prepared by Wurts & Associates for the Fresno County Employees’ Retirement Association for the period ending September 30, 2008, MSREF I generated approximately a 48% gross internal rate of return for investors and MSREF II generated approximately a 27% gross internal rate of return for investors. In 2002, Mr. Happel left Morgan Stanley & Co. to join Westbrook Partners, a large real estate private equity firm with over $5 billion of real estate assets under management at the time. From October 2004 to May 2009, he worked at Atticus Capital, a multi-billion dollar hedge fund, as the head of real estate with responsibility for investing primarily in REITs and other publicly traded real estate securities. Mr. Happel received a B.A. in economics from Duke University and a J.D. from Harvard Law School.
60
Nicholas Radesca
Mr. Radesca has served as our interim chief financial officer, treasurer and secretary and the interim chief financial officer, treasurer and secretary of the Advisor and the Property Manager since June 2015 and previously served in such capacities from February 2014 to March 2014. Mr. Radesca has served as the interim chief financial officer and treasurer of ARC NYCR, the ARC NYCR advisor and the ARC NYCR property manager since June 2015. Mr. Radesca has served as chief financial officer, treasurer and secretary of American Realty Capital Daily Net Asset Value Trust, Inc. (“ARC DNAV”), the ARC DNAV advisor and the ARC DNAV property manager since January 2014, November 2014 and December 2014, respectively. Mr. Radesca has served as chief financial officer, treasurer and secretary of American Finance Trust, Inc. ("AFIN"), the AFIN advisor and the AFIN property manager since November 2015. He also previously served as an executive officer of AFIN, the AFIN advisor and the AFIN property manager from December 2014 from May 2015. Mr. Radesca has served as chief financial officer, treasurer and secretary of Realty Finance Trust, Inc. (“RFT”) and the RFT advisor since November 2015. Mr. Radesca previously served as an executive office of RFT and the RFT advisor from January 2013 until November 2014. Mr. Radesca has served as the chief financial officer, treasurer and secretary of AR Capital Acquisition Corp. (“AUMA”) since August 2014. Mr. Radesca previously served as an executive officer of Business Development Corporation of America (“BDCA”) from February 2013 until December 2015. Mr. Radesca served as the interim chief financial officer and treasurer of American Realty Capital New York City REIT II, Inc. (“NYCR II”), the NYCR II advisor and the NYCR II property manager from June 2015 until the dissolution and liquidation of those entities in January 2016. Mr. Radesca also previously served as interim chief financial officer, treasurer and secretary of American Realty Capital Hospitality Trust, Inc. (“ARC HOST”), the ARC HOST advisor and the ARC HOST property manager from May 2014 until December 2014. Mr. Radesca served as interim chief financial officer of American Realty Capital - Retail Centers of America, Inc. (“ARC RCA”) and the ARC RCA advisor from May 2014 until December 2014. Mr. Radesca also served as interim chief financial officer of American Realty Capital - Retail Centers of America II, Inc. (“ARC RCA II”) and the ARC RCA II advisor from June 2015 until the liquidation and dissolution of those entities in January 2016. Mr. Radesca has served as an executive officer of the advisor to United Development Funding Income Fund V ("UDF V") since September 2013. Prior to joining the predecessor to AR Global in December 2012, Mr. Radesca was employed by Solar Capital Management, LLC, from March 2008 to May 2012, where he served as the chief financial officer and corporate secretary for Solar Capital Ltd. and its predecessor company, and Solar Senior Capital Ltd., both of which are publicly traded business development companies. From 2006 to February 2008, Mr. Radesca served as the chief accounting officer at iStar Financial Inc. (“iStar”), a publicly traded commercial REIT, where his responsibilities included overseeing accounting, tax and SEC reporting. Prior to iStar, Mr. Radesca served in various senior accounting and financial reporting roles at Fannie Mae, Del Monte Foods Company, Providian Financial Corporation and Bank of America. Mr. Radesca has more than 20 years of experience in financial reporting and accounting and is a licensed certified public accountant in New York and Virginia. Mr. Radesca holds a B.S. in accounting from the New York Institute of Technology and an M.B.A. from the California State University, East Bay.
Patrick O'Malley
Patrick A. O'Malley has served as our chief investment officer since June 2015 and the chief investment officer of the Advisor since May 2015. Mr. O’Malley has also served as chief investment officer of ARC NYCR since June 2015 and has served as chief investment officer of the ARC NYCR advisor since May 2015. Prior to that time, Mr. O'Malley served as our managing director of acquisitions from June 2012 until June 2015 and as the managing director of acquisitions for ARC NYCR from April 2014 until May 2015. Mr. O'Malley is actively involved in all aspects of the real estate portfolio and has over 13 years of real estate experience with a concentration on the New York City Metro area. From February 2011 until May 2012, Mr. O'Malley was a Senior Vice President at Wagenhals Development Group (“WDG”), where he focused on real estate redevelopment opportunities. Prior to joining WDG, Mr. O'Malley served as managing director for the real estate capital markets group at Rockwood Real Estate Advisors from September 2008 until January 2011. Prior to Mr. O'Malley's involvement in real estate, he worked on Wall Street at several firms including Donaldson, Lufkin & Jenrette and Salomon Smith Barney. Mr. O’Malley holds a B.A. from Manhattan College and previously held the following financial licenses: Series 3 (commodities), Series 4 (derivatives), Series 7 (general securities), Series 24 (regulatory compliance), Series 55 (equity trading) and Series 63 (state law and regulations). Additionally, Mr. O'Malley spent two years in the United States Peace Corps in Mali, West Africa as a small business development volunteer.
61
Randolph C. Read
Randolph C. Read has served as an independent director of our company since December 2014, including as non-executive chairman of our board of directors since June 2015. Mr. Read has served as the non-executive chairman of the board of directors of Healthcare Trust, Inc. ("HTI") since February 2015. Mr. Read has also served as an independent director of Business Development Corporation of America ("BDCA") and Business Development Corporation of America II ("BDCA II") since December 2014. Mr. Read has been president and chief executive officer of Nevada Strategic Credit Investments, LLC since 2009. From 2007 to 2009 Mr. Read served with The Greenspun Corporation, lastly as executive director and president, whose companies included its wholly owned subsidiary American Nevada Realty. Mr. Read has previously served as president of a variety of other companies, including International Capital Markets Group, Inc. Mr. Read serves on two advisory boards and has previously served on a number of public and private company boards. He is admitted as a Certified Public Accountant and has an M.B.A. in Finance from the Wharton Graduate School of the University of Pennsylvania and a B.S. from Tulane University.
We believe that Mr. Read’s prior business experience and his leadership qualities make him well qualified to serve as a member of our Board of Directors.
Robert H. Burns
Robert H. Burns has served as an independent director of our company since October 2009. He has served as an independent director of American Realty Capital Hospitality Trust, Inc. ("ARC HOST") since September 2014 and as an independent director of American Realty Capital Global Trust II, Inc. since February 2015. Mr. Burns also served as an independent director of American Realty Capital Healthcare Trust, Inc. ("ARC HT") from March 2012 until the close of ARC HT’s merger with Ventas, Inc. in January 2015. Mr. Burns served as an independent director of American Realty Capital Trust III, Inc. ("ARCT III") from January 2011 to March 2012 and as an independent director of AFIN from January 2013 until September 2014. He also served as an independent director of American Realty Capital Trust, Inc. ("ARCT") from January 2008 until January 2013 when ARCT closed its merger with Realty Income Corporation. Mr. Burns is a hotel industry veteran with an international reputation and over thirty years of hotel, real estate, food and beverage and retail experience. He founded and built the luxurious Regent International Hotels brand, which he sold in 1992. From 1970 to 1992, Mr. Burns served as chairman and chief executive officer of Regent International Hotels, where he was personally involved in all strategic and major operating decisions. Mr. Burns and his team of professionals performed site selection, obtained land use and zoning approvals, performed all property due diligence, financed each project by raising both equity and arranging debt, oversaw planning, design and construction of each hotel property, and managed each asset. Each Regent hotel typically contained a significant food and beverage element and high-end retail component, frequently including luxury goods such as clothing, jewelry, as well as retail shops. Mr. Burns opened the first Regent hotel in Honolulu, Hawaii, in 1970. From 1970 to 1979, the company opened and managed a number of prominent hotels, but gained international recognition in 1980 with the opening of The Regent Hong Kong, which had many amenities and attracted attention throughout the world. In all, Mr. Burns developed over 18 major hotel projects including the Four Seasons Hotel in New York City, the Beverly Wilshire Hotel in Beverly Hills, the Four Seasons Hotel in Milan, Italy, and the Four Seasons Hotel in Bali, Indonesia. Mr. Burns currently serves as chairman of Barings’ Chrysalis Emerging Markets Fund, a position he has held since 1991, and as a director of Barings’ Asia Pacific Fund, a position he has held since 1986. Additionally, he has been a member of the executive committee of the board of directors of Jazz at Lincoln Center in New York City since 2000. He also chairs the Robert H. Burns Foundation which he founded in 1992. The Robert H. Burns Foundation funds the education of Asian students at American schools. Mr. Burns frequently lectures at Stanford Business School. Mr. Burns served as a faculty member at the University of Hawaii from 1963 to 1994 and as president of the Hawaii Hotel Association from 1968 to 1970. Mr. Burns began his career in Sheraton’s Executive Training Program in 1958, and advanced within Sheraton and then within Westin Hotels from 1962 to 1963. He later spent eight years with Hilton International Hotels from 1963 to 1970. Mr. Burns graduated from the School of Hotel Management at Michigan State University in 1958 and the University of Michigan’s Graduate School of Business in 1960 after serving three years in the U.S. Army in Korea. For the past five years Mr. Burns has devoted his time to owning and operating Villa Feltrinelli on Lago di Garda, a small, luxury hotel in northern Italy, and working on developing hotel projects in Asia, focusing on Vietnam and China.
We believe that Mr. Burns’ current and prior experience as a director or executive officer of the companies described above and his experience as a real estate developer for over 40 years, during which he developed over 18 major hotel projects, make him well qualified to serve as a member of our board of directors.
62
William M. Kahane
William M. Kahane has served as a director of our company since its formation in October 2009 and was appointed as executive chairman in December 2014 and served in such position until June 2015. Mr. Kahane also previously served as our president and treasurer, and the president and treasurer of the Advisor and the Property Manager from its formation in October 2009 until March 2012. Mr. Kahane has served as a director of Healthcare Trust, Inc. (“HTI”) since March 2013, including as executive chairman from December 2014 until February 2015. Mr. Kahane has served as a director of ARC HOST from February 2014, including as executive chairman from December 2014. Mr. Kahane previously served as the chief executive officer and president of ARC HOST from August 2013 until November 2014. Mr. Kahane has served as a director of Global Net Lease, Inc. (“GNL”) since February 2015, including as executive chairman from February 2015 until March 2015. He also previously served an executive officer of GNL, the GNL advisor and the GNL property manager from October 2014 until February 2015. Mr. Kahane has served as chief executive officer and director of AUMA since August 2014. Mr. Kahane previously served as a director of ARC RCA from its formation in July 2010, including as chairman from November 2014, until December 2015. Mr. Kahane also previously served as an executive officer of ARC RCA and the ARC RCA advisor from November 2014, including as chief executive office from December 2014, until December 2015. Mr. Kahane also previously served as an executive officer of ARC RCA and the ARC RCA advisor from their respective formations in July 2010 and May 2010 until March 2012. Mr. Kahane served as the chief executive officer and president of ARC DNAV, the ARC DNAV advisor and the ARC DNAV property manager and as chairman of the board of directors of ARC DNAV from December 2014 until December 2015. Mr. Kahane also previously served as a director of ARC DNAV from September 2010 until March 2012 and as chief operating officer and secretary of ARC DNAV, the ARC DNAV advisor and the ARC DNAV property manager from November 2014 until December 2014. Mr. Kahane served as a director of ARC NYCR from its formation in December 2013, including as executive chairman from December 2014, until November 2015. Mr. Kahane served as an executive officer of AFIN, the AFIN advisor and the AFIN property manager from November 2014, including as chief executive officer from December 2014, until May 2015. Mr. Kahane also previously served as executive chairman of the AFIN board of directors from February 2015 until November 2015. Mr. Kahane served as executive chairman of the board of directors of ARC Global II from December 2014 until November 2015 and previously served as an executive officer of ARC Global II, the ARC Global II advisor and the ARC Global II property manager from October 2014 until December 2014. Mr. Kahane previously served as a director of RFT from November 2014, including as chairman from December 2014, until June 2015. Mr. Kahane served as executive chairman of the board of directors of American Realty Capital Healthcare Trust III, Inc. (“ARC HT III”) from December 2014 until November 2015. Mr. Kahane served as a director of Phillips Edison - ARC Grocery Center REIT II, Inc. (“PECO II”) from August 2013 until January 2015. Mr. Kahane served as a director of BDCA since its formation in May 2010 until December 2015 and as an executive officer from May 2010 until March 2012.
63
Mr. Kahane served as a director of ARC HT from its formation in August 2010 until January 2015 when ARC HT closed its merger with Ventas, Inc. Mr. Kahane previously served as an executive officer of ARC HT, the ARC HT advisor and the ARC HT property manager from their respective formations in August 2010 until March 2012. He also served as a director and executive officer of American Realty Capital Properties, Inc. (“ARCP”) (now known as VEREIT, Inc.) from December 2010 until March 2012. Additionally, Mr. Kahane served as an executive officer of ARCP’s former manager from November 2010 until March 2012 and served as a director of ARCP from February 2013 to June 2014. Mr. Kahane served as an executive officer of American Realty Capital Trust, Inc. (“ARCT”), the ARCT advisor and the ARCT property manager from their formation in August 2007 until the close of ARCT’s merger with Realty Income Corporation in January 2013. He also served as a director of ARCT from August 2007 until January 2013. Mr. Kahane served as an executive officer of American Realty Capital Trust III, Inc. (“ARCT III”), the ARCT III advisor, and the ARCT III property manager from their formation in October 2010 until April 2012. Mr. Kahane served as a director of RCS Capital Corporation (“RCAP”) from February 2013 until December 2014, and served as chief executive officer of RCAP from February 2013 until September 2014. RCAP filed for Chapter 11 bankruptcy in January 2016. Mr. Kahane served as a director of Cole Real Estate Income Strategy (Daily NAV), Inc. (“Cole DNAV”) from February 2014 until December 2014, and served as a director of Cole Credit Property Trust, Inc. (“CCPT”) from May 2014 until February 2014. Mr. Kahane has served as an executive officer of the UDF V advisor since April 2015, and previously served as a member of the board of trustees of UDF V from October 2014 until November 2015. Mr. Kahane has served as a member of the investment committee of Aetos Capital Asia Advisors, a $3 billion series of opportunistic funds focusing on assets primarily in Japan and China, since 2008. Mr. Kahane began his career as a real estate lawyer practicing in the public and private sectors from 1974 to 1979 where he worked on the development of hotel properties in Hawaii and California. From 1981 to 1992, Mr. Kahane worked at Morgan Stanley & Co., or Morgan Stanley, specializing in real estate, including the lodging sector becoming a managing director in 1989. In 1992, Mr. Kahane left Morgan Stanley to establish a real estate advisory and asset sales business known as Milestone Partners which continues to operate and of which Mr. Kahane is currently the chairman. Mr. Kahane worked very closely with Mr. Nicholas S. Schorsch while a trustee at American Financial Realty Trust (“AFRT”), from April 2003 to August 2006, during which time Mr. Kahane served as chairman of the finance committee of AFRT’s board of trustees. Mr. Kahane served as a managing director of GF Capital Management & Advisors LLC (“GF Capital”), a New York-based merchant banking firm, where he directed the firm’s real estate investments, from 2001 to 2003. GF Capital offers comprehensive wealth management services through its subsidiary TAG Associates LLC, a leading multi-client family office and portfolio management services company with approximately $5 billion of assets under management. Mr. Kahane also was on the board of directors of Catellus Development Corp., a NYSE growth-oriented real estate development company, where he served as chairman. Mr. Kahane received a B.A. from Occidental College, a J.D. from the University of California, Los Angeles Law School and an MBA from Stanford University’s Graduate School of Business.
We believe that Mr. Kahane’s current and prior experience as a director or executive officer of the companies described above and his significant investment banking experience in real estate make him well qualified to serve as a member of our board of directors.
Keith Locker
Keith Locker has served as an independent director of our company since November 2015. Mr. Locker has served Sunstone Hotel Investors, Inc (NYSE: SHO) as a director since May 2, 2006 and was non-executive chairman from 2011 through 2015. Since May 2003, Mr. Locker has been president of Inlet Capital LLC, or Inlet, an investment and asset management firm focused on the commercial real estate industry; president of Global Capital Resources LLC and GCR Advisors Inc. (both affiliates of Inlet), which companies together are the Co-General Partner and Co- Advisor, respectively, to the NYLIM-GCR Fund-1 2002 L.P., which provided fixed and variable rate senior and subordinate mortgages; and president and managing member of COP Holdings, LLC (an affiliate of Inlet), an investment firm focused on factory retail outlet centers. Furthermore, Mr. Locker was director of IVP Securities, LLC from 2004 through 2015. From December 2006 through 2007, Mr. Locker was a director of The Mills Corporation, a publicly traded retail mall REIT, where he was chairman of the compensation committee. From May 2005 to January 2007, he served as a director of Glenborough Realty Trust, a publicly traded office REIT, where he was a member of the audit and compensation committees until sale of the company to Morgan Stanley. Mr. Locker was previously a managing director in the Real Estate Investment Banking Group at Deutsche Bank Securities, Inc. from September 2000 to February 2003. Prior to joining Deutsche Bank in 2000, Mr. Locker was senior managing director at Bear, Stearns & Co. Inc., responsible for Real Estate Investment Banking. Mr. Locker has more than 30 years of major national market experience in REITS, real estate finance, private placements, capital markets and transaction structuring and risk management. Mr. Locker earned a B.S./B.A. from Boston University School of Management in 1983 and an M.B.A. from the Wharton School of the University of Pennsylvania in 1988.
We believe that Mr. Locker is well qualified to serve as a director due to his significant experience and leadership roles serving as an executive officer or director of various real estate companies as discussed above, and his experience in REITs, real estate, capital markets, governance, risk management and asset management.
64
James Nelson
James Nelson has served as an independent director of our company since November 2015. Mr. Nelson has served as a director of Icahn Enterprises GP since June 2001 and is a member of the audit committee. Mr. Nelson has served as a director and a member of the audit committee of Herbalife Ltd. since April 2014. Mr. Nelson has served as a director and member of the compensation, governance and strategic alternatives committees of Voltari Corporation (f/k/a Motricity Inc.) from June 2011 until September 2015, and from January 2012 until September 2015, he served as chairman of its board of directors. Mr. Nelson served as a director of Single Touch Systems, Inc., a technology based mobile media solutions provider, from May 2013 through April 2014. From April 2014 to August 2014, Mr. Nelson served as a director of Ubiquity Broadcasting Corporation, a vertically integrated, technology-focused media company. From December 2003 until June 2007 Mr. Nelson served as a director and member of the audit committee of American Entertainment Properties Corp., or AEP. From May 2005 until November 2007, Mr. Nelson served as a director and member of the audit committee of Atlantic Coast Entertainment Holdings, Inc. From 1986 until 2009, Mr. Nelson was chairman and chief executive officer of Eaglescliff Corporation, a specialty investment banking, consulting and wealth management company. From March 1998 through 2003, Mr. Nelson was chairman and chief executive officer of Orbit Aviation, Inc., a company engaged in the acquisition and completion of Boeing Business Jets for private and corporate clients. From August 1995 until July 1999, Mr. Nelson was chief executive officer and co-chairman of Orbitex Management, Inc., a financial services company in the mutual fund sector. From August 1995 until March 2001, he was on the Board of Orbitex Financial Services Group. From April 2003 through April 2010, Mr. Nelson served as a director and chairman of the audit committee of the Viskase Companies INC., a food packaging company. From January 2008 through June 2008, Mr. Nelson served as a director and member of the audit committee of Shuffle Master, Inc., a gaming manufacturing company. From March 2008 until March 2010, Mr. Nelson was a director and served on the audit committee of Pacific Energy Resources Ltd., an energy producer. From April 2008 thru November 2012 Mr. Nelson served as a director and as chairman of the audit committee of Cequel Communications, an owner and operator of a large cable television system. From March 2010 to May 2014 Mr. Nelson served as a director and member of the audit committee of Tropicana Entertainment Inc. From April 2010 to November 2013, Mr. Nelson served as a director and member of the audit committee of Take-Two Interactive Software, Inc., a global publisher and developer of interactive entertainment software products.
We believe that Mr. Nelson is well qualified to serve as a director due to his significant experience and leadership roles serving as chief executive officer, director and chairman of the audit committee of various companies as discussed above.
P. Sue Perrotty
P. Sue Perrotty has served as an independent director of our company since September 2014 and as chair of our audit committee since December 2014. Ms. Perrotty has served as non-executive chair of GNL since March 2015, as an independent director of AUMA since October 2014 and as an independent director of ARC HT III since August 2014. Ms. Perrotty served as an independent director of ARC HT from November 2013 until the close of ARC HT’s merger with Ventas, Inc. in January 2015. Ms. Perrotty also served as an independent director of ARC DNAV from August 2013 until August 2014 and as an independent director of ARC HOST from September 2013 until September 2014. Ms. Perrotty has served as president and chief executive officer of AFM Financial Services in Cranford, New Jersey since April 2011. Ms. Perrotty also has been an investor and advisor to several small businesses and entrepreneurs in varying stages of development since August 2008. Ms. Perrotty served in the administration of Governor Edward G. Rendell as chief of staff to First Lady, Judge Marjorie Rendell from November 2002 through August 2008. Ms. Perrotty held the position of executive vice president and head of Global Operations for First Union Corp. as a member of the Office of the Chairman from January 2001 to January 2002. Prior to that time, Ms. Perrotty was Banking Group head for the Pennsylvania and Delaware Banking Operations of First Union from November 1998 until January 2001. Ms. Perrotty joined First Union through the merger with Corestates Bank where she served as executive vice president and head of IT and Operations from April 1996 until November 1998. Ms. Perrotty also served as senior executive vice president and head of all Consumer Businesses including Retail Banking, Mortgage Banking, Product Development and Marketing as well as strategic customer information and delivery system development. Ms. Perrotty was a member of the chairman’s staff in each of the companies she served. Ms. Perrotty serves on several boards including the Board of Trustees of Albright College, where she is currently chair of the Finance Committee and member of the Investment and Property subcommittees. Ms. Perrotty also serves as vice chair of the Berks County Community Foundation and as development chair for the Girls Scouts of Eastern PA Board. Ms. Perrotty has received several awards for community leadership and professional accomplishments including the PA 50 Best Women in Business, the Franciscan Award from Alvernia University, the Albright College Distinguished Alumni Award, the Women of Distinction Award from the March of Dimes, Taking the Lead Award from the Girl Scouts of Eastern PA and the 2006 Champion of Youth Award from Olivet Boys & Girls Club. Ms. Perrotty is a graduate of Albright College with a Bachelor of Science degree in Economics and was also awarded an Honorary Doctor of Laws degree from Albright College in 2010.
We believe that Ms. Perrotty’s current and prior experience as a director or executive officer of the companies described above, her prior business experience and her leadership qualities make her well-qualified to serve on our board of directors.
65
Family Relationships
There are no familial relationships between any of our directors and executive officers.
Code of Ethics and Corporate Governance Guidelines
The board of directors has adopted a Code of Ethics most recently amended and restated on February 17, 2016 (the “Code of Ethics”), which is applicable to our directors, officers and employees (if we ever have employees) and the directors, officers and employees of our company's subsidiaries and affiliates. The Code of Ethics covers topics including, but not limited to, conflicts of interest, confidentiality of information, full and fair disclosure, reporting of violations and compliance with laws and regulations. The board of directors has also adopted Corporate Governance Guidelines to assist the board of directors in the exercise of its responsibilities and to serve the interests of the Company and its stockholders.
The Code of Ethics and the Corporate Governance Guidelines are available on our website at www.nyrt.com by clicking on “Investor Relations — Corporate Information — Governance Documents.” You may also obtain a copy of the Code of Ethics by writing to our secretary at: New York REIT, Inc., 405 Park Avenue, 14th Floor, New York, New York 10022, Attention: Nicholas Radesca, Interim Chief Financial Officer, Treasurer and Secretary. A waiver of the Code of Ethics may be made only by the board of directors or the appropriate committee of the board of directors and will be promptly disclosed to the extent required by law.
Audit Committee
Our audit committee consists of Ms. Perrotty, Mr. Read and Mr. Locker, each of whom is “independent” within the meaning of the applicable requirements set forth in the Exchange Act and applicable SEC rules. Also, each of the audit committee members is an independent director under the applicable rules of the NYSE. Ms. Perrotty is the chair of our audit committee. The board of directors has determined that Ms. Perrotty and Mr. Locker are each qualified as an “audit committee financial expert” as defined in Item 407(d)(5) of Regulation S-K and the rules and regulations of the SEC and each is an independent director.
Section 16(a) Beneficial Ownership Reporting Compliance
Section 16(a) of the Exchange Act requires the Company’s officers and directors and persons who beneficially own more than 10% of the Common Stock of the Company to file initial reports of ownership of such securities and reports of changes in ownership of such securities with the SEC. Such officers, directors and 10% stockholders of the Company are also required by SEC regulations to furnish the Company with copies of all Section 16(a) forms they file. Based solely on the Company’s review of the copies of such forms received by it with respect to the year ended December 31, 2015, all reports were filed on a timely basis, with the exceptions noted below:
Mr. Radesca filed two late reports, one in connection with becoming an insider as a result of his appointment as our interim chief financial officer in June 2015 and one in connection with restricted shares that were granted to Mr. Radesca in November 2015. Gregory W. Sullivan, our former chief financial officer, filed one late report in connection with restricted shares granted in March 2015.
Item 11. Executive Compensation.
Compensation Discussion and Analysis
We currently have no employees. Our Advisor performs our day-to-day management functions. Our named executive officers, Michael A. Happel, Nicholas Radesca and Patrick O’Malley, are employees of the Advisor and Property Manager and, except in the limited circumstances described below, do not receive any compensation directly from us for the performance of their duties as our executive officers. Moreover, we do not reimburse our Advisor and its affiliates that are involved in the management of our operations, including the Property Manager, for salaries, bonuses or benefits to be paid to our named executive officers.
See “Item 13. Certain Relationships and Related Transactions, Director Independence” below for a discussion of fees and expense reimbursements payable to the Advisor, the Property Manager and their affiliates under our agreements with them.
We do not determine the compensation payable to our named executive officers by our Advisor or its affiliates. Our Advisor or its affiliates, in their discretion, determine the levels of base salary and cash incentive compensation earned by our named executive officers. Our Advisor or its affiliates also determine whether and to what extent our named executive officers will be provided with pension, deferred compensation and other employee benefits plans and programs. As a result, we do not have, and our board of directors and compensation committee have not considered, a compensation policy or program for our named executive officers, except to the limited extent described below.
66
Our employee and director incentive restricted share plan (the “RSP”) provides for the issuance of restricted shares of common stock (“restricted shares”). Our board of directors has delegated its administrative responsibilities under the RSP to our compensation committee. In this capacity, our compensation committee has the ability to grant awards of restricted shares to our directors, officers and employees (if we ever have employees), employees of our Advisor and its affiliates, employees of entities that provide services to us, directors of the Advisor or of entities that provide services to us, certain of our consultants and certain consultants to the Advisor and its affiliates or to entities that provide services to us. Our compensation committee also has the ability in this capacity to determine what form the awards will take and the terms and conditions of the awards. See “Share-Based Compensation Plans — Restricted Share Plan.”
In February 2015, our compensation committee authorized the grant of an aggregate of 279,679 restricted shares under the RSP to the employees of the Advisor and its affiliates, and in March 2015 we issued 279,365 restricted shares, including 53,737 restricted shares granted to Gregory W. Sullivan, who was then our chief financial officer, and 48,264 restricted shares granted to Patrick O'Malley, who is an employee of our Advisor and was appointed to be our chief investment officer in June 2015, and 9,656 restricted shares to Nicholas Radesca, who is an employee of our Advisor and replaced Mr. Sullivan upon his resignation as our chief financial officer in June 2015. These restricted shares vest pro rata over a four-year period beginning on March 31, 2016. Mr. Sullivan forfeited his unvested interests in his restricted shares upon his resignation in June 2015.
In November 2015, in addition to the February 2015 grant to Mr. Radesca, our compensation committee awarded to Mr. Radesca 30,000 restricted shares, which vest pro rata over a three-year period beginning on November 3, 2016, subject to automatic vesting in their entirety upon his resignation or replacement as interim chief financial officer at any time.
Our compensation committee considered our overall corporate performance as one of the important factors in determining to make the grants discussed above to certain of our named executive officers as well as other employees of the Advisor and its affiliates. In addition, our compensation committee considered individual contributions to our activities by our named executive officers and other employees of our Advisor and its affiliates and consulted with our Advisor and our named executive officers. In establishing the amounts of these awards, our compensation committee did not engage in any benchmarking of award levels/opportunities or consider specific performance targets. These awards were generally intended to align the interests of the recipients with the interests of our stockholders and to further provide flexibility to us in our ability to enable our Advisor and its affiliates who support our Advisor to attract, motivate and retain talented individuals. The vesting requirements of these awards were designed to promote retention.
Our compensation committee has not yet made any grants to our named executive officers or other employees of our Advisor and its affiliates in 2016 or determined whether or not to make any grants under the RSP or adopt a formal equity incentive compensation program for 2016. We expect that similar factors as were considered in 2015 will be considered in connection with any determination by our compensation committee to make grants during 2016, and the amounts thereof.
Because our named executive officers did not receive any compensation directly from us for the performance of their duties as our executive officers in any fiscal year prior to the year ended December 31, 2015, we have not held a non-binding stockholder advisory vote on compensation of executives or a non-binding stockholder advisory vote on the frequency of the stockholder vote on executive compensation at any annual meeting since our inception.
Compensation Committee Report
Our compensation committee has furnished the following report. The information contained in this “Compensation Committee Report” is not to be deemed “soliciting material” or “filed” with the SEC, nor is such information to be incorporated by reference into any future filings under the Securities Act of 1933, as amended, or the Securities Exchange Act of 1934, as amended, except to the extent that we specifically incorporate it by reference into such filings.
Our compensation committee has reviewed and discussed the “Compensation Discussion and Analysis” with management. Based on its review and discussions, our compensation committee recommended to our board of directors that the “Compensation Discussion and Analysis” be included in this Annual Report on Form 10-K for the fiscal year ended December 31, 2015 for filing with the SEC.
The Compensation Committee
Robert Burns, Chairman
Keith Locker
James L. Nelson
67
Summary Compensation Table
The following table summarizes the annual compensation received by our named executive officers for the fiscal years ended December 31, 2015, 2014 and 2013:
Name and Principal Position | Year | Salary ($) | Bonus ($) | Stock Awards ($)(1) | All Other Compensation ($)(2) | Total ($) | ||||||||||||||||
Michael A. Happel, | 2015 | $ | — | $ | — | $ | — | $ | — | $ | — | |||||||||||
President and Chief Executive Officer | 2014 | — | — | — | — | — | ||||||||||||||||
2013 | — | — | — | — | — | |||||||||||||||||
Nicholas Radesca, | 2015 | $ | — | $ | — | $ | 446,836 | $ | 5,631 | $ | 452,467 | |||||||||||
Interim Chief Financial Officer, Treasurer and Secretary(3) | 2014 | — | — | — | — | — | ||||||||||||||||
2013 | — | — | — | — | — | |||||||||||||||||
Gregory W. Sullivan, | 2015 | $ | — | $ | — | $ | 556,715 | $ | 6,180 | $ | 562,895 | |||||||||||
Former Chief Financial Officer, Treasurer and Secretary(3) | 2014 | — | — | — | — | — | ||||||||||||||||
2013 | — | — | — | — | — | |||||||||||||||||
Patrick O'Malley, | 2015 | $ | — | $ | — | $ | 500,015 | $ | 16,651 | $ | 516,666 | |||||||||||
Chief Investment Officer(4) | 2014 | — | — | — | — | — | ||||||||||||||||
2013 | — | — | — | — | — | |||||||||||||||||
__________________________
(1) | Amounts in this column represent the aggregate grant date fair value of awards of restricted shares calculated in accordance with FASB ASC Topic 718 for purposes of this table only. In Note 16 to our consolidated financial statements included in this Annual Report on From 10-K, these grants have been accounted for under for under FASB ASC Topic 505. |
(2) | The amount reported as “All Other Compensation” represents the value of distributions on unvested restricted shares. |
(3) | On June 3, 2015, Mr. Sullivan resigned as our chief financial officer, forfeiting his unvested interests in his restricted shares, and was replaced by Mr. Radesca, who continues to serve as our interim chief financial officer. Mr. Radesca has been an employee of our Advisor commencing prior to January 1, 2015. |
(4) | On June 22, 2015, Mr. O'Malley was appointed as our chief investment officer. Mr. O'Malley has been an employee of our Advisor commencing prior to January 1, 2015. |
68
Grants of Plan-Based Awards
The following table summarizes certain information regarding all plan-based awards granted during the fiscal year ended December 31, 2015 to our named executive officers:
Grant Date | Date of Compensation Committee Action | All Other Stock Awards: Number of Shares of Stock or Units (#)(1) | Grant Date Fair Value of Stock and Option Awards ($)(2) | ||||||||
Nicholas Radesca(3) | 11/3/2015 | 11/3/2015 | 30,000 | $ | 346,800 | ||||||
Nicholas Radesca(3) | 3/31/2015 | 2/13/2015 | 9,656 | 100,036 | |||||||
Gregory W. Sullivan(3) | 3/31/2015 | 2/13/2015 | 53,737 | 556,715 | |||||||
Patrick O'Malley(4) | 3/31/2015 | 2/13/2015 | 48,264 | 500,015 | |||||||
____________________________
(1) | Amounts in this column represent restricted share awards. |
(2) | Amounts in this column represent the aggregate grant date fair value of awards of restricted shares calculated in accordance with FASB ASC Topic 718 for purposes of this table only. In Note 16 to our consolidated financial statements included in this Annual Report on From 10-K, these grants have been accounted for under for under FASB ASC Topic 505. |
(3) | On June 3, 2015, Mr. Sullivan resigned as our chief financial officer, forfeiting his unvested interests in his restricted shares, and was replaced by Mr. Radesca, who continues to serve as our interim chief financial officer. Mr. Radesca has been an employee of our Advisor commencing prior to January 1, 2015. |
(4) | On June 22, 2015, Mr. O'Malley was appointed as our chief investment officer. Mr. O'Malley has been an employee of our Advisor commencing prior to January 1, 2015. |
Outstanding Equity Awards at Fiscal Year End
The following table sets forth certain information with respect to all outstanding equity-based awards held at the end of the fiscal year ended December 31, 2015 by each named executive officer:
Names | Number of Restricted Shares That Have Not Vested (#) | Market Value of Restricted Shares That Have Not Vested ($)(1) | |||||
Nicholas Radesca | 39,656 | (2) | $ | 456,044 | |||
Patrick O'Malley | 48,264 | (3) | 555,036 | ||||
____________________________
(1) | Based on $11.50 per share, the closing price of our common stock on the last business day of the fiscal year ended December 31, 2015. |
(2) | Represents 9,656 restricted shares granted pursuant to the RSP which vest pro rata over a four-year period beginning on March 31, 2016 and 30,000 restricted shares granted pursuant to the RSP, which vest pro rata over a three-year period beginning on November 3, 2016. |
(3) | Represents restricted shares granted pursuant to the RSP, which vest pro rata over a four-year period beginning on March 31, 2016. |
Option Exercises and Stock Vested
We have not granted any stock options to our named executive officers to date and no restricted shares granted to our named executive officers vested during the fiscal year ended December 31, 2015.
69
Potential Payments Upon Termination or Change in Control
Our named executive officers are employees of our Advisor or its affiliates and therefore we have no obligation to pay them any form of compensation upon their termination of employment, except with respect to the restricted stock award agreements entered into between such named executive officers and our company. These agreements generally provide that any unvested portion of the award will be immediately and irrevocably forfeited upon a termination of the employment of the named executive officer by our Advisor or its affiliates, including a termination of employment due to such officer’s resignation, discharge, death or retirement, except with respect to the restricted shares granted to Mr. Radesca on November 3, 2015, which vest automatically if he resigns or is replaced as our interim chief financial officer for any reason.
In addition, Mr. Happel currently holds 73,412 earned LTIP units transferred to him by the Advisor pursuant to the terms of the OPP (defined below), the agreement pursuant to which the LTIP units were issued to our Advisor in connection with the Listing in 2014. The OPP provides for early calculation of earned LTIP units and for the accelerated vesting of any earned LTIP units in the event Advisor is terminated or in the event of a change in control of our company, in either case prior to April 15, 2017. The OPP also provides for accelerated vesting of earned LTIP units in the event the Advisor is terminated by our company or in the event of a change in control of our company on or following the end of the April 15, 2017. See “Item 13. Certain Relationships and Related Transactions, and Director Independence — 2014 Advisor Multi-Year Outperformance Agreement.”
Compensation Committee Interlocks and Insider Participation
There are no compensation committee interlocks and no insider participation in compensation decisions that are required to be reported under the rules and regulations of the Exchange Act.
Share-Based Compensation Plans
The following table sets forth information regarding securities authorized for issuance under our stock option plan and our restricted share plan (as described below) as of December 31, 2015:
Plan Category | Number of Securities to be Issued Upon Exercise of Outstanding Options, Warrants and Rights | Weighted-Average Exercise Price of Outstanding Options, Warrants and Rights | Number of Securities Remaining Available For Future Issuance Under Equity Compensation Plans (Excluding Securities Reflected in Column (a) | ||||||||
(a) | (b) | (c) | |||||||||
Equity Compensation Plans approved by security holders | — | $ | — | 16,976,060 | (1) | ||||||
Equity Compensation Plans not approved by security holders | — | — | — | ||||||||
Total | — | $ | — | 16,976,060 | |||||||
____________________
(1) | The total number of shares of restricted stock available for future issuance under the RSP is calculated based on 10% of our outstanding shares of capital stock on a fully diluted basis as of December 31, 2015. |
70
Stock Option Plan
We have adopted a stock option plan to provide incentive compensation to attract and retain qualified directors, officers, advisors, consultants and other personnel, including the Advisor, Property Manager and their respective affiliates, as well as personnel of the Advisor, Property Manager and affiliates, and any of our joint venture affiliates. Our board of directors has delegated its administrative responsibilities under the stock option plan to our compensation committee. In this capacity, our compensation committee has the full authority to: (1) administer and interpret the stock option plan; (2) authorize the granting of awards; (3) determine the eligibility of directors, officers, advisors, consultants and other personnel, including the Advisor, Property Manager and affiliates, as well as personnel of the Advisor, Property Manager and affiliates, and any of our joint venture affiliates, to receive an award; (4) determine the number of shares of common stock to be covered by each award (subject to the individual participant limitations provided in the stock option plan); (5) determine the terms, provisions and conditions of each award (which may not be inconsistent with the terms of the stock option plan); (6) prescribe the form of instruments evidencing such awards; and (7) take any other actions and make all other determinations that it deems necessary or appropriate in connection with the stock option plan or the administration or interpretation thereof; however, neither the compensation committee nor the board of directors may take any action under our stock option plan that would result in a repricing of any stock option without having first obtained the affirmative vote of our stockholders. In connection with this authority, our board or directors or our compensation committee may, among other things, establish performance goals that must be met in order for awards to be granted or to vest, or for the restrictions on any such awards to lapse. The total number of shares that may be made subject to awards under our stock option is 500,000 shares (as such number may be adjusted for stock splits, stock dividends, combinations and similar events).
No awards under our stock option plan have been made.
Restricted Share Plan
The RSP provides for the issuance of restricted shares, including to our non-executive directors. Our board of directors has delegated its administrative responsibilities under the RSP to our compensation committee. In this capacity, our compensation committee has the ability to grant awards of restricted shares to our directors, officers and employees (if we ever have employees), employees of our Advisor and its affiliates, employees of entities that provide services to us, directors of the Advisor or of entities that provide services to us, certain of our consultants and certain consultants to the Advisor and its affiliates or to entities that provide services to us. Our compensation committee also has the ability in this capacity to determine which form the awards will take and the terms and conditions of the awards.
As of December 31, 2015, there were 316,570 unvested restricted shares of common stock outstanding under the RSP. Restricted shares may not, in general, be sold or otherwise transferred until the restrictions are removed and the shares have vested. Holders of restricted shares are entitled to receive cash distributions prior to the time that the restrictions on the restricted shares have lapsed. Any distributions payable in shares of common stock will be subject to the same restrictions as the underlying restricted shares.
The vesting terms of awards under the RSP are as described in the relevant award agreement.
Compensation of Directors
The following table sets forth information regarding compensation of our directors during the year ended December 31, 2015:
Name | Fees Earned or Paid in Cash(8) | Stock Awards(9) | Option Awards | Non-Equity Incentive Plan Compensation | Changes in Pension Value and Nonqualified Deferred Compensation Earnings | All Other Compensation(10) | Total Compensation | |||||||||||||||||||||
William M. Kahane(1) | $ | — | $ | — | $ | — | $ | — | $ | — | $ | — | $ | — | ||||||||||||||
Randolph C. Read(2) | 179,125 | 87,921 | — | — | — | 2,111 | 269,157 | |||||||||||||||||||||
P. Sue Perrotty(3) | 141,000 | 65,002 | — | — | — | 3,431 | 209,433 | |||||||||||||||||||||
Robert H. Burns(4) | 122,750 | 79,994 | — | — | — | 37,474 | 240,218 | |||||||||||||||||||||
Marc Rowan(5) | — | — | — | — | — | — | — | |||||||||||||||||||||
Keith Locker(6) | 68,357 | 49,996 | — | — | — | 330 | 118,683 | |||||||||||||||||||||
James Nelson(7) | 40,857 | 49,996 | — | — | — | 330 | 91,183 | |||||||||||||||||||||
(1) | Mr. Kahane received no additional compensation for serving as a director. |
71
(2) | Mr. Read was paid $149,917 in cash for the year ended December 31, 2015 for fees earned in the fourth quarter 2014 through third quarter 2015. |
(3) | Ms. Perrotty was paid $129,000 in cash for the year ended December 31, 2015 for fees earned in the fourth quarter 2014 through third quarter 2015. |
(4) | Mr. Burns was paid $99,750 in cash, including amounts withheld for income taxes, for the year ended December 31, 2015 for fees earned in the fourth quarter 2014 through third quarter 2015. |
(5) | Mr. Rowan received no additional compensation for serving as a director. Mr. Rowan resigned from our board of directors on November 12, 2015. |
(6) | Mr. Locker was not paid any cash during the year ended December 31, 2015. Fees earned by Mr. Locker during the fourth quarter 2015 will be paid in the first quarter of 2016. |
(7) | Mr. Nelson was not paid any cash during the year ended December 31, 2015. Fees earned by Mr. Nelson during the fourth quarter 2015 will be paid in the first quarter of 2016. |
(8) | Represents fees earned by our directors for the year ended December 31, 2015. Fees earned by our directors for their services are paid quarterly in arrears. |
(9) | Our non-independent directors do not receive compensation for serving on the board of directors. If a director also is our employee or an employee of the Advisor or any of its affiliates, we do not pay compensation for services rendered as a director. |
(10) | The amount reported as “All Other Compensation” represents the value of distributions on unvested restricted shares during the year ended December 31, 2015. |
We pay to each of our independent directors an annual fee for his or her services of $100,000, $50,000 of which is payable in the form of cash and $50,000 of which is payable in the form of restricted shares of common stock (one third of which vests in each of the succeeding three years). We pay our non-executive chair an additional annual fee of $105,000. The board of directors does not currently have a lead independent director. If appointed, the lead independent director will receive an additional annual fee of $105,000. These fees are payable in cash, although the non-executive chair and lead independent director may each elect to receive restricted shares of common stock (one third of which vests in each of the succeeding three years) in lieu of all or a portion of the $105,000 additional annual fee. Each independent director receives $30,000 in cash in the aggregate as an annual fee for his or her service on the audit committee, compensation committee and nominating and corporate governance committee. Each independent director may elect to receive restricted shares of common stock (one third of which vests in each of the succeeding three years) in lieu of all or a portion of the $30,000 annual fee for service on the audit committee, compensation committee and nominating and corporate governance committee. Each independent director also receives $2,000 for each meeting the director attends in person ($2,500 for attendance by the chairperson of the audit committee at each meeting of the audit committee) and $1,500 for each meeting attended by telephone. The independent directors are entitled to receive $750 for each transaction reviewed and voted upon electronically with a maximum of $2,250 for three or more transactions reviewed and voted upon per electronic meeting. If there is a meeting of the board of directors and one or more committees in a single day, the fees are limited to $2,500 per day ($3,000 for the chairperson of the audit committee if there is a meeting of such committee). Restricted shares of common stock issued to independent directors will be forfeited upon such director’s voluntary resignation or if such director is not re-elected, except any unvested restricted shares due to vest in the year in which such director voluntarily resigns or fails to be re-elected will automatically vest.
We also pay each independent director for each external seminar, conference, panel, forum or other industry-related event attended in person and in which the independent director actively participates, solely in his or her capacity as an independent director of our company, in the following amounts:
• | $2,500 for each day of an external seminar, conference, panel, forum or other industry-related event that does not exceed four hours, or |
• | $5,000 for each day of an external seminar, conference, panel, forum or other industry-related event that exceeds four hours |
In either of the above cases, we will reimburse, to the extent not otherwise reimbursed, an independent director’s reasonable expenses associated with attendance at such external seminar, conference, panel, forum or other industry-related event. An independent director cannot be paid or reimbursed for attendance at a single external seminar, conference, panel, forum or other industry-related event by us and another company for which he or she is a director.
All directors also receive reimbursement of reasonable out of pocket expenses incurred in connection with attendance at meetings of our board of directors.
72
Item 12. Security Ownership of Certain Beneficial Owners and Management and Related Stockholder Matters.
The following table sets forth information regarding the beneficial ownership of common stock as of February 12, 2016 by:
• | each person known by us to be the beneficial owner of more than 5% of its outstanding shares of common stock based solely upon the amounts and percentages contained in the public filings of such persons; |
• | each of our directors and named executive officers; and |
• | all of our directors and executive officers as a group. |
For purposes of the table below, “beneficial ownership” is determined in accordance with Rule 13d-3 under the Exchange Act, pursuant to which a person or group of persons is deemed to have “beneficial ownership” of any shares that the person has the right to acquire within 60 days after February 12, 2016. For purposes of computing the percentage of outstanding common stock held by each person or group of persons named below, any shares that the person or persons has the right to acquire within 60 days after February 12, 2016 are deemed to be outstanding but are not deemed to be outstanding for the purpose of computing the percentage ownership of any other person. As of February 12, 2016, there were 165,045,217 shares of common stock outstanding. SEC rules also generally attribute beneficial ownership of securities to persons who possess sole or shared voting power or investment power with respect to such securities. Except as otherwise indicated, all persons listed below have sole voting and investment power with respect to the shares beneficially owned by them, subject to applicable community property laws.
Beneficial Owner(1) | Number of Shares Beneficially Owned | Percent of Class | ||||
The Vanguard Group(2) | 23,313,305 | 14.3 | % | |||
FMR LLC(3) | 13,297,023 | 8.2 | % | |||
BlackRock, Inc.(4) | 12,067,818 | 7.4 | % | |||
Vanguard Specialized Funds - Vanguard REIT Index Fund(5) | 11,721,172 | 7.2 | % | |||
Prudential Financial, Inc.(6) | 8,396,033 | 5.2 | % | |||
William M. Kahane(7)(17) | 530,575 | * | ||||
Michael A. Happel(8)(17) | 942,759 | * | ||||
Nicholas Radesca(9) | 53,157 | * | ||||
Patrick O'Malley(10) | 48,264 | * | ||||
Robert H. Burns(11) | 86,000 | * | ||||
P. Sue Perrotty(12) | 11,143 | * | ||||
Randolph C. Read(13) | 8,451 | * | ||||
Keith Locker(14) | 4,310 | * | ||||
James Nelson(15) | 4,310 | * | ||||
Gregory Sullivan(16) | 92,751 | * | ||||
All directors and executive officers as a group (nine persons)(17) | 1,688,969 | 1.0 | % | |||
* Less than 1%
(1) | Unless otherwise indicated, the business address of each individual or entity listed in the table is 405 Park Avenue, New York, New York 10022. |
(2) | The business address for The Vanguard Group, Inc. is 100 Vanguard Blvd., Malvern, Pennsylvania 19355. The Vanguard Group has sole voting power over 454,215 shares, shared voting power over 135,200 shares, shared dispositive power over 343,588 shares and sole dispositive power over 22,969,717 shares. The information contained herein respecting The Vanguard Group, Inc. is based solely on Amendment No. 2 to the Schedule 13G filed by The Vanguard Group with the SEC on February 10, 2016. |
(3) | The business address for FMR LLC is 245 Summer Street, Boston, Massachusetts 02210. FMR LLC has sole voting power over 8,227,320 shares and sole dispositive power over 13,297,023 shares. The information contained herein respecting FMR LLC is based solely on the Schedule 13G filed by FMR LLC with the SEC on February 12, 2016. |
(4) | The business address for BlackRock, Inc. is 55 East 52nd Street, New York, New York 10022. BlackRock, Inc. has sole voting power over 11,670,427 shares and sole dispositive power over 12,067,818 shares. The information contained herein respecting BlackRock, Inc. is based solely on Amendment No. 1 to the Schedule 13G filed by BlackRock, Inc. with the SEC on January 27, 2016. |
73
(5) | The business address for Vanguard Specialized Funds — Vanguard REIT Index Fund is 100 Vanguard Blvd., Malvern, Pennsylvania 19355. The Vanguard Group has sole voting power over all of the shares that it beneficially owns. The information contained herein respecting Vanguard Specialized Funds — Vanguard REIT Index Fund is based solely on Amendment No. 1 to the Schedule 13G filed by Vanguard Specialized Funds — Vanguard REIT Index Fund with the SEC on February 9, 2016. |
(6) | The business address for Prudential Financial, Inc. is 751 Broad Street, Newark, New Jersey 07102. Prudential Financial, Inc. has sole voting power over 1,285,196 shares, shared voting power over 7,110,837 shares, sole dispositive power over 1,285,196 shares and shared dispositive power over 7,110,837 shares. The information contained herein respecting Prudential Financial, Inc. is based solely on the Schedule 13G filed by Prudential Financial, Inc. on February 3, 2016. |
(7) | Includes 40,000 restricted shares granted to each of our directors on April 15, 2014 (for directors in place as of that date in connection with the Listing), which vest annually over a five-year period in equal installments beginning with the anniversary of the date of grant. Also includes 438,181 OP units, all of which are currently convertible into shares of our common stock or the cash value of a corresponding number of shares, at the election of the OP, in accordance with the limited partnership agreement of the OP. Subsequent to December 31, 2015, Mr. Kahane converted 350,544 OP units into share of common stock, which were issued on February 1, 2016. |
(8) | Includes 826,347 OP units, all of which are currently convertible into shares of our common stock or the cash value of a corresponding number of shares, at the election of the OP, in accordance with the limited partnership agreement of the OP. |
(9) | Includes 9,656 restricted shares granted to Mr. Radesca on March 31, 2015 which vest over a four-year period following the grant date and 30,000 restricted shares granted to Mr. Radesca on November 3, 2015 which vest over a three-year period following the grant date. Also includes 13,501 OP units, all of which were submitted for redemption during January 2016 and will be converted into shares of our common stock on or around May 1, 2016, in accordance with the limited partnership agreement of the OP. |
(10) | Includes 48,264 restricted shares granted to Mr. O'Malley on March 31, 2015 which vest over a four-year period following the grant date. |
(11) | Includes 40,000 restricted shares granted to each of our directors on April 15, 2014 (for directors in place as of that date in connection with the Listing), which vest annually over a five year period in equal installments beginning with the anniversary of the date of grant. Also includes 4,673 restricted shares granted to Mr. Burns on May 29, 2014 and 7,774 restricted shares granted on July 13, 2015 which vest over a three-year period following the grant date. |
(12) | Includes 4,826 restricted shares granted to Ms. Perrotty on September 12, 2014 and 6,317 restricted shares granted on July 13, 2015 which vest over a three-year period following the grant date. |
(13) | Includes 2,134 restricted shares granted to Mr. Read on January 21, 2015 and 6,317 restricted shares granted on July 13, 2015 which vest over a three-year period following the grant date. |
(14) | Includes 4,310 restricted shares granted to Mr. Locker on November 8, 2015 which vest over a three-year period following the grant date. |
(15) | Includes 4,310 restricted shares granted to Mr. Nelson on November 8, 2015 which vest over a three-year period following the grant date. |
(16) | Mr. Sullivan resigned from his role as our chief financial officer effective as of June 3, 2015. The information contained herein respecting Mr. Sullivan is based solely on the Form 4 filed by Mr. Sullivan on May 6, 2015. |
(17) | Does not include LTIP units. On April 15, 2014 the Advisor was issued 8,880,579 LTIP units under the OPP. On April 15, 2015, 367,059 LTIP units were earned by the Advisor under the terms of the OPP. On June 30, 2015, the Advisor transferred, in accordance with the applicable requirements of the OPP, the 367,059 earned LTIP units pro rata to the ultimate members of the Sponsor, including 39,691 earned LTIP units to Mr. Kahane and 73,412 earned LTIP units to Mr. Happel and the remaining 253,956 earned LTIP units to the other members of the Sponsor. Subject to the Advisor's continued service through the vesting date, LTIP units will vest 1/3 on each of April 15, 2017, April 15, 2018 and April 15, 2019. At the time the Advisor's average capital account balance with respect to an LTIP unit is economically equivalent to the average capital account balance of an OP unit, the LTIP unit has been earned and it has been vested for 30 days, the Advisor, in its sole discretion, will be entitled to convert such LTIP unit into an OP unit in accordance with the provisions of the limited partnership agreement of the OP. Any earned and vested LTIP units may be converted into OP units, which may in turn be converted into shares of common stock, in accordance with the terms and conditions of the limited partnership agreement of the OP. See "Item 13. Certain Relationships and Related Transactions, and Director Independence — 2014 Advisor Multi Year Outperformance Agreement." |
Item 13. Certain Relationships and Related Transactions, and Director Independence.
Our Property Manager and Advisor are owned and controlled directly or indirectly by our Sponsor. Our Sponsor is controlled by William M. Kahane, a member of our board of directors, and Nicholas S. Schorsch, formerly our chief executive officer and chairman. The Former Dealer Manager, RCS Advisory Services, LLC (“RCS Advisory”) and American National Stock Transfer, LLC ("ANST") are subsidiaries of RCAP, a company that, until transactions entered into in connection with filing for Chapter 11 bankruptcy in January 2016, was also controlled by Messrs. Schorsch and Kahane.
74
Michael A. Happel, our chief executive officer and president, also is the chief executive officer and president of our Advisor and our Property Manager. Nicholas Radesca, our interim chief financial officer, treasurer and secretary, is also the interim chief financial officer, chief operating officer, treasurer and secretary of our Advisor and our Property Manager. Patrick O'Malley, our chief investment officer, is also the chief investment officer of our Advisor and our Property Manager.
Advisor
In connection with the Listing, we entered into an amended and restated advisory agreement with our Advisor on April 15, 2014, which was amended and restated again in June 2015, pursuant to which our Advisor manages our day-to-day operations. Under the amended and restated advisory agreement, we have agreed to pay an asset management fee to our Advisor equal to 0.50% per annum of the cost of assets (as defined in the amended and restated advisory agreement) and to reimburse the Advisor for costs and expenses incurred by the Advisor or any affiliate of the Advisor in providing asset management services; provided that if the cost of assets exceeds $3.0 billion on the applicable determination date, then the asset management fee is equal to 0.50% per annum of the cost of assets up to $3.0 billion and 0.40% per annum of the cost of assets in excess of $3.0 billion. The asset management fee is payable in monthly installments on the first business day of each month.
Total asset management fees paid during the year ended December 31, 2015 were $12.5 million, all paid in cash.
We reimburse the Advisor for costs and expenses paid or incurred by the Advisor and its affiliates in connection with providing services to us (including reasonable salaries and wages, benefits and overhead of all employees directly involved in the performance of such services), although we will not reimburse the Advisor for personnel costs in connection with services for which the Advisor receives a separate fee. Prior to June 2015, reimbursement of costs and expenses was subject to the limitation that we would not reimburse the Advisor for any amount by which our total operating expenses (as defined in the advisory agreement during the applicable time) for the four preceding fiscal quarters exceeded the greater of (a) 2.0% of average invested assets and (b) 25.0% of net income other than any additions to reserves for depreciation, bad debt or other similar non cash reserves and excluding any gain from the sale of assets for that period (the "2%/25% Limitation"). The 2%/25% Limitation was removed from the Advisory Agreement in connection with the amendment and restatement in June 2015.
Total reimbursement of costs and expenses during the year ended December 31, 2015 were $0.8 million.
For substantial assistance in connection with the sale of properties, we will pay the Advisor a property disposition fee not to exceed the lesser of 2.0% of the contract sale price of the property and 50% of the competitive real estate commission paid if a third party broker is also involved; provided, however that in no event may the property disposition fee paid to the Advisor when added to real estate commissions paid to unaffiliated third parties exceed the lesser of 6.0% of the contract sales price and a competitive real estate commission. For purposes of the foregoing, "competitive real estate commission" means a real estate brokerage commission for the purchase or sale of a property which is reasonable, customary and competitive in light of the size, type and location of the property. We incurred and paid $0.2 million in property disposition fees during the year ended December 31, 2015.
RCAP and its Affiliates
The predecessor to AR Global is a party to a services agreement with RCS Advisory, pursuant to which RCS Advisory and its affiliates provided us and certain other companies sponsored by AR Global with services (including, without limitation, transaction management, compliance, due diligence, event coordination and marketing services, among others) on a time and expenses incurred basis or at a flat rate based on services performed. The predecessor to AR Global instructed RCS Advisory to stop providing such services in November 2015 and no services have since been provided by RCS Advisory. The services covered by this agreement exclude any services provided in connection with a liquidation event or otherwise outside the ordinary course of business, which were permitted to be provided pursuant to a separate agreement and fee arrangement. We are also party to a transfer agency agreement with ANST pursuant to which ANST provides us with transfer agency services (including broker and stockholder servicing, transaction processing, year-end IRS reporting and other services), and supervisory services overseeing the transfer agency services performed by a third-party transfer agent. AR Global received written notice from ANST on February 10, 2016 that it will wind down operations by the end of the month and will withdraw as the transfer agent effective February 29, 2016. Our current provider of sub-transfer agency services will provide us with transfer agency services (including broker and stockholder servicing, transaction processing, year-end IRS reporting and other services) until we enter into a definitive transfer agency agreement with a transfer agent.
The amounts incurred from RCS Advisory and ANST for services performed on behalf of us described in the preceding paragraph were $0.7 million for the year ended December 31, 2015.
75
Property Manager
Pursuant to an amended and restated management agreement with the Property Manager, we pay the Property Manager fees equal to: (i) for non-hotel properties, 4.0% of gross revenues from the properties managed plus market-based leasing commissions; (ii) for hotel properties, a fee based on a percentage of gross revenues at a market rate in light of the size, type and location of the hotel property plus a customary incentive fee based on performance. Notwithstanding the foregoing, in the case of both hotel and non-hotel properties, the Property Manager may be entitled to receive higher fees if the Property Manager demonstrates to the satisfaction of a majority of the directors (including a majority of the independent directors) that a higher competitive fee is justified for the services rendered. We also reimburse the Property Manager for property-level expenses that it pays or incurs on our behalf, including reasonable salaries, bonuses and benefits of persons employed by the Property Manager except for the salaries, bonuses and benefits of persons who also serve as one of our executive officers or as an executive officer of the Property Manager or its affiliates. The Property Manager may subcontract the performance of its property management and leasing duties to third parties and pay all or a portion of its property management fee to the third parties with whom it contracts for these services. If we contract directly with third parties for such services we will pay them customary market fees and will pay the Property Manager an oversight fee equal to 1.0% of the gross revenues of the property managed. In no event do we pay the Property Manager or any affiliate both a property management fee and an oversight fee with respect to any particular property. Property management fees of $2.6 million were incurred for the year ended December 31, 2015; however, the Property Manager elected to waive (not defer) such property management fees, and the Property Manager will determine if a portion or all of such fees will be waived in subsequent periods on a quarter-to-quarter basis.
2014 Advisor Multi-Year Outperformance Agreement
On April 15, 2014 (the "Effective Date"), in connection with the Listing, we entered into the 2014 Advisor Multi-Year Outperformance Agreement (as amended and restated effective August 5, 2015, the "OPP") with the OP and the Advisor. We amended and restated the OPP effective August 5, 2015 to amend certain definitions related to performance measurement to equitably adjust for share issuances and share repurchases for the OPP's remaining valuation dates.
Under the OPP, the Advisor was issued 8,880,579 LTIP units in the OP with a maximum award value on the issuance date equal to 5.0% of our market capitalization (the "OPP Cap"). The LTIP units are structured as profits interests in the OP.
The Advisor is eligible to earn a number of LTIP units with a value equal to a portion of the OPP Cap upon the first, second and third anniversaries of the Effective Date based on our achievement of certain levels of total return to our stockholders (“Total Return”), including both share price appreciation and common stock dividends, as measured against a peer group of companies, as set forth below, for the three-year performance period commencing on the Effective Date (the “Three-year Period”); each 12-month period during the Three-Year Period (the “One-Year Period”); and the initial 24-month period of the Three-Year Period (the “Two-Year Period”), as follows:
Performance Period | Annual Period | Interim Period | ||||||
Absolute Component: 4% of any excess Total Return if total stockholder return attained above an absolute hurdle measured from the beginning of such period: | 21% | 7% | 14% | |||||
Relative Component: 4% of any excess Total Return attained above the Total Return for the performance period of the Peer Group*, subject to a ratable sliding scale factor as follows based on achievement of cumulative Total Return measured from the beginning of such period: | ||||||||
• | 100% will be earned if total stockholder return achieved is at least: | 18% | 6% | 12% | ||||
• | 50% will be earned if total stockholder return achieved is: | 0% | 0% | 0% | ||||
• | 0% will be earned if total stockholder return achieved is less than: | 0% | 0% | 0% | ||||
• | a percentage from 50% to 100% calculated by linear interpolation will be earned if the cumulative Total Return achieved is between: | 0% - 18% | 0% - 6% | 0% - 12% | ||||
*The “Peer Group” is comprised of the companies in the SNL US REIT Office Index as of the Effective Date.
The potential outperformance award is calculated at the end of each One-Year Period, the Two-Year Period and the Three-Year Period. The award earned for the Three-Year Period is based on the formula in the table above less any awards earned for the Two-Year Period and One-Year Periods, but not less than zero; the award earned for the Two-Year Period is based on the formula in the table above less any award earned for the first and second One-Year Period, but not less than zero. Any LTIP units that are unearned at the end of the Performance Period will be forfeited. On April 15, 2015, 367,059 LTIP units were earned by the Advisor under the terms of the OPP.
76
Subject to the Advisor’s continued service through each vesting date, one third of any earned LTIP units will vest on each of the third, fourth and fifth anniversaries of the Effective Date. Until such time as an LTIP unit is earned in accordance with the provisions of the OPP, the holder of such LTIP unit is entitled to distributions on such LTIP unit equal to 10% of the distributions made per OP unit. After an LTIP unit is earned, the holder of such LTIP unit is entitled to a catch-up distribution and then the same distribution as the holder of an OP unit. At the time the Advisor’s average capital account balance with respect to an LTIP unit is economically equivalent to the average capital account balance of an OP unit, the LTIP unit has been earned and it has been vested for 30 days, the holder, in its sole discretion, will be entitled to convert such LTIP unit into an OP unit in accordance with the provisions of the limited partnership agreement of the OP.
The OPP provides for early calculation of LTIP units earned and for the accelerated vesting of any earned LTIP units in the event Advisor is terminated or in the event of a change in control, in either case prior to the end of the Three-Year Period. The OPP also provides for accelerated vesting of earned LTIP units in the event the Advisor is terminated by us or in the event of a change in control of our company on or following the end of the Three-Year Period.
Pursuant to the OPP, LTIP units, or OP units issued upon conversion of LTIP units, may only be transferred with the consent of our compensation committee and upon agreement by the transferees to be bound by the terms of the OPP.
On April 15, 2015, in connection with the first anniversary of the effective date, 367,059 LTIP units were earned by the Advisor under the terms of the OPP. The Advisor is controlled by the Sponsor. The remaining LTIP units are currently unearned and unvested and will only be earned and vest upon the satisfaction of the performance based and service based vesting criteria summarized above. Any LTIP units that are not earned and vested will be forfeited.
On June 30, 2015, the Advisor transferred, in accordance with the applicable requirements of the OPP, the 367,059 earned LTIP units pro rata to the ultimate members of the Sponsor, including 39,691 earned LTIP units to William Kahane, one of our directors, 73,412 earned LTIP units to Michael A. Happel, our chief executive officer and president, and the remaining 253,956 earned LTIP units to the other members of the Sponsor. We paid $0.7 million in distributions related to LTIP units during the year ended December 31, 2015.
Strategic Advisory Agreement with Former Dealer Manager
In October 2014, we entered into separate transaction management agreements with Barclays Capital Inc. and the Former Dealer Manager as financial advisors to assist our board of directors in evaluating strategic options to enhance long-term stockholder value, including a business combination involving us or a sale of the Company. In May 2015, we terminated our agreements with Barclays Capital Inc. and the Former Dealer Manager. No amounts were paid and we are no longer obligated to pay any transaction fees under either agreement.
Affiliated Mutual Fund
During the year ended December 31, 2015, we had investments in a real estate income fund managed by an affiliate of the Sponsor. There was no obligation to purchase any additional shares and the shares were able to be sold at any time. We sold our investment for $3.3 million in the third quarter of 2015.
Indemnification Agreement
We have entered into an indemnification agreement with each of our directors and executive officers, and certain former directors and executive officers, providing for indemnification of such directors and executive officers consistent with the provisions of our charter. No amounts have been paid by us to these individuals pursuant to the indemnification agreement through February 25, 2016.
Viceroy Hotel
During the year ended December 31, 2015, we recognized $0.1 million in revenues from employees of, and other entities related to, the Sponsor and its affiliates related to room rentals at the Viceroy Hotel.
Joint Ventures with ARC NYCR
On October 1, 2015, we announced that we intend to enter into joint venture agreements with ARC NYCR, which is intended to better align interests between us and ARC NYCR and to facilitate the continued growth and diversification of both portfolios with reduced need to raise additional equity capital. Any joint venture agreement will require approval by our board of directors and the board of directors of ARC NYCR. We have suspended efforts to form a joint venture agreement with ARC NYCR due to our ongoing evaluation of strategic alternatives.
77
Investment Allocation Agreement
We have entered into the Allocation Agreement, with ARC NYCR, which has investment objectives similar to ours and is currently in the process of raising capital to make investments and making investments. Pursuant to the Allocation Agreement, if the Advisor or the advisor of ARC NYCR determines that one or more proposed New York City property acquisitions is appropriate for the REIT it advises, and assuming each of us and ARC NYCR has sufficient capital to support such proposed New York City property acquisition, such proposed New York City property acquisition will be presented to our board of directors and the board of directors of ARC NYCR for a vote on whether to pursue such proposed New York City property acquisition. If our board of directors and the board of directors of ARC NYCR approves the pursuit of such proposed New York City property acquisition, then the acquisitions of such properties will be subject to rotation among us and ARC NYCR, depending on whether we and ARC NYCR have sufficient capital to acquire all or some of the proposed New York City property acquisitions and which of us and ARC NYCR most recently made a property acquisition.
Director Independence
Our bylaws provide that the number of directors may not be less than the minimum required by Maryland corporate law nor more than fifteen; provided, however, that the number of directors may be changed from time to time by resolution adopted by the affirmative vote of a majority of the board of directors. The board of directors has currently set the number of directors at six. A majority of these directors must be “independent” except for a period of up to 60 days after the death, resignation or removal of an independent director. An indirect relationship includes circumstances in which a director’s spouse, parents, children, siblings, mothers- or fathers-in-law, sons- or daughters-in-law, or brothers- or sisters-in-law, is or has been associated with our Sponsor, Advisor, any of their affiliates or us.
The board of directors has considered the independence of each director in accordance with the elements of independence set forth in the listing standards of the NYSE. Based upon information solicited from each nominee, the board of directors has affirmatively determined that P. Sue Perrotty, Robert H. Burns, Randolph C. Read, Keith Locker and James L. Nelson have no material relationship with us (either directly or as a partner, stockholder or officer of an organization that has a relationship with us) other than as our director and are “independent” within the meaning of the NYSE’s director independence standards, as currently in effect and that.
The members of the audit committee are Ms. Perrotty and Messrs. Read and Locker, each of whom is independent for purposes of the applicable NYSE corporate governance listing requirements and rules and regulations of the SEC. Ms. Perrotty. currently serves as chairperson of the audit committee.
The members of the compensation committee are Messrs. Burns, Nelson and Locker, each of whom is independent for purposes of the applicable NYSE corporate governance listing requirements and rules and regulations of the SEC. Mr. Burns currently serves as chairperson of the compensation committee.
The members of the nominating and corporate governance committee are Ms. Perrotty and Messrs. Read and Nelson, each of whom is independent for purposes of the applicable NYSE corporate governance listing requirements and rules and regulations of the SEC. Ms. Perrotty currently serves as chairperson of the nominating and corporate governance committee.
Oversight of Conflict of Interest
On August 5, 2015, we established a conflicts committee. The members of the conflicts committee are Ms. Perrotty and Messrs. Burns and Nelson, each of whom is independent for purposes of the applicable NYSE corporate governance listing requirements and rules and regulations of the SEC. Mr. Nelson currently serves as chairperson of the conflicts committee. The charter of the conflicts committee is available to any stockholder who sends a request to New York REIT, Inc., 405 Park Avenue, 14th Floor, New York, NY 10022. The conflicts committee charter is also available on our website at www.nyrt.com by clicking on “Investors - Corporation Information - Governance Documents - Conflicts Committee Charter.”
Pursuant to the conflicts committee charter, the conflicts committee has the authority to: (a) review and evaluate the terms and conditions, and to determine the advisability of any transactions ("Related Party Transactions") and conflict of interest ("Conflict") situations between us, on the one hand, and any of the Sponsor, the Advisor, a director, an officer or any affiliate thereof, on the other hand; (b) to negotiate the terms and conditions of any Related Party Transaction, and, if the conflicts committee deems appropriate, but subject to the limitations of applicable law, to approve the execution and delivery of documents in connection with any Related Party Transaction on our behalf; (c) to determine whether the relevant Related Party Transaction is fair to, and in our best interest and the best interest of our stockholders, and (d) to recommend to the board of directors what action, if any should be taken by the board of directors with respect to any Related Party Transaction.
78
Prior to establishing the conflicts committee, the independent directors reviewed the material transactions between the Sponsor, the Advisor and their respective affiliates, on the one hand, and us, on the other hand. Either the independent directors of the board or the conflicts committee has determined that all our transactions and relationships with our Sponsor, Advisor and their respective affiliates during the year ended December 31, 2015 were fair and were approved in accordance with these policies.
In order to reduce or eliminate certain potential conflicts of interest, our advisory agreement provides for the following exclusions:
• | If we or the OP proposes to enter into any transaction in which the Advisor or any of its affiliates has a direct or indirect interest, then such transaction must be approved by a majority of the board of directors (including a majority of the independent directors) not otherwise interested in such transaction as fair and reasonable to us and on terms and conditions not less favorable to us than those available from unaffiliated third parties. |
• | Neither we nor the OP may make loans to the Advisor or any affiliate thereof except for loans to wholly owned subsidiaries of us. Neither the Advisor nor any of its affiliates must make loans to us or the OP, or to joint ventures involving us or the OP, unless approved by a majority of the directors (including a majority of the independent directors) not otherwise interested in such transaction as fair, competitive, and commercially reasonable, and no less favorable to us or OP, as applicable, than comparable loans between unaffiliated parties. |
• | We and the OP may enter into joint ventures involving us or the OP with the Advisor or its affiliates, provided that (a) a majority of directors (including a majority of independent directors) not otherwise interested in the transaction approves the transaction as being fair and reasonable to us or the OP, as applicable, and (b) the investment by us or the OP, as applicable, is on substantially the same terms as those received by other joint venturers. |
• | If the board of directors elects to internalize any management services provided by the Advisor, neither we nor the OP shall pay any compensation or other remuneration to the Advisor or its affiliates in connection with such internalization of management services. |
We have also entered into the Allocation Agreement with ARC NYCR.
Item 14. Principal Accounting Fees and Services.
We have selected and appointed KPMG LLP (“KPMG”) as our independent registered public accounting firm to audit our consolidated financial statements for the fiscal year ended December 31, 2015. KPMG was selected and appointed as our independent registered public accounting firm on February 2, 2015.
For the period from October 6, 2009 (date of inception) to January 22, 2015, Grant Thornton had served as our independent registered public accounting firm.
Fees for professional services billed by KPMG LLP for the year ended December 31, 2015 were $4,897,825, exclusively related to the audits of our 2014 and 2015 financial statements. No fees for professional services rendered by KPMG were incurred during the year ended December 31, 2014 because we did not engage KPMG until February 2015.
The audit committee's policy is to pre-approve all audit and permissible non-audit services provided by the independent registered public accountants. These services may include audit services, audit-related services, tax services, and other services. The audit committee generally pre-approves particular services or categories of services on a case-by-case basis. The independent registered public accounting firm and management are required to periodically report to the audit committee regarding the extent of services provided by the independent registered public accounting firm in accordance with these pre-approvals, and the fees for services performed to date.
All of the services described below were pre-approved by the audit committee.
Audit Fees
Audit fees billed by KPMG were $1,385,850 and $3,511,975, respectively, related to the audits of our 2015 and 2014 financial statements, which were billed during the year ended December 31, 2015.
Audit Related Fees
There were no audit related fees billed by KPMG for the years ended December 31, 2015 or 2014.
Tax Fees
There were no tax fees billed by KPMG for the years ended December 31, 2015 and 2014.
All Other Fees
There were no other fees billed by KPMG for the years ended December 31, 2015 and 2014.
79
PART IV
Item 15. Exhibits and Financial Statement Schedules.
(a)Financial Statement Schedules
See the Index to Consolidated Financial Statements at page F-1 of this report.
The following financial statement schedule is included herein at page F-43 of this report:
Schedule III – Real Estate and Accumulated Depreciation
(b)Exhibits
EXHIBIT INDEX
The following exhibits are included, or incorporated by reference, in this Annual Report on Form 10-K for the year ended December 31, 2015 (and are numbered in accordance with Item 601 of Regulation S-K):
Exhibit No. | Description | |
3.1 (6) | Amended and Restated Charter of American Realty Capital New York Recovery REIT, Inc. dated June 13, 2014 | |
3.2 (4) | Amended and Restated Bylaws of American Realty Capital New York Recovery REIT, Inc. dated April 15, 2014 | |
4.1 (4) | Fourth Amended and Restated Agreement of Limited Partnership of New York Recovery Operating Partnership, L.P. dated as of April 15, 2014 | |
4.2 (9) | First Amendment to Fourth Amended and Restated Agreement of Limited Partnership of New York Recovery Operating Partnership L.P., dated as of April 15, 2015. | |
10.1 (10) | Seventh Amended and Restated Advisory Agreement by and among New York REIT, Inc., New York Recovery Operating Partnership, L.P. and New York Recovery Advisors, LLC dated as of June 26, 2015 | |
10.2 (2) | Amended and Restated Management Agreement, among American Realty Capital New York Recovery REIT, Inc., New York Recovery Operating Partnership, L.P. and New York Recovery Properties, LLC, dated as of September 2, 2010 | |
10.3 (1) | Employee and Director Incentive Restricted Share Plan adopted as of September 22, 2010 | |
10.4 (4) | First Amendment to Employee and Director Incentive Restricted Share Plan of American Realty Capital New York Recovery REIT, Inc. dated as of March 31, 2014 | |
10.5 (5) | Second Amendment to Employee and Director Incentive Restricted Share Plan of American Realty Capital New York Recovery REIT, Inc. dated as of April 29, 2014 | |
10.6 (1) | 2010 Stock Option Plan Adopted as of September 22, 2010 | |
10.7 (13) | Second Amended and Restated 2014 Advisor Multi-Year Outperformance Agreement by and among New York REIT, Inc., New York Recovery Operating Partnership, L.P. and New York Recovery Advisors, LLC made as of August 5, 2015 | |
10.8 (4) | Contribution and Exchange Agreement dated as of April 15, 2014 | |
10.9 (4) | Listing Note Agreement dated as of April 15, 2014 | |
10.10 (4) | Second Amended and Restated Credit Agreement, dated April 14, 2014 by and among New York Recovery Operating Partnership, L.P., as borrower, New York REIT, Inc. as the REIT and guarantor, the lenders party thereto and Capital One, National Association, as administrative agent | |
10.11 (13) | First Amendment to Second Amended and Restated Credit Agreement by and among New York REIT, Inc., New York Recovery Operating Partnership, L.P. and Capital One, National Association, dated as of August 27, 2015 | |
10.12 (14) | Contribution and Admission Agreement, dated as of October 8, 2013, between WWP Sponsor, LLC and ARC NYWWPJV001, LLC | |
10.13 (3) | Second Amended and Restated Limited Liability Company Agreement of WWP Holdings, LLC, dated October 31, 2013, by and among NYWWPJV001, LLC and WWP Sponsor, LLC | |
10.14 (7) | Agreement of Purchase and Sale, dated as of July 29, 2014, by and between 245 West 17th Street Property Investors II, LLC, 249 West 17th Street Property Investors II, LLC and New York Recovery Operating Partnership, L.P. | |
10.15 (7) | First Amendment to Agreement of Purchase and Sale, dated as of August 22, 2014, by and between 245 West 17th Street Property Investors II, LLC, 249 West 17th Street Property Investors II, LLC and New York Recovery Operating Partnership, L.P. | |
80
Exhibit No. | Description | |
10.16 (9) | Indemnification Agreement between New York REIT, Inc. and each of Nicholas S. Schorsch, Michael A. Happel, Gregory W. Sullivan, Edward M. Weil, Jr., William M. Kahane, Randolph C. Read, Robert H. Burns, P. Sue Perrotty, Scott J. Bowman, William G. Stanley, New York Recovery Advisors, LLC, AR Capital, LLC and RCS Capital Corp, dated as of December 31, 2014 | |
10.17 (11) | Indemnification Agreement, between New York REIT, Inc. and each of Nicholas Radesca and Patrick O'Malley, dated as of June 22, 2015 | |
10.18 (12) | Loan Agreement, dated as of September 30, 2015, between ARC NY1440BWY1, LLC, as Borrower, and H/2 Financial Funding I LLC, as Lender | |
10.19 (12) | Mezzanine Loan Agreement, dated as of September 30, 2015, between ARC NY1440BWY1 MEZZ, LLC, as Borrower, and Paramount Group Fund VIII 1440 Broadway Mezz LP, as Lender | |
10.20 (12) | Amended, Restated and Consolidated Mortgage, Assignment of Rents and Leases, Collateral Assignment of Property Agreements, Security Agreement and Fixture Filing, made as of September 30, 2015 | |
10.21 (12) | Pledge and Security Agreement, made as of September 30, 2015, by ARC NY1440BWY1 MEZZ, LLC in favor of Paramount Group Fund VIII 1440 Broadway Mezz LP | |
10.22 (12) | Guaranty (Unfunded Obligations), dated as of September 30, 2015, by New York REIT, Inc. and New York Recovery Operating Partnership, L.P. for the benefit of the Mortgage Lender | |
10.23 (12) | Guaranty (Unfunded Obligations), dated as of September 30, 2015, by New York REIT, Inc. and New York Recovery Operating Partnership, L.P. for the benefit of the Mezzanine Lender | |
10.24 (12) | Environmental Indemnity Agreement, dated as of September 30, 2015, by New York REIT, Inc., New York Recovery Operating Partnership, L.P., and ARC NY1440BWY1, LLC for the benefit of the Mortgage Lender | |
10.25 (12) | Environmental Indemnity Agreement, dated as of September 30, 2015, by New York REIT, Inc., New York Recovery Operating Partnership, L.P., and ARC NY1440BWY1 MEZZ, LLC for the benefit of the Mezzanine Lender. | |
10.26 (12) | Guaranty, dated as of September 30, 2015, by New York REIT, Inc. and New York Recovery Operating Partnership, L.P. for the benefit of the Mortgage Lender | |
10.27 (12) | Guaranty, dated as of September 30, 2015, by New York REIT, Inc. and New York Recovery Operating Partnership, L.P. for the benefit of the Mezzanine Lender | |
10.28 (13) | Indemnification Agreement, dated September 30, 2015, between New York REIT, Inc. and Marc Rowan | |
10.29 * | Form of Restricted Stock Award Agreement | |
10.30 * | Indemnification Agreement, dated November 8, 2015, between New York REIT, Inc. and Keith Locker | |
10.31 * | Indemnification Agreement, dated November 8, 2015, between New York REIT, Inc. and James Nelson | |
14.1 * | Second Amended and Restated Code of Business Conduct and Ethics | |
16.1 (8) | Letter from Grant Thornton LLP to the Securities and Exchange Commission dated January 28, 2015 | |
21.1 * | Subsidiaries of New York REIT, Inc. | |
23.1 * | Consent of KPMG LLP | |
23.2 * | Consent of Grant Thornton LLP | |
31.1 * | Certification of the Principal Executive Officer of the Company pursuant to Securities Exchange Act Rule 13a-14(a) or 15d-14(a), as adopted pursuant to Section 302 of the Sarbanes-Oxley Act of 2002 | |
31.2 * | Certification of the Principal Financial Officer of the Company pursuant to Securities Exchange Act Rule 13a-14(a) or 15d-14(a), as adopted pursuant to Section 302 of the Sarbanes-Oxley Act of 2002 | |
32 * | Written statements of the Principal Executive Officer and Principal Financial Officer of the Company pursuant to 18 U.S.C. Section 1350, as adopted pursuant to Section 906 of the Sarbanes-Oxley Act of 2002 | |
101 * | XBRL (eXtensible Business Reporting Language). The following materials from New York REIT, Inc.'s Annual Report on Form 10-K for the year ended December 31, 2015, formatted in XBRL: (i) the Consolidated Balance Sheets, (ii) the Consolidated Statements of Operations and Comprehensive Loss, (iii) the Consolidated Statement of Changes in Equity, (iv) the Consolidated Statements of Cash Flows and (v) the Notes to the Consolidated Financial Statements. As provided in Rule 406T of Regulation S-T, this information in furnished and not filed for purpose of Sections 11 and 12 of the Securities Act of 1933 and Section 18 of the Securities Exchange Act of 1934 | |
______________________________________
* | Filed herewith |
(1) | Filed as an exhibit to the Post-Effective Amendment No. 1 to New York REIT, Inc.'s Registration Statement on Form S-11 (Registration No. 333-163069) filed with the SEC on March 2, 2011. |
81
(2) | Filed as an exhibit to the Pre-Effective Amendment No. 1 to Post-Effective Amendment No. 3 to New York REIT Inc.'s Registration Statement on Form S-11 (Registration No. 333-163069) filed with the SEC on July 26, 2011. |
(3) | Filed as an exhibit to New York REIT, Inc.'s Current Report on Form 8-K/A filed with the SEC on November 27, 2013. |
(4) | Filed as an exhibit to New York REIT, Inc.'s Current Report on Form 8-K filed with the SEC on April 15, 2014. |
(5) | Filed as an exhibit to New York REIT, Inc.'s Amendment No. 1 to Schedule TO filed with the SEC on May 5, 2014. |
(6) | Filed as an exhibit to New York REIT, Inc.'s Registration Statement on Form S-8 (Registration No. 333-197362) filed with the SEC on July 11, 2014. |
(7) | Filed as an exhibit to New York REIT, Inc.'s Quarterly Report on Form 10-Q filed with the SEC on November 4, 2014. |
(8) | Filed as an exhibit to New York REIT, Inc.'s Current Report on Form 8-K filed with the SEC on January 28, 2015. |
(9) | Filed as an exhibit to New York REIT, Inc.'s Annual Report on Form 10-K filed with the SEC on May 11, 2015. |
(10) | Filed as an exhibit to New York REIT, Inc.’s Current Report on Form 8-K filed with the SEC on June 26, 2015. |
(11) | Filed as an exhibit to New York REIT, Inc.’s Quarterly Report on Form 10-Q filed with the SEC on August 7, 2015. |
(12) | Filed as an exhibit to New York REIT, Inc.’s Current Report on Form 8-K filed with the SEC on October 5, 2015. |
(13) | Filed as an exhibit to New York REIT, Inc.’s Quarterly Report on Form 10-Q filed with the SEC on November 9, 2015. |
(14) | Filed as an exhibit to New York REIT, Inc.'s Quarterly Report on Form 10-Q filed with the SEC on November 13, 2013. |
82
Pursuant to the requirements of Section 13 or 15(d) of the Securities Exchange Act of 1934, the registrant has duly caused this report to be signed on its behalf by the undersigned, thereunto duly authorized, this 26th day of February, 2016.
NEW YORK REIT, INC. | ||
By: | /s/ MICHAEL A. HAPPEL | |
MICHAEL A. HAPPEL | ||
CHIEF EXECUTIVE OFFICER AND PRESIDENT | ||
Pursuant to the requirements of the Securities Exchange Act of 1934, as amended, this annual report on Form 10-K has been signed below by the following persons on behalf of the registrant and in the capacities and on the dates indicated.
Name | Capacity | Date | ||
/s/ Michael A. Happel | Chief Executive Officer and President (and Principal Executive Officer) | February 26, 2016 | ||
Michael A. Happel | ||||
/s/ Nicholas Radesca | Interim Chief Financial Officer, Treasurer and Secretary (Principal Financial Officer and Principal Accounting Officer) | February 26, 2016 | ||
Nicholas Radesca | ||||
/s/ Randolph C. Read | Non-Executive Chairman of the Board of Directors | February 26, 2016 | ||
Randolph C. Read | ||||
/s/ Robert H. Burns | Independent Director, Compensation Committee Chair | February 26, 2016 | ||
Robert H. Burns | ||||
/s/ William M. Kahane | Director | February 26, 2016 | ||
William M. Kahane | ||||
/s/ Keith Locker | Independent Director | February 26, 2016 | ||
Keith Locker | ||||
/s/ James L. Nelson | Independent Director, Conflicts Committee Chair | February 26, 2016 | ||
James L. Nelson | ||||
/s/ P. Sue Perrotty | Independent Director, Audit Committee Chair, Nominating and Corporate Governance Committee Chair | February 26, 2016 | ||
P. Sue Perrotty | ||||
83
Page | |
Financial Statement Schedule: | |
F-1
REPORT OF INDEPENDENT REGISTERED PUBLIC ACCOUNTING FIRM
The Board of Directors and Stockholders
New York REIT, Inc.:
We have audited the accompanying consolidated balance sheets of New York REIT, Inc. and subsidiaries (the Company) as of December 31, 2015 and 2014, and the related consolidated statements of operations, comprehensive loss, changes in equity and cash flows for the years then ended. In connection with our audits of the consolidated financial statements, we also have audited financial statement schedule III. These consolidated financial statements and financial statement schedule are the responsibility of the Company’s management. Our responsibility is to express an opinion on these consolidated financial statements and financial statement schedule based on our audits.
We conducted our audits in accordance with the standards of the Public Company Accounting Oversight Board (United States). Those standards require that we plan and perform the audit to obtain reasonable assurance about whether the financial statements are free of material misstatement. An audit includes examining, on a test basis, evidence supporting the amounts and disclosures in the financial statements. An audit also includes assessing the accounting principles used and significant estimates made by management, as well as evaluating the overall financial statement presentation. We believe that our audits provide a reasonable basis for our opinion.
In our opinion, the consolidated financial statements referred to above present fairly, in all material respects, the financial position of New York REIT, Inc. and subsidiaries as of December 31, 2015 and 2014 and the results of their operations and their cash flows for the years then ended in conformity with U.S. generally accepted accounting principles. Also in our opinion, the related financial statement schedule, when considered in relation to the basic consolidated financial statements taken as a whole, present fairly, in all material respects, the information set forth therein.
We also have audited, in accordance with the standards of the Public Company Accounting Oversight Board (United States), New York REIT Inc.’s internal control over financial reporting as of December 31, 2015, based on criteria established in Internal Control - Integrated Framework (2013) issued by the Committee of Sponsoring Organizations of the Treadway Commission (COSO), and our report dated February 26, 2016 expressed an unqualified opinion on the effectiveness of the Company’s internal control over financial reporting.
/s/ KPMG LLP
New York, New York
February 26, 2016
F-2
REPORT OF INDEPENDENT REGISTERED PUBLIC ACCOUNTING FIRM
The Board of Directors and Stockholders
New York REIT, Inc.
We have audited the accompanying consolidated statements of operations and comprehensive loss, changes in equity, and cash flows of New York REIT Inc. (a Maryland corporation) and subsidiaries (the “Company”) for the year ended December 31, 2013. These financial statements are the responsibility of the Company’s management. Our responsibility is to express an opinion on these financial statements based on our audit.
We conducted our audit in accordance with the standards of the Public Company Accounting Oversight Board (United States). Those standards require that we plan and perform the audit to obtain reasonable assurance about whether the financial statements are free of material misstatement. We were not engaged to perform an audit of the Company’s internal control over financial reporting. Our audit included consideration of internal control over financial reporting as a basis for designing audit procedures that are appropriate in the circumstances, but not for the purpose of expressing an opinion on the effectiveness of the Company’s internal control over financial reporting. Accordingly, we express no such opinion. An audit also includes examining, on a test basis, evidence supporting the amounts and disclosures in the financial statements, assessing the accounting principles used and significant estimates made by management, as well as evaluating the overall financial statement presentation. We believe that our audit provides a reasonable basis for our opinion.
In our opinion, the consolidated financial statements referred to above present fairly, in all material respects, the results of operations and cash flows of New York REIT, Inc. and subsidiaries for the year ended December 31, 2013 in conformity with accounting principles generally accepted in the United States of America.
/s/ GRANT THORNTON LLP
Philadelphia, Pennsylvania
February 28, 2014
F-3
REPORT OF INDEPENDENT REGISTERED PUBLIC ACCOUNTING FIRM
The Board of Directors and Stockholders
New York REIT, Inc.:
We have audited New York REIT Inc.’s (the Company’s) internal control over financial reporting as of December 31, 2015, based on the criteria established in Internal Control - Integrated Framework (2013) issued by the Committee of Sponsoring Organizations of the Treadway Commission (COSO). The Company’s management is responsible for maintaining effective internal control over financial reporting and for its assessment of the effectiveness of internal control over financial reporting, included in the accompanying Management’s Annual Report on Internal Control over Financial Reporting. Our responsibility is to express an opinion on the Company’s internal control over financial reporting based on our audit.
We conducted our audit in accordance with the standards of the Public Company Accounting Oversight Board (United States). Those standards require that we plan and perform the audit to obtain reasonable assurance about whether effective internal control over financial reporting was maintained in all material respects. Our audit included obtaining an understanding of internal control over financial reporting, assessing the risk that a material weakness exists, and testing and evaluating the design and operating effectiveness of internal control based on the assessed risk. Our audit also included performing such other procedures as we considered necessary in the circumstances. We believe that our audit provides a reasonable basis for our opinion.
A company’s internal control over financial reporting is a process designed to provide reasonable assurance regarding the reliability of financial reporting and the preparation of financial statements for external purposes in accordance with generally accepted accounting principles. A company’s internal control over financial reporting includes those policies and procedures that (1) pertain to the maintenance of records that, in reasonable detail, accurately and fairly reflect the transactions and dispositions of the assets of the company; (2) provide reasonable assurance that transactions are recorded as necessary to permit preparation of financial statements in accordance with generally accepted accounting principles, and that receipts and expenditures of the company are being made only in accordance with authorizations of management and directors of the company; and (3) provide reasonable assurance regarding prevention or timely detection of unauthorized acquisition, use, or disposition of the company’s assets that could have a material effect on the financial statements.
Because of its inherent limitations, internal control over financial reporting may not prevent or detect misstatements. Also, projections of any evaluation of effectiveness to future periods are subject to the risk that controls may become inadequate because of changes in conditions, or that the degree of compliance with the policies or procedures may deteriorate.
In our opinion, the Company maintained, in all material respects, effective internal control over financial reporting as of December 31, 2015, based on criteria established in Internal Control - Integrated Framework (2013) issued by the Committee of Sponsoring Organizations of the Treadway Commission (COSO).
We also have audited, in accordance with the standards of the Public Company Accounting Oversight Board (United States), the consolidated balance sheets of New York REIT Inc. and subsidiaries as of December 31, 2015 and 2014 and the related consolidated statements of operations, comprehensive loss, changes in equity and cash flows for the years then ended, and the related financial statement schedule III, and our report dated February 26, 2016 expressed an unqualified opinion on those consolidated financial statements and financial statements schedule.
/s/ KPMG LLP
New York, New York
February 26, 2016
F-4
NEW YORK REIT, INC.
CONSOLIDATED BALANCE SHEETS
(In thousands, except share and per share data)
December 31, | ||||||||
2015 | 2014 | |||||||
ASSETS | ||||||||
Real estate investments, at cost: | ||||||||
Land | $ | 477,171 | $ | 494,065 | ||||
Buildings, fixtures and improvements | 1,208,138 | 1,235,918 | ||||||
Acquired intangible assets | 137,594 | 158,383 | ||||||
Total real estate investments, at cost | 1,822,903 | 1,888,366 | ||||||
Less accumulated depreciation and amortization | (172,668 | ) | (124,178 | ) | ||||
Total real estate investments, net | 1,650,235 | 1,764,188 | ||||||
Cash and cash equivalents | 98,604 | 22,512 | ||||||
Restricted cash | 2,019 | 6,347 | ||||||
Investment securities, at fair value | — | 4,659 | ||||||
Investment in unconsolidated joint venture | 215,370 | 225,501 | ||||||
Assets held for sale | 29,268 | — | ||||||
Preferred equity investment | — | 35,100 | ||||||
Derivatives, at fair value | 431 | 205 | ||||||
Tenant and other receivables | 3,537 | 4,833 | ||||||
Unbilled rent receivables | 42,905 | 30,866 | ||||||
Prepaid expenses and other assets (including amounts prepaid to related parties of $7 as of December 31, 2015) | 10,074 | 13,195 | ||||||
Deferred costs, net | 19,312 | 13,429 | ||||||
Total assets | $ | 2,071,755 | $ | 2,120,835 | ||||
LIABILITIES AND EQUITY | ||||||||
Mortgage notes payable | $ | 388,436 | $ | 172,242 | ||||
Credit facility | 485,000 | 635,000 | ||||||
Market lease intangibles, net | 73,083 | 84,220 | ||||||
Liabilities related to assets held for sale | 321 | — | ||||||
Derivatives, at fair value | 1,266 | 1,276 | ||||||
Accounts payable, accrued expenses and other liabilities (including amounts due to related parties of $99 and $575 as of December 31, 2015 and 2014, respectively) | 27,736 | 27,850 | ||||||
Deferred rent | 3,617 | 4,550 | ||||||
Dividends payable | 27 | 20 | ||||||
Total liabilities | 979,486 | 925,158 | ||||||
Preferred stock, $0.01 par value; 40,866,376 shares authorized, none issued and outstanding | — | — | ||||||
Convertible preferred stock, $0.01 par value; 9,133,624 shares authorized, none issued and outstanding | — | — | ||||||
Common stock, $0.01 par value; 300,000,000 shares authorized, 162,529,811 and 162,181,939 shares issued and outstanding at December 31, 2015 and December 31, 2014, respectively | 1,626 | 1,622 | ||||||
Additional paid-in capital | 1,403,624 | 1,401,619 | ||||||
Accumulated other comprehensive loss | (1,237 | ) | (816 | ) | ||||
Accumulated deficit | (369,273 | ) | (255,478 | ) | ||||
Total stockholders' equity | 1,034,740 | 1,146,947 | ||||||
Non-controlling interests | 57,529 | 48,730 | ||||||
Total equity | 1,092,269 | 1,195,677 | ||||||
Total liabilities and equity | $ | 2,071,755 | $ | 2,120,835 | ||||
The accompanying notes are an integral part of these consolidated financial statements.
F-5
NEW YORK REIT, INC.
CONSOLIDATED STATEMENTS OF OPERATIONS AND COMPREHENSIVE INCOME (LOSS)
(In thousands, except share and per share data)
Year Ended December 31, | ||||||||||||
2015 | 2014 | 2013 | ||||||||||
Revenues: | ||||||||||||
Rental income | $ | 129,118 | $ | 117,221 | $ | 49,532 | ||||||
Hotel revenue | 26,125 | 22,742 | 2,254 | |||||||||
Operating expense reimbursements and other revenue | 19,278 | 15,604 | 4,101 | |||||||||
Total revenues | 174,521 | 155,567 | 55,887 | |||||||||
Operating expenses: | ||||||||||||
Property operating | 43,752 | 37,209 | 12,546 | |||||||||
Hotel operating | 25,366 | 23,736 | 2,372 | |||||||||
Operating fees incurred from the Advisor | 12,465 | 8,397 | — | |||||||||
Acquisition and transaction related | 3,771 | 16,083 | 17,417 | |||||||||
Vesting of asset management fees | — | 11,500 | — | |||||||||
Value of Listing Note | — | 33,479 | — | |||||||||
General and administrative | 27,345 | 12,337 | 1,019 | |||||||||
Depreciation and amortization | 82,716 | 84,799 | 31,751 | |||||||||
Total operating expenses | 195,415 | 227,540 | 65,105 | |||||||||
Operating loss | (20,894 | ) | (71,973 | ) | (9,218 | ) | ||||||
Other income (expenses): | ||||||||||||
Interest expense | (29,362 | ) | (23,720 | ) | (10,673 | ) | ||||||
Income (loss) from unconsolidated joint venture | 1,939 | (1,499 | ) | (95 | ) | |||||||
Income from preferred equity investment, investment securities and interest | 1,103 | 2,906 | 670 | |||||||||
Gain on sale of real estate investment, net | 7,523 | — | — | |||||||||
Gain (loss) on derivative instruments | (578 | ) | 1 | 5 | ||||||||
Total other expenses | (19,375 | ) | (22,312 | ) | (10,093 | ) | ||||||
Net loss | (40,269 | ) | (94,285 | ) | (19,311 | ) | ||||||
Net loss attributable to non-controlling interests | 1,188 | 1,257 | 32 | |||||||||
Net loss attributable to stockholders | (39,081 | ) | (93,028 | ) | (19,279 | ) | ||||||
Other comprehensive income (loss): | ||||||||||||
Unrealized gain (loss) on derivatives | (177 | ) | (687 | ) | 1,320 | |||||||
Unrealized gain (loss) on investment securities | (244 | ) | 484 | (240 | ) | |||||||
Total other comprehensive income (loss) | (421 | ) | (203 | ) | 1,080 | |||||||
Comprehensive loss attributable to stockholders | $ | (39,502 | ) | $ | (93,231 | ) | $ | (18,199 | ) | |||
Basic and diluted weighted average common shares outstanding | 162,165,580 | 166,959,316 | 73,074,872 | |||||||||
Basic and diluted net loss per share attributable to stockholders | $ | (0.24 | ) | $ | (0.56 | ) | $ | (0.26 | ) | |||
Dividends declared per common share | $ | 0.46 | $ | 0.49 | $ | 0.61 | ||||||
The accompanying notes are an integral part of these consolidated financial statements.
F-6
NEW YORK REIT, INC.
CONSOLIDATED STATEMENTS OF CHANGES IN EQUITY
(In thousands, except share data)
Common Stock | Accumulated Other Comprehensive Income (Loss) | ||||||||||||||||||||||||||||||
Number of Shares | Par Value | Additional Paid-In Capital | Accumulated Deficit | Stockholders' Equity | Non- controlling Interests | Total Equity | |||||||||||||||||||||||||
Balance December 31, 2012 | 19,930,772 | 199 | 164,972 | (1,693 | ) | (22,338 | ) | 141,140 | 1,291 | 142,431 | |||||||||||||||||||||
Issuances of common stock | 152,371,933 | 1,524 | 1,501,003 | — | — | 1,502,527 | — | 1,502,527 | |||||||||||||||||||||||
Common stock offering costs, commissions and dealer manager fees | — | — | (149,210 | ) | — | — | (149,210 | ) | — | (149,210 | ) | ||||||||||||||||||||
Common stock issued though distribution reinvestment plan | 1,984,370 | 20 | 18,832 | — | — | 18,852 | — | 18,852 | |||||||||||||||||||||||
Common stock repurchases | (195,395 | ) | (2 | ) | (1,884 | ) | — | — | (1,886 | ) | — | (1,886 | ) | ||||||||||||||||||
Equity-based compensation | 28,728 | — | 232 | — | — | 232 | — | 232 | |||||||||||||||||||||||
Increase in interest in Bleecker Street | — | — | (247 | ) | — | — | (247 | ) | (753 | ) | (1,000 | ) | |||||||||||||||||||
Distributions to non-controlling interest holders | — | — | — | — | — | — | (65 | ) | (65 | ) | |||||||||||||||||||||
Dividends declared | — | — | — | — | (44,391 | ) | (44,391 | ) | — | (44,391 | ) | ||||||||||||||||||||
Net loss | — | — | — | — | (19,279 | ) | (19,279 | ) | (32 | ) | (19,311 | ) | |||||||||||||||||||
Other comprehensive income | — | — | — | 1,080 | — | 1,080 | — | 1,080 | |||||||||||||||||||||||
Balance December 31, 2013 | 174,120,408 | 1,741 | 1,533,698 | (613 | ) | (86,008 | ) | 1,448,818 | 441 | 1,449,259 | |||||||||||||||||||||
Issuances of common stock | 18,908 | — | 184 | — | — | 184 | — | 184 | |||||||||||||||||||||||
Common stock offering costs, commissions and dealer manager fees | — | — | (95 | ) | — | — | (95 | ) | — | (95 | ) | ||||||||||||||||||||
Common stock issued though distribution reinvestment plan | 2,002,008 | 20 | 18,999 | — | — | 19,019 | — | 19,019 | |||||||||||||||||||||||
Common stock repurchases, inclusive of fees and expenses | (14,175,115 | ) | (141 | ) | (153,622 | ) | — | — | (153,763 | ) | — | (153,763 | ) | ||||||||||||||||||
Contributions from non-controlling interest holders of affiliates | — | — | — | — | — | — | 750 | 750 | |||||||||||||||||||||||
Issuance of OP units to affiliates | — | — | — | — | — | — | 44,979 | 44,979 | |||||||||||||||||||||||
Redemption of OP units by affiliates | — | — | — | — | — | — | (698 | ) | (698 | ) | |||||||||||||||||||||
Equity-based compensation | 215,730 | 2 | 2,455 | — | — | 2,457 | 5,295 | 7,752 | |||||||||||||||||||||||
Distributions to non-controlling interest holders | — | — | — | — | — | — | (780 | ) | (780 | ) | |||||||||||||||||||||
Dividends declared | — | — | — | — | (76,442 | ) | (76,442 | ) | — | (76,442 | ) | ||||||||||||||||||||
Net loss | — | — | — | — | (93,028 | ) | (93,028 | ) | (1,257 | ) | (94,285 | ) | |||||||||||||||||||
Other comprehensive loss | — | — | — | (203 | ) | — | (203 | ) | — | (203 | ) | ||||||||||||||||||||
Balance, December 31, 2014 | 162,181,939 | 1,622 | 1,401,619 | (816 | ) | (255,478 | ) | 1,146,947 | 48,730 | 1,195,677 | |||||||||||||||||||||
OP units converted to common stock | 92,751 | 1 | 973 | — | — | 974 | (974 | ) | — | ||||||||||||||||||||||
Equity-based compensation | 255,121 | 3 | 1,032 | — | — | 1,035 | 14,145 | 15,180 | |||||||||||||||||||||||
Distributions to non-controlling interest holders | — | — | — | — | — | — | (3,184 | ) | (3,184 | ) | |||||||||||||||||||||
Dividends declared | — | — | — | — | (74,714 | ) | (74,714 | ) | — | (74,714 | ) | ||||||||||||||||||||
Net loss | — | — | — | — | (39,081 | ) | (39,081 | ) | (1,188 | ) | (40,269 | ) | |||||||||||||||||||
Other comprehensive loss | — | — | — | (421 | ) | — | (421 | ) | — | (421 | ) | ||||||||||||||||||||
Balance, December 31, 2015 | 162,529,811 | $ | 1,626 | $ | 1,403,624 | $ | (1,237 | ) | $ | (369,273 | ) | $ | 1,034,740 | $ | 57,529 | $ | 1,092,269 | ||||||||||||||
The accompanying notes are an integral part of these consolidated financial statements.
F-7
Year Ended December 31, | ||||||||||||
2015 | 2014 | 2013 | ||||||||||
Cash flows from operating activities: | ||||||||||||
Net loss | $ | (40,269 | ) | $ | (94,285 | ) | $ | (19,311 | ) | |||
Adjustments to reconcile net loss to net cash provided by operating activities: | ||||||||||||
Depreciation and amortization | 82,716 | 84,799 | 31,751 | |||||||||
Amortization of deferred financing costs | 7,036 | 8,184 | 2,369 | |||||||||
Accretion of below- and amortization of above-market lease liabilities and assets, net | (8,366 | ) | (9,738 | ) | (2,681 | ) | ||||||
Vesting of asset management fees and final value of listing note | — | 44,979 | — | |||||||||
Loss (gain) on derivative instruments | 75 | (1 | ) | (5 | ) | |||||||
Gain on sale of real estate investment, net | (7,523 | ) | — | — | ||||||||
Gain on sale of investments | (109 | ) | — | — | ||||||||
Bad debt expense | 870 | 220 | 481 | |||||||||
Equity-based compensation | 15,245 | 7,752 | 232 | |||||||||
Loss (income) from unconsolidated joint venture | (1,939 | ) | 1,499 | 95 | ||||||||
Changes in assets and liabilities: | ||||||||||||
Tenant and other receivables | 952 | (2,823 | ) | (1,215 | ) | |||||||
Unbilled rent receivables | (13,683 | ) | (19,590 | ) | (8,968 | ) | ||||||
Prepaid expenses, other assets and deferred costs | 349 | (6,632 | ) | (8,566 | ) | |||||||
Accrued unbilled ground rent | 3,179 | 4,348 | 476 | |||||||||
Accounts payable and accrued expenses | (102 | ) | (8,730 | ) | 7,314 | |||||||
Due from affiliated entities | — | — | 325 | |||||||||
Deferred rent | (706 | ) | (3,447 | ) | 7,131 | |||||||
Net cash provided by operating activities | 37,725 | 6,535 | 9,428 | |||||||||
Cash flows from investing activities: | ||||||||||||
Proceeds from sale of preferred equity investment and other real estate investments | 70,854 | — | — | |||||||||
Investment in real estate and other assets | — | (316,206 | ) | (1,298,228 | ) | |||||||
Acquisition funds released from (held in) escrow | 4,748 | (4,748 | ) | — | ||||||||
Capital expenditures | (30,289 | ) | (11,801 | ) | (12,089 | ) | ||||||
Purchase of investment securities | (78 | ) | (3,127 | ) | (1,288 | ) | ||||||
Proceeds from sale of investment securities | 4,602 | — | — | |||||||||
Distributions from unconsolidated joint venture | 12,070 | 8,047 | 2,097 | |||||||||
Net cash provided by (used in) investing activities | 61,907 | (327,835 | ) | (1,309,508 | ) | |||||||
Cash flows from financing activities: | ||||||||||||
Proceeds from mortgage notes payable | 305,000 | — | — | |||||||||
Payments on mortgage notes payable | (88,806 | ) | (474 | ) | (72,853 | ) | ||||||
Proceeds from credit facility | — | 330,000 | 305,000 | |||||||||
Payments on credit facility | (150,000 | ) | — | (19,995 | ) | |||||||
Proceeds from issuance of common stock | — | 11,311 | 1,492,523 | |||||||||
Proceeds from issuance of operating partnership units | — | 750 | — | |||||||||
Payments for purchase of derivative instruments | (488 | ) | — | — | ||||||||
Repurchases of common stock, inclusive of fees and expenses | — | (154,269 | ) | (1,763 | ) | |||||||
Payments of offering costs and fees related to stock issuances | — | (1,506 | ) | (148,223 | ) | |||||||
Payments of financing costs | (10,771 | ) | (7,293 | ) | (7,562 | ) | ||||||
Dividends paid | (74,707 | ) | (66,129 | ) | (17,799 | ) | ||||||
Distributions to non-controlling interest holders | (3,184 | ) | (780 | ) | (65 | ) | ||||||
Redemptions of OP units and restricted shares | (65 | ) | (698 | ) | (1,000 | ) | ||||||
Restricted cash | (519 | ) | (477 | ) | (160 | ) | ||||||
Net cash provided by (used in) financing activities | (23,540 | ) | 110,435 | 1,528,103 | ||||||||
Net increase (decrease) in cash and cash equivalents | 76,092 | (210,865 | ) | 228,023 | ||||||||
Cash and cash equivalents, beginning of period | 22,512 | 233,377 | 5,354 | |||||||||
Cash and cash equivalents, end of period | $ | 98,604 | $ | 22,512 | $ | 233,377 | ||||||
F-8
Year Ended December 31, | ||||||||||||
2015 | 2014 | 2013 | ||||||||||
Supplemental Disclosures: | ||||||||||||
Cash paid for interest | $ | 21,660 | $ | 15,467 | $ | 7,946 | ||||||
Non-Cash Investing and Financing Activities: | ||||||||||||
Accrued capital expenditures | 498 | 3,555 | — | |||||||||
Reclassification of real estate and other assets to held for sale | 29,268 | — | — | |||||||||
Reclassification of liabilities related to real estate and other assets to held for sale | 321 | — | — | |||||||||
Mortgage notes payable used to acquire investments in real estate | — | — | 60,000 | |||||||||
Liabilities assumed in acquisition of real estate | — | — | 12,206 | |||||||||
Dividends payable | 27 | 20 | — | |||||||||
Debt assumed in real estate acquisitions | — | — | 1,411 | |||||||||
Conversion of preferred stock to common stock | — | — | 506 | |||||||||
Conversion of OP units to common stock | 974 | — | — | |||||||||
Common stock issued through distribution reinvestment plan | — | 19,019 | 18,852 | |||||||||
The accompanying notes are an integral part of these consolidated financial statements.
F-9
NEW YORK REIT, INC.
NOTES TO CONSOLIDATED FINANCIAL STATEMENTS
December 31, 2015, 2014 and 2013
Note 1 — Organization
New York REIT, Inc. (the "Company") is a REIT oriented towards owning income-producing commercial real estate in New York City, primarily office and retail properties located in Manhattan. The Company may also acquire multifamily, industrial, hotel and other types of real properties as well as originate or acquire first mortgage loans, mezzanine loans, or preferred equity interests related to New York City real estate. The Company purchased its first property and commenced active operations in June 2010. As of December 31, 2015, the Company owned 22 properties.
The Company, incorporated on October 6, 2009, is a Maryland corporation that qualified as a real estate investment trust for U.S. federal income tax purposes ("REIT") beginning with its taxable year ended December 31, 2010. On April 15, 2014, the Company listed its common stock on the New York Stock Exchange ("NYSE") under the symbol "NYRT" (the "Listing").
Substantially all of the Company's business is conducted through New York Recovery Operating Partnership, L.P. (the "OP"), a Delaware limited partnership. The Company has no direct employees. The Company has retained New York Recovery Advisors, LLC (the "Advisor") to manage its affairs on a day-to-day basis. New York Recovery Properties, LLC (the "Property Manager") serves as the Company's property manager, unless services are performed by a third party for specific properties. The Advisor and Property Manager are under common control with AR Global Investments, LLC (the successor business to AR Capital, LLC, "AR Global"), the parent of the Company's sponsor, American Realty Capital III, LLC (the "Sponsor"), as a result of which, they are related parties and have received or will continue to receive compensation, fees and expense reimbursements for services related to the investment and management of the Company's assets.
Realty Capital Securities, LLC (the "Former Dealer Manager") served as the dealer manager of the initial public offering, which was ongoing from September 2010 to December 2013 (the "IPO"), and, together with its affiliates, continued to provide the Company with various services through December 31, 2015. RCS Capital Corporation, the parent company of the Former Dealer Manager and certain of its affiliates that provided services to the Company, filed for Chapter 11 bankruptcy protection in January 2016, prior to which it was also under common control with AR Global, the parent of the Sponsor.
Note 2 — Summary of Significant Accounting Policies
Basis of Accounting
The accompanying consolidated financial statements of the Company are prepared on the accrual basis of accounting in accordance with accounting principles generally accepted in the United States of America ("GAAP").
Reclassifications
Certain prior year amounts have been reclassified to conform with the current year presentation, specifically the amortization of the basis difference related to our unconsolidated joint venture of $2.2 million for the year ended December 31, 2013, which has been reflected as a component of income (loss) from unconsolidated joint venture instead of depreciation and amortization in the accompanying consolidated statements of operations and comprehensive loss. See Note 4 — Investment in Unconsolidated Joint Venture.
Principles of Consolidation
The consolidated financial statements include the accounts of the Company, its wholly owned subsidiaries and consolidated joint venture arrangements in which the Company has controlling financial interests, either through voting or similar rights or by means other than voting rights if the Company is the primary beneficiary of a variable interest entity ("VIE"). The portions of the consolidated joint venture arrangements not owned by the Company are presented as noncontrolling interests. All inter-company accounts and transactions have been eliminated in consolidation.
The Company evaluates its relationships and investments to determine if it has variable interests in a VIE. A variable interest is an investment or other interest that will absorb portions of an entity’s expected losses or receive portions of the entity’s expected residual returns. If the Company determines that it has a variable interest in an entity, it evaluates whether such interest is in a VIE. A VIE is broadly defined as an entity where either (1) the equity investors as a group, if any, lack the power through voting or similar rights to direct the activities of an entity that most significantly impact the entity’s economic performance or (2) the equity investment at risk is insufficient to finance that entity’s activities without additional subordinated financial support. The Company consolidates any VIEs when it is determined to be the primary beneficiary of the VIE’s operations.
F-10
NEW YORK REIT, INC.
NOTES TO CONSOLIDATED FINANCIAL STATEMENTS
December 31, 2015, 2014 and 2013
A variable interest holder is considered to be the primary beneficiary of a VIE if it has the power to direct the activities of a VIE that most significantly impact the entity’s economic performance and has the obligation to absorb losses of, or the right to receive benefits from, the entity that could potentially be significant to the VIE.
The Company continually evaluates the need to consolidate its joint ventures. In determining whether the Company has a controlling interest in a joint venture and the requirement to consolidate the accounts of that entity, management considers factors such as ownership interest, power to make decisions and contractual and substantive participating rights of the partners or members as well as whether the entity is a VIE for which the Company is the primary beneficiary.
Use of Estimates
The preparation of financial statements in conformity with GAAP requires management to make estimates and assumptions that affect the reported amounts of assets and liabilities and disclosure of contingent assets and liabilities at the date of the financial statements and the reported amounts of revenues and expenses during the reporting period. Actual results could differ from those estimates. Management makes significant estimates regarding revenue recognition, purchase price allocations to record investments in real estate, derivative financial instruments and hedging activities, equity-based compensation expenses related to the 2014 Advisor Multi-Year Outperformance Agreement (as amended and restated effective August 5, 2015, the "OPP") and fair value measurements, as applicable.
Investments in Real Estate
The Company evaluates the inputs, processes and outputs of each asset acquired to determine if the transaction is a business combination or asset acquisition. If an acquisition qualifies as a business combination, the related transaction costs are recorded as an expense in the consolidated statement of operations and comprehensive loss. If an acquisition qualifies as an asset acquisition, the related transaction costs are generally capitalized and subsequently amortized over the useful life of the acquired assets.
In business combinations, the Company allocates the purchase price of acquired properties to tangible and identifiable intangible assets or liabilities and non-controlling interests based on their respective estimated fair values. Tangible assets may include land, land improvements, buildings, fixtures and tenant improvements. Intangible assets or liabilities may include the value of in-place leases, above- and below-market leases and other identifiable intangible assets or liabilities based on lease or property specific characteristics.
The fair value of the tangible assets of an acquired property with an in-place operating lease is determined by valuing the property as if it were vacant, and the “as-if-vacant” value is then allocated to the tangible assets based on the fair value of the tangible assets. The fair value of in-place leases is determined by considering estimates of carrying costs during the expected lease-up periods, current market conditions, as well as costs to execute similar leases. The fair value of above- or below-market leases and ground leases is recorded based on the present value of the difference between the contractual amount to be paid pursuant to the in-place lease and the Company's estimate of the comparable fair market lease rate, measured over the remaining term of the lease, including any below market fixed rate renewal options for below-market leases. The fair value of other intangible assets, such as real estate tax abatements, are recorded based on the present value of the expected benefit and amortized over the expected useful life.
Fair values of assumed mortgages, if applicable, are recorded as debt premiums or discounts based on the present value of the estimated cash flows, which is calculated to account for either above- or below-market interest rates.
Non-controlling interests in property owning entities are recorded based on its fair value at the date of acquisition, as determined by the terms of the applicable agreement.
The Company utilizes a number of sources in making its estimates of fair values for purposes of allocating purchase price, including real estate valuations prepared by independent valuation firms. The Company also considers information and other factors including: market conditions, the industry in which the tenant operates, characteristics of the real estate such as location, size, demographics, value and comparative rental rates, tenant credit profile and the importance of the location of the real estate to the operations of the tenant’s business.
F-11
NEW YORK REIT, INC.
NOTES TO CONSOLIDATED FINANCIAL STATEMENTS
December 31, 2015, 2014 and 2013
Disposals of real estate investments that represent a strategic shift in operations that will have a major effect on the Company's operations and financial results are presented as discontinued operations in the consolidated statements of operations and comprehensive loss for all periods presented; otherwise, the Company continues to report the results of these properties' operations within continuing operations. Properties that are intended to be sold will be designated as "held for sale" on the consolidated balance sheets at the lesser of carrying amount or fair value less estimated selling costs when they meet specific criteria to be presented as held for sale. Properties are no longer depreciated when they are classified as held for sale. The Company has three properties classified as held for sale as of December 31, 2015. The Company did not have any properties held for sale as of December 31, 2014. See Note 3 — Real Estate Investments.
Acquired intangible assets and lease liabilities consist of the following as of December 31, 2015 and 2014.
December 31, 2015 | ||||||||||||
(In thousands) | Gross Carrying Amount | Accumulated Amortization | Net Carrying Amount | |||||||||
Intangible assets: | ||||||||||||
In-place leases | $ | 113,392 | $ | 31,120 | $ | 82,272 | ||||||
Other intangible | 3,804 | 429 | 3,375 | |||||||||
Above-market leases | 20,398 | 3,713 | 16,685 | |||||||||
Total acquired intangible assets | $ | 137,594 | $ | 35,262 | $ | 102,332 | ||||||
Intangible lease liabilities: | ||||||||||||
Below-market leases | $ | 77,177 | $ | 21,110 | $ | 56,067 | ||||||
Above-market ground lease liability | 17,968 | 952 | 17,016 | |||||||||
Total market lease intangibles | $ | 95,145 | $ | 22,062 | $ | 73,083 | ||||||
December 31, 2014 | ||||||||||||
(In thousands) | Gross Carrying Amount | Accumulated Amortization | Net Carrying Amount | |||||||||
Intangible assets: | ||||||||||||
In-place leases | $ | 131,518 | $ | 27,450 | $ | 104,068 | ||||||
Other intangible | 3,804 | 107 | 3,697 | |||||||||
Above-market leases | 23,061 | 3,605 | 19,456 | |||||||||
Total acquired intangible assets | $ | 158,383 | $ | 31,162 | $ | 127,221 | ||||||
Intangible lease liabilities: | ||||||||||||
Below-market leases | $ | 81,708 | $ | 14,953 | $ | 66,755 | ||||||
Above-market ground lease liability | 17,968 | 503 | 17,465 | |||||||||
Total market lease intangibles | $ | 99,676 | $ | 15,456 | $ | 84,220 | ||||||
Depreciation and Amortization
Depreciation is computed using the straight-line method over the estimated useful lives of up to 40 years for buildings, 15 years for land improvements, five to seven years for fixtures and improvements and the shorter of the useful life or the remaining lease term for tenant improvements and leasehold interests.
Acquired above-market leases are amortized as a reduction of rental income over the remaining terms of the respective leases. Acquired below-market leases are amortized as an increase to rental income over the remaining terms of the respective leases and expected below-market renewal option periods.
Acquired above-market ground leases are amortized as a reduction of property operating expense over the remaining term of the respective leases. Acquired below-market ground lease values are amortized as an increase to property operating expense over the remaining terms of the respective leases and expected below-market renewal option period.
F-12
NEW YORK REIT, INC.
NOTES TO CONSOLIDATED FINANCIAL STATEMENTS
December 31, 2015, 2014 and 2013
The value of in-place leases, exclusive of the value of above- and below-market in-place leases, is amortized to depreciation and amortization expense over the remaining terms of the respective leases.
Assumed mortgage premiums or discounts, if applicable, are amortized as a reduction or increase to interest expense over the remaining term of the respective mortgages.
The following table provides the weighted-average remaining amortization and accretion periods as of December 31, 2015, for intangible assets and liabilities and the projected amortization expense and adjustments to revenues for the next five years:
(Dollar amounts in thousands) | Weighted- Average Remaining Amortization Period | 2016 | 2017 | 2018 | 2019 | 2020 | ||||||||||||||||
In-place leases | 8.9 | $ | 10,665 | $ | 9,612 | $ | 8,655 | $ | 8,271 | $ | 8,033 | |||||||||||
Other intangible | 10.5 | 321 | 321 | 321 | 321 | 321 | ||||||||||||||||
Total to be included in depreciation and amortization expense | $ | 10,986 | $ | 9,933 | $ | 8,976 | $ | 8,592 | $ | 8,354 | ||||||||||||
Above-market lease assets | 12.4 | $ | (1,428 | ) | $ | (1,420 | ) | $ | (1,420 | ) | $ | (1,420 | ) | $ | (1,407 | ) | ||||||
Below-market lease liabilities | 9.1 | 7,446 | 6,660 | 5,875 | 5,490 | 5,250 | ||||||||||||||||
Total to be included in rental income | $ | 6,018 | $ | 5,240 | $ | 4,455 | $ | 4,070 | $ | 3,843 | ||||||||||||
Above-market ground lease liability to be deducted from property operating expenses | 35.6 | $ | (449 | ) | $ | (449 | ) | $ | (449 | ) | $ | (449 | ) | $ | (449 | ) | ||||||
For the years ended December 31, 2015, 2014 and 2013, amortization of in-place leases and other intangible of $19.8 million, $21.1 million and $8.1 million, respectively, is included in depreciation and amortization on the consolidated statements of operations and comprehensive loss. For the years ended December 31, 2015, 2014 and 2013, net amortization of above- and below-market lease intangibles of $7.9 million, $9.3 million and $2.6 million, respectively, is included in rental income on the consolidated statements of operations and comprehensive loss. For the years ended December 31, 2015, 2014 and 2013, amortization of above-market ground lease liability of $0.4 million, $0.4 million, and $0.1 million, respectively, is included in property operating expense on the consolidated statements of operations and comprehensive loss.
Impairment of Long Lived Assets
When circumstances indicate the carrying value of a property may not be recoverable, the Company reviews the asset for impairment. This review is based on an estimate of the future undiscounted cash flows, excluding interest charges, expected to result from the property’s use and eventual disposition. These estimates consider factors such as expected future operating income, market and other applicable trends and residual value, as well as the effects of leasing demand, competition and other factors. If such estimated cash flows are less than the carrying value of a property, an impairment loss is recorded to the extent that the carrying value exceeds the estimated fair value of the property for properties to be held and used. For properties held for sale, the impairment loss is based on the adjustment to estimated fair value less estimated cost to dispose of the asset. Generally, the Company determines estimated fair value for properties held for sale based on the agreed-upon selling price of an asset. These assessments may result in the immediate recognition of an impairment loss, resulting in a reduction of net income (loss). The Company recognized impairment charges of $0.9 million during the year ended December 31, 2015. The Company was not required to recognize any impairment charges for the years ended December 31, 2014 and 2013.
Impairment of Equity Method Investments
The Company monitors the value of its equity method investments for indicators of impairment. An impairment charge is recognized when the Company determines that a decline in the fair value of the investment below its carrying value is other-than-temporary. The assessment of impairment is subjective and involves the application of significant assumptions and judgments about the Company's intent and ability to recover its investment given the nature and operations of the underlying investment. The Company was not required to recognize any impairment charges related to equity method investments during the years ended December 31, 2015, 2014 or 2013.
F-13
NEW YORK REIT, INC.
NOTES TO CONSOLIDATED FINANCIAL STATEMENTS
December 31, 2015, 2014 and 2013
Cash and Cash Equivalents
Cash and cash equivalents includes cash in bank accounts as well as investments in highly-liquid money market funds with original maturities of three months or less. As of December 31, 2015 and 2014, $0.2 million and $0.3 million, respectively, was held in money market funds with the Company's financial institutions.
The Company deposits cash with high-quality financial institutions. These deposits are guaranteed by the Federal Deposit Insurance Company (the "FDIC") up to an insurance limit. At December 31, 2015 and 2014 the Company had deposits of $98.6 million and $22.5 million, respectively, of which $96.3 million and $18.9 million, respectively, were in excess of the amount insured by the FDIC. Although the Company bears risk to amounts in excess of those insured by the FDIC, it does not anticipate any losses as a result.
Restricted Cash
Restricted cash primarily consists of maintenance, real estate tax, structural, and debt service reserves.
Investment Securities
The Company classifies its investments in debt or equity securities into one of three classes: held-to-maturity, available-for-sale or trading, as applicable. Investments in debt securities that the Company has the positive intent and ability to hold until maturity are classified as held-to-maturity and are reported at amortized cost. Debt and equity securities that are bought and held principally for the purposes of selling them in the near future are classified as trading securities. Debt and equity securities not classified as trading securities or as held-to-maturity securities are classified as available-for-sale securities and are reported at fair value, with unrealized holding gains and losses reported as a component of equity within accumulated other comprehensive income or loss. Gains or losses on securities sold are based on the specific identification method.
The Company evaluates its investments in securities for impairment or other-than-temporary impairment on a quarterly basis. The Company reviews each investment individually and assesses factors that may include (i) if the carrying amount of an investment exceeds its fair value, (ii) if there has been any change in the market as a whole or in the investee’s market, (iii) if there are any plans to sell the investment in question or if the Company believes it may be forced to sell its investment, and (iv) if there have been any other factors that would indicate the possibility of the existence of an other-than-temporary impairment. The fair value of the Company’s investments in available-for-sale securities generally rise and fall based on current market conditions. If, after reviewing relevant factors surrounding an impaired security, the Company determines that it will not recover its full investment in an impaired security, the Company recognizes an other-than-temporary impairment charge in the consolidated statements of operations and comprehensive loss in the period in which the other-than-temporary impairment is discovered, regardless of whether or not the Company plans to sell or believes it will be forced to sell the security in question. The Company was not required to recognize any other-than-temporary impairment charges for the years ended December 31, 2015, 2014 or 2013.
Investment in Unconsolidated Joint Venture
The Company accounts for its investment in unconsolidated joint venture under the equity method of accounting because the Company exercises significant influence over, but does not control, the entity and is not considered to be the primary beneficiary. This investment was recorded initially at cost and subsequently adjusted for equity in net income (loss) and cash contributions and distributions. Any difference between the carrying amount of this investment and the underlying equity in net assets is depreciated and amortized over the estimated useful lives of the assets and liabilities with a corresponding adjustment to the equity income (loss) from unconsolidated joint venture on the accompanying consolidated statements of operations and comprehensive loss. Equity income (loss) from unconsolidated joint venture is allocated based on the Company's ownership or economic interest in the joint venture. A loss in the value of a joint venture investment that is determined to be other than temporary is recognized in the period in which the loss occurs. See Note 4 — Investment in Unconsolidated Joint Venture.
Deferred Costs, Net
Deferred costs, net consists of deferred financing costs and leasing costs. Deferred financing costs represent commitment fees, legal fees, and other costs associated with obtaining commitments for financing. These costs are amortized to interest expense over the terms of the respective financing agreements using the effective interest method. Unamortized deferred financing costs are expensed when the associated debt is refinanced or repaid before maturity. Costs incurred in seeking financial transactions that do not close are expensed in the period in which it is determined that the financing will not close.
Deferred leasing costs, consisting primarily of lease commissions and professional fees incurred, are deferred and amortized to depreciation and amortization expense over the term of the lease.
F-14
NEW YORK REIT, INC.
NOTES TO CONSOLIDATED FINANCIAL STATEMENTS
December 31, 2015, 2014 and 2013
Derivative Instruments
The Company uses derivative financial instruments to hedge the interest rate risk associated with a portion of its borrowings. The principal objective of such agreements is to minimize the risks and costs associated with the Company's operating and financial structure as well as to hedge specific anticipated transactions.
The Company records all derivatives on the balance sheet at fair value. The accounting for changes in the fair value of derivatives depends on the intended use of the derivative, whether the Company has elected to designate a derivative in a hedging relationship and apply hedge accounting and whether the hedging relationship has satisfied the criteria necessary to apply hedge accounting. Derivatives designated and qualifying as a hedge of the exposure to changes in the fair value of an asset, liability, or firm commitment attributable to a particular risk, such as interest rate risk, are considered fair value hedges. Derivatives designated and qualifying as a hedge of the exposure to variability in expected future cash flows, or other types of forecasted transactions, are considered cash flow hedges. Hedge accounting generally provides for the matching of the timing of gain or loss recognition on the hedging instrument with the recognition of the changes in the fair value of the hedged asset or liability that is attributable to the hedged risk in a fair value hedge or the earnings effect of the hedged forecasted transactions in a cash flow hedge.
The Company may enter into derivative contracts that are intended to economically hedge certain of its risk, even though hedge accounting does not apply or if the Company does not elect to apply hedge accounting. If the Company designates a qualifying derivative as a hedge, changes in the value of the derivative are reflected in accumulated other comprehensive income (loss) on the accompanying consolidated balance sheets. If a derivative does not qualify as a hedge, or if the Company does not elect to apply hedge accounting, changes in the value of the derivative are reflected in other income (loss) on the accompanying consolidated statements of operations and comprehensive loss.
Revenue Recognition
The Company's revenues, which are derived primarily from rental income, include rents that each tenant pays in accordance with the terms of each lease reported on a straight-line basis over the initial term of the lease. Because many of the Company's leases provide for rental increases at specified intervals, GAAP requires that the Company record a receivable, and include in revenues on a straight-line basis, unbilled rent receivables that it will only receive if the tenant makes all rent payments required through the expiration of the initial term of the lease. The Company defers the revenue related to lease payments received from tenants in advance of their due dates. When the Company acquires a property, the acquisition date is considered to be the commencement date for purposes of this calculation.
Rental revenue recognition commences when the tenant takes possession of or controls the physical use of the leased space. For the tenant to take possession, the leased space must be substantially ready for its intended use. To determine whether the leased space is substantially ready for its intended use, the Company evaluates whether the Company owns or if the tenant owns the tenant improvements. When the Company is the owner of tenant improvements, rental revenue recognition begins when the tenant takes possession of the finished space, which is on the date on which such improvements are substantially complete. When the tenant is the owner of tenant improvements, rental revenue recognition begins when the tenant takes possession of or controls the space.
When the Company concludes that it is the owner of tenant improvements, the Company capitalizes the cost to construct the tenant improvements, including costs paid for or reimbursed by the tenants. When the Company concludes that the tenant is the owner of tenant improvements for accounting purposes, the Company records its contribution towards those improvements as a lease incentive, which is included in deferred leasing costs, net on the consolidated balance sheets and amortized as a reduction to rental income on a straight-line basis over the term of the lease.
The Company continually reviews receivables related to rent and unbilled rent receivables and determines collectability by taking into consideration the tenant's payment history, the financial condition of the tenant, business conditions in the industry in which the tenant operates and economic conditions in the area in which the property is located. In the event that the collectability of a receivable is in doubt, the Company will record an increase in its allowance for uncollectible accounts or record a direct write-off of the receivable in its consolidated statements of operations and comprehensive loss.
F-15
NEW YORK REIT, INC.
NOTES TO CONSOLIDATED FINANCIAL STATEMENTS
December 31, 2015, 2014 and 2013
The Company owns certain properties with leases that include provisions for the tenant to pay contingent rental income based on a percent of the tenant's sales upon the achievement of certain sales thresholds or other targets which may be monthly, quarterly or annual targets. As the lessor to the aforementioned leases, the Company defers the recognition of contingent rental income until the specified target that triggered the contingent rental income is achieved, or until such sales upon which percentage rent is based are known. If contingent rental income is recognized pursuant to these provisions, contingent rental income is included in rental income on the consolidated statements of operations and comprehensive loss. The Company recognized contingent rental revenue of $0.6 million during the year ended December 31, 2015. The Company did not recognize any revenue or deferred revenue related to contingent rental income during the years ended December 31, 2014 or 2013.
Cost recoveries from tenants are included in operating expense reimbursement in the period the related costs are incurred, as applicable.
The Company's hotel revenues are recognized as earned and are derived from room rentals and other sources such as charges to guests for telephone service, movie and vending commissions, meeting and banquet room revenue and laundry services.
Share-Based Compensation
The Company has a stock-based incentive award plan for its directors, which is accounted for under the guidance for employee share based payments. The cost of services received in exchange for a stock award is measured at the grant date fair value of the award and the expense for such awards is included in general and administrative expenses and is recognized over the service period or when the requirements for exercise of the award have been met.
During the year ended December 31, 2015, the Company granted restricted shares to employees of the Advisor, which are accounted for under the guidance for non-employee share-based payments. The fair value of the awards granted to employees of the Advisor are remeasured quarterly, with the resulting amortization adjustments reflected in general and administrative expense in the consolidated statements of operations and comprehensive loss.
2014 Advisor Multi-Year Outperformance Agreement
On April 15, 2014 (the "Effective Date"), in connection with the Listing, the Company entered into the OPP with the OP and the Advisor, which is accounted for under the guidance for non-employee share-based payments. The Company records equity based compensation expense associated with the awards over the requisite service period of five years. Equity-based compensation expense is adjusted each reporting period for changes in the estimated market-related performance. See Note 16 — Share-Based Compensation.
Income Taxes
The Company elected to be taxed as a REIT under Sections 856 through 860 of the Internal Revenue Code commencing with its taxable year ended December 31, 2010. If the Company continues to qualify for taxation as a REIT, it generally will not be subject to federal corporate income tax to the extent it distributes annually all of its REIT taxable income to its stockholders, determined without regard for the deduction for dividends paid and excluding net capital gains. REITs are subject to a number of organizational and operational requirements, including a requirement that the Company distribute annually at least 90% of the Company’s REIT taxable income to the Company’s stockholders. If the Company fails to continue to qualify as a REIT in any taxable year and does not qualify for certain statutory relief provisions, the Company will be subject to U.S. federal and state income taxes at regular corporate rates (including any applicable alternative minimum tax) beginning with the year in which it fails to qualify and may be precluded from being able to elect to be treated as a REIT for the Company’s four subsequent taxable years. The Company distributed to its stockholders 100% of its REIT taxable income for each of the years ended December 31, 2015, 2014 and 2013. Accordingly, no provision for federal or state income taxes related to such REIT taxable income was recorded on the Company’s financial statements. Even if the Company qualifies for taxation as a REIT, it may be subject to certain state and local taxes on its income and property, and federal income and excise taxes on its undistributed income.
F-16
NEW YORK REIT, INC.
NOTES TO CONSOLIDATED FINANCIAL STATEMENTS
December 31, 2015, 2014 and 2013
During the year ended December 31, 2013, the Company purchased a hotel, which is owned by a subsidiary of the OP and leased to a taxable REIT subsidiary ("TRS"), that is owned by the OP. A TRS is subject to federal, state and local income taxes. The TRS is a tax paying component for purposes of classifying deferred tax assets and liabilities. The Company records net deferred tax assets to the extent the Company believes these assets will more likely than not be realized. In making such determination, the Company considers all available positive and negative evidence, including future reversals of existing taxable temporary differences, projected future taxable income, tax planning strategies and recent financial operations. In the event the Company determines that it would not be able to realize the deferred income tax assets in the future in excess of the net recorded amount, the Company establishes a valuation allowance which offsets the previously recognized income tax benefit. Deferred income taxes result from temporary differences between the carrying amounts of assets and liabilities of the TRS for financial reporting purposes and the amounts used for income tax purposes. The TRS had deferred tax assets and a corresponding valuation allowance of $3.1 million and $1.7 million as of December 31, 2015 and 2014, respectively. The TRS had federal and state net operating loss carry forwards as of December 31, 2015 of $6.7 million, which will expire through 2036. The Company estimated income tax relating to its TRS using a combined federal and state rate of approximately 43% for the year ended December 31, 2015. The Company has concluded that it is more likely than not that the net operating loss carry forwards will not be utilized during the carry forward period and as such the Company has established a valuation allowance against these deferred tax assets. The Company had immaterial current and deferred federal and state income tax expense for the years ended December 31, 2015, 2014 and 2013.
As of December 31, 2015, the Company had no material uncertain income tax positions. The tax years subsequent to and including the year ended December 31, 2012 remain open to examination by the major taxing jurisdictions to which the Company is subject.
Per Share Data
The Company calculates basic income (loss) per share of common stock by dividing net income (loss) for the period by the weighted-average shares of its common stock outstanding for the respective period. Diluted income per share takes into account the effect of dilutive instruments such as unvested restricted stock, Long-term Incentive Plan ("LTIP") units and OP units (assuming such units are not antidilutive), based on the average share price for the period in determining the number of incremental shares that are to be added to the weighted-average number of shares outstanding. See Note 18 — Net Loss Per Share.
Reportable Segments
The Company has determined that it has one reportable segment, with activities related to investing in real estate. The Company's investments in real estate generate rental revenue and other income through the leasing and management of properties. Management evaluates the operating performance of the Company's investments in real estate at the individual property level.
Recent Accounting Pronouncements
In May 2014, the Financial Accounting Standards Board (“FASB”) issued revised guidance relating to revenue recognition. Under the revised guidance, an entity is required to recognize revenue when it transfers promised goods or services to customers in an amount that reflects the consideration to which the entity expects to be entitled in exchange for those goods or services. The revised guidance was to become effective for fiscal years, and interim periods within those fiscal years, beginning after December 15, 2016. Early adoption was not permitted under GAAP. The revised guidance allows entities to apply the full retrospective or modified retrospective transition method upon adoption. In July 2015, the FASB deferred the effective date of the revised guidance by one year to annual reporting periods beginning after December 15, 2017, although entities will be allowed to early adopt the guidance as of the original effective date. The Company has not yet selected a transition method and is currently evaluating the impact of the new guidance.
In February 2015, the FASB amended the accounting for consolidation of certain legal entities. The amendments modify the evaluation of whether certain legal entities are VIEs or voting interest entities, eliminate the presumption that a general partner should consolidate a limited partnership and affect the consolidation analysis of reporting entities that are involved with VIEs (particularly those that have fee arrangements and related party relationships). The revised guidance is effective for fiscal years, and for interim periods within those fiscal years, beginning after December 15, 2015. Early adoption is permitted, including adoption in an interim period. The guidance is not expected to have a significant impact on the Company's financial position, results of operations or cash flows.
F-17
NEW YORK REIT, INC.
NOTES TO CONSOLIDATED FINANCIAL STATEMENTS
December 31, 2015, 2014 and 2013
In April 2015, the FASB amended the presentation of debt issuance costs on the balance sheet. The amendment requires that debt issuance costs related to a recognized debt liability be presented on the balance sheet as a direct deduction from the carrying amount of that debt liability. In August 2015, the FASB added that, for line of credit arrangements, the SEC staff would not object to an entity deferring and presenting debt issuance costs as an asset and subsequently amortizing the deferred debt issuance costs ratably over the term of the line, regardless of whether or not there are any outstanding borrowings. The revised guidance is effective for fiscal years, and for interim periods within those fiscal years, beginning after December 15, 2015. Early adoption is permitted for financial statements that have not previously been issued. The revised guidance is not expected to have a significant impact on the Company's financial position, results of operations or cash flows.
In September 2015, the FASB issued an update that eliminates the requirement to adjust provisional amounts from a business combination and the related impact on earnings by restating prior period financial statements for measurement period adjustments. The new guidance requires that the cumulative impact of measurement period adjustments on current and prior periods, including the prior period impact on depreciation, amortization and other income statement items and their related tax effects, shall be recognized in the period the adjustment amount is determined. The cumulative adjustment would be reflected within the respective financial statement line items affected. The revised guidance is effective for fiscal years, and for interim periods within those fiscal years, beginning after December 15, 2015. Early adoption is permitted. The Company elected to adopt the new guidance as of September 30, 2015. The adoption of this guidance had no impact on the Company's consolidated financial position, results of operations or cash flows.
In January 2016, the FASB issued an update that amends the recognition and measurement of financial instruments. The new guidance significantly revises an entity’s accounting related to equity investments and the presentation of certain fair value changes for financial liabilities measured at fair value. Among other things, it also amends the presentation and disclosure requirements associated with the fair value of financial instruments. The revised guidance is effective for fiscal years, and for interim periods within those fiscal years, beginning after December 15, 2017. Early adoption is not permitted for most of the amendments in the update. The Company is currently evaluating the impact of the new guidance.
Note 3 — Real Estate Investments
The following table presents the allocation of the assets acquired and liabilities assumed during the years ended December 31, 2014 and 2013. There were no real estate assets acquired or liabilities assumed during the year ended December 31, 2015.
Year Ended December 31, | ||||||||
(Dollar amounts in thousands) | 2014 | 2013 | ||||||
Real estate investments, at cost: | ||||||||
Land | $ | 68,251 | $ | 333,166 | ||||
Buildings, fixtures and improvements | 233,607 | 749,127 | ||||||
Total tangible assets | 301,858 | 1,082,293 | ||||||
Acquired intangibles: | ||||||||
In-place leases | 25,169 | 81,376 | ||||||
Other intangible | 3,804 | — | ||||||
Above-market lease assets | 3,707 | 10,389 | ||||||
Below-market lease liabilities | (23,705 | ) | (70,589 | ) | ||||
Total acquired intangibles | 8,975 | 21,176 | ||||||
Total assets acquired, net | 310,833 | 1,103,469 | ||||||
Investment in unconsolidated joint venture | 273 | 236,965 | ||||||
Preferred equity investment | 5,100 | 30,000 | ||||||
Mortgage notes payable used to acquire investments in real estate | — | (60,000 | ) | |||||
Other liabilities assumed | — | (12,206 | ) | |||||
Cash paid for acquired real estate investments and other assets | $ | 316,206 | $ | 1,298,228 | ||||
Number of properties and other investments purchased | 1 | 7 | ||||||
F-18
NEW YORK REIT, INC.
NOTES TO CONSOLIDATED FINANCIAL STATEMENTS
December 31, 2015, 2014 and 2013
The following table presents future minimum base cash rental payments due to the Company, excluding future minimum base cash rental payments related to unconsolidated joint ventures, subsequent to December 31, 2015. These amounts exclude contingent rental payments, as applicable, that may be collected from certain tenants based on provisions related to sales thresholds and increases in annual rent based on exceeding certain economic indexes among other items.
(In thousands) | Future Minimum Base Rental Cash Payments | |||
2016 | $ | 104,174 | ||
2017 | 106,823 | |||
2018 | 104,931 | |||
2019 | 96,911 | |||
2020 | 97,330 | |||
Thereafter | 562,352 | |||
$ | 1,072,521 | |||
The following table lists the tenants whose annualized cash rent represented greater than 10% of total annualized cash rent as of December 31, 2015, 2014 and 2013, including annualized cash rent related to the Company's unconsolidated joint venture:
December 31, | ||||||||
Property Portfolio | Tenant | 2015 | 2014 | 2013 | ||||
Worldwide Plaza | Cravath, Swaine & Moore, LLP | 16% | 16% | 18% | ||||
Worldwide Plaza | Nomura Holdings America, Inc. | 11% | 11% | 12% | ||||
The termination, delinquency or non-renewal of any of the above tenants may have a material adverse effect on the Company's operations.
Real Estate Held For Sale and Real Estate Sales
Real Estate Held for Sale
In November 2015, the Company entered into agreements to sell its Duane Reade property in Queens, NY ("Duane Reade") and its property located at 1623 Kings Highway in Brooklyn, New York ("1623 Kings Highway"). In December 2015, the Company entered into an agreement to sell its Foot Locker property in Brooklyn, New York ("Foot Locker"). Concurrently with entering into the agreements, the Company stopped recognizing depreciation and amortization expense and the real estate and other assets and liabilities associated with the properties were reclassified as held for sale on the Company's consolidated balance sheets as of December 31, 2015.
The expected disposal of the properties referenced above does not represent a strategic shift that has a major effect on the Company’s operations and financial results. Accordingly, the operating results of these properties remain classified within continuing operations for all periods presented.
The Company recognized an impairment charge of $0.9 million related to Duane Reade as the carrying amount of Duane Reade's real estate and related assets, net of related liabilities, on the date of reclassification as held for sale was greater than the Company's estimate of its fair value less estimated costs to sell, which is reflected within gain on sale of real estate investments, net on the consolidated statements of operations and comprehensive loss for the year ended December 31, 2015. The Company closed on the sales of Duane Reade and 1623 Kings Highway subsequent to December 31, 2015. See Note 21 — Subsequent Events.
F-19
NEW YORK REIT, INC.
NOTES TO CONSOLIDATED FINANCIAL STATEMENTS
December 31, 2015, 2014 and 2013
The following table details the major classes of assets associated with Duane Reade, 1623 Kings Highway and Foot Locker that have been reclassified as held for sale as of December 31, 2015:
(In thousands) | December 31, 2015 | |||
Real estate held for sale, at cost: | ||||
Land | $ | 10,636 | ||
Buildings, fixtures and improvements | 18,783 | |||
Acquired intangible lease assets | 3,237 | |||
Total real estate held for sale, at cost | 32,656 | |||
Less accumulated depreciation and amortization | (4,813 | ) | ||
Real estate assets held for sale, net | 27,843 | |||
Other assets related to real estate assets held for sale | 1,425 | |||
Assets held for sale | $ | 29,268 | ||
As of December 31, 2015, the Company had $0.3 million of liabilities related to real estate assets held for sale.
Real Estate Sales
On October 21, 2015, the Company sold its property located at 163 Washington Avenue in Brooklyn, New York and recognized a net gain on the sale of the property of $8.4 million for the year ended December 31, 2015, which is reflected within gain on sale of real estate investments, net on the consolidated statements of operations and comprehensive loss. The Company did not sell any properties during the years ended December 31, 2014 or 2013.
The disposal of the property referenced above did not represent a strategic shift that has a major effect on the Company’s operations and financial results. Accordingly, the operating results of 163 Washington Avenue remain classified within continuing operations for all periods presented until the date of disposal.
Note 4 — Investment in Unconsolidated Joint Venture
On October 30, 2013, the Company purchased a 48.9% equity interest in WWP Holdings, LLC ("Worldwide Plaza") for a contract purchase price of $220.1 million, based on the property value for Worldwide Plaza of $1.3 billion less $875.0 million of debt on the property. As of December 31, 2015, the Company's pro rata portion of debt secured by Worldwide Plaza was $427.9 million. The debt on the property has a weighted average interest rate of 4.6% and matures in March 2023. The Company accounts for the investment in Worldwide Plaza using the equity method of accounting because the Company exercises significant influence over, but does not control, the entity.
Pursuant to the terms of the membership agreement governing the Company’s purchase of the 48.9% equity interest in Worldwide Plaza, the Company retains an option to purchase the balance of the equity interest in Worldwide Plaza beginning 38 months following the closing of the acquisition, or December 2016, at an agreed-upon property value of $1.4 billion, subject to certain adjustments, including, but not limited to, adjustments for certain loans that are outstanding at the time of exercise, adjustments for the percentage equity interest being acquired and any of the Company's preferred return in arrears. If the Company does not exercise its purchase option, the Company will be subject to a fee in the amount of $25.0 million.
At acquisition, the Company's investment in Worldwide Plaza exceeded the Company's share of the book value of the net assets of Worldwide Plaza by $260.6 million. This basis difference resulted from the excess of the Company's purchase price for its equity interest in Worldwide Plaza over the book value of Worldwide Plaza's net assets. Substantially all of this basis difference was allocated to the fair values of Worldwide Plaza's assets and liabilities. The Company amortizes the basis difference over the anticipated useful lives of the underlying tangible and intangible assets acquired and liabilities assumed. The basis difference related to the land will be recognized upon disposition of the Company's investment. As of December 31, 2015 and 2014, the carrying value of the Company's investment in Worldwide Plaza was $215.4 million and $225.5 million, respectively.
The Company is party to litigation related to Worldwide Plaza. See Note 13 — Commitments and Contingencies.
F-20
NEW YORK REIT, INC.
NOTES TO CONSOLIDATED FINANCIAL STATEMENTS
December 31, 2015, 2014 and 2013
The amounts reflected in the following tables (except for the Company’s share of equity and income) are based on the financial information of Worldwide Plaza. The Company does not record losses of the joint venture in excess of its investment balance because the Company is not liable for the obligations of the joint venture or is otherwise committed to provide financial support to the joint venture.
The condensed balance sheets as of December 31, 2015 and 2014 for Worldwide Plaza are as follows:
December 31, | ||||||||
(In thousands) | 2015 | 2014 | ||||||
Real estate assets, at cost | $ | 714,642 | $ | 704,143 | ||||
Less accumulated depreciation and amortization | (117,092 | ) | (97,181 | ) | ||||
Total real estate assets, net | 597,550 | 606,962 | ||||||
Cash and cash equivalents | 9,036 | 3,784 | ||||||
Other assets | 259,894 | 252,000 | ||||||
Total assets | $ | 866,480 | $ | 862,746 | ||||
Debt | $ | 875,000 | $ | 875,000 | ||||
Other liabilities | 15,515 | 12,442 | ||||||
Total liabilities | 890,515 | 887,442 | ||||||
Deficit | (24,035 | ) | (24,696 | ) | ||||
Total liabilities and deficit | $ | 866,480 | $ | 862,746 | ||||
Company's basis | $ | 215,370 | $ | 225,501 | ||||
The condensed statements of operations for the years ended December 31, 2015 and 2014, and the period from October 31, 2013 (date of acquisition) to December 31, 2013 for Worldwide Plaza are as follows:
Year Ended | Period from October 31, 2013 (date of acquisition) to | |||||||||||
(In thousands) | December 31, 2015 | December 31, 2014 | December 31, 2013 | |||||||||
Rental income | $ | 123,362 | $ | 113,498 | 18,736 | |||||||
Other revenue | 4,940 | 4,932 | 837 | |||||||||
Total revenue | 128,302 | 118,430 | 19,573 | |||||||||
Operating expenses: | ||||||||||||
Operating expense | 47,816 | 45,911 | 7,288 | |||||||||
Depreciation and amortization | 27,677 | 26,835 | 4,025 | |||||||||
Total operating expenses | 75,493 | 72,746 | 11,313 | |||||||||
Operating income | 52,809 | 45,684 | 8,260 | |||||||||
Interest expense | (40,077 | ) | (40,077 | ) | (6,808 | ) | ||||||
Net income | 12,732 | 5,607 | 1,452 | |||||||||
Company's preferred return | (15,736 | ) | (15,617 | ) | (2,653 | ) | ||||||
Net loss to members | $ | (3,004 | ) | $ | (10,010 | ) | $ | (1,201 | ) | |||
F-21
NEW YORK REIT, INC.
NOTES TO CONSOLIDATED FINANCIAL STATEMENTS
December 31, 2015, 2014 and 2013
Net income (loss) related to Worldwide Plaza includes the Company's pro rata share of Worldwide Plaza net income (loss) to members as well as the Company's preferred return less amortization of the basis difference. The following table presents the components of the income (loss) related to the Company's investment in Worldwide Plaza for the periods presented, which is included in income (loss) from unconsolidated joint venture on the consolidated statements of operations and comprehensive loss.
Year Ended | Period from October 31, 2013 (date of acquisition) to | |||||||||||
(In thousands) | December 31, 2015 | December 31, 2014 | December 31, 2013 | |||||||||
Company's preferred return | $ | 15,736 | $ | 15,617 | $ | 2,653 | ||||||
Company's share of net loss from Worldwide Plaza | (1,470 | ) | (4,895 | ) | (587 | ) | ||||||
Amortization of basis difference | (12,327 | ) | (12,221 | ) | (2,161 | ) | ||||||
Company's income (loss) from Worldwide Plaza | $ | 1,939 | $ | (1,499 | ) | $ | (95 | ) | ||||
Note 5 — Preferred Equity Investment
On March 27, 2015, the Company's preferred equity investment in a class A office building located at 123 William Street (the "Property") in the Financial District of downtown Manhattan was repaid as a result of the sale of the Property. The preferred equity investment carried a 6.0% current pay rate and a 2.0% accrual rate. Pursuant to the sale of the Property, the Company received $1.1 million in current and accrued income earned and $35.1 million for the return of all principal invested.
The preferred equity investment had a fixed return based on contributed capital, no participation in profits or losses of the real estate activities, and property foreclosure rights in the event of default. As such, the Company recorded returns earned in income from preferred equity investment, investment securities and interest on the consolidated statements of operations and comprehensive loss.
Note 6 — Investment Securities
The Company's investment securities consisted of redeemable preferred stock and equity securities, with an aggregate fair value of $4.7 million as of December 31, 2014. The Company sold its investment securities during the year ended December 31, 2015 for a gain of $0.1 million, which is included in income from preferred equity investment, investment securities and interest on the accompanying consolidated statements of operations and comprehensive loss. The equity securities consisted of a real estate income fund managed by an affiliate of the Sponsor. See Note 14 — Related Party Transactions and Arrangements.
The Company's preferred stock investment was redeemable at the issuer's option after five years from issuance.
The following table details the unrealized gains and losses on investment securities as of December 31, 2014:
(In thousands) | Cost | Gross Unrealized Gains | Gross Unrealized Losses | Fair Value | ||||||||||||
December 31, 2014 | ||||||||||||||||
Redeemable preferred stock | $ | 1,288 | $ | 21 | $ | (12 | ) | $ | 1,297 | |||||||
Equity securities | 3,127 | 235 | — | 3,362 | ||||||||||||
Total | $ | 4,415 | $ | 256 | $ | (12 | ) | $ | 4,659 | |||||||
No other-than-temporary impairment charges were required to be recognized during the years ended December 31, 2015 and 2014.
F-22
NEW YORK REIT, INC.
NOTES TO CONSOLIDATED FINANCIAL STATEMENTS
December 31, 2015, 2014 and 2013
Note 7 — Credit Facility
On April 14, 2014, the Company amended and restated its credit facility with Capital One, National Association (the "Credit Facility"). The Credit Facility allows for total borrowings of up to $705.0 million with a $305.0 million term loan and a $400.0 million revolving loan. The term loan component of the Credit Facility matures in August 2018 and the revolving loan component matures in August 2016. The Company has two options to extend the maturity date of the revolving loan component of the Credit Facility through August 2018. The Credit Facility contains an "accordion feature" to allow the Company, under certain circumstances and with the consent of its lenders, to increase the aggregate loan borrowings to up to $1.0 billion of total borrowings.
On August 27, 2015, the Company entered into an amendment pursuant to which certain changes were made under the Credit Facility primarily to increase the borrowing base capacity including, among other changes, (i) the ability to add a hotel asset as a borrowing base asset and (ii) reducing the debt service coverage ratio test from 1.4 to 1.3 for draw downs on the Credit Facility. The Company incurred $6.3 million of fees related to the amendment of which $4.0 million have been capitalized and included in deferred costs on the consolidated balance sheets and $2.4 million are included in acquisition and transaction related expense on the consolidated statements of operations and comprehensive loss.
The Company has the option, based upon its corporate leverage, to have the Credit Facility priced at either: (a) LIBOR, plus an applicable margin that ranges from 1.50% to 2.25%; or (b) the Base Rate plus an applicable margin that ranges from 0.50% to 1.25%. Base Rate is defined in the Credit Facility as the greater of (i) the fluctuating annual rate of interest announced from time to time by the lender as its “prime rate,” (ii) 0.50% above the federal funds effective rate and (iii) 1.00% above the applicable one-month LIBOR. The Company has historically paid interest calculated based on LIBOR, plus an applicable margin.
The Company repaid $150.0 million in advances on the revolving portion of its Credit Facility during the year ended December 31, 2015. The outstanding balance of the term and revolving portions of the Credit Facility was $305.0 million and $180.0 million, respectively, as of December 31, 2015 and $305.0 million and $330.0 million, respectively as of December 31, 2014. The Credit Facility had a combined weighted average interest rate of 2.39% and 2.08% as of December 31, 2015 and 2014, respectively, a portion of which is fixed with an interest rate swap. The Credit Facility includes an unused commitment fee per annum of (a) 0.15% if the unused balance of the facility is equal to or less than 50% of the available facility and (b) 0.25% if the unused balance of the facility exceeds 50% of the available facility. The actual availability of borrowings under the Credit Facility for any period is based on requirements outlined in the Credit Facility with respect to the pool of eligible unencumbered assets that comprise our borrowing base properties. The unused borrowing capacity, based on the debt service coverage ratio of the borrowing base properties as of December 31, 2015, was $63.0 million.
The Credit Facility provides for monthly interest payments for each Base Rate loan and periodic payments for each LIBOR loan, based upon the applicable LIBOR loan period, with all principal outstanding being due on the maturity date. The Credit Facility may be prepaid at any time, in whole or in part, without premium or penalty. In the event of a default, the lenders have the right to terminate their obligations under the Credit Facility and to accelerate the payment on any unpaid principal amount of all outstanding loans.
The Credit Facility requires the Company to meet certain financial covenants, including the maintenance of certain financial ratios (such as specified debt to equity and debt service coverage ratios) as well as the maintenance of a minimum net worth. As of December 31, 2015, the Company was in compliance with the debt covenants under the Credit Facility.
F-23
NEW YORK REIT, INC.
NOTES TO CONSOLIDATED FINANCIAL STATEMENTS
December 31, 2015, 2014 and 2013
Note 8 — Mortgage Notes Payable
The Company's mortgage notes payable as of December 31, 2015 and 2014 consist of the following:
Outstanding Loan Amount | |||||||||||||||||
Portfolio | Encumbered Properties | December 31, 2015 | December 31, 2014 | Effective Interest Rate | Interest Rate | Maturity | |||||||||||
(In thousands) | (In thousands) | ||||||||||||||||
Design Center | 1 | $ | 19,798 | $ | 20,198 | 4.4 | % | Fixed | Dec. 2021 | ||||||||
Foot Locker | 1 | 3,250 | 3,250 | 4.6 | % | Fixed | Jun. 2016 | ||||||||||
Duane Reade(2) | 1 | 8,400 | 8,400 | 3.6 | % | Fixed | Nov. 2016 | ||||||||||
1100 Kings Highway | 1 | 20,200 | 20,200 | 3.4 | % | Fixed | (1) | Aug. 2017 | |||||||||
1623 Kings Highway(2) | 1 | 7,288 | 7,288 | 3.3 | % | Fixed | (1) | Nov. 2017 | |||||||||
256 West 38th Street | 1 | 24,500 | 24,500 | 3.1 | % | Fixed | (1) | Dec. 2017 | |||||||||
1440 Broadway(2) | 1 | 305,000 | — | 3.9 | % | Variable | (3) | Oct. 2019 | |||||||||
Bleecker Street | — | 21,300 | |||||||||||||||
Regal Parking Garage | — | 3,000 | |||||||||||||||
Washington Street Portfolio | — | 4,741 | |||||||||||||||
One Jackson Square | — | 13,000 | |||||||||||||||
350 West 42nd Street | — | 11,365 | |||||||||||||||
229 West 36th Street | — | 35,000 | |||||||||||||||
7 | $ | 388,436 | $ | 172,242 | 3.8 | % | (4) | ||||||||||
______________________
(1) | Fixed through an interest rate swap agreement. |
(2) | Total commitments of $325.0 million; additional $20.0 million available, subject to lender approval, to fund certain tenant allowances, capital expenditures and leasing costs. |
(3) | LIBOR portion is capped through an interest rate cap agreement. |
(4) | Calculated on a weighted average basis for all mortgages outstanding as of December 31, 2015. |
(5) | Subsequent to December 31, 2015, as a result of the closing of the sales of the properties, the Company repaid its mortgages securing Duane Reade and 1623 Kings Highway. See Note 21 — Subsequent Events. |
During the year ended December 31, 2015, the Company repaid four mortgage notes payable and settled through legal defeasance two mortgage notes payable before the scheduled maturity dates. As a result, the Company incurred $1.8 million in expenses related to these transactions, which relates to prepayment penalties and the write-off of previously recorded deferred financing costs, of which $0.6 million is included in acquisition and transaction related expenses and $1.2 million is included in interest expense on the consolidated statements of operations and comprehensive loss.
The Company's remaining properties, with the exception of 367-369 Bleecker Street and 387 Bleecker Street (which excludes 382-384 Bleecker Street), that are not subject to mortgage notes payable collateralize the borrowing base of the Credit Facility and are subject to mortgages under the Credit Facility for that purpose.
On September 30, 2015, in connection with the mortgage notes payable secured by its property located at 1440 Broadway, the Company executed guarantees in favor of the lenders with respect to the costs of certain unfunded obligations of the Company related to tenant allowances, capital expenditures and leasing costs, which guarantees are capped at $5.3 million in the aggregate. The guarantees expire in October 2019, the maturity date of the 1440 Broadway mortgage. As of December 31, 2015, the Company has not been required to perform under the guarantees and has not recognized any assets or liabilities related to the guarantees.
Real estate investments of $685.5 million, at cost, at December 31, 2015 have been pledged as collateral to their respective mortgages and are not available to satisfy the Company's corporate debts and obligations unless first satisfying the mortgage notes payable on the properties.
F-24
NEW YORK REIT, INC.
NOTES TO CONSOLIDATED FINANCIAL STATEMENTS
December 31, 2015, 2014 and 2013
The following table summarizes the scheduled aggregate principal repayments subsequent to December 31, 2015:
(In thousands) | Future Minimum Principal Payments | |||
2016 | $ | 12,068 | ||
2017 | 55,533 | |||
2018 | 3,703 | |||
2019 | 308,869 | |||
2020 | 4,041 | |||
Thereafter | 4,222 | |||
Total | $ | 388,436 | ||
Some of the Company's mortgage note agreements require compliance with certain property-level financial covenants including debt service coverage ratios. As of December 31, 2015, the Company was in compliance with the financial covenants under its mortgage note agreements.
Note 9 — Subordinated Listing Distribution
Upon occurrence of the Listing, New York Recovery Special Limited Partnership, LLC (the "SLP") became entitled to begin receiving distributions of net sale proceeds pursuant to its special limited partner interest in the OP (the "SLP Interest") in an aggregate amount that was evidenced by the issuance of a note by the OP (the "Listing Note"). The Listing Note was equal to 15.0% of the amount, if any, by which (a) the average market value of the Company’s outstanding common stock for the period 180 days to 210 days after the Listing, plus dividends paid by the Company prior to the Listing, exceeded (b) the sum of the total amount of capital raised from stockholders during the Company’s IPO and the amount of cash flow necessary to generate a 6.0% annual cumulative, non-compounded return to such stockholders. Concurrently with the Listing, the Company, as general partner of the OP, caused the OP to enter into the Listing Note agreement dated April 15, 2014 by and between the OP and the SLP, and caused the OP to issue the Listing Note. The Listing Note was evidence of the SLP's right to receive distributions of net sales proceeds from the sale of the Company's real estate and real estate-related assets up to an aggregate amount equal to the principal balance of the Listing Note. Pursuant to the terms of the partnership agreement of the OP, the SLP had the right, but not the obligation, to convert all or a portion of the SLP interest into limited partnership units of the OP ("OP units"), which are convertible into shares of the Company's common stock or the cash value of a corresponding number of shares, at the election of the OP, in accordance with the limited partnership agreement of the OP.
The principal amount of the Listing Note was determined based, in part, on the actual market value of the Company’s outstanding common stock for the period 180 days to 210 days after the Listing. Until the final principal amount of the Listing Note was determined in November 2014, the Listing Note was considered to be a derivative which was marked to fair value at each reporting date, with changes in the fair value recorded in the consolidated statements of operations and comprehensive loss.
The principal amount of the Listing Note was determined to be $33.5 million and was recorded as an expense in the consolidated statements of operations and comprehensive loss during the year ended December 31, 2014. On November 21, 2014, at the request of the SLP, the Listing Note was converted into 3,062,512 OP units and the value of the Listing Note was reclassified from derivative liabilities to non-controlling interest on the consolidated balance sheets.
F-25
NEW YORK REIT, INC.
NOTES TO CONSOLIDATED FINANCIAL STATEMENTS
December 31, 2015, 2014 and 2013
Note 10 — Fair Value of Financial Instruments
The Company determines fair value of its financial instruments based on quoted prices when available or through the use of alternative approaches, such as discounting the expected cash flows using market interest rates commensurate with the credit quality and duration of the instrument. This alternative approach also reflects the contractual terms of the instruments, as applicable, including the period to maturity, and may use observable market-based inputs, including interest rate curves and implied volatilities, and unobservable inputs, such as expected volatility. The guidance defines three levels of inputs that may be used to measure fair value:
Level 1 — Quoted prices in active markets for identical assets and liabilities that the reporting entity has the ability to access at the measurement date.
Level 2 — Inputs other than quoted prices included within Level 1 that are observable for the asset and liability or can be corroborated with observable market data for substantially the entire contractual term of the asset or liability.
Level 3 — Unobservable inputs that reflect the entity's own assumptions that market participants would use in the pricing of the asset or liability and are consequently not based on market activity, but rather through particular valuation techniques.
The determination of where an asset or liability falls in the hierarchy requires significant judgment and considers factors specific to the asset or liability. In instances where the determination of the fair value measurement is based on inputs from different levels of the fair value hierarchy, the level in the fair value hierarchy within which the entire fair value measurement falls is based on the lowest level input that is significant to the fair value measurement in its entirety.
Although the Company has determined that the majority of the inputs used to value its derivatives, such as interest rate swaps and caps, fall within Level 2 of the fair value hierarchy, the credit valuation adjustments associated with those derivatives utilize Level 3 inputs, such as estimates of current credit spreads to evaluate the likelihood of default by the Company and its counterparties. However, as of December 31, 2015 and 2014, the Company has assessed the significance of the impact of the credit valuation adjustments on the overall valuation of its derivative positions and has determined that the credit valuation adjustments are not significant to the overall valuation of the Company's derivatives. As a result, the Company has determined that its derivative valuations in their entirety are classified in Level 2 of the fair value hierarchy. See Note 11 — Interest Rate Derivatives and Hedging Activities.
The valuation of derivatives is determined using a discounted cash flow analysis on the expected cash flows. This analysis reflects the contractual terms of the derivatives, including the period to maturity, as well as observable market-based inputs, including interest rate curves and implied volatilities. In addition, credit valuation adjustments are incorporated into the fair values to account for the Company's potential nonperformance risk and the performance risk of the counterparties.
The Company had investments in redeemable preferred stock and an equity security as of December 31, 2014 that were traded in active markets and therefore, due to the availability of quoted market prices in active markets, the Company classified these investments as Level 1 in the fair value hierarchy.
The following table presents information about the Company's assets and liabilities (including derivatives that are presented net) measured at fair value on a recurring basis as of December 31, 2015 and 2014, aggregated by the level in the fair value hierarchy within which those instruments fall:
(In thousands) | Quoted Prices in Active Markets Level 1 | Significant Other Observable Inputs Level 2 | Significant Unobservable Inputs Level 3 | Total | ||||||||||||
December 31, 2015 | ||||||||||||||||
Derivatives, net | $ | — | $ | (835 | ) | $ | — | $ | (835 | ) | ||||||
December 31, 2014 | ||||||||||||||||
Derivatives, net | $ | — | $ | (1,071 | ) | $ | — | $ | (1,071 | ) | ||||||
Investment securities | $ | 4,659 | $ | — | $ | — | $ | 4,659 | ||||||||
A review of the fair value hierarchy classification is conducted on a quarterly basis. Changes in the type of inputs may result in a reclassification for certain assets. There were no transfers between levels of the fair value hierarchy during the years ended December 31, 2015 or 2014.
F-26
NEW YORK REIT, INC.
NOTES TO CONSOLIDATED FINANCIAL STATEMENTS
December 31, 2015, 2014 and 2013
Financial instruments not carried at fair value
The Company is required to disclose the fair value of financial instruments for which it is practicable to estimate the value. The fair value of short-term financial instruments such as cash and cash equivalents, restricted cash, prepaid expenses and other assets, accounts payable and dividends payable approximates their carrying value on the consolidated balance sheets due to their short-term nature. The fair values of the Company's financial instruments that are not reported at fair value on the consolidated balance sheets are reported below.
Carrying Amount at | Fair Value at | Carrying Amount at | Fair Value at | |||||||||||||||
(In thousands) | Level | December 31, 2015 | December 31, 2015 | December 31, 2014 | December 31, 2014 | |||||||||||||
Mortgage notes payable | 3 | $ | 388,436 | $ | 401,503 | $ | 172,242 | $ | 174,468 | |||||||||
Credit Facility | 3 | $ | 485,000 | $ | 487,579 | $ | 635,000 | $ | 651,579 | |||||||||
Preferred equity investment | 3 | $ | — | $ | — | $ | 35,100 | $ | 34,800 | |||||||||
The fair value of mortgage notes payable, the fixed-rate portions of term loans on the Credit Facility and the preferred equity investment are estimated using a discounted cash flow analysis based on similar types of arrangements. The Company's preferred equity investment was repaid in March 2015. See Note 5 — Preferred Equity Investment. Advances under the Credit Facility with variable interest rates and advances under the revolving portion of the Credit Facility are considered to be reported at fair value.
Note 11 — Interest Rate Derivatives and Hedging Activities
Risk Management Objective of Using Derivatives
The Company uses derivative financial instruments, including interest rate swaps, caps, collars, options, floors and other interest rate derivative contracts, to hedge all or a portion of the interest rate risk associated with its borrowings. The principal objective of such arrangements is to minimize the risks and costs associated with the Company's operating and financial structure as well as to hedge specific anticipated transactions. The Company does not utilize derivatives for speculative or purposes other than interest rate risk management. The use of derivative financial instruments carries certain risks, including the risk that the counterparties to these contractual arrangements will not perform under the agreements. To mitigate this risk, the Company only enters into derivative financial instruments with counterparties that the Company believes to have high credit ratings and with major financial institutions with which the Company and the Advisor and its affiliates may also have other financial relationships.
Cash Flow Hedges of Interest Rate Risk
The Company's objectives in using interest rate derivatives are to add stability to interest expense and to manage its exposure to interest rate movements. To accomplish this objective, the Company primarily uses interest rate swaps and caps as part of its interest rate risk management strategy. Interest rate swaps designated as cash flow hedges involve the receipt of variable-rate amounts from a counterparty in exchange for the Company making fixed-rate payments over the life of the agreements without exchange of the underlying notional amount. Interest rate caps designated as cash flow hedges involve the receipt of variable-rate amounts if interest rates rise above the cap strike rate on the contract.
The effective portion of changes in the fair value of derivatives designated and that qualify as cash flow hedges is recorded in accumulated other comprehensive loss and is subsequently reclassified into earnings in the period that the hedged forecasted transaction affects earnings. The Company uses such derivatives to hedge the variable cash flows associated with variable-rate debt.
During the year ended December 31, 2015, the Company terminated two of its interest rate swaps as the related hedged debts were repaid, which made it probable that the forecasted transactions would not occur and, as a result, accelerated the reclassification of amounts in accumulated other comprehensive loss to earnings. The accelerated amounts resulted in a loss of $0.2 million for the year ended December 31, 2015, which is included in the gain (loss) on derivative instruments on the consolidated statements of operations and comprehensive loss.
Amounts reported in accumulated other comprehensive loss related to derivatives are reclassified to interest expense as interest payments are made on the Company's variable-rate debt. During the next 12 months, the Company estimates that an additional $1.0 million will be reclassified from accumulated other comprehensive loss as an increase to interest expense.
F-27
NEW YORK REIT, INC.
NOTES TO CONSOLIDATED FINANCIAL STATEMENTS
December 31, 2015, 2014 and 2013
As of December 31, 2015 and 2014, the Company had the following outstanding interest rate derivatives that were designated as cash flow hedges of interest rate risk.
December 31, 2015 | December 31, 2014 | |||||||||||
Interest Rate Derivative | Number of Instruments | Notional Amount | Number of Instruments | Notional Amount | ||||||||
(In thousands) | (In thousands) | |||||||||||
Interest rate swaps | 4 | $ | 131,988 | 6 | $ | 179,988 | ||||||
Derivatives Not Designated as Hedges
Derivatives not designated as hedges are not speculative and are used to manage the Company's exposure to interest rate movements and other identified risks, but do not meet the strict hedge accounting requirements under GAAP. Changes in the fair value of derivatives not designated in hedging relationships are recorded directly in earnings, which resulted in an expense of $0.4 million during the year ended December 31, 2015 and included in gain (loss) on derivative instruments on the consolidated statements of operations and comprehensive loss.
As of December 31, 2015, the Company had the following outstanding interest rate derivatives that were not designated as hedges in qualified hedging relationships. The Company did not have any outstanding interest rate derivatives that were not designated as hedges as of December 31, 2014.
December 31, 2015 | ||||||
Interest Rate Derivative | Number of Instruments | Notional Amount | ||||
(In thousands) | ||||||
Interest rate caps | 2 | $ | 305,000 | |||
Balance Sheet Classification
The table below presents the fair value of the Company's derivative financial instruments as well as their classification on the consolidated balance sheets as of December 31, 2015 and 2014:
December 31, | ||||||||||
(In thousands) | Balance Sheet Location | 2015 | 2014 | |||||||
Derivatives designated as hedging instruments: | ||||||||||
Interest rate swaps | Derivative assets, at fair value | $ | 15 | $ | 205 | |||||
Interest rate swaps | Derivative liabilities, at fair value | $ | (1,266 | ) | $ | (1,276 | ) | |||
Derivatives not designated as hedging instruments: | ||||||||||
Interest rate caps | Derivative assets, at fair value | $ | 416 | $ | — | |||||
F-28
NEW YORK REIT, INC.
NOTES TO CONSOLIDATED FINANCIAL STATEMENTS
December 31, 2015, 2014 and 2013
Derivatives in Cash Flow Hedging Relationships
The table below details the location in the financial statements of the income or loss recognized on interest rate derivatives designated as cash flow hedges for the years ended December 31, 2015, 2014 and 2013:
Year Ended December 31, | ||||||||||||
(In thousands) | 2015 | 2014 | 2013 | |||||||||
Amount of loss recognized in accumulated other comprehensive income (loss) from interest rate derivatives (effective portion) | $ | (2,344 | ) | $ | (2,847 | ) | $ | (16 | ) | |||
Amount of loss reclassified from accumulated other comprehensive income (loss) into income as interest expense (effective portion) | $ | (2,167 | ) | $ | (2,160 | ) | $ | (1,336 | ) | |||
Amount of gain (loss) recognized in gain (loss) on derivative instruments (ineffective portion, reclassifications of missed forecasted transactions and amounts excluded from effectiveness testing) | $ | (4 | ) | $ | 1 | $ | 5 | |||||
Offsetting Derivatives
The table below presents a gross presentation, the effects of offsetting, and a net presentation of the Company's derivatives as of December 31, 2015 and 2014. The net amounts of derivative assets or liabilities can be reconciled to the tabular disclosure of fair value. The tabular disclosure of fair value provides the location that derivative assets and liabilities are presented on the accompanying consolidated balance sheets.
Gross Amounts Not Offset on the Balance Sheet | ||||||||||||||||||||||||
Derivatives (In thousands) | Gross Amounts of Recognized Assets | Gross Amounts of Recognized Liabilities | Net Amounts of Assets (Liabilities) presented on the Balance Sheet | Financial Instruments | Cash Collateral Posted | Net Amount | ||||||||||||||||||
December 31, 2015 | $ | 431 | $ | (1,266 | ) | $ | (835 | ) | $ | — | $ | — | $ | (835 | ) | |||||||||
December 31, 2014 | $ | 205 | $ | (1,276 | ) | $ | (1,071 | ) | $ | — | $ | — | $ | (1,071 | ) | |||||||||
Credit-risk-related Contingent Features
The Company has agreements with its derivative counterparties that contain a provision whereby if the Company either defaults or is capable of being declared in default on any of its indebtedness, then the Company could also be declared in default on its derivative obligations.
As of December 31, 2015, the fair value of derivatives in a net liability position including accrued interest but excluding any adjustment for nonperformance risk related to these agreements was $1.4 million. As of December 31, 2015, the Company has not posted any collateral related to its agreements and was not in breach of any agreement provisions. If the Company had breached any of these provisions, it could have been required to settle its obligations under the agreements at the aggregate termination value of $1.4 million at December 31, 2015.
Note 12 — Common Stock
As of December 31, 2015 and 2014, the Company had 162.5 million and 162.2 million shares of common stock outstanding, respectively, including shares of unvested restricted common stock ("restricted shares") and shares issued under the distribution reinvestment plan (the "DRIP"), but not including OP units or Long-term Incentive Plan units ("LTIP units") which may in the future be converted into shares of common stock.
From December 2010 to April 2014, the Company declared and paid dividends at a dividend rate equal to $0.605 per annum per share of common stock. The dividends were paid by the fifth day following each month end to stockholders of record at the close of business each day during the prior month at a per share rate of 0.0016575342 per day. In April 2014, the Company's board of directors authorized, and the Company declared, a monthly dividend at an annualized rate equal to $0.46 per share per annum. Beginning in April 2014, dividends are paid to stockholders of record on the close of business on the 8th day of each month, payable on the 15th day of such month. The Company's board of directors may reduce the amount of dividends paid or suspend dividend payments at any time and therefore dividend payments are not assured.
F-29
NEW YORK REIT, INC.
NOTES TO CONSOLIDATED FINANCIAL STATEMENTS
December 31, 2015, 2014 and 2013
On March 31, 2014, the board of directors approved the termination of the Company's Share Repurchase Program ("SRP"). The Company processed all of the requests received under the SRP through the first quarter of 2014. The following table reflects the cumulative number of shares repurchased as of and through the termination of the SRP:
Number of Requests | Number of Shares Repurchased | Average Price per Share | |||||||
Repurchases prior to December 31, 2012 | 11 | 84,199 | 9.56 | ||||||
Year ended December 31, 2013 | 24 | 195,395 | 9.65 | ||||||
Repurchases in 2014 through termination of the SRP | 1 | 5,000 | 10.00 | ||||||
Cumulative repurchase requests through termination of SRP | 36 | 284,594 | $ | 9.63 | |||||
Note 13 — Commitments and Contingencies
Future Minimum Lease Payments
The Company has entered into operating and capital lease agreements primarily related to certain acquisitions under leasehold interest arrangements. The following table reflects the minimum base cash payments due from the Company over the next five years and thereafter under these arrangements, including the present value of the net minimum payments due under capital leases. These amounts exclude contingent rent payments, as applicable, that may be payable based on provisions related to increases in annual rent based on exceeding certain economic indexes, among other items.
Future Minimum Base Rent Payments | ||||||||
(In thousands) | Operating Leases | Capital Leases | ||||||
2016 | $ | 4,958 | $ | 86 | ||||
2017 | 4,905 | 86 | ||||||
2018 | 5,089 | 86 | ||||||
2019 | 5,346 | 86 | ||||||
2020 | 5,346 | 86 | ||||||
Thereafter | 246,281 | 3,404 | ||||||
Total minimum lease payments | $ | 271,925 | $ | 3,834 | ||||
Less: amounts representing interest | (1,721 | ) | ||||||
Total present value of minimum lease payments | $ | 2,113 | ||||||
Total rental expense related to operating leases was $7.7 million, $7.7 million and $0.9 million, respectively, for the years ended December 31, 2015, 2014 and 2013. During the years ended December 31, 2015, 2014 and 2013, interest expense related to capital leases was approximately $0.1 million. The following table discloses assets recorded under capital leases and the accumulated amortization thereon as of December 31, 2015 and 2014:
December 31, | ||||||||
(In thousands) | 2015 | 2014 | ||||||
Buildings, fixtures and improvements | $ | 11,783 | $ | 11,783 | ||||
Less accumulated depreciation and amortization | (1,705 | ) | (1,137 | ) | ||||
Total real estate investments, net | $ | 10,078 | $ | 10,646 | ||||
Litigation and Regulatory Matters
In the ordinary course of business, the Company may become subject to litigation, claims and regulatory matters. There are no legal or regulatory proceedings pending or known to be contemplated against the Company from which the Company expects to incur a material loss.
F-30
NEW YORK REIT, INC.
NOTES TO CONSOLIDATED FINANCIAL STATEMENTS
December 31, 2015, 2014 and 2013
RXR Realty (“RXR”) initiated a suit against the Company alleging that it suffered “lost profits” in connection with the Company’s purchase of its 48.9% interest in Worldwide Plaza in October 2013. On August 12, 2014, the Supreme Court of the State of New York dismissed all of RXR’s claims against the seller of Worldwide Plaza and dismissed RXR’s disgorgement claims against the Company, permitting only a limited, immaterial claim against the Company for RXR’s cost of producing due diligence-related material to proceed. RXR appealed the ruling and, on October 13, 2015, the appellate court upheld the previous decisions; however, the appellate court held that the trial court's exclusion of lost profit damages was premature and would have to be considered through a motion for summary judgment. The Company has moved for summary judgment. Oral argument of the motion is scheduled for March 24, 2016. The Company has not recognized a liability with respect to RXR's claim because the Company does not believe that it is probable that it will incur a related material loss.
Environmental Matters
In connection with the ownership and operation of real estate, the Company may potentially be liable for costs and damages related to environmental matters. The Company maintains environmental insurance for its properties that provides coverage for potential environmental liabilities, subject to the policy's coverage conditions and limitations. The Company has not been notified by any governmental authority of any non-compliance, liability or other claim, and is not aware of any other environmental condition that it believes will have a material adverse effect on the consolidated results of operations.
Note 14 — Related Party Transactions and Arrangements
Individual members of the Advisor and the SLP and employees or former employees of the Advisor hold interests in the OP. See Note 19 — Non-Controlling Interests.
As of December 31, 2014, the Company had investments in a real estate income fund managed by an affiliate of the Sponsor (see Note 6 — Investment Securities). There was no obligation to purchase any additional shares and the shares could have been sold at any time. The Company sold its investments in the real estate income fund during the year ended December 31, 2015. The Company recognized income on this investment of $0.1 million during the year ended December 31, 2015, which includes the gain recognized on the sale of the investments and dividend income. During the year ended December 31, 2014, the Company recognized income of $0.1 million on its equity security.
The following table details revenues from related parties at the Viceroy Hotel. The Company did not have any receivables from related parties as of December 31, 2015 or 2014.
Year Ended December 31, | ||||||||||||
(In thousands) | 2015 | 2014 | 2013 | |||||||||
Hotel revenues | $ | 134 | $ | 545 | $ | 68 | ||||||
Fees Paid in Connection with the IPO
The Former Dealer Manager and the Sponsor were paid fees and compensation in connection with the sale of the Company's common stock in the IPO. The Former Dealer Manager received a selling commission of up to 7.0% of gross offering proceeds before reallowance of commissions earned by participating broker-dealers and a dealer manager fee of 3.0% of gross offering proceeds. In addition, the Former Dealer Manager was permitted to re-allow a portion of its dealer manager fee to such participating broker-dealers, based on such factors as the volume of shares sold by respective participating broker-dealers and marketing support provided as compared to other participating broker-dealers. During the years ended December 31, 2014 and 2013, the Company incurred approximately $8,000 and $135.0 million, respectively, in commissions and fees to the Former Dealer Manager.
The Advisor and its affiliates received compensation and reimbursement for services provided in connection with the IPO. Effective March 1, 2013, the Company began utilizing transfer agent services provided by an affiliate of the Former Dealer Manager. All offering costs related to the IPO incurred by the Company, or its affiliated entities, on behalf of the Company were charged to additional paid-in capital on the accompanying consolidated balance sheets. Subsequent to the IPO, transfer agent fees are recorded in general and administrative expenses on the consolidated statements of operations and comprehensive loss. During the year ended December 31, 2013, the Company incurred $11.6 million in fees and expense reimbursements from the Advisor and Former Dealer Manager.
The Company did not incur any fees or expense reimbursements related to the IPO during the year ended December 31, 2015 and did not have any amounts payable to the Advisor or Former Dealer Manager related to fees paid in connection with the IPO as of December 31, 2015 or 2014.
F-31
NEW YORK REIT, INC.
NOTES TO CONSOLIDATED FINANCIAL STATEMENTS
December 31, 2015, 2014 and 2013
Fees Paid in Connection With the Operations of the Company
Prior to October 12, 2014 (the "Termination Date"), the Advisor was paid an acquisition fee of 1.0% of the contract purchase price of each acquired property and 1.0% of the amount advanced for a loan or other investment and, if the Advisor provided services in connection with the origination or refinancing of any debt that the Company obtained and used to acquire assets, or that was assumed, directly or indirectly, in connection with the acquisition of assets, the Company paid the Advisor a financing coordination fee equal to 0.75% of the amount available or outstanding under such financing or such assumed debt. Additionally, the Company reimbursed the Advisor for expenses incurred by the Advisor for services provided by third parties and acquisition expenses incurred by the Advisor directly from third parties. The total of all acquisition fees, acquisition expenses and any financing coordination fees with respect to the Company's portfolio of investments or reinvestments did not exceed 4.5% of the contract purchase price of the Company's portfolio as measured as of the Company's last property acquisition.
On April 15, 2014, in conjunction with the Listing, the Company amended and restated its advisory agreement with the OP and the Advisor, which, among other things, terminated the acquisition fee and financing coordination fee on the Termination Date, which was 180 days after the Listing. The Company amended and restated its advisory agreement again on June 26, 2015 (as amended from time to time, the "Advisory Agreement"), which, among other things, removed the 2%/25% Limitation (defined below).
If the Company acquires additional properties, the Company will reimburse the Advisor for expenses incurred by the Advisor or its affiliates for services provided by third parties and acquisition expenses incurred by the Advisor or its affiliates on their own behalf or directly from third parties, but will not pay acquisition fees or financing coordination fees.
Until the Listing, the Company paid the Advisor an asset management subordinated participation by causing the OP to issue (subject to periodic approval by the board of directors) to the Advisor a number of performance-based restricted, forfeitable partnership units of the OP designated as "Class B units" equal to a maximum 0.75% per annum of the cost of the Company's assets. As of April 15, 2014, in aggregate, the board of directors had approved the issuance of 1,188,667 Class B units to the Advisor in connection with this arrangement. The Advisor received distributions on unvested Class B units equal to the per share dividends paid on the Company's common stock. The value of issued Class B units was determined and expensed when the vesting condition was met, which occurred as of the Listing, resulting in $11.5 million of expense which was included in vesting of asset management fees expense in the consolidated statement of operations and comprehensive loss for the year ended December 31, 2014 and in non-controlling interest on the consolidated balance sheets as of December 31, 2014. On April 15, 2014, the Class B units were converted to OP units on a one-to-one basis.
With effect from Listing, the asset management subordinated participation was no longer applicable. Instead, an asset management fee became payable to the Advisor equal to 0.50% per annum of the cost of assets up to $3.0 billion and 0.40% per annum of the cost of assets above $3.0 billion. The asset management fee is payable in the form of cash, OP units, and shares of restricted common stock of the Company, or a combination thereof, at the Advisor’s election. During the year ended December 31, 2015, and the period from the Listing to December 31, 2014, the asset management fee was paid in cash.
Unless the Company contracts with a third party, the Company pays the Property Manager a property management fee equal to: (i) for non-hotel properties, 4.0% of gross revenues from properties managed, plus market-based leasing commissions; and (ii) for hotel properties, a market-based fee equal to a percentage of gross revenues. The Company also reimburses the Property Manager for property-level expenses. The Property Manager may subcontract the performance of its property management and leasing services duties to third parties and pay all or a portion of its property management fee to the third parties with whom it contracts for these services. If the Company contracts directly with third parties for such services, the Company will pay them customary market fees and pay the Property Manager an oversight fee equal to 1.0% of the gross revenues of the applicable property.
F-32
NEW YORK REIT, INC.
NOTES TO CONSOLIDATED FINANCIAL STATEMENTS
December 31, 2015, 2014 and 2013
The Company reimburses the Advisor for costs and expenses paid or incurred by the Advisor and its affiliates in connection with providing services to the Company (including reasonable salaries and wages, benefits and overhead of all employees directly involved with the performance of such services), although the Company will not reimburse the Advisor for personnel costs in connection with services for which the Advisor receives a separate fee. Prior to June 2015, reimbursement of costs and expenses was subject to the limitation that the Company would not reimburse the Advisor for any amount by which the Company's total operating expenses (as defined in the advisory agreement during the applicable time) for the four preceding fiscal quarters exceeded the greater of (a) 2.0% of average invested assets and (b) 25.0% of net income other than any additions to reserves for depreciation, bad debt or other similar non cash reserves and excluding any gain from the sale of assets for that period (the "2%/25% Limitation"). The 2%/25% Limitation was removed from the Advisory Agreement in connection with the amendment and restatement in June 2015. Total reimbursement of costs and expenses for the year ended December 31, 2015 was $0.8 million. No reimbursement was incurred for the years ended December 31, 2014 and 2013.
Throughout the year ended December 31, 2015, the Former Dealer Manager and its affiliates provided us with various services, including legal, marketing and transfer agent services, among others. As of December 31, 2015, an affiliate of the Former Dealer Manager continued to provide transfer agency services to the Company. Following the completion of the IPO, these fees are included in general and administrative expenses on the consolidated statements of operations and comprehensive loss during the period the service was provided. The amounts incurred from the Former Dealer Manager and its affiliates for services performed on behalf of the Company were $0.7 million for the year ended December 31, 2015.
The following table details amounts incurred, forgiven and contractually due in connection with the operations related services described above as of and for the periods presented:
Year Ended December 31, | Payable (Receivable) as of | |||||||||||||||||||||||||||||||
2015 | 2014 | 2013 | December 31, | December 31, | ||||||||||||||||||||||||||||
(In thousands) | Incurred | Forgiven | Incurred | Forgiven | Incurred | Forgiven | 2015 | 2014 | ||||||||||||||||||||||||
Acquisition fees and related cost reimbursements | $ | — | $ | — | $ | 3,350 | $ | — | $ | 15,836 | $ | — | $ | — | $ | — | ||||||||||||||||
Financing coordination fees | — | — | 2,363 | — | 6,584 | — | — | — | ||||||||||||||||||||||||
Ongoing fees: | ||||||||||||||||||||||||||||||||
Asset management fees (1) | 12,465 | — | 8,397 | — | — | — | (7 | ) | 15 | |||||||||||||||||||||||
Transfer agent and other professional fees | 1,713 | — | 1,971 | — | — | — | 99 | 560 | ||||||||||||||||||||||||
Property management and leasing fees | — | 2,603 | — | 1,731 | — | 840 | — | — | ||||||||||||||||||||||||
Strategic advisory fees | — | — | — | — | 920 | — | — | — | ||||||||||||||||||||||||
Distributions on Class B units | — | — | 107 | — | 139 | — | — | — | ||||||||||||||||||||||||
Total related party operational fees and reimbursements | $ | 14,178 | $ | 2,603 | $ | 16,188 | $ | 1,731 | $ | 23,479 | $ | 840 | $ | 92 | $ | 575 | ||||||||||||||||
___________________________________________
(1) | Prior to the Listing, the Company caused the OP to issue to the Advisor restricted performance based Class B units for asset management services, which vested as of the Listing. |
In order to improve operating cash flows and the ability to pay dividends from operating cash flows, the Advisor agreed to waive certain fees including property management fees during the years ended December 31, 2015, 2014 and 2013. Because the Advisor waived certain fees, cash flow from operations that would have been paid to the Advisor was available to pay dividends to stockholders. The fees that were waived were not deferrals and accordingly, will not be paid to the Advisor in any subsequent periods. Additionally, to improve the Company's working capital, the Advisor may elect to absorb, and not seek reimbursement for, a portion of the Company's expenses incurred in connection with the operations of the Company. The following table details property operating and general and administrative expenses absorbed by the Advisor during the periods presented. These costs are presented net in the consolidated statements of operations and comprehensive loss.
Year Ended December 31, | ||||||||||||
(In thousands) | 2015 | 2014 | 2013 | |||||||||
Property operating expenses absorbed | $ | — | $ | 623 | $ | — | ||||||
General and administrative expenses absorbed | — | 1,418 | 1,450 | |||||||||
Total expenses absorbed | $ | — | $ | 2,041 | $ | 1,450 | ||||||
The Company had no receivables from the Advisor related to absorbed general and administrative expenses as of December 31, 2015 or 2014.
F-33
NEW YORK REIT, INC.
NOTES TO CONSOLIDATED FINANCIAL STATEMENTS
December 31, 2015, 2014 and 2013
Fees Paid in Connection with the Liquidation or Listing of the Company's Real Estate Assets
In December 2013, the Company entered into a transaction management agreement with RCS Advisory Services, LLC, an entity under common control with the Former Dealer Manager, to provide strategic alternatives transaction management services through the occurrence of a liquidity event and a la carte services thereafter. The Company paid $3.0 million pursuant to this agreement. The Company incurred $1.5 million of expenses pursuant to this agreement during the years ended December 31, 2014 and 2013, including amounts for services provided in preparation for the Listing, which are included in acquisition and transaction related costs in the consolidated statement of operations and comprehensive loss. The Company did not incur any expenses pursuant to this agreement for the year ended December 31, 2015. The Company does not owe the Former Dealer Manager or its affiliates any more fees pursuant to this agreement.
In December 2013, the Company entered into an information agent and advisory services agreement with the Former Dealer Manager and American National Stock Transfer, LLC, an entity under common control with the Former Dealer Manager, to provide in connection with a liquidity event, advisory services, educational services to external and internal wholesalers, communication support as well as proxy, tender offer or redemption and solicitation services. The Company paid $1.9 million pursuant to this agreement. For the year ended December 31, 2014, the Company incurred $1.3 million of expenses pursuant to this agreement, which included amounts for services provided in preparation for the Company's tender offer in April 2014 (the "Tender Offer"), and are included in additional paid-in capital on the accompanying consolidated balance sheets. The Company incurred $0.6 million in fees pursuant to this arrangement during the year ended December 31, 2013 which were included in acquisition and transaction related costs in the consolidated statement of operations and comprehensive loss. The Company did not incur any expenses pursuant to this agreement during the year ended December 31, 2015. The Company does not owe the Former Dealer Manager or its affiliates any more fees pursuant to this agreement.
In December 2013, the Company entered into an agreement with RCS Capital, the investment banking and capital markets division of the Former Dealer Manager, for strategic and financial advice and assistance in connection with (i) a possible sale transaction involving the Company (ii) the possible listing of the Company’s securities on a national securities exchange, and (iii) a possible acquisition transaction involving the Company. The Former Dealer Manager was entitled to a transaction fee equal to 0.25% of the transaction value in connection with the possible sale transaction, listing or acquisition. In April 2014, in connection with the Listing, the Company incurred and paid $6.9 million in connection with this agreement which was included in acquisition and transaction related costs in the consolidated statement of operations and comprehensive loss. The Company does not owe the Former Dealer Manager or its affiliates any more fees pursuant to this agreement.
During the year ended December 31, 2014, the Company incurred $0.6 million of expenses to affiliated entities of the Advisor for general legal, marketing and sales services provided in connection with the Listing. These expenses are included in acquisition and transaction related costs in the consolidated statement of operations and comprehensive loss. During the year ended December 31, 2014, the Company also incurred approximately $9,000 of expenses to affiliated entities of the Advisor for general legal services provided in connection with the Tender Offer. These expenses are included in additional paid-in capital on the accompanying consolidated balance sheets. The Company did not incur any expenses pursuant to this agreement for the year ended December 31, 2015. As of December 31, 2015 and 2014, there were no amounts payable to affiliated entities of the Advisor in accounts payable and accrued expenses on the accompanying consolidated balance sheets relating to the Listing or Tender Offer.
For substantial assistance in connection with the sale of properties, the Company will pay the Advisor a property disposition fee not to exceed the lesser of 2.0% of the contract sale price of the property and 50% of the competitive real estate commission paid if a third party broker is also involved; provided, however that in no event may the property disposition fee paid to the Advisor when added to real estate commissions paid to unaffiliated third parties exceed the lesser of 6.0% of the contract sales price and a competitive real estate commission. For purposes of the foregoing, "competitive real estate commission" means a real estate brokerage commission for the purchase or sale of a property which is reasonable, customary and competitive in light of the size, type and location of the property. The Company incurred and paid $0.2 million in property disposition fees during the year ended December 31, 2015. No such fees were incurred or paid for the years ended December 31, 2014 or 2013.
In connection with the Listing, the OP issued the Listing Note. See Note 9 — Subordinated Listing Distribution.
In connection with the Listing and the Advisory Agreement, the Company terminated the subordinated termination fee that would be due to the Advisor in the event of termination of the Advisory Agreement.
F-34
NEW YORK REIT, INC.
NOTES TO CONSOLIDATED FINANCIAL STATEMENTS
December 31, 2015, 2014 and 2013
In October 2014, the Company entered into separate transaction management agreements with Barclays Capital Inc. and the Former Dealer Manager as financial advisors to assist the board of directors of the Company in evaluating strategic options to enhance long-term stockholder value, including a business combination involving the Company or a sale of the Company. In May 2015, the Company terminated its agreements with Barclays Capital Inc. and the Former Dealer Manager prior to paying any fees thereunder. The Company is no longer obligated to pay any transaction fees under either agreement.
Note 15 — Economic Dependency
Under various agreements, the Company has engaged or will engage the Advisor, its affiliates and entities under common control with the Advisor to provide certain services that are essential to the Company, including asset management services, supervision of the management and leasing of properties owned by the Company, asset acquisition and disposition decisions, as well as other administrative responsibilities for the Company including accounting services, transaction management and investor relations.
As a result of these relationships, the Company is dependent upon the Advisor and its affiliates. In the event that these companies are unable to provide the Company with the respective services, the Company will be required to find alternative providers of these services.
Note 16 — Share-Based Compensation
Stock Option Plan
The Company has a stock option plan (the "Plan") which authorizes the grant of nonqualified stock options to the Company's independent directors, officers, advisors, consultants and other personnel, subject to the absolute discretion of the board of directors and the applicable limitations of the Plan. The exercise price for all stock options granted under the Plan will be equal to the fair market value of a share on the date of grant. Upon a change in control, unvested options will become fully vested and any performance conditions imposed with respect to the options will be deemed to be fully achieved. A total of 0.5 million shares have been authorized and reserved for issuance under the Plan. As of December 31, 2015 and 2014, no stock options were issued under the Plan.
Restricted Share Plan
The Company's employee and director incentive restricted share plan ("RSP") provides the Company with the ability to grant awards of restricted shares to the Company's directors, officers and employees (if the Company ever has employees), employees of the Advisor and its affiliates, employees of entities that provide services to the Company, directors of the Advisor or of entities that provide services to the Company, certain consultants to the Company and the Advisor and its affiliates or to entities that provide services to the Company.
Prior to the Listing, the RSP provided for the automatic grant of 3,000 restricted shares of common stock to each of the independent directors, without any further action by the Company's board of directors or the stockholders, on the date of initial election to the board of directors and on the date of each annual stockholder's meeting. Restricted shares issued to independent directors vest over a five-year period in increments of 20% per annum. Subsequent to the Listing, the Company amended the RSP to, among other things, remove the fixed amount of restricted shares that are automatically granted to the independent directors. Under the amended RSP, the annual amount granted to the independent directors is determined by the board of directors. Generally, such awards provide for accelerated vesting of (i) all unvested restricted shares upon a change in control or a termination without cause and (ii) the portion of the unvested restricted shares scheduled to vest in the year of voluntary termination or the failure to be re-elected to the board.
Prior to March 31, 2014, the total number of shares of common stock granted under the RSP could not exceed 5.0% of the Company's outstanding shares on a fully diluted basis at any time, and in any event could not exceed 7.5 million shares (as such number may be adjusted for stock splits, stock dividends, combinations and similar events). On March 31, 2014, the Company adopted an amendment to the Company’s RSP to increase the number of shares of the Company's capital stock, par value $0.01 per share, available for awards thereunder to 10% of the Company’s outstanding shares of capital stock on a fully diluted basis at any time. The amendment also eliminated the RSP limit of 7.5 million shares of capital stock.
Restricted shares may not, in general, be sold or otherwise transferred until restrictions are removed and the shares have vested. Holders of restricted shares may receive cash dividends prior to the time that the restrictions on the restricted shares have lapsed. Any dividends payable in shares of common stock are subject to the same restrictions as the underlying restricted shares.
F-35
NEW YORK REIT, INC.
NOTES TO CONSOLIDATED FINANCIAL STATEMENTS
December 31, 2015, 2014 and 2013
The following table displays restricted share award activity during the years ended December 31, 2015, 2014 and 2013:
Number of Restricted Shares | Weighted-Average Issue Price | |||||
Unvested, December 31, 2012 | 19,800 | $ | 9.55 | |||
Granted | 9,000 | 9.00 | ||||
Vested | (4,800 | ) | 9.63 | |||
Unvested, December 31, 2013 | 24,000 | 9.33 | ||||
Granted | 218,845 | 10.74 | ||||
Vested | (150,231 | ) | 10.52 | |||
Forfeited | (3,115 | ) | 10.70 | |||
Unvested, December 31, 2014 | 89,499 | 10.73 | ||||
Granted | 340,527 | 10.54 | ||||
Vested | (33,651 | ) | 10.56 | |||
Forfeited | (79,805 | ) | 10.36 | |||
Unvested, December 31, 2015 | 316,570 | $ | 10.59 | |||
In the first quarter of 2015, the board of directors approved, and the Company awarded, 279,365 restricted shares to employees of the Advisor. The awards vest over a four year period in increments of 25% per annum. During the year ended December 31, 2015, 79,805 restricted shares were forfeited. In the fourth quarter 2015, the Company awarded an additional 30,000 restricted shares to its interim chief financial officer. This award vests over a three year period, subject to automatic vesting in its entirety upon his resignation or replacement as interim chief financial officer.
Compensation expense related to restricted shares was $1.1 million, $2.5 million, and $0.1 million for the years ended December 31, 2015, 2014 and 2013, respectively. As of December 31, 2015, the Company had approximately $1.9 million of unrecognized compensation cost related to unvested restricted share awards granted under the Company’s RSP, which is expected to vest over a period of 3.2 years.
2014 Advisor Multi-Year Outperformance Agreement
On the Effective Date in connection with the Listing, the Company entered into the OPP with the OP and the Advisor. The Company amended and restated the OPP effective August 5, 2015 to amend certain definitions related to performance measurement to equitably adjust for share issuances and share repurchases for the OPP's remaining valuation dates.
Under the OPP, the Advisor was issued 8,880,579 LTIP units in the OP with a maximum award value on the issuance date equal to 5.0% of the Company’s market capitalization (the “OPP Cap”). The LTIP units are structured as profits interests in the OP.
F-36
NEW YORK REIT, INC.
NOTES TO CONSOLIDATED FINANCIAL STATEMENTS
December 31, 2015, 2014 and 2013
The Advisor is eligible to earn a number of LTIP units with a value equal to a portion of the OPP Cap upon the first, second and third anniversaries of the Effective Date based on the Company’s achievement of certain levels of total return to its stockholders (“Total Return”), including both share price appreciation and common stock dividends, as measured against a peer group of companies, as set forth below, for the three-year performance period commencing on the Effective Date (the “Three-year Period”); each 12-month period during the Three-Year Period (the “One-Year Periods”); and the initial 24-month period of the Three-Year Period (the “Two-Year Period”), as follows:
Performance Period | Annual Period | Interim Period | ||||||
Absolute Component: 4% of any excess Total Return if total stockholder return attained above an absolute hurdle measured from the beginning of such period: | 21% | 7% | 14% | |||||
Relative Component: 4% of any excess Total Return attained above the Total Return for the performance period of the Peer Group*, subject to a ratable sliding scale factor as follows based on achievement of cumulative Total Return measured from the beginning of such period: | ||||||||
• | 100% will be earned if total stockholder return achieved is at least: | 18% | 6% | 12% | ||||
• | 50% will be earned if total stockholder return achieved is: | 0% | 0% | 0% | ||||
• | 0% will be earned if total stockholder return achieved is less than: | 0% | 0% | 0% | ||||
• | a percentage from 50% to 100% calculated by linear interpolation will be earned if the cumulative Total Return achieved is between: | 0% - 18% | 0% - 6% | 0% - 12% | ||||
______________________
*The “Peer Group” is comprised of the companies in the SNL US REIT Office Index.
The potential outperformance award is calculated at the end of each One-Year Period, the Two-Year Period and the Three-Year Period. The award earned for the Three-Year Period is based on the formula in the table above less any awards earned for the Two-Year Period and One-Year Periods, but not less than zero; the award earned for the Two-Year Period is based on the formula in the table above less any award earned for the first and second One-Year Period, but not less than zero. Any LTIP units that are unearned at the end of the Performance Period will be forfeited. On April 15, 2015, 367,059 LTIP units were earned by the Advisor under the terms of the OPP.
Moreover, the OPP provides for early calculation of earned LTIP units and for the accelerated vesting of any earned LTIP units in the event the Advisor is terminated or in the event of a change in control of the Company, which could motivate the Advisor to recommend a transaction that would result in a change in control under the OPP when such a transaction would not otherwise be in the best interests of the Company's stockholders.
Subject to the Advisor’s continued service through each vesting date, one third of any earned LTIP units will vest on each of the third, fourth and fifth anniversaries of the Effective Date. Until such time as an LTIP unit is earned in accordance with the provisions of the OPP, the holder of such LTIP unit is entitled to distributions on such LTIP unit equal to 10% of the distributions made per OP unit. The Company paid $0.7 million and $0.3 million, respectively, in distributions related to LTIP units during the years ended December 31, 2015 and 2014, respectively, which is included in non-controlling interest in the consolidated balance sheets. After an LTIP unit is earned, the holder of such LTIP unit is entitled to a catch-up distribution and then the same distribution as the holder of an OP unit. At the time the Advisor’s average capital account balance with respect to an LTIP unit is economically equivalent to the average capital account balance of an OP unit, the LTIP unit has been earned and it has been vested for 30 days, the Advisor, in its sole discretion, will be entitled to convert such LTIP unit into an OP unit in accordance with the provisions of the limited partnership agreement of the OP.
Compensation expense related to the OPP was $14.1 million and $5.3 million, respectively, for the years ended December 31, 2015 and 2014.
The valuation of the OPP is determined using a Monte Carlo simulation. This analysis reflects the contractual terms of the OPP, including the performance periods and total return hurdles, as well as observable market-based inputs, including interest rate curves, and unobservable inputs, such as expected volatility. As a result, the Company has determined that its OPP valuation in its entirety is classified in Level 3 of the fair value hierarchy. See Note 10 — Fair Value of Financial Instruments.
F-37
NEW YORK REIT, INC.
NOTES TO CONSOLIDATED FINANCIAL STATEMENTS
December 31, 2015, 2014 and 2013
The following table presents information about the Company's OPP, which is measured at fair value on a recurring basis as of December 31, 2015 and 2014, aggregated by the level in the fair value hierarchy within which the instrument falls:
(In thousands) | Quoted Prices in Active Markets Level 1 | Significant Other Observable Inputs Level 2 | Significant Unobservable Inputs Level 3 | Total | ||||||||||||
December 31, 2015 | ||||||||||||||||
OPP | $ | — | $ | — | $ | 43,500 | $ | 43,500 | ||||||||
December 31, 2014 | ||||||||||||||||
OPP | $ | — | $ | — | $ | 29,100 | $ | 29,100 | ||||||||
Level 3 valuations
The following is a reconciliation of the beginning and ending balance for the changes in instruments with Level 3 inputs in the fair value hierarchy for the year ended December 31, 2015:
(In thousands) | OPP | |||
Beginning balance as of December 31, 2014 | $ | 29,100 | ||
Fair value at issuance | — | |||
Fair value adjustment | 14,400 | |||
Ending balance as of December 31, 2015 | $ | 43,500 | ||
The following table provides quantitative information about significant Level 3 input used:
Financial Instrument | Fair Value | Principal Valuation Technique | Unobservable Inputs | Input Value | |||||||
(In thousands) | |||||||||||
December 31, 2015 | |||||||||||
OPP | $ | 43,500 | Monte Carlo Simulation | Expected volatility | 27.0 | % | |||||
December 31, 2014 | |||||||||||
OPP | $ | 29,100 | Monte Carlo Simulation | Expected volatility | 27.0 | % | |||||
Expected volatility is a measure of the variability in possible returns for an instrument, parameter or market index given how much the particular instrument, parameter or index changes in value over time. Generally, the higher the expected volatility of the underlying instrument, the wider the range of potential future returns. An increase in expected volatility, in isolation, would generally result in an increase in the fair value measurement of an instrument. For the relationship described above, the inverse relationship would also generally apply.
F-38
NEW YORK REIT, INC.
NOTES TO CONSOLIDATED FINANCIAL STATEMENTS
December 31, 2015, 2014 and 2013
Note 17 — Accumulated Other Comprehensive Income (Loss)
The following table illustrates the changes in accumulated other comprehensive income (loss) as of and for the periods indicated:
Unrealized gains | Change in | Total accumulated | ||||||||||
on available-for-sale | unrealized gain | other comprehensive | ||||||||||
(in thousands) | securities | (loss) on derivatives | income (loss) | |||||||||
Balance, December 31, 2012 | $ | — | $ | (1,693 | ) | $ | (1,693 | ) | ||||
Other comprehensive loss, before reclassifications | (240 | ) | (16 | ) | (256 | ) | ||||||
Amounts reclassified from accumulated other comprehensive income (loss) | — | 1,336 | 1,336 | |||||||||
Net current-period other comprehensive income (loss) | (240 | ) | 1,320 | 1,080 | ||||||||
Balance, December 31, 2013 | (240 | ) | (373 | ) | (613 | ) | ||||||
Other comprehensive income (loss), before reclassifications | 484 | (2,847 | ) | (2,363 | ) | |||||||
Amounts reclassified from accumulated other comprehensive income (loss) | — | 2,160 | 2,160 | |||||||||
Net current-period other comprehensive income (loss) | 484 | (687 | ) | (203 | ) | |||||||
Balance, December 31, 2014 | 244 | (1,060 | ) | (816 | ) | |||||||
Other comprehensive loss, before reclassifications | (137 | ) | (2,344 | ) | (2,481 | ) | ||||||
Amounts reclassified from accumulated other comprehensive income (loss) | (107 | ) | 2,167 | 2,060 | ||||||||
Net current-period other comprehensive loss | (244 | ) | (177 | ) | (421 | ) | ||||||
Balance, December 31, 2015 | $ | — | $ | (1,237 | ) | $ | (1,237 | ) | ||||
For a reconciliation of the income statement line item affected due to amounts reclassified out of accumulated other comprehensive loss for the years ended December 31, 2015, 2014 and 2013, see Note 11 — Interest Rate Derivatives and Hedging Activities.
Note 18 — Net Loss Per Share
The following is a summary of the basic and diluted net loss per share computations for the periods presented:
Year Ended December 31, | ||||||||||||
2015 | 2014 | 2013 | ||||||||||
Net loss attributable to stockholders | $ | (39,081 | ) | $ | (93,028 | ) | $ | (19,279 | ) | |||
Basic and Diluted weighted average shares outstanding | 162,165,580 | 166,959,316 | 73,074,872 | |||||||||
Basic and diluted net loss per share attributable to stockholders | $ | (0.24 | ) | $ | (0.56 | ) | $ | (0.26 | ) | |||
F-39
NEW YORK REIT, INC.
NOTES TO CONSOLIDATED FINANCIAL STATEMENTS
December 31, 2015, 2014 and 2013
Diluted net loss per share assumes the conversion of all common share equivalents into an equivalent number of common shares, unless the effect is antidilutive. The Company considers unvested restricted shares, OP units and LTIP units to be common share equivalents. The Company had the following common share equivalents for the periods presented, which were excluded from the calculation of diluted loss per share attributable to stockholders as the effect would have been antidilutive:
Year Ended December 31, | |||||||||
2015 | 2014 | 2013 | |||||||
Unvested restricted stock | 316,570 | 89,499 | 24,000 | ||||||
OP units | 4,178,090 | 4,270,841 | 200 | ||||||
Class B units | — | — | 454,739 | ||||||
LTIP units | 8,880,579 | 8,880,579 | — | ||||||
Total anti-dilutive common share equivalents | 13,375,239 | 13,240,919 | 478,939 | ||||||
Note 19 — Non-Controlling Interests
The Company is the sole general partner of the OP and holds the majority of the OP units. As of December 31, 2015 and 2014, the Advisor or members, employees or former employees of the Advisor held 4,178,090 and 4,270,841 OP units, respectively, and 8,880,579 unvested LTIP units. There were $2.6 million and $0.8 million, respectively, of distributions paid to OP unit and LTIP unit holders during the years ended December 31, 2015 and 2014. There were no OP units or LTIP units outstanding during the year ended December 31, 2013, as such, no distributions were paid.
A holder of OP units has the right to distributions and has the right to convert OP units for the cash value of a corresponding number of shares of the Company's common stock or a corresponding number of shares of the Company's common stock, at the election of the OP, in accordance with the limited partnership agreement of the OP. The remaining rights of the holders of OP units are limited, however, and do not include the ability to replace the general partner or to approve the sale, purchase or refinancing of the OP's assets.
On May 13, 2015, 92,751 OP units were redeemed for shares of the Company's common stock and reclassified from non-controlling interest to stockholders' equity.
The Company was the controlling member of the limited liability company that owned 163 Washington Avenue, acquired in September 2012. The Company had the sole voting rights under the operating agreement of this limited liability company. The non-controlling members' aggregate initial investment balance of $0.5 million would have been reduced by the dividends paid to each non-controlling member. No dividends were paid during the years ended December 31, 2014 or 2013. On October 21, 2015, the Company sold the 163 Washington Avenue property and distributed to the non-controlling members $0.6 million, representing their invested capital plus a return on investment.
F-40
NEW YORK REIT, INC.
NOTES TO CONSOLIDATED FINANCIAL STATEMENTS
December 31, 2015, 2014 and 2013
Note 20 — Quarterly Results (Unaudited)
Presented below is a summary of the unaudited quarterly financial information for the years ended December 31, 2015, 2014 and 2013:
Quarters Ended | ||||||||||||||||
(In thousands, except share and per share data) | March 31, 2015 | June 30, 2015 | September 30, 2015 | December 31, 2015 | ||||||||||||
Total revenues(1) | $ | 41,849 | $ | 43,677 | $ | 44,608 | $ | 44,387 | ||||||||
Basic and diluted net loss attributable to stockholders(2) | $ | (8,516 | ) | $ | (8,982 | ) | $ | (13,075 | ) | $ | (8,508 | ) | ||||
Basic and diluted weighted average shares outstanding | 162,092,424 | 162,156,470 | 162,203,065 | 162,208,672 | ||||||||||||
Basic and diluted net loss per share attributable to stockholders(2) | $ | (0.05 | ) | $ | (0.06 | ) | $ | (0.08 | ) | $ | (0.05 | ) | ||||
____________________________
(1) | During the fourth quarter of 2015, the Company reclassified the write-off of a terminated below-market lease from depreciation and amortization expense to revenue. Revenue for the quarter ended March 31, 2015 has been revised to reflect this reclassification. |
(2) | During the fourth quarter of 2015, the Company identified certain immaterial errors impacting interest expense in its previously issued quarterly financial statements. Interest expense and net loss were understated by $0.3 million for each of the quarters ended March 31, 2015, June 30, 2015 and September 30, 2015. Quarterly amounts in the table above have been revised to reflect the corrected amounts. |
Quarters Ended | ||||||||||||||||
(In thousands, except share and per share data) | March 31, 2014 | June 30, 2014 | September 30, 2014 | December 31, 2014 | ||||||||||||
Total revenues | $ | 33,592 | $ | 35,949 | $ | 40,514 | $ | 45,512 | ||||||||
Basic net income (loss) attributable to stockholders | $ | (8,156 | ) | $ | (67,237 | ) | $ | 9,695 | $ | (27,330 | ) | |||||
Adjustments to net income (loss) attributable to stockholders for common share equivalents | — | — | (1,305 | ) | — | |||||||||||
Diluted net income (loss) attributable to stockholders | $ | (8,156 | ) | $ | (67,237 | ) | $ | 8,390 | $ | (27,330 | ) | |||||
Basic weighted average shares outstanding | 175,068,005 | 168,972,601 | 161,975,420 | 162,019,399 | ||||||||||||
Basic net income (loss) per share attributable to stockholders | $ | (0.05 | ) | $ | (0.40 | ) | $ | 0.06 | $ | (0.17 | ) | |||||
Diluted weighted average shares outstanding | 175,068,005 | 168,972,601 | 162,181,209 | 162,019,399 | ||||||||||||
Diluted net income (loss) per share attributable to stockholders | $ | (0.05 | ) | $ | (0.40 | ) | $ | 0.05 | $ | (0.17 | ) | |||||
Quarters Ended | ||||||||||||||||
(In thousands, except share and per share data) | March 31, 2013 | June 30, 2013 | September 30, 2013 | December 31, 2013 | ||||||||||||
Total revenues | $ | 8,327 | $ | 10,905 | $ | 15,728 | $ | 20,927 | ||||||||
Basic net income (loss) attributable to stockholders | $ | (2,794 | ) | $ | 2,019 | $ | (5,373 | ) | $ | (13,131 | ) | |||||
Adjustments to net income (loss) attributable to stockholders for common share equivalents | — | (223 | ) | — | — | |||||||||||
Diluted net income (loss) attributable to stockholders | $ | (2,794 | ) | $ | 1,796 | $ | (5,373 | ) | $ | (13,131 | ) | |||||
Basic weighted average shares outstanding | 23,217,358 | 41,982,278 | 83,841,078 | 141,836,952 | ||||||||||||
Basic net income (loss) per share attributable to stockholders | $ | (0.12 | ) | $ | 0.05 | $ | (0.06 | ) | $ | (0.09 | ) | |||||
Diluted weighted average shares outstanding | 23,217,358 | 42,001,432 | 83,841,078 | 141,836,952 | ||||||||||||
Diluted net income (loss) per share attributable to stockholders | $ | (0.12 | ) | $ | 0.04 | $ | (0.06 | ) | $ | (0.09 | ) | |||||
F-41
NEW YORK REIT, INC.
NOTES TO CONSOLIDATED FINANCIAL STATEMENTS
December 31, 2015, 2014 and 2013
Note 21 — Subsequent Events
The Company has evaluated subsequent events through the filing of this Annual Report on Form 10-K, and determined that there have not been any events that have occurred that would require adjustments to disclosures in the consolidated financial statements, except for the following events:
On February 1, 2016, the Company issued 2,515,406 shares of its common stock upon redemption of 2,515,406 OP units held by certain individuals who are members of the Advisor and Sponsor.
On February 2, 2016, the Company closed on the sale of its Duane Reade property for a contract sale price of $12.6 million, exclusive of closing costs. At closing, the Company repaid a mortgage note payable securing the property of $8.4 million.
On February 17, 2016, the Company closed on the sale of its property located at 1623 Kings Highway for a contract sale price of $17.0 million, exclusive of closing costs. At closing, the Company repaid a mortgage note payable securing the property of $7.3 million.
F-42
New York REIT, Inc.
Real Estate and Accumulated Depreciation
Schedule III
December 31, 2015
(dollar amounts in thousands)
Encumbrances | Initial Costs | Subsequent to Acquisition | Gross Amount | |||||||||||||||||||||||||||||
Acquisition | at | Building and | Building and | at | Accumulated | |||||||||||||||||||||||||||
Portfolio | State | Date | December 31, 2015 | Land | Improvements | Land | Improvements | December 31, 2015(3) (4) | Depreciation(5)(6) | |||||||||||||||||||||||
Design Center | NY | 6/22/2010 | $ | 19,798 | $ | 11,243 | $ | 18,884 | $ | — | $ | 3,062 | $ | 33,189 | $ | 5,239 | ||||||||||||||||
367-387 Bleecker Street | NY | 12/1/2010 | — | (1) | — | 31,167 | — | — | 31,167 | 6,762 | ||||||||||||||||||||||
Foot Locker (2) | NY | 4/18/2011 | 3,250 | 2,753 | 2,753 | — | 48 | 5,554 | 272 | |||||||||||||||||||||||
33 West 56th Street (garage) | NY | 6/1/2011 | — | (1) | — | 4,637 | — | — | 4,637 | 960 | ||||||||||||||||||||||
Duane Reade (2) | NY | 10/5/2011 | 8,400 | 4,443 | 8,252 | — | (850 | ) | 11,845 | 1,011 | ||||||||||||||||||||||
416 Washington Street | NY | 11/3/2011 | — | (1) | — | 8,979 | — | 1,011 | 9,990 | 2,190 | ||||||||||||||||||||||
One Jackson Square | NY | 11/18/2011 | — | (1) | — | 21,466 | — | 66 | 21,532 | 4,437 | ||||||||||||||||||||||
350 West 42nd Street | NY | 3/16/2012 | — | (1) | — | 19,869 | — | 83 | 19,952 | 3,618 | ||||||||||||||||||||||
1100 Kings Highway | NY | 5/4/2012 | 20,200 | 17,112 | 17,947 | — | 85 | 35,144 | 3,062 | |||||||||||||||||||||||
1623 Kings Highway (2) | NY | 10/9/2012 | 7,288 | 3,440 | 8,538 | — | 42 | 12,020 | 726 | |||||||||||||||||||||||
256 West 38th Street | NY | 12/26/2012 | 24,500 | 20,000 | 26,483 | — | 2,579 | 49,062 | 5,891 | |||||||||||||||||||||||
229 West 36th Street | NY | 12/27/2012 | — | (1) | 27,400 | 22,308 | — | 836 | 50,544 | 3,831 | ||||||||||||||||||||||
350 Bleecker Street | NY | 12/31/2012 | — | (1) | — | 11,783 | — | — | 11,783 | 1,705 | ||||||||||||||||||||||
218 West 18th Street | NY | 3/27/2013 | — | (1) | 17,500 | 90,869 | — | 3,221 | 111,590 | 13,647 | ||||||||||||||||||||||
50 Varick Street | NY | 7/5/2013 | — | (1) | — | 77,992 | — | 23,553 | 101,545 | 11,573 | ||||||||||||||||||||||
333 West 34th Street | NY | 8/9/2013 | — | (1) | 98,600 | 120,908 | — | 148 | 219,656 | 20,870 | ||||||||||||||||||||||
Viceroy Hotel | NY | 11/18/2013 | — | (1) | — | 169,945 | — | 2,615 | 172,560 | 12,583 | ||||||||||||||||||||||
1440 Broadway | NY | 12/23/2013 | 305,000 | 217,066 | 289,410 | — | (5,844 | ) | 500,632 | 33,013 | ||||||||||||||||||||||
245-249 West 17th Street | NY | 8/22/2014 | — | (1) | 68,251 | 233,607 | — | 10,460 | 312,318 | 8,022 | ||||||||||||||||||||||
Total | $ | 388,436 | $ | 487,808 | $ | 1,185,797 | $ | — | $ | 41,115 | $ | 1,714,720 | $ | 139,412 | ||||||||||||||||||
___________________________________
(1) | These properties collateralize the Credit Facility, which had $485.0 million outstanding as of December 31, 2015. |
(2) | Held for sale as of December 31, 2015. |
(3) | Acquired intangible lease assets allocated to individual properties in the amount of $140.8 million are not reflected in the table above. |
(4) | The tax basis of aggregate land, buildings and improvements as of December 31, 2015 is $1.7 billion (unaudited). |
(5) | The accumulated depreciation column excludes $36.2 million of amortization associated with acquired intangible lease assets. |
(6) | Each of the properties has a depreciable life of: 40 years for buildings, 15 years for land improvements and five to seven years for fixtures. |
A summary of activity for real estate and accumulated depreciation for the years ended December 31, 2015, 2014 and 2013:
December 31, | ||||||||||||
(In thousands) | 2015 | 2014 | 2013 | |||||||||
Real estate investments, at cost (including assets held for sale): | ||||||||||||
Balance at beginning of year | $ | 1,729,983 | $ | 1,414,959 | $ | 322,205 | ||||||
Additions-Acquisitions | — | 301,858 | 1,082,292 | |||||||||
Capital expenditures | 27,231 | 15,356 | 12,089 | |||||||||
Disposals | (42,494 | ) | (2,190 | ) | (1,627 | ) | ||||||
Balance at end of the year | $ | 1,714,720 | $ | 1,729,983 | $ | 1,414,959 | ||||||
Accumulated depreciation (including assets held for sale): | ||||||||||||
Balance at beginning of year | $ | 93,012 | $ | 31,715 | $ | 9,476 | ||||||
Depreciation expense | 61,527 | 63,349 | 23,405 | |||||||||
Disposals | (15,127 | ) | (2,052 | ) | (1,166 | ) | ||||||
Balance at end of the year | $ | 139,412 | $ | 93,012 | $ | 31,715 | ||||||
F-43