Exhibit 99.1

| ||
| FOR IMMEDIATE RELEASE | NYSE:ARI | |
| CONTACT: | Hilary Ginsberg |
| Investor Relations |
| (212) 822-0767 |
APOLLO COMMERCIAL REAL ESTATE FINANCE, INC. REPORTS
FIRST QUARTER 2015 FINANCIAL RESULTS AND
DECLARES A COMMON STOCK QUARTERLY DIVIDEND OF $0.44 PER SHARE
— 18.9% Increase in Operating Earnings Per Share of Common Stock –
New York, NY, April 28, 2015 – Apollo Commercial Real Estate Finance, Inc. (the “Company” or “ARI”) (NYSE:ARI) today reported financial results for the quarter ended March 31, 2015.
First Quarter 2015 Highlights
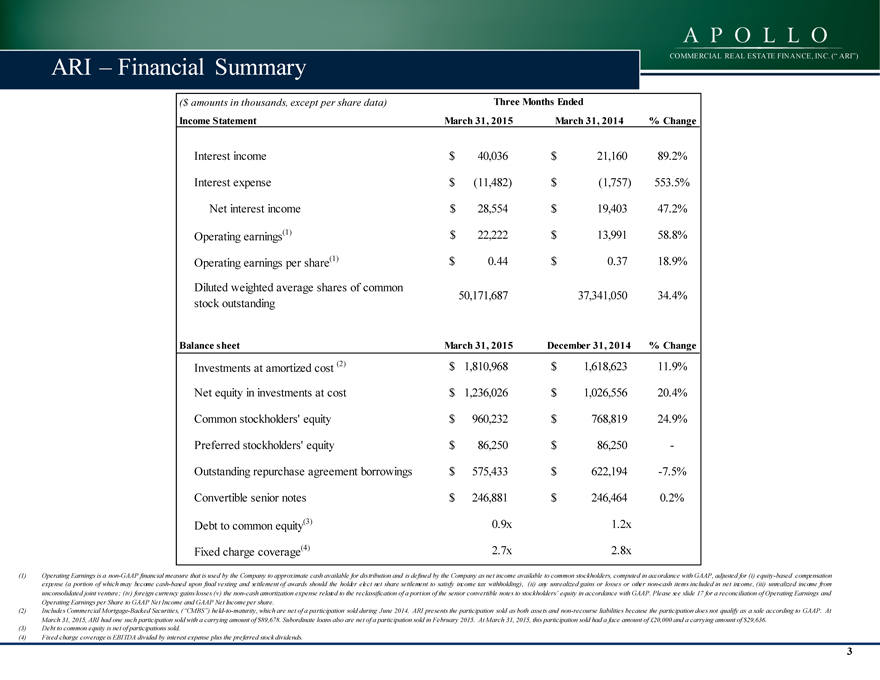
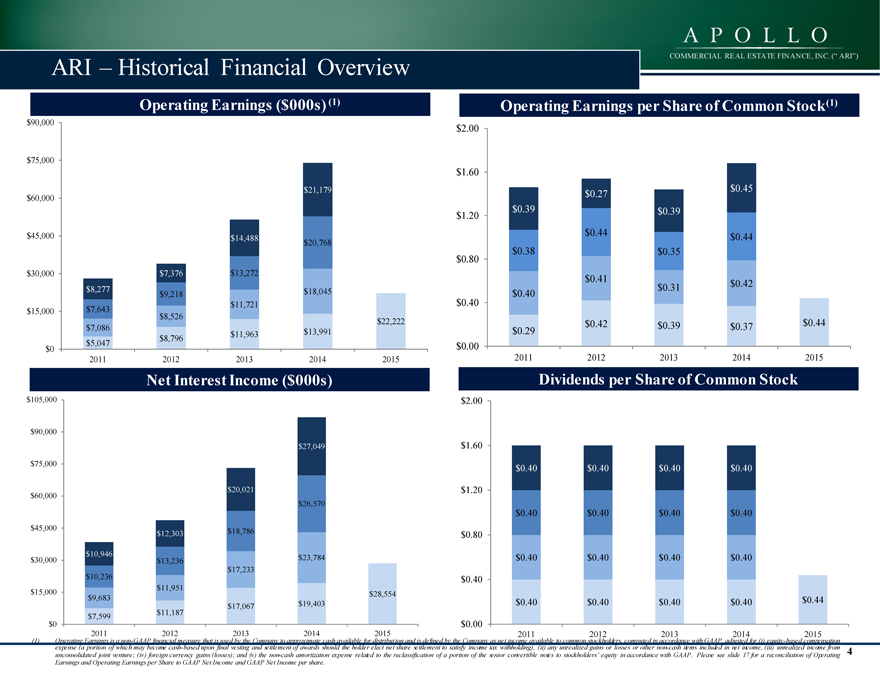
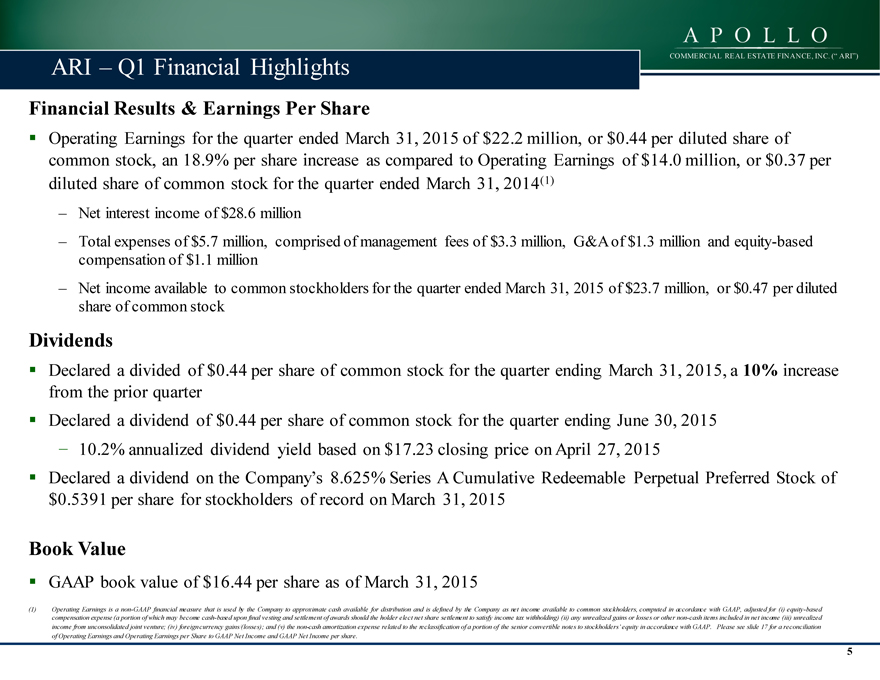
| • | Reported Operating Earnings (a non-GAAP financial measure defined below) per diluted share of common stock of $0.44 for the quarter ended March 31, 2015, an increase of 18.9% as compared to Operating Earnings per diluted share of common stock of $0.37 for the quarter ended March 31, 2014; |
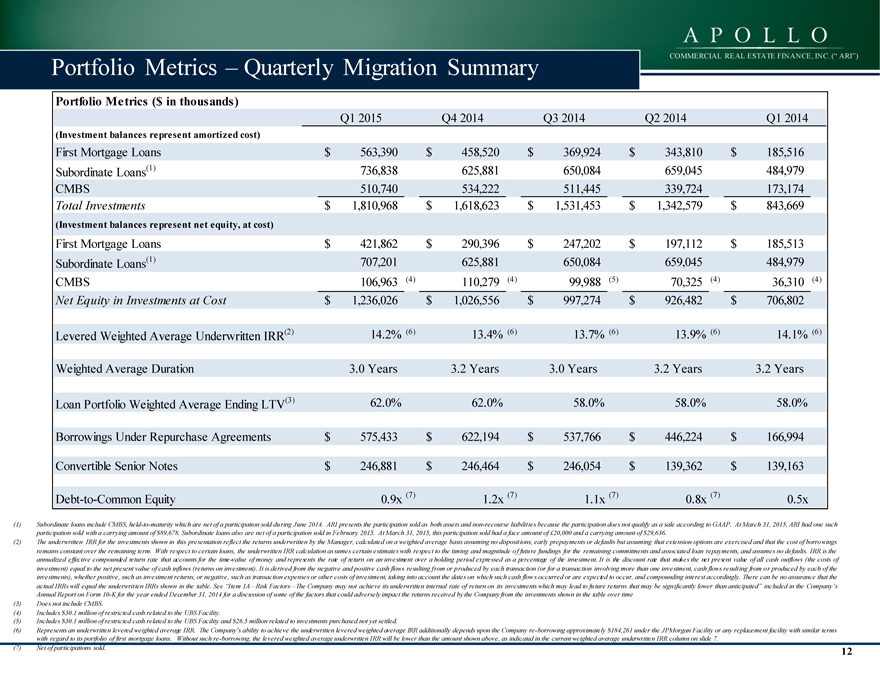
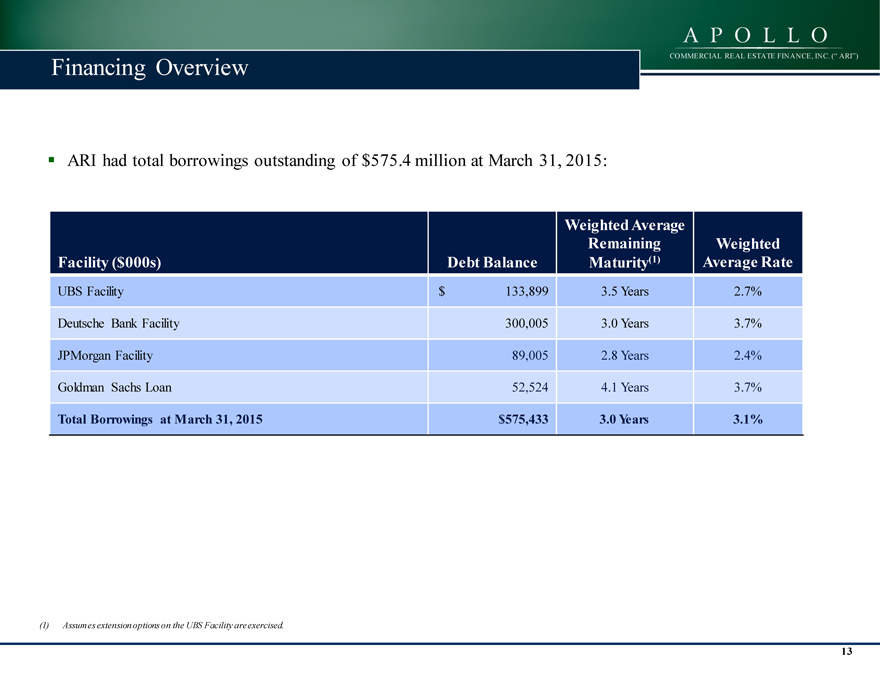
| • | Generated $28.6 million of net interest income from the Company’s $1.8 billion commercial real estate debt portfolio, which had a levered weighted average underwritten internal rate of return (“IRR”) of approximately 14.2% at March 31, 2015; |
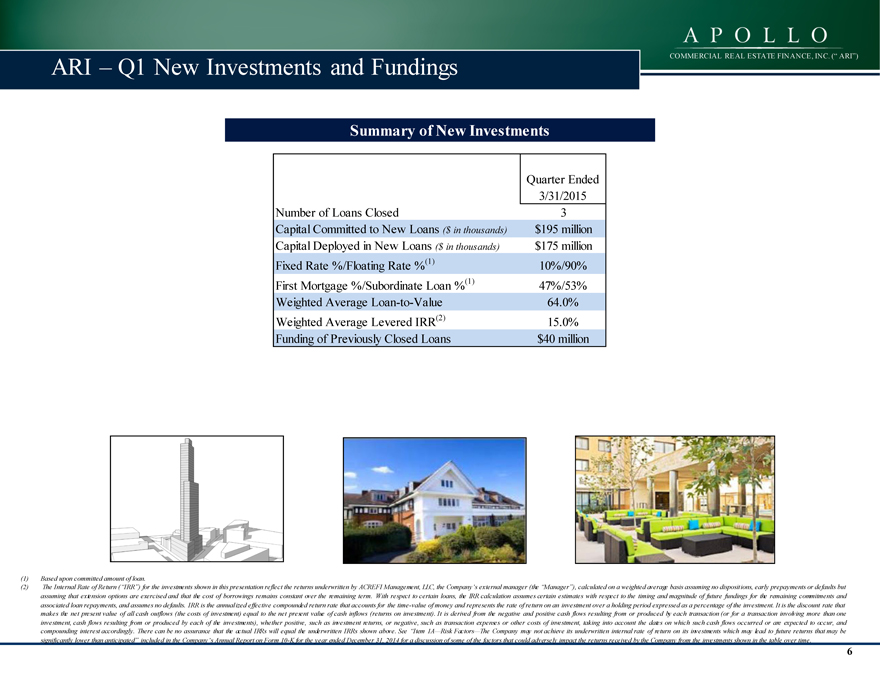
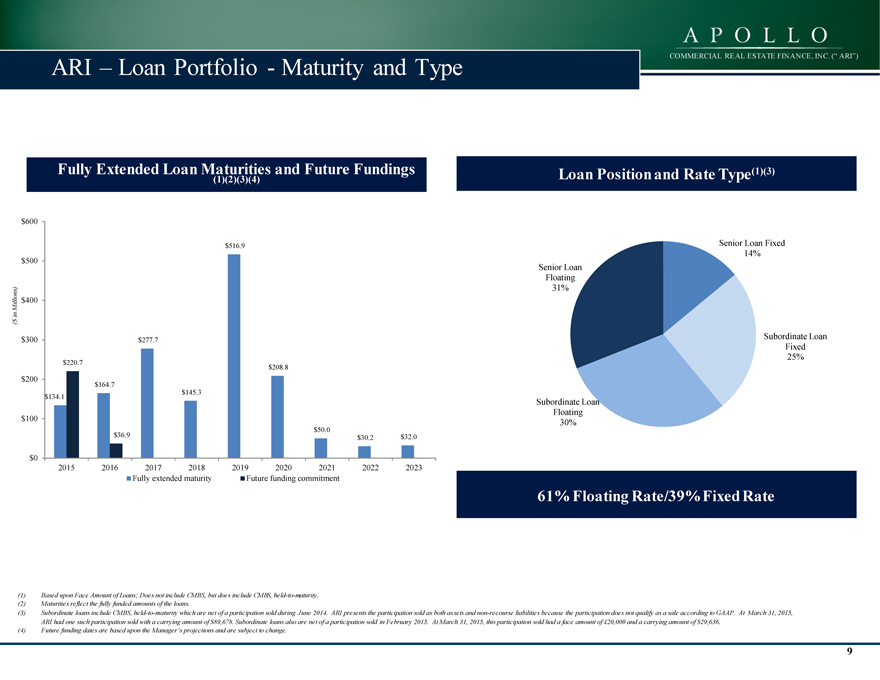
| • | Completed $195.2 million of commercial real estate first mortgage and mezzanine loan transactions, $175.2 million of which were funded at closing and 90% of which were floating rate; |
| • | Funded $39.9 million for commercial real estate first mortgage and mezzanine loans that were previously closed in 2014; |
| • | Completed an underwritten public offering of 11.5 million shares of common stock, including the full exercise of the underwriters’ option to purchase additional shares, raising net proceeds of $193.1 million; |
| • | Amended and restated the Company’s master repurchase agreement with JPMorgan Chase Bank, N.A. (the “JPMorgan Facility”) to increase the borrowing capacity to $300 million, lower the interest rate on current balances and extend the maturity and entered into a $52.5 million repurchase agreement with Goldman Sachs Bank USA (the “Goldman Sachs Loan”) secured by certain participation interests in a first mortgage loan; and |
| • | Increased the quarterly dividend per share of common stock by 10% to $0.44 for the quarter ended March 31, 2015. |
“ARI has had a very strong start to 2015 with respect to capital deployment, capital formation and financial performance,” said Stuart Rothstein, Chief Executive Officer and President of the Company. “Year to date, ARI has completed $195.2 million of commercial real estate loan transactions and has funded $39.9 million of transactions that closed in 2014. In addition, ARI successfully completed a common stock offering, which brought the Company’s equity market capitalization over the $1 billion mark and expanded ARI’s main credit facility to increase borrowing capacity. ARI’s pipeline of commercial mortgage loans, both first mortgage and mezzanine, remains robust and the Company continues to benefit from a favorable macro-economic environment for commercial real estate lending.”
First Quarter 2015 Operating Results
The Company reported Operating Earnings of $22.2 million, or $0.44 per diluted share of common stock, for the three months ended March 31, 2015, representing a per share increase of 18.9% as compared to Operating Earnings of $14.0 million, or $0.37 per diluted share of common stock, for the three months ended March 31, 2014. Net income available to common stockholders for the three months ended March 31, 2015 was $23.7 million, or $0.47 per share of common stock, as compared to net income available to common stockholders of $15.7 million, or $0.42 per share of common stock, for the three months ended March 31, 2014.
First Quarter 2015 Investment Activity
New Investments – During the first quarter, ARI completed the following commercial real estate first mortgage and mezzanine loan transactions:
| • | $92.5 million first mortgage loan ($72.6 million of which was funded during the quarter) which was underwritten to generate a levered weighted average IRR of approximately 21%; |
| • | $102.7 million of subordinate loans with a weighted average underwritten IRR of approximately 10%; simultaneously with closing, ARI syndicated a $30.7 million pari passu participation in one of the subordinate loans to a fund managed by affiliates of Apollo Global Management, LLC and retained a $52.0 million participation; and |
| • | $39.9 million of fundings from previously closed loans. |
Quarter End Commercial Real Estate Debt Portfolio Summary
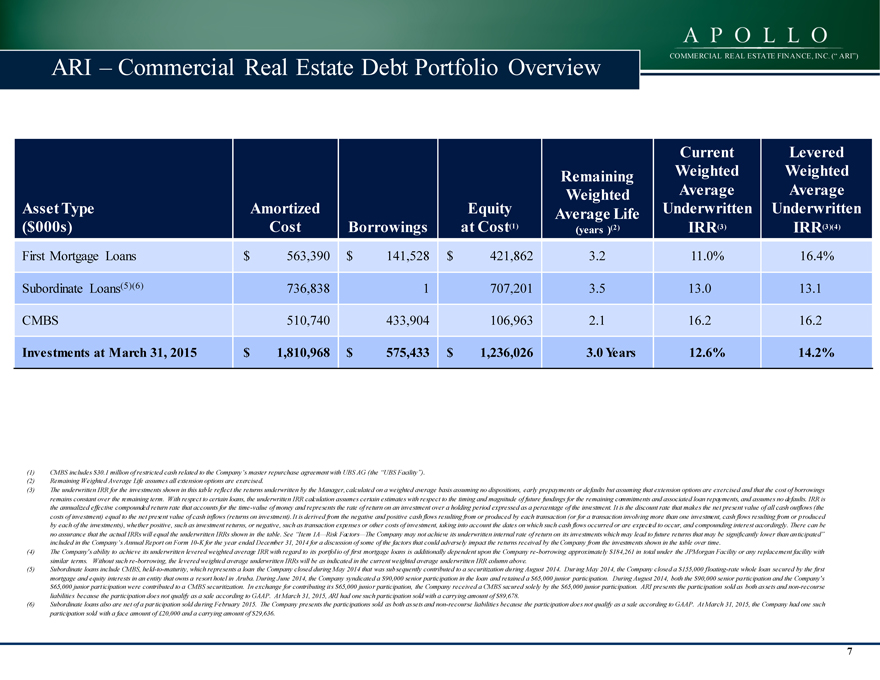
The following table sets forth certain information regarding the Company’s commercial real estate debt portfolio at March 31, 2015 ($ amounts in thousands):
| Description |
Amortized Cost |
Weighted Average Yield |
Debt | Cost of Funds |
Equity at Cost(1) |
Current Weighted Average Underwritten IRR(2) |
Levered Weighted Average Underwritten IRR(2)(3) |
|||||||||||||||||||||
| First mortgage loans |
$ | 563,390 | 8.6 | % | $ | 141,528 | 2.9 | % | $ | 421,862 | 11.0 | % | 16.4 | % | ||||||||||||||
| Subordinate loans(4)(5) |
736,838 | 11.7 | 1 | 3.7 | 707,201 | 13.0 | 13.1 | |||||||||||||||||||||
| CMBS |
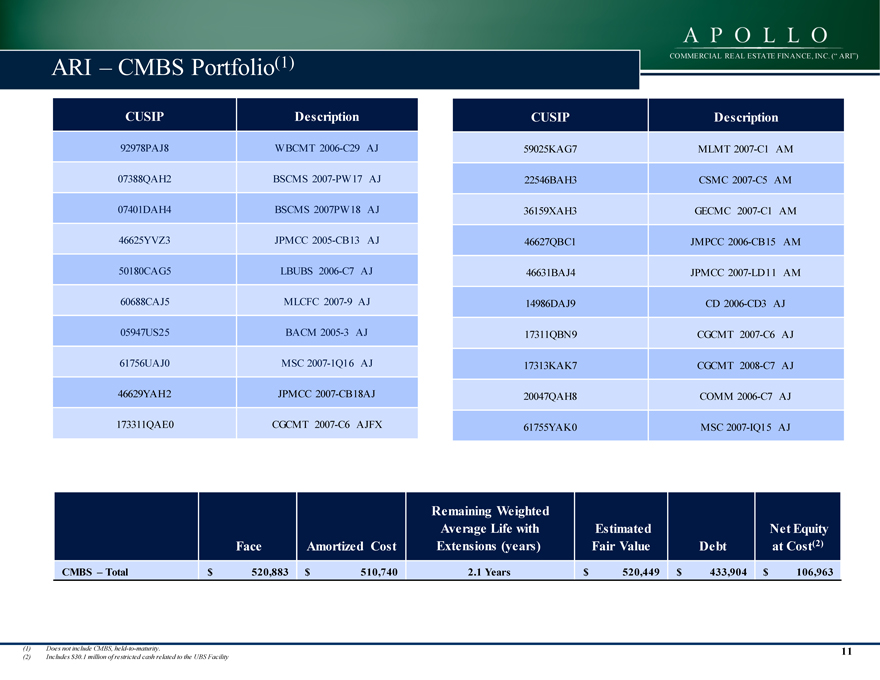
510,740 | 6.5 | 433,904 | 3.4 | 106,963 | 16.2 | 16.2 | |||||||||||||||||||||
|
|
|
|
|
|
|
|
|
|
|
|
|
|
|
|||||||||||||||
| Total/Weighted Average |
$ | 1,810,968 | 9.3 | % | $ | 575,433 | 3.1 | % | $ | 1,236,026 | 12.6 | % | 14.2 | % | ||||||||||||||
|
|
|
|
|
|
|
|
|
|
|
|
|
|
|
|||||||||||||||
Please see chart footnotes at the end of the press release.
Loan-to-Value
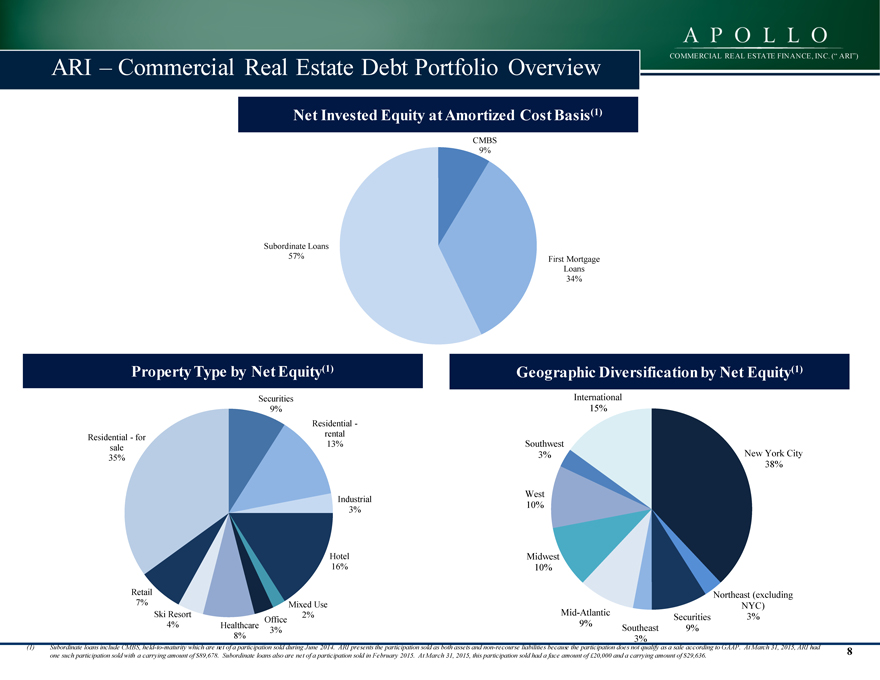
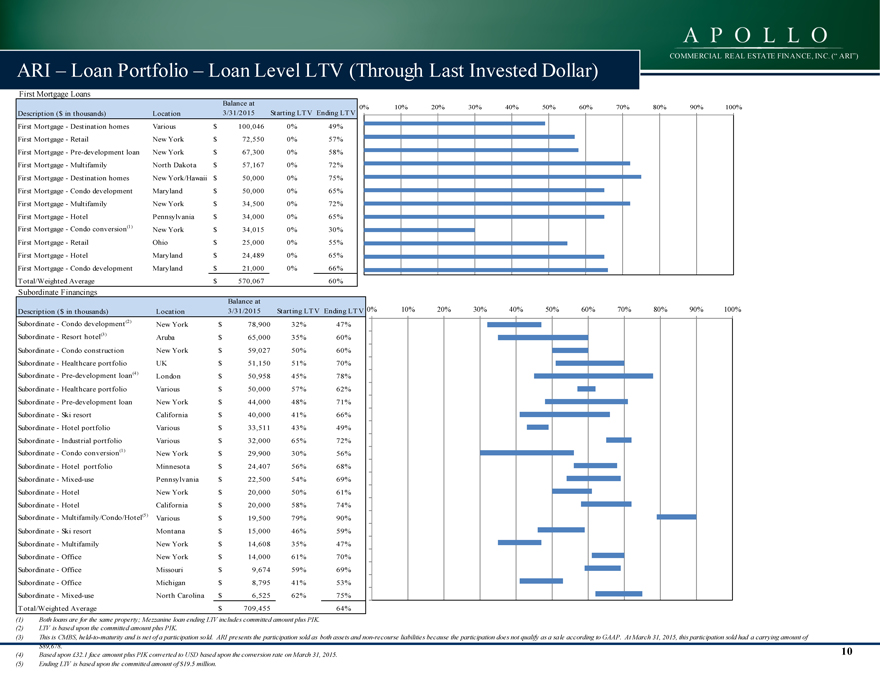
At March 31, 2015, the Company’s commercial real estate loan portfolio, which includes CMBS, held-to-maturity, had a weighted average LTV of 62%. Within the commercial real estate loan portfolio, the first mortgage loans had a weighted average LTV of 60% and the subordinate loans (including CMBS, held-to-maturity) had a weighted average LTV of 64%.
Book Value
The Company’s book value per share of common stock at March 31, 2015 was $16.44 as compared to $16.39 at December 31, 2014. For purposes of GAAP accounting, the Company carries loans at amortized cost and its CMBS are marked to market. Management has estimated that the fair value of the Company’s loan portfolio at March 31, 2015 was approximately $9.9 million greater than the carrying value as of the same date.
Capital Markets Activities
During the first quarter of 2015, ARI completed the following capital markets activities:
| • | Common Stock Offering – ARI completed a public offering of 11.5 million shares of common stock, including the full exercise of the underwriters’ option to purchase additional shares, raising net proceeds of $193.1 million; |
| • | JP Morgan Facility – ARI amended and restated the JPMorgan Facility to increase the borrowing capacity from $175.0 million to $300.0 million. In addition, the JPMorgan Facility now has a two-year term plus a one-year extension option and the interest rate spread ranges from LIBOR + 2.25% to LIBOR + 4.75% depending on the collateral pledged, which may include mortgage and mezzanine loans secured by properties located in the United States, England or Wales; and |
| • | Goldman Sachs Loan – ARI entered into the $52.5 million Goldman Sachs Loan. The Goldman Sachs Loan bears interest at LIBOR + 3.5% and is secured by certain participation interests in a first mortgage loan secured by a portfolio of international destination homes. The maturity date on the Goldman Sachs Loan is the earlier of April 30, 2019 or the repayment or sale of the purchased loan. |
2
Subsequent Events
New Investments – Subsequent to quarter end, ARI completed $8.0 million of fundings from previously closed loans.
Loan Repayments – Subsequent to quarter end, ARI received a $24.6 million principal repayment from a first mortgage loan secured by a hotel in Silver Springs, Maryland.
Dividend – ARI’s Board of Directors declared a dividend of $0.44 per share of common stock, which is payable on July 15, 2015 to common stockholders of record on June 30, 2015.
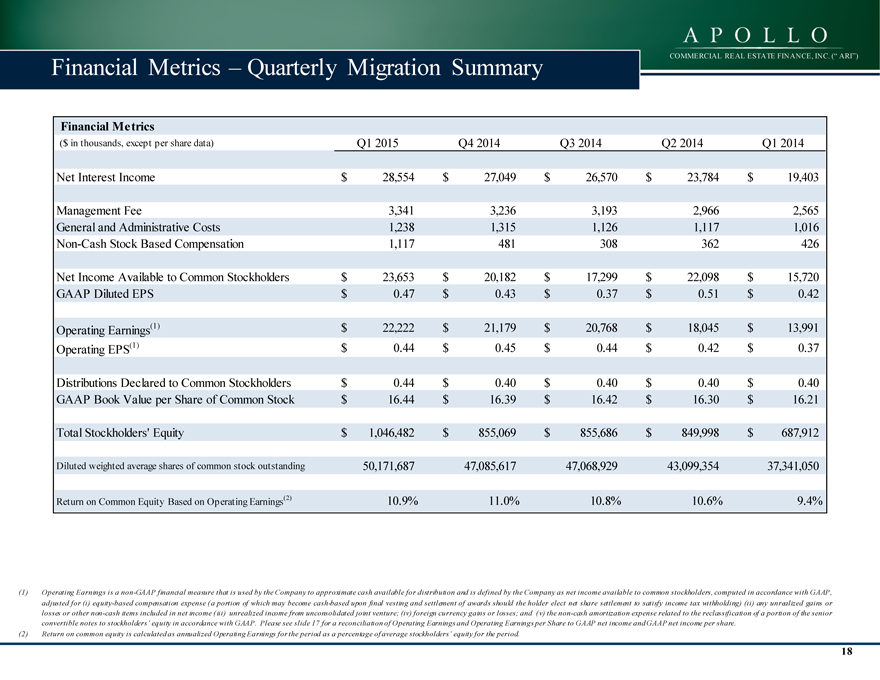
Definition of Operating Earnings
Operating Earnings is a non-GAAP financial measure that is used by the Company to approximate cash available for distribution and is defined by the Company as net income available to common stockholders, computed in accordance with GAAP, adjusted for (i) equity-based compensation expense (a portion of which may become cash-based upon final vesting and settlement of awards should the holder elect net share settlement to satisfy income tax withholding); (ii) any unrealized gains or losses or other non-cash items included in net income available to common stockholders; (iii) unrealized income from unconsolidated joint ventures; (iv) foreign currency gains/(losses) and (v) the non-cash amortization expense related to the reclassification of a portion of the convertible senior notes to stockholders’ equity in accordance with GAAP.
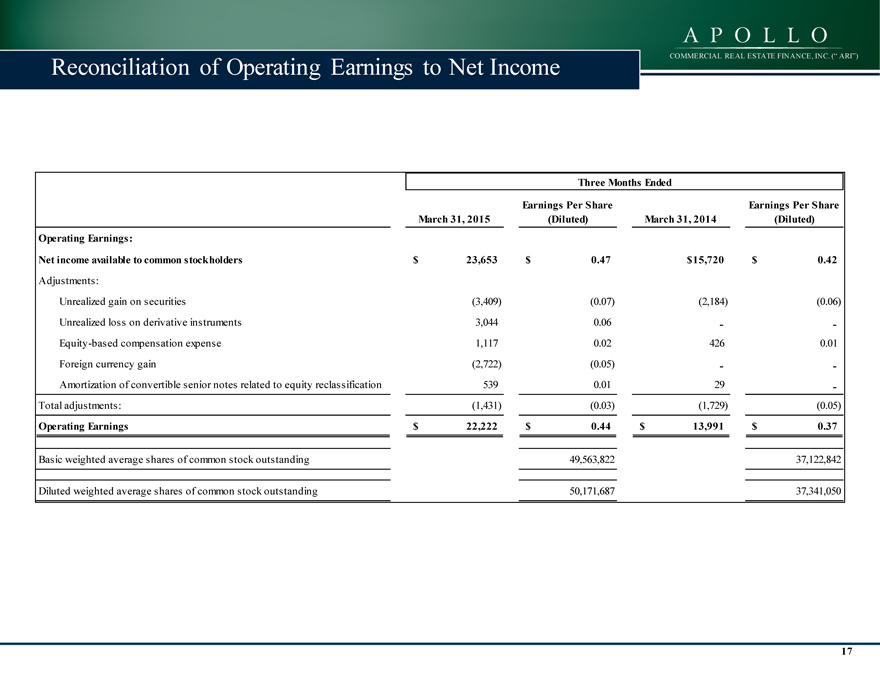
Reconciliation of Operating Earnings to Net Income Available to Common Stockholders
The tables below reconcile Operating Earnings and Operating Earnings per share of common stock with net income available to common stockholders and net income available to common stockholders per share of common stock for the three month periods ended March 31, 2015 and March 31, 2014 ($ amounts in thousands, except share and per share data):
| Three Months Ended March 31, 2015 |
Earnings Per Share (Diluted) |
Three Months Ended March 31, 2014 |
Earnings Per Share (Diluted) |
|||||||||||||
| Operating Earnings: |
||||||||||||||||
| Net income available to common stockholders |
$ | 23,653 | $ | 0.47 | $ | 15,720 | $ | 0.42 | ||||||||
| Adjustments: |
||||||||||||||||
| Unrealized gain on securities |
(3,409 | ) | (0.07 | ) | (2,184 | ) | (0.06 | ) | ||||||||
| Unrealized loss on derivative instruments |
3,044 | 0.06 | — | — | ||||||||||||
| Equity-based compensation expense |
1,117 | 0.02 | 426 | 0.01 | ||||||||||||
| Foreign currency gain |
(2,722 | ) | (0.05 | ) | — | — | ||||||||||
| Amortization of convertible senior notes related to equity reclassification |
539 | 0.01 | 29 | — | ||||||||||||
|
|
|
|
|
|
|
|
|
|||||||||
| Total adjustments: |
(1,431 | ) | (0.03 | ) | (1,729 | ) | (0.05 | ) | ||||||||
|
|
|
|
|
|
|
|
|
|||||||||
| Operating Earnings |
$ | 22,222 | $ | 0.44 | $ | 13,991 | $ | 0.37 | ||||||||
|
|
|
|
|
|
|
|
|
|||||||||
| Basic weighted average shares of common stock outstanding: |
49,563,822 | 37,122,842 | ||||||||||||||
| Diluted weighted average shares of common stock outstanding: |
50,171,687 | 37,341,050 | ||||||||||||||
Teleconference Details:
The Company will host a conference call to discuss its financial results on Wednesday, April 29, 2015 at 11:00 a.m. Eastern Time. Members of the public who are interested in participating in the Company’s first quarter 2015 earnings teleconference call should dial from the U.S., (877) 331-6553, or from outside the U.S., (760) 666-3769,
3
shortly before 11:00 a.m. and reference the Apollo Commercial Real Estate Finance, Inc. Teleconference Call (number 21408595). Please note the teleconference call will be available for replay beginning at 1:00 p.m. on Wednesday, April 29, 2015, and ending at midnight on Wednesday, May 6, 2015. To access the replay, callers from the U.S. should dial (855) 859-2056 and callers from outside the U.S. should dial (404) 537-3406, and enter conference identification number 21408595.
Webcast:
The conference call will also be available on the Company’s website at www.apolloreit.com. To listen to a live broadcast, please go to the site at least 15 minutes prior to the scheduled start time in order to register, download and install any necessary audio software. A replay of the call will also be available for 30 days on the Company’s website.
Supplemental Information
The Company provides supplemental financial information to offer more transparency into its results and make its reporting more informative and easier to follow. The supplemental financial information is available in the investor relations section of the Company’s website at www.apolloreit.com.
About Apollo Commercial Real Estate Finance, Inc.
Apollo Commercial Real Estate Finance, Inc. (NYSE: ARI) is a real estate investment trust that primarily originates, acquires, invests in and manages performing commercial real estate mortgage loans, subordinate financings, CMBS and other commercial real estate-related debt investments. The Company is externally managed and advised by ACREFI Management, LLC, a Delaware limited liability company and an indirect subsidiary of Apollo Global Management, LLC, a leading global alternative investment manager with approximately $160 billion of assets under management at December 31, 2014.
Additional information can be found on the Company’s website at www.apolloreit.com.
Dividend Reinvestment Plan
The Company adopted a Direct Stock Purchase and Dividend Reinvestment Plan (the “Plan”). The Plan provides new investors and existing holders of the Company’s common stock with a convenient and economical method to purchase shares of its common stock. By participating in the Plan, participants may purchase additional shares of the Company’s common stock by reinvesting some or all of the cash dividends received on their shares of the Company’s common stock. In addition, the Plan permits participants to make optional cash investments of up to $10,000 per month, and, with the Company’s prior approval, optional cash investments in excess of $10,000 per month, for the purchase of additional shares of the Company’s common stock.
The Plan is administered by a division of Wells Fargo Bank, N.A. (“Wells”). Stockholders and other persons may obtain a copy of the Plan prospectus and an enrollment form by contacting Wells at (800) 468-9716 or (651) 450-4064, if outside the United States, or visiting Wells’ website at www.shareowneronline.com.
This communication does not constitute an offer to sell or the solicitation of an offer to buy securities.
Forward-Looking Statements
Certain statements contained in this press release constitute forward-looking statements as such term is defined in Section 27A of the Securities Act of 1933, as amended, and Section 21E of the Securities Exchange Act of 1934, as amended, and such statements are intended to be covered by the safe harbor provided by the same. Forward-looking statements are subject to substantial risks and uncertainties, many of which are difficult to predict and are generally beyond the Company’s control. These forward-looking statements include information about possible or assumed future results of the Company’s business, financial condition, liquidity, results of operations, plans and objectives. When used in this release, the words believe, expect, anticipate, estimate, plan, continue, intend, should, may or similar expressions, are intended to identify forward-looking statements. Statements regarding the following subjects, among others, may be forward-looking: the return on equity; the yield on investments; the ability to borrow to finance assets; the Company’s ability to deploy the proceeds of its capital raises or acquire its target assets; and risks associated with investing in real estate assets, including changes in business conditions and the general economy. For a further list and description of such risks and uncertainties, see the reports filed by the Company with the Securities and Exchange Commission. The forward-looking statements, and other risks, uncertainties and factors are based on the Company’s beliefs, assumptions and expectations of its future performance, taking into account all information currently available to the Company. Forward-looking statements are not predictions of future events. The Company disclaims any intention or obligation to update or revise any forward-looking statements, whether as a result of new information, future events or otherwise, except as required by law.
4
Footnotes
(1) CMBS includes $30,127 of restricted cash related to the Company’s repurchase facility with UBS AG.
(2) The underwritten IRR for the investments shown in the above table and elsewhere in this press release reflect the returns underwritten by ACREFI Management, LLC, the Company’s external manager, calculated on a weighted average basis assuming no dispositions, early prepayments or defaults but assuming that extension options are exercised and that the cost of borrowings remains constant over the remaining term. With respect to certain loans, the underwritten IRR calculation assumes certain estimates with respect to the timing and magnitude of future fundings for the remaining commitments and associated loan repayments, and assumes no defaults. IRR is the annualized effective compounded return rate that accounts for the time-value of money and represents the rate of return on an investment over a holding period expressed as a percentage of the investment. It is the discount rate that makes the net present value of all cash outflows (the costs of investment) equal to the net present value of cash inflows (returns on investment). It is derived from the negative and positive cash flows resulting from or produced by each transaction (or for a transaction involving more than one investment, cash flows resulting from or produced by each of the investments), whether positive, such as investment returns, or negative, such as transaction expenses or other costs of investment, taking into account the dates on which such cash flows occurred or are expected to occur, and compounding interest accordingly. There can be no assurance that the actual IRRs will equal the underwritten IRRs shown in the table. See “Item 1A—Risk Factors—The Company may not achieve its underwritten internal rate of return on its investments which may lead to future returns that may be significantly lower than anticipated” included in the Company’s Annual Report on Form 10-K for the year ended December 31, 2014 for a discussion of some of the factors that could adversely impact the returns received by the Company from the investments shown in the table over time.
(3) The Company’s ability to achieve its underwritten levered weighted average IRR with regard to its portfolio of first mortgage loans is additionally dependent upon the Company utilizing the JPMorgan Facility or any replacement facility with similar terms and re-borrowing approximately $184,261 in total. Without such re-borrowing, the levered weighted average underwritten IRRs will be as indicated in the current weighted average underwritten IRR column above.
(4) Subordinate loans include CMBS, held-to-maturity, which represents a loan the Company closed during May 2014 that was subsequently contributed to a securitization during August 2014. During May 2014, the Company closed a $155,000 floating-rate whole loan secured by the first mortgage and equity interests in an entity that owns a resort hotel in Aruba. During June 2014, the Company syndicated a $90,000 senior participation in the loan and retained a $65,000 junior participation. During August 2014, both the $90,000 senior participation and the Company’s $65,000 junior participation were contributed to a CMBS securitization. In exchange for contributing its $65,000 junior participation, the Company received a CMBS secured solely by the $65,000 junior participation. ARI presents the participation sold as both assets and non-recourse liabilities because the participation does not qualify as a sale according to GAAP. At March 31, 2015, ARI had one such participation sold with a carrying amount of $89,678.
(5) Subordinate loans also are net of a participation sold during February 2015. The Company presents the participation sold as both assets and non-recourse liabilities because the participation does not qualify as a sale according to GAAP. At March 31, 2015, the Company had one such participation sold with a face amount of £20,000 and a carrying amount of $29,636.
5
Apollo Commercial Real Estate Finance, Inc. and Consolidated Subsidiaries
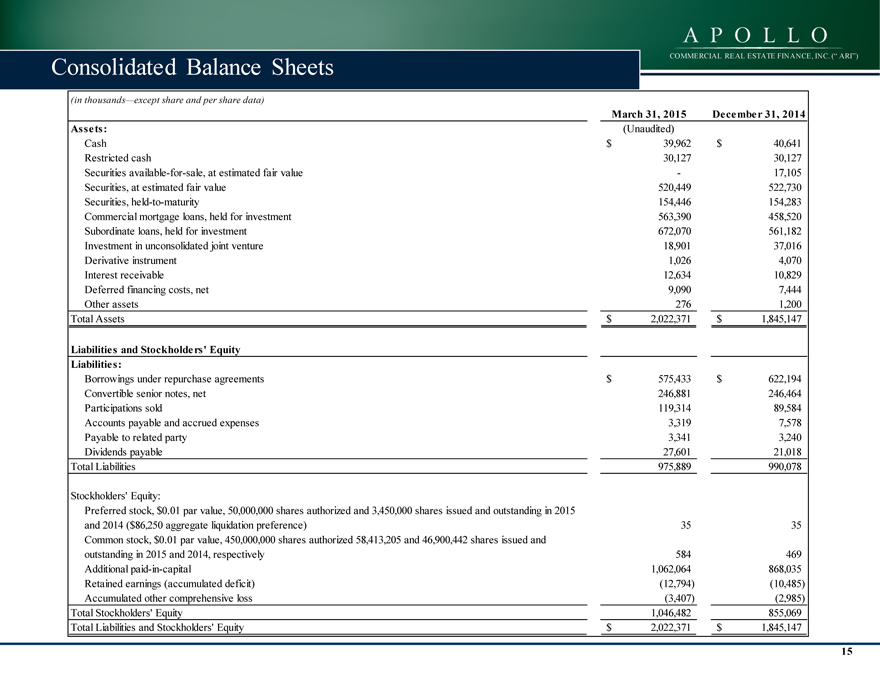
Condensed Consolidated Balance Sheets
(in thousands—except share and per share data)
| March 31, 2015 | December 31, 2014 | |||||||
| (Unaudited) | ||||||||
| Assets: |
||||||||
| Cash |
$ | 39,962 | $ | 40,641 | ||||
| Restricted cash |
30,127 | 30,127 | ||||||
| Securities available-for-sale, at estimated fair value |
— | 17,105 | ||||||
| Securities, at estimated fair value |
520,449 | 522,730 | ||||||
| Securities, held-to-maturity |
154,446 | 154,283 | ||||||
| Commercial mortgage loans, held for investment |
563,390 | 458,520 | ||||||
| Subordinate loans, held for investment |
672,070 | 561,182 | ||||||
| Investment in unconsolidated joint venture |
18,901 | 37,016 | ||||||
| Derivative instrument |
1,026 | 4,070 | ||||||
| Interest receivable |
12,634 | 10,829 | ||||||
| Deferred financing costs, net |
9,090 | 7,444 | ||||||
| Other assets |
276 | 1,200 | ||||||
|
|
|
|
|
|||||
| Total Assets |
$ | 2,022,371 | $ | 1,845,147 | ||||
|
|
|
|
|
|||||
| Liabilities and Stockholders’ Equity |
||||||||
| Liabilities: |
||||||||
| Borrowings under repurchase agreements |
$ | 575,433 | $ | 622,194 | ||||
| Convertible senior notes, net |
246,881 | 246,464 | ||||||
| Participations sold |
119,314 | 89,584 | ||||||
| Accounts payable and accrued expenses |
3,319 | 7,578 | ||||||
| Payable to related party |
3,341 | 3,240 | ||||||
| Dividends payable |
27,601 | 21,018 | ||||||
|
|
|
|
|
|||||
| Total Liabilities |
975,889 | 990,078 | ||||||
| Stockholders’ Equity: |
||||||||
| Preferred stock, $0.01 par value, 50,000,000 shares authorized and 3,450,000 shares issued and outstanding in 2015 and 2014 ($86,250 aggregate liquidation preference) |
35 | 35 | ||||||
| Common stock, $0.01 par value, 450,000,000 shares authorized, 58,413,205 and 46,900,442 shares issued and outstanding in 2015 and 2014, respectively |
584 | 469 | ||||||
| Additional paid-in-capital |
1,062,064 | 868,035 | ||||||
| Retained earnings (accumulated deficit) |
(12,794 | ) | (10,485 | ) | ||||
| Accumulated other comprehensive loss |
(3,407 | ) | (2,985 | ) | ||||
|
|
|
|
|
|||||
| Total Stockholders’ Equity |
1,046,482 | 855,069 | ||||||
|
|
|
|
|
|||||
| Total Liabilities and Stockholders’ Equity |
$ | 2,022,371 | $ | 1,845,147 | ||||
|
|
|
|
|
|||||
6
Apollo Commercial Real Estate Finance, Inc. and Consolidated Subsidiaries
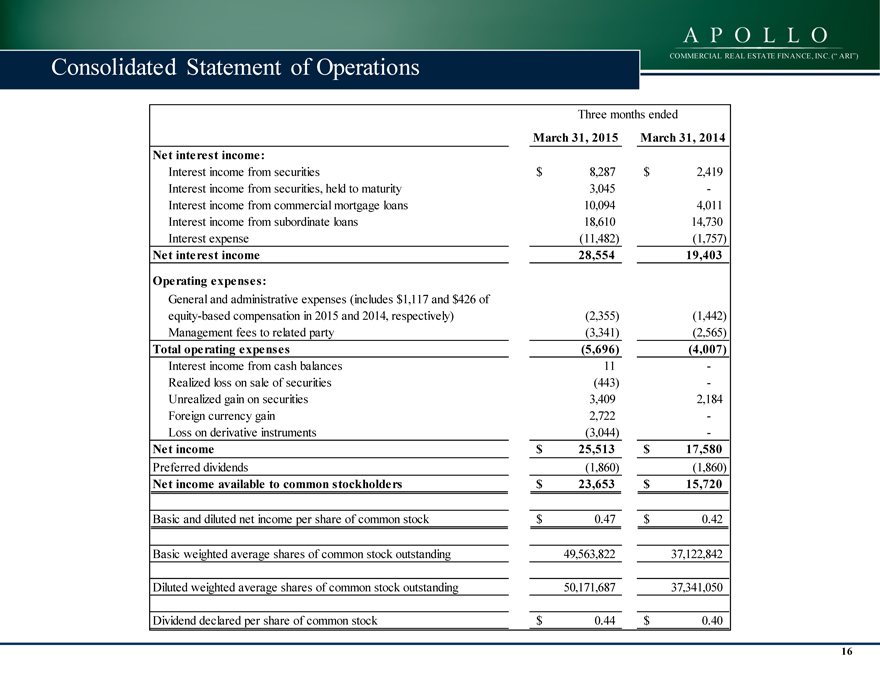
Condensed Consolidated Statement of Operations
(in thousands—except share and per share data)
| Three months ended March 31, 2015 |
Three months ended March 31, 2014 |
|||||||
| (Unaudited) | (Unaudited) | |||||||
| Net interest income: |
||||||||
| Interest income from securities |
$ | 8,287 | $ | 2,419 | ||||
| Interest income from securities, held to maturity |
3,045 | — | ||||||
| Interest income from commercial mortgage loans |
10,094 | 4,011 | ||||||
| Interest income from subordinate loans |
18,610 | 14,730 | ||||||
| Interest expense |
(11,482 | ) | (1,757 | ) | ||||
|
|
|
|
|
|||||
| Net interest income |
28,554 | 19,403 | ||||||
| Operating expenses: |
||||||||
| General and administrative expenses (includes $1,117 and $426 of equity-based compensation in 2015 and 2014, respectively) |
(2,355 | ) | (1,442 | ) | ||||
| Management fees to related party |
(3,341 | ) | (2,565 | ) | ||||
|
|
|
|
|
|||||
| Total operating expenses |
(5,696 | ) | (4,007 | ) | ||||
| Interest income from cash balances |
11 | — | ||||||
| Realized loss on sale of securities |
(443 | ) | — | |||||
| Unrealized gain on securities |
3,409 | 2,184 | ||||||
| Foreign currency gain |
2,722 | — | ||||||
| Loss on derivative instruments |
(3,044 | ) | — | |||||
|
|
|
|
|
|||||
| Net income |
25,513 | 17,580 | ||||||
|
|
|
|
|
|||||
| Preferred dividends |
(1,860 | ) | (1,860 | ) | ||||
|
|
|
|
|
|||||
| Net income available to common stockholders |
$ | 23,653 | $ | 15,720 | ||||
|
|
|
|
|
|||||
| Basic and diluted net income per share of common stock |
$ | 0.47 | $ | 0.42 | ||||
|
|
|
|
|
|||||
| Basic weighted average shares of common stock outstanding |
49,563,822 | 37,122,842 | ||||||
|
|
|
|
|
|||||
| Diluted weighted average shares of common stock outstanding |
50,171,687 | 37,341,050 | ||||||
|
|
|
|
|
|||||
| Dividend declared per share of common stock |
$ | 0.44 | $ | 0.40 | ||||
|
|
|
|
|
|||||
7