Exhibit 99.1

NEWS RELEASE
Toronto, August 8, 2023
(in U.S. dollars unless otherwise noted)
Franco-Nevada Reports Q2 2023 Results
Improved performance from core precious metal assets
“Our portfolio continues to generate strong cash flows and high margins. The second quarter’s results benefited from our core assets returning to normal production and deliveries caught up from the disruptions in Q1. Revenue from our Diversified assets was impacted by lower oil, gas and iron ore prices compared to the relative highs of the prior year period” stated Paul Brink, CEO. “We expect Total GEOs for the year to be at the low end of our guidance range provided in March this year. We are looking forward to increased contributions from Cobre Panama, where the CP100 Expansion is on-track for year-end, and to contributions from royalties on several new mines. Franco-Nevada is debt-free and is growing its cash balances.”
| | | | Q2 2023 | | | | | H1 2023 | |
| | Q2 results | | vs | | | H1 results | | vs | |
| | | | Q2 2022 | | | | | H1 2022 | |
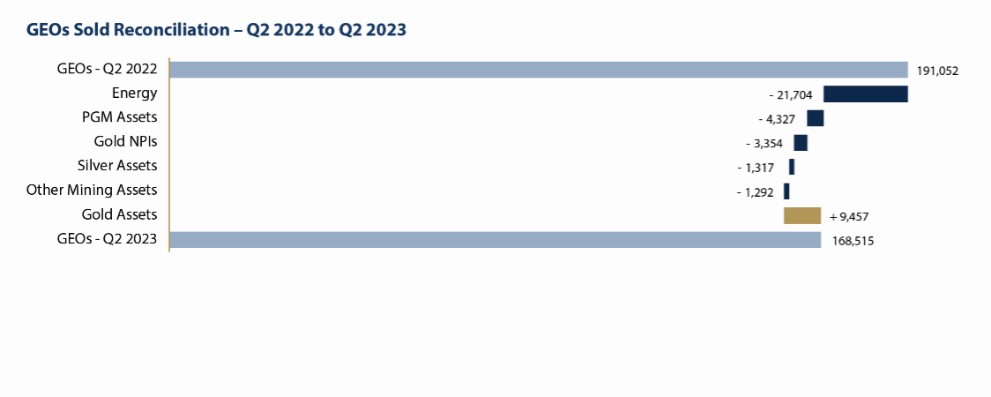
Total GEOs1 sold (including Energy) | | 168,515 GEOs | | -12% | | | 313,846 GEOs | | -15% | |
Precious Metal GEOs1 sold | | 132,033 GEOs | | +0.3% | | | 243,271 GEOs | | -7% | |
Revenue | | $329.9 million | | -6% | | | $606.2 million | | -12% | |
Net income | | $184.5 million ($0.96/share) | | -6% | | | $341.0 million ($1.78/share) | | -10% | |
Adjusted Net Income2 | | $182.9 million ($0.95/share) | | -7% | | | $335.1 million ($1.75/share) | | -10% | |
Adjusted EBITDA2 | | $275.6 million ($1.44/share) | | -8% | | | $505.0 million ($2.63/share) | | -14% | |
Adjusted EBITDA Margin2 | | 83.5% | | -2.3% | | | 83.3% | | -2.1% | |
Strong Financial Position
| ● | No debt and $2.3 billion in available capital as at June 30, 2023 |
| ● | Generated $261.9 million in operating cash flow during the quarter |
| ● | 16 consecutive annual dividend increases. Quarterly dividend of $0.34/share |
| ● | Global 50 Top Rated and #1 gold company by Sustainalytics, AA by MSCI and Prime by ISS ESG |
| ● | Committed to the World Gold Council’s Responsible Gold Mining Principles |
| ● | Partnering with our operators on community and ESG initiatives |
| ● | Goal of 40% diverse representation at the Board and top leadership levels as a group by 2025 |
Diverse, Long-Life Portfolio
| ● | Most diverse royalty and streaming portfolio by asset, operator and country |
| ● | Core precious metal streams on world-class copper assets outperforming acquisition expectations |
| ● | Long-life reserves and resources |
Growth and Optionality
| ● | Mine expansions and new mines driving 5-year growth profile |
| ● | Long-term optionality in gold, copper and nickel and exposure to some of the world’s great mineral endowments |
| ● | Strong pipeline of precious metal opportunities |
Quarterly revenue and GEOs sold by commodity | | | | ||||||||
| | Q2 2023 | | Q2 2022 | | ||||||
|
| GEOs Sold |
| Revenue |
| GEOs Sold |
| Revenue |
| ||
| | # | | (in millions) | | # |
| (in millions) | | ||
PRECIOUS METALS | | | | | | | | | | | |
Gold | | 108,817 | | $ | 213.9 |
| 102,714 | | $ | 190.7 | |
Silver | | 18,139 | | | 35.4 |
| 19,456 | | | 35.8 |
|
PGM | | 5,077 | | | 9.9 |
| 9,404 | | | 17.3 |
|
| | 132,033 | | $ | 259.2 |
| 131,574 | | $ | 243.8 |
|
DIVERSIFIED | | | | | | | | | | | |
Iron ore | | 5,108 | | $ | 10.1 |
| 7,769 | | $ | 14.6 |
|
Other mining assets | | 2,691 | | | 5.1 |
| 1,322 | | | 2.4 |
|
Oil | | 19,751 | | | 36.9 |
| 25,342 | | | 46.2 |
|
Gas | | 6,583 | | | 14.2 |
| 20,939 | | | 37.9 |
|
NGL | | 2,349 | | | 4.4 |
| 4,106 | | | 7.4 |
|
| | 36,482 | | $ | 70.7 |
| 59,478 | | $ | 108.5 |
|
| | 168,515 | | $ | 329.9 |
| 191,052 | | $ | 352.3 |
|
H1 revenue and GEOs sold by commodity | | | | ||||||||
| | H1 2023 | | H1 2022 | | ||||||
|
| GEOs Sold |
| Revenue |
| GEOs Sold |
| Revenue |
| ||
| | # | | (in millions) | | # |
| (in millions) | | ||
PRECIOUS METALS | | | | | | | | | | | |
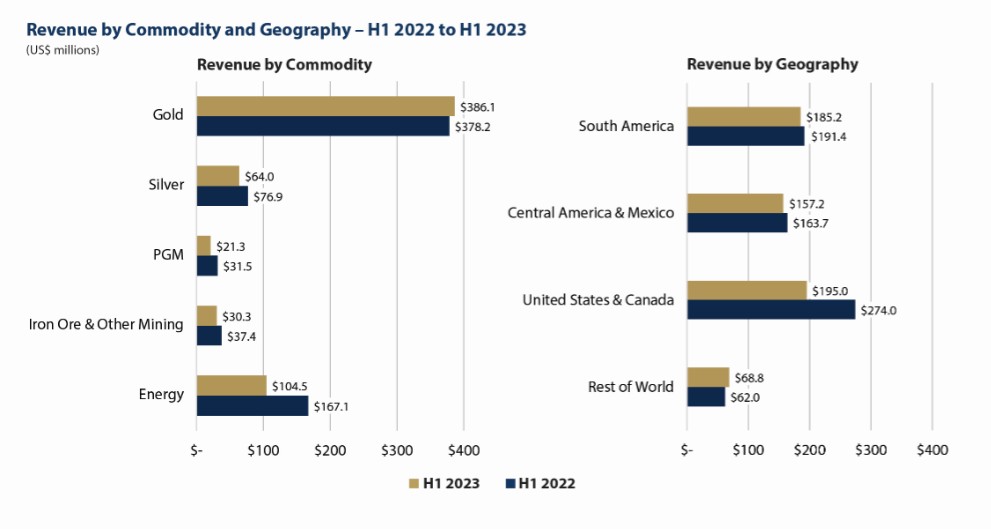
Gold | | 199,539 | | $ | 386.1 |
| 202,545 | | $ | 378.2 |
|
Silver | | 32,952 | | | 64.0 |
| 40,857 | | | 76.9 |
|
PGM | | 10,780 | | | 21.3 |
| 16,799 | | | 31.5 |
|
| | 243,271 | | $ | 471.4 |
| 260,201 | | $ | 486.6 |
|
DIVERSIFIED | | | | | | | | | | |
|
Iron ore | | 12,182 | | $ | 23.2 | | 18,262 | | $ | 33.9 | |
Other mining assets | | 3,758 | | | 7.1 |
| 1,885 | | | 3.5 |
|
Oil | | 33,921 | | | 64.0 |
| 45,518 | | | 85.2 |
|
Gas | | 15,701 | | | 31.1 |
| 36,081 | | | 67.4 |
|
NGL | | 5,013 | | | 9.4 |
| 7,719 | | | 14.5 |
|
| | 70,575 | | $ | 134.8 | | 109,465 | | $ | 204.5 | |
| | 313,846 | | $ | 606.2 |
| 369,666 | | $ | 691.1 |
|
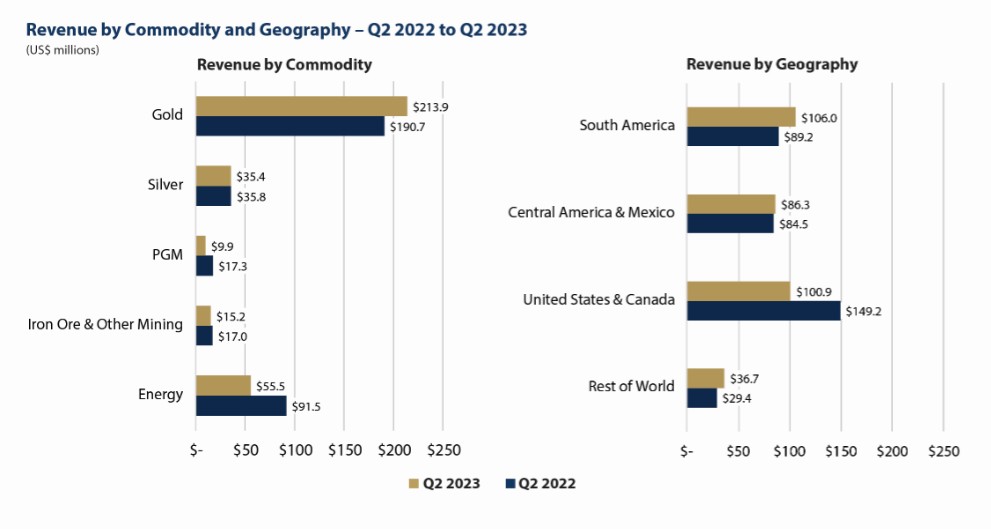
In Q2 2023, we earned $329.9 million in revenue, down 6.4% from Q2 2022, as the impact of lower commodity prices for our Diversified assets more than offset the increase in revenue from our Precious Metal assets. With Cobre Panama and Antapaccay operating at full production levels following the temporary disruptions in early 2023, both assets generated strong deliveries in Q2 2023. Partly offsetting the impact of lower oil and gas prices, during the quarter, we received catch-up royalty payments of approximately $7.0 million related to new wells primarily at our Permian interests, which are not expected to reoccur.
Precious Metal revenue accounted for 78.6% of our revenue (64.8% gold, 10.7% silver, 3.1% PGM). Revenue was sourced 88.9% from the Americas (32.1% South America, 26.2% Central America & Mexico, 17.5% U.S. and 13.1% Canada).
Environmental, Social and Governance (ESG) Updates
During the quarter, we contributed to the Producer Partnership, a Sibanye-Stillwater sponsored initiative which aims to end hunger in Montana, and to the i-80 Fund, which supports small businesses in rural northern Nevada. We also partnered with Perpetua Resources to support social capacity building at the Stibnite Gold Project and made a strategic level partnership commitment to the Canadian Institute of Mining, Metallurgy and Petroleum. We continue to rank highly with leading ESG rating agencies.
2
Portfolio Additions
| ● | Acquisition of Royalty on Pascua-Lama Project – Chile: Subsequent to quarter-end, we agreed to acquire a sliding-scale gold royalty and fixed-rate copper royalty from private individuals pertaining to the Chilean portion of Barrick’s Pascua-Lama project for a purchase price of $75.0 million. At gold prices exceeding $800/ounce, we will hold a 2.70% NSR (gold) and 0.54% NSR (copper) on the property. |
| ● | Acquisition of Additional Royalty Interest on Caserones – Chile: During the six months ended June 30, 2023, we acquired, through two separate transactions, an incremental effective NSR totaling 0.1120% on Lundin Mining’s Caserones copper-molybdenum mine located in Chile for an aggregate purchase price of $9.4 million. Inclusive of our interest of 0.4582% acquired in April 2022, we now hold an 0.57% effective NSR on Caserones. |
| ● | Acquisition Agreement for New Royalties with EMX Royalty Corporation: On June 27, 2023, we executed a binding term sheet with EMX Royalty Corporation for the joint acquisition of newly created precious metals and copper royalties sourced by EMX. Franco-Nevada will contribute 55% (up to $5.5 million) and EMX will contribute 45% (up to $4.5 million) towards the royalty acquisitions, with the resulting royalty interests equally split on a 50/50 basis. |
| ● | Acquisition of Royalties on Exploration Properties – Nevada and Arizona, U.S.: On June 15, 2023, we acquired a portfolio of eight royalties on exploration properties located in the states of Nevada and Arizona, including a 0.5% NSR on Integra Resources’ Wildcat and Mountain View gold projects, for a purchase price of $2.5 million. |
| ● | Acquisition of Additional Royalty on Valentine Gold Project and Private Placement with Marathon Gold Corporation – Newfoundland, Canada: On June 8, 2023, we acquired an additional 1.5% NSR on Marathon’s Valentine Gold project located in Newfoundland for a purchase price of $45.0 million. Inclusive of our initial 1.5% NSR (reduced from 2.0% following Marathon’s buy-back of 0.5% in February 2023), we now hold an aggregate 3.0% NSR on the project. Subsequent to quarter-end, on July 5, 2023, we also acquired 6,578,947 common shares of Marathon at a price of C$0.76 per common share for an aggregate of $3.8 million (C$5.0 million), comprising the back-end of a non-brokered charity flow-through offering. |
| ● | Share Subscription with Gold Candle Ltd.: Subsequent to quarter-end, on July 26, 2023, we completed the previously announced subscription for common shares of Gold Candle, a private company, for an aggregate purchase price of $4.6 million (C$6.0 million). Gold Candle owns the Kerr-Addison project, located in Virginiatown, Ontario, over which we hold a 1% NSR. |
Q2 2023 Portfolio Updates
Precious Metal assets: GEOs sold from our Precious Metal assets were 132,033, compared to 131,574 GEOs in Q2 2022, as operations at Cobre Panama and Antapaccay successfully returned to full production, contributing strong deliveries to Franco-Nevada during the quarter.
South America:
| ● | Antapaccay (gold and silver stream) – GEOs delivered and sold were significantly higher in Q2 2023 compared to Q2 2022. Operations returned to normalized levels in March following the temporary suspension of operations and constrained logistics experienced in early 2023 as a result of political tensions in Peru. In addition, production at Antapaccay during the period benefited from higher copper grades and recoveries based on mine sequencing. Glencore continues to study the Coroccohuayco expansion project at its Antapaccay mine. The Coroccohuayco deposit, located within 10 km of the Antapaccay plant, is currently scoped as an open pit and hosts Measured and Indicated Mineral Resources of 643 million tonnes with a copper grade of 0.60%. |
| ● | Antamina (22.5% silver stream) – GEOs delivered and sold were lower in Q2 2023 compared to Q2 2022, as operations at Antamina were affected by Cyclone Yaku, a tropical cyclone that affected Peru’s northern region in March 2023. The effect of the cyclone carried into April 2023 production and, as a result, we anticipate our deliveries of silver ounces in Q3 2023 to be lower than initially expected. |
| ● | Candelaria (gold and silver stream) – While gold production at Candelaria was lower in Q2 2023 than in the prior year period, our GEOs delivered and sold during the quarter were slightly higher due to the timing of shipments. |
| ● | Tocantinzinho (gold stream) – In Q2 2023, we funded $93.1 million of our $250.0 million stream deposit on the Tocantinzinho project, for a total of $183.8 million disbursed as at June 30, 2023. G Mining Ventures reported that the physical construction of the project was 27% complete as of the end of May 2023 and remains on track for commercial production in H2 2024. |
3
| ● | Salares Norte (1-2% royalty) – Total project completion was 90% as of the end of March 2023 and Gold Fields expects commencement of commercial production in Q4 2023. |
Central America & Mexico:
| ● | Cobre Panama (gold and silver stream) – Operations at Cobre Panama ramped back up to full production in Q2 2023, following an interruption due to export restrictions in Q1 2023. Production for the quarter also benefited from additional processing facilities related to the CP100 Expansion project and we received strong deliveries from Cobre Panama. GEOs delivered and sold in Q2 2023 exceeded those from Q2 2022. Following a public consultation process, the Refreshed Concession Contract was signed by the Government of Panama and First Quantum on June 26, 2023, and is expected to be presented before the National Assembly of Panama during the current legislative term that commenced on July 1, 2023. |
| ● | Guadalupe-Palmarejo (50% gold stream) – GEOs sold from Guadalupe-Palmarejo decreased in Q2 2023 compared to the same quarter in 2022 due to lower production at the mine and a lesser proportion of production being sourced from ground covered by our stream. |
U.S.:
| ● | Stillwater (5% royalty) – Production at the mine was impacted by an incident that damaged shaft infrastructure in March 2023, which was remediated in April 2023. The decrease in GEOs also reflects a less favourable PGM to gold GEO conversion ratio. |
| ● | Marigold (0.5-5% royalties) – Production at Marigold was higher in Q2 2023 compared to Q2 2022 as a result of mine sequencing. In addition, our GEOs earned were higher than in the prior year period primarily due to mining occurring on higher royalty ground. |
| ● | Copper World Project (2.085% royalty) – Hudbay announced a positive permitting update from the Army Corps of Engineers in April 2023 and that the required state level permits continue to be expected in 2023. A pre-feasibility study for Phase I of the Copper World project is expected in 2023. |
Canada:
| ● | Detour Lake (2% royalty) – Agnico Eagle indicated that the mill set a record for quarterly throughput and that the continued focus on mill process optimization and availability is tracking well to reach and potentially exceed throughput of 28.0 million tonnes per annum. Agnico Eagle is expecting to complete an underground mining scenario study in H1 2024. |
| ● | Kirkland Lake (1.5-5.5% royalty & 20% NPI) – Agnico Eagle reported record quarterly mill throughput at the Macassa mine, supported by the new ventilation system and commissioning of Shaft #4. Exploration drilling during the quarter targeted the Main Break and eastern extension of the South Mine Complex. Drilling is also continuing at the AK deposit in 2023 where production could potentially begin in 2024. |
| ● | Canadian Malartic (1.5% royalty) – Agnico Eagle reported that underground development and surface activities at the Odyssey project are progressing well. Drilling activities were focused on infilling the internal zones at the Odyssey South deposit and mineral resource expansion of the East Gouldie deposit to the east and west. |
| ● | Magino (2% royalty) – Argonaut Gold reported that it poured first gold at the Magino mine in June 2023 and that the process plant ramp-up remains on schedule, with commercial production expected in Q3 2023. |
| ● | Island Gold (0.62% royalty) – Alamos Gold reported that the Phase 3+ Expansion is progressing well with the construction of the hoist house largely complete, the headframe well underway, and shaft sinking on track to start in Q4 2023. The Phase 3+ Expansion is expected to more than double gold production to an average of 287,000 ounces per year starting in 2026. |
| ● | Greenstone (Hardrock) (3% royalty) – Equinox Gold reported that construction of the project is on schedule and budget, with construction 83% complete as of the end of June 2023 and first gold pour expected in H1 2024. |
| ● | Valentine Gold (3% royalty) – Construction was 15% complete as of the end of June 2023. Marathon reported that the project remains on schedule for first gold production in Q1 2025. |
4
Rest of World:
| ● | Tasiast (2% royalty) – Production at Tasiast benefited from higher grades, improving recoveries, and increased throughput. Kinross reported that construction and initial commissioning at the Tasiast 24k project are complete. The operation is expected to ramp up for the remainder of the year to consistently achieve 24,000 tonnes per day. |
| ● | Subika (Ahafo) (2% royalty) – Newmont reported it expects to reach higher grade and tonnes mined from the Subika Underground mine, in addition to higher ore tonnes mined and improved grade at the Subika Open Pit. |
| ● | Séguéla (1.2% royalty) – Fortuna Silver Mines reported the Séguéla mine poured first gold in May 2023 and produced 4,023 ounces during the initial ramp-up weeks of Q2 2023. |
| ● | Yandal (Bronzewing) (2% royalty) – Northern Star Resources reported that ore from the Orelia pit was processed for the first time during the quarter as feed for the expanded Thunderbox mill. The Thunderbox mill expansion, which doubles capacity to 6 million tonnes per annum, was completed in December 2022 and commissioning is underway. |
Diversified assets: Our Diversified assets, primarily comprising our Iron Ore and Energy interests, generated $70.7 million in revenue, down from $108.5 million in Q2 2022. The decrease is primarily due to lower oil, gas and iron ore prices compared to the relative highs of the prior year period.
Iron Ore & Other Mining:
| ● | Vale Royalty (iron ore royalty) – Revenue from the Vale royalty decreased compared to Q2 2022 due to lower estimated iron ore prices, as well as lagging sales to production, which are expected to normalize in H2 2023. |
| ● | LIORC – Production at Iron Ore Company of Canada was impacted by a 3.5-week shutdown due to wildfires in Northern Quebec. |
| ● | Caserones (0.57% effective NSR) – Lundin Mining completed the acquisition of a 51% majority interest in Caserones in July 2023. We earned revenue of $2.5 million in Q2 2023, compared to $1.2 million in Q2 2022. |
Energy:
| ● | U.S. (various royalty rates) – Revenue from our U.S. Energy interests decreased compared to Q2 2022, largely due to lower realized oil and gas prices. Partly offsetting the impact of lower prices, we received approximately $7.0 million in royalty payments related to new wells primarily at our Permian assets, which are not expected to reoccur. |
| ● | Canada (various royalty rates) – Revenue from our Canadian Energy interests decreased compared to Q2 2022, also due to the decrease in commodity prices. For our Weyburn NRI, the impact of lower prices was partly offset by lower operating and capital expenditures incurred at the Weyburn Unit. |
Dividend Declaration
Franco-Nevada is pleased to announce that its Board of Directors has declared a quarterly dividend of US$0.34 per share. The dividend will be paid on September 28, 2023 to shareholders of record on September 14, 2023 (the “Record Date”). The dividend has been declared in U.S. dollars and the Canadian dollar equivalent will be determined based on the daily average rate posted by the Bank of Canada on the Record Date. Under Canadian tax legislation, Canadian resident individuals who receive “eligible dividends” are entitled to an enhanced gross-up and dividend tax credit on such dividends.
The Company has a Dividend Reinvestment Plan (the “DRIP”) which allows shareholders of Franco-Nevada to reinvest dividends to purchase additional common shares at the Average Market Price, as defined in the DRIP, subject to a discount from the Average Market Price in the case of treasury acquisitions. Pursuant to the terms of the DRIP, the Company has changed the discount applicable to the Average Market Price from 3% to 1%, effective from the dividend payable on March 30, 2023. The Company may, from time to time, in its discretion, further change or eliminate the discount applicable to treasury acquisitions or direct that such common shares be purchased in market acquisitions at the prevailing market price, any of which would be publicly announced. Participation in the DRIP is optional. The DRIP and enrollment forms are available on the Company’s website at www.franco-nevada.com. Canadian and U.S. registered shareholders may also enroll in the DRIP online through the plan agent’s self-service web portal at www.investorcentre.com/franco-nevada. Canadian and U.S. beneficial shareholders should contact their financial intermediary to arrange enrollment. Non-Canadian and non-U.S. shareholders may potentially participate in the DRIP, subject to the satisfaction of certain conditions. Non-Canadian and non-U.S. shareholders should contact the Company to determine whether they satisfy the necessary conditions to participate in the DRIP.
This press release is not an offer to sell or a solicitation of an offer for securities. A registration statement relating to the DRIP has been filed with the U.S. Securities and Exchange Commission and may be obtained under the Company’s profile on the U.S. Securities and Exchange Commission’s website at www.sec.gov.
5
Shareholder Information
The complete unaudited Condensed Consolidated Financial Statements and Management’s Discussion and Analysis can be found on our website at www.franco-nevada.com, on SEDAR+ at www.sedarplus.ca and on EDGAR at www.sec.gov.
We will host a conference call to review our Q2 2023 results. Interested investors are invited to participate as follows:
Conference Call and Webcast: | August 9th 10:00 am ET |
Dial-in Numbers: | Toll-Free: 1-888-390-0546 International: 416-764-8688 |
Conference Call URL (This allows participants to join the conference call by phone without operator assistance. Participants will receive an automated call back after entering their name and phone number): | https://bit.ly/3P6nG47 |
Webcast: | www.franco-nevada.com |
Replay (available until August 16th): | Toll-Free: 1-888-390-0541 International: 416-764-8677 Passcode: 828736 # |
Corporate Summary
Franco-Nevada Corporation is the leading gold-focused royalty and streaming company with the largest and most diversified portfolio of cash-flow producing assets. Its business model provides investors with gold price and exploration optionality while limiting exposure to cost inflation. Franco-Nevada is debt-free and uses its free cash flow to expand its portfolio and pay dividends. It trades under the symbol FNV on both the Toronto and New York stock exchanges. Franco-Nevada is the gold investment that works.
For more information, please go to our website at www.franco-nevada.com or contact:
Sandip Rana | | |
Chief Financial Officer | | |
(416) 306-6303 | | |
info@franco-nevada.com | | |
6
Forward-Looking Statements
This press release contains “forward-looking information” and “forward-looking statements” within the meaning of applicable Canadian securities laws and the United States Private Securities Litigation Reform Act of 1995, respectively, which may include, but are not limited to, statements with respect to future events or future performance, management’s expectations regarding Franco-Nevada’s growth, results of operations, estimated future revenues, performance guidance, carrying value of assets, future dividends and requirements for additional capital, mineral resource and mineral reserve estimates, production estimates, production costs and revenue, future demand for and prices of commodities, expected mining sequences, business prospects and opportunities, the performance and plans of third party operators, audits being conducted by the CRA, the expected exposure for current and future assessments and available remedies, obtaining all required Panamanian approvals for the refreshed concession contract with the Government of Panama for the Cobre Panama mine and the terms of the refreshed concession contract. In addition, statements relating to resources and reserves, gold equivalent ounces (“GEOs”) and mine life are forward-looking statements, as they involve implied assessment, based on certain estimates and assumptions, and no assurance can be given that the estimates and assumptions are accurate and that such resources and reserves, GEOs or mine life will be realized. Such forward-looking statements reflect management’s current beliefs and are based on information currently available to management. Often, but not always, forward-looking statements can be identified by the use of words such as “plans”, “expects”, “is expected”, “budgets”, “potential for”, “scheduled”, “estimates”, “forecasts”, “predicts”, “projects”, “intends”, “targets”, “aims”, “anticipates” or “believes” or variations (including negative variations) of such words and phrases or may be identified by statements to the effect that certain actions “may”, “could”, “should”, “would”, “might” or “will” be taken, occur or be achieved. Forward-looking statements involve known and unknown risks, uncertainties and other factors, which may cause the actual results, performance or achievements of Franco-Nevada to be materially different from any future results, performance or achievements expressed or implied by the forward-looking statements. A number of factors could cause actual events or results to differ materially from any forward-looking statement, including, without limitation: fluctuations in the prices of the primary commodities that drive royalty and stream revenue (gold, platinum group metals, copper, nickel, uranium, silver, iron ore and oil and gas); fluctuations in the value of the Canadian and Australian dollar, Mexican peso, and any other currency in which revenue is generated, relative to the U.S. dollar; changes in national and local government legislation, including permitting and licensing regimes and taxation policies and the enforcement thereof; the adoption of a global minimum tax on corporations; regulatory, political or economic developments in any of the countries where properties in which Franco-Nevada holds a royalty, stream or other interest are located or through which they are held; risks related to the operators of the properties in which Franco-Nevada holds a royalty, stream or other interest, including changes in the ownership and control of such operators; relinquishment or sale of mineral properties; influence of macroeconomic developments; business opportunities that become available to, or are pursued by Franco-Nevada; reduced access to debt and equity capital; litigation; title, permit or license disputes related to interests on any of the properties in which Franco-Nevada holds a royalty, stream or other interest; whether or not the Company is determined to have “passive foreign investment company” (“PFIC”) status as defined in Section 1297 of the United States Internal Revenue Code of 1986, as amended; potential changes in Canadian tax treatment of offshore streams; excessive cost escalation as well as development, permitting, infrastructure, operating or technical difficulties on any of the properties in which Franco-Nevada holds a royalty, stream or other interest; access to sufficient pipeline capacity; actual mineral content may differ from the resources and reserves contained in technical reports; rate and timing of production differences from resource estimates, other technical reports and mine plans; risks and hazards associated with the business of development and mining on any of the properties in which Franco-Nevada holds a royalty, stream or other interest, including, but not limited to unusual or unexpected geological and metallurgical conditions, slope failures or cave-ins, sinkholes, flooding and other natural disasters, terrorism, civil unrest or an outbreak of contagious disease; the impact of COVID-19 (coronavirus); and the integration of acquired assets. The forward-looking statements contained in this press release are based upon assumptions management believes to be reasonable, including, without limitation: the ongoing operation of the properties in which Franco-Nevada holds a royalty, stream or other interest by the owners or operators of such properties in a manner consistent with past practice; the accuracy of public statements and disclosures made by the owners or operators of such underlying properties; no material adverse change in the market price of the commodities that underlie the asset portfolio; the Company’s ongoing income and assets relating to determination of its PFIC status; no material changes to existing tax treatment; the expected application of tax laws and regulations by taxation authorities; the expected assessment and outcome of any audit by any taxation authority; no adverse development in respect of any significant property in which Franco-Nevada holds a royalty, stream or other interest; the accuracy of publicly disclosed expectations for the development of underlying properties that are not yet in production; integration of acquired assets; and the absence of any other factors that could cause actions, events or results to differ from those anticipated, estimated or intended. However, there can be no assurance that forward-looking statements will prove to be accurate, as actual results and future events could differ materially from those anticipated in such statements. Investors are cautioned that forward-looking statements are not guarantees of future performance. In addition, there can be no assurance as to the outcome of the ongoing audit by the CRA or the Company’s exposure as a result thereof. Franco-Nevada cannot assure investors that actual results will be consistent with these forward-looking statements. Accordingly, investors should not place undue reliance on forward-looking statements due to the inherent uncertainty therein.
For additional information with respect to risks, uncertainties and assumptions, please refer to Franco-Nevada’s most recent Annual Information Form filed with the Canadian securities regulatory authorities on www.sedarplus.ca and Franco-Nevada’s most recent Annual Report filed on Form 40-F filed with the SEC on www.sec.gov. The forward-looking statements herein are made as of the date of this press release only and Franco-Nevada does not assume any obligation to update or revise them to reflect new information, estimates or opinions, future events or results or otherwise, except as required by applicable law.
7
ENDNOTES:
| 1 | GEOs: GEOs include Franco-Nevada’s attributable share of production from our Mining and Energy assets after applicable recovery and payability factors. GEOs are estimated on a gross basis for NSRs and, in the case of stream ounces, before the payment of the per ounce contractual price paid by the Company. For NPI royalties, GEOs are calculated taking into account the NPI economics. Silver, platinum, palladium, iron ore, oil, gas and other commodities are converted to GEOs by dividing associated revenue, which includes settlement adjustments, by the relevant gold price. The price used in the computation of GEOs earned from a particular asset varies depending on the royalty or stream agreement, which may make reference to the market price realized by the operator, or the average price for the month, quarter, or year in which the commodity was produced or sold. For Q2 2023, the average commodity prices were as follows: $1,978/oz gold (Q2 2022 - $1,872), $24.18/oz silver (Q2 2022 - $22.64), $1,028/oz platinum (Q2 2022 - $957) and $1,449/oz palladium (Q2 2022 - $2,092), $112/t Fe 62% CFR China (Q2 2022 - $143), $73.78/bbl WTI oil (Q2 2022 - $108.41) and $2.32/mcf Henry Hub natural gas (Q2 2022 - $7.49). For H1 2023 prices, the average commodity prices were as follows: $1,933/oz gold (H1 2022 - $1,873), $23.37/oz silver (H1 2022 - $23.29), $1,011/oz platinum (H1 2022 - $993) and $1,508/oz palladium (H1 2022 - $2,207), $118/t Fe 62% CFR China (H1 2022 - $142), $74.95/bbl WTI oil (H1 2022 - $101.35) and $2.54/mcf Henry Hub natural gas (H1 2022 - $6.03). |
| 2 | NON-GAAP FINANCIAL MEASURES: Adjusted Net Income and Adjusted Net Income per share, Adjusted EBITDA and Adjusted EBITDA per share, and Adjusted EBITDA Margin are non-GAAP financial measures with no standardized meaning under International Financial Reporting Standards (“IFRS”) and might not be comparable to similar financial measures disclosed by other issuers. For a quantitative reconciliation of each non-GAAP financial measure to the most directly comparable IFRS financial measure, refer to the following tables. Further information relating to these Non-GAAP financial measures is incorporated by reference from the “Non-GAAP Financial Measures” section of Franco-Nevada’s MD&A for the three and six months ended June 30, 2023 dated August 8, 2023 filed with the Canadian securities regulatory authorities on SEDAR+ available at www.sedarplus.ca and with the U.S. Securities and Exchange Commission available on EDGAR at www.sec.gov. |
| ● | Adjusted Net Income and Adjusted Net Income per share are non-GAAP financial measures, which exclude the following from net income and earnings per share (“EPS”): impairment charges and reversal related to royalty, stream and working interests and investments; gains/losses on the sale of royalty, stream and working interests and investments; foreign exchange gains/losses and other income/expenses; unusual non-recurring items; and the impact of income taxes on these items. |
| ● | Adjusted EBITDA and Adjusted EBITDA per share are non-GAAP financial measures, which exclude the following from net income and EPS: income tax expense/recovery; finance expenses and finance income; depletion and depreciation; non-cash costs of sales; impairment charges and reversals related to royalty, stream and working interests and investments; gains/losses on the sale of royalty, stream and working interests and investments; foreign exchange gains/losses and other income/expenses; and unusual non-recurring items. |
| ● | Adjusted EBITDA Margin is a non-GAAP financial measure which is defined by the Company as Adjusted EBITDA divided by revenue. |
8
Reconciliation of Non-GAAP Financial Measures:
| | For the three months ended | | | For the six months ended | | ||||||||||
| | June 30, | | | June 30, | | ||||||||||
(expressed in millions, except per share amounts) |
| 2023 |
|
| 2022 |
|
| 2023 |
|
| 2022 |
| ||||
Net income | | $ | 184.5 | | | $ | 196.5 | | | $ | 341.0 | | | $ | 378.5 | |
Gain on sale of royalty interest | | | — | | | | — | | | | (3.7) | | | | — | |
Foreign exchange (gain) loss and other (income) expenses | | | (1.7) | | | | 0.4 | | | | (3.9) | | | | (5.8) | |
Finance income related to repayment of Noront Loan | | | — | | | | (2.2) | | | | — | | | | (2.2) | |
Tax effect of adjustments | | | 0.1 | | | | 1.1 | | | | 1.7 | | | | 2.5 | |
Adjusted Net Income | | $ | 182.9 | | | $ | 195.8 | | | $ | 335.1 | | | $ | 373.0 | |
Basic weighted average shares outstanding | | | 191.9 | | | | 191.5 | | | | 191.9 | | | | 191.4 | |
Adjusted Net Income per share | | $ | 0.95 | | | $ | 1.02 | | | $ | 1.75 | | | $ | 1.95 | |
| | For the three months ended | | | For the six months ended |
| ||||||||||
| | June 30, | | | June 30, | | ||||||||||
(expressed in millions, except per share amounts) |
| 2023 |
|
| 2022 |
|
| 2023 |
|
| 2022 |
| ||||
Net income | | $ | 184.5 | | | $ | 196.5 | | | $ | 341.0 | | | $ | 378.5 | |
Income tax expense | | | 27.0 | | | | 36.7 | | | | 54.6 | | | | 72.7 | |
Finance expenses | | | 0.7 | | | | 0.8 | | | | 1.4 | | | | 1.7 | |
Finance income | | | (10.0) | | | | (2.8) | | | | (20.5) | | | | (3.5) | |
Depletion and depreciation | | | 75.1 | | | | 69.6 | | | | 136.1 | | | | 144.2 | |
Gain on sale of royalty interest | | | — | | | | — | | | | (3.7) | | | | — | |
Foreign exchange (gain) loss and other (income) expenses | | | (1.7) | | | | 0.4 | | | | (3.9) | | | | (5.8) | |
Adjusted EBITDA | | $ | 275.6 | | | $ | 301.2 | | | $ | 505.0 | | | $ | 587.8 | |
Basic weighted average shares outstanding | | | 191.9 | | | | 191.5 | | | | 191.9 | | | | 191.4 | |
Adjusted EBITDA per share | | $ | 1.44 | | | $ | 1.57 | | | $ | 2.63 | | | $ | 3.07 | |
| | For the three months ended | | | For the six months ended | | ||||||||||
| | June 30, | | | June 30, | | ||||||||||
(expressed in millions, except Adjusted EBITDA Margin) |
| 2023 |
|
| 2022 |
|
| 2023 |
|
| 2022 |
| ||||
Adjusted EBITDA | | $ | 275.6 | | | $ | 301.2 | | | $ | 505.0 | | | $ | 587.8 | |
Revenue | |
| 329.9 | | |
| 352.3 | | |
| 606.2 | | |
| 691.1 | |
Adjusted EBITDA Margin | |
| 83.5 | % | |
| 85.5 | % | |
| 83.3 | % | |
| 85.1 | % |
9
FRANCO-NEVADA CORPORATION
CONDENSED CONSOLIDATED STATEMENTS OF FINANCIAL POSITION
(in millions of U.S. dollars)
| | At June 30, | | | At December 31, | | ||
| | 2023 |
|
| 2022 |
| ||
ASSETS | | | | | | | | |
Cash and cash equivalents | | $ | 1,295.1 | | | $ | 1,196.5 | |
Receivables | |
| 144.4 | | |
| 135.7 | |
Gold bullion, prepaid expenses and other current assets | |
| 63.8 | | |
| 50.9 | |
Current assets | | $ | 1,503.3 | | | $ | 1,383.1 | |
| | | | | | | | |
Royalty, stream and working interests, net | | $ | 5,086.6 | | | $ | 4,927.5 | |
Investments | |
| 232.3 | | |
| 227.2 | |
Deferred income tax assets | |
| 35.2 | | |
| 39.9 | |
Other assets | |
| 49.8 | | |
| 49.1 | |
Total assets | | $ | 6,907.2 | | | $ | 6,626.8 | |
| | | | | | | | |
LIABILITIES | | | | | | | | |
Accounts payable and accrued liabilities | | $ | 52.2 | | | $ | 43.1 | |
Current income tax liabilities | |
| 4.1 | | |
| 7.1 | |
Current liabilities | | $ | 56.3 | | | $ | 50.2 | |
| | | | | | | | |
Deferred income tax liabilities | | $ | 165.4 | | | $ | 153.0 | |
Other liabilities | | | 6.0 | | | | 6.0 | |
Total liabilities | | $ | 227.7 | | | $ | 209.2 | |
| | | | | | | | |
SHAREHOLDERS’ EQUITY | | | | | | | | |
Share capital | | $ | 5,713.6 | | | $ | 5,695.3 | |
Contributed surplus | |
| 18.2 | | |
| 15.6 | |
Retained earnings | |
| 1,150.9 | | |
| 940.4 | |
Accumulated other comprehensive loss | |
| (203.2) | | |
| (233.7) | |
Total shareholders’ equity | | $ | 6,679.5 | | | $ | 6,417.6 | |
Total liabilities and shareholders’ equity | | $ | 6,907.2 | | | $ | 6,626.8 | |
| | | | | | | | |
| | | | | | | | |
| | | | | | | | |
The unaudited condensed consolidated financial statements and accompanying notes can be found in our Q2 2023 Quarterly Report available on our website
10
FRANCO-NEVADA CORPORATION
CONDENSED CONSOLIDATED STATEMENTS OF INCOME AND COMPREHENSIVE INCOME
(in millions of U.S. dollars and shares, except per share amounts)
| | For the three months ended | | | For the six months ended | | ||||||||||
| | June 30, | | | June 30, | | ||||||||||
|
| 2023 |
|
| 2022 |
| | 2023 |
|
| 2022 | | ||||
Revenue | | $ | 329.9 | | | $ | 352.3 | | | $ | 606.2 | | | $ | 691.1 | |
| | | | | | | | | | | | | | | | |
Costs of sales | | | | | | | | | | | | | | | | |
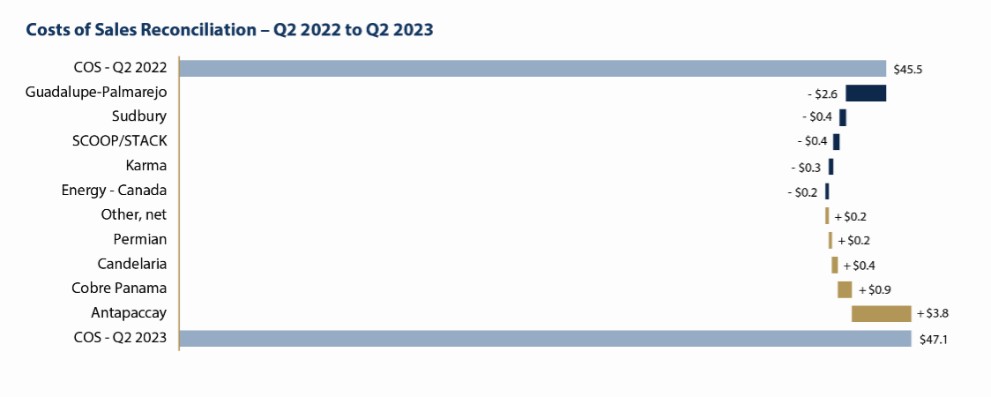
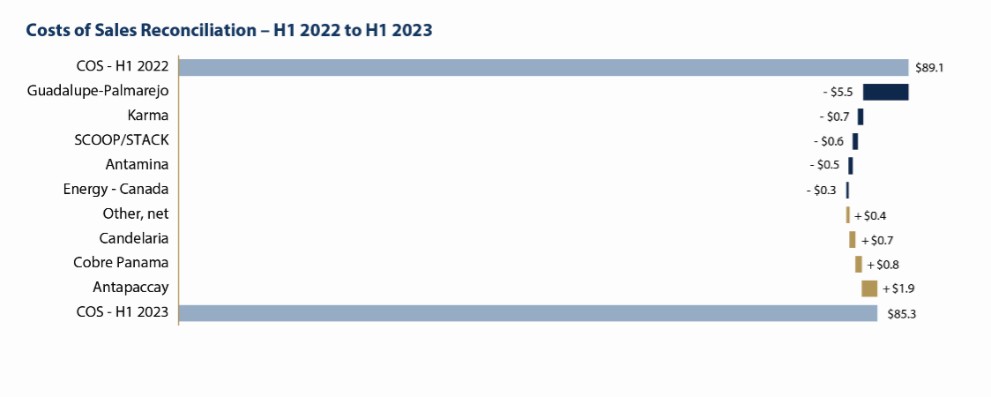
Costs of sales | | $ | 47.1 | | | $ | 45.5 | |
| $ | 85.3 | | | $ | 89.1 | |
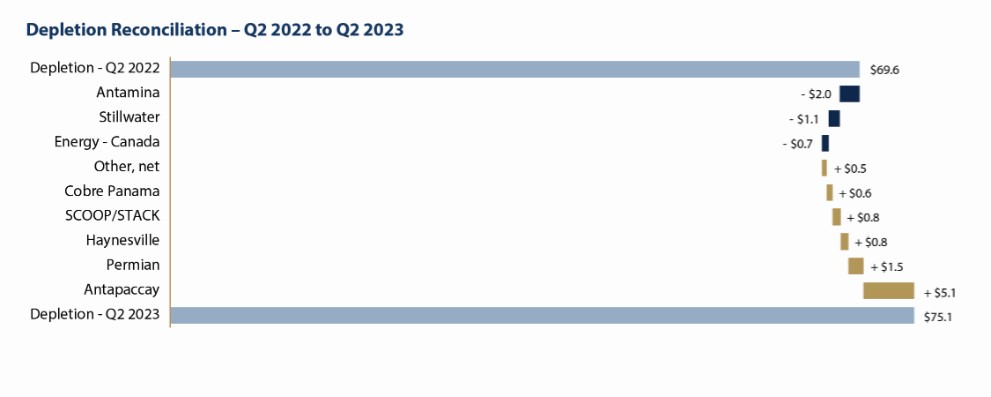
Depletion and depreciation | | | 75.1 | | |
| 69.6 | |
| | 136.1 | | |
| 144.2 | |
Total costs of sales | | $ | 122.2 | | | $ | 115.1 | | | $ | 221.4 | | | $ | 233.3 | |
Gross profit | | $ | 207.7 | | | $ | 237.2 | | | $ | 384.8 | | | $ | 457.8 | |
| | | | | | | | | | | | | | | | |
Other operating expenses (income) | | | | | | | | | | | | | | | | |
General and administrative expenses | | $ | 6.2 | | | $ | 5.8 | |
| $ | 12.4 | | | $ | 11.4 | |
Share-based compensation expenses | | | 2.4 | | | | — | | | | 5.6 | | | | 4.3 | |
Gain on sale of royalty interest | | | — | | | | — | |
| | (3.7) | | | | — | |
Gain on sale of gold bullion | | | (1.4) | | | | (0.2) | |
| | (2.1) | | | | (1.5) | |
Total other operating expenses | | $ | 7.2 | | | $ | 5.6 | |
| $ | 12.2 | | | $ | 14.2 | |
Operating income | | $ | 200.5 | | | $ | 231.6 | |
| $ | 372.6 | | | $ | 443.6 | |
Foreign exchange gain (loss) and other income (expenses) | | $ | 1.7 | | | $ | (0.4) | |
| $ | 3.9 | | | $ | 5.8 | |
Income before finance items and income taxes | | $ | 202.2 | | | $ | 231.2 | |
| $ | 376.5 | | | $ | 449.4 | |
| | | | | | | | | | | | | | | | |
Finance items | | | | | | | | | | | | | | | | |
Finance income | | $ | 10.0 | | | $ | 2.8 | |
| $ | 20.5 | | | $ | 3.5 | |
Finance expenses | | | (0.7) | | |
| (0.8) | |
| | (1.4) | | |
| (1.7) | |
Net income before income taxes | | $ | 211.5 | | | $ | 233.2 | |
| $ | 395.6 | | | $ | 451.2 | |
| | | | | | | | | | | | | | | | |
Income tax expense | | | 27.0 | | |
| 36.7 | |
| | 54.6 | | |
| 72.7 | |
Net income | | $ | 184.5 | | | $ | 196.5 | | | $ | 341.0 | | | $ | 378.5 | |
| | | | | | | | | | | | | | | | |
Other comprehensive income (loss), net of taxes | | | | | | | | | | | | | | | | |
| | | | | | | | | | | | | | | | |
Items that may be reclassified subsequently to profit and loss: | | | | | | | | | | | | | | | | |
Currency translation adjustment | | $ | 30.3 | | | $ | (49.2) | |
| $ | 29.9 | | | $ | (27.0) | |
| | | | | | | | | | | | | | | | |
Items that will not be reclassified subsequently to profit and loss: | | | | | | | | | | | | | | | | |
(Loss) gain on changes in the fair value of equity investments | | | | | |
| | |
| | | | |
| | |
at fair value through other comprehensive income ("FVTOCI"), | | | | | | | | | | | | | | | | |
net of income tax | | | (5.8) | | | | (76.8) | | | | 1.0 | | | | (57.1) | |
Other comprehensive income (loss), net of taxes | | $ | 24.5 | | | $ | (126.0) | |
| $ | 30.9 | | | $ | (84.1) | |
| | | | | | | | | | | | | | | | |
Comprehensive income | | $ | 209.0 | | | $ | 70.5 | | | $ | 371.9 | | | $ | 294.4 | |
| | | | | | | | | | | | | | | | |
Earnings per share | | | | | | | | | | | | | | | | |
Basic | | $ | 0.96 | | | $ | 1.03 | | | $ | 1.78 | | | $ | 1.98 | |
Diluted | | $ | 0.96 | | | $ | 1.02 | | | $ | 1.77 | | | $ | 1.97 | |
Weighted average number of shares outstanding | | | | | | | | | | | | | | | | |
Basic | | | 191.9 | | | | 191.5 | | | | 191.9 | | | | 191.4 | |
Diluted | | | 192.2 | | | | 191.9 | | | | 192.2 | | | | 191.8 | |
| | | | | | | | | | | | | | | | |
| | | | | | | | | | | | | | | | |
The unaudited condensed consolidated financial statements and accompanying notes can be found in our Q2 2023 Quarterly Report available on our website
11
FRANCO-NEVADA CORPORATION
CONDENSED CONSOLIDATED STATEMENTS OF CASH FLOWS
(in millions of U.S. dollars)
| | For the six months ended | | |||||
| | June 30, | | |||||
|
| 2023 |
|
| 2022 |
| ||
Cash flows from operating activities | | | | | | | | |
Net income | | $ | 341.0 | | | $ | 378.5 | |
Adjustments to reconcile net income to net cash provided by operating activities: | | | | | | | | |
Depletion and depreciation | |
| 136.1 | | |
| 144.2 | |
Share-based compensation expenses | |
| 3.2 | | |
| 3.0 | |
Gain on sale of royalty interest | |
| (3.7) | | |
| — | |
Unrealized foreign exchange gain | |
| (3.5) | | |
| — | |
Deferred income tax expense | | | 15.1 | | |
| 13.2 | |
Other non-cash items | |
| (2.0) | | |
| (6.0) | |
Acquisition of gold bullion | | | (25.2) | | | | (23.0) | |
Proceeds from sale of gold bullion | |
| 18.6 | | |
| 26.5 | |
Changes in other assets | |
| — | | |
| (26.7) | |
Operating cash flows before changes in non-cash working capital | | $ | 479.6 | | | $ | 509.7 | |
Changes in non-cash working capital: | | | | | | | | |
Increase in receivables | | $ | (8.7) | | | $ | (24.5) | |
(Increase) decrease in prepaid expenses and other | |
| (4.0) | | |
| 2.6 | |
Increase in current liabilities | |
| 4.8 | | |
| 0.1 | |
Net cash provided by operating activities | | $ | 471.7 | | | $ | 487.9 | |
| | | | | | | | |
Cash flows used in investing activities | | | | | | | | |
Acquisition of royalty, stream and working interests | | $ | (270.8) | | | $ | (12.8) | |
Proceeds from sale of royalty interest | | | 7.0 | | | | — | |
Proceeds from sale of investments | |
| 1.9 | | |
| 1.7 | |
Acquisition of energy well equipment | |
| (0.8) | | |
| (0.6) | |
Acquisition of investments | |
| (0.5) | | |
| (47.4) | |
Proceeds from settlement of loan receivable from Noront Resources Ltd. | | | — | | | | 42.7 | |
Net cash used in investing activities | | $ | (263.2) | | | $ | (16.4) | |
| | | | | | | | |
Cash flows used in financing activities | | | | | | | | |
Payment of dividends | | $ | (116.4) | | | $ | (101.4) | |
Proceeds from exercise of stock options | |
| 2.9 | | |
| 5.2 | |
Net cash used in financing activities | | $ | (113.5) | | | $ | (96.2) | |
Effect of exchange rate changes on cash and cash equivalents | | $ | 3.6 | | | $ | (4.0) | |
Net change in cash and cash equivalents | | $ | 98.6 | | | $ | 371.3 | |
Cash and cash equivalents at beginning of period | | $ | 1,196.5 | | | $ | 539.3 | |
Cash and cash equivalents at end of period | | $ | 1,295.1 | | | $ | 910.6 | |
| | | | | | | | |
Supplemental cash flow information: | | | | | | | | |
Income taxes paid | | $ | 50.9 | | | $ | 59.3 | |
Dividend income received | | $ | 5.6 | | | $ | 8.2 | |
Interest and standby fees paid | | $ | 1.2 | | | $ | 1.3 | |
The unaudited condensed consolidated financial statements and accompanying notes can be found in our Q2 2023 Quarterly Report available on our website
12