Exhibit 99.1

TABLE OF CONTENTS
| Page |
1 | |
| |
1 | |
| |
4 | |
| |
4 | |
| |
4 | |
| |
5 | |
| |
13 | |
| |
15 | |
| |
17 | |
| |
23 | |
| |
29 | |
| |
34 | |
| |
42 | |
| |
49 | |
| |
63 | |
| |
63 | |
| |
64 | |
| |
65 | |
| |
69 | |
| |
69 | |
| |
69 | |
| |
69 | |
| |
69 | |
| |
69 | |
| |
70 | |
| |
APPENDIX A FRANCO-NEVADA CORPORATION AUDIT AND RISK COMMITTEE CHARTER | A-1 |
i
Unless otherwise noted or the context otherwise indicates, the terms “Franco-Nevada”, “FNV”, “Company”, “Corporation”, “our” and “we” refer to Franco-Nevada Corporation and its subsidiaries. For reporting purposes, the Corporation presents its financial statements in United States dollars and in conformity with International Financial Reporting Standards as issued by the International Accounting Standards Board (“IFRS”). All dollar amounts in this Annual Information Form (“AIF”) are expressed in United States dollars, except as otherwise indicated. References to “US$”, “$” or “dollars” are to United States dollars, references to “C$” are to Canadian dollars and references to “A$” are to Australian dollars.
The information contained in this AIF is as of December 31, 2021, unless otherwise indicated. More current information may be available on our public website at www.franco-nevada.com or on the System for Electronic Document Analysis and Retrieval (“SEDAR”) at www.sedar.com or on the website of the United States Securities and Exchange Commission (the “SEC”) at www.sec.gov. In addition, we generally maintain supporting materials on our website which may assist in reviewing (but are not to be considered part of) this AIF including Franco-Nevada’s most recent Asset Handbook and Environmental, Social and Governance (ESG) Report (which contains a discussion of environmental, social and governance issues, including climate change), and a glossary of non-technical and technical terms.
This AIF contains “forward looking information” and “forward looking statements” within the meaning of applicable Canadian securities laws and the United States Private Securities Litigation Reform Act of 1995, respectively, which may include, but are not limited to, statements with respect to future events or future performance, management’s expectations regarding Franco-Nevada’s growth, results of operations, estimated future revenues, performance guidance, carrying value of assets, future dividends and requirements for additional capital, mineral reserve and mineral resource estimates, production estimates, production costs and revenue, future demand for and prices of commodities, expected mining sequences, business prospects and opportunities, the performance and plans of third-party operators, audits being conducted by the Canada Revenue Agency (“CRA”), the expected exposure for current and future assessments and available remedies, the remedies relating to and consequences of the ruling of the Supreme Court of Panama in relation to the Cobre Panama project, the aggregate value of common shares which may be issued pursuant to its at-the-market equity program (the “ATM Program”), and the Corporation’s expected use of the net proceeds of the ATM Program, if any. In addition, statements (including data in tables) relating to reserves and resources including reserves and resources covered by a royalty, stream or other interest, gold equivalent ounces (“GEOs”) or mine lives are forward looking statements, as they involve implied assessment, based on certain estimates and assumptions, and no assurance can be given that the estimates and assumptions are accurate and that such reserves and resources, mine lives and GEOs will be realized. Such forward looking statements reflect management’s current beliefs and are based on information currently available to management. Often, but not always, forward looking statements can be identified by the use of words such as “plans”, “expects”, “is expected”, “budgets”, “potential for”, “scheduled”, “estimates”, “forecasts”, “predicts”, “projects”, “intends”, “targets”, “aims”, “anticipates” or “believes” or variations (including negative variations) of such words and phrases or may be identified by statements to the effect that certain actions “may”, “could”, “should”, “would”, “might” or “will” be taken, occur or be achieved. Forward looking statements involve known and unknown risks, uncertainties and other factors, which may cause the actual results, performance or achievements of Franco-Nevada to be materially different from any future results, performance or achievements expressed or implied by the forward looking statements. A number of factors could cause actual events or results to differ materially from any forward looking statement, including, without limitation: the price at which common shares are sold in the ATM Program and the aggregate net proceeds received by the Corporation as a result of the ATM Program; fluctuations in the prices of the primary commodities that drive royalty and stream revenue (gold, platinum group metals, copper, nickel, uranium, silver, iron-ore and oil and gas); fluctuations in the value of the Canadian and Australian dollar, Mexican peso and any other currency in which revenue is generated, relative to the U.S. dollar; changes in national and local government legislation, including permitting and licensing regimes and taxation policies and the enforcement thereof; the adoption of a global minimum tax on corporations; regulatory, political or economic developments in any of the countries where properties in which Franco-Nevada holds a royalty, stream or other interest are located or through which they are held; risks related to the operators of the properties in which Franco-Nevada holds a royalty, stream or other interest, including changes in the ownership and control of such operators; relinquishment or sale of mineral properties; influence of macroeconomic developments; business opportunities that become available to, or are pursued by Franco-Nevada; reduced access to debt and equity capital; litigation; title, permit or license disputes related to interests on any of the properties in which Franco-Nevada holds a royalty, stream or other interest; whether or not the Corporation is determined to have “passive foreign investment company” (“PFIC”) status as defined in Section 1297 of the United States Internal Revenue Code of 1986, as amended; potential changes in Canadian tax treatment of offshore streams; excessive cost escalation as well as development, permitting, infrastructure, operating or technical difficulties on any of the properties in which Franco-Nevada holds a royalty, stream or other interest; access to sufficient pipeline capacity; actual mineral content may differ from the reserves and resources contained in technical reports; rate and timing of production differences from resource estimates, other technical reports and mine plans; risks and hazards associated with the business of development and mining on any of the properties in which Franco-Nevada holds a royalty, stream or other interest, including, but not limited to unusual or unexpected geological and metallurgical conditions, slope failures or cave-ins, flooding and other natural disasters, terrorism, civil unrest or an outbreak of contagious disease; the impact of the COVID-19 (coronavirus) pandemic; and the integration of acquired assets. The forward looking statements contained in this AIF are based upon assumptions management believes to be reasonable, including, without limitation: the ongoing operation of the properties in which Franco-Nevada holds a royalty, stream or other interest by the owners or operators of such properties in a manner consistent with past practice; the accuracy of public statements and disclosures made by the owners or operators of such underlying properties; no material adverse change in the market price of the commodities that underlie the asset portfolio; the Corporation’s
ongoing income and assets relating to determination of its PFIC status; no material changes to existing tax treatment; the expected application of tax laws and regulations by taxation authorities; the expected assessment and outcome of any audit by any taxation authority; no adverse development in respect of any significant property in which Franco-Nevada holds a royalty, stream or other interest; the accuracy of publicly disclosed expectations for the development of underlying properties that are not yet in production; integration of acquired assets; and the absence of any other factors that could cause actions, events or results to differ from those anticipated, estimated or intended. However, there can be no assurance that forward looking statements will prove to be accurate, as actual results and future events could differ materially from those anticipated in such statements. Investors are cautioned that forward looking statements are not guarantees of future performance. In addition, there can be no assurance as to the outcome of the ongoing audit by the CRA or the Company’s exposure as a result thereof. Franco-Nevada cannot assure investors that actual results will be consistent with these forward looking statements. Accordingly, investors should not place undue reliance on forward looking statements due to the inherent uncertainty therein. For additional information with respect to risks, uncertainties and assumptions, please refer to the “Risk Factors” section of this AIF filed with the Canadian securities regulatory authorities on www.sedar.com and the SEC on www.sec.gov. The forward looking statements herein are made as of the date of this AIF only and Franco-Nevada does not assume any obligation to update or revise them to reflect new information, estimates or opinions, future events or results or otherwise, except as required by applicable law.
CAUTIONARY NOTE REGARDING MINERAL RESERVE AND RESOURCE ESTIMATES
This AIF has been prepared in accordance with the requirements of Canadian securities laws in effect in Canada, which differ from the requirements of U.S. securities laws. Unless otherwise indicated, all mineral resource and reserve estimates included in this AIF have been prepared by the owners or operators of the relevant properties (as and to the extent indicated by them) in accordance with National Instrument 43-101 — Standards of Disclosure for Mineral Projects (“NI 43-101”) and the Canadian Institute of Mining and Metallurgy Classification System. NI 43-101 is a rule developed by the Canadian securities regulatory authorities which establishes standards for all public disclosure an issuer makes of scientific and technical information concerning mineral projects. NI 43-101 permits a historical estimate made prior to the adoption of NI 43-101 that does not comply with NI 43-101 to be disclosed using the historical terminology if, among other things, the disclosure: (a) identifies the source and date of the historical estimate; (b) comments on the relevance and reliability of the historical estimate; (c) states whether the historical estimate uses categories other than those prescribed by NI 43-101; and (d) includes any more recent estimates or data available.
Mining disclosure under U.S. securities law was previously required to comply with SEC Industry Guide 7 (“SEC Industry Guide 7”) under the United States Securities Exchange Act of 1934, as amended. The SEC has adopted rules to replace SEC Industry Guide 7 with new mining disclosure rules under sub-part 1300 of Regulation S-K of the U.S. Securities Act (“Regulation S-K 1300”) which became mandatory for U.S. reporting companies beginning with the first fiscal year commencing on or after January 1, 2021. Under Regulation S-K 1300, the SEC now recognizes estimates of “Measured Mineral Resources”, “Indicated Mineral Resources” and “Inferred Mineral Resources”. In addition, the SEC has amended its definitions of “Proven Mineral Reserves” and “Probable Mineral Reserves” to be substantially similar to international standards. Readers are cautioned that despite efforts to harmonize U.S. mining disclosure rules with NI 43-101 and other international requirements, there are differences between the terms and definitions used in Regulation S-K 1300 and mining terms defined in the Canadian Institute of Mining, Metallurgy and Petroleum Standards, which definitions have been adopted by NI 43‑101, and there is no assurance that any mineral reserves or mineral resources that an owner or operator may report as “proven mineral reserves”, “probable mineral reserves”, “measured mineral resources”, “indicated mineral resources” and “inferred mineral resources” under NI 43-101 would be the same had the owner or operator prepared the reserve or resource estimates under the standards of Regulation S-K 1300.
Certain reserve or resource estimates of U.S. reporting companies presented herein (notably those of Vale S.A.) have been prepared in accordance with SEC Industry Guide 7. Canadian standards, including NI 43-101, differ significantly from the requirements under SEC Industry Guide 7, and reserve and resource information contained herein may not be comparable to similar information disclosed by U.S. companies. In particular, and without limiting the generality of the foregoing, the term “resource” does not equate to the term “reserves”. Under SEC Industry Guide 7, mineralization could not be classified as a “reserve” unless the determination has been made that the mineralization could be economically and legally produced or extracted at the time the reserve determination is made. The SEC’s disclosure standards did not normally permit the inclusion of information concerning “measured mineral resources”, “indicated mineral resources” or “inferred mineral resources” or other descriptions of the amount of mineralization in mineral deposits that do not constitute “reserves” in documents filed with the SEC in compliance with SEC Industry Guide 7. U.S. investors are cautioned that “inferred mineral resources” have a lower level of confidence than that applying to “indicated mineral resources” and cannot be directly converted to a “mineral reserve”. It is reasonably expected that the majority of “inferred mineral resources” could be upgraded to “indicated mineral resources” with continued exploration. Under Canadian rules, estimated “inferred mineral resources” may not form the basis of feasibility or pre-feasibility studies except in rare cases. Investors are cautioned not to assume that all or any part of an “inferred mineral resource” exists or is economically or legally mineable. Disclosure of “contained ounces” in a mineral resource is permitted disclosure under Canadian regulations; however, SEC Industry Guide 7 normally only permitted issuers to report mineralization that does not constitute “reserves” under SEC Industry Guide 7 as in-place tonnage and grade without reference to unit measures. The requirements of NI 43-101 for identification of “reserves” are also not the same as under SEC Industry Guide 7, and reserves reported by the Corporation in compliance with NI 43-101 may not qualify as “reserves” under SEC Industry Guide 7. Accordingly, information concerning mineral deposits set forth herein may not be comparable with information made public by companies that have reported in accordance with SEC Industry Guide 7.
2
In addition to NI 43-101, a number of resource and reserve estimates have been prepared in accordance with the JORC Code or the SAMREC Code (as such terms are defined in NI 43-101), which differ from the requirements of NI 43-101 and U.S. securities laws. Accordingly, information containing descriptions of the Corporation’s mineral properties set forth herein may not be comparable to similar information made public by U.S. companies subject to the reporting and disclosure requirements under the U.S. federal securities laws and the rules and regulations thereunder. For more information, see “Reconciliation to CIM Definitions”.
3
The following table sets out the high and low rates of exchange for one U.S. dollar expressed in Canadian dollars during each of the following periods; the average rate of exchange for those periods; and the rate of exchange in effect at the end of each of those periods, each based on the exchange rate published by the Bank of Canada.
| | Years ended December 31, |
| |||||||
|
| 2021(1) |
| 2020(1) |
| 2019(1) |
| |||
High | | $ | 1.2942 | | $ | 1.4496 | | $ | 1.3600 | |
Low | | $ | 1.2040 | | $ | 1.2718 | | $ | 1.2988 | |
Average for the Period | | $ | 1.2535 | | $ | 1.3415 | | $ | 1.3269 | |
End of Period | | $ | 1.2678 | | $ | 1.2732 | | $ | 1.2988 | |
(1) | Based on the daily rate published by the Bank of Canada. |
On March 16, 2022 the daily exchange rate was US$1.00 = C$1.2721 as published by the Bank of Canada.
| | Spot Commodity Prices | |||||||||||||||||||||||||
|
| Gold/oz |
| Silver/oz |
| Platinum/oz |
| Palladium/oz |
| Iron Ore/$ tonne |
| Oil/C$ bbl |
| Gas/C$ mcf |
| Oil/$ bbl |
| Gas/$ mcf | |||||||||
| | (LBMA Gold | | (LBMA Silver | | (London PM Fix) | | (London PM Fix) | | (62% Fe, CFR China) | | (Edmonton Light) | | (AECO-C) | | (WTI) | | (Henry Hub) | |||||||||
| | Price PM) | | Price) | | | | | | | | | | | | | | | |||||||||
Average for 2019 | | $ | 1,392 | | $ | 16.20 | | $ | 863 | | $ | 1,539 | | $ | 93 | | $ | 69 | | $ | 1.70 | | $ | 57 | | $ | 2.53 |
Average for 2020 | | $ | 1,770 | | $ | 20.55 | | $ | 884 | | $ | 2,194 | | $ | 107 | | $ | 46 | | $ | 2.13 | | $ | 39 | | $ | 2.13 |
Average for 2021 | | $ | 1,800 | | $ | 25.17 | | $ | 1,091 | | $ | 2,397 | | $ | 160 | | $ | 80 | | $ | 3.43 | | $ | 68 | | $ | 3.72 |
Name, Address and Incorporation
Franco-Nevada was incorporated under the Canada Business Corporations Act on October 17, 2007 and was amalgamated with Franco-Nevada Canada Corporation, its wholly-owned subsidiary, on January 1, 2008. Franco-Nevada’s head office and registered office is currently located at Suite 2000, Commerce Court West, 199 Bay Street, Toronto, Ontario M5L 1G9. Franco-Nevada has additional offices in (i) Hastings, Christ Church, Barbados, (ii) Denver, Colorado and (iii) Perth, Australia, all of which are used to manage its asset portfolio and pursue new investment opportunities.
Intercorporate Relationships
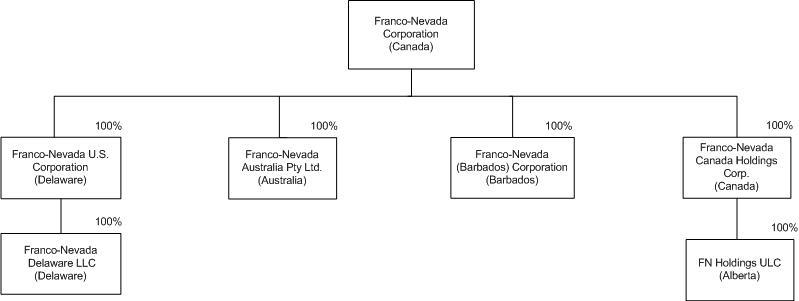
The chart below depicts significant subsidiaries that are wholly-owned by Franco-Nevada either directly or indirectly and are existing under the laws of the jurisdictions set out therein. Intermediate holding companies have been omitted.
4
GENERAL DEVELOPMENT OF FRANCO-NEVADA’S BUSINESS
Overview
Franco-Nevada is the leading gold-focused royalty and streaming company with the largest and most diversified portfolio of royalties and streams by commodity, geography, operator, revenue type and stage of project.
Franco-Nevada’s shares are listed on the Toronto and New York stock exchanges under the symbol FNV. An investment in Franco-Nevada’s shares is expected to provide investors with yield and exposure to commodity price and exploration optionality while limiting exposure to cost inflation and other operating risks.
Our tag-line is “Franco-Nevada is the gold investment that works” and we are committed to ensuring it does work, for our shareholders, our operating partners and our communities:
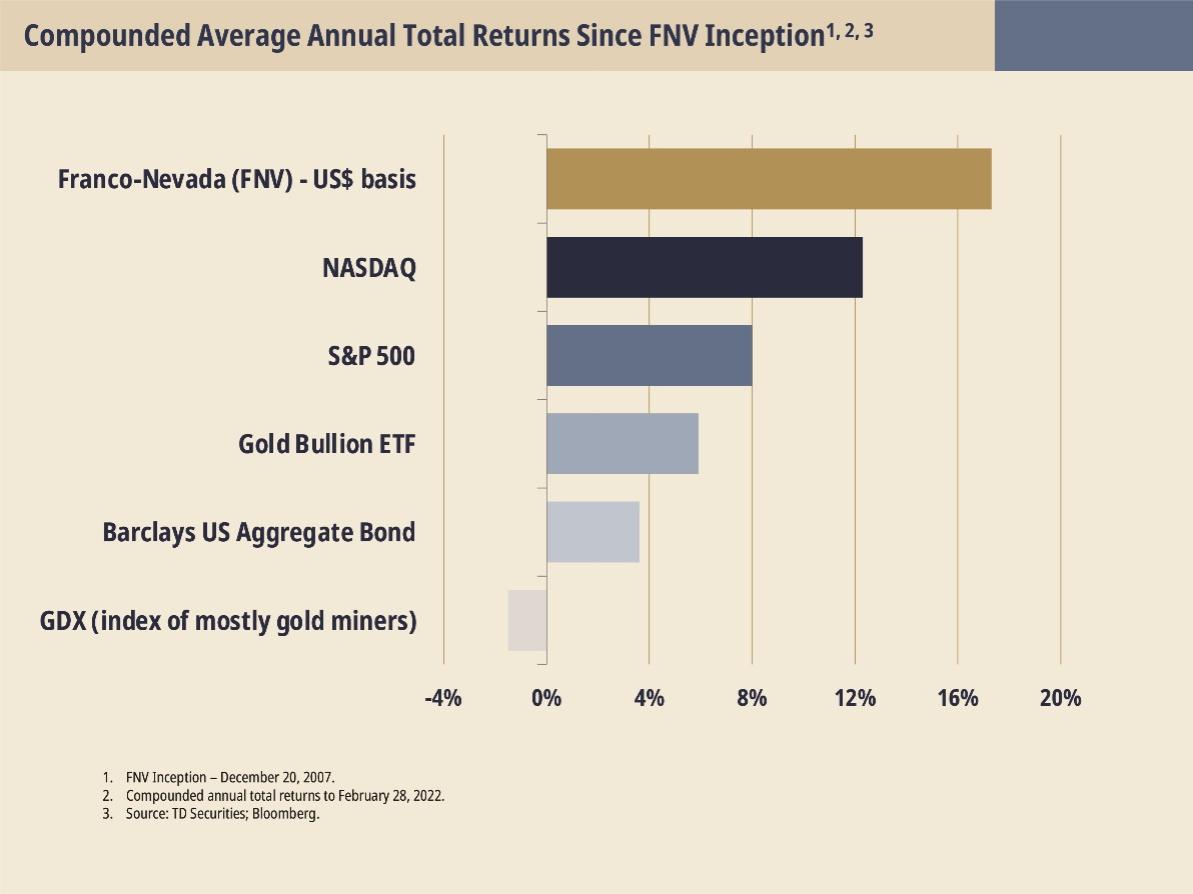
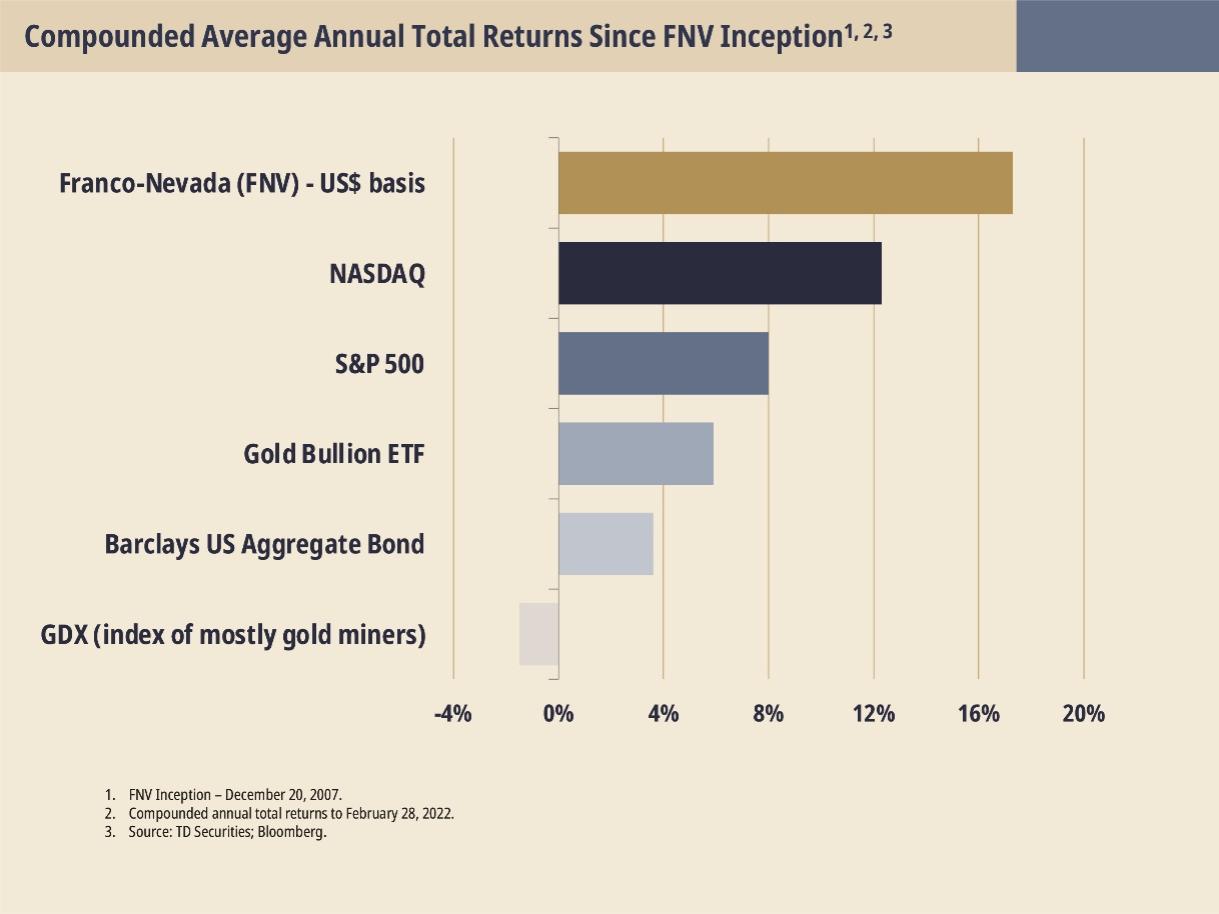
• | We believe that combining lower risk gold investments with a strong balance sheet, progressively growing dividends and exposure to exploration optionality is the right mix to appeal to investors seeking to hedge market instability. Since our Initial Public Offering over 14 years ago, we have increased our dividend annually and our share price has outperformed the gold price and all relevant gold equity benchmarks. |
• | We build long-term alignment with our operating partners. This alignment and the natural flexibility of our royalties and streams is an effective financing tool for the cyclical resource sector. |
• | We work to be a positive force in all our communities, promoting responsible mining, providing a safe and diverse workplace and contributing to build community support for the operations in which we invest. |
Our revenue is generated from various forms of agreements, ranging from net smelter return royalties, streams, net profits interests, net royalty interests, working interests and other types of arrangements. We do not operate mines, develop projects or conduct exploration. Franco-Nevada has a free cash flow generating business with limited future capital commitments and management is focused on managing and growing its portfolio of royalties and streams. We recognize the cyclical nature of the industry and have a long-term investment outlook. We maintain a strong balance sheet to minimize financial risk and so that we can make investments during commodity cycle downturns.
The advantages of this business model are:
• | Exposure to commodity price optionality; |
• | A perpetual discovery option over large areas of geologically prospective lands; |
• | No additional capital requirements other than the initial investment; |
• | Limited exposure to cost inflation; |
• | A free cash-flow business with limited cash calls; |
5
• | A high-margin business that can generate cash through the entire commodity cycle; |
• | A scalable and diversified business in which a large number of assets can be managed with a small stable overhead; and |
• | Management that focuses on forward-looking growth opportunities rather than operational or development issues. |
Our short-term financial results are primarily tied to the price of commodities and the amount of production from our portfolio of assets. Our attributable production has typically been supplemented by acquisitions of new assets. Over the longer term, our results are impacted by the amount of exploration and development capital available to operators to expand or extend our producing assets or to progress our advanced and exploration assets into production.
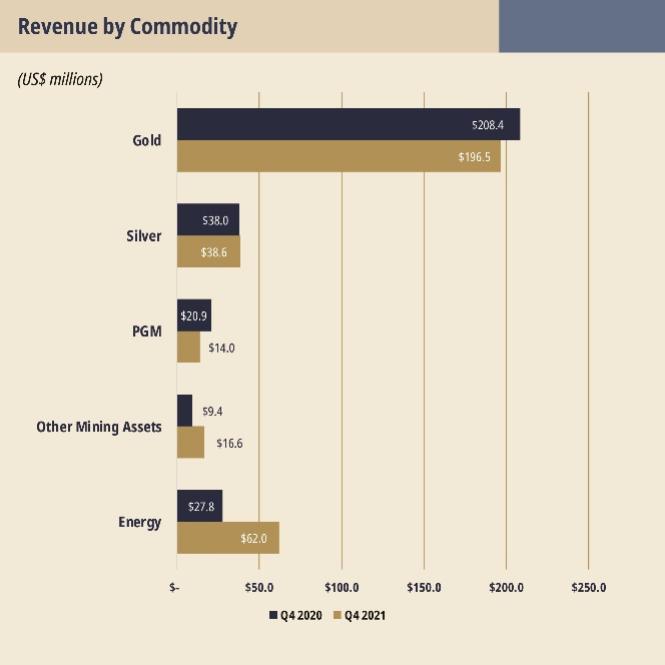
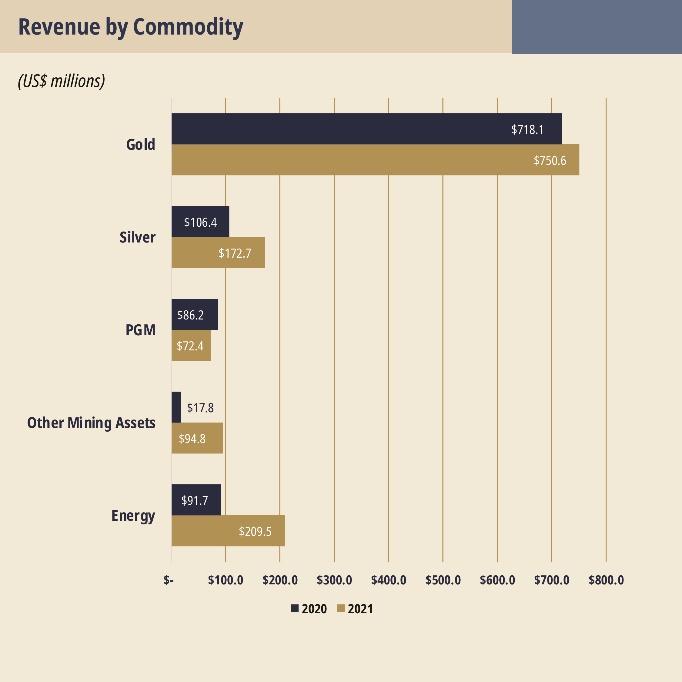
The focus of our business is to create exposure to gold and precious metal resource optionality. This principally involves investments in gold mines and providing financing to copper and other base metal mines to obtain exposure to by-product gold, silver and platinum group metals production. We also invest in other metals and energy to expose our shareholders to additional resource optionality. In 2021, 76.6% of our revenue was earned from precious metals and 83.9% was earned from mining assets.
One of the strengths of Franco-Nevada’s business model is that our margins are not generally impacted when producer costs increase. The majority of our interests are royalty and streams with payments/deliveries that are based on production levels with no adjustments for the operator’s operating costs. In 2021, these interests accounted for 93.1% of our revenue. We also have a small number of NPI and NRI royalties which are based on the profit of the underlying operations.
Franco-Nevada currently operates a small organization. As of March 17, 2022, Franco-Nevada has 35 full-time employees and 5 part-time contractors. As such, Franco-Nevada is dependent upon the continued availability and commitment of its key management, whose contributions to the immediate and future operations of Franco-Nevada are of significant importance. From time to time, Franco-Nevada may also need to identify and retain additional skilled management and specialized technical personnel to efficiently operate its business. For additional information, see “Risk Factors”.
Investment Process and Corporate Policies
Franco-Nevada currently does not operate any of the mining or diversified assets in which it has royalty, stream or other interests. However, Franco-Nevada recognizes its business model is dependent on the industry operating in a responsible fashion and actively supports the industry in its efforts and initiatives, including the World Gold Council and its Responsible Gold Mining Principles and the Prospectors and Developers Association of Canada and its initiatives for responsible exploration. A detailed description of Franco-Nevada’s investment process and a discussion of environmental, social and governance issues, including climate change, is contained in Franco-Nevada’s most recent Environmental, Social and Governance (ESG) Report, which can be found on the Corporation’s website at www.franco-nevada.com but is not to be considered part of this AIF.
Franco-Nevada has adopted policies relating to its business conduct, including a code of business conduct and ethics, a business integrity policy, a whistleblower policy, a policy concerning confidentiality, fair disclosure and trading in securities, a human rights policy, a non-discrimination, anti-harassment and equal opportunity policy, a diversity and inclusion policy, an investment principles (environmental, social and governance) policy, a responsible gold mining principles policy, a supplier code of conduct, a corporate responsibility policy, a health and safety policy, and an information security policy. Additional information relating to these and other policies can be found on the Corporation’s website at www.franco-nevada.com and are also contained in Franco-Nevada’s most recent Environmental, Social and Governance (ESG) Report and its management information circular for its annual and special meeting of shareholders scheduled to be held on May 4, 2022 which will be filed on SEDAR.
6
Three-Year History
2019
Acquisition of Salares Norte Royalty Interest – Chile
On January 31, 2019, Franco-Nevada, through a wholly-owned subsidiary, acquired an existing 2% NSR on Gold Fields’ Salares Norte project in the Atacama region of northern Chile for $32.0 million, comprised of $27.0 million of Franco-Nevada common shares (366,499 common shares) and $5.0 million in cash. Gold Fields has an option to buy back 1% of the NSR for $6.0 million within 24 months of the commencement of commercial production.
Acquisition of Valentine Lake Royalty Interest – Canada
On February 21, 2019, Franco-Nevada acquired a 2% NSR on Marathon Gold Corporation’s (“Marathon”) Valentine Lake Gold Camp in central Newfoundland for C$18.0 million. Marathon has an option to buy back 0.5% of the NSR for US$7.0 million until December 31, 2022.
2019 ATM Program
On July 19, 2019, Franco-Nevada established an at-the-market equity program (the “2019 ATM Program”) whereby the Company was permitted to issue up to an aggregate of $200 million worth of common shares from treasury at prevailing market prices to the public through the Toronto Stock Exchange, the New York Stock Exchange or any other marketplace on which the common shares were listed, quoted or otherwise trade.
In 2019, the Company issued 1,433,400 common shares under the 2019 ATM Program at an average price per common share of $96.56. The gross proceeds to the Company from these issuances were $138.4 million, and the net proceeds were $136.0 million after deducting agent commission costs of $1.4 million and other share issuance costs of $1.0 million. The 2019 ATM Program was replaced in 2020 by the Company’s new at-the-market equity program (as described below).
Acquisition of Marcellus Royalty Interest – U.S.A.
On July 22, 2019, Franco-Nevada acquired from Range Resources Corporation (“Range”) an overriding royalty interest on acreage in the Marcellus shale play in Pennsylvania for a gross purchase price of $300.0 million. The royalty is calculated as 1% of gross production, less allowed deductions from approximately 350,000 net acres of Range’s working interest position in Washington, Western Allegheny and Southern Beaver Counties in Pennsylvania. The royalty applies to existing production and future development from the Marcellus formation as well as future potential development from the Utica and Upper Devonian formations. The royalty provides exposure to a significant inventory of undeveloped drilling locations that is expected to be capable of supporting cash flow for several decades. The royalty is registered on title and is a direct interest in real property.
Acquisition of Premier Gold Royalty Interests – Canada and U.S.A.
On September 25, 2019, Franco-Nevada acquired two royalties from Premier Gold Mines Limited for $6.0 million, including a 2% NSR on property owned by Newmont Corporation adjoining its Musselwhite Mine in Northwestern Ontario and a 1.5% NSR on Nevada Gold Mines LLC’s Rain/Emigrant and Saddle properties located at the south end of the Carlin Trend in Nevada.
Acquisition of Project 81 Royalty Interest and Noble Common Shares – Canada
On November 22, 2019, Franco-Nevada acquired a 2% NSR on Noble Mineral Exploration’s (“Noble”) 55,000 hectare patented land package known as Project 81 in the Timmins-Cochrane area of Ontario, Canada, in exchange for Franco-Nevada agreeing to waive its pre-emptive and buy-back rights in respect of a historical third-party royalty on Project 81, which was subsequently terminated. Franco-Nevada’s 2% NSR covers the Crawford Nickel-Sulphide Project, which was spun out by Noble to Canada Nickel Company Inc. (“CNC”). As part of the arrangement, Noble issued C$500,000 of its common shares to Franco-Nevada and Franco-Nevada subsequently received CNC common shares as part of the aforementioned Crawford spin out.
Acquisition of Eagle’s Nest Royalty Interest and Extension of Noront Loan – Canada
On December 23, 2019, Franco-Nevada acquired a 1% gross royalty on Noront Resources Ltd.’s (“Noront”) Eagle’s Nest nickel, copper and PGM deposit in the Ring of Fire mining district of Ontario, Canada, for C$5.0 million ($3.8 million).
Franco-Nevada also extended the term of its $25 million loan to Noront to September 30, 2022, from its original maturity of April 28, 2020, under substantially the same terms and conditions, although the loan must be repaid upon a change of control. The loan bears annual interest at 7%, and amounted to $39.7 million including accrued interest as at December 31, 2021.
2020
Acquisition of Island Gold Royalty Interest – Canada
On March 20, 2020, Franco-Nevada acquired an existing 0.62% NSR on Alamos Gold Inc.’s Island Gold project in Finan Township in the Province of Ontario for $13.4 million (C$19.0 million).
7
At-the-Market Equity Program
On May 11, 2020, the Company established a new at-the-market equity program (the “ATM Program”) permitting the Company to issue up to an aggregate of $300 million worth of common shares from treasury at prevailing market prices to the public through the Toronto Stock Exchange, the New York Stock Exchange or any other marketplace on which the common shares are listed, quoted or otherwise trade. The 2019 ATM Program, which permitted the Company to issue up to an aggregate of $200 million worth of common shares, was terminated on April 28, 2020 when the Company renewed its base shelf prospectus.
For 2020, the Company issued 1,054,800 common shares under the ATM Program and the 2019 ATM Program at an average price per common share of $128.96. The gross proceeds from these issuances were $136.0 million, and the net proceeds were $133.7 million after deducting agent commission costs of $1.4 million and other share issuance costs of $0.9 million. During the year ended December 31, 2021, the Company did not issue any common shares under its ATM Program.
Acquisition of Freeport Royalty Portfolio Interests
On September 1, 2020, the Company acquired a portfolio of 24 royalties from Freeport-McMoRan Inc. for $30.6 million in cash. The portfolio includes prospective royalties over Wallbridge Mining Co. Ltd.’s Fenelon, Martiniere and Northway-Noyon projects. It also includes producing royalties on Industrias Peñoles, S.A.B.de C.V.’s Milpillas copper mine in Sonora, Mexico, and on Ormat Technologies Inc.’s Neal Hot Spring geothermal operation in Oregon.
Acquisition of Alpala Royalty – Northern Ecuador
On September 11, 2020, the Company completed a royalty transaction with SolGold plc (“SolGold”) to acquire a 1% NSR with reference to all minerals produced from the Alpala copper-gold-silver project in northern Ecuador for $100.0 million. The Alpala project is owned by Exploraciones Novomining SA, which is held 85% by SolGold and 15% by Cornerstone Capital Resources Inc. SolGold has the option to buy-back 50% of the royalty for a period of time. Franco-Nevada is entitled to receive certain minimum royalty payments from 2028 and also has the option to convert the NSR to a gold-only NSR for a period of time once Alpala is producing. The NSR covers the Cascabel concession.
Acquisition of Rio Baker (Salares Norte) Royalty – Chile
On September 23, 2020, the Company, through a wholly-owned subsidiary, acquired an existing 2% NSR on all mineral production from Gold Fields’ Rio Baker concessions in Chile for $5.0 million cash with contingent payments of up to $8.0 million. With this acquisition, the Company now has exposure to 100% of the Salares Norte deposit. The royalty agreement is subject to a 0.5% buy-back at any time for $4.0 million.
Amendment of Sabodala Gold Stream Agreement – Senegal
On September 25, 2020, the Company, through a wholly-owned subsidiary, amended its existing Sabodala gold purchase and sale agreement with Teranga Gold Corporation (“Teranga”) to compensate the Company for displacement that will be caused by the processing of Massawa ore through the Sabodala processing facilities and to provide for certain protocols for the commingling of Sabodala and Massawa ores. Teranga acquired a 90% interest in the Massawa project from Barrick Gold Corporation on March 4, 2020.
The amended agreement provides that effective September 1, 2020, Teranga will make fixed deliveries of 783.33 ounces of refined gold per month until 105,750 ounces of gold have been delivered to the Company (the “Fixed Delivery Period”) and 6% of production from the stream area thereafter. Following the Fixed Delivery Period, a reconciliation will be conducted to determine if the Company would have received more or less than 105,750 ounces of gold under the 6% variable stream during such period. Teranga will be entitled to a credit for an over-delivery which will be applied against the 6% variable stream until depleted and the Company will be entitled to a one-time additional delivery in the case of an under-delivery.
Acquisition of U.S. Oil & Gas Royalty Rights – U.S.A.
Effective October 1, 2020, the Company, through a wholly-owned subsidiary, acquired a royalty portfolio in the Haynesville natural gas play in Texas, from Mesa Minerals Partners LLC, a Quantum Energy Partners portfolio company, for $135 million. The Haynesville represents one of the most active gas plays in North America. The royalties are located in Harrison and Panola counties, which represent a core area of the East Texas part of the basin, where Rockcliff Energy II LLC is the primary operator. The royalties are derived principally from mineral title which provides a perpetual interest in royalty lands.
2021
Acquisition of Condestable Gold and Silver Stream – Peru
On March 8, 2021, the Company closed, through a wholly-owned subsidiary, a precious metals stream agreement with reference to the gold and silver production from the Condestable mine in Peru, for an up-front deposit of $165.0 million. The Condestable mine is located approximately 90 kilometers south of Lima, Peru, and is owned and operated by a subsidiary of Southern Peaks Mining LP (“SPM”), a private company. Commencing on January 1, 2021 and ending December 31, 2025, Franco-Nevada will receive 8,760 ounces of gold and 291,000 ounces of silver annually until a total of 43,800 ounces of gold and 1,455,000 ounces
8
of silver have been delivered (the “Fixed Deliveries”). Thereafter, Franco-Nevada will receive 63% of the contained gold and contained silver produced until a cumulative total of 87,600 ounces of gold and 2,910,000 ounces of silver have been delivered (the “Variable Phase 1 Deliveries”). The stream then reduces to 25% of gold and silver produced in concentrate over the remaining life of mine (the “Variable Phase 2 Deliveries”). Franco-Nevada will pay 20% of the spot price for gold and silver for each ounce delivered under the stream (the “Ongoing Payment”). The stream has an effective date of January 1, 2021, with the first quarterly delivery received March 15, 2021.
Until March 8, 2025, subject to certain restrictions, a subsidiary of SPM may, at its option, make a one-time special delivery comprising the number of ounces of refined gold equal to $118.8 million at the then current spot price subject to the Ongoing Payment, to achieve the early payment of the Fixed Deliveries and Variable Phase 1 Deliveries. The Variable Phase 2 Deliveries would commence immediately thereafter.
Acquisition of Séguéla Royalty – Côte d'Ivoire
On March 30, 2021, the Company acquired a 1.2% NSR on Fortuna Silver Mines Inc.’s (“Fortuna”) Séguéla gold project in Côte d'Ivoire for $15.2 million (A$20.0 million). The royalty agreement is subject to a buy-back at the option of Fortuna of up to 50% of the royalty at a pro rata portion of the purchase price for a period of up to three years after closing.
Acquisition of Vale Royalty – Brazil
On April 16, 2021, we acquired 57 million of Vale S.A.’s (“Vale”) outstanding participating debentures (the “Royalty”) for $538 million (R$3,049,500,000). The Royalty terms, on a 100% basis, provide for a 1.8% (0.264% attributable) net sales royalty on (i) iron ore sales from Vale’s Northern System, including the Serra Norte, Serra Sul and Serra Leste operations, and (ii) an estimated 70% of iron ore sales capacity from Vale’s Southeastern System, in the medium term, including from the Itabira, Minas Centrais (Brucutu) and Mariana (Fazendão) mining complexes. The Southeastern System will start contributions under the Royalty once a cumulative sales threshold of 1.7 Bt of iron ore has been reached, currently forecast by Vale to be achieved between 2024 and 2025. The Royalty also provides for a 2.5% (0.367% attributable) net sales royalty on certain copper and gold assets and 1.25% (0.183% attributable) in the case of the Sossego mine. Additionally, the Royalty provides for a 1% (0.147% attributable) net sales royalty on all other minerals (covered mining rights include prospective deposits for other minerals including zinc and manganese, amongst others), subject to certain thresholds. The 1% rate (0.147% attributable) also applies to net proceeds in the event of an underlying asset sale.
Royalty payments are declared on a semi-annual basis on March 31st and September 30th of each year reflecting sales in the preceding half calendar year period.
The transaction was financed with a combination of cash on hand and a draw of $150.0 million on our $1 billion corporate revolving credit facility. The amount drawn was fully repaid by June 30, 2021.
Investment in Labrador Iron Ore Royalty Corporation – Canada
The Company has accumulated a 9.9% equity investment in Labrador Iron Ore Royalty Corporation (“LIORC”). The position was acquired over a number of years for a total investment of $74.2 million (C$93 million), representing an average cost of $11.72 (C$14.72) per share. The investment in LIORC functions similar to a royalty given the flow through of revenue generated from LIORC’s underlying 7% gross overriding royalty interest, C$0.10 per tonne commission, and 15.1% equity interest in Iron Ore Company of Canada’s (“IOC”) Carol Lake mine, operated by Rio Tinto. LIORC normally pays cash dividends from net income derived from IOC to the maximum extent possible, while maintaining appropriate levels of working capital. The dividends the Company receives from LIORC are reflected in revenue from the Company’s Diversified assets and included in the calculation of GEOs sold.
Acquisition of Rosemont/Copper World Royalty Interest – U.S.A.
On November 26, 2021, the Company acquired from certain private sellers, through a wholly-owned subsidiary, an existing 0.585% NSR royalty interest on Hudbay Minerals Inc.’s (“Hudbay”) Rosemont copper project. With the acquisition of this royalty, which has identical terms as the Company’s existing 1.5% NSR royalty and covers the same land package, including most of the Copper World deposits, the Company now has a 2.085% NSR over the project.
The total consideration for the 0.585% NSR royalty interest was up to $19.5 million, comprised of $7.0 million paid on closing of the transaction, and up to $12.5 million in contingent payments upon achievement of certain milestones at Rosemont and/or the Copper World deposits.
Investment in Skeena Resources Limited (Eskay Creek) – Canada
On December 23, 2021, for the aggregate purchase price of $17.2 million (C$22.1 million), (i) the Company acquired 1,471,739 common shares of Skeena Resources Limited (“Skeena”), (ii) the Company entered into an agreement with Skeena to amend the terms of the Company’s existing 1% NSR royalty agreement such that the existing royalty will now cover substantially all of the Eskay Creek gold-silver project (“Eskay Creek”) land package, including all currently known mineralized zones, and (iii) Skeena granted the Company a right of first refusal (the “ROFR”) over the sale of a 0.5% NSR royalty (the “0.5% NSR Royalty”) on Eskay Creek.
9
If Skeena has not sold the 0.5% NSR Royalty by October 2, 2023, the Company will have the right to purchase the 0.5% NSR Royalty for C$22.5 million.
Acquisition of U.S. Oil & Gas Royalty Rights with Continental Resources, Inc.
Through a wholly-owned subsidiary, the Company has a strategic relationship with Continental Resources, Inc. (“Continental”) to acquire, through a jointly-owned entity (the “Royalty Acquisition Venture”), royalty rights within Continental’s areas of operation. In 2021, the Company recorded contributions to the Royalty Acquisition Venture of $22.4 million. As at December 31, 2021, the Company’s cumulative investment in the Royalty Acquisition Venture totaled $428.4 million and the Company has remaining commitments of $91.6 million.
Credit Facilities
On July 9, 2021, the Company renewed its $1.0 billion unsecured revolving term credit facility (the “Corporate Revolver”) under substantially the same terms, extending the maturity date from March 22, 2024 to July 9, 2025. In April 2021, the Company drew down $150.0 million from the Corporate Revolver to finance part of the acquisition cost of the Vale Royalty Debentures. The amount drawn was fully repaid by June 30, 2021. As at December 31, 2021, there were no amounts borrowed against the Company’s revolving credit facilities. The Company has posted security in the form of standby letters of credit in the amount of $18.2 million (C$23.1 million) in connection with the audit by the CRA. The standby letters of credit reduce the available balance under the Corporate Revolver.
On March 16, 2021, Franco-Nevada (Barbados) Corporation amended its $100.0 million unsecured revolving credit facility (the “FNBC Revolver”) to extend the term by an additional year. The FNBC Revolver has a maturity date of March 20, 2022. However, the Company does not intend to renew the term of the FNBC Revolver, such that the facility will not be available to draw on after March 20, 2022.
Cobre Panama Constitutional Proceedings
In relation to the ongoing constitutional proceedings in connection with Minera Panama SA’s (“MPSA”) mining concession contract, First Quantum Minerals Ltd. (“First Quantum”) reported that, in July 2021, the Government of Panama announced the appointment of a high-level commission of senior government ministers and officials, chaired by the Minister of Commerce, to discuss First Quantum’s concession contract. In September 2021, the Supreme Court upheld its ruling in respect of the clarification motions presented by First Quantum to the Court in relation to its Law 9 decision announced in September 2018 and the ruling was gazetted in Q4 2021. First Quantum’s understanding is that the upholding of the unconstitutionality ruling against Law 9 of 1997 does not have retroactive effects, pursuant to article 2573 of the Code of Judicial Proceedings of Panama, therefore the approval of the mining concession contract which occurred in 1997 with the enactment of Law 9, remains unaltered, providing operation continuity as per status quo. In September 2021, the Ministry of Commerce publicly announced the culmination of the high-level formal discussions on two topics being environmental and labour matters.
During January 2022, the Government of Panama tabled a new proposal, namely that the Government should receive $375 million in benefits per year from Cobre Panama and that the existing revenue royalty payable to the Government will be replaced by a gross profit royalty. The parties continue to finalize the detail behind these proposed principles, including the appropriate mechanics that would achieve the desired outcome, the necessary protections to First Quantum’s business for downside copper price impact and production scenarios and ensuring that the new contract and legislation are both durable and sustainable.
Once an agreement is concluded and the full contract is documented, it is expected that newly drafted legislation would be put to the National Assembly. First Quantum noted that it welcomes the transparency of the robust ministerial commission process and it is hopeful that this matter can be concluded shortly.
Franco-Nevada does not expect the current proposal to have a material impact on future deliveries pursuant to our stream agreement.
CRA Review
The CRA is conducting an audit of Franco-Nevada’s 2012-2017 taxation years and has issued a series of reassessments to the Company and certain of its subsidiaries. A description of the matters and amounts at issue is included in the notes to Franco-Nevada’s financial statements for the year ended December 31, 2021.
2022 Guidance and 5-Year Outlook
The following contains forward looking statements about our guidance for 2022 and 5-year outlook. Reference should be made to the “Forward Looking Statements” section at the beginning of this AIF. For a description of material factors that could cause our actual results to differ materially from the forward looking statements below, please see the “Forward Looking Statements” section of this AIF and the “Risk Factors” section of this AIF filed with the Canadian securities regulatory authorities on www.sedar.com and our most recent Form 40-F filed with the SEC on www.sec.gov. The 2022 guidance and 5-year outlook are based on assumptions including the forecasted state of operations from our assets based on the public statements and other disclosures by the third-party owners and operators of the underlying properties and our assessment thereof.
10
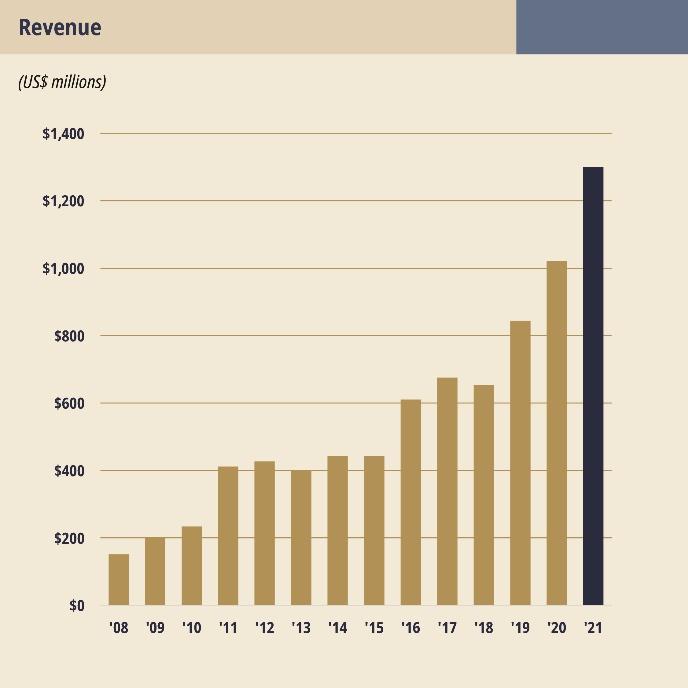
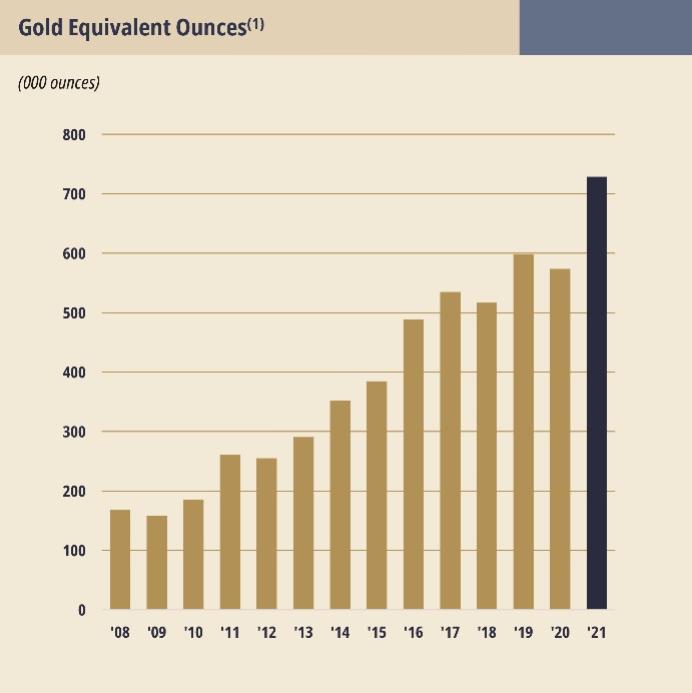
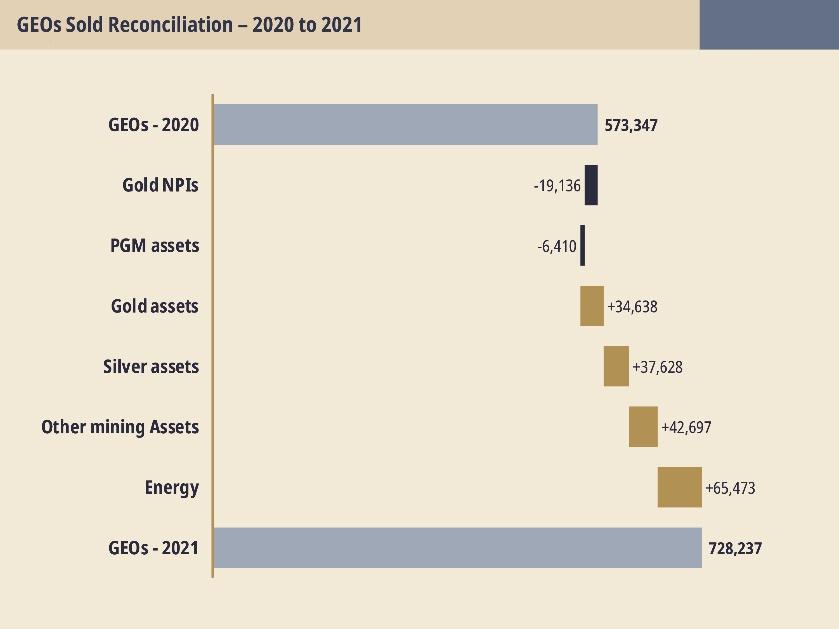
2021 was a year of significant growth for Franco-Nevada, with record revenue and a 27.0% year-over-year increase in total GEOs. In 2022, we anticipate a slightly lower production profile in comparison to 2021, as detailed below:
|
|
| 2022 guidance |
|
| 2021 Actual |
|
| 2020 Actual |
|
Total Gold & Gold Equivalent Ounce sales | | | 680,000 - 740,000 | | | 728,237 | | | 573,347 | |
Precious Metal Gold & Gold Equivalent Ounce sales | | | 510,000 - 550,000 | | | 558,397 | | | 511,677 | |
| (1) | We expect our streams to contribute between 385,000 and 425,000 of our GEO sales. For the year ended December 31, 2021, 418,982 of our GEOs sold were from streams. |
| (2) | For our 2022 guidance and 5-year outlook as set out below, when reflecting revenue earned from gold, silver, platinum, palladium, iron ore, oil and gas commodities to GEOs, we assumed the following prices: $1,800/oz Au, $23.00/oz Ag, $1,000/oz Pt, $2,100/oz Pd, $125/tonne Fe 62% CFR China, $85/bbl WTI oil and $3.75/mcf Henry Hub natural gas. |
| (3) | Our 2022 guidance and 5-year outlook as set out below do not assume any other acquisitions and do not reflect any incremental revenue from additional contributions we may make to the Royalty Acquisition Venture with Continental as part of our remaining commitment of $91.6 million. |
Precious Metals
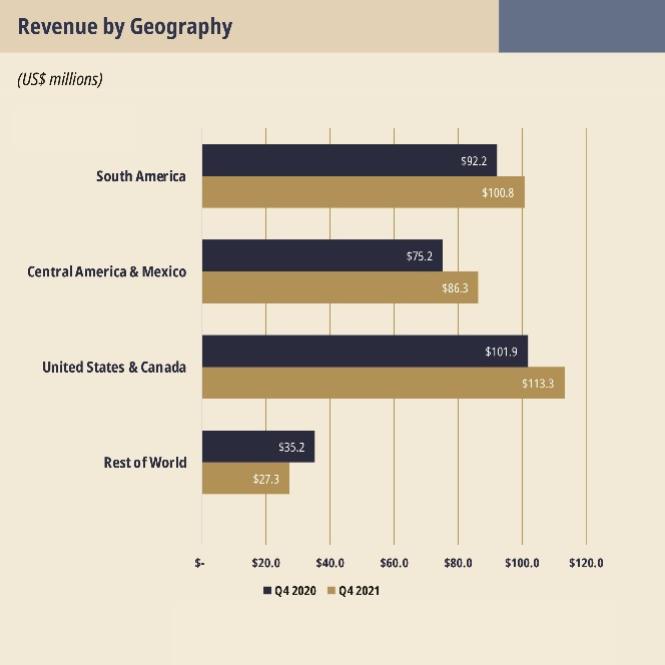
• | South America: For Candelaria, we expect between 60,000 and 70,000 GEOs sold, relatively consistent with GEOs sold in 2021. While we expect production to benefit from initiatives to debottleneck the plant pebble crushing circuit, the effect of these initiatives are not expected to be realized until early 2023. For Antapaccay, we anticipate production to decrease from 62,411 GEOs in 2021 to between 47,500 and 57,500 GEOs due to expected lower grades based on the sequencing of the life of mine plan. For Antamina, in 2021, we benefited from strong silver production, realizing sales of 3.8 million silver ounces in the year. For 2022, we anticipate deliveries to revert to the higher end of our long-term expected range of 2.8 million to 3.2 million silver ounces. |
• | Central America & Mexico: Copper production at Cobre Panama is expected to increase with First Quantum announcing guidance of between 330,000 and 360,000 tonnes in 2022, up from 331,000 tonnes produced in 2021. However, while copper production at the mine is expected to increase, we expect deliveries of gold and silver ounces to Franco-Nevada to be between 120,000-140,000 GEOs, relatively consistent with 2021. Our deliveries in 2021, which totaled 131,062 GEOs, included ounces that had been produced in Q4 2020 but where shipment was delayed to Q1 2021. For Guadalupe-Palmarejo, we expect a decrease in GEOs for 2022, to between 35,000 and 45,000 GEOs, as GEO production in 2021 was particularly strong due to higher mill throughput and significant production sourced from ground covered by our stream. |
• | United States: While we expect relatively consistent PGM production at Stillwater, we anticipate that lower platinum and palladium prices will convert to fewer GEOs than in 2021 based on the commodity prices we assumed for our 2022 guidance. We also expect fewer GEOs from Goldstrike, as payments received in 2021 included $7.1 million in royalties related to prior periods which are not expected to recur in 2022. |
• | Canada: We expect lower royalties from our Hemlo NPI as production shifts away from our royalty ground. We anticipate this decrease to be partly offset by higher production from McCreedy West based on the life of mine plan, and by the resumption of royalty payments from our NPI on Musselwhite. |
• | Rest of World: We anticipate increased production from our Subika (Ahafo) royalty, as production from Ahafo is expected to increase to 650,000 ounces in 2022, up from 481,000 ounces in 2021. In addition, Franco-Nevada expects a larger proportion of production to be sourced from ground covered by our royalty. Production at Tasiast is also expected to increase significantly as the mine has returned to full production after a mill fire in June 2021, and continues to incrementally increase throughput capacity to 24,000 tonnes per day. |
Diversified
• | Iron ore: We benefited from record iron ore prices in 2021. Our Vale Royalty generated GEOs that achieved the high-end of our expected range and LIORC paid the highest amount of dividends of any year since we acquired our equity stake in 2015. Iron ore prices have decreased from the record highs in mid-2021. We have assumed $125/tonne 62% Fe benchmark iron ore prices for 2022, slightly below recent spot prices. At these prices, we expect our Diversified Mining assets to contribute between 35,000 and 55,000 GEOs, compared to 52,584 GEOs in 2021. |
• | Energy: Our Energy assets were significant contributors to our 2021 revenue as a result of the rally in oil and gas prices in the year, generating 117,256 GEOs in 2021. For 2022, we have assumed commodity prices of $85/bbl WTI for oil and $3.75/mcf Henry Hub for natural gas which are below recent spot prices. Based on these prices, we expect between 125,000 and 145,000 GEOs from our Energy assets. Production from our U.S. assets is expected to be consistent with volumes produced in 2021. Recently acquired royalties under our Royalty Acquisition Venture with Continental are expected to provide additional volume contribution. This is expected to be partly offset by a decrease in production from the Midland basin, which performed particularly well in 2021 due to the drilling of a number of new high-royalty wells on our acreage. Underlying performance from our Canadian assets is expected to remain stable, however, the Weyburn NRI volumes, which are accounted for net of operating and capital costs, should benefit from strong commodity prices. |
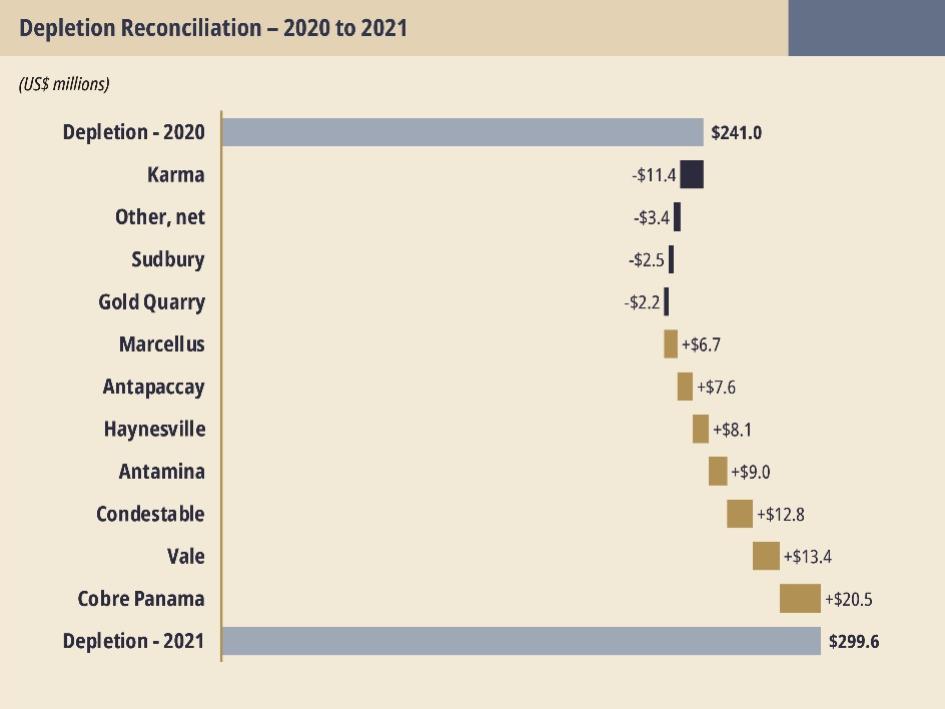
Depletion: We estimate depletion and depreciation expense in 2022 to be between $270.0 million and $300.0 million, compared to depletion and depreciation expense of $299.6 million in 2021.
11
Capital commitments: As of December 31, 2021, our remaining capital commitment to the Royalty Acquisition Venture with Continental is $91.6 million.
5-Year Outlook
We expect our portfolio to produce between 765,000 and 825,000 GEOs by 2026, of which 570,000 to 610,000 GEOs are expected to be generated from Precious Metal assets. This outlook assumes that Cobre Panama will have expanded its mill throughput capacity to 100 million tonnes per year during 2023. It also assumes the commencement of production at Salares Norte, Greenstone (Hardrock), Rosemont, Valentine Lake, and Eskay Creek, continued deliveries from Sudbury through 2026, and that the stream at MWS will have reached its cap in 2024.
12
EXPLANATION OF ROYALTIES, STREAMS AND OTHER INTERESTS
A royalty is a payment to a royalty holder by a property owner or an operator of a property and is typically based on a percentage of the minerals or other products produced or the revenues or profits generated from the property. The granting of a royalty to a person usually arises as a result of: (i) paying part of the consideration payable to land owners, prospectors or junior mining companies for the purchase of their property interests; (ii) providing capital in exchange for granting a royalty; or (iii) converting a participating interest in a joint venture relationship into a royalty.
Royalties are not typically working interests in a property. Therefore, depending on the nature of the royalty interest and the laws applicable to the royalty and project, the royalty holder is generally not responsible for, and has no obligation to contribute, additional funds for any purpose, including, but not limited to, operating or capital costs, or environmental or reclamation liabilities. Typically, royalty interests are established through a contract between the royalty holder and the property owner, although many jurisdictions permit the holder to also register or otherwise record evidence of a royalty interest in applicable mineral title or land registries. The unique characteristics of royalties may provide royalty holders with special commercial benefits not available to the property owner because the royalty holder may enjoy the upside potential of the property with reduced risk.
Revenue-based Royalties: The majority of royalty revenues that Franco-Nevada receives are royalties based on revenues from the value of production. The key types of revenue-based royalties are described in general terms below:
Net Smelter Return (“NSR”) royalties are based on the value of production or net proceeds received by the operator from a smelter or refinery. These proceeds are usually subject to deductions or charges for transportation, insurance, smelting and refining costs as set out in the royalty agreement. For gold royalties, the deductions are generally minimal, while for base metal projects the deductions can be much more substantial. This type of royalty generally provides cash flow that is free of any operating or capital costs and environmental liabilities. A smaller percentage NSR in a project can effectively equate to the economic value of a larger percentage profit or working interest in the same project.
Gross Royalties (“GR”) or Gross Overriding Royalties (“GORR”) are based on the total revenue stream from the sale of production from the property with few, if any, deductions. Some contracts refer to gross proceeds (“GP”) which have been characterized as comparable to GRs in this document.
Overriding Royalties (“ORR”) and Lessor or Freehold Royalties (“FH”) are based on the proceeds from gross production and are usually free of any operating, capital and environmental costs. These terms are usually applied in the oil & gas industry.
Profit-based Royalties: Franco-Nevada also receives a portion of its revenues from royalties that are calculated based on profits, as described below:
Net Profit Interest (“NPI”) is based on the profit realized after deducting costs related to production as set out in the royalty agreement. NPI payments generally begin after payback of capital costs. Although the royalty holder is generally not responsible for providing capital, covering operating losses or environmental liabilities, increases in production costs will affect net profits and royalties payable.
Net Royalty Interest (“NRI”) is paid net of operating and capital costs similar to an NPI.
Fixed Royalties: Franco-Nevada has a small number of fixed royalties. These are royalties that are paid based on a set rate per tonne mined, produced or processed or even a minimum for a period of time rather than as a percentage of revenue or profits. These types of royalties are more common for iron ore, coal and industrial minerals and usually do not have exposure to changes in the underlying commodity price.
The royalty types listed above can include additional provisions that allow them to change character in different circumstances or have varying rates. Some examples are as follows:
Minimum Royalty (“MR”) is a provision included in some royalties that requires fixed payments at a certain level even if the project is not producing, or the project is producing at too low a rate to achieve the minimum.
Advance Minimum Royalty (“AMR”) is similar to an MR except that, once production begins, the minimum payments already paid are often credited against subsequent royalty payments from production that exceeds the minimum.
Sliding Scale Royalty (“Sliding Scale” or “ss”) refers to royalties where the royalty percentage is variable. Generally this royalty percentage is indexed to metal prices or a production threshold. Generally, a minimum or maximum percentage would be applied to such a royalty.
Capped Royalty (“Capped”) refers to royalties that expire or cease payment after a particular cumulative royalty amount has been paid or a set production volume threshold or time period has been reached.
Royalties can be commodity specific and, for instance, apply only to gold or hydrocarbons or have varying royalty structures for different commodities from the same property. Royalties can be restricted or varied by metallurgy, ore type or even by stratigraphic
13
horizon. Generally, the contract terms for royalties in the oil & gas business are more standardized than those found in the mineral business.
Streams: Streams are distinct from royalties. They are metal purchase agreements where, in exchange for an upfront deposit and ongoing payments for metal delivered, the holder purchases all or a portion of one or more metals produced from a mine, at a preset price. In the case of gold, the agreements typically provide for the purchase price to be the spot price at the time of delivery with a fixed price per ounce (typically the lesser of (i) $400 per ounce with a small inflationary adjustment and (ii) the spot price at the time of delivery) or a percentage of the spot price for gold payable in cash (the “Ongoing Price”) and the balance paid by applying the upfront deposit. Once the upfront deposit is fully applied, the purchase price is the Ongoing Price. Precious metals streams are well suited to co-product production providing incentive to the operator to produce the precious metals. Because streams can also be used as a form of financing a project, the stream structure may also help maintain the borrowing capacity for the project. Streams can provide higher leverage to commodity price changes when structured with a fixed purchase price per ounce.
Working Interests (“WI”): A working interest is significantly different than a royalty or stream in that a holder of a WI owns an undivided possessory interest in the land or leasehold itself, and is liable for its share of capital, operating and environmental costs, usually in proportion to its ownership percentage, and it receives its pro-rata share of revenue. Minority working or equity interests are not considered to be royalties because of the ongoing funding commitments, although they can be similar in their calculations to NPIs.
Example Economics of a Royalty (NSR or NPI) versus a Stream
The example below compares the value per ounce to Franco-Nevada of a 4% NSR, a 4% stream or a 4% NPI or WI. Assume for one ounce of gold, a sales price of $1,800, a “stream cost” of $400 per ounce and that the “all-in sustaining cost”(1) of the mine is $1,026 per ounce.
|
| | |
| | |
| Developed |
| |
| | NSR | | Stream | | NPI or WI |
| |||
One ounce sold at | | $ | 1,800 | | $ | 1,800 | | $ | 1,800 | |
Applicable cost | |
| — | | $ | 400 | | $ | 1,026 | (1) |
Margin for calculation | | $ | 1,800 | | $ | 1,400 | | $ | 774 | |
| | | | | | | | | | |
NSR, Stream or NPI % | |
| 4 | % |
| 4 | % |
| 4 | % |
Revenue per ounce to FNV | | $ | 72 | | $ | 56 | | $ | 31 | |
| (1) | For applicable costs for a developed NPI or WI, Franco-Nevada is, for illustrative purposes, assuming Barrick Gold Corporation’s (“Barrick”) 2021 all-in sustaining cash cost measure, as Barrick is the operator of two assets at which Franco-Nevada has NPI interests. |
Based on the above economics, a comparable percentage NSR is 2.3 times more valuable than an equivalent Developed NPI or WI and almost 1.3 times more valuable than a stream interest. The NSR provides the highest margins and most downside protection to changes in the commodity price. The stream provides commodity price leverage similar to a low cost operating company with certainty as to future costs. The NPI or WI provides the most leverage to commodity price.
14
TECHNICAL AND THIRD-PARTY INFORMATION
Except where otherwise stated, the disclosure in this AIF relating to properties and operations on the properties in which Franco-Nevada holds royalty, stream or other interests is based on information publicly disclosed by the owners or operators of these properties and information/data available in the public domain as at March 11, 2022 (except where stated otherwise), and none of this information has been independently verified by Franco-Nevada. Specifically, as a royalty or stream holder, Franco-Nevada has limited, if any, access to properties included in its asset portfolio. Additionally, Franco-Nevada may from time to time receive operating information from the owners and operators of the properties, which it is not permitted to disclose to the public. Franco-Nevada is dependent on the operators of the properties and their qualified persons to provide information to Franco-Nevada or on publicly available information to prepare disclosure pertaining to properties and operations on the properties on which Franco-Nevada holds royalty, stream or other interests and generally has limited or no ability to independently verify such information. Although Franco-Nevada does not have any knowledge that such information may not be accurate, there can be no assurance that such third-party information is complete or accurate. Some information publicly reported by operators may relate to a larger property than the area covered by Franco-Nevada’s royalty, stream or other interest. Franco-Nevada’s royalty, stream or other interests often cover less than 100% and sometimes only a portion of the publicly reported mineral reserves, mineral resources and production of a property.
Except where otherwise noted, the disclosure in this AIF relating to mineral reserve and mineral resource statements for individual properties is made as at December 31, 2021. In addition, such numerical information presented in this AIF which has been derived from information publicly disclosed by owners or operators may have been rounded by Franco-Nevada and, therefore, there may be some inconsistencies between the significant digits presented in this AIF and the information publicly disclosed by owners and operators.
Franco-Nevada considers its stream interests in the Antamina project, the Antapaccay project, the Candelaria project and the Cobre Panama project to be its only material mining projects for the purposes of NI 43-101. Franco-Nevada will continue to assess the materiality of its assets as new assets are acquired or move into production. During 2022, Franco-Nevada intends to continue to evaluate whether the inclusion of the Summary of Mineral Reserves and Mineral Resources contained in this AIF should be continued to be included going forward. For additional information, please refer to Franco-Nevada’s most recent Asset Handbook which can be found on our website.
Information contained in this AIF with respect to each of the Antamina project, the Antapaccay project, the Candelaria project and the Cobre Panama project has been prepared in accordance with the exemption set forth in section 9.2 of NI 43-101.
Unless otherwise noted, the disclosure contained in this AIF of a scientific or technical nature for the Antamina project is based on (i) the technical report entitled “Technical Report, Mineral Reserves and Resources, Antamina Deposit, Peru 2010” and dated January 31, 2011, which technical report was prepared for Compañía Minera Antamina S.A. (“CM Antamina”), and filed under Teck’s SEDAR profile on March 22, 2011; (ii) the news release dated February 2, 2022 of Glencore plc (“Glencore”) containing the Glencore 2021 Production Report, available on Glencore’s website, and which reports silver production for the Antamina project; and (iii) the information disclosed in the annual information form of Teck Resources Limited (“Teck”) dated February 23, 2022 and filed under Teck’s SEDAR profile on February 25, 2022.
The disclosure contained in this AIF of a scientific or technical nature for the Antapaccay project is based on (i) the information disclosed in the document entitled “Antapaccay Mining and Technical Information” and dated effective February 10, 2016, which document was prepared by Compañía Minera Antapaccay S.A. (“CM Antapaccay”), the owner and operator of the Antapaccay project and an indirect wholly-owned subsidiary of Glencore, available on CM Antapaccay’s website at www.glencoreperupublicaciones.com/publication/db414077; (ii) the Glencore Statement of Resources & Reserves as at December 31, 2021; and (iii) the news release dated February 2, 2022 of Glencore containing the Glencore 2021 Production Report, each of (ii) and (iii) available on Glencore’s website.
The disclosure contained in this AIF of a scientific or technical nature for the Candelaria project is based on (i) the technical report entitled “Technical Report for the Candelaria Copper Mining Complex, Atacama Province, Region III, Chile” dated November 28, 2018 which technical report was prepared for Lundin Mining Corporation (“Lundin”) and filed under Lundin’s SEDAR profile on November 28, 2018 (the “Candelaria Technical Report”); (ii) the information disclosed in the annual information form of Lundin dated February 17, 2022 and filed under Lundin’s SEDAR profile on February 17, 2022; (iii) Lundin’s press release dated September 13, 2021 announcing Mineral Reserves and Mineral Resources as of June 30, 2021; and (iv) the management’s discussion and analysis of Lundin for the year ended December 31, 2021, dated as of February 17, 2022 and filed under Lundin’s SEDAR profile on February 17, 2022.
The disclosure contained in this AIF for the Cobre Panama project is based on (i) the technical report entitled “Cobre Panamá Project -- Colón Province, Republic of Panamá -- NI 43-101 Technical Report” and dated March 2019, which was prepared for First Quantum and filed under First Quantum’s SEDAR profile on March 29, 2019 (“Cobre Panama Technical Report”); (ii) the management’s discussion and analysis of First Quantum for the year ended December 31, 2021 and filed under First Quantum’s SEDAR profile on February 16, 2022; (iii) the information disclosed in the annual information form of First Quantum dated March
15
29, 2021 and filed under First Quantum’s SEDAR profile on March 29, 2021; and (iv) the news release dated February 15, 2022 of First Quantum containing the year end 2021 results, and filed under First Quantum’s SEDAR profile on February 16, 2022.
The technical and scientific information contained in this AIF including relating to the Antamina project, the Antapaccay project, the Candelaria project and the Cobre Panama project was reviewed and approved in accordance with NI 43-101 by Phil Wilson, C.Eng., Vice President, Technical of the Corporation and a “Qualified Person” as defined in NI 43-101.
Reconciliation to CIM Definitions
In this AIF, Franco-Nevada has disclosed a number of resource and reserve estimates covering properties related to the mining assets that are not based on Canadian Institute of Mining, Metallurgy and Petroleum (“CIM”) definitions, but instead have been prepared in reliance upon JORC, SAMREC, SEC Industry Guide 7, and S-K 1300 (collectively, the “Acceptable Foreign Codes”). Estimates based on Acceptable Foreign Codes are recognized under NI 43-101 in certain circumstances.
In each case, the mineral resources and mineral reserves reported in this AIF are based on estimates previously disclosed by the relevant property owner or operator, without reference to the underlying data used to calculate the estimates. Accordingly, Franco-Nevada is not able to reconcile the resource and reserve estimates prepared in reliance on an Acceptable Foreign Code with that of CIM definitions. Franco-Nevada previously sought confirmation from one of its technical advisory firms, that is comprised of engineers experienced in the preparation of resource and reserve estimates using CIM and each of the Acceptable Foreign Codes, of the extent to which an estimate prepared under an Acceptable Foreign Code would differ from that prepared under CIM definitions. Franco-Nevada was advised that, while the CIM definitions are not identical to those of the Acceptable Foreign Codes, the resource and reserve definitions and categories are substantively the same as the CIM definitions mandated in NI 43-101 and will typically result in reporting of substantially similar reserve and resource estimates. Such advisors further confirmed, without reference to the procedures in which the estimates prepared using Acceptable Foreign Codes that are reproduced in this AIF were conducted, that in the course of their preparation of a resource or reserve estimate they would effectively use the same procedures to prepare and report the resource or reserve estimate regardless of the reliance on CIM or any of the Acceptable Foreign Codes. Such advisors noted two provisos to this confirmation, being (i) SEC Industry Guide 7 prohibited the reporting of resources, and only permits reporting of reserves, and (ii) it was generally accepted practice that staff at the SEC expected to see metals prices based on historic three year average prices in connection with reserves reported in accordance with SEC Industry Guide 7, while each of CIM and the other Acceptable Foreign Codes permits the author of a resource or reserve estimate to use his or her discretion to establish a reasonable assumed metal price in such calculations. See “Cautionary Note Regarding Mineral Reserve and Resource Reporting Estimates”.
16
Franco-Nevada’s assets are categorized by commodity and stage of development. By commodity, assets are characterized as “Precious Metals” or “Diversified”. “Precious Metals” includes gold, silver, and PGM assets. “Diversified” includes iron ore, other mining and energy assets (which encompass oil, gas and natural gas liquids). “Producing” assets are those that have generated revenue from steady-state operations for Franco-Nevada or are expected to in the next year. “Advanced” assets are interests on projects which are not yet producing, but where in management’s view, the technical feasibility and commercial viability of extracting a mineral resource are demonstrable. “Exploration” assets represent interests on projects where technical feasibility and commercial viability of extracting a mineral resource are not demonstrable.
Management uses the following criteria in its assessment of technical feasibility and commercial viability:
(i) | Geology: there is a known mineral deposit which contains mineral reserves or resources; or the project is adjacent to a mineral deposit that is already being mined or developed and there is sufficient geologic certainty of converting the deposit into mineral reserves or resources. |
(ii) | Accessibility and authorization: there are no significant unresolved issues impacting the accessibility and authorization to develop or mine the mineral deposit, and social, environmental and governmental permits and approvals to develop or mine the mineral deposit appear obtainable. |
For accounting purposes, the number of assets has been counted in different manners depending on the category. Royalties on a producing or advanced property are generally counted as a single asset even if Franco-Nevada has multiple different royalties on the property, such as at the Goldstrike complex. Streams covering a group of mines in close proximity and operated by a common operator such as the Sudbury streams have also been counted as one asset. However, royalties and streams on producing properties that have significant co-products have been counted twice, such as the Robinson royalties for gold and copper or the Sudbury streams for gold and PGM. Exploration royalties are simply counted by the number of royalty contracts and no effort has been made to consolidate royalties on the same property. Franco-Nevada’s energy interests are subdivided into Producing Assets, which are assets that are currently producing oil or natural gas, or Exploration Assets, which are undeveloped assets that are not producing oil or natural gas. Franco-Nevada’s energy interests consist of a variety of working interests and royalty interests which are derived from a large number of underlying leases, contractual agreements and mineral title covering land positions primarily in western Canada and Oklahoma, Pennsylvania and Texas in the United States. For accounting purposes, these leases, contracts and mineral title have been grouped into distinct land areas and tabulated as individual assets. In many cases, Franco-Nevada owns multiple royalties or working interests that pertain to the same land area, and in these circumstances, the interests are counted as a single asset.
As of March 17, 2022, Franco-Nevada estimates that it holds 222 precious metals assets and 183 diversified assets for a total of 405 assets.
Franco-Nevada Asset Tabulation at March 17, 2022 | ||||||||||
|
|
| Precious Metals |
|
| Diversified |
|
| TOTAL |
|
Producing | |
| 45 | |
| 67 | |
| 112 | |
Advanced | |
| 36 | |
| 7 | |
| 43 | |
Exploration | |
| 141 | |
| 109 | |
| 250 | |
TOTAL | |
| 222 | |
| 183 | |
| 405 | |
|
17
Summary of Mineral Reserves and Mineral Resources
The Mineral Reserves and Mineral Resources tabulated in this AIF reflect the most recent publicly disclosed figures by the operators of the assets (converted to a 100% basis where appropriate) in which Franco-Nevada has interests. However, Franco-Nevada’s interests often do not cover the entire Mineral Reserve and Mineral Resource that is publicly reported by the operator. This could be a result of the underlying agreement not applying to the entire property or due to the underlying agreement not applying to 100% of the disclosed Mineral Reserves and Mineral Resources. In such cases, Franco-Nevada is reporting either that portion of the Mineral Reserve and Mineral Resource covered by its interests or is providing its best approximation as to the appropriate percentage covered by Franco-Nevada’s interests.
| | | | | Mineral Reserves | | | Est. % of Mineral | | ||||||||||||||||||
| | | | | Proven | | | Probable | | | Proven & Probable | | | Reserves & | | ||||||||||||
| | | | | Tonnes |
| Grade |
| Contained |
|
| Tonnes |
| Grade |
| Contained |
|
| Tonnes |
| Grade |
| Contained |
|
| Resources Covered | |
GOLD - SOUTH AMERICA | | Notes | | | 000s | | g/t | | 000 oz | | | 000s | | g/t | | 000 oz | | | 000s | | g/t | | 000 oz | | | by FNV Interest | |
Candelaria |
| 3,4 |
| | 540,929 |
| 0.12 |
| 2,100 | |
| 134,645 |
| 0.16 |
| 700 | |
| 675,574 |
| 0.12 |
| 2,700 | | | 80 | % |
Antapaccay |
| 5 |
| | 189,000 |
| 0.08 |
| 486 | |
| 286,000 |
| 0.08 |
| 736 | |
| 475,000 |
| 0.08 |
| 1,222 | | | 100 | % |
Condestable | | 6 | | | 20,546 |
| 0.19 |
| 128 | | | 7,376 |
| 0.18 |
| 42 | | | 27,922 |
| 0.19 |
| 170 | | | 100 | % |
Sossego | | 7 | | | 59,200 | | 0.24 | | 457 | | | 39,100 | | 0.10 | | 126 | | | 98,300 | | 0.19 | | 583 | | | 100 | % |
Cerro Moro |
| 8 |
| | 365 |
| 9.27 |
| 109 | |
| 1,384 |
| 7.82 |
| 348 | |
| 1,749 |
| 8.12 |
| 457 | | | 100 | % |
Salares Norte | | 9 | | | — | | — | | — | | | 21,079 | | 5.13 | | 3,476 | | | 21,079 | | 5.13 | | 3,476 | | | 100 | % |
Cascabel | | 10 | | | — | | — | | — | | | — | | — | | — | | | — | | — | | — | | | 100 | % |
Posse (Mara Rosa) | | 11 | | | 11,800 | | 1.20 | | 456 | | | 12,000 | | 1.16 | | 446 | | | 23,800 | | 1.18 | | 902 | | | 100 | % |
Taca Taca | | 12 |
| | 408,300 |
| 0.13 |
| 1,750 | |
| 1,350,200 |
| 0.08 |
| 3,337 | |
| 1,758,500 |
| 0.09 |
| 5,087 | |
| 100 | % |
CentroGold (Gurupi) |
| 13 |
| | — |
| — |
| — | |
| — |
| — |
| — | |
| — |
| — |
| — | | | 100 | % |
Calcatreu | | 14 |
| | — |
| — |
| — | |
| — |
| — |
| — | |
| — |
| — |
| — | |
| 100 | % |
San Jorge | | 15 |
| | — |
| — |
| — | |
| — |
| — |
| — | |
| — |
| — |
| — | |
| 100 | % |
Volcan | | 16 |
| | — |
| — |
| — | |
| — |
| — |
| — | |
| — |
| — |
| — | |
| 5 | % |
GOLD - CENTRAL AMERICA & MEXICO | | | | | | | | | | | | | | | | | | | | | | | | | | | |
Cobre Panama |
| 17 |
| | 236,000 |
| 0.11 |
| 835 | |
| 2,790,500 |
| 0.07 |
| 6,270 | |
| 3,026,600 |
| 0.07 |
| 7,104 | | | 100 | % |
Guadalupe-Palmarejo |
| 2,18 |
| | 3,406 |
| 2.26 |
| 247 | |
| 11,012 |
| 1.80 |
| 637 | |
| 14,418 |
| 1.91 |
| 884 | | | 86 | % |
GOLD - UNITED STATES | | | | | | | | | | | | | | | | | | | | | | | | | | | |
Carlin Trend |
| 19 |
| | 39,024 |
| 6.01 |
| 7,317 | |
| 130,081 |
| 2.70 |
| 11,220 | |
| 162,602 |
| 3.46 |
| 17,886 | | | 35 | % |
Marigold |
| 20 |
| | — |
| — |
| — | |
| 203,800 |
| 0.52 |
| 3,410 | |
| 203,800 |
| 0.52 |
| 3,410 | | | 97 | % |
Bald Mountain |
| 21 |
| | — |
| — |
| — | |
| 40,980 |
| 0.60 |
| 798 | |
| 40,980 |
| 0.60 |
| 798 | | | 95 | % |
Mesquite |
| 22 |
| | 34 |
| 0.79 |
| 1 | |
| 30,264 |
| 0.48 |
| 470 | |
| 30,298 |
| 0.48 |
| 471 | | | 100 | % |
Castle Mountain | | 23 |
| | 84,910 |
| 0.55 |
| 1,498 | |
| 172,990 |
| 0.48 |
| 2,670 | |
| 257,900 |
| 0.51 |
| 4,168 | |
| 100 | % |
Fire Creek/Midas |
| 2,24 |
| | — |
| — |
| — | |
| — |
| — |
| — | |
| — |
| — |
| — | | | 100 | % |
Hollister |
| 2,25 |
| | — |
| — |
| — | |
| — |
| — |
| — | |
| — |
| — |
| — | | | 100 | % |
Stibnite Gold |
| 26 |
| | 4,996 |
| 2.35 |
| 378 | |
| 99,630 |
| 1.39 |
| 4,441 | |
| 104,626 |
| 1.43 |
| 4,819 | | | 100 | % |
Sandman |
| 27 |
| | — |
| — |
| — | |
| — |
| — |
| — | |
| — |
| — |
| — | |
| 100 | % |
Robinson |
| 28 |
| | 110,513 |
| 0.15 |
| 533 | |
| 8,860 |
| 0.12 |
| 34 | |
| 119,374 |
| 0.15 |
| 576 | | | 100 | % |
GOLD - CANADA | | | | | | | | | | | | | | | | | | | | | | | | | | | |
Detour Lake |
| 29 |
| | 80,269 |
| 1.13 |
| 2,917 | |
| 493,044 |
| 0.76 |
| 12,117 | |
| 573,313 |
| 0.82 |
| 15,034 | | | 100 | % |
Sudbury | | 30 | | | not available | | | not available | | | not available | | | not available | | ||||||||||||
Hemlo |
| 31 |
| | 360 |
| 4.79 |
| 55 | |
| 6,100 |
| 5.19 |
| 1,000 | |
| 6,400 |
| 5.16 |
| 1,100 | | | 20 | % |
Brucejack |
| 32 |
| | 2,400 |
| 7.90 |
| 600 | |
| 12,000 |
| 8.40 |
| 3,300 | |
| 14,400 |
| 8.30 |
| 3,900 | | | 100 | % |
Kirkland Lake |
| 33 |
| | 237 |
| 15.30 |
| 116 | |
| 3,315 |
| 16.32 |
| 1,740 | |
| 3,551 |
| 16.26 |
| 1,856 | | | 100 | % |
Dublin Gulch (Eagle) |
| 34 |
| | 30,000 |
| 0.71 |
| 694 | |
| 118,000 |
| 0.63 |
| 2,366 | |
| 148,000 |
| 0.64 |
| 3,061 | | | 100 | % |
Musselwhite |
| 35 |
| | 2,800 |
| 5.07 |
| 460 | |
| 6,700 |
| 6.07 |
| 1,310 | |
| 9,500 |
| 5.77 |
| 1,770 | | | 100 | % |
Timmins West |
| 36 |
| | 1,518 |
| 3.03 |
| 148 | |
| 4,172 |
| 2.94 |
| 393 | |
| 5,690 |
| 2.96 |
| 541 | | | 100 | % |
Canadian Malartic |
| 37 |
| | 42,932 |
| 0.84 |
| 1,160 | |
| 57,516 |
| 1.28 |
| 2,376 | |
| 100,510 |
| 1.09 |
| 3,534 | | | 9 | % |
Island Gold | | 38 | | | 834 |
| 9.33 |
| 250 | | | 3,278 |
| 10.33 |
| 1,088 | | | 4,112 |
| 10.12 |
| 1,338 | | | 90 | % |
Golden Highway - Holt Complex |
| 39 |
| | — |
| — |
| — | |
| — |
| — |
| — | |
| — |
| — |
| — | | | 100 | % |
Golden Highway - Hislop |
| 40 |
| | — |
| — |
| — | |
| — |
| — |
| — | |
| — |
| — |
| — | | | 100 | % |
Golden Highway - Aquarius | | 41 | | | — | | — | | — | | | — | | — | | — | | | — | | — | | — | | | 100 | % |
Greenstone (Hardrock) |
| 42 |
| | 5,623 |
| 1.28 |
| 232 | |
| 129,700 |
| 1.27 |
| 5,307 | |
| 135,323 |
| 1.27 |
| 5,538 | | | 100 | % |
Valentine Lake | | 43 | | | 29,700 | | 1.46 | | 1,400 | | | 17,400 |
| 1.17 |
| 700 | | | 47,100 |
| 1.36 |
| 2,100 | | | 100 | % |
Eskay Creek | | 44 | | | 13,500 | | 4.25 | | 1,850 | | | 12,900 | | 2.46 | | 1,020 | | | 26,400 | | 3.37 | | 2,870 | | | 100 | % |
Red Lake (Bateman) | | 45 |
| | 339 |
| 5.76 |
| 63 | |
| 3,223 |
| 5.52 |
| 572 | |
| 3,563 |
| 5.54 |
| 635 | |
| 100 | % |
Courageous Lake | | 46 |
| | 12,000 |
| 2.41 |
| 1,000 | |
| 79,000 |
| 2.17 |
| 5,500 | |
| 91,000 |
| 2.20 |
| 6,500 | |
| 100 | % |
Goldfields |
| 47 |
| | — |
| — |
| — | |
| — |
| — |
| — | |
| — |
| — |
| — | | | 100 | % |
Monument Bay | | 48 |
| | — |
| — |
| — | |
| — |
| — |
| — | |
| — |
| — |
| — | |
| 100 | % |
Red Mountain |
| 49 |
| | 2,194 |
| 6.68 |
| 471 | |
| 351 |
| 5.51 |
| 62 | |
| 2,545 |
| 6.52 |
| 534 | | | 100 | % |
Fenelon-Martiniere | | 50 | | | — | | — | | — | | | — | | — | | — | | | — | | — | | — | | | 100 | % |
GOLD - AUSTRALIA | | | | | | | | | | | | | | | | | | | | | | | | | | | |
Duketon |
| 51 |
| | 14,000 |
| 0.50 |
| 210 | |
| 55,000 |
| 1.00 |
| 1,780 | |
| 69,000 |
| 0.90 |
| 1,990 | | | 93 | % |
Matilda (Wiluna) |
| 52 |
| | 330 |
| 3.06 |
| 33 | |
| 36,090 |
| 1.07 |
| 1,236 | |
| 36,410 |
| 1.08 |
| 1,269 | | | 100 | % |
South Kalgoorlie |
| 53 |
| | 655 |
| 4.80 |
| 101 | |
| 1,073 |
| 5.36 |
| 185 | |
| 1,727 |
| 5.15 |
| 286 | | | 82 | % |
Yandal (Bronzewing) | | 54 |
| | 3,600 |
| 2.00 |
| 234 | |
| 11,891 |
| 1.50 |
| 557 | |
| 15,491 |
| 1.60 |
| 791 | |
| 100 | % |
Aphrodite | | 55 |
| | — |
| — |
| — | |
| 7,105 |
| 2.51 |
| 573 | |
| 7,105 |
| 2.51 |
| 573 | |
| 100 | % |
Red October |
| 56 |
| | — |
| — |
| — | |
| — |
| — |
| — | |
| — |
| — |
| — | | | 100 | % |
Henty |
| 57 |
| | — |
| — |
| — | |
| — |
| — |
| — | |
| — |
| — |
| — | | | 100 | % |
Bullabulling | | 58 |
| | — |
| — |
| — | |
| — |
| — |
| — | |
| — |
| — |
| — | |
| 50 | % |
Edna May |
| 59 |
| | 600 |
| 0.50 |
| 9 | |
| 380 |
| 3.20 |
| 40 | |
| 980 |
| 1.55 |
| 49 | | | 2 | % |
Glenburgh | | 60 |
| | — |
| — |
| — | |
| — |
| — |
| — | |
| — |
| — |
| — | |
| 100 | % |
GOLD - REST OF WORLD | | | | | | | | | | | | | | | | | | | | | | | | | | | |
MWS |
| 61 |
| | 50,000 |
| 0.24 |
| 390 | |
| 164,900 |
| 0.26 |
| 1,358 | |
| 214,900 |
| 0.25 |
| 1,749 | |
| fixed interest | |
Sabodala-Massawa Complex |
| 62 |
| | 17,300 |
| 1.25 |
| 696 | |
| 60,100 |
| 2.12 |
| 4,101 | |
| 77,400 |
| 1.93 |
| 4,796 | | | 42 | % |
Tasiast |
| 63 |
| | 48,563 |
| 1.30 |
| 1,961 | |
| 63,910 |
| 2.20 |
| 4,443 | |
| 112,473 |
| 1.80 |
| 6,404 | | | 100 | % |
Subika (Ahafo) |
| 64 |
| | 49,500 |
| 1.80 |
| 2,860 | |
| 52,400 |
| 1.92 |
| 3,240 | |
| 101,900 |
| 1.86 |
| 6,100 | | | 68 | % |
Karma |
| 65 |
| | 300 |
| 0.40 |
| 4 | |
| 5,200 |
| 0.93 |
| 154 | |
| 5,500 |
| 0.90 |
| 158 | | | 100 | % |
Edikan |
| 66 |
| | 14,100 |
| 1.06 |
| 480 | |
| 22,300 |
| 1.17 |
| 837 | |
| 36,400 |
| 1.13 |
| 1,318 | | | 100 | % |
Kiziltepe | | 67 | | | 466 | | 2.06 | | 31 | | | 451 |
| 2.65 |
| 38 | | | 926 |
| 2.39 |
| 71 | | | 100 | % |
Seguela | | 68 | | | — | | — | | — | | | 12,100 | | 2.80 | | 1,088 | | | 12,100 | | 2.80 | | 1,088 | | | 100 | % |
Perama Hill |
| 69 |
| | 3,088 |
| 4.03 |
| 400 | |
| 9,410 |
| 2.81 |
| 850 | |
| 12,498 |
| 3.11 |
| 1,250 | | | 100 | % |
Agi Dagi | | 70 |
| | 1,450 |
| 0.76 |
| 36 | |
| 52,911 |
| 0.66 |
| 1,130 | |
| 54,361 |
| 0.67 |
| 1,166 | |
| 100 | % |
Sissingue |
| 71 |
| | 3,800 |
| 1.51 |
| 184 | |
| 700 |
| 2.58 |
| 58 | |
| 4,600 |
| 1.64 |
| 242 | | | 100 | % |
TOTAL GOLD MINERAL RESERVES | | | | | | | |
| 35,339 | | | | | |
| 99,679 | | | | | |
| 134,323 | | | | |
18
| | | | | Mineral Resources - Inclusive of Reserves | | | Mineral Resources | | | Est. % of Mineral | | ||||||||||||||||||
| | | | | Measured (M) | | | Indicated (I) | | | (M)+(I) | | | Inferred | | | Reserves & | | ||||||||||||
|
| |
|
| Tonnes |
| Grade |
| Contained |
|
| Tonnes |
| Grade |
| Contained |
|
| Contained | |
| Tonnage |
| Grade |
| Contained |
|
| Resources Covered | |
GOLD - SOUTH AMERICA | | Notes | | | 000s | | g/t | | 000 oz | | | 000s | | g/t | | 000 oz | | | 000 oz | | | 000s | | g/t | | 000 oz | | | by FNV Interest | |
Candelaria |
| 3,4 |
| | 874,003 |
| 0.13 |
| 3,700 | |
| 370,541 |
| 0.16 |
| 1,900 | |
| 5,600 | |
| 99,029 |
| 0.16 |
| 500 | | | 80 | % |
Antapaccay |
| 5 |
| | 266,000 |
| 0.08 |
| 684 | |
| 1,009,000 |
| 0.08 |
| 2,595 | |
| 3,279 | |
| 238,000 |
| 0.05 |
| 383 | | | 100 | % |
Condestable | | 6 | | | 33,392 |
| 0.24 |
| 259 | | | 55,934 |
| 0.24 |
| 430 | | | 701 | | | 60,600 |
| 0.24 |
| 480 | | | 100 | % |
Sossego | | 7 | | | n/a | | n/a | | n/a | | | n/a | | n/a | | n/a | | | n/a | | | n/a | | n/a | | n/a | | | 100 | % |
Cerro Moro |
| 1,8 |
| | 542 |
| 7.98 |
| 139 | |
| 2,144 |
| 6.31 |
| 435 | |
| 574 | |
| 1,488 |
| 4.73 |
| 226 | | | 95 | % |
Salares Norte | | 9 | | | — | | — | | — | | | 23,714 | | 4.99 | | 3,804 | | | 3,804 | | | 1,842 | | 1.84 | | 109 | | | 100 | % |
Cascabel | | 10 | | | 1,192,000 | | 0.39 | | 15,000 | | | 1,703,000 | | 0.14 | | 7,800 | | | 22,900 | | | 751,000 | | 0.13 | | 3,140 | | | 100 | % |
Posse (Mara Rosa) | | 11 | | | 14,000 | | 1.20 | | 510 | | | 19,000 | | 1.10 | | 640 | | | 1,200 | | | 100 | | 0.60 | | 2 | | | 100 | % |
Taca Taca |
| 12 |
| | 421,500 |
| 0.14 |
| 1,853 | |
| 1,781,800 |
| 0.07 |
| 4,200 | |
| 6,052 | |
| 716,900 |
| 0.05 |
| 1,183 | | | 100 | % |
CentroGold (Gurupi) |
| 13 |
| | — |
| — |
| — | |
| 21,000 |
| 1.90 |
| 1,300 | |
| 1,300 | |
| 7,300 |
| 1.80 |
| 410 | | | 100 | % |
Calcatreu |
| 14 |
| | — |
| — |
| — | |
| 9,841 |
| 2.11 |
| 669 | |
| 669 | |
| 8,078 |
| 1.34 |
| 348 | | | 100 | % |
San Jorge |
| 15 |
| | 79,518 |
| 0.22 |
| 584 | |
| 104,091 |
| 0.19 |
| 626 | |
| 1,211 | |
| 11,235 |
| 0.16 |
| 59 | | | 100 | % |
Volcan |
| 16 |
| | 105,918 |
| 0.74 |
| 2,513 | |
| 283,763 |
| 0.70 |
| 6,368 | |
| 8,881 | |
| 41,553 |
| 0.50 |
| 671 | | | 5 | % |
GOLD - CENTRAL AMERICA & MEXICO | | | | | | | | | | | | | | | | | | | | | | | | | | | | | | |
Cobre Panama |
| 17 |
| | 234,800 |
| 0.12 |
| 906 | |
| 3,318,700 |
| 0.06 |
| 6,490 | |
| 7,396 | |
| 1,093,800 |
| 0.04 |
| 1,301 | | | 100 | % |
Guadalupe-Palmarejo |
| 1,2,18 |
| | 6,758 |
| 2.03 |
| 442 | |
| 26,776 |
| 1.73 |
| 1,489 | |
| 1,931 | |
| 4,276 |
| 1.79 |
| 246 | | | 88 | % |
GOLD - UNITED STATES | | | | | | | | | | | | | | | | | | | | | | | | | | | | | | |
Carlin Trend |
| 19 |
| | 82,927 |
| 4.68 |
| 12,683 | |
| 276,423 |
| 2.20 |
| 19,512 | |
| 30,894 | |
| 110,569 |
| 2.10 |
| 7,480 | | | 35 | % |
Marigold |
| 1,20 |
| | — |
| — |
| — | |
| 319,100 |
| 0.49 |
| 5,004 | |
| 5,004 | |
| 21,800 |
| 0.36 |
| 252 | | | 96 | % |
Bald Mountain |
| 1,21 |
| | 9,150 |
| 0.80 |
| 233 | |
| 232,355 |
| 0.56 |
| 4,157 | |
| 4,390 | |
| 45,716 |
| 0.50 |
| 669 | | | 95 | % |
Mesquite |
| 22 |
| | 126 |
| 0.74 |
| 3 | |
| 140,670 |
| 0.42 |
| 1,921 | |
| 1,924 | |
| 85,419 |
| 0.34 |
| 928 | | | 100 | % |
Castle Mountain |
| 23 |
| | 88,026 |
| 0.57 |
| 1,604 | |
| 256,074 |
| 0.52 |
| 4,315 | |
| 5,919 | |
| 86,271 |
| 0.58 |
| 1,608 | | | 100 | % |
Fire Creek/Midas |
| 1,2,24 |
| | 20 |
| 17.14 |
| 11 | |
| 171 |
| 15.06 |
| 83 | |
| 94 | |
| 69,473 |
| 1.43 |
| 3,185 | | | 100 | % |
Hollister |
| 1,2,25 |
| | 16 |
| 19.05 |
| 10 | |
| 64 |
| 19.59 |
| 40 | |
| 51 | |
| 582 |
| 14.58 |
| 273 | | | 100 | % |
Stibnite Gold |
| 26 |
| | 4,902 |
| 2.42 |
| 382 | |
| 127,367 |
| 1.38 |
| 5,652 | |
| 6,034 | |
| 36,169 |
| 1.07 |
| 1,246 | | | 100 | % |
Sandman |
| 27 |
| | — |
| — |
| — | |
| 18,550 |
| 0.73 |
| 433 | |
| 433 | |
| 3,246 |
| 0.58 |
| 61 | | | 100 | % |
Robinson |
| 28 |
| | 317,942 |
| 0.18 |
| 1,840 | |
| 40,173 |
| 0.15 |
| 194 | |
| 2,072 | |
| 11,942 |
| 0.18 |
| 69 | | | 100 | % |
GOLD - CANADA | | | | | | | | | | | | | | | | | | | | | | | | | | | | | | |
Detour Lake |
| 1,29 |
| | 106,106 |
| 1.23 |
| 4,189 | |
| 1,039,244 |
| 0.77 |
| 25,563 | |
| 29,752 | |
| 52,370 |
| 0.71 |
| 1,196 | | | 100 | % |
Sudbury | | 30 | | | not available | | | not available | | | — | | | not available | | | not available | | ||||||||||||
Hemlo |
| 31 |
| | 680 |
| 4.50 |
| 99 | |
| 38,000 |
| 2.03 |
| 2,500 | |
| 2,600 | |
| 9,100 |
| 2.80 |
| 820 | | | 20 | % |
Brucejack |
| 32 |
| | 4,300 |
| 8.00 |
| 1,100 | |
| 18,100 |
| 10.70 |
| 6,200 | |
| 7,200 | |
| 9,400 |
| 10.30 |
| 3,100 | | | 100 | % |
Kirkland Lake |
| 1,33 |
| | 489 |
| 15.71 |
| 247 | |
| 18,538 |
| 6.19 |
| 3,687 | |
| 3,934 | |
| 25,886 |
| 4.54 |
| 3,781 | | | 100 | % |
Dublin Gulch (Eagle) |
| 34 |
| | 37,400 |
| 0.71 |
| 850 | |
| 180,000 |
| 0.61 |
| 3,547 | |
| 4,397 | |
| 21,500 |
| 0.52 |
| 361 | | | 100 | % |
Musselwhite |
| 1,35 |
| | 4,200 |
| 4.59 |
| 620 | |
| 9,000 |
| 5.46 |
| 1,580 | |
| 2,200 | |
| 3,200 |
| 4.22 |
| 440 | | | 100 | % |
Timmins West |
| 1,36 |
| | 1,770 |
| 3.13 |
| 178 | |
| 5,139 |
| 3.01 |
| 497 | |
| 675 | |
| 174 |
| 4.36 |
| 24 | | | 100 | % |
Canadian Malartic |
| 1,37 |
| | 43,192 |
| 0.84 |
| 1,166 | |
| 73,812 |
| 1.71 |
| 4,050 | |
| 5,214 | |
| 67,230 |
| 2.89 |
| 6,236 | | | 26 | % |
Island Gold | | 1,38 | | | 854 |
| 9.21 |
| 253 | |
| 4,354 |
| 9.79 |
| 1,371 | |
| 1,624 | |
| 7,906 |
| 13.59 |
| 3,454 | | | 90 | % |
Golden Highway - Holt Complex |
| 1,39 |
| | 5,806 |
| 4.29 |
| 800 | |
| 5,884 |
| 4.75 |
| 898 | |
| 1,699 | |
| 9,097 |
| 4.48 |
| 1,310 | | | 100 | % |
Golden Highway - Hislop |
| 1,40 |
| | — |
| — |
| — | |
| 1,337 |
| 4.00 |
| 173 | |
| 173 | |
| 804 |
| 3.80 |
| 97 | | | 100 | % |
Golden Highway - Aquarius | | 1,41 | | | — | | — | | — | | | 23,112 | | 1.49 | | 1,106 | | | 1,106 | | | 502 | | 0.87 | | 14 | | | 100 | % |
Greenstone (Hardrock) |
| 42 |
| | 5,700 |
| 1.30 |
| 237 | |
| 141,800 |
| 1.51 |
| 6,868 | |
| 7,105 | |
| 25,500 |
| 3.78 |
| 3,095 | | | 100 | % |
Valentine Lake | | 43 | | | 32,587 |
| 1.83 |
| 1,920 | |
| 24,069 |
| 1.57 |
| 1,218 | |
| 3,138 | |
| 29,585 |
| 1.72 |
| 1,639 | | | 100 | % |
Eskay Creek | | 44 | | | 17,657 | | 4.19 | | 2,380 | | | 20,848 | | 2.26 | | 1,518 | | | 3,898 | | | 5,668 | | 1.27 | | 231 | | | 100 | % |
Red Lake (Bateman) |
| 1,45 |
| | 775 |
| 6.12 |
| 153 | |
| 4,498 |
| 6.03 |
| 873 | |
| 1,025 | |
| 1,562 |
| 6.83 |
| 343 | | | 100 | % |
Courageous Lake |
| 46 |
| | 13,401 |
| 2.53 |
| 1,090 | |
| 93,914 |
| 2.28 |
| 6,884 | |
| 7,974 | |
| 53,587 |
| 2.27 |
| 3,914 | | | 100 | % |
Goldfields |
| 47 |
| | — |
| — |
| — | |
| 22,600 |
| 1.34 |
| 975 | |
| 975 | |
| 6,000 |
| 0.92 |
| 176 | | | 100 | % |
Monument Bay |
| 1,48 |
| | — |
| — |
| — | |
| 36,581 |
| 1.52 |
| 1,787 | |
| 1,787 | |
| 41,946 |
| 1.32 |
| 1,781 | | | 100 | % |
Red Mountain |
| 49 |
| | 1,920 |
| 8.81 |
| 544 | |
| 1,271 |
| 5.85 |
| 239 | |
| 783 | |
| 405 |
| 5.32 |
| 69 | | | 100 | % |
Fenelon-Martiniere | | 50 | | | — | | — | | — | | | 43,558 | | 1.91 | | 2,671 | | | 2,671 | | | 31,778 | | 1.69 | | 1,724 | | | 100 | % |
GOLD - AUSTRALIA | | | | | | | | | | | | | | | | | | | | | | | | | | | | | | |
Duketon |
| 51 |
| | 19,000 |
| 0.82 |
| 500 | |
| 113,000 |
| 0.95 |
| 3,450 | |
| 3,950 | |
| 16,000 |
| 1.19 |
| 610 | | | 91 | % |
Matilda (Wiluna) |
| 52 |
| | 1,430 |
| 1.24 |
| 57 | |
| 57,100 |
| 1.91 |
| 3,495 | |
| 3,552 | |
| 19,900 |
| 3.09 |
| 1,978 | | | 100 | % |
South Kalgoorlie |
| 53 |
| | 1,120 |
| 6.19 |
| 223 | |
| 2,876 |
| 5.25 |
| 485 | |
| 708 | |
| 2,058 |
| 4.46 |
| 295 | | | 75 | % |
Yandal (Bronzewing) |
| 54 |
| | 2,800 |
| 2.60 |
| 237 | |
| 17,116 |
| 1.90 |
| 1,045 | |
| 1,282 | |
| 5,310 |
| 1.50 |
| 263 | | | 100 | % |
Aphrodite |
| 55 |
| | — |
| — |
| — | |
| 17,614 |
| 2.10 |
| 1,163 | |
| 1,163 | |
| 7,892 |
| 2.00 |
| 500 | | | 100 | % |
Red October |
| 56 |
| | 105 |
| 8.40 |
| 28 | |
| 519 |
| 5.60 |
| 93 | |
| 122 | |
| 4,392 |
| 3.44 |
| 485 | | | 100 | % |
Henty |
| 57 |
| | — |
| — |
| — | |
| 1,800 |
| 4.50 |
| 257 | |
| 257 | |
| 700 |
| 4.30 |
| 100 | | | 100 | % |
Bullabulling |
| 58 |
| | — |
| — |
| — | |
| 68,805 |
| 0.99 |
| 2,190 | |
| 2,190 | |
| 26,595 |
| 1.19 |
| 1,020 | | | 50 | % |
Edna May |
| 59 |
| | 600 |
| 0.50 |
| 9 | |
| 23,290 |
| 1.03 |
| 770 | |
| 779 | |
| 7,036 |
| 1.04 |
| 236 | | | 2 | % |
Glenburgh |
| 60 |
| | — |
| — |
| — | |
| 13,500 |
| 1.00 |
| 431 | |
| 431 | |
| 2,800 |
| 0.90 |
| 79 | | | 100 | % |
GOLD - REST OF WORLD | | | | | | | | | | | | | | | | | | | | | | | | | | | | | | |
MWS |
| 61 |
| | 82,900 |
| 0.22 |
| 588 | |
| 164,900 |
| 0.26 |
| 1,358 | |
| 1,946 | |
| — |
| — |
| — | |
| fixed interest | |
Sabodala-Massawa Complex |
| 62 |
| | 19,400 |
| 1.38 |
| 862 | |
| 82,700 |
| 2.17 |
| 5,778 | |
| 6,640 | |
| 24,300 |
| 2.21 |
| 1,728 | | | 42 | % |
Tasiast |
| 1,63 |
| | 57,029 |
| 1.22 |
| 2,240 | |
| 125,228 |
| 1.68 |
| 6,752 | |
| 8,992 | |
| 12,678 |
| 2.40 |
| 971 | | | 100 | % |
Subika (Ahafo) |
| 1,64 |
| | 50,000 |
| 1.79 |
| 2,870 | |
| 99,000 |
| 2.04 |
| 6,480 | |
| 9,350 | |
| 24,300 |
| 2.21 |
| 1,730 | | | 47 | % |
Karma |
| 65 |
| | 300 |
| 0.40 |
| 4 | |
| 47,700 |
| 1.24 |
| 1,894 | |
| 1,898 | |
| 16,200 |
| 1.30 |
| 679 | | | 100 | % |
Edikan |
| 66 |
| | 24,800 |
| 1.01 |
| 803 | |
| 46,100 |
| 1.03 |
| 1,522 | |
| 2,326 | |
| 5,600 |
| 1.60 |
| 300 | | | 100 | % |
Kiziltepe | | 67 | | | 600 |
| 3.01 |
| 58 | |
| 698 |
| 2.33 |
| 52 | |
| 110 | |
| 1,180 |
| 2.09 |
| 79 | | | 100 | % |
Seguela | | 68 | | | — | | — | | — | | | 14,000 | | 3.00 | | 1,328 | | | 1,328 | | | 1,500 | | 2.20 | | 104 | | | 100 | % |
Perama Hill |
| 69 |
| | 3,093 |
| 4.15 |
| 412 | |
| 10,973 |
| 2.73 |
| 962 | |
| 1,374 | |
| 16,006 |
| 1.53 |
| 787 | | | 100 | % |
Agi Dagi |
| 1,70 |
| | 2,516 |
| 0.74 |
| 60 | |
| 104,453 |
| 0.63 |
| 2,132 | |
| 2,192 | |
| 19,551 |
| 0.52 |
| 330 | | | 100 | % |
Sissingue |
| 71 |
| | 4,400 |
| 1.46 |
| 206 | |
| 1,200 |
| 2.18 |
| 84 | |
| 290 | |
| 130 |
| 1.67 |
| 7 | | | 100 | % |
TOTAL GOLD MINERAL RESOURCES* | | | | | | | |
| 68,338 | | | | | |
| 195,982 | |
| 263,123 | | | | | |
| 70,915 | | | | |
*Total excludes New Prosperity
| | | | | Silver Mineral Reserves | | | Est. % of Mineral | | ||||||||||||||||||
| | | | | Proven | | | Probable | | | Proven & Probable | |
| Reserves & | | ||||||||||||
|
| |
|
| Tonnes |
| Grade |
| Contained | | | Tonnes |
| Grade |
| Contained | | | Tonnes |
| Grade |
| Contained | | | Resources Covered | |
Silver | | Notes | |
| 000s | | g/t | | 000 oz |
|
| 000s | | g/t | | 000 oz |
|
| 000s | | g/t | | 000 oz |
|
| by FNV Interest | |
Candelaria |
| 72,4 | |
| 540,929 |
| 1.73 |
| 30,000 | |
| 134,645 |
| 2.08 |
| 9,000 | |
| 675,574 |
| 1.80 |
| 39,000 | | | 80 | % |
Antapaccay |
| 73 | |
| 189,000 |
| 1.19 |
| 7,231 | |
| 286,000 |
| 1.13 |
| 10,390 | |
| 475,000 |
| 1.15 |
| 17,621 | | | 100 | % |
Antamina |
| 74,75 | |
| 186,000 |
| 8.80 |
| 52,701 | |
| 149,800 |
| 11.20 |
| 54,011 | |
| 335,800 |
| 9.90 |
| 106,969 | | | 22.5 | % |
Condestable | | 76 | | | 20,546 | | 5.66 | | 3,739 | |
| 7,376 | | 6.37 | | 1,510 | |
| 27,922 | | 5.85 | | 5,249 | | | 100 | % |
Cerro Moro |
| 77 | |
| 365 |
| 593.50 |
| 6,964 | |
| 1,384 |
| 342.00 |
| 15,215 | |
| 1,749 |
| 394.50 |
| 22,180 | | | 100 | % |
Salares Norte | | 78 | |
| — |
| — |
| — | |
| 21,079 |
| 57.94 |
| 39,263 | |
| 21,079 |
| 57.94 |
| 39,263 | | | 100 | % |
Cascabel | | 79 | | | — |
| — |
| — | |
| — |
| — |
| — | |
| — |
| — |
| — | | | 100 | % |
Calcatreu | | 80 | |
| — |
| — |
| — | |
| — |
| — |
| — | |
| — |
| — |
| — | | | 100 | % |
Cobre Panama |
| 81 | |
| 236,000 |
| 1.44 |
| 10,926 | |
| 2,790,500 |
| 1.36 |
| 121,758 | |
| 3,026,600 |
| 1.37 |
| 133,049 | | | 100 | % |
Fire Creek/Midas |
| 2,82 | |
| — |
| — |
| — | |
| — |
| — |
| — | |
| — |
| — |
| — | | | 100 | % |
Eskay Creek | | 83 | |
| 13,500 | | 124.00 | | 53,700 | |
| 12,900 | | 64.00 | | 26,500 | |
| 26,400 | | 94.00 | | 80,200 | | | 100 | % |
TOTAL SILVER MINERAL RESERVES | | | | | | | |
| 165,262 | | | | | |
| 277,647 | | | | | |
| 443,532 | | | | |
19
| | | | Silver Mineral Resources - Inclusive of Reserves | | | | | | | | | Est. % of Mineral | | ||||||||||||||||
| | | | | Measured (M) | | | Indicated (I) | | | (M)+(I) | | | Silver Inferred Mineral Resources | | | Reserves & | | ||||||||||||
|
| |
|
| Tonnes |
| Grade |
| Contained |
|
| Tonnes |
| Grade |
| Contained |
|
| Contained |
|
| Tonnage |
| Grade |
| Contained |
|
| Resources Covered | |
Silver | | Notes | | | 000s | | g/t | | 000 oz | | | 000s | | g/t | | 000 oz | | | 000 oz | | | 000s | | g/t | | 000 oz | | | by FNV Interest | |
Candelaria |
| 72,4 | |
| 874,003 |
| 1.99 |
| 56,000 | |
| 370,541 |
| 2.27 |
| 27,000 | |
| 83,000 | |
| 99,029 |
| 2.20 |
| 7,000 | | | 80 | % |
Antapaccay |
| 73 | |
| 266,000 |
| 1.57 |
| 13,441 | |
| 1,009,000 |
| 1.76 |
| 57,150 | |
| 70,591 | |
| 238,000 |
| 0.81 |
| 6,168 | | | 100 | % |
Antamina |
| 1,74,75 | |
| 306,500 |
| 9.77 |
| 96,264 | |
| 618,800 |
| 11.48 |
| 228,384 | |
| 324,905 | |
| 1,260,600 |
| 11.00 |
| 447,741 | | | 22.5 | % |
Condestable | | 76 | | | 33,392 |
| 5.88 |
| 6,315 | |
| 55,934 |
| 6.29 |
| 11,308 | |
| 17,624 | |
| 60,600 |
| 6.29 |
| 12,256 | | | 100 | % |
Cerro Moro |
| 1,77 | |
| 542 |
| 475.85 |
| 8,292 | |
| 2,144 |
| 315.11 |
| 21,721 | |
| 30,014 | |
| 1,488 |
| 170.60 |
| 8,159 | | | 95 | % |
Salares Norte | | 78 | | | — |
| — |
| — | |
| 23,714 |
| 56.29 |
| 42,915 | |
| 42,915 | |
| 1,842 |
| 12.61 |
| 747 | | | 100 | % |
Cascabel | | 79 | | | 1,192,000 |
| 1.37 |
| 52,400 | |
| 1,470,000 |
| 0.84 |
| 39,800 | |
| 92,200 | |
| 554,000 |
| 0.61 |
| 10,600 | | | 100 | % |
Calcatreu | | 80 | | | — |
| — |
| — | |
| 9,841 |
| 19.83 |
| 6,275 | |
| 6,275 | |
| 8,078 |
| 13.09 |
| 3,399 | | | 100 | % |
Cobre Panama |
| 81 | |
| 234,800 |
| 1.50 |
| 11,323 | |
| 3,318,700 |
| 1.33 |
| 141,573 | |
| 152,896 | |
| 1,093,800 |
| 1.08 |
| 38,085 | | | 100 | % |
Fire Creek/Midas |
| 1,2,82 | |
| 20 |
| 43.64 |
| 28 | |
| 171 |
| 98.68 |
| 544 | |
| 572 | |
| 69,473 |
| 5.98 |
| 13,349 | | | 100 | % |
Eskay Creek | | 83 | | | 17,657 | | 117.42 | | 66,655 | | | 20,848 | | 52.14 | | 34,945 | | | 101,600 | | | 5,668 | | 27.38 | | 4,990 | | | 100 | % |
TOTAL SILVER MINERAL RESOURCES | | | | | | | |
| 310,719 | | | | | |
| 611,615 | |
| 922,592 | | | | | |
| 552,494 | | | | |
| | | | | PGM Mineral Reserves | | | Est. % of Mineral | | ||||||||||||||||||
| | | | | Proven | | | Probable | | | Proven & Probable | | | Reserves & | | ||||||||||||
|
| |
|
| Tonnes |
| Grade |
| Contained |
|
| Tonnes |
| Grade |
| Contained |
|
| Tonnes |
| Grade |
| Contained |
|
| Resources Covered | |
PGM | | Notes | | | 000s | | g/t | | 000 oz | | | 000s | | g/t | | 000 oz | | | 000s | | g/t | | 000 oz | | | by FNV Interest | |
Stillwater |
| 84 | |
| 8,200 |
| 15.40 |
| 4,100 | |
| 60,100 |
| 12.00 |
| 23,200 | |
| 68,300 |
| 12.40 |
| 27,300 | | | 98 | % |
Sudbury |
| 85 | |
| not available | |
| not available | |
| not available | | | not available | | ||||||||||||
Eagle's Nest | | 86 | | | 5,264 | | 4.65 | | 787 | | | 5,867 | | 3.72 | | 702 | | | 11,131 | | 4.16 | | 1,489 | | | 100 | % |
Marathon (Sally) | | 87 | | | — | | — | | — | | | — | | — | | — | | | — | | — | | — | | | 100 | % |
Pandora |
| 88 | |
| 2,195 |
| 4.20 |
| 244 | |
| 19,756 |
| 4.08 |
| 2,683 | |
| 21,951 |
| 4.09 |
| 2,927 | | | 80 | % |
TOTAL PGM MINERAL RESERVES | | | | | | | |
| 5,131 | | | | | |
| 26,585 | | | | | |
| 31,716 | | | | |
| | | | PGM Mineral Resources - Inclusive of Reserves | | | | | | | | | Est. % of Mineral | | ||||||||||||||||
| | | | | Measured (M) | | | Indicated (I) | | | (M)+(I) | | | PGM Inferred Mineral Resources | | | Reserves & | | ||||||||||||
| | | | | Tonnes | | Grade | | Contained | | | Tonnes | | Grade | | Contained | | | Contained | | | Tonnage | | Grade | | Contained | | | Resources Covered | |
PGM | | Notes | | | 000s | | g/t | | 000 oz | | | 000s | | g/t | | 000 oz | | | 000 oz | | | 000s | | g/t | | 000 oz | | | by FNV Interest | |
Stillwater |
| 84 | |
| 39,900 |
| 14.70 |
| 18,900 | |
| 59,100 |
| 13.80 |
| 26,100 | |
| 45,000 | |
| 113,600 |
| 12.20 |
| 44,600 | | | 98 | % |
Sudbury |
| 85 | |
| not available | |
| not available | |
| | |
| not available | | | not available | | ||||||||||||
Eagle's Nest | | 86 | | | 5,346 | | 4.79 | | 823 | | | 5,643 | | 4.41 | | 800 | | | 1,627 | | | 10,581 | | 4.29 | | 1,459 | | | 100 | % |
Marathon (Sally) | | 87 | | | — | | — | | — | | | 24,801 | | 0.62 | | 494 | | | 494 | | | 14,019 | | 0.48 | | 218 | | | 100 | % |
Pandora |
| 88 | |
| 22,195 |
| 4.81 |
| 3,415 | |
| 147,317 |
| 4.60 |
| 21,707 | |
| 25,122 | |
| 21,220 |
| 4.72 |
| 3,171 | | | 80 | % |
TOTAL PGM MINERAL RESOURCES | | | | | | | |
| 23,138 | | | | | |
| 49,101 | |
| 72,243 | | | | | |
| 49,447 | | | | |
| | | | | Copper Mineral Reserves | | | Est. % of Mineral | | ||||||||||||||||||
| | | | | Proven | | | Probable | | | Proven & Probable | | | Reserves & | | ||||||||||||
| | | | | Tonnes | | Grade | | Contained | | | Tonnes | | Grade | | Contained | | | Tonnes | | Grade | | Contained | | | Resources Covered | |
Copper | | Notes | | | 000s | | % | | Mlbs | | | 000s | | % | | Mlbs | | | 000s | | % | | Mlbs | | | by FNV Interest | |
Sossego | | 89 | | | 59,200 | | 0.89 | | 1,162 | | | 39,100 | | 0.40 | | 345 | | | 98,300 | | 0.69 | | 1,495 | | | 100 | % |
Cascabel | | 90 | | | — |
| — | | — | |
| — |
| — | | — | |
| — |
| — | | — | | | 100 | % |
NuevaUnion (Relincho) |
| 91 | |
| 576,400 |
| 0.34 | | 4,320 | |
| 977,400 |
| 0.36 | | 7,757 | |
| 1,553,800 |
| 0.35 | | 12,078 | | | 100 | % |
Taca Taca |
| 92 | |
| 408,300 |
| 0.59 | | 5,295 | |
| 1,350,200 |
| 0.39 | | 11,757 | |
| 1,758,500 |
| 0.44 | | 17,052 | | | 100 | % |
Vizcachitas |
| 93 | |
| — |
| — | | — | |
| — |
| — | | — | |
| — |
| — | | — | | | 100 | % |
Rosemont/Copper World |
| 94 | |
| 426,100 |
| 0.48 | | 4,509 | |
| 111,000 |
| 0.31 | | 759 | |
| 537,100 |
| 0.45 | | 5,328 | |
| 100 | % |
Robinson | | 95 | |
| 110,513 |
| 0.42 | | 1,023 | |
| 8,860 |
| 0.28 | | 55 | |
| 119,374 |
| 0.41 | | 1,078 | | | 100 | % |
TOTAL COPPER MINERAL RESERVES | | | | | | | | | 16,309 | | | | | | | 20,673 | | | | | | | 37,031 | | | | |
| | | | | Copper Mineral Resources - Inclusive of Reserves | | | | | | | | | | Est. % of Mineral | | ||||||||||||||
| | | | | Measured (M) | | | Indicated (I) | | | (M)+(I) | | | Copper Inferred Mineral Resources | | | Reserves & | | ||||||||||||
| | | | | Tonnes | | Grade | | Contained | | | Tonnes | | Grade | | Contained | | | Contained | | | Tonnage | | Grade | | Contained | | | Resources Covered | |
Copper | | Notes | | | 000s | | % | | Mlbs | | | 000s | | % | | Mlbs | | | Mlbs | | | 000s | | % | | Mlbs | | | by FNV Interest | |
Sossego | | 89 | | | n/a | | n/a | | n/a | | | n/a | | n/a | | n/a | | | n/a | | | n/a | | n/a | | n/a | | | 100 | % |
Cascabel | | 90 | | | 1,192,000 |
| 0.48 | | 12,566 | |
| 1,703,000 |
| 0.28 | | 10,428 | |
| 22,994 | |
| 751,000 |
| 0.24 | | 4,012 | | | 100 | % |
NuevaUnion (Relincho) |
| 1,91 | |
| 895,400 |
| 0.29 | | 5,657 | |
| 1,440,400 |
| 0.33 | | 10,411 | |
| 16,068 | |
| 724,700 |
| 0.36 | | 5,752 | | | 100 | % |
Taca Taca |
| 92 | |
| 421,500 |
| 0.60 | | 5,606 | |
| 1,781,800 |
| 0.39 | | 15,229 | |
| 20,835 | |
| 716,900 |
| 0.31 | | 4,863 | | | 100 | % |
Vizcachitas |
| 93 | |
| 254,400 |
| 0.44 | | 2,462 | |
| 1,029,670 |
| 0.39 | | 8,740 | |
| 11,202 | |
| 788,820 |
| 0.34 | | 5,861 | | | 100 | % |
Rosemont/Copper World |
| 1,94 | |
| 587,400 |
| 0.45 | | 5,860 | |
| 757,900 |
| 0.30 | | 4,984 | |
| 10,915 | |
| 204,300 |
| 0.34 | | 1,539 | |
| 99 | % |
Robinson |
| 95 | |
| 317,942 |
| 0.47 | | 3,294 | |
| 40,173 |
| 0.34 | | 301 | |
| 3,553 | |
| 11,942 |
| 0.38 | | 100 | | | 100 | % |
TOTAL COPPER MINERAL RESOURCES | | | | | | | | | 35,446 | | | | | | | 50,093 | |
| 85,567 | | | | | | | 22,127 | | | | |
| | | | | Nickel Mineral Reserves | | | Est. % of Mineral | | ||||||||||||||||||
| | | | | Proven | | | Probable | | | Proven & Probable | | | Reserves & | | ||||||||||||
| | |
|
| Tonnes | | Grade | | Contained |
|
| Tonnes | | Grade | | Contained |
|
| Tonnes | | Grade | | Contained |
|
| Resources Covered | |
Nickel | | Notes | | | 000s | | % | | Mlbs | | | 000s | | % | | Mlbs | | | 000s | | % | | Mlbs | | | by FNV Interest | |
Falcondo |
| 96 | |
| 44,900 |
| 1.28 | | 1,267 | |
| 26,300 |
| 1.36 | | 789 | |
| 71,200 |
| 1.31 | | 2,056 | | | 100 | % |
Eagle's Nest | | 97 | | | 5,264 | | 2.02 | | 234 | | | 5,867 | | 1.38 | | 178 | | | 11,131 | | 1.68 | | 413 | | | 100 | % |
Crawford | | 98 | | | — | | — | | — | | | — | | — | | — | | | — | | — | | — | | | 100 | % |
Mt Keith |
| 99 | |
| 67,600 |
| 0.57 | | 847 | |
| 19,990 |
| 0.55 | | 240 | |
| 87,600 |
| 0.56 | | 1,087 | | | 100 | % |
TOTAL NICKEL MINERAL RESERVES | | | | | | | | | 2,348 | | | | | | | 1,207 | | | | | | | 3,556 | | | | |
| | | | | Nickel Mineral Resources - Inclusive of Reserves | | | | | | | | | | Est. % of Mineral | | ||||||||||||||
| | | | | Measured (M) | | | Indicated (I) | | | (M)+(I) | | | Nickel Inferred Mineral Resources | | | Reserves & | | ||||||||||||
| | | |
| Tonnes | | Grade | | Contained | | | Tonnes | | Grade | | Contained | | | Contained |
|
| Tonnage | | Grade | | Contained | | | Resources Covered | |
Nickel | | Notes | | | 000s | | % | | Mlbs | | | 000s | | % | | Mlbs | | | Mlbs | | | 000s | | % | | Mlbs | | | by FNV Interest | |
Falcondo |
| 96 | |
| 40,500 |
| 1.42 | | 1,268 | |
| 31,100 |
| 1.53 | | 1,049 | |
| 2,320 | |
| 4,900 |
| 1.40 | | 151 | | | 100 | % |
Eagle's Nest | | 97 | | | 5,346 | | 2.08 | | 245 | | | 5,643 | | 1.50 | | 187 | | | 432 | | | 10,581 | | 0.98 | | 228 | | | 100 | % |
Crawford | | 98 | | | 240,000 | | 0.29 | | 1,509 | | | 413,600 | | 0.24 | | 2,216 | | | 3,725 | | | 497,200 | | 0.24 | | 2,610 | | | 100 | % |
Mt Keith |
| 99 | |
| 136,600 |
| 0.54 | | 1,622 | |
| 67,000 |
| 0.52 | | 768 | |
| 2,390 | |
| 24,000 |
| 0.52 | | 275 | | | 100 | % |
TOTAL NICKEL MINERAL RESOURCES | | | | | | | | | 4,645 | | | | | | | 4,219 | |
| 8,868 | | | | | | | 3,265 | | | | |
| | | | | Chromite Mineral Resources - Inclusive of Reserves | | | | | | | Est. % of Mineral | | ||||||||
| | | | | Measured (M) | | | Indicated (I) | | | Chromite Inferred Mineral Resources | | | Reserves & | | ||||||
| | | |
| Tonnes | | Grade | | | Tonnes | | Grade | |
| Tonnage | | Grade | | | Resources Covered | |
Chromite | | Notes | | | 000s | | % Cr2O3 | | | 000s | | % Cr2O3 | | | 000s | | % Cr2O3 | | | by FNV Interest | |
Ring of Fire |
| 100 | |
| 140,190 |
| 32.5 | |
| 52,570 |
| 29.8 | |
| 54,580 |
| 30.8 | | | 100 | % |
TOTAL CHROMITE MINERAL RESOURCES | | | | | 140,190 | | | | | 52,570 | | | | | 54,580 | | | | | | |
20
| | | | | Iron Ore Mineral Reserves | | | Est. % of Mineral | | ||||||||||||
| | | | | Proven | | | Probable | | | Proven & Probable | | | Reserves & | | ||||||
| | |
|
| Tonnes | | Grade |
|
| Tonnes | | Grade |
|
| Tonnes | | Grade |
|
| Resources Covered | |
Iron Ore | | Notes | | | 000s | | % Fe | | | 000s | | % Fe | | | 000s | | % Fe | | | by FNV Interest | |
Vale (Northern & Southeastern System) | | 101 | | | 4,288,500 | | 56.7 | | | 6,484,700 | | 58.9 | | | 10,773,200 | | 58.0 | | | varies by system | |
LIORC | | 102,103 | | | 696,000 | | 39.0 | | | 448,000 | | 38.0 | | | 1,144,000 | | 38.0 | | | 100 | % |
TOTAL IRON ORE MINERAL RESERVES | | | | | 4,984,500 | | | | | 6,932,700 | | | | | 11,917,200 | | | | | | |
| | | | | Iron Ore Mineral Resources - Inclusive of Reserves | | | | | | | Est. % of Mineral | | ||||||||
| | | | | Measured (M) | | | Indicated (I) | | | Iron Ore Inferred Mineral Resources | | | Reserves & | | ||||||
| | | |
| Tonnes | | Grade | | | Tonnes | | Grade | |
| Tonnage | | Grade | | | Resources Covered | |
Iron Ore | | Notes | | | 000s | | % Fe | | | 000s | | % Fe | | | 000s | | % Fe | | | by FNV Interest | |
Vale (Northern & Southeastern System) | | 101 | | | n/a | | n/a | | | n/a | | n/a | | | n/a | | n/a | | | varies by system | |
LIORC | | 1,102,103 | | | 854,000 | | 39.4 | | | 1,076,000 | | 38.6 | | | 895,000 | | 38.0 | | | 100 | % |
TOTAL IRON ORE MINERAL RESOURCES | | | | | 854,000 | | | | | 1,076,000 | | | | | 895,000 | | | | | | |
Notes and Sources
All Mineral Reserves and Resources have been calculated in accordance with CIM or acceptable foreign codes for the purposes of NI 43-101, including S-K 1300, SEC Industry Guide 7, JORC, or SAMREC guidelines
Mineral Resources which are not Mineral Reserves do not have demonstrated economic viability
Unless otherwise noted, Mineral Resources were reported by the operator inclusive of Mineral Reserves
Contained metal does not take into account recovery losses
Franco-Nevada's royalties or stream interests may not cover the operator's entire property or all estimated Mineral Reserves and Resources or a combination of both
Mineral Reserve estimates reported by Vale S.A. have been prepared and reported in accordance with SEC Industry Guide 7 and as such no Mineral Resources are reported
The grade of platinum group elements has been reported by the operators as either the sum of the individual platinum group elements grades or the individual grades. In the cases where individual platinum group element grades have been reported, the Company’s Qualified Person has calculated the sum of the platinum group element grades for presentation purposes
Mineral Reserves and Resources based on publicly disclosed information available as of March 11, 2022
Rows and columns may not add up due to rounding
Inferred Resources are in addition to Measured and Indicated Resources. See "Cautionary Note to US Investors Regarding Reserve and Resource Reporting Standards".
| 1 | Mineral Resources reported by operator exclusive of Mineral Reserves. The Company's QP determined the inclusive Mineral Resources by adding the exclusive Measured and Indicated Mineral Resources to the Proven and Probable Reserves |
| 2 | Mineral Reserves and Resources are reported by the operator in non-metric units. The Company's QP calculated the metric conversion using 1 opt = 34.286 g/t, 1 short ton = 0.9018 metric tonnes, 1 oz = 31.1035 g |
| 3 | Lundin Mining Corporation; Company Press Release, September 13, 2021 |
| 4 | The stream agreement applies to 100% of the property, but only with respect to the ownership interest of Lundin Mining Corporation which indirectly owns 80% of the Candelaria Copper Mining Complex |
| 5 | Glencore; Resources & Reserves as at December 31, 2021 |
| 6 | Southern Peaks Mining LP; Mineral Reserves: Feasibility Study Condestable Mine, October 15, 2021. Mineral Resources: Letter to Franco-Nevada (Barbados) Corporation, February 4, 2022, containing global, in situ, resource estimate |
| 7 | Vale S.A., Form 20-F as filed with the Securities and Exchange Commission on March 23, 2021 |
| 8 | Yamana Gold Inc.; News Release, February 8, 2022 |
| 9 | Gold Fields Limited; Mineral Resources and Mineral Reserves Supplement to the Integrated Annual Report 2020 |
| 10 | SolGold Plc; Annual Report 2021 & News Release, October 19, 2021 |
| 11 | Hochschild Mining Plc; News Release, November 30, 2021 |
| 12 | First Quantum Minerals Ltd.; News Release, November 30, 2020 |
| 13 | OZ Minerals Ltd.; Mineral Resource Estimate and Ore Reserve Statement as at May 6, 2019 and June 24, 2019 |
| 14 | Patagonia Gold Corp.; Investor Presentation, November 2021 |
| 15 | Coro Mining Corp.; NI 43-101 Technical Report, Preliminary Feasibility Study, San Jorge 25kt/y Copper Leach Project, March 2012 |
| 16 | Hochschild Mining Plc; Corporate Website, February 10, 2022 |
| 17 | First Quantum Minerals Ltd.; Annual Information Form, March 29, 2021 |
| 18 | Coeur Mining, Inc.; News Release, February 16, 2022 |
| 19 | Barrick Gold Corporation; Press Release, February 10, 2022. Carlin Trend includes Goldstrike, Gold Quarry and South Arturo as well as other properties where Franco-Nevada has no royalties or stream interests |
| 20 | SSR Mining Inc.; Technical Report, February 2022 |
| 21 | Kinross Gold Corporation; News Release, February 16, 2022 |
| 22 | Equinox Gold Corp.; Mineral Reserves and Mineral Resources, September 20, 2021 |
| 23 | Equinox Gold Corp.; Mineral Reserves and Mineral Resources, September 20, 2021 |
| 24 | Hecla Mining Company; Company Press Release, February 17, 2022 |
| 25 | Hecla Mining Company; Company Press Release, February 17, 2022 |
| 26 | Midas Gold Corp. (now Perpetua Resources Idaho, Inc.); NI 43-101 Feasibility Study Technical Report, December 22, 2020 |
| 27 | Gold Bull Resources Corp.; News Release, February 2, 2021 |
| 28 | KGHM; Mineral Resources and Reserves Report, December 31, 2014 |
| 29 | Agnico Eagle Mines Ltd.; Mineral Reserves and Mineral Resources as of December 31, 2021 |
| 30 | KGHM does not provide updated Mineral Reserve and Mineral Resource estimates. As such, Franco-Nevada has chosen not to display the historical figure moving forward |
| 31 | Barrick Gold Corporation; Press Release, February 10, 2022 |
| 32 | Pretium Resources Inc.; 2021 Brucejack Mine Mineral Reserves and Mineral Resources |
| 33 | Agnico Eagle Mines Ltd.; Mineral Reserves and Mineral Resources as of December 31, 2021 |
| 34 | Victoria Gold Corp.; Corporate Website, January 2022 |
| 35 | Newmont Corporation; News Release, February 24, 2022 |
| 36 | Pan American Silver Corp.; NI 43-101 Technical Report, June 30, 2021 |
| 37 | Yamana Gold Inc.; News Release, February 8, 2022 |
| 38 | Alamos Gold Inc.; Press Release, February 22, 2022 |
| 39 | Agnico Eagle Mines Ltd.; Mineral Reserves and Mineral Resources as of December 31, 2021 |
| 40 | Agnico Eagle Mines Ltd.; Mineral Reserves and Mineral Resources as of December 31, 2021 |
| 41 | Agnico Eagle Mines Ltd.; Mineral Reserves and Mineral Resources as of December 31, 2021 |
| 42 | Equinox Gold Corp.; Mineral Reserves and Mineral Resources, September 20, 2021 |
| 43 | Marathon Gold Corporation; NI 43-101 Technical Report & Feasibility Study, April 15, 2021 |
| 44 | Skeena Resources Ltd.; NI 43-101 Technical Report and Prefeasibility Study, July 22, 2021 |
| 45 | Evolution Mining Limited; ASX Announcement, 20 May 2021, NI 43-101 Technical Report, January 27, 2021 prepared for Battle North Gold Corp. |
| 46 | Seabridge Gold Inc.; Mineral Reserves and Resources, December 2020 |
| 47 | Fortune Bay Corp.; Technical Report: Resource Estimate for the Goldfields Project, May 4, 2021 |
| 48 | Yamana Gold Inc.; News Release, February 8, 2022 |
| 49 | Ascot Resources Ltd.; Premier & Red Mountain Gold Project Feasibility Study NI 43-101 Technical Report, April 15, 2020 |
| 50 | Wallbridge Mining Company Limited; NI 43-101 Technical Report, December 23, 2021 |
| 51 | Regis Resources Limited; ASX Announcement, June 15, 2021 |
| 52 | Wiluna Mining Corporation Limited; ASX Announcements, March 16, 2021 & November 17, 2021 |
| 53 | Northern Star Resources Limited; ASX Announcement, May 3, 2021 |
| 54 | Northern Star Resources Limited; ASX Announcement, May 3, 2021 |
| 55 | Bardoc Gold Ltd.; December 2021 Quarterly Activities Report |
| 56 | Matsa Resources Ltd.; ASX Announcement, September 2, 2021 & AngloGold Ashanti Limited; Mineral Resource and Ore Reserve Report as at December 31, 2020 |
| 57 | Catalyst Metals Limited; ASX Announcement, October 5, 2021 |
| 58 | Norton Gold Fields Limited; Corporate Website, February 1, 2022 |
| 59 | Ramelius Resources Limited; ASX Release, September 10, 2021 |
| 60 | Gascoyne Resources Limited; Corporate Presentation, January 20, 2022 |
| 61 | Harmony Gold Mining Company Limited; Mineral Resources and Mineral Reserves Report 2021 |
| 62 | Endeavour Mining Corp.; Annual Information Form, March 31, 2021 |
| 63 | Kinross Gold Corporation; News Release, February 16, 2022 |
21
| 64 | Newmont Corporation; News Release, February 24, 2022 |
| 65 | Endeavour Mining Corp.; Annual Information Form, March 31, 2021 |
| 66 | Perseus Mining Ltd.; Company Press Release, August 24, 2021 |
| 67 | Ariana Resources PLC; Press Release, February 1, 2022 |
| 68 | Fortuna Silver Mines Inc.; NI 43-101 Technical Report, Seguela Project Feasibility Study (Prepared for Roxgold), May 26, 2021 |
| 69 | Eldorado Gold Corp.; News Release, December 15, 2021 |
| 70 | Alamos Gold Inc.; Press Release, February 22, 2022 |
| 71 | Perseus Mining Ltd.; Company Press Release, August 24, 2021 |
| 72 | Lundin Mining Corporation; Company Press Release, September 13, 2021 |
| 73 | Glencore; Resources & Reserves as at December 31, 2021 |
| 74 | Teck Resources Limited; Annual Information Form, February 23, 2022 |
| 75 | The stream agreement applies to 100% of the property, but only with respect to the ownership interest of Teck Resources Limited which indirectly owns a 22.5% interest in Compañía Minera Antamina S.A. |
| 76 | Southern Peaks Mining LP; Mineral Reserves: Feasibility Study Condestable Mine, October 15, 2021. Mineral Resources: Letter to Franco-Nevada (Barbados) Corporation, February 4, 2022, containing global, in situ, resource estimate |
| 77 | Yamana Gold Inc.; News Release, February 8, 2022 |
| 78 | Gold Fields Limited; Mineral Resources and Mineral Reserves Supplement to the Integrated Annual Report 2020 |
| 79 | SolGold Plc; Annual Report 2021 |
| 80 | Patagonia Gold Corp.; Investor Presentation, November 2021 |
| 81 | First Quantum Minerals Ltd.; Annual Information Form, March 29, 2021 |
| 82 | Hecla Mining Company; Company Press Release, February 17, 2022 |
| 83 | Skeena Resources Ltd.; NI 43-101 Technical Report and Prefeasibility Study, July 22, 2021 |
| 84 | Sibanye-Stillwater; Market Release, March 2, 2022 |
| 85 | KGHM does not provide updated Mineral Reserve and Mineral Resource estimates. As such, Franco-Nevada has chosen not to display the historical figure moving forward |
| 86 | Noront Resources Ltd.; NI 43-101 Technical Report Feasibility Study, September 4, 2012 |
| 87 | Generation Mining Limited; Corporate Presentation, January 2022 |
| 88 | Lonmin Plc; Mineral Resource and Mineral Reserve Statement 2017 |
| 89 | Vale S.A., Form 20-F as filed with the Securities and Exchange Commission on March 23, 2021 |
| 90 | SolGold Plc; Annual Report 2021 & News Release, October 19, 2021 |
| 91 | Teck Resources Limited; Annual Information Form, February 23, 2022 |
| 92 | First Quantum Minerals Ltd.; News Release, November 30, 2020 |
| 93 | Los Andes Copper Ltd.; Corporate Presentation, January 17, 2022 |
| 94 | Hudbay Minerals Inc.; Investor Presentation, February 2022 |
| 95 | KGHM; Mineral Resources and Reserves Report, December 31, 2014 |
| 96 | Glencore; Resources & Reserves as at December 31, 2014 |
| 97 | Noront Resources Ltd.; NI 43-101 Technical Report Feasibility Study, September 4, 2012 |
| 98 | Canada Nickel Company Inc.; Corporate Presentation, February 2022 |
| 99 | BHP Group Limited; Annual Report 2021 |
| 100 | Noront Resources Ltd.; Corporate Website, March 7, 2022 |
| 101 | Vale S.A., Form 20-F as filed with the Securities and Exchange Commission on March 23, 2021 |
| 102 | Labrador Iron Ore Royalty Corporation; Annual Information Form, March 11, 2022 |
| 103 | Franco-Nevada holds a 9.9% equity interest in Labrador Iron Ore Royalty Corporation ("LIORC"). LIORC, directly and through its wholly-owned subsidiary, owns a 15.1% equity interest in Iron Ore Company of Canada and receives a 7% gross overriding royalty on the operation and also receives a C$0.10/t commission on sales of iron ore |
22
ANTAMINA MINING AND TECHNICAL INFORMATION
Description and Location
The Antamina project is owned and operated by CM Antamina, a Peruvian Sociedad Anonima indirectly owned by BHP Billiton plc (33.75%), Glencore (33.75%), Teck (22.5%) and Mitsubishi Corporation (10%).
The Antamina property consists of numerous mining concessions and mining claims covering an area of approximately 92,300 hectares and an area of approximately 15,000 hectares of surface rights. These rights, concessions and claims can be held indefinitely, contingent upon the payment of annual license fees and provision of certain production and investment information. All of the mining concessions are located in the San Marcos District, Province of Huari, Ancash Department, Peru, and constitute all of the mineral rights that are required to permit exploitation of the deposit for which Mineral Reserves and Mineral Resources are stated. CM Antamina has sufficient surface rights for mining, tailings disposal, waste disposal, processing and required infrastructure, based on the current Mineral Reserves.
CM Antamina also owns a port facility located at Huarmey and an electrical substation located at Huallanca. CM Antamina holds title to all easements and rights of way for the 302 kilometre concentrate pipeline from the mine to CM Antamina’s port at Huarmey.
In Peru, the mining tax regime includes the Special Mining Tax and the Modified Mining Royalty which apply to CM Antamina’s operating margin based on a progressive sliding scale ranging from 3% to 20.4%. CM Antamina is also subject to Peruvian income tax.
In addition to Franco-Nevada’s stream, Teck’s interest is subject to a net profits royalty of 1.667% payable in respect of all of CM Antamina’s free cash flow. In addition, certain of Antamina’s unexploited concessions are subject to a contractual 2.5% NSR royalty. The concessions are otherwise free of any contractual royalties or back-in rights.
Accessibility, Climate, Local Resource, Infrastructure and Physiography
The Antamina deposit is located at an average elevation of 4,200 metres, 385 kilometres by road and 270 kilometres by air north of Lima, Peru. Antamina lies on the eastern side of the Western Cordillera in the upper part of the Rio Marañon basin. Mine personnel live in a camp facility while at work and commute from both local communities and larger population centres, including Lima.
The mine is accessible via an all-weather chip sealed access road maintained by CM Antamina. The mine road connects at the Peruvian National Highway 14 at Conococha Lake. The closest town to the mine site is San Marcos, 38 kilometres by dirt road. Huaraz is the closest city to the mine site, 200 kilometres by paved road or 156 kilometres by partial dirt road.
Power for the mine is taken from the Peru national energy grid through an electrical substation constructed at Huallanca. Fresh water requirements are sourced from a dam-created reservoir upstream from the tailings impoundment facility. The tailings impoundment facility is located next to the mill. Water reclaimed from the tailings impoundment is used as process water in the mill operation. The operation is subject to water and air permits issued by the Government of Peru and is in material compliance with those permits. The operation holds all of the permits that are material to its current operations.
The topography in the area of the Antamina property is characterized by steep, sharp limestone ridges and peaks, generally at 4,500 to 4,800 metres altitude, but up to a maximum of 5,073 metres. There are short glacial valleys with lakes and deep, steep-sided river canyons and valleys. The ambient air temperatures at the Antamina property range from an hourly maximum of 15.3°C to an hourly minimum of -0.1°C and the rainfall averages 1,870 millimetres per year. These conditions are appropriate to conduct mining operations throughout the year. Occasional interruptions in mining activities may occur due to strong lightning storms.
History
The Antamina valley has seen limited mineral production by indigenous peoples for centuries. The Cerro de Pasco Corporation (“Cerro”) was the first company to carry out exploratory work of any magnitude on the Antamina project, beginning in 1952. Cerro defined over one million tonnes averaging better than 3.0% copper and a lower grade reserve of 10 million tonnes. In 1970, all of the mining assets owned by Cerro were transferred to the Government of Peru. Following expropriation, Minero Perú, the Peruvian mining administration agency, formed the Empresa Minera Especial (“EME”) in partnership with Geomin, the Romanian mining agency. EME carried out a work program on the property culminating in a series of feasibility studies based on the proven and probable reserves determined from drilling and underground sampling. The basic mining plan involved an initial open pit producing 10,000 tonnes per day of ore for seven years then 20,000 tonnes per day for 13 years. EME updated the initial study in 1978, 1979 and 1982. EME was disbanded in the 1981-1982 period due to its failure to finance the project.
In 1996, Rio Algom Limited and Inmet Mining Corporation acquired the Antamina project and shortly afterward formed CM Antamina to hold their interest in the project. In 1998, Inmet Mining Corporation sold its interest in CM Antamina, and CM Antamina was restructured under the ownership of Rio Algom Limited (37.5%), Noranda Inc. (37.5%) and Teck Corporation
23
(25%). In 1999, the ownership was further modified as the three partners sold 10% of their interest to Mitsubishi Corporation, resulting in the ownership of Rio Algom Limited (33.75%), Noranda Inc. (33.75%), Teck Corporation (22.5%) and Mitsubishi Corporation (10%). As a result of various corporate transactions involving its parent owners, the current ownership of CM Antamina is BHP Billiton plc (33.75%), Glencore (33.75%), Teck (22.5%) and Mitsubishi Corporation (10%).
Geological Setting, Mineralization and Deposit Type
The Antamina deposit sits at the bottom of a glacial valley surrounded by limestone ridges. It is hosted in a sequence of limestones and sediments, which were strongly deformed by thrusting and folding, then later intruded by intermediate to felsic stocks.
The Antamina polymetallic deposit is skarn-hosted. It is unusual in its persistent mineralization and predictable zonation, and has a SW-NE strike length of more than 2,500 metres and a width of up to 1,000 metres. The skarn is well-zoned symmetrically on either side of the central intrusion with the zoning used as the basis for four major subdivisions: a brown garnet skarn, a green garnet skarn, a wollastonite/diopside/green garnet skarn and a marbleized limestone with veins or mantos of wollastonite. Other types of skarn, including the massive sulphides, massive magnetite, and chlorite skarn, represent the remainder of the skarn and are randomly distributed throughout the deposit. The variability of ore types can result in significant changes in the relative proportions of copper and zinc produced in any given year.
Chalcopyrite is the predominant copper sulfide mineral. Approximately five percent of the copper mineralization is in the form of the copper sulfide mineral bornite. Zinc occurs primarily as the sulfide mineral sphalerite. Silver is normally associated in solid solution with chalcopyrite. However, it is also associated with galena, bismuth sulphosalts and tennantite. Molybdenum exists as the sulfide mineral molybdenite.
Metal zonation is quite distinctive within the deposit. Copper occurs relatively evenly distributed from endoskarn to the limestone contact. Zinc and bismuth tend to occur within 70 metres of the contact of green garnet skarn with limestone/marble/hornfels. Molybdenite is generally located within the intrusive core and the surrounding endoskarn. Silver is present in any of the exoskarn lithologies. Lead is generally located in green garnet exoskarn, diopside exoskarn and hornfels. However, veins and blebs of tennantite and other minerals can be found as rare occurrences in any rock type at Antamina.
Exploration
Commencing in 1996, CM Antamina performed an extensive exploration and development program to define the deposit. A resource model was built in 1997 to provide input to the feasibility study. The Antamina deposit had been drilled and underground sampled to the level that a resource and reserve model was constructed and a feasibility study undertaken in 1998. Work performed on the property up to 1999 includes metallurgical testing, check assaying of previous drill hole and underground tunnel pulps, geologic mapping, geotechnical core logging and mapping, 135 kilometres of core drilling, 6 kilometres underground tunnels and 225 metres of drifting for bulk sampling. As well, during the development and feasibility work, over 400 tonnes of metallurgical samples, representing all parts of the deposit, were taken and shipped to labs for various bench scale flotation and milling tests as well as pilot plant tests. Project construction was commenced in 1999 with initial production realized in June 2001. Since production, additional exploration studies have associated satellite areas of the property with the main intrusive and Antamina skarn through geochronology, isotopic and alteration patterns. In addition, a series of potential areas for grass-roots exploration have been identified based on stratigraphic, structural and morphological patterns.
Drilling
The Antamina data set contains core drill data, reverse circulation drill data, and data from underground drifts. EME drilled 174 core holes for 19,885 metres and extended the underground drifts driven by Cerro to a total of 6,000 metres. In addition, the entire 6,000 metres of underground drifts were channel sampled. Between 1996 and 2008, CM Antamina drilled an additional 1,905 core holes for 580,060 metres. The drill hole and underground data has been entered into AcQuire database software for validation and storage. The Antamina resource model is updated on an annual basis to incorporate new available drilling data and improved understanding of the orebody.
In 2021, the drilling program consisted of 28 directional drillholes totalling 11,478 metres and 50 non-directional drillholes totalling 16,372 metres. The total programme consisted of approximately 27,850 metres completed within the Antamina pit.
For diamond core, three-metre samples on average of half core (HQ or NQ) are collected and prepared for assay at an external laboratory. The remaining half of the core is retained for future reference. The assay program includes approximately 20% of quality-control samples, comprising reference materials, duplicates and blanks as well as samples for external control at a secondary laboratory. The reference materials consist of matrix-matched material from Antamina, homogenized and certified in accordance with industry practice.
24
Sampling, Analysis and Data Verification
More than 280,000 samples have been analyzed. Assay data used for resource modeling is predominately from drill core samples (95%), with a lesser amount of underground channel (4%) and reverse circulation (1%) samples. No bias was noted for particular minerals with respect to core recovery and the samples used for the resource estimation are considered representative. Drill core sampling methodology for all Antamina drilling campaigns was the same: the drill core was cut in half, and sample intervals were set at three metres in length; however, the length of samples were adjusted to start and end at major geologic alteration and lithology contacts. All efforts were made to collect samples with a minimum length not less than 1 metre, except for density samples which average approximately 0.15 metre in length. The whole length of the drill hole was sampled, whether mineralized or not, except where low recovery prevented the collection of a representative sample. Most of the density data has been collected using two methods: caliper and wax-coat water immersion (which were determined to produce equivalent datasets). Additional studies were performed to determine correction factors for the bias between the whole core density and the in-situ density. Those factors were subsequently used during the resource estimation procedures. A bulk metallurgical sample was taken for pilot plant testing to determine grinding and bulk flotation characteristics of the ores. A drift location for the bulk sample was selected in the likely starter pit area. Approximately 400 tonnes of material were shipped for testing.
For all drilling programs run by CM Antamina, sample preparation, assaying, analytical and quality control procedures have followed acceptable industry standard practices. The procedures followed included the use of independent assay labs for all sample preparation and assays and the use of QA/QC protocols in all drilling campaigns. Additionally, most of the drilling programs included an independent audit of the QA/QC program and results. All original data (geological logs, field forms, printed assay certificates, core photographs, and all other types of paper forms) have been archived at the mine site, inventoried and filed by hole. All of the paper forms have been scanned and electronically stored, together with all of the information that was originally received in an electronic form. A backup copy of all electronically-stored data (including backups of the SQL-based resource database) is stored in the CM Antamina vault in Lima. Industry accepted procedures were utilized for sampling, sample preparation, security and analytical procedures. Sample checks have demonstrated that the samples are representative of the mineralization and that there is no bias in the sampling.
Mineral Processing and Metallurgical Testing
Extensive metallurgical testing was conducted on the Antamina ore body from November 1996 to December 1997. The work was carried out by reputable metallurgical laboratories under the direction of a committee of experienced metallurgical experts from within the ownership group supported by independent consultants. Much of the critical initial work was carried out in duplicate at different laboratories. Concentrator operations were started in May 2001. Over twenty years of operational and metallurgical data has been gathered since the original feasibility test work. The operational data and metallurgical relationships developed subsequent to the feasibility study have been applied to the current resource model.
Mineral Resource and Reserve Estimates
The Mineral Reserves and Mineral Resources for the Antamina deposit as of December 31, 2021 are as follows:
Mineral Reserves as at December 31, 2021 (100% basis)
| | | Proven | | | Probable | | | Total |
| |||||||||
|
|
| Tonnes |
|
| Grade |
|
| Tonnes |
|
| Grade |
|
| Tonnes |
|
| Grade |
|
Copper | | | ‘000 | | | Cu % | | | ‘000 | | | Cu % | | | ‘000 | | | Cu % |
|
Copper only ore OP | |
| 132,900 | |
| 0.92 | |
| 81,800 | |
| 0.98 | |
| 214,700 | |
| 0.94 | |
Copper Zinc ore OP | |
| 53,100 | |
| 0.91 | |
| 68,000 | |
| 0.97 | |
| 121,100 | |
| 0.94 | |
Total | |
| 186,000 | |
| 0.92 | |
| 149,800 | |
| 0.97 | |
| 335,800 | |
| 0.94 | |
| | | Proven | | | Probable | | | Total |
| |||||||||
|
|
| Tonnes |
|
| Grade |
|
| Tonnes |
|
| Grade |
|
| Tonnes |
|
| Grade |
|
Zinc | | | ‘000 | | | Zn % | | | ‘000 | | | Zn % | | | ‘000 | | | Zn % |
|
Total | |
| 53,100 | |
| 2.0 | |
| 68,000 | |
| 2.0 | |
| 121,100 | |
| 2.0 | |
| | | Proven | | | Probable | | | Total |
| |||||||||
|
|
| Tonnes |
|
| Grade |
|
| Tonnes |
|
| Grade |
|
| Tonnes |
|
| Grade |
|
Silver | | | ‘000 | | | Ag g/t | | | ‘000 | | | Ag g/t | | | ‘000 | | | Ag g/t |
|
Copper only ore OP | |
| 132,900 | |
| 7.1 | |
| 81,800 | |
| 8.4 | |
| 214,700 | |
| 7.6 | |
Copper Zinc ore OP | |
| 53,100 | |
| 13.1 | |
| 68,000 | |
| 14.6 | |
| 121,100 | |
| 14.0 | |
Total | |
| 186,000 | |
| 8.8 | |
| 149,800 | |
| 11.2 | |
| 335,800 | |
| 9.9 | |
25
| | | Proven | | | Probable | | | Total |
| |||||||||
|
|
| Tonnes |
|
| Grade |
|
| Tonnes |
|
| Grade |
|
| Tonnes |
|
| Grade |
|
Molybdenum | | | ‘000 | | | Mo % | | | ‘000 | | | Mo % | | | ‘000 | | | Mo % |
|
Total | |
| 132,900 | |
| 0.036 | |
| 81,800 | |
| 0.035 | |
| 214,700 | |
| 0.035 | |
Mineral Resources (Exclusive of Mineral Reserves) as at December 31, 2021 (100% basis)
| | | Measured | | | Indicated | | | Inferred |
| |||||||||
|
|
| Tonnes |
|
| Grade |
|
| Tonnes |
|
| Grade |
|
| Tonnes |
|
| Grade |
|
Copper | | | ‘000 | | | Cu % | | | ‘000 | | | Cu % | | | ‘000 | | | Cu % |
|
Copper only ore OP | |
| 84,400 | |
| 0.69 | |
| 319,300 | |
| 0.78 | |
| 606,800 | |
| 0.82 | |
Copper Zinc ore OP | |
| 36,100 | |
| 0.74 | |
| 149,700 | |
| 1.00 | |
| 239,000 | |
| 1.05 | |
Copper only ore UG | | | — | | | — | | | — | | | — | | | 256,400 | | | 1.25 | |
Copper Zinc ore UG | |
| — | |
| — | |
| — | |
| — | |
| 158,400 | |
| 1.16 | |
Total | |
| 120,500 | |
| 0.70 | |
| 469,000 | |
| 0.85 | |
| 1,260,600 | |
| 0.99 | |
| | | Measured | | | Indicated | | | Inferred |
| |||||||||
|
|
| Tonnes |
|
| Grade |
|
| Tonnes |
|
| Grade |
|
| Tonnes |
|
| Grade |
|
Zinc | | | ‘000 | | | Zn % | | | ‘000 | | | Zn % | | | ‘000 | | | Zn % |
|
Copper Zinc ore OP | | | 36,100 | | | 1.4 | | | 149,700 | | | 1.7 | | | 239,000 | | | 1.5 | |
Copper Zinc ore UG | | | — | | | — | | | — | | | — | | | 158,400 | | | 1.4 | |
Total | |
| 36,100 | |
| 1.4 | |
| 149,700 | |
| 1.7 | | | 397,400 | |
| 1.5 | |
| | | Measured | | | Indicated | | | Inferred |
| |||||||||
|
|
| Tonnes |
|
| Grade |
|
| Tonnes |
|
| Grade |
|
| Tonnes |
|
| Grade |
|
Silver | | | ‘000 | | | Ag g/t | | | ‘000 | | | Ag g/t | | | ‘000 | | | Ag g/t |
|
Copper only ore OP | |
| 84,400 | |
| 7.2 | |
| 319,300 | |
| 8.5 | |
| 606,800 | |
| 7.8 | |
Copper Zinc ore OP | |
| 36,100 | |
| 20.7 | |
| 149,700 | |
| 18.1 | |
| 239,000 | |
| 15.6 | |
Copper only ore UG | | | — | | | — | | | — | | | — | | | 256,400 | | | 11.8 | |
Copper Zinc ore UG | |
| — | |
| — | |
| — | |
| — | |
| 158,400 | |
| 15.4 | |
Total | |
| 120,500 | |
| 11.2 | |
| 469,000 | |
| 11.6 | |
| 1,260,600 | |
| 11.0 | |
| | | Measured | | | Indicated | | | Inferred |
| |||||||||
|
|
| Tonnes |
|
| Grade |
|
| Tonnes |
|
| Grade |
|
| Tonnes |
|
| Grade |
|
Molybdenum | | | ‘000 | | | Mo % | | | ‘000 | | | Mo % | | | ‘000 | | | Mo % |
|
Copper only ore OP | | | 84,400 | | | 0.018 | | | 319,300 | | | 0.023 | | | 606,800 | | | 0.025 | |
Copper only ore UG | | | — | | | — | | | — | | | — | | | 256,400 | | | 0.016 | |
Total | |
| 84,400 | |
| 0.018 | |
| 319,300 | |
| 0.023 | |
| 863,200 | |
| 0.022 | |
Notes: (1) Source: Teck AIF dated February 23, 2022. (2) Columns and rows may not add up due to rounding. (3) Mineral Resources that are not Mineral Reserves do not have demonstrated economic viability. (4) Open pit reserve estimates were prepared assuming long-term metal prices of: $3.03/lb copper, $1.07/lb zinc, $9.40/lb molybdenum and $18.32/oz silver. Open pit and underground resource estimates were prepared assuming long-term metal prices of: $3.30/lb copper, $1.18/lb zinc, $11.11/lb molybdenum and $25.14/oz silver. (5) The cut-off grades at Antamina are based on the net value before taxes that the material is expected to generate per hour of concentrator operation at assumed prices, and varies by year in an effort to maximise the net present value of the pit. |
Mineral Reserves are limited by the current operation tailings dam capacity.
Mining Operations
Project construction commenced in 1999 with initial production realized in June 2001. Antamina is currently a producing property, with the mine and concentrator operating at the designed capacity.
The mine is an open-pit, truck/shovel operation.
Processing and Recovery
The ore is crushed within the pit and conveyed through a 2.7 kilometre tunnel to a coarse ore stockpile at the mill. It is then processed utilizing two SAG mills, followed by ball mill grinding and flotation to produce separate copper, zinc, molybdenum and lead/bismuth concentrates. The mill has the capacity to process approximately 145,000 tonnes per day depending on ore hardness. Silver is predominantly contained within the copper concentrates, with additional silver contained within the
26
lead-bismuth concentrate. The concentrator processes multiple ore types on a campaign basis. These campaigns range from a number of days to an entire month or longer depending upon ore development and concentrate marketing requirements.
The last five years of production of metal in concentrates on a 100% basis, from Antamina is shown in the table below:
|
| Metal Produced in Concentrates | ||||||
|
| Cu |
| Zn |
| Mo |
| Ag |
| | (kt) | | (kt) | | (Mlbs) | | (Moz)* |
2017 |
| 422 |
| 372 |
| 8.7 |
| 19.5 |
2018 |
| 446 |
| 409 |
| 10.2 |
| 16.5 |
2019 | | 449 | | 303 | | 7.8 | | 15.0 |
2020 | | 381 | | 428 | | 7.9 | | 16.4 |
2021 | | 445 | | 462 | | 4.9 | | 18.2 |
* Calculated from Glencore’s 33.75% interest in Antamina.
On a 100% basis, Antamina’s 2022 production is expected to be in the range of approximately 405,000-425,000 tonnes of copper, 400,000-420,000 tonnes of zinc and 8 to 10 million pounds of molybdenum in concentrate.
Between 2023 and 2025, Antamina is expected to produce between 400,000 – 425,000 tonnes of copper, 355,000–445,000 tonnes of zinc and 13–18 million pounds of molybdenum in concentrate on a 100% basis, although annual production will fluctuate due to feed grades and the amount of copper-zinc ore processed.
Infrastructure, Permitting and Compliance
A 302 kilometre slurry concentrate pipeline, approximately 22 centimetres in diameter with a single pump station at the mine site, transports copper and zinc concentrates to the Huarmey port, where they are dewatered and stored prior to loading onto vessels for shipment to smelters and refineries world-wide. CM Antamina has entered into long-term off-take agreements with affiliates of the Antamina shareholders on market terms for copper, zinc and molybdenum concentrates.
A closure plan complying with Peruvian law is currently on file with the Ministry of Energy and Mines. Included in the closure plan are details for facility dismantling, demolition, post-closure stability and long-term maintenance (water management/treatment systems, socio-economic support, land use/reclamation, schedules and financial provisions). Engineering and designs are required to be provided to a feasibility level and must be updated every five years or within 12 months of any environmental impact assessment or modification thereto.
Based on currently permitted tailings storage capacity, the mine life is expected to continue until 2028. CM Antamina is currently conducting engineering studies for additional tailings storage options and alternative mine plans that could result in significant mine life extensions. Any mine life extension will require a modification of Antamina’s current Environmental Impact Assessment certificate, a process that began in October 2019 with the submission of the study area and common terms of reference to Peruvian regulators for a mine life extension to 2036. A decision in respect of the requested modification is expected in 2023.
Operating and Capital Costs
Total 2022 projected cash operating costs for the project (shown on a 100% basis, calculated from Teck’s attributable 22.5% share) are tabulated below.
|
| Approximated Projected Cost, |
Component | | $ million |
Labour |
| 467 |
Supplies |
| 453 |
Energy |
| 258 |
Other (including general & administrative, inventory changes) |
| 182 |
Less amounts associated with projected capitalized stripping |
| (338) |
Total |
| 1,022 |
The cash operating costs presented above do not include transportation or royalties.
Under a long-term streaming agreement with the Company, Teck has agreed to deliver silver to the Company equivalent to 22.5% of the payable silver sold by CM Antamina. The Company will pay 5% of the spot price at the time of the delivery for each ounce of silver delivered under the agreement. After 86 million ounces of silver have been delivered under the agreement, the stream will be reduced by one-third. A total of 21.8 million ounces of silver have been delivered under the agreement from the effective date in 2015 to December 31, 2021.
27
Total 2022 projected capital costs for the project (shown on a 100% basis, calculated from Teck’s attributable 22.5% share) are tabulated below:
|
| Approximated Projected Cost, |
Component | | $ million |
Sustaining |
| 436 |
Growth | | 67 |
Capitalized Stripping |
| 338 |
Total |
| 840 |
28
ANTAPACCAY MINING AND TECHNICAL INFORMATION
Property Description, Location and Access
The Antapaccay project is owned and operated by CM Antapaccay, a Peruvian company that is an indirect wholly-owned subsidiary of Glencore. Glencore indirectly acquired CM Antapaccay in May 2013 as a result of its acquisition of Xstrata.
The Antapaccay project is located in southern Peru in the Cusco Region, Espinar District and Province, approximately 250 kilometres from the cities of Cusco and Arequipa. The project is accessed by paved and dirt roads (approximately 5 hours by road from Cusco and Arequipa) and is between 3,800 and 4,000 metres above sea level. Mine personnel live at the mine’s facilities while at work and commute from both local communities and larger population centres.
The Antapaccay mine is located 9.4 kilometres southwest of CM Antapaccay’s past-producing Tintaya mine, and the Antapaccay concentrator is located 4.5 kilometres south of the Tintaya concentrator.
The CM Antapaccay property consists of numerous mining concessions and mining claims covering an area of 99,766 hectares, which includes the former Tintaya mine, current Antapaccay mine and Coroccohuayco project (as described below). These concessions and claims can be held indefinitely, contingent on the payment of the annual license fees and provision of certain production and investment information. The Antapaccay project itself covers 13 mining concessions with a total effective area of 7,944 hectares. These mining concessions constitute all of the mineral rights that are required to permit exploitation of the deposit for which Mineral Reserves are stated.
The CM Antapaccay property also includes the Coroccohuayco project, a satellite deposit that is located within 10 kilometres of the Antapaccay plant. At this stage, exploration, drilling and engineering studies at Coroccohuayco have focused on defining Mineral Resources and Mineral Reserves and no mining activities are being undertaken.
As of March 9, 2022, CM Antapaccay held surface rights over approximately 11,502 hectares of the total concession area and continues to acquire additional surface rights. Surface rights have been acquired for all current operating needs in respect of the Antapaccay project. Additional surface rights would be necessary for the development of certain Mineral Reserves and Mineral Resources.
CM Antapaccay is operating under a tax stability agreement with the government of Peru, pursuant to which it pays a royalty of 1% of net income up to $60 million, 2% of net income between $60 million and $120 million, and 3% of net income in excess of $120 million. CM Antapaccay is also subject to the Special Mining Contribution which applies to its operating income based on a progressive sliding scale ranging from 4% to 13%.
History
Mining activities at the Tintaya mine began in 1984 by the state-owned mining company, Empresa Minera Especial Tintaya SA (“Empresa”). The Tintaya mine produced over 1.6 million tonnes of copper and 500,000 ounces of gold until operations ceased in 2012.
Initial exploration activities outside of the Tintaya mine area focussed on the Antapaccay concessions as well as the concessions comprising the Coroccohuayco project. The existence of copper-bearing mineralization in the area of the Antapaccay project was known, with a history of artisanal mining close to the surface at the old Atalaya mine in the same area.
In October 1994, Magma Copper Company (“Magma”) purchased Empresa, and in 1995 geologists from Magma revised the then existing information on Atalaya (geology and geophysics) and completed mapping of the site, and estimated the potential for 68 million tonnes of skarn-type mineralization grading 1.50% copper.
In July 1998, Broken Hill Proprietary Company Limited (“BHP”) acquired Atalaya, following which exploration commenced. Two copper-gold porphyry-type orebodies were discovered in addition to the skarn-type mineralization, and, in February 2000, Mineral Resources of 285 million tonnes grading 0.95% copper and 0.19 grams per tonne gold were reported.
The Antapaccay project was managed by BHP Billiton (formed by the merger of BHP with Billiton plc) until 2006, when Xstrata acquired properties in Peru, including the Tintaya mine and plant that were operating at the time and the Antapaccay project. Following the acquisition, further project and infill drilling work was completed on Antapaccay, and construction of the mine and related infrastructure started in 2010. Mining operations commenced in 2012 with first concentrate production in November 2012 and initial design capacity of 70,000 tonnes per day reached in February 2013.
Geological Setting, Mineralization and Deposit Type
Antapaccay
The Antapaccay project contains a porphyry-skarn type (copper-silver-gold) deposit located in the Eocene-Oligocene Andahuaylas-Yauri strip, 9.4 kilometres southwest in a straight line from the Tintaya mine, in the area of the old Atalaya mine. The Eocene-Oligocene Andahuaylas-Yauri strip is located 250 to 300 kilometres west of the current Peru-Chile Trench, above a thick cap of sialic crust (50 to 60 kilometres), in a transitory zone between the flat subduction slab of central Peru and the
29
normal subduction of southern Peru and northern Chile and immediately to the southeast of the Abancay deflection. It consists geologically of a thick cretaceous sedimentary sequence folded during the Andean deformations and widely intruded by stocks, sills and dykes of Andahuaylas-Yauri batholith, covered by Cenozoic lacustrine and volcanic deposits and quaternary deposits.
The copper mineralization at Antapaccay is mainly contained in intermediate intrusive rocks with dissemination, veinlets, hydrothermal breccias which are in contact with pre-mineral rocks such as diorites and sedimentary rocks (limestones, calcareous shales, siltstones and sandstones), forming contact mineralized breccias, exoskarn and stockwork in sedimentary bodies with a clear predominance of chalcopyrite over bornite up to 350 metres; the roles reverse at a greater depth and are associated with a level of anhydrite-gypsum.
The dominant mineralization within the porphyry is chalcopyrite, followed by bornite and chalcocite. Mineralization consists of both disseminations and veinlets, with the highest grades of gold corresponding to intense bornite rich stockwork zones. The dominant alteration type within the porphyry is a potassic alteration of the host diorite. The porphyry is also in contact with cretaceous sedimentary rocks, which have formed irregular skarn (limestones) and stockwork (hornfels and quartzites) containing high copper values, but represent a minor component of all the resources.
The conditions for the occurrence of a metasomatic process exist in contact with limestones, generating irregular garnet-magnetite +/-pyroxene exoskarn, mainly with chalcopyrite patches. Extensive areas of intense grey quartz veinlet stockwork with a high bornite and chalcopyrite content were identified always near the hornfels-intrusive rock contact, expanding into the hornfels for several metres.
Coroccohuayco
The main copper bearing minerals at Coroccohuayco are bornite, chalcopyrite and chalcocite, with the host rock consisting of Cretaceous sedimentary rocks of the Ferrobamba and Mara formation intruded by monzonitic plutons of the Eocene—Oligocene Andahuaylas—Yauri batholiths. The Coroccohuayco deposit is dominantly a skarn-hosted deposit, whereas the Antapaccay deposit is dominantly porphyry-hosted.
Exploration
General geological techniques utilized at the Antapaccay project include geological mapping, soil geochemistry, geophysical studies (magnetic and induced polarization), cartography, diamond drilling, sampling and interpretation. In addition, up-to-date aerial photographs of the project have been collected to generate digital topographical reliefs to 5 metres. Exploration work undertaken to date indicates the potential for additional copper discoveries within the CM Antapaccay property area.
Drilling
Antapaccay
The Antapaccay resource model is updated on an annual basis to incorporate new available drilling data and improved understanding of the orebody. The orebody model and Mineral Resource estimate for 2021 was updated using a drill hole database that now includes over 385,030 meters and 1,117 drill holes) total drilling data.
The last geological drilling campaign was carried out in 2021 with 12,422.8 meters in 50 drill holes.
Coroccohuayco
The orebody model and Mineral Resource estimate for Coroccohuayco was updated in 2019 using 255,611 metres of drilling. No further drilling has taken place in 2020 or 2021.
Sampling, Analysis and Data Verification
Samples of diamond drill hole cores were collected in carton boxes in the drilling area and the logging area to record geological, geo-mechanical and geotechnical data and to be photographed. Sampling intervals of 2, 2.5 and 3 metres were predominantly used, and 2-metre intervals were standard for mineralized rocks. Samples were sent to the Tintaya sampling area for preparation in accordance with standard protocols. The remaining materials, being half core samples and coarse and fine pulps, were stored in the enclosed areas located at the Tintaya camp.
Drill core sampling methodology for Antapaccay drilling campaigns followed a standardized procedure for copper. The drill core was split in half, respecting the distribution of the mineralization indicated by the logging geologist, and the sample was then reduced by up to 90% of its size with progressively smaller meshes (down to 2 millimetre sieve size). The sample was then reduced with a Jones Riffle quarterer, obtaining 2 kilograms of sample, which was bagged to be kept in the respective file. The rest of the sample was quartered to obtain four 0.5 kilogram samples, which were then dried and pulverized up to 95% of their size with a #140 mesh (0.106 millimetre sieve size). The pulverized samples were put in jars and placed in a homogenizer for 5 minutes and then placed in envelopes, with one envelope sent to the laboratory and the remaining 3 envelopes stored for future requirements. A duplicate was taken every 20 intervals of samples with copper grading more than 0.30%. Upon obtaining 30 samples, the samples were re-encoded and sent to the same laboratory. Standard samples were placed at intervals indicated by CM Antapaccay geologists.
30
For all drilling programs run by CM Antapaccay, sample preparation, assaying, analytical and quality control procedures have followed acceptable industry standard practices. Current quality control of the chemical analysis procedures include standard sample preparation of low, middle and high grade material from the deposit, fine white sample preparation, protocols for blast holes, drill holes, specific gravity for diamond drill programs, and a general quality assurance and quality control (“QA/QC”) program, based on the latest developments in the industry.
Mineral Processing and Metallurgical Testing
Extensive metallurgical test work and studies have been completed on Antapaccay ore, both prior to the construction of the Antapaccay plant and since commissioning in 2012. The work was completed by a number of reputable engineering and metallurgical laboratories.
Mineral Resource and Mineral Reserve Estimates
The Mineral Resources for the Antapaccay project were estimated from core drilling information and were evaluated using standard geological and geostatistical block modelling methodologies. The primary estimation methodology was Ordinary Kriging. The Mineral Reserve estimate is based on a mine plan and open pit designs developed using modifying parameters including metal prices, metal recovery, operating costs and sustaining capital cost estimates based on the production schedule and equipment requirements.
The Mineral Reserves for the Antapaccay Deposit and Mineral Resources for the Antapaccay and Coroccohuayco deposits are as follows:
Mineral Reserve Statement as of December 31, 2021 | | | | | ||||
|
| |
| Proved Ore Reserves |
| Probable Ore Reserves |
| Total Ore Reserves |
Antapaccay | | Ore (Mt) | | 189 | | 286 | | 475 |
|
| Copper (%) |
| 0.45 | | 0.40 | | 0.42 |
|
| Gold (g/t) |
| 0.08 | | 0.08 | | 0.08 |
|
| Silver (g/t) |
| 1.19 | | 1.13 | | 1.15 |
Mineral Resource Statement as of December 31, 2021 | | | | | | | ||||
|
| |
| Measured Mineral |
| Indicated Mineral |
| Measured and Indicated |
| Inferred Mineral |
| | | | Resources | | Resources | | Mineral Resources | | Resources |
Antapaccay | | Ore (Mt) | | 194 | | 438 | | 632 | | 177 |
|
| Copper (%) |
| 0.44 | | 0.37 | | 0.39 | | 0.28 |
|
| Gold (g/t) |
| 0.08 | | 0.08 | | 0.08 | | 0.05 |
|
| Silver (g/t) |
| 1.19 | | 1.06 | | 1.10 | | 0.66 |
Coroccohuayco | | Ore (Mt) | | 72 | | 571 | | 643 | | 61 |
| | Copper (%) | | 0.64 | | 0.59 | | 0.60 | | 0.36 |
| | Gold (g/t) | | 0.08 | | 0.08 | | 0.08 | | 0.05 |
| | Silver (g/t) | | 2.60 | | 2.30 | | 2.33 | | 1.23 |
Notes:
| (1) | Source: Glencore Statement of Resources & Reserves as at December 31, 2021. Mineral Resources and Mineral Reserves are reported in accordance with the 2012 edition of the Australasian Code for Reporting of Exploration Results, Mineral Resources and Ore Reserves (JORC Code). |
| (2) | Measured and Indicated Mineral Resources are reported inclusive of Mineral Reserves. |
| (3) | Columns and rows may not add up due to rounding. |
| (4) | Mineral Resources that are not Mineral Reserves do not have demonstrated economic viability. |
| (5) | Commodity prices and exchange rates used to establish the economic viability of Mineral Reserves are based on long-term forecasts applied at the time the Mineral Reserve was estimated. |
| (6) | Mineral Resources and Mineral Reserves for Antapaccay were estimated using a variable cut off grade with a marginal cut-off grade of 0.10% Cu content considered as the minimum recoverable grade. Mineral Resources for the Coroccohuayco deposit are based on an economic pit shell and are reported with a 0.10% Cu cut-off as a minimum recoverable grade in the plant. |
Following interpretation of the revised and updated drilling results at Coroccohuayco, the expected method of exploitation changed from a combined open pit/underground operation to open pit only.
The difference in resources at Coroccohuayco compared to 2020 is due to the increase in the prices of Cu, Au and Ag metals, as well as decreased mining costs in the long-term.
The reset of mine planning to the conceptual stage for open pit mining has resulted in zero ore reserves being declared in 2021 at Coroccohuayco.
The Lerchs-Grossman pit optimization method was used to determine the economic pit shell for Measured, Indicated and Inferred Mineral Resources. This method was selected over the floating cone since it provides for improved optimization for discontinuous orebodies in which a mineral area may share some waste material extraction expenses. This situation exists at Antapaccay with the monzonitic porphyry that has a prophylitical alteration and the waste rock area between the North and South pits, separating part of the orebody.
31
The calculated profit values per block were directly used in the Lerchs-Grossman process for the required economic data. The inter-ramp slope angles recommended by engineering consultants and metallurgical recovery were used to control the walls during the optimization process. The Lerchs-Grossman algorithm finds the most profitable pit surface based on the three-dimensional graph theory, block-by-block economic values and pit slope data.
The resulting life of mine plan and Mineral Reserve estimates consider only Measured and Indicated Mineral Resources, with all Inferred Mineral Resources within the design pit being treated as waste.
Mining Operations
The Antapaccay mine is an open pit mine (consisting of a North pit and a South pit) with truck and shovel operations that provide a total annual material handling capacity of approximately 180 million tonnes of material. Major equipment includes a fleet of owner-operated 400 short ton class trucks, 48 cubic metre and 35 cubic metre rope shovels, dozers and loaders, as well as support equipment. Ore is mined and sent to the primary crusher located at the mine and the crushed ore is subsequently transported to the coarse ore stockpile by an overland conveyor of approximately 6.8 kilometres. The feeders at the coarse ore stockpile convey the crushed ore to the Antapaccay plant for processing. A portion of the material from the coarse ore stockpile is transported to the Tintaya plant for processing.
The Antapaccay metallurgical plant consists of a semi-autogenous grinding mill and two ball mills to prepare feed for a conventional flotation circuit to recover the copper, gold and silver contained in the feed ore into a copper concentrate. The Tintaya metallurgical plant consists of multi-stage crushing followed by ball-milling to prepare feed for a conventional flotation circuit to recover the copper, gold and silver contained in the feed ore into a copper concentrate. The nominal throughput of the Antapaccay and Tintaya plants are currently approximately 90,000 and 20,000 tonnes per day, respectively. The copper concentrate produced from both processing plants is thickened and filtered on site prior to being trucked approximately 355 kilometres to port facilities at the Port of Matarani, operated by TISUR, for shipment to smelters. The road from Tintaya to the port has been expanded to accommodate the shipment of concentrates originating from the Antapaccay project.
Flotation tailings are thickened and delivered to the Tintaya open pit for disposal. The fully-permitted tailings dam storage capacity is sufficient for the current Antapaccay life of mine plan and options to increase height for extended capacity are being studied.
The last five years of production (metal in concentrates) from Antapaccay is shown in the table below:
| | Metal Produced in Concentrates | ||||
| | Cu |
| Au |
| Ag |
|
| (kt) | | (koz) | | (koz) |
2017 |
| 207 |
| 139 |
| 1,455 |
2018 |
| 205 |
| 132 |
| 1,523 |
2019 |
| 197 |
| 85 |
| 1,576 |
2020 |
| 186 |
| 90 |
| 1,298 |
2021 |
| 171 |
| 90 |
| 1,382 |
The current life of mine plan contemplates that the Antapaccay mine will operate for 12 years ending in 2033, with ore processed through the Tintaya and Antapaccay plants. There is the potential to extend the mine life beyond 2033 through additional exploration on the CM Antapaccay property and the development of the Coroccohuayco deposit.
The material produced from the Antapaccay project is marketable in the main international concentrate markets based on its specifications. Payments made to CM Antapaccay are based on the copper, gold and silver contained in concentrates typical for the international concentrate markets.
Infrastructure, Permitting and Compliance Activities
Power for the Antapaccay project is supplied from the Peru national energy grid through an electrical substation constructed at Tintaya. Water consumption is primarily sourced from recycled water from the tailings facility for concentrator plant operations. The Antapaccay project currently has water rights which are sufficient for its requirements and the operation currently discharges a surplus of pre-treated water of around 700 l/s.
CM Antapaccay holds all of the permits that are material to the Antapaccay operations, operating permits are valid until the end of the life of the mine and a closure plan complying with Peruvian law has been approved by the relevant authorities. Included in the closure plan are details for facility dismantling, demolition, post-closure stability and long-term maintenance, including socio-economic support, reclamation, schedules and financial provisions.
Capital and Operating Costs
The main capital expenditures for 2022 are sustaining capital costs.
32
The Antapaccay project is a low-cost copper project. Fluctuations in the cash operating costs are largely driven by the changes in the copper head grade in the open pit over the life of mine.
Exploration and Development
Ongoing drilling campaigns are planned to further define the lithology of the resource at depth and for exploratory drilling. Beyond the estimated Mineral Resources and Mineral Reserves of Antapaccay and Coroccohuayco, there are a number of regional targets and prospects for exploration across the 99,766 hectares of concessions held by CM Antapaccay.
33
CANDELARIA MINING AND TECHNICAL INFORMATION
Property Description, Location and Access
The Candelaria Copper Mining Complex comprises two adjacent copper mining operations, Compañia Contractual Minera Candelaria (“Minera Candelaria”) and Compañia Contractual Minera Ojos del Salado (“Minera Ojos del Salado”), which produce copper concentrates from open pit and underground mines. Minera Candelaria is an open pit and underground mine (“Candelaria Underground”) providing copper ore to an on-site flotation concentrator with a nominal processing capacity of 75,000 tonnes per day, and Minera Ojos del Salado comprises two underground mines: Santos and Alcaparrosa. The Santos mine provides copper ore to an on-site concentrator with a capacity of 3,800 tonnes per day, while the remainder of ore from the Santos mine and ore from the Alcaparrosa mine is treated at the Minera Candelaria processing plant. The Candelaria Copper Mining Complex is indirectly owned by Lundin Mining Corporation (“Lundin Mining”) (80%) and Sumitomo Corporation (“Sumitomo”) (20%).
Candelaria Copper Mining Complex is located in Chile’s Atacama Region, at an elevation of approximately 650 metres above sea level, approximately 20 kilometres south of the city of Copiapó and 650 kilometres north of Santiago. The properties are easily accessed using the public road system. Employees and contractors are primarily from the Atacama region. Copiapó is a modern city with regular services and a population of approximately 160,000. The regional Atacama airport is serviced by daily commercial flights from Santiago and other destinations.
The mineral concentrate products from the two processing plants are transported by road to either a domestic smelter in Chile or to Candelaria’s concentrate storage facility and marine terminal at Punta Padrones, which is located on the Pacific coast approximately 110 km from the mining complex and adjacent to the community of Caldera. Punta Padrones port is also the site of a desalination plant that Minera Candelaria built in 2013, to supply it with process water via a dedicated pipeline.
The Minera Candelaria property comprises 215 mining exploitation concessions (approximately 6,094 ha) and 34 mining exploration concessions (approximately 6,680 ha) and the Minera Ojos del Salado property comprises 196 mining exploitation concessions (approximately 9,305 ha) and 65 mining exploration concessions (approximately 11,050 ha). The tenements are free of material mortgages, encumbrances, prohibitions, injunctions, and litigation. The tenements containing the active and future mining activities are not affected by material royalties.
Exploration concessions have a duration of two years and the titleholder must pay an annual fee of approximately $1.40 per hectare to the Chilean Treasury. At the end of this period, the concessions may: (i) be renewed as an exploration concession for two additional years in which case at least 50% of the surface area must be renounced, or (ii) be converted, totally or partially, into exploitation concessions. Exploitation concessions are of indefinite duration and an annual fee is payable to the Chilean Treasury of approximately $6.8 per hectare.
History
The Candelaria sulphide deposit was discovered by Phelps Dodge Corporation (“Phelps Dodge”) in 1987. A feasibility study was completed in 1990 and, following approval by the Chilean government, construction started in October of 1992. Sumitomo acquired a 20% stake in the property in 1992. Production commenced in early 1995.
In 2007, property ownership changed when Freeport-McMoRan Inc. (“Freeport”) acquired Phelps Dodge.
During 2011, a pipeline was completed to bring water from a nearby sewage treatment facility to the Candelaria Copper Mining Complex. A desalination plant at the port of Caldera was built and commissioned in 2013 at a capacity of 500 litres per second.
The Minera Ojos del Salado complex has been in production since 1929, with processing taking place at what is now called the Pedro Aguirre Cerda (“PAC”) plant. Phelps Dodge became sole owner of Minera Ojos del Salado and the Santos mine and the PAC plant in 1985. The PAC plant’s current capacity is 3,800 tonnes per day. Sumitomo acquired its 20% interest in Minera Ojos del Salado in 2005.
In early 1996, production from the Alcaparrosa underground mine commenced.
Between October 1998 and 2004, the Santos, Alcaparrosa and PAC plant operations were suspended due to the weak copper price environment.
In November 2014, Lundin Mining acquired Freeport’s interest in the Candelaria Copper Mining Complex.
In 2015, the Candelaria 2030 EIA, including the new Los Diques tailings management facility, received environmental approval from Chilean regulators. Construction of Los Diques commenced in 2016 after the receipt of the major construction permits. Construction continued throughout 2017 and first tailings were placed during the first quarter of 2018.
During 2018, exploration success led to the first declaration of Mineral Resources and Mineral Reserves on the Española deposit. In 2019, the first ore was produced from the new South Sector of the Candelaria underground mine.
34
In February 2020, the Candelaria Copper Mining Complex submitted an Environmental Impact Assessment which, if accepted, will provide flexibility to expand and extend the mine operating life to at least 2040. At the date of this AIF, the Environmental Impact Assessment has been through two rounds of review and a determination is expected in 2022.
Candelaria Copper Mining Complex has been a significant producer of copper since the mid-1990s. In the last five years, annual payable copper and gold metal in concentrates sold varied between 123 kilotonnes and 179 kilotonnes and 73,000 to 100,000 ounces, respectively.
Geological Setting, Mineralization and Deposit Type
The Candelaria sulphide deposit is located at the boundary between the Coastal Cordillera and the Copiapó Precordillera. The Coastal Cordillera of Chañaral and Copiapó is composed of Permian to Lower Cretaceous intrusions within a basement of metasedimentary rocks of Devonian to Carboniferous age. Volcanic, volcaniclastic, and marine carbonate rocks represent intra- and back-arc sequences that were deposited during the early to mid-Cretaceous period.
The Candelaria, Santos, and Alcaparrosa mines are located in the district of Punta del Cobre. The polymetallic sulphide deposits are hosted in volcanic rocks of the Punta del Cobre Formation. Polymetallic sulphide deposits in the Punta del Cobre district are located to the east of the main branches of the Atacama fault zone, a subduction-linked strike-slip fault system stretching over 1,000 kilometres along the Chilean coast and active at least since the Jurassic period. The dominant structural elements of the Punta del Cobre area are the northeast-trending Tierra Amarilla Anticlinorium, a southeast verging fold-and-thrust system, and a series of north-northwest to northwest-trending high-angle faults.
The copper-gold sulphide mineralization found at the Candelaria Copper Mining Complex, which is generally referred to as iron oxide copper gold (“IOCG”) mineralization, is located within the thermal aureole of the Lower Cretaceous magmatic arc plutonic suite in the Candelaria-Punta del Cobre district. Depending on lithology and the structural setting, the polymetallic sulphide mineralization can occur as veins, hydrothermal breccias, replacement mantos, and calcic skarns within andesite and tuff units. Commonly the mineralization is hosted in the tuff, lower andesite, or “albitoforo” field units of the Punta del Cobre Formation. There are also some localized controls to mineralization in the form of faults, breccias, veins, and foliation. Candelaria has become an exploration model for Andean-type IOCG deposits that display close relationships to the plutonic complexes and broadly coeval fault systems.
The main mineralized body at the Candelaria mine is up to 400 m thick in its central part and thins towards the edges. In east-west sections, the mineralization has a lenticular, downward concave shape with a steep eastern limb and a shallowly dipping western limb. The shape of the mineralized body in north-south section is irregular. In plan view, the extent of the mineralization in the Candelaria mine is approximately 1,400 m by 4,000 m. The mineralized body was folded after its formation. The north-northeast-trending fold axis corresponds to the Tierra Amarilla Anticline.
In the Santos mine, three styles of mineralization are observed: veins, mantos, and breccia bodies. An important vein in the Santos mine is the Isabel Vein, which has a northwest striking orientation, and extends over 1 km in length and between 4 m and 30 m in width. Manto-type mineralization occurs as tabular bodies located at two sedimentary horizons located in the floor and roof of the albitoforo. The manto mineralization is characterized by variable iron contents with magnetite common in the north and deeper areas, and specular hematite in the south. Mineralization occurs within breccia bodies which are typically contained with the albitoforo and lower andesite units, and the mineralization generally forms steeply west-dipping and north-northwest to northwest-striking bodies.
Mineralization at the Alcaparrosa mine principally occurs as mantos that trend to the northeast and dip to the west. Ore mineralogy consists of chalcopyrite, pyrite, and magnetite, with trace pyrrhotite, molybdenite, and arsenopyrite. Mineralization at the Alcaparrosa mine also occurs as veinlets defining dense stockwork, breccias as well as fine dissemination in biotite meta-andesites. High-grade bodies are also found in massive veins striking north-northwest, north, and east.
In the La Española project area, mineralization occurs within mantos hosted mainly in a brown garnet skarn, and in lesser proportions within silica hornfels. Chalcopyrite is the primary copper sulphide mineral found as clusters and in disseminated form, commonly associated with brown garnet porphyroblasts. Near the surface and down to a depth of approximately 70 m, the mineralization is oxidized, characterized by the presence of chrysocolla, malachite, native copper, diogenite and bornite.
Exploration
Historic exploration has focused on drilling known manto, veins, and breccia masses in proximity to existing underground infrastructure. This strategy has proven very effective in defining new estimated Mineral Resources and Mineral Reserves available for underground mining. Much of the exploration is conducted from underground, requiring significant underground development to provide adequate drilling stations. Regional exploration is also undertaken on the large properties surrounding the mines identifying targets and defining new areas with Mineral Resource potential.
In 2021, exploration focused on near-mine targets at Candelaria, Alcaparrosa, Santos, and La Española with limited drilling on regional targets west of Candelaria. Exploration drifting completed 168 m to provide platforms for future exploration drilling
35
to further expand known Mineral Resources. Downhole geophysics on select drillholes was completed and surface resistivity geophysical, surveys were employed at Santos. District surface mapping was carried out to the west of Candelaria.
Exploration drilling in 2021 in the underground North and South sectors of Candelaria continued to intersect extensions of the mineralization. The 2021 drill program in Candelaria North was focused on the far north sector to enable future mine planning. The Santos surface drilling program confirmed the extension of mineralization along veins in the southern portion of the deposit, while the underground drilling in the Santos Mine confirmed the continuation of the sub-vertical orebody in the north.
Drilling
Mineral Resources are estimated based on information obtained from surface and underground drill holes. In 2021, a total of 18,890 m were drilled in Candelaria underground (North and South sectors). There were also 4,384 m drilled from underground at the Alcaparrosa Mine and 9,858 m drilled from surface and underground at Santos for exploration. Moving away from the mine, 5,197 m were drilled at La Española with a further 1,676 m of drilling completed in the District. A total of 39,987 m was drilled for exploration purposes. Additionally, a total of 994 m was drilled for geomechanical studies in 11 holes and 334 m for hydrogeological studies in 4 holes. The drilling and sampling procedures used are consistent with generally recognized industry best practices.
Sampling, Analysis and Data Verification
Analytical samples informing the Candelaria open pit Mineral Resources were prepared and assayed at the Candelaria mine site. Analytical samples informing the Ojos del Salado Mineral Resource estimates were formerly prepared and assayed by Intertek in Paipote, Chile, an independent laboratory.
Since 2018, the Candelaria and Ojos del Salado drilling samples have been sent to the Geolaquim laboratory, an independent laboratory in Paipote, and the Candelaria laboratory used as an umpire laboratory. Specific gravity is measured systematically every 2 m over the full sample interval.
All drilling assay samples are collected by a contractor under the direct supervision of a mine geologist. Samples from Candelaria are processed at the mine site, and transported to the Geolaquim laboratory Samples from Ojos del Salado are also transported directly from the property to the Geolaquim laboratory in Paipote. In each case, established procedures were used to ensure the security of samples during transportation between the drill rig and the laboratories. Quality assurance procedures, data verification and assay protocols used in connection with drilling and sampling conform to industry accepted quality control methods.
The analytical quality control program implemented at Candelaria and Ojos del Salado includes the use of control samples (coarse and pulp duplicate samples and reference material samples) inserted within all batches submitted for assaying.
Since 2016, exploration data are managed through an acQuire database, which includes quality control management features for sample coordinates from borehole surveys and data management tools. Sample numbering and labelling is controlled through acQuire, including insertion of quality control samples and consignment notes to the primary laboratories. Analytical results are received electronically and managed through acQuire with quality control filters. Samples outside defined limits are rejected by acQuire and flagged for further investigation. The acQuire system includes features for reporting analytical results and preparing bias charts and time series plots.
Mineral Processing and Metallurgical Testing
The Candelaria Copper Mining Complex maintains regular metallurgical testing programs that are incorporated with historical testing results and mill performance into a statistical model to predict and improve the complex’s processing performance in terms of mill throughput, metal recovery to concentrate, and final concentrate grade. Metallurgical tests are executed in a number of specialized commercial facilities and the in-house metallurgical development laboratory. Testing includes rock hardness classification, mineralogy using QEMSCANTM technology and bench scale flotation testing that is correlated with industrial scale performance in order to predict mill throughput and metallurgical performance. A similar but less intense program is underway for the PAC plant.
Metallurgical tests initiated in late 2016 involved a blend of ore considered representative of future feedstock. Testwork included SAG and ball mill pilot testing, specific SAG design tests, bench scale flotation kinetic modelling and automated scanning electron microscopy. Results and analysis from this testwork programme were evaluated using the Ausenco Ausgrind methodology to improve confidence in the estimated throughput for the Life of Mine plan.
A number of process initiatives focusing on debottlenecking and improving the existing facilities have been completed. As a part of these initiatives, further variability test work programs were initiated. The Mine-to-Mill study evaluated potential improvements in primary crusher feed size from blasting (both underground and the open pit) and the effect on overall comminution specific energy. This was combined with on-going geo-metallurgical initiatives to characterize different geological zones, adding to the existing ore hardness and rougher flotation response databases by incorporating more underground
36
sections data and replacing the reliance on SPI tests for SAG milling power calculations with the established JKTech or SMC methodology.
The Candelaria Mill Optimization Project (“CMOP”), which was completed in 2020, included upgrades in secondary grinding and classification. These improvements allowed reduced grind size feed to the flotation circuit and thus improve metal recovery.
Other initiatives saw the introduction of a gold-specific collector in the cleaning section of the flotation circuit and recirculation of the tailings stream of this area into the scavenger feed stream, to improve gold recovery capability. A study is underway that would increase plant throughput by removing the current partial recirculation of pebbles to the primary grinding circuit and push the overall pebble production into the secondary grinding circuit.
Mineral Resource and Mineral Reserve Estimates
The Mineral Resources at the Candelaria Copper Mining Complex are estimated from core drilling information stored in a secure central database and were evaluated using a geostatistical block modelling approach. Separate models were prepared for the Candelaria open pit mine and Candelaria underground (South sector) and the three underground mines (Candelaria North sector, Santos, and Alcaparrosa) using slightly different methodologies and assumptions.
The open pit Mineral Reserve estimates for both Candelaria and Española are based on a mine plan and open pit designs developed using modifying parameters including metal prices, metal recovery based on performance of the processing plant, actual operating and sustaining capital cost estimates based on the production schedule and equipment requirements. Open pit optimizations are carried out using Minesight® and Datamine software.
Underground Mineral Reserve estimates at Candelaria Underground (North and South sectors), Alcaparrosa and Santos are based on mine plans and designs developed using modifying parameters including metal prices, metal recovery based on performance of the processing plant, actual operating and sustaining capital cost estimates based on the production schedule and equipment requirements. Stope layouts, mining sequence and development plans are developed using Deswik software with Stope Optimizer and Minesight® for detailed design and operational refinements.
Factors which may affect the Mineral Resource and Mineral Reserve estimates include: dilution and mining recovery, metal prices, smelter, refining and shipping terms, metallurgical performance, geotechnical characteristics of the rock mass, capital and operating cost estimates, and the likelihood of obtaining land title, required permits and environmental, social and legal licenses. To the extent such factors are within the control of, or capable of influence, by the Candelaria Copper Mining Complex, these factors are managed through industry accepted practices and procedures and well as maintaining an engaged and constructive dialogue with the local communities and government authorities.
Details of the June 30, 2021 Mineral Resource and Mineral Reserve estimate for the Candelaria Copper Mining Complex are set forth below:
Consolidated Mineral Resource Statement as of June 30, 2021 (100% Basis)* | | | | | | | | | | | | |||||
| | Classification | | Quantity | | Cu | | Au | | Ag | | Cu | | Au | | Ag |
| | | | ‘000 t | | % | | g/t | | g/t | | ‘000 t | | Moz | | Moz |
Candelaria Open Pit |
| Measured |
| 479,622 |
| 0.45 |
| 0.10 |
| 1.59 |
| 2,158 |
| 1.5 |
| 25 |
|
| Measured Stockpile |
| 83,695 |
| 0.31 |
| 0.08 |
| 1.32 |
| 259 |
| 0.2 |
| 4 |
|
| Indicated |
| 35,308 |
| 0.28 |
| 0.07 |
| 1.06 |
| 99 |
| 0.1 |
| 1 |
|
| Inferred |
| 6,237 |
| 0.21 |
| 0.04 |
| 0.63 |
| 13 |
| — |
| — |
Candelaria La Española |
| Measured |
| 35,695 |
| 0.41 |
| 0.09 |
| 0.37 |
| 147 |
| 0.1 |
| — |
|
| Indicated |
| 39,697 |
| 0.39 |
| 0.08 |
| 0.39 |
| 155 |
| 0.1 |
| — |
|
| Inferred |
| 17,208 |
| 0.38 |
| 0.08 |
| 0.35 |
| 66 |
| — |
| — |
Candelaria Underground |
| Measured |
| 274,950 |
| 0.94 |
| 0.21 |
| 3.09 |
| 2,577 |
| 1.9 |
| 27 |
| | Measured Stockpile | | 41 | | 0.94 | | 0.23 | | 2.20 | | — | | — | | — |
|
| Indicated |
| 295,536 |
| 0.83 |
| 0.18 |
| 2.75 |
| 2,458 |
| 1.7 |
| 26 |
|
| Inferred |
| 75,584 |
| 0.87 |
| 0.19 |
| 2.83 |
| 660 |
| 0.5 |
| 7 |
* Reported within the boundaries of the Compañia Contractual Minera Candelaria and Compañia Contractual Ojos del Salado properties. Mineral Resources are not Mineral Reserves and have not demonstrated economic viability. All figures are rounded to reflect the relative accuracy of the estimates. Mineral Resources include Mineral Reserves. Open pit Mineral Resources are reported at a cut-off grade of 0.15 percent copper for the Candelaria Open Pit and 0.17 percent copper for the Española project, within conceptual pit shells based on metal prices of US$3.45 per pound of copper and US$1,500 per ounce of gold. Underground Mineral Resources are reported at a cut-off grade of 0.45 percent copper within confining grade shells of 0.4 percent copper. Franco-Nevada’s stream covers only Lundin’s 80% indirect interest in the Candelaria Copper Mining Complex.
37
Consolidated Mineral Reserve Statement as of June 30, 2021 (100% Basis)* | | | | | | | | | | | | |||||
| | Classification | | Quantity | | Cu | | Au | | Ag | | Cu | | Au | | Ag |
| | | | ‘000 t | | % | | g/t | | g/t | | ‘000 t | | Moz | | Moz |
Candelaria Open Pit |
| Proven |
| 347,365 | | 0.47 | | 0.11 | | 1.61 | | 1,646 | | 1.3 | | 18 |
| | Proven Stockpile | | 83,695 | | 0.31 | | 0.09 | | 1.33 | | 262 | | 0.2 | | 4 |
|
| Probable |
| 22,342 | | 0.33 | | 0.07 | | 0.76 | | 74 | | 0.1 | | 1 |
|
| Total |
| 453,401 | | 0.44 | | 0.11 | | 1.52 | | 1,981 | | 1.5 | | 22 |
Candelaria La Española |
| Proven |
| 32,702 | | 0.42 | | 0.09 | | 0.38 | | 136 | | 0.1 | | — |
|
| Probable |
| 25,297 | | 0.40 | | 0.09 | | 0.39 | | 102 | | 0.1 | | — |
|
| Total |
| 58,000 | | 0.41 | | 0.09 | | 0.38 | | 238 | | 0.2 | | 1 |
Candelaria Underground |
| Proven |
| 77,126 | | 0.87 | | 0.20 | | 3.19 | | 673 | | 0.5 | | 8 |
| | Proven Stockpile | | 41 | | 0.95 | | 0.24 | | 2.20 | | — | | — | | — |
|
| Probable |
| 87,006 | | 0.79 | | 0.18 | | 2.92 | | 691 | | 0.5 | | 8 |
|
| Total |
| 164,173 | | 0.83 | | 0.19 | | 3.04 | | 1,364 | | 1.0 | | 16 |
* Mineral Reserves included in Mineral Resources. Mineral Reserves have been prepared using metal prices of US$3.00 per pound of copper, US$1,500 per ounce of gold. All figures have been rounded to reflect the relative accuracy of the estimates. Mineral Reserves for the Candelaria Open Pit, La Española Open Pit and underground for the Candelaria property are estimated at cut-off grades of 0.16 percent copper, 0.19 percent copper and 0.50 percent copper, respectively. Underground Mineral Reserves for the Ojos de Salado property, Santos and Alcaparrosa mines are estimated at cut-off grades of 0.55 and 0.60 percent copper, respectively.
Mining Operations
The Candelaria and La Española open pits will operate with an overall mining rate of approximately 326,000 tpd for the next ten years. As the final waste stripping is completed, the overall mining rate will decline. A stockpile strategy has been developed to maximize the grade of material going to the processing facility. Direct milling ore will average 0.65% Cu from Candelaria and 0.43% Cu from Española. Lower grade stockpile ore will be recovered to meet the plant capacity as required. The mine currently operates five electric shovels, five hydraulic shovels, approximately 56 haulage trucks, seven production drills, and a fleet of support equipment.
The Candelaria open pit was designed to be mined in several phases of development. As of June 2021, four phases of development remain in the LOM plan (Phases 10 to 13). The overall strip ratio is 2.2:1 including ore delivered to stockpiles. The total in-pit waste is 810 Mt and the LOM of the open pit mine is 16 years. The Española total in-pit waste is 131 Mt and the overall life estimated is 11 years.
The Candelaria underground (North and South sectors) is expected to produce over 5.1 Mt of ore per year from 2022 until the end of the life of the mine. Access and infrastructure development to the South sector commenced in 2017 with first ore mined in 2019. The estimated average grade of the Candelaria underground ore is 0.82% Cu.
The Alcaparrosa underground mine produces approximately 1.6 Mt of ore per year with an average grade of 0.81% Cu. The Santos underground mine produces approximately 1.9 Mt of ore per year with an estimated average grade of 0.90% Cu over the remaining LOM. The three underground mines utilize a sublevel stoping mining method for ore extraction. This method is ideal for relatively large, vertical, as well as thick deposits with favorable and stable host rock. The stopes range in sizes from 100,000 tonnes to 1 million tonnes of ore and material is extracted at rates of 1,000 tpd up to 3,000 tpd, depending on the number of draw points and the broken ore flow characteristics.
In early 2022, a feasibility study was completed for expansion of throughput of the underground mines from 15 ktpd to 30 ktpd and included underground crushing and conveying systems and a surface secondary crushing plant.
All open pit pushbacks and associated pit slopes are geotechnically evaluated by independent experts to validate the design parameters. Similarly, underground stoping areas are evaluated for overall stability.
Processing and Recovery Operations
Minera Candelaria and Minera Ojos del Salado manage and operate two processing plants. The Candelaria processing plant receives ore from the Candelaria open pit as well as from the Candelaria, Alcaparrosa and Santos underground mines. It has a nominal capacity of 75,000 tonnes per day. The PAC processing plant receives ore from the Santos underground mine and has a design capacity of 3,800 tonnes per day.
The Candelaria processing plant flowsheet is conventional comprising two parallel process lines for grinding and flotation followed by common final concentrate filtration and shipping of bulk copper concentrates. Run of mine ore is trucked to a primary gyratory crusher which then feeds, via a stockpile the two parallel SAG mill – ball mill grinding circuits complemented with pebble extraction, crushing and milling a portion of the crushed pebbles. The secondary ball mills cyclone overflow constitutes feed to two parallel rougher flotation banks. Rougher concentrate is reground prior to two stage cleaning in column flotation cells. Final flotation copper concentrate with gold and silver by-product metals is thickened, filtered with ceramic disc filters, and stored on site. Final flotation tails are conventionally thickened and disposed in the Los Diques tailings management facility. The historical processing performance of Candelaria from 2000 through 2021 has average metallurgical recoveries of 94% for copper, 74% for gold, and 83% for silver.
38
A Feasibility Study was undertaken in 2017 to evaluate potential debottlenecking options of the main Candelaria processing plant and add throughput capacity. The expansion of the plant has not been advanced, but a number of process improvement initiatives, highlighted during the study, have been since completed. These included upgrades to the primary crusher motor, ball mill repowering, cyclone and cyclone feed pump capacity upgrades executed as part of the CMOP. The forecast cumulative impact of these upgrades was to deliver an additional 4,000 tpd of throughput and 1.7% copper recovery. Although the recovery improvement, from a finer flotation feed size, was largely achieved, the increase in throughput was limited by a residual bottleneck around the pebble milling circuit. Removal of such is the subject of on-going studies and implementation of the retained solution is planned for 2022-2023 under the Phase 3 Optimization Project.
The PAC concentrator has been in operation since 1929 and upgraded several times to the current capacity of 3,800 tonnes per day. The PAC concentrator flowsheet comprises a conventional three stage crushing plant. The grinding circuit has three closed circuit ball mills operating in parallel. The ball mills cyclone overflow constitutes feed to the rougher flotation bank. Rougher concentrates are reground prior to cleaning in a column cell with the tailings scavenged with conventional mechanical flotation cells. Final concentrate is thickened and filtered using a ceramic disc filter. Final flotation tailings from the PAC plant are pumped to the Los Diques tailings storage facilities.
Copper concentrates containing precious metals from both plants, are sold on contract to local smelters or trucked to the Punta Padrones port, near Caldera, for export to overseas smelters. Demand for copper concentrates produced by the Candelaria Copper Mining Complex is strong as they have very low content of critical elements such as lead, arsenic, antimony, bismuth, and mercury which make them good base feed for smelters.
Candelaria Copper Mining Complex has an agreement with a third-party company to process Candelaria’s flotation tailings to produce a magnetite concentrate and this produces an additional source of by-product revenue subject to favourable iron ore prices.
Infrastructure, Permitting and Compliance Activities
The mines of the Candelaria Copper Mining Complex receive electrical power through long-term contracts with AES Gener S.A., a local energy company. The main water supply comes from a desalination plant, which was commissioned in 2013 and is located adjacent to the Punta Padrones port facility. Copper concentrate is sold on contract to local smelters or is shipped by road to the Punta Padrones port facility and from there by ship to various smelters around the world. The desalination plant and the Punta Padrones port are owned by Minera Candelaria.
The active tailings storage facility (“TSF”), known as Los Diques, commenced operation in 2018 replacing the original Candelaria TSF. The Los Diques TSF, approved as a key part of the Candelaria 2030 EIA, is located to the southwest of the open pit and plant sites and has a designed capacity of approximately 600 million tonnes. The main impoundment of the TSF is constructed from rockfill using the downstream method. The TSF now receives the full flotation tailings from the Candelaria and PAC processing plants. Future phases of the Los Diques TSF have been initiated ahead of schedule, taking advantage of synergies with the original project and the availability of mine waste from the open pit. The original Candelaria TSF is inactive, except for on-going recovery of tailings drain-down water, which is recycled to the process plant. There is no longer a supernatant pond on the Candelaria tailings facility.
The physical stability of the tailings embankments is inspected and monitored on a continuous basis by Candelaria Copper Mining Complex staff and a monitoring report is submitted quarterly to the Chilean Mining and Geology National Authority. All Candelaria Copper Mining Complex tailings facilities have a formally appointed external Engineer of Record that conducts in-person dam safety focused inspections at least annually. For the active Los Diques tailings facility, representatives from the Engineer of Record team maintain a full-time site presence to perform construction quality assurance and supervision. Monitoring data is regularly shared with the Engineer of Record to review and verify that all levels are below pre-determined safety trigger levels. The most recent independent tailings review site visit was completed in November 2021.
Chile has established a comprehensive regulatory framework for mining and other industrial activities, dating from the mid-1990’s that has been updated several times since then. Although the Candelaria and Ojos del Salado facilities were permitted and developed prior to the modern framework being in place, both hold numerous environmental approvals stemming from modifications to the original developments and are compliant with current regulatory requirements. In addition, the two companies hold more than 1,000 permits for construction and operation of the mining and milling facilities, and related infrastructure. Candelaria is operating under the Candelaria 2030 EIA approved by the environmental authorities in July 2015.
On February 26, 2020, the Candelaria Copper Mining Complex submitted an Environmental Impact Assessment which, if approved, will include an extension to the mine life, expanded underground mining production, development of the La Española satellite deposit and other mine optimization initiatives. At the date of this AIF, the Environmental Impact Assessment has been through two rounds of review (ICSARAs) and is currently under review with the authorities with a determination expected in 2022. Current authorizations to mine extend through 2030 so no material impact is anticipated by the continued administrative review; however, the approved EIA will be necessary to commence building key infrastructure in 2023 or might otherwise require mine plan resequencing.
39
The Alcaparrosa Mine received environmental approval in 1996 with subsequent amendments, most recently an EIA to support the extension of the mine operation through 2022. A routine permit renewal was submitted in December 2020 and was approved in 2021.
The Santos Mine technical sectorial permit application was submitted to the agency on September 30, 2020 and is under administrative review with a determination anticipated in 2022.
Candelaria and Ojos del Salado operate under Lundin Mining’s Responsible Mining Management System and corresponding health, safety, environment and community standards. This system undergoes a third-party audit to ensure continued compliance with those standards and guidance documents. In addition, the Health, Safety and Environmental Management Systems at Candelaria and Ojos del Salado are certified under the international ISO - 45000 and ISO - 14001 (2015) standards. The environmental management systems that fall under ISO - 14001 were last certified in March 2018 and were recertified in the first quarter of 2021. The health and safety management systems that fall under OHSAS - 18001 were last certified in March 2018, and were converted to ISO - 45001 certification in October 2021. The energy management systems that fall under ISO - 50001 were certified in 2021.
Separate mine closure plans are in place for Candelaria and Ojos del Salado and both have been approved by SERNAGEOMIN. These plans are updated periodically, at a minimum of every five years, and include financial guarantees pursuant to local regulations. A final report indicating completion of obligations identified in the San Esteban closure plan (which consisted of two small historical tailings facilities) was approved in 2020 under new Chilean regulations. One of the closed San Esteban tailings facilities has been decommissioned with the tailings solids relocated to the Candelaria tailings facility and the Candelaria Copper Mining Complex continues to maintain and monitor the other closed tailings facility. In addition, the Candelaria Copper Mining Complex maintains and monitors three closed tailings facility locations at Ojos del Salados, none of which have a water cover.
Social and Community
The social performance team engages with numerous stakeholders, primarily in the communities nearest the mine and port facilities, namely Tierra Amarilla, Caldera and Copiapó. Community offices are located in each of these municipalities; engagement occurs throughout the year and is focused on managing social impacts, risks and opportunities specific to each community. The team bases its activities on a 5-year social performance strategic plan and systems which reflect best practice and international standards in stakeholder engagement, grievance procedures, risk management and community investment.
Capital and Operating Costs
For the year ending December 31, 2021, the combined Candelaria Copper Mining Complex cash operating cost were US$1.51/lb Cu. For 2022, the cash operating cost is forecast to be US$1.55/lb Cu.
Forecast capital costs for Candelaria for 2022 are estimated at US$370 million. Expected capital expenditure for underground development, supporting infrastructure and equipment is $115 million and that for ongoing development of the Los Diques TSF is $55 million.
The Candelaria Copper Mining Complex capitalizes waste costs during the production phase of the mine when these costs provide probable future economic benefits and identifiable improved access to the ore body which can be reliably measured.
Candelaria Capital Cost Estimates |
| Unit |
| 2022 Guidance |
Capitalised Waste Stripping |
| $M | | 180 |
Underground Development and Equipment |
| $M | | 115 |
Los Diques TSF |
| $M | | 55 |
Other Sustaining |
| $M | | 20 |
Total Sustaining |
| $M | | 370 |
Exploration, Development, and Production
The 2022 exploration efforts will have two objectives. The first is to extend near-mine Mineral Resources at Santos, Alcaparrosa and all sectors of Candelaria underground. The second objective is to test district targets with strategic growth potential to the south and southwest of existing operations. An exploration drilling budget of 54,270 m has been planned for 2022. A further 500 m of exploration drifting has been outlined to develop future drilling platforms. Downhole geophysics, surface geophysics and CSAMT (Controlled-source audio-frequency magnetotellurics) will be strategically employed. An infill drilling program of 13,300 m and 1,370 m of Hydrogeological drilling are planned for 2022. Total exploration expenditure in 2022 is estimated at approximately $15 million.
40
The last five years of production of metal contained in concentrate from the Candelaria Complex is shown in the table below:
| | Metal Produced in Concentrates | ||||
|
| Cu |
| Au |
| Ag |
| | (kt) | | (Koz) | | (Moz) |
2017 |
| 183 |
| 104 |
| 1.8 |
2018 |
| 134 |
| 78 |
| 1.2 |
2019 | | 146 | | 88 | | 1.3 |
2020 | | 127 | | 76 | | 1.1 |
2021 | | 152 | | 91 | | 1.4 |
For 2022, forecast production is 155 – 165 thousand tonnes copper and 83 – 88 thousand ounces of gold.
The current forecast LOM of the Candelaria open pit and stockpiles is to 2044, the La Española open pit is to 2034, while the underground mines, Candelaria (North and South sectors), Alcaparrosa and Santos, have LOM’s to 2043, 2029 and 2029, respectively.
41
COBRE PANAMA MINING AND TECHNICAL INFORMATION
Project Description, Location and Access
The Cobre Panama concession is located 120 kilometres west of Panama City and 25 kilometres from the Caribbean Sea coast, in the Donoso and Omar Torrijos Herrera Districts of Colon Province, in the Republic of Panama. Previously the Cobre Panama Project was located completely within the Donoso District however, following district realignment, the Project now lies partly within each of the amended Districts.
The Cobre Panama property consists of four concessions covering a combined area of 12,955.1 hectares. There is no other industrial development in the area of the concessions and the region is sparsely populated. The primary occupation of the local residents is subsistence farming. The nearest community, the village of Coclecito (population approximately 900), is 12 kilometres southeast of the plant site. The city of Penonomé, which has a population of approximately 25,000, is 49 kilometres southeast of Coclecito.
Access to the Cobre Panama property is via the southern Pan-American Highway from Panama City to Penonomé, all-weather roads to La Pintada and then sealed roads from Coclecito to the mine site. Helicopter pads have been retained for occasional use and there is a runway at Coclecito however frequent thick cloud cover impedes aircraft visibility and therefore limits its availability.
The topography in the concession area is rugged with considerable local relief covered by dense forest. The area to the north is a lowland with minimal relief extending to the Caribbean coast. Climatic conditions are tropical with high precipitation levels, high humidity and relatively high temperatures year-round of 25 to 30 degrees Celsius.
Legal Status of Concession
In February 1996, the Republic of Panama and Minera Panama SA (“MPSA”), entered into a mining concession contract in respect of the Cobre Panama project.
On February 26, 1997, Contract-Law No. 9 (“Law 9”) was passed by the Panamanian National Assembly. Law 9 granted the status of national law to the mining concession contract, establishing a statutory legal and fiscal regime for the development of the Cobre Panama project.
The legal regime established by Law 9 for the development of the Cobre Panama concession is supplemented by the Mineral Resources Code of Panama (the “Panama Mining Code”).
On December 30, 2016, the Government of Panama signed and issued Resolution No. 128 by which it extended the Law 9 mining concession for a second 20 year term which commenced March 1, 2017 up to February 28, 2037. MPSA remains eligible for consideration of a third 20 year term of the Law 9 mining concession commencing March 1, 2037.
Under Law 9, MPSA has the rights to explore for, extract, exploit, beneficiate, process, refine, transport, sell and market the gold, copper and other mineral deposits on the Cobre Panama concession.
Corporate income tax under Law 9 is payable at a rate of 25% on taxable earnings which is exempted for the period during which MPSA has outstanding debt relating to the construction and development of the project.
In September 2018, First Quantum became aware of a ruling of the Supreme Court of Panama (“Supreme Court”) in relation to the constitutionality of Law 9. The Supreme Court decision found that that the National Assembly had failed to consider whether Law 9 complied with applicable legislation at the time, namely Cabinet Decree 267 of 1969. First Quantum understands that the ruling of the Supreme Court with respect to the constitutionality of Law 9 relates to the enactment of Law 9 and does not affect the legality or tenure of the MPSA mining concession itself, which remains in effect, and allows continuation of the development and operation of the Cobre Panama project by MPSA.
On September 26, 2018, the Government of Panama issued a news release affirming support for Cobre Panama. The release confirmed that the Ministry of Commerce and Industries, (the mining regulator in Panama), considers that the MPSA mining concession contract, and its extension, remains in effect in all its parts while the Company seeks to clarify the legal position. The Attorney General of Panama has provided two formal opinions favourable to the constitutionality of Law 9 as required in this type of proceedings by Panamanian law.
In July 2021, the Government of Panama announced the appointment of a high-level commission of senior government ministers and officials, chaired by the Minister of Commerce, to discuss the Company’s concession contract. In September 2021, the Supreme Court upheld its ruling in respect of the clarification motions presented by the Company to the Court in relation to its Law 9 decision announced in September 2018 and the ruling was gazetted in the fourth quarter. FQM understands that the upholding of the unconstitutionality ruling against Law 9 of 1997 does not have retroactive effects, pursuant to article 2573 of the Code of Judicial Proceedings of Panama, therefore the approval of the mining concession contract which occurred in 1997 with the enactment of Law 9, remains unaltered, providing operational continuity.
42
During January 2022, the Government of Panama tabled a new proposal, namely that the Government of Panama should receive $375 million in benefits per year from Cobre Panama and that the existing revenue royalty will be replaced by a gross profit royalty. The parties continue to finalize the details behind this proposal, including the appropriate mechanics that would achieve this outcome, the necessary protections to the business for copper price downside and alternate production scenarios and to ensure that the new contract and legislation are both durable and sustainable. FQM has noted they are hopeful that this matter can be concluded shortly.
History
In August 2012, MPSA entered into a precious metals stream agreement with a subsidiary of Franco-Nevada Corporation for the delivery of precious metals based on production of the Cobre Panama project, which was amended and restated on November 2, 2015 (the “PSA”).
In 2013, First Quantum acquired an indirect 80% interest in MPSA, which holds the Cobre Panama concession, through its acquisition of Inmet Mining Corporation (“Inmet”). At that time the remaining 20% interest in MPSA was held by KPMC, a 50/50 joint venture company whose ultimate shareholders were LS-Nikko Copper Inc. and KORES. In August 2017, First Quantum increased its effective ownership of MPSA to 90% by acquiring LS-Nikko’s 50% holding of KPMC which was payable in six installments over a five-year period.
On January 19, 2018, Franco-Nevada, through a wholly-owned subsidiary, entered into an amended and restated stream agreement with First Quantum and KORES which covers 100% of Cobre Panama.
Cobre Panama completed construction, phased commissioning and start-up in 2019 and commercial production was declared from September 1, 2019.
During 2020, COVID-19 had a direct impact at Cobre Panama resulting in the operation being placed on preservation and safe maintenance beginning April 7, 2020 following Panamanian government restrictions related to COVID-19. On July 7, 2020, the Company announced the resumption of normal operations ahead of expectation and successfully ramped up ahead of expectation, on August 8, 2020. Cobre Panama continues to operate while adhering to the strictest protocols implemented to protect the health of the workforce and communities. As the pandemic has worsened globally at the end of 2020 and early 2021, First Quantum has identified additional cases amongst its workforce at Cobre Panama. Cases have been effectively contained and isolated, according to the established protocols and in coordination with local health authorities, with limited impact to operations.
Geological Setting and Mineralization
Mineralization at Cobre Panama consists of several disseminated copper-gold-molybdenum deposits. Known geologically as porphyry copper deposits, these are typical of the Western Cordillera of the Americas and other regions around the Pacific Ocean basin.
The porphyry deposits occur at the southern margin of a large granodioritic batholith of mid-Oligocene age. The main deposits are Balboa, Botija, Colina and Valle Grande. There are also a number of smaller zones, the most significant being Brazo and Botija Abajo (collectively “BABR”) and Medio.
All of the porphyry style mineralization on the property is hosted in granodiorite, feldspar-quartz-hornblende porphyry and adjacent andesitic volcanic rocks. The porphyry at Balboa intruded passively toward the south from a source located northwest of the deposit and is also thought to be influenced by a high angle structure to the west of the deposit.
At Botija, a number of north dipping feldspar-quartz-hornblende dikes cut the granodiorite. Two roof pendants of andesitic volcanic rock occur in the central and eastern parts of the deposit. At Colina, mineralization is associated with an east-southeasterly trending, shallow north-dipping 2.5 kilometre by 1 kilometre feldspar-quartz-hornblende porphyry sill and dyke complex that intrudes granodiorite and andesitic volcanic rocks. The Valle Grande zone is associated with a southeast trending feldspar-quartz-hornblende porphyry lopolith that is bounded to the north and south by andesitic volcanics and minor granodioritic dykes. Mineralisation at Balboa is dominantly hosted by a feldspar-quartz-hornblende porphyry that intrudes the adjacent andesite. Medio is a low to moderate grade porphyry associated with silicified and sereticised porphyrytic intrusive rocks and brecciated andesite volcanics, and at Brazo and Botija Abajo mineralisation is primarily located within feldspar-quartz or feldspar-quartz-hornblende porphyry.
Hydrothermal alteration along the Cobre Panama mineral trend is primarily silica-chlorite which is interpreted to be a form of propylitic alteration. Potassic alteration, consisting of salmon coloured potassium feldspar and secondary biotite is seen in the central parts of Botija. Argillic and phyllic alteration is patchy in the three main deposits with the latter variety being most prevalent near the tops of the deposits. At Brazo, pervasive sericite, clay and pyrite is associated with well-developed quartz stockworks.
Hypogene sulphides occur as disseminations, micro-veinlets, fracture fillings and quartz-sulphide stockworks. Chalcopyrite is the dominant copper mineral with lesser bornite. Traces of molybdenite are commonly found in quartz veinlets. There is no
43
significant zone of supergene enrichment at Botija, Colina and Valle Grande. At Brazo, supergene mineralization consisting of chalcocite-coated pyrite and rare native copper occurs to a depth of at least 150 metres.
Exploration and Drilling
During a regional survey in 1968, a United Nations Development Program team discovered copper, gold and molybdenum porphyry mineralization in the Petaquilla River region of north-central Panama. A total of 1,813 diamond drill holes totalling 348,775 metres have been drilled from discovery to February 2018.
During 2019, MPSA commenced additional diamond drilling in the vicinity of the Colina and smaller Medio pits in order to sterilize proposed areas for infrastructure development, and for further resource delineation at Colina.
Sampling, Analysis and Data Verification
Samples from MPSA drilling were placed within aluminum trays and dried in ovens. Once dry, the entire sample was crushed in a Rocklabs Boyd crusher, with sieve tests conducted regularly to ensure that the material was being crushed to the appropriate size. The equipment was cleaned after every sample using high-pressure air and after every tenth sample a coarse blank sample was passed through the crusher. The crushed sample material was split using a Jones rifle splitter and a 500 gram aliquot taken for assay. The aliquot was placed in a small plastic bag which was heat sealed and marked with a bar-coded sample tag. The reject material was returned to the original sample bag and stored on site.
The sample aliquots were shipped by air courier to ALS Chemex Lima in Lima, Peru, for analysis. Copper assays were conducted using four acid digestion and Atomic Absorption Spectroscopy (“AAS”) finish. Umpire assay checks and secondary assay work was conducted by Acme Santiago in Santiago, Chile. Both labs have ISO/IEC 17025-2005 certification. Residual pulps were stored at either ALS Chemex in Lima, Perú, or at a storage warehouse at First Quantum’s Minera Antares office in Arequipa, Peru. Residual pulps were discarded after 3 years due to oxidation and a reduced ability to repeat the original assays. All MPSA drill core is however safely and securely stored in warehouses located on the Cobre Panama site.
All assay samples were kept in a locked facility on site until they were ready for shipment. Samples for a given hole were batched once the entire hole had been logged and sampled. Samples were collected into larger bags in batches of approximately 90 samples per bag. Samples to be assayed for sequential copper were batched into bags of 20 to 25 samples. Several times a week, the samples were dispatched by road to a secure warehouse in Penonomé by MPSA staff. While in storage, generally for less than two days, samples were kept under locked conditions until picked up by DHL cargo shipping. DHL then airfreighted the samples to ALS Chemex Laboratory in Lima, Peru.
A detailed review of all the historical and current QA/QC practices, QA/QC data and historical QA/QC reports at Cobre Panama has been undertaken by First Quantum in order to determine the accuracy, precision and bias present in the drillhole assay data for the project area, in order to determine suitability for mineral resource estimation. While a systemized program of QA/QC sampling was not fully implemented until 2006, numerous programs of check analysis were undertaken to compare each program of drilling to historic drilling undertaken by previous owners. Similarly, routine review of the QA/QC data and results did not occur until the MPSA drilling programs. Regular reviews of the QA/QC data have been undertaken by MPSA personnel and corrections made to the database when an error was identified. The sampling QA/QC results and the related studies demonstrate that sample assay data is representative of the mineralisation sampled and that it is appropriate for use in the Mineral Resource estimation. In addition, data verification completed by FQM supports that data used in the Mineral Resource estimate is similarly adequate.
Metallurgical Testing
Various metallurgical test work programs have been undertaken on the Cobre Panama project since 1968, commensurate with the various levels of preliminary feasibility and prefeasibility studies that were completed up until 1998.
In 1997, an extensive program of metallurgical testing was designed to confirm earlier studies on the metallurgical response of the Botija and Colina ores. Work included grinding, flotation, dewatering and mineralogical testing. Further testing was completed, including locked-cycle flotation testwork and modal analysis to assist in defining grind requirements for both rougher and cleaner flotation. Copper-molybdenum separation by means of differential flotation was also tested.
Confirmatory batch laboratory flotation testwork was conducted during 2014. Based on all of this testwork, variable processing recovery relationships were determined for copper and gold, whilst fixed recovery values were determined for molybdenum and silver.
During 2018, a confirmatory geometallurgical testwork programme was commenced using grade control samples to validate the processing recovery relationships especially in regard to ore from initial mining horizons. At that time an update to the processing recovery relationships was not warranted.
44
Mineral Resources
The Mineral Resource estimate for each of the Cobre Panama deposits was generated from the drillhole sample results and an interpretation of the relevant geology that relates to the spatial distribution of copper, molybdenum, gold and silver mineralization. The Botija Mineral Resource estimate was updated in December 2018 with added Reverse Circulation (“RC”) grade control drilling results. Block grade estimates used ordinary kriging and was post processed by local uniform conditioning of the copper and gold panel estimates considered appropriate to the scale of mining, The Mineral Resource estimates were classified according to the drill hole spacing, sample QA/QC, geological confidence and confidence in the grade estimates.
The Mineral Resource estimate for Cobre Panama, inclusive of the Mineral Reserve inventory, is presented below and reflects the March 2019 NI 43-101 Technical Report estimates, depleted to December 31, 2020.
Mineral Resource Statement as at December 31, 2020, and reported using a 0.15% Cu cut-off grade
Deposit |
| Category |
| Tonnes (Mt) |
| TCu % |
| Mo % |
| Au g/t |
| Ag g/t |
Botija |
| Measured |
| 234.8 |
| 0.51 |
| 0.008 | | 0.12 |
| 1.50 |
Botija |
| Indicated |
| 616.1 |
| 0.36 |
| 0.007 | | 0.07 |
| 1.13 |
Colina |
| Indicated |
| 1,031.6 |
| 0.39 |
| 0.007 | | 0.06 |
| 1.58 |
Medio |
| Indicated |
| 63.0 |
| 0.28 |
| 0.004 | | 0.03 |
| 0.96 |
Valle Grande |
| Indicated |
| 602.1 |
| 0.36 |
| 0.006 | | 0.04 |
| 1.37 |
Balboa |
| Indicated |
| 647.3 |
| 0.35 |
| 0.002 | | 0.08 |
| 1.37 |
Botija Abajo |
| Indicated |
| 114.0 |
| 0.31 |
| 0.004 | | 0.06 |
| 0.93 |
Brazo |
| Indicated |
| 228.3 |
| 0.36 |
| 0.004 | | 0.05 |
| 0.81 |
Total Measured and Indicated | | |
| 3,537.3 |
| 0.37 |
| 0.006 | | 0.07 |
| 1.34 |
Botija |
| Inferred |
| 194.5 |
| 0.23 |
| 0.004 | | 0.05 |
| 0.87 |
Colina |
| Inferred |
| 125.1 |
| 0.26 |
| 0.006 | | 0.05 |
| 1.20 |
Medio |
| Inferred |
| 189.4 |
| 0.25 |
| 0.005 | | 0.03 |
| 1.25 |
Valle Grande |
| Inferred |
| 362.9 |
| 0.29 |
| 0.005 | | 0.03 |
| 1.14 |
Balboa |
| Inferred |
| 78.8 |
| 0.23 |
| 0.003 | | 0.04 |
| 0.96 |
Botija Abajo |
| Inferred |
| 66.7 |
| 0.27 |
| 0.005 | | 0.06 |
| 1.25 |
Brazo |
| Inferred |
| 76.4 |
| 0.21 |
| 0.003 | | 0.01 |
| 0.73 |
Total Inferred | | |
| 1,093.8 |
| 0.26 |
| 0.005 | | 0.04 |
| 1.08 |
Stockpile Mineral Resource Statement as at December 31, 2020
Deposit |
| Category |
| Tonnes (Mt) |
| TCu % |
| Mo ppm |
| Au g/t |
| Ag g/t |
Botija |
| Indicated |
| 16.3 |
| 0.22 |
| 37.56 | | 0.05 |
| 0.87 |
Mineral Reserves
The Mineral Reserve estimate for Cobre Panama is disclosed entirely within the Measured and Indicated Mineral Resource estimate in the table above. The actual cut-off grade for the estimate varies due to variable processing recovery, but otherwise reflects a longer-term consensus copper price of $3.00/lb, a molybdenum price of $13.50/lb, a gold price of $1,200/oz and a silver price of $16.00/oz.
45
Mineral Reserve Statement as at December 31, 2020 – In situ
| | Total Ore | ||||||||
|
| Tonnes |
| TCu |
| Mo |
| Au |
| Ag |
Pit and Classification | | (Mt) | | (%) | | (ppm) | | (ppm) | | (ppm) |
Botija |
| |
| |
| |
| |
| |
Proven |
| 236.0 |
| 0.48 |
| 78.75 |
| 0.11 |
| 1.44 |
Probable | | 595.1 | | 0.34 | | 67.13 | | 0.07 | | 1.09 |
Total Mineral Reserve |
| 831.1 |
| 0.38 |
| 70.43 |
| 0.08 |
| 1.19 |
Colina and Medio |
| |
| |
| |
| |
| |
Proven |
| — |
| — |
| — |
| — |
| — |
Probable | | 981.3 | | 0.39 | | 66.98 | | 0.06 | | 1.61 |
Total Mineral Reserve |
| 981.3 |
| 0.39 |
| 66.98 |
| 0.06 |
| 1.61 |
Valle Grande |
| |
| |
| |
| |
| |
Proven |
| — |
| — |
| — |
| — |
| — |
Probable | | 541.1 | | 0.37 | | 67.43 | | 0.05 | | 1.42 |
Total Mineral Reserve |
| 541.1 |
| 0.37 |
| 67.43 |
| 0.05 |
| 1.42 |
Balboa |
| |
| |
| |
| |
| |
Proven |
| — |
| — |
| — |
| — |
| — |
Probable | | 437.1 | | 0.35 | | 16.10 | | 0.08 | | 1.36 |
Total Mineral Reserve |
| 437.1 |
| 0.35 |
| 16.10 |
| 0.08 |
| 1.36 |
BABR |
| |
| |
| |
| |
| |
Proven |
| — |
| — |
| — |
| — |
| — |
Probable | | 219.7 | | 0.40 | | 41.31 | | 0.07 | | 0.87 |
Total Mineral Reserve |
| 219.7 |
| 0.40 |
| 41.31 |
| 0.07 |
| 0.87 |
Combined Pits |
| |
| |
| |
| |
| |
Proven |
| 236.0 |
| 0.48 |
| 78.75 |
| 0.11 |
| 1.44 |
Probable | | 2,774.2 | | 0.37 | | 57.05 | | 0.07 | | 1.36 |
Total Mineral Reserve |
| 3,010.3 |
| 0.38 |
| 58.75 |
| 0.07 |
| 1.37 |
Mineral Reserve Statement as at December 31, 2020 – Stockpiles
| | Total Ore | ||||||||
|
| Tonnes |
| TCu |
| Mo |
| Au |
| Ag |
| | (Mt) | | (%) | | (ppm) | | (ppm) | | (ppm) |
Proven |
| — | | — | | — | | — | | — |
Probable |
| 16.3 | | 0.22 | | 37.56 | | 0.05 | | 0.87 |
Total Mineral Reserve |
| 16.3 | | 0.22 | | 37.56 | | 0.05 | | 0.87 |
An economic analysis, in the form of a simple cash-flow model to support the Mineral Reserve estimate is included in the current Cobre Panama Technical Report. The cashflow model forms part of a more comprehensive financial model that exists for the project, from which an accurate net present value and internal rate of return can be calculated.
Mining Operations
Mining at Cobre Panama involves ultra-class scale mining equipment and conventional open pit methods at up to approximately 83 Mbcm of ore and waste mined per annum.
The mine development approach for the open pits now follows a terracing strategy rather than using phased pit designs which would have the unintended consequence of creating deep sumps which could, when inundated, curtail all production until the water was cleared. The terracing strategy, where a low terrace can be maintained towards one side of the pit with wide, ascending terraces providing multiple mining horizons is considered more suitable for the high rainfall environment as in the event of excessive rainfall the low terrace can act as a sump and be pumped clear over a duration not impacting production from the upper benches.
The multiple pits will be mined in an optimized sequence and in phases with ore crushed in-pit and conveyed overland to the nearby processing plant. At the end of 2020, four rope shovels, three ultra-class loaders and thirty ultra-class trucks were operating in the Botija Pit.
The Botija pit will be mined first, followed by the Colina and Medio pits. Mining in the Valle Grande and BABR pits will commence towards the end of mining of the Colina pit, with the Balboa pit being mined last.
The crusher feed is expected to continue to increase over the course of 2022 to achieve between 85 and 90 Mtpa. Commissioning of the CP100 project is targeted for the first quarter of 2023 to allow for a ramp up of production over the course of the year and achieve a throughput rate of 100 Mtpa by the end of 2023. Mill throughput of 100 Mtpa will be maintained from 2024 though 2041 before dropping to 75Mtpa between 2042 and 2054. The overall life of mine strip ratio (tonnes) is 1:1.
As at the end of December 2020, the mine life is 34 years.
46
Processing and Recovery Operations
The predominantly copper/molybdenum sulphide ore is amenable to conventional differential flotation processing, with gold and silver recovered into the copper concentrate and also separated into a bleed stream gravity concentrate.
The processing plant design is based upon a conventional sulphide ore flotation circuit, with differential flotation to produce separate copper and molybdenum concentrate products. Plant tailings are directed into the tailings management facility and, at a later date, into the depleted Botija pit.
The copper concentrate, containing gold and silver by-products, is piped as a slurry to the port site on the northern coast of the country (on the Caribbean Sea), where it is dried in filter presses and stored before being loaded onto vessels for shipping to world markets. The molybdenum concentrate will be delivered to the port by road and shipped in bulk bags.
While design recoveries vary for each deposit, the average recoveries are expected to be as follows over the life of mine:
•Copper:90.2%
•Molybdenum:53.4%
•Gold:55.9%
•Silver:45.0%
Infrastructure, Permitting and Compliance Activities
The project has two main areas: the mine and plant site within the concession boundaries, and the port and power station at Punta Rincon, approximately 25 kilometres north of the plant site on the Caribbean coast. The port and power plant site consists of a deep water berth for concentrate and coal shipments, a conventional ship landing site and a 300 MW coal fired power plant. An access road has been constructed between the mine and the power plant site and port area.
Project power is generated by a coal-fired power station at the port site and transmitted via a 230kV transmission line to the Botija substation at the mine site. The Botija substation is also connected to the national Panama electricity grid via a 230 kV transmission line to the Llano Sanchez substation. In 2018 the first 150MW generator Unit 1 of the power plant was synchronized to the national grid. Unit 2 was synchronized to the national grid in January 2019.
New access roads and improvements to the existing access roads from Penonome through La Pintada and Coclecito to the site have been constructed to permit safe access to the mine and plant site from the Pan-American Highway via the existing road from Penomone.
In December 2011, the Government of Panama, through Autoridad Nacional del Ambiente (“Mi-Ambiente”, being the Panamanian national environmental authority), approved the project environmental and social impact assessment (“ESIA”) required for development of the Cobre Panama copper project, including the mining operations and related infrastructure at Botija, Colina, Medio and Valle Grande, the port facility, and the coal-fired power plant. Since the initial submission, the Project definition and development scope has changed to include additional open pits and aspects that will need to be addressed in a new ESIA. The expected timeframe for submitting the new ESIA is in mid-2024.
Cobre Panama continues to implement its environmental management plans to meet commitments made in the project ESIA and comply with Panama environmental regulations, international standards including Equator Principles and IFC Performance Standards and Company environmental policy. The project has transitioned from construction to operations and is developing its environmental management system in accordance with the ISO 14001:2015.
The mine closure plan and costs were reviewed in 2020. The closure cost present value as at December 31, 2020 was $168 million.
Cobre Panama continues to implement its bio-diversity action plan in line with IFC Performance Standard 6 to protect and conserve the sensitive bio-diversity of the project area.
The project is located in the tropics with a high average annual rainfall and all drainage from the open pit, waste dumps and ore stockpiles is being collected and used as process water in the mill. Water is being recycled from the TMF to the mill. Excess water is being released to meet the approved ecological flow requirement. The water quality meets all local and IFC requirements. Water released from the TMF to surface waters is expected to meet water quality standards over the life of mine.
The project continues to be audited bi-annually against ESIA commitments by a third-party independent auditor and the results provided to Mi-Ambiente.
In 2018, the Cobre Panama successfully obtained permits for the power plant water concession and the process plant water concession. In 2020 the process plant water concession received final approval by the Controller General of Panama.
47
In 2019, Cobre Panama successfully obtained occupation permits for the power plant and the processing plant. During 2019, Cobre Panama also lodged the necessary environmental permits for water discharge from the power plant and the TMF, the permit for operation of the emulsion plant and the occupation permits to operate the power plant and the processing plant.
Other than a fine of $20,000 related to minor administrative legacy issues from the construction phase of the project, no material environmental incident was reported at Cobre Panama in 2020 and no notice of violation or penalties were imposed by any applicable regulatory authority.
The environmental expenditure at Cobre Panama in 2020 was $9.55 million.
Capital and Operating Expenses
Project spending to completion amounted to $6.77 billion. Capital expenditure in the next three years provides for the expansion of throughput to 100 million tonnes per annum. The majority of this capital is for pre-stripping and the mine fleet for Colina pit and process plant upgrades including the secondary crushing screening plant and the sixth ball mill.
For 2021, copper C1 cash costs at Cobre Panama were $1.31/lb, and copper AISC was $1.61/lb.
Project Development and Production
Project construction and commissioning for the 85 Mtpa processing plant, including crushing, milling, flotation, the tailings management facility and the concentrate filtration and export facility, plus the gravity gold plant is complete.
The ultra class mine fleet is operational, including trolley assist.
The molybdenum flotation and bagging plant is planned to be constructed.
The table below shows the historical production from Cobre Panama:
|
| Cu (tonnes) |
| Au (ounces) |
| Ag (ounces) |
2019 | | 147,480 | | 60,074 | | 1,132,247 |
2020 |
| 205,548 |
| 84,667 |
| 1,595,561 |
2021 |
| 331,000 |
| 141,637 |
| 2,521,235 |
The Company’s precious metals streams are linked to copper production from the Cobre Panama project.
Cobre Panama is expected to achieve 85 million tonnes of mill throughput in 2022 and a throughput rate of 100 Mtpa by the end of 2023. The table below shows estimated metal production for the next three years.
|
| 2022 |
| 2023 |
| 2024 |
Copper '000 tonnes | | 330 - 360 | | 350 - 380 | | 370 - 400 |
Gold '000 ounces |
| 135 - 150 |
| 140 - 155 |
| 155 - 170 |
Over the life of operations, the average annual by-product production is expected to be 107,000 ounces of recovered gold, 1,701 thousand ounces of recovered silver and 2,717 tonnes of recovered molybdenum. The average copper feed grade over life of mine is expected to be 0.37% total copper.
48
Investors should carefully consider all of the information disclosed in this AIF. In addition to the other information presented in this AIF, the following risk factors should be given special consideration.
Risks Related to the Business of Franco-Nevada
Changes in the market price of the commodities that underlie the royalty, stream, working and other interests will affect the profitability of Franco-Nevada and the revenue generated therefrom
The revenue derived by Franco-Nevada from its asset portfolio will be significantly affected by changes in the market price of the commodities underlying the royalties, streams, working interests and investments. Franco-Nevada’s revenue is particularly sensitive to changes in the price of gold, silver, oil, natural gas, natural gas liquids, PGM, copper and iron ore, as the revenue from these commodities represents substantially all of the cash flow derived from the asset portfolio. Commodity prices, including those to which Franco-Nevada is exposed, fluctuate on a daily basis and are affected by numerous factors beyond the control of Franco-Nevada, including levels of supply and demand, industrial development levels, inflation and the level of interest rates and the strength of the U.S. dollar. Such external economic factors are in turn influenced by changes in international investment patterns, monetary systems, political developments and geopolitical events.
Franco-Nevada also holds marketable securities in a number of companies that operate in the commodity sector and the value of these securities may be adversely affected by price fluctuations and future material commodity price declines, as well as other factors.
All commodities, by their nature, are subject to wide price fluctuations and future material price declines will result in a decrease in revenue or, in the case of severe declines that cause a suspension or termination of production by relevant operators, a complete cessation of revenue from royalties, streams or working interests applicable to one or more relevant commodities. Moreover, despite Franco-Nevada’s commodity diversification, the broader commodity market tends to be cyclical, and a general downturn in overall commodity prices could result in a significant decrease in overall revenue. Any such price decline may result in a material adverse effect on Franco-Nevada’s profitability, results of operations and financial condition.
Gold, silver, and/or PGM are produced or will be produced as a by-product metal at some of the assets including the Antamina project, Antapaccay project, Candelaria project, Cobre Panama project, Sudbury project and MWS project; therefore, production decisions and the economic cut-off applied to the reporting of gold, silver and PGM reserves and resources, as applicable, will be influenced by changes in the commodity prices of other metals at the mines. To some extent, risks related to this will be mitigated by Franco-Nevada in respect of each of Antapaccay and Cobre Panama as gold and silver deliveries under the stream are initially tied to the production of copper, the primary product to be produced at such projects.
For mining assets that are subject to stream agreements where there is a fixed price payable per ounce, in the event that the price of gold and/or silver falls below the fixed price per ounce (subject to inflation adjustment), Franco-Nevada would not realize any profits.
The operation of the properties in which Franco-Nevada holds an interest is generally determined by third-party property owners and operators, and Franco-Nevada has no or limited decision making power as to how these properties are operated, and the operators’ failure to perform could affect the revenues generated by Franco-Nevada
Franco-Nevada is not directly involved in the operation of mines. The revenue derived from the asset portfolio is based on production by third-party property owners and operators. The owners and operators generally will have the power to determine the manner in which the properties are exploited, including decisions to expand, continue or reduce, suspend or discontinue production from a property, decisions about the marketing of products extracted from the property, decisions to relinquish or dispose of mineral properties, and decisions to advance exploration efforts and conduct development of non-producing properties. The interests of third-party owners and operators and those of Franco-Nevada on the relevant properties may not always be aligned. As an example, it will usually be in the interest of Franco-Nevada to advance development and production on properties as rapidly as possible in order to maximize near-term cash flow, while third-party owners and operators may take a more cautious approach to development as they are at risk on the cost of development and operations. Likewise, it may be in the interest of property owners to invest in the development of and emphasize production from projects or areas of a project that are not subject to streaming, royalty or working interest obligations. The inability of Franco-Nevada to control the operations for the properties in which it has a royalty, stream or other interest may result in, among other things, differences between Franco-Nevada’s assumptions for a property and actual results, which may lead to a material and adverse effect on Franco-Nevada’s profitability, results of operations and financial condition. In addition, the owners or operators may take action contrary to Franco-Nevada’s policies or objectives; be unable or unwilling to fulfill their obligations under their agreements with Franco-Nevada; have difficulty obtaining or be unable to obtain the financing necessary to move projects forward; or experience financial, operational or other difficulties, including insolvency, which could limit the owner or operator’s ability to perform its obligations under arrangements with Franco-Nevada.
49
Franco-Nevada may not be entitled to any material compensation if any of the properties in which it holds a royalty, stream or other interest shuts down or discontinues their operations on a temporary or permanent basis. At any time, any of the operators of the properties in which it holds a royalty, stream or other interest or their successors may decide to suspend or discontinue operations.
The owners or operators of the projects in which Franco-Nevada holds an interest may from time to time announce transactions, including the sale or transfer of the projects or of the operator itself, over which Franco-Nevada has little or no control. If such transactions are completed it may result in a new operator controlling the project, who may or may not operate the project in a similar manner to the current operator which may positively or negatively impact Franco-Nevada. If any such transaction is announced, there is no certainty that such transaction will be completed, or completed as announced, and any consequences of such non-completion on Franco-Nevada may be difficult or impossible to predict.
Franco-Nevada has limited access to data and disclosure regarding the operation of properties, which will affect its ability to assess the royalty, stream, or other interest’s performance
As a holder of royalties, streams or other interests, Franco-Nevada has limited access to data on the operations or to the actual properties themselves. This could affect its ability to assess the performance of the royalty, stream, or working or other interest. This could result in deviations in cash flow from that which is anticipated by Franco-Nevada. In addition, some royalties, streams or other interests may be subject to confidentiality arrangements which govern the disclosure of information with regard to the applicable interest and, as such, Franco-Nevada may not be in a position to publicly disclose non-public information with respect to certain royalties, streams, or other interests. The limited access to data and disclosure regarding the operations of the properties in which Franco-Nevada has an interest, may restrict Franco-Nevada’s ability to enhance its performance which may result in a material and adverse effect on Franco-Nevada’s profitability, results of operations and financial condition. Although Franco-Nevada attempts to obtain these rights when creating new royalty or stream agreements or negotiating working or other interests, there is no assurance that Franco-Nevada’s efforts will be successful.
Franco-Nevada depends on its operators for the calculation of applicable payments. It may not be able to detect errors and payment calculations may call for retroactive adjustments
Franco-Nevada’s royalty, stream and other payments are calculated by the operators of the properties on which Franco-Nevada has royalties, streams, or interests based on the reported production. Each operator’s calculation of Franco-Nevada’s royalty, stream or other payments is subject to and dependent upon the adequacy and accuracy of its production, cost and accounting functions, and errors may occur from time to time in the calculations made by an operator. Certain royalty, stream or other agreements require the operators to provide Franco-Nevada with production and operating information that may, depending on the completeness and accuracy of such information, enable Franco-Nevada to detect errors in the calculation of royalty, stream or other payments that it receives. Franco-Nevada does not, however, have the contractual right to receive production information for all of its royalty, stream or other interests. As a result, Franco-Nevada’s ability to detect payment errors through its monitoring program and its associated internal controls and procedures is limited, and the possibility exists that Franco-Nevada will need to make retroactive royalty, stream or other revenue adjustments. Some of Franco-Nevada’s royalty, stream or other contracts provide the right to audit the operational calculations and production data for the associated royalty, stream or other payments; however, such audits may occur many months following Franco-Nevada’s recognition of the royalty, stream or other interest revenue and may require Franco-Nevada to adjust its revenue in later periods.
The Antamina, Antapaccay, Candelaria and Cobre Panama streams are significant to Franco-Nevada and other assets and properties may become significant to Franco-Nevada from time to time and any adverse development related to any such assets will affect the revenue derived from such assets
The streams on Antamina, Antapaccay, Candelaria and Cobre Panama are currently significant to Franco-Nevada, although as new assets are acquired or move into production, the materiality of each of Franco-Nevada’s assets will be reconsidered. Any adverse development affecting the operation of, production from or recoverability of mineral reserves from Antamina, Antapaccay, Candelaria and Cobre Panama or any other significant property in the asset portfolio from time to time, such as, but not limited to, unusual and unexpected geologic formations, seismic activity, rock bursts, cave-ins, pit wall failures, tailings dam failures, flooding and other conditions involved in the drilling and removal of material, any of which could result in damage to, or destruction of, mines and other producing facilities, damage to life or property, environmental damage, or the inability to hire suitable personnel and engineering contractors or secure supply agreements on commercially suitable terms, may have a material adverse effect on Franco-Nevada’s profitability, financial condition and results of operations. As well, any adverse development in the resolution of issues with Law 9 with respect to Cobre Panama may have a material adverse effect on Franco-Nevada’s profitability, financial condition and results of operations. In addition, Franco-Nevada has no control over operational decisions made by the third-party owners and operators of these projects. Any adverse decision made by the owners and operators, including for example, alterations to mine plans or production schedules, may impact the timing and amount of revenue that Franco-Nevada receives and may have a material and adverse effect on Franco-Nevada’s profitability, financial condition and results of operations. As these mines mature, Franco-Nevada can expect overall declines in production
50
over the years unless operators are able to replace reserves that are mined through mine expansion or successful new exploration.
Franco-Nevada is dependent on the payment of royalty, stream, and other payments by the owners and operators of the relevant properties and any delay in or failure of such payments will affect the revenues generated by the asset portfolio
Franco-Nevada is dependent to a large extent upon the financial viability and operational effectiveness of owners and operators of the relevant royalty/stream/interest properties. Payments from production generally flow through the operator and there is a risk of delay and additional expense in receiving such revenues. Payments may be delayed by restrictions imposed by lenders, delays in the sale or delivery of products, the ability or willingness of smelters and refiners to process mine products, delays in the connection of wells to a gathering system, blowouts or other accidents, recovery by the operators of expenses incurred in the operation of the royalty/stream/interest properties, the establishment by the operators of reserves for such expenses or the insolvency of the operator. Franco-Nevada’s rights to payment under the royalties/streams/interests must, in most cases, be enforced by contract without the protection of the ability to liquidate a property. This inhibits Franco-Nevada’s ability to collect outstanding royalties/streams/payments from interest properties upon a default. Additionally, some agreements may provide limited recourse in particular circumstances which may further inhibit Franco-Nevada’s ability to recover or obtain equitable relief in the event of a default under such agreements. In the event of a bankruptcy of an operator or owner, a creditor or the operator may seek to terminate the royalty, stream or other agreement or otherwise limit Franco-Nevada’s recovery in the insolvency proceeding. Failure to receive payments from the owners and operators of the relevant properties or termination of Franco-Nevada’s rights may result in a material and adverse effect on Franco-Nevada’s profitability, results of operations and financial condition.
Certain royalty and stream interests and working interests are subject to rights in favour of others or third parties that could adversely affect the revenues generated from the asset portfolio
Some royalty and stream interests and working or other interests are subject to: (i) buy-down right provisions pursuant to which an operator may buy-back all or a portion of the royalty, stream or working or other interest, (ii) pre-emptive rights pursuant to which parties to operating and royalty or stream agreements have the right of first refusal or first offer with respect to a proposed sale or assignment of such interest by or to Franco-Nevada, (iii) claw-back rights pursuant to which the seller of a royalty, stream or working or other interest to Franco-Nevada has the right to re-acquire the royalty, stream or working or other interest, or (iv) a right to dispose of property interests which are subject to the royalty, stream or working or other interest, for a return to Franco-Nevada, if any, which may be lower than Franco-Nevada’s assumptions regarding the asset. Holders may exercise these rights such that certain royalty, stream interests and working or other interests would no longer be held by Franco-Nevada.
The asset portfolio includes a number of royalty interests based on net profits, and the revenue derived from such royalty interests is dependent upon factors beyond the control of Franco-Nevada that may have an adverse effect on the overall revenues generated by the asset portfolio
Franco-Nevada holds a number of net profit royalties, equity interests and working interests in its asset portfolio. These royalties and other interests allow the operator to account for the effect of prevailing cost pressures on the operation before calculating the royalty or other amounts payable to Franco-Nevada. These cost pressures include costs of labour, equipment, fuel, electricity, environmental compliance, oil prices and numerous other capital, operating and production inputs. Such costs will fluctuate in ways that are unpredictable and are beyond the control of Franco-Nevada, and can have a dramatic effect on the revenue payable to Franco-Nevada on these royalties and other interests. Any increase in the costs incurred by the operators on the applicable properties will likely result in a decline in the revenue received by Franco-Nevada. This will affect overall revenue generated by the asset portfolio which may have a material and adverse effect on Franco-Nevada’s profitability, financial condition, and results of operations.
Franco-Nevada may enter into acquisitions or other material royalty or streaming transactions at any time
Franco-Nevada is continuously reviewing opportunities to acquire existing royalties or streams, to create new royalty interests or streaming arrangements through the financing of mining projects, financing of new acquisitions or to acquire companies that hold royalties or streams. At any given time, Franco-Nevada has various types of transactions and acquisition opportunities in various stages of active review, including submission of indications of interest and participation in discussions or negotiations in respect of such transactions. This process also involves the engagement of consultants and advisors to assist in analyzing particular opportunities. Any such acquisition or transaction could be material to Franco-Nevada and may involve the issuance of securities by Franco-Nevada or the incurring of indebtedness to fund any such acquisition. In addition, any such acquisition or other royalty or streaming transaction may have other transaction specific risks associated with it, including risks related to the completion of the transaction, the project operators or the jurisdictions in which assets may be acquired.
51
Additionally, Franco-Nevada may consider opportunities to restructure its royalties or stream arrangements where it believes such a restructuring may provide a long-term benefit to Franco-Nevada, even if such restructuring may reduce near-term revenues or result in Franco-Nevada incurring transaction related costs.
Franco-Nevada may enter into one or more acquisitions, restructurings or other royalty and streaming transactions at any time.
Franco-Nevada may experience difficulty attracting and retaining qualified management and technical personnel to efficiently operate its business
Franco-Nevada is dependent upon the continued availability and commitment of its key management, whose contributions to immediate and future operations of Franco-Nevada are of significant importance. The loss of any such key management could negatively affect business operations. From time to time, Franco-Nevada may also need to identify and retain additional skilled management and specialized technical personnel to efficiently operate its business. The number of persons skilled in the acquisition, exploration and development of royalties, streams and other interests in natural resource properties is limited and competition for such persons is intense. Recruiting and retaining qualified personnel is critical to Franco-Nevada’s success and there can be no assurance of such success. If Franco-Nevada is not successful in attracting and retaining qualified personnel, Franco-Nevada’s ability to execute its business model and growth strategy could be affected, which could have a material and adverse impact on its profitability, results of operations and financial condition. Franco-Nevada does not intend to maintain “key man” insurance for any members of its management.
Increased competition for royalty and stream interests and resource investments could adversely affect Franco-Nevada’s ability to acquire additional royalties, streams and other investments in mineral and oil & natural gas properties
Many companies are engaged in the search for and the acquisition of mineral and oil & natural gas interests, and there is a limited supply of desirable mineral and oil & natural gas interests. The mineral exploration and mining and oil & natural gas businesses are competitive in all phases. Many companies are engaged in the acquisition of mining and oil & natural gas interests, including large, established companies with substantial financial resources, operational capabilities and long earnings records. There has been significant growth in the number of royalty and streaming companies over the last several years. Franco-Nevada may be at a competitive disadvantage in acquiring mineral and oil and gas interests, whether by way of royalty, stream or other form of investment, as competitors may have greater financial resources and technical staffs or may have different investment criteria. There can be no assurance that Franco-Nevada will be able to compete successfully against other companies in acquiring royalty, stream and other interests. In addition, Franco-Nevada may be unable to acquire royalties or streams at acceptable valuations which may result in a material and adverse effect on Franco-Nevada’s profitability, results of operations and financial condition.
Royalty/stream and other interests may not be honoured by operators of a project
Royalty, stream and other interests in natural resource properties are largely contractual in nature. Parties to contracts do not always honour contractual terms and contracts themselves may be subject to interpretation or technical defects. To the extent grantors of such interests do not abide by their contractual obligations, Franco-Nevada would be forced to take legal action to enforce its contractual rights. Such litigation may be time consuming and costly and there is no guarantee of success. Any pending proceedings or actions or any decisions determined adversely against Franco-Nevada, may have a material and adverse effect on Franco-Nevada’s profitability, results of operations, financial condition and the trading price of Franco-Nevada securities.
There may be unknown defects in the asset portfolio
A defect in a royalty, stream, working interest or equity interest and/or the underlying contract may arise to defeat or impair the claim of Franco-Nevada to such royalty, stream, working interest or equity interest. Unknown defects in the royalty, stream or other assets of Franco-Nevada may result in a material and adverse effect on Franco-Nevada’s profitability, results of operations, financial condition and the trading price of Franco-Nevada securities.
Current global financial conditions continue to be challenging
Global financial conditions have been characterized by ongoing volatility. Global financial conditions could suddenly and rapidly destabilize in response to future events, as government authorities may have limited resources to respond to future crises. Global capital markets have continued to display increased volatility in response to global events. Future crises may be precipitated by any number of causes, including natural disasters, geopolitical instability, changes to energy prices or sovereign defaults.
Any sudden or rapid destabilization of global economic conditions could negatively impact Franco-Nevada’s ability, or the ability of the operators of the properties in which Franco-Nevada holds royalties, streams or other interests, to obtain equity or debt financing or make other suitable arrangements to finance their projects. Additionally, Franco-Nevada may be subject to counterparty risk and liquidity risk. Franco-Nevada is exposed to various counterparty risks including, but not limited to (i) through financial institutions that hold Franco-Nevada’s cash, (ii) through companies that have payables to Franco-Nevada, (iii) through Franco-Nevada’s insurance providers, and (iv) through Franco-Nevada’s lenders. Franco-Nevada is also exposed
52
to liquidity risks in meeting its operating expenditure requirements in instances where cash positions are unable to be maintained or appropriate financing is unavailable. These factors may impact the ability of Franco-Nevada to obtain loans or other credit facilities or obtain equity financing in the future or to obtain them on terms favourable to Franco-Nevada. If increased levels of volatility continue or in the event of a rapid destabilization of global economic conditions, Franco-Nevada’s operations could be adversely impacted and the trading price of Franco-Nevada securities could be adversely affected.
The impact of the current COVID-19 pandemic, as well as similar pandemics and public health emergencies in the future, may significantly impact Franco-Nevada
The COVID-19 global health pandemic has had a significant impact on the global economy and commodity and financial markets. The full extent and impact of the COVID-19 pandemic is unknown and continuing to be determined. The adverse effects of the pandemic may continue for an extended and unknown period of time, particularly as variant strains of the virus are identified. The impact of the pandemic to date has included extreme volatility in financial markets, elevated inflation, extreme volatility in commodity prices (including gold, silver, palladium, iron ore, oil and gas) and has raised the prospect of an extended global recession. As well, as efforts have been undertaken to contain the spread of the COVID-19 pandemic, the operation and development of mining projects has been impacted. Many mining projects, including a number of the properties in which Franco-Nevada holds a royalty, stream or other interest were impacted by the pandemic resulting in the temporary suspension of operations, and other mitigation measures that impacted production. As of the date hereof, none of the operations in which Franco-Nevada holds a royalty, stream or other interest are suspended as a result of the COVID-19 pandemic. If the operation or development of one or more of the properties in which Franco-Nevada holds a royalty, stream or other interest and from which it receives or expects to receive significant revenue is suspended as a result of the continuing COVID-19 pandemic or future pandemics or other public health emergencies, it may have a material adverse impact on Franco-Nevada’s profitability, results of operations, financial condition and the trading price of Franco-Nevada’s securities. The broader impact of the COVID-19 pandemic or future pandemics or similar public health emergencies on investors, businesses, the global economy or financial and commodity markets may also have a material adverse impact on Franco-Nevada’s profitability, results of operations, financial condition and the trading price of Franco-Nevada’s securities.
Franco-Nevada’s revenue, earnings, the value of its treasury and the value it records for its assets are subject to variations in foreign exchange rates, which may adversely affect the revenue generated by the asset portfolio or cause adjustments to the recorded value of assets
Franco-Nevada’s royalty, stream and other interests are subject to foreign currency fluctuations and inflationary pressures, which may have a material and adverse effect on Franco-Nevada’s profitability, results of operations and financial condition. There can be no assurance that the steps taken by management to address variations in foreign exchange rates will eliminate all adverse effects and Franco-Nevada may suffer losses due to adverse foreign currency rate fluctuations.
The ability to pay dividends will be dependent on the financial condition of Franco-Nevada
Payment of dividends on the Common Shares is within the discretion of Franco-Nevada’s Board of Directors and will depend upon Franco-Nevada’s future earnings, cash flows, acquisition capital requirements and financial condition, and other relevant factors. Although Franco-Nevada currently pays a regular dividend, there can be no assurance that it will be in a position to declare dividends due to the occurrence of one or more of the risks described herein.
Changes in tax legislation or accounting rules could affect the profitability of Franco-Nevada
Changes to, or differing interpretation of, taxation laws or regulations in any of Canada, the United States, Mexico, Barbados, Australia, Chile, Peru, Brazil or any of the countries in which Franco-Nevada’s assets or relevant contracting parties are located could result in some or all of Franco-Nevada’s profits being subject to additional taxation. Canada, together with approximately 140 other countries comprising the OECD/G20 Inclusive Framework on BEPS (Base Erosion and Profit Shifting), approved in principle in 2021, certain base erosion tax initiatives, including the introduction of a 15% global minimum tax which is intended to be effective in 2023. Canada has not yet released any domestic legislation in respect of the introduction of a global minimum tax.
No assurance can be given that new taxation rules or accounting policies will not be enacted or that existing rules will not be applied in a manner which could result in Franco-Nevada’s profits being subject to additional taxation or which could otherwise have a material adverse effect on Franco-Nevada’s profitability, results of operations, financial condition and the trading price of Franco-Nevada securities. In addition, the introduction of new tax rules or accounting policies, or changes to, or differing interpretations of, or application of, existing tax rules or accounting policies could make royalties, streams or other investments by Franco-Nevada less attractive to counterparties. Such changes could adversely affect Franco-Nevada’s ability to acquire new assets or make future investments.
Reviews conducted by tax authorities, now or in the future, may result in adverse tax consequences for Franco-Nevada
Tax authorities in jurisdictions applicable to Franco-Nevada may periodically conduct reviews of Franco-Nevada’s tax filings and compliance. Those reviews could result in adverse tax consequences and unexpected financial costs and exposure.
53
The CRA is conducting an audit of Franco-Nevada’s 2012-2017 taxation years and has issued a series of reassessments to Franco-Nevada relating to the 2012-2017 taxation years. A description of the matters and amounts at issue is included in the notes to Franco-Nevada’s financial statements for the year ended December 31, 2021.
Management believes that Franco-Nevada has filed its tax returns and paid all applicable taxes in compliance with Canadian and applicable foreign tax laws. Franco-Nevada does not believe that the reassessments are supported by Canadian tax law and jurisprudence and intends to vigorously defend its tax filing positions.
The CRA audit is ongoing and there can be no assurance of the outcome thereof that the CRA will not further challenge the manner in which Franco-Nevada or any of its subsidiaries has filed its income tax returns and reported its income. In the event that the CRA or other applicable tax authority successfully challenges the manner in which Franco-Nevada or a subsidiary has filed its tax returns and reported its income, this could potentially result in additional income taxes, penalties and interest, which could have a material adverse effect on Franco-Nevada.
Certain of Franco-Nevada’s directors and officers serve in similar positions with other public companies, which could put them in a conflict position from time to time
Certain of the directors and officers of Franco-Nevada also serve as directors or officers of, or have significant shareholdings in, other companies involved in natural resource exploration, development and production and, to the extent that such other companies may engage in transactions or participate in the same ventures in which Franco-Nevada participates, or in transactions or ventures in which Franco-Nevada may seek to participate, the directors and officers of Franco-Nevada may have a conflict of interest in negotiating and concluding terms respecting the extent of such participation. In all cases where directors and officers have an interest in other companies, such other companies may also compete with Franco-Nevada for the acquisition of royalties or streams, or mineral or oil & natural gas property investments. Such conflicts of the directors and officers may result in a material and adverse effect on Franco-Nevada’s profitability, results of operations, financial condition and the trading price of Franco-Nevada securities.
Franco-Nevada can provide no assurance that it will be able to obtain adequate financing in the future or that the terms of such financing will be favourable and Franco-Nevada may have to raise additional capital through the issuance of additional equity, which could result in dilution to Franco-Nevada’s shareholders
There can be no assurance that Franco-Nevada will be able to obtain adequate financing in the future or that the terms of such financing will be favourable. Failure to obtain such additional financing could impede Franco-Nevada’s funding obligations, or result in delay or postponement of further business activities which may result in a material and adverse effect on Franco-Nevada’s profitability, results of operations and financial condition. Franco-Nevada may require new capital to continue to grow its business and there are no assurances that capital will be available when needed, if at all. It is likely that, at least to some extent, such additional capital will be raised through the issuance of additional equity, which could result in dilution to shareholders.
If Franco-Nevada expands its business beyond the acquisition of royalty, stream and other interests, Franco-Nevada may face new challenges and risks which could affect its profitability, results of operations and financial condition
Franco-Nevada’s operations and expertise have been focused on the acquisition and management of royalty, stream and other interests. Franco-Nevada may pursue acquisitions outside this area, including acquiring and/or investing in and/or developing resource projects. Expansion of Franco-Nevada’s activities into new areas would present challenges and risks that it has not faced in the past, including many of the risks described under “Risks Related to Mining Operations and Oil & Natural Gas Operations”. The failure to manage these challenges and risks successfully may result in a material and adverse effect on Franco-Nevada’s profitability, results of operations, financial condition and the trading price of Franco-Nevada securities.
Potential litigation affecting the properties in which Franco-Nevada holds its royalty/stream interests could have an adverse effect on Franco-Nevada
Potential litigation may arise on a property on which Franco-Nevada holds or has a royalty, stream or other interest (for example, litigation brought by community or indigenous groups, litigation between joint venture partners or litigation between operators and original property owners or neighbouring property owners). As a royalty, stream or other interest holder, Franco-Nevada will not generally have any influence on the litigation and will not generally have access to data. Any such litigation that results in the cessation or reduction of production from a property (whether temporary or permanent) could have a material and adverse effect on Franco-Nevada’s profitability, results of operations, financial condition and the trading price of Franco-Nevada securities.
Information Systems and Cybersecurity
Franco-Nevada’s operations depend, in part, on its information technology (“IT”) systems, networks, equipment and software and the security of these systems. Franco-Nevada depends on various IT systems to estimate reserve and resource quantities, process and record financial data, analyze seismic information, administer its contracts with its counterparties and communicate with employees and third parties. These IT systems, and those of its third-party service providers and vendors
54
and the counterparties under its royalty/stream agreements, may be vulnerable to an increasing number of continually evolving cyber security risks. Unauthorized third parties may be able to penetrate network security and misappropriate or compromise confidential information, create system disruptions or cause shutdowns. Any such breach or compromise may go undetected for an extended period of time.
A significant breach of Franco-Nevada’s IT systems or data security or misuse of data, particularly if such breach or misuse goes undetected for an extended period of time, could result in significant costs, loss of revenue, fines or lawsuits and damage to reputation. The costs to eliminate or alleviate cyber or other security problems, including bugs, viruses, worms, malware and other security vulnerabilities, could be significant, and Franco-Nevada’s efforts to address these problems may not be successful. The significance of any cyber-security breach is difficult to quantify but may in certain circumstances be material and could have a material adverse effect on Franco-Nevada’s business, financial condition and results of operations.
Risks Related to Mining Operations and Oil & Natural Gas Operations
Franco-Nevada is subject to the same risk factors as the owners and operators of properties in which it holds a royalty, stream or other interests
To the extent that they relate to the production of minerals or oil & natural gas from, or the continued operation of, the properties in which Franco-Nevada holds a royalty, stream or other interest, Franco-Nevada will be subject to the risk factors applicable to the owners and operators of such mines or projects.
The inability to add additional reserves to its asset portfolio through either the development of existing resources or the acquisition of new mineral or oil & natural gas producing assets could adversely affect Franco-Nevada
The revenue generated by Franco-Nevada is principally based on the exploitation of mineral and oil & natural gas reserves on assets underlying the royalty, stream or other interests on which Franco-Nevada has a royalty, stream or other interest. Reserves are continually being depleted through extraction and the long-term viability of Franco-Nevada’s asset portfolio depends on the replacement of reserves through new producing assets and increases in reserves on existing producing assets. While Franco-Nevada may be able to maintain all or a portion of its interest in its reserve inventory through acquisitions, its business model relies on the successful development of the non-producing properties in its asset portfolio. Exploration for minerals and energy resources is a speculative venture necessarily involving substantial risk. There is no certainty that the expenditures made by the operator of any given project will result in discoveries of commercial quantities of minerals or energy resources on properties underlying the asset portfolio. Even in those cases where a significant mineral or oil & natural gas deposit is identified, there is no guarantee that the deposit can be economically extracted. Substantial expenditures are required to establish reserves through drilling, to develop processes to extract the resources and, in the case of new properties, to develop the extraction and processing facilities and infrastructure at any site chosen for extraction. Although substantial benefits may be derived from the discovery of a major deposit, no assurance can be given that new reserves will be identified to replace or increase the amount of reserves currently in the asset portfolio. This includes mineral resources, as the resources that have been discovered have not been subjected to sufficient analysis to justify commercial operations or the allocation of funds required for development. The inability to add additional reserves or to replace existing reserves through either the development of existing resources or the acquisition of new mineral or oil & natural gas producing assets may result in a material and adverse effect on Franco-Nevada’s profitability, results of operations, financial condition and the trading price of Franco-Nevada securities.
Reserves and resources are estimates based on interpretation and assumptions and actual production may differ from amounts identified in such estimates
The mineral reserves and resources and oil & natural gas reserves and resources on properties underlying Franco-Nevada’s royalty, stream or other interests are estimates only, and no assurance can be given that the estimated reserves and resources are accurate or that the indicated level of minerals and/or oil & natural gas will be produced. Such estimates are, in large part, based on interpretations of geological data obtained from drill holes and other sampling techniques. Actual mineralization or formations may be different from those predicted. Further, it may take many years from the initial phase of drilling before production is possible and during that time the economic feasibility of exploiting a discovery may change.
Market price fluctuations of the applicable commodity, as well as increased production and capital costs or reduced recovery rates, may render the proven and probable reserves on properties underlying Franco-Nevada’s royalty/stream interests unprofitable to develop at a particular site or sites for periods of time or may render reserves containing relatively lower grade mineralization uneconomic. Moreover, short-term operating factors relating to the reserves, such as the need for the orderly development of ore bodies or the processing of new or different ore grades, may cause reserves to be reduced or not extracted. Estimated reserves may have to be recalculated based on actual production experience. The economic viability of a mineral deposit may also be impacted by other attributes of a particular deposit, such as size, grade and proximity to infrastructure, governmental regulations and policy relating to price, taxes, royalties, land tenure, land use permitting, the import and export of minerals and environmental protection and by political and economic stability.
55
Resource estimates in particular must be considered with caution. Resource estimates for properties that have not commenced production are based, in many instances, on limited and widely spaced drill hole or other limited information, which is not necessarily indicative of the conditions between and around drill holes. Such resource estimates may require revision as more drilling or other exploration information becomes available or as actual production experience is gained. Franco-Nevada’s interpretations and assumptions regarding the information underlying resource estimates may also differ from those of the operator.
Further, resources may not have demonstrated economic viability and may never be extracted by the operator of a property. It should not be assumed that any part or all of the mineral resources on properties underlying Franco-Nevada’s royalty/stream interests constitute or will be converted into reserves.
Any of the foregoing factors may require operators to reduce their reserves and resources, which may result in a material and adverse effect on Franco-Nevada’s profitability, results of operations, financial condition and the trading price of Franco-Nevada securities.
The exploration and development of mining and resource properties is inherently dangerous and subject to risks beyond the control of Franco-Nevada
Companies engaged in mining and oil & natural gas activities are subject to all of the hazards and risks inherent in exploring for and developing natural resource projects. These risks and uncertainties include, but are not limited to, environmental hazards, industrial accidents, labour disputes, increases in the cost of labour, social unrest, changes in the regulatory environment, permitting and title risks, impact of non-compliance with laws and regulations, fires, explosions, blowouts, cratering, sour gas releases and spills, encountering unusual or unexpected geological formations or other geological or grade problems, unanticipated metallurgical characteristics or less than expected mineral recovery, encountering unanticipated ground or water conditions, cave-ins, pit wall failures, flooding, rock bursts, tailings dam failures, periodic interruptions due to inclement or hazardous weather conditions, earthquakes, seismic activity, other natural disasters or unfavourable operating conditions and losses. Should any of these risks or hazards affect a company’s exploration or development activities, it may (i) cause the cost of development or production to increase to a point where it would no longer be economic to produce the metal or oil & natural gas from the company’s resources or expected reserves, (ii) result in a write-down or write-off of the carrying value of one or more projects, (iii) cause delays or stoppage of mining or processing, (iv) result in the destruction of properties, processing facilities or third-party facilities necessary to the company’s operations, (v) cause personal injury or death and related legal liability, or (vi) result in the loss of insurance coverage. The occurrence of any of the above-mentioned risks or hazards could result in an interruption or suspension of operation of the properties in which Franco-Nevada holds a royalty/stream interest and have a material and adverse effect on Franco-Nevada’s profitability, results of operations, financial condition and the trading price of Franco-Nevada securities.
Title defects may result in a loss of entitlement to a property
A defect in the chain of title to any of the properties underlying the royalty, stream or other interests necessary for the anticipated development or operation of a particular project to which a royalty, stream or other interest relates may arise to defeat or impair the claim of the operator to a property. In addition, claims by third parties or indigenous groups in Canada and elsewhere may impact on the operator’s ability to conduct activities on a property to the detriment of Franco-Nevada’s royalty, stream or other interests. To the extent an owner or operator does not have title to the property, it may be required to cease operations or transfer operational control to another party. Many royalties, streams or other interests are contractual, rather than an interest in land, with the risk that an assignment or bankruptcy or insolvency proceedings by an owner may result in the loss of any effective royalty, stream or other interest in a particular property. Further, even in those jurisdictions where there is a right to record or register royalties, streams or other interests held by Franco-Nevada in land registries or mining recorders offices, such registrations may not necessarily provide any protection to the holder of such interests. Accordingly, the holder of such interests may be subject to risk from third parties. As a result, known title defects as well as unforeseen and unknown title defects may impact operations at a project in which Franco-Nevada has a royalty, stream or other interest and may result in a material and adverse effect on Franco-Nevada’s profitability, results of operations, financial condition and the trading price of Franco-Nevada securities.
The operations in which Franco-Nevada holds a royalty, stream or other interest require various property rights, permits, licenses and consultation obligations in order to conduct current and future operations, and delays or a failure to obtain or maintain such property rights, permits and licenses or comply with consultation obligations, or a failure to comply with the terms of any of such property rights, permits and licenses could result in interruption or closure of operations or exploration on the properties
Exploration, development and operation of mining and oil & natural gas properties are subject to laws and regulations governing health and worker safety, employment standards, indigenous and community consultation, environmental matters, mine development, project development, mineral production, permitting and maintenance of title, exports, taxes, labour standards, reclamation obligations, heritage and historic matters and other matters. Franco-Nevada, in respect of its own assets and operations, as well as the owners and operators of the properties in which Franco-Nevada holds a royalty, stream
56
or other interest, require licenses and permits from various governmental authorities in order to conduct their operations. Future changes in such laws and regulations or in such licenses and permits could have a material adverse impact on the revenue Franco-Nevada derives from the royalty, stream or other interests. Such licenses and permits are subject to change in various circumstances and are required to be kept in good standing through a variety of means, including cash payments and satisfaction of conditions of issue. Such licenses and permits are subject to expiration, relinquishment and/or termination without notice to, control of or recourse by Franco-Nevada. There can be no guarantee that Franco-Nevada or the owners or operators of those properties in which Franco-Nevada holds a royalty, stream or other interest, will be able to obtain or maintain all necessary licenses and permits in good standing and conduct all consultation that may be required to explore, develop and operate the properties, commence construction or operation of mining or oil & natural gas facilities, or maintain operations that economically justify the cost. Any failure to conduct appropriate consultation, comply with applicable laws and regulations, permits and licenses, or to maintain permits and licenses in good standing, even if inadvertent, could result in interruption or closure of exploration, development or mining operations or fines, penalties or other liabilities accruing to the owner or operator of the project. Any such occurrence could substantially decrease production or cause the termination of operations on the property and have a material and adverse effect on Franco-Nevada’s profitability, results of operations, financial condition and the trading price of Franco-Nevada securities.
Franco-Nevada is exposed to risks related to the permitting, construction, development and/or expansion in relation to the projects and properties in which it holds a royalty, stream or other interest
Many of the projects or properties in which Franco-Nevada holds an interest are in the permitting, construction, development and/or expansion stage and such projects are subject to numerous risks including, but not limited to, delays in obtaining equipment, materials and services essential to the construction and development of such projects in a timely manner, delays or inability to obtain required permits, changes in environmental or other regulations, currency exchange rates, labour shortages, cost escalations and fluctuations in metal prices. There can be no assurance that the owners or operators of such projects will have the financial, technical and operational resources to complete permitting, construction, development and/or expansion of such projects in accordance with current expectations or at all.
The operations in which Franco-Nevada holds an interest are subject to environmental and endangered species laws and regulations that may increase the costs of doing business and may restrict the operations
All phases of the mining and the oil & natural gas business present environmental risks and hazards and are subject to environmental regulation pursuant to a variety of government laws and regulations, including laws and regulations relating to the protection of endangered and threatened species. Compliance with such laws and regulations can require significant expenditures and a breach may result in the imposition of fines and penalties, which may be material. In addition, such laws and regulations can constrain or prohibit the exploration and development of new projects or the development or expansion of existing projects. Environmental legislation is evolving in a manner expected to result in stricter standards and enforcement, increases in land use restrictions, larger fines and liability and potentially increased capital expenditures and operating costs. Any breach of environmental legislation by Franco-Nevada as an owner or operator of a property, or by owners or operators of properties underlying the asset portfolio, could have a material impact on the viability of the relevant property and impair the revenue derived from the owned property or applicable royalty/stream, which could have a material and adverse effect on Franco-Nevada’s profitability, results of operations, financial condition and the trading price of Franco-Nevada securities.
Risks Relating to Climate Change
Franco-Nevada acknowledges climate change as both an international and local concern that will impact its business and the business of the operators of the properties in which it holds a royalty, stream or other interest in a number of possible ways. Franco-Nevada supports and endorses various initiatives for voluntary actions consistent with international initiatives on climate change. In addition to voluntary actions, governments are moving to introduce and implement new and more stringent climate change legislation and treaties at the international, national, state/provincial and local levels. While some of the costs associated with reducing emissions can be offset by increased energy efficiency and technological innovation, Franco-Nevada expects that continued efforts to address climate change, including complying with enhanced regulatory requirements, may result in increased costs for the operations at the properties in which it holds an interest.
Climate change may also pose physical risks to the properties in which Franco-Nevada holds an interest. This could include adverse effects on operations as a result of increasing occurrences of extreme weather events, water shortages, changes in rainfall and storm patterns, changes in sea levels and other negative weather and climate patterns.
Investors are increasingly sensitive to the climate change impacts and mitigation efforts of companies, and are increasingly seeking enhanced disclosure on the risks, challenges, governance implications and financial impacts of climate change faced by companies, including many of the operators of the properties in which Franco-Nevada holds an interest. Adverse publicity or climate-related litigation in respect of these operators could have a negative impact on Franco-Nevada. Challenges relating to climate change could have an impact on the ability of these operators to access the capital markets and such limitations could have a corresponding negative effect on their business and operations.
57
The impacts of climate change, including those described above, could have a material and adverse effect on Franco-Nevada’s profitability, results of operations, financial condition and the trading price of Franco-Nevada securities.
Risks relating to foreign jurisdictions
Many of Franco-Nevada’s royalty and stream interests relate to properties outside of the United States and Canada, including Latin America and, to a lesser extent, Africa. In addition, future investments may expose Franco-Nevada to new jurisdictions. The ownership, development and operation of these properties and the mines and projects thereupon by their owners and operators are subject to the risks normally associated with conducting business in foreign countries. These risks include, depending on the country, nationalization and expropriation, social unrest and political instability, less developed legal and regulatory systems, uncertainties in perfecting mineral titles, trade barriers, exchange controls and material changes in taxation. These risks may, among other things, limit or disrupt the ownership, development or operation of properties, mines or projects in respect of which Franco-Nevada holds royalty and stream interests, restrict the movement of funds, or result in the deprivation of contractual rights or the taking of property by nationalization or expropriation without fair compensation.
Franco-Nevada applies various methods, where practicable, to identify, assess and, where possible, mitigate these risks prior to entering into stream and royalty agreements. Such methods generally include: conducting due diligence on the political, social, legal and regulatory systems and on the ownership, title and regulatory compliance of the properties subject to the royalty or stream interest; engaging experienced local counsel and other advisors in the applicable jurisdiction; negotiating where possible so that the applicable royalty or stream agreement contains appropriate protections, representations, warranties and, in each case as Franco-Nevada deems necessary or appropriate in the circumstances, all applied on a risk-adjusted basis. There can be no assurance, however, that Franco-Nevada will be able to identify or mitigate all risks relating to holding royalty and stream interests in respect of properties, mines and projects located in foreign jurisdictions, and the occurrence of any of the factors and uncertainties described above could have a material adverse effect on Franco-Nevada’s business, results of operations, cash flows and financial condition.
Franco-Nevada is exposed to risks of changing political attitudes and stability and ensuing changes in government regulation in the countries in which it holds royalty, stream or other interests
The properties on which Franco-Nevada holds or will hold a royalty, stream or other interest are located in multiple legal jurisdictions and political systems. There is sovereign risk in investing in foreign countries, including the risk that the resource concessions may be susceptible to revision or cancellation by new laws, may not be renewed as anticipated or may otherwise be adversely impacted by changes in direction by the government in question. It is possible that changes in applicable laws, regulations, or in their enforcement or regulatory interpretation could result in adverse changes to mineral or oil & natural gas operations. These are matters over which Franco-Nevada has no control. There is no assurance that future political and economic conditions in such countries will not result in the adoption of different policies or attitudes respecting the development and ownership of resources. Any such changes in policy or attitudes may result in changes in laws affecting ownership of assets, land tenure and resource concessions, licensing fees, taxation, royalties, price controls, exchange rates, export controls, environmental protection, labour relations, foreign investment, nationalization, expropriation, repatriation of income and return of capital, which may affect both the ability to undertake exploration and development on, or production from, the properties in which Franco-Nevada holds a royalty, stream or other interest. In certain areas where Franco-Nevada holds a royalty, stream or other interest, the regulatory environment is in a state of continuing change, and new laws, regulations and requirements may be retroactive in their effect and implementation. Any changes in governmental laws, regulations, economic conditions or shifts in political attitudes or stability are beyond the control of Franco-Nevada and the owners and operators of the properties in which Franco-Nevada has an interest and such changes may result in a material and adverse effect on Franco-Nevada’s profitability, results of operations, financial condition and the trading price of Franco-Nevada securities.
Additionally, Franco-Nevada is indirectly exposed to the risks faced by the owners and operators of the properties in which Franco-Nevada holds or will hold royalties, streams or other interests in foreign jurisdictions. These include risks related to political and economic instability, under-developed legal systems, inconsistencies in the application of local laws and other legal uncertainty, terrorism, military repression, political violence, crime, corruption, infectious diseases, unsophisticated infrastructure and inaccessibility.
Potential changes to mining legislation in Chile and Peru
Franco-Nevada has a number of streams and royalties with respect to properties located in each of Chile (including Candelaria) and Peru (including Antamina and Antapaccay). Both Chile and Peru have recently been experiencing periods of significant political volatility and changes in government. Government bodies and officials in Chile and Peru have made a variety of proposals regarding potential changes to mining legislation in the respective countries. The proposals are wide ranging and have included potential changes in mining policies, royalties, taxation levels, ownership rights and the treatment of local communities. While the scope and pace of the proposed changes and their implementation (if at all) are uncertain, such changes (if made) could have a material adverse impact on the operations of the owners or operators of properties underlying
58
Franco-Nevada’s royalties and streams in these jurisdictions. This may materially and adversely affect Franco-Nevada’s profitability, results of operations, financial condition and the trading price of Franco-Nevada securities.
Changes to provincial and state royalty frameworks may have an adverse effect on the revenue generated by energy assets
In addition to federal regulation, each Canadian province and U.S. state has legislation and regulations that govern royalties, production rates and other matters. The royalty regime in a given province or state is a significant factor in the profitability of crude oil, natural gas liquids, sulfur and natural gas production. Royalties payable on production from lands other than Crown or U.S. federal government lands are determined by negotiation between the mineral freehold owner and the lessee, although production from such lands is subject to certain taxes and royalties. Royalties from production on Crown or U.S. federal government lands are determined by governmental regulation and are generally calculated as a percentage of the value of gross production. The rate of royalties payable generally depends in part on prescribed reference prices, well productivity, geographical location, field discovery date, method of recovery and the type or quality of the petroleum product produced. Other royalties and royalty-like interests are, from time to time, carved out of the working interest owner’s interest through non-public transactions. These are often referred to as overriding royalties, gross overriding royalties, net profits interests, or net carried interests.
Occasionally the governments of the western Canadian provinces create incentive programs for exploration and development. Such programs often provide for royalty rate reductions, royalty holidays, or royalty tax credits and are generally introduced when commodity prices are low to encourage exploration and development activity by improving earnings and cash flow within the industry.
Any increased royalty burden may affect the operations of the owners or operators of properties underlying Franco-Nevada’s energy assets which may materially and adversely affect its profitability, results of operations, financial condition and the trading price of Franco-Nevada securities.
Proposed changes to U.S. federal mining and public land law could impose, among other things, royalties and fees paid to the U.S. government by mining companies and royalty holders
Periodically, members of the U.S. Congress have introduced bills which would supplant or alter the provisions of The General Mining Law of 1872 which governs the disposition of metallic minerals on lands owned by the federal government. Some of the production covered by Franco-Nevada’s royalties occurs on unpatented mining claims located on U.S. federal lands. There have been recent proposals to amend the U.S. mining law to impose a royalty on the production of select hardrock minerals, such as silver, gold and copper, from U.S. federal lands, and a reclamation fee on production from federal and other lands. Any such proposal, if enacted by the U.S. Congress, could substantially increase the cost of holding mining claims and could reduce the revenue Franco-Nevada receives from royalties on unpatented mining claims, and to a lesser extent, on other lands in the United States. Moreover, such legislation could significantly impair the ability of owners of properties subject to Franco-Nevada’s royalties to develop mineral resources on unpatented mining claims. Although it is impossible at this time to predict what royalties and fees may be imposed in the future, the imposition of such royalties and fees could adversely affect the potential for development of such mining claims and the economics of existing operating mines on federal lands. Passage of such legislation may result in a material and adverse effect on Franco-Nevada’s profitability, results of operations, financial condition and the trading price of Franco-Nevada securities.
Adequate infrastructure is necessary for the properties in which Franco-Nevada has an interest or to realize maximum value from its interests
Mining, processing, development and exploration activities depend, to one degree or another, on adequate infrastructure. Reliable roads, bridges, power sources and water supply are important determinants, which affect capital and operating costs. Unusual or infrequent weather phenomena, sabotage, government or other interference in the maintenance or provision of such infrastructure could adversely affect the operations in which Franco-Nevada has a royalty/stream interest.
Realized pricing for Franco-Nevada’s oil and gas royalties and iron ore royalties differs from benchmark pricing due to product quality differences and transportation costs. From time to time, material differences in price may arise due to transportation bottlenecks or a lack of pipeline capacity. These differentials are expected to be volatile over time and change with market dynamics.
Production is dependent on operators’ employees
Production from the properties in which Franco-Nevada holds an interest depends on the efforts of operators’ employees. There is competition for geologists and persons with mining and oil & gas expertise. The ability of the owners and operators of such properties to hire and retain geologists and persons with expertise is key to those operations. Further, relations with employees may be affected by changes in the scheme of labour relations that may be introduced by the relevant governmental authorities in the jurisdictions in which those operations are conducted. Changes in such legislation or otherwise in the relationships of the owners and operators of such properties with their employees may result in strikes, lockouts or other work stoppages, any of which could have a material adverse effect on such operations, results of operations and financial condition
59
of Franco-Nevada. If these factors cause the owners and operators of such properties to decide to cease production at one or more of the properties, such decision could have a material adverse effect on the business and financial condition of Franco-Nevada.
Franco-Nevada is subject to risks related to certain operations in developing economies
Certain operators are subject to risks normally associated with the conduct of business in developing economies. Risks may include, among others, problems relating to power supply, labour disputes, delays or invalidation of governmental orders and permits, corruption, uncertain political and economic environments, civil disturbances and crime, arbitrary changes in laws or policies, foreign taxation and exchange controls, nationalization of assets, opposition to mining from environmental or other non-governmental organizations or changes in the political attitude towards mining, empowerment of previously disadvantaged people, local ownership requirements, limitations on foreign ownership, power supply issues, limitations on repatriation of earnings, infrastructure limitations and increased financing costs. The above risks may limit, disrupt or negatively impact the operator’s business activities.
Franco-Nevada’s assets may be subject to risks related to indigenous peoples
Various international and national, state and provincial laws, codes, resolutions, conventions, guidelines, treaties, and other principles and considerations relate to the rights of indigenous peoples. Franco-Nevada holds royalty, stream and other interests on operations located in some areas presently or previously inhabited or used by indigenous peoples. Many of these materials impose obligations on government to respect the rights of indigenous people. Some mandate consultation with indigenous people regarding actions which may affect indigenous people, including actions to approve or grant mining rights or permits. The obligations of government and private parties under the various international and national requirements, principles and considerations pertaining to indigenous people continue to evolve and be defined. Franco-Nevada’s current and future operations are subject to a risk that one or more groups of indigenous people may oppose continued operation, further development, or new development of those projects or operations on which Franco-Nevada holds a royalty, stream or other interest. This risk exists even where operators have sought to comply with applicable consultation obligations. Such opposition may be directed through legal or administrative proceedings or protests, roadblocks or other forms of public expression against Franco-Nevada or the operators’ activities. Opposition by indigenous people to such activities may require modification of or preclude operation or development of projects or may require the entering into of agreements with indigenous people. Claims and protests of indigenous peoples may disrupt or delay activities of the operators of Franco-Nevada’s royalty, stream or other interests.
Franco-Nevada’s assets may be subject to risks relating to environment, social and governance (ESG) matters
Mining, extraction, processing and development activities in both mining and oil and gas are subject to ESG risks which could have a significant impact on project development, operational performance, reputation and social license to operate. ESG issues at the properties underlying Franco-Nevada’s assets could have a material and adverse effect on Franco-Nevada’s profitability, results of operations, financial condition, the trading price of Franco-Nevada securities and Franco-Nevada’s reputation. Franco-Nevada’s corporate policies including its Investment Principles Policy (Environmental, Social and Governance) set out the principles regarding ESG matters which guide Franco-Nevada’s investment decisions and the ongoing management and evaluation of Franco-Nevada’s assets in an effort to mitigate these risks.
Risks Related to Franco-Nevada’s securities
Franco-Nevada’s securities are subject to price volatility
Securities markets have a high level of price and volume volatility, and the market price of securities of many companies have experienced wide fluctuations in price which have not necessarily been related to the operating performance, underlying asset values or prospects of such companies. Factors unrelated to the financial performance or prospects of Franco-Nevada include macroeconomic developments in North America and globally, and market perceptions of the attractiveness of particular industries or asset classes. There can be no assurance that continued fluctuations in mineral and oil & natural gas prices will not occur. As a result of any of these factors, the market price of Franco-Nevada’s securities at any given time may not accurately reflect the long-term value of Franco-Nevada.
In the past, following periods of volatility in the market price of a company’s securities, shareholders have instituted class action securities litigation against them. Such litigation, if instituted, could result in substantial cost and diversion of management attention and resources, which could significantly harm profitability and the reputation of Franco-Nevada.
There may be limitations on enforcement of civil judgments
A substantial portion of the assets of Franco-Nevada are located outside of Canada. As a result, it may not be possible for investors in Franco-Nevada’s securities to collect from Franco-Nevada judgments obtained in courts in Canada predicated on the civil liability provisions of securities legislation of certain of the provinces and territories of Canada. It may also be difficult for investors in Franco-Nevada’s securities to succeed in a lawsuit in the United States, based solely on violations of Canadian securities laws.
60
Additional issuance of securities by Franco-Nevada may dilute existing securityholders, reduce some or all of Franco-Nevada’s financial measures on a per share basis, reduce the trading price of the Common Shares or other Franco-Nevada securities or impede Franco-Nevada’s ability to raise future capital
Franco-Nevada may issue additional securities in the future in connection with acquisitions, strategic transactions, financings or for other purposes. To the extent additional securities are issued, Franco-Nevada’s existing securityholders could be diluted and some or all of Franco-Nevada’s financial measures could be reduced on a per share basis. Additionally, Franco-Nevada securities issued in connection with a transaction may not be subject to resale restrictions and, as such, the market price of Franco-Nevada’s securities may decline if certain large holders of Franco-Nevada securities or recipients of Franco-Nevada securities in connection with an acquisition, sell all or a significant portion of such securities or are perceived by the market as intending to sell such securities. In addition, such issuances of securities may impede Franco-Nevada’s ability to raise capital through the sale of additional equity securities in the future.
Franco-Nevada may be, or may become, a “passive foreign investment company,” which may result in adverse tax consequences for United States investors
If Franco-Nevada were classified as a PFIC for any taxable year during which a U.S. investor owned Common Shares, the U.S. investor generally would be subject to certain adverse U.S. federal income tax consequences, including increased tax liability on gain from the disposition of Common Shares and on certain distributions and a requirement to file annual reports with the U.S. Internal Revenue Service (“IRS”). In general, a non-U.S. corporation is a PFIC for any taxable year in which (i) 75% or more of its gross income consists of passive income or (ii) 50% or more of the value of its assets consists of assets that produce, or are held for the production of, passive income. Passive income generally includes dividends, interest, certain rents and royalties, certain gains from the sale of stock and securities, and certain gains from commodities transactions. The IRS recently issued final and proposed regulations providing guidance on various aspects of the PFIC rules, including the income and asset tests. The proposed regulations will not be effective unless and until they are adopted in final form, although taxpayers generally may rely on the proposed regulations before adoption, provided the proposed regulations are applied consistently.
Although Franco-Nevada continues to evaluate the implications of the final and proposed regulations for its classification under the PFIC rules, Franco-Nevada believes, on a more-likely-than-not basis, that it was not a PFIC for its taxable year ended December 31, 2021, and, based on its current and anticipated business activities and financial expectations, Franco-Nevada expects, on a more-likely-than-not basis, that it will not be a PFIC for its current taxable year or for the foreseeable future. However, the classification of Franco-Nevada under the PFIC rules will depend, in part, on whether certain of its income qualifies for the exception for active business gains arising from the sale of commodities for purposes of the PFIC income and asset tests. Moreover, the determination as to whether a corporation is, or will be, a PFIC for a particular taxable year depends, in part, on the application of complex U.S. federal income tax rules, which are subject to differing interpretations and uncertainty. There is limited authority on the application of the relevant PFIC rules, including the active business gains exception, to entities such as Franco-Nevada and its subsidiaries. There is also significant uncertainty regarding the application of the recently issued final and proposed regulations. Accordingly, there can be no assurance that the IRS will not challenge the views of Franco-Nevada concerning its PFIC status or that such a challenge will not be successful. In addition, whether any corporation will be a PFIC for any taxable year depends on its assets and income over the course of such taxable year, and, as a result, Franco-Nevada’s PFIC status for its current taxable year and any future taxable year cannot be predicted with certainty.
Each U.S. investor should consult its own tax advisor regarding the PFIC status of Franco-Nevada. See the discussion set forth under the heading, “United States Federal Income Tax Considerations” contained in Franco-Nevada’s Annual Report on Form 40-F, which has been filed with the SEC and can be found at the SEC’s website www.sec.gov.
Franco-Nevada’s business is subject to evolving corporate governance and public disclosure regulations that have increased both Franco-Nevada’s compliance costs and the risk of noncompliance, which could have an adverse effect on the price of Franco-Nevada’s securities
Franco-Nevada is subject to changing rules and regulations promulgated by a number of United States and Canadian governmental and self-regulated organizations, including the SEC, the Canadian Securities Administrators, the NYSE, the TSX, the International Accounting Standards Board and the Financial Accounting Standards Board. These rules and regulations continue to evolve in scope and complexity making compliance more difficult and uncertain. For example, new rules have been enacted that will require Franco-Nevada to disclose on an annual basis certain payments made by Franco-Nevada, its subsidiaries or entities controlled by it, to domestic and foreign governments, including sub-national governments. Further, Franco-Nevada’s efforts to comply with these and other new and existing rules and regulations have resulted in, and are likely to continue to result in, increased general and administrative expenses and a diversion of management time and attention from revenue-generating activities to compliance activities.
61
Franco-Nevada may fail to maintain the adequacy of internal control over financial reporting as per the requirements of the Sarbanes-Oxley Act
Section 404 of the Sarbanes-Oxley Act of 2002 (“SOX”) requires an annual assessment by management of the effectiveness of Franco-Nevada’s internal control over financial reporting and an attestation report by Franco-Nevada’s independent auditors addressing this assessment. While Franco-Nevada’s internal controls over financial reporting for the year ended December 31, 2021 were effective, Franco-Nevada may in the future fail to achieve and maintain the adequacy of its internal control over financial reporting, as such standards are modified, supplemented or amended from time to time, and Franco-Nevada may not be able to ensure that it can conclude on an ongoing basis that it has effective internal control over financial reporting in accordance with Section 404 of SOX. Franco-Nevada’s failure to satisfy the requirements of Section 404 of SOX on an ongoing, timely basis could result in the loss of investor confidence in the reliability of its financial statements, which in turn could harm Franco-Nevada’s business and negatively impact the trading price of its Common Shares. In addition, any failure to implement required new or improved controls, or difficulties encountered in their implementation, could harm Franco-Nevada’s operating results or cause it to fail to meet its reporting obligations. Future acquisitions of companies may provide Franco-Nevada with challenges in implementing the required processes, procedures and controls in its acquired operations. Acquired companies may not have disclosure controls and procedures or internal control over financial reporting that are as thorough or effective as those required by securities laws currently applicable to Franco-Nevada.
No evaluation can provide complete assurance that Franco-Nevada’s internal control over financial reporting will detect or uncover all failures of persons within Franco-Nevada to disclose material information otherwise required to be reported. The effectiveness of Franco-Nevada’s controls and procedures could also be limited by simple errors or faulty judgments. In addition, should Franco-Nevada expand in the future, the challenges involved in implementing appropriate internal control over financial reporting will increase and will require that Franco-Nevada continue to improve its internal control over financial reporting. Although Franco-Nevada intends to devote substantial time and incur substantial costs, as necessary, to ensure compliance, Franco-Nevada cannot be certain that it will be successful in complying with Section 404 on an ongoing basis.
Franco-Nevada may become subject to burdensome regulatory requirements under U.S. laws regulating pension plans
Franco-Nevada may not qualify as an “operating company” for purposes of the Employee Retirement Income Security Act of 1974 (United States), as amended (“ERISA”). Consequently, if 25% or more of the issued Common Shares were held by private pension plans subject to ERISA or plans subject to the U.S. Internal Revenue Code’s “prohibited transaction” rules (such as individual retirement accounts), then Franco-Nevada’s assets would be treated as ERISA “plan assets”. As a result, Franco-Nevada could become subject to the ERISA regulatory regime, including, among other potentially burdensome regulatory requirements, heightened fiduciary duties owed to plan participants. While Franco-Nevada intends to monitor beneficial ownership of its Common Shares by ERISA plans, there can be no assurance that Franco-Nevada will not become subject to ERISA regulations in the future. If Franco-Nevada were subject to ERISA regulatory requirements, it could have a material and adverse effect on Franco-Nevada’s ability to manage its business and/or its results of operations and financial condition.
62
Franco-Nevada declares its dividends in U.S. dollars. The following tables set forth the dividends paid by Franco-Nevada for each of the three most recently completed financial years in U.S. dollars and the Canadian dollar equivalent.
Dividends Paid in US$ (in millions) |
| 2021 |
| 2020 |
| 2019 | |||
Per Common Share (in dollars) | | $ | 1.16 | | $ | 1.03 | | $ | 0.99 |
Cash payments | | $ | 179.6 | | $ | 154.9 | | $ | 138.2 |
DRIP payments(1) | | $ | 41.8 | | $ | 42.3 | | $ | 48.8 |
In aggregate(1) | | $ | 221.4 | | $ | 197.2 | | $ | 187.0 |
| (1) | For 2021, 2020 and 2019, includes DRIP payments which were satisfied by the issuance of 313,845, 327,478, and 558,770 Common Shares, respectively. |
Dividends Paid in C$ (in millions) |
| 2021 |
| 2020 |
| 2019 | |||
Per Common Share (in dollars)(1) | | $ | 1.45 | | $ | 1.37 | | $ | 1.31 |
Cash payments(1) | | $ | 226.6 | | $ | 208.4 | | $ | 183.2 |
DRIP payments(1)(2) | | $ | 52.7 | | $ | 56.9 | | $ | 64.5 |
In aggregate(1)(2) | | $ | 279.3 | | $ | 265.3 | | $ | 247.7 |
| (1) | The exchange rate used to convert the dividends to C$ is the daily exchange rate posted by the Bank of Canada on the record date. |
| (2) | For 2021, 2020 and 2019, includes DRIP payments which were satisfied by the issuance of 313,845, 327,478, and 558,770 Common Shares, respectively. |
Franco-Nevada has adopted a dividend policy to pay a sustainable dividend as determined by its Board of Directors to qualify its Common Shares for large generalist institutional funds. In July 2010, Franco-Nevada began to declare and pay monthly dividends and, effective Q2 2014, the Board of Directors began to pay dividends on a quarterly basis. The Board of Directors may change the dividend policy at any time at its sole discretion and there is no assurance that Franco-Nevada will be able to pay any dividends or sustain any level of dividend payments. It is expected that the Board of Directors will conduct periodic reviews of Franco-Nevada’s dividend policy.
On July 9, 2013, Franco-Nevada adopted a DRIP to provide, among other things, eligible holders of Franco-Nevada’s Common Shares with a means to reinvest dividends declared and payable to them as shareholders (less any withholding tax) in additional Common Shares of Franco-Nevada. Currently, such Common Shares are issued from treasury at a 3% discount to the market price. The discount may be adjusted in future but cannot exceed 5%. Shareholders were able to participate in the DRIP starting with the October 2013 dividend payment. During Q2 2018, Franco-Nevada amended and restated the DRIP to allow for the participation of certain non-Canadian and non-U.S. shareholders, subject to the satisfaction of certain conditions. Non-Canadian and non-U.S. shareholders who are interested in participating in the DRIP should contact Franco-Nevada to determine whether they satisfy the necessary conditions to participate in the DRIP.
The authorized share capital of Franco-Nevada consists of an unlimited number of Common Shares and an unlimited number of preferred shares of which, as of March 16, 2022, 191,338,892 Common Shares and no preferred shares were outstanding.
Common Shares
Each Common Share carries the right to one vote at all meetings of shareholders of Franco-Nevada. There are no special rights or restrictions of any nature attached to the Common Shares. All Common Shares rank equally as to dividends, voting powers and participation in assets upon liquidation of Franco-Nevada.
Preferred Shares
The preferred shares may be issued in one or more series, each series to consist of such number of shares as may, before the issue thereof, be fixed by resolution of the Board of Directors. The directors shall determine before the issue thereof the designations, rights, privileges, restrictions and conditions attaching to the preferred shares of each series including the rate or amount of dividends or the method of calculating dividends, the dates of payment thereof, the redemption and/or purchase prices and terms and conditions of redemption and/or purchase, any voting rights, any conversion rights and any sinking fund or other provisions.
The preferred shares of each series will, with respect to payment of dividends and the distribution of assets in the event of liquidation, dissolution or winding up, rank on a parity with the preferred shares of every other series and be entitled to preference over the Common Shares and over any other shares ranking junior to the preferred shares. The preferred shares of any series may also be given such other preferences over the Common Shares and over any other shares ranking junior to the preferred shares as may be fixed by the directors.
63
The Common Shares of Franco-Nevada are listed and posted for trading on the TSX and the New York Stock Exchange (“NYSE”) in each case under the symbol “FNV”.
Trading Price and Volume
The following table sets forth the high and low prices and volumes for the Common Shares traded on the TSX and on the NYSE for fiscal year to date and for the most recently completed financial year.
| | Common Shares TSX | | Common Shares NYSE |
| ||||||||
|
| High C$ |
| Low C$ |
| Volume |
| High $ |
| Low $ |
| Volume |
|
2021 | | | | | | | | | | | | | |
January |
| 169.78 | | 151.80 | | 6,431,452 |
| 133.15 | | 118.77 | | 11,414,249 | |
February |
| 158.95 | | 135.74 | | 9,045,797 |
| 125.36 | | 106.75 | | 12,987,128 | |
March |
| 158.70 | | 133.63 | | 12,317,913 | | 126.30 | | 105.62 | | 23,148,887 | |
April |
| 178.93 | | 158.68 | | 8,050,070 |
| 143.24 | | 126.25 | | 9,902,792 | |
May |
| 186.12 | | 172.51 | | 8,104,584 |
| 154.16 | | 140.39 | | 10,106,431 | |
June |
| 188.44 | | 175.95 | | 9,499,279 |
| 155.89 | | 142.01 | | 12,488,496 | |
July |
| 199.82 | | 180.28 | | 6,931,326 |
| 160.45 | | 143.69 | | 11,497,971 | |
August |
| 205.25 | | 178.26 | | 6,596,209 |
| 163.79 | | 140.30 | | 10,973,309 | |
September |
| 186.91 | | 160.26 | | 8,879,766 |
| 148.90 | | 126.64 | | 13,235,918 | |
October |
| 181.81 | | 177.32 | | 7,261,037 |
| 147.43 | | 126.04 | | 11,222,886 | |
November |
| 189.12 | | 185.24 | | 7,326,069 |
| 150.64 | | 136.29 | | 10,358,130 | |
December |
| 177.58 | | 164.14 | | 7,402,602 |
| 139.57 | | 126.98 | | 13,437,012 | |
2022 | | | | | | | | | | | | | |
January |
| 175.10 | | 171.96 | | 6,947,824 |
| 138.95 | | 124.95 | | 11,080,673 | |
February |
| 193.51 | | 164.71 | | 9,169,110 |
| 151.84 | | 129.55 | | 13,003,124 | |
March (1-16) |
| 216.32 | | 187.00 | | 7,658,738 |
| 168.37 | | 147.27 | | 12,750,538 | |
64
The following table sets forth, as at the date hereof, the name, province or state and country of residence, position held with Franco-Nevada and principal occupation of each director and executive officer of Franco-Nevada:
Name and Municipality of Residence |
| Position with Franco-Nevada(1) |
| Principal Occupation |
| | | | |
David Harquail | | Director and Chair of the Board | | Chair of the Board, Franco-Nevada |
Toronto, Ontario, Canada | | | | |
| | | | |
Paul Brink | | Director and President & Chief | | President & Chief Executive Officer, |
Toronto, Ontario, Canada | | Executive Officer | | Franco-Nevada |
| | | | |
Tom Albanese(2) | | Director | | Corporate Director |
Hillsborough, New Jersey, U.S.A. | | | | |
| | | | |
Derek W. Evans(3) | | Director | | President, Chief Executive Officer and |
Calgary, Alberta, Canada | | | | Director, MEG Energy Corp. |
| | | | |
Catharine Farrow(3) | | Director | | President, FarExGeoMine Ltd. |
Sudbury, Ontario, Canada | | | | |
| | | | |
Louis Gignac(3) | | Director | | Chair, G Mining Ventures Corp, |
Brossard, Quebec, Canada | | | | |
| | | | |
Maureen Jensen(3) | | Director | | Corporate Director |
Thornbury, Ontario, Canada | | | | |
| | | | |
Jennifer Maki(2) | | Director | | Corporate Director |
Toronto, Ontario, Canada | | | | |
| | | | |
Randall Oliphant(2) | | Director | | Corporate Director |
Toronto, Ontario, Canada | | | | |
| | | | |
Elliott Pew(2) | | Director | | Corporate Director |
Boerne, Texas, U.S.A. | | | | |
| | | | |
Sandip Rana | | Chief Financial Officer | | Chief Financial Officer, Franco-Nevada |
Oakville, Ontario, Canada | | | | |
| | | | |
Lloyd Hong | | Chief Legal Officer & Corporate Secretary | | Chief Legal Officer & Corporate |
Toronto, Ontario, Canada | | | | Secretary, Franco-Nevada |
| | | | |
Eaun Gray | | Senior Vice President, Business | | Senior Vice President, Business |
Toronto, Ontario, Canada | | Development | | Development, Franco-Nevada |
| | | | |
Jason O’Connell | | Senior Vice President, Diversified | | Senior Vice President, Diversified, |
Toronto, Ontario, Canada | | | | Franco-Nevada |
(1) | Messrs. Harquail, Gignac, and Oliphant have served since November 2007. Derek Evans, Tom Albanese, Catharine Farrow, Jennifer Maki, Elliott Pew, Paul Brink and Maureen Jensen were appointed in August 2008, August 2013, May 2015, May 2019, September 2019, May 2020 and May 2020, respectively. |
(2) | Member of the Audit and Risk Committee (the “ARC”). Elliott Pew was appointed a member of the ARC effective March 11, 2021. |
(3) | Member of the Compensation and ESG Committee (the “CESGC”). Derek Evans and Maureen Jensen were appointed members of the CESGC effective March 11, 2021. |
Each director’s term of office expires at the next annual meeting of shareholders of Franco-Nevada or when his or her successor is duly elected or appointed, unless his or her term ends earlier in accordance with the articles or by-laws of Franco-Nevada, he or she resigns from office or he or she becomes disqualified to act as a director of Franco-Nevada.
As of March 17, 2022, the directors and executive officers of Franco-Nevada, as a group, beneficially own, directly or indirectly, or exercise control or direction over an aggregate of 1,353,416 Common Shares, representing approximately 0.7% of the Common Shares outstanding.
Biographical information regarding the current directors and executive officers of Franco-Nevada is provided as follows:
David Harquail, Director and Chair of the Board — David Harquail is Chair of the Board. Mr. Harquail was the founding CEO of the Corporation. Prior to his appointment as Chair in May 2020, Mr. Harquail served as the Corporation’s CEO for more than
65
13 years since its initial public offering in 2007. He serves as a director of the Bank of Montreal and is a past director and former Chair (2017-2020) of the World Gold Council. He has also held senior executive roles and served as a director of numerous public mining companies and has been actively involved in industry organizations. Mr. Harquail holds a B.A.Sc. in Geological Engineering from the University of Toronto, an MBA from McGill University and is a registered Professional Engineer in Ontario. He is also a major benefactor of the School of Earth Sciences and its Mineral Exploration Research Centre (MERC) at Laurentian University in Sudbury as well as the Centre for Neuromodulation at Sunnybrook Health Sciences in Toronto. In 2021, Mr. Harquail was the recipient of the Association of Mineral Exploration’s Murray Pezim Award for significant contributions to the mineral exploration and mining community by a financier.
Paul Brink, President & Chief Executive Officer — Paul Brink is President & CEO and a director of Franco-Nevada. Prior to his appointment as CEO, Mr. Brink served as President & Chief Operating Officer of Franco-Nevada from May 2018 to May 2020. He has been with Franco-Nevada since its IPO in 2007 and successfully led its business development activities as SVP, Business Development from 2008 until his promotion to President & Chief Operating Officer in 2018. Mr. Brink is active with a number of not-for-profit organizations. He previously had roles in corporate development at Newmont, investment banking at BMO Nesbitt Burns and project financing at UBS. Mr. Brink holds a Bachelor’s degree in Mechanical Engineering from the University of Witwatersrand and a Master’s degree in Management Studies from Oxford University.
Tom Albanese, Director — Tom Albanese is a director of Franco-Nevada. He served as CEO of Vedanta Resources plc (2014 to 2017), CEO of Vedanta Limited (2014 to 2017) and was CEO of Rio Tinto plc (2007 to 2013). Mr. Albanese is a director of CoTec Holdings Corp. and is the lead independent director of Nevada Copper Corp. He previously served on the boards of Vedanta Resources plc, Vedanta Limited, Rio Tinto plc, Ivanhoe Mines Limited, Palabora Mining Company and Turquoise Hill Resources Limited. Mr. Albanese holds a Master’s of Science degree in Mining Engineering and a Bachelor of Science degree in Mineral Economics both from the University of Alaska Fairbanks.
Derek W. Evans, Director — Derek Evans is President & CEO of MEG Energy Corp. and is a director of Franco-Nevada. He served as President and CEO and a director of Pengrowth Energy Corporation from 2009 until March 15, 2018. Mr. Evans has over 40 years of experience in a variety of operational and senior executive positions in the oil and gas business in Western Canada. Mr. Evans is also active in not-for-profit organizations and is a board member of MaRS (an innovation hub). Mr. Evans holds a Bachelor of Science degree in Mining Engineering from Queen’s University and is a registered Professional Engineer in Alberta. Mr. Evans is also a member of the Institute of Corporate Directors.
Dr. Catharine Farrow, Director — Catharine Farrow is a director of Franco-Nevada. She is a Registered Professional Geoscientist (PGO) with more than 26 years of mining industry experience. She also serves as a director of Centamin plc and of Eldorado Gold Corporation and is lead independent director of Aclara Resources Inc. She is also active in the mining industry in both private companies and academia. From 2012 to 2017, she was Founding CEO, Director and Co-Founder of TMAC Resources Inc. Dr. Farrow has served on the Board of a number of not-for-profit and government Advisory Boards. She has been honoured as one of the 100 Global Inspirational Women in Mining (2015 and 2018) and is a past recipient of the William Harvey Gross Medal of the Geological Association of Canada (2000) and the Distinguished Alumni Award from the Acadia Alumni Association (2020). Dr. Farrow obtained her BSc (Hons) from Mount Allison University, her MSc from Acadia University and her PhD from Carleton University. She also holds the ICD.D designation.
Louis Gignac, Director — Louis Gignac is Chair of G Mining Ventures Corp. (a public mining exploration and development company) and of G Mining Services Inc. (a private consultancy) and is a director of Franco-Nevada. Mr. Gignac previously served as President, CEO and a director of Cambior Inc., from 1986 to 2006 and previously held management positions with Falconbridge Copper Company and Exxon Minerals Company and has served as a director of several public companies. Mr. Gignac is a member of the Ordre des ingénieurs du Québec. Mr. Gignac holds a Doctorate of Engineering in Mining Engineering from the University of Missouri Rolla, a Master’s degree in Mineral Engineering from the University of Minnesota, and a Bachelor of Science degree in Mining Engineering from Laval University. He also holds the ICD.D designation. Mr. Gignac was inducted into the Canadian Mining Hall of Fame in 2016.
Maureen Jensen, Director — Maureen Jensen is a director of Franco-Nevada. She served as Chair and Chief Executive Officer of the Ontario Securities Commission (the “OSC”) from 2016 until April 2020 and was previously the Executive Director and Chief Administrative Officer of the OSC from 2011 to 2016. Before joining the OSC, Ms. Jensen was Senior Vice-President, Surveillance and Compliance at the Investment Industry Regulatory Organization of Canada. Ms. Jensen has held senior regulatory and business positions at the Toronto Stock Exchange and had a 20-year career in the mining industry. Ms. Jensen is a director and chair-nominee of Canada’s Ombudsman for Banking Services and Investments and is also active in other not-for-profit organizations including the Toronto Centre for Global Leadership in Financial Supervision, as Chair of the Prosperity Project and as a Public Governor of FINRA in the United States. Ms. Jensen is a Registered Professional Geoscientist (PGO), holds the ICD.D designation, has a BSc. Doctor of Laws (Honoris Causa) and is a member of the Investment Industry Hall of Fame.
Jennifer Maki, Director — Jennifer Maki is a director of Franco-Nevada. She is also a director of Baytex Energy Corp. and Pan American Silver Corp. She previously served as Chief Executive Officer of Vale Canada and Executive Director of Vale Base
66
Metals (2014 to 2017) and previously held several other positions with Vale Base Metals, including Chief Financial Officer & Executive Vice-President and Vice-President & Treasurer. She has also served on the boards of not-for-profit organizations. Ms. Maki has a Bachelor of Commerce degree from Queen’s University and a postgraduate diploma from the Institute of Chartered Accountants, both in Ontario, Canada. She also holds the ICD.D designation.
Randall Oliphant, Director — Randall Oliphant is a director of Franco-Nevada. He has worked in natural resources in many capacities for over 30 years. From 1999 to 2003, Mr. Oliphant was the President and Chief Executive Officer of Barrick Gold Corporation and since that time he has served on the boards of numerous public companies and not-for-profit organizations. He served as Executive Chairman of New Gold from 2009 to 2017. Mr. Oliphant presently serves on the advisory board of Metalmark Capital LLC, a leading private equity firm. Mr. Oliphant also served as Chairman of the World Gold Council from 2013 to 2017. Mr. Oliphant is a CPA, CA and was granted the designation of FCPA in 2016 in recognition of his outstanding contribution to his profession.
Elliott Pew, Director — Elliott Pew is a director of Franco-Nevada. He has over 40 years of diverse experience in the oil and gas industry. Previously, Mr. Pew served as Board Chair and a Member of the Audit and Risk Committee of Enerplus Corporation, as a director of Southwestern Energy Company, and as co-founder, executive and member of the board of managers of Common Resources I, II and III (private E&P). Prior to that, Mr. Pew held senior executive positions with Newfield Exploration Company in Houston and was Senior Vice President, Exploration of American Exploration Company. He holds an M.A. in Geology from the University of Texas at Austin and an A.B. in Geology from Franklin and Marshall College and is a member of the ICD and NACD.
Sandip Rana, Chief Financial Officer — Sandip Rana, Chief Financial Officer, joined Franco-Nevada in April 2010. He previously served in treasurer and controller roles at old Franco-Nevada until 2002 and then acted as an international controller for Newmont. From 2003 to April 2010, Mr. Rana held financial roles at Four Seasons Hotels Limited where he last served as Vice-President Corporate Finance. Mr. Rana holds a Bachelor of Business Administration degree from the Schulich School of Business and is a Chartered Professional Accountant, CA. In February 2019, Mr. Rana was recognized as a Top Gun CFO by Brendan Wood International.
Lloyd Hong, Chief Legal Officer & Corporate Secretary — Lloyd Hong, Chief Legal Officer & Corporate Secretary, joined Franco-Nevada in December 2012. He previously was the Senior Vice‐President, Legal Counsel and Assistant Secretary of Uranium One Inc. Prior to that, he was a partner with the Canadian law firm of Davis LLP (now DLA Piper (Canada) LLP) with a practice focused on corporate finance and mergers and acquisitions. Mr. Hong holds a Bachelor of Commerce degree from the University of Alberta and a Bachelor of Laws degree from Queen’s University. Mr. Hong is a member of The Law Society of Ontario and The Law Society of British Columbia (non-practising).
Eaun Gray, Senior Vice President, Business Development — Eaun Gray, Senior Vice President, Business Development, heads Franco-Nevada’s mining business development group. Mr. Gray was previously a Vice President at Rothschild & Co where he advised on mergers and acquisitions and debt and stream transactions. Prior to that, Mr. Gray worked for CIBC in investment and corporate banking. Mr. Gray completed a Master of Business Administration degree at the Tuck School at Dartmouth College (Edward Tuck Scholar), is a CFA Charterholder and received a Bachelor of Commerce from Queen’s University (First Class Honours).
Jason O’Connell, Senior Vice President, Diversified — Jason O’Connell, Senior Vice President, Diversified, has been with Franco-Nevada since 2008. His role includes leading business development activities for diversified mining and energy opportunities and managing the Corporation’s Energy portfolio. Mr. O’Connell led the growth of the Corporation’s US Energy portfolio and, prior to that, held roles in the business development group and managed investor relations. Prior to joining Franco-Nevada, he worked in mining equity research with the Bank of Montreal. Mr. O’Connell holds a Master of Business Administration degree from Dalhousie University and Bachelor of Science degree with honours in Geology from Acadia University.
Cease Trade Orders, Bankruptcies, Penalties or Sanctions
Except as set out below, no director or executive officer of Franco-Nevada (or where applicable, personal holding company of a director or executive officer):
| (a) | is, as at the date hereof, or has been, within 10 years before the date hereof, a director, chief executive officer or chief financial officer of any company (including the Company) that: |
| (i) | was subject to an order that was issued while the director or executive officer was acting in the capacity as director, chief executive officer or chief financial officer, or |
| (ii) | was subject to an order that was issued after the director or executive officer ceased to be a director, chief executive officer or chief financial officer and which resulted from an event that occurred while that person was acting in the capacity as director, chief executive officer or chief financial officer; or |
| (b) | is, as at the date hereof, or has been, within 10 years before the date hereof, a director or executive officer of any company (including the Company) that, while that person was acting in that capacity, or within a year |
67
| of that person ceasing to act in that capacity, became bankrupt, made a proposal under any legislation relating to bankruptcy or insolvency or was subject to or instituted any proceedings, arrangement, or compromise with creditors or had a receiver, receiver-manager or trustee appointed to hold its assets; or |
| (c) | has, within 10 years before the date hereof, become bankrupt, made a proposal under any legislation relating to bankruptcy or insolvency, or become subject to or instituted any proceedings, arrangement or compromise with creditors, or had a receiver, receiver-manager or trustee appointed to hold the assets of the director or executive officer; or |
| (d) | has been subject to: |
| (i) | any penalties or sanctions imposed by a court relating to securities legislation or by a securities regulatory authority or has entered into a settlement agreement with a securities regulatory authority; or |
| (ii) | any other penalties or sanctions imposed by a court or regulatory body that would likely be considered important to a reasonable investor in making an investment decision. |
Derek Evans was a director (until his resignation in January 2016) of a private oil and gas company that sought protection under the Companies’ Creditors Arrangement Act (Canada) in May 2016.
Under a settlement agreement dated November 30, 2017, Louis Gignac, a director of the Corporation, resolved concerns of the Authorité des marchés financiers (“AMF”) regarding a trade in shares of another issuer made in 2015. The AMF and Mr. Gignac agreed in the settlement agreement that Mr. Gignac traded shares in error while in possession of privileged information, as defined in the Securities Act (Quebec) (the “Quebec Act”). The AMF and Mr. Gignac agreed that Mr. Gignac self-reported his trading to the AMF, fully cooperated with the AMF and that Mr. Gignac had no intention of trading with privileged information. Mr. Gignac agreed to pay an administrative fine of $94,369 under section 204 of the Quebec Act to fully resolve the matter.
For the purposes of the above, “order” means: (i) a cease trade order; (ii) an order similar to a cease trade order, or (iii) an order that denied the relevant company access to any exemption under securities legislation, and, with respect to each, was in effect more than 30 consecutive days.
Other Disclosed Matters
On October 17, 2017, the SEC filed civil charges against each of Rio Tinto PLC, Tom Albanese and the former CFO of Rio Tinto PLC, alleging, among other things, violations of the anti-fraud, reporting, books and records and internal control provisions of U.S. federal securities laws in connection with conduct at Rio Tinto PLC and certain of its subsidiaries while Mr. Albanese was the CEO of Rio Tinto PLC and prior to his becoming a director of the Corporation.
On March 2, 2018, the Australian Securities and Investments Commission (“ASIC”) commenced civil proceedings in the Federal Court of Australia against each of Rio Tinto Limited, Tom Albanese and the former CFO of Rio Tinto Limited related to statements which ASIC alleged were misleading contained in the annual report of Rio Tinto Limited for 2011. On May 1, 2018, ASIC expanded the proceedings commenced on March 2, 2018 in the Federal Court of Australia. The expanded proceedings related to Rio Tinto Limited’s alleged failure to recognize an impairment of a wholly owned subsidiary, Rio Tinto Coal Mozambique in its 2012 Interim Financial Statements. On February 28, 2022, ASIC amended the proceedings, dropping all of its claims for relief against Mr. Albanese and the former CFO. On March 7, 2022, the Federal Court of Australia entered an order that, among other things, dismissed the proceedings in their entirety against Mr. Albanese and the former CFO. There were no findings of liability or contraventions on the part of Mr. Albanese (or the former CFO). The proceedings are concluded.
The Corporation is aware of the SEC allegations and will continue to monitor the progress of the situation.
Conflicts of Interest
In the opinion of management of Franco-Nevada, there are no existing or potential conflicts of interest among Franco-Nevada, its directors, officers or other insiders of Franco-Nevada, other than as described in the following paragraph. Various officers, directors or other insiders of the Corporation may hold senior positions with other entities, including entities involved in the resource industry or may otherwise be involved in transactions within the resource industry and may develop other interests outside the Corporation. In the event that any such conflict of interest arises (or could potentially arise) for a director, such director will be required to disclose the conflict to a meeting of the directors of the Corporation and abstain from voting for or against the approval of such participation or such terms. In the event that any such conflict of interest arises (or could potentially arise) for an officer or other insider of the Corporation, such person will be required to disclose the conflict to the Chief Legal Officer and abstain from participating in any discussions related to such matter and the Board will be apprised of such conflict. In appropriate cases, the Corporation will establish a special committee of independent directors to review a matter in which several directors, or management, may have a conflict. Any decision made by any of such directors involving the Corporation will be required to be made in accordance with their duties and obligations to deal honestly and in good faith with a view to the best interests of the Corporation and its shareholders.
68
LEGAL PROCEEDINGS AND REGULATORY ACTIONS
Other than with respect to the ongoing CRA audits as described in the financial statements, there are no outstanding material legal proceedings to which Franco-Nevada or any of its subsidiaries is a party or was a party to during fiscal 2021 or that any of its properties or assets is subject or was subject to, during fiscal 2021, and no proceedings are known to be contemplated against Franco-Nevada, any of its subsidiaries or any of their property or assets.
There have been no penalties or sanctions imposed against Franco-Nevada by a court relating to securities legislation or by a securities regulatory authority during fiscal 2021 and there have been no other penalties or sanctions imposed by a court or regulatory body against Franco-Nevada that would likely be considered important to a reasonable investor in making an investment decision. Franco-Nevada has not entered into any settlement agreement before a court relating to securities legislation or with a securities regulatory authority during fiscal 2021.
INTERESTS OF MANAGEMENT AND OTHERS IN MATERIAL TRANSACTIONS
No director or executive officer of Franco-Nevada, any other insider of Franco-Nevada or any associate or affiliate of any of such individuals or companies has any material interest, directly or indirectly, in any transaction within the three most recently completed financial years or during the current financial year that has materially affected Franco-Nevada or is reasonably expected to materially affect Franco-Nevada.
The registrar and transfer agent for the Common Shares is Computershare Investor Services Inc. at its principal office in Toronto, Ontario.
Franco-Nevada has not entered into a material contract since October 17, 2007 (date of incorporation) that is still in effect other than material contracts entered into in the ordinary course of business (none of which are required to be disclosed).
Certain technical and scientific information contained in this AIF, including in respect of the Antamina project, the Antapaccay project, the Candelaria project and the Cobre Panama project was reviewed and approved in accordance with NI 43-101 by Phil Wilson, C.Eng., Vice President, Technical of the Corporation and a “Qualified Person” as defined in NI 43-101.
To the knowledge of Franco-Nevada, this expert held less than 1% of the outstanding securities of the Corporation or of any associate or affiliate thereof as of the date hereof, when he prepared the technical information contained in this AIF or following the preparation of such technical information. No firm or person received, or will receive, any direct or indirect interest in any securities of the Corporation or of any associate or affiliate thereof in connection with the preparation of such technical information.
Franco-Nevada’s auditors are PricewaterhouseCoopers LLP, Chartered Professional Accountants, who have issued a report of an independent registered public accounting firm dated March 9, 2022 in respect of Franco-Nevada’s consolidated financial statements as at December 31, 2021 and 2020 and for each of the years then ended and on the effectiveness of internal control over financial reporting as at December 31, 2021. They have advised Franco-Nevada that they are independent with respect to Franco-Nevada within the meaning of the Chartered Professional Accountants of Ontario CPA Code of Professional Conduct and comply with the rules of the US Securities and Exchange Commission (SEC) and the Public Company Accounting Oversight Board (PCAOB) on auditor independence.
Additional information relating to Franco-Nevada is available electronically on SEDAR at www.sedar.com and on the website of the SEC at www.sec.gov and on its website at www.franco-nevada.com. A glossary of non-technical and technical terms is generally available on Franco-Nevada’s website.
Additional information, including directors’ and officers’ remuneration and indebtedness, principal holders of Franco-Nevada’s securities and securities authorized for issuance under equity compensation plans, is contained in Franco-Nevada’s management information circular for its annual and special meeting of shareholders scheduled to be held on May 4, 2022. For information relating to compensation and corporate governance related matters, please see “Statement of Executive Compensation” and “Statement of Governance Practices”, respectively, in such circular.
Additional financial information is provided in Franco-Nevada’s financial statements and MD&A for its most recently completed financial year.
69
AUDIT AND RISK COMMITTEE INFORMATION
The following information is provided in accordance with Form 52-110F1 under the Canadian Securities Administrators’ National Instrument 52-110 — Audit Committees (“NI 52-110”).
Audit and Risk Committee Charter
The Audit and Risk Committee Charter (the “Charter”) is attached as Appendix A to this AIF. The Charter was last updated effective March 9, 2020 to remove oversight over oil and gas reserves disclosure as the Corporation ceased providing such disclosure in 2018 as it was no longer material.
With respect to risk management, the Charter provides that the ARC will generally review with management the Company’s significant risks and exposures and the steps management has taken to manage, monitor and control such risks and exposures. The ARC will also more specifically review the Company’s principal business, political, financial, litigation and control risks and exposures with a view to ensuring that such risks and exposures are being effectively managed, monitored or controlled. For more information regarding the ARC’s responsibilities relating to risk management, please see Appendix A to this AIF.
Composition of the Audit and Risk Committee
As of December 31, 2021, the ARC was composed of the following four directors: Jennifer Maki, Chair, Tom Albanese, Randall Oliphant, and Elliott Pew. Each director was and is considered “independent” and “financially literate” (as such terms are defined in NI 52-110, the rules of the NYSE and Rule 10A-3 of the U.S. Securities Exchange Act of 1934).
Relevant Education and Experience
Each member of the ARC is financially literate, i.e., has the ability to read and understand financial statements. Collectively, the ARC has the education and experience to fulfill the responsibilities outlined in the Charter, including those relating to risk management. The education and current and past experience of each ARC member that is relevant to the performance of his or her responsibilities as an ARC member is summarized below:
Education and Experience (Past and Present)
Tom Albanese | ● Director, CoTec Holdings Corp. |
| ● Lead Independent Director of Nevada Copper Corp. |
| ● Previous CEO of Vedanta Resources plc and Vedanta Limited (formerly known as SesaSterlite Ltd.) |
| ● Previous Chair of Vedanta Limited’s Risk Management Committee |
| ● Previous Chief Executive Officer of Rio Tinto plc |
| ● Previous Chair of Rio Tinto plc Risk Committee |
| |
Jennifer Maki | ● Director, Baytex Energy Corp. |
| ● Director, Pan American Silver Corp. |
| ● Previous CEO, Vale Canada and Executive Director of Vale Base Metals |
| ● ICD.D, Institute of Corporate Directors (2019) |
| ● Chartered Professional Accountant, CA (1996) |
| ● Bachelor of Commerce, Queen’s University |
| |
Randall Oliphant | ● Previous Executive Chair and Director of New Gold Inc. |
| ● Previous President, CEO and Chief Financial Officer of Barrick Gold Corporation |
| ● Previous Director and Chair of the audit committee of WesternZagros Resources Ltd. |
| ● FCPA, FCA (2016) |
| ● Chartered Professional Accountant, CA (1986) |
| ● Bachelor of Commerce (with honours), University of Toronto, 1984 |
| |
Elliott Pew | ● Previous Director of Enerplus Corporation |
| ● Previous Board Chair and Member, Audit and Risk Committee of Enerplus Corporation |
| ● Previous Director of Southwestern Energy Company |
| ● Previous Senior Executive of Newfield Exploration Company |
| ● Member, ICD and NACD |
Pre-Approval Policies and Procedures
The Board of Directors, upon the recommendation of the ARC, has adopted policies and procedures regarding services provided by external auditors (collectively, the “Auditor Independence Policy”). Under the Auditor Independence Policy, specific
70
proposals for audit services and permitted non-audit services must be pre-approved by the ARC. The ARC may delegate to any one or more of its members pre-approval authority (other than pre-approval of the annual audit service engagement). Any approvals granted under this delegated authority must be presented to the ARC at its next meeting. The Auditor Independence Policy also provides that the ARC may pre-approve services (other than the annual audit service engagement) without the requirement for a specific proposal where the scope and parameters of such services and their attendant fees are clearly defined. The ARC must be informed in writing at its next scheduled meeting of any engagement of the external auditor to provide services in such circumstances. The Auditor Independence Policy deems de minimus non-audit services to have been pre-approved by the ARC in limited circumstances and subject to certain conditions being met.
The Auditor Independence Policy prohibits the external auditors from providing any of the following types of non-audit services:
| ● | bookkeeping or other services related to the accounting records or financial statements; |
| ● | financial information systems design and implementation; |
| ● | appraisal or valuation services, fairness opinion, or contribution-in-kind reports; |
| ● | actuarial services; |
| ● | internal audit outsourcing services; |
| ● | management functions or human resources services; |
| ● | corporate finance or other services; |
| ● | broker-dealer, investment advisor or investment banking services; |
| ● | legal services; |
| ● | expert services; and |
| ● | any other service that under applicable law and generally accepted auditing standards cannot be provided by an external auditor. |
The Auditor Independence Policy provides that the external auditor should not be precluded from providing tax or advisory services that do not fall within any the categories described above, unless the provision of those services would reasonably be expected to compromise the independence of the external auditor.
Reliance on Certain Exemptions
At no time since the commencement of Franco-Nevada’s most recently completed financial year has Franco-Nevada relied on any exemption from NI 52-110.
Audit Committee Oversight
At no time since the commencement of Franco-Nevada’s most recently completed financial year was a recommendation of the ARC to nominate or compensate an external auditor not adopted by the Board of Directors of Franco-Nevada.
Fees
For the years ended December 31, 2021 and 2020, PricewaterhouseCoopers LLP was paid fees in Canadian dollars from the Corporation as detailed below:
|
|
| December 31, 2021 | |
|
| December 31, 2020 | |
| ||
Audit Fees | |
| C$ | 917,348 | (1) | |
| C$ | 1,221,016 | (1) | |
Audit-Related Fees | |
| C$ | 30,000 | | |
| C$ | 86,670 | | |
Tax Fees | |
| C$ | 118,246 | | |
| C$ | 243,710 | | |
Other Fees | |
| C$ | 17,663 | | |
| C$ | 16,899 | | |
Total Fees | |
| C$ | 1,083,257 | | |
| C$ | 1,568,295 | | |
| (1) | Audit fees are reported on an accrual basis for the relevant year and include out-of-pocket expenses and administrative fees. |
For the years ended December 31, 2021 and 2020, “Audit-Related Fees” noted above are fees incurred for the French translation of documents, “Tax Fees” are fees incurred for tax compliance, planning, and audit support services, and “Other Fees” are fees incurred for the completion of agreed upon procedures regarding the amounts of silver delivered under the Antamina stream. The change in “Audit Fees” and “Audit-Related Fees” for the year ended December 31, 2021 compared to December 31, 2020 relates primarily to fees incurred during 2020 for the Corporation’s at-the-market equity program which was not utilized during 2021.
71
FRANCO-NEVADA CORPORATION
AUDIT AND RISK COMMITTEE CHARTER
PURPOSE
The Audit and Risk Committee is appointed by the Board of Directors of Franco-Nevada Corporation (the “Company”) to assist the Board of Directors in its oversight and evaluation of:
| ● | the quality and integrity of the financial statements of the Company, |
| ● | the compliance by the Company with legal and regulatory requirements in respect of financial disclosure, |
| ● | the qualification, independence and performance of the Company’s independent auditors, |
| ● | the performance of the Company’s Chief Financial Officer, and |
| ● | risk management oversight, including climate change risks. |
In addition, the Audit and Risk Committee provides an avenue for communication between the independent auditor, financial management, other employees and the Board of Directors concerning accounting and auditing matters.
The Audit and Risk Committee is directly responsible for the appointment, compensation, retention (and termination) and oversight of the work of the independent auditor (including oversight of the resolution of any disagreements between management and the independent auditor regarding financial reporting) for the purpose of preparing audit reports or performing other audit, review or attest services for the Company.
The Audit and Risk Committee is not responsible for:
| ● | planning or conducting audits, |
| ● | certifying or determining the completeness or accuracy of the Company’s financial statements or that those financial statements are in accordance with applicable accounting principles or standards, or |
| ● | guaranteeing the report of the Company’s independent auditor. |
The fundamental responsibility for the Company’s financial statements and disclosure rests with management. It is not the duty of the Audit and Risk Committee to conduct investigations, to itself resolve disagreements (if any) between management and the independent auditor or to ensure compliance with applicable legal and regulatory requirements.
REPORTS
The Audit and Risk Committee shall report to the Board of Directors of the Company on a regular basis and, in any event, before the public disclosure by the Company of its quarterly and annual financial results. The reports of the Audit and Risk Committee shall include any issues of which the Committee is aware with respect to the quality or integrity of the Company’s financial statements, its compliance with legal or regulatory requirements in respect of financial matters and disclosure, and the performance and independence of the Company’s independent auditor.
The Committee shall also prepare, as required by applicable law, any committee report required for inclusion in the Company’s publicly filed documents.
COMPOSITION
The members of the Audit and Risk Committee shall be three or more individuals who are appointed (and may be replaced) by the Board of Directors of the Company on the recommendation of the Company’s Compensation and ESG Committee. Each of the members of the Audit and Risk Committee shall be “independent” and “financially literate” within the meaning of National Instrument 52-110 — Audit Committees (“NI 52-110”) and any other securities legislation and stock exchange rules applicable to the Company, and as confirmed by the Board of Directors using its business judgment. In addition, at least one member of the Audit and Risk Committee shall be a “financial expert” as determined by the Board of Directors in its business judgment. No member of the Audit and Risk Committee shall accept (directly or indirectly) any consulting, advisory or other compensatory fee from the Company or any of its subsidiaries or affiliates (collectively, the “Franco-Nevada Group”) (other than remuneration for acting in his or her capacity as a director) or be an “affiliated entity” within the meaning of NI 52-110.
A-1
RESPONSIBILITIES
Independent Auditors
The Audit and Risk Committee shall:
| ● | Recommend to the Board of Directors the independent auditor to be nominated for the purpose of preparing or issuing an auditor’s report or performing other audit, review or attest services for the Company and the compensation of the independent auditor; |
| ● | Recommend to the Board of Directors any change of the independent auditor, and oversee any such change to ensure compliance with the provisions of the Canada Business Corporations Act and applicable securities legislation; |
| ● | Require and obtain confirmation from the independent auditor that it ultimately is accountable, and will report directly, to the Audit and Risk Committee and the Board of Directors of the Company; |
| ● | Oversee the work of the independent auditor engaged for the purpose of preparing or issuing an auditor’s report or performing other audit, review or attest services for the Company, including the resolution of disagreements between management and the external auditor regarding financial reporting; |
| ● | Pre-approve all audit and permitted non-audit services provided to the Company and its subsidiary entities by the independent auditor, including adopting policies and procedures for the pre-approval of the retention thereof (subject to any restrictions on such services imposed by applicable securities legislation) and including procedures for the delegation of authority to provide such approval to one or more members of the Audit and Risk Committee; and |
| ● | At least annually, review the qualifications, performance and independence of the independent auditor. In doing so, the Audit and Risk Committee should, among other things, undertake the measures set forth in Schedule “A”. |
The Financial Statements, Audit Process and Related Disclosure
The Audit and Risk Committee shall:
| ● | As may be delegated by the Board of Directors, review, approve and authorize the issuance of the Company’s interim financial statements, MD&A and interim earnings press releases before the Company publicly discloses this information; |
| ● | Review and recommend to the Board of Directors for approval the Company’s annual financial statements, MD&A and press releases before the Company publicly discloses the information; and |
| ● | Be satisfied that adequate procedures are in place for the review of the Company’s public disclosure of financial information extracted or derived from the Company’s financial statements and will periodically assess the adequacy of those procedures. |
The Audit and Risk Committee shall also, as it determines to be appropriate:
| ● | Review with management and the independent auditor, |
| ● | the planning and staffing of the audit by the independent auditor, |
| ● | financial information and any earnings guidance provided to analysts and rating agencies, recognizing that this review and discussion may be done generally (consisting of a discussion of the types of information to be disclosed and the types of presentations to be made) and need not take place in advance of the disclosure of each release or provision of guidance, |
| ● | any significant financial reporting issues and judgments made in connection with the preparation of the Company’s financial statements, including any significant changes in the selection or application of accounting principles or standards, any major issues regarding auditing principles and practices, and the adequacy of internal controls that could significantly affect the Company’s financial statements, as raised by the independent auditor, and review management’s response thereto, |
| ● | all critical accounting policies and practices used, |
| ● | all alternative treatments of financial information by applicable accounting principles or standards that have been discussed with management, ramifications of the use of such alternative disclosures and treatments, and the treatment preferred by the independent auditor, |
A-2
| ● | the use of “pro forma” or “adjusted” information that is not consistent with applicable accounting principles or standards, |
| ● | the effect of regulatory and accounting initiatives, as well as any off-balance sheet structures, transactions, arrangements and obligations (contingent or otherwise), on the Company’s financial statements, |
| ● | any disclosures concerning any weaknesses or any deficiencies in the design or operation of internal controls or disclosure controls made to the Audit and Risk Committee by the Chief Executive Officer and the Chief Financial Officer during their certification process for forms filed with applicable securities regulators, and |
| ● | the adequacy of the Franco-Nevada Group’s internal accounting controls and management information systems and its financial, auditing and accounting organizations and personnel and any special steps adopted in light of any material control deficiencies. |
| ● | Review with the independent auditor, |
| ● | the quality as well as the acceptability of the accounting principles or standards that have been applied, |
| ● | any problems or difficulties the independent auditor may have encountered during the provision of its audit-related services, including any restrictions on the scope of activities or access to requested information and any significant disagreements with management, any management letter provided by the independent auditor or other material communication (including any schedules of unadjusted differences) to management and the Company’s response to that letter or communication, and |
| ● | any changes to the Company’s significant auditing and accounting principles, standards and practices suggested by the independent auditor to members of management. |
Risk Management Oversight
The Audit and Risk Committee shall:
| ● | Generally review with management the Franco-Nevada Group’s significant risks and exposures and the steps management has taken to manage, monitor and control such risks and exposures. |
| ● | More specifically review the Company’s principal business, political, financial, litigation and control risks and exposures with a view to ensuring that such risks and exposures are being effectively managed, monitored or controlled by: |
| ● | reviewing the Company’s risk philosophy as set forth by management and the Board of Directors, |
| ● | reviewing management’s assessment of the significant risks and exposures facing the Company, including climate change risks (where applicable), |
| ● | reviewing management’s policies, plans, processes and programs to manage and control significant risks and exposures, including the Company’s loss prevention policies, disaster response and recovery programs, corporate liability protection programs for directors and officer and any other insurance programs, as applicable, |
| ● | receiving regular reports from management regarding the development and implementation of its policies, plans, processes and programs to manage, monitor and control significant risks and exposures, and |
| ● | if the Audit and Risk Committee deems it appropriate, requesting the independent auditor’s opinion of management’s assessment of significant risks facing the Company and how effectively they are managed, monitored and controlled. |
Compliance
The Audit and Risk Committee shall:
| ● | Establish procedures for: |
| ● | the receipt, retention and treatment of complaints received by the Company regarding accounting, internal accounting controls or auditing matters, and |
A-3
| ● | the confidential, anonymous submission by employees of the Franco-Nevada Group of concerns regarding questionable accounting or auditing matters. |
| ● | Review and approve clear policies for the hiring by the Franco-Nevada Group of partners, employees or former partners or employees of the present and former independent auditor of the Company. |
The Audit and Risk Committee shall also, as it determines appropriate:
| ● | Obtain reports from the Chief Financial Officer, other members of management and the independent auditor that the Company’s subsidiary/foreign affiliated entities are in conformity with applicable legal requirements and the Company’s Code of Business Conduct and Ethics, including disclosures of insider and affiliated party transactions. |
| ● | Review with the Chief Financial Officer, other members of management and the independent auditor any correspondence with regulators or governmental agencies and any employee complaints or published reports, which raise material issues regarding the Company’s financial statements or accounting policies. |
| ● | Advise the Board of Directors of the Company with respect to the Franco-Nevada Group’s policies and procedures regarding compliance with applicable laws and regulations and with the Company’s Code of Business Conduct and Ethics. |
| ● | Review with the Chief Financial Officer legal matters that may have a material impact on the financial statements, the Franco-Nevada Group’s compliance policies and any material reports or inquiries received from regulators or governmental agencies. |
| ● | Periodically review with management the need for an internal audit function. |
Delegation
To avoid any confusion, the Audit and Risk Committee responsibilities identified above are the sole responsibility of the Audit and Risk Committee and may not be delegated to a different committee.
MEETINGS
The Audit and Risk Committee shall meet at least quarterly and more frequently as circumstances require. All members of the Audit and Risk Committee should strive to be at all meetings. The Audit and Risk Committee shall meet separately, periodically, with management and the independent auditors and may request any officer or employee of the Franco-Nevada Group or the Franco-Nevada Group’s outside counsel or independent auditor to attend meetings of the Committee or with any members of, or advisors to, the Committee. The Audit and Risk Committee also may meet with the investment bankers, financial analysts and rating agencies that provide services to, or follow, the Franco-Nevada Group.
The Audit and Risk Committee may form and delegate authority to individual members and subcommittees where the Committee determines it is appropriate to do so.
INDEPENDENT ADVICE
In discharging its mandate, the Audit and Risk Committee shall have the authority to retain (and authorize the payment by the Company of) and receive advice from special legal, accounting or other advisors as the Audit and Risk Committee determines to be necessary to permit it to carry out its duties.
ANNUAL EVALUATION
At least annually, the Audit and Risk Committee shall, in a manner it determines to be appropriate:
| ● | Perform a review and evaluation of the performance of the Committee and its members, including the compliance of the Audit and Risk Committee with this Charter. |
| ● | Review and assess the adequacy of its Charter and recommend to the Board of Directors any improvements to this Charter that the Committee determines to be appropriate. |
A-4
SCHEDULE “A”
Qualifications, Performance and Independence of Independent Auditor
| ● | Review the experience and qualifications of the senior members of the independent auditor’s team. |
| ● | Confirm with the independent auditor that it is in compliance with applicable legal, regulatory and professional standards relating to auditor independence. |
| ● | Review annual reports from the independent auditor regarding its independence and consider whether there are any non-audit services or relationships that may affect the objectivity and independence of the independent auditor and, if so, recommend that the Board of Directors of the Company take appropriate action to satisfy itself of the independence of the independent auditor. |
| ● | Obtain and review such report(s) from the independent auditor as may be required by applicable legal and regulatory requirements. |
Updated: March 9, 2020
A-5