Exhibit 99.1

NEWS RELEASE
Toronto, May 8, 2019
(in U.S. dollars unless otherwise noted)
Franco-Nevada Reports Record Q1 Results
Dividend Increased for 12th Consecutive Year
Ongoing Board and Succession Planning
“Franco-Nevada’s diversified portfolio performed very well in the first quarter delivering record revenue and net income,” stated David Harquail, CEO. “We expect even stronger numbers in the second half as Cobre Panama begins its initial deliveries, Candelaria returns to normal operations and our U.S. energy royalties continue to grow. It is a testament to both the portfolio and our business model that today Franco-Nevada has increased its dividend for the 12th consecutive year adding to the over $1 billion of dividends already paid.”
Pierre Lassonde, Chair, added: “I would like to welcome Jennifer Maki who was elected today at our AGM as the newest member of the Franco-Nevada board. Jennifer is the former CEO of Vale Canada and Executive Director of Vale Base Metals and is a Chartered Professional Accountant. She brings a depth of mining and financial experience to our board. On a separate note, today at the AGM, I announced my intention to step down as Chair at the next annual meeting in May 2020. At that point, I will have served as chair for over 12 years. Both announcements are part of an orderly and long-term succession planning process being led by the board.”
Q1/2019 Financial Highlights
|
· |
122,049 GEOs sold |
|
· |
$179.8 million in revenue – a new record |
|
· |
$65.2 million of Net Income (a new record), or $0.35 per share |
|
· |
$31.0 million in Cash Costs, or $254 per GEO |
|
· |
$140.9 million of Adjusted EBITDA, or $0.75 per share |
|
· |
Quarterly dividend increased to $0.25 from $0.24 per share – increased for 12th consecutive year |
|
Revenue and GEOs by Asset Categories |
|||||||||||
|
|
|
Q1/2019 |
|
Q1/2018 |
|
||||||
|
|
|
GEOs |
|
Revenue |
|
GEOs |
|
Revenue |
|
||
|
|
|
# |
|
(in millions) |
|
# |
|
(in millions) |
|
||
|
Gold |
|
87,578 |
|
|
$ 114.0
|
|
88,794 |
|
|
$ 118.3
|
|
|
Silver |
|
15,298 |
|
|
20.0 |
|
17,672 |
|
|
23.5 |
|
|
PGMs |
|
14,629 |
|
|
19.1 |
|
6,935 |
|
|
9.3 |
|
|
Other Mining Assets |
|
4,544 |
|
|
5.9 |
|
2,270 |
|
|
3.0 |
|
|
Mining |
|
122,049 |
|
|
$ 159.0
|
|
115,671 |
|
|
$ 154.1
|
|
|
Energy |
|
— |
|
|
20.8 |
|
— |
|
|
19.0 |
|
|
|
|
122,049 |
|
|
$ 179.8
|
|
115,671 |
|
|
$ 173.1
|
|
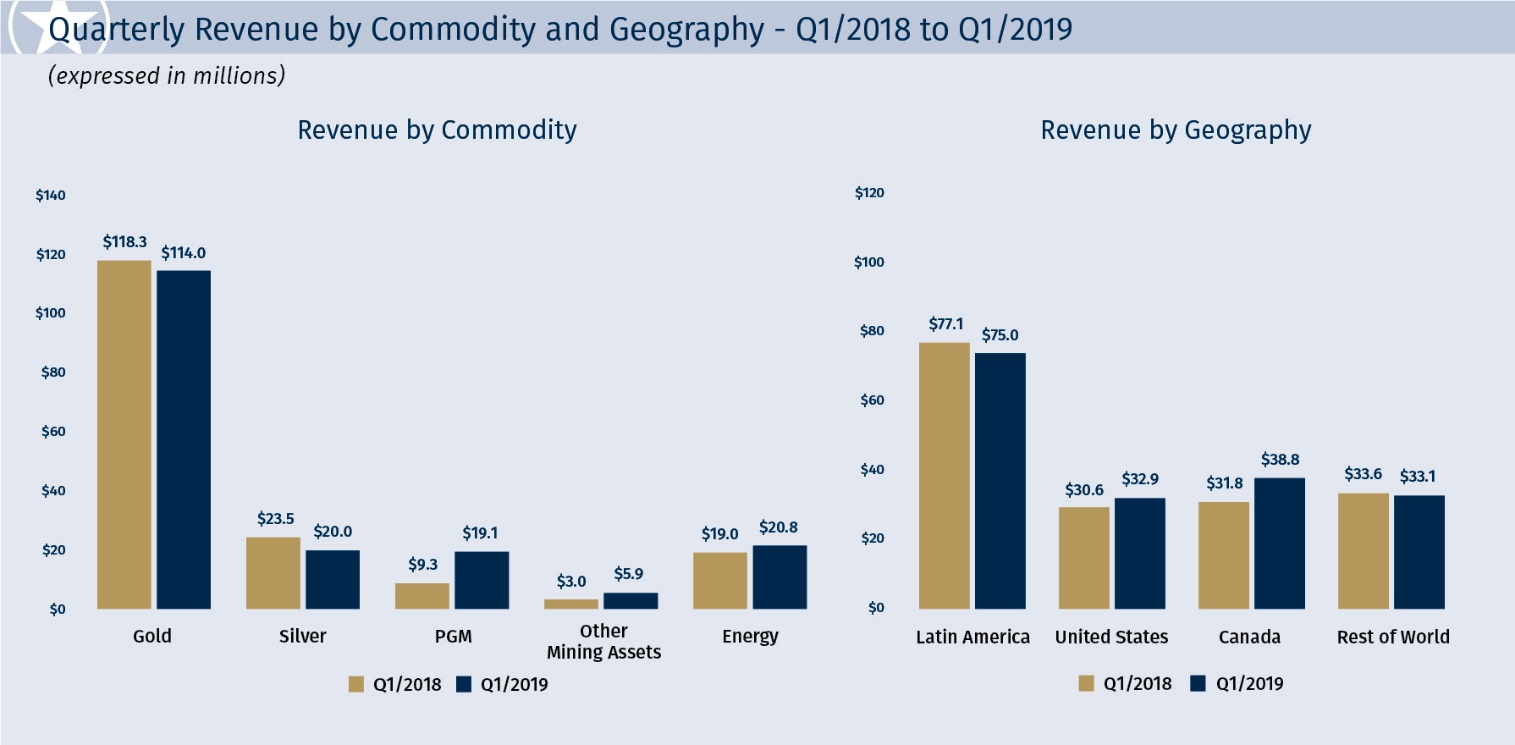
For Q1/2019, revenue was sourced 88.4% from gold and gold equivalents (63.4% gold, 11.1% silver, 10.6% PGM and 3.3% other mining assets) and 11.6% from energy (oil, gas and NGLs). The portfolio is actively managed to maintain a focus on precious metals (gold, silver and PGM) with a target of no more than 20% from energy. Geographically, revenue was sourced 81.6% from the Americas (41.7% Latin America, 18.3% U.S. and 21.6% Canada).
Corporate Updates
|
· |
Board of Directors: Franco-Nevada’s board is leading an orderly and long-term succession process. At today’s AGM, Jennifer Maki was elected to the board. She has served as Chief Executive Officer of Vale Canada and Executive Director of Vale Base Metals (2014 to 2017) and previously held several other positions with Vale Base Metals and is a Chartered Professional Accountant. Pierre Lassonde has served as Chair of Franco-Nevada since 2007 and has announced his intention to step down as Chair at the next annual meeting in May 2020. These two announcements are unrelated. |
|
· |
Salares Norte: On January 31, 2019, Franco-Nevada, through a wholly-owned Chilean subsidiary, acquired an existing 2% NSR on Gold Fields’ Salares Norte gold project in the Atacama region of northern Chile for $32.0 million, comprised of $27.0 million of Franco-Nevada common shares (366,499 common shares) and $5.0 million in cash. Gold Fields has an option to buy back 1% of the NSR for $6.0 million within 24 months of commercial production. |
|
· |
Valentine Lake: On February 21, 2019, Franco-Nevada acquired a 2% NSR on Marathon Gold Corporation’s (“Marathon”) Valentine Lake Gold Camp in central Newfoundland for C$18.0 million. Marathon has an option to buy back 0.5% of the NSR for $7.0 million until December 31, 2022. |
Q1/2019 Portfolio Updates
|
· |
Mining — Latin America: GEOs from Latin American mining assets were stable year-over-year, with 57,546 GEOs earned compared to 57,854 GEOs in Q1/2018. While deliveries from Candelaria increased significantly year-over-year, the impact was mostly offset by lower production from Antapaccay and Antamina. |
|
· |
Cobre Panama (gold and silver stream) – The operator, First Quantum, reports that ore milling has begun and 25 tonnes of copper concentrate were produced. First Quantum reiterated its production guidance of 140,000 to 175,000 tonnes of copper for Cobre Panama for 2019. It expects the operation to be milling at an annualized rate of 72 mtpy by year end. First Quantum also released a technical report in March that projects the operation reaching a milling throughput of 100 mtpy in 2023. Franco-Nevada’s precious metals streams are tied to copper produced. |
|
· |
Candelaria (gold and silver stream) – GEOs earned from Candelaria in the quarter were higher due to the processing of higher grade ore. The operation is expected to benefit substantially in the second half from over $1 billion in fleet purchases, stripping and development. |
|
· |
Antapaccay (gold and silver stream) – GEOs earned from Antapaccay were lower as expected with the life of mine plan. |
|
· |
Antamina (22.5% silver stream) – GEOs earned from Antamina were lower as expected in the life of mine plan. |
|
· |
Cerro Moro (2% royalty) – Cerro Moro began production in 2018. Franco-Nevada will benefit from the first full year of production in 2019. An aggressive drill program is planned to delineate near-mine targets. |
|
· |
Guadalupe-Palmarejo (50% gold stream) – GEOs sold in Q1/2019 were down year-over-year as less mining occurred on Franco-Nevada stream lands. Development at the La Nación deposit, located between the Independencia and Guadalupe mines and predominantly on stream lands, remains on-schedule with production expected in the second half of 2019. |
|
· |
Mining — U.S.: GEOs from U.S. mining assets decreased by 5.0% in Q1/2019 compared with Q1/2018 mainly due to lower payments from Fire Creek/Midas and South Arturo, partly offset by strong production from Stillwater. GEOs received from the U.S. mining assets were 17,558 GEOs. |
|
· |
Goldstrike (2-4% royalty & 2.4-6% NPI); Gold Quarry (7.29% royalty) – Barrick and Newmont’s joint venture in Nevada is expected to realize synergies. This could positively impact the NPI royalty at Goldstrike. |
|
· |
Rosemont (1.5% royalty) – Hudbay announced in March 2019 the receipt of the final key federal permit outstanding allowing the company to advance Rosemont towards construction. Hudbay subsequently announced that it has reached an agreement to purchase United Copper & Moly LLC’s 7.95% interest in the project and terminate the earn-in and off-take rights. Franco-Nevada’s royalty is on all metals produced. |
|
· |
South Arturo (4-9% royalty) – Joint venture operators Barrick and Premier Gold continue to advance the construction of the El Nino underground and Phase 1 open pit. A small amount of production is expected in 2019 with more meaningful production expected in 2020. |
|
· |
Stillwater (5% royalty) – Sibanye-Stillwater is forecasting PGM production between 645,000-675,000 ounces for 2019 as the Blitz project continues to ramp-up. Blitz is anticipated to increase total PGM production from Stillwater by more than 50% to approximately 850,000 ounces per year by late 2021 or early 2022. |
2
|
· |
Fire Creek/Midas (2.5% royalty) – The fixed delivery requirement for Fire Creek/Midas was met in 2018. The new operator, Hecla, has placed the Midas mine on care and maintenance with more focus being placed on increasing production from Fire Creek. |
|
· |
Mining — Canada: GEOs from Canadian mining assets increased 53.6% in Q1/2019 to 21,581 GEOs compared with Q1/2018 mainly due to the resumption of mining at Sudbury’s McCreedy mine. |
|
· |
Sudbury (50% precious metals stream) – KGHM announced that it has resumed mining the PM zone at the McCreedy mine which contains higher grade precious metal ore. As part of the revised arrangements with KGHM, Franco-Nevada has agreed to increase its ongoing cost to $800 per GEO delivered from McCreedy until December 31, 2021. The increase in deliveries from McCreedy will be partially offset going forward by plans to put the Levack mine on care and maintenance at the end of March 2019. |
|
· |
Brucejack (1.2% royalty) – Pretium provided an updated mine plan for the Brucejack operation in April 2019. The updated plan assumes average annual production of over 525,000 ounces of gold over the first 10 years and over 440,000 ounces of gold over the 14-year mine life. The mine passed the 503,386 gold ounce production threshold in December 2018 which triggered the start of royalty payments to Franco-Nevada. |
|
· |
Hardrock (3% royalty) – The Hardrock project received provincial government approval in March 2019 which follows receipt of the federal approval in December 2018. The joint venture partners will continue to advance permitting including construction permit applications and additional drilling for the balance of 2019. |
|
· |
Kirkland Lake (1.5-5.5% royalty & 20% NPI) – The Macassa mine produced a record 72,776 ounces during the quarter, an increase of 35% from Q1/2018. Kirkland Lake continues to advance the construction of the #4 Shaft at the Macassa mine. Kirkland Lake has the goal of increasing production at Macassa to over 400,000 ounces per year over the next five to seven years. |
|
· |
Musselwhite (5% NPI) – An underground fire at the end of March 2019 caused the operation to be suspended. Newmont, the new operator, is expected to give an update on the integration of the Goldcorp assets during the second quarter of 2019 with potentially more information regarding the re-opening of Musselwhite. |
|
· |
Golden Highway (0.25–10% royalty) – Franco-Nevada and Kirkland Lake amended the royalty agreement on the Holloway property to a fixed 3% NSR royalty versus the previous sliding scale royalty. Kirkland Lake is now targeting approximately 20,000 ounces of production in 2019, growing to approximately 50,000 ounces by 2021. Previously, the Holloway mine was on care and maintenance. |
|
· |
Mining — Rest of World: GEOs from Rest of World mining assets were 25,364 GEOs during the quarter, remaining stable compared to Q1/2018. |
|
· |
Subika (2% royalty) – Newmont declared commercial production at the Subika Underground in Q4/2018. The second major project, the Ahafo Mill expansion, is expected to have first production and declare commercial production in the second half of 2019. |
|
· |
Duketon (2% royalty) – Regis Resources commenced underground development below the current Rosemont open pit and delineated a maiden mineral reserve of 123,000 ounces. |
|
· |
Ity (1–1.5% royalty) – Franco-Nevada has a 1.5% royalty on the project until 35 tonnes of gold are produced. With Endeavour’s increased production forecast for 2019, this threshold may be met by the end of the year. |
|
· |
Agi Dagi (2% royalty) – Alamos received its operating permit for Kirazli (not subject to our royalty) and expects to start earthworks at the project. When Kirazli is constructed, the development focus is expected to shift to Agi Dagi. |
|
· |
Tasiast (2% royalty) – The Phase One (12,000 tpd) expansion is complete. Phase Two activities are paused as Kinross continues to analyze expansion options and engages in discussions with the Government of Mauritania. |
|
· |
Energy: Revenue from the energy assets increased to $20.8 million in Q1/2019 compared to $19.0 million in Q1/2018, reflecting the additional contributions from new investments in the SCOOP/STACK and positive year-over-year production from the Permian interests. This was partially offset by lower revenue from our Canadian assets. |
|
· |
SCOOP/STACK (Continental) (various royalty rates) –The Royalty Acquisition Venture is having good success at acquiring additional royalties. In Q1/2019, Franco-Nevada recorded contributions of $51.4 million to the Royalty Acquisition Venture and its remaining commitment over the next three years is $206.8 million. Revenue in Q1/2019 totalled $2.8 million. |
|
· |
SCOOP/STACK (Other) (various royalty rates) – These assets generated $2.7 million in revenue in Q1/2019 versus $2.2 million in Q1/2018, due to an increase in volumes from new wells on royalty lands. Encana is now a significant operator over our STACK royalty lands. |
3
|
· |
Permian (various royalty rates) – Franco-Nevada’s interests in the Permian Basin earned revenue of $4.5 million in Q1/2019 versus $3.7 million in Q1/2018, reflecting the addition of the Delaware royalties, an increase in volumes from new wells and proceeds received from prior periods. |
|
· |
Weyburn (NRI, ORR, WI) – Weyburn contributed $7.3 million in revenue in Q1/2019 versus $10.1 million in Q1/2018. Revenues in the quarter were affected by lower realized prices and increased capital spending at the operation. Through 2019, realized prices are expected to improve as a result of a more balanced market in western Canada and capital spending at Weyburn is expected to be lower. |
|
· |
Orion (4% GORR) – Orion generated $1.7 million in revenue in Q1/2019 versus $0.8 million in Q1/2018. While production volume was significantly higher, revenue was negatively impacted by price differentials and government mandated volume curtailments. These issues are expected to improve over the balance of 2019. |
Dividend Declaration
Franco-Nevada is pleased to announce that its board of directors has declared a quarterly dividend of $0.25 per share. The dividend is a 4.2% increase from the previous $0.24 per share quarterly dividend and marks the 12th consecutive annual dividend increase for Franco-Nevada shareholders. Canadian investors in Franco-Nevada’s IPO in December 2007 are now receiving an effective 8.9% yield on their cost base. The dividend will be paid on June 27, 2019 to shareholders of record on June 13, 2019 (the “Record Date”). The Canadian dollar equivalent is to be determined based on the daily average rate posted by the Bank of Canada on the Record Date. Under Canadian tax legislation, Canadian resident individuals who receive “eligible dividends” are entitled to an enhanced gross-up and dividend tax credit on such dividends.
The Company has a Dividend Reinvestment Plan (the “DRIP”). Participation in the DRIP is optional. The Company will issue additional common shares through treasury at a 3% discount to the Average Market Price, as defined in the DRIP. However, the Company may, from time to time, in its discretion, change or eliminate the discount applicable to treasury acquisitions or direct that such common shares be purchased in market acquisitions at the prevailing market price, any of which would be publicly announced. The DRIP and enrollment forms are available on the Company’s website at www.franco-nevada.com. Canadian and U.S. registered shareholders may also enroll in the DRIP online through the plan agent’s self-service web portal at www.investorcentre.com/franco-nevada. Canadian and U.S. beneficial shareholders should contact their financial intermediary to arrange enrollment. During Q2/2018, the Company amended and restated the DRIP to allow for certain non-Canadian and non-U.S. shareholders to participate in the DRIP, subject to the satisfaction of certain conditions. Non-Canadian and non-U.S. shareholders should contact the Company to determine whether they satisfy the necessary conditions to participate in the DRIP.
This press release is not an offer to sell or a solicitation of an offer of securities. A registration statement relating to the DRIP has been filed with the U.S. Securities and Exchange Commission and may be obtained under the Company’s profile on the U.S. Securities and Exchange Commission’s website at www.sec.gov.
Shareholder Information
The complete Consolidated Interim Financial Statements and Management’s Discussion and Analysis can be found today on Franco‑Nevada’s website at www.franco-nevada.com, on SEDAR at www.sedar.com and on EDGAR at www.sec.gov.
Management will host a conference call tomorrow, Thursday, May 9, 2019 at 8:30 a.m. Eastern Time to review Franco‑Nevada’s Q1/2019 results.
Interested investors are invited to participate as follows:
|
· |
Via Conference Call: Toll-Free: (888) 390-0546; International: (416) 764-8688 |
|
· |
Conference Call Replay until May 16: Toll-Free (888) 390-0541; International (416) 764-8677; Code 770553# |
|
· |
Webcast: A live audio webcast will be accessible at www.franco-nevada.com |
Corporate Summary
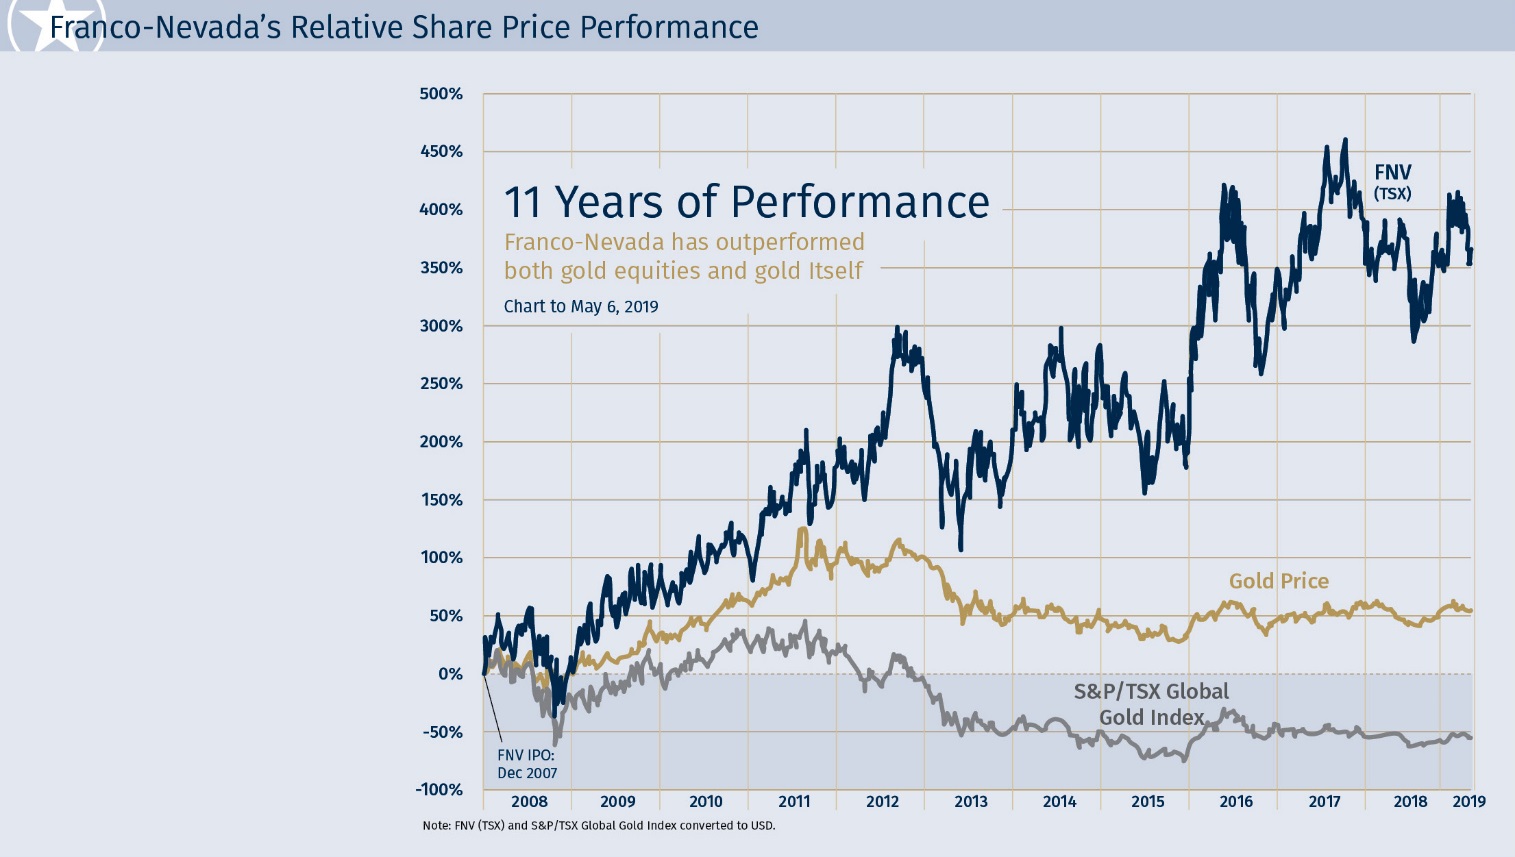
Franco-Nevada Corporation is the leading gold-focused royalty and stream company with the largest and most diversified portfolio of cash-flow producing assets. Its business model provides investors with gold price and exploration optionality while limiting exposure to many of the risks of operating companies. Franco-Nevada has a strong balance sheet and uses its free cash flow to expand its portfolio and pay dividends. It trades under the symbol FNV on both the Toronto and New York stock exchanges. Franco-Nevada is the gold investment that works.
4
For more information, please go to our website at www.franco-nevada.com or contact:
|
Stefan Axell |
|
Sandip Rana |
|
Director, Corporate Affairs |
|
Chief Financial Officer |
|
(416) 306-6328 |
|
(416) 306-6303 |
|
info@franco-nevada.com |
Forward Looking Statements
This press release contains “forward looking information” and “forward looking statements” within the meaning of applicable Canadian securities laws and the United States Private Securities Litigation Reform Act of 1995, respectively, which may include, but are not limited to, statements with respect to future events or future performance, management’s expectations regarding Franco-Nevada’s growth, results of operations, estimated future revenues, carrying value of assets, future dividends and requirements for additional capital, mineral reserve and mineral resource estimates, production estimates, production costs and revenue, future demand for and prices of commodities, expected mining sequences, business prospects and opportunities, audits being conducted by the Canada Revenue Agency and available remedies, and the remedies relating to and consequences of the ruling of the Supreme Court of Panama in relation to the Cobre Panama project. In addition, statements (including data in tables) relating to reserves and resources and gold equivalent ounces (“GEOs”) are forward looking statements, as they involve implied assessment, based on certain estimates and assumptions, and no assurance can be given that the estimates and assumptions are accurate and that such reserves and resources and GEOs will be realized. Such forward looking statements reflect management’s current beliefs and are based on information currently available to management. Often, but not always, forward looking statements can be identified by the use of words such as “plans”, “expects”, “is expected”, “budgets”, “scheduled”, “estimates”, “forecasts”, “predicts”, “projects”, “intends”, “targets”, “aims”, “anticipates” or “believes” or variations (including negative variations) of such words and phrases or may be identified by statements to the effect that certain actions “may”, “could”, “should”, “would”, “might” or “will” be taken, occur or be achieved. Forward looking statements involve known and unknown risks, uncertainties and other factors, which may cause the actual results, performance or achievements of Franco-Nevada to be materially different from any future results, performance or achievements expressed or implied by the forward looking statements. A number of factors could cause actual events or results to differ materially from any forward looking statement, including, without limitation: fluctuations in the prices of the primary commodities that drive royalty and stream revenue (gold, platinum group metals, copper, nickel, uranium, silver, iron-ore and oil and gas); fluctuations in the value of the Canadian and Australian dollar, Mexican peso, and any other currency in which revenue is generated, relative to the U.S. dollar; changes in national and local government legislation, including permitting and licensing regimes and taxation policies and the enforcement thereof; regulatory, political or economic developments in any of the countries where properties in which Franco-Nevada holds a royalty, stream or other interest are located or through which they are held; risks related to the operators of the properties in which Franco-Nevada holds a royalty, stream or other interest, including changes in the ownership and control of such operators; influence of macroeconomic developments; business opportunities that become available to, or are pursued by Franco-Nevada; reduced access to debt and equity capital; litigation; title, permit or license disputes related to interests on any of the properties in which Franco-Nevada holds a royalty, stream or other interest; whether or not the Corporation is determined to have “passive foreign investment company” (“PFIC”) status as defined in Section 1297 of the United States Internal Revenue Code of 1986, as amended; potential changes in Canadian tax treatment of offshore streams; excessive cost escalation as well as development, permitting, infrastructure, operating or technical difficulties on any of the properties in which Franco-Nevada holds a royalty, stream or other interest; access to sufficient pipeline capacity; actual mineral content may differ from the reserves and resources contained in technical reports; rate and timing of production differences from resource estimates, other technical reports and mine plans; risks and hazards associated with the business of development and mining on any of the properties in which Franco-Nevada holds a royalty, stream or other interest, including, but not limited to unusual or unexpected geological and metallurgical conditions, slope failures or cave-ins, flooding and other natural disasters, terrorism, civil unrest or an outbreak of contagious diseases; and the integration of acquired assets. The forward looking statements contained in this press release are based upon assumptions management believes to be reasonable, including, without limitation: the ongoing operation of the properties in which Franco-Nevada holds a royalty, stream or other interest by the owners or operators of such properties in a manner consistent with past practice; the accuracy of public statements and disclosures made by the owners or operators of such underlying properties; no material adverse change in the market price of the commodities that underlie the asset portfolio; the Corporation’s ongoing income and assets relating to determination of its PFIC status; no material changes to existing tax treatment; no adverse development in respect of any significant property in which Franco-Nevada holds a royalty, stream or other interest; the accuracy of publicly disclosed expectations for the development of underlying properties that are not yet in production; integration of acquired assets; the expected application of tax laws and regulations by taxation authorities; the expected assessment and outcome of any audit by any taxation authority; and the absence of any other factors that could cause actions, events or results to differ from those anticipated, estimated or intended. However, there can be no assurance that forward looking statements will prove to be accurate, as actual results and future events could differ materially from those anticipated in such statements. Investors are cautioned that forward looking statements are not guarantees of future performance. Franco-Nevada cannot assure investors that actual results will be consistent with these forward looking statements and investors should not place undue reliance on forward looking statements due to the inherent uncertainty therein. For additional information with respect to risks, uncertainties and assumptions, please refer to the “Risk Factors” section of Franco-Nevada’s most recent Annual Information Form filed with the Canadian securities regulatory authorities on www.sedar.com and Franco-Nevada’s most recent Annual Report filed on Form 40-F filed with the SEC on www.sec.gov. The forward looking statements herein are made as of the date of this press release only and Franco-Nevada does not assume any obligation to update or revise them to reflect new information, estimates or opinions, future events or results or otherwise, except as required by applicable law.
5
NON-IFRS MEASURES: Cash Costs, Adjusted EBITDA, and Adjusted Net Income are intended to provide additional information only and do not have any standardized meaning prescribed under IFRS and should not be considered in isolation or as a substitute for measures of performance prepared in accordance with IFRS. These measures are not necessarily indicative of operating profit or cash flow from operations as determined under IFRS. Other companies may calculate these measures differently. For a reconciliation of these measures to various IFRS measures, please see below or the Company’s current MD&A disclosure found on the Company’s website, on SEDAR and on EDGAR. Comparative information has been recalculated to conform to current presentation.
|
1 |
GEOs include our gold, silver, platinum, palladium and other mining assets. GEOs are estimated on a gross basis for NSR royalties and, in the case of stream ounces, before the payment of the per ounce contractual price paid by the Company. For NPI royalties, GEOs are calculated taking into account the NPI economics. Platinum, palladium, silver and other minerals are converted to GEOs by dividing associated revenue, which includes settlement adjustments, by the relevant gold price. The gold price used in the computation of GEOs earned from a particular asset varies depending on the royalty or stream agreement, which may make reference to the market price realized by the operator, or the average for the month, quarter, or year in which the mineral was produced or sold. For Q1/2019, the average commodity prices were as follows: $1,304 gold (2018 - $1,329), $15.57 silver (2018 - $16.77), $823 platinum (2018 - $978) and $1,435 palladium (2018 - $1,035). |
|
2 |
Cash Costs attributable to GEO production and Cash Costs per GEO are non-IFRS financial measures. Cash Costs attributable to GEO production is calculated by starting with total costs of sale and excluding depletion and depreciation, costs not attributable to GEO production such as our Energy operating costs, and other non-cash costs of sales such as costs related to our prepaid gold purchase agreement. Cash Costs is then divided by GEOs sold, excluding prepaid ounces, to arrive at Cash Costs per GEO. |
|
3 |
Adjusted EBITDA and Adjusted EBITDA per share are non-IFRS financial measures, which exclude the following from net income and earnings per share (“EPS”): income tax expense/recovery; finance expenses; finance income; depletion and depreciation; non-cash costs of sales; impairment charges related to royalty, stream and working interests and investments; gains/losses on sale of royalty interests; gains/losses on investments; and foreign exchange gains/losses and other income/expenses. |
|
4 |
Adjusted Net Income and Adjusted Net Income per share are non-IFRS financial measures, which exclude the following from net income and EPS: foreign exchange gains/losses and other income/expenses; impairment charges related to royalty, stream and working interests and investments; gains/losses on sale of royalty interests; gains/losses on investments; unusual non-recurring items; and the impact of income taxes on these items. |
6
Reconciliation to IFRS measures:
|
|
|
For the three months ended |
|
||||
|
|
|
March 31, |
|
||||
|
(expressed in millions, except per GEO amounts) |
|
2019 |
|
2018 |
|
||
|
Total costs of sales |
|
$ |
93.3 |
|
$ |
90.8 |
|
|
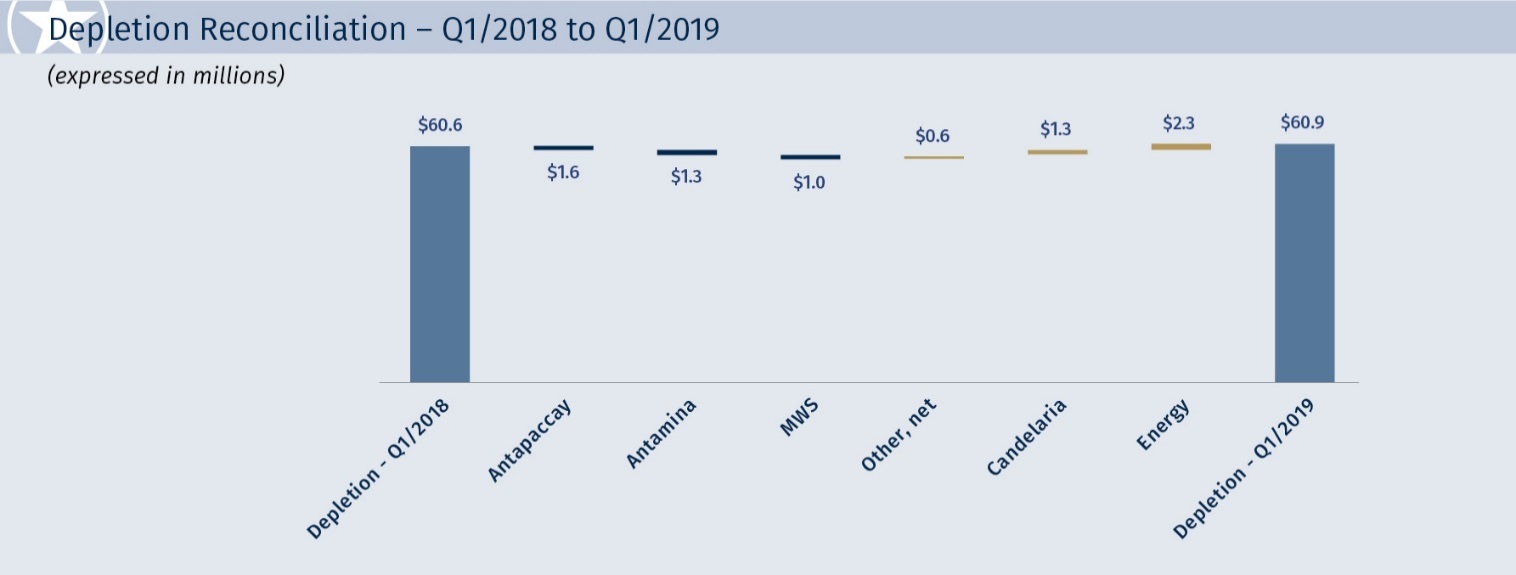
Depletion and depletion |
|
|
(60.9) |
|
|
(60.6) |
|
|
Energy operating costs |
|
|
(1.4) |
|
|
(1.0) |
|
|
Non-cash costs of sales |
|
|
— |
|
|
(1.9) |
|
|
Cash Costs attributable to GEO production |
|
$ |
31.0 |
|
$ |
27.3 |
|
|
GEOs, excluding prepaid ounces |
|
|
122,049 |
|
|
113,504 |
|
|
Cash Costs per GEO |
|
$ |
254 |
|
$ |
241 |
|
|
|
|
|
For the three months ended |
|
||||
|
|
|
|
March 31, |
|
||||
|
(expressed in millions, except per share amounts) |
|
|
2019 |
|
2018 |
|
||
|
Net Income |
|
|
$ |
65.2 |
|
$ |
64.6 |
|
|
Income tax expense |
|
|
|
13.0 |
|
|
13.5 |
|
|
Finance expenses |
|
|
|
2.5 |
|
|
0.9 |
|
|
Finance income |
|
|
|
(0.7) |
|
|
(1.0) |
|
|
Depletion and depreciation |
|
|
|
60.9 |
|
|
60.6 |
|
|
Non-cash costs of sales |
|
|
|
— |
|
|
1.9 |
|
|
Foreign exchange (gains)/losses and other (income)/expenses |
|
|
|
— |
|
|
(0.6) |
|
|
Adjusted EBITDA |
|
|
$ |
140.9 |
|
$ |
139.9 |
|
|
Basic weighted average shares outstanding |
|
|
|
187.0 |
|
|
185.9 |
|
|
Adjusted EBITDA per share |
|
|
$ |
0.75 |
|
$ |
0.75 |
|
|
|
|
For the three months ended |
|
||||
|
|
|
March 31, |
|
||||
|
(expressed in millions, except per share amounts) |
|
2019 |
|
2018 |
|
||
|
Net Income |
|
$ |
65.2 |
|
$ |
64.6 |
|
|
Foreign exchange (gains)/losses and other (income)/expenses |
|
|
— |
|
|
(0.6) |
|
|
Tax effect of adjustments |
|
|
— |
|
|
(0.1) |
|
|
Adjusted Net Income |
|
$ |
65.2 |
|
$ |
63.9 |
|
|
Basic weighted average shares outstanding |
|
|
187.0 |
|
|
185.9 |
|
|
Adjusted Net Income per share |
|
$ |
0.35 |
|
$ |
0.34 |
|
7
FRANCO-NEVADA CORPORATION
CONSOLIDATED STATEMENTS OF FINANCIAL POSITION
(unaudited, in millions of U.S. dollars)
|
|
|
At March 31, |
|
|
At December 31, |
|
||
|
|
|
2019 |
|
|
2018 |
|
||
|
ASSETS |
|
|
|
|
|
|
|
|
|
Cash and cash equivalents (Note 4) |
|
$ |
72.6 |
|
|
$ |
69.7 |
|
|
Receivables |
|
|
68.6 |
|
|
|
75.5 |
|
|
Prepaid expenses and other (Note 6) |
|
|
31.7 |
|
|
|
33.3 |
|
|
Current assets |
|
$ |
172.9 |
|
|
$ |
178.5 |
|
|
|
|
|
|
|
|
|
|
|
|
Royalty, stream and working interests, net (Note 7) |
|
$ |
4,604.4 |
|
|
$ |
4,555.6 |
|
|
Investments (Note 5) |
|
|
197.6 |
|
|
|
169.7 |
|
|
Deferred income tax assets |
|
|
16.8 |
|
|
|
17.3 |
|
|
Other assets (Note 8) |
|
|
13.4 |
|
|
|
10.7 |
|
|
Total assets |
|
$ |
5,005.1 |
|
|
$ |
4,931.8 |
|
|
|
|
|
|
|
|
|
|
|
|
LIABILITIES |
|
|
|
|
|
|
|
|
|
Accounts payable and accrued liabilities |
|
$ |
36.9 |
|
|
$ |
23.6 |
|
|
Current income tax liabilities |
|
|
4.9 |
|
|
|
1.4 |
|
|
Current liabilities |
|
$ |
41.8 |
|
|
$ |
25.0 |
|
|
|
|
|
|
|
|
|
|
|
|
Lease liabilities |
|
$ |
2.8 |
|
|
$ |
— |
|
|
Debt (Note 9) |
|
|
157.2 |
|
|
|
207.6 |
|
|
Deferred income tax liabilities |
|
|
74.8 |
|
|
|
67.3 |
|
|
Total liabilities |
|
$ |
276.6 |
|
|
$ |
299.9 |
|
|
|
|
|
|
|
|
|
|
|
|
SHAREHOLDERS’ EQUITY (Note 15) |
|
|
|
|
|
|
|
|
|
Share capital |
|
$ |
5,196.5 |
|
|
$ |
5,158.3 |
|
|
Contributed surplus |
|
|
16.8 |
|
|
|
15.6 |
|
|
Deficit |
|
|
(304.6) |
|
|
|
(321.7) |
|
|
Accumulated other comprehensive loss |
|
|
(180.2) |
|
|
|
(220.3) |
|
|
Total shareholders’ equity |
|
$ |
4,728.5 |
|
|
|
4,631.9 |
|
|
Total liabilities and shareholders’ equity |
|
$ |
5,005.1 |
|
|
$ |
4,931.8 |
|
|
|
|
|
|
|
|
|
|
|
|
|
|
|
|
|
|
|
|
|
|
Contingencies (Note 19) |
|
|
|
|
|
|
|
|
|
Subsequent events (Note 20) |
|
|
|
|
|
|
|
|
The accompanying notes are an integral part of these consolidated financial statements and can be found in our Q1/2019 Report available on our website
8
FRANCO-NEVADA CORPORATION
CONSOLIDATED STATEMENTS OF INCOME AND COMPREHENSIVE INCOME
(unaudited, in millions of U.S. dollars, except per share amounts)
|
|
|
For the three months ended |
|
|||||
|
|
|
March 31, |
|
|||||
|
|
|
2019 |
|
|
2018 |
|
||
|
Revenue (Note 10) |
|
$ |
179.8 |
|
|
$ |
173.1 |
|
|
|
|
|
|
|
|
|
|
|
|
Cost of sales |
|
|
|
|
|
|
|
|
|
Costs of sales (Note 11) |
|
$ |
32.4 |
|
|
$ |
30.2 |
|
|
Depletion and depreciation |
|
|
60.9 |
|
|
|
60.6 |
|
|
Total costs of sales |
|
$ |
93.3 |
|
|
$ |
90.8 |
|
|
Gross profit |
|
$ |
86.5 |
|
|
$ |
82.3 |
|
|
|
|
|
|
|
|
|
|
|
|
Other operating expenses (income) |
|
|
|
|
|
|
|
|
|
General and administrative expenses |
|
$ |
6.9 |
|
|
$ |
5.2 |
|
|
Gain on sale of gold bullion |
|
|
(0.4) |
|
|
|
(0.3) |
|
|
Total other operating expenses (income) |
|
$ |
6.5 |
|
|
$ |
4.9 |
|
|
Operating income |
|
$ |
80.0 |
|
|
$ |
77.4 |
|
|
Foreign exchange gain and other income (expenses) |
|
$ |
— |
|
|
$ |
0.6 |
|
|
Income before finance items and income taxes |
|
$ |
80.0 |
|
|
$ |
78.0 |
|
|
|
|
|
|
|
|
|
|
|
|
Finance items (Note 13) |
|
|
|
|
|
|
|
|
|
Finance income |
|
$ |
0.7 |
|
|
$ |
1.0 |
|
|
Finance expenses |
|
|
(2.5) |
|
|
|
(0.9) |
|
|
Net income before income taxes |
|
$ |
78.2 |
|
|
$ |
78.1 |
|
|
|
|
|
|
|
|
|
|
|
|
Income tax expense (Note 14) |
|
|
13.0 |
|
|
|
13.5 |
|
|
Net income |
|
$ |
65.2 |
|
|
$ |
64.6 |
|
|
|
|
|
|
|
|
|
|
|
|
Earnings per share (Note 16) |
|
|
|
|
|
|
|
|
|
Basic |
|
$ |
0.35 |
|
|
$ |
0.35 |
|
|
Diluted |
|
$ |
0.35 |
|
|
$ |
0.35 |
|
|
Weighted average number of shares outstanding (Note 16) |
|
|
|
|
|
|
|
|
|
Basic |
|
|
187.0 |
|
|
|
185.9 |
|
|
Diluted |
|
|
187.3 |
|
|
|
186.2 |
|
|
|
|
|
|
|
|
|
|
|
|
|
|
|
|
|
|
|
|
|
|
Other comprehensive income (loss) |
|
|
|
|
|
|
|
|
|
|
|
|
|
|
|
|
|
|
|
Items that may be reclassified subsequently to profit and loss: |
|
|
|
|
|
|
|
|
|
Currency translation adjustment |
|
$ |
14.0 |
|
|
$ |
(23.2) |
|
|
|
|
|
|
|
|
|
|
|
|
Items that will not be reclassified subsequently to profit and loss: |
|
|
|
|
|
|
|
|
|
Changes in the fair value of equity investments at fair value through other |
|
|
|
|
|
|
|
|
|
comprehensive income ("FVTOCI"), net of income tax (Note 5) |
|
|
22.9 |
|
|
|
(25.7) |
|
|
Other comprehensive income (loss) |
|
$ |
36.9 |
|
|
$ |
(48.9) |
|
|
|
|
|
|
|
|
|
|
|
|
Comprehensive income |
|
$ |
102.1 |
|
|
$ |
15.7 |
|
The accompanying notes are an integral part of these consolidated financial statements and can be found in our Q1/2019 Report available on our website
9
FRANCO-NEVADA CORPORATION
CONSOLIDATED STATEMENTS OF CASH FLOWS
(unaudited, in millions of U.S. dollars)
|
|
|
For the three months ended |
|
|||||
|
|
|
March 31, |
|
|||||
|
|
|
2019 |
|
|
2018 |
|
||
|
Cash flows from operating activities |
|
|
|
|
|
|
|
|
|
Net income |
|
$ |
65.2 |
|
|
$ |
64.6 |
|
|
Adjustments to reconcile net income to net cash provided by operating activities: |
|
|
|
|
|
|
|
|
|
Depletion and depreciation |
|
|
60.9 |
|
|
|
60.6 |
|
|
Non-cash costs of sales |
|
|
— |
|
|
|
1.9 |
|
|
Share-based payments |
|
|
1.4 |
|
|
|
1.2 |
|
|
Unrealized foreign exchange gain |
|
|
(0.1) |
|
|
|
— |
|
|
Deferred income tax expense |
|
|
3.3 |
|
|
|
6.1 |
|
|
Other non-cash items |
|
|
0.3 |
|
|
|
(0.3) |
|
|
Acquisition of gold bullion |
|
|
(7.6) |
|
|
|
(6.4) |
|
|
Proceeds from sale of gold bullion |
|
|
11.2 |
|
|
|
5.6 |
|
|
Operating cash flows before changes in non-cash working capital |
|
$ |
134.6 |
|
|
$ |
133.3 |
|
|
Changes in non-cash working capital: |
|
|
|
|
|
|
|
|
|
Decrease in receivables |
|
$ |
6.9 |
|
|
$ |
4.5 |
|
|
Increase in prepaid expenses and other |
|
|
(1.5) |
|
|
|
(0.7) |
|
|
Increase in current liabilities |
|
|
3.6 |
|
|
|
0.4 |
|
|
Net cash provided by operating activities |
|
$ |
143.6 |
|
|
$ |
137.5 |
|
|
|
|
|
|
|
|
|
|
|
|
Cash flows from investing activities |
|
|
|
|
|
|
|
|
|
Acquisition of royalty, stream and working interests |
|
$ |
(57.3) |
|
|
$ |
(523.0) |
|
|
Acquisition of energy well equipment |
|
|
(0.3) |
|
|
|
(0.2) |
|
|
Proceeds from sale of investments |
|
|
1.3 |
|
|
|
— |
|
|
Net cash used in investing activities |
|
$ |
(56.3) |
|
|
$ |
(523.2) |
|
|
|
|
|
|
|
|
|
|
|
|
Cash flows from financing activities |
|
|
|
|
|
|
|
|
|
Repayment of credit facilities |
|
$ |
(50.0) |
|
|
$ |
— |
|
|
Credit facility amendment costs |
|
|
(0.8) |
|
|
|
(0.5) |
|
|
Payment of dividends |
|
|
(34.9) |
|
|
|
(35.6) |
|
|
Proceeds from exercise of stock options |
|
|
1.0 |
|
|
|
— |
|
|
Net cash used in financing activities |
|
$ |
(84.7) |
|
|
$ |
(36.1) |
|
|
Effect of exchange rate changes on cash and cash equivalents |
|
$ |
0.3 |
|
|
$ |
(1.6) |
|
|
Net change in cash and cash equivalents |
|
$ |
2.9 |
|
|
$ |
(423.4) |
|
|
Cash and cash equivalents at beginning of period |
|
$ |
69.7 |
|
|
$ |
511.1 |
|
|
Cash and cash equivalents at end of period |
|
$ |
72.6 |
|
|
$ |
87.7 |
|
|
|
|
|
|
|
|
|
|
|
|
Supplemental cash flow information: |
|
|
|
|
|
|
|
|
|
Cash paid for interest expense and loan standby fees |
|
$ |
2.2 |
|
|
$ |
0.6 |
|
|
Income taxes paid |
|
$ |
7.0 |
|
|
$ |
7.7 |
|
The accompanying notes are an integral part of these consolidated financial statements and can be found in our Q1/2019 Report available on our website
10