UNITED STATES
SECURITIES AND EXCHANGE COMMISSION
Washington, D.C. 20549
FORM N-CSRS
CERTIFIED SHAREHOLDER REPORT OF
REGISTERED MANAGEMENT INVESTMENT COMPANIES
Investment Company Act file number: 811-22311
Schwab Strategic Trust – Schwab Fixed-Income ETFs
(Exact name of registrant as specified in charter)
211 Main Street, San Francisco, California 94105
(Address of principal executive offices) (Zip code)
Jonathan de St. Paer
Schwab Strategic Trust – Schwab Fixed-Income ETFs
211 Main Street, San Francisco, California 94105
(Name and address of agent for service)
Registrant’s telephone number, including area code: (415) 636-7000
Date of fiscal year end: December 31
Date of reporting period: June 30, 2021
| Item 1: | Report(s) to Shareholders. |

| Schwab U.S. TIPS ETF | SCHP |
| Schwab Short-Term U.S. Treasury ETF | SCHO |
| Schwab Intermediate-Term U.S. Treasury ETF | SCHR |
| Schwab Long-Term U.S. Treasury ETF | SCHQ |
| Schwab U.S. Aggregate Bond ETF | SCHZ |
| Schwab 1-5 Year Corporate Bond ETF | SCHJ |
| Schwab 5-10 Year Corporate Bond ETF | SCHI |
| 1 | ETF performance must be shown based on both a Market Price and a Net Asset Value (NAV) basis. The fund’s per share net asset value (NAV) is the value of one share of the fund. NAV is calculated by taking the fund’s total assets (including the fair value of securities owned), subtracting liabilities, and dividing by the number of shares outstanding. The NAV Return is based on the NAV of the fund, and the Market Price Return is based on the market price per share of the fund. The price used to calculate market return (Market Price) is determined using the Official Closing Price of the primary stock exchange (generally, 4:00 p.m. Eastern time) and may not represent the returns you would receive if shares were traded at other times. Market Price and NAV returns assume that dividends and capital gain distributions have been reinvested in the fund at Market Price and NAV, respectively. |
| 2 | Source for category information: Morningstar, Inc. The Morningstar Category return represents all passively- and actively-managed ETFs within the category as of the report date. |
 |
Matthew Hastings, CFA, Managing Director and Head of Taxable Bond Strategies, leads the portfolio management team for the Schwab Fixed-Income ETFs and Schwab Taxable Bond Funds. He also has overall responsibility for all aspects of the management of the funds. Prior to joining CSIM in 1999, Mr. Hastings was in fixed-income sales and trading at Lehman Brothers. He has worked in the fixed-income securities industry since 1996. |
 |
Steven Hung, Senior Portfolio Manager, is responsible for the day-to-day co-management of the Schwab U.S. Aggregate Bond ETF, Schwab 1-5 Year Corporate Bond ETF and Schwab 5-10 Year Corporate Bond ETF. His primary focus is corporate bonds. Prior to joining CSIM in 1999, Mr. Hung was an associate in Schwab’s management training program for nine months. In that role, he worked as a clerk on the options trading floor of the Pacific Coast Stock Exchange. |
 |
Mark McKissick, CFA, Senior Portfolio Manager, is responsible for the day-to-day co-management of the Schwab U.S. TIPS ETF, Schwab Short-Term U.S. Treasury ETF, Schwab Intermediate-Term U.S. Treasury ETF, Schwab Long-Term U.S. Treasury ETF and Schwab U.S. Aggregate Bond ETF. Prior to joining Schwab in 2016, Mr. McKissick worked at Denver Investments for 17 years, most recently as a director of fixed income and portfolio manager. In this role he co-managed multiple bond strategies, as well as oversaw the firm’s fixed-income business including the investment process, client service and other administrative functions. He also served as a credit/security analyst from 1999 to 2005. Prior to that, he worked as a senior research analyst with Hotchkis & Wiley, a portfolio manager at Payden & Rygel, and a vice president in fixed income at Salomon Brothers. |
 |
Alfonso Portillo, Jr., Senior Portfolio Manager, is responsible for the day-to-day co-management of the Schwab U.S. Aggregate Bond ETF. His primary focus is securitized products. Prior to joining Schwab in 2007, Mr. Portillo worked for ten years at Pacific Investment Management Company, most recently as a vice president and member of the mortgage- and asset-backed portfolio management team. He has worked in fixed-income asset management since 1996. |
| Fund and Inception Date | 6 Months | 1 Year | 5 Years | 10 Years |
| Fund: Schwab U.S. TIPS ETF (8/5/2010) | ||||
| Market Price Return2 | 1.57% | 6.25% | 4.08% | 3.31% |
| NAV Return2 | 1.66% | 6.39% | 4.11% | 3.32% |
| Bloomberg Barclays US Treasury Inflation-Linked Bond Index (Series-L)SM | 1.73% | 6.51% | 4.17% | 3.40% |
| ETF Category: Morningstar Inflation-Protected Bond3 | 2.01% | 7.04% | 3.88% | 2.85% |
| Fund Expense Ratio4: 0.05% | ||||
| Weighted Average Maturity7 | 8.0 Yrs |
| Weighted Average Duration7 | 7.5 Yrs |
| 1 | Performance does not reflect the deduction of taxes that a shareholder would pay on fund distributions or on the redemption or sale of fund shares. |
| 2 | ETF performance must be shown based on both a Market Price and a Net Asset Value (NAV) basis. The fund’s per share net asset value (NAV) is the value of one share of the fund. NAV is calculated by taking the fund’s total assets (including the fair value of securities owned), subtracting liabilities, and dividing by the number of shares outstanding. The NAV Return is based on the NAV of the fund, and the Market Price Return is based on the market price per share of the fund. The price used to calculate market return (Market Price) is determined using the Official Closing Price of the primary stock exchange (generally, 4:00 p.m. Eastern time) and may not represent the returns you would receive if shares were traded at other times. NAV is used as a proxy for purposes of calculating Market Price Return on inception date. Market Price and NAV returns assume that dividends and capital gain distributions have been reinvested in the fund at Market Price and NAV, respectively. |
| 3 | Source for category information: Morningstar, Inc. The Morningstar Category return represents all passively- and actively-managed ETFs within the category as of the report date. |
| 4 | As stated in the prospectus. |
| 5 | The percentage may differ from the Portfolio Holdings because the above calculation is based on a percentage of total investments, whereas the calculation in the Portfolio Holdings is based on a percentage of net assets. |
| 6 | Less than 0.05%. |
| 7 | See Glossary for definitions of maturity and duration. |
| Fund and Inception Date | 6 Months | 1 Year | 5 Years | 10 Years |
| Fund: Schwab Short-Term U.S. Treasury ETF (8/5/2010) | ||||
| Market Price Return2 | -0.11% | 0.00% | 1.54% | 1.13% |
| NAV Return2 | -0.11% | 0.00% | 1.54% | 1.13% |
| Bloomberg Barclays US Treasury 1-3 Year Index | -0.09% | 0.05% | 1.60% | 1.21% |
| ETF Category: Morningstar Short Government3 | -0.40% | -0.08% | 1.45% | 1.19% |
| Fund Expense Ratio4: 0.05% | ||||
| Weighted Average Maturity6 | 2.0 Yrs |
| Weighted Average Duration6 | 2.0 Yrs |
| 1 | Performance does not reflect the deduction of taxes that a shareholder would pay on fund distributions or on the redemption or sale of fund shares. |
| 2 | ETF performance must be shown based on both a Market Price and a Net Asset Value (NAV) basis. The fund’s per share net asset value (NAV) is the value of one share of the fund. NAV is calculated by taking the fund’s total assets (including the fair value of securities owned), subtracting liabilities, and dividing by the number of shares outstanding. The NAV Return is based on the NAV of the fund, and the Market Price Return is based on the market price per share of the fund. The price used to calculate market return (Market Price) is determined using the Official Closing Price of the primary stock exchange (generally, 4:00 p.m. Eastern time) and may not represent the returns you would receive if shares were traded at other times. NAV is used as a proxy for purposes of calculating Market Price Return on inception date. Market Price and NAV returns assume that dividends and capital gain distributions have been reinvested in the fund at Market Price and NAV, respectively. |
| 3 | Source for category information: Morningstar, Inc. The Morningstar Category return represents all passively- and actively-managed ETFs within the category as of the report date. |
| 4 | As stated in the prospectus. |
| 5 | The percentage may differ from the Portfolio Holdings because the above calculation is based on a percentage of total investments, whereas the calculation in the Portfolio Holdings is based on a percentage of net assets. |
| 6 | See Glossary for definitions of maturity and duration. |
| Fund and Inception Date | 6 Months | 1 Year | 5 Years | 10 Years |
| Fund: Schwab Intermediate-Term U.S. Treasury ETF (8/5/2010) | ||||
| Market Price Return2 | -1.89% | -2.05% | 2.13% | 2.79% |
| NAV Return2 | -1.89% | -2.10% | 2.14% | 2.79% |
| Bloomberg Barclays US Treasury 3-10 Year Index | -1.87% | -2.04% | 2.20% | 2.88% |
| ETF Category: Morningstar Intermediate Government3 | -1.42% | -1.19% | 1.85% | 2.30% |
| Fund Expense Ratio4: 0.05% | ||||

| Weighted Average Maturity7 | 5.7 Yrs |
| Weighted Average Duration7 | 5.4 Yrs |
| 1 | Performance does not reflect the deduction of taxes that a shareholder would pay on fund distributions or on the redemption or sale of fund shares. |
| 2 | ETF performance must be shown based on both a Market Price and a Net Asset Value (NAV) basis. The fund’s per share net asset value (NAV) is the value of one share of the fund. NAV is calculated by taking the fund’s total assets (including the fair value of securities owned), subtracting liabilities, and dividing by the number of shares outstanding. The NAV Return is based on the NAV of the fund, and the Market Price Return is based on the market price per share of the fund. The price used to calculate market return (Market Price) is determined using the Official Closing Price of the primary stock exchange (generally, 4:00 p.m. Eastern time) and may not represent the returns you would receive if shares were traded at other times. NAV is used as a proxy for purposes of calculating Market Price Return on inception date. Market Price and NAV returns assume that dividends and capital gain distributions have been reinvested in the fund at Market Price and NAV, respectively. |
| 3 | Source for category information: Morningstar, Inc. The Morningstar Category return represents all passively- and actively-managed ETFs within the category as of the report date. |
| 4 | As stated in the prospectus. |
| 5 | The percentage may differ from the Portfolio Holdings because the above calculation is based on a percentage of total investments, whereas the calculation in the Portfolio Holdings is based on a percentage of net assets. |
| 6 | Less than 0.05%. |
| 7 | See Glossary for definitions of maturity and duration. |
| Fund and Inception Date | 6 Months | 1 Year | Since Inception* |
| Fund: Schwab Long-Term U.S. Treasury ETF (10/10/2019) | |||
| Market Price Return2 | -7.81% | -10.61% | 1.69% |
| NAV Return2 | -7.94% | -10.62% | 1.72% |
| Bloomberg Barclays US Long Treasury Index | -7.92% | -10.58% | 1.76% |
| ETF Category: Morningstar Long Government3 | -7.22% | -10.08% | N/A |
| Fund Expense Ratio4: 0.05% | |||

| Weighted Average Maturity7 | 24.2 Yrs |
| Weighted Average Duration7 | 18.0 Yrs |
| * | Inception (10/10/19) represents the date that the shares began trading in the secondary market. |
| 1 | Performance does not reflect the deduction of taxes that a shareholder would pay on fund distributions or on the redemption or sale of fund shares. |
| 2 | ETF performance must be shown based on both a Market Price and a Net Asset Value (NAV) basis. The fund’s per share net asset value (NAV) is the value of one share of the fund. NAV is calculated by taking the fund’s total assets (including the fair value of securities owned), subtracting liabilities, and dividing by the number of shares outstanding. The NAV Return is based on the NAV of the fund, and the Market Price Return is based on the market price per share of the fund. The price used to calculate market return (Market Price) is determined using the Official Closing Price of the primary stock exchange (generally, 4:00 p.m. Eastern time) and may not represent the returns you would receive if shares were traded at other times. NAV is used as a proxy for purposes of calculating Market Price Return on inception date. Market Price and NAV returns assume that dividends and capital gain distributions have been reinvested in the fund at Market Price and NAV, respectively. |
| 3 | Source for category information: Morningstar, Inc. The Morningstar Category return represents all passively- and actively-managed ETFs within the category as of the report date. |
| 4 | As stated in the prospectus. |
| 5 | The percentage may differ from the Portfolio Holdings because the above calculation is based on a percentage of total investments, whereas the calculation in the Portfolio Holdings is based on a percentage of net assets. |
| 6 | Less than 0.05%. |
| 7 | See Glossary for definitions of maturity and duration. |
| Fund and Inception Date | 6 Months | 1 Year | 5 Years | Since Inception* |
| Fund: Schwab U.S. Aggregate Bond ETF (7/14/2011) | ||||
| Market Price Return2 | -1.65% | -0.68% | 2.90% | 3.18% |
| NAV Return2 | -1.69% | -0.47% | 2.93% | 3.18% |
| Bloomberg Barclays US Aggregate Bond Index | -1.60% | -0.33% | 3.03% | 3.29% |
| ETF Category: Morningstar Intermediate Core Bond3 | -1.22% | 0.77% | 3.02% | N/A |
| Fund Expense Ratio4: 0.04% | ||||

| Weighted Average Maturity7 | 8.4 Yrs |
| Weighted Average Duration7 | 6.7 Yrs |
| * | Inception (7/14/11) represents the date that the shares began trading in the secondary market. |
| 1 | Performance does not reflect the deduction of taxes that a shareholder would pay on fund distributions or on the redemption or sale of fund shares. |
| 2 | ETF performance must be shown based on both a Market Price and a Net Asset Value (NAV) basis. The fund’s per share net asset value (NAV) is the value of one share of the fund. NAV is calculated by taking the fund’s total assets (including the fair value of securities owned), subtracting liabilities, and dividing by the number of shares outstanding. The NAV Return is based on the NAV of the fund, and the Market Price Return is based on the market price per share of the fund. The price used to calculate market return (Market Price) is determined using the Official Closing Price of the primary stock exchange (generally, 4:00 p.m. Eastern time) and may not represent the returns you would receive if shares were traded at other times. NAV is used as a proxy for purposes of calculating Market Price Return on inception date. Market Price and NAV returns assume that dividends and capital gain distributions have been reinvested in the fund at Market Price and NAV, respectively. |
| 3 | Source for category information: Morningstar, Inc. The Morningstar Category return represents all passively- and actively-managed ETFs within the category as of the report date. |
| 4 | As stated in the prospectus. |
| 5 | The percentage may differ from the Portfolio Holdings because the above calculation is based on a percentage of total investments, whereas the calculation in the Portfolio Holdings is based on a percentage of net assets. |
| 6 | The fund may seek to obtain exposure to U.S. agency mortgage pass-through securities, in part or in full, through the use of “to-be-announced” or “TBA” transactions, which are standardized contracts for future delivery of mortgage pass-through securities in which the exact mortgage pools to be delivered are not specified until a few days prior to settlement. These transactions represented approximately 1.0% of total investments on June 30, 2021. |
| 7 | See Glossary for definitions of maturity and duration. |
| Fund and Inception Date | 6 Months | 1 Year | Since Inception* |
| Fund: Schwab 1-5 Year Corporate Bond ETF (10/10/2019) | |||
| Market Price Return2 | 0.00% | 1.69% | 3.34% |
| NAV Return2 | -0.02% | 1.93% | 3.33% |
| Bloomberg Barclays US 1-5 Year Corporate Bond Index | 0.10% | 2.17% | 3.50% |
| ETF Category: Morningstar Short-Term Bond3 | 0.44% | 2.65% | N/A |
| Fund Expense Ratio4: 0.05% | |||
| Weighted Average Maturity6 | 3.0 Yrs |
| Weighted Average Duration6 | 2.8 Yrs |
| * | Inception (10/10/19) represents the date that the shares began trading in the secondary market. |
| 1 | Performance does not reflect the deduction of taxes that a shareholder would pay on fund distributions or on the redemption or sale of fund shares. |
| 2 | ETF performance must be shown based on both a Market Price and a Net Asset Value (NAV) basis. The fund’s per share net asset value (NAV) is the value of one share of the fund. NAV is calculated by taking the fund’s total assets (including the fair value of securities owned), subtracting liabilities, and dividing by the number of shares outstanding. The NAV Return is based on the NAV of the fund, and the Market Price Return is based on the market price per share of the fund. The price used to calculate market return (Market Price) is determined using the Official Closing Price of the primary stock exchange (generally, 4:00 p.m. Eastern time) and may not represent the returns you would receive if shares were traded at other times. NAV is used as a proxy for purposes of calculating Market Price Return on inception date. Market Price and NAV returns assume that dividends and capital gain distributions have been reinvested in the fund at Market Price and NAV, respectively. |
| 3 | Source for category information: Morningstar, Inc. The Morningstar Category return represents all passively- and actively-managed ETFs within the category as of the report date. |
| 4 | As stated in the prospectus. |
| 5 | The percentage may differ from the Portfolio Holdings because the above calculation is based on a percentage of total investments, excluding derivatives, whereas the calculation in the Portfolio Holdings is based on a percentage of net assets. |
| 6 | See Glossary for definitions of maturity and duration. |
| Fund and Inception Date | 6 Months | 1 Year | Since Inception* |
| Fund: Schwab 5-10 Year Corporate Bond ETF (10/10/2019) | |||
| Market Price Return2 | -1.26% | 2.60% | 5.17% |
| NAV Return2 | -1.31% | 2.78% | 5.18% |
| Bloomberg Barclays US 5-10 Year Corporate Bond Index | -1.15% | 3.02% | 5.29% |
| ETF Category: Morningstar Corporate Bond3 | -0.67% | 4.42% | N/A |
| Fund Expense Ratio4: 0.05% | |||
| Weighted Average Maturity6 | 7.5 Yrs |
| Weighted Average Duration6 | 6.5 Yrs |
| * | Inception (10/10/19) represents the date that the shares began trading in the secondary market. |
| 1 | Performance does not reflect the deduction of taxes that a shareholder would pay on fund distributions or on the redemption or sale of fund shares. |
| 2 | ETF performance must be shown based on both a Market Price and a Net Asset Value (NAV) basis. The fund’s per share net asset value (NAV) is the value of one share of the fund. NAV is calculated by taking the fund’s total assets (including the fair value of securities owned), subtracting liabilities, and dividing by the number of shares outstanding. The NAV Return is based on the NAV of the fund, and the Market Price Return is based on the market price per share of the fund. The price used to calculate market return (Market Price) is determined using the Official Closing Price of the primary stock exchange (generally, 4:00 p.m. Eastern time) and may not represent the returns you would receive if shares were traded at other times. NAV is used as a proxy for purposes of calculating Market Price Return on inception date. Market Price and NAV returns assume that dividends and capital gain distributions have been reinvested in the fund at Market Price and NAV, respectively. |
| 3 | Source for category information: Morningstar, Inc. The Morningstar Category return represents all passively- and actively-managed ETFs within the category as of the report date. |
| 4 | As stated in the prospectus. |
| 5 | The percentage may differ from the Portfolio Holdings because the above calculation is based on a percentage of total investments, excluding derivatives, whereas the calculation in the Portfolio Holdings is based on a percentage of net assets. |
| 6 | See Glossary for definitions of maturity and duration. |
| Expense
Ratio (Annualized)1 |
Beginning
Account Value at 1/1/21 |
Ending
Account Value (Net of Expenses) at 6/30/21 |
Expenses
Paid During Period 1/1/21-6/30/212 | |
| Schwab U.S. TIPS ETF | ||||
| Actual Return | 0.05% | $1,000.00 | $1,016.60 | $0.25 |
| Hypothetical 5% Return | 0.05% | $1,000.00 | $1,024.55 | $0.25 |
| Schwab Short-Term U.S. Treasury ETF | ||||
| Actual Return | 0.05% | $1,000.00 | $ 998.90 | $0.25 |
| Hypothetical 5% Return | 0.05% | $1,000.00 | $1,024.55 | $0.25 |
| Schwab Intermediate-Term U.S. Treasury ETF | ||||
| Actual Return | 0.05% | $1,000.00 | $ 981.10 | $0.25 |
| Hypothetical 5% Return | 0.05% | $1,000.00 | $1,024.55 | $0.25 |
| Schwab Long-Term U.S. Treasury ETF | ||||
| Actual Return | 0.05% | $1,000.00 | $ 920.60 | $0.24 |
| Hypothetical 5% Return | 0.05% | $1,000.00 | $1,024.55 | $0.25 |
| Schwab U.S. Aggregate Bond ETF | ||||
| Actual Return | 0.04% | $1,000.00 | $ 983.10 | $0.20 |
| Hypothetical 5% Return | 0.04% | $1,000.00 | $1,024.60 | $0.20 |
| Schwab 1-5 Year Corporate Bond ETF | ||||
| Actual Return | 0.05% | $1,000.00 | $ 999.80 | $0.25 |
| Hypothetical 5% Return | 0.05% | $1,000.00 | $1,024.55 | $0.25 |
| Schwab 5-10 Year Corporate Bond ETF | ||||
| Actual Return | 0.05% | $1,000.00 | $ 986.90 | $0.25 |
| Hypothetical 5% Return | 0.05% | $1,000.00 | $1,024.55 | $0.25 |
| 1 | Based on the most recent six-month expense ratio. |
| 2 | Expenses for each fund are equal to its annualized expense ratio, multiplied by the average account value over the period, multiplied by 181 days of the period, and divided by 365 days of the fiscal year. |
| 1/1/21–
6/30/21* |
1/1/20–
12/31/20 |
1/1/19–
12/31/19 |
1/1/18–
12/31/18 |
1/1/17–
12/31/17 |
1/1/16–
12/31/16 | |
| Per-Share Data | ||||||
| Net asset value at beginning of period | $62.06 | $56.57 | $53.27 | $55.39 | $54.84 | $53.15 |
| Income (loss) from investment operations: | ||||||
| Net investment income (loss)1 | 1.28 | 0.81 | 1.21 | 1.51 | 1.17 | 0.99 |
| Net realized and unrealized gains (losses) | (0.26) | 5.37 | 3.23 | (2.23) | 0.43 | 1.46 |
| Total from investment operations | 1.02 | 6.18 | 4.44 | (0.72) | 1.60 | 2.45 |
| Less distributions: | ||||||
| Distributions from net investment income | (0.54) | (0.69) | (1.14) | (1.40) | (1.05) | (0.76) |
| Net asset value at end of period | $62.54 | $62.06 | $56.57 | $53.27 | $55.39 | $54.84 |
| Total return | 1.66% 2 | 10.94% | 8.36% | (1.31%) | 2.95% | 4.60% |
| Ratios/Supplemental Data | ||||||
| Ratios to average net assets: | ||||||
| Total expenses | 0.05% 3 | 0.05% | 0.05% | 0.05% | 0.05% 4 | 0.07% |
| Net investment income (loss) | 4.17% 3 | 1.36% | 2.18% | 2.80% | 2.13% | 1.78% |
| Portfolio turnover rate5 | 10% 2 | 23% | 20% | 17% | 19% | 16% |
| Net assets, end of period (x 1,000) | $18,388,178 | $14,090,007 | $8,733,970 | $5,779,263 | $2,880,386 | $1,614,977 |
| * | Unaudited. |
| Description | Quoted
Prices in Active Markets for Identical Assets (Level 1) |
Other
Significant Observable Inputs (Level 2) |
Significant
Unobservable Inputs (Level 3) |
Total | |
| Assets | |||||
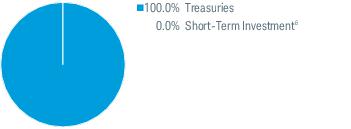
| Treasuries | $— | $18,348,254,220 | $— | $18,348,254,220 | |
| Short-Term Investment1 | 599,796 | — | — | 599,796 | |
| Total | $599,796 | $18,348,254,220 | $— | $18,348,854,016 |
| 1 | As categorized in the Portfolio Holdings. |
| Assets | ||
| Investments in securities, at value — unaffiliated (cost $17,609,395,712) | $18,348,854,016 | |
| Receivables: | ||
| Investments sold | 331,299,761 | |
| Interest | 40,906,171 | |
| Dividends | 263 | |
| Other assets | + | 6,859 |
| Total assets | 18,721,067,070 | |
| Liabilities | ||
| Payables: | ||
| Investments bought | 244,702,084 | |
| Management fees | 738,540 | |
| Fund shares redeemed | 87,441,629 | |
| Due to custodian | + | 6,858 |
| Total liabilities | 332,889,111 | |
| Net Assets | ||
| Total assets | 18,721,067,070 | |
| Total liabilities | – | 332,889,111 |
| Net assets | $18,388,177,959 | |
| Net Assets by Source | ||
| Capital received from investors | 17,314,760,781 | |
| Total distributable earnings | 1,073,417,178 | |
| Net Asset Value (NAV) | ||||
| Net Assets | ÷ | Shares
Outstanding |
= | NAV |
| $18,388,177,959 | 294,000,000 | $62.54 | ||
| Investment Income | ||
| Interest received from securities - unaffiliated | $341,152,050 | |
| Dividends received from securities - unaffiliated | + | 1,110 |
| Total investment income | 341,153,160 | |
| Expenses | ||
| Management fees | 4,042,624 | |
| Total expenses | – | 4,042,624 |
| Net investment income | 337,110,536 | |
| Realized and Unrealized Gains (Losses) | ||
| Net realized losses on sales of securities - unaffiliated | (10,387,445) | |
| Net realized gains on sales of in-kind securities - unaffiliated | + | 198,565,097 |
| Net realized gains | 188,177,652 | |
| Net change in unrealized appreciation (depreciation) on securities - unaffiliated | + | (208,447,596) |
| Net realized and unrealized losses | (20,269,944) | |
| Increase in net assets resulting from operations | $316,840,592 | |
| Operations | ||||
| 1/1/21-6/30/21 | 1/1/20-12/31/20 | |||
| Net investment income | $337,110,536 | $145,222,282 | ||
| Net realized gains | 188,177,652 | 163,539,483 | ||
| Net change in unrealized appreciation (depreciation) | + | (208,447,596) | 744,938,595 | |
| Increase in net assets resulting from operations | 316,840,592 | 1,053,700,360 | ||
| Distributions to Shareholders | ||||
| Total distributions | ($149,529,035) | ($145,346,920) | ||
| Transactions in Fund Shares | ||||||||
| 1/1/21-6/30/21 | 1/1/20-12/31/20 | |||||||
| SHARES | VALUE | SHARES | VALUE | |||||
| Shares sold | 107,100,000 | $6,618,430,738 | 117,700,000 | $7,091,983,560 | ||||
| Shares redeemed | + | (40,150,000) | (2,487,571,521) | (45,050,000) | (2,644,299,382) | |||
| Net transactions in fund shares | 66,950,000 | $4,130,859,217 | 72,650,000 | $4,447,684,178 | ||||
| Shares Outstanding and Net Assets | ||||||||
| 1/1/21-6/30/21 | 1/1/20-12/31/20 | |||||||
| SHARES | NET ASSETS | SHARES | NET ASSETS | |||||
| Beginning of period | 227,050,000 | $14,090,007,185 | 154,400,000 | $8,733,969,567 | ||||
| Total increase | + | 66,950,000 | 4,298,170,774 | 72,650,000 | 5,356,037,618 | |||
| End of period | 294,000,000 | $18,388,177,959 | 227,050,000 | $14,090,007,185 | ||||
| 1/1/21–
6/30/21* |
1/1/20–
12/31/20 |
1/1/19–
12/31/19 |
1/1/18–
12/31/18 |
1/1/17–
12/31/17 |
1/1/16–
12/31/16 | |
| Per-Share Data | ||||||
| Net asset value at beginning of period | $51.39 | $50.48 | $49.88 | $50.03 | $50.41 | $50.43 |
| Income (loss) from investment operations: | ||||||
| Net investment income (loss)1 | 0.13 | 0.65 | 1.14 | 0.94 | 0.57 | 0.42 |
| Net realized and unrealized gains (losses) | (0.19) | 0.91 | 0.60 | (0.20) 2 | (0.39) | (0.03) |
| Total from investment operations | (0.06) | 1.56 | 1.74 | 0.74 | 0.18 | 0.39 |
| Less distributions: | ||||||
| Distributions from net investment income | (0.11) | (0.65) | (1.14) | (0.89) | (0.56) | (0.41) |
| Net asset value at end of period | $51.22 | $51.39 | $50.48 | $49.88 | $50.03 | $50.41 |
| Total return | (0.11%) 3 | 3.11% | 3.53% | 1.50% | 0.35% | 0.78% |
| Ratios/Supplemental Data | ||||||
| Ratios to average net assets: | ||||||
| Total expenses | 0.05% 4 | 0.05% | 0.06% 5 | 0.06% | 0.06% | 0.08% 6 |
| Net investment income (loss) | 0.50% 4 | 1.26% | 2.27% | 1.89% | 1.13% | 0.83% |
| Portfolio turnover rate7 | 37% 3 | 74% | 77% | 65% | 65% | 66% |
| Net assets, end of period (x 1,000) | $9,067,783 | $7,507,924 | $5,262,952 | $4,254,630 | $2,181,398 | $1,414,092 |
| * | Unaudited. |
| Security | Number
of Shares |
Value ($) |
| Short-Term Investment 0.1% of net assets | ||
| Money Market Fund 0.1% | ||
| State Street Institutional U.S. Government Money Market Fund, Premier Class 0.03% (a) | 7,872,380 | 7,872,380 |
| Total Short-Term Investment | ||
| (Cost $7,872,380) | 7,872,380 | |
| (a) | The rate shown is the 7-day yield. |
| Description | Quoted
Prices in Active Markets for Identical Assets (Level 1) |
Other
Significant Observable Inputs (Level 2) |
Significant
Unobservable Inputs (Level 3) |
Total | |
| Assets | |||||
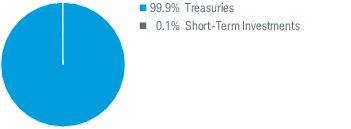
| Treasuries | $— | $9,041,134,908 | $— | $9,041,134,908 | |
| Short-Term Investment1 | 7,872,380 | — | — | 7,872,380 | |
| Total | $7,872,380 | $9,041,134,908 | $— | $9,049,007,288 |
| 1 | As categorized in the Portfolio Holdings. |
| Assets | ||
| Investments in securities, at value — unaffiliated (cost $9,034,336,069) | $9,049,007,288 | |
| Receivables: | ||
| Investments sold | 824,800,988 | |
| Fund shares sold | 343,101,688 | |
| Interest | 26,689,244 | |
| Dividends | + | 37 |
| Total assets | 10,243,599,245 | |
| Liabilities | ||
| Payables: | ||
| Investments bought | 834,857,332 | |
| Management fees | 373,477 | |
| Fund shares redeemed | + | 340,585,899 |
| Total liabilities | 1,175,816,708 | |
| Net Assets | ||
| Total assets | 10,243,599,245 | |
| Total liabilities | – | 1,175,816,708 |
| Net assets | $9,067,782,537 | |
| Net Assets by Source | ||
| Capital received from investors | 9,030,108,057 | |
| Total distributable earnings | 37,674,480 | |
| Net Asset Value (NAV) | ||||
| Net Assets | ÷ | Shares
Outstanding |
= | NAV |
| $9,067,782,537 | 177,050,000 | $51.22 | ||
| Investment Income | ||
| Interest received from securities - unaffiliated | $22,100,092 | |
| Dividends received from securities - unaffiliated | + | 427 |
| Total investment income | 22,100,519 | |
| Expenses | ||
| Management fees | 2,002,388 | |
| Total expenses | – | 2,002,388 |
| Net investment income | 20,098,131 | |
| Realized and Unrealized Gains (Losses) | ||
| Net realized losses on sales of securities - unaffiliated | (1,204,765) | |
| Net realized gains on sales of in-kind securities - unaffiliated | + | 23,981,461 |
| Net realized gains | 22,776,696 | |
| Net change in unrealized appreciation (depreciation) on securities - unaffiliated | + | (53,334,539) |
| Net realized and unrealized losses | (30,557,843) | |
| Decrease in net assets resulting from operations | ($10,459,712) | |
| Operations | ||||
| 1/1/21-6/30/21 | 1/1/20-12/31/20 | |||
| Net investment income | $20,098,131 | $88,084,006 | ||
| Net realized gains | 22,776,696 | 82,629,101 | ||
| Net change in unrealized appreciation (depreciation) | + | (53,334,539) | 22,483,068 | |
| Increase (decrease) in net assets resulting from operations | (10,459,712) | 193,196,175 | ||
| Distributions to Shareholders | ||||
| Total distributions | ($17,400,000) | ($88,160,440) | ||
| Transactions in Fund Shares | ||||||||
| 1/1/21-6/30/21 | 1/1/20-12/31/20 | |||||||
| SHARES | VALUE | SHARES | VALUE | |||||
| Shares sold | 81,450,000 | $4,179,139,139 | 133,700,000 | $6,866,598,962 | ||||
| Shares redeemed | + | (50,500,000) | (2,591,420,647) | (91,850,000) | (4,726,663,144) | |||
| Net transactions in fund shares | 30,950,000 | $1,587,718,492 | 41,850,000 | $2,139,935,818 | ||||
| Shares Outstanding and Net Assets | ||||||||
| 1/1/21-6/30/21 | 1/1/20-12/31/20 | |||||||
| SHARES | NET ASSETS | SHARES | NET ASSETS | |||||
| Beginning of period | 146,100,000 | $7,507,923,757 | 104,250,000 | $5,262,952,204 | ||||
| Total increase | + | 30,950,000 | 1,559,858,780 | 41,850,000 | 2,244,971,553 | |||
| End of period | 177,050,000 | $9,067,782,537 | 146,100,000 | $7,507,923,757 | ||||
| 1/1/21–
6/30/21* |
1/1/20–
12/31/20 |
1/1/19–
12/31/19 |
1/1/18–
12/31/18 |
1/1/17–
12/31/17 |
1/1/16–
12/31/16 | |
| Per-Share Data | ||||||
| Net asset value at beginning of period | $58.21 | $54.97 | $52.89 | $53.35 | $53.41 | $53.55 |
| Income (loss) from investment operations: | ||||||
| Net investment income (loss)1 | 0.28 | 0.94 | 1.28 | 1.21 | 0.89 | 0.79 |
| Net realized and unrealized gains (losses) | (1.38) | 3.24 | 2.07 | (0.55) 2 | (0.07) | (0.15) |
| Total from investment operations | (1.10) | 4.18 | 3.35 | 0.66 | 0.82 | 0.64 |
| Less distributions: | ||||||
| Distributions from net investment income | (0.25) | (0.94) | (1.27) | (1.12) | (0.88) | (0.78) |
| Net asset value at end of period | $56.86 | $58.21 | $54.97 | $52.89 | $53.35 | $53.41 |
| Total return | (1.89%) 3 | 7.62% | 6.38% | 1.28% | 1.54% | 1.16% |
| Ratios/Supplemental Data | ||||||
| Ratios to average net assets: | ||||||
| Total expenses | 0.05% 4 | 0.05% | 0.06% 5 | 0.06% | 0.06% | 0.09% 6 |
| Net investment income (loss) | 1.00% 4 | 1.63% | 2.35% | 2.34% | 1.66% | 1.44% |
| Portfolio turnover rate7 | 35% 3 | 51% | 38% | 41% | 30% | 30% |
| Net assets, end of period (x 1,000) | $3,360,549 | $3,952,710 | $4,735,743 | $3,480,449 | $1,165,708 | $790,506 |
| * | Unaudited. |
| Description | Quoted
Prices in Active Markets for Identical Assets (Level 1) |
Other
Significant Observable Inputs (Level 2) |
Significant
Unobservable Inputs (Level 3) |
Total | |
| Assets | |||||
| Treasuries | $— | $3,349,080,035 | $— | $3,349,080,035 | |
| Short-Term Investment1 | 1,658,268 | — | — | 1,658,268 | |
| Total | $1,658,268 | $3,349,080,035 | $— | $3,350,738,303 |
| 1 | As categorized in the Portfolio Holdings. |
| Assets | ||
| Investments in securities, at value — unaffiliated (cost $3,345,154,008) | $3,350,738,303 | |
| Cash | 2,356,072 | |
| Receivables: | ||
| Investments sold | 254,322,501 | |
| Fund shares sold | 76,702,168 | |
| Interest | 11,676,791 | |
| Dividends | + | 19 |
| Total assets | 3,695,795,854 | |
| Liabilities | ||
| Payables: | ||
| Investments bought | 190,147,891 | |
| Management fees | 138,323 | |
| Fund shares redeemed | + | 144,960,663 |
| Total liabilities | 335,246,877 | |
| Net Assets | ||
| Total assets | 3,695,795,854 | |
| Total liabilities | – | 335,246,877 |
| Net assets | $3,360,548,977 | |
| Net Assets by Source | ||
| Capital received from investors | 3,330,911,776 | |
| Total distributable earnings | 29,637,201 | |
| Net Asset Value (NAV) | ||||
| Net Assets | ÷ | Shares
Outstanding |
= | NAV |
| $3,360,548,977 | 59,100,000 | $56.86 | ||
| Investment Income | ||
| Interest received from securities - unaffiliated | $19,565,481 | |
| Dividends received from securities - unaffiliated | + | 275 |
| Total investment income | 19,565,756 | |
| Expenses | ||
| Management fees | 928,425 | |
| Total expenses | – | 928,425 |
| Net investment income | 18,637,331 | |
| Realized and Unrealized Gains (Losses) | ||
| Net realized losses on sales of securities - unaffiliated | (22,685,466) | |
| Net realized gains on sales of in-kind securities - unaffiliated | + | 46,965,895 |
| Net realized gains | 24,280,429 | |
| Net change in unrealized appreciation (depreciation) on securities - unaffiliated | + | (121,310,693) |
| Net realized and unrealized losses | (97,030,264) | |
| Decrease in net assets resulting from operations | ($78,392,933) | |
| Operations | ||||
| 1/1/21-6/30/21 | 1/1/20-12/31/20 | |||
| Net investment income | $18,637,331 | $68,855,042 | ||
| Net realized gains | 24,280,429 | 314,577,533 | ||
| Net change in unrealized appreciation (depreciation) | + | (121,310,693) | (12,306,381) | |
| Increase (decrease) in net assets resulting from operations | (78,392,933) | 371,126,194 | ||
| Distributions to Shareholders | ||||
| Total distributions | ($16,244,610) | ($68,701,360) | ||
| Transactions in Fund Shares | ||||||||
| 1/1/21-6/30/21 | 1/1/20-12/31/20 | |||||||
| SHARES | VALUE | SHARES | VALUE | |||||
| Shares sold | 20,800,000 | $1,187,753,038 | 53,250,000 | $3,088,045,843 | ||||
| Shares redeemed | + | (29,600,000) | (1,685,276,379) | (71,500,000) | (4,173,504,097) | |||
| Net transactions in fund shares | (8,800,000) | ($497,523,341) | (18,250,000) | ($1,085,458,254) | ||||
| Shares Outstanding and Net Assets | ||||||||
| 1/1/21-6/30/21 | 1/1/20-12/31/20 | |||||||
| SHARES | NET ASSETS | SHARES | NET ASSETS | |||||
| Beginning of period | 67,900,000 | $3,952,709,861 | 86,150,000 | $4,735,743,281 | ||||
| Total decrease | + | (8,800,000) | (592,160,884) | (18,250,000) | (783,033,420) | |||
| End of period | 59,100,000 | $3,360,548,977 | 67,900,000 | $3,952,709,861 | ||||
| 1/1/21–
6/30/21* |
1/1/20–
12/31/20 |
10/10/19
1– 12/31/19 |
||||
| Per-Share Data | ||||||
| Net asset value at beginning of period | $54.87 | $47.34 | $50.00 | |||
| Income (loss) from investment operations: | ||||||
| Net investment income (loss)2 | 0.41 | 0.86 | 0.22 | |||
| Net realized and unrealized gains (losses) | (4.77) | 7.50 | (2.67) | |||
| Total from investment operations | (4.36) | 8.36 | (2.45) | |||
| Less distributions: | ||||||
| Distributions from net investment income | (0.35) | (0.83) | (0.21) | |||
| Net asset value at end of period | $50.16 | $54.87 | $47.34 | |||
| Total return | (7.94%) 3 | 17.64% | (4.91%) 3 | |||
| Ratios/Supplemental Data | ||||||
| Ratios to average net assets: | ||||||
| Total expenses | 0.05% 4 | 0.05% | 0.06% 4,5 | |||
| Net investment income (loss) | 1.66% 4 | 1.55% | 2.07% 4 | |||
| Portfolio turnover rate6 | 26% 3 | 45% | 3% 3 | |||
| Net assets, end of period (x 1,000) | $80,260 | $90,535 | $18,935 | |||
| * | Unaudited. |
| Description | Quoted
Prices in Active Markets for Identical Assets (Level 1) |
Other
Significant Observable Inputs (Level 2) |
Significant
Unobservable Inputs (Level 3) |
Total | |
| Assets | |||||
| Treasuries | $— | $79,788,162 | $— | $79,788,162 | |
| Short-Term Investment1 | 83 | — | — | 83 | |
| Total | $83 | $79,788,162 | $— | $79,788,245 |
| 1 | As categorized in the Portfolio Holdings. |
| Assets | ||
| Investments in securities, at value — unaffiliated (cost $84,587,099) | $79,788,245 | |
| Receivables: | ||
| Investments sold | 2,011,023 | |
| Interest | + | 475,147 |
| Total assets | 82,274,415 | |
| Liabilities | ||
| Payables: | ||
| Investments bought | 2,010,890 | |
| Management fees | + | 3,026 |
| Total liabilities | 2,013,916 | |
| Net Assets | ||
| Total assets | 82,274,415 | |
| Total liabilities | – | 2,013,916 |
| Net assets | $80,260,499 | |
| Net Assets by Source | ||
| Capital received from investors | 90,149,205 | |
| Total distributable loss | (9,888,706) | |
| Net Asset Value (NAV) | ||||
| Net Assets | ÷ | Shares
Outstanding |
= | NAV |
| $80,260,499 | 1,600,000 | $50.16 | ||
| Investment Income | ||
| Interest received from securities — unaffiliated | $699,726 | |
| Dividends received from securities — unaffiliated | + | 16 |
| Total investment income | 699,742 | |
| Expenses | ||
| Management fees | 20,423 | |
| Total expenses | – | 20,423 |
| Net investment income | 679,319 | |
| Realized and Unrealized Gains (Losses) | ||
| Net realized losses on sales of securities — unaffiliated | (2,662,773) | |
| Net realized losses on sales of in-kind securities — unaffiliated | + | (1,934,544) |
| Net realized losses | (4,597,317) | |
| Net change in unrealized appreciation (depreciation) on securities — unaffiliated | + | (5,103,281) |
| Net realized and unrealized losses | (9,700,598) | |
| Decrease in net assets resulting from operations | ($9,021,279) | |
| Operations | ||||
| 1/1/21-6/30/21 | 1/1/20-12/31/20 | |||
| Net investment income | $679,319 | $911,800 | ||
| Net realized gains (losses) | (4,597,317) | 1,324,543 | ||
| Net change in unrealized appreciation (depreciation) | + | (5,103,281) | 913,961 | |
| Increase (decrease) in net assets resulting from operations | (9,021,279) | 3,150,304 | ||
| Distributions to Shareholders | ||||
| Total distributions | ($577,780) | ($911,465) | ||
| Transactions in Fund Shares | ||||||||
| 1/1/21-6/30/21 | 1/1/20-12/31/20 | |||||||
| SHARES | VALUE | SHARES | VALUE | |||||
| Shares sold | 900,000 | $45,400,396 | 1,550,000 | $86,042,044 | ||||
| Shares redeemed | + | (950,000) | (46,076,188) | (300,000) | (16,680,585) | |||
| Net transactions in fund shares | (50,000) | ($675,792) | 1,250,000 | $69,361,459 | ||||
| Shares Outstanding and Net Assets | ||||||||
| 1/1/21-6/30/21 | 1/1/20-12/31/20 | |||||||
| SHARES | NET ASSETS | SHARES | NET ASSETS | |||||
| Beginning of period | 1,650,000 | $90,535,350 | 400,000 | $18,935,052 | ||||
| Total increase (decrease) | + | (50,000) | (10,274,851) | 1,250,000 | 71,600,298 | |||
| End of period | 1,600,000 | $80,260,499 | 1,650,000 | $90,535,350 | ||||
| 1/1/21–
6/30/21* |
1/1/20–
12/31/20 |
1/1/19–
12/31/19 |
1/1/18–
12/31/18 |
1/1/17–
12/31/17 |
1/1/16–
12/31/16 | |
| Per-Share Data | ||||||
| Net asset value at beginning of period | $56.05 | $53.43 | $50.59 | $52.07 | $51.55 | $51.41 |
| Income (loss) from investment operations: | ||||||
| Net investment income (loss)1 | 0.48 | 1.19 | 1.43 | 1.35 | 1.18 | 1.06 |
| Net realized and unrealized gains (losses) | (1.43) | 2.79 | 2.90 | (1.42) | 0.59 | 0.23 2 |
| Total from investment operations | (0.95) | 3.98 | 4.33 | (0.07) | 1.77 | 1.29 |
| Less distributions: | ||||||
| Distributions from net investment income | (0.50) | (1.36) | (1.49) | (1.41) | (1.25) | (1.15) |
| Net asset value at end of period | $54.60 | $56.05 | $53.43 | $50.59 | $52.07 | $51.55 |
| Total return | (1.69%) 3 | 7.50% | 8.64% | (0.09%) | 3.46% | 2.49% |
| Ratios/Supplemental Data | ||||||
| Ratios to average net assets: | ||||||
| Total expenses | 0.04% 4 | 0.04% | 0.04% | 0.04% | 0.04% | 0.05% 5 |
| Net investment income (loss) | 1.77% 4 | 2.14% | 2.71% | 2.67% | 2.26% | 2.01% |
| Portfolio turnover rate6,7 | 25% 3 | 68% | 63% | 71% | 101% | 119% |
| Net assets, end of period (x 1,000) | $8,970,213 | $8,732,745 | $7,383,509 | $5,544,583 | $4,925,693 | $3,309,447 |
| * | Unaudited. |
|
Value at 12/31/20 |
Gross
Purchases* |
Gross
Sales |
Realized
Gains(Losses) |
Net
change in unrealized appreciation (depreciation) |
Value at 6/30/21 |
Face
amount at 6/30/21 |
Interest
Income Earned | |
| TD Ameritrade Holding Corp., 2.95%, 04/01/22 | $205,818 | ($80) | ($204,043) | $3,865 | ($5,560) | $— | — | $2,016 |
| TD Ameritrade Holding Corp., 3.75%, 04/01/24 | 219,684 | (1,053) | (76,257) | 3,507 | (4,943) | 140,938 | 130,000 | 3,079 |
| TD Ameritrade Holding Corp., 3.30%, 04/01/27 | 508,054 | 425 | (218,600) | 27,708 | (42,930) | 274,657 | 250,000 | 5,738 |
| TD Ameritrade Holding Corp., 2.75%, 10/01/29 | 165,630 | (146) | — | — | (3,941) | 161,543 | 150,000 | 2,063 |
| The Charles Schwab Corp., 2.65%, 01/25/23 | 314,394 | (1,956) | (26,017) | 644 | (2,666) | 284,399 | 275,000 | 3,806 |
| The Charles Schwab Corp., 3.55%, 02/01/24 | 163,742 | (1,326) | — | — | (957) | 161,459 | 150,000 | 2,663 |
| The Charles Schwab Corp., 0.75%, 03/18/24 | — | 452,866 | — | — | (171) | 452,695 | 450,000 | 578 |
| The Charles Schwab Corp., 4.20%, 03/24/25 | 286,730 | (2,965) | (56,000) | 656 | (4,995) | 223,426 | 200,000 | 4,713 |
| The Charles Schwab Corp., 3.85%, 05/21/25 | 142,405 | (995) | — | — | (3,121) | 138,289 | 125,000 | 2,406 |
| The Charles Schwab Corp., 0.90%, 03/11/26 | — | 503,132 | (74,093) | (1,399) | (5,275) | 422,365 | 425,000 | 1,603 |
| The Charles Schwab Corp., 1.15%, 05/13/26 | — | 250,260 | — | — | (72) | 250,188 | 250,000 | — |
| The Charles Schwab Corp., 3.20%, 03/02/27 | — | 218,311 | — | — | 837 | 219,148 | 200,000 | 1,013 |
| The Charles Schwab Corp., 3.20%, 01/25/28 | 514,354 | (1,103) | (245,122) | 10,017 | (29,928) | 248,218 | 225,000 | 5,360 |
| The Charles Schwab Corp., 2.00%, 03/20/28 | — | 353,836 | — | — | 5,645 | 359,481 | 350,000 | 1,108 |
| The Charles Schwab Corp., 4.00%, 02/01/29 | 299,042 | 57,129 | (113,525) | 1,659 | (13,609) | 230,696 | 200,000 | 4,767 |
| The Charles Schwab Corp., 3.25%, 05/22/29 | 229,660 | (602) | — | — | (8,094) | 220,964 | 200,000 | 3,250 |
| The Charles Schwab Corp., 4.63%, 03/22/30 | 316,102 | (1,443) | (119,024) | 8,269 | (21,270) | 182,634 | 150,000 | 4,599 |
| The Charles Schwab Corp., 1.65%, 03/11/31 | — | 237,195 | — | — | 5,828 | 243,023 | 250,000 | 855 |
| The Charles Schwab Corp., 2.30%, 05/13/31 | — | 204,640 | — | — | (58) | 204,582 | 200,000 | — |
| Total | $3,365,615 | $2,266,125 | ($1,132,681) | $54,926 | ($135,280) | $4,418,705 | $49,617 |
| Description | Quoted
Prices in Active Markets for Identical Assets (Level 1) |
Other
Significant Observable Inputs (Level 2) |
Significant
Unobservable Inputs (Level 3) |
Total | |
| Assets | |||||
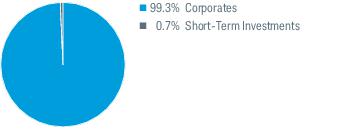
| Corporates 1 | $— | $2,353,644,226 | $— | $2,353,644,226 | |
| Treasuries | — | 3,375,063,148 | — | 3,375,063,148 | |
| Government Related1 | — | 533,563,990 | — | 533,563,990 | |
| Securitized 1 | — | 2,666,203,003 | — | 2,666,203,003 | |
| Short-Term Investments1 | 177,639,959 | — | — | 177,639,959 | |
| Total | $177,639,959 | $8,928,474,367 | $— | $9,106,114,326 |
| 1 | As categorized in Portfolio Holdings. |
| Assets | ||
| Investments in securities, at value — affiliated (cost $4,315,176) | $4,418,705 | |
| Investments in securities, at value — unaffiliated (cost $8,798,740,289) including securities on loan of $1,155,388 | 9,100,504,578 | |
| Collateral invested for securities on loan, at value (cost $1,191,043) | 1,191,043 | |
| Cash | 1,359,511 | |
| Receivables: | ||
| Investments sold | 132,328,365 | |
| Interest | 41,831,254 | |
| Dividends | 2,772 | |
| Income from securities on loan | + | 2,024 |
| Total assets | 9,281,638,252 | |
| Liabilities | ||
| Collateral held for securities on loan | 1,191,043 | |
| Payables: | ||
| Investments bought | 210,720,956 | |
| Investments bought — Delayed delivery | 99,220,488 | |
| Management fees | + | 293,213 |
| Total liabilities | 311,425,700 | |
| Net Assets | ||
| Total assets | 9,281,638,252 | |
| Total liabilities | – | 311,425,700 |
| Net assets | $8,970,212,552 | |
| Net Assets by Source | ||
| Capital received from investors | 8,666,064,115 | |
| Total distributable earnings | 304,148,437 | |
| Net Asset Value (NAV) | ||||
| Net Assets | ÷ | Shares
Outstanding |
= | NAV |
| $8,970,212,552 | 164,300,000 | $54.60 | ||
| Investment Income | ||
| Interest received from securities - affiliated | $49,617 | |
| Interest received from securities - unaffiliated | 78,586,886 | |
| Dividends received from securities - unaffiliated | 22,007 | |
| Securities on loan, net | + | 6,218 |
| Total investment income | 78,664,728 | |
| Expenses | ||
| Management fees | 1,735,165 | |
| Total expenses | – | 1,735,165 |
| Net investment income | 76,929,563 | |
| Realized and Unrealized Gains (Losses) | ||
| Net realized gains on sales of securities - affiliated | 3,865 | |
| Net realized gains on sales of securities - unaffiliated | 9,845,498 | |
| Net realized gains on sales of in-kind securities - affiliated | 51,061 | |
| Net realized gains on sales of in-kind securities - unaffiliated | + | 4,774,824 |
| Net realized gains | 14,675,248 | |
| Net change in unrealized appreciation (depreciation) on securities - affiliated | (135,280) | |
| Net change in unrealized appreciation (depreciation) on securities - unaffiliated | + | (240,196,935) |
| Net change in unrealized appreciation (depreciation) | + | (240,332,215) |
| Net realized and unrealized losses | (225,656,967) | |
| Decrease in net assets resulting from operations | ($148,727,404) | |
| Operations | ||||
| 1/1/21-6/30/21 | 1/1/20-12/31/20 | |||
| Net investment income | $76,929,563 | $171,172,023 | ||
| Net realized gains | 14,675,248 | 68,213,661 | ||
| Net change in unrealized appreciation (depreciation) | + | (240,332,215) | 308,348,875 | |
| Increase (decrease) in net assets resulting from operations | (148,727,404) | 547,734,559 | ||
| Distributions to Shareholders | ||||
| Total distributions | ($80,366,990) | ($196,101,450) | ||
| Transactions in Fund Shares | ||||||||
| 1/1/21-6/30/21 | 1/1/20-12/31/20 | |||||||
| SHARES | VALUE | SHARES | VALUE | |||||
| Shares sold | 13,600,000 | $743,697,556 | 31,800,000 | $1,772,159,926 | ||||
| Shares redeemed | + | (5,100,000) | (277,135,682) | (14,200,000) | (774,556,964) | |||
| Net transactions in fund shares | 8,500,000 | $466,561,874 | 17,600,000 | $997,602,962 | ||||
| Shares Outstanding and Net Assets | ||||||||
| 1/1/21-6/30/21 | 1/1/20-12/31/20 | |||||||
| SHARES | NET ASSETS | SHARES | NET ASSETS | |||||
| Beginning of period | 155,800,000 | $8,732,745,072 | 138,200,000 | $7,383,509,001 | ||||
| Total increase | + | 8,500,000 | 237,467,480 | 17,600,000 | 1,349,236,071 | |||
| End of period | 164,300,000 | $8,970,212,552 | 155,800,000 | $8,732,745,072 | ||||
| 1/1/21–
6/30/21* |
1/1/20–
12/31/20 |
10/10/19
1– 12/31/19 |
||||
| Per-Share Data | ||||||
| Net asset value at beginning of period | $51.37 | $50.04 | $50.00 | |||
| Income (loss) from investment operations: | ||||||
| Net investment income (loss)2 | 0.26 | 0.89 | 0.23 | |||
| Net realized and unrealized gains (losses) | (0.27) | 1.74 | 0.02 | |||
| Total from investment operations | (0.01) | 2.63 | 0.25 | |||
| Less distributions: | ||||||
| Distributions from net investment income | (0.19) | (0.89) | (0.21) | |||
| Distributions from net realized gains | — | (0.41) | — | |||
| Total distributions | (0.19) | (1.30) | (0.21) | |||
| Net asset value at end of period | $51.17 | $51.37 | $50.04 | |||
| Total return | (0.02%) 3 | 5.31% | 0.50% 3 | |||
| Ratios/Supplemental Data | ||||||
| Ratios to average net assets: | ||||||
| Total expenses | 0.05% 4 | 0.05% | 0.06% 4,5 | |||
| Net investment income (loss) | 1.01% 4 | 1.74% | 2.01% 4 | |||
| Portfolio turnover rate6 | 6% 3 | 80% | 12% 3 | |||
| Net assets, end of period (x 1,000) | $624,318 | $118,146 | $35,029 | |||
| * | Unaudited. |
|
Value at 12/31/20 |
Gross
Purchases* |
Gross
Sales |
Realized
Gains(Losses) |
Net
change in unrealized appreciation (depreciation) |
Value at 6/30/21 |
Face
amount at 6/30/21 |
Interest
Income Earned | |
| TD Ameritrade Holding Corp., 2.95%, 04/01/22 | $— | $101,974 | ($102,047) | $73 | $— | $— | — | $320 |
| TD Ameritrade Holding Corp., 3.75%, 04/01/24 | 32,953 | 80,965 | — | — | (83) | 113,835 | 105,000 | 865 |
| TD Ameritrade Holding Corp., 3.63%, 04/01/25 | 55,746 | (416) | — | — | (636) | 54,694 | 50,000 | 906 |
| The Charles Schwab Corp., 2.65%, 01/25/23 | 26,200 | 129,263 | — | — | (336) | 155,127 | 150,000 | 1,756 |
| The Charles Schwab Corp., 3.55%, 02/01/24 | 10,916 | 107,618 | — | — | (131) | 118,403 | 110,000 | 868 |
| The Charles Schwab Corp., 0.75%, 03/18/24 | — | 352,109 | — | — | (13) | 352,096 | 350,000 | 486 |
| The Charles Schwab Corp., 4.20%, 03/24/25 | — | 112,402 | — | — | (689) | 111,713 | 100,000 | 1,773 |
| The Charles Schwab Corp., 3.85%, 05/21/25 | — | 221,525 | — | — | (263) | 221,262 | 200,000 | 1,652 |
| The Charles Schwab Corp., 3.45%, 02/13/26 | — | 32,894 | — | — | 175 | 33,069 | 30,000 | 302 |
| The Charles Schwab Corp., 0.90%, 03/11/26 | — | 198,806 | — | — | (46) | 198,760 | 200,000 | 123 |
| The Charles Schwab Corp., 1.15%, 05/13/26 | — | 250,891 | — | — | (704) | 250,187 | 250,000 | 224 |
| Total | $125,815 | $1,588,031 | ($102,047) | $73 | ($2,726) | $1,609,146 | $9,275 |
| Description | Quoted
Prices in Active Markets for Identical Assets (Level 1) |
Other
Significant Observable Inputs (Level 2) |
Significant
Unobservable Inputs (Level 3) |
Total | |
| Assets | |||||
| Corporates 1 | $— | $618,642,898 | $— | $618,642,898 | |
| Short-Term Investments1 | 4,552,367 | — | — | 4,552,367 | |
| Liabilities | |||||
| Futures Contracts2 | (9) | — | — | (9) | |
| Total | $4,552,358 | $618,642,898 | $— | $623,195,256 |
| 1 | As categorized in the Portfolio Holdings. |
| 2 | Futures contracts are reported at cumulative unrealized appreciation or depreciation. |
| Assets | ||
| Investments in securities, at value — affiliated (cost $1,607,040) | $1,609,146 | |
| Investments in securities, at value — unaffiliated (cost $618,406,330) including securities on loan of $605,403 | 620,963,731 | |
| Collateral invested for securities on loan, at value (cost $622,388) | 622,388 | |
| Cash | 327,368 | |
| Deposit with broker for futures contracts | 33,600 | |
| Receivables: | ||
| Investments sold | 9,911,249 | |
| Fund shares sold | 5,117,342 | |
| Interest | 4,720,283 | |
| Income from securities on loan | 454 | |
| Foreign tax reclaims | 451 | |
| Dividends | + | 99 |
| Total assets | 643,306,111 | |
| Liabilities | ||
| Collateral held for securities on loan | 622,388 | |
| Payables: | ||
| Investments bought | 8,003,534 | |
| Investments bought — Delayed delivery | 99,949 | |
| Management fees | 24,958 | |
| Fund shares redeemed | 10,234,683 | |
| Variation margin on futures contracts | + | 2,769 |
| Total liabilities | 18,988,281 | |
| Net Assets | ||
| Total assets | 643,306,111 | |
| Total liabilities | – | 18,988,281 |
| Net assets | $624,317,830 | |
| Net Assets by Source | ||
| Capital received from investors | 621,029,260 | |
| Total distributable earnings | 3,288,570 | |
| Net Asset Value (NAV) | ||||
| Net Assets | ÷ | Shares
Outstanding |
= | NAV |
| $624,317,830 | 12,200,000 | $51.17 | ||
| Investment Income | ||
| Interest received from securities — affiliated | $9,275 | |
| Interest received from securities — unaffiliated | 2,096,773 | |
| Dividends received from securities — unaffiliated | 518 | |
| Securities on loan, net | + | 793 |
| Total investment income | 2,107,359 | |
| Expenses | ||
| Management fees | 99,000 | |
| Total expenses | – | 99,000 |
| Net investment income | 2,008,359 | |
| Realized and Unrealized Gains (Losses) | ||
| Net realized gains on sales of securities — unaffiliated | 35,669 | |
| Net realized gains on sales of in-kind securities — affiliated | 73 | |
| Net realized gains on sales of in-kind securities — unaffiliated | 153,889 | |
| Net realized gains on futures contracts | + | 42,768 |
| Net realized gains | 232,399 | |
| Net change in unrealized appreciation (depreciation) on securities — affiliated | (2,726) | |
| Net change in unrealized appreciation (depreciation) on securities — unaffiliated | (608,486) | |
| Net change in unrealized appreciation (depreciation) on futures contracts | + | (2) |
| Net change in unrealized appreciation (depreciation) | + | (611,214) |
| Net realized and unrealized losses | (378,815) | |
| Increase in net assets resulting from operations | $1,629,544 | |
| Operations | ||||
| 1/1/21-6/30/21 | 1/1/20-12/31/20 | |||
| Net investment income | $2,008,359 | $1,672,472 | ||
| Net realized gains | 232,399 | 1,238,095 | ||
| Net change in unrealized appreciation (depreciation) | + | (611,214) | 3,135,651 | |
| Increase in net assets resulting from operations | 1,629,544 | 6,046,218 | ||
| Distributions to Shareholders | ||||
| Total distributions | ($1,515,105) | ($2,580,855) | ||
| Transactions in Fund Shares | ||||||||
| 1/1/21-6/30/21 | 1/1/20-12/31/20 | |||||||
| SHARES | VALUE | SHARES | VALUE | |||||
| Shares sold | 10,700,000 | $546,983,093 | 2,950,000 | $149,197,325 | ||||
| Shares redeemed | + | (800,000) | (40,925,463) | (1,350,000) | (69,546,162) | |||
| Net transactions in fund shares | 9,900,000 | $506,057,630 | 1,600,000 | $79,651,163 | ||||
| Shares Outstanding and Net Assets | ||||||||
| 1/1/21-6/30/21 | 1/1/20-12/31/20 | |||||||
| SHARES | NET ASSETS | SHARES | NET ASSETS | |||||
| Beginning of period | 2,300,000 | $118,145,761 | 700,000 | $35,029,235 | ||||
| Total increase | + | 9,900,000 | 506,172,069 | 1,600,000 | 83,116,526 | |||
| End of period | 12,200,000 | $624,317,830 | 2,300,000 | $118,145,761 | ||||
| 1/1/21–
6/30/21* |
1/1/20–
12/31/20 |
10/10/19
1– 12/31/19 |
||||
| Per-Share Data | ||||||
| Net asset value at beginning of period | $53.69 | $50.07 | $50.00 | |||
| Income (loss) from investment operations: | ||||||
| Net investment income (loss)2 | 0.51 | 1.26 | 0.29 | |||
| Net realized and unrealized gains (losses) | (1.22) | 3.60 | 0.04 | |||
| Total from investment operations | (0.71) | 4.86 | 0.33 | |||
| Less distributions: | ||||||
| Distributions from net investment income | (0.41) | (1.24) | (0.26) | |||
| Net asset value at end of period | $52.57 | $53.69 | $50.07 | |||
| Total return | (1.31%) 3 | 9.83% | 0.67% 3 | |||
| Ratios/Supplemental Data | ||||||
| Ratios to average net assets: | ||||||
| Total expenses | 0.05% 4 | 0.05% | 0.06% 4,5 | |||
| Net investment income (loss) | 1.97% 4 | 2.43% | 2.61% 4 | |||
| Portfolio turnover rate6 | 6% 3 | 36% | 8% 3 | |||
| Net assets, end of period (x 1,000) | $349,567 | $190,584 | $110,151 | |||
| * | Unaudited. |
|
Value at 12/31/20 |
Gross
Purchases* |
Gross
Sales |
Realized
Gains(Losses) |
Net
change in unrealized appreciation (depreciation) |
Value at 6/30/21 |
Face
amount at 6/30/21 |
Interest
Income Earned | |
| TD Ameritrade Holding Corp., 3.30%, 04/01/27 | $56,451 | $138,748 | ($82,248) | $2,702 | ($5,790) | $109,863 | 100,000 | $1,933 |
| TD Ameritrade Holding Corp., 2.75%, 10/01/29 | 27,605 | 38 | — | — | (719) | 26,924 | 25,000 | 344 |
| The Charles Schwab Corp., 0.90%, 03/11/26 | — | 352,663 | (346,137) | (6,526) | — | — | — | 648 |
| The Charles Schwab Corp., 3.20%, 03/02/27 | 56,330 | 223,706 | (164,089) | (2,343) | (4,030) | 109,574 | 100,000 | 2,396 |
| The Charles Schwab Corp., 3.20%, 01/25/28 | — | 81,252 | — | — | 1,487 | 82,739 | 75,000 | 647 |
| The Charles Schwab Corp., 2.00%, 03/20/28 | — | 203,643 | — | — | 1,775 | 205,418 | 200,000 | 339 |
| The Charles Schwab Corp., 4.00%, 02/01/29 | — | 58,716 | — | — | (1,042) | 57,674 | 50,000 | 900 |
| The Charles Schwab Corp., 3.25%, 05/22/29 | 34,449 | (124) | — | — | (1,180) | 33,145 | 30,000 | 488 |
| The Charles Schwab Corp., 4.63%, 03/22/30 | 189,661 | (811) | (89,375) | (141) | (8,017) | 91,317 | 75,000 | 2,781 |
| The Charles Schwab Corp., 1.65%, 03/11/31 | — | 95,188 | — | — | 2,021 | 97,209 | 100,000 | 151 |
| Total | $364,496 | $1,153,019 | ($681,849) | ($6,308) | ($15,495) | $813,863 | $10,627 |
| Description | Quoted
Prices in Active Markets for Identical Assets (Level 1) |
Other
Significant Observable Inputs (Level 2) |
Significant
Unobservable Inputs (Level 3) |
Total | |
| Assets | |||||
| Corporates 1 | $— | $345,803,017 | $— | $345,803,017 | |
| Short-Term Investment1 | 1,152,535 | — | — | 1,152,535 | |
| Liabilities | |||||
| Futures Contracts2 | (17) | — | — | (17) | |
| Total | $1,152,518 | $345,803,017 | $— | $346,955,535 |
| 1 | As categorized in the Portfolio Holdings. |
| 2 | Futures contracts are reported at cumulative unrealized appreciation or depreciation. |
| Assets | ||
| Investments in securities, at value — affiliated (cost $798,487) | $813,863 | |
| Investments in securities, at value — unaffiliated (cost $345,441,160) | 346,141,689 | |
| Deposit with broker for futures contracts | 36,250 | |
| Receivables: | ||
| Investments sold | 5,248,075 | |
| Fund shares sold | 31,506,791 | |
| Interest | 2,710,805 | |
| Income from securities on loan | 57 | |
| Dividends | + | 21 |
| Total assets | 386,457,551 | |
| Liabilities | ||
| Payables: | ||
| Investments bought | 31,564,495 | |
| Investments bought — Delayed delivery | 49,856 | |
| Management fees | 13,425 | |
| Fund shares redeemed | 5,256,651 | |
| Variation margin on futures contracts | + | 5,760 |
| Total liabilities | 36,890,187 | |
| Net Assets | ||
| Total assets | 386,457,551 | |
| Total liabilities | – | 36,890,187 |
| Net assets | $349,567,364 | |
| Net Assets by Source | ||
| Capital received from investors | 347,436,342 | |
| Total distributable earnings | 2,131,022 | |
| Net Asset Value (NAV) | ||||
| Net Assets | ÷ | Shares
Outstanding |
= | NAV |
| $349,567,364 | 6,650,000 | $52.57 | ||
| Investment Income | ||
| Interest received from securities - affiliated | $10,627 | |
| Interest received from securities - unaffiliated | 3,623,546 | |
| Dividends received from securities - unaffiliated | 300 | |
| Securities on loan, net | + | 168 |
| Total investment income | 3,634,641 | |
| Expenses | ||
| Management fees | 89,795 | |
| Total expenses | – | 89,795 |
| Net investment income | 3,544,846 | |
| Realized and Unrealized Gains (Losses) | ||
| Net realized losses on sales of securities - affiliated | (8,623) | |
| Net realized losses on sales of securities - unaffiliated | (575,211) | |
| Net realized gains on sales of in-kind securities - affiliated | 2,315 | |
| Net realized gains on sales of in-kind securities - unaffiliated | 1,507,836 | |
| Net realized gains on futures contracts | + | 21,906 |
| Net realized gains | 948,223 | |
| Net change in unrealized appreciation (depreciation) on securities - affiliated | (15,495) | |
| Net change in unrealized appreciation (depreciation) on securities - unaffiliated | (9,545,722) | |
| Net change in unrealized appreciation (depreciation) on futures contracts | + | (344) |
| Net change in unrealized appreciation (depreciation) | + | (9,561,561) |
| Net realized and unrealized losses | (8,613,338) | |
| Decrease in net assets resulting from operations | ($5,068,492) | |
| Operations | ||||
| 1/1/21-6/30/21 | 1/1/20-12/31/20 | |||
| Net investment income | $3,544,846 | $3,689,710 | ||
| Net realized gains | 948,223 | 584,587 | ||
| Net change in unrealized appreciation (depreciation) | + | (9,561,561) | 9,603,720 | |
| Increase (decrease) in net assets resulting from operations | (5,068,492) | 13,878,017 | ||
| Distributions to Shareholders | ||||
| Total distributions | ($3,048,215) | ($3,679,790) | ||
| Transactions in Fund Shares | ||||||||
| 1/1/21-6/30/21 | 1/1/20-12/31/20 | |||||||
| SHARES | VALUE | SHARES | VALUE | |||||
| Shares sold | 6,300,000 | $333,486,911 | 2,250,000 | $117,151,963 | ||||
| Shares redeemed | + | (3,200,000) | (166,386,837) | (900,000) | (46,916,962) | |||
| Net transactions in fund shares | 3,100,000 | $167,100,074 | 1,350,000 | $70,235,001 | ||||
| Shares Outstanding and Net Assets | ||||||||
| 1/1/21-6/30/21 | 1/1/20-12/31/20 | |||||||
| SHARES | NET ASSETS | SHARES | NET ASSETS | |||||
| Beginning of period | 3,550,000 | $190,583,997 | 2,200,000 | $110,150,769 | ||||
| Total increase | + | 3,100,000 | 158,983,367 | 1,350,000 | 80,433,228 | |||
| End of period | 6,650,000 | $349,567,364 | 3,550,000 | $190,583,997 | ||||
| SCHWAB STRATEGIC TRUST (ORGANIZED JANUARY 27, 2009) | |
| Schwab U.S. TIPS ETF | Schwab U.S. Small-Cap ETF |
| Schwab Short-Term U.S. Treasury ETF | Schwab U.S. Dividend Equity ETF |
| Schwab Intermediate-Term U.S. Treasury ETF | Schwab International Dividend Equity ETF |
| Schwab Long-Term U.S. Treasury ETF | Schwab International Equity ETF |
| Schwab U.S. Aggregate Bond ETF | Schwab International Small-Cap Equity ETF |
| Schwab 1-5 Year Corporate Bond ETF | Schwab Emerging Markets Equity ETF |
| Schwab 5-10 Year Corporate Bond ETF | Schwab U.S. REIT ETF |
| Schwab U.S. Broad Market ETF | Schwab Fundamental U.S. Broad Market Index ETF |
| Schwab 1000 Index® ETF | Schwab Fundamental U.S. Large Company Index ETF |
| Schwab U.S. Large-Cap ETF | Schwab Fundamental U.S. Small Company Index ETF |
| Schwab U.S. Large-Cap Growth ETF | Schwab Fundamental International Large Company Index ETF |
| Schwab U.S. Large-Cap Value ETF | Schwab Fundamental International Small Company Index ETF |
| Schwab U.S. Mid-Cap ETF | Schwab Fundamental Emerging Markets Large Company Index ETF |
2. Significant Accounting Policies:
3. Risk Factors:
4. Affiliates and Affiliated Transactions:
| Schwab
U.S. TIPS ETF |
Schwab
Short-Term U.S. Treasury ETF |
Schwab
Intermediate-Term U.S. Treasury ETF |
Schwab
Long-Term U.S. Treasury ETF |
Schwab
U.S. Aggregate Bond ETF |
Schwab
1-5 Year Corporate Bond ETF |
Schwab
5-10 Year Corporate Bond ETF |
| 0.05% | 0.05% | 0.05% | 0.05% | 0.04% | 0.05% | 0.05% |
| Underlying Funds | |||||
| Schwab
U.S. TIPS ETF |
Schwab
Short-Term U.S. Treasury ETF |
Schwab
U.S. Aggregate Bond ETF | |||
| Schwab Target 2010 Index Fund | 0.0%* | 0.1% | 0.3% | ||
| Schwab Target 2015 Index Fund | 0.0%* | 0.1% | 0.4% | ||
| Schwab Target 2020 Index Fund | 0.1% | 0.3% | 1.4% | ||
| Schwab Target 2025 Index Fund | 0.1% | 0.3% | 2.0% | ||
| Schwab Target 2030 Index Fund | 0.0%* | 0.2% | 2.4% | ||
| Schwab Target 2035 Index Fund | -% | 0.1% | 1.2% | ||
| Schwab Target 2040 Index Fund | -% | 0.1% | 1.1% | ||
| Schwab Target 2045 Index Fund | -% | 0.0%* | 0.4% | ||
| Schwab Target 2050 Index Fund | -% | 0.0%* | 0.4% | ||
| Schwab Target 2055 Index Fund | -% | 0.0%* | 0.2% | ||
| Schwab Target 2060 Index Fund | -% | 0.0%* | 0.1% | ||
| Schwab Target 2065 Index Fund | -% | 0.0%* | 0.0%* | ||
| Schwab VIT Balanced Portfolio | 0.0%* | 0.1% | 0.4% | ||
| Schwab VIT Balanced with Growth Portfolio | 0.0%* | 0.1% | 0.5% | ||
| Schwab VIT Growth Portfolio | -% | -% | 0.3% | ||
5. Other Service Providers:
6. Board of Trustees:
7. Borrowing from Banks:
8. Derivatives:
| Notional Amounts | Number of Contracts | |
| Schwab 1-5 Year Corporate Bond ETF | $1,839,749 | 15 |
| Schwab 5-10 Year Corporate Bond ETF | 675,891 | 5 |
| Purchases
of Long-Term U.S. Government Securities* |
Purchases
of Other Long-Term Securities |
Total
Purchases of Long-Term Securities | |
| Schwab U.S. TIPS ETF | $1,810,886,094 | $— | $1,810,886,094 |
| Schwab Short-Term U.S. Treasury ETF | 6,107,650,407 | — | 6,107,650,407 |
| Schwab Intermediate-Term U.S. Treasury ETF | 1,891,296,811 | — | 1,891,296,811 |
| Schwab Long-Term U.S. Treasury ETF | 43,859,766 | — | 43,859,766 |
| Schwab U.S. Aggregate Bond ETF | 2,342,597,998 | 179,648,309 | 2,522,246,307 |
| Schwab 1-5 Year Corporate Bond ETF | — | 41,809,573 | 41,809,573 |
| Schwab 5-10 Year Corporate Bond ETF | — | 25,601,641 | 25,601,641 |
| Sales/Maturities
of Long-Term U.S. Government Securities |
Sales/Maturities
of Other Long-Term Securities |
Total
Sales/Maturities of Long-Term Securities | |
| Schwab U.S. TIPS ETF | $1,586,125,052 | $— | $1,586,125,052 |
| Schwab Short-Term U.S. Treasury ETF | 2,977,054,792 | — | 2,977,054,792 |
| Schwab Intermediate-Term U.S. Treasury ETF | 1,275,681,647 | — | 1,275,681,647 |
| Schwab Long-Term U.S. Treasury ETF | 21,382,619 | — | 21,382,619 |
| Schwab U.S. Aggregate Bond ETF | 1,906,247,953 | 260,035,858 | 2,166,283,811 |
| Schwab 1-5 Year Corporate Bond ETF | — | 24,243,776 | 24,243,776 |
| Schwab 5-10 Year Corporate Bond ETF | — | 22,007,408 | 22,007,408 |
10. In-Kind Transactions:
| In-Kind
Purchases of Securities |
In-Kind
Sales of Securities | |
| Schwab U.S. TIPS ETF | $6,269,781,856 | $2,477,253,759 |
| Schwab Short-Term U.S. Treasury ETF | 1,025,488,191 | 2,533,900,921 |
| Schwab Intermediate-Term U.S. Treasury ETF | 450,446,502 | 1,547,388,612 |
| Schwab Long-Term U.S. Treasury ETF | 22,453,735 | 45,203,742 |
| Schwab U.S. Aggregate Bond ETF | 221,241,053 | 68,355,154 |
| Schwab 1-5 Year Corporate Bond ETF | 529,016,252 | 40,220,927 |
| Schwab 5-10 Year Corporate Bond ETF | 328,273,314 | 162,494,631 |
| Schwab
U.S. TIPS ETF |
Schwab
Short-Term U.S. Treasury ETF |
Schwab
Intermediate-Term U.S. Treasury ETF |
Schwab
Long-Term U.S. Treasury ETF | ||||
| Tax cost | $17,624,726,422 | $9,035,022,592 | $3,347,654,388 | $85,292,907 | |||
| Gross unrealized appreciation | $725,095,425 | $25,257,824 | $24,219,069 | $— | |||
| Gross unrealized depreciation | (967,831) | (11,273,128) | (21,135,154) | (5,504,662) | |||
| Net unrealized appreciation (depreciation) | $724,127,594 | $13,984,696 | $3,083,915 | ($5,504,662) |
| Schwab
U.S. Aggregate Bond ETF |
Schwab
1-5 Year Corporate Bond ETF |
Schwab
5-10 Year Corporate Bond ETF | |||
| Tax cost | $8,814,921,806 | $620,637,410 | $346,257,471 | ||
| Gross unrealized appreciation | $342,843,159 | $2,964,966 | $3,409,208 | ||
| Gross unrealized depreciation | (51,650,639) | (407,120) | (2,711,144) | ||
| Net unrealized appreciation (depreciation) | $291,192,520 | $2,557,846 | $698,064 |
| Expiration Date | Schwab
U.S. TIPS ETF |
Schwab
Short-Term U.S. Treasury ETF |
Schwab
Intermediate-Term U.S. Treasury ETF |
Schwab
Long-Term U.S. Treasury ETF | |||
| No expiration | $29,722,805 | $2,337,524 | $1,440,182 | $227,609 | |||
| Total | $29,722,805 | $2,337,524 | $1,440,182 | $227,609 |
| Expiration Date | Schwab
U.S. Aggregate Bond ETF |
Schwab
1-5 Year Corporate Bond ETF |
Schwab
5-10 Year Corporate Bond ETF | ||
| No expiration | $3,971,628 | $— | $13,832 | ||
| Total | $3,971,628 | $— | $13,832 |
| Schwab
U.S. TIPS ETF |
Schwab
Short-Term U.S. Treasury ETF |
Schwab
Intermediate-Term U.S. Treasury ETF |
Schwab
Long-Term U.S. Treasury ETF | |
| Ordinary income | $145,346,920 | $88,160,440 | $68,701,360 | $911,465 |
| Schwab
U.S. Aggregate Bond ETF |
Schwab
1-5 Year Corporate Bond ETF |
Schwab
5-10 Year Corporate Bond ETF | |
| Ordinary income | $196,101,450 | $2,580,855 | $3,679,790 |
| 1 | The meeting on June 8, 2021 was held by means of videoconference in reliance on exemptive relief from the in-person voting requirement under the 1940 Act as provided by the Securities and Exchange Commission. |
| Independent Trustees | |||
| Name,
Year of Birth, and Position(s) with the trust (Terms of office, and length of Time Served1) |
Principal
Occupations During the Past Five Years |
Number
of Portfolios in Fund Complex Overseen by the Trustee |
Other Directorships |
| Robert
W. Burns 1959 Trustee (Trustee of Schwab Strategic Trust since 2009; The Charles Schwab Family of Funds, Schwab Investments, Schwab Capital Trust, Schwab Annuity Portfolios and Laudus Trust since 2016) |
Retired/Private Investor (Jan. 2009 – present). Formerly, Managing Director, Pacific Investment Management Company, LLC (PIMCO) (investment management firm) and President, PIMCO Funds. | 103 | None |
| John
F. Cogan 1947 Trustee (Trustee of The Charles Schwab Family of Funds, Schwab Investments, Schwab Capital Trust and Schwab Annuity Portfolios since 2008; Laudus Trust since 2010; Schwab Strategic Trust since 2016) |
Senior Fellow (Oct. 1979 – present), The Hoover Institution at Stanford University (public policy think tank); Senior Fellow (2000 – present), Stanford Institute for Economic Policy Research; Professor of Public Policy (1994 – 2015), Stanford University. | 103 | Director (2005 – 2020), Gilead Sciences, Inc. |
| Nancy
F. Heller 1956 Trustee (Trustee of The Charles Schwab Family of Funds, Schwab Investments, Schwab Capital Trust, Schwab Annuity Portfolios, Schwab Strategic Trust and Laudus Trust since 2018) |
Retired. President and Chairman (2014 – 2016), TIAA Charitable (financial services); Senior Managing Director (2003 – 2016), TIAA (financial services). | 103 | None |
| David
L. Mahoney 1954 Trustee (Trustee of The Charles Schwab Family of Funds, Schwab Investments, Schwab Capital Trust, Schwab Annuity Portfolios and Laudus Trust since 2011; Schwab Strategic Trust since 2016) |
Private Investor. | 103 | Director
(2004 – present), Corcept Therapeutics Incorporated Director (2009 – present), Adamas Pharmaceuticals, Inc. Director (2003 – 2019), Symantec Corporation |
| Jane
P. Moncreiff 1961 Trustee (Trustee of The Charles Schwab Family of Funds, Schwab Investments, Schwab Capital Trust, Schwab Annuity Portfolios, Schwab Strategic Trust and Laudus Trust since 2019) |
Consultant (2018 – present), Fulham Advisers LLC (management consulting); Chief Investment Officer (2009 – 2017), CareGroup Healthcare System, Inc. (healthcare). | 103 | None |
| Independent Trustees (continued) | |||
| Name,
Year of Birth, and Position(s) with the trust (Terms of office, and length of Time Served1) |
Principal
Occupations During the Past Five Years |
Number
of Portfolios in Fund Complex Overseen by the Trustee |
Other Directorships |
| Kiran
M. Patel 1948 Trustee (Trustee of The Charles Schwab Family of Funds, Schwab Investments, Schwab Capital Trust, Schwab Annuity Portfolios and Laudus Trust since 2011; Schwab Strategic Trust since 2016) |
Retired. Executive Vice President and General Manager of Small Business Group (Dec. 2008 – Sept. 2013), Intuit, Inc. (financial software and services firm for consumers and small businesses). | 103 | Director (2008 – present), KLA-Tencor Corporation |
| Kimberly
S. Patmore 1956 Trustee (Trustee of The Charles Schwab Family of Funds, Schwab Investments, Schwab Capital Trust, Schwab Annuity Portfolios, Schwab Strategic Trust and Laudus Trust since 2016) |
Consultant (2008 – present), Patmore Management Consulting (management consulting). | 103 | None |
|
J. Derek Penn 1957 Trustee (Trustee of The Charles Schwab Family of Funds, Schwab Investments, Schwab Capital Trust, Schwab Annuity Portfolios, Schwab Strategic Trust and Laudus Trust since 2021) |
Head of Equity Sales and Trading (2006 – 2018), BNY Mellon (financial services). | 103 | None |
| Interested Trustees | |||
| Name,
Year of Birth, and Position(s) with the trust (Terms of office, and length of Time Served1) |
Principal
Occupations During the Past Five Years |
Number
of Portfolios in Fund Complex Overseen by the Trustee |
Other Directorships |
| Walter
W. Bettinger II2 1960 Chairman and Trustee (Trustee of The Charles Schwab Family of Funds, Schwab Investments, Schwab Capital Trust and Schwab Annuity Portfolios since 2008; Schwab Strategic Trust since 2009; Laudus Trust since 2010) |
Director, President and Chief Executive Officer (Oct. 2008 – present), The Charles Schwab Corporation; President and Chief Executive Officer (Oct. 2008 – present) and Director (May 2008 – present), Charles Schwab & Co., Inc.; Director (Apr. 2006 – present), Charles Schwab Bank, SSB; Director (Nov. 2017 – present), Charles Schwab Premier Bank, SSB; Director (July 2019 – present), Charles Schwab Trust Bank; Director (May 2008 – present) and President and Chief Executive Officer (Aug. 2017 – present), Schwab Holdings, Inc.; Director (Oct. 2020 – present), TD Ameritrade Holding Corporation; Director (July 2016 – present), Charles Schwab Investment Management, Inc. | 103 | Director (2008 – present), The Charles Schwab Corporation |
| Interested Trustees (continued) | |||
| Name,
Year of Birth, and Position(s) with the trust (Terms of office, and length of Time Served1) |
Principal
Occupations During the Past Five Years |
Number
of Portfolios in Fund Complex Overseen by the Trustee |
Other Directorships |
| Joseph
R. Martinetto2 1962 Trustee (Trustee of The Charles Schwab Family of Funds, Schwab Investments, Schwab Capital Trust, Schwab Annuity Portfolios, Schwab Strategic Trust and Laudus Trust since 2016) |
Chief Operating Officer (Feb. 2018 – present) and Senior Executive Vice President (July 2015 – Feb. 2018), The Charles Schwab Corporation; Senior Executive Vice President (July 2015 – present), Charles Schwab & Co., Inc.; Chief Financial Officer (July 2015 – Aug. 2017) and Executive Vice President and Chief Financial Officer (May 2007 – July 2015), The Charles Schwab Corporation and Charles Schwab & Co., Inc.; Director (May 2007 – present), Charles Schwab & Co., Inc.; Director (Apr. 2010 – present) and Chief Executive Officer (July 2013 – Apr. 2015), Charles Schwab Bank, SSB; Director (Nov. 2017 – present), Charles Schwab Premier Bank, SSB; Director (May 2007 – present), Chief Financial Officer (May 2007 – Aug. 2017), Senior Executive Vice President (Feb. 2016 – present), and Executive Vice President (May 2007 – Feb. 2016), Schwab Holdings, Inc.; Director (Oct. 2020 – present), TD Ameritrade Holding Corporation. | 103 | None |
| Officers of the Trust | |
| Name,
Year of Birth, and Position(s) with the trust (Terms of office, and length of Time Served3) |
Principal Occupations During the Past Five Years |
| Jonathan
de St. Paer 1973 President and Chief Executive Officer (Officer of The Charles Schwab Family of Funds, Schwab Investments, Schwab Capital Trust, Schwab Annuity Portfolios, Schwab Strategic Trust and Laudus Trust since 2018) |
Director (Apr. 2019 – present), President (Oct. 2018 – present), Chief Operating Officer (Jan. 2020 – present), and Chief Executive Officer (Apr. 2019 – Nov. 2019), Charles Schwab Investment Management, Inc.; Senior Vice President (June 2020 – present) and Chief Operating Officer (Jan. 2020 – present), Charles Schwab Investment Advisory, Inc.; Chief Executive Officer (Apr. 2019 – present), President (Nov. 2018 – present) and Trustee (Apr. 2019 – Dec. 2020), Schwab Funds, Laudus Funds and Schwab ETFs; Director (Apr. 2019 – present), Charles Schwab Worldwide Funds plc and Charles Schwab Asset Management (Ireland) Limited; Senior Vice President (Apr. 2019 – present), Senior Vice President – Strategy and Product Development (CSIM) (Jan. 2014 – Mar. 2019), and Vice President (Jan. 2009 – Dec. 2013), Charles Schwab & Co., Inc. |
| Mark
Fischer 1970 Treasurer, Chief Financial Officer and Chief Operating Officer (Officer of The Charles Schwab Family of Funds, Schwab Investments, Schwab Capital Trust, Schwab Annuity Portfolios, Schwab Strategic Trust and Laudus Trust since 2013) |
Treasurer and Chief Financial Officer (Jan. 2016 – present) and Chief Operating Officer (Dec. 2020 – present), Schwab Funds, Laudus Funds and Schwab ETFs; Assistant Treasurer (Dec. 2013 – Dec. 2015), Schwab Funds and Laudus Funds; Assistant Treasurer (Nov. 2013 – Dec. 2015), Schwab ETFs; Chief Financial Officer (Mar. 2020 – present) and Vice President (Oct. 2013 – present), Charles Schwab Investment Management, Inc.; Executive Director (Apr. 2011 – Sept. 2013), J.P. Morgan Investor Services; Assistant Treasurer (May 2005 – Mar. 2011), Massachusetts Financial Service Investment Management. |
| Omar
Aguilar 1970 Senior Vice President and Chief Investment Officer (Officer of The Charles Schwab Family of Funds, Schwab Investments, Schwab Capital Trust, Schwab Annuity Portfolios, Schwab Strategic Trust and Laudus Trust since 2011) |
Senior Vice President and Chief Investment Officer (Apr. 2011 – present), Charles Schwab Investment Management, Inc.; Senior Vice President and Chief Investment Officer (June 2011 – present), Schwab Funds, Laudus Funds and Schwab ETFs; Head of the Portfolio Management Group and Vice President of Portfolio Management (May 2009 – Apr. 2011), Financial Engines, Inc. (investment management firm); Head of Quantitative Equity (July 2004 – Jan. 2009), ING Investment Management. |
| Brett
Wander 1961 Senior Vice President and Chief Investment Officer (Officer of The Charles Schwab Family of Funds, Schwab Investments, Schwab Capital Trust, Schwab Annuity Portfolios, Schwab Strategic Trust and Laudus Trust since 2011) |
Senior Vice President and Chief Investment Officer (Apr. 2011 – present), Charles Schwab Investment Management, Inc.; Senior Vice President and Chief Investment Officer (June 2011 – present), Schwab Funds, Laudus Funds and Schwab ETFs; Senior Managing Director and Global Head of Active Fixed-Income Strategies (Jan. 2008 – Oct. 2010), State Street Global Advisors; Director of Alpha Strategies (Apr. 2006 – Jan. 2008), Loomis, Sayles & Company (investment management firm). |
| William
P. McMahon, Jr. 1972 Senior Vice President and Chief Investment Officer (Officer of The Charles Schwab Family of Funds, Schwab Investments, Schwab Capital Trust, Schwab Annuity Portfolios, Schwab Strategic Trust and Laudus Trust since 2021) |
Senior Vice President and Chief Investment Officer (Jan. 2020 – present), Charles Schwab Investment Management, Inc.; Senior Vice President and Chief Investment Officer (June 2021 – present), Schwab Funds, Laudus Funds and Schwab ETFs; Senior Vice President and Chief Investment Officer – ThomasPartners Strategies (Apr. 2018 – Dec. 2019), Charles Schwab Investment Advisory, Inc.; Senior Vice President and Chief Investment Officer (May 2001 – Apr. 2018), ThomasPartners, Inc. |
| Officers of the Trust (continued) | |
| Name,
Year of Birth, and Position(s) with the trust (Terms of office, and length of Time Served3) |
Principal Occupations During the Past Five Years |
| David
Lekich 1964 Chief Legal Officer and Secretary, Schwab Funds and Schwab ETFs Vice President and Assistant Clerk, Laudus Funds (Officer of The Charles Schwab Family of Funds, Schwab Investments, Schwab Capital Trust, Schwab Annuity Portfolios, Schwab Strategic Trust and Laudus Trust since 2011) |
Senior Vice President (Sept. 2011 – present) and Vice President (Mar. 2004 – Sept. 2011), Charles Schwab & Co., Inc.; Senior Vice President and Chief Counsel (Sept. 2011 – present) and Vice President (Jan. 2011 – Sept. 2011), Charles Schwab Investment Management, Inc.; Secretary (Apr. 2011 – present) and Chief Legal Officer (Dec. 2011 – present), Schwab Funds; Vice President and Assistant Clerk (Apr. 2011 – present), Laudus Funds; Secretary (May 2011 – present) and Chief Legal Officer (Nov. 2011 – present), Schwab ETFs. |
| Catherine
MacGregor 1964 Vice President and Assistant Secretary, Schwab Funds and Schwab ETFs Chief Legal Officer, Vice President and Clerk, Laudus Funds (Officer of The Charles Schwab Family of Funds, Schwab Investments, Schwab Capital Trust, Schwab Annuity Portfolios and Laudus Trust since 2005; Schwab Strategic Trust since 2009) |
Vice President (July 2005 – present), Charles Schwab & Co., Inc.; Vice President (Sept. 2005 – present), Charles Schwab Investment Management, Inc.; Vice President (Dec. 2005 – present) and Chief Legal Officer and Clerk (Mar. 2007 – present), Laudus Funds; Vice President (Nov. 2005 – present) and Assistant Secretary (June 2007 – present), Schwab Funds; Vice President and Assistant Secretary (Oct. 2009 – present), Schwab ETFs. |
| 1 | Each Trustee shall hold office until the election and qualification of his or her successor, or until he or she dies, resigns or is removed. The retirement policy requires that each independent trustee retire by December 31 of the year in which the Trustee turns 74 or the Trustee’s twentieth year of service as an independent trustee on any trust in the Fund Complex, whichever occurs first. |
| 2 | Mr. Bettinger and Mr. Martinetto are Interested Trustees. Mr. Bettinger is an Interested Trustee because he owns stock of The Charles Schwab Corporation (CSC), the parent company of Charles Schwab Investment Management, Inc. (CSIM), the investment adviser for the trusts in the Fund Complex, is an employee and director of Charles Schwab & Co., Inc. (Schwab), the principal underwriter for The Charles Schwab Family of Funds, Schwab Investments, Schwab Capital Trust, Schwab Annuity Portfolios and Laudus Trust, and is a director of CSIM. Mr. Martinetto is an Interested Trustee because he owns stock of CSC and is an employee and director of Schwab. |
| 3 | The President, Treasurer and Secretary/Clerk hold office until their respective successors are chosen and qualified or until he or she sooner dies, resigns, is removed or becomes disqualified. Each of the other officers serves at the pleasure of the Board. |
Schwab ETFs
| * | FUNDAMENTAL INDEX is a registered trademark of Research Affiliates LLC. |
| Item 2: | Code of Ethics. |
Not applicable to this semi-annual report.
| Item 3: | Audit Committee Financial Expert. |
Not applicable to this semi-annual report.
| Item 4: | Principal Accountant Fees and Services. |
Not applicable to this semi-annual report.
| Item 5: | Audit Committee of Listed Registrants. |
Not applicable to this semi-annual report.
| Item 6: | Schedule of Investments. |
The schedules of investments are included as part of the report to shareholders filed under Item 1 of this Form.
| Item 7: | Disclosure of Proxy Voting Policies and Procedures for Closed-End Management Investment Companies. |
Not applicable.
| Item 8: | Portfolio Managers of Closed-End Management Investment Companies. |
Not applicable.
| Item 9: | Purchases of Equity Securities by Closed-End Management Investment Company and Affiliated Purchasers. |
Not applicable.
| Item 10: | Submission of Matters to a Vote of Security Holders. |
Not applicable.
| Item 11: | Controls and Procedures. |
| (a) | Based on their evaluation of Registrant’s disclosure controls and procedures, as of a date within 90 days of the filing date, Registrant’s Chief Executive Officer, Jonathan de St. Paer and Registrant’s Chief Financial Officer, Mark Fischer, have concluded that Registrant’s disclosure controls and procedures are: (i) reasonably designed to ensure that information required to be disclosed in this report is appropriately communicated to Registrant’s officers to allow timely decisions regarding disclosures required in this report; (ii) reasonably designed to ensure that information required to be disclosed in this report is recorded, processed, summarized and reported in a timely manner; and (iii) are effective in achieving the goals described in (i) and (ii) above. |
| (b) | During the period covered by this report, there have been no changes in Registrant’s internal control over financial reporting that the above officers believe to have materially affected, or to be reasonably likely to materially affect, Registrant’s internal control over financial reporting. |
| Item 12: | Disclosure of Securities Lending Activities for Closed-End Management Investment Companies. |
Not applicable.
| Item 13: | Exhibits. |
Pursuant to the requirements of the Securities Exchange Act of 1934 and the Investment Company Act of 1940, the registrant has duly caused this report to be signed on its behalf by the undersigned, thereunto duly authorized.
(Registrant) Schwab Strategic Trust – Schwab Fixed-Income ETFs
| By: | /s/ Jonathan de St. Paer | |
| Jonathan de St. Paer Chief Executive Officer | ||
| Date: | August 16, 2021 | |
Pursuant to the requirements of the Securities Exchange Act of 1934 and the Investment Company Act of 1940, this report has been signed below by the following persons on behalf of the registrant and in the capacities and on the dates indicated.
| By: | /s/ Jonathan de St. Paer | |
| Jonathan de St. Paer Chief Executive Officer | ||
| Date: | August 16, 2021 | |
| By: | /s/ Mark Fischer | |
| Mark Fischer Chief Financial Officer | ||
| Date: | August 16, 2021 | |