| ROBO Global(R) Robotics and Automation Index ETF | ||||||||||||||||||||||||||||||||||||||||||
| ROBO Global® Robotics and Automation Index ETF | ||||||||||||||||||||||||||||||||||||||||||
| Investment Objective | ||||||||||||||||||||||||||||||||||||||||||
|
The ROBO Global® Robotics and Automation Index ETF (the “Fund”) seeks to provide investment results that, before fees and expenses, correspond generally to the price and yield performance of the ROBO Global® Robotics and Automation Index (the “Index”). | ||||||||||||||||||||||||||||||||||||||||||
| Fees and Expenses | ||||||||||||||||||||||||||||||||||||||||||
|
This table describes the fees and expenses that you may pay if you buy and hold shares of the Fund. This table and the Example below do not include the brokerage commissions that investors may pay on their purchases and sales of shares of the Fund. | ||||||||||||||||||||||||||||||||||||||||||
| Annual Fund Operating Expenses (expenses that you pay each year as a percentage of the value of your investment) | ||||||||||||||||||||||||||||||||||||||||||
| ||||||||||||||||||||||||||||||||||||||||||
| Example | ||||||||||||||||||||||||||||||||||||||||||
|
This Example is intended to help you compare the cost of investing in the Fund with the cost of investing in other funds. The Example assumes that you invest $10,000 in the Fund for the time periods indicated and then sell all of your shares at the end of those periods. The Example also assumes that your investment has a 5% return each year and that the Fund’s operating expenses remain the same. Although your actual costs may be higher or lower, based on these assumptions your cost would be: | ||||||||||||||||||||||||||||||||||||||||||
| ||||||||||||||||||||||||||||||||||||||||||
| Portfolio Turnover | ||||||||||||||||||||||||||||||||||||||||||
|
The Fund pays transaction costs, such as commissions, when it buys and sells securities (or “turns over” its portfolio). A higher portfolio turnover rate may indicate higher transaction costs and may result in higher taxes when shares of the Fund are held in a taxable account. These costs, which are not reflected in annual fund operating expenses or in the Example, affect the Fund’s performance. For the fiscal year ended April 30, 2019, the Fund’s portfolio turnover rate was 29% of the average value of its portfolio. | ||||||||||||||||||||||||||||||||||||||||||
| Principal Investment Strategies | ||||||||||||||||||||||||||||||||||||||||||
|
The Fund will normally invest at least 80% of its total assets in securities of the Index or in depositary receipts representing securities of the Index. The Index is designed to measure the performance of robotics-related and/or automation-related companies. Companies eligible for inclusion in the Index will derive a portion of revenues and profits from robotics-related and/or automation-related products and/or services, as determined by ROBO Global® (the “Index Provider”) (“Robotics and Automation Companies”). Such products and/or services include any technology, service or device that supports, aids or contributes, in any capacity, to any type of robot, robotic action and/or automation system process, software or management. Examples of such products and/or services include products that incorporate artificial intelligence, unmanned vehicles, software that enables virtualized product design and implementation, three-dimensional printers, navigation systems, and medical robots or robotic instruments. Under normal circumstances, the Fund will invest at least 80% of its net assets, plus the amount of any borrowings for investment purposes, in securities of Robotics and Automation Companies. This investment policy may be changed without shareholder approval, upon 60 days’ notice to shareholders.
Eligible Index components are common and preferred equity securities of Robotics and Automation Companies that have a market capitalization exceeding $200 million at the time of inclusion on the Index and a minimum trailing 3-month composite average daily volume of USD $1,000,000 at the time of inclusion. Index components are selected from a proprietary database of Robotics and Automation Companies that are organized into two general categories: technologies and applications. Robotics and Automation Companies are categorized as technologies if they: (1) manufacture or provide services related to any machinery, equipment, devices or sensors supporting a robot performing its task, or (2) provide key-enabling software and processing technologies used to advance the conversion to autonomous systems. Robotics and Automation Companies are categorized as applications if they incorporate multiple robotic and automation technologies into their product or manufacturing process to improve efficiency in traditional business lines as well as the development of entirely new business propositions. Each category’s representation in the Index varies. The Index consists of a mix of “bellwether” stocks (securities that the Index Provider believes are indicative of the performance of Robotics and Automation Companies as a whole) and “non-bellwether” stocks (securities of companies that have a distinct segment of their business involved in robotics-related and/or automation-related products and/or services, which the Index Provider believes will drive higher revenues as such products and/or services expand). Index components are generally weighted 40% bellwether stocks and 60% non-bellwether stocks at the time of the Index rebalance. The Index consists of securities of both U.S. and foreign issuers, including securities of issuers located in emerging market countries. The Index Provider expects, under normal circumstances, at least 40% of the Index components to represent securities of non-U.S. issuers. As of July 31, 2019, a significant portion of the Index consists of securities of Japanese issuers. The Index is rebalanced and additions are made quarterly. Deletions from the Index may be made at any time due to changes in business, mergers, acquisitions, bankruptcies, suspensions, de-listings and spin-offs, or for other reasons as determined at the sole discretion of the Index Provider. The Index is unmanaged and cannot be invested in directly.
The Fund employs a “passive management” investment strategy in seeking to achieve its investment objective. The Fund generally will use a replication methodology, meaning it will invest in all of the securities comprising the Index in proportion to the weightings in the Index. However, the Fund may utilize a sampling methodology under various circumstances, including when it may not be possible or practicable to purchase all of the securities in the Index. Exchange Traded Concepts, LLC (the “Adviser”) expects that over time, if the Fund has sufficient assets, the correlation between the Fund’s performance, before fees and expenses, and that of the Index will be 95% or better. A figure of 100% would indicate perfect correlation.
The Fund may invest up to 20% of its assets in investments that are not included in the Index, but which the Adviser or Vident Investment Advisory, LLC (the “Sub-Adviser”) believes will help the Fund track the Index. Such investments include cash and cash equivalents, including money market funds.
The Fund will concentrate its investments (i.e., invest more than 25% of its total assets) in a particular industry or group of industries to approximately the same extent that the Index concentrates in an industry or group of industries. As of July 31, 2019, the Index was not concentrated in any industry. In addition, in replicating the Index, the Fund may from time to time invest a significant portion of its assets in the securities of companies in one or more sectors. As of July 31, 2019, the Index had a significant amount of investment exposure in the industrials and information technology sectors.
The Index Provider is not affiliated with the Fund, the Adviser or the Sub-Adviser. The Index Provider developed the methodology for determining the securities to be included in the Index and for the ongoing maintenance of the Index. The Index is calculated by Solactive AG, which is not affiliated with the Fund, the Adviser or the Sub-Adviser. | ||||||||||||||||||||||||||||||||||||||||||
| Principal Risks | ||||||||||||||||||||||||||||||||||||||||||
|
As with all funds, a shareholder is subject to the risk that his or her investment could lose money. An investment in the Fund is not a bank deposit and is not insured or guaranteed by the FDIC or any government agency. The principal risks affecting shareholders’ investments in the Fund are set forth below.
Common Stock Risk: Common stock holds the lowest priority in the capital structure of a company, and therefore takes the largest share of the company’s risk and its accompanying volatility. The value of the common stock held by the Fund may fall due to general market and economic conditions, perceptions regarding the industries in which the issuers of securities held by the Fund participate, or facts relating to specific companies in which the Fund invests. Currency Exchange Rate Risk: The Fund may invest a relatively large percentage of its assets in securities denominated in non-U.S. currencies. Changes in currency exchange rates and the relative value of non-U.S. currencies will affect the value of the Fund’s investment and the value of your shares. Because the Fund’s net asset value (“NAV”) is determined in U.S. dollars, the Fund’s NAV could decline if the currency of the non-U.S. market in which the Fund invests depreciates against the U.S. dollar, even if the value of the Fund’s holdings, measured in the foreign currency, increases. Currency exchange rates can be very volatile and can change quickly and unpredictably. As a result, the value of an investment in the Fund may change quickly and without warning and you may lose money. Early Close/Trading Halt Risk: An exchange or market may close or issue trading halts on specific securities, or the ability to buy or sell certain securities or financial instruments may be restricted, which may result in the Fund being unable to buy or sell certain securities or financial instruments. In such circumstances, the Fund may be unable to rebalance its portfolio, may be unable to accurately price its investments and/or may incur substantial trading losses. Emerging Markets Securities Risk: Emerging markets are subject to greater market volatility, lower trading volume, political and economic instability, uncertainty regarding the existence of trading markets and more governmental limitations on foreign investment than more developed markets. In addition, securities in emerging markets may be subject to greater price fluctuations than securities in more developed markets. The Fund’s investment in securities of foreign companies may be in the form of depositary receipts or other securities convertible into securities of foreign issuers. Foreign Securities Risk: Investments in non-U.S. securities involve certain risks that may not be present with investments in U.S. securities. For example, investments in non-U.S. securities may be subject to risk of loss due to foreign currency fluctuations or to expropriation, nationalization or adverse political or economic developments. Foreign securities may have relatively low market liquidity and decreased publicly available information about issuers. Investments in non-U.S. securities also may be subject to withholding or other taxes and may be subject to additional trading, settlement, custodial, and operational risks. Non-U.S. issuers may also be subject to inconsistent and potentially less stringent accounting, auditing, financial reporting and investor protection standards than U.S. issuers. These and other factors can make investments in the Fund more volatile and potentially less liquid than other types of investments. Geographic Investment Risk: To the extent the Fund invests a significant portion of its assets in the securities of companies of a single country or region, it is more likely to be impacted by events or conditions affecting that country or region. As of July 31, 2019, the Fund invested a significant portion of its assets in the securities of Japanese issuers. Investing in Japan Risk: The growth of Japan’s economy has historically lagged that of its Asian neighbors and other major developed economies. The Japanese economy is heavily dependent on international trade and has been adversely affected by trade tariffs, other protectionist measures, competition from emerging economies and the economic conditions of its trading partners. China has become an important trading partner with Japan, yet the countries’ political relationship has become strained. Should political tension increase, it could adversely affect the economy, especially the export sector, and destabilize the region as a whole. Japan also remains heavily dependent on oil imports, and higher commodity prices could therefore have a negative impact on the economy.
Illiquid Investments Risk: This risk exists when particular Fund investments are difficult to purchase or sell, which can reduce the Fund’s returns because the Fund may be unable to transact at advantageous times or prices.
Index Tracking Risk: The Fund’s return may not match or achieve a high degree of correlation with the return of the Index. To the extent the Fund utilizes a sampling approach, it may experience tracking error to a greater extent than if the Fund sought to replicate the Index.
Industry Concentration Risk: Because the Fund’s assets will be concentrated in an industry or group of industries to the extent the Index concentrates in a particular industry or group of industries, the Fund is subject to loss due to adverse occurrences that may affect that industry or group of industries.
Issuer-Specific Risk: Fund performance depends on the performance of individual securities to which the Fund has exposure. Issuer-specific events, including changes in the financial condition of an issuer, can have a negative impact on the value of the Fund.
Large-Capitalization Risk: Returns on investments in securities of large companies could trail the returns on investments in securities of smaller and mid-sized companies.
Limited Authorized Participants, Market Makers and Liquidity Providers Risk: Because the Fund is an exchange-traded fund (“ETF”), only a limited number of institutional investors (known as “Authorized Participants”) are authorized to purchase and redeem shares directly from the Fund. In addition, there may be a limited number of market makers and/or liquidity providers in the marketplace. To the extent either of the following events occur, shares of the Fund may trade at a material discount to NAV and possibly face delisting: (i) Authorized Participants exit the business or otherwise become unable to process creation and/or redemption orders and no other Authorized Participants step forward to perform these services, or (ii) market makers and/or liquidity providers exit the business or significantly reduce their business activities and no other entities step forward to perform their functions.
Management Risk: Because the Fund may not fully replicate the Index and may hold fewer than the total number of securities in the Index and may hold securities not included in the Index, the Fund is subject to management risk. This is the risk that the Sub-Adviser’s security selection process, which is subject to a number of constraints, may not produce the intended results.
Market Risk: The values of equity securities in the Index could decline generally or could underperform other investments.
Micro-Capitalization Risk: The micro-capitalization companies in which the Fund may invest may be more vulnerable to adverse business or economic events than larger, more established companies, and may underperform other segments of the market or the equity market as a whole. Securities of micro-capitalization companies generally trade in lower volumes, are often more vulnerable to market volatility, and are subject to greater and more unpredictable price changes than larger capitalization stocks or the stock market as a whole.
Non-Diversification Risk: The Fund is a non-diversified investment company under the Investment Company Act of 1940 (the “1940 Act”), meaning that, as compared to a diversified fund, it can invest a greater percentage of its assets in securities issued by or representing a small number of issuers. As a result, the performance of these issuers can have a substantial impact on the Fund’s performance.
Operational Risk: The Fund and its service providers may experience disruptions that arise from human error, processing and communications errors, counterparty or third-party errors, technology or systems failures, any of which may have an adverse impact on the Fund.
Passive Investment Risk: The Fund is not actively managed and therefore the Fund would not sell a security due to current or projected underperformance of the security, industry or sector, unless that security is removed from the Index or selling the security is otherwise required upon a rebalancing of the Index.
Preferred Securities Risk: Preferred securities are subordinated to bonds and other debt instruments in a company’s capital structure and therefore will be subject to greater credit risk than those debt instruments. In addition, preferred securities are subject to other risks, such as having no or limited voting rights, being subject to special redemption rights, having distributions deferred or skipped, having limited liquidity, changing tax treatments and possibly being in heavily regulated industries.
Robotics and Automation Companies Risk: The Fund invests primarily in the equity securities of Robotics and Automation Companies and, as such, is particularly sensitive to risks to those types of companies. These risks include, but are not limited to, small or limited markets for such securities, changes in business cycles, world economic growth, technological progress, rapid obsolescence, and government regulation. Securities of Robotics and Automation Companies, especially smaller, start-up companies, tend to be more volatile than securities of companies that do not rely heavily on technology. Rapid change to technologies that affect a company’s products could have a material adverse effect on such company’s operating results. Robotics and Automation Companies may rely on a combination of patents, copyrights, trademarks and trade secret laws to establish and protect their proprietary rights in their products and technologies. There can be no assurance that the steps taken by these companies to protect their proprietary rights will be adequate to prevent the misappropriation of their technology or that competitors will not independently develop technologies that are substantially equivalent or superior to such companies’ technology.
Sector Focus Risk: The Fund may invest a significant portion of its assets in one or more sectors and thus will be more susceptible to the risks affecting those sectors. While the Fund’s sector exposure is expected to vary over time based on the composition of the Index, the Fund anticipates that it may be subject to some or all of the risks described below. The list below is not a comprehensive list of the sectors to which the Fund may have exposure over time and should not be relied on as such.
Industrials Sector Risk: Stock prices for industrials companies are affected by supply and demand both for their specific product or service and for industrials sector products in general. Government regulation, world events, exchange rates and economic conditions, technological developments and liabilities for environmental damage and general civil liabilities will likewise affect the performance of these companies.
Information Technology Sector Risk: The Fund is subject to the risk that market or economic factors impacting information technology companies and companies that rely heavily on technology advances could have a major effect on the value of the Fund’s investments. The value of stocks of information technology companies and companies that rely heavily on technology is particularly vulnerable to rapid changes in technology product cycles, rapid product obsolescence, government regulation and competition, both domestically and internationally, including competition from foreign competitors with lower production costs.
Small- and Mid-Capitalization Risk: The small- and mid-capitalization companies in which the Fund invests may be more vulnerable to adverse business or economic events than larger, more established companies, and may underperform other segments of the market or the equity market as a whole. Securities of small- and mid-capitalization companies generally trade in lower volumes, are often more vulnerable to market volatility, and are subject to greater and more unpredictable price changes than larger capitalization stocks or the stock market as a whole.
Trading Risk: Shares of the Fund may trade on the NYSE Arca, Inc. (the “Exchange”) above or below their NAV. The NAV of shares of the Fund will fluctuate with changes in the market value of the Fund’s holdings. In addition, although the Fund’s shares are currently listed on the Exchange, there can be no assurance that an active trading market for shares will develop or be maintained. Trading in Fund shares may be halted due to market conditions or for reasons that, in the view of the Exchange, make trading in shares of the Fund inadvisable. | ||||||||||||||||||||||||||||||||||||||||||
| Performance Information | ||||||||||||||||||||||||||||||||||||||||||
|
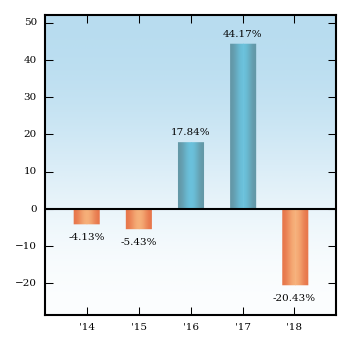
The following bar chart and table provide some indication of the risks of investing in the Fund by showing changes in the Fund’s performance from year to year and by showing how the Fund’s average annual returns for certain time periods compare with the average annual total returns of the Index, the S&P 500 Index, and the MSCI ACWI. All returns assume reinvestment of dividends and distributions. The Fund’s past performance (before and after taxes) is not necessarily an indication of how the Fund will perform in the future. Updated performance information is available online at www.roboglobaletfs.com or by calling toll-free 1-855-456-ROBO. | ||||||||||||||||||||||||||||||||||||||||||
| Annual Total Returns as of 12/31 | ||||||||||||||||||||||||||||||||||||||||||
| ||||||||||||||||||||||||||||||||||||||||||
|
Best and Worst Quarter Returns (for the period reflected in the bar chart above)
| ||||||||||||||||||||||||||||||||||||||||||
| Average Annual Total Returns for the Periods Ended December 31, 2018 | ||||||||||||||||||||||||||||||||||||||||||
| ||||||||||||||||||||||||||||||||||||||||||
|
After-tax returns are calculated using the historical highest individual federal marginal income tax rates and do not reflect the impact of state and local taxes. Your actual after-tax returns will depend on your tax situation and may differ from those shown. After-tax returns shown are not relevant to investors who hold their shares of the Fund through tax-deferred arrangements, such as 401(k) plans or individual retirement accounts. In some cases the return after taxes may exceed the return before taxes due to an assumed tax benefit from any losses on a sale of shares of the Fund at the end of the measurement period. |