UNITED
STATES
SECURITIES
AND EXCHANGE COMMISSION
Washington,
D.C. 20549
Annual
Report on Form 20-F
¨ REGISTRATION STATEMENT
PURSUANT TO SECTION 12(b) OR (g) OF THE SECURITIES
EXCHANGE
ACT OF 1934
OR
x ANNUAL REPORT PURSUANT
TO SECTION 13 OR 15(d) OF THE SECURITIES EXCHANGE ACT OF
1934
For the
fiscal year ended December 31, 2009
OR
¨ TRANSITION REPORT
PURSUANT TO SECTION 13 OR 15(d) OF THE SECURITIES EXCHANGE ACT OF
1934
For the
transition period from ____________ to ___________
OR
¨ SHELL COMPANY REPORT
PURSUANT TO SECTION 13 OR 15(d) OF THE SECURITIES
EXCHANGE
ACT OF
1934
Date of
event requiring this shell company report __________________
Commission
file number: 001-34175
ECOPETROL
S.A.
(Exact
name of Registrant as specified in its charter)
N/A
(Translation
of Registrant’s name into English)
REPUBLIC
OF COLOMBIA
(Jurisdiction
of incorporation or organization)
Carrera
13 No. 36 – 24
BOGOTA –
COLOMBIA
(Address
of principal executive offices)
Alejandro
Giraldo
Investor
Relations Officer
investors@ecopetrol.com.co
Tel.
(571) 234 5190
Fax.
(571) 234 5628
Carrera
13 N.36-24 Piso.8
Bogota,
Colombia
(Name,
Telephone, E-Mail and/or Facsimile number and Address of Company Contact
Person)
Securities
registered or to be registered pursuant to Section 12(b) of the
Act.
|
Title
of each class
|
Name
of each exchange on which registered:
|
|
American
Depository Shares (as evidenced by American Depository Receipts), each
representing the right to receive 20 Common Shares
|
New
York Stock Exchange
Lima
Stock Exchange
|
|
Ecopetrol
Common Shares par value Ps$250 per share*
|
New
York Stock Exchange
|
|
7.625%
Notes due 2019
|
New
York Stock Exchange
|
*Not for
trading but only in connection with the registration of the American Depositary
Shares pursuant to the requirements of the SEC.
Securities
registered or to be registered pursuant to Section 12(g) of the
Act: None
Securities
for which there is a reporting obligation pursuant to Section 15(d) of
the Act: None
Indicate
the number of outstanding shares of each of the issuer’s classes of capital
or common stock as of the close of the period covered by the annual
report.
Common
Shares, par value Ps$250 per share: 40,472,512,588
Indicate
by check mark if the registrant is a well-known seasoned issuer, as defined in
Rule 405 of the Securities Act.
xYes ¨No
If this
report is an annual or transition report, indicate by check mark if the
registrant is not required to file reports pursuant to Section 13 or
15(d) of the Securities Exchange Act of 1934.
¨Yes xNo
Note: Checking
the box above will not relieve any registrant required to file reports pursuant
to Section 13 or 15(d) of the Securities Exchange Act of 1934 from
their obligations under those Sections.
Indicate
by check mark whether the registrant (1) has filed all reports required to
be filed by Section 13 or 15(d) of the Securities Exchange Act of 1934
during the preceding 12 months (or for such shorter period that the
registrant was required to file such reports), and (2) has been subject to
such filing requirements for the past 90 days.
xYes ¨No
Indicate
by check mark whether the registrant has submitted electronically and posted on
its corporate Web site, if any, every Interactive Data File required to be
submitted and posted pursuant to Rule 405 of Regulation S-T (§232.405
of this chapter) during the preceding 12 months (or for such shorter period that
the registrant was required to submit and post such files).
¨Yes xNo
Indicate
by check mark whether the registrant is a large accelerated filer, an
accelerated filer, or a non-accelerated filer. See definition of
“accelerated filer and large accelerated filer” in Rule 12b-2 of the
Exchange Act. (Check one):
Large
accelerated filer x Accelerated filer
¨ Non-accelerated
filer ¨
Indicate
by check mark which basis of accounting the registrant has used to prepare the
financial statements included in this filing:
|
¨ U.S.
GAAP
|
¨ International
Financial Reporting
Standards
as issued by the
International
Accounting Standards
Board
|
x
Other
|
If
“Other” has been checked in response to the previous question, indicate by check
mark which financial statement item the registrant has elected to
follow:
¨ Item 17 x Item 18
If this
is an annual report, indicate by check mark whether the registrant is a shell
company (as defined in Rule 12b-2 of the Exchange Act).
¨Yes xNo
(APPLICABLE
ONLY TO ISSUERS INVOLVED IN BANKRUPTCY PROCEEDINGS DURING THE PAST FIVE
YEARS)
Indicate
by check mark whether the registrant has filed all documents and reports
required to be filed by Sections 12, 13 or 15(d) of the Securities
Exchange Act of 1934 subsequent to the distribution of securities under a plan
confirmed by a court.
¨Yes oNo
ii
|
Page
|
||
|
Forward-Looking
Statements
|
1
|
|
|
Enforcement
of Civil Liabilities
|
2
|
|
|
Presentation
of Financial Information
|
2
|
|
|
Presentation
of Information Concerning Reserves
|
4
|
|
|
ITEM
1.
|
Identity
of Directors, Senior Management and Advisors
|
4
|
|
ITEM
2.
|
Offer
Statistics and Expected Timetable
|
4
|
|
ITEM
3.
|
Key
Information
|
5
|
|
3.A.
|
Selected
Financial Data
|
5
|
|
3.B.
|
Capitalization
and Indebtedness
|
7
|
|
3.C.
|
Reasons
for the Offer and Use of Proceeds
|
7
|
|
3.D.
|
Risk
Factors
|
7
|
|
ITEM
4.
|
Information
on the Company
|
20
|
|
4.A.
|
History
and Development of the Company
|
20
|
|
4.B.
|
Business
Overview
|
21
|
|
4.C.
|
Organizational
Structure
|
64
|
|
4.D.
|
Property,
Plant and Equipment
|
65
|
| ITEM 4A. | Unresolved Staff Comments | 65 |
|
ITEM
5.
|
Operating
and Financial Review and Prospects
|
65
|
|
5.A.
|
Operating
Results
|
71
|
|
5.B.
|
Liquidity
and Capital Resources
|
83
|
|
5.C.
|
Research
and Development, Patents and Licenses, etc.
|
86
|
|
5.D.
|
Trend
Information
|
86
|
|
5.E.
|
Off-Balance
Sheet Arrangements
|
86
|
|
5.F.
|
Tabular
Disclosure of Contractual Obligations
|
86
|
|
5.G.
|
Safe
Harbor
|
90
|
|
ITEM
6.
|
Directors,
Senior Management and Employees
|
90
|
|
6.A.
|
Directors
and Senior Management
|
90
|
|
6.B.
|
Compensation
|
94
|
|
6.C.
|
Board
Practices
|
94
|
|
6.D.
|
Employees
|
95
|
|
6.E.
|
Share
Ownership
|
99
|
|
ITEM
7.
|
Major
Shareholders and Related Party Transactions
|
99
|
|
7.A.
|
Major
Shareholders
|
99
|
|
7.B.
|
Related
Party Transactions
|
99
|
|
7.C.
|
Interests
of Experts and Counsel
|
102
|
|
ITEM
8.
|
Financial
Information
|
102
|
|
8.A.
|
Consolidated
Statements and Other Financial Information
|
102
|
|
8.B.
|
Significant
Changes
|
102
|
|
ITEM
9.
|
The
Offer and Listing
|
102
|
|
9.A.
|
Offer
and Listing Details
|
102
|
|
9.B.
|
Plan
of Distribution
|
104
|
|
9.C.
|
Markets
|
104
|
|
9.D.
|
Selling
Shareholders
|
106
|
|
9.E.
|
Expenses
of the Issue
|
106
|
|
ITEM
10.
|
Additional
Information
|
106
|
|
10.A.
|
Share
Capital
|
106
|
|
10.B.
|
Memorandum
and Articles of Incorporation
|
106
|
|
10.C.
|
Material
Contracts
|
110
|
|
10.D.
|
Exchange
Controls
|
111
|
|
10.E.
|
Taxation
|
112
|
|
10.F.
|
Dividends
and Paying Agents
|
118
|
|
10.G.
|
Statement
by Experts
|
118
|
|
10.H.
|
Documents
on Display
|
118
|
iii
|
10.I.
|
Subsidiary
Information
|
118
|
|
ITEM
11.
|
Quantitative
and Qualitative Disclosures About Market Risk
|
118
|
|
ITEM
12.
|
Description
of Securities Other than Equity Securities
|
120
|
|
12.A.
|
Debt
Securities
|
120
|
|
12.B.
|
Warrants
and Rights
|
120
|
|
12.C.
|
Other
Securities
|
120
|
|
12.D.
|
American
Depositary Shares
|
121
|
|
ITEM
13.
|
Defaults,
Dividend Arrearages and Delinquencies
|
122
|
|
ITEM
14.
|
Material
Modifications to the Rights of Security Holders and Use of
Proceeds
|
122
|
|
ITEM
15.
|
Controls
and Procedures
|
122
|
|
ITEM
16.
|
[Reserved]
|
124
|
|
16.A.
|
Audit
Committee Financial Expert
|
124
|
|
16.B.
|
Code
of Ethics
|
124
|
|
16.C.
|
Principal
Accountant Fees and Services
|
124
|
|
16.D.
|
Exemptions
from the Listing Standards for Audit Committee
|
125
|
|
16.E.
|
Purchases
of Equity Securities by the Issuer and Affiliated
Purchasers
|
125
|
|
16.F.
|
Change
in Registrant’s Certifying Accountant
|
125
|
|
16.G.
|
Corporate
Governance
|
125
|
|
ITEM
17.
|
Financial
Statements
|
129
|
|
ITEM
18.
|
Financial
Statements
|
129
|
|
ITEM
19.
|
Exhibits
|
130
|
iv
FORWARD-LOOKING
STATEMENTS
This
annual report on Form 20-F contains forward-looking statements of Ecopetrol
S.A. (hereinafter “we”, “us”, “our”, “Ecopetrol” or the “Company”), within the
meaning of the safe harbor provisions of the U.S. Private Securities Litigation
Reform Act of 1995. These statements are not based on historical
facts and reflect our expectations for future events and
results. Most facts are uncertain because of their
nature. Words such as “anticipate”, “believe”, “could”, “estimate”,
“expect”, “should”, “plan”, “potential”, “predicts”, “prognosticate”, and
“achieve”, among other similar expressions, are understood as forward-looking
statements. These factors may include the following:
|
|
·
|
Drilling
and exploration activities
|
|
|
·
|
Future
production rates
|
|
|
·
|
Import
and export activities
|
|
|
·
|
Liquidity,
cash flow and uses of cash flow
|
|
|
·
|
Projected
capital expenditures
|
|
|
·
|
Dates
by which certain areas will be developed or will come
on-stream
|
|
|
·
|
Allocation
of capital expenditures to exploration and production
activities
|
Actual
results are subject to certain factors out of the control of the Company and may
differ materially from the anticipated results. These factors may
include the following:
|
|
·
|
Changes
in international crude oil and natural gas
prices
|
|
|
·
|
Competition
|
|
|
·
|
Limitations
on our access to sources of
financing
|
|
|
·
|
Significant
political, economic and social developments in Colombia and other
countries where we do business
|
|
|
·
|
Military
operations, terrorist acts, wars or
embargoes
|
|
|
·
|
Regulatory
developments
|
|
|
·
|
Technical
difficulties
|
|
|
·
|
Other
factors discussed in this document as “Risk
Factors”
|
Most of
these statements are subject to risks and uncertainties that are difficult to
predict. Therefore, our actual results could differ materially from
projected results. Accordingly, readers should not place undue
reliance on the forward-looking statements contained in this annual
report.
1
ENFORCEMENT
OF CIVIL LIABILITIES
We are a
Colombian company, all of our Directors and executive officers and certain of
the experts named in this annual report are residents of Colombia, and a
substantial portion of their respective assets are located in Colombia.
Colombian courts determine whether to enforce a U.S. judgment predicated on the
U.S. securities laws through a procedural system known as exequatur. Colombian courts
will enforce a foreign judgment, without reconsideration of the merits, only if
the judgment satisfies the following requirements:
|
|
·
|
a
treaty exists between Colombia and the country where the judgment was
granted or there is reciprocity in the recognition of foreign judgments
between the courts of the relevant jurisdiction and the courts of
Colombia;
|
|
|
·
|
the
foreign judgment does not relate to “in rem rights” vested
in assets that were located in Colombia at the time the suit was filed and
does not contravene or conflict with Colombian laws relating to public
order other than those governing judicial
procedures;
|
|
|
·
|
the
foreign judgment, in accordance with the laws of the country where it was
rendered, is final and is not subject to appeal and a duly certified and
authenticated copy of the judgment has been presented to a competent court
in Colombia;
|
|
|
·
|
the
foreign judgment does not refer to any matter upon which Colombian courts
have exclusive jurisdiction;
|
|
|
·
|
no
proceeding is pending in Colombia with respect to the same cause of
action, and no final judgment has been awarded in any proceeding in
Colombia on the same subject matter and between the same parties;
and
|
|
|
·
|
in
the proceeding commenced in the foreign court that issued the judgment,
the defendant was served in accordance with the law of such jurisdiction
and in a manner reasonably designated to give the defendant an opportunity
to defend against the action.
|
The
United States and Colombia do not have a bilateral treaty providing for
automatic reciprocal recognition and enforcement of judgments in civil and
commercial matters. The Colombian Supreme Court has in the past
accepted that reciprocity exists when it has been proven that either a U.S.
court has enforced a Colombian judgment or that a U.S. court would enforce a
foreign judgment, including a judgment issued by a Colombian
court. However, such enforceability decisions are considered by
Colombian courts on a case-by-case basis.
We
reserve our right to plead sovereign immunity under the United States Foreign
Sovereign Immunities Act of 1976 with respect to actions brought against us
under United States federal securities laws or any state securities
laws.
PRESENTATION
OF FINANCIAL INFORMATION
In this
annual report, references to “US$” or “U.S. dollars” are to United States
Dollars and references to “$”, “Ps$”, “Peso” or “Pesos” are to Colombian Pesos,
the functional currency under which we prepare our financial
statements. Certain figures shown in this annual report have been
subject to rounding adjustments and, accordingly, certain totals or tables may
not be an exact calculation of the preceding figures. In this annual
report a billion is equal to one with nine zeros.
The
accompanying audited consolidated financial statements of Ecopetrol and our
consolidated subsidiaries for the years ended December 31, 2009, 2008 and
2007 have been prepared from accounting records, which are maintained under the
historical cost convention as modified in 1992, to comply with the legal
provisions of the Colombian Contaduría General de la
Nación or National Accounting Office or CGN, to recognize the effect of
inflation on non-monetary balance sheet accounts, including shareholders’
equity, until December 31, 2001. The CGN eliminated the use of
inflation adjustments for accounting purposes for state-owned companies starting
on January 1, 2002. However, our consolidated financial
statements recognize the effect of inflation on non-monetary balance sheet
accounts for an extended period from January 1, 1992 until December 31, 2006 for
Hocol, Oleoducto de Colombia S.A. and Ocensa because, prior to our acquisition
of these companies, they were subject to the accounting rules applicable to
Colombian privately-owned entities. Under such rules, the effect of
inflation on non-monetary balance sheet accounts was required to be recognized
until December 31, 2006.
2
Our
consolidated financial statements are prepared in accordance with accounting
principles for Colombian state-owned entities issued by the CGN and other
applicable legal provisions. The CGN adopted new accounting
principles for Colombian state-owned entities in
September 2007. These accounting principles are known as the
Régimen de Contabilidad
Pública (Regime of Public Accounting or RCP). Pursuant to CGN
Communication No. 0079-101345 of September 28, 2007, RCP became
effective for Ecopetrol beginning with fiscal year ended December 31,
2008. Our consolidated financial statements at and for the years
ended December 31, 2009 and 2008 have been prepared under
RCP. Our consolidated financial statements for all prior years were
prepared under the Plan
General de Contabilidad Pública (General Governmental Accounting Plan or
PGCP), the former accounting principles issued by the CGN for Colombian
state-owned entities. RCP differ in certain respects from
PGCP. See Note 1 to our consolidated financial statements
“Principal Accounting Policies and Practices”. We refer to both RCP
and PGCP as Colombian Government Entity GAAP. Colombian Government
Entity GAAP differs in certain significant respects from generally accepted
accounting principles in the United States or U.S. GAAP. Note 33 to
our audited consolidated financial statements included in this annual report
provides a description of the principal differences between Colombian Government
Entity GAAP and U.S. GAAP as they relate to our audited consolidated financial
statements and provides a reconciliation of net income and shareholders’ equity
for the years and dates indicated therein. As a state-owned
company, our consolidated financial statements are periodically reviewed by the
CGN. However, the review of our accounts by the CGN does not
constitute an audit.
Our
consolidated financial statements include the financial results for Black Gold
Re Ltd., Oleo é Gas Do Brasil Ltda., Ecopetrol Perú S.A., Ecopetrol America
Inc., Andean Chemicals Ltd., Propilco S.A., Ecopetrol Global Energy, Ecopetrol
Transportation Company Limited, Ecopetrol Pipelines International Limited,
Refineria de Cartagena S. A. (“Reficar”), COMAI - Compounding and Masterbatching
Industry Ltda. and Hocol Petroleum Limited, which are wholly owed by
us. Our consolidated financial statements also include the financial
results of Bioenergy S.A., ODL Finance, Oleoducto Central S.A. (Ocensa) and
Oleoducto de Colombia S.A. (ODC) of which at December 31, 2009 we had a
80%, 65%, 60% and 66% interest, respectively. Black Gold
Re Ltd., Oleo é Gas Do Brasil Ltda., Ecopetrol Perú S.A. and Ecopetrol America
Inc. are included in our consolidated financial statements for the years ended
December 31, 2009, 2008 and 2007. Andean Chemicals Ltd.,
Propilco S.A., Bioenergy S.A. and ODL Finance are included in our consolidated
financial statements for the years ended December 31, 2009 and
2008. Ecopetrol Global Energy, Ecopetrol Transportation Company
Limited, Ecopetrol Pipelines International Limited, Reficar, Hocol Petroleum
Limited, Oleoducto Central S.A. (Ocensa) and Oleoducto de Colombia S.A. (ODC)
are included in our consolidated financial statements for the year ended
December 31, 2009. These financial statements were consolidated
line by line and all transactions and significant balances between affiliates
have been eliminated.
This annual report translates certain Peso amounts into
U.S. dollars at specified rates solely for the convenience of the
reader. Unless otherwise indicated, such Peso amounts have been
translated at the rate of Ps$2,044.23 per US$1.00, which corresponds to the
Tasa
Representativa del Mercado or Representative Market Rate for
December 31, 2009, the last business day of the year. The
Representative Market Rate is computed and certified by the Superintendencia
Financiera or Superintendency of Finance, the Colombian banking and
securities regulator, on a daily basis and represents the weighted average of
the buy and sell foreign exchange rates negotiated on the previous day by
certain financial institutions authorized to engage in foreign exchange
transactions. The Superintendency of Finance also calculates the
Representative Market Rate for each month for purposes of preparing financial
statements and converting amounts in foreign currency to Pesos. Such
conversion should not be construed as a representation that the Peso amounts
correspond to, or have been or could be converted into, U.S. dollars at that
rate or any other rate. On July 14, 2010, the Representative Market Rate was Ps$1,871.19
per
US$1.00.
PRESENTATION
OF ABBREVIATIONS
The
following is a list of crude oil and natural gas measurement abbreviations
commonly used throughout this annual report.
|
bpd
|
Barrels
per day
|
|
boe
|
Barrels
of oil equivalent
|
3
|
btu
|
British
thermal units
|
|
cf
|
Cubic
feet
|
|
cfpd
|
Cubic
feet per day
|
|
mcf
|
Million
cubic feet
|
|
mcfpd
|
Million
cubic feet per day
|
|
mbtu
|
Million
British thermal units
|
|
gbtu
|
Giga
British thermal units
|
|
gbtud
|
Giga
British thermal units per day
|
|
gcf
|
Giga
Cubic feet
|
PRESENTATION
OF THE NATION AND GOVERNMENT OF COLOMBIA
References
to the Nation in this annual report relate to the Republic of Colombia, our
controlling shareholder. References made to the Government of
Colombia or the Government correspond to the executive branch including the
President of Colombia, the ministries and other governmental agencies
responsible for regulating our business.
PRESENTATION
OF INFORMATION CONCERNING RESERVES
Information
concerning the technical definitions used for the estimated proved reserves is
included in this annual report. Our hydrocarbon net proved reserves
have been audited in 2009 by Ryder Scott, DeGolyer and MacNaughton and Gaffney,
Cline & Associates (collectively, the “External Engineers”) and their
reserves reports are included as exhibits herein. These firms have
audited 97% of our total net proved reserves for 2009. Their audit
process was conducted in accordance with the U.S. Securities and Exchange
Commission (“SEC”) definitions and rules set forth in Rule 4-10(a) of Regulation
S-X and the disclosure guidelines contained in the SEC’s “Modernization of Oil and Gas
Reporting” final rule dated December 31, 2008 and effective as of January
1, 2010. The information presented in this annual report referring to
our 2009 net proved reserves estimates is based on those reports and on our own
calculations for the remaining 3% of our hydrocarbon net proved
reserves. The information regarding 2008 net proved reserves is based
on the 2008 audited reserve reports for 89% of our total reserves prepared by
the External Engineers under SEC definitions and rules. The remaining
11% corresponds to calculations made by us internally using SEC definitions and
rules. The information regarding our proved reserves for 2007 is
based on the 2006 reserves reports prepared by the External Engineers under SEC
definitions and rules at December 31, 2006 and updated by us to
December 31, 2007 by applying the same rules. See “Item 4B
– Business Overview – Reserves” for additional information on our reserves
estimates.
On
December 31, 2008, the SEC issued a final rule revising disclosure requirements
relating to oil and gas reserves as contained in Rule 4-10(a) of Regulation
S-X. For Ecopetrol, the principal of the rule change was in the
prices used to estimate our reserves. In relation with the crude oil
and natural gas prices, under the new SEC rule, reserves are required to be
estimated by applying (x) the unweighted arithmetic average of the
first-day-of-the-month price for each month within the year to (y) year-end
quantities of proved reserves (the “SEC average price
methodology”). Prior to this revision, the SEC required reserves to
be estimated by applying (x) the year-end WTI price to (y) year-end quantities
of proved reserves (the “SEC year-end price methodology”). Our proved
reserves as of December 31, 2009 are based on the SEC average price methodology
for purposes of U.S. GAAP. Our proved reserves as of December 31,
2008 and 2007 are based on the SEC year-end price methodology for purposes of
U.S. GAAP.
|
ITEM 1.
|
Identity
of Directors, Senior Management and
Advisors
|
Not
applicable.
|
ITEM 2.
|
Offer
Statistics and Expected Timetable
|
Not
applicable.
4
|
ITEM 3.
|
Key
Information
|
|
3.A.
|
Selected
Financial Data
|
The
following table sets forth, for the periods and at the dates indicated, our
summary historical financial data, which have been derived from our consolidated
financial statements, presented in Pesos. Our consolidated financial
statements for the years ended December 31, 2009 and 2008 were audited by
Pricewaterhouse Coopers Ltda. and our consolidated financial statements for the
years ended December 31, 2007, 2006 and 2005 were audited by Ernst &
Young Audit Ltda. The information included below and elsewhere in
this annual report is not necessarily indicative of our future
performance. The tables set forth below are derived from, and should
be read in conjunction with, our consolidated financial statements and
accompanying Notes included in this annual report. See also
Item 5 – “Operating and Financial Review and Prospects” in this annual
report.
|
BALANCE SHEET
|
||||||||||||||||||||||||
|
For the year ended December 31,
|
||||||||||||||||||||||||
|
2009(1)
|
2009
|
2008
|
2007
|
2006
|
2005
|
|||||||||||||||||||
|
(US$
|
||||||||||||||||||||||||
|
in thousands except
for common share
and dividends per
share amounts)
|
(Pesos in millions except for
common share and dividends
per share amounts)
|
|||||||||||||||||||||||
|
Total
assets
|
27,178,702 | 55,559,517 | 48,702,412 | 48,112,080 | 42,137,722 | 32,664,817 | ||||||||||||||||||
|
Shareholders’
Equity
|
15,932,628 | 32,569,957 | 34,619,717 | 26,808,467 | 20,835,746 | 13,285,251 | ||||||||||||||||||
|
Number of common shares(3)
|
40,472,512,588 | 40,472,512,588 | 40,472,512,588 | 40,472,512,588 | (2) | 36,384,788,817 | 36,384,788,817 | |||||||||||||||||
|
Dividends
declared per share:
|
0.11 | 220.0 | (4) | 115.0 | (4) | 123.0 | (4) | 55.0 | 35.7 | |||||||||||||||
|
Amounts
in accordance with U.S. GAAP
|
||||||||||||||||||||||||
|
Total
Assets
|
21,198,326 | 43,334,253 | 40,244,452 | 29,698,528 | 26,517,482 | |||||||||||||||||||
|
Ecopetrol
Shareholders’ Equity
|
11,027,096 | 22,541,921 | 27,425,735 | 20,991,031 | 18,015,386 | |||||||||||||||||||
|
Number of common shares(3)
|
40,472,512,588 | 40,472,512,588 | 40,472,512,588 | 40,472,512,588 | 36,384,788,817 | |||||||||||||||||||
|
Dividends
declared per share:
|
0.11 | 220.0 | 115.0 | 123.0 | 55.0 | |||||||||||||||||||
|
(1)
|
Amounts
stated in U.S. dollars have been translated for the convenience of the
reader at the rate of Ps$2,044.23 to US$1.00, which is the Representative
Market Rate at December 31, 2009, the last business day of the year,
as reported and certified by the Superintendency of
Finance.
|
|
(2)
|
Includes
48,512,147 new shares, before the 1 to 400 split, issued to the Republic
of Colombia or the Nation on April 27, 2007 as a result of the
capitalization of developed reserves in accordance with Decree 2625 of
2000.
|
|
(3)
|
Number
of common shares include (i) a 1 to 400 stock split occurred in
July 2007 which for purposes of comparability and dividends per share
has been applied as if it had occurred in 2003, (ii) 48,512,147
shares issued to the Nation on April 2007 representing in-kind
contributions, and (iii) 4,087,723,771 shares issued to the public in
connection with our initial offering of shares in
Colombia.
|
|
(4)
|
Represents
payments made in 2009 and 2008 based on net income and retained earnings
for the years ended December 31, 2008 and 2007,
respectively. In 2007 dividends were declared and paid on
36,384,788,817 shares. In the same year, dividend payments to
the Nation amounted to Ps$4,475,399 million of which
Ps$3,052,236 million corresponded to net income and
Ps$1,423,163 million to retained earnings paid prior to our initial
public offering in the fourth quarter of 2007. See Item 5
—”Operating and Financial Review and Prospects — Pre-IPO Distribution of
Retained Earnings”.
|
Colombian
Government Entity GAAP differs in certain significant respects to U.S.
GAAP. For differences in net income and shareholders’ equity, see
Note 33 to our consolidated financial statements “Differences between Colombian
Government Entity GAAP and U.S. GAAP” and Item 5 — “Operating and Financial
Review and Prospects — Principal Differences between Colombian Government Entity
GAAP and U.S. GAAP.”
5
|
INCOME STATEMENT
|
||||||||||||||||||||||||
|
For the year ended December 31,
|
||||||||||||||||||||||||
|
2009(1)
|
2009
|
2008
|
2007
|
2006
|
2005
|
|||||||||||||||||||
|
(US$
in thousands
except for
income per share
and average
number of
shares amounts)
|
(Pesos in millions except for net
income per share and average
number of shares amounts)
|
|||||||||||||||||||||||
|
Total revenue
|
14,873,273 | 30,404,390 | 33,896,669 | 22,332,320 | 18,389,965 | 15,512,903 | ||||||||||||||||||
|
Operating
income
|
3,851,494 | 7,873,339 | 12,657,358 | 8,959,138 | 4,798,437 | 4,543,292 | ||||||||||||||||||
|
Net
operating
|
||||||||||||||||||||||||
|
income
per share
|
0.10 | 195 | 313 | 292 | 113,038 | 107,027 | ||||||||||||||||||
|
Income
before
|
||||||||||||||||||||||||
|
income
tax
|
3,546,981 | 7,250,844 | 16,011,204 | 7,065,304 | 4,891,142 | 4,288,330 | ||||||||||||||||||
|
Net
income
|
2,510,507 | 5,132,054 | 11,629,677 | 5,179,792 | 3,391,373 | 3,253,756 | ||||||||||||||||||
|
Weighted
average number of shares outstanding(2)
|
40,472,512,588 | 40,472,512,588 | 40,472,512,588 | 30,702,164,870 | 42,449,825 | 42,449,825 | ||||||||||||||||||
|
Net
income per share(3)
|
0.06 | 127 | 287 | 169 | 79,891 | 76,648 | ||||||||||||||||||
|
Amounts
in accordance with U.S. GAAP
|
||||||||||||||||||||||||
|
Total
revenue
|
14,456,091 | 29,551,574 | 33,849,213 | 22,784,694 | 19,461,739 | |||||||||||||||||||
|
Operating
income
|
3,158,820 | 6,457,354 | 9,840,311 | 8,455,099 | 7,245,976 | |||||||||||||||||||
|
Net
operating income per share
|
0.08 | 160 | 243 | 229 | 199 | |||||||||||||||||||
|
Income
before
|
||||||||||||||||||||||||
|
income
tax and non-controlling interest
|
3,427,860 | 7,007,335 | 13,427,443 | 8,710,648 | 7,765,863 | |||||||||||||||||||
|
Net
income attributable to Ecopetrol
|
2,239,703 | 4,578,468 | 8,841,883 | 6,144,685 | 6,636,424 | |||||||||||||||||||
|
Net
income per Share
|
0.06 | 113 | 218 | 166 | 182 | |||||||||||||||||||
|
Average
number
|
||||||||||||||||||||||||
|
of
shares outstanding(4)
|
40,472,512,588 | 40,472,512,588 | 40,472,512,588 | 36,922,352,491 | 36,384,788,817 | |||||||||||||||||||
|
(1)
|
Amounts
stated in U.S. dollars have been translated for the convenience of the
reader at the rate of Ps$2,044.23 to US$1.00, which was the Representative
Market Rate at December 31, 2009, the last business day of the year,
as reported and certified by the Superintendency of
Finance.
|
|
(2)
|
The
weighted average number of common shares outstanding during 2007 was
30,702,164,870 as a result of the application of the 1 to 400 stock
split, capitalization of reserves by the Nation and initial public
offering in Colombia, which represents a net income per share of Ps$169,
compared to Ps$79,891 during 2006 when the average number of shares
outstanding was 42,449,825.
|
|
(3)
|
Net
Income per share is calculated using the weighted-average number of
outstanding shares at December 31 of each year, adjusted for a
1 to 400 stock split and the contribution to equity from the
Nation.
|
|
(4)
|
Amounts
calculated in accordance with U.S. GAAP which differs in certain respects
with the calculation of weighted average number of shares for Colombian
Government Entity GAAP.
|
Exchange
Rates
On July 14, 2010, the Representative Market Rate was Ps$1,871.19
per
US$1.00. The Federal Reserve Bank of New York does not
report a noon-buying rate for Pesos. The Superintendency of Finance
calculates the Representative Market Rate based on the weighted averages of the
buy/sell foreign exchange rates quoted daily by foreign exchange rate market
intermediaries including financial institutions for the purchase and sale of
U.S. dollars.
The
following table sets forth the high, low, average and period-end exchange rate
for Pesos/U.S. dollar Representative Market Rate for each of the last five years
and for the last six months.
|
Exchange Rates
|
||||||||||||||||
|
High
|
Low
|
Average
|
Period-End
|
|||||||||||||
|
Year
ended December 31,
|
||||||||||||||||
|
2005
|
2,397.25 | 2,272.95 | 2,320.77 | 2,284.22 | ||||||||||||
|
2006
|
2,634.06 | 2,225.44 | 2,357.98 | 2,238.79 | ||||||||||||
|
2007
|
2,261.22 | 1,877.88 | 2,078.35 | 2,014.76 | ||||||||||||
|
2008
|
2,392.28 | 1,652.41 | 1,966.26 | 2,243.59 | ||||||||||||
|
2009
|
2,596.37 | 1,825.68 | 2,156.29 | 2,044.23 | ||||||||||||
|
January 2010
|
2,044.23 | 1,957.82 | 1,978.19 | 1,982.29 | ||||||||||||
|
February 2010
|
2,003.76 | 1,914.87 | 1,952.89 | 1,932.32 | ||||||||||||
|
March 2010
|
1,934.21 | 1,888.05 | 1,909.10 | 1,928.59 | ||||||||||||
|
April 2010
|
1,973.05 | 1,911.07 | 1,940.36 | 1,969.75 | ||||||||||||
|
May 2010
|
2,029.54 | 1,950.44 | 1,984.36 | 1,971.55 | ||||||||||||
|
June 2010
|
1,971.55 | 1,886.05 | 1,925.90 | 1,916.46 | ||||||||||||
|
Source:
|
Superintendency
of Finance for historical data. Banco de la República
or the Colombian Central Bank (www.banrep.gov.co) for
averages.
|
6
|
3.B.
|
Capitalization
and Indebtedness
|
Not
applicable.
|
3.C.
|
Reasons
for the Offer and Use of Proceeds
|
Not
applicable.
|
3.D.
|
Risk
Factors
|
Below is
a description of the risk factors that we face which may affect our future
results and the overall performance of the Colombian oil
industry. Prospective purchasers of our shares represented by
American Depositary Receipts or ADRs should carefully consider the risks
described below, as well as other information contained in this annual report,
before deciding to invest in our ADRs. The risk factors described
below are not the only ones that we face. Additional risks and
uncertainties that we are unaware of, or that we currently deem immaterial, may
also become important factors that affect us.
Financial
results and the operation of the business units could be affected by the
occurrence of one or more of these factors resulting in a decline in the price
of our shares, which may result in you losing some or all of your
investment.
Risks
relating to Colombia’s political and regional environment
Colombia
has experienced internal security issues that have had or could have in the
future a negative effect on the Colombian economy and on us.
Colombia
has experienced internal security issues, primarily due to the activities of
guerrillas, paramilitary groups and drug cartels. In the past,
guerrillas have targeted the crude oil pipelines, including the Oleoducto
Transandino, Caño Limón-Coveñas and Ocensa pipelines, and other related
infrastructure disrupting our activities and those of our business
partners. On several occasions guerilla attacks have resulted in
unscheduled shut-downs of the transportation systems in order to repair damaged
sections and undertake clean-up activities. These activities, their
possible escalation and the effects associated with them have had and may have
in the future a negative impact on the Colombian economy or on us, which may
affect our customers, employees or assets. In the context of the
political instability, allegations have been made against members of the
Congress of Colombia and on Government officials for possible ties with illegal
groups. This situation may have a negative impact on the credibility
of the Colombian Government which could in turn have a negative impact on the
Colombian economy or on us in the future.
There
have been certain events in Colombia and abroad, which have resulted in
political tension between Colombia and some of its neighboring
countries.
Events
such as the Colombian government-sponsored attacks on a FARC camp in Ecuador
(which resulted in the death of one of the members of the FARC’s Secretariat)
and the signing of military treaty between Colombia and the United States have
made the diplomatic relations between Colombia and some of its neighboring
countries, in particular Ecuador and Venezuela, very tense. This
political tension is heightened by the Colombian Government’s allegations that
neighboring countries are supporting the guerilla groups. On other
occasions allegations have been made by Venezuela that the Colombian army has
entered foreign soil while in pursuit of FARC members. The Colombian
army and air force continue to combat FARC members throughout Colombia,
including Colombia’s borders. Similar future events could result in
new and heightened tensions with its neighbors, which could have a negative
impact on Colombia’s economy and general security situation.
7
Companies
operating in Colombia, including us, are subject to prevailing economic
conditions and investment climate in Colombia, which may be less stable than
prevailing economic conditions in developed countries.
The
market price of securities issued by Colombian companies, including us are
subject to the prevailing economic conditions in
Colombia. Substantially all of our assets and operations are located
in Colombia, and most of our sales are currently derived from our crude oil and
natural gas production and production of our refineries located in
Colombia. In the past, economic growth in Colombia has been
negatively affected by lower foreign direct investment and high inflation rates
and the perception of political instability.
The
Colombian government has changed monetary, fiscal, taxation, labor and other
policies over time and has thus influenced the performance of the Colombian
economy. We have no control over the extent and timing of government
intervention and policies.
Presidential
elections took place in Colombia on May 30, 2010 with Juan Manuel Santos of
Party of the U receiving 46.56% of the vote and Antanas Mockus of the Green
Party receiving 21.49% of the vote. Since no candidate received more
than 50% of the vote, a second round was held on June 20, 2010. Juan
Manuel Santos was elected President in this second round, having received 69.1%
of the vote while Antanas Mockus received 27.5% of the vote. The
investment and security climate in the country will be tied to how this new
government is perceived by foreign investors.
If the
perception of improved overall security in Colombia changes or if foreign direct
investment declines, the Colombian economy may face a downturn which could
negatively affect our financial condition and results of
operation. Furthermore, the market price of our shares and ADSs may
be adversely affected by changes in governmental policy, particularly those
affecting economic growth, exchange rates, interest rates, inflation and
taxes.
Developments
and the perception of risk in other countries, especially emerging market
countries, may adversely affect the market price of Colombian securities,
including our American Depositary Shares (ADSs).
Securities
issued by Colombian companies may be affected by economic and market conditions
in other countries, including other Latin American and emerging market
countries. Securities issued by Colombian issuers are also likely to
be affected by economic and political conditions in Colombia’s
neighbors: Venezuela, Ecuador, Perú, Brazil and
Panama. Although economic conditions in such Latin American and other
emerging market countries may differ significantly from economic conditions in
Colombia, investors’ reactions to developments in these other countries may have
an adverse effect on the market value of securities of Colombian
issuers.
Due to
crises in several emerging market countries (such as the Asian financial crisis
of 1997, the Russian financial crisis of 1998 and the Argentine financial crisis
of 2001), and the recent world financial crisis, investors may view investments
in emerging markets with heightened caution. As a result of the
crisis in other countries, flows of investments into Colombia were
reduced. Crises in other emerging market countries may hamper
investor enthusiasm for securities of Colombian issuers. If Latin
America experiences a new slow-down or if the price for securities of Latin
American issuers falls, the price for our ADSs could follow this trend and could
be adversely affected. A new financial crisis or an expansion of the
current crisis could also make it more difficult for us and our subsidiaries to
access the international capital markets and finance our operations and capital
expenditures in the future on acceptable terms.
Our
controlling shareholder’s interests may be different from yours.
The
Republic of Colombia, or the Nation, is our largest shareholder controlling
89.9% of our outstanding capital stock. Colombian law requires the
Nation to maintain the majority of our outstanding capital stock, thus holding
the right to elect the majority of the members of our Board of
Directors. In the future, the Nation as our controlling shareholder
may undertake projects which may not be in our best interest or in the best
interest of our minority shareholders, including holders of our
ADSs.
Before
we, or any of our Colombian subsidiaries, can issue any debt in the
international and local capital markets or incur any other type of indebtedness,
the Government, through the Ministry of Finance and Public Credit, must
authorize the issuance of such debt and we must register external debt with the
Colombian Central Bank. However, this restriction is not applicable to foreign
companies which have branch offices in Colombia, such as our subsidiaries Hocol
or ODL. We cannot assure you that if we were to seek such an
authorization, that the Nation would issue it in a timely fashion or at
all.
8
Additionally
our controlling shareholder may require our Board of Directors to declare
dividends in an amount that result in us having to reduce our capital
expenditures thereby negatively affecting our prospects, results of operations
and financial condition.
Our
operations are subject to extensive regulation.
The
Colombian hydrocarbons industry is subject to extensive regulation and
supervision by the Government in matters including the award of exploration and
production blocks by the National Hydrocarbon Agency, or Agencia Nacional de
Hidrocarburos or ANH, the imposition of specific drilling and exploration
obligations, restrictions on production, price controls, capital expenditures
and required divestments. Existing regulation applies to virtually
all aspects of our operations in Colombia and abroad. See
Item 4B “— Business Overview — Regulation”.
The terms
and conditions of the agreements with the ANH under which we explore and produce
crude oil and natural gas generally reflect negotiations with the ANH and other
governmental authorities and may vary by fields, basins and hydrocarbons
discovered.
We are
required, as are all oil companies undertaking exploratory and production
activities in Colombia, to pay a percentage of our production to the Government
as royalties. The Government has modified the royalty program for
crude oil and natural gas production several times in the last 20 years, as it
has modified the regime regulating new contracts entered into with the
Government. The royalty regime for contracts being entered into today
for crude oil is tied to a scale starting at 8% for production of up to 5,000
barrels per day or bpd and increases up to 25% for production above
600,000 bpd. Royalties for natural gas production are also
subject to a sliding scale depending on whether the field is on-or off-shore and
range between 8% and 25%.
In the
future, the Government may once again amend royalty payment levels for new
contracts and such changes could have a material adverse effect on our financial
condition or results of operation.
The
Government may delay the reimbursement of the gasoline and diesel fuel price
differentials.
The
Government regulates domestic prices of liquid fuels according to international
market conditions in order to align domestic prices with trends in international
prices, with a one month lag. When domestic prices of liquid fuels
are lower than international parity prices, the Government is responsible for
reimbursing importers or refiners for the difference, which difference is called
the fuel price differential pursuant to Law 1151 of 2007. The fuel
price differential is calculated on a monthly basis and reported on a quarterly
basis, with the corresponding cash payment to be made during the next subsequent
quarter. In cases of payment delays, refiners are entitled to receive
interest on past due amounts.
Historically,
when domestic prices of liquid fuels were higher than international parity
prices, the Government lowered domestic prices. However, towards the
end of 2008 as international prices decreased, the Government decided not to
lower domestic prices. Instead, the Government kept domestic prices
high and allocated the positive difference between domestic fuel prices and the
international parity prices to a Fuels Stabilization Fund (Fondo de
Estabilización de Precios de los Combustibles - FEPC). Similar to the
approach followed by other countries, this Fund is funded with these excess
payments when international prices are low and depleted when international
prices are high in order to mitigate domestic price volatility.
During
2008, refiners, including us, were entitled to fuel price differential payments
based on trends in international prices. However, the payment by the
Government of the 2008 fuel price differential was delayed and the Ministry of
Mines and Energy issued a resolution by which it established a payment schedule
relating to the 2008 fuel price differential. Under this payment
schedule, the 2008 fuel price differential was paid in three installments in
April, August and December 2009 and the Government recognized an opportunity
cost with respect to these amounts.
9
During
2009, refiners, including us, were once again entitled to fuel price
differential payments corresponding to the third and fourth quarters of the
year. However, the fuel price differential for the third quarter of
2009 was not timely paid during the fourth quarter of 2009. Instead,
the Government, through Decree 4839 of 2008, stated that all payments
corresponding to the 2009 fuel price differential would be paid in
2010. Pursuant thereto, the price differential corresponding to the
third quarter of 2009 was paid in February 2010, together with the fuel price
differential for the fourth quarter of 2009.
Based on
these past delays, we are unable to determine when we will collect the amount of
any fuel price differentials that become due in the future. Any
material delay in payment of these fuel price differentials by the Government or
a significant amendment to Law 1151 imposing on us additional responsibilities
with respect to the fuel price differentials could have a negative impact on our
financial condition and results of operations.
Risks
related to our business
Our
business depends substantially on international prices for crude oil and refined
products, and prices for these products are volatile. A sharp
decrease in such prices could materially and adversely affect our business
prospects and results of operations.
Crude oil
prices have traditionally fluctuated as a result of a variety of factors
including, among others, the following:
|
|
·
|
Changes
in international prices of natural gas and refined
products;
|
|
|
·
|
Long-term
changes in the demand for crude oil, natural gas and refined
products;
|
|
|
·
|
Regulatory
changes;
|
|
|
·
|
Inventory
levels;
|
|
|
·
|
Increase
in the cost of capital;
|
|
|
·
|
Adverse
economic conditions;
|
|
|
·
|
Development
of new technologies;
|
|
|
·
|
Economic
and political events, especially in the Middle East and elsewhere with
high levels of crude oil
production;
|
|
|
·
|
The
willingness and ability of the Organization of the Petroleum Exporting
Countries or OPEC and its members to set production levels and
prices;
|
|
|
·
|
Local
and global demand and supply;
|
|
|
·
|
Development
of alternative fuels;
|
|
|
·
|
Weather
conditions; and
|
|
|
·
|
Terrorism
and global conflict.
|
As of
December 2009, nearly 96% of our revenues came from sales of crude oil,
natural gas and refined products. Most prices for products developed
and sold by us are quoted in U.S. dollars and fluctuations in the
U.S. dollar/Peso exchange rate have a direct effect on our Peso-denominated
financial statements.
A
significant and sustained decrease in crude oil prices could have a negative
impact on our results of operations and financial condition. In
addition, a reduction of international crude oil prices could result in a delay
in our capital expenditure plan, in particular delaying exploration and
development activities, thereby delaying the development of reserves and
affecting future cash flows.
10
We
are exposed to the credit risks of our customers and any material nonpayment or
nonperformance by our key customers could adversely affect our cash flow and
results of operations.
Some of
our customers may experience financial problems that could have a significant
negative effect on their creditworthiness. Severe financial problems
encountered by our customers could limit our ability to collect amounts owed to
us, or to enforce the performance of obligations owed to us under contractual
arrangements. In addition, many of our customers finance their
activities through their cash flows from operations, the incurrence of debt or
the issuance of equity.
The
combination of declining cash flows as a result of declines in commodity prices,
a reduction in borrowing bases under reserve-based credit facilities and the
lack of availability of debt or equity financing may result in a significant
reduction of our customers’ liquidity and limit their ability to make payments
or perform on their obligations to us. In addition, some of our customers may be
highly leveraged and subjected to their own operating expenses, and as such the
risk we face in doing business with these customers may increase. Other
customers may be subjected to regulatory changes, which could increase the risk
that they may default on their obligations to us. For example, due to a
Venezuelan government constraint imposed on foreign currency transactions, PDVSA
Gas has delayed payments to its providers, including us. Financial problems
experienced by our customers could result in the impairment of our assets, a
decrease in our operating cash flows and may also reduce or curtail our
customers’ future use of our products and services, which may have a material
adverse effect on our revenues.
Achieving
our long-term growth prospects depends on our ability to execute our strategic
plan, in particular discovering additional reserves and successfully developing
them, and failure to do so could prevent us from achieving our long-term
goals.
The
ability to achieve our long-term growth objectives depends on discovering or
acquiring new reserves as well as successfully developing them. Our
exploration activities expose us to the inherent risks of drilling, including
the risk that we will not discover commercially productive crude oil or natural
gas reserves. The costs associated with drilling wells are often
uncertain, and numerous factors beyond our control may cause drilling operations
to be curtailed, delayed or cancelled.
If we are
unable to conduct successful exploration and development of our exploration
activities, or if we do not acquire properties having proved reserves, our level
of proved reserves will decline. Failure to secure additional
reserves may impede us from achieving our growth targets, production targets and
may have a negative effect on our results of operations and financial
condition.
Our
deep water drilling operations carried out by us and in conjunction with our
business partners involve certain risks and costs which may be outside of our
control.
We, in
association with our business partners, have undertaken deep water exploratory
drilling in two blocks in the Gulf of Mexico. Additionally, we are
acting as operators in five off-shore exploratory blocks in
Colombia. In association with our business partners, we are also
planning on undertaking deep water drilling in four blocks in Colombia,
five blocks in the Gulf of Mexico, and two blocks in Brazil. These
deep water drilling activities entail new and heightened risks as reserves are
located at greater distances underneath the seabed. The heightened
risks and costs associated with deep water drilling may have a negative effect
on our results of operations and financial condition.
Furthermore,
as a result of the recent oil spill in the Gulf of Mexico, significant concerns
regarding the safety of deep water drilling have been raised and the U.S.
Government has declared a six-month moratorium on drilling new deep-water wells
in the Gulf of Mexico. In 2010 we, in association with our business
partners which were to act as operators, had specifically planned the drilling
of two exploratory wells in the Gulf of Mexico. Due to the
above-mentioned moratorium, we will most likely be unable to complete the
drilling of these wells. Since we have no control over these types of
foreign government regulations, they may negatively impact the timing of our
deep water drilling operations and consequently our results of operations and
financial condition.
11
Our
crude oil and natural gas reserve estimates involve some degree of uncertainty
and may prove to be incorrect over time, which could adversely affect our
ability to generate revenue.
Historical
reserves estimates are prepared by the use of commonly used geological and
engineering oil industry practices. Estimates are based on
geological, topographic and engineering facts. Actual reserves and
production may vary materially from estimates shown in this annual report, which
could affect our results of operation.
Our
drilling activities are capital intensive and may not be
productive.
Drilling
for crude oil and natural gas involves numerous risks, including the risk that
we will not encounter commercially productive crude oil or natural gas
reservoirs. The costs of drilling, completing and operating wells are
high or uncertain, and drilling operations may be curtailed, delayed or canceled
as a result of a variety of factors, including:
|
|
·
|
Unexpected
drilling conditions;
|
|
|
·
|
Pressure
or irregularities in formations;
|
|
|
·
|
Security
problems;
|
|
|
·
|
Equipment
failures or accidents;
|
|
|
·
|
Fires,
explosions, blow-outs and surface
cratering;
|
|
|
·
|
Title
problems;
|
|
|
·
|
Other
adverse weather conditions; and
|
|
|
·
|
Shortages
or delays in the availability or in the delivery of
equipment.
|
Certain
of our future drilling activities may not be successful and, if unsuccessful,
this failure could reduce the ratio at which we replace our reserves, which
could have an adverse effect on our results of operations and financial
condition. While all drilling, whether developmental or exploratory, involves
risks, exploratory drilling involves greater risks of dry holes or failure to
find commercial quantities of hydrocarbons. Because of the percentage of our
capital budget devoted to higher-risk exploratory projects, it is likely that we
may in the future experience significant exploration and dry hole
expenses.
Increased
competition from foreign crude oil companies may have a negative impact on our
ability to gain access to additional crude oil and natural gas reserves in
Colombia.
The ANH
is the governmental entity responsible for promoting oil and gas investments in
Colombia, establishing terms of reference for exploration rounds and assigning
exploration blocks to oil and gas companies. Prior to the enactment
of Decree Law 1760 of 2003, we had an automatic right to explore any
territory in Colombia and to enter into joint venture agreements with foreign
and local oil companies. Under current regulations, we are entitled
to bid for any exploration blocks offered for exploration by the ANH and we
compete under the same conditions as other domestic and foreign oil and gas
companies, that is, we receive no special treatment. We may also
request the ANH to assign us exploration blocks which have not been previously
reserved by that Agency. Our ability to obtain access to potential
production fields also depends on our ability to evaluate and select potential
hydrocarbon-producing fields and to adequately bid for these exploration
fields.
Our
strategies include international expansion where we may face competition from
local market players and international oil companies that have experience
exploring in other countries.
If we are
unable to adequately compete with foreign and local oil companies, or if we
cannot enter into joint ventures with market players with properties where we
could potentially find additional reserves, we may be conducting exploration
activities in less attractive blocks. If we fail to maintain our
current market position in Colombia, our results of operations and financial
conditions may be adversely affected.
12
We
may be subject to substantial risks relating to our development of exploration
activities outside Colombia.
We began
exploration activities outside Colombia in 2006 through our Brazilian
subsidiary, Oleo é Gas Do Brazil Ltda. Our foreign subsidiaries have
subsequently entered into a number of joint venture exploration agreements with
regional and international oil companies to explore blocks in Perú, Brazil and
the U.S. Gulf of Mexico. The results of operations and financial
condition of our subsidiaries in these countries may be adversely affected by
fluctuations in their local economies, political instability and government
actions.
We have
limited experience exploring outside Colombia, where we are the incumbent
operator. We may face new and unexpected risks involving
environmental requirements that exceed those currently faced by
us. Additionally, we may be exposed to legal disputes with foreign
regulators. For example, we were awarded block Tucano-156 in Brazil
in the 8th round of 2006. However, our award is currently suspended
as a result of a governmental injunction against the 8th round award
process. According to official publications, Brazil’s Agencia Nacional do Petroleo
(ANP) removed all blocks that did not receive offers during the 8th
round. However, the publications do not specify what will be the
result with respect to the 38 blocks which did receive winning offers, including
Tucano-156. According to our consultations with the Superintendência de Promoção de
Licitações (SPL), the awarding process has not yet been defined and the
ANP is still waiting for further instructions from the Brazilian
government. We may also experience the imposition of restrictions on
hydrocarbon exploration and export, or increases in export tax or income tax
rates for crude oil and natural gas.
If one or
more of these risks described above were to materialize, we may not achieve the
strategic objectives in our international operations, which may negatively
affect our results of operations and financial condition.
We
may incur losses and spend time and money defending pending lawsuits and
arbitrations.
We are
currently a party to several legal proceedings relating to civil,
administrative, environmental, and labor claims filed against us. We
are also subject to labor-related lawsuits filed by current and former employees
in connection with pension plans and retirement benefits affecting the
plaintiffs. These claims involve substantial sums of money as well as
other remedies. See Notes 18 and 30 to our consolidated
financial statements.
Our most
relevant legal proceeding was brought by an association of former employees
known by the acronym Foncoeco. See Item
4B — “Legal Proceedings” for a description of this proceeding.
Our
operations may not be able to keep pace with the increasing demand for natural
gas.
The
demand for natural gas in Colombia has grown significantly in recent
years. As a result of this growth, demand for natural gas could
exceed production capacity, resulting in possible supply
shortages. When production shortages occur, we are required to
compensate industrial clients with whom we have supply contracts by paying
penalties and other compensatory expenses detailed in the supply
contracts.
Internal
demand for natural gas has experienced strong growth during the last decade as a
result of national campaigns for cleaner energy and more competitive tariffs for
retail customers. We may not be able to keep up with local demand and
industrial commitments if demand outpaces the rate of new gas developments and
discoveries.
We have
long-term contracts to supply power utilities and other large
customers. In 2007, we signed an agreement with PDVSA Gas to supply
natural gas to Venezuela until 2012, when it is expected that Venezuela will
supply us with natural gas. It is uncertain whether Venezuela will be
able to begin supplying us with natural gas by 2012.
Additionally,
if our current expansion projects or new projects are delayed, we may be
required to compensate our long-term contract customers for our failure to
supply natural gas, which may negatively impact our financial condition and
results of operation.
13
We
are not permitted by law to own more than 25% of a natural gas transportation
company, which may not allow us to transport new natural gas reserves to
distribution points and to our customers.
We
discovered natural gas reserves in the Cusiana and Cupiagua fields for which
limited transportation capacity currently exists. New natural gas
transportation infrastructure may not be available to transport natural gas from
new or existing fields to consumption areas. Furthermore, we are
prohibited by law from holding more than 25% of the equity of any natural gas
transportation company and we cannot determine whether the necessary
transportation capacity will be built by third parties to transport natural
gas. We may be required to enter into agreements with natural gas
transportation companies in terms that are not favorable to us.
We
currently have long-term supply contracts with gas-fired power plants that
require us to deliver natural gas in Barrancabermeja and not at La Guajira
fields. Our ability to deliver the natural gas to these clients at
the delivery point is limited by the Ballena-Barranca pipeline transportation
capacity. If we are unable to acquire the necessary transportation,
we may be unable to meet our obligation with power generators, which could
result in us having to pay fines.
If we are
unable to transport natural gas discoveries to our customers or to regions where
natural gas is needed, we may not be able to develop these reserves, which may
result in impairment of the related assets and would not allow us to recover the
capital expenditures invested to make these natural gas
discoveries.
Results
could be affected by conflicts with the labor unions.
In the
past, we have been affected by strikes and work stoppages promoted by our labor
unions. These strikes have been both politically and
contract-related, especially during collective bargaining
negotiations. In April, 2009, we entered into an agreement with the
Unión Sindical Obrera de la Industria del Petróleo (USO), one of our industry
labor unions, to restore trust between USO and us with open communication and
transparency as the main principles. Additionally, on August 22,
2009, as a result of consensual negotiations, we entered into a new five-year
collective bargaining agreement with three of our most significant industry
labor unions: USO, Asociación de Directivos Profesionales, Técnicos y
Trabajadores de las Empresas de la Rama de Actividad Económica del Recurso
Natural del Petróleo y sus Derivados de Colombia (ADECO) and Sindicato Nacional
de Trabajadores de Empresas Operadoras, Contratistas, Subcontratistas de
Servicios y Actividades de la Industria del Petróleo y Similares
(SINDISPETROL). The new collective bargaining agreement is effective
as of July 1, 2009 and covers salaries, healthcare, education, housing,
transport, meals, cultural activities, union rights and guarantees, among other
aspects. We consider reaching this agreement during consensual
negotiations as a significant step towards the development of improved relations
with our labor unions. SINCOPETROL, our company’s labor union,
neither presented any list of claims to us nor objected to the bargaining
agreement. Thus, we do not have a labor conflict with
SINCOPETROL.
However,
we cannot assure you that we will not experience labor unrest in the
future. In the event relations with our labor unions deteriorate,
which could result in industry-general strikes, work stoppages or even sabotage,
our results of operations and financial condition could be negatively
affected.
We
may not be able to achieve our corporate goals if we face difficulty in finding
competent successors to our current management and employees.
Our
growth strategy and the successful achievement of our corporate goals depend on
the competence of our management and employees. Due to the upcoming
expiration of retirement benefits, some of our managers and employees will leave
the Company in order not to lose those retirement benefits. See
Item 6D — “Employees”. As a result, we may face a difficulty in
finding successors to our current managers and employees with the required
competence and leadership. These difficulties, in turn, may
negatively affect our results.
Interruption
of activities caused by external factors.
We are
exposed to several risks that may partially interrupt our
activities. These risks include, among others, fire disasters,
explosions, malfunction of pipelines and emission of toxic
substances. As a result of the occurrence of any of the above,
operational activities could be significantly affected or
paralyzed. These risks could result in property damage, loss of
revenue, cost of human lives, pollution and harm to the environment, among
others. If any of these occur, we may be exposed to economic
sanctions, fines or penalties.
14
We
conduct exploration and production activities in areas classified as indigenous
reserves and afrocolombian lands.
We carry
out and plan to carry out exploration and production activities in areas
classified by the Government as indigenous reserves (resguardos) and afrocolombian
lands (territorios
colectivos). We may not begin to explore for or produce
hydrocarbons in these regions until we reach an agreement with the indigenous or
afrocolombian communities living on these lands. Generally these
consultations last between four and six months, but may be significantly delayed
if we cannot reach an agreement. For example, we conduct operations
in areas of the Northeastern region which are inhabited by the U’wa
community. Commencement of operations on two blocks in this region
have been delayed for 17 years and eight years, respectively, and as of
December 2009, we have not received approval to undertake activities in
these two blocks by the indigenous authorities. Similarly, some of
our exploration operations in the Southern region have been delayed for over a
year as a result of the presence of the Kofan community who oppose our presence
and activities in the reservation. If our activities endanger the
conservation and preservation of these cultural minorities or their identities
or beliefs, we may not be able to explore regions with good
prospects. We may face similar risks in other jurisdictions where we
have initiated exploration activities which could have a negative effect on our
operations.
Currency
fluctuations and an appreciation of the Peso against the U.S. dollar could have
a material adverse effect on our financial condition and results of operations
because approximately 54% of our revenues came from foreign sales
Approximately
54% of our sales are made in the international markets. The impact of
fluctuations in exchange rates, especially the Peso/U.S. dollar rate on our
operations has been and may continue to be material. In addition, a
substantial share of our liquid assets are held in U.S. dollars or indexed to
foreign currencies and gain value when the Peso depreciates against the U.S.
dollar and lose value when Peso appreciates against the U.S.
dollar. We use forwards, swaps or futures contracts to partially
mitigate the impact of currency fluctuations in order to be able to balance our
U.S. Dollar denominated assets and liabilities as our foreign currency
indebtedness increases.
The Peso
depreciated 9.7% on average against the U.S. dollar in 2009. When the
Peso depreciates against the U.S. dollar, our revenues from exports, when
translated into Pesos, increase.
The Peso
appreciated 11.9% and 5.4% on average against the U.S. dollar in 2007 and 2008,
respectively. When the Peso appreciates against the U.S. dollar, our
revenues from exports, when translated into Pesos, decrease. However,
imported goods and oil services denominated in U.S. dollars become cheaper for
us.
Our
ability to access the credit and capital markets on favorable terms to obtain
funding for our capital projects may be limited due to the deterioration of
these markets.
We expect
to make significant expenditures to reach the corporate goals established by our
2008 – 2015 Strategic Plan. Our ability to fund these expenditures is
dependent on our ability to access the capital necessary to finance the
construction of these facilities. In recent years, domestic and
global financial markets and economic conditions have been weak and volatile and
contributed significantly to a substantial deterioration in the credit and
capital markets. These conditions, along with significant write-offs
in the financial services sector and the re-pricing of credit risk can make it
difficult for us to obtain funding for our capital needs on favorable
terms. As a result, we may be forced to revise the timing and scope
of these projects as necessary to adapt to existing markets and economic
conditions.
We
may be exposed to increases in interest rates, thereby increasing our financial
costs.
As a
result of our initial public offering, we became a Sociedad de Economía Mixta or
mixed economy company and can now incur debt locally and in the international
capital markets and can be affected by changes in prevailing interest
rates. If market interest rates increase, our financing expenses may
increase, which could have an adverse effect on our results of operations and
financial condition.
15
During
recent periods, the cost of raising funds in debt and equity capital markets has
increased while the availability of funds from those markets has
diminished. Likewise, during recent periods, the cost of obtaining
funds from the credit markets has increased as many lenders have increased
interest rates, enacted tighter lending standards and reduced, and in some cases
ceased to provide, funding to borrowers. If the financial market’s
recovery from the recent crisis falters, our ability to obtain capital from
credit facilities may be impaired.
We
are subject to extensive environmental regulations in Colombia and in the other
countries in which we operate.
Our
operations are subject to extensive national, state and local environmental
regulations in Colombia. Environmental rules and regulations are applicable to
our exploration, production, refining, transportation and supply and marketing
activities. These regulations establish, among others, quality standards for
hydrocarbon products, air emissions, water discharges and waste disposal,
environmental standards for abandoned crude oil wells, remedies for soil, water
pollution and the general storage, handling, transportation and treatment of
hydrocarbons in Colombia. Since the creation of the Ministry of the Environment
in 1993 and the enactment of more rigorous laws, environmental regulations have
substantially impacted our operations and business results. Currently, all
exploratory project drilling in areas that do not yet have a license must have
an environmental impact assessment and must receive an environmental license
from the local authorities. The Ministry of the Environment routinely inspects
our crude oil fields, refineries and other production sites and may decide to
open investigations which may result in fines, restrictions on operations or
other sanctions in connection with our non-compliance with environmental
laws.
We are
also subject to regional environmental regulations issued by the corporaciones autonomas regionales or regional
environmental authorities, which oversee compliance with each region’s
environmental laws and regulations by oil and gas companies. If we
fail to comply with any of these national or regional environmental regulations,
we could be subject to administrative and criminal penalties, including
warnings, fines and closure orders of our facilities. See Item 4
— “Business Overview – Environmental Matters”.
Environmental
compliance has become more stringent in Colombia in recent years and as a result
we have allocated a greater percentage of our expenditures for compliance with
these laws and regulations. If environmental laws continue to impose
additional costs and expenses on us, we may need to reduce our investments on
strategic projects in order to allocate funds to environmental
compliance. These additional costs may have a negative impact on the
profitability of the projects we intend to undertake or may make them
economically unattractive, in turn having a negative impact on our results of
operations and financial condition.
We are
subject to foreign environmental regulations for the exploratory activities
conducted by us outside Colombia. Failure to comply with foreign
environmental regulations may result in investigations by foreign regulators,
which could lead to fines, warnings or temporary suspensions of our operations,
which could have a negative impact on our financial condition and results of
operations.
Our
activities face operational risks that may affect the health and safety of our
workforce.
Some of
our operations are developed in remote and dangerous locations which involve
health and safety risks that could affect our workforce. Under
Colombian law and industrial safety regulations we are required to have health
and safety practices that minimize risks and healthy issues faced by our
workforce. Failure to comply with health and safety regulations may
derive investigations by health officials which could result in lawsuits or
fines.
We may be
obliged to incur additional costs and expenses to allocate funds to industrial
safety and health compliance. These additional costs may have a
negative impact on the profitability of the projects we may decide to
undertake.
In
addition, we may be subject to foreign health and safety regulations for our
exploratory activities conducted outside Colombia. Foreign health and
safety regulations may be more severe than those established under Colombian law
and, therefore, we may be required to make additional investments to comply with
those regulations.
16
We
have made significant investments in acquisitions and we may not realize the
value expected.
We have
acquired interests in several companies in Colombia and abroad. See
Item 4 – “Information on the Company”. Obtaining the expected
benefits of the acquisitions will depend, in part, on our ability to (i) obtain
the expected operational and financial results from these acquisitions and (ii)
manage disparate operations and to integrate distinct corporate
cultures. These efforts may not succeed or may distract our
management from operating our existing business. Our failure to
successfully obtain the expected results from our recent acquisitions could
adversely affect our financial condition and results of operations.
Our
strategic plan contemplates the expansion of operations outside of Colombia
where we will be subject to risks associated with investments in new
countries.
As part
of our strategic plan, we have begun to operate through business partners,
subsidiaries or affiliates outside of Colombia. As of the date
hereof, we have investments and subsidiaries incorporated in Perú, Brazil,
Bermuda and the United States, and we are analyzing investments in other
countries. In connection with making investments, we are and will be
subject to risks relating to unstable economic and political conditions,
governmental economic actions, such as exchange or price controls or limits on
the activities to be performed by us, increases in tax rates, contractual
changes, and social and environmental challenges. In addition, we
have recently acquired 50% ownership interest in Offshore International Group
Inc. (OIG), a company that has investments in Perú, and we have faced
reputational risks arising from prior ownership of such
company. These factors, among others that our international
activities may encounter, could adversely affect our results of operations in
those countries and decrease the value of our investments.
Our
subsidiary, Refineria de Cartagena S.A. (“Reficar”) is currently negotiating a
project financing which, if delayed, could affect our operating results and
financial condition.
Our
subsidiary, Refineria de Cartagena S.A. (“Reficar”) has entered into
negotiations to raise approximately US$ 3.4 billion through a
limited-recourse project financing. We will act as sponsor and will
provide a guarantee to the project lenders. We are targeting a
November 2010 closing for the transaction. If for any
reason the closing of the transaction is delayed, the targeted final
completion of the project could also be delayed, which would result in higher
capital expenditure requirements for Reficar and a decrease in our
profitability. Additionally, if the start up of the upgraded
refinery is delayed, or if the upgraded refinery does not reach the expected
performance level in terms of the quality of products and/or volumes produced,
the project lenders could request that we act on the guarantee and assume the
payment obligations of Reficar, which would affect our operating results and
financial condition.
Risks
relating to our ADSs
The
market for our ADSs has only started to develop recently. An active
and liquid public market for our ADSs may not develop.
The
number of our outstanding ADSs has increased significantly since they began
trading on the New York Stock Exchange on September 18,
2008. Nevertheless, the number of outstanding ADSs is still
relatively small when compared to the number of our total outstanding
shares. Increases in the liquidity of the ADSs will depend on the
creation of new receipts by investors in the international market, which will in
turn depend largely on market conditions and the interest of new investors in
our Company.
In
addition, holders of ADSs may choose to cancel them and receive instead common
shares in an amount equivalent to that of the ADSs previously
held. Cancellation of a considerable number of ADSs may significantly
influence the development of an actively liquid market for our ADSs, which may
have a material adverse effect on the price of our ADSs.
Illiquid
or inactive trading markets generally result in higher price volatility and
lower efficiency in the execution of sale and purchase orders in the securities
markets. The market price of the ADSs may fluctuate significantly in
response to a number of factors, some of which may be beyond our
control. In the event that the trading price of our ADSs declines,
you may lose all or part of your investment in our ADSs.
17
Holders
of our ADSs may encounter difficulties in exercising their voting
rights.
Holders
of our common shares are entitled to vote on shareholder
matters. However, holders of our ADSs may encounter difficulties in
exercising some of the rights of shareholders if they hold our ADSs rather than
the underlying common shares. For example, holders of our ADSs are
not entitled to attend shareholders’ meetings, and can only vote by giving
timely instructions to the Depositary in advance of a shareholders’
meeting. Under Colombian law, we are not required to solicit proxies
from our existing shareholders and, therefore, you may not receive notice in
time to instruct the depositary to vote the shares.
We
believe that the holders of the ADSs should be able to direct the Depositary to
vote the common shares separately in accordance with their individual
instructions, particularly as this is the current interpretation of the Superintendencia de Sociedades
or Superintendency of Corporations; this issue has been the subject of
differing regulatory interpretations in the past and may be subject to differing
interpretations in the future. Under prior regulatory
interpretations, the Depositary could be required to vote the underlying common
shares in a single block (presumably reflecting the majority vote of the ADS
holders). In the future, the Colombian regulatory authorities may
change their interpretation as to how voting rights should be exercised by ADSs
holders, and if this were to occur any such limitation or loss could adversely
affect the value of such common shares and your ADSs.
Our
ADSs holders may be subject to restrictions on foreign investment in
Colombia.
Colombia’s
International Investment statute regulates the manner in which non-Colombian
residents can invest in Colombia and participate in the Colombian securities
market. Among other requirements, Colombian law requires foreign
investors to register certain foreign exchange transactions with the Colombian
Central Bank and outlines the necessary procedures to authorize certain types of
foreign investments. Colombian law requires that certain foreign
exchange transactions, including international investment in foreign currency
between Colombian residents and non-Colombian residents, must be made through
authorized foreign exchange market participants. Any income or
expenses under our ADR program must be made through the foreign exchange
market.
Investors
acquiring our ADRs are not required to register with the Colombian Central
Bank. Investors in ADRs who choose to surrender their ADRs and
withdraw common shares would have to register their investment in the common
shares as a foreign direct investment, in the event the investor does not own a
portfolio of investments in Colombia; or as a portfolio investment, in the event
the investor delivers such shares to a registered foreign capital investment
fund. Non-Colombian residents cannot directly hold portfolio
investments in Colombia, but are able to do so through a registered foreign
capital investment fund. Investors would only be allowed to transfer
dividends abroad after their foreign investment registration procedure with the
Colombian Central Bank has been completed. Investors withdrawing the
common shares may incur in expenses and/or suffer delays in the application
process. The failure of a non-resident investor to report or register
foreign exchange transactions with the Colombian Central Bank relating to
investments in Colombia on a timely basis may prevent the investor from
remitting dividends, or initiate an investigation that may result in a
fine. In the future, the Government, the Congress of Colombia or the
Colombian Central Bank may amend Colombia’s International Investment Statute or
the foreign investment rules, which could result in more restrictive rules and
could negatively affect trading of our ADSs.
Additionally,
Colombia currently has a free exchange rate system; however, other restrictive
rules for the exchange rate system could be implemented in the
future. In the event that a more restrictive exchange rate system is
implemented, the depositary may experience difficulties converting Peso amounts
into U.S. dollars to remit dividend payments.
Holders
of our ADSs are not able to effect service of process on us, our directors or
executive officers within the United States, which may limit your recovery in
any foreign judgment you obtain against us.
We are a
sociedad de economía
mixta organized under the laws of Colombia. All of our
directors and executive officers reside outside the United
States. All or a substantial portion of our assets and the assets of
these persons are located outside the United States. As a result, it
may not be possible for you to effect service of process within the United
States upon us or these persons or to enforce against us or them in U.S. courts
judgments obtained in such courts predicated upon the civil liability provisions
of the U.S. federal securities laws. Colombian courts determine
whether to enforce a U.S. judgment predicated on the U.S. securities laws
through a procedural system known as exequatur. For a
description of these limitations, see “Enforcement of Civil
Liabilities.”
18
We
may claim immunity under the Foreign Sovereign Immunities Act with respect to
actions brought against us under the US securities laws and your ability to sue
or recover may be limited.
We
reserve the right to plead sovereign immunity under the United States Foreign
Sovereign Immunities Act of 1976 with respect to actions brought against us
under United States federal securities laws or any state securities
laws. Accordingly, you may not be able to obtain a judgment in a U.S.
court against us unless the U.S. court determines that we are not entitled to
sovereign immunity with respect to that action. Moreover, you may not
be able to enforce a judgment against us in the United States except under the
limited circumstances specified in the Foreign Sovereign Immunities
Act.
The
protections afforded to minority shareholders in Colombia are different from
those in the United States, and may be difficult to enforce.
Under
Colombian law, the protections afforded to minority shareholders are different
from those in the United States. In particular, the legal framework
with respect to shareholder disputes is less developed under Colombian law than
U.S. law and there are different procedural requirements for commencing
shareholder lawsuits, such as shareholder derivative suits. As a
result, it may be more difficult for our minority shareholders to enforce their
rights against us or our Directors or controlling shareholder than it would be
for shareholders of a U.S. company.
The
relative volatility and illiquidity of the Colombian securities markets may
substantially limit our investors’ ability to sell our ADSs at the price and
time they desire.
Investing
in securities that are traded in emerging markets, such as Colombia, often
involves greater risk when compared to other world markets, and these
investments are generally considered to be more speculative in
nature.
The
Colombian securities market is substantially smaller, less liquid, more
concentrated and can be more volatile than other securities
markets. For example, the Bolsa de Valores de Colombia
or BVC had a market capitalization of approximately Ps$287,082 billion
(US$140.46 billion using the closing rate for 2009) as of December 31,
2009, a 47% increase when compared with the amount at the end of 2008, and a
trading volume of approximately Ps$114,380 million (US$53.1 million,
using the average exchange rate for 2009), a 151% increase when compared to the
volume in 2008. In contrast, the New York Stock Exchange had a market
capitalization of US$11.8 trillion as of December 31, 2009, and a
daily trading volume of approximately US$70.6 billion in 2009.
As of
December 31, 2009 our shares represented the highest market capitalization
of the BVC with 35% of the total. In addition, they had the highest
trading volume in the BVC averaging Ps$24,613 million traded per day. Our
shares represent 21.4% of the Índice General de la Bolsa de
Valores de Colombia or IGBC stock market index, 12.5% of the COL20, a
stock market index that includes the top 20 traded stocks in the BVC and 21.1%
of the COLCAP, a stock price volatility index.
Given the
current ownership of our shares, it may be difficult for you to purchase large
quantities of shares from a single shareholder. We cannot assure you
that a liquid trading market for our ADSs will develop or, if developed, will be
maintained following this offering, which could substantially limit the ability
of investors in our ADSs to sell them at the price and time you
desire.
We
are not required to disclose as much information to investors as a U.S. issuer
is required to disclose.
We are
subject to the reporting requirements of the Superintendency of Finance and the
BVC. The corporate disclosure requirements that apply to us may not
be equivalent to the disclosure requirements that apply to a U.S. issuer and, as
a result, you may receive less interim information about us than you would
receive from a U.S. issuer.
19
|
ITEM 4.
|
Information
on the Company
|
|
4.A.
|
History
and Development of the Company
|
Ecopetrol
is a mixed economy company, organized on August 25, 1951, and existing
under the laws of Colombia. We have an unlimited
duration. Our address is Carrera 13 No. 36-24 Bogota, Colombia
and our telephone number is +571 234 4000.
We were
incorporated as the Empresa Colombiana de Petróleos as a result of the reversion
of the De Mares concession to the Government by the Tropical Oil Company in
1921. We began our operations as a governmental industrial and
commercial company, responsible for administering Colombia’s hydrocarbon
resources.
We began
operating the crude oil fields at Cira-Infantas and the pipeline that connected
that field with the Barrancabermeja refinery and the port of
Cartagena. Three years later, the first national seismic study was
performed under the De Mares concession which led to the discovery of the
Llanito crude oil field in 1960.
In 1961,
we assumed the direct operation of the Barrancabermeja refinery and continued
its transformation into an industrial complex. International
Petroleum Colombia Limited or Intercol began the construction of a new facility
in Mamonal, Cartagena, where the pipeline terminal of the Andean National
Corporation was already located and which also included a loading
port. In December 1957, the Cartagena refinery began operations,
and in 1974 it was acquired by us.
In 1970,
we adopted our first by-laws that transformed us into a governmental industrial
and commercial company, linked to the Ministry of Mines and
Energy. Decree Law 1760 of June 26, 2003 transformed us
from an industrial and commercial company into a state-owned corporation by
shares linked to the Ministry of Mines and Energy and renamed us Ecopetrol S.A.
in order to make us more competitive. Prior to our reorganization our
capital expenditures program and access to the credit markets were limited by
the Government which was making its decisions based on its budgetary needs and
not on our growth prospects.
In 2006,
the Congress of Colombia authorized us to issue up to 20% of our capital stock
in Colombia, subject to the condition that the Nation control at least 80% of
our capital stock. On November 13, 2007, we placed
4,087,723,771 shares in the BVC, which resulted in 482,941 new shareholders
and raised approximately Ps$5,723 billion for the sale of 10.1% of our
capital stock. Since September 18, 2008, our ADS’s have been
trading in the New York Stock Exchange under the symbol “EC”. In
addition, on December 4, 2009, our ADSs began trading on the Lima Stock
Exchange under the symbol “EC”. Each ADS represents 20 common shares
of the Company.
In
April 2008, we completed the acquisition of Polipropileno del Caribe S.A.
(Propilco), the main polypropylene supplier in Colombia, for the purchase price
of approximately US$690 million, thereby increasing our market share in the
petrochemical business. We acquired 49% of Propilco’s shares directly
and the remaining 51% indirectly, through our subsidiary Andean Chemicals
Ltd.
In July
2008, we, through our Panamanian subsidiary ODL Finance, acquired a 65% interest
in Oleoducto de los Llanos Orientales (“ODL”). ODL is a company
which, through its Colombian branch Oleoducto de los Llanos Orientales Sucursal
Colombia, has built a crude oil pipeline, connecting the Rubiales field to the
Monterrey pump station. See Item 4B — “Business Overview —
Transportation” for further details on this pipeline.
In
February 2009, we, in partnership with Korea National Oil Corporation
(KNOC), acquired a 100% stake (50% for each participating company) in Offshore
International Group Inc. (OIG) for the purchase price of
US$992 million. OIG is the U.S. parent of Savia Perú (formerly
Petrotech Peruana S.A.), which carries out crude oil exploration and production
activities in Perú.
In
February 2009, we entered into a memorandum of understanding with Glencore
International A.C. pursuant to which we acquired in May 2009 all of its
stake in Reficar through our subsidiary Andean Chemicals for the purchase price
of US$545 million, thereby becoming the sole indirect owner of
Reficar.
20
In
March 2009, we entered into an agreement with Maurel et Prom pursuant to
which we acquired in May 2009 100% of its stake in its subsidiary in
Bermuda, Hocol Petroleum Limited, for the purchase price of US$580 million
plus US$162 million for working capital. Hocol Petroleum
Limited’s most important assets are Hocol and Homcol, two companies incorporated
in the Cayman Islands with branches in Colombia involved in crude oil and
natural gas exploration and production activities in Colombia.
In
March 2009, we entered into an agreement with Enbridge Inc., a Canadian
company, pursuant to which we acquired 100% of its stake in Oleoducto Central
S.A. (Ocensa) for the purchase price of approximately US$418 million,
thereby increasing our ownership of Ocensa from 35.3% to 60%.
These
recent acquisitions were funded mainly through cash on hand and cash flow from
our operations.
Currently,
we are the largest company in Colombia as measured by revenue, profit, assets
and shareholders’ equity. We are Colombia’s only
vertically-integrated crude oil and natural gas company with operations in
Colombia and overseas. Our operation does not include natural gas
transportation activities due to legal restrictions.
|
4.B.
|
Business
Overview
|
Strategic
Plan
Our 2008
– 2015 Strategic Plan focuses on transforming us into a global company with
emphasis on crude oil, natural gas and the development of alternative
fuels. We are committed to developing into a key player with high
competitive standards, strong human resources and transparent social
responsibility policies. We intend to become one of Petroleum Intelligence
Weekly’s 27 leading oil and natural gas companies.
Our
strategic plan provides detailed initiatives for each one of our business
segments. Our main objectives are to achieve a daily output of
approximately 1 million boe by 2015 and a reserves addition of
2,110 million barrels of oil equivalent or boe by 2012. We are
also planning on expanding our refining and conversion capacity and increasing
our petrochemical production, while complying with local and international
environmental standards.
We expect
to fund our strategic initiatives through cash on hand and cash flow from
operating activities. We also expect to access the local and
international capital markets to fund part of our expansion. During
2009, we began to incur long-term debt, (i) entering into a
Ps$2.2 trillion (approximately US$1 billion) syndicated loan facility
with a syndicate of local banks in May 2009 and (ii) issuing
US$1.5 billion aggregate principal amount of 7.625% notes due 2019 on
July 23, 2009 under Rule 144A/Regulation S with registration
rights with the SEC (which notes were subsequently registered with the
SEC). In addition, Oleoducto de los Llanos Orientales (“ODL”), our
indirect Panamanian subsidiary, through its Colombian branch office, Oleoducto
de los Llanos Orientales Sucursal Colombia, (i) entered into a
Ps$520,000 million (approximately US$200 million) loan facility with
Grupo Aval (composed of Banco de Bogota S.A., Banco de Occidente S.A., Banco
Popular S.A. and Banco AV Villas S.A.) in March 2009, (ii) placed a
series of notes in an aggregate principal amount equal to
Ps$500,000 million (approximately US$260 million) through the Dutch
Auction System in October 2009 and (iii) entered into a second
Ps$800,000 million (approximately US$406 million) loan facility with
Grupo Aval in May 2010 (which proceeds were used to fully pay the first credit
facility with Grupo Aval and any remaining amount was allocated to finance part
of the Rubiales pipeline described in Item 4B – “Business Overview –
Transportation – Pipelines – Oleoducto de los Llanos Orientales”
below). We believe that we will be able to access local and
international markets when the need arises. We are also authorized by
law 1118 of 2006 to sell an additional 9.9% of our equity, which could be used
to complete funding our strategic plan. See Item 5B — “Liquidity
and Capital Resources — Liquidity” for a description of our liquidity and
capital resources.
We expect
to achieve our strategy together with our joint venture partners with whom we
have built long-term relationships. We are also working with foreign
governmental authorities in countries where we already have operation or where
we intend to develop operations.
21
Exploration
and Production
We intend
to continue the expansion of our exploration and production activities and enter
into new joint ventures to further develop our business. We intend to
become a global player with the capacity to increase reserves and production of
crude oil and natural gas in a sustainable way, entering frontier on-shore and
off-shore areas. In line with our development strategy, we intend to
increase our average daily production of hydrocarbons to one million boe
per day by the year 2015. By 2015, we estimate our total investment
in exploration activities at US$11 billion and in production activities at
US$27 billion for a total of US$38 billion.
Increase
our average daily production of hydrocarbons
Our 2008
– 2015 Strategic Plan contemplates estimated capital expenditures of
approximately US$38 billion in exploratory and development activities in
Colombia and abroad. Our goals are to increase our reserves by
2,110 million boe by 2012 and to increase our daily output of hydrocarbons
to one million boe per day by 2015. From 2008 to 2015, we
estimate spending approximately US$11 billion in exploratory activities in
Colombia and abroad. We estimate that we will need to incorporate
approximately 435 million boe of proved reserves per year from a
combination of exploratory drilling, acquisition of reserves in place and
incorporation of new reserves from existing fields to achieve our
one million boe per day production target.
Between
2008 and 2015, we plan to invest approximately US$16 billion in production
projects, including development of mature fields, increasing production of heavy
crude oil and development of natural gas fields. In addition, during
the course of the same period, we intend to invest approximately
US$11 billion to execute our growth strategy by selectively entering into
joint ventures with major international and regional crude oil companies to bid
for new exploration and production blocks on-shore and off-shore within and
outside Colombia. In 2009, our capital expenditures in our
exploration and production segment were Ps$5,564,438 million (approximately
US$2.72 billion).
For 2008
and 2009, our capital expenditures in our exploration and production segment
were Ps$10,476 billion (approximately
US$5.125 billion). During the same period, we increased our
proved reserves by 623 million boe. In 2009 alone, we produced a
daily average of 521 thousand boe representing an increase of 30% compared to
2007.
Refining
and Petrochemicals
Expand
our refining capacity in the Barrancabermeja refinery and Reficar and increase
our production of petrochemicals
We intend
to expand and modernize our refining capacity in the Barrancabermeja refinery
and Reficar in order to reach a 95% conversion rate. Our goal is to
process approximately 650 thousand bpd by 2015. The
implementation of this initiative will allow us to increase production of
refined products and improve the efficiency of and upgrade existing facilities
in order to reach higher margins in our refining segment. Our
strategic plan contemplates the investment of approximately US$11 billion
in the upgrade and expansion of our refineries. We expect to invest
approximately US$4 billion to increase our production of petrochemicals and
reach 2.7 million tons per year by 2015, including 700,000 tons per year of
polypropylene produced by Polipropileno del Caribe S.A.
(Propilco). For 2008 and 2009, our capital expenditures in our
refining and petrochemicals segment were Ps$3,487 billion (approximately
US$1.706 billion), mainly due to our acquisition of the remaining 51%
ownership of Reficar and resulting from our commitment to provide cleaner
fuels. In 2009 alone, our capital expenditures in our refining and
petrochemicals segment were Ps$2,711 billion (approximately
US$1,326 million).
Transportation
Development
of our transportation infrastructure
We plan
to implement a transportation infrastructure program focused on the construction
of crude oil pipelines and multipurpose transportation systems to assure our
transportation capacity. We intend to invest approximately
US$1.2 billion in the construction and upgrading of our transportation
infrastructure to meet our future requirements and in the conversion of existing
crude oil pipelines for the transportation of heavy crude oil. For
2008 and 2009, our capital expenditures in our Transportation segment were
Ps$3,210 billion (approximately US$1.570 billion). In 2009
alone, our capital expenditures in our transportation segment were
Ps$2,270 billion (approximately US$1.110 billion), including the
acquisition of Embridge’s stake in Ocensa. We anticipate making
further investments in our transportation segment in the near future because our
production has grown at faster levels than expected.
22
Market
and Supply
Selectively
expand our activities into the retail segment
Our
marketing strategy is focused on supplying the local market and exporting crude
oil, refined products and natural gas to end-users, including refineries and
wholesalers in order to improve our margins. We are focused on
increasing our market participation in crude oil and refined products in the Far
East. We are currently opening new markets for our products, such as
China, India, Nigeria and Angola. Our 2008 – 2015 Strategic Plan
contemplates investments of approximately US$3 billion in the retail
sector, and we have been evaluating on a selective basis the prospect of
entering into retail markets in Colombia.
Our
principal export market in 2009 was the US market. Currently, we
maintain short-term crude oil supply contracts with Valero, ConocoPhillips and
Tesoro Refining, as well as supply contracts for refined products with Refineria
Dominicana de Petróleo S.A., and Berkshire, and a natural gas supply agreement
with PDVSA.
Based on
our natural gas production growth projections, we expect to increase our sales
by focusing on deliveries of compressed natural gas for motor vehicles and
industrial users, which have high demand.
Others
Expand
our operations in the renewable energy market
We intend
to participate in the renewable energy market in Colombia with local investors
with whom we have undertaken the development of a refinery to process palm oil
and sugar cane for bio-fuels. Our plan calls for investment of
US$570 million in these initiatives. See Item 4B —
“Business Overview — Environmental Matters.”
Capital
Expenditures
Our
consolidated capital expenditures during 2009 amounted to
Ps$10,750,197 million compared to Ps$6,704,595 million in 2008 and
Ps$3,036,962 million in 2007. The most significant increase in
our capital expenditures has been in our refining and petrochemicals segment
which increased 249.3% in 2009 to Ps$2,710,526 million from
Ps$776,080 million in 2008, and 231% in 2008 when compared to Ps$234,462
million in 2007. We plan to meet our budgeted capital expenditures
primarily through existing cash on hand, cash from operating activities and
financings in the local and international financial markets. We may
access equity markets through the issuance of an additional 9.9% of our common
stock as authorized by Law 1118 of 2006.
At
March 31, 2010, our unaudited consolidated capital expenditures were
approximately Ps$1,381 billion. These capital expenditures were
funded mainly by our cash on hand and cash flow from our
operations.
We
currently have capital expenditures commitments locally and
abroad. The most significant capital expenditures are within our
exploration, production, transportation and refining segments. See
Note 31 to our consolidated financial statements for a description of our
principal commitments.
Overview
We are a
vertically integrated oil company operating in Colombia and
overseas. We are majority owned by the Nation and our shares trade on
the BVC under the symbol ECOPETROL and in the New York Stock Exchange and the
Lima Stock Exchange under the symbol “EC”. We divide our operations
into four business segments that include exploration and production;
transportation; refining; and marketing and supply. We are the
largest corporation in Colombia, as measured by assets, sales, net income and
net worth, and we play a key role in the local energy supply
market.
23
Overview
by Business Segment
Exploration
and Production
Summary
Our
exploration and production business segment includes exploration, development
and production activities in Colombia and abroad. We began local
exploration in 1955 and international exploration in 2006. We conduct
exploration and production activities directly and through joint ventures with
third parties. We are the largest producer of crude oil and natural
gas, the largest operator, and at December 31, 2009, we maintained the most
acreage under exploration in Colombia.
According
to the ANH, Colombia has 23 sedimentary basins, and at December 31, 2009,
we had exploratory activities in 15 of them. The following map shows
the basins where we conduct exploratory activities.
24
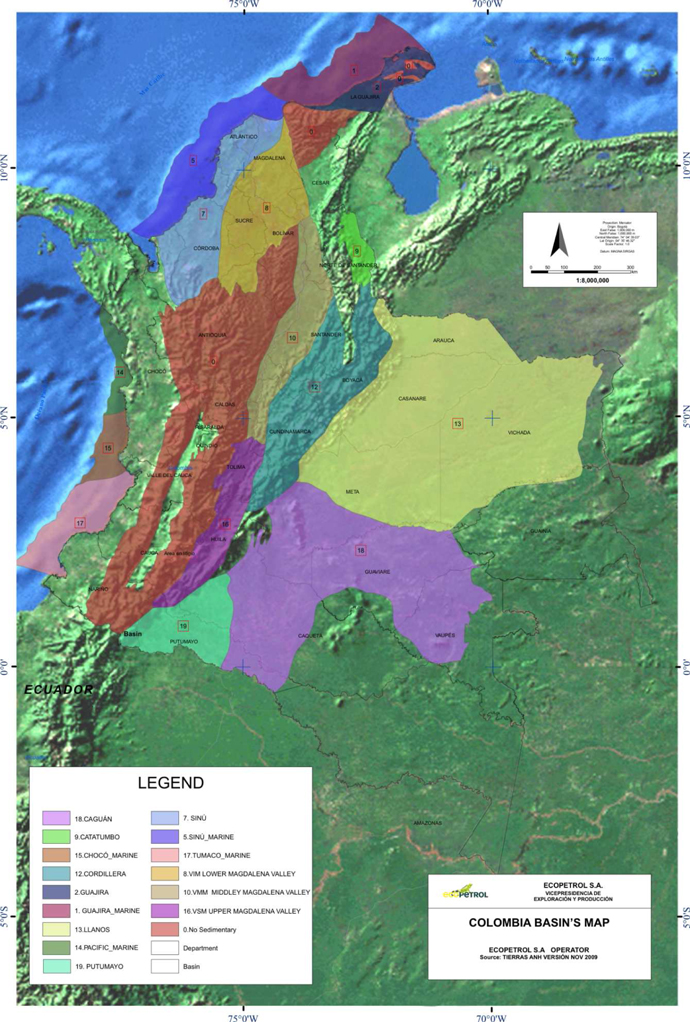
25
We have
organized our production activities into five administrative
regions. The administrative regions, and their respective 2009
results, are:
Northeastern Region – The
Northeastern region is comprised of two areas, one located in the north of
Colombia along the Atlantic coast and the other located in the Piedemonte
Llanero. The Northeastern region covers approximately
439,151 acres, and includes the natural gas fields located at La Guajira
and the crude oil and natural gas fields located in
Cusiana-Cupiagua. In 2009, the Northeastern region had a total
production of approximately 36.8 thousand bpd of crude oil and
494 million cubic feet per day or mcfpd of natural gas. At
December 31, 2009, we had 543.4 million boe of net proved reserves of
crude oil and natural gas located in this region.
Mid-Magdalena Valley Region –
The Mid-Magdalena Valley region runs along the Magdalena river valley and covers
approximately 1,580,093 acres. The Mid-Magdalena Valley region
includes the crude oil fields located in the Santander department and part of
the Antioquia, Cesar and Boyacá departments near the Barrancabermeja
refinery. The Mid-Magdalena Valley region has a total production of
approximately 73.4 thousand bpd of heavy and light crude oil and 23.5 mcfpd
of natural gas. At December 31, 2009, we had 252.7 million
boe of net proved reserves of crude oil and natural gas located in this
region.
Central Region – The Central
region is located in Colombia’s central region and includes the Meta department
and part of the Casanare department. The Central region covers
approximately 666,369 acres and has a total production of approximately
155.9 thousand bpd of heavy and medium crude oil and 3.9 mcfpd of natural
gas. At December 31, 2009, we had 438.7 million boe of net
proved reserves of crude oil and natural gas located in this
region.
Catatumbo-Orinoquía Region –
The Catatumbo-Orinoquía region is located in the eastern part of Colombia and
runs along the border with Venezuela covering approximately
651,005 acres. The Catatumbo-Orinoquía region includes the Caño
Limón crude oil field and the Gibraltar natural gas field with a total
production of approximately 70 thousand bpd of crude oil and 0.6
mcfpd. At December 31, 2009, we had 94.3 million boe of net
proved reserves of crude oil and natural gas located in this
region.
Southern Region – The
Southern region is located on the southwestern region of Colombia and covers
approximately 1,718,132 acres. The Southern region includes the
Orito, Guando and Neiva fields located mainly in the Cundinamarca, Huila and
Putumayo departments. The Southern region has a total production of
approximately 62 thousand bpd of crude oil and 5.1 mcfpd of natural
gas. At December 31, 2009, we had 112.8 million boe of net
proved reserves of crude oil and natural gas located in this
region.
In
addition to the administrative regions mentioned above, we have established a
Minor Fields Area that covers some of our small fields throughout the
country. The main purpose of this Minor Fields Area is to establish
strategies adequate enough to improve efficiency in the production of reserves
from these small fields. The total production of the Minor Fields
Area during 2009 was 7.2 thousand bpd of crude oil and 1.94 mcfpd of
natural gas. This production corresponds to 71 fields located in
Mid-Magdalena Valley, Central, Catatumbo-Orinoquía and the Southern
regions.
26
The map
below indicates the location of our operations in Colombia.
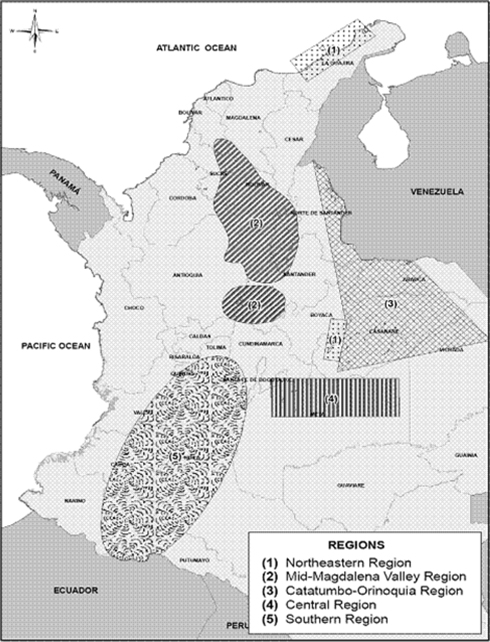
Strategy
Our main
objectives in exploration and production in Colombia and abroad are to increase
our crude oil and natural gas reserves and reach a production of
one million boe per day in 2015, by:
|
|
·
|
Investing
in high potential hydrocarbon areas in Colombia and
abroad;
|
|
|
·
|
Selectively
acquiring reserves;
|
|
|
·
|
Implementing
new strategies and deploying state-of-the art technologies to increase
reserve recovery of new and mature
fields;
|
|
|
·
|
Investing
in the development of natural gas and heavy crude oil;
and
|
27
|
|
·
|
Entering
into new joint ventures with regional and international oil companies in
Colombia and abroad.
|
Exploration
Our
exploration plan in Colombia is focused on exploration of existing production
sites in close proximity, exploration of currently producing basins and
exploration of frontier areas, including off-shore areas, which have the
potential for substantial findings. Our exploration strategy outside
of Colombia is focused on prospects for greater findings and establishing joint
ventures with experienced operators.
Exploration
Activities in Colombia
We
conduct exploration in Colombia on our own and through joint ventures with
regional and international oil and gas companies. We also benefit
from sole risk contracts when commercial reserves are found. In the
case of sole risk contracts, we do not take any exploration risk.
In 2009,
we acquired 4,433 equivalent kilometers of seismic in Colombia, corresponding to
2,184 kilometers of 2D seismic and 2,249 equivalent kilometers of 3D
seismic. Ecopetrol directly acquired 3,095 of those kilometers of
seismic and 1,338 were acquired by our business
partners. Additionally, operators of sole risk contracts acquired 627
equivalent kilometers of seismic, corresponding to 231 kilometers of 2D seismic
and 396 kilometers of 3D seismic.
Exploration
Activities Outside of Colombia
Our
international exploration strategy is focused on securing blocks available for
exploration and entering into joint ventures with international and regional oil
companies. Exploring outside Colombia will allow us to diversify our
risk and improve the possibilities for increasing our crude oil and natural gas
reserves. In December 2006, the incorporation of Ecopetrol Oleo
e Gas do Brasil Ltda., our first foreign subsidiary, represented a milestone in
our international expansion and our consolidation as an international oil and
gas company. In 2007, two new subsidiaries were incorporated,
Ecopetrol del Perú and Ecopetrol America Inc.
In
March 2009, our subsidiary, Ecopetrol America Inc., participated in the
Gulf of Mexico Lease Sale 208, carried out by the Mineral Management Service of
the United States (the “MMS,” now the Bureau of Ocean Energy, Management,
Regulation and Enforcement (the “BOE”)). As part of this sale, the
MMS awarded 22 exploratory blocks to Ecopetrol America Inc., six of them in
association with Repsol, four in association with Eni and four in association
with Stone. In the remaining eight blocks, Ecopetrol America has a
100% ownership interest. Drilling in the Gulf of Mexico has been
affected by the Gulf spill. See Item 3D — “Risk Factors — Risks
related to our business”.
In 2009,
our international subsidiaries drilled three wells. One well was
drilled in Brazil, with our business partners Repsol and Hess, which
respectively have 40% and 30% ownership interests, and of which we have the
remaining 30% ownership interest. Two wells were drilled in the Gulf
of Mexico: the first well was drilled with our business partners Eni
and Gdf Suez, which respectively have 53% and 25% ownership interests, and of
which we have the remaining 22% ownership interest; the second well was drilled
with our business partners BP, Moesx and Hess, which respectively have 60%, 15%
and 10% ownership interests, and of which we have the remaining 15% ownership
interest. Of the three wells drilled, two found the presence of
hydrocarbons but were not considered commercially successful, and the third well
was dry. Also, in 2009, we acquired 4,810 equivalent kilometers of
seismic data internationally, corresponding to 249 equivalent kilometers of 2D
seismic and 4,561 equivalent kilometers of 3D seismic.
Also,
during 2009, Ecopetrol Oleo e Gas do Brasil Ltda secured a farm-in agreement in
the BM-ES-30 (Hess) block, which is located in the Espirito Santo basin of the
Brazilian off-shore. Ecopetrol del Perú also carried out farm-in
agreements with Petrobras (Bloque 110 y 117) and Talisman (Bloque
158).
Finally,
in 2009, Savia Perú, our 50% -owned affiliate, drilled two exploratory wells
(one net well), one of which was productive (one-half net
well).
28
The
following table sets forth the number of gross and net exploratory wells drilled
by us and our joint venture partners, and the exploratory wells drilled by third
parties under a sole risk contract for the years ended December 31, 2009,
2008 and 2007.
|
For the year ended December 31,
|
||||||||||||
|
2009
|
2008
|
2007
|
||||||||||
|
COLOMBIA
|
||||||||||||
|
Ecopetrol
|
||||||||||||
|
Gross
Exploratory Wells
|
||||||||||||
|
Owned
and operated by Ecopetrol
|
||||||||||||
|
Productive(1)
|
2 | 4 | 1 | |||||||||
|
Dry(2)
|
7 | 6 | 3 | |||||||||
|
Total
|
9 | 10 | 4 | |||||||||
|
Operated
by Ecopetrol in Joint Venture
|
||||||||||||
|
Productive
|
- | 1 | 1 | |||||||||
|
Dry
|
- | 0 | 2 | |||||||||
|
Total
|
- | 1 | 3 | |||||||||
|
Operated
by Partner in Joint Venture
|
||||||||||||
|
Productive
|
3 | 1 | – | |||||||||
|
Dry
|
3 | 1 | 5 | |||||||||
|
Total
|
6 | 2 | 5 | |||||||||
|
Net
Exploratory Wells
|
||||||||||||
|
Productive
|
3.2 | 5 | 1.4 | |||||||||
|
Dry
|
8.2 | 6.4 | 5.6 | |||||||||
|
Total
|
11.4 | 11.4 | 7 | |||||||||
|
Sole Risk(3)
|
||||||||||||
|
Productive
|
4 | 8 | 8 | |||||||||
|
Dry
|
5 | 12 | 13 | |||||||||
|
Total
|
9 | 20 | 21 | |||||||||
|
Hocol
|
||||||||||||
|
Gross
Exploratory Wells
|
||||||||||||
|
Productive
|
1 | - | - | |||||||||
|
Dry
|
2 | - | ||||||||||
|
Total
|
3 | - | - | |||||||||
|
Net
Exploratory Wells
|
||||||||||||
|
Productive
|
0.2 | - | - | |||||||||
|
Dry
|
2 | - | - | |||||||||
|
Total
|
2.2 | - | ||||||||||
|
INTERNATIONAL
|
||||||||||||
|
Ecopetrol
America Inc.
|
||||||||||||
|
Gross
Exploratory Wells
|
||||||||||||
|
Productive
|
- | - | - | |||||||||
|
Dry
|
2 | 1 | - | |||||||||
|
Total
|
2 | 1 | - | |||||||||
|
Net
Exploratory Wells
|
||||||||||||
|
Productive
|
- | - | ||||||||||
|
Dry
|
0.4 | 0.3 | - | |||||||||
|
Total
|
0.4 | 0.3 | - | |||||||||
|
Ecopetrol
Oleo e Gas do Brasil
|
||||||||||||
|
Gross
Exploratory Wells
|
||||||||||||
|
Productive
|
0 | - | - | |||||||||
|
Dry
|
1 | - | - | |||||||||
|
Total
|
1 | - | - | |||||||||
|
Net
Exploratory Wells
|
||||||||||||
|
Productive
|
- | |||||||||||
|
Dry
|
0.3 | - | - | |||||||||
|
Total
|
0.3 | - | - | |||||||||
|
Ecopetrol
del Perú
|
||||||||||||
|
Gross
Exploratory Wells
|
||||||||||||
|
Productive
|
- | - | - | |||||||||
|
Dry
|
- | 1 | - | |||||||||
|
Total
|
- | 1 | - | |||||||||
|
Net
Exploratory Wells
|
||||||||||||
|
Productive
|
- | - | ||||||||||
|
Dry
|
- | 0.5 | - | |||||||||
|
Total
|
- | 0.5 | - | |||||||||
|
Savia
Perú
|
||||||||||||
|
Gross
Exploratory Wells
|
||||||||||||
|
Productive
|
1 | - | - | |||||||||
|
Dry
|
1 | - | - | |||||||||
|
Total
|
2 | - | - | |||||||||
|
Net
Exploratory Wells
|
||||||||||||
|
Productive
|
0.5 | |||||||||||
|
Dry
|
0.5 | - | - | |||||||||
|
Total
|
1 | - | - | |||||||||
29
|
(1)
|
A
productive well is an exploratory well that is not a dry
well.
|
|
(2)
|
A
dry well or hole is an exploratory well found to be incapable of producing
either crude oil or natural gas in sufficient quantities to justify
completion as a crude oil or natural gas
well.
|
|
(3)
|
We
do not take any risk in sole risk contracts but we benefit from successful
exploratory efforts. See Item 4 — “Overview of Exploration
and Production Contractual
Arrangements.”
|
Production
Our
average daily production of hydrocarbons in 2009 totaled 520.6 thousand
boed, of which 426 thousand bpd corresponded to crude oil and
94.6 thousand boed corresponded to natural gas. This production
includes the production of our subsidiaries and affiliates: Hocol
S.A., Ecopetrol America Inc. and Savia Perú S.A. on a pro rata
basis.
During
2009, we produced 419.8 thousand bpd of crude oil in Colombia through
Ecopetrol S.A. and Hocol, of which 205.9 thousand bpd came from fields we
directly operate and of which 213.9 thousand bpd came from our participation in
joint ventures, shared risk agreements and other contractual arrangements with
our business partners.
During
2008, our average daily production of hydrocarbons totaled 447 thousand
boed, of which 362 thousand bpd corresponded to crude oil and
85 thousand boed corresponded to natural gas. Our average daily
production of hydrocarbons in 2007 was 399 thousand boed, of which
327 thousand bpd corresponded to crude oil and 72 thousand boed to
natural gas.
Our
production during 2009 consisted of approximately 66% light and medium crudes
(with a gravity between 16º and 35º American Petroleum Institute or API) and 34%
of heavy crudes, with a gravity lower than 15° API.
Our crude
oil and natural gas production in 2009 includes 99 fields directly operated
by us and 167 fields in joint venture with 40 oil companies. At
December 31, 2009, we were the largest participant in the Colombian
hydrocarbons industry with approximately 63% of crude oil production and
approximately 52% of natural gas production.
30
We
produce crude oil and natural gas in all of our regions. The
Northeastern region has significant production of natural gas and light crude
oil while the Central region and the southern part of the Mid-Magdalena Valley
region have the most significant production and prospects of heavy crude oil,
and currently produce light and medium crude oil. The
Catatumbo-Orinoquía region has significant production of medium crude oil and
the Southern region has production of medium and light crude oil.
We
undertook development drilling in the producing regions and applied new
technologies, allowing us to drill 165 gross development wells operated by us in
Colombia in 2009, 19 more than in 2008 and 45 more than in 2007. Of
the total gross development wells drilled in 2009, two were dry wells, one
located in the Catatumbo-Orinoquia region, and the other in the Southern
region. There were seven dry development wells in 2008 and five dry
development wells during 2007.
Relevant
operational activities
The
following table sets forth the number of gross and net development wells drilled
exclusively by us and in joint ventures for the years ended December 31,
2009, 2008 and 2007.
|
For the year ended December 31,
|
||||||||||||
|
2009
|
2008
|
2007
|
||||||||||
|
COLOMBIA
|
||||||||||||
|
Ecopetrol
|
||||||||||||
|
Northeastern
Region:
|
||||||||||||
|
Gross
wells owned and operated by Ecopetrol
|
– | – | – | |||||||||
|
Gross
wells in Joint Ventures(1)
|
6 | 1 | 2 | |||||||||
|
Net
Wells
|
3 | 1 | 1 | |||||||||
|
Mid-Magdalena
Valley Region:
|
||||||||||||
|
Gross
wells owned and operated by Ecopetrol
|
100 | 90 | 77 | |||||||||
|
Gross
wells in Joint Ventures
|
249 | 344 | 153 | |||||||||
|
Net
Wells
|
227 | 285 | 146 | |||||||||
|
Central
Region:
|
||||||||||||
|
Gross
wells owned and operated by Ecopetrol
|
46 | 41 | 29 | |||||||||
|
Gross
wells in Joint Ventures
|
115 | 66 | 17 | |||||||||
|
Net
Wells
|
113 | 79 | 38 | |||||||||
|
Catatumbo-Orinoquía
Region:
|
||||||||||||
|
Gross
wells owned and operated by Ecopetrol
|
4 | 5 | 8 | |||||||||
|
Gross
wells in Joint Ventures
|
12 | 59 | 53 | |||||||||
|
Net
Wells
|
10 | 36 | 36 | |||||||||
|
Southern
Region:
|
||||||||||||
|
Gross
wells owned and operated by Ecopetrol
|
7 | 10 | 6 | |||||||||
|
Gross
wells in Joint Ventures
|
48 | 36 | 58 | |||||||||
|
Net
Wells
|
23 | 27 | 33 | |||||||||
|
Hocol
|
||||||||||||
|
Gross
wells owned and operated by Hocol
|
8 | - | - | |||||||||
|
Gross
wells in Joint Ventures
|
1 | - | - | |||||||||
|
Net
Wells
|
8 | - | - | |||||||||
|
Total
Gross wells owned and operated in Colombia
|
165 | 146 | 120 | |||||||||
|
Total
Gross wells in Joint Ventures in Colombia
|
431 | 506 | 283 | |||||||||
|
Total
Net Wells (Colombia)
|
384 | 428 | 254 | |||||||||
|
INTERNATIONAL
|
||||||||||||
|
Savia
Perú
|
||||||||||||
|
Gross
wells
|
5 | - | - | |||||||||
|
Net
Wells
|
5 | - | - | |||||||||
|
Total
Gross Wells (International)
|
5 | - | - | |||||||||
|
Total
Net Wells (International)
|
5 | - | - | |||||||||
31
|
(1)
|
Net
wells correspond to the sum of wells entirely owned by us and our
ownership percentage of wells owned in joint venture with our
partners.
|
Production
Activities in Colombia
As a
result of our 2008 – 2015 Strategic Plan and our investments in production
activities, our average daily production of crude oil in Colombia reached 419.8
thousand bpd in 2009, a 16% increase compared to 2008 and a 29% increase when
compared to 2007. The increase in our average daily production is due
to a 12.6% increase in production from fields developed with our business
partners, which totaled 213.9 thousand bpd in 2009 from 189.9 thousand bpd in
2008, and a 19.9% increase from fields operated by us, which totaled a
205.9 thousand bpd in 2009 compared to 171.7 thousand bpd in
2008.
The
following table sets forth our average daily crude oil production, average sales
price and average production costs (lifting costs) for the years ended
December 31, 2009, 2008 and 2007.
|
For the Year ended December 31
|
||||||||||||
|
2009
|
2008
|
2007
|
||||||||||
|
(thousand
bpd)
|
||||||||||||
|
COLOMBIA
|
||||||||||||
|
Ecopetrol
|
||||||||||||
|
Northeastern
region:
|
||||||||||||
|
Joint
venture operation
|
36.9 | 40.4 | 47.5 | |||||||||
|
Direct
operation
|
— | — | — | |||||||||
|
Total
Northeastern region
|
36.9 | 40.4 | 47.5 | |||||||||
|
Mid-Magdalena
Valley region:
|
||||||||||||
|
Joint
venture operation
|
16.9 | 15.1 | 12.7 | |||||||||
|
Direct
operation
|
56.6 | 50.7 | 39.4 | |||||||||
|
Total
Mid-Magdalena Valley region
|
73.4 | 65.8 | 52.1 | |||||||||
|
Central
region:
|
||||||||||||
|
Joint
venture operation
|
44.5 | 28.6 | 15.3 | |||||||||
|
Direct
operation
|
111.5 | 93.7 | 82.8 | |||||||||
|
Total
Central region
|
156.0 | 122.3 | 98.1 | |||||||||
|
Catatumbo-Orinoquía
region:
|
||||||||||||
|
Joint
venture operation
|
67.1 | 70.9 | 64.9 | |||||||||
|
Direct
operation
|
2.9 | 3.0 | 6.0 | |||||||||
|
Total
Catatumbo-Orinoquia region
|
70.0 | 73.9 | 70.9 | |||||||||
|
Southern
region:
|
||||||||||||
|
Joint
venture operation
|
35.4 | 33.6 | 35.2 | |||||||||
|
Direct
operation
|
26.6 | 24.3 | 22.9 | |||||||||
|
Total
Southern region
|
62.0 | 57.9 | 58.1 | |||||||||
|
Minor
Fields:
|
||||||||||||
|
Joint
venture operation
|
6.6 | — | — | |||||||||
|
Direct
operation
|
0.5 | — | — | |||||||||
|
Total
Minor Fields
|
7.2 | — | — | |||||||||
|
Hocol
S.A(1)
|
||||||||||||
|
Joint
venture operation
|
6.3 | — | — | |||||||||
|
Direct
operation
|
7.8 | — | — | |||||||||
|
Total
Hocol
|
14.1 | — | — | |||||||||
|
Production
Tests
|
0.3 | 1.3 | — | |||||||||
|
Total
Average Daily Crude Oil Production (Colombia)
|
419.8 | 361.6 | 326.7 | |||||||||
|
INTERNATIONAL
|
||||||||||||
|
Savia
Perú
|
5.3 | — | — | |||||||||
|
Ecopetrol
America
|
0.9 | 0.3 | — | |||||||||
|
Total
Average Daily Crude Oil Production (International)
|
6.2 | 0.3 | — | |||||||||
|
TOTAL AVERAGE DAILY CRUDE OIL
PRODUCTION
|
426.0 | 361.9 | 326.6 | |||||||||
|
Crude
Oil Average Sales Price
|
||||||||||||
|
(U.S.
dollars per barrel)(2)
|
60.86 | 85.30 | 65.10 | |||||||||
|
Crude
Oil Average Sales Price
|
||||||||||||
|
(Ps$
per barrel)(2)
|
131,059 | 167,797 | 135,173 | |||||||||
|
Aggregate
Average Lifting Costs of Crude Oil
(U.S. dollars
per barrel)(3)
|
8.27 | 8.33 | 7.22 | |||||||||
|
Aggregate
Average Lifting Costs of Crude Oil
(Ps$ per
barrel)(3)
|
17,825 | 16,376 | 15,057 | |||||||||
32
|
(1)
|
Hocol
and Savia Perú production figures correspond to their
equivalent daily productions since their respective months of
acquisitions.
|
|
(2)
|
Corresponds
to Ecopetrol’s average sales price on an unconsolidated
basis.
|
|
(3)
|
Lifting
costs per barrel are calculated based on total production, which includes
royalties, and correspond to Ecopetrol’s lifting costs on an
unconsolidated basis.
|
Our crude
oil lifting costs on a Peso basis increased to Ps$17,825 during 2009 from
Ps$16,376 during 2008, mainly due to (i) an increase in production costs as a
result of the expansion of our production facilities and maintenance expenses,
(ii) increased costs from joint ventures and (iii) an increase in workovers to
maintain our increasing production levels, partially offset by the increase in
our crude oil production levels. Our crude oil lifting costs on a
Dollar basis decreased to US$8.27 in 2009 from US$8.33 in 2008 as a result of
the above mentioned factors, which result was more than offset by the 10%
depreciation of the average exchange rate of the Peso against the U.S.
Dollar.
Our crude
oil lifting costs on a Peso basis increased to Ps$16,376 during 2008 from
Ps$15,057 in 2007 mainly as a result of an increase in production costs from
maintenance and services contracted in mature fields, partially offset by an
increase in our crude oil production. Our crude oil lifting costs on
a Dollar basis increased to US$8.33 in 2008 from US$7.22 in 2007 as a result of
the above mentioned factors and the 5% appreciation of the average exchange rate
of the Peso against the U.S. Dollar.
The
following table sets forth our developed and undeveloped gross and net acreage
of crude oil production by region for the year ended December 31,
2009.
|
Production Acreage at
December 31, 2009
|
Average crude oil production for the
year ended December 31, 2009(1)
|
|||||||||||
|
Developed and Undeveloped
|
(thousand bpd)
|
|||||||||||
|
Gross
|
Net
|
|||||||||||
|
(in
acres)
|
||||||||||||
|
COLOMBIA
|
||||||||||||
|
Ecopetrol
|
||||||||||||
|
Northeastern
region
|
200,350 | 120,210 | 36.9 | |||||||||
|
Mid-Magdalena
Valley region
|
835,370 | 531,187 | 73.4 | |||||||||
|
Central
region
|
464,954 | 291,287 | 156.0 | |||||||||
|
Catatumbo-Orinoquía
region
|
640,839 | 389,669 | 70.0 | |||||||||
|
Southern
region
|
1,476,199 | 836,721 | 62.0 | |||||||||
|
Minor
Fields
|
558,667 | 165,253 | 7.2 | |||||||||
|
Hocol
|
37,264 | 10,681 | 14.1 | |||||||||
|
Total
(Colombia)
|
4,213,642 | 2,345,008 | 419.5 | |||||||||
|
INTERNATIONAL
|
||||||||||||
|
Savia
Perú
|
10,933,233 | 10,933,233 | 5.5 | |||||||||
|
Ecopetrol America
Inc.
|
5,760 | 530 | 0.9 | |||||||||
|
Total
(International)
|
10,938,993 | 10,933,763 | 6.4 | |||||||||
|
TOTAL
|
15,152,635 | 13,278,771 | 426.0 | |||||||||
33
|
(1)
|
Does
not include 0.28 thousand bpd of production from exploratory
activities.
|
The
following table sets forth our total gross and net productive wells by region
for the year ended December 31, 2009.
|
At December 31, 2009
|
||||||||||||||||||||||||
|
Crude Oil
|
Natural Gas
|
Natural Gas and
Crude Oil
|
||||||||||||||||||||||
|
Gross
|
Net
|
Gross
|
Net
|
Gross
|
Net
|
|||||||||||||||||||
|
COLOMBIA
|
||||||||||||||||||||||||
|
Ecopetrol
|
||||||||||||||||||||||||
|
Northeastern
region
|
1 | 1 | 62 | 33 | 64 | 33 | ||||||||||||||||||
|
Mid-Magdalena
Valley region
|
2,837 | 1,939 | 7 | 4 | 0 | 0 | ||||||||||||||||||
|
Central
region
|
532 | 395 | 0 | 0 | 0 | 0 | ||||||||||||||||||
|
Catatumbo-Orinoquía
region
|
728 | 463 | 1 | 1 | 0 | 0 | ||||||||||||||||||
|
Southern
region
|
908 | 547 | 5 | 2 | 6 | 3 | ||||||||||||||||||
|
Minor
fields
|
69 | 38 | 15 | 10 | 4 | 1 | ||||||||||||||||||
|
Hocol
|
252 | 115 | 2 | 2 | 0 | 0 | ||||||||||||||||||
|
Total
(Colombia)
|
5,327 | 3,497 | 92 | 52 | 74 | 37 | ||||||||||||||||||
|
INTERNATIONAL
|
||||||||||||||||||||||||
|
Savia
Perú
|
652 | 652 | ||||||||||||||||||||||
|
Ecopetrol America
Inc.
|
8 | 1 | ||||||||||||||||||||||
|
Total
(International)
|
— | — | — | — | 660 | 653 | ||||||||||||||||||
|
TOTAL
|
5,327 | 3,497 | 92 | 52 | 734 | 690 | ||||||||||||||||||
Volume
of crude oil purchased
The table
below sets forth the volumes of crude oil purchased from our business partners
and volumes of crude oil purchased from the ANH corresponding to royalties which
have been received by the ANH in-kind from producers for the years ended
December 31, 2009, 2008 and 2007.
|
For the year ended December 31,
|
||||||||||||
|
2009
|
2008
|
2007
|
||||||||||
|
(million barrels)
|
||||||||||||
|
Ecopetrol
|
||||||||||||
|
Crude
oil purchased from the ANH
|
35.1 | 32.6 | 31.0 | |||||||||
|
Crude
oil purchased from our Business partners
|
26.4 | 18.8 | 12.7 | |||||||||
|
Hocol
|
||||||||||||
|
Crude
oil purchased from our Business partners
|
4.8 | — | — | |||||||||
|
Total
|
66.3 | 51.4 | 43.7 | |||||||||
Crude
Oil
Light
crude oil
Light
crude oil has an API gravity 25º or higher and tends to have a higher sales
price in the international market. We develop and produce light crude
oil in the Cravo Norte joint venture and in the Cusiana and Cupiagua
fields. During 2009, our production of light crude oil was
83.8 thousand bpd, a 6.2% decrease compared to 89 thousand bpd
produced in 2008. During 2008, our production of light crude oil
decreased 9% when compared to 98 thousand bpd in 2007. The
decrease in production is due to the decline of the fields as they are becoming
mature.
34
Our most
productive fields are located in the Northeastern regions. These
fields are:
(i) Cravo Norte
Area. Cravo Norte is located in the Catatumbo-Orinoquia region
and is comprised of Cravo Norte, Chipiron, Cosecha and Rondon Joint
Ventures. The production in the Cravo Norte area comes primarily from
the Caño Limon and Caño Yarumal fields. During 2009, the production
level in this area reached 46 thousand bpd, compared to 51.2 thousand bpd in
2008 and 45.5 thousand bpd in 2007. We estimate that the Cravo Norte
area has approximately 46.6 million barrels of crude oil in proved
reserves.
(ii) Cusiana and
Cupiagua. The Cusiana and Cupiagua blocks are located in the
Piedemonte Llanero and are developed in partnership with British Petroleum and
Total. The project is composed by the Cusiana, Cupiagua, Pauto,
Floreña and Volcanera fields. The production of these fields during
2009 was 36.8 thousand bpd, compared to 40.4 thousand bpd in 2008 and
47.5 thousand bpd in 2007. We estimate that the Cusiana and
Cupiagua fields have approximately 138.1 million barrels of crude oil in
proved reserves and 1.083 mcf of natural gas reserves. The first
joint venture agreement with British Petroleum and Total under which we produce
crude oil and natural gas in these fields expired in June 2010 and the
production rights reverted to us at no additional cost. See
Item 4 — “Overview of Exploration and Production Contractual
Arrangements.”
Heavy
crude oil
We
consider heavy crudes those having an API gravity below 15º. We
develop, upgrade and produce heavy crude in the Central and Mid-Magdalena Valley
regions. From 2000 to 2009, we invested approximately
US$2,200 million to expand our production of heavy crude oil, which
increased from 24 thousand bpd in 2000 to 146 thousand bpd in
2009. Our production of heavy crudes in 2009 reached
146 thousand bpd, a 34% increase when compared to 2008 as a result of the
development of the Rubiales, Castilla and Chichimene fields, in the San Fernando
Region. In 2008, our production of heavy crudes amounted to
109 thousand bpd, compared to 81 thousand bpd in 2007, mainly as a
result of the development of the same fields. We are committed to
developing our heavy crude reserves as they are an integral part of our growth
strategy.
Our most
important heavy crude oil projects are:
(i) Cubarral. The
Cubarral block is located in the Central region and is composed of the Castilla
and Chichimene fields with approximately 302.5 million barrels of developed
and undeveloped proved reserves. We decided to undertake the
development of the project and selected a strategic partner for exploration in
the Caño Sur Block.
(ii) Rubiales. The
Rubiales field is located in the Central region and is developed in joint
venture with Metapetroleum. Investments in this field during 2009
amounted to US$247 million as we and our business partner drilled 105
development wells and enlarged our fluid treatment facilities. The
Rubiales field increased Ecopetrol’s production from 20 thousand bpd in
2008 to 38 thousand bpd in 2009. We expect our production share
during 2010 to reach 59 thousand bpd.
(iii) Nare-Teca. The
Nare-Teca fields are located in the Mid-Magdalena Valley region developed in
joint venture with Mansarovar, a joint venture between Sinopec from China and
Oil and Natural Gas Corporation Ltd. from India. During 2009, we
invested approximately US$24 million in drilling 67 development wells, of
which 27 were successful horizontal wells. We expect our production
share to increase to 13 thousand bpd in 2010 and to reach a maximum of 32
thousand bpd by 2014.
Mature
fields
We
consider the development of mature fields an integral part of our strategy to
increase average daily production and hydrocarbon reserves. Mature
fields are those fields that have reached their maximum output and have entered
their final decline in production. Approximately 70.4% of our fields
are considered mature. However, these reservoirs, discovered over 20
years ago, still have significant reserves which can be recovered through
aggressive drilling campaigns and by applying new technologies. We
continue to focus our efforts on improving the productivity ratio of several
directly operated mature fields and other
fields currently held in joint venture with other oil companies, which will
become mature in the near future.
35
For the
last six years, we have been developing mature fields in all of our
administrative regions in Colombia and through Hocol, since May
2009. As a result of these activities, we were able to reduce the
rate of decline in production from mature crude oil fields which totaled
264 thousand bpd in 2009 compared to 227.2 thousand bpd in 2008 and
227 thousand bpd in 2007.
The table
below describes the location, number and daily production of our mature fields
in Colombia for the periods indicated below.
|
At December 31,
2009
|
For the year ended December 31,
|
|||||||||||||||
|
Number of fields
|
2009
|
2008
|
2007
|
|||||||||||||
|
(thousand bpd)
|
||||||||||||||||
|
Ecopetrol
|
||||||||||||||||
|
Northeastern
region:
|
||||||||||||||||
|
Joint
Venture
|
5 | 36.8 | 40.4 | 47.5 | ||||||||||||
|
Direct
Operation
|
— | — | — | — | ||||||||||||
|
Total
Northeastern region
|
5 | 36.8 | 40.4 | 47.5 | ||||||||||||
|
Mid-Magdalena
Valley region:
|
||||||||||||||||
|
Joint
Venture
|
13 | 6.2 | 4.1 | 5.2 | ||||||||||||
|
Direct
Operation
|
31 | 56.5 | 50.9 | 39.0 | ||||||||||||
|
Total
Mid-Magdalena Valley region
|
44 | 62.7 | 55.0 | 44.2 | ||||||||||||
|
Central
region:
|
||||||||||||||||
|
Joint
Venture
|
14 | 6.5 | 1.4 | 1.5 | ||||||||||||
|
Direct
Operation
|
17 | 13.8 | 20.8 | 23.5 | ||||||||||||
|
Total
Central region
|
31 | 20.3 | 22.2 | 25 | ||||||||||||
|
Catatumbo-Orinoquía
region:
|
||||||||||||||||
|
Joint
Venture
|
53 | 67.1 | 67.9 | 64.1 | ||||||||||||
|
Direct
Operation
|
5 | 2.9 | 4.8 | 5.7 | ||||||||||||
|
Total
Catatumbo-Orinoquía region
|
58 | 70.0 | 72.7 | 69.8 | ||||||||||||
|
Southern
region:
|
||||||||||||||||
|
Joint
Venture
|
37 | 35.4 | 13 | 17.6 | ||||||||||||
|
Direct
Operation
|
33 | 26.6 | 23.9 | 22.9 | ||||||||||||
|
Total
Southern region
|
70 | 62.0 | 36.9 | 40.5 | ||||||||||||
|
Minor
fields:
|
||||||||||||||||
|
Joint
Venture
|
41 | 6.6 | — | — | ||||||||||||
|
Direct
Operation
|
4 | 0.5 | — | — | ||||||||||||
|
Total
Minor fields
|
45 | 7.1 | — | — | ||||||||||||
|
Hocol
|
||||||||||||||||
|
Minor
fields (Hocol):
|
||||||||||||||||
|
Joint
Venture
|
— | — | — | — | ||||||||||||
|
Direct
Operation
|
9 | 5.1 | — | — | ||||||||||||
|
Total
Minor fields (Hocol)
|
9 | 5.1 | — | — | ||||||||||||
|
TOTAL
|
262 | 264.0 | 227.2 | 227 | ||||||||||||
Purchase
Commitments with our business partners
We have
entered into a number of crude oil purchase contracts with certain of our
business partners. Crude oil purchased from our business partners is
either processed in our refineries or exported. The purchase price is
calculated based on international market prices. Consequently, our
total financial exposure depends on the international prices of oil and volumes
produced. We believe that the risk of such exposure is hedged because
we either export the crude oil at international market prices or sell refined
products at prices which are correlated with international market
prices. During 2009, the total volumes of crude oil we purchased from
our business partners amounted to 26% of our total crude oil
sales.
36
Deliveries
of crude oil are made on a continuous basis. At February 23,
2010 we had 39 of these contracts outstanding, of which 36 or 95% expire in
2010, and the remaining 3 or 5% thereafter.
Under
most of our existing contracts we are obliged to purchase 100% of our partner’s
production in the specific field. During January 2010, our
purchases of crude oil under these commitments amounted to 67.2 thousand
bpd of crude oil.
The term
of some of our purchase contracts is linked to the term of the joint venture
agreements signed with our business partners. Other clauses of the
contracts such as price and place of delivery may be subject to renegotiation
during the term of the contract. Other purchase contracts not linked
to joint venture agreements may be extended and renegotiated by the
parties.
Natural
Gas
Our
production of natural gas is driven by the growth of local demand and exports to
Venezuela. In 2009, we produced 539.2 mcfpd, a 11% increase when
compared to the 2008 production and a 31% increase when compared to the 2007
production.
The
following table sets forth our average daily natural gas production, our average
sales price and average production costs (lifting costs) for the years ended
December 31, 2009, 2008 and 2007.
|
For the year ended December 31,
|
||||||||||||
|
2009
|
2008
|
2007
|
||||||||||
|
(mcfpd)
|
||||||||||||
|
COLOMBIA
|
||||||||||||
|
Ecopetrol
|
||||||||||||
|
Northeastern
region:
|
||||||||||||
|
Joint
Venture
|
494.4 | 451.8 | 375.4 | |||||||||
|
Direct
Operation
|
— | — | — | |||||||||
|
Total
Northeastern region
|
494.4 | 451.8 | 375.4 | |||||||||
|
Mid-Magdalena
Valley region:
|
||||||||||||
|
Joint
Venture
|
4.0 | 6.0 | 8.1 | |||||||||
|
Direct
Operation
|
19.4 | 21.4 | 21.5 | |||||||||
|
Total
Mid-Magdalena
|
||||||||||||
|
Total
Valley region
|
23.3 | 27.4 | 29.6 | |||||||||
|
Central
region:
|
||||||||||||
|
Joint
Venture
|
— | — | — | |||||||||
|
Direct
Operation
|
3.9 | 1.7 | 1.6 | |||||||||
|
Total
Central region
|
3.9 | 1.7 | 1.6 | |||||||||
|
Catatumbo-Orinoquía
region:
|
||||||||||||
|
Joint
Venture
|
0.2 | 1.0 | 1.1 | |||||||||
|
Direct
Operation
|
0.5 | — | — | |||||||||
|
Total
Catatumbo-Orinoquía region
|
0.7 | 1.0 | 1.1 | |||||||||
|
Southern
region:
|
||||||||||||
|
Joint
Venture
|
3.4 | 2.8 | 3.3 | |||||||||
|
Direct
Operation
|
1.7 | 2.2 | 1.0 | |||||||||
|
Total
Southern region
|
5.2 | 5.0 | 4.3 | |||||||||
|
Minor
Fields:
|
||||||||||||
|
Joint
venture operation
|
1.9 | — | — | |||||||||
|
Direct
operation
|
— | — | — | |||||||||
|
Total
Minor Fields
|
1.9 | — | — | |||||||||
|
Hocol(1)
|
||||||||||||
|
Joint
venture operation
|
4.0 | — | — | |||||||||
|
Direct
operation
|
— | — | — | |||||||||
|
Total
Hocol
|
4.0 | — | — | |||||||||
|
Production
Tests
|
0.2 | |||||||||||
|
Total
Natural Gas Production (Colombia)
|
533.6 | 486.9 | 412.0 | |||||||||
|
INTERNATIONAL
|
||||||||||||
|
Savia
Perú(1)
|
5.3 | |||||||||||
|
Ecopetrol
America
|
0.4 | |||||||||||
|
Total
Natural Gas Production (International)
|
5.7 | — | — | |||||||||
|
TOTAL
NATURAL GAS PRODUCTION
|
539.2 | 486.9 | 412.0 | |||||||||
|
Natural
Gas Average Sales Price (U.S. dollars per thousand cf)
|
2.94 | 3.47 | 2.06 | |||||||||
|
Natural
Gas Average Sales Price (Ps$ per thousand cf)
|
6,321 | 6,818 | 4,270 | |||||||||
|
Aggregate
Average Lifting Costs of Natural Gas (U.S. dollars per thousand cf)(2)(3)
|
0.38 | 0.52 | 0.49 | |||||||||
|
Aggregate
Average Lifting Costs of Natural Gas (Ps$ per thousand cf)(2)(3)
|
829 | 1,015 | 1,024 | |||||||||
37
|
(1)
|
Hocol
and Savia Perú production figures correspond to their equivalent daily
productions since their respective months of
acquisitions.
|
|
(2)
|
Corresponds
to lifting costs from La Guajira
fields.
|
|
(3)
|
During
2009, we modified our methodology for calculating our natural gas lifting
cost as follows: we now calculate this cost by taking our production cost
and dividing it by our produced volumes (including royalties) rather than
using the total volume produced by our fields as the
denominator. Our 2008 and 2007 natural gas lifting costs have
been restated under the new
methodology.
|
Our natural gas lifting costs on a Peso
basis decreased to Ps$829 per thousand cf in 2009 from Ps$1,015 per thousand cf
in 2008 due to the decrease in our total natural gas production costs and the
increase in our natural gas production as a result of the commencement of
operations of our natural gas compression project, which enabled us to increase
production at La Guajira fields. Our natural gas lifting costs on a
Dollar basis decreased to US$0.38 per thousand cf in 2009 from US$0.52 per
thousand cf in 2008 due the above mentioned factors and the 10% depreciation in
the average exchange rate of the Peso against the U.S. Dollar.
Our natural gas lifting costs on a Peso
basis decreased to Ps$1,015 per thousand cf in 2008 from Ps$1,024 per thousand
cf in 2007 mainly due to an increase in our total volumes produced as a result
of the commencement of natural gas exports to Venezuela, partially offset by (i)
an increase in the disbursements for minor projects related to natural gas
treatment in the Guajira fields as established in the contract with our business
partner Chevron, (ii) an increase in the production payments to Petrosantander
as a result of an increase in volumes and the sales price of natural gas
(pursuant to our contract with them). Our natural gas lifting costs on a Dollar
basis increased to US$0.52 per thousand cf in 2008 from US$0.49 per thousand cf
in 2007 due to the above mentioned reasons, which effect was more than offset by
the 5% appreciation in the average exchange rate of the Peso against the U.S.
Dollar.
38
The
following table sets forth our developed and undeveloped gross and net acreage
of natural gas production by region:
|
Developed and Undeveloped
Production Acreage as of
December 31, 2009
|
Average natural gas
production for the year ended
December 31, 2009
|
|||||||||||
|
(in acres)
|
(thousand cfpd)
|
|||||||||||
|
Gross
|
Net
|
|||||||||||
|
COLOMBIA
|
||||||||||||
|
Ecopetrol
S.A.
|
||||||||||||
|
Northeastern
region
|
238,801 | 142,127 | 494.4 | |||||||||
|
Mid-Magdalena
Valley region
|
744,723 | 442,798 | 23.3 | |||||||||
|
Central
region
|
201,415 | 129,384 | 3.9 | |||||||||
|
Catatumbo-Orinoquía
region
|
10,166 | — | 0.7 | |||||||||
|
Southern
region
|
241,933 | 121,802 | 5.2 | |||||||||
|
Minor
fields(1)
|
24,859 | 12,430 | 2.1 | |||||||||
|
Hocol
|
114 | 80 | 4.0 | |||||||||
|
Total
(Colombia)
|
1,462,011 | 848,621 | 533.6 | |||||||||
|
INTERNATIONAL
|
||||||||||||
|
Savia
Perú
|
9,295 | 9,295 | 5.3 | |||||||||
|
Ecopetrol America
Inc.
|
— | — | 0.4 | |||||||||
|
Total
(International)
|
9,295 | 9,295 | 5.7 | |||||||||
|
TOTAL
|
1,471,306 | 857,916 | 539.2 | |||||||||
|
(1)
|
Minor
fields production figures include production from production
tests.
|
Northeastern
region
The
largest production of natural gas in Colombia is located in the Northeastern
region, which we develop under joint venture contracts. We develop
the Guajira natural gas reserves with our partner Chevron. The
Cusiana and Cupiagua reserves are developed in partnership with British
Petroleum and Total; however, the first joint venture agreement with British
Petroleum and Total under which we produce crude oil and natural gas in these
fields expired in June 2010 and the production rights reverted to us at no
additional cost.
Natural
gas production in the Northeastern region averaged 494.4 mcfpd in
2009. The natural gas produced from these fields is used to supply
our local demand and to meet our commitments to supply natural gas to
Venezuela. We are continuing to re-inject natural gas in the Cusiana
and the Cupiagua fields in order to increase our recovery ratio.
As a
result of the age and the decline rate of the Cusiana, Cupiagua and Floreña
crude oil fields, we commenced production of natural gas for
sale. Our current natural gas treatment capacity for these fields is
200 mcfpd. During 2009, our production of natural gas for sale from
the Cusiana, Cupiagua, Floreña and Pauto fields totaled 114.9 mcfpd, a 10%
decrease in comparison to the 127.6 mcfpd produced in 2008, resulting from a
decrease in natural gas demand from the Termoyopal power plant, which is
operated with natural gas from the Pauto and Floreña fields. We have
increased the capacity of the existing Cusiana natural gas treatment plant, and
we plan to build a new Cupiagua natural gas treatment plant in order to increase
treatment capacity and to increase production of natural gas for sale from these
fields to 480 mcfpd by 2012.
Reserves
Our net
proved reserves of crude oil and natural gas at December 31, 2009, totaled
1,538.2 million boe, which represents a 35.0% increase from the
1,137.0 million boe registered in 2008. In 2008, our proved
reserves decreased 6.0% from the 1,209.9 million boe registered in
2007. The increase in our reserves in 2009 is mainly due to
(i) revisions which include new development projects and reserves
reclassification in our existing production fields and (ii) extensions and
discoveries which include new acquisitions. Our crude oil reserves in
2009 increased to 1,123.3 million barrels of crude oil from
798.9 million barrels of crude oil in 2008 and our natural gas proved
reserves increased to 2,329.4 million cubic feet or mcf from 1,898.9 mcf of
reserves in 2008.
Our
reserves calculation process is supervised and coordinated by Adriano Lobo, our
corporate manager of resevoirs. He is a geologist who holds a masters
degree in Geology from the University of Texas at Austin and has more than 20
years of experience in projects associated with the characterization,
development, estimation, and reporting of reserves. In addition, we
have a reserves coordinator, Martha Patricia Gómez, who is a petroleum engineer,
and has more than 15 years of experience (five of which in issues directly
relating to the calculation of reserves). Our reserves coordinator
supervises and provides support to our employees involved in the reserves
calculation process. These employees meet the Society of Petroleum
Enginners-SPE qualifications for reserves calculation. Our
reserves calculation process ends with the review of our reserves report by our
reserves committee and the approval of our Board of Directors. This
entire process meets the requirements of our reserves corporate guide, which is
aligned to satisfy the SEC definitions and rules and is part of our internal
control process.
39
Hydrocarbon
reserves were calculated using SEC definitions and rules. Our
hydrocarbon net proved reserves have been audited in 2009 by Ryder Scott,
DeGolyer and MacNaughton and Gaffney, Cline & Associates (collectively, the
“External Engineers”) and their reserves reports are included as exhibits
herein. These firms have audited 97% of our total net proved reserves
for 2009. Their audit process was conducted in accordance with the
U.S. Securities and Exchange Commission (“SEC”) definitions and rules set forth
in Rule 4-10(a) of Regulation S-X and the disclosure guidelines contained in the
SEC’s “Modernization of Oil
and Gas Reporting” final rule dated December 31, 2008 and effective as of
January 1, 2010. The information presented below and elsewhere in
this annual report referring to our 2009 net proved reserves estimates is based
on those reports and on our own calculations for the remaining 3% of our
hydrocarbon net proved reserves. Our 2009 crude oil and natural gas
net proved reserves include reserves from our acquisitions located in the Gulf
of Mexico, Perú and Hocol´s assets in Colombia.
The
information regarding 2008 net proved reserves is based on the 2008 audited
reserve reports for 89% of our total reserves prepared by the External Engineers
under SEC definitions and rules. The remaining 11% corresponds to
calculations made by us internally using SEC definitions and rules.
Our
reserves were audited in 2006 by the External Engineers. We updated
the reserve estimates at December 31, 2007 using the same valuation
method. In July 2008, the External Engineers audited 85% of our
reserves at December 31, 2007 but the reserve estimates for 2007 shown in
this annual report are ours. The total negative difference between
our estimates and those of the experts with respect to the 85% of reserves that
were audited is 5.6%. Although the total difference was not material,
there were significant differences, both positive and negative, with respect to
particular fields. The most important differences, on a field by
field basis arise from the following four areas: (1) Evaluation
of the quality and quantity of information available to incorporate reserves as
proved with reasonable certainty, reflecting changes for the Tibu (+100.6% or
12.77 million barrels), Casabe (-14.8% or 6.01 million barrels) and
Gibraltar (-59.2% or 18.48 million boe) fields; (2) differences in
quantifying depletion rates for purposes of estimating future production,
affecting the estimates for the Cusiana (-33.4% or 29.65 million barrels),
San Francisco (-70.2% or 20.58 million barrels), Guando (-8.9% or
6.4 million barrels), La Cira (-18.2% or 8.99 million barrels)
and Orito (-25.8% or 4.57 million barrels) fields; (3) differences in
the method used to estimate the reserves in the Cupiagua
fields (+23.9% or 17.3 million barrels) which in 2006 was the
gas/oil ratio against accumulated gas and in 2007 was oil rate against time; and
(4) as a result of differences in the External Engineers’ interpretations,
the economic limits differ with respect to the ones reported by us, therefore
reflecting differences between operating expenses and capital expenditures
applied by us and by the External Engineers. We do not deem these
differences to be significant with respect to the impact on the Company’s
estimates as a whole.
The
reserve information presented in this section is based on the SEC’s definitions
and rules used for U.S. GAAP purposes. See Item 5 —
“Operating and Financial Review and Prospects – Principal differences between
Colombian Government Entity GAAP and U.S. GAAP” and Note 33 to our consolidated
financial statements.
40
The following table sets forth our
estimated net proved reserves (developed and undeveloped) of crude oil and gas
by region and for the years ended December 31, 2009, 2008 and
2007.
|
At December 31,
|
||||||||||||||||||||||||
|
2009
|
2008
|
2007
|
||||||||||||||||||||||
|
Crude Oil
(million
barrels)
|
Gas
(gcf)
|
Crude Oil
(million
barrels)
|
Gas
(gcf)
|
Crude Oil
(million
barrels)
|
Gas
(gcf)
|
|||||||||||||||||||
|
PROVED
DEVELOPED RESERVES
|
||||||||||||||||||||||||
|
Colombia
|
||||||||||||||||||||||||
|
Ecopetrol
S.A.
|
||||||||||||||||||||||||
|
Northeastern
region
|
65.2 | 1674.9 | 66.3 | 680.0 | 87.5 | 1119.8 | ||||||||||||||||||
|
Mid-Magdalena
Valley region
|
148.0 | 24.4 | 134.2 | 33.3 | 153.0 | 66.1 | ||||||||||||||||||
|
Central
region
|
196.2 | 0.0 | 137.3 | 0.0 | 152.4 | 0.0 | ||||||||||||||||||
|
Catatumbo
– Orinoquía region
|
68.6 | 0.0 | 76.5 | 0.0 | 93.1 | 0.0 | ||||||||||||||||||
|
Southern
region
|
97.5 | 3.8 | 92.4 | 4.9 | 158.5 | 19.4 | ||||||||||||||||||
|
Minor
Fields
|
6.6 | 0.8 | 10.9 | 2.0 | 6.8 | 5.2 | ||||||||||||||||||
|
Hocol
|
29.7 | 3.1 | — | — | — | — | ||||||||||||||||||
|
Total
(Colombia)
|
611.6 | 1707.0 | 517.6 | 720.1 | 651.3 | 1210.5 | ||||||||||||||||||
|
International
|
||||||||||||||||||||||||
|
Savia
Perú
|
14.2 | 23.0 | — | — | — | — | ||||||||||||||||||
|
Ecopetrol
America
|
4.7 | 2.6 | 0.8 | 0.5 | — | — | ||||||||||||||||||
|
Total
(International)
|
18.8 | 25.6 | 0.8 | 0.5 | — | — | ||||||||||||||||||
|
TOTAL
PROVED DEVELOPED RESERVES
|
630.5 | 1732.6 | 518.4 | 720.6 | 651.3 | 1210.5 | ||||||||||||||||||
|
PROVED
UNDEVELOPED RESERVES
|
||||||||||||||||||||||||
|
Colombia
|
||||||||||||||||||||||||
|
Ecopetrol
S.A.
|
||||||||||||||||||||||||
|
Northeastern
region
|
75.8 | 584.7 | 41.5 | 1173.0 | 45.8 | 758.2 | ||||||||||||||||||
|
Mid-Magdalena
Valley region
|
99.1 | 7.5 | 77.2 | 5.3 | 59.2 | 10.9 | ||||||||||||||||||
|
Central
region
|
242.5 | 0.0 | 126.2 | 0.0 | 65.1 | 0.0 | ||||||||||||||||||
|
Catatumbo
– Orinoquía region
|
25.7 | 0.0 | 20.1 | 0.0 | 12.7 | 0.0 | ||||||||||||||||||
|
Southern
region
|
14.6 | 0.4 | 13.8 | 0.0 | 22.5 | 0.0 | ||||||||||||||||||
|
Minor
Fields
|
1.0 | 0.0 | 1.7 | 0.0 | 0.7 | — | ||||||||||||||||||
|
Hocol
|
19.3 | 0.4 | — | — | — | — | ||||||||||||||||||
|
Total
(Colombia)
|
478.0 | 593.0 | 280.5 | 1178.3 | 206.1 | 769.1 | ||||||||||||||||||
|
International
|
||||||||||||||||||||||||
|
Savia
Perú
|
14.9 | 3.8 | — | — | — | — | ||||||||||||||||||
|
Ecopetrol
America
|
0.0 | 0.0 | 0.0 | 0.0 | — | — | ||||||||||||||||||
|
Total
(International)
|
14.9 | 3.8 | 0.0 | 0.0 | — | — | ||||||||||||||||||
|
TOTAL
PROVED UNDEVELOPED RESERVES
|
492.8 | 596.9 | 280.5 | 1178.3 | 206.1 | 769.1 | ||||||||||||||||||
|
TOTAL
PROVED RESERVES (DEVELOPED AND UNDEVELOPED)
|
1123.3 | 2329.4 | 798.9 | 1898.9 | 857.4 | 1979.6 | ||||||||||||||||||
41
The
following table sets forth our estimated consolidated net proved developed and
undeveloped reserves of crude oil and natural gas at December 31, 2009,
2008 and 2007.
|
Net proved developed and undeveloped
Reserves
|
||||||||||||
|
Crude Oil
(million
barrels)
|
Gas (gcf)
|
Total (million boe)
|
||||||||||
|
Reserves
at December 31, 2007
|
857.4 | 1,979.6 | 1,209.9 | |||||||||
|
Revisions
|
44.2 | 54.5 | 53.9 | |||||||||
|
Extensions
and discoveries
|
8.3 | 0.8 | 8.4 | |||||||||
|
Production
|
(111.0 | ) | (136.0 | ) | (135.2 | ) | ||||||
|
Reserves
at December 31, 2008
|
798.9 | 1,898.9 | 1,137.0 | |||||||||
|
Revisions
|
318.98 | 548.55 | 416.7 | |||||||||
|
Extensions
and discoveries(1)
|
137.29 | 38.62 | 144.2 | |||||||||
|
Production
|
(131.85 | ) | (156.63 | ) | (159.7 | ) | ||||||
|
Reserves
at December 31, 2009
|
1,123.3 | 2,329.4 | 1,538.2 | |||||||||
|
Net
proved developed reserves
|
||||||||||||
|
At
December 31, 2007
|
651.3 | 1,210.5 | 866.9 | |||||||||
|
At
December 31, 2008
|
518.4 | 720.6 | 646.7 | |||||||||
|
At
December 31, 2009
|
630.5 | 1,732.6 | 939.0 | |||||||||
(1)
Extensions and discoveries during 2009 included 94.7 mboe associated with our
acquisition of Hocol and OIG.
Revisions
include existing projects in our existing fields, new projects in our existing
fields and reserves reclassification. The revisions during 2009
resulting from new projects in our existing fields amounted to 256 mboe, which
corresponds mainly to new projects at the Rubiales (110 mboe), Castilla (44
mboe), Chichimene (32 mboe) and Pauto (15 mboe) fields, representing 78% of all
of our new projects. Additionally, we reclassified 211 mboe of
reserves from unproved to proved reserves, which mainly occurred at the Cusiana
(69 mboe), Pauto (60 mboe), Chichimene (43 mboe) and Castilla (30 mboe) fields,
representing 96% of the total reclassifications. In 2009, economic
limits reduced proved reserves by 62
mboe and other minor changes in existing projects at our existing projects
resulted in revisions of 11 mboe.
The
increase in extensions and discoveries of reserves during 2009 is mainly due to
the 95 mboe increase resulting from our acquisition of Savia Perú and Hocol. In
addition, 49 mboe of new reserves were discovered.
During 2009, our total proved
undeveloped reserves increased by 108.8 mboe to 599.2 mboe at December 31, 2009
from 490.4 mboe at December 31, 2008. At December 31, 2009, 82% of
our total proved undeveloped reserves corresponded to crude oil.
Of the total amount of proved
undeveloped reserves that we had at the end of 2008, we converted approximately
358 mboe or 73% to proved developed reserves during 2009, which resulted from
(i) natural gas projects in the Northeastern region, mainly conducted through a
new compression unit in the Guajira fields and additional natural gas treatment
capacity in the Cusiana field, which represented 41% of the total conversion and
(ii) crude oil projects, mainly associated with the development of heavy crude
oil fields in Castilla, Rubiales and Chichimene in the central region, which
represented the remaining 32% of the total conversion. The amount of
investment made during 2009 to convert the proved undeveloped reserves to the
proved developed reserves was Ps$1,493 billion.
42
The reduction in our proved undeveloped
reserves resulting from our conversion to proved developed reserves during 2009
was more than offset by an increase in our proved undeveloped reserves of
approximately 467 mboe. This increase mainly resulted from (i) an
increase of 382 mboe corresponding to revisions, which include our new
development projects and reserves reclassification in our existing production
fields and (ii) an increase of 84 mboe corresponding to extensions and
discoveries, which includes new acquisitions.
Current
Activities
During
the first quarter of 2010, we drilled 6 gross (4.8 net) exploratory wells, of
which two gross (0.8 net) were productive wells and four gross (4 net) were dry
wells. During the same period, we acquired 9,201 equivalent
kilometers of seismic, of which 454 equivalent kilometers were acquired directly
by us in Colombia, 2,264 equivalent kilometers were acquired by our business
partners in Colombia and 6,483 equivalent kilometers were acquired abroad in the
US Gulf Coast, Perú and Brazil.
During
the first quarter of 2010, our average production of crude oil was
484.6 thousand barrels per day. Our average production of
natural gas during the same period was 580.3 million cubic feet per day for
a total production of 586.4 thousand boe per day, which represents a 27%
increase when compared to the same period in 2009. We drilled
134 gross wells during the first quarter of 2009, of which 25 were drilled
directly by us and 109 were drilled by our business partners.
Overview
of Exploration and Production Contractual Arrangements
Contractual
Arrangements for the exploration and production of crude oil and natural gas in
Colombia
Introduction
Colombia
has modified the contractual regime governing the exploration, development and
production of hydrocarbons several times since its introduction in 1970 to
address the country’s exploration and production needs. The
exploration and production contracts entered into by our business partners and
us provide for the production split, the length of the exploration and
production terms and royalty payments.
Under
Colombian law, an existing contract cannot be modified because of a change to
the contractual regime, except in the cases of public order
regulations. As a result, contracts that were executed prior to the
issuance of a new contractual regime remain in force and are not affected by the
new regime put in place subsequently. At December 31, 2009, we
were party to 96 agreements with partners.
Under
joint venture contracts entered into before March 1994, which include the
Cusiana and Cupiagua crude oil fields, the private investor explored a
previously agreed upon area at its own risk and expense. Thereafter,
we had the option to become a joint venture partner by reimbursing the investor
50% of the exploration costs of oil wells within commercially viable fields and
50% interest of all future development costs related to those
fields. Once we became a partner, we had a 50% interest in the
production of the field.
If we
decided not to become a joint venture partner within a certain period of time,
the private investor had the right to enter into a sole risk contract for the
field’s crude oil production until it had recovered 200% of its investment and a
100% of its total costs. Thereafter, we could participate in the
development of the field and all future costs and expenses are automatically
shared with our partner as if we had elected to become a joint venture partner
in the field.
Beginning
in 1994, modifications were made to standard joint venture contracts to maintain
the private investor’s share of production at 50% until aggregate production
exceeded 60 million barrels. Thereafter, our share increased
gradually, up to a maximum of 70% of production. In 1995, further
modifications to the standard joint venture contracts required us to pay for
half of the exploration costs, not only for wells that ultimately proved to be
productive, but also for dry wells, stratigraphic wells and seismic exploration
in fields that became commercially viable. The modifications also
provided for competitive bidding for the right to explore and develop marginal
fields (defined according to certain technical, financial and operational
criteria). In the bidding process, private companies presented bids
based on percentages of production they would pay us in exchange for the rights
to develop these fields. Winning bidders were responsible for all
future investment and operating costs related to the field.
43
The
standard joint venture contract was once again modified in 1997 to promote
private sector activity in the development of inactive areas and small fields
and in the exploration for natural gas. These modifications extended
the exploration periods, increased the levels of reimbursement for private
companies’ exploration costs and provided for the reimbursement of exploration
costs in real terms and denominated in U.S. dollars.
In 1999,
the Government adopted two additional modifications to the standard terms of the
joint venture contracts, applicable to new joint venture contracts:
|
|
·
|
Reduction of Our Initial
Participation. The Government reduced our initial
participation under the joint venture contracts from 50% to
30%. At December 31, 2009, we had 33 joint venture
contracts outstanding in which our participation was greater than or equal
to 50%, and 13 joint venture agreements are outstanding where our
participation was 30% or below.
|
|
|
·
|
Modified
R-Factor. The Government modified the formula used to
determine the increase in our share of total production or the
R-Factor. The R-Factor is calculated by dividing accumulated
revenues in cash by investments and costs. If the R-Factor
increases above a certain profitability threshold, then our share of
production increases above the initial 30%. Pursuant to the
1999 modifications, we raised the profitability threshold at which the
R-Factor triggers an increase in our share from 1.0 to
1.5. Private companies benefited from this modification because
our share remained at 30% for a longer period of time. In
addition, the R-Factor was calculated in constant dollars. This
new calculation method was designed to prevent inflation from causing an
increase in the R-Factor and a corresponding increase in our
share.
|
We also
entered into various types of arrangements in connection with our own crude oil
and natural gas exploration and production projects. These
arrangements included: risk participation contracts, incremental
production agreements, shared-risk production contracts, risk services
production contracts, discovered undeveloped fields contracts and sole risk
contracts.
|
|
·
|
Risk Participation
Contracts. Under these contracts, we assumed 15% of the
exploration costs and risks at the beginning of the second year in
exchange for a larger participation in the future production and equal
representation on the executive committee of the joint
venture. At December 31, 2009, we had three risk
participation contracts in effect.
|
|
|
·
|
Incremental Production
Agreements. We currently have two types of incremental
production agreements, the standard incremental production agreements or
SIPA, and the development of incremental production project agreements or
DIPA. Under the SIPA, we calculate the total number of proved
developed reserves available in a specific field or well and then
establish a base production curve for the reserves. Any future
production exceeding the curve, which we refer to as incremental
production, results from extracting proved undeveloped reserves or
probable reserves which require additional investments funded by our
partners under the SIPA. We have the right to a previously
specified percentage of the incremental production. Our
percentage participation varies depending on the total amount invested by
our partners and on the R-Factor which cannot be lower than
1.5. The volume produced under the production curve is not
shared with our partners. At December 31, 2009, we had
five SIPAs in effect.
|
Under the
DIPA, we file a request with the Ministry of Mines and Energy to approve an
incremental production project for a field that we directly
operate. If the project is approved, we agreed with our partners to
develop the field and we determine mandatory investment thresholds for our
partners. We are not required to fund any investment. The
production from the field is distributed to us and our partners receive a
percentage of the total production from the field which varies depending on the
invested amount. Once the mandatory investment stage expires, we
agree with our partners on the percentage of production, total costs and
additional investments to be paid by each party. We pay 20% royalties
to the Nation on the base production curve and variable royalties on any
incremental production. Additionally, in the event of higher prices
and large volumes, we have adjustment clauses to increase our share in the
production. At December 31, 2009, we had two DIPAs in
effect.
44
|
|
·
|
Shared-Risk Production
Contracts. Under these contracts, we remain as operators
of the field and assume responsibility for 50% of all investments and
costs. Private oil companies submit bids to enter into
agreements with us based upon the production percentage they will assign
to us. The successful bidder has the right to enter into the
shared-risk contract with us. At December 31, 2009, we had
one shared-risk production contract
outstanding.
|
|
|
·
|
Risk Service Production
Contracts. We began using the risk service production
contract in January 1998 to increase production through the use of
new technologies in crude oil fields then operated by our
partners. All investments in new technologies were made by our
partners who received a tariff payment based on a formula that took into
account the incremental production resulting from the technological and
operative investments. At December 31, 2009, we had two
risk service contracts outstanding for the development of the
Valdivia-Almagro field and the Rancho Hermoso field located in the Mirador
formation.
|
|
|
·
|
Discovered Undeveloped Fields
Contracts. We have entered into discovered undeveloped
fields contracts to promote exploration by private companies of both
undeveloped and inactive fields. Under this agreement, the
contracting party assumes all costs and expenses for the development and
operation of a field in exchange for a previously specified fee per
barrel, which varies depending on the production level. At
December 31, 2009, we had 20 discovered undeveloped fields contracts
outstanding, of which at least two contracts are nearing termination
because the fields have not been in production for some
time.
|
|
|
·
|
Sole Risk Contracts.
After 2000, the party deciding to enter in a sole risk contract has
the right to recover 100% of its investment and
costs. Thereafter, we can participate in the development of the
field sharing all new investment and costs. At
December 31, 2009, we had 15 sole risk contracts
outstanding.
|
At
December 31, 2009 we also have certain other agreements outstanding,
including:
|
|
·
|
One
Service and Technical
Cooperation Contract with Universidad Industrial de
Santander. Pursuant to this agreement, research can be
conducted as part of the development of the Colorado
field.
|
|
|
·
|
One Operation Agreement
under which production was being carried out on the Cocorná field while we
await the court of arbitration to make a final decision about the
termination of the Cocorná joint venture contract. This
agreement terminated on May 1, 2010 as the arbitration decision was issued
in favor of Ecopetrol.
|
|
|
·
|
One
Technical Alliance
Agreement with a service company to support the operation of Casabe
field in which Ecopetrol maintains operation and ownership of 100%
reserves.
|
Current
Contractual Regime
In 2004,
the authority to enter into exploration and production contracts was assigned to
the ANH under a different exploration and production contractual
scheme. We became an operator like any other company, competing with
all other regional and international oil companies in Colombia for exploration
and production opportunities under the same conditions and without any special
rights. Decree Law 1760 gave us the ability to maintain in effect all
contracts we had entered into prior to January 1, 2004, as well as to have
absolute discretion as to whether or not such contracts would be extended after
their stated termination date. If we decide not to extend the
contracts, the production rights will revert to us and we would have the right,
at no additional costs to us, to exploit the associated reserves
indefinitely. Contracts entered into by us after January 1,
2004, that are not extended by the ANH, they will revert to the ANH and not to
us.
45
The ANH
introduced two new model contracts to replace the previously used joint venture
contracts: the exploration and production contract and the technical
evaluation agreement.
|
|
·
|
Exploration and Production
Contract or E&P. Under the E&P contract the
contractor, including us, assumes all exploration and production
activities. The contractor also assumes all risks and costs of
exploration and is the sole owner of all production and assets involved in
the exploration and production activities for the term of the
contract. There is no partnership or joint venture between the
contractor and the ANH.
|
|
|
·
|
Technical Evaluation
Agreements or TEA. The scope of the technical evaluation
agreement is limited to exploration activities. Under this
agreement, the contractor can evaluate a specific area and decide whether
or not it will enter into an exploration and production
contract. The contractor assumes all risks and costs of the
activities and operations. The agreement may be entered into
for an 18-month period for on-shore areas and up to a 24-month period for
off-shore areas.
|
We have
entered into a number of exploration and production contracts with regional and
international oil companies. Please see Annex I — “Description of
Exploration and Production Contracts” for a list of our exploration and
productions contracts still in force at December 31, 2009 which describes
the main characteristics of these contracts, including the region where they are
developed, the identity of our partners and operators, our ownership percentage,
the expiration date, the percentage of royalties we have to pay, and whether or
not once expired and not extended by us, they will revert to us.
Management
of crude oil and natural gas joint ventures
Every
crude oil and natural gas joint venture development has an executive committee,
which makes all technical, financial and operational decisions. All
major decisions are made unanimously, including for those projects where we have
less than a 50% economic interest. Although we do not operate a
number of these joint ventures under development, we do have an active role in
the decision making process and development of the projects. As a
result, we have direct control over the development of joint ventures, even for
those joint ventures where we have less than a majority economic
interest.
Refining
and Petrochemicals
Summary
There are
two main refineries in Colombia: the Barrancabermeja refinery
(“Barrancabermeja”), which we own and operate, and Refinería de Cartagena S.A.
(“Reficar”), which we wholly own since May 2009 and operate. We
also own two other minor refineries, Orito and Apiay. Our refineries
produce a full range of refined products including gasoline, diesel, jet fuel,
liquefied petroleum gas or LPG and heavy fuel oils among others.
During
2009, refining and petrochemicals investments amounted to
Ps$2,710.53 billion. These investments comprised 87 different
projects, including re-conversion, upgrading, equipment replacement and
environmental projects.
The
following table sets forth our daily average installed and actual refinery
capacity for each of the last three years.
|
For
the year ended December 31,
|
||||||||||||||||||||||||||||||||||||
|
2009
|
2008
|
2007
|
||||||||||||||||||||||||||||||||||
|
Capacity
|
Through-
put
|
%
Use
|
Capacity
|
Through-
put
|
%
Use
|
Capacity
|
Through-
put
|
%
Use
|
||||||||||||||||||||||||||||
|
(bpd)
|
||||||||||||||||||||||||||||||||||||
|
Barrancabermeja
|
250,000 | 216,970 | 87% | 250,000 | 232,052 | 93% | 250,000 | 229,650 | 92% | |||||||||||||||||||||||||||
|
Reficar
|
80,000 | 78,920 | 99% | 80,000 | 78,028 | 98% | 80,000 | 80,270 | 100% | |||||||||||||||||||||||||||
|
Apiay
|
2,500 | 1,525 | 61% | 2,500 | 1,314 | 53% | 2,500 | 2,208 | 88% | |||||||||||||||||||||||||||
|
Orito
|
2,500 | 1,495 | 60% | 2,500 | 1,176 | 47% | 2,500 | 1,128 | 45% | |||||||||||||||||||||||||||
|
Total
|
335,000 | 298,910 | 89% | 335,000 | 312,570 | 93% | 335,000 | 313,256 | 94% | |||||||||||||||||||||||||||
46
The
average conversion ratio for Barrancabermeja and Reficar during 2009 was 79.5%
and 78.8% respectively. In 2009 these refineries supplied the local
demand for fuels and produced a surplus of certain refined products for
export. Over the last three years we have maintained the conversion
ratios of our refineries at similar rates, 79.3% in 2009, 78.1% in 2007 and
80.1% in 2007.
The
refining margin decreased from 4.47 US$/Bl in 2008 to 4.41 US$/Bl in 2009 mainly
due to the “crack spread” (difference between the prices of refined products and
the prices of crude oil), low gasoline and LPG prices, and high crude oil prices
(because of the lower discount of heavy crude oils to the WTI).
Strategy
During
2009, we made significant progress in achieving our corporate goals to
(i) position Barrancabermeja and Reficar among Latin-America’s first
quartile within the Solomon Index (which classifies refineries by their
performance and rank) by 2010 and (ii) implement an aggressive investment
plan that will allow us to reach a production level of 650 thousand bpd and
2.7 million tons per year. This strategy is oriented towards
improving the configuration of Barrancabermeja and Reficar and upgrading them to
high conversion through the addition of coking capacity, hydrocracking and
complimentary hydroprocessing units and making the necessary modifications in
order for the fuels produced by the refineries to comply with more stringent
environmental regulations in Colombia and our export markets. Our
strategy is also focused on refining heavy crude oil and increasing our
production of petrochemicals. The strategy may also include further
upgrades and expansions and selectively acquiring additional refining
assets. We seek to improve our ranking in the Solomon Index, which
classifies refineries by their performance and rank, to be one of the best
refineries in Latin America.
Barrancabermeja
At
Barrancabermeja, we produce a variety of fuels, such as regular and premium
unleaded gasoline, diesel fuel, kerosene, jet fuel, aviation fuel, LPG, fuel oil
and sulfur. We also produce petrochemicals, including, paraffin
waxes, lube base oils, low-density polyethylene, aromatics, asphalts, alkylates,
cyclohexane and aliphatic solvents, and refinery grade propylene.
The fuel
hydro-treatment facility at Barrancabermeja is another major refining project
that we have undertaken, which will enable us to meet existing regulation
requirements relating to fuel quality standards, including diesel fuel with
maximum sulfur content of 50 parts per million by 2010.
Barrancabermeja
is undergoing a modernization process aiming to convert it into deep conversion,
allowing it to process heavy and extra-heavy crudes produced in local fields and
increase production of mid-distillates for the local market, as well as
producing fuels meeting international sulphur content standards. This
project should be in operation in 2014.
Reficar
In 2006,
we selected Glencore as our strategic partner in the development of the master
plan with respect to our Cartagena refinery. Pursuant to this plan,
Reficar was incorporated and began operations on April 1,
2007. Simultaneously with the incorporation of Reficar, we
transferred all of Reficar’s assets to Glencore in exchange for a 49.0%
interest. Reficar’s products are mainly exported to the Caribbean and
the United States.
In
February 2009, as a result of financing difficulties experienced by Glencore
which were making it difficult for it to develop the master plan, we entered
into a memorandum of understanding with Glencore pursuant to which we acquired
in May 2009 all of its stake in Reficar through our subsidiary Andean Chemicals,
thereby becoming the sole indirect owner of Reficar.
As part
of this overhaul plan we expect to increase the competitiveness and
profitability of Reficar through the modernization of its facilities and
processes and improve the reliability of its units. We plan to
increase the refinery’s production capacity to 150 thousand bpd by 2013 and
improve refining margins by processing cheaper heavy crude oils; raising the
conversion ratio, and producing a higher quality product slate. We
also expect to satisfy existing environmental regulations for fuels by reducing
sulfur content in gasoline and diesel fuel, thus complying with national and
international fuel standards.
47
The
following table sets forth the production of refined products of Barrancabermeja
for the years ended December 31, 2009, 2008 and 2007.
|
For
the year ended December 31,
|
||||||||||||
|
2009
|
2008
|
2007
|
||||||||||
|
(bpd)
|
||||||||||||
|
LPG,
propylene and Butane
|
17,122 | 18,227 | 18,019 | |||||||||
|
Motor
Fuels
|
75,174 | 77,110 | 78,663 | |||||||||
|
Jet
Fuel
|
52,413 | 15,861 | 15,152 | |||||||||
|
Diesel
|
15,375 | 60,633 | 66,931 | |||||||||
|
Fuel
Oil
|
44,390 | 48,747 | 41,387 | |||||||||
|
Lube
Base Oils and Waxes
|
2,288 | 2,031 | 1,752 | |||||||||
|
Aromatics
and solvents
|
3,301 | 2,893 | 3,227 | |||||||||
|
Asphalts
and Aromatic Tar
|
7,547 | 6,862 | 6,434 | |||||||||
|
Intermediates
|
881 | 998 | 477 | |||||||||
|
Total
|
218,491 | 233,363 | 232,042 | |||||||||
|
Difference
between Inventory of Intermediate Products
|
236 | 1,897 | (441 | ) | ||||||||
|
Total
Production
|
218,727 | 235,259 | 231,601 | |||||||||
The
following table sets forth the production of refined products of Reficar for the
years ended December 31, 2009, 2008 and 2007.
|
For
the year ended December 31,(1)
|
||||||||||||
|
2009
|
2008
|
2007
|
||||||||||
|
(bpd)
|
||||||||||||
|
LPG,
Propylene and Butane
|
5,255 | 4,869 | 3,117 | |||||||||
|
Motor
Fuels
|
26,847 | 24,577 | 27,198 | |||||||||
|
Jet
Fuel and Kerosene
|
20,742 | 6,969 | 6,911 | |||||||||
|
Diesel
|
8,098 | 20,260 | 21,534 | |||||||||
|
Fuel
Oil
|
16,710 | 18,495 | 19,288 | |||||||||
|
Aromatic
Tar
|
945 | 820 | 1,162 | |||||||||
|
Other
Products
|
40 | 33 | 46 | |||||||||
|
Total
|
78,636 | 76,024 | 79,256 | |||||||||
|
Difference
between Inventory of Intermediate Products
|
1,619 | 2,176 | 1,499 | |||||||||
|
Total
Production
|
80,255 | 78,200 | 80,755 | |||||||||
|
(1)
|
The
table shows the entire production of
Reficar.
|
In
addition to our product slate, we have started to purchase low-sulfur diesel and
biodiesel to improve the quality of the diesel produced at Barrancabermeja and
Reficar. Reficar is currently purchasing biodiesel fuel in the local
market and mixing it with its production of diesel to reduce sulfur
content. Barrancabermeja is also working on improving the quality of
its diesel products and is currently importing low-sulfur diesel. The
low-sulfur diesel is being mixed with the current diesel production of
Barrancabermeja.
Petrochemicals
and other products
We own
and operate four petrochemical plants located within Barrancabermeja producing a
variety of products including aromatics, cyclohexane, paraffin waxes, lube base
oils, polyethylene and solvents.
In 2008,
we invested US$54 million to improve our polyethylene production capacity
in the Barrancabermeja Refinery. As a result of this investment,
during 2009, we increased our low-density polyethylene production capacity at
Barrancabermeja by 10,695 tons per year, representing an increase of
19%. As a result, our polyethylene deliveries increased by 31,970
tons per year.
48
Propilco
On
April 7, 2008, we completed the acquisition of
Propilco. Propilco is the main polypropylene supplier in Colombia and
the leading resins producer in the Andean region, Central America and the
Caribbean. This acquisition allows us to assure synergies and to
create value by taking advantage of the petrochemical flows derived from the
refining process. It also opens the possibility of us undertaking new
petrochemical projects in the future, which would follow the current trend in
the hydrocarbon industry.
The
following table sets forth Propilco’s capacity and throughput for each of the
last three years.
|
For
the year ended December 31,
|
||||||||||||
|
2009
|
2008
|
2007
|
||||||||||
|
(Metric
Tons)
|
||||||||||||
|
Capacity
|
455,000 | 405,000 | 380,000 | |||||||||
|
Throughput
|
384,858 | 383,874 | 372,476 | |||||||||
|
%
Use
|
85 | % | 95 | % | 98 | % | ||||||
During
2009, Propilco’s production totaled 385 thousand tons of petrochemical
products, a 0.3% and 3.3% increase when compared to the 384 thousand tons
produced in 2008 and 372 thousand tons in 2007,
respectively. However, Propilco’s profits were negatively affected
during the last two quarters of 2008 and the first quarter of 2009 as a result
of the decrease in the differences between the prices of petrochemical products
and the price of crude oil.
We intend
to expand Propilco’s production facilities to increase its production capacity
to 500 thousand tons in 2010.
Transportation
Summary
Our
transportation segment includes the transportation of crude oil, motor fuels,
fuel oil and other refined products, excluding natural gas. In 2009,
our transportation segment also included the transportation of the mixture of
diesel and palm oil.
At
December 31, 2009, we, directly or in joint venture with private sector
participants, owned, operated and maintained an extensive network of crude oil
and refined products pipelines connecting our and third-party production centers
and terminals to refineries, major distribution points and export
facilities. We own outright 42% of the total crude oil pipeline
shipping capacity and 99% of the total product pipeline shipping capacity in
Colombia. When aggregated with the crude oil pipelines in which we
own an interest, we have access to 75% of the oil pipeline shipping capacity in
Colombia.
Our
transportation business has three key elements: transportation and
shipping of our own and third party crude oil and refined products; sales of
excess transportation capacity to third parties; and optimization of our
transportation infrastructure according to our existing and future
transportation needs.
At
December 31, 2009, our network of crude oil and multi-purpose pipelines extended
approximately 9,164 kilometers in length. The transportation network we own
directly and in partnership with our joint venture partners consists of
approximately 5,128 kilometers of main crude oil pipeline networks connecting
various fields to the Barrancabermeja refinery and Reficar, as well as to export
facilities. Of the 5,128 kilometers of crude oil pipelines, we directly own
2,911 kilometers and 2,217 kilometers with our business partners. We also own
3,654 kilometers of pipelines for transportation of refined products from the
Barrancabermeja refinery and Reficar to wholesale distribution points.
Approximately 58.2% of our crude oil pipelines were constructed through joint
ventures and other agreements with our business partners in order to transport
crude oil from producing fields.
49
Strategy
Our main
strategies in our transportation segment are to:
|
|
·
|
Improve
efficiency in all stages of logistic processes by using a variety of
transportation systems and focusing on operational excellence, safety
standards and high quality
services;
|
|
|
·
|
Construct
the necessary crude oil pipelines to transport our crude oil and heavy
crude oil from the fields to the refineries and ports and to construct the
necessary refined products pipelines to transport our refined products
according to demand; and
|
|
|
·
|
Selectively
invest in the development of new and more efficient transportation systems
and support upstream and downstream
strategies.
|
All of
our transportation processes have been certified under ISO 9001, ISO 14001 and
OHSAS 18001, which provide standards for hydrocarbons reception, storage,
dispatch by pipes and pipelines and the import and export facilities of our
docks.
We are
currently developing our transportation infrastructure in order to meet our
increased transportation needs and for any additional needs which may result
from new discoveries. We have significant experience in providing
transportation services through crude oil pipelines, trucks, tankers and
barges.
50
The map
below shows the main transportation networks owned by our business partners and
us.
TRANSPORTATION
INFRASTRUCTURE
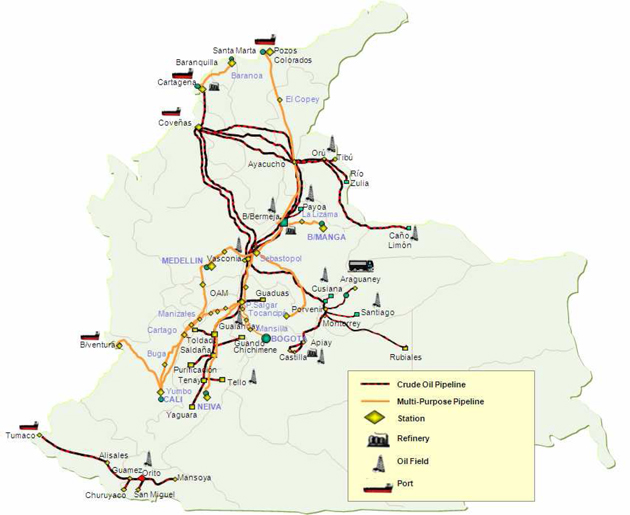
Pipelines
In 2009,
pipelines in which we own an interest transported a total of 576.2 thousand
bpd of crude oil and 223.3 thousand bpd of refined products for a total of
799.5 thousand bpd in 2009, a 6.3% increase when compared to
2008. In 2008 pipelines transported a total of 751.8 thousand
bpd of crude oil and refined products compared to 710.4 thousand bpd in
2007.
The
following table sets forth our main pipelines and the main pipelines in which we
own an interest by name, kilometers covered, type of product transported,
origin, destination and our ownership percentage as of December 31,
2009.
|
Pipeline
|
Kilometers
|
Product
Transported
|
Origin
|
Destination
|
Ownership
Percentage
|
||||||||
|
Caño
Limón-Coveñas
|
771.4 |
Crude
Oil
|
Caño
Limón
|
Coveñas
|
100.00 | % | |||||||
|
Oleoducto
del Alto Magdalena
|
397.4 |
Crude
Oil
|
Tenay
|
Vasconia
|
85.12 | % | |||||||
|
Oleoducto
de Colombia
|
480.8 |
Crude
Oil
|
Vasconia
|
Coveñas
|
65.57 | % | |||||||
|
Oleoducto
Central S.A. (Ocensa)
|
834.5 |
Crude
Oil
|
Cusiana
|
Coveñas
|
60.00 | % | |||||||
51
|
Pipeline
|
Kilometers
|
Product
Transported
|
Origin
|
Destination
|
Ownership
Percentage
|
||||||||
|
Oleoducto
Transandino
|
305.4 |
Crude
Oil
|
Southern
fields
|
Tumaco
Port
|
100.00 | % | |||||||
|
Oleoducto
de los Llanos (ODL)
|
235 |
Crude
Oil
|
East
fields
|
Monterrey
|
65.00 | % | |||||||
As a
result of the extension of the Cravo Norte Association Contract, we and our
business partner Occidental, agreed that all assets included in such contract
which were acquired prior to December 31, 2008 would completely revert back
to Ecopetrol. The Caño Limon-Coveñas pipeline is included among these
assets. As a result, since January 1, 2009, we are the exclusive
owner of this pipeline.
In
March 2009, we entered into an agreement with Enbridge Inc., a Canadian
company, pursuant to which we acquired 100% of its interest in Oleoducto Central
S.A. (Ocensa), thereby increasing our ownership of Ocensa from 35.3% to
60%.
In
March 2009, we entered into an agreement with Maurel et Prom pursuant to
which we acquired in May 2009 100% of its stake in its subsidiary in
Bermuda, Hocol Petroleum Limited. Hocol Petroleum Limited’s most
important assets are Hocol and Homcol, two companies incorporated in the Cayman
Islands with branches in Colombia involved in crude oil and natural gas
exploration and production activities in Colombia. Additionally, as a
result of this acquisition, we are now the indirect owner of Hocol’s interest in
Oleoducto de Colombia S.A. and Oleoducto del Alto Magdalena and our total
interest in these two pipelines increased from 43.85% to 65.57% and from 49% to
85.12%, respectively.
In
September 2009, Oleoducto de los Llanos Orientales Sucursal Colombia, a
branch of our subsidiary, Oleoducto de los Llanos Orientales (“ODL”) in which we
have a 65% interest, inaugurated the 235 km, 24” pipeline to transport crude oil
from the Rubiales field to the Monterrey pump station where it connect with the
Ocensa pipeline. The current transportation capacity of the pipeline
is 160 thousand bpd.
The
operation of our pipelines is made under international standards and industry
practices, such as remote operation, integrity management, automatic ticket
transfer, health, safety and environmental policies and a high index of customer
satisfaction. The reduction in operating costs, fulfillment of
volumetric commitments and reduction in theft, have resulted in higher customer
satisfaction and a lower number of complaints.
The table
below sets forth the volumes of crude oil and refined products transported
through the crude oil pipelines and multipurpose pipelines owned by
us.
|
For
the year ended December 31,
|
||||||||||||
|
2009
|
2008
|
2007
|
||||||||||
|
(thousand
bpd)
|
||||||||||||
|
Crude
oil transport
|
576.2 | 542.3 | 516.6 | |||||||||
|
Refined
products transport
|
223.3 | 209.5 | 193.8 | |||||||||
|
Total
|
799.5 | 751.8 | 710.4 | |||||||||
At
December 31, 2009, we owned 58 stations, 23 of them located in crude oil
pipelines and 35 of them in refined products pipelines with a nominal storage
capacity of 19 million barrels of crude oil and 6 million barrels of
refined products. We also sell storage capacity to third parties in
our Pozos Colorados and Mansilla facilities and in the Coveñas
port. We do not own any tankers.
Theft
of hydrocarbons
Hydrocarbon
theft, which reached 7,270 bpd in 2002, was reduced to 196 bpd in 2009, as a
result of the comprehensive strategy developed in coordination with different
law-enforcement agencies and governmental authorities. Theft of fuel
in 2009, when compared to 2008, was reduced by 50% and 97.3% when compared to
2002. We continue to evaluate alternatives to improve the efficiency
of our transportation system, including improvements to the monitoring and
control systems through new supervisory activities and data collection
systems.
52
The table
below sets forth the decrease in the level of hydrocarbon theft in our pipelines
and multipurpose pipelines.
|
For
the year ended December 31,
|
||||||||||||
|
2009
|
2008
|
2007
|
||||||||||
|
(bpd)
|
||||||||||||
|
Hydrocarbon
theft
|
196 | 389 | 561 | |||||||||
Other
transportation facilities
We also
enter into transportation agreements with tanker trucks and barge companies to
transport crude oil from production locations that currently do not have
pipeline connection to the refineries and our export
locations. Production of refined products for which we currently have
no pipeline capacity and cannot be transported in the tanker trucks is
transported by barges. During 2009, 24.4 million barrels of
crude oil and refined products were transported by tanker trucks and
9.75 million barrels of crude oil and refined products were transported by
barges.
Export
and import facilities
We
currently own five docks for export of crude oil and refined
products. Our crude oil loading facilities can load tankers of up to
145 thousand DWT. Adjacent to these loading facilities we also
have crude oil storage facilities which are capable of storing 7.5 million
barrels. Our docks used for import and export of refined products can
load tankers of up to 70 thousand DWT. Additionally, these
facilities have storage capacity of up to 1 million barrels.
New
transportation projects:
Heavy
Crude Oil Castilla Pipeline Project
We expect
to construct a new pipeline system, which will transport solvents from the
Sutamarchan pumping station in the Central region to the Castilla
field. This new pipeline system will occur in two
stages. First, we intend to construct a new 133 kilometers
multipurpouse-pipeline, which will transport solvents from the Sutamarchan
pumping station to the Porvenir pumping station. Second, we intend to
convert our old Apiay – Provenir crude oil pipeline to a refined products
pipeline. This pipeline will transport solvents for heavy crude oils
produced in the Castilla fields.
In
December 2008 we finished the construction of a new 129 kilometer pipeline
in the Central region which connects the Apiay field with the El Porvenir
pumping station. The pipeline increased our transportation capacity
from the Castilla fields by approximately 50% in the first stage of the
project. This pipeline became the second pipeline connecting the
Apiay field with the El Porvenir pumping station.
Increase
the capacity of the Pozos Colorados - Galán multi-purpose pipeline
We built
a new 140 kilometers pipeline in the Mid Magdalena region from Ayacucho to Galán
and we expect to modify approximately 290 kilometers of the Pozos Colorados –
Ayacucho pipeline, upgrading the system to a 14” pipeline. Through
this expansion, we aim to (i) increase transportation capacity to 60 bpd
and (ii) transport imported diluents and diesel to the Barrancabermeja
Refinery.
Distribution
and Marketing
Summary
We market
a full range of refined and feed stock products locally
including regular and high octane gasoline, diesel fuel, jet fuel, natural gas
and petrochemical products. Local sales of regular gasoline, LPG, jet
fuel and diesel fuel as well as natural gas from the Guajira field are subject
to government price regulation with reference to international benchmarks for
fuel oil.
53
We are
the main producer and supplier of fuel and refined products in
Colombia. For regulated products, the Ministry of Mines and Energy
establishes maximum prices producers can charge and retail prices for these
products pursuant to resolutions. The Ministry also establishes
maximum wholesale and retail margins. In terms of LPG, the Energy and
Gas Regulatory Commission establishes maximum prices as well as wholesale and
retail margins.
Strategy
Our
strategy in the marketing and distribution business segment is focused on
supplying the local market and exporting crude oil not used in our refineries,
and refined products principally to end-users, including refineries and
wholesalers. Our crude oil export sales are made in the spot market
and through long-term contracts, primarily to US Gulf Coast refineries, the US
West Coast, Caribbean and Chinese refineries. We are focused on
entering into new and developing markets and increasing the direct sales of our
products to the Far-East.
Crude
oil supply commitments
As part
of our transfer of Reficar’s assets in April 2007, we extended a commercial
offer to Reficar for the supply of crude oil. The commercial offer
was renewed in January 2010 for an additional six-month
period. Pursuant to the terms of the offer, Reficar has the option to
purchase from us up to 85 thousand bpd of crude oil from our Caño Limón,
Vasconia Blend, Ayacucho Blend, Cusiana and Castilla production. As
we continue to operate Reficar, our operations committee evaluates and decides
monthly the refinery’s crude oil mix needs including the need for foreign crudes
which we import from West Africa, the North Sea and the
Caribbean. The purchase price for the delivered volumes is equal to
an international benchmark index, subject to certain adjustments.
Import
of Ultra Low Sulfur Diesel Fuels
We are
reducing sulfur emissions from fuels produced by us through the import of ultra
low sulfur diesel to be mixed with our local production in order to protect the
environment. From July 2008 (the date we began to import this
ultra low sulfur diesel) through December 2009, we managed to keep sulfur diesel
levels under 500 ppm (parts per million) in Bogota and reduced sulfur
diesel levels from 3,000 ppm to 2,500 ppm in the rest of the
country. We expect that the quality of our diesel (sulfur levels)
will continue to improve in 2010 according to our results and international
standards.
Natural
Gas
Summary
Development
of natural gas reserves began in the 1970s with the discovery of the Guajira
fields in the Northeastern region. Additional natural gas reserves
were discovered in the Piedemonte
Llanero. In Colombia we have been selling natural gas to local
distribution companies, power generators and large customers and have also been
exporting natural gas to Venezuela. In 1986, we introduced a program
known as “Natural Gas for Change”, which sought to increase local
consumption. In 1993, the Government developed a regulatory framework
for the distribution and marketing of natural gas. Between 1995 and
1997, we connected our natural gas production fields with distribution points
and major cities. In 1997, we transferred all of our natural gas
transportation assets to a newly created company, Empresa Colombiana de Gas or
Ecogás. Ecogás had spun off from us in 1998. Thereafter,
Ecogas transferred all of its assets to a new company, incorporated for such
purpose, named Transportadora de Gas Internacional S.A. E.S.P. (“TGI,” formerly,
Transportadora de Gas del Interior S.A.E.S.P.), which is owned by Empresa de
Energía Eléctrica de Bogotá.
Marketing of Natural
Gas
Currently,
there are more than 20 natural gas distribution companies with operations in
Colombia. As a result of the growth of the natural gas demand from
Venezuela and the increase in the domestic consumption of the gas-power plants
in recent years, the total demand for natural gas, including natural gas
exports, has increased by 14.1% in 2009 to 1,035.1 giga British thermal units
per day (gbtud), from 907 gbtud in 2008 and by 19.2% from 760.4 gbtud in
2007. At December 31, 2009, natural gas distribution companies
had approximately 5.3 million customers. We sell natural gas to
distribution companies through take-or-pay or swing contracts.
54
Compressed
Natural Gas
Demand
for compressed natural gas decreased by 4.3% in 2009 as compared to 2008 as a
result of (i) a decrease in natural gas price competitiveness against
gasoline prices, (ii) a decrease in the benefit/cost ratio due to higher
costs associated with new conversion technologies and (iii) certain supply
problems in some cities.
During
2009, we signed three new agreements for the supply of compressed natural gas in
the following Colombian regions: the Central Region, which includes
cities such as Bogota and Medellin, the Coffee Region and the Western
Region. 21,600 additional vehicles were converted in 2009 for a total
of 301,986 vehicles converted at the end of 2009.
Natural
gas sales to the power and industrial sector
We market
and sell natural gas to the industrial sector and to gas-fired and combined
cycle power plants. We have a number of long-term supply contracts
with power generators under which such companies have entered into take-or-pay
contracts and purchase and supply obligations for the supply of natural
gas. Pursuant to the terms of these agreements if we do not ship the
contracted natural gas amounts we must pay a fine to our
customers. Long-term supply contracts establish a pricing formula
that depends on international reference prices.
We have
entered into long-term take-or-pay contracts with 11 of the 14 gas fired and
combined cycle power plants located in Colombia. During 2009, gas
sales increased in the industrial sector as a result of the South Pacific
phenomenon known as “El Niño”.
The
following table sets forth our local deliveries of natural gas including
deliveries to our refineries, during 2009, 2008 and 2007.
|
For
the year ended December 31,
|
||||||||||||
|
2009
|
2008
|
2007
|
||||||||||
|
(gbtud)
|
||||||||||||
|
Gas-fired
power plants
|
153.7 | 73.5 | 123.3 | |||||||||
|
Refineries
|
87.2 | 88.3 | 93.5 | |||||||||
|
Petrochemical
|
3.1 | 4.2 | 4.0 | |||||||||
|
Industrial
|
65.7 | 64.7 | 40.6 | |||||||||
|
Distributors(1)
|
172.2 | 192.2 | 152.9 | |||||||||
|
Compressed
Natural Gas
|
36.2 | 31.6 | 40.9 | |||||||||
|
Producers
|
30.3 | 36.1 | 60.0 | |||||||||
|
Total
Deliveries
|
548.4 | 490.5 | 515.2 | |||||||||
|
(1)
|
Deliveries
to distributors include deliveries to industrial clients who are required
to purchase natural gas from
distributors.
|
Natural
Gas Exports
In 2007,
we and Chevron entered into a long-term natural gas supply contract with
PDVSA. Pursuant to the terms of the agreement, we have agreed to
deliver the following quantities of natural gas to Venezuela:
|
For
the year ended December 31,
|
||||||||||||||||
|
2008
|
2009
|
2010
|
2011
|
|||||||||||||
|
(gbtud)
|
||||||||||||||||
|
Volume
Commitments
|
50 | 150 | 150 | 100 | ||||||||||||
In 2009
and 2008, we and our partner Chevron delivered 179.1 gbtud and 146.9 gbtud
respectively, thereby exceeding the quantities of natural gas agreed to in our
gas export contract with PDVSA. Of the total volume of gas delivered,
45.6% came from us, 34.4% came from Chevron and 20% came from
royalties.
55
Natural
gas delivery commitments
The table
below sets forth the commitments we have in firm contracts with local natural
gas distribution companies, local industries, gas fired power generators,
international companies (PDVSA in Venezuela) and internal agreements with our
refineries and fields:
|
For
the year ended December 31,
|
||||||||||||||||||||||||||||
|
2010
|
2011
|
2012
|
2013
|
2014
|
2015
|
2016
|
||||||||||||||||||||||
|
(gbtud)
|
||||||||||||||||||||||||||||
|
Volume Commitments(1)
|
669 | 730 | 373 | 271 | 324 | 271 | 256 | |||||||||||||||||||||
|
(1)
|
Includes
royalty volumes that are managed by
Ecopetrol.
|
We have
natural gas delivery commitments with local natural gas distribution companies,
local industry, gas-fired power generators, international companies (PDVSA) and
internal agreements with refineries and fields. Pursuant to long-term
supply contracts and other agreements, we must supply natural gas to these
parties and failure to deliver the agreed amounts would result in
fines. In order to meet our natural gas delivery commitments we have
four (4) main natural gas production fields, the “Guajira” fields, the “Cusiana
and Cupiagua” fields, the “Piedemonte” fields and the “Gibraltar”
fields. The “Guajira”, “Cusiana and Cupiagua” and “Piedemonte” fields
are productive fields whereas the “Gibraltar” field will begin production at the
end of 2010. Of our total natural gas production at December 31,
2009, 73% was supplied by the La Guajira production, 20% from the Cusiana and
Cupiagua fields and the remaining 8% from fields located in other
regions.
The
following table sets forth the estimated production of our productive fields
which is available to meet our firm delivery commitments of natural gas for the
years ended December 31, 2010 to 2014.
|
For
the year ended December 31,
|
||||||||||||||||||||
|
2010
|
2011
|
2012
|
2013
|
2014
|
||||||||||||||||
|
(gbtud)
|
||||||||||||||||||||
|
Guajira
Fields
|
464.6 | 450.0 | 409.5 | 347.7 | 315.0 | |||||||||||||||
|
Cusiana
and Cupiagua Fields
|
209.8 | 243.2 | 190.1 | 190.1 | 190.1 | |||||||||||||||
|
Other
Fields
|
51.1 | 74.2 | 63.9 | 60.5 | 55.6 | |||||||||||||||
|
Imports
|
0.0 | 0.0 | 39.0 | 85.0 | 127.0 | |||||||||||||||
|
Total
|
725.53 | 767.38 | 702.46 | 683.31 | 687.74 | |||||||||||||||
Price
controls on the La Guajira natural gas production
The
Ministry of Mines and Energy through the Colombian Commission for the
Regulation of Energy and Gas or CREG, establishes the maximum price we are
allowed to charge customers who consume less than 100 thousand cfpd from La
Guajira field, under take-or-pay contracts, which we refer to as regulated
customers. Maximum prices we can charge are determined with reference
to the average export price for fuel oil for the prior six months.
Priorities
for delivery of natural gas
The
Ministry of Mines and Energy established distribution priorities in the event of
a shortfall of reserves or production of natural gas. Residential
consumers with existing supply contracts, small businesses and distributors of
compressed natural gas have the first priority for
delivery. Contracts for export of natural gas have the same priority
under the firm commitments as other users such as industrial consumers and power
generators. The agreements that are not firm commitments and
contemplate delivery of natural gas “as available” have priority over customers
on the spot market. We may enter into natural gas export contracts if
the ratio of reserves to production exceeds seven years.
56
The
Ministry of Mines and Energy also establishes distribution priorities in the
event of a natural gas shortfall derived from supply or infrastructure
issues. This order of priority is based on the type of contract, with
firm supply contracts having priority over swing supply contracts.
Legal
Proceedings
At
December 31, 2009, we were a party to 2,428 legal proceedings relating to
civil, administrative, environmental, tax and labor claims filed against us in
the Colombian courts and arbitration tribunals. Historically, we have
been successful in defending lawsuits filed against us. Based on the
advice of our legal advisors it is reasonable to assume that the litigation
procedures brought against us will not materially affect our financial position
or solvency regardless of the outcome. See Note 30 (Contingencies) to our
Consolidated Financial Statements included in this annual report for a
discussion of our legal proceedings. We highlight an unresolved
material lawsuit:
Foncoeco
An
association of former employees known by the acronym Foncoeco brought an action
against us in connection with a company profit-sharing plan offered in 1962 that
expired in 1975. The plaintiffs claim that our Board of Directors had
set aside a specific amount under the profit sharing plan, which was not
entirely distributed to employees eligible under the plan. The court
of first instance on June 25, 2002, ruled in our favor and rejected the
plaintiffs’ arguments. The plaintiffs appealed the ruling to the
Bogota Higher Tribunal, which ordered us to present a rendición de cuentas (an
accounting action) to the first instance judge based on the amounts allocated by
our Board of Directors. Based on the judge’s conclusion with respect
to our accounting and the expert testimony of a witness presented by the
plaintiffs who included amounts never allocated by our Board of Directors to the
profit sharing plan, the first instance judge on December 16, 2005, ordered
us to pay Ps$541,833 million, or approximately
US$260 million. We have appealed the decision by the first
instance judge to the Bogota Higher Tribunal and are still waiting for the final
judgment. Based on the opinions from our legal counsel regarding the
likelihood of a favorable ruling we expect the Bogota Higher Tribunal to revise
and reduce the amount of the first instance. Additionally, as of
December 31, 2009 we have increased the previously created provision to
Ps$139,933 million considering the probability of a ruling in favor of the
plaintiffs.
Regulation
The
principal governmental entities regulating us are the Ministry of Mines and
Energy and the CREG.
Ministry
of Mines and Energy
The
Ministry of Mines and Energy is responsible for managing and regulating
Colombia’s nonrenewable natural resources assuring their optimal utilization by
defining and adopting national policies regarding exploration, production,
transportation, refining and distribution of minerals and
hydrocarbons.
CREG
Laws 142
and 143 of 1994 created the CREG, a special administrative unit of the Ministry
of Mines and Energy, responsible for regulating and establishing the standards
for the exploitation and use of energy and natural gas, fostering the
development of the energy services industry, promoting competition and
responding to consumer and industry needs.
Control
Entities
Superintendency
of Domiciliary Public Services
Under
Colombian regulations, the distribution and marketing of natural gas is
considered a public service. As such, this activity is regulated by
Law 142 of 1994 and supervised by the Superintendency of Domiciliary Public
Services.
57
Superintendency
of Corporations
We are
subject to the supervision of the Superintendency of Corporations, the
governmental body responsible for supervising corporations domiciled in
Colombia.
Superintendency
of Finance
The
Superintendency of Finance is responsible for monitoring, promoting and
regulating the publicly traded securities market, registered issuers,
broker-dealers, mutual funds and any other participants in the public market
including the BVC.
We are a
registered issuer and our debt (pension bonds) and equity securities are
publicly traded. The Superintendency of Finance is responsible for
the supervision of any activity we undertake that may affect the market for our
securities. We are required to inform the Superintendency of Finance
of any material event and provide periodic reports of our financial
condition.
Superintendency
of Ports and Transport
The
Superintendency of Ports and Transport has exclusive control and regulates us in
matters related to ports concession contracts, in which we act as
contractor.
National
Superintendency of Health
Since we
provide health benefits to our employees and their families, the National
Superintendency of Health has exclusive control and regulates us in matters
related to the inspection, supervision and control of the Social Security Health
System.
Hydrocarbon
Resources Administrator
National
Hydrocarbons Agency – ANH
The ANH
was created in 2003 and is responsible for the administration of Colombia’s
hydrocarbon reserves. The ANH’s objective is to manage the
hydrocarbon reserves owned by the Nation through the design, promotion and
negotiation of the exploration and production agreements in areas where
hydrocarbons are found. The ANH is also responsible for creating and
maintaining attractive conditions for private investments in the hydrocarbon
sector and for designing, bidding rounds for exploration blocks. Any
oil company selected by the ANH to explore a specific block must execute an
exploration and production contract with the ANH. All royalty
payments in connection with the production of hydrocarbons are made to the ANH
in-kind unless the ANH grants a specific waiver to make royalty payments in
cash.
We, and
other oil companies working in Colombia send to the ANH information on the
evolution of our exploratory activities and those of our partners.
Regulatory
Framework
Regulation of
Exploration and Production Activities
Pursuant
to Colombian law, the Nation is the exclusive owner of all hydrocarbon resources
located in Colombia and has full authority to determine the rights, royalties or
compensation to be paid by private investors for the exploration or production
of any hydrocarbon reserves. The Ministry of Mines and Energy is the
authority responsible for regulating all activities related to the exploration
and production of hydrocarbons in Colombia.
Decree
Law 1056 of 1953 or the Petroleum Code, establishes the general procedures and
requirements that must be completed by a private investor prior to commencing
hydrocarbon exploration or production activities. The Petroleum Code
sets forth general guidelines, obligations and disclosure procedures that need
to be followed during the performance of these activities.
58
Prior to
2003, all activities regarding the exploration and production of hydrocarbons
were governed by Decree 231 of 1974. Consequently, during such period
all of our activities were outlined and regulated by this
decree. Decree 231 was replaced by Decree Law 1760 of 2003, but all
agreements entered into by us prior to 2003 with other oil companies are still
regulated by Decree 231.
Decree
Law 1760 of 2003 introduced Colombia’s new contractual regime for hydrocarbons
and granted the ANH full and exclusive authority to regulate and oversee the
exploration and production of hydrocarbon reserves. Decree Law 1760
was complemented by Decree 2288 of 2004, which regulates all aspects related to
the reversion of reserves and infrastructure under the joint venture agreements
executed by us before 2004. Accord 008 of 2004 issued by the
Directive Council of the ANH, sets forth the necessary steps for entering into
exploration and production contracts with the ANH.
Pursuant
to Colombian law we are obliged by law to pay a percentage of our production to
the ANH as royalties. Each production contract has its own royalty
arrangement. In 1999, a modification to the royalty system
established a sliding scale for royalty payments linked to the production level
of crude oil and natural gas fields discovered after July 29, 1999 whether
the production is crude oil or natural gas, and the quality of the crude oil
produced. Since 2002 the royalties system has ranged from 8% for
fields producing up to 5,000 bpd to 25% for fields producing in excess of
600,000 bpd. Changes in royalty programs only apply to new
discoveries and do not alter fields already in their production
stage. Producing fields pay royalties in accordance with the
applicable royalty program at the time of the discovery. Our
contracts specify that royalties are to be paid in physical product (oil and
gas) to the ANH.
We
currently purchase all physical product delivered by producers of crude oil and
natural gas as royalty payments to the ANH at prices set forth in Law 756 of
2002 and Resolution 18-1709 of 2003. The purchase price is calculated
on a reference price for crude oil and natural gas at the wellhead and varies
depending on prevailing international prices. We have an interagency
agreement or Convenio with the ANH, whereby we collect all in kind and cash
royalties owed to the ANH by the oil and gas companies in
Colombia. The ANH may extend offers to sell such physical product and
we, at our option, may accept such offers to purchase the royalty
volume. We sell the physical product purchased from the ANH as part
of our ordinary business.
Regulation of
Refining and Petrochemical Activities
Refining
and petrochemical activities are considered a public service and are subject to
Governmental regulation. Article 58 of the Petroleum Code
establishes that oil refining activities can be developed throughout
Colombia. Oil refineries must comply with the technical
characteristics and requirements established by the existing
regulations.
The
Ministry of Mines and Energy is responsible for regulating, supervising and
overseeing all activities related to the refining of crude oil, import of
refined products, storage, transport and distribution.
Decree 2657
of 1964 regulated the oil refining activities and created the Oil Refining
Planning Committee which is responsible for studying industry problems and
implementing short and long-term refining planning policies. The
Committee is also responsible for evaluating and reviewing new refining projects
or expansion of existing infrastructure. Prior to deciding on a new
project, the Committee must take into account the significance of the project
and the economic impact, the sources of financing, profitability, social
contribution, the effects on Colombia’s balance of payments and the price
structure of the refined products.
Pursuant
to Resolution 18 0966 of 2006 issued by the Ministry of Mines and Energy and
Article 58 of the Petroleum Code, any refining company operating in
Colombia must provide a portion or, if needed, the total of its production to
supply local demand prior to exporting any production. If the
regulated production income, the principal item in the price formula,
becomes lower than the export parity price, the price paid for the refined
products will be equivalent to the price for those products in the U.S. Gulf
Coast market. If there is a need of local demand for imported crudes,
the refining company may charge additional transportation costs in proportion to
the crudes delivered to the refinery.
The
Ministry of Mines and Energy establishes the safety standards for LPG, storage
equipment, maintenance and distribution. Regulations issued in 1992
established that every local, commercial and industrial facility with a storage
capacity of LPG greater than 420 pounds must receive an authorization for
operations from the General Directorate of Hydrocarbons of the Ministry of Mines
and Energy.
59
Regulation of
Transportation Activities
Hydrocarbon
transportation activity is considered a public service in Colombia and therefore
is under governmental supervision and control. Transportation and
distribution of crude oil, natural gas and refined products must comply with the
Petroleum Code.
Transport
systems, classified as crude oil pipelines and multipurpose pipelines, can be
owned by private parties. The building, operation and maintenance of
the pipelines must comply with environmental, social, technical and economic
requirements under national and international
standards. Transportation networks must follow specific conditions
regarding design and specifications, while complying with the quality standards
demanded by the oil and gas industry.
According
to Law 681 of 2001, multipurpose pipelines owned by us must be open to
third-party use and we must offer their capacity on the basis of equal access to
all.
The
hydrocarbon transport activity can be developed by third parties and must meet
all requirements established by law.
The
Ministry of Mines and Energy is responsible for:
|
|
·
|
Studying
and approving the design and blueprints for private pipelines and
approving the construction of all
pipelines;
|
|
|
·
|
Establishing
the hydrocarbon transport tariffs based on the information furnished by
the service provider;
|
|
|
·
|
Issuing
the hydrocarbon transport
regulations;
|
|
|
·
|
Verifying
the calculation and payment of transport related taxes;
and
|
|
|
·
|
Managing
the information system for the oil product distribution
chain.
|
The
construction of transportation systems requires Government licenses and local
permits awarded by the Ministry of the Environment as well as licenses from the
regional environmental authorities.
Regulation on
selling, distributing, transporting and marketing of natural gas
The sale
of natural gas and its by-products is subject to certain controls and
limitations under Colombian law such as maximum prices to be charged to
wholesalers, retailers and distributors.
The
distribution of natural gas and its by-products is considered a domiciliary
public service and is therefore subject to Government regulation. The
transportation and marketing of natural gas production, although not classified
as domiciliary public services, are considered complementary activities to the
distribution service and therefore, are also governed by Law 142 of
1994. In addition, each of these activities is governed by specific
regulations established by the CREG and the Ministry of Mines and
Energy.
CREG’s
Resolution 057 of 1996 delineates and separates the different activities
related to the natural gas market. It defines transportation as an
independent activity. As such, transporters of natural gas are not
allowed to (i) perform production, commercialization or distribution
activities or (ii) participate in companies whose main purpose is to
perform one of said activities. Transporters also cannot have an
economic interest in electricity generating companies. In addition,
companies whose corporate purpose is to sell, commercialize or distribute
natural gas cannot be transporters and cannot have an economic interest in any
transportation company. Moreover, producers and distributors of
natural gas are allowed to commercialize natural gas as well.
60
CREG’s
Resolution 057 of 1996 also establishes that whenever producers of natural gas
require natural gas for their own use or for the use of their subsidiaries, they
must acquire it from the market or from their own production at a market
price. However, producers are allowed to re-inject natural gas in the
crude of the oil fields operated by them.
CREG’s
Resolution 093 of 2006, as modified by CREG’s Resolution 095 of 2008,
establishes that partners to a natural gas field are not allowed to jointly
commercialize their product without the prior authorization of the CREG, except
for commercialization in the form of auctions by the seller.
The CREG
also regulates the type of agreements that can be used for the marketing,
production, distribution and transportation of natural gas. CREG’s
Resolutions 070 of 2006 and 095 of 2008, as amended, provide three types of
contracts that can be used:
|
|
·
|
Take-or-Pay
Agreements. The buyer agrees to purchase a specific
amount or percentage of production of natural gas and the producer
guarantees the availability of 100% of the agreed
amount.
|
|
|
·
|
Optional Purchase
Agreements. The buyer agrees to pay a premium for its
right to take a fixed amount of natural gas and agrees to pay an exercise
price for the amount of natural gas made available. The
producer guarantees to have available 100% of the agreed-on
amount.
|
|
|
·
|
Interruptible Supply
Agreements. The parties may enter into contracts which
are interruptible if certain market conditions
exist.
|
The
export of natural gas is not considered a public service under Colombian law and
therefore is not subject to Law 142 of 1994. The export of natural
gas is governed by Decree 3428 of 2003 which provides, among other things, that
an importer of natural gas who acquires such natural gas through the national
pipeline system is subject to CREG’s regulatory framework. Export
prices and transportation of natural gas for export are not subject to price
controls. Natural gas producers must first supply the local
consumers.
Decree
3428 of 2003 provides that producers of natural gas may freely dispose of their
proved reserves of natural gas when the R-Factor of the proved reserves is
higher than seven years. If the R-Factor is lower than seven years,
producers of natural gas are not allowed to enter into new agreements or
increase the amounts of previous agreements for the production of natural
gas. The
R-factor will be published by the Ministry of Mines.
Notwithstanding
the foregoing, it is important to highlight that Decree 2687 of 2008, as
modified by Decree 4670 of 2008, establishes that internal demand for natural
gas will take precedence over external demand. Also CREG’s Resolution
095 of 2008 establishes the conditions under which foreign bidders can
participate in natural gas auctions.
Regulation for
sales of liquid fuels
The sale
and transport of liquid fuels (excluding natural gas liquids) is considered a
public service under Colombian law and is therefore subject to the supervision
and control by the Ministry of Mines and Energy.
Decrees
283 and 1521 of 1990 and 1998, respectively, each with its respective
modifications, establish minimum technical requirements for the construction of
storage plants and service stations and regulate the distribution of liquid
fuels establishing the minimum requirements for distributors and the activities
and types of agreements permitted for these agents. The Ministry also
regulates the types of liquid fuels that can be sold and purchased and the
penalties for noncompliance with governmental regulations.
The
Ministry of Mines and Energy fixes the price that we can charge for the sale of
gasoline and fuel oil to wholesalers. The Ministry of Mines and
Energy issues periodic price adjustments and each municipality imposes
additional surcharges applicable to the price.
The price
of gasoline and fuel oil is composed by a set of items such as freights,
volume conversion ratios, import and export tariffs, transportation tariffs and
income tax. Such items are adjusted periodically depending on
the fuel oil and gasoline market. Each municipality may impose
additional surcharges depending on their economic needs.
61
Wholesalers
sell the product based on the price set by the Ministry and the local
municipalities to retailers, earning a distribution margin set by the Ministry
of Mines and Energy. Retailers are free to set a sale price for the
fuel oil and gasoline to be charged to the public.
The
distribution of fuels in areas near Colombian borders is subject to specific
regulations that impose stringent control procedures and
requirements.
Regulation of
biofuel and related activities
The sale
and distribution of biofuels is regulated by the Ministry of Mines and
Energy. Regulations establish the quality and pricing standards for
biofuels and impose minimum requirements for mixing ethanol with gasoline and
biodiesel with diesel.
Environmental
Matters
Regulation
Law 99 of
1993 imposes on any company, including crude oil and natural gas companies, the
obligation to obtain an environmental license prior to undertaking any activity
that could negatively impact the environment. Crude oil companies
must file an environmental plan with the Ministry of Environment which includes,
among others, an environmental impact assessment, and mechanisms established to
prevent, mitigate, correct and compensate any activity that may harm the
environment. The number of licenses required for a crude oil or
natural gas field may vary depending on the background of the field and the
number of wells. In certain cases, the Ministry of Environment will
require a license for each well, and in other cases will require only one
license per field. Obtaining a license may take between 90 and 145
business days depending on whether or not the Ministry of Environment requires
the applicant to file additional information.
The
Ministry of Environment is the highest environmental authority in Colombia and
is in charge of issuing Nation-wide environmental regulations, policies, and
programs. At the regional level, regional environmental authorities
such as the Corporaciones
Autónomas Regionales, are the highest environmental authorities of the
region and are in charge of executing and overseeing all regulations, policies
and programs issued by the Ministry of Environment.
The use
of natural resources is also regulated. Companies that use large
amounts of water for consumption; that discharge industrial wastes into the
coastlines or rivers; that exploit forests reserves or that produce atmospheric
emissions of gases, must obtain a permit from the regional environmental
authorities. Decree 1900 of 2006 provides that any company that uses
water resources and that requires an environmental license to the use of such
resources must assign 1% of its investment to the recovery, conservation,
preservation and supervision of the water resources used.
A company
that does not comply with the environmental regulations, or does not follow the
environmental plan filed before the Ministry of Environment, or that ignores the
requirements imposed by an environmental license, may be subject to an
administrative procedure initiated by the Ministry of Environment or the
regional environmental authorities, as it may be the case, which may result in
oral or written warnings, penalties, license revocation or even temporary or
permanent suspension of the activity being undertaken.
As
February 26, 2010, we were party to 66 environmental administrative
proceedings. During 2009, 34 proceedings were opened and 12
proceedings were closed. In nine of the closed proceedings, we were
subject to monetary fines and the remaining three non-liability declared by the
Company. It is not possible for us to determine the material effect
of these proceedings. Most of our fines have been between Ps$6 and
Ps$447 million.
62
Environmental
Practices
We have
implemented aggressive environmental practices and standards throughout all the
activities performed by us and our workforce. During 2009, we
invested Ps$611,775 million in environmental programs to increase our
environmental compliance levels. These investments include
investments made through our business partners in the sum of
Ps$47,027 million. Such programs include:
|
|
·
|
Compliance. The
purpose of this program is to guarantee knowledge, assessment, disclosure
and compliance with all laws, regulations and requirements imposed by the
Ministry of Environment and other regulatory bodies. We
undertake environmental impact assessments and constantly review our
environmental plan.
|
|
|
·
|
Contingency
Planning. This program focuses on implementing
preventive actions in our operative areas in order to diminish the impact
of oil spills and establish the steps that need to be followed in case of
an emergency.
|
|
|
·
|
Eco-Efficiency. This
program is designed to minimize the environmental impacts resulting from
our (i) use of natural resources through activities such as water
uptake and forest exploitation and (ii) waste generation through
liquid emissions and creation of hazardous
waste.
|
|
|
·
|
Biodiversity. This
program implements initiatives to preserve endangered species in areas
where our activities have strong influence. During 2009, we
invested approximately Ps$24,126 million in investigation and
rehabilitation projects for the recovery of ecosystems and environmental
education in the areas where we
operate.
|
|
|
·
|
Environmental
Culture. This program seeks to promote an environmental
culture in our organization, in our activities, and in our and daily
life. We initiated several environmental campaigns to educate
our working force in areas such as occupational health and friendly
environmental practices.
|
|
|
·
|
Alternative Energy
Sources. This program is designed to develop alternative
energy sources, such as biodiesel and ethanol projects and
activities. During 2009, we invested approximately
US$7.5 million in Bioenergy S.A., a Colombian company of which we
currently own 85%. Bioenergy S.A. is expected to begin
operation during the first quarter of 2012 and to produce
92.75 Million liters per year of ethanol. Throughout 2009,
we worked on the technology for this plant and performed the necessary
activities in order to have a basic seedbed ready for the first
80 acres. In addition, we have continued to construct a
biodiesel plant in Barrancabermeja, Ecodiesel Colombia S.A, of which we
currently own 50%. Ecodiesel Colombia S.A. is expected to begin
commercial production during the first half of 2010 and to have a
production of approximately 100,000 tons of biodiesel per
year.
|
Health,
Safety and the Environment or HSE
We are
devoted to improving our HSE practices. We have several programs in
place to increase our industrial safety and minimize the number of accidents of
our workforce or our contractors. The frequency of accidents taking
place within our premises has declined significantly since 2005, to 1.24
accidents per million of hours worked in 2009 from 5.77 accidents
per million of hour worked in 2005, representing a 79%
reduction. These programs include, among others, the technical and
HSE competences in our employees and contractors, the standardization of HSE
protocols and procedures, drafting safety manuals, compliance with existing
regulations and the study of HSE benchmarks among oil companies.
Specifically,
in the area of occupational health, our goal is to control the workplace hazards
that can affect the health and productivity of our workforce. One of
the ways we aim to reach this goal is by monitoring the health of each one of
our employees and providing the support and mentorship necessary to ensure their
integrity and acclamation to the work. Furthermore, we also actively
promote industrial hygiene and ergonomics and seek to address the psychosocial
effects of our work environment.
63
Additionally,
during 2009 we began working on “Project Safety”, a project aimed at the
continuous improvement and minimization of operational incidents (fire,
explosion, loss of primary containment and multiple fatalities). This
program was built around the following six pillars: (i) culture
and leadership, (ii) requirements, (iii) safe design, (iv) safe
operation, (v) prevention and (vi) response to
emergencies.
During
2009 we also improved the safety standards of our processes through the use of
rigorous methods and new technologies, the performance of risk assessments to
each stage of our process, the implementation of new technologies in our
projects, including emergency shut down systems and conducted safety integrity
level studies and alarm systems.
In 2009,
we recorded 116 environmental incidents as compared to the 56 incidents recorded
in 2008. This increase is a result of an improvement in our reporting
tools and controls.
Human
Rights Initiatives
We have a
strong commitment for the protection of human rights in the areas where we
operate and use a set of security and human rights principles, or Principios Voluntarios en Seguridad
y Derechos Humanos, as basis for a risk analysis of our company and the
communities where we operate. We use this set of principles to
interact with the local communities and strengthen their relationship with local
authorities, our third party contractors and us. In particular, under
the Colombian Constitution and legal framework, we are required to enter into
formal consultations with indigenous communities whenever we are making plans to
commence projects or operations in lands under their control.
Insurance
Ecopetrol,
in compliance will all its legal and contractual obligations, has a
comprehensive corporate insurance program covering the main insurance risks of
the Company, which include but are not limited to the following: all
risks associated with property damage and business interruption, control of
wells, sabotage and terrorism, general liability, directors and officers, cargo,
crime and other minor operational risks. In addition, under our
corporate insurance program, all our reinsurers must comply with a credit risk
rating of A- by Duff & Phelps, or equivalent.
All our
projects and installations under construction are insured against loss in
compliance with the terms of the relevant agreements, usually through a
performance bond in connection with completion of the contract and/or other
damage and liability insurance.
|
4.C.
|
Organizational
Structure
|
We are a
mixed economy company and have a number of subsidiaries both in Colombia and
abroad. Our subsidiaries are either directly owned by us or
indirectly owned by us through one of our other subsidiaries. At
December 31, 2009, we had 18 subsidiaries directly owned by us, of which 9
were incorporated in Colombia and 9 were incorporated abroad, and 20
subsidiaries indirectly owned by us. Some of our subsidiaries have
subsidiaries of their own.
The
following diagram sets forth our significant subsidiaries by business segment at
May 31, 2010.
64
ORGANIZATIONAL
STRUCTURE
ECOPETROL
S.A.

*Direct
and indirect participation
**Solely
indirect participation through other Subsidiaries or Affiliates:
OIG is the
parent company of Savia Perú
S.A. and Ecopetrol Transportation Company is the parent company of Ecopetrol
Pipelines Ltd
See
Exhibit 8.1 to this annual report for a complete list of our significant
subsidiaries, their respective countries of incorporation, our percentage
ownership in each (both directly and indirectly through our other subsidiaries)
and our voting ownership in each.
|
4.D.
|
Property,
Plant and Equipment
|
Under
Colombian law, the Nation owns all crude oil and natural gas reserves within
Colombia and we have certain rights to explore and produce those reserves in
areas awarded by the ANH after public bidding. Most of our property,
consisting of refineries and storage, production and transportation facilities,
is located in Colombia. Our main assets consist of our wells,
refining facilities and our pipelines. See Item 4 — “Information
on the Company — Reserves” for a description of our reserves, sources
of crude oil and natural gas, main tangible assets and material plans for
expansion and improvements in our facilities.
|
ITEM 4A.
|
Unresolved
Staff Comments
|
None.
|
ITEM 5.
|
Operating
and Financial Review and Prospects
|
The
following discussion presents our financial results and prospects as well as
factors that affect our results of operation under Colombian Government Entity
GAAP, unless otherwise indicated.
Overview
We are a
vertically integrated crude oil and natural gas company engaged in exploration,
development, production, transportation, refining, wholesaling and distribution
of crude oil, natural gas and refined products. We are in the process
of building facilities to process palm oil and sugar cane for
biofuels. We own and have interest in companies which own 9,164
kilometers of crude oil pipelines and multi-purpose transportation
pipelines. For the year ended December 31, 2009, our average
daily production of crude oil was 426.0 thousand bpd and 539.2 mcfpd of
natural gas. Almost all of our crude oil and natural gas production
and refining capacity is located in Colombia. In 2006, we began
hydrocarbon exploration and production activities outside Colombia in
partnership with regional and international oil companies and through the
acquisition of exploration and production companies abroad. We export
crude oil and refined products mainly to North America and the
Caribbean.
65
We refine
crude oil and other hydrocarbons in our refineries in Colombia into a variety of
products, including gasoline, diesel, jet fuel, petrochemicals and industrial
products. Crude oil, natural gas and refined products are transported
mainly through pipelines to our customers and to the
refineries. Since 2008, we have wholly owned Propilco, the main
polypropylene supplier in Colombia, and as a result, have entered into the
petrochemicals business.
Since our
IPO in November 2007, 10.1% of our capital stock has been in the public
market. On September 18, 2008, we listed our ADSs on the New
York Stock Exchange and on December 4, 2009, our ADSs began trading on the
Lima Stock Exchange as well. As a result of our initial public
offering, we are now subject to the mixed economy regime, which, among other
aspects, excludes us from the Government budgetary rules, the national
procurement regime and salary caps for state-owned companies.
In 2009,
we began to incur long-term indebtedness through a syndicated loan facility with
local banks and from a bond issuance in the international
markets. See Item 5B — “Liquidity and Capital Resources —
Liquidity.”
Recent
Acquisitions
The
following acquisitions were funded mainly through cash on hand and cash flow
from our operations:
In
February 2009, we, in partnership with Korea National Oil Corporation
(KNOC), acquired a 100% stake (50% for each participating company) in Offshore
International Group Inc. (OIG) for the purchase price of
US$992 million. OIG is the U.S. parent of Savia Perú (formerly
Petrotech Peruana S.A.), which carries out crude oil exploration and production
activities in Perú. From February 2009, we account our 50% interest
in OIG as an equity investment.
In
February 2009, we entered into a memorandum of understanding with Glencore
International A.C. pursuant to which we acquired in May 2009 all of its
stake in Reficar through our subsidiary Andean Chemicals for the purchase price
of US$545 million, thereby becoming the sole indirect owner of
Reficar. Through this acquisition, we will continue the development
of the expansion and modernization plan for Reficar, which includes increasing
refining capacity, increasing the conversion factor and improving the quality of
the fuels produced to meet environmental requirements. From
May 2009, we consolidate the results of operations of Reficar.
In
March 2009, we entered into an agreement with Maurel et Prom pursuant to
which we acquired in May 2009 100% of its stake in its subsidiary in
Bermuda, Hocol Petroleum Limited, for the purchase price of US$580 million
plus US$162 million for working capital. Hocol Petroleum
Limited’s most important assets are Hocol and Homcol, two companies incorporated
in the Cayman Islands with branches in Colombia involved in crude oil and
natural gas exploration and production activities in Colombia. From
June 2009, we consolidate the results of operations of Hocol and
Homcol. As a result of this acquisition, our ownership in Oleoducto
de Colombia (ODC), a 481 km crude oil pipeline that connects the Vasconia
Station and Coveñas, went from 43.85% to 65.57%.
In
March 2009, we entered into an agreement with Enbridge Inc., a Canadian
company, pursuant to which we acquired its 100% stake in Oleoducto Central S.A.
(Ocensa) for the purchase price of approximately US$418 million, thereby
increasing our ownership of Ocensa from 35.3% to 60%. From March
2009, we consolidate the results of operations of Ocensa.
Transformation
from a wholly state-owned entity
We have
been undergoing a two-step transformation process since 2003, first from a
wholly state-owned entity to a state-owned entity characterized by shares,
and then with our initial public offering in November 2007, to a mixed
economy company, which incorporates private capital. This two-step
process has resulted in a substantial change in the legal framework to which we
are subject and in the nature of our relationship to the Nation, including a
number of changes that have had a significant effect on our results of
operations. The most important changes are described
below.
66
Role
of Ecopetrol in managing Colombia’s hydrocarbon reserves
Prior to
2003, we were an Empresa
Industrial y Comercial del Estado or state-owned commercial and
industrial national entity responsible for the administration and exploitation
of Colombia’s hydrocarbon reserves, including managing relationships with
regional and international oil companies doing business in
Colombia. As a result, we are the counterparty to a large number of
contracts to exploit Colombia’s hydrocarbon reserves that predate the beginning
of our transformation process.
In 2003,
the Congress of Colombia created the ANH, which became the governmental agency
responsible for managing Colombia’s hydrocarbon reserves and awarding
exploration and production blocks to oil and gas companies. Since the
creation of the ANH, any company, including us, wishing to explore, develop and
produce hydrocarbon reserves in Colombia must sign contracts with the ANH and
not with us. As a result, we became an operator like any other
company, competing with all other regional and international oil companies in
Colombia for exploration and production opportunities under the same conditions
and without any special privileges. Nevertheless, we have remained as
counterparty to the contracts which we signed prior to January 1,
2004.
The
contracts on which we are the counterparty all have clauses which provide, at
our sole option, for extensions. If we do not extend the contracts,
the right to exploit the hydrocarbon reserves which are the subject of the
contract revert to us, and we have the right to exploit them for an indefinite
period at no additional cost to us. If we decide to extend a specific
contract and have come to an agreement with the other parties on the terms of
such extension, a copy of the final agreement is submitted to the ANH for its
review. The ANH’s review focuses on assuring that the terms of the
extension benefits the Nation more than if the contract were not extended, the
production rights reverted to us and we undertook their
development.
In
June 2010, the “Santiago de las Atalayas Contract”, one of the most
important exploration and production contracts due to its amount of crude oil
and natural gas reserves, terminated and the right to exploit the hydrocarbon
reserves subject to this Contract reverted back to us.
All
exploration and production contracts entered into after January 1, 2004, in
the event they are not extended by the ANH, revert to the ANH and not to
us.
Accounting
for reserves and production
Under
Colombian law, the Nation owns all hydrocarbon reserves within Colombia, and we
have the right to explore and produce those reserves as detailed in Item 4
— “Information on the Company — Overview of Exploration and Production
Contractual Arrangements”. In connection with our transformation
process we changed our accounting for all reserves other than reserves that
arose in connection with the reversion of concessions.
Prior to
March 2007 and in accordance with Decree 2625 of 2000, we recorded a cost
of sales in the line-cost of sales of contributions in kind, for every barrel
produced (other than from reverted concessions) pursuant to a pricing formula
specified in the decree and we recorded a contribution to capital from the
Nation for the amount expensed. Since March 2007 and in
accordance with Decree 727 of 2007, we no longer record a cost of sales or a
capital contribution from the Nation in respect of our production (other than
from reverted concessions). We account for production from reverted
concessions by recording a depletion charge on our income statement and a
reduction in the related asset. At the time we received the reverted
concession, we placed the asset in our books at the book value carried by the
party holding the concession. In addition, pursuant to Decree 727 of
2007, we are required to record the value of any hydrocarbon exploration or
production rights that we own. Pursuant to an opinion issued by the
CGN, such records are carried out in memorandum accounts. However,
these memorandum accounts are not part of our balance sheet.
67
FAEP
In 1995,
the Government established a macroeconomic stabilization fund to manage excess
export earnings from the sale of crude oil from three major oil fields in which
we were a partner. As a result, some of our export earnings from
these fields were required to be deposited into a fund, the FAEP, which we owned
and recorded on our balance sheet as an asset, but which was held at the
Colombian Central Bank, which acted as the FAEP’s portfolio
manager. The amount we recognized as current revenues was determined
by a specific formula contained in the law based on the amount of production and
sales prices of specified fields. The remaining amount was retained
in the FAEP account at the Colombian Central Bank and was recorded in our
balance sheet as deferred income with the related liability and the FAEP account
as a long-term asset. We recognized the deferred income as revenue
when such funds were distributed to us from time to time. In
August 2007, in connection with our corporate transformation prior to our
initial public offering, we distributed to the Government all of the deferred
income in the FAEP account and we removed from our balance sheet the asset and
the liability attributable to the FAEP, and our FAEP account ceased to
exist. As a result, since that date, we recognize all of our export
earnings as current revenues.
Gasoline
and diesel price differentials
The
Government regulates domestic prices of liquid fuels according to international
market conditions in order to align domestic prices with trends in international
prices, with a one month lag. When domestic prices of liquid fuels
are lower than international parity prices, the Government is responsible for
reimbursing importers or refiners for the difference, which difference is called
the fuel price differential pursuant to Law 1151 of 2007. The fuel
price differential is calculated on a monthly basis and reported on a quarterly
basis, with the corresponding cash payment to be made during the next subsequent
quarter. In cases of payment delays, refiners are entitled to receive
interest on past due amounts.
Historically,
when domestic prices of liquid fuels were higher than international parity
prices, the Government lowered domestic prices. However, towards the
end of 2008 as international prices decreased, the Government decided not to
lower domestic prices. Instead, the Government kept domestic prices
high and allocated the positive difference between domestic fuel prices and the
international parity prices to a Fuels Stabilization Fund (Fondo de
Estabilización de Precios de los Combustibles - FEPC). Similar to the
approach followed by other countries, this Fund is funded with these excess
payments when international prices are low and depleted when international
prices are high in order to mitigate domestic price volatility.
As of the
beginning of 2007, following our transformation from a state owned entity, we
charge the domestic prices established by the Government to wholesalers and, at
the same time, we accrue the amount of any fuel price differential due pursuant
to Law 1151 as revenues and record an account receivable from the
Government.
During
2008, refiners, including us, were entitled to fuel price differential payments
based on trends in international prices. However, the payment by the
Government of the 2008 fuel price differential was delayed and the Ministry of
Mines and Energy issued a resolution by which it established a payment schedule
relating to the 2008 fuel price differential. Under this payment
schedule, the 2008 fuel price differential was paid in three installments in
April, August and December 2009 and the Government recognized an opportunity
cost with respect to these amounts.
During
the first and second quarters of 2009, refiners, including us, were not entitled
to fuel price differential payments based on trends in international
prices. Instead, refiners, including us, were required to allocate
the difference between high domestic prices and low international prices into
the FEPC.
During
the third and fourth quarters of 2009, refiners, including us, were once again
entitled to fuel price differential payments due to high international
prices. Thus, the government depleted the FEPC in order to pay
refiners, including us, the corresponding fuel price differential
payments. The aggregate amount due to us for both quarters totaled
Ps$226 billion and was effectively paid in February 2010.
Reficar
In 2006,
we selected Glencore as our strategic partner in the development of the master
plan with respect to our Cartagena refinery. Pursuant to this plan,
Reficar was incorporated and began operations on April 1,
2007. Simultaneously with the incorporation of Reficar, we
transferred all of Reficar’s assets to Glencore in exchange for a 49.0%
interest.
68
Prior to
the incorporation of Reficar and transfer of Reficar’s assets to Glencore, the
results of operations of the Cartagena refinery were included in our
consolidated results. As of April 1, 2007, following the
incorporation of Reficar and transfer of Reficar’s assets to Glencore, under
Colombian Government Entity GAAP as in effect for 2007 and 2006, we started
recording our 49.0% interest in Reficar as an investment at cost. As
such, we started recording as revenues the delivery of crude oil to Reficar and
stopped recording as revenues Reficar’s sales of refined
products. However, under Colombian Government Entity GAAP as in
effect for fiscal year 2008 and 2009, we began treating our 49.0% interest in
Reficar as an investment under the equity method.
Under
U.S. GAAP, we quantified the effects of the transfer by recording a
Ps$579,241 million gain in 2007 equal to 51% of the difference between the
book value of the transferred assets and the fair value of the assets received,
which we determined to be a more reliable indicator of the value of the
exchange. The 2009 gain also includes Ps$23,640 million
corresponding to the amortization of the deferred gain. The remaining
49% or Ps$556,236 million is to be amortized over the useful life of the
equipment.
In
February 2009, as a result of financing difficulties experienced by Glencore
which were making it difficult for it to develop the master plan, we entered
into a memorandum of understanding with Glencore. Pursuant thereto,
in May 2009, we acquired all of Glencore’s stake in Reficar for the purchase
price of US$549 million through our subsidiary Andean Chemicals, thereby
becoming the sole indirect owner of Reficar. As of such date,
Reficar’s results are consolidated into our results. In addition,
under U.S. GAAP, we recorded the effects of this business combination by
applying FAS 141 regarding the determination of goodwill and FAS 141(R)
regarding the determination of the purchase price allocation. See
Note 33 to our consolidated financial statements.
Payments
of tariffs of the build, operate, maintain and transfer contracts or BOMTs
transferred to Ecogás as part of its spin-off from us
As a
result of Law 401 of 1997, in 1998, we were required to spin-off all of our
natural gas transportation assets to Ecogás, a newly created natural gas
transportation company. Prior to the spin-off of the natural gas
transportation assets, we had entered into a number of BOMT contracts for the
construction, operation, maintenance and transfer of the gas
pipelines. As part of the spin-off we were required to transfer all
rights under the BOMT contracts to Ecogás, while remaining obliged for 100% of
the tariffs. Nevertheless, pursuant to Decree 958 of 1998 Ecogás was
responsible for reimbursing us for 70% of the tariffs.
During
2007, in connection with the sale by the Government of Ecogás to Empresa de
Energía de Bogotá, Ecogás’ obligation was cancelled. We made a
calculation of the present value of the future tariff payments corresponding to
Ecogás’ 70% reimbursement obligation, and the Government delivered to us the
future tariff payments in cash to cover these future BOMT obligations which
totaled Ps$729,588 million at December 31, 2007. We
recorded this payment as a deferred income and as we make payments under the
BOMTs, we record an expense and a reduction in the related deferred income
liability. We will make all future tariff payments under the BOMT
contracts until their expiration. This arrangement should not have a
negative effect on our operating expenses, as the 70% expense which was
previously compensated by Ecogás’ reimbursement, is offset by our recording the
deferred income arising from the lump-sum payment.
Pre-IPO
distribution of retained earnings
On
April 27, 2007, we distributed as dividends retained earnings and other
reserves amounting to Ps$4,475,399 million to our shareholders in
cash.
Development
of a Strategic Plan
We have
developed the 2008 – 2015 Strategic Plan aimed at producing one million boe
by 2015, placing special emphasis on the production of heavy crude
oil. We intend to invest heavily in our exploration and production
activities, and in acquisition of reserves in Colombia and abroad to reach our
goal. As part of our strategic plan, we are upgrading and expanding
Barrancabermeja and Reficar, increasing their capacity and conversion
rate.
Factors
Affecting our Operating Results
Our
operating results are affected by international prices for crude oil and natural
gas, production volumes and product mix. Higher crude oil and natural
gas prices have a positive impact on our results of operations in both our
exploration and production segments due to our export revenues
increasing. Results from our refining activities are also affected by
conversion ratios, utilization rates, refining capacity and operating costs, all
of which affect our refining margins. Currently, we have relatively
low, although improving, conversion ratios in our refineries which results in us
producing and selling refined products, particularly fuel oil, below
costs. Finally, changes in the value of foreign currencies,
particularly the U.S. dollar against the Peso, have a significant effect on our
financial statements.
69
Sales
volumes and prices
Our
exploration and production segments’ results depend on production levels and
average local and international prices for crude oil and natural gas that we
market and sell to our customers locally and abroad. Additionally,
sales volumes depend on our purchases of crude oil and natural gas from our
business partners and the ANH.
We sell
crude oil in the international market. In addition, we process crude
oil at Barrancabermeja and Reficar. We also sell refined products in
the local and international markets. Currently, production and sale
prices of crude oil and refined products are the main drivers of our financial
performance.
Local
sales and prices
We have a
number of crude oil and natural gas long-term supply contracts with local
customers, including Reficar and gas-fired power plants. Local sale
prices are determined in accordance with existing regulations, contractual
arrangements and the spot market linked to international
benchmarks. In May 2009, we started recording as revenues the
refined products sales of Reficar and stopped recording as revenues our sales of
crude oil to Reficar.
International
sales and prices
We export
crude oil and refined products at prices which are set by reference to
international benchmarks and negotiation with our buyers. However, we
export any crude oil and refined products surplus only after we have fulfilled
our supply commitments with our refineries and local buyers.
Our
commercial strategy has led us to the Far East, and we are currently opening new
markets for our products, such as in China, India, Nigeria and
Angola. Additionally, we have started to trade some volume out of the
Colombian supply chain by purchasing crude oil from an international third party
and selling such crude oil to another international third party.
During
the last two years we have significantly increased our sales on a “delivered”
basis, giving us more chartering experience and thus affording us more
operational flexibility and the ability to increase prices.
Exploration
costs
We
account for exploratory drilling using the successful effort method whereby all
costs associated with the exploration and drilling of productive wells are
capitalized, while costs incurred in exploring and drilling of dry wells are
expensed in the period and accounted for under Operating Expenses – studies and
projects. Consequently, the number of exploratory wells we declared
as dry negatively affects our results. As such, the significant
expansion of our drilling program which we are currently undertaking will likely
result in higher dry well expenses.
Royalties
We are
obliged by law to pay a percentage of our production to the ANH as
royalties. Each production contract has its own royalty
arrangement. In 1999, a modification to the royalty system
established a sliding scale for royalty payments linked to the production level
of crude oil and natural gas fields discovered after July 29, 1999 whether
the production is crude oil or natural gas, and the quality of the crude oil
produced. Since 2002 the royalties system has ranged from 8% for
fields producing up to 5,000 bpd to 25% for fields producing in excess of
600 thousand bpd. Changes in royalty programs only apply to new
discoveries and do not alter fields already in their production
stage. Producing fields pay royalties in accordance with the
applicable royalty program at the time of the discovery. Our
contracts specify that royalties are to be paid in physical product (crude oil
or natural gas).
70
Purchases
of hydrocarbons from the ANH
We
currently purchase all physical product delivered by producers of crude oil and
natural gas as royalty payments to the ANH at prices set forth in a crude oil
offer letter from the ANH dated July 17, 2009 and a natural gas offer letter
from ANH dated June 17, 2009 as well. For crude oil, the purchase
price is calculated according to a formula that includes a reference price for
crude oil (WTI), a quality adjustment for API gravity and sulfur content, the
transportation rates from the wellhead to Coveñas port and a marketing
fee. We have an interagency agreement or Convenio with the ANH,
whereby we collect all in kind and cash royalties owed to the ANH by the oil and
gas companies in Colombia. The ANH may extend offers to sell such
physical product and we, at our option, may accept such offers to purchase the
royalty volume. We sell the physical product purchased from the ANH
as part of our ordinary business.
Effect
of taxes and exchange rate variation on our income
Income
tax
We are
subject to tax on our income at statutory rate of 33%, the standard corporate
rate in Colombia since 2008. The statutory income tax rate during
2007 was 34%.
Exchange
rate variation
Since
1999, the Government has allowed the Peso to float freely against all major
currencies, including the U.S. dollar. A strong depreciation or
revaluation of the Peso, particularly against the U.S. dollar, has multiple
effects on our financial results. Our results are reported in Pesos,
and we maintain our financial records in Pesos. During 2009, 2008 and
2007, the Peso has appreciated (depreciated) on average (9.7%), 5.4% and 11.9%
respectively against the U.S. dollar.
Almost
all of our exports of crude oil, natural gas and refined products are made in
U.S. dollars at prices determined by reference to international
benchmarks. If the Peso depreciates against the U.S. dollar, our
revenues from exports increase when expressed in Pesos. Imported
goods, however, including imported services denominated in U.S. dollars, will by
the same token increase.
The
opposite effect occurs when the Peso appreciates against the U.S. dollar as was
the case in 2007 and 2008 based on average exchange rates. Our
revenues from exports of crude oil and natural gas were reduced in Pesos as a
result of the appreciation of the Peso. The appreciation of the Peso
also results in lower cost of products, services supplied and contracted abroad
as these are denominated in U.S. dollars.
In 2009,
we began to incur U.S. Dollar denominated long-term debt while at the same time
reducing our financial investments denominated in U.S. Dollars, which used to
form part of our investment plan. This strategy allowed us to
maintain a balance between our U.S. Dollar assets and liabilities. As
a result, the net exchange gain/loss of our investments and liabilities
denominated in U.S. Dollars was essentially balanced at year-end.
During
2007 and 2008, most of our financial investments were denominated in U.S.
dollars, and we had no debt. Thus, the volatility of the Peso against
the U.S. Dollar during 2007 and 2008 resulted in substantial net exchange losses
in 2007 and net exchange gains in 2008.
|
5.A.
|
Operating
Results
|
The
following discussion is based on information contained in our audited
consolidated financial statements and should be read in conjunction
therewith. Our consolidated financial statements have been prepared
in accordance with Colombian Government Entity GAAP, which differs in certain
significant respects from U.S. GAAP. See Note 33 to our consolidated
financial statements for a description of the principal
differences.
71
Results
of operations for the year ended December 31, 2009, compared to the year ended
December 31, 2008, and compared to the year ended December 31,
2007.
The
following table sets forth components of our income statement for the years
ended December 31, 2009, 2008 and 2007.
|
For the Year ended
December 31, |
2009/2008
|
For the Year ended
|
2008/2007
|
|||||||||||||||||
|
2009
|
2008
|
% change
|
December 31, 2007
|
% change
|
||||||||||||||||
|
(Pesos in millions)
|
|
(Pesos in millions)
|
||||||||||||||||||
|
Revenues:
|
||||||||||||||||||||
|
Total
Revenue
|
30,404,390 | 33,896,669 | (10 | )% | 22,332,320 | 52 | % | |||||||||||||
|
Cost
of Sales
|
19,906,073 | 19,084,436 | 4 | % | 12,121,833 | 57 | % | |||||||||||||
|
Gross
Profit
|
10,498,317 | 14,812,233 | (29 | )% | 10,210,487 | 45 | % | |||||||||||||
|
Operating
Expenses:
|
2,624,978 | 2,154,875 | 22 | % | 1,251,349 | 72 | % | |||||||||||||
|
Operating
Income
|
7,873,339 | 12,657,358 | (38 | )% | 8,959,138 | 41 | % | |||||||||||||
|
Non-operating
income (expenses):
|
(622,495 | ) | 3,353,846 |
n.m.
|
(1,893,834 | ) |
n.m.
|
|||||||||||||
|
Income
before income tax
|
7,250,844 | 16,011,204 | 55 | % | 7,065,304 | 127 | % | |||||||||||||
|
Income
tax:
|
2,114,029 | 4,381,982 | 52 | % | 1,885,512 | 132 | % | |||||||||||||
|
Non-controlling
interest:
|
(4,761 | ) | (455 | ) |
n.m.
|
- |
n.m.
|
|||||||||||||
|
Net
Income
|
$ | 5,132,054 | $ | 11,629,677 | 56 | % | $ | 5,179,792 | 125 | % | ||||||||||
n.m.= Not
meaningful
Total
Revenues
Methodology
Starting
in 2009, the methodology established for assigning our crude oil and natural gas
sales to the production and market and supply segments, as the case may be, was
modified. Under the current methodology, we allocate our crude oil
and natural gas sales to the production segment when the volumes sold come from
our own production, whereas our crude oil and natural gas sales are allocated to
the market and supply segment when the corresponding volumes sold are purchased
from the ANH and our business partners. For presentation purposes we
have recasted our segment sales information for the years 2008 and
2007.
From May
2009 we stopped recording as revenues our local sales of crude oil to
Reficar. Instead, our crude oil sales to Reficar are allocated to our
market and supply segment and eliminated in
consolidation. Additionally, from May 2009, we started recording as
revenues the refined product sales of Reficar.
72
Results
The
following table sets forth our principal sources of revenue by business segment
for the years ended December 31, 2009, 2008 and 2007.
|
For the Year ended
December 31,
|
2009/2008 |
For the Year ended
|
2008/2007
|
|||||||||||||||||
|
2009
|
2008
|
% change
|
December 31, 2007
|
% change
|
||||||||||||||||
|
(Pesos in millions)
|
(Pesos in millions)
|
|||||||||||||||||||
|
Production
Segment (1):
|
||||||||||||||||||||
|
Crude
oil:
|
||||||||||||||||||||
|
Export
sales
|
7,329,974 | 4,107,194 | 78.5 | % | 1,102,815 | 272.4 | % | |||||||||||||
|
Total
sales of crude oil
|
7,329,974 | 4,107,194 | 78.5 | % | 1,102,815 | 272.4 | % | |||||||||||||
|
Natural
Gas:
|
||||||||||||||||||||
|
Local
sales
|
547,792 | 464,588 | 17.9 | % | 407,291 | 14.1 | % | |||||||||||||
|
Other
income from local sales of natural gas
|
157,653 | 129,631 | 21.6 | % | 6,614 |
n.m.
|
||||||||||||||
|
Export
sales
|
307,820 | 310,389 | (0.8 | )% | 35 |
n.m.
|
||||||||||||||
|
Total
sales of natural gas
|
1,013,265 | 904,608 | 12.0 | % | 413,940 | 118.5 | % | |||||||||||||
|
Other
Income from Production Segment (2)
|
128,147 | 140,429 | (8.7 | )% | 115,824 | 21.2 | % | |||||||||||||
|
Total
production segment sales
|
8,471,386 | 5,152,231 | 64.4 | % | 1,632,579 | 215.6 | % | |||||||||||||
|
Production
segment eliminations in consolidation
|
(33,845 | ) | - |
n.m.
|
- |
n.m.
|
||||||||||||||
|
Total
production segment sales to third parties
|
8,437,901 | 5,152,231 | 63.8 | % | 1,632,579 | 215.6 | % | |||||||||||||
|
Refining
segment:
|
||||||||||||||||||||
|
Refined
Products:
|
||||||||||||||||||||
|
Local
sales(3)
|
11,850,849 | 14,876,906 | (20.3 | )% | 11,517,000 | 29.2 | % | |||||||||||||
|
Sales
of refined products allocated to our production segment(4)
|
(72,956 | ) | (90,628 | ) | (19.5 | )% | (94,734 | ) | (4.3 | )% | ||||||||||
|
Other
income from local sales of refined products(5)
|
56,521 | 61,612 | (8.3 | )% | 49,842 | 23.6 | % | |||||||||||||
|
Export
sales
|
4,136,988 | 3,273,018 | 26.4 | % | 2,156,388 | 51.8 | % | |||||||||||||
|
Total
refining segment sales:
|
15,971,402 | 18,120,908 | (11.9 | )% | 13,628,496 | 33.0 | % | |||||||||||||
|
Refining
segment eliminations in consolidation
|
(75,077 | ) | - |
n.m.
|
- |
n.m.
|
||||||||||||||
|
Total
Refining segment sales to third parties
|
15,896,325 | 18,120,908 | (12.3 | )% | 13,628,496 | 33.0 | % | |||||||||||||
|
Market
and supply segment:
|
||||||||||||||||||||
|
Crude
oil sales:
|
||||||||||||||||||||
|
Local
sales
|
3,636,242 | 4,774,401 | (23.8 | )% | 3,004,629 | 58.9 | % | |||||||||||||
|
Export
sales
|
4,485,538 | 4,589,088 | (2.3 | )% | 3,373,322 | 36.0 | % | |||||||||||||
|
Total
crude oil sales
|
8,121,780 | 9,363,489 | (13.3 | )% | 6,377,951 | 46.8 | % | |||||||||||||
|
Natural
gas sales:
|
||||||||||||||||||||
|
Local
sales
|
486,210 | 436,826 | 11.3 | % | 252,880 | 72.7 | % | |||||||||||||
|
Other
income from local sales of natural gas
|
80,726 | 72,003 | 12.1 | % | 60,471 | 19.1 | % | |||||||||||||
|
Export
sales
|
3,914 | 2,958 | 32.3 | % | 1 |
n.m.
|
||||||||||||||
|
Total
natural gas sales
|
570,850 | 511,787 | 11.5 | % | 313,352 | 63.3 | % | |||||||||||||
|
Refined
Products sales:
|
||||||||||||||||||||
|
Export
sales
|
69,865 | - |
n.m.
|
- |
n.m.
|
|||||||||||||||
|
Total
Market and Supply segment sales
|
8,762,495 | 9,875,276 | (11.3 | )% | 6,691,303 | 47.6 | % | |||||||||||||
|
Market
and Supply segment eliminations in consolidation
|
(3,618,048 | ) | - |
n.m.
|
- |
n.m.
|
||||||||||||||
|
Total
Market and Supply segment sales to third parties
|
5,144,447 | 9,875,276 | (47.9 | )% | 6,691,303 | 47.6 | % | |||||||||||||
|
Transportation
segment:
|
||||||||||||||||||||
|
Transportation
sales
|
1,596,766 | 752,599 | 112.2 | % | 695,268 | 8.2 | % | |||||||||||||
|
Sales
of transportation services allocated to our production, market and supply,
and refining segment
|
(16,832 | ) | (27,761 | ) | (39.4 | )% | (17,330 | ) | 60.2 | % | ||||||||||
|
Total
transportation sales
|
1,579,934 | 724,838 | 118.0 | % | 677,938 | 6.9 | % | |||||||||||||
|
Transportation
segment eliminations in consolidation
|
(675,507 | ) | - |
n.m.
|
- |
n.m.
|
||||||||||||||
|
Total
Transportation segment sales to third parties
|
904,427 | 724,838 | 24.8 | % | 677,938 | 6.9 | % | |||||||||||||
|
Other
sales(6)
|
354,549 | 308,702 | 14.9 | % | 139,188 | 121.8 | % | |||||||||||||
|
Adjustment
to other sales(7)
|
(333,259 | ) | (285,286 | ) | 16.8 | % | (120,687 | ) | 136.4 | % | ||||||||||
|
FAEP
|
- | - |
n.m.
|
(316,497 | ) |
n.m.
|
||||||||||||||
|
Total
sales
|
30,404,390 | 33,896,669 | (10.3 | )% | 22,332,320 | 51.8 | % | |||||||||||||
73
n.m.=Not
meaningful.
|
(1)
|
Local
sales of crude oil are assigned to the Market and Supply segment, since
all the production sold was purchased from ANH and business partners and
thus did not come directly from our
production.
|
|
(2)
|
Corresponds
to sales of refined products, transportation services and industrial
services allocated to our production
segment.
|
|
(3)
|
Includes
motor fuel price differential reimbursements by the Government amounting
to Ps$1,778,050 million in 2007, Ps$3,070,479 million in 2008 and
Ps$196,533 million in 2009.
|
|
(4)
|
Corresponds
to sales of refined products from our Apiay and Orito refineries allocated
to our production segment.
|
|
(5)
|
Corresponds
to sales of transportation services and industrial services allocated to
our refining segment.
|
|
(6)
|
Includes
insurance premiums and sales of industrial services in
Colombia.
|
|
(7)
|
Corresponds
to sales of industrial services allocated to our production
segment.
|
In 2009,
total revenues decreased by 10.3% as compared to 2008, mainly due to the lower
average prices of crude oil and refined products, offset in part by an increase
in the total volumes sold. The 51.8% increase in total revenues in
2008 compared to 2007 was due to an increase in the average price of crude oil
and refined products, higher volumes of crude oil sold and sales of crude oil to
Reficar beginning in April 2007, partially offset by lower sales of refined
products, due to not taking into account the sales of refined products by
Reficar from April 2007 until May 2009.
74
The
following table sets forth our total export and local sales of crude oil,
natural gas and refined products for the years ended December 31, 2009, 2008 and
2007.
|
For the Year ended
December 31,
|
2009/2008
|
For the Year
ended
December 31,
|
2008/2007
|
|||||||||||||||||
|
2009
|
2008
|
% change
|
2007
|
% change
|
||||||||||||||||
|
Crude oil:
|
||||||||||||||||||||
|
Local
sales (barrels)(1)
|
455,895 | 26,981,442 | (98.3 | )% | 20,859,714 | 29.3 | % | |||||||||||||
|
Export
sales (barrels)
|
92,921,245 | 54,592,797 | 70.2 | % | 34,724,093 | 57.2 | % | |||||||||||||
|
Average
price per local barrel (in U.S. dollars)(2)
|
67.77 | 89.95 | (24.7 | )% | 69.38 | 29.7 | % | |||||||||||||
|
Average
price per export barrel (in U.S. dollars) (3)
|
60.83 | 83.00 | (26.7 | )% | 62.54 | 32.7 | % | |||||||||||||
|
Weighted
average price per local and export barrel (in U.S.
dollars)
|
60.86 | 85.30 | (28.7 | )% | 65.10 | 31.0 | % | |||||||||||||
|
Natural
gas:
|
||||||||||||||||||||
|
Local
sales (mbtu)
|
167,095,380 | 146,955,743 | 13.7 | % | 160,056,709 | (8.2 | )% | |||||||||||||
|
Export
sales (mbtu)(4)
|
43,568,928 | 35,491,468 | 22.8 | % | 6,555 |
n.m.
|
||||||||||||||
|
Average
local price (mbtu) (in U.S. dollars)
|
2.72 | 3.12 | (12.7 | )% | 1.99 | 56.9 | % | |||||||||||||
|
Average
export price (mbtu) (in U.S. dollars)
|
3.27 | 4.30 | (23.9 | )% | 2.77 | 55.3 | % | |||||||||||||
|
Refined
products:
|
||||||||||||||||||||
|
Product
local sales (barrels)
|
86,211,706 | 69,312,065 | 24.4 | % | 71,191,548 | (2.6 | )% | |||||||||||||
|
Export
sales (barrels)
|
34,368,558 | 18,380,770 | 87.0 | % | 19,335,063 | (4.9 | )% | |||||||||||||
|
Average
local price per barrel (U.S. dollars)
|
67.18 | 106.02 | (36.6 | )% | 77.89 | 36.1 | % | |||||||||||||
|
Average
export price per barrel (U.S. dollars)
|
69.25 | 72.63 | (4.7 | )% | 53.81 | 35.0 | % | |||||||||||||
n.m. =
Not meaningful.
|
(1)
|
Starting
in May 2009, no longer includes sales to
Reficar.
|
|
(2)
|
Corresponds
to average price per local barrel translated at an average exchange rate
of 2,156.29 for 2009, 1,966.26 for 2008 and 2,078.35 for
2007.
|
|
(3)
|
Corresponds
to the average of the actual prices at which we sold our crude oil in the
international markets.
|
|
(4)
|
We
initiated exports of natural gas to Venezuela in the third quarter of
2007.
|
Production
segment sales
Crude
oil
Export
sales
In 2009,
our production segment revenues from exports of crude oil increased by 78.5%,
mainly due to a 74.4% increase in volumes exported in this segment, resulting
from an increase in our production level and an approximately 9.7% depreciation
in the average exchange rate for the Peso against the U.S. Dollar, which were
partially offset by a decrease in the average sales price. In 2008,
our production segment revenues from exports of crude oil increased by 272.4%
due to a 210.6% increase in volumes exported in this segment and an increase in
the average export price of crude oil, partially offset by a 5.4% appreciation
in the average exchange rate for the Peso against the U.S. Dollar.
Natural
gas
Local
sales
Our
production segment local sales of natural gas increased by 17.9% in 2009 as
compared to 2008 mainly due to a 12.1% increase in volumes sold in this segment,
which was partially offset by an 12.7% decrease in the average sale
price. Our production segment local sales of natural gas increased by
14.1% in 2008 primarily due to an increase in the average sale price of natural
gas, partially offset by an 14.7% reduction in volumes as a result of lower
consumption in the thermal power generation sector and scheduled maintenance
programs.
Export
sales
Export
sales of natural gas decreased in 2009 as compared to 2008 mainly due to lower
average export price which decreased 23.9%, partially offset by a 20.8% increase
in the exported volumes in this segment. In 2008, export sales of
natural gas reflect the first complete year of natural gas exports to
Venezuela. In 2007, export sales of natural gas only reflected the
start of our sales of natural gas to Venezuela.
75
Production
segment sales to third parties
Our total
production segment sales to third parties increased by 63.8% in 2009, compared
to 2008, as a result of the increase in our volumes produced, partially offset
by a decline in the average sales prices, and by 215.6% in 2008, compared to
2007, as a result of the increases in the average sale price and in our volumes
produced.
Refining
segment sales
Local
sales
Local
sales of refined products decreased 20.3% in 2009 as compared to 2008 as a
result of lower average sales prices which decreased 36.6%, partially offset by
a 24.4% increase in the volumes sold due to the consolidation of the results of
Reficar into our results of operations. Revenue from local sales of
refined products in 2008 as compared to 2007 increased by 29.2% as a result of
higher average sales prices resulting from an increase in international oil
prices, partially offset by a 2.6% decrease in volumes sold. The
decrease in volumes sold resulted from no longer recording Reficar’s sales in
our consolidated results of operations from April 2007 as a result of the
transfer of a majority of Reficar’s shares to Glencore, which in turn was
partially offset by the increase in volumes sold due to the consolidation of the
results of Propilco into our results of operations.
Export
sales
As a
result of our acquisition of the remaining 51% ownership interest of Reficar,
from May 2009 the refined product exports of Reficar are now consolidated into
our total refined products exports. As a result, our exported volumes
increased by 87%, and our exports of refined products increased 26.4% in 2009,
compared to 2008. This increase was partially offset by a 4.7%
decrease in the average export price. The increase in revenues from
exports of refined products in 2008 as compared to 2007 was due to a 35%
increase in the average sales price (resulting from the increase in
international oil prices), partially offset by our no longer recording the
refined product exports of Reficar in our consolidated results of operations
from April 2007 as a result of the transfer of a majority of Reficar’s shares to
Glencore.
Refining
segment sales to third parties
Our total
refining segment sales to third parties decreased 12.3% in 2009, compared to
2008, as a result of the decrease in the average sales prices of refined
products, partially offset by a 37.5% increase in our volumes sold, which mainly
resulted from the volumes sold by Reficar. Our total refining segment
sales to third parties increased 33% in 2008, compared to 2007, as a result of
the increase in the average sales price.
Market
and Supply segment sales
Crude
Oil
Local
sales
Our local
sales of crude oil assigned to our market and supply segment almost entirely
reflect sales to Reficar that have been eliminated in consolidation since May
2009 as a result of our acquisition of Reficar from
Glencore. Revenues from local sales of crude oil allocated to our
market and supply segment increased by 58.9% in 2008 as compared to 2007 as a
result of an increase in sales to Reficar and higher average sales prices for
crude oil, as a result of the increase in international oil prices.
Export
Sales
Exports
of crude oil allocated to our market and supply segment decreased by 2.3% in
2009, compared to 2008, as a result of a 26.7% decrease in the average export
price of crude oil, partially offset by a 17.9% increase in our exported volumes
allocated to this segment. Revenues from exports of crude oil
allocated to this segment increased in 2008 as compared to 2007, as a result of
higher average international crude oil prices and an increase in volumes sold
internationally, partially offset by a 5.4% appreciation in the average exchange
rate for the Peso against the U.S. Dollar.
76
Natural
Gas
Local
Sales
Revenues
from local sales of natural gas allocated to our market and supply segment
increased by 11.3% in 2009 as compared to 2008, mainly as a result of a 17.9%
increase in the volumes sold in this segment, partially offset by the lower
average sales price of natural gas.
Market
and Supply segment sales to third parties
Our total
market and supply segment sales to third parties decreased by 47.9% in 2009,
compared to 2008, mainly as a result of the eliminations in consolidation of our
crude oil sales to Reficar.
Transportation
segment sales
Our total transportation segment sales increased
by 112.2% in 2009, compared to 2008, mainly
due to higher volumes of crude oil and refined products transported, which in turn resulted from (i) our consolidation
as of March 2009 of the results of operations of Ocensa and ODC, (ii) the commencement of operations of ODL and (iii) the
expansion of our transportation infrastructure. Transportation
segment sales in 2008 increased by 8.2%, compared
to 2007, as a result of higher volumes transported.
Transportation
segment sales to third parties
As a
result of the above mentioned increase in volumes and after giving effect to eliminations in consolidation of
the transportation services provided by us to our subsidiaries, our
transportation segment sales to third parties increased by 24.8% in 2009,
compared to 2008.
Cost
and Expenses
The
following table sets forth elements of our cost of sales, operating expenses and
operating income for the years ended December 31, 2009, 2008 and
2007.
|
For the Year ended
December 31,
|
2009/2008
|
For the Year ended
December 31,
|
2008/2007
|
|||||||||||||||||
|
2009
|
2008
|
% change
|
2007
|
% change
|
||||||||||||||||
|
(Pesos
in millions)
|
(Pesos
in millions)
|
|||||||||||||||||||
|
Cost
of sales
|
19,906,073 | 19,084,436 | 4 | % | 12,121,833 | 57 | % | |||||||||||||
|
Operating
expenses
|
2,624,978 | 2,154,875 | 22 | % | 1,251,349 | 72 | % | |||||||||||||
|
Operating
Income
|
7,873,339 | 12,657,358 | (38 | )% | 8,959,138 | 41 | % | |||||||||||||
Cost
of sales—consolidated
As a
result of the increase in international prices for crude oil, our costs of sales
have been affected by a number of factors. The most important factors
are described below:
|
|
·
|
Purchases
of hydrocarbons from the ANH in 2009 decreased 22% to Ps$4,358,408 million
as compared with 2008 mainly as a result of lower average prices,
partially offset by an increase on the volumes
purchased. Purchases of hydrocarbons from the ANH in 2008
increased 43% to Ps$5,584,474 million as compared to 2007 as a result of
higher average prices on an increased number of barrels purchased as
compared to 2007.
|
77
|
|
·
|
Purchases
of crude oil from our business partners in 2009 increased 29% to
Ps$4,130,116 million as compared with 2008 mainly due to higher volumes
purchased as crude oil production from our business partners
increased. Purchases of crude oil from our business partners in
2008 increased 124% to Ps$3,193,690 million as compared to 2007 as a
result of higher volume purchased to meet existing supply obligations,
which amounted to 19 million barrels in 2008 compared to 12.9 million
barrels in 2007 and increases in average prices for crude
oil.
|
|
|
·
|
Purchases
of imported products in 2009 decreased 21% to Ps$2,739,681 million as
compared with 2008 as a result of lower average
prices. Purchases of imported products in 2008 increased to
Ps$3,470,987 million as compared to 2007 as a result of higher volumes
purchased in order to mix such imports with the local production of
gasoline and diesel in order to decrease the content of sulphur in our
fuels and a higher average international price for gasoline and
diesel.
|
|
|
·
|
Services
contracted with associations, which
are pro rata expenses for our joint ventures, increased
by 8.6% in 2009 to Ps$1,290,177 million as compared to 2008, mainly as a result of an increase in
production
activities. Services contracted with associations in 2008
increased 16.6% to Ps$1,188,294 million as compared to 2007 due to an
increase in production activities and
increases in the price of oil services as a result of a worldwide increase
in demand for oil services.
|
|
|
·
|
Maintenance
costs increased by 53% to Ps$1,274,618 million as compared to 2008, mainly
due to the consolidation of the maintenance costs of Ocensa and Hocol into
our results of operations. Maintenance costs increased by 40%
to Ps$593,331 million in 2008 as compared to 2007, mainly due to an
increase in tariffs and an increase in our production
activities.
|
|
|
·
|
Depreciation
costs increased by 85% to Ps$1,239,846 million as compared to 2008, mainly
due to the consolidation of Ocensa’s depreciation into our results of
operations. Depreciation costs decreased by 7% to Ps$670,279
million in 2008 as compared to 2007, mainly due to our no longer recording
Reficar’s depreciation costs in our consolidated results of operations
from April 2007 as a result of the transfer of a mjaority of Reficar’s
shares to Glencore.
|
|
|
·
|
Labor
costs in 2009 increased 22% to 918,264 million as compared to 2008 mainly
due to a 2.65% increase in the total number of Ecopetrol’s employees in
response to the increase in the exploration and production activities, and
an adjustment in wages which has been progressively implemented among all
of our employees. Labor costs increased 40% in 2008 as compared
to 2007 increased as a result of increases in wages, labor benefits and
bonuses paid as part of our personnel retention policies and an increase
in the number of our employees who are eligible to receive these
benefits.
|
Principal
elements of our cost of sales by business segments are as follows:
Production
segment’s cost of sales
Cost of
sales affecting our production segment are mainly related to the amortization
and depletion of our production assets, services contracted with outside
vendors, maintenance costs, project expenses and labor costs related to this
segment.
Refining
segment’s cost of sales
Cost of
sales affecting our refining segment are primarily for the purchase of crude oil
and natural gas to upload and feed the refineries, to import products for the
refining process, to feed stock transportation services, for services contracted
for the maintenance of the refineries, and for the amortization and depreciation
of refining assets.
Transportation
segment’s cost of sales
Cost of
sales affecting our transportation segment are: depreciation and
amortization of our transportation assets and project costs, which relate to
costs associated with the maintenance of transportation networks and
construction and conversion of existing pipelines to the transportation of heavy
crude oil. Due to the consolidation of Ocensa and ODC, our
transportation costs have increased as we now include the total costs of sales
of these subsidiaries into our cost of sales.
78
Market
and supply segment’s cost of sales
Cost of
sales affecting our market and supply segment are mainly related to the costs
associated with purchases of crude oil and natural gas volumes from the ANH and
from our business partners.
Operating
expenses
Our
operating expenses increased in 2009 compared to 2008 as well as in 2008
compared to 2007, mainly as a result of the following factors:
|
|
·
|
Studies
and projects in 2009 compared to 2008 increased by 53% as a result of an
increase in the number of seismic studies and production projects
conducted. Studies and projects in 2008 increased, compared to 2007, as a result of higher maintenance
expenses for production projects, an increase in accounting for dry wells
and exploration costs.
|
|
|
·
|
Oil
pipeline transportation tariff payments in
2009 were eliminated beginning in
March 2009 when we began to
consolidate the operating results of OCENSA and
ODC. Oil
pipeline transportation tariff
payments increased in 2008, compared to 2007, as a result of higher volume
transported and maintenance of back-up product pipelines, offset in part
by a decrease in tariffs.
|
Our
operating expenses by business segments increased in 2009, compared to 2008, and increased
in 2008, compared to
2007. Such expenses by business segment are described
below.
Exploration
and production segment’s operating expenses
Operating
expenses affecting our exploration and production segment are primarily for
studies and projects, which correspond to expensing dry wells, the amortization
of the goodwill from our acquisitions assigned to this segment and
administrative expenses assigned to this segment.
Refining
segment’s operating expenses
Operating
expenses affecting our refining segment are primarily for the amortization of
the goodwill from our acquisitions assigned to this segment and administrative
expenses assigned to this segment.
Transportation
segment’s operating expenses
Operating
expenses affecting our transportation segment are primarily for the amortization
of the goodwill from our acquisitions assigned to this segment and for tariffs
paid in connection with crude oil transportation.
Market
and supply segment’s operating expenses
Operating
expenses affecting our market and supply segment are primarily for the
administrative expenses related to selling the crude oil and natural gas
assigned to this segment.
Non-operating
income (expenses)
The
following table sets forth our non-operating income (expenses) for the years
ended December 31, 2009, 2008 and 2007.
|
At December 31,
|
||||||||||||
|
2009
|
2008
|
2007
|
||||||||||
|
(Pesos in millions)
|
||||||||||||
|
Non-operating income(expenses):
|
|
|||||||||||
|
Financial
income, net
|
495,833 | 4,101,252 | 93,628 | |||||||||
|
Pension
expenses
|
(595,157 | ) | (1,144,925 | ) | (1,090,343 | ) | ||||||
|
Inflation
gain
|
22,355 | 30,473 | 41,132 | |||||||||
|
Other
income (expenses), net
|
(545,526 | ) | 367,046 | (938,251 | ) | |||||||
79
Financial income,
net. Financial income, net, includes foreign exchange gains,
valuation of investments, dividends received and profit from sale of
investments. The following table
summarizes the principal components of our financial income (expenses) for the
years ended December 31, 2009, 2008 and
2007.
|
At December 31,
|
||||||||||||
|
2009
|
2008
|
2007
|
||||||||||
|
|
(Pesos in millions)
|
|||||||||||
|
Financial income:
|
|
|||||||||||
|
Exchange difference gain
|
14,672,907 | 10,863,242 | 3,772,753 | |||||||||
|
Interest and monetary
correction
|
479,694 | 682,542 | 161,125 | |||||||||
|
Income on valuation of investment portfolio
|
168,442 | 1,640,338 | 808,922 | |||||||||
|
(Pesos in millions)
|
||||||||||||
|
Financial expenses:
|
|
|||||||||||
|
Exchange difference loss
|
(14,798,550 | ) | (8,901,184 | ) | (4,385,021 | ) | ||||||
|
Interest
|
(138,801 | ) | (19,376 | ) | (1,021 | ) | ||||||
|
Financial Income, net:
|
495,833 | 4,101,252 | 93,628 | |||||||||
Financial
income, net decreased in 2009 when compared with 2008 mainly due to (i) a decrease in our net exchange difference gain (loss) as
a result of a slight unbalance in our
investments and liabilites denominated in U.S. Dollars in favor of liabilities due to the net
effect of the 9.7% depreciation of the Peso against the U.S. dollar; (ii) a decrease in our income on valuation of investment portfolios
as we transferred our pension liabilities
to pension trust funds and (iii) a decrease in interest received from our
investment portfolios as we utilized some of our financial investments to fund
our investment plan. Financial income, net increased
significantly in 2008 when compared to 2007 mainly due to a net exchange gain
and an increase in net income from the valuation of our investment
portfolio.
Pension
expenses. Pension expenses decreased by 48% in 2009 when
compared to 2008 mainly as a result of not registering an amortization of the
pension actuarial calculation because the current yield of this portfolio covers the increase in
liability. The only actuarial amortizations which were registered
correspond to health and education. Pension expenses increased by 5%
in 2008 compared to 2007, mainly due to an increase in the amortization of the
actuarial calculation.
Other income (expenses),
net. Other income includes recovery of provisions, other
revenues and other recoveries. Other expenses include BOMT contracts
related expenses, legal and other provisions and taxes unrelated to
income.
Other
income (expenses) decreased in 2009 compared to 2008, mainly due to a lower
recovery of legal provisions and an increase in legal provisions and taxes
unrelated to income.
Other
income (expenses) increased in 2008 compared to 2007, mainly due to an increase
in the recovery of provisions for legal proceedings and to lower provision
expenses in 2008.
Income
before income tax
Income
before income tax decreased by 54.7% in 2009 when compared to 2008, mainly due
to lower revenues as a result of the lower average price of crude
oil. Income before income taxes increased by 126.6% in 2008, compared
to 2007, as a result of higher revenue due to a higher average price of crude
oil without a comparable increase in cost of sales and operating
expenses.
Income
tax
The
effective income tax rate for 2009 was 29.16%, compared to 27.3% in 2008 and
26.7% in 2007. Our effective tax rates were lower than the statutory
rate as a result of tax benefits mainly related to (i) an income tax deduction
applicable to productive fixed assets investments, equal to 40% of these
investments for 2007, 2008 and 2009 and (ii) exempt net income on asphalt
sales.
80
Net
Income
As a
result of the foregoing, net income decreased by 55.9% in 2009 when compared to
2008 and increased by 124.5% in 2008, compared to 2007.
Principal
differences between Colombian Government Entity GAAP and U.S. GAAP
We
prepare our financial statements in accordance with Colombian Government Entity
GAAP. These principles and regulations differ in certain significant
respects from U.S. GAAP. The following is a description of the most
relevant differences between Colombian Government Entity GAAP and U.S.
GAAP. Note 33 to our consolidated financial statements presents
reconciliations of net income and shareholders’ equity determined under
Colombian Government Entity GAAP to those same amounts as determined according
to U.S. GAAP, as well as a complete description of the differences between the
two accounting standards. The principal differences between Colombian
Government Entity GAAP and U.S. GAAP are as follows:
FAEP
Under
Colombian Governmental Entity GAAP, contributions to FAEP were recorded as
increases to deferred income and an asset account for the same
amount. No revenue was recognized for contributions to
FAEP. Distributions from the FAEP to us were recorded as ordinary
revenue with corresponding decreases in the deferred income and the FAEP asset
accounts.
Under
U.S. GAAP, the FAEP amount is recognized as current income and not as deferred
income. U.S. GAAP requires us to recognize the FAEP as revenue even
though it was a Government savings program with the purpose of maintaining
macro-economic stability in the country. Therefore, the amounts
recognized as current income under U.S. GAAP had the effect of increasing
retained earnings and when the distribution of the amounts deposited in the FAEP
was made by us to the Government in August 2007, for U.S. GAAP purposes, the
distribution was treated as a dividend payment to the sole
shareholder.
Advances
received from Ecogás for BOMT Contracts (Build, Operate, Maintain and
Transfer)
Under
Colombian Government Entity GAAP, payment obligations under the BOMT contracts
were treated as equivalent to an operating lease. Under U.S. GAAP the
obligations are treated as capital leases, and an asset and liability were
recognized and payments under the BOMT contracts serve to reduce the liability
and the asset is depreciated. Subsequently, we subleased the same
asset to Ecogás, with the corresponding treatment of the payments receivable
from Ecogás as direct financing lease for U.S. GAAP purposes.
Contributions
in kind
Under
Colombian Government Entity GAAP, contributions of the Nation in kind (the
produced reserves) pursuant to Decree 2625 of 2000 were recognized as a cost of
production during the years Decree 2625 was in force and a contribution to
equity. Under U.S. GAAP, costs associated with these contributions
were reversed to reflect retained earnings that were later distributed to the
Nation as a stock dividend.
Reversal
of concessions
Under
Colombian Government Entity GAAP, we recorded an asset for the contributions of
the Nation of crude oil and natural gas reserves deriving from the reversal of
concessions of oilfield areas in favor of the Nation, given before the
effectiveness of Decree 1760 of 2003. Reserves were valued by means
of the technical-economic model where the value per barrel resulted from the
relation of the net present value obtained at a discount rate and the total
proved reserves on the contribution date. For U.S. GAAP purposes,
these reversions were considered a transfer of assets between entities under
common control. Ecopetrol as the entity that received the net assets,
should have initially recognized the assets transferred at their carrying
amounts in the accounts of the transferring entity at the date of transfer,
which in this case is zero as the transferring entity did not recognize a
carrying value.
81
Reserves
On December 31, 2008, the SEC issued a final rule
revising disclosure requirements relating to oil and gas reserves as contained
in Rule 4-10(a) of Regulation S-X. Under
the new SEC rule, reserves are required to
be estimated by applying the
unweighted arithmetic average of the
first-day-of-the-month price for each month
within the year to year-end quantities of
proved reserves (the “SEC average price
methodology”). Prior to this
revision, the SEC required reserves to be
estimated by applying the year-end WTI
price to year-end quantities of proved
reserves (the “SEC year-end price
methodology”). Our proved
reserves as of December 31, 2009 are based on the SEC average price methodology
for U.S. GAAP purposes, which mirrors the average price
methodology used by us to prepare our
consolidated financial statements
during this period. Our proved
reserves as of December 31, 2008 are based on the SEC year-end price methodology
for U.S. GAAP purposes, which mirrors the year-end price
methodology used by us to prepare our
consolidated financial statements during
this period. However, our proved
reserves as of December 31, 2007 are estimated using average prices for the
preparation of our consolidated financial statements and using the SEC
year-end price methodology for U.S. GAAP
purposes. As a result, the quantity of proved reserves for this
period differs from the estimated quantities of proved reserves in accordance
with the SEC year-end methodology. See Note 33 to our
consolidated financial statements for a
description of the main differences between Colombian Government Entity GAAP and
U.S.
GAAP.
Under the new SEC
final rule, optional disclosure of probable and possible reserves is allowed but
we opted not to do so. Estimates
of reserves were prepared by the use of commonly used geological and engineering oil industry practices. The method or combination of methods used
in the analysis of each reserve was adopted by experience with similar reserves,
stages of development, quality and completeness of basic data, and production history.
The majority of the
producing proved reserves were estimated by the application of appropriate
decline curves or other performance relationships. In analyzing decline curves, reserves were
estimated to the calculated economic limits based
on current economic conditions. In certain cases where the previous
methods could not be used, reserves were estimated by analogy with similar
reserves where more complete data was available.
Effects
of inflation on financial information
The
accompanying consolidated financial statements have been prepared from the
accounting records, which are maintained under the historical cost convention,
modified since 1992 to comply with the legal provisions of the CGN to recognize
the effect of inflation on non-monetary balance sheet accounts until December
31, 2001, including equity. The CGN eliminated the use of inflation
adjustments for accounting purposes for state-owned companies starting on
January 1, 2002. However, our consolidated financial statements
recognize the effect of inflation on non-monetary balance sheet accounts for an
extended period from January 1, 1992 until December 31, 2006 for Hocol,
Oleoducto de Colombia S.A. and Ocensa because, prior to our acquisition of these
companies, they were subject to the accounting rules applicable to Colombian
privately-owned entities. Under such rules, the effect of inflation
on non-monetary balance sheet accounts was required to be recognized until
December 31, 2006. The accumulated inflation adjustments were
eliminated in the process of reconciling our financial statements to U.S.
GAAP.
Valuation
surplus
Under
Colombian Government Entity GAAP, property, plant and equipment are revalued
every three years in accordance with market value and the investments in
unconsolidated investees are revalued by using the equity intrinsic value
(percentage of ownership of the Company in the equity of the
investee). The excess of these amounts over the carrying amount is
treated as valuation surplus with a corresponding amount in equity (valuation
surplus). Revaluation of these assets is not done for purposes of
U.S. GAAP.
82
Variable
interest entity
Under
Colombian Government Entity GAAP consolidation with significant subsidiaries is
required when there is control by having more than 50% ownership or majority of
the voting rights in the subsidiary. Under U.S. GAAP (FIN 46(R)) if
an entity has variable interests whereby one party absorbs losses or benefits
from net profits in excess of its ownership interest then those variable
interests must be evaluated. Ocensa was not consolidated under
Colombian Government Entity GAAP until March 2009 while as Ocensa was a variable
interest entity under the rules of FIN 46 and included in our consolidated
results pursuant thereto until March 2009. Thereafter, Ocensa was
consolidated under both Colombian Government Entity GAAP and U.S. GAAP, when we
acquired voting control. See Note 33 to our consolidated financial
statements for a description of our analysis.
Equity
method accounting
Under
Colombian Government Entity GAAP as in effect for fiscal year 2007, equity
method is only applied when control exists. Under U.S. GAAP, equity
method is required for investments where significant influence exists (generally
ownership higher than 20%) but the investment is not controlled.
Under
Colombian Government Entity GAAP as in effect for fiscal year 2009 and 2008,
equity method is applied for investments where significant influence exists but
the investment is not controlled. However, unlike U.S. GAAP, there is
no 20% ownership requirement.
Employee
benefit plans
There are
significant differences in the measurement of expense and balance sheet amounts
for employee benefit plans between Colombian Government Entity GAAP and U.S.
GAAP. See Note 33 to our consolidated financial
statements.
Investment
securities
There are
significant differences in the measurement of expense and balance sheet amounts
for investments between Colombian Government Entity GAAP and U.S.
GAAP. See Note 33 to our consolidated financial
statements.
Provisions
- allowances and contingences
There are
significant differences in the measurement of expense and balance sheet amounts
for provisions - allowances and contingences between Colombian Government Entity
GAAP and U.S. GAAP. See Note 33 to our consolidated financial
statements.
|
5.B.
|
Liquidity
and Capital Resources
|
History
Prior to
our corporate transformation and initial public offering, the Government limited
our capital expenditure program and access to the credit markets as it was
making decisions for us based on its own budgetary needs and concerns and not on
the growth prospects of the Company. Furthermore, we were required to
make macroeconomic stabilization payments to the FAEP, which negatively affected
our cash flow from the export of crude oil. As a result of our sale
of shares to private investors, we became a mixed economy company, which
provides us budgetary autonomy and access to credit markets.
Liquidity
Our
principal sources of liquidity in 2009 were cash flows from operations amounting
to Ps$9,405,637 million, a Ps$2.2 trillion syndicated
loan facility with local banks and a
US$1,500 million bond
issuance. Our principal uses of liquidity in 2009 were
Ps$10,750,197 million in capital expenditures, which included investments in
natural and environmental resources and reserves, additions to our property,
plant and equipment and dividend payments for the fiscal year 2009 amounting to
Ps$8,902,602 million.
83
At
December 31, 2009, we had consolidated indebtedness of Ps$6,151,435 million,
which corresponded mainly to:
|
|
·
|
A
Ps$2.2 trillion (approximately US$1 billion) syndicated loan facility we
entered with a syndicate of local banks in May 2009. This loan
facility has a term of seven years with a two year grace
period. The interest rate under the facility equals the fixed
term deposit rate (DTF) plus an additional 4% (the anticipated quarterly
interest rate). Amortization is bi-annual under the
loan. In addition, as guarantee for the loan, we pledged our
direct stock in Reficar (which was 49% of the total shares at the time of
the loan), Oleoducto Central S.A. (Ocensa) and Propileno del Caribe
(Propilco). We used the proceeds from this loan to finance our
strategic plan.
|
|
|
·
|
An
issuance of US$1,500 million aggregate principal amounts of 7.625% Notes
Due 2019 (the “Original Notes”) on July 23, 2009. The Original
Notes were issued pursuant to Rule 144A/ Regulation S with registration
rights with the SEC. The Original Notes were subsequently
registered with the SEC on September 3, 2009 (the “Registered
Notes”). Concurrently with this registration, we commenced an
exchange offer to exchange up to U.S.$1.5 billion aggregate principal
amount of the Registered Notes for an equal principal amount of our
outstanding Original Notes under the terms and subject to the conditions
set forth in a prospectus dated September 3, 2009. The exchange
offer was carried out in compliance with the obligations acquired by us
under the Registration Rights Agreement referred to in the
prospectus. The exchange offer expired on October 2,
2009. Bonds exchange requests were received in an aggregate
amount of US$1,492,541,000. On October 7, 2009, we issued an
aggregate amount of US$1,492,541,000 in Registered Notes and cancelled an
aggregate amount of US$1,492,541,000 in Original Notes. In
addition, the Registered Notes were listed on the New York Stock
Exchange.
|
In
addition, ODL, our indirect Panamanian subsidiary, through its Colombian branch
office, Oleoducto de los Llanos Orientales Sucursal Colombia, entered into a
Ps$520,000 million (approximately US$200 million) loan facility with Banco de
Bogota S.A., Banco de Occidente S.A., Banco Popular S.A. and Banco AV Villas
S.A., which together comprise the Grupo Aval, in March 2009. This
loan facility (which has been paid in full) had a term of five years and its
proceeds were used to finance part of the Rubiales pipeline described in Item 4B
– “Business Overview – Transportation – Pipelines – Oleoducto de los Llanos
Orientales” above. The interest rate under the facility equaled the
fixed term deposit rate (DTF) plus an additional 5% (the anticipated quarterly
interest rate). In October 2009 Oleoducto de los Llanos Orientales
Sucursal Colombia also placed a series of notes in an aggregate principal amount
equal to Ps$500,000 million (approximately US$260 million) through the Dutch
Auction System. Furthermore, in May 2010 Oleoducto de los Llanos
Orientales Sucursal Colombia entered into a second Ps$800,000 million
(approximately US$406 million) loan facility with Grupo Aval. The
interest rate under the new facility equals the fixed term deposit rate (DTF)
plus an additional 4% (the anticipated quarterly interest rate). The
principal amount under the second loan facility will be amortized in 20 equal
quarterly payments. As guarantee for the second loan, Oleoducto de
los Llanos Orientales Sucursal Colombia pledged its economic rights to certain
finance tariffs it is entitled to receive under its Ship-or-Pay
Contracts. The proceeds from this second credit facility were used to
fully pay the first credit facility with Grupo Aval and any remaining amount was
allocated to finance part of the Rubiales pipeline described in Item 4B –
“Business Overview – Transportation – Pipelines – Oleoducto de los Llanos
Orientales” above.
Furthermore, Ocensa entered into a
Ps$1,200,000 million (approximately US$631 million) loan facility with a
syndicate of local banks, comprised of Bancolombia S.A., Banco de Bogota S.A.,
Banco de Occidente S.A., Banco Popular S.A., Banco AV Villas S.A., Banco
Davivienda S.A., Banco Bilbao Vizcaya Argentaria Colombia (BBVA) S.A., Banco
Agrario de Colombia S.A., Banco Santander S.A. and Helm Bank S.A., in March
2010. This loan facility has a term of seven year and its proceeds will be
used to (i) increase Ocensa’s transportation capacity and (ii) return equity to
Ocensa’s shareholders. The interest rate under the facility equals the
fixed term deposit rate (DTF) plus an additional 4%. The first
disbursement under this loan was made in March 2010 in an amount totaling
Ps$260,000 million. Ocensa expects to make all remaining
disbursements during the second half of 2010.
For 2010, major cash needs include planned capital
expenditures amounting to approximately Ps$16.95 trillion, of which
Ps$2.14 trillion correspond
to exploration activities, Ps$7.89 trillion correspond to
production activities, Ps$4.14 trillion correspond
to refining activities, Ps$1.92 trillion for
transportation activities, Ps$864 billion for other
capital expenditures and Ps$3.68 trillion for
dividend distributions. Based on
the current price of oil, we expect our existing and anticipated working capital, capital expenditure requirements and declared dividend payments to be met from our cash flows
from operations and cash in hand. In addition, we may access the
local and international financial markets
for additional needs, if required. We believe such funding
will be available. See Item 3D — “Risk Factors — Risks related to our
business”.
84
Use
of Funds
Capital
expenditures
The
following table sets forth our consolidated capital expenditures for each of our
business segments for 2009, 2008 and 2007.
|
For the Year ended December 31,
|
||||||||||||
|
2009
|
2008
|
2007
|
||||||||||
|
(Pesos in millions)
|
||||||||||||
|
Exploration
& production
|
5,564,438 | 4,911,487 | 2,678,684 | |||||||||
|
Refining
and Petrochemicals
|
2,710,526 |
(1)
|
776,080 | 234,462 | ||||||||
|
Transportation
|
2,269,540 |
(2)
|
939,996 | 92,344 | ||||||||
|
Corporate
|
197,237 | 69,483 | 23,760 | |||||||||
|
Marketing
and Supply
|
8,455 | 7,549 | 7,712 | |||||||||
|
Total
|
10,750,197 | 6,704,595 | 3,036,962 | |||||||||
|
(1)
|
Does not include Ps$868,053 million corresponding
to our initial share ownership in
Reficar.
|
|
(2)
|
Does not
include (i) Ps$636,832 million corresponding to non-controlling
interest capital expenditures and Ps$528,207 million corresponding to our
initial share ownership in Ocensa and (ii) Ps$31,087 million corresponding
to non-controlling interest capital expenditures and Ps$36,287
million corresponding to our
initial share ownership in
ODC.
|
Our
2008-2015 budget capital expenditure is approximately US$57.7 billion
distributed by business segment. See Item 4B — “Business
Overview — Strategy”.
We plan
to meet our budgeted capital expenditures for the next two to three years mainly
through existing cash on hand and cash from operating activities. We
also expect to access local and international financial markets to fund part of
our capital expenditures. Furthermore, we may decide to access the
equity markets through the issuance of an additional 9.9% of our common stock as
authorized by law 1118 of 2006.
Cash
from operating activities
Net cash
provided by operating activities decreased by 9.9% in 2009 compared to 2008 as a
result of a decrease in the average price of crude oil and natural gas, which
resulted in a 10.3% decrease in our total revenues. Net cash provided
by operating activities increased by 11.0% in 2008, compared to 2007, mainly due
to the increase in average sales prices and in our production
levels.
Cash
used in investing activities
Net cash
used in investing activities decreased in 2009, compared to 2008, mainly as a
result of (i) decreases in our purchases of investments and our redemption and
sale of our investments and (ii) increases in our investments in natural and
environmental resources. These
investments were partially funded by cash
provided by our portfolio investments, which totaled Ps$7.977 trillion.
Net cash used in investment activities increased in
2008, compared to 2007, mainly due to the increase in our capital expenditures
as a result of our investment projects.
Cash
used in financing activities
Net cash
used in financing activities decreased in 2009,
compared to 2008, mainly due to the increase in our financial obligations as a
result of our incurrence of indebtedness in
2009. See Item 5: “Operating and Financial Review and
Prospects – Liquidity and Capital Resources” above. This increase was
partially offset by the increase in our dividend payments in 2009, amounting to Ps$8,903 billion.
Net cash used in financing activities increased in 2008,
compared to 2007, mainly as a result
of the fact that the receipt of cash
from
our initial public offering in Colombia in
2007 did not re-occur in 2008.
Dividends
In 2009,
we paid dividends of Ps$8,902,602 million to our shareholders, including the
Nation. On March 25, 2010, our shareholders at the ordinary general
shareholders’ meeting approved dividends for the fiscal year ended December 31,
2009, amounting to Ps$3,682,999 million, or Ps$91.00 per share, based on the
number of outstanding shares at December 31, 2009. Dividends declared
will be paid in three installments. The first payment was made in
April, and the second and third payments will be made in August and December,
2010, respectively.
85
|
5.C.
|
Research
and Development, Patents and Licenses,
etc.
|
Our
research and development activities are conducted by the Instituto Colombiano del
Petróleo (ICP) or the Institute, our research and development
unit. Our activities are focused on developing technology solutions
for us and the Colombian oil industry and the development of technical tests and
analyses to evaluate our business. Each year, we present to the Instituto Colombiano para el
Desarrollo de la Ciencia y la Tecnología (“COLCIENCIAS”) our research and
development projects in order to get a certification for our investment in
science and technology. In 2009, we presented 24 projects to
COLCIENCIAS which amounted to Ps$136,696 million (approximately US$ 63 million),
of which Ps$109,456 million correspond to projects certified by COLCIENCIAS and
the remaining Ps$27,241 million to man-hours dedicated to those
projects. In 2008, our research and development investment amounted
to Ps$86,695 million, including Ps$62,042 million related to 19 projects
certified by COLCIENCIAS and Ps$24,653 million corresponding to man-hours
dedicated to these projects. In 2007, our investment in research and
development investment amounted to Ps$46,795 million, of which Ps$37,551 million
corresponded to 24 projects certified by COLCIENCIAS and Ps$9,244 million to
man-hours dedicated to those projects.
The
Institute has 25 demo locations and 20 research and development
laboratories. During 2009 our research and development laboratories
rendered services to other companies including Shell, British Petroleum, Exxon
Mobil as well as the ANH.
We
currently own 19 patents in Colombia, United States, Venezuela, Ecuador, Brazil
and Nigeria, including two patents granted by the Government of Nigeria in the
first quarter in 2010. In 2009, we filed for 39 new patents, four of
them in Colombia. One of our most significant patents is an
anti-theft patent which allowed us to reduce fuel oil and crude oil theft by 50%
in 2009 when compared to 2008. Most of our patents will expire
between 2015 and 2017.
In 2009, we were also granted twelve new commercial
brands, adding to the eight brands we had
previously (which existing brands have been
renewed for an additional 10-year period).
During the first
quarter of 2010, the
ICP’s
Technical Information Center became one of the first
specialized information units in the Oil and Gas Sector in Latin America to
receive the certification in the System of Information Security Management under
the NTC/ISO 27001:2005, standard granted by
the ICONTEC, a Colombian National Standards organization.
|
5.D.
|
Trend
Information
|
See Item
5 — “Operating and Financial Review and Prospects — Overview”.
|
5.E.
|
Off-Balance
Sheet Arrangements
|
Under
Colombian Government Entity GAAP we do not have any off-balance sheet
arrangements.
|
5.F.
|
Tabular
Disclosure of Contractual
Obligations
|
Contractual
Obligations
We enter
into various commitments and contractual obligations that may require future
cash payments. The following table summarizes our contractual
obligations at December 31, 2009.
|
Payments due by period
|
||||||||||||||||||||
|
Total
|
Less than 1
year
|
1-3
years
|
3 to 5
years
|
More than 5
years
|
||||||||||||||||
|
(Pesos in millions)
|
||||||||||||||||||||
|
Contractual
Obligations:
|
||||||||||||||||||||
|
Pension
Plan Obligations
|
16,076,329 | 574,152 | 1,311,108 | 1,391,040 | 12,800,029 | |||||||||||||||
|
Contract
Service Obligations
|
4,306,254 | 2,595,169 | 1,309,160 | 5,883 | 396,042 | |||||||||||||||
|
Operating
Lease Obligations
|
44,157 | 35,906 | 8,251 | 0 | 0 | |||||||||||||||
|
Natural
Gas Supply Agreements
|
1,422,512 | 59,736 | 551,066 | 4,432 | 807,277 | |||||||||||||||
|
Purchase
Obligations (oil and refining)
|
3,039 | 3,039 | 0 | 0 | 0 | |||||||||||||||
|
Energy
Supply Agreements
|
2,862,526 | 2,438,004 | 422,309 | 2,213 | ||||||||||||||||
|
Capital
expenditures
|
18,674,140 | 6,617,677 | 2,949,793 | 54,316 | 9,052,354 | |||||||||||||||
|
Build,
Operate, Maintain and Transfer Contracts (BOMT)
|
301,195 | 63,490 | 113,870 | 123,835 | 0 | |||||||||||||||
|
Capital
(Finance) Lease Obligations
|
71,163 | 21,563 | 48,538 | 1,062 | 0 | |||||||||||||||
|
Financial
Sector Debt
|
2,272,708 | 182,934 | 1,238,832 | 683,273 | 167,670 | |||||||||||||||
|
Bonds
|
3,369,584 | 215,702 | 615,140 | 345,138 | 2,193,603 | |||||||||||||||
|
Total
|
49,403,607 | 12,807,372 | 8,568,066 | 2,608,980 | 25,419,189 | |||||||||||||||
86
Critical
accounting policies and estimates
The
following discussion sets forth our critical accounting
policies. Critical accounting policies are those policies that
require us to exercise the most judgment or involve a higher degree of
complexity in the application of the accounting policies that currently affect
our financial condition and results of operations. The accounting
estimates we make in these contexts require us to calculate variables and make
assumptions about matters that are highly uncertain. In each case, if
we had made other estimates, or if changes in the estimates occur from period to
period, our financial condition and results of operations could be materially
affected. This information should be read together with Note 1 to our
consolidated financial statements for a summary of the economic entity and
principal accounting policies and practices. There are many other
areas in which we use estimates about uncertain matters, but the reasonably
likely effect of changed or different estimates is not material to our financial
presentation.
Oil
and gas reserves
When
accounting for our reserves we use the internationally recognized “successful
efforts” method of accounting for investments in exploration and production
areas. These investments are amortized using the technical
units-of-production method on the basis of proved developed reserves by
field. The reserves are based on technical studies prepared
internally by our Department of Reservoirs and approved by our reserves
committee, which follow estimation methodologies recommended by international
organizations of specialists in hydrocarbon reserves and that in accordance with
their certification meet the guidelines followed by the SEC.
Oil and
gas reserves are divided between proved and unproved reserves. Proved
reserves are estimated quantities of crude oil, natural gas and natural gas
liquids that geological and engineering data demonstrate with reasonable
certainty to be recoverable in future years from known reservoirs under existing
economic and operating conditions. Proved reserves can also be
divided in two categories: developed and
undeveloped. Developed proved reserves are expected to be recovered
from existing wells including line pack, or when the costs necessary to put them
in production are relatively low. For undeveloped proved reserves,
significant investments are necessary, including drilling new wells and
installing production or transportation facilities.
The
estimation of hydrocarbon reserves is subject to several uncertainties inherent
to the determination of proved reserves, production recovery rates, the
timeliness with which investments are made to develop the reservoirs and the
degree of maturity of the fields.
87
On December 31, 2008, the SEC issued a final rule revising disclosure requirements
relating to oil and gas reserves as contained in Rule 4-10(a) of Regulation
S-X. Under the new SEC rule, reserves are
required to be estimated by applying the unweighted arithmetic average of the
first-day-of-the-month price for each month
within the year to year-end quantities of proved reserves (the “SEC average price methodology”). Prior to this revision, the SEC required
reserves to be estimated by applying the year-end WTI price to year-end
quantities of proved reserves (the “SEC year-end price methodology”). Our
proved reserves as of December 31, 2009 are based on the SEC average price
methodology for U.S. GAAP purposes, which mirrors the average price methodology
used by us to prepare our consolidated
financial statements during this period. Our proved reserves as of
December 31, 2008 are based on the SEC year-end price methodology for U.S. GAAP
purposes, which mirrors the year-end price methodology used by us to prepare our
consolidated financial statements during this period. However, our
proved reserves as of December 31, 2007 are estimated using average prices for
the preparation of our consolidated financial statements and using the SEC
year-end price methodology for U.S. GAAP purposes. As a result, the quantity
of proved reserves for this period differs from the estimated quantities of
proved reserves in accordance with the SEC year-end
methodology. See Note 33 to our
consolidated financial statements for a description of the main differences
between Colombian Government Entity GAAP
and U.S. GAAP.
Crude oil
prices have traditionally fluctuated as a result of a variety of factors such as
changes in international prices of natural gas and refined products, long term
changes in the demand for crude oil, natural gas and refined products,
regulatory changes, inventory levels, increase in the cost of capital, economic
conditions, development of new technologies, economic and political events, and
local and global demand and supply. Revisions to proved reserves
estimates of crude oil and gas and the effect of such price variations are
presented in Note 33.xxviii to our consolidated financial
statements. Changes in the crude oil price may affect our estimates
in the future. A decrease in our estimated proved reserves due to
pricing may result in the impairment of oil and gas properties.
The
calculation of units-of-production depreciation and depletion is a critical
accounting estimate that measures the depreciation and depletion of upstream
assets. The units of production are equal to the ratio of actual
volumes produced to total proved developed reserves (those proved reserves
recoverable through existing wells with existing equipment and operating
methods) and applied to our asset cost.
Financial
derivative instruments
Occasionally
we enter into hedging agreements to protect our exposure from the fluctuations
of international crude prices. The difference between amounts paid
and income received under hedging operations is recognized as financial
income/expense. We do not enter into hedging contracts for
speculative purposes.
Under
Colombian Government Entity GAAP, our estimates are based on current spot prices
subject to market variations. The differences between our estimates
and current payments have been immaterial. We do not foresee material
variations in the near future that may significantly impact our financial
condition or results of operations. Our transactions with financial
derivatives have not been significant during the last three years.
Under
U.S. GAAP, we used fair values to measure our financial derivative
instruments. Fair values were based on market
quotes. There have not been material variations between fair values
that have impacted significantly our financial condition or operating
performance in the past.
Pension
plans and other retirement benefits
The
determination of the expense and liability relating to our pension and other
retirement benefits require us to use judgment in the determination of actuarial
assumptions. These include active employees with indefinite term
contracts, retirees and their heirs, pension benefits, healthcare and education
expenses; number of temporary employees who will remain with us until
retirement, voluntary retirement plans and pension bonuses. The
calculation of retirement bonds posted by us to meet our pension obligations is
regulated by Decrees 1748 of 1995, 1474 of 1997 and 876 of 1998, as well as Law
100 of 1993 and its regulatory decree.
These
actuarial assumptions include estimates of future mortality, withdrawal, changes
in compensation and discount rate to reflect the time value of money as well as
the rate of return on pension bonds and other plan assets. These
assumptions are reviewed at least annually and may differ materially from actual
results due to changing market and economic conditions, regulatory events,
judicial rulings, higher or lower withdrawal rates or longer or shorter life
spans of participants.
88
Most of
our assumptions have been based on historical trends. Actuarial gains
and losses a result of differences between estimates and actual calculations and
differences between Colombian Government Entity GAAP and U.S. GAAP are disclosed
in Note 33.vii to our consolidated financial statements. Changes in
interest rates and amendments to plan conditions have affected prior
estimates. We believe that the assumptions used in recording our
obligations under the plans are reasonable based on our experience and market
conditions.
Litigation
and tax assessments
We are
subject to claims for substantial amounts, regulatory and arbitration
proceedings, tax assessment and other claims arising in the normal course of
business. Management and legal counsel evaluate these situations
based on their nature, the likelihood that they materialize, and the amounts
involved, to decide on any changes to the amounts accrued and/or
disclosed. This analysis includes current legal processes against the
Company and claims not yet initiated. In accordance with management’s
evaluation and guidance provided by Colombian Government Entity GAAP, we created
reserves to meet these costs when it is probable that a liability has been
incurred and reasonable estimates of the liability can be made. At
December 31, 2009, we had created a provision of Ps$680,022 million for
litigation contingencies. We also maintain insurance policies to
cover specific operational risks and asset protection.
Estimates
are based on legal counsel’s evaluation of the cases and management’s
judgment. In the past our estimates have been accurate and have not
varied substantially compared to final judgments. We believe that
payments required to settle the amounts related to the claims, in case of loss,
will not vary significantly from the estimated costs, and thus will not have a
material adverse effect on our results of operations or cash
flows. Litigation and tax assessment differences between Colombian
Government Entity GAAP and U.S. GAAP are disclosed in Note 33 to our
consolidated financial statements.
Income
taxes are accounted for under the assets and liability
method. Deferred tax assets and liabilities are recognized for the
future tax consequences attributable to differences between the carrying amounts
of existing assets and liabilities in the financial statements and their
respective tax base. Deferred taxes on assets and liabilities are
calculated based on statutory tax rates that we believe will be applied to our
taxable income during the years in which temporary differences between the
carrying amounts are expected to be recovered.
Abandonment
of fields
We are
required by law to remove equipment and restore the land or seabed at the end of
operations at production sites. To estimate this obligation, we
include plugging costs and abandonment of wells, dismantling of facilities and
environmental recovery of areas and wells. Changes resulting from new
estimates of the liability for abandonment can occur as a result of changes in
economic conditions. We accrue the estimated discounted costs of
dismantling and removing these facilities at the time of installation of the
assets. The related liability is estimated in foreign currency and is
adjusted for exchange difference at the end of each year.
We use
economic factors from different sources and develop our own internal estimates
of future inflation rates and discount rates. There have not been
significant disparities between estimates and asset retirement costs
paid. We believe that the assumptions used in recording our asset
retirement costs and obligations are reasonable based on our experience and
market conditions.
Differences
between Colombian Government Entity GAAP and U.S. GAAP are disclosed in Note 33
to our consolidated financial statements.
Recognition
and measurement of assets recognized and liabilities assumed upon business
combinations
Under
U.S. GAAP, we account for businesses acquired using the purchase method of
accounting which requires that the assets acquired and liabilities assumed be
recorded at the date of acquisition at their respective fair
values. The application of the purchase method requires certain
estimates and assumptions especially concerning the determination of the fair
values of the acquired intangible assets, property, plant and equipment as well
as the liabilities assumed at the date of the acquisition. In
addition, the useful lives of the acquired intangible assets, property, plant
and equipment have to be determined. The judgments made in the
context of the purchase price allocation can materially impact our future
results of operations. Accordingly, for significant acquisitions, we
obtain assistance from third-party valuation specialists. The
valuations are based on information available at the acquisition date and
different methodologies are used for each intangible identified
above.
89
Goodwill
Under
U.S. GAAP, Ecopetrol tests goodwill for impairment at least annually using a
two-step process that begins with an estimation of the fair value of a reporting
unit. The first step is a screen for potential impairment and the
second step measures the amount of impairment, if any. However, if
certain criteria are met, the requirement to test goodwill for impairment
annually can be satisfied without a re-measurement of the fair value of a
reporting unit. Fair value is determined by reference to market
value, if available, or by a qualified evaluator or pricing
model. Determination of a fair value by a qualified evaluator or
pricing model requires management to make assumptions and use
estimates. Management believes that the assumptions and estimates
used are reasonable and supportable in the existing market environment and
commensurate with the risk profile of the assets valued. However,
different assumptions and estimates could be used which would lead to different
results. In 2009, the most significant amounts of goodwill relate to
the acquisitions of Reficar and OIG. The valuation models used to
determine the fair value of these companies are sensitive to changes in the
underlying assumptions. For example, the prices and volumes of
product sales to be achieved and the prices which will be paid for the purchase
of raw materials are assumptions which may vary in the
future. Adverse changes in any of these assumptions could lead us to
record a goodwill impairment charge. During 2009, Ecopetrol conducted
a quality impairment test of goodwill which showed that no goodwill had been
impaired.
Under
Colombian Government Entity GAAP, goodwill corresponds to the difference between
the acquisition price and the book value of the acquired company. This amount is
amortized during the period on which the Company expects to receive future
benefits. Additionally, under Colombian Government Entity GAAP,
goodwill is not subject to impairment tests.
|
5.G.
|
Safe
Harbor
|
See —
“Forward Looking Statements.”
|
ITEM
6.
|
Directors,
Senior Management and Employees
|
|
6.A.
|
Directors
and Senior Management
|
The
information below sets forth the names and business experience of each of our
Directors, officers and senior management, as of the date hereof.
Directors
of Ecopetrol
The
following are our current Directors as elected at the shareholders’ meeting held
on March 25, 2010:
Minister of Mines and Energy, Hernan
Martínez (68) has been a member of our Board of Directors since September
25, 2006. Mr. Martínez has served as Minister of Mines and Energy of
Colombia since 2006. Prior to holding this position, Mr. Martínez
worked as Manager of Corporate Planning for Esso Colombiana S.A.; President of
International Colombia Resources Corporation; President of Exxon Mobil Colombia
S.A., and as representative of the President of Colombia before the
ANH. He has been a member of various Boards of Directors, including
Carton de Colombia S.A., Empresa de Interconexión Eléctrica S.A. ESP,
Transmisión Eléctrica S.A. and Inversura S.A. Mr. Martinez earned a
degree in chemical engineering from Universidad Pontificia Bolivariana and
obtained a specialization degree in petroleum management from Northwestern
University. Mr. Martínez was appointed as a director by the
Nation.
Minister of Finance, Oscar I.
Zuluaga (50) has been a member of our Board of Directors since March 26,
2007. Mr. Zuluaga has served as Minister of Finance of Colombia since
2007. From 1988 to 1990, Mr. Zuluaga was a member of the Council of
Pensilvania (Caldas-Colombia), and in 1990 became the Mayor of this
municipality. He served in the Senate of Colombia from 2002 to
2004. He is a founding member of the “U” Political Party, and served
as the Advisor Minister for the Office of the President of Colombia in
2006. Mr. Zuluaga was also a Vice-President and President of Acerías
de Colombia S.A. from 1992 to 2001. Mr. Zuluaga has been a member of
the Board of Directors of Banco de la Republica – Colombia’s central bank,
Fenalco or Federación Nacional
de Comerciantes, Fedemetal, and the Colombo-Venezuelan Chamber of
Commerce. Mr. Zuluaga earned a degree in economics from Pontificia
Universidad Javeriana and a master’s degree in public finance from Exeter
University, England. Mr. Zuluaga was appointed as a director by the
Nation. He earned the award of the “Best Latin American Minister of
Finance 2009” issued by the journal of Emerging
Market.
90
Esteban Piedrahíta (39) has
been a member of our Board of Directors since May 2009. Mr.
Piedrahíta has served as Director of the National Planning Agency of Colombia
since May 4, 2009. He has worked for the Inter-American Development
Bank and the Colombian Embassy in Washington. He has also held
positions at Poder
Magazine, Semana
Publishing House, Estrategias Corporativas and
Salomon Brothers
Inc. Mr. Piedrahíta earned a degree in economics from Harvard
University and a master’s degree with honors in Philosophy and Science History
from the London School of Economics and Political Science. Mr.
Piedrahíta was appointed as a director by the Nation.
Fabio Echeverri (77) has been
a member of our Board of Directors since September 16, 2002. From
1957 to 1962, Mr. Echeverri worked as the President of Banco de Colombia and
Banco Comercial Antioqueño. Since then, he has held various positions
in the private and public sectors, serving as President of Siderurgica de
Medellin, Director of ANDI (National Association of Industries), AILA (Latin
American Association of Industries) and CONANDI (Andean Confederation of
Industries), and as a member of the Inter-American Council of Commerce and
Production, a position that he held for over 18 years. Mr. Echeverri
is currently a member of the Board of Directors of the Shaio Clinic,
Telecom-Colombia and Frigoríficos Ganaderos de Colombia S.A. During
his career, Mr. Echeverri has been a chairman of the Board of Directors of Fondo
Ganadero de Antioquia; and chairman of the board of Siemens S.A., among
others. Mr. Echeverri earned degrees in economics from Gimnasio
Moderno and Universidad Jorge Tadeo Lozano. Mr. Echeverri was
appointed as an independent director by the Nation.
Joaquin Moreno (61) has been
a member of our Board of Directors since March 27, 2008. Mr. Moreno
worked for 33 years for the Royal Dutch/Shell Group. He held various
positions such as Project Manager in Colombia; Project and Operations Manager
and Marketing and Operations Manager of Shell Química de Venezuela; Director of
Marketing for agrochemical products and Global Marketing Manager for
petrochemical products at Shell Centre–Shell International Chemicals Company in
London; Director of Shell Venezuela S.A.; Director of Shell Colombia S.A. and
Director of Cerromatoso S.A., and Strategic Planning Director for Exploration
and Production in Europe and the Middle East at the Shell offices in the
Netherlands. Mr. Moreno has also served as Country Chairman and
President for Shell in Mexico, Colombia and Venezuela. Mr. Moreno has
been a member of various Boards of Directors of local and international
companies. Mr. Moreno earned a degree in civil engineering from
Universidad Industrial de Santander and completed a program in advanced
management at Harvard University. He was appointed as an independent
director by the Nation.
Ignacio Sanín (62) has been a
member of our Board of Directors since September 16, 2002. Mr. Sanín
is currently the managing partner of the law firm Ignacio Sanín Bernal &
Cia, Asociados. Mr. Sanín is a recognized professor of law having
taught in various universities in Colombia at the undergraduate and postgraduate
levels. Mr. Sanín earned a law degree and a degree in political
science from Universidad Pontificia Bolivariana. He has completed
postgraduate studies in commercial and tax law at the Polytechnic School, London
School of Economics and King’s College in London. He obtained a
master’s degree in private law and a master’s degree in commercial law from
Universidad Pontificia Bolivariana. Mr. Sanín was appointed as an
independent director by the Nation.
Maria E. Velásquez (52) has
been a member of our Board of Directors since December 16, 2004. Mrs.
Velásquez has served as Vice-President of Tecnocquimicas S.A. since February
2008. Prior to her current position, Mrs. Velásquez held the
positions of Vice-President and President of Imusa S.A. from 2002 to
2007. She has also held positions in marketing at Andeco Ltda. and
Diriventas Ltda. Mrs. Velásquez has been a member of various Boards
of Directors, including those of the Colombian-American Chamber of Commerce and
the Chamber of Commerce of Medellin. Mrs. Velásquez earned a business
degree from Universidad de Medellin and specialization degrees in marketing from
Universidad EAFIT and management from Universidad de la Sabana. Mrs.
Velásquez was appointed as an independent director by the Nation.
Amylkar Acosta Medina (59) has been a member of our
Board of Directors since March 25, 2010. From 1991 to 2002, Mr.
Acosta was a senator in the Colombian National Senate, where he also served as
President of the National Congress from July 1997 to July 1998. From
1974 to 1988, Mr. Acosta was a member of the Council of Rioacha and Medellín,
cities in the Guajira and Antioquia regions of Colombia. Mr. Acosta
has served as an advisor to the General Controller of the National
Government. He was also Vice-Minister of the Ministry of Mines and
Energy from 1997 to 1998 and has held several positions as a researcher and
professor at various universities. Mr. Acosta has published various
economic treatises, articles and research papers. Mr. Acosta earned a
degree in economics from Universidad de Antioquia. In accordance with
the Declaration of the Nation dated July 26, 2007, he was appointed by the
Nation as an independent director representing the hydrocarbon production
departments of Colombia.
91
Mauricio Cárdenas (47) has
been a member of our Board of Directors since March 27, 2008. Mr.
Cárdenas has served as the executive director of Fedesarrollo (Fundación para la Educación Superior
y el Desarrollo) since 2003. Mr. Cardenas served as President
of Empresa de Energía de Bogota in 1993. He left this position to
become the Minister of Economic Development of Colombia. He then
worked as an investigator and executive director of Fedesarrollo. In
1998, Mr. Cárdenas was appointed the Minister of Transportation and later became
the Director of the National Planning Agency of Colombia. Mr.
Cárdenas was also a visiting professor for the Center of International
Development at Harvard University from March to June 2001 and has held several
positions as a researcher and a professor at various
universities. Mr. Cárdenas has served as a member of the Board of
Directors of various organizations, including the Latin American and Caribbean
Economic Association, LACEA, Universidad de los Andes and the
BVC. Mr. Cárdenas has published various economic treatises, articles
and research papers. Mr. Cárdenas earned a degree and a master’s
degree in economics from Universidad de los Andes and later obtained a Ph.D. in
economics from the University of California, Berkeley. In accordance
with the Declaration of the Nation dated July 26, 2007, Mr. Cárdenas was
appointed by the Nation as an independent director representing the ten largest
minority shareholders.
None of
our Directors, or executive officers has any family relationship with any other
director or executive officer.
Officers
and Senior Management of Ecopetrol
The
following presents information concerning our executive officers and senior
management.
Javier G. Gutiérrez (58) has served as our
President and Chief Executive Officer since January 22, 2007. Prior
to becoming our CEO, Mr. Gutiérrez served as CEO of Empresa de Interconexión Eléctrica
S.A. ESP or ISA
since 1992 where he started in the planning department in 1975. Mr.
Gutiérrez also worked as Vice-President of the Colombian Commission for Regional
Electric Integration from 1995 to 1997. In 2002, Mr. Gutiérrez
received an award from the Portafolio economic
journal as the
“Best Enterprise Leader in Colombia”. In 2005 the América Economía Journal granted Mr. Gutiérrez
an award of excellence and in the same year La República, a renowned
financial journal in Colombia, ranked Mr. Gutiérrez among Colombia’s top 10
executives. In 2008, Mr. Gutiérrez was recognized as the enterprise
leader with the best reputation in Colombia by the Spanish Monitor of Corporate
Reputation (MERCO). Mr. Gutiérrez earned a degree in civil
engineering, a master’s degree in industrial engineering from Universidad de los
Andes and a specialization degree in finance from Universidad
EAFIT. Mr. Gutierrez has worked as a part-time professor of
statistics and research at Universidad de los Andes and as a professor of
operational research at Universidad EAFIT.
Adriana M. Echeverri
(40) joined
us in 1994, and has served as our Chief Financial Officer since September
2006. Prior to being appointed as our CFO, Mrs. Echeverri worked as
Chief of the Finance and Treasury Unit from September 2003 to September
2006. She earned a degree in finance and foreign affairs and an MBA
from Universidad Externado de Colombia.
Margarita Obregon (52) joined Ecopetrol in 2000
and has served as the Secretary of the Board of Directors and as Chief to the
Support Office of the Chief Executive Officer since 2008. Prior to
joining us, Mrs. Obregon worked in the supply department of Previsora S.A: Compañía
de Seguros and as legal advisor of lands for British Petroleum Company –
BP in Alvaro Rengifo y
Cia. Mrs. Obregon also served as the head of the Business and
Administration department of the Fiduciaria del
Estado. Mrs. Obregon earned a law degree from Colegio Mayor de
Nuestra Señora del Rosario with specialization degrees in financial law and
administration law.
Nelson Navarrete (47) has
served as our Exploration and Production Executive Vice-President since February
2008. Mr. Navarrete joined us in 1986. Prior to becoming
our Exploration and Production Executive Vice-President, he held several
positions within the operations department, such as Management Coordinator of
the Cusiana oil field, Director of Reserves & Production, Regional Manager
of fields located in the Piedemonte, and Chief of
Production. Mr. Navarrete earned a degree in petroleum engineering
from Universidad America and a master’s degree in petroleum engineering from
Tulsa University.
92
Pedro A. Rosales (46) joined
us in 1989, and has served as our Downstream Executive Vice-President since
February 2008. Mr. Rosales is responsible for the following
businesses: refining, petrochemicals, transportation and logistics,
marketing and distribution, biofuels and gas. Mr. Rosales has held
several positions in the Company within the areas of maintenance, operations,
projects, planning and administration. Prior to becoming our
Downstream Executive Vice-President, Mr. Rosales served as our Vice-President of
Transportation since January 2003 and as our Chief Operation Officer since
2006. Mr. Rosales is a member of the board of directors of Refinería
de Cartagena S.A. (“Reficar”), Oleoducto Central S.A. (“Ocensa”), Propileno del
Caribe (“Propilco”) and Empresa de Energía de Bogotá (“EEB”). Mr.
Rosales earned a degree in mechanical engineering and an MBA from Universidad de
los Andes.
Hector Manosalva (48) joined us in 1986 and
has served as our Production Vice-President since 2009. Mr. Manolsava
earned a degree in petroleum engineering from Universidad de America and a
specialization degree in finance from Universidad EAFIT. He has held
a number of positions in Ecopetrol, including Chief of the Planning Division,
Production Director in Putumayo, Director of Corporate Social Responsibility and
Director of Production in the Central region.
Diego A. Carvajal (56) has served as our
Vice-President of Exploration since 2005. Mr. Carvajal has extensive
technical and managerial experience in projects of exploration and production of
hydrocarbons, both in Colombia and overseas. Former President of the
Colombian Association of Petroleum Geologists and Geophysicists, affiliated to
AAPG. From 1984 to 1993, Mr. Carvajal worked as an Exploration
Geologist for the Texas Petroleum Company – TEXACO, and from 1993 to 2005 he
worked as Exploration Team Leader for the BP Exploration Co. Colombia
Ltd. He joined Ecopetrol in 2005 as our Vice-President of
Exploration. Mr. Carvajal earned a degree in geology from Universidad
Nacional de Colombia.
Camilo Marulanda (31) joined
us in 2003 and has served as our Vice-President of Strategy since
2009. Mr. Marulanda earned a degree in economics and a specialization
degree in marketing from Universidad de los Andes. He worked for
Procter & Gamble Colombia from August 2001 to February 2003 as Category
Manager. Mr. Marulanda was Chief of the Marketing Department since
September 2003, Director of the National Commercialization unit since December
2004 and Vice-President of Supply and Marketing since December
2005.
Federico Maya (44) has served
as our Vice-President of Refining and Petrochemicals since December
2005. Mr. Maya has held various positions at Ecopetrol over the last
20 years, including Marketing and Contract Coordinator for Ecopetrol’s Gas
Department, member of the Corporate Planning Directory, and Chief of Supply and
Marketing. Mr. Maya earned a degree in chemical engineering from
Pontificia Universidad Bolivariana and a specialization degree in marketing from
Universidad EAFIT.
Claudia Castellanos (46) has served as our
Vice-President of Supply and Marketing since 2009. Mrs. Castellanos
earned a degree in chemical engineering from Universidad Industrial de Santander
and a specialization degree in energy resources management from Universidad
Autónoma de Bucaramanga. She has worked in Ecopetrol for over 22
years as a process engineer at Reficar, where she also worked in the Finance
Department. Prior to becoming our Vice-President of Supply and
Marketing, Mrs. Castellanos was chief of our Gas Department for six years, where
her focus was in the domestic and international commercialization of natural
gas.
Alvaro Castañeda (47) has served as our
Vice-President of Transportation since 2009. Mr. Castañeda earned a
degree in metallurgical engineering, a specialization degree in international
management of oil and gas and a master’s degree in administration from
Universidad Autonoma de Bucaramanga and Instituto Tecnologico de
Monterrey. He has worked in Ecopetrol for the last 20 years, and has
held various positions, including Plant Coordinator, Director of the Operations
Department, Chief of the Centralized Operations Department and Director of
Multipurpose Pipelines.
Martha Cecilia Castaño (41)
joined us in 2004 and has served as our Vice-President of Human Resources since
2008. Prior to becoming our Human Resources Vice-President, Mrs.
Castaño worked as Coordinator of Organizational Culture, Chief of the
Leadership, Internal Communications and Cultural Unit and was also in charge of
the Labor Relations Department. Mrs. Castaño earned a degree in
social communications and a specialization degree in economics from Universidad
de la Sabana. She has also worked in Acopi, El Tiempo, Uniandinos and
Empresa de Telecomunicaciones de Bogotá (ETB), in several areas such as human
resources management, corporate communications and labor
relations.
93
Oscar A. Villadiego (45)
joined us in 1986, and has served as Vice-President of Services and
Technology since February 2008. He has held several positions in the
Production Vice-Presidency in such areas as the crude oil reserves, development
and human resources unit. He served as manager for the Central region
for a period of 2.5 years, and as Technical Manager for the production
Vice-Presidency for four years. Mr. Villadiego earned a degree in
Petroleum Engineering from Universidad America in 1987.
Mauricio Echeverry (53)
joined us in November 1999, and has served as our General Counsel since
then. Mr. Echeverry held the positions of Dean, Associate Dean and
Professor at Universidad de los Andes Law School. He was also
Colombia’s Deputy General Prosecutor and Plenipotentiary Minister for Colombia’s
Embassy in the U.S. Mr. Echeverry earned a law degree and a
specialization degree in commercial law from Universidad de los
Andes.
|
6.B.
|
Compensation
|
The total
compensation paid to our Directors, executive officers and senior management
during 2009 amounted to Ps$7,832 million.
Based on
a resolution adopted at our 2008 annual shareholders’ meeting, board
compensation for Board and/or Committee meetings in person is set at the
equivalent of four minimum monthly wage salaries, which totals approximately
Ps$1,987,600 for 2009 and Ps$2,060,000 for 2010, minus the VAT and Industry and
Commerce taxes. Fees for attendance at virtual meetings is set at 50%
of the in-person meeting fees.
Our
Directors are not eligible to receive pension and retirement benefits from
us. The total amount set aside to provide pension and retirement
benefits to our eligible executive officer totals Ps$4,029,638,051.
|
6.C.
|
Board
Practices
|
Our Board
of Directors is composed of nine members and is responsible for, among other
things, establishing our general business policies. The members of
the Board of Directors are elected at the annual shareholders’ meeting for
one-year terms through an electoral quota voting system (number of votes
required to fill each position is calculated by dividing the number of possible
votes by the number of open board positions) and may be reelected indefinitely;
the members of the Board of Directors may be elected without an electoral quota
voting system when there is unanimity. Pursuant to our
by-laws, the Board of Directors’ positions are filled either by person or by
position. Currently, we have three members appointed by their
position: the Minister of Finance, the Minister of Mines and Energy
and the Director of the National Planning Agency. Our Directors were
elected on March 25, 2010. Our executive officers are appointed by
our Board of Directors.
None of
the service contracts of any of our Directors contain provisions for benefits
upon termination of such director’s services.
Pursuant
to our by-laws, our Board of Directors has four committees, which establish
guidelines, set specific actions and evaluate and submit proposals designed to
improve performances in the areas under their supervision and
control.
These
committees are comprised of members of the Board of Directors whom are appointed
by the Board.
In
addition to applicable regulations, the committees also have their own specific
regulations that establish their purposes, duties and
responsibilities.
94
The
following table sets forth the current members of our committees:
|
Audit Committee(1)
|
Compensation and Nomination
Committee
|
Corporate Governance
Committee
|
||
|
Joaquin Moreno
|
Minister of Mines and Energy
|
Ignacio Sanín
|
||
|
Mauricio
Cárdenas
|
Fabio
Echeverri
|
Amylcar
Acosta
|
||
|
Maria
E. Velásquez
|
Maria
E. Velásquez
|
Minister
of Finance
|
||
|
Ignacio
Sanín
|
Amilcar
Acosta
|
|||
|
Business
Committee
|
||||
|
Joaquin
Moreno
|
||||
|
Mauricio
Cárdenas
|
||||
|
Maria
E. Velásquez
|
||||
|
Minister
of Mines and Energy
|
||||
|
Director
of National Planning Department
|
|
|
|
(1)
|
All
members of our audit committee must be
independent.
|
Audit
Committee
Our audit
committee, comprised of four independent Directors, is the highest internal
control body of our company and provides support to our Board of Directors in
accounting and financial matters. It is in charge of guaranteeing the
design, implementation and supervision of our internal control over financial
reporting. It also provides support for the Board in analyzing topics
related to financial matters, risks, control environment and assessment of the
Company’s internal and external auditor.
All
committee members are required to be knowledgeable in accounting matters and at
least one of them is required to be an expert in financial and accounting
matters.
Compensation
and Nomination Committee
Our
compensation and nominating committee, comprised of three members, including at
least one independent director, provides general guidelines for selection and
compensation of our executive officers and employees.
Corporate
Governance Committee
Our
corporate governance committee, comprised of three members, including at least
one independent director, makes corporate governance proposals to our Board to
ensure and supervise the fulfillment of the good governance practices of the
Company according to the Company’s Code of Good Governance.
Business
Committee
Our
business committee, comprised of five members, including at least one
independent director, was created to assist the Board in analyzing potential
business ventures. Based on its delegation of power, the committee
studies, analyzes and approves investment projects, new exploration and
production businesses and other matters which would help the Company move
forward in its efforts towards internationalization. The primary
criteria used in the committee’s decision-making is the optimization of the
Company’s portfolio and the proper allocation of its resources.
|
6.D.
|
Employees
|
At
December 31, 2009 we had 6,695 employees. The collective bargaining
agreement entered into between us and our three main labor unions governs the
labor relations of our unionized employees, which stood at 2, 169 on December
31, 2009. Agreement 01 of 1977 governs the labor relations of our
employees devoted to technical and trustworthy activities, which stood at 4,526
on December 31, 2009. The collective bargaining agreement and
Agreement 01 of 1977 do not vary significantly in benefits or economic
benefits. Employees hired before January 29, 2003 have a special
retirement plan and those hired after January 29, 2003 are subject to Law 100
with respect to their retirement scheme.
95
To
support our corporate growth strategy, we increased our total number of
employees by 2.73% from 6,517 in 2008 to 6,695 in 2009. The table
below presents the number of Ecopetrol S.A’s employees and the average number of
employees by business segments for the years ended December 31, 2009, 2008
and 2007:
|
December 2009(a)
|
Direct Employees (full
time)
|
Direct Employees average(2)
|
Temporary Employees
|
|||||||||
|
Exploration
and Production
|
||||||||||||
|
Exploration
|
130 | 123 | - | |||||||||
|
Production
|
1369 | 1372 | 57 | |||||||||
|
Others
|
240 | 238 | - | |||||||||
|
Total
Exploration and Production
|
1739 | 1733 | 57 | |||||||||
|
Downstream
|
|
|||||||||||
|
Refining
|
2080
|
2073
|
220
|
|||||||||
|
Transport
|
869 | 858 | 72 | |||||||||
|
Marketing
|
150 | 147 | 1 | |||||||||
|
Others
|
18 | 18 | - | |||||||||
|
Total
Downstream
|
3117 | 3096 | 293 | |||||||||
|
Corporate
|
1839 | 1849 | 117 | |||||||||
|
TOTAL(1)
|
6695 | 6678 | 467 | |||||||||
|
December 2008(b)
|
Direct Employees (full
time)
|
Direct Employees average(2)
|
Temporary Employees
|
|||||||||
|
Exploration
and Production
|
||||||||||||
|
Exploration
|
108 | 100 | - | |||||||||
|
Production
|
1,343 | 1,305 | 94 | |||||||||
|
Others
|
215 | 124 | - | |||||||||
|
Total
Exploration and Production
|
1,666 | 1,529 | 94 | |||||||||
|
Downstream
|
||||||||||||
|
Refining
|
2,056 | 1,991 | 212 | |||||||||
|
Transport
|
580 | 812 | 65 | |||||||||
|
Marketing
|
141 | 123 | 0 | |||||||||
|
Others
|
14 | 9 | 0 | |||||||||
|
Total
Downstream
|
3,061 | 2,935 | 277 | |||||||||
|
Corporate
|
1,790 | 1,700 | 130 | |||||||||
|
TOTAL(1)
|
6,517 | 6,154 | 501 | |||||||||
|
December 2007(c)
|
Direct Employees (full
time)
|
Direct Employees average(2)
|
Temporary Employees
|
|||||||||
|
Exploration
and Production
|
||||||||||||
|
Exploration
|
100 | 97 | 8 | |||||||||
|
Production
|
1,278 | 1,298 | 85 | |||||||||
|
Others
|
- | - | - | |||||||||
|
Total
Exploration and Production
|
1,378 | 1,395 | 93 | |||||||||
|
Downstream
|
||||||||||||
|
Refining
|
1,979 | 1,936 | 81 | |||||||||
|
Transport
|
762 | 768 | 23 | |||||||||
|
Marketing
|
113 | 113 | 9 | |||||||||
|
Others
|
- | - | - | |||||||||
|
Total
Downstream
|
2,854 | 2,817 | 113 | |||||||||
|
Corporate
|
1,631 | 1,638 | 114 | |||||||||
|
TOTAL(1)
|
5,863 | 5,850 | 320 | |||||||||
|
(1)
|
At
the last day of each month.
|
|
(2)
|
Averages
are calculated on a monthly basis from January to December of
each year.
|
|
(a)
|
279
persons employed by us during 2009 were not included in our 2009 employee
statistics as they were involved in intermittent, non-regular activities
and do not classify as temporary
employees.
|
|
(b)
|
60
persons employed by us during 2008 were not included in our 2008 employee
statistics as they were involved in intermittent, non-regular activities
and do not classify as temporary
employees.
|
|
(c)
|
211
persons employed by us during 2007 were not included in our 2007 employee
statistics as they were involved in intermittent, non-regular activities
and do not classify as temporary
employees.
|
96
The following table sets forth the
number of employees of each of our subsidiaries for the years ended
December 31, 2009 and 2008:
|
December 2009
|
Direct Employees (full
time)
|
|||
|
Ecopetrol
America Inc.
|
- | |||
|
Bioenergy
S.A.
|
62 | |||
|
Hocol
S.A.
|
152 | |||
|
Ocensa
|
130 | |||
|
ODC
S.A.
|
2 | |||
|
ODL
|
9 | |||
|
Ecopetrol
del Perú S.A.
|
4 | |||
|
Refinería
de Cartagena S.A.
|
106 | |||
|
Ecopetrol
Oleo e Gas do Brasil Ltda
|
4 | |||
|
Propilco
S.A.
|
231 | |||
|
TOTAL
SUBSIDIARIES(1)
|
700 | |||
|
December 2008
|
Direct Employees (full
time)
|
|||
|
Ecopetrol
America Inc.
|
- | |||
|
Bioenergy
S.A.
|
28 | |||
|
Hocol
S.A.
|
- | |||
|
Ocensa
|
- | |||
|
ODC
S.A.
|
- | |||
|
ODL
|
- | |||
|
Ecopetrol
del Perú S.A.
|
- | |||
|
Refinería
de Cartagena S.A.
|
- | |||
|
Ecopetrol
Oleo e Gas do Brasil Ltda
|
- | |||
|
Propilco
S.A.
|
223 | |||
|
TOTAL
SUBSIDIARIES(1)
|
251 | |||
|
(1)
|
At
the last day of each month.
|
Labor
Unions
We
currently have three industry-wide labor unions and one company labor
union:
|
|
1.
|
Unión
Sindical Obrera de la Industria del Petróleo — USO (Industry labor
union)
|
|
|
2.
|
Asociación
de Directivos Profesionales, Técnicos y Trabajadores de las Empresas de la
Rama de Actividad Económica del Recurso Natural del Petróleo y sus
Derivados de Colombia — ADECO (Industry labor
union)
|
|
|
3.
|
Sindicato
Nacional de Trabajadores de Empresas Operadoras, Contratistas,
Subcontratistas de Servicios y Actividades de la Industria del Petróleo y
Similares — SINDISPETROL (Industry labor
union)
|
|
|
4.
|
Sindicato
Nacional de Trabajadores de Ecopetrol — SINCOPETROL (Company labor
union)
|
Our
employees and any employee working for a company in the oil and gas industry may
join the USO, ADECO or Sindispetrol. Sincopetrol may only be joined
by our employees.
On
August 22, 2009, as a result of consensual negotiations, we entered into a
five-year collective bargaining agreement with USO, ADECO and
Sindispetrol.
97
The
following are the most representative benefits of the agreement currently in
force:
|
|
·
|
Transportation
Subsidy. Monthly transportation subsidy depends on the
employee’s location and ranges between Ps$1,213 and
Ps$130,000;
|
|
|
·
|
Food
Subsidy. Daily food subsidy ranges between Ps$6,520 and
Ps$8,195 depending on the employee’s
location;
|
|
|
·
|
Lodging
Subsidy. Monthly lodging subsidy to employees ranges
between Ps$190,739 and $405,000;
|
|
|
·
|
Subsidy for
Education. Subsidy that covers 90% of tuition and board
expenses and fixed amounts of transportation and textbooks for our
employees and their children;
|
|
|
·
|
Stability
Clause. Employees who as of December 1, 2004 had
worked over 16 months cannot be fired without just
cause;
|
|
|
·
|
Retirement
Benefit. A retirement benefit is paid to our employees
who meet the following requirements: have worked for us for at
least 20 years and have reached the specific retirement age. In
order for employees to be eligible to receive the benefit, the number of
years working for us (in excess of 20), plus their age must be equal 70
years. The retirement benefit paid is equal to at least 75% of
the average compensation received by the employee during the last 12
months. This benefit expires on July 31,
2010. After July 31, 2010, we will transfer to pension
funds the amounts accrued under this benefit for each employee who did not
meet the requirements established by
law;
|
|
|
·
|
Public Retirement
Benefit. A retirement benefit is paid to our employees
who meet the following requirements: have worked for us and
other public or private company for a total period of at least 20 years,
are at least 50 years old, in the case of women, and 55 years old, in the
case of men. The retirement benefit paid is equal to 75% of the
average compensation received by the employee during the last 12
months. This benefit is paid in proportion to the time worked
for us, with the difference being assumed by the other companies for which
the employee has worked;
|
|
|
·
|
Retirement plan for new
employees. Employees hired after January 29, 2003
are not covered by our retirement scheme and are covered by the general
social security system;
|
|
|
·
|
Five-year
bonus. A cash benefit bonus accrued on a yearly basis
and paid for every 5-year period worked in the Company according to the
following scale:
|
|
5
years worked
|
Bonus
equivalent to 9 days of basic payment plus Ps$180,000
|
|
10
years worked
|
Bonus
equivalent to 14 days of basic payment plus Ps$180,000
|
|
15
years worked
|
Bonus
equivalent to 19 days of basic payment plus Ps$180,000
|
|
20
years worked
|
Bonus
equivalent to 24 days of basic payment plus Ps$180,000
|
|
25
years worked
|
Bonus
equivalent to 29 days of basic payment plus Ps$180,000
|
|
30
years worked
|
Bonus
equivalent to 34 days of basic payment plus
Ps$180,000
|
Labor
Relations
As part
of our challenge to improve workplace morale, we implemented a number of
initiatives to maintain good relations with our employees, guarantee competitive
wages, strengthen our corporate culture, provide opportunities for personal
development and improve the general welfare of our employees. Our
initiatives also sought to strengthen communication processes, and start
performance-based compensation.
As part
of the actions to improve quality of life, we extended open term contracts to
472 employees, 1,093 home loans were extended to our employees for a total
of Ps$91,217 million and 547 loans for computers were extended for a total
of Ps$3,257 million.
98
We
provided on-site and external training and development courses to our
employees. At December 31, 2009, our employees had received an
average of 80.1 hours of training per employee.
Labor
Regulation
As of
November 13, 2007, all of our employees are official employees as a result
of our transformation into a mixed economy company. Therefore, our
employees have been governed by the provisions of the Colombian Labor Code since
then.
|
6.E.
|
Share
Ownership
|
The
disclosure of the beneficial ownership of shares by any of our Directors or
executive officers is not provided as no Director or executive officer
beneficially owns more than 1% of our outstanding shares.
|
ITEM 7.
|
Major
Shareholders and Related Party
Transactions
|
|
7.A.
|
Major
Shareholders
|
The
following table sets forth the names of our major shareholders, and the number
of shares and the percentage of outstanding shares owned by them at
December 31, 2009, 2008 and 2007.
|
At December 31,
|
||||||||||||||||||||||||
|
2009
|
2008
|
2007
|
||||||||||||||||||||||
|
Shareholders
|
Number
of shares
|
%
Ownership
|
Number
of shares
|
%
Ownership
|
Number
of shares
|
%
Ownership
|
||||||||||||||||||
|
Nation
|
36,384,788,817 | 89.9 | % | 36,384,788,817 | 89.9 | % | 36,384,788,817 | 89.9 | % | |||||||||||||||
|
Public
float
|
4,087,723,771 | 10.1 | % | 4,087,723,771 | 10.1 | % | 4,087,723,771 | 10.1 | % | |||||||||||||||
|
Total
|
40,472,512,588 | 100 | % | 40,472,512,588 | 100 | % | 40,472,512,588 | 100 | % | |||||||||||||||
All our
common shares have identical voting rights.
|
7.B.
|
Related
Party Transactions
|
Agreements
We engage
in a variety of transactions with related parties in the ordinary course of
business. Set forth below is a description of material related party
transactions. For additional information about transactions with
related parties see Note 15 to our consolidated financial
statements.
Ocensa
As of
December 31, 2009, we had entered into the following agreements with
Ocensa, a company in which we have a 60% equity interest since
March 2009:
In
March 1995, we entered into an agreement for the transportation of crude
oil through the Ocensa pipeline. Pursuant to the terms of the
agreement, we are required to make monthly payments that vary depending on the
volumes of crude oil we transport through the pipeline and a tariff calculated
by Ocensa on the basis of Ocensa’s financial projections and their expected
volumes of crude oil. In 2009, payments made by us under this
agreement amounted to US$274.5 million. This agreement expires
in December 2093 or upon liquidation of Ocensa.
In
December 1995, we leased the Porvenir and Miralflores terminals to
Ocensa. Pursuant to the terms of the agreement we receive monthly
payments of approximately US4590,000 plus applicable taxes. The
duration of the agreement is indefinite.
In
November 1996, we leased the Cravo Norte port to
Ocensa. Pursuant to the terms of the agreement we receive monthly
payments of US$25,000, plus applicable taxes. The duration of this
agreement is indefinite.
99
In
September 1999, we entered into a joint operation agreement for the TLU-3
Coveñas buoy with Ocensa, ODC and the Cravo Norte joint
venture. Pursuant to the terms of the agreement we are required to
make monthly payments of a fixed amount of US$75,000 plus a variable amount
depending of the volumes exported through the buoy. There have not
been variable payments in the last three years. The duration of this
agreement is indefinite.
In
December 1999, we entered into an operation and maintenance agreement for
the Porvenir, Miralflores and Vasconia pumping stations. Pursuant to
the terms of the agreement, we receive monthly payments of approximately
US$349,000 plus applicable taxes and variable costs. This agreement
expires on December 1, 2010.
In
December 2004 we entered into a natural gas supply
agreement. Pursuant to the terms of the agreement, we receive
variable monthly payments based on the volumes of natural gas delivered and a
fixed tariff. In June 2008, this contract was renewed for an
additional two years. During 2009, we received monthly payments of
approximately US$445,142 under this contract.
Oleoducto
de Colombia S.A. or ODC
We
entered into the following agreements with ODC, a company where we have a 43.85%
equity interest:
In
July 1992, we entered into a take-and-pay agreement for the transportation
of hydrocarbons. Pursuant to the agreement, we must pay a previously
agreed tariff over the volume of hydrocarbons transported. The
duration of this agreement is indefinite.
In
August 1992, we entered into an operation and maintenance agreement for the
Vasconia and Coveñas terminals. Pursuant to the terms of the
agreement, ODC is required to make monthly payments amounting of approximately
US$1.1 million per year plus any other expenses incurred by us in the
performance of the agreement, including a variable surcharge between 5% and 12%
on such expenses, plus any applicable taxes. The duration of this
agreement is indefinite.
In
July 2006, we entered into an operation and maintenance agreement for the
Caucasia Station and the Vasconia-Coveñas pipeline system. Pursuant
to the terms of the agreement, ODC is required to make monthly payments of
US$508,500 per year, plus any other expenses incurred by us in the performance
of the agreement, including a variable surcharge of between 5% and 12% on such
expenses, plus any applicable taxes. The duration of this agreement
is indefinite.
In
March 2007, we entered into a services agreement to guarantee the
protection and safety of the Cusiana-Coveñas and Vasconia-Coveñas pipeline
systems. Under the terms of the agreement, ODC must pay us
Ps$51 million per year. This agreement expires in
March 2011.
Reficar
In
conjunction with our transfer of Reficar’s assets in April 2007, we entered into
a maintenance and administration agreement with Reficar, which we wholly own as
of May 2009. Pursuant to the terms of the agreement, we provide them
with maintenance and administration services and Reficar pays us a monthly fee
equal to Ps$2.9 billion and a variable annual fee that may not exceed
Ps$6.96 billion. This agreement expires in April 2011 and may be
extended for additional one-year periods until Reficar’s upgrade and
modernization is completed.
Also, as
part of the transfer, we extended a ten-month commercial offer to Reficar for
the supply of crude oil. The commercial offer was renewed in January
2010 for an additional six-month period. Pursuant to the terms of the
offer, Reficar has the option to purchase from us up to 85 thousand bpd of crude
oil from our Caño Limón, Vasconia Blend, Ayacucho Blend, Cusiana and Castilla
production. As we continue to operate Reficar, our operations
committee evaluates and decides monthly the refinery’s crude oil mix needs
including the need for foreign crudes which we import from West Africa, the
North Sea and the Caribbean. The purchase price for the delivered
volumes is equal to an international benchmark index, subject to certain
adjustments. At April 31, 2010, we had received aggregate payments of
approximately Ps$1.31 billion for the supplied amounts.
100
Oleoducto
de los Llanos Orientales or ODL
We
entered into two ship-or-pay agreements with ODL, a company where we have a 65%
equity interest.
The first
agreement was entered into in March 2009 and establishes a financing tariff
which will be used to pay ODL’s indebtedness to the Grupo Aval for five
years. This financing tariff is collected through a trust fund, which
in turn is responsible for making the debt service payments to the Grupo
Aval.
The
second agreement was entered into in September 2009 and establishes a
financing tariff which will be used to securitize ODL’s indebtedness for seven
years.
Under
both of these contracts, ODL has committed itself to transport 30,000 barrels of
oil a day during the first phase of the ODL project (which entered in operation
in September 2009) and 60,000 barrels of oil a day upon commencement of the
second phase of the ODL project, which is expected to occurred in
April 2010.
Other
Agreements
We
entered into a supply agreement with Ecodiesel, a company in which we have a 50%
equity interest. This agreement is not yet operative and will begin
once the Ecodiesel plan starts with its activities. Pursuant to the
terms of the agreement, Ecodiesel must deliver and we must purchase specific
amounts of biodiesel each month. Payments vary depending on the
purchased volumes of biodiesel. This agreement expires on December
31, 2017.
In April
2002, we entered into a service agreement with Sociedad Colombiana de Servicios
Portuarios S.A., Serviport, a company in which we have a 49% equity
interest. Pursuant to the terms of the agreement, Serviport assists
us in our maritime operations in Coveñas port in exchange for which we pay
Serviport approximately US$155,000 per month. This agreement is renewable
annually.
Transactions
with other state-controlled entities
We are a
state-owned oil and gas company and operate in an industry regulated by the
Governmental authorities, agencies and other organizations.
In the
ordinary course of business we enter into transactions with other state-owned
entities which include but are not limited to the following:
|
|
·
|
sales
and purchase of goods, properties and other
assets;
|
|
|
·
|
rendering
and receiving services;
|
|
|
·
|
lease
of assets;
|
|
|
·
|
depositing
and borrowing money; and
|
|
|
·
|
use
of public utilities.
|
These
transactions are conducted in the ordinary course of business on terms
comparable to the terms of transactions with private parties. We have
also established procurement policies and approval processes for purchases of
products and services, which do not depend on whether the counterparties are
state-owned entities or not.
Loans
to our Directors and Executive Officers
We extend
loans to our employees as part of our compensation scheme, including our
executive officers. We do not extend loans to our
Directors. We grant loans for housing and
computers. Housing loans to our executive officers are approved by a
housing loans committee composed of the Human Resources and Strategy
vice-presidents, and the Compensation manager. Executive officers may
apply for housing loans after their third year in tenure. The
principal amount of the loan depends on the applicant’s tenure and cannot exceed
59 times the applicant’s monthly salary. We do not guarantee any
loans made by third parties to our executive officers or
employees. At December 31, 2009 the total amount of outstanding
loans granted to our executive officers was
Ps$896.8 million.
101
The
following table sets forth a description of the loans outstanding to our
executive officers at December 31, 2009.
|
Executive
Officer
|
Nature of the
Loan and Date
of
Disbursement
|
Principal
Amount of
the Loan
|
Amount
Outstanding at
December 31,
2009
|
Largest
Amount
Outstanding
during period
|
Termination
Date
|
Applicable
Interest
Rate
|
|||||||||||||
|
(Pesos
in millions)
|
|||||||||||||||||||
|
Javier
G. Gutiérrez
|
Housing,
June 2008
|
729 | 655.6 | 729 |
June 2028
|
UVR
|
|||||||||||||
|
Adriana
M. Echeverri
|
Housing,
June 2002
|
37.5 | 45.1 | 56.6 |
October,
2018
|
8%
|
|||||||||||||
|
Pedro
A. Rosales
|
Housing,
April 1997
and
September 2003
|
279.2 | 196.1 | 247.5 |
September 2018
|
UVR
|
|||||||||||||
|
7.C.
|
Interests
of Experts and Counsel
|
Not
applicable.
|
ITEM 8.
|
Financial
Information
|
|
8.A.
|
Consolidated
Statements and Other Financial
Information
|
Our
Annual Consolidated Financial Statements are filed as part of this annual report
starting on page F-1.
|
8.B.
|
Significant
Changes
|
There
have not been any significant changes since the date of our Annual Consolidated
Financial Statements for the year ended December 31, 2009.
|
ITEM 9.
|
The
Offer and Listing
|
|
9.A.
|
Offer
and Listing Details
|
American
Depositary Receipts
We
entered into a deposit agreement with JPMorgan Chase Bank, N.A., as depositary,
for the issuance of ADRs evidencing ADSs. Each of the ADSs will
represent 20 of our common shares or evidence of the right to receive 20 of our
common shares.
On
September 12, 2008, we submitted to the Securities and Exchange Commission
an application to register our company and to register and list our ADSs
evidenced by ADRs on the New York Stock Exchange or NYSE. Our ADSs
began trading on the NYSE under the symbol “EC” on September 18,
2008.
In
addition, on December 4, 2009, our ADSs began trading on the Lima Stock
Exchange under the symbol “EC”.
Common
Shares
In
November 2007, we conducted an initial public offering of 10.1% of our
common shares in Colombia. As a result of such offering, our
common shares trade on the BVC under the symbol ECOPETROL.
102
Price
Information
The
following table sets forth reported high and low closing prices in Pesos for our
shares and the reported average daily trading volume of our shares on the BVC
for the periods indicated. The table also sets forth information on
the trading price of our shares in Pesos and U.S. dollars, as well as the
average trading volume.
|
Shares
Traded on the BVC
|
||||||||||||||||||||
|
Pesos
per share
|
U.S.
dollars per share(1)
|
Average
|
||||||||||||||||||
|
High
|
Low
|
High
|
Low
|
number
of
shares
traded
per day
|
||||||||||||||||
|
2007
|
2,080 | 1,400 | 1.0187 | 0.6701 | 19,706,337 | |||||||||||||||
|
2008
|
2,895 | 1,575 | 1.6638 | 0.7647 | 21,063,806 | |||||||||||||||
|
2009
|
2,815 | 1,990 | 1.4707 | 0.7833 | 10,245,002 | |||||||||||||||
|
Most
recent quarters
|
||||||||||||||||||||
|
First
quarter 2008
|
2,095 | 1,575 | 1.1543 | 0.8003 | 18,601,066 | |||||||||||||||
|
Second
quarter 2008
|
2,895 | 2,095 | 1.6638 | 1.1417 | 25,198,314 | |||||||||||||||
|
Third
quarter 2008
|
2,730 | 2,390 | 1.5557 | 1.1640 | 19,266,325 | |||||||||||||||
|
Fourth
quarter 2008
|
2,600 | 1,825 | 1.1911 | 0.7647 | 21,214,848 | |||||||||||||||
|
First
quarter 2009
|
2,150 | 1,990 | 0.9384 | 0.7833 | 10,121,571 | |||||||||||||||
|
Second
quarter 2009
|
2,580 | 2,085 | 1.2363 | 0.8431 | 10,952,758 | |||||||||||||||
|
Third
quarter 2009
|
2,815 | 2,505 | 1.4208 | 1.1856 | 12,083,692 | |||||||||||||||
|
Fourth
quarter 2009
|
2,715 | 2,425 | 1.4707 | 1.1806 | 7,714,689 | |||||||||||||||
|
First
quarter 2010
|
2,710 | 2,370 | 1.4313 | 1.1958 | 7,013,937 | |||||||||||||||
|
Second
quarter 2010
|
2,790 | 2,630 | 1.4634 | 1.3035 | 6,314,608 | |||||||||||||||
|
Most
recent six months
|
||||||||||||||||||||
|
January 2010
|
2,495 | 2,370 | 1.2544 | 1.1958 | 6,395,938 | |||||||||||||||
|
February 2010
|
2,600 | 2,405 | 1.3508 | 1.2042 | 7,179,267 | |||||||||||||||
|
March 2010
|
2,710 | 2,560 | 1.4313 | 1.3248 | 7,380,692 | |||||||||||||||
|
April 2010
|
2,785 | 2,680 | 1.4338 | 1.3799 | 7,269,191 | |||||||||||||||
|
May 2010
|
2,790 | 2,630 | 1.4304 | 1.3035 | 8,342,527 | |||||||||||||||
|
June 2010
|
2,775 | 2,685 | 1.4634 | 1.3658 | 3,424,285 | |||||||||||||||
|
(1)
|
U.S.
dollars per common share translated at the Representative Market Rate for
each period.
|
The
following table sets forth reported high and low closing prices in U.S. Dollars
for our ADRs and the reported average daily trading volume of our ADRs on the
NYSE for the periods indicated. The table also sets forth information
on the trading price of our ADRs in U.S. dollars, as well as the average trading
volume.
|
ADRs
Traded on NYSE
|
||||||||||||
|
U.S.
dollars per share(1)
|
Average
number of
|
|||||||||||
|
High
|
Low
|
shares
traded per day
|
||||||||||
|
2008
|
27.25 | 15.04 | 42,074 | |||||||||
|
2009
|
29.99 | 15.31 | 48,289 | |||||||||
|
Most
recent quarters
|
||||||||||||
|
Third
quarter 2008
|
27.25 | 23.52 | 120,235 | |||||||||
|
Fourth
quarter 2008
|
24.50 | 15.04 | 31,219 | |||||||||
|
First
quarter 2009
|
19.50 | 15.31 | 42,277 | |||||||||
|
Second
quarter 2009
|
24.89 | 17.24 | 47,985 | |||||||||
|
Third
quarter 2009
|
28.77 | 23.64 | 48,341 | |||||||||
|
Fourth
quarter 2009
|
29.99 | 23.96 | 54,960 | |||||||||
|
First
quarter 2010
|
28.73 | 23.60 | 64,272 | |||||||||
|
Second
quarter 2010
|
29.58 | 26.00 | 65,182 | |||||||||
103
|
ADRs
Traded on NYSE
|
||||||||||||
|
U.S.
dollars per share(1)
|
Average
number of
|
|||||||||||
|
High
|
Low
|
shares
traded per day
|
||||||||||
|
Most
recent six months
|
||||||||||||
|
January 2010
|
25.64 | 23.60 | 72,847 | |||||||||
|
February 2010
|
27.09 | 23.95 | 61,590 | |||||||||
|
March 2010
|
28.73 | 26.98 | 59,521 | |||||||||
|
April 2010
|
28.78 | 27.26 | 50,697 | |||||||||
|
May 2010
|
28.43 | 26.00 | 82,833 | |||||||||
|
June 2010
|
29.58 | 26.85 | 62,818 | |||||||||
|
(1)
|
Each
ADR represents the right to receive 20 of our common
shares.
|
The
following table sets forth reported high and low closing prices in U.S. Dollars
for our ADRs and the reported average daily trading volume of our ADRs on the
Lima Stock Exchange for the periods indicated. The table also sets
forth information on the trading price of our ADRs in U.S. dollars, as well as
the average trading volume.
|
ADRs
Traded on Lima Stock Exchange
|
||||||||||||
|
U.S.
dollars per share(1)
|
Average
number of
|
|||||||||||
|
High
|
Low
|
shares
traded per day
|
||||||||||
|
2009
|
25.5 | 25.0 | 578 | |||||||||
|
Most
recent quarters
|
||||||||||||
|
Fourth
quarter 2009
|
25.5 | 25.0 | 578 | |||||||||
|
First
quarter 2010
|
28.3 | 23.8 | 302 | |||||||||
|
Second
quarter 2010
|
29.0 | 27.2 | 179 | |||||||||
|
Most
recent six months
|
||||||||||||
|
January 2010
|
25.5 | 23.8 | 525 | |||||||||
|
February 2010
|
26.2 | 26.2 | 112 | |||||||||
|
March 2010
|
28.3 | 28.0 | 175 | |||||||||
|
April 2010
|
27.2 | 27.2 | 200 | |||||||||
|
May 2010
|
27.4 | 27.4 | 50 | |||||||||
|
June 2010
|
29.0 | 29.0 | 288 | |||||||||
|
(1)
|
Each
ADR represents the right to receive 20 of our common
shares.
|
|
9.B.
|
Plan
of Distribution
|
Not
applicable.
|
9.C.
|
Markets
|
Bolsa
de Valores de Colombia – BVC
The BVC
began operations in 2001 as a result of the merger of the Bogotá, Medellín and
Occidental Stock Exchanges, the largest exchanges in Colombia. The
BVC is the largest stock exchange in Colombia for trading securities and
derivatives. The BVC has over 500 shareholders and is a member of the
World Federation of Exchanges and the Federación Iberoamericana de
Bolsas.
The BVC
is the only exchange where our common shares trade in Colombia. The
table below sets forth the reported aggregate market capitalization of the BVC,
as of December 31, 2009.
|
Aggregate
Market Capitalization on BVC
|
||||||||
|
Market
Capitalization
|
Market
Capitalization
|
|||||||
|
(Ps$
in billions)
|
(US$
in billions)(1)
|
|||||||
|
December 31,
2009
|
287,082 | 140.44 | ||||||
|
(1)
|
Representative
Market Rate at December 31,
2009.
|
104
There are
three basic indexes that measure the BVC’s performance. The principal
and most important is the IGBC. The IGBC is calculated on the price
variation of the stock of the companies with the highest capitalization and
highest trading volumes.
Another
index used to measure the performance of the BVC, is the COLCAP. The
COLCAP includes the price variations of the 20 companies having the highest
trading volumes in the BVC, where the adjusted market capitalization of each
company determines its weighted value.
The
COL20, an index measuring the performance of the BVC, was introduced in
2008. The COL20 measures the liquidity of the 20 stocks having the
highest trading volumes in the BVC, which in turn determines their weight on the
index.
New
York Stock Exchange
Since
September 18, 2008, our ADRs have been trading on the New York Stock
Exchange as a result of our ADR listing. The average traded volume of
our ADRs has increased since we began the program.
Lima
Stock Exchange
Since
December 4, 2009, our ADRs have been trading on the Lima Stock Exchange as
a result of our ADR listing in that exchange.
Transfer
and Registration of Shares
In
general, the following transfers do not need to be effected through the
BVC: transfers between shareholders having the same beneficial owner;
transfers of shares owned by financial institutions that are in process of
liquidation under the control and supervision of the Superintendency of Finance;
repurchase of shares; transfers of shares made by the Nation; transfers of
shares issued abroad by Colombian companies, provided they take place outside
Colombia; transfers of shares issued abroad by foreign companies, provided they
take place outside Colombia; and any other transaction authorized to be effected
outside the BVC by the Superintendence of Finance.
Pursuant
to Colombian law, purchases of 25% or more of the outstanding shares with voting
rights (including ADSs) of a listed company, or the purchase of 5% or more of
the outstanding shares with voting rights (including ADSs) by a shareholder or
group shareholders beneficially owning 25% or more of the outstanding capital
stock of a listed company, should be made pursuant to public tender offer
rules.
Certain
exemptions apply to tender offer rules including, transfers made through an
auction on the BVC as a result of privatization procedures; transfers authorized
in writing by 100% of the shareholders; repurchase of shares by the issuer in
open market transactions; transfers by virtue of law including donations,
liquidation processes, judicial decisions, among others. In any case,
the Superintendency of Finance must be notified of any transfer that is deemed
to be an hecho
relevante or a significant event, under Colombian law.
Under
Colombian law, shares may be traded either in physical form or electronic
form. Transfers of shares are subject to a registry system which
differs depending on whether the shares are evidenced by electronic form or
physical form. Transfers of shares evidenced by electronic
certificates must first be registered with Depósito Centralizado de
Valores or DECEVAL through the relevant stockbroker. DECEVAL’s
main purpose is to receive, safekeep and manage share certificates issued by
corporations in order to keep a record of the transactions undertaken over such
securities, including but not limited to transfers, pledges and
withdrawals. Accordingly, DECEVAL is not allowed to hold, invest or
otherwise use the securities held under its custody.
Transfer
of shares evidenced by electronic and physical certificates must be registered
on the Issuer’s stock ledger. Only those holders registered on the
stock ledger are recognized by us and third parties as
shareholders. Registration requires endorsement of the certificates
or a written instruction from the holder. In the case of electronic
certificates, DECEVAL notifies us regarding the transfer of shares after
registering it in its system.
105
Transfer
of shares do not give rise to any fee for us but they may be subject to certain
taxes, stamp duties or other governmental charges which the shareholder may be
required to pay.
|
9.D.
|
Selling
Shareholders
|
Not
applicable.
|
9.E.
|
Expenses
of the Issue
|
Not
applicable.
|
ITEM 10.
|
Additional
Information
|
|
10.A.
|
Share
Capital
|
Not
applicable.
|
10.B.
|
Memorandum
and Articles of Incorporation
|
Corporate
Purpose
Pursuant
to Article 4 of our by-laws, we may engage in the exploration, production,
refining, transportation, storage, distribution and commercialization of crude
oil and its by-products in Colombia and abroad. Our by-laws also
authorize us to perform activities for the exploration and production of crude
oil in areas that prior to January 1, 2004 were operated by us directly or
were subject to agreements subscribed by us; to directly or indirectly explore
and produce crude oil in areas assigned to us by the ANH; to directly or
indirectly explore and produce crude oil in areas assigned to us by a foreign
regulatory entity; to buy, sell, import, export, store, blend, or distribute
hydrocarbons and its by-products in Colombia or abroad; to undertake research
for developing and commercializing alternative energy sources; and in general,
to undertake any other activity instrumental or required to develop our
corporate purpose. Our corporate purpose includes administering and
managing all properties that were formerly part of the De Mares
concession.
Additionally,
pursuant to Article 5 of our by-laws, we may enter into all acts, contracts
and legal business and activities which may be required for us to adequately
fulfill our corporate purpose.
Directors
Our Board
of Directors is composed of nine members and is responsible for, among other
things, establishing our general business policies. The members of
the Board of Directors are elected at the annual shareholders’ meeting for
one-year terms through an electoral quota voting system (number of votes
required to fill each position is calculated by dividing the number of possible
votes by the number of open board positions). Pursuant to our
by-laws, the Board of Directors’ positions are filled either by person or by
position. Currently, we have three members appointed by their
position: the Minister of Finance, the Minister of Mines and Energy
and the Director of the National Planning Agency. Our Directors were
elected on March 25, 2010. Our executive officers are appointed by
our Board of Directors.
Pursuant
to our by-laws, our Board of Directors has four (4) committees (Audit Committee,
Corporate Governance Committee, Nomination and Compensation Committee and
Business Committee), which establish guidelines, set specific actions and
evaluate and submit proposals designed to improve performances in the areas
under their supervision and control. These committees are comprised
of members of the Board of Directors whom are appointed by the
Board.
According
to Colombian law, Directors must be elected in accordance with a proportional
representation system similar to cumulative voting (through an electoral quota
voting system). Directors may be removed without cause at any moment
by a majority of the shareholders present at a general shareholders’
meeting.
106
Under
Colombian law, a director or executive officer must disclose any transaction
involving a conflict of interest to the general shareholders’
meeting. The general shareholders’ meeting may approve or reject the
transaction giving rise to the conflict with the vote of the majority of the
shares present at the shareholders’ meeting. If the director or
executive officer with a conflict is a shareholder, his or her vote will be
excluded.
The
compensation of our Directors is set annually and exclusively by the general
shareholders’ meeting. Directors are compensated for attending board
meetings and committee meetings. A Board meeting requires a quorum of
at least five members and decisions are approved with a majority of the members
present.
Neither
our by-laws nor our code of corporate governance provide a minimum retirement
age for our Directors. Under our by-laws there is no requirement for
a person to have a minimum number of shares to be considered as a
director. Colombian law provides that Directors willing to sell or
purchase shares in our company require a prior authorization of the Board of
Directors. Colombian law does not impose any limitation as to the
number of shares that may be acquired by a director.
Colombian
law prohibits Directors from receiving corporate loans.
In
compliance with our corporate governance best practices, below is a summary of
the number of our shares held by each respective Board Member as of
December 31, 2009:
|
Board of Directors Member Shares
|
||||
|
Board Member
|
No. of Shares
for period
ending on
December 31,
2009
|
|||
|
Minister
of Mines and Energy
|
1,000 | |||
|
Minister
of Finance and Public Credit
|
0 | |||
|
National
Director of Planning
|
0 | |||
|
Fabio
Echeverri Correa
|
0 | |||
|
Ignacio
Sanín Bernal
|
0 | |||
|
Maria
E. Velasquez Restrepo
|
0 | |||
|
Joaquin
Moreno Uribe
|
50,000 | |||
|
German
Bernal Gutierrez
|
0 | |||
|
Mauricio
Cárdenas Santamaria
|
2,000 | |||
Preference
Rights and Restrictions Attaching to Our Shares
We have
only one class of stock without special rights or restrictions. Our
shareholders do not have any type of preemptive rights.
Under
Colombian law, our shareholders have the following economic privileges and
voting rights:
|
|
·
|
To
participate and vote in the decisions of the general shareholders
meeting;
|
|
|
·
|
To
receive dividends based on the financial performance of the Company in
proportion to their share
ownership;
|
|
|
·
|
To
transfer and sell shares according to our by-laws and Colombian
law;
|
|
|
·
|
To
inspect corporate books and records 15 business days prior to the ordinary
shareholders’ meeting where the year-end financial statements are to be
approved;
|
|
|
·
|
Upon
liquidation, to receive a proportional amount of the corporate assets
after the payment of external liabilities;
and
|
107
|
|
·
|
To
sell the shares, known as derecho de retiro, if a
corporate restructuring affects the economic or voting rights of the
shareholders in the terms and conditions established under Colombian
law.
|
Our
by-laws and corporate governance code provide additional rights to our minority
shareholders. These rights include:
|
|
·
|
Sale of
Assets. For a ten-year period counted from the date of
adoption of our by-laws or until the Nation loses its status as majority
shareholder, the Nation guarantees that any sale of 15% or more of our
assets requires the approval of the general shareholders’ meeting and that
the Nation would only be allowed to vote its shares in favor of the
proposal if 2% or more of our minority shareholders accept the
proposal.
|
|
|
·
|
Candidate
List. Pursuant to our by-laws and law 1118 of 2006, the
Nation will include in its candidate list for election of members of the
Board of Directors one member selected by the departments that produce
hydrocarbons. In addition, pursuant to the declaration of the
Nation dated July 26, 2007, the Nation will include in its candidate
list for election of members of the Board of Directors one member selected
by the ten largest minority shareholders. The minority
shareholders’ right to select a candidate loses its effect when minority
shareholders, according to their share participation, name a member to our
Board of Directors.
|
|
|
·
|
Extraordinary
Meetings. Our by-laws and corporate governance code
provide that the entity exercising permanent control over Ecopetrol S.A.
must instruct the Company’s CEO or Statutory Auditor to call an
extraordinary meeting of the Company’s shareholders when so requested by a
or plurality of shareholders holding at least 5% of the total number of
shares outstanding. Such requests shall be made in writing and
must clearly indicate the purpose of the
meeting.
|
|
|
·
|
Office for the Attention of
Shareholders. We created an office for the attention of
shareholders, our specialized unit responsible for receiving complaints
from our shareholders. Pursuant to our by-laws, shareholders
holding at least 5% of the total number of shares outstanding may request
that the office for the attention of shareholders a special audit of the
following documents: the income statement; the proposal for the
distribution of profits; the report of the Board of Directors as to the
economic and financial status of our company; the report from our general
counsel as to the legal status of our company; and the report from the
independent auditors. Special audits cannot be made of
documents that contain scientific, technological or statistical
information of our company, or agreement that gives us competitive and
economic advantages over our competitors, or in respect of any document
related to intellectual property. Shareholders also have the
right to propose good corporate governance recommendations to the office
for the protection of investors.
|
|
|
·
|
Others. Pursuant
to our by-laws, shareholders holding at least 5% of the total number of
shares outstanding may propose recommendations to our Board of Directors
pertaining to the management of our company. Any shareholder
may file a written petition to our Board of Directors to investigate
corporate governance violations that the shareholder believes to have been
committed.
|
Amendments
to Rights and Restrictions to Shares
The
rights and restrictions given to our shareholders may only be modified through
an amendment to our by-laws. The general shareholders’ meeting has
full and exclusive authority to modify or amend our by-laws.
General
Shareholders’ Meeting
Shareholders’
meetings may be ordinary or extraordinary. Ordinary meetings will
take place in our legal domicile located in Bogota, Colombia, within the first
three months following the end of each fiscal year, on the day and at the time
set forth in the notice for the general shareholders’ meeting. The
call for the general shareholders’ meeting may be made electronically or by
written communication sent to each shareholder. In both cases the
call must be published in a newspaper of wide circulation 20 business days prior
to the date on which the meeting will take place.
108
In the
ordinary general shareholders’ meeting, our Board of Directors and the external
auditor are appointed and our annual financial statements, profit distribution,
audit and management reports and any other matter provided under applicable law
or our corporate by-laws are approved.
Extraordinary
meetings of shareholders may be called by our Board of Directors, by our
president or chief executive officer, by our external auditor, or by
shareholders holding at least 5% of the shares outstanding. Calls to
extraordinary meetings should be made at least eight days prior to the date of
the meeting, and may be made electronically or by written communication to each
shareholder or be published in a newspaper of wide circulation. The
meeting notice must specify the agenda for the meeting.
The
required quorum for both ordinary and extraordinary meetings is 50% plus one
share entitled to vote and decisions are approved with a majority of the members
present. This quorum is exempted in the case of “second-call
meetings,” which may take place when a meeting fails to obtain the required
quorum and is called within a period between 10 business days and 30 business
days from the first date, in which case decisions may be adopted by a majority
of the shares present regardless of the number represented.
Unless
Colombian law requires a super majority, decisions made at the shareholders’
meeting must be approved by a majority of the shares
present. Colombian law requires super majorities in the following
cases:
|
|
·
|
the
vote of at least 70% of the shares present and entitled to vote at the
ordinary shareholders’ meeting is required to approve the issuance of
stock not subject to preemptive
rights;
|
|
|
·
|
the
vote of at least 78% of the shares represented entitled to vote is
required to approve the distribution of less than 50% of the annual net
profits. If the sum of all legal reserves (statutory, legal and
optional) exceeds the amount of the outstanding capital, the Company must
distribute at least 70% of the annual net
profits;
|
|
|
·
|
the
vote of at least 80% of the shares represented is required to approve the
payment of dividends in shares; and
|
|
|
·
|
the
vote of 100% of the outstanding and issued shares is required to replace a
vacancy on the Board of Directors without applying the electoral quotient
system.
|
Shareholders
may be represented by proxies provided that the proxy: (i) is in
writing (faxes and electronic documents are valid), (ii) specifies the name
of the representative, (iii) specifies the date or time of the meeting for
which the proxy is given and (iv) other specified by the applicable
law. Proxies granted abroad do not require legalization or an
apostille.
During
our annual shareholders’ meeting, our employees and Directors are only allowed
to represent their own shares.
Limitations
to the Rights to Hold Securities
There are
no limitations in our by-laws or Colombian law on the rights of Colombian
residents or foreign investors to own the shares of our company, or on the right
to hold or exercise voting rights with respect to those shares.
Restrictions
on Change of Control Mergers, Acquisitions or Corporate Restructuring of the
Company
Under
Colombian law and our by-laws, the general shareholders’ meeting has full and
exclusive authority to approve any corporate restructuring including, any
mergers, acquisitions or spin-offs. Corporate restructurings are also
subject to the requirement that the Nation must hold a minimum of 80% of our
common stock at all times. While Law 1118 of 2006 is in effect, there
cannot be any restructuring that results in a change of control of our
company.
109
Ownership
Threshold Requiring Public Disclosure
Our
corporate governance code provides that we must disclose periodically in our web
page, the names of the shareholders of our company, indicating at least, the
twenty shareholders with the highest number of shares. We must also
disclose this information to the Superintendency of Finance at the end of each
fiscal year.
Colombian
securities regulations set forth the obligation to disclose any material event
or hecho
relevante. Any transfer of shares equal or greater than 5% of
our capital stock or any person acquiring a percentage of shares that would make
him the beneficial owner of 5% or more of our capital stock, is a material
event, and therefore, must be disclosed to the Superintendency of
Finance.
Changes
in the Capital of the Company
There are
no conditions in our by-laws governing changes in our capital stock that are
more stringent than those required under Colombian law, with the exception that
the Nation must hold a minimum of 80% of our capital stock at all
times.
|
10.C.
|
Material
Contracts
|
Transportation
Agreement between Ecopetrol and ECOGAS/TGI
On
October 6, 2006, we entered into a natural gas transportation agreement
with Ecogás for the transportation of natural gas from the Ballena terminal
located in the La Guajira fields to the Barrancabermeja terminal. The
agreement is set to expire in November 30, 2012. Pursuant to the
terms of the agreement, Ecogás will transport natural gas produced by us upon
our request, up to the available capacity set forth in the
agreement. According to the agreement, Ecogás should undertake two
overhauling stages to expand the pipeline’s capacity. After its first
capacity expansion completed in June 2007 the pipeline’s capacity was
increased to 190,000 thousand cfpd expanding our transportation capacity to
134,066 thousand cfpd. Once Ecogás executes the second expansion
to 262,000 thousand cfpd we will have transportation availability of up to
175,000 thousand cfpd.
In
February 27, 2007, Ecogás transferred the rights and obligations under this
agreement to Transportadora de Gas del Interior S.A. ESP, currently operating as
Transportadora de Gas Internacional S.A. ESP or TGI.
Pursuant
to the terms of the agreement, we pay TGI a regulated transportation tariff
composed of a fixed fee, a variable fee depending on transported volumes and an
administration, operation and maintenance fee. Payments for
transported volume are made in Pesos. During 2009, we paid Ps$132.578 billion for the transportation services provided
to us by TGI and at March 31, 2010, we had
paid TGI Ps$21.883 billion.
Please
see Exhibit 4.2 to this annual report for a full description of this
agreement.
Transportation
Agreement between Ecopetrol and Ocensa
On
March 31, 1995 we entered into a crude oil transportation agreement with
Ocensa. Pursuant to the terms of the agreement, Ocensa agreed to
transport this pipeline our production of crude oil from the Cusiana and
Cupiagua fields.
We are
required to make monthly payments that vary depending on the volumes shipped
through the Ocensa pipeline and a tariff calculated by Ocensa based on its
financial projections and its expected transportation
volume. Payments to Ocensa are made in cash in accordance with the
agreement. In 2007, payments made by us to Ocensa under this
agreement amounted to US$245.7 million, to US$276.5 million in 2008
and to US$ 274.5 million in 2009.
This
agreement expires in December 2093 or upon liquidation of
Ocensa.
Please
refer to Exhibit 4.1 to this annual report for a full description of this
agreement.
110
|
10.D.
|
Exchange
Controls
|
Payments
in foreign currency with respect to certain foreign exchange transactions
including international investments between Colombian residents and
non-Colombian residents must by law be conducted through the commercial exchange
market. Therefore, any foreign currency income or expenses under the
ADRs must be channeled through that market. Transactions conducted
through the commercial exchange market are made at market rates freely
negotiated with authorized intermediaries (banks, financial corporations and
others).
Colombian
law provides that the Colombian Central Bank may intervene in the foreign
exchange market if the value of the Colombian Peso experiences significant
volatility. Likewise the Colombian government introduces from time to
time amendments to the International Investment Statute. For example,
on May 23, 2007, the Colombian government introduced a new deposit
requirement related to portfolio investments made by foreign
investors. Decrees 1801 of 2007 and 1888 and 3264 of 2008 required
foreign investors making portfolio investments in securities other than shares
or mandatory convertible bonds to make a non-interest bearing deposit with the
Colombian Central Bank for a term of six months from the date of such
investment, for an amount equivalent to 40% of the value of investment converted
at the representative market rate then in effect. Nevertheless, since
June 29, 2007, when the Colombian government issued Decree 2466 of 2007
setting forth that portfolio investments made pursuant to ADR programs were
exempt from the deposit requirement, ADRs were not affected by the requirement
of Decree 1801 of 2007. As a result, neither Ecopetrol nor the
purchasers of ADRs had to comply with the 40% deposit
requirement. Furthermore, in 2008, pursuant to Decree 3913 of
October 8, 2008, the Colombian government eliminated the 40% deposit
requirement for all investors. See Item 3D — “Risk Factors —
Risks relating to the ADRs”.
The
Colombian Central Bank may also limit the remittance of dividends and/or
investments of foreign currency received by Colombian residents whenever the
international reserves fall below an amount equal to three months of
imports. Since the creation of the current foreign exchange regime in
1991, the Colombian Central Bank has never taken such
action. However, we cannot assure you that the Colombian Central Bank
will not intervene in the future. See Item 3D — “Risk Factors —
Risks Relating to Colombia”.
Registration
of foreign investment represented in underlying shares
Colombia’s
International Investment Statute, which has been amended from time to time
through related decrees and regulations, regulates the manner in which
non-Colombian resident entities and individuals can invest in Colombia and
participate in the Colombian securities markets. Among other
requirements, the statute mandates registration of certain foreign exchange
transactions with the Colombian Central Bank and specifies procedures to
authorize and administer certain types of foreign investments. Additionally, the pertainent information must be updated yearly.
Foreign
investors who acquire ADRs are not required to register before Colombian
authorities. Holders of ADRs who wish to withdraw the underlying
shares will have to comply with certain registration and reporting procedures,
among other requirements. Under these foreign investment regulations,
the failure of a foreign investor to report or register with the Colombian
Central Bank foreign exchange transactions relating to investments in Colombia
on a timely basis may prevent the investor from obtaining remittance rights,
constitute an exchange control infraction and result in a fine.
Holders
of ADRs will benefit from the registration to be obtained by the custodian for
our common shares underlying the ADRs in Colombia, which permits the custodian
to convert dividends and other distributions with respect to the common shares
into foreign currency and remit the proceeds abroad. If investors in
ADRs choose to surrender their ADRs and withdraw common shares, they would have
to register their investment in the common shares as a foreign direct
investment, provided that the investor does not own a portfolio of investments
in Colombia; or as a portfolio investment, in the event the investor delivers
such shares to a registered foreign capital investment
fund. Non-Colombian residents cannot directly hold portfolio
investments in Colombia, but are able to do so through a registered foreign
capital investment fund. Holders of ADRs that surrender their ADRs
may also deliver the underlying common shares to a foreign investment capital
fund authorized to operate in Colombia.
111
In
obtaining its own foreign investment registration, an investor who surrendered
its ADRs and withdrew common shares may incur expenses and/or suffer delays in
the application process. Investors would only be allowed to transfer
dividends abroad or transfer funds received as distributions relating to our
common shares after their foreign investment registration procedure with the
Colombian Central Bank has been completed. In addition, the
depositary’s foreign investment registration may also be adversely affected by
future legislative changes, but its rights to transfer abroad dividends or
profits arising from distributions relating to our common shares must be
maintained, according to Colombian law and foreign investment treaties entered
into by Colombia, except when the Colombian international reserves fall below an
amount equivalent to three months worth of imports.
|
10.E.
|
Taxation
|
Colombian
Tax Considerations
The
following is a description of the Colombian tax considerations for investments
in common shares in Colombia or for the purchase of ADSs in a foreign securities
market. This description is based on the applicable law in effect as
of the date of this annual report. Prospective purchasers of common
shares or ADSs should consult their own tax advisors for a detailed analysis of
the tax consequences resulting from the acquisition, ownership and disposition
of common shares or ADSs.
General
Considerations
Income
tax and complementary taxes are considered a single tax with two
components: income and sporadic earnings. Taxes are
accrued on a calendar basis.
Pursuant
to the Colombian Tax Code, Colombian corporations and public entities are
subject to Colombian taxes on income earned in Colombia and worldwide; while
foreign entities are liable only for income earned in Colombia.
Tax
Treatment of a Non-Resident of Colombia who Purchases an ADR in a Foreign
Securities Market
Dividends
In
general, dividends paid to foreign companies or other foreign entities,
non-Colombian residents or successors of non-Colombian residents are subject to
Colombian income tax.
To avoid
double taxation, corporate and branch profits are taxed at the corporate or
branch level. If the accounting earnings and profits of a Colombian
corporation exceed the tax profits subject to income tax, the excess is subject
to income tax at the shareholder level. If the shareholder is a
non-resident, the applicable tax rate is 33%.
Therefore,
provided all distributions, including the payment of dividends, are made by
Ecopetrol to non-resident holders of ADRs through the Depositary, such payments
will be exempted from income, withholding and remittance tax in
Colombia. This exception would not apply in the case of distributions
paid out of non-taxed earnings made by Ecopetrol which would be subject to
income tax at the 33% rate.
Dividends
paid to foreign investment capital funds are subject to a 33% withholding income
tax.
Taxation
on Capital Gains for the sale of ADRs
Under
Colombian law, capital from the sale of ADRs is not subject to income tax in
Colombia as they are considered foreign sourced income.
Similarly,
capital gains earned by foreign capital investment funds arising from the
purchase or sale of securities are not subject to income taxes in
Colombia. The remittance of capital gains to the Depositary is not
subject to income tax in Colombia.
112
Tax
Treatment in Colombia of Non-Residents who Purchase Ecopetrol’s shares in
Colombia’s securities market
Dividends
Dividends
paid to foreign companies, other foreign entities, non-Colombian residents or
successors of non-Colombian residents are subject to Colombian income
tax.
To avoid
double taxation, corporate and branch profits are taxed at the corporate or
branch level. If the accounting earnings and profits of a Colombian
corporation exceed the tax profits subject to income tax, the excess is subject
to income tax at the shareholder level. If the shareholder is a
non-Colombian resident, the applicable tax rate is 33%.
Therefore,
all distributions, including the payment of dividends, made by Ecopetrol to
shareholders not resident in Colombia, will be exempted from income, withholding
and remittance taxes. This exception would not apply in the case of
distributions paid out of non-taxed earnings made by Ecopetrol which would be
subject to the 33% income tax rate.
Taxation
on Capital Gains for the sale of shares
Capital
gains obtained in the sale of shares listed on the BVC and owned by the same
beneficial owner, are not subject to income tax in Colombia, provided that the
shares sold during the taxable year do not represent more than 10% of the
outstanding shares of the listed company. However, a seller of shares
must file an income tax return for each transaction involving a sale of shares
within the month following the sale, even when such sale is not subject to any
tax.
Tax
treatment by Non-Residents who purchase Ecopetrol’s shares in the BVC market and
exchange them for ADRs
Dividends
Dividends
paid to ADRs are not subject to income, withholding or remittance
taxes. In the event Ecopetrol distributes dividends from such taxes,
the dividends are paid to the Depositary of ADRs. In any case, the
Depositary of ADRs is only subject to income tax or complementary taxes and
non-taxed earnings. The dividend payments would be taxed at the 33%
rate.
Material
U.S. Federal Income Tax Consequences
The
following discussion is a summary of the material U.S. federal income tax
consequences of acquiring, holding and disposing of our common shares or
ADSs. This discussion applies only to beneficial owners of common
shares or ADSs that are “U.S. Holders,” as defined below, that hold the common
shares or ADSs as “capital assets” (generally, property held for
investment). This discussion is based on the U.S. Internal Revenue
Code of 1986, as amended, or the Code, its legislative history, existing final,
temporary and proposed Treasury Regulations, administrative pronouncements by
the U.S. Internal Revenue Service, or IRS, and judicial decisions, all as
currently in effect and all of which are subject to change (possibly on a
retroactive basis) and to different interpretations.
This
discussion is also based in part on the representations of the Depositary and
the assumption that each obligation in the deposit agreement and any related
agreement will be performed in accordance with its terms.
This
discussion does not purport to address all U.S. federal income tax consequences
that may be relevant to a particular U.S. Holder and you are urged to consult
your own independent tax advisor regarding your specific tax
situation. The discussion does not address the tax consequences that
may be relevant to U.S. Holders in special tax situations, including, for
example:
|
|
·
|
insurance
companies;
|
|
|
·
|
tax-exempt
organizations;
|
113
|
|
·
|
broker-dealers;
|
|
|
·
|
traders
in securities that elect to mark to
market;
|
|
|
·
|
banks
or other financial institutions;
|
|
|
·
|
partnerships
or other pass-through entities;
|
|
|
·
|
persons
whose functional currency for U.S. federal income tax purposes is not the
U.S. dollar;
|
|
|
·
|
real
estate investment trusts, regulated investment companies or grantor
trusts;
|
|
|
·
|
persons
that received our common stock or ADSs as compensation for the performance
of services;
|
|
|
·
|
U.S.
expatriates;
|
|
|
·
|
persons
that hold our common shares or ADSs as part of a hedge, straddle,
conversion or other integrated transaction;
or
|
|
|
·
|
persons
that own, directly, indirectly or constructively, 10% or more of the total
combined voting power of our
shares.
|
Except
where specifically described below, this discussion assumes that we are not a
passive foreign investment company, or PFIC, for U.S. federal income tax
purposes. See “—Passive Foreign Investment
Companies.” Further, this discussion does not address U.S. federal
estate and gift tax or the alternative minimum tax consequences of holding
common shares or ADSs or the indirect consequences to holders of equity
interests in partnerships (or any other entity treated as a partnership for U.S.
federal income tax purposes) that own our common shares or ADSs. In
addition, this discussion does not address the state, local and non-U.S. tax
consequences of holding our common shares or ADSs.
You
should consult your own tax advisor regarding the U.S. federal, state and local,
as well as non-U.S., income and other tax consequences of purchasing, owning and
disposing of our common shares or ADSs in your particular
circumstances.
You are a
“U.S. Holder” if you are a beneficial owner of common shares or ADSs and you are
for U.S. federal income tax purposes:
|
|
·
|
an
individual, who is a citizen or resident of the United
States;
|
|
|
·
|
a
corporation, or any other entity taxable as a corporation, created or
organized in or under the laws of the United States, any state thereof or
the District of Colombia;
|
|
|
·
|
an
estate, the income of which is subject to U.S. federal income tax
regardless of its source; or
|
|
|
·
|
a
trust if (i) a court within the United States is able to exercise
primary supervision over its administration and one or more U.S. persons
have the authority to control all substantial decisions of the trust or
(ii) if the trust has a valid election in effect under current U.S.
Treasury regulations to be treated as a U.S.
person.
|
If a
partnership holds common shares or ADSs the tax treatment of a partner will
generally depend upon the status of the partner and upon the activities of the
partnership. A partner of a partnership considering the purchase of
our common shares or ADSs should consult its own independent tax advisor
regarding the U.S. federal income tax consequences of investing in our common
shares or ADSs through a partnership.
For U.S.
federal income tax purposes, if you are a holder of ADSs, you generally will be
treated as the owner of our common stock represented by such ADSs.
114
Distributions
on Common Shares or ADSs
If you
are a U.S. Holder, for U.S. federal income tax purposes, distributions made by
us of cash or property with respect to common shares or ADSs generally will be
treated as a dividend for U.S. federal income tax purposes to the extent paid
out of our current or accumulated earnings and profits (as determined under U.S.
federal income tax principles). A U.S. Holder of common shares or
ADSs generally will be taxed on such dividend as ordinary
income. Distributions in excess of our current or accumulated
earnings and profits will be treated first as a tax-free return of capital
reducing such U.S. Holder’s adjusted tax basis in the common shares or
ADSs. Any distribution in excess of such adjusted tax basis will be
treated as capital gain and will be either long-term or short-term capital gain
depending upon whether the U.S. Holder held the common shares or ADSs for more
than one year. Distributions of additional common shares or ADSs to
U.S. Holders that are part of a pro rata distribution to all of our shareholders
generally will not be subject to U.S. federal income tax. We do not
maintain calculations of our earnings and profits under U.S. federal income tax
principles, and, therefore, U.S. Holders should expect that any distributions
generally will be reported as dividends for U.S. federal income tax
purposes. As used below, the term “dividend” means a distribution
that constitutes a dividend for U.S. federal income tax purposes.
A U.S.
Holder will be entitled, subject to a number of complex limitations and
conditions, to claim a U.S. foreign tax credit in respect of any Colombian
income taxes withheld on dividends received on common shares or
ADSs. U.S. Holders who do not elect to claim a credit for any foreign
income taxes paid during the taxable year may instead claim a deduction in
respect of such Colombian income taxes provided the U.S. Holder elects to deduct
(rather than credit) all foreign income taxes for that
year. Dividends received with respect to the common shares or ADSs
will be treated as foreign source income, subject to various classifications and
other limitations. For the purposes of the U.S. foreign tax credit
limitations, the dividends paid with respect our common shares or ADSs should
generally constitute “passive category income”. The U.S. Treasury
Department has expressed concerns that parties to whom depositary shares such as
the ADSs are released may be taking actions that are inconsistent with the
claiming of foreign tax credits by U.S. Holders of such
ADSs. Accordingly, the analysis of the creditability of Colombian
income taxes described above could be affected by future actions that may be
taken by the U.S. Treasury Department. The rules relating to
computing foreign tax credits or deducting foreign income taxes are extremely
complex, and U.S. Holders are urged to consult their own independent tax
advisors regarding the availability of foreign tax credits with respect to any
Colombian income taxes withheld.
Dividends
paid by us generally will not be eligible for the “dividends received deduction”
available under the Code to certain U.S. corporate
shareholders. Also, dividends paid by us generally are not expected
to qualify for the preferential tax rates available to U.S. non-corporate
shareholders for certain “qualified dividend income”.
The
amount of any cash distribution paid in Pesos will be included in your gross
income in an amount equal to the U.S. dollar value of the distribution,
calculated by reference to the exchange rate in effect at the time the
distribution is actually or constructively received by the U.S. Holder, in the
case of our common shares, or by the depositary, in the case of ADSs, regardless
of whether the payment is in fact converted to U.S. dollars at that
time. A U.S. Holder should not recognize any foreign currency gain or
loss in respect of such distribution if such Pesos are converted into
U.S. dollars on the date they are received by the U.S. Holder, in the case
of our common shares, or by the depositary, in the case of ADSs. If
the Pesos are not converted into U.S. dollars on the date of receipt, however,
gain or loss may be recognized upon a subsequent sale or other disposition of
the Pesos. Such foreign currency gain or loss, if any, will be U.S.
source ordinary income or loss. U.S. Holders should consult with
their own independent tax advisors regarding the treatment of any foreign
currency gain or loss if any Pesos received as a dividend are not converted into
U.S. dollars on the date of receipt.
Sale,
Exchange or Other Taxable Dispositions of Common Shares or ADSs
A U.S.
Holder generally will recognize capital gain or loss upon the sale, exchange or
other taxable disposition of common shares or ADSs in an amount equal to the
difference between the amount realized on the sale, exchange or other taxable
disposition of the common shares or ADSs and the U.S. Holder’s adjusted tax
basis in the common shares or ADSs. Any gain or loss will be
long-term capital gain or loss if the common shares or ADSs have been held for
more than one year. Certain non-corporate U.S. Holders (including
individuals) may be eligible for preferential rates of U.S. federal income tax
in respect of long-term capital gains. The deductibility of capital
losses is subject to limitations under the Code.
115
If you
are a U.S. Holder of common shares or ADSs, the initial tax basis of your common
shares or ADSs will be the U.S. dollar value of the Peso-denominated purchase
price determined on the date of purchase. If the common shares or
ADSs are treated as traded on an “established securities market,” a cash basis
U.S. Holder, or, if it elects, an accrual basis U.S. Holder, will determine the
dollar value of the cost of such common shares or ADSs by translating the amount
paid at the spot rate of exchange on the settlement date of the
purchase. If you convert U.S. dollars to Pesos and immediately
use that currency to purchase common shares or ADSs, such conversion generally
will not result in taxable gain or loss to you.
With
respect to the sale or exchange of common shares or ADSs, the amount realized
generally will be the U.S. dollar value of the payment received determined on
(i) the date of receipt of payment in the case of a cash basis U.S. Holder
and (ii) the date of disposition in the case of an accrual basis U.S.
Holder. If the common shares or ADSs are treated as traded on an
“established securities market,” a cash basis taxpayer, or, if it elects, an
accrual basis taxpayer, will determine the U.S. dollar value of the amount
realized by translating the amount received at the spot rate of exchange on the
settlement date of the sale.
If a
Colombian income tax is withheld or otherwise imposed on the sale, exchange or
other taxable disposition of common shares or ADSs, the amount realized by a
U.S. Holder will include the gross amount of the proceeds of that sale or other
disposition before deduction of the Colombian income tax. Capital
gain or loss, if any, realized by a U.S. Holder on the sale, exchange or other
taxable disposition of common shares or ADSs generally will be treated as U.S.
source income or loss for U.S. foreign tax credit
purposes. Consequently, in the case of a disposition of a common
share or ADS that is subject to Colombian income tax imposed on the gain, the
U.S. Holder may not be able to benefit from the foreign tax credit for the
Colombian income tax (because the income or loss on the disposition would be
U.S. sourced), unless the U.S. Holder can apply the credit against U.S.
federal income tax payable on other income from foreign
sources. Alternatively, the U.S. Holder may take a deduction for the
Colombian income tax if it does not elect to claim a foreign tax credit for any
foreign income taxes paid or accrued during the taxable year.
Deposits
and withdrawals of common shares in exchange for ADSs will not result in the
realization of gain or loss for U.S. federal income tax purposes.
Passive
Foreign Investment Companies
Special
U.S. federal income tax rules apply to U.S. Holders owning shares in a
PFIC. A non-U.S. corporation generally will be classified as a PFIC
for U.S. federal income tax purposes in any taxable year in which, after
applying certain look-through rules with respect to the income and assets of
subsidiaries, either:
|
|
·
|
at
least 75% of its gross income is passive income;
or
|
|
|
·
|
at
least 50% of the average value of its gross assets is attributable to
assets that produce passive income or are held for the production of
passive income.
|
Passive
income for this purpose generally includes, among other things, dividends,
interest, royalties, rent, gains from the disposition of passive assets and net
gains from commodities transactions (other than gains from commodities
transactions derived in the active conduct of a trade or business and not
derived from a related person).
Based on
current estimates of our income, assets and the nature of our business, we do
not believe that we were classified for our most recently ended taxable year, or
will be classified for our current taxable year, as a PFIC and we intend to
continue our operations in such a manner that we do not expect that we would
become a PFIC in the future. However, there can be no assurance in
this regard, because the PFIC determination is made annually and is based on the
portion of our assets (including goodwill) and income that is characterized as
passive under the PFIC rules, and further because our business plans may be
subject to change. If we are or become a PFIC, unless a U.S. Holder
elects to be taxed annually on a mark-to-market basis with respect to its common
shares or ADSs, as described below, any gain realized on a sale or other taxable
disposition of our common shares or ADSs and certain “excess distributions”
(generally distributions in excess of 125% of the average distribution over a
three-year period or, if shorter, the holding period for our common shares or
ADSs) will be treated as ordinary income and will be subject to tax as if
(i) the excess distribution or gain had been realized ratably over the
U.S. Holder’s holding period for our common shares or ADSs, (ii) the
amount deemed realized in each year had been subject to tax in each such year at
the highest marginal rate for such year, and (iii) the interest charge
generally applicable to underpayments of tax had been imposed on the taxes
deemed to have been payable in those years. Income allocated to the
year of sale or excess distribution or any taxable period before we became a
PFIC, would be subject to tax at the U.S. Holder’s regular ordinary income rate
for the year of sale or excess distribution and would not be subject to the
interest charge discussed above.
116
If we are
treated as a PFIC, the rules above can be avoided by a U.S. Holder that makes a
mark-to-market election. A U.S. Holder may make a mark-to-market
election for our common shares or ADSs if our common shares or ADSs constitute
“marketable stock” as defined in the Treasury Regulations. Our common
shares and ADSs will be “marketable stock” if they are “regularly traded” on a
“qualified exchange or other market.” We cannot provide any assurance
that our common shares or ADSs are or will be considered “marketable stock” for
this purpose. In particular, it is unclear whether the BVC would meet
the requirements for a “qualified exchange or other market.” If a
mark-to-market election were made, a U.S. Holder would take into account each
year the appreciation or depreciation in value of its common shares or ADSs as
if the common shares or ADSs were sold at fair market value at the end of the
year. Such appreciation or depreciation generally would be treated as
ordinary income or ordinary loss, as would gains or losses on actual
dispositions of common shares or ADSs. A U.S. Holder will be entitled
to deduct as an ordinary loss each year the excess of such holder’s adjusted tax
basis in the common shares over their fair market value at the end of the year,
but only to the extent of the net amount previously included in income as a
result of the mark-to-market election. A mark-to-market election
under the PFIC rules with respect to shares would not apply to a subsidiary
PFIC, and a U.S. Holder would not be able to make such a mark-to-market election
in respect of its indirect ownership interest in that subsidiary
PFIC. Consequently, U.S. Holders of shares could be subject to the
PFIC rules with respect to income of the subsidiary PFIC, the value of which
already had been taken into account indirectly via mark-to-market
adjustments.
Any U.S.
Holder who owns common shares or ADSs during any year that we are a PFIC would
be required to file IRS Form 8621. U.S. Holders should also be
aware that recently enacted legislation may broaden the current IRS
Form 8621 filing requirements or impose an additional annual filing
requirement for U.S. persons owning shares of a PFIC. The legislation
does not describe what information would be required to be included in either
situation, but grants the Secretary of the U.S. Treasury Department power to
make this determination. U.S. Holders should consult their own tax
advisors regarding the application of the PFIC rules to our common shares or
ADSs and the application of the recently enacted legislation to their particular
situation. U.S. Holders should also consult their own independent tax
advisors regarding the availability and advisability of making a mark-to-market
election should we be considered a PFIC for any taxable year.
Backup
Withholding and Information Reporting
In
general, dividends on common shares or ADSs, and payments of the proceeds of a
sale, exchange or other taxable disposition of common shares or ADSs, paid
within the United States, by a U.S. payor or through certain U.S.-related
financial intermediaries to a U.S. Holder are subject to information reporting
and may be subject to backup withholding at a current rate of 28% unless the
holder (i) establishes that it is a corporation or other exempt recipient
or (ii) with respect to backup withholding, provides an accurate taxpayer
identification number and certifies that it is a U.S. person and that no loss of
exemption from backup withholding has occurred.
Backup
withholding is not an additional tax. The amount of any backup
withholding tax from a payment to a U.S. Holder will be allowed as a credit
against the U.S. Holder’s U.S. federal income tax liability, provided that the
required information is timely furnished to the IRS. A U.S. Holder
generally may obtain a refund of any amounts withheld under the backup
withholding rules that exceed its U.S. federal income tax liability by timely
filing a refund claim with the IRS.
In
addition, U.S. Holders should be aware that recently enacted legislation imposes
new reporting requirements with respect to the holding of foreign financial
assets, including stock of foreign issuers, if the aggregate value of all of
such assets exceeds $50,000. U.S. Holders should consult their own
tax advisors regarding the application of the information reporting rules to our
common shares or ADSs and the application of the recently enacted legislation to
their particular situation.
117
Non-U.S.
Holders
The above
discussion does not address the U.S. federal income tax consequences of
acquiring, holding and disposing of our common shares or ADSs for holders of the
common shares or ADSs that are not U.S. Holders. If you are such a
non-U.S. holder, you should consult your own independent tax advisor regarding
the U.S. federal income tax consequences, if any, of acquiring, owning and
disposing of our common shares or ADSs in your particular
circumstances.
|
10.F.
|
Dividends
and Paying Agents
|
Not
applicable.
|
10.G.
|
Statement
by Experts
|
Not
applicable.
|
10.H.
|
Documents
on Display
|
We have
filed this annual report on Form 20-F with the SEC under the Securities
Exchange Act of 1934, as amended, with respect to our common
stock. You may read and copy all or any portion of this annual report
or other information in the SEC’s public reference room at 100 F. Street,
NE, Washington, D.C. 20549. You can also request copies of these
documents upon payment of a duplicating fee, by writing the
SEC. Please call the SEC at 1-800-SEC-0330 for further information on
the operation of the public reference rooms. The SEC maintains a web
site (http://www.sec.gov) that
contains all of our filings with the SEC.
|
10.I.
|
Subsidiary
Information
|
Not
applicable.
|
ITEM 11.
|
Quantitative
and Qualitative Disclosures About Market
Risk
|
Risk
Management and Financial Instruments
We are
subject to a number of risks. The most important risk we face is
crude oil price volatility. Other exposures include currency and
interest rate risk as we hold in our treasury investment portfolios a number of
foreign currency-denominated instruments.
Oil price
risk results from our day-to-day operations as we export and import crude oil
and refined products.
Currently
we manage our exposure to oil price variation risk using the cash flow at risk
methodology. Our exposure tool prices fluctuations, which are
measured based on the impact such price variations have on our cash
flow. Specifically, we implemented CF@R or cash flow-at-risk
methodology to determine the impact of oil price variations on our cash
flow.
Currency
risk is mainly an accounting risk as we have to report our financial statements
in Pesos whereas 30% of our operations are denominated in U.S.
dollars. We manage our currency risk by maintaining funds in
U.S. dollars and in Pesos. We use our U.S. dollar funds to meet
our U.S. dollar denominated expenses and liabilities and our Peso funds to meet
our Peso denominated expenses.
Interest
rate risk results from our exposure value of our floating-rate investments held
in our investment portfolio. As interest rates vary, the value of our
floating-rate investments held in our investment portfolio can experience
fluctuations as a result of market movements.
With
respect to interest rate risk, the effective duration of our fixed income
portfolio in U.S. dollars vary between +/- 25% versus the portfolio’s
benchmark.
118
Since
2007 we have been using a financial model based on key rate durations to measure
our portfolio’s sensitivity to interest rate changes from each segment of the
curve.
Through
this model, risk managers try to recognize the fact that yield curve movements
are caused by multiple market factors and do not depend on a curve equilibrium
model. Also, the model allows us to calculate value at risk versus a
previously defined benchmark.
Finally,
at December 2009, we did not have any off-balance sheet debt. As
a result of this, our exposure to passive interest rate is only
marginal.
From time
to time we enter into derivative contracts as we deem necessary to hedge our
exposure to oil price, exchange rate and interest rate risks.
Investment
Guidelines
Following
Decree 648 of 2001, our management established investment guidelines for our
investment portfolios. In general terms, our guidelines determine
that we should invest our excess cash in fixed-income securities of issuers
rated A+ or higher according to the rating issued by a recognized rating
agency. We have no limitation to invest in securities issued or
guaranteed by the U.S. government and we may invest in securities issued by OECD
member countries so long as they are rated A+ or higher.
Our
investment portfolio in U.S. dollars is segmented in four tranches, each one
matching our liquidity needs. Working capital is calculated taking
into account our cash flow needs for the next 60 days. The
liquidity tranche is calculated as the contingent cash flow needs over the
working capital taking into account the development of capital expenditure
projects. The asset liability tranche is built to match our
off-balance debt. Finally, the investment tranche is composed of the
remaining resources from the total portfolio after deducting the above mentioned
tranches.
Sensitivity
Analysis
The
following table provides information about our financial statements as of
December 31, 2009 that may be sensitive to changes in WTI prices and
exchange rates:
|
Income
Statement 2009
|
Income
Statement Case
WTI(1) + US$1
|
Differs
Between Real
2009 and Case
WTI
|
Income
Statement Case
TRM(2) - 1%
|
Differs
Between Real
2009 and Case
TRM
|
||||||||||||||||
|
(Pesos
in billions)
|
||||||||||||||||||||
|
Local
Revenue
|
14,058.53 | 14,298.81 | 240.28 | 13,923.69 | (134.84 | ) | ||||||||||||||
|
Export
Revenue
|
16,345.86 | 16,539.75 | 193.89 | 16,219.73 | (126.12 | ) | ||||||||||||||
|
Total
Revenue
|
30,404.39 | 30,838.56 | 434.17 | 30,143.43 | (260.96 | ) | ||||||||||||||
|
Cost
of Sales
|
19,906.07 | 20,090.08 | 184.01 | 19,808.11 | (97.97 | ) | ||||||||||||||
|
Selling
Operating Expenses
|
1,962.64 | 1,962.51 | -0.13 | 1,962.51 | (0.13 | ) | ||||||||||||||
|
Administrative
Operating Expenses
|
662.34 | 662.66 | 0.32 | 662.66 | 0.32 | |||||||||||||||
|
Operating
Profit
|
7,873.34 | 8,123.32 | 249.98 | 7,710.15 | (163.19 | ) | ||||||||||||||
|
Non-Operating
Income (Expenses)
|
(622.50 | ) | (622.37 | ) | 0.13 | (622.37 | ) | 0.13 | ||||||||||||
|
Profit
before Income Tax
|
7,250.84 | 7,500.95 | 250.11 | 7,087.79 | (163.06 | ) | ||||||||||||||
|
Income
Tax
|
2,118.79 | 2,186.20 | 67.41 | 2,074.57 | (44.22 | ) | ||||||||||||||
|
Net
Income
|
5,132.05 | 5,314.75 | 182.70 | 5,013.22 | (118.83 | ) | ||||||||||||||
WTI= West
Texas Intermediate.
|
(1)
|
Average
WTI for 2009 was US$61.80 for
barrel.
|
|
(2)
|
Average
Market Representative Rate for 2009 was $2,153.30 per US$1 on a calendar
day basis
|
119
Assumptions
for the sensitivity analysis of Financial Statements
|
|
·
|
The
base scenario on which our sensitivity analysis is made corresponds to the
Consolidated Statements of Financial, Economic and Social Activity or
Income Statement for 2009 as
presented elsewhere in this annual
report.
|
|
|
·
|
The
sensitivity of the WTI price index is the increase of one dollar per
barrel of crude oil in the average WTI reference price based on a 365-day year for 2009. Prices assumed correspond
to real prices for crude oil, natural gas and refined products for 2009, adjusted to account for the differences
between such real prices and the WTI reference price.
|
|
|
·
|
The
sensitivity of our results to changes in the exchange rates is the
decrease by 1% on the average exchange rate for 2009 on a calendar day
basis. Prices assumed correspond
to real prices of crude oil, natural gas and refined products in 2009,
proportionally adjusted to account for differences between such real prices and the monthly average exchange
rate.
|
The table
below sets forth the line items that are being affected by the variation on
the reference prices or the average exchange rate.
|
VARIATION ON WTI REFERENCE
PRICE
|
VARIATION ON AVERAGE EXCHANGE
RATE
|
|
|
OPERATING INCOME
|
||
|
Local
Sales
|
Local
Sales
|
|
|
Crude
Oil
|
Crude
Oil
|
|
|
Refined
products
|
Refined
products
|
|
|
Natural
gas
|
Natural
gas
|
|
|
Exports
|
Exports
|
|
|
Crude
Oil
|
Crude
Oil
|
|
|
Refined
products
|
Refined
products
|
|
|
Natural
gas
|
Natural
gas
|
|
|
COST OF SALES
|
||
|
Local
purchases
|
Local
purchases
|
|
|
Purchases
from business partners
|
Purchases
from business partners
|
|
|
Purchases
of hydrocarbons from the ANH
|
Purchases
of hydrocarbons from the ANH
|
|
|
Purchases
of Natural gas
|
Purchases
of Natural gas
|
|
|
Imports
|
Imports
|
|
|
Crude
Oil
|
Crude
Oil
|
|
|
Products
|
Products
|
|
|
NON-OPERATING INCOME
|
||
|
Exchange
income
|
||
|
Exchange
loss
|
||
|
ITEM 12.
|
Description
of Securities Other than Equity
Securities
|
|
12.A.
|
Debt
Securities
|
Not
applicable.
|
12.B.
|
Warrants
and Rights
|
Not
applicable.
|
12.C.
|
Other
Securities
|
Not
applicable.
120
|
12.D.
|
American
Depositary Shares
|
Fees
and charges that a holder of our ADSs may have to pay, either directly or
indirectly
Our
Depositary may charge each person to whom ADSs are issued, including, without
limitation, issuances against deposits of shares, issuances in respect of share
distributions, rights and other distributions, issuances pursuant to a stock
dividend or stock split declared by us or issuances pursuant to a merger,
exchange of securities or any other transaction or event affecting the ADSs or
deposited securities, and each person surrendering ADSs for withdrawal of
deposited securities in any manner permitted by the deposit agreement or whose
ADRs are cancelled or reduced for any other reason, US$5.00 for each 100 ADSs
(or any portion thereof) issued, delivered, reduced, cancelled or surrendered,
the case may be. The Depositary may sell (by public or private sale) sufficient
securities and property received in respect of a share distribution, rights
and/or other distribution prior to such deposit to pay such charge.
The
Depositary collects its fees for issuance and cancellation of ADSs directly from
investors depositing shares or surrendering ADSs for the purpose of withdrawal
or from intermediaries acting for them. The Depositary collects fees for making
distributions to investors by deducting those fees from the amounts distributed
or by selling a portion of distributable property to pay the fees. The
Depositary may collect its annual fee for Depositary services by deduction from
cash distributions, or by directly billing investors, or by charging the
book-entry system accounts of participants acting for them. The Depositary may
generally refuse to provide services to any holder until the fees and expenses
owing by such holder for those services or otherwise are paid.
The
following additional charges shall be incurred by the ADR holders, by any party
depositing or withdrawing shares or by any party surrendering ADSs or to whom
ADSs are issued (including, without limitation, issuance pursuant to a stock
dividend or stock split declared by us or an exchange of stock regarding the
ADRs or the deposited securities or a distribution of ADSs), whichever is
applicable:
|
|
·
|
a
fee of US$1.50 per ADR or ADRs for transfers of certificated or direct
registration ADRs;
|
|
|
·
|
a
fee of up to US$0.05 per ADS for any cash distribution made pursuant to
the deposit agreement;
|
|
|
·
|
a
fee of US$0.05 per ADS per calendar year (or portion thereof) for services
performed by the Depositary in administering our ADR program (which fee
may be charged on a periodic basis during each calendar year and shall be
assessed against holders of ADRs as of the record date or record dates set
by the Depositary during each calendar year and shall be payable in the
manner described in the next succeeding
provision);
|
|
|
·
|
any
other charge payable by any of the Depositary, any of the Depositary’s
agents, including, without limitation, the custodian, or the agents of the
Depositary’s agents in connection with the servicing of our shares or
other deposited securities (which charge shall be assessed against
registered holders of our ADRs as of the record date or dates set by the
Depositary and shall be payable at the sole discretion of the Depositary
by billing such registered holders or by deducting such charge from one or
more cash dividends or other cash
distributions);
|
|
|
·
|
a
fee for the distribution of securities (or the sale of securities in
connection with a distribution), such fee being in an amount equal to the
fee for the execution and delivery of ADSs which would have been charged
as a result of the deposit of such securities (treating all such
securities as if they were shares) but which securities or the net cash
proceeds from the sale thereof are instead distributed by the Depositary
to those holders entitled thereto;
|
|
|
·
|
stock
transfer or other taxes and other governmental
charges;
|
|
|
·
|
cable,
telex and facsimile transmission and delivery charges incurred at your
request;
|
|
|
·
|
transfer
or registration fees for the registration of transfer of deposited
securities on any applicable register in connection with the deposit or
withdrawal of deposited securities;
|
121
|
|
·
|
expenses
of the Depositary in connection with the conversion of foreign currency
into U.S. dollars; and
|
|
|
·
|
such
fees and expenses as are incurred by the Depositary (including, without
limitation, expenses incurred in connection with compliance with foreign
exchange control regulations or any law or regulation relating to foreign
investment) in delivery of deposited securities or otherwise in connection
with the Depositary’s or its custodian’s compliance with applicable laws,
rules or regulations.
|
We will
pay all other charges and expenses of the Depositary and any agent of the
Depositary (except the custodian) pursuant to agreements from time to time
between us and the Depositary. The fees described above may be amended from time
to time.
Fees
and other direct and indirect payments made by the Depositary to us
Our
Depositary has agreed to reimburse us for certain expenses we incur that are
related to establishment and maintenance of the ADR program, including investor
relations expenses and exchange application and listing fees. In
2009, the Depositary made direct payments and reimbursements to us in the amount
of US$$3,143.38 for expenses related to investor relations
expenses.
|
ITEM 13.
|
Defaults,
Dividend Arrearages and
Delinquencies
|
None.
|
ITEM 14.
|
Material
Modifications to the Rights of Security Holders and Use of
Proceeds
|
None.
|
ITEM 15.
|
Controls
and Procedures
|
Disclosure
controls and procedures
As required by Rules 13a-15(e) and
15d-15(e) under the Securities Exchange Act of 1934, we evaluated the design and
effectiveness of our financial disclosure controls and procedures as of December
31, 2009, under the supervision and participation of our management, including
our Chief Executive Officer and Chief Financial Officer. There are inherent
limitations to the effectiveness of any system of disclosure controls and
procedures, including the possibility of human error and the circumvention or
overriding of the controls and procedures. Accordingly, even if effective,
disclosure controls and procedures can only provide reasonable assurance of
achieving their control objectives. Based upon this evaluation, our Chief
Executive Officer and Chief Financial Officer concluded that the disclosure
controls and procedures are effective to provide reasonable assurance that the
information required to be disclosed in the reports that we file and submit
under the Securities Exchange Act of 1934 is recorded, summarized and reported
as and when required.
Management’s
Annual Report on Internal Control over Financial Reporting
Our management is responsible for
establishing and maintaining adequate internal control over financial reporting
as defined in Rules 13a-15(f) and 15(d)-15(f) under the Securities Exchange Act
of 1934.
Our
internal control over financial reporting is a process designed under the
supervision of our Chief Executive Officer and Chief Financial Officer, and
affected by our board of directors, management and other personnel, to provide
reasonable assurance regarding the reliability of financial reporting and the
preparation of our financial statements for external reporting purposes in
accordance with generally accepted accounting principles, and it includes those
policies and procedures that:
|
|
·
|
pertain
to the maintenance of records that, in reasonable detail, accurately and
fairly reflect transactions and dispositions of our
assets;
|
122
|
|
·
|
provide
reasonable assurance that transactions are recorded as necessary to permit
preparation of financial statements in accordance with generally accepted
accounting principles, and that receipts and expenditures are being made
only in accordance with authorization of our management and directors;
and
|
|
|
·
|
provide
reasonable assurance regarding prevention or timely detection of
unauthorized acquisition, use or disposition of our assets that could have
a material effect on our financial
statements.
|
Because of its inherent limitations,
internal control over financial reporting may not prevent or detect
misstatements. Therefore, effective control over financial reporting cannot, and
does not, provide absolute assurance of achieving our control objectives. Also,
any evaluation of the effectiveness of the internal controls to future periods
is subject to the risk that controls may become inadequate because of changes in
conditions or that the degree of compliance with the policies or procedures may
deteriorate.
As of the year ended December 31, 2009,
our management conducted an assessment of the effectiveness of our internal
control over financial reporting in accordance with the criteria established in
the publication “Internal Control – Integrated Framework”, issued by the
Treadway Commission’s Committee of Sponsoring Organizations (COSO).
Based on the assessment performed, our
management has identified a material weakness in our process relating to the
preparation and analysis of the differences existing between Colombian
Government Entity GAAP and U.S. generally accepted accounting principles (US
GAAP). A material weakness is a deficiency or combination of deficiencies
in internal control over financial reporting such that there is a reasonable
possibility that a material misstatement of the annual financial statements
would not be prevented or detected on a timely basis.
The material weakness is the result of
the aggregation of control deficiencies due to our lack of sufficient accounting
personnel competent in the application of US GAAP to ensure:
(1) appropriate interpretation of US
GAAP to determine the differences existing in terms of non-recurring
transactions such as business combinations, including the measurement and
financial statement presentation of goodwill, non-controlling (minority)
interest, additional paid in capital, contingent considerations and deferred
income tax; and timely review of adjustments to fair value on the acquisition
date for validity and accuracy;
(2) appropriate interpretation of US
GAAP to estimate the differences existing in terms of recurring transactions
including changes in the lives of fixed assets; analysis of conditions used to
estimate contingent liabilities; and the completeness and accuracy of (i) the
basis, both for income tax and financial reporting purposes, used to compute the
deferred income tax over consolidated assets and liabilities, and (ii) journal
entries to record the differences;
(3) that entries relating to US GAAP
differences and financial statements reconciled to US GAAP were analyzed,
reviewed and monitored on a timely basis to provide reasonable assurance of
their validity, accuracy and completeness.
This situation has resulted in a number
of adjustments to our U.S. GAAP differences which were identified by our
Independent Auditor during their review of our consolidated financial statements
reconciled to US GAAP included in this annual report. These control deficiencies
could result in a misstatement of the differences existing between Colombian
Government Entity GAAP and U.S. GAAP that would not be prevented or detected on
a timely basis. Accordingly, our management has concluded that our internal
control over financial reporting was not effective as of December 31,
2009.
In response to the results of this
evaluation, our management will undertake the following changes to remediate
this material weakness:
|
|
·
|
perform
an assessment of our closing and reporting process to identify areas where
our process controls and efficiency can be improved. These improvements
will allow for more comprehensive review of our preparation and analysis
of the differences existing between Colombian Government Entity GAAP and
U.S. GAAP; and
|
123
|
|
·
|
improve
the accounting skills and U.S. GAAP expertise of our accounting group
through training, hiring of experienced personnel and the support of U.S.
GAAP experts.
|
As discussed in the Item 5 — “Recent
Acquisitions”, from March to May 2009, we acquired complete ownership of
Refineria de Cartagena S.A. and Hocol Petroleum Limited (the “Acquired
Companies”). For purposes of evaluating internal controls over financial
reporting, our management determined that the internal controls of the Acquired
Companies would be excluded from their internal control assessment as of
December 31, 2009, due to the timing of the closing of these
acquisitions. For the year ended December 31, 2009, under Colombian
Government Entity GAAP, Refineria de Cartagena S.A. and Hocol Petroleum Limited
contributed approximately 5% and 3% of total assets, respectively, and 13%
and 6% of total revenues, respectively.
The effectiveness of our internal
control over financial reporting has been audited by PricewaterhouseCoopers
Ltda., an independent registered public accounting firm, as stated in their
audit report accompanying our consolidated financial statements, which expresses
an adverse opinion on the effectiveness of our internal control over financial
reporting as of December 31, 2009.
Attestation
Report of the Registered Public Accounting Firm
PricewaterhouseCoopers Ltda.’s
attestation report on our internal control over financial reporting is
included in their audit report accompanying our consolidated financial
statements. See Item 18 — “Financial Statements”.
Changes
in Internal Control over Financial Reporting
There were no changes made in our
internal control over financial reporting during the year ended December 31,
2009 that have materially affected or are reasonably likely to materially affect
the Company’s internal controls over financial reporting.
|
ITEM 16.
|
[Reserved]
|
|
16.A.
|
Audit
Committee Financial Expert
|
On
April 19, 2010, our Board of Directors determined that Mauricio Cardenas, a
member of our Audit Committee, meets the requirements of an “audit committee
financial expert” as defined by the Securities and Exchange
Commission.
|
16.B.
|
Code
of Ethics
|
We
currently have a code of ethics which complies with the requirements of U.S. and
Colombian law. Our Code of Ethics is available on our website at
http://www.ecopetrol.com.co/english/documentos/42238_CARTILLA_CODIGO_DE_ETICA-12-03-09.pdf.
|
16.C.
|
Principal
Accountant Fees and Services
|
Principal
Accountant Fees
Our
consolidated financial statements for fiscal years ended December 31, 2009
and 2008 were audited by PricewaterhouseCoopers Ltda. (“PwC”) and our
consolidated financial statements for fiscal years ended December 31, 2007
were audited by Ernst & Young Audit Ltda (“E&Y”). The
following table sets forth the fees billed to us by PwC, during fiscal years
ended December 31, 2009 and 2008, and E&Y, during fiscal year ended
December 31, 2007:
124
|
At December 31,
|
||||||||||||
|
2009 (PwC)
|
2008 (PwC)
|
2007 (E&Y)
|
||||||||||
|
(in millions of pesos, excluding 16% value added
tax)
|
||||||||||||
|
Audit
fees
|
4,435 | 2,117 | 3,465 | |||||||||
|
Audit
– related fees
|
1,306 | 168 | 0 | |||||||||
|
Total
|
5,741 | 2,285 | 3,465 | |||||||||
Audit
Fees
The audit
fees listed in the table above are the aggregated fees billed by
PricewaterhouseCoopers Ltda. and Ernst & Young Audit Ltda. in connection
with their audits of our annual consolidated financial statements (under
Colombian GAAP and U.S. GAAP), interim consolidated financial statements (under
Colombian GAAP), subsidiary audits (under local GAAP) and review of periodic
documents filed with the SEC. In addition, these audit fees include
fees related to our independent auditors’ audits of our internal controls over
financial reporting.
Audited
– Related Fees
The
audit–related fees listed in the table above are the fees billed by
PricewaterhouseCoopers Ltda. in connection with their audit of (i) our
variable compensation bonus system, (ii) their review in connection with
SEC filings and debt offerings and (iii) their evaluation of the risks and
controls of our technical information service suppliers under
SAS70.
Audit
Committee Approval Policies and Procedures
Our audit
committee has not established pre-approval policies and procedures for the
engagement of our independent auditors for services. Our audit
committee expressly approves on a case-by-case basis any engagement of our
independent auditors for audit and non-audit services provided to
us.
|
16.D.
|
Exemptions
from the Listing Standards for Audit
Committee
|
Not
applicable.
|
16.E.
|
Purchases
of Equity Securities by the Issuer and Affiliated
Purchasers
|
None.
|
16.F.
|
Change
in Registrant’s Certifying
Accountant
|
Not
Applicable.
|
16.G.
|
Corporate
Governance
|
On
November 4, 2003, the NYSE established new corporate governance standards
(“NYSE standards”) that are applicable to NYSE-listed companies, including
non-U.S. issuers. These standards were then amended on
November 3, 2004. Under these standards, non-U.S. issuers are
permitted, in general, to follow their home country corporate governance
practices in lieu of most of the new NYSE corporate governance requirements (the
“NYSE Sections”) codified in Section 303A of the NYSE’s Listed Company
Manual. Non-U.S. issuers must comply with NYSE Sections 303A.06,
303A.11 and 303A.12(b) and (c). Section 303A.11 requires that
non-U.S. issuers disclose any significant ways in which their corporate
governance practices differ from those followed by U.S. companies in accordance
with the NYSE Sections.
Pursuant
to the requirements of Section 303A.11 of the NYSE’s Listed Company Manual,
the following is a summary of the significant differences between our corporate
governance standards and those required of U.S. companies in accordance
with the NYSE Sections:
125
NYSE
Section 303A.01
Requirement: Listed
companies must have a majority of independent directors on their board of
directors.
Colombian
Requirement: Law No. 964/2005 establishes that (i) listed
companies must be comprised of a minimum of five directors and a maximum of 10
directors and (ii) at least 25% of board members must be
independent. Under our corporate governance guidelines, our board of
directors must be comprised of nine directors, of which at least three must be
independent. As of the date of this annual report, we have six
independent directors.
NYSE
Section 303A.02
Requirement: Establishes
general standards to evaluate directors’ independence (no director qualifies as
“independent” unless the board of directors affirmatively determines that the
director has no material relationship with the listed company; directly or as a
partner, shareholder or officer of an organization that has a relationship with
the Company), and emphasizes that the concern is independence from
management. The board of directors is also required to express an
opinion with regard to the independence or lack of independence of each
individual director.
Colombian
Requirement: Law No. 964/2005 sets forth the requirements
under which a board member is considered independent. Law No.
964/2005 is primarily concerned with independence from management and that no
material related-party relationship exists between the director and the
Company. In accordance with Law No. 964/2005, our corporate
governance guidelines establish the minimum independence requirements for our
directors, requiring them to maintain their independent status while holding
such position. Our corporate governance code also establishes that
Directors will declare in writing their independent status. Once a
director becomes non-independent, he or she must tender their
resignation.
NYSE
Section 303A.03
Requirement: The
non-management directors of each listed company must meet at regularly scheduled
executive sessions without management.
Colombian
Requirement: A comparable rule does not exist under Colombian
law. Except for our Audit Committee, our Board of Directors does not
meet without management.
NYSE
Section 303A.04
Requirement: Listed
companies must have a nominating/corporate governance committee composed
entirely of independent directors, with a written charter that covers certain
minimum specified duties.
Colombian
Requirement: Colombian law does not require the establishment
of a nominating/corporate governance committee composed entirely of independent
directors. Pursuant to our by-laws, we have a three-member corporate
governance committee comprised of at least one independent director which acts
pursuant to a written charter that covers specific duties.
NYSE
Section 303A.05
Requirement: Listed
companies must have a compensation committee composed entirely of independent
directors, with a written charter that covers certain minimum specified
duties.
Colombian
Requirement: Colombian law does not require the establishment
of a compensation committee composed entirely of independent
directors. Pursuant to our by-laws, we have a three-member nomination
and compensation committee comprised of at least one independent director which
acts pursuant to a written charter that covers specific duties.
126
NYSE
Section 303A.06
Requirement: Listed
companies must have an “audit committee” that satisfies the requirements of
Rule 10A-3 under the Securities Exchange Act of 1934. Foreign
private issuers must satisfy the requirements of Rule 10A-3 under the
Securities Exchange Act of 1934 by July 31, 2005.
Colombian
Requirement: According to Law No. 964/2005, Colombian
companies that are authorized to issue securities by the Superintendency of
Finance must have an audit committee that satisfies the requirements of Law No.
964/2005, including its minimum number of members, independence criteria and
audit-related duties. Our audit committee is composed by Mauricio
Cardenas, María Velasquez, Joaquín Moreno and Ignacio Sanín, all of whom are
independent directors, and the committee meets the requirements of Law No.
964/2005 and Rule 10A-3 under the Securities Exchange Act of
1934.
NYSE
Section 303A.07(a)
Requirement: An
audit committee shall consist of at least three members. All of its
members must satisfy the requirements for independence set out in
Section 303A.02 and shall be financially literate or must acquire such
financial knowledge within a reasonable period and at least one of its members
shall have experience in accounting or financial administration.
Colombian
Requirement: Colombian law requires that a company’s audit
committee be comprised of at least three members who must all be independent and
have adequate experience in accounting or financial administration in order to
adequately carry out the functions of an audit committee member. All
three of our audit committee members are independent and financially
literate. In addition, Mauricio Cardenas, a member of our audit
committee, meets the requirements of an “audit committee financial expert” as
defined by the SEC.
NYSE
Section 303A.07(b).
Requirement: If
a member of the audit committee is simultaneously a member of the audit
committee of more than three public companies, and the listed company does not
limit the number of audit committees on which its members may serve, then, in
each case the board of directors shall determine whether the simultaneous
service would prevent such members from effectively serving on the listed
company’s audit committee, and shall disclose its decision in the annual proxy
statement of the Company or in the Company’s annual report on Form 10-K,
which is filed with the SEC.
Colombian
Requirement: A comparable rule does not exist under Colombian
law nor our corporate governance guidelines. However, under our
by-laws, a member of our board of directors cannot sit on the board of more than
five companies.
NYSE
Section 303A.07(c)
Requirement: An
audit committee shall have a written charter establishing the duties and
responsibilities of its members, including the duties and responsibilities
required, at a minimum, by Rule 10A-3(b)(2-5) of the Securities Exchange
Act of 1934.
Colombian
Requirement: Law No. 964/2005 establishes the functions and
responsibilities of an audit committee, which are substantially similar to those
required under Rule 10A-3 of the Securities Exchange Act of
1934. Our audit committee acts pursuant to a written charter which
establishes the specific duties and responsibilities of our audit committee
members. These duties and responsibilities are essentially the same
as those required under Rule 10A-3 of the Securities Exchange Act of
1934.
NYSE
Section 303A.07(c)(iii)(A)
Requirement: Provides
that the audit committee must, at least annually, obtain and review report by
the independent auditor describing: the firm’s internal
quality-control procedures; any material issues raised by the most recent
internal quality-control review, or peer review, of the firm, or by any inquiry
or investigation by governmental or professional authorities, within the
preceding five years, respecting one or more independent audits carried out by
the firm, and any steps taken to deal with any such issues; and all
relationships between the independent auditor and the Company.
127
Colombian
Requirement: Decree No. 410/1971 and Law No. 222/1995 regulate
the contents of the reports prepared by the independent auditors and compliance
with the recommendations set forth therein. Pursuant to our by-laws,
our audit committee must review our independent auditor’s reports, including its
assessment of our internal control over financial reporting.
NYSE
Section 303A.07(c)(iii)(B-C)
Requirement: Provides
that the audit committee shall: meet to review and discuss the
Company’s annual audited consolidated financial statements and quarterly
financial statements with management and the independent auditor, including
reviewing the Company’s specific disclosures under “Operating and Financial
Review and Prospects,” and discuss the Company’s earnings press releases, as
well as financial information and earnings guidance provided to analysts and
rating agencies.
Colombian
Requirement: Pursuant to Law No. 964/2005, the audit committee
is responsible for reviewing the Company’s annual audited financial statements
and quarterly financial statements. Our audit committee reviews our
annual audited consolidated and unconsolidated financial statements and
quarterly financial statements as well as our public disclosures about the
Company’s financial information.
NYSE
Section 303A.07(c)(iii)(D-H)
Requirement: Provides
that the audit committee shall: discuss policies with respect to risk
assessment and risk management; meet separately, periodically, with management,
with internal auditors (or other personnel responsible for the internal audit
function) and with independent auditors; review with the independent auditor any
audit problems or difficulties and management’s response; set clear policies for
hiring external auditors’ employees; and report regularly to the board of
directors.
Colombian
Requirement: Law No. 964/2005 requires the audit committee to
supervise a company’s risk assessment and internal quality-control
program. Our audit committee supervises our risk assessment and
internal quality-control program and makes recommendations related to such
program, presents any quality-control risk to the Company’s shareholders and
reports regularly to our board of directors. The written charter of
the audit committee establishes that the committee members can meet separately
with the Company’s external and internal auditors.
NYSE
Section 303A.07(d)
Requirement: Provides
that each company must have an internal audit function to provide management and
the audit committee with ongoing assessments of the Company’s risk management
processes and system of internal control.
Colombian
Requirement: Law No. 87/1993 requires state-owned companies to
have an internal audit function in order to provide ongoing assessments of the
Company’s risk management processes and system of internal
control. Since becoming a mixed economy company on November 13,
2007, Law No. 87/1993 no longer applies to us. However, we do have an
internal audit department that provides ongoing assessments about our risk
management processes and system of internal control. Our internal
audit department follows the standards set forth by the Committee of Sponsoring
Organizations (COSO).
Requirement: Shareholders
must be given the opportunity to vote on equity compensation plans and material
revisions thereto, with limited exemptions set forth in the NYSE
standards.
Colombian
Requirement: No similar opportunity to vote on equity
compensation plans and material revisions thereto is given to shareholders under
Colombian law. We do not give our shareholders the right to vote on
equity compensation plans and material revisions thereto.
128
NYSE
Section 303A.09
Requirement: Listed
companies must adopt and disclose corporate governance guidelines.
Colombian
Requirement: The Superintendency of Finance does recommend the
adoption of corporate governance guidelines. However, according to
Superintendency of Finance Circular No. 056/2007, the adoption of corporate
governance guidelines is voluntary. Nevertheless, listed companies
must annually publish a corporate governance survey comparing their corporate
governance standards with those recommended by the Superintendency of
Finance. Our corporate governance guidelines are listed on our
website at http://www.ecopetrol.com.co.
NYSE
Section 303A.10
Requirement: Listed
companies must adopt and disclose a code of business conduct and ethics for
directors, officers and employees, and promptly disclose any waivers of the code
for directors or executive officers.
Colombian
Requirement: Colombian law requires that companies adopt a
code of ethics for directors, officers and employees. We have adopted
a code of ethics which applies to our directors, officers and
employees. Our code of ethics can be found on our website at
http://www.ecopetrol.com.co/english/documentos/42238_CARTILLA_CODIGO_DE_ETICA-12-03-09.pdf.
NYSE
Section 303A.12(a)
Requirement: The
CEO must certify to the NYSE each year that he or she is not aware of any
violation by the Company of NYSE corporate governance listing standards,
qualifying the certification to the extent necessary.
Colombian
Requirement: No such requirement exists under Colombian
law.
NYSE
Section 303A.12(b)
Requirement: The
CEO shall notify the NYSE in writing whenever any executive officer of the
Company becomes aware of any material noncompliance with of any applicable
provision of NYSE Section 303A.
Colombian
Requirement: No such requirement exists under Colombian
law.
NYSE
Section 303A.12(c)
Requirement: Listed
companies must submit an executed Written Affirmation annually to the
NYSE. In addition, listed companies must submit an interim Written
Affirmation each time a change occurs to the board or any of the committees
subject to Section 303A.
Colombian
Requirement: As a local issuer, we must report any change in
our Board of Directors or in our committees as relevant
information.
|
ITEM 17.
|
Financial
Statements
|
Not
applicable.
|
ITEM 18.
|
Financial
Statements
|
See page
F-1 through F-109.
129
|
ITEM 19.
|
Exhibits
|
|
Exhibit No.
|
Description
|
|
|
1.1
|
By-laws
of Ecopetrol S.A. dated November 6, 2007 as recorded under Public Deed No.
5314 of November 14, 2007 (incorporated by reference to Exhibit 1.1 on
Form 20-F filed with the U.S. Securities and Exchange Commission on
September 12, 2008 (File No. 001-34175)).
|
|
|
4.1
|
Transportation
Agreement between Ecopetrol S.A. and Ocensa S.A., dated March 31, 1995
(incorporated by reference to Exhibit 4.1 on Form 20-F filed with the U.S.
Securities and Exchange Commission on September 12, 2008 (File No.
001-34175)).
|
|
|
4.2
|
Natural
Gas Transportation Agreement between Ecopetrol S.A. and Empresa Colombiana
de Gas-Ecogás, dated October 6, 2006 (incorporated by reference to Exhibit
4.2 on Form 20-F filed with the U.S. Securities and Exchange Commission on
September 12, 2008 (File No. 001-34175)).
|
|
|
4.3
|
Indenture,
dated as of July 23, 2009, between the Company and The Bank of New York
Mellon, as trustee (incorporated by reference to Exhibit 4.2 to the
Company’s Form F-4 filed with the U.S. Securities and Exchange Commission
on July 31, 2009 (File No. 333-160965)).
|
|
|
8.1
|
Subsidiaries
of Ecopetrol S.A.
|
|
|
12.1
|
Section
302 Certification of the Chief Executive Officer.
|
|
|
12.2
|
Section
302 Certification of the Chief Financial Officer.
|
|
|
13.1
|
Section
906 Certification of the Chief Executive Officer.
|
|
|
13.2
|
Section
906 Certification of the Chief Financial Officer.
|
|
|
23.1
|
Consent
of Ernst & Young Audit Ltda.
|
|
|
23.2
|
Consent
of PricewaterhouseCoopers Ltda.
|
|
|
23.3
|
Consent
of Ryder Scott.
|
|
|
23.4
|
Consent
of Gaffney, Cline & Associates.
|
|
|
23.5
|
Consent
of DeGolyer and MacNaughton.
|
|
|
99.1
|
Third
Party Reserve Report of Ryder Scott.
|
|
|
99.2
|
Third
Party Reserve Report of Gaffney, Cline &
Associates.
|
|
|
99.3
|
Third
Party Reserve Report of DeGolyer and
MacNaughton.
|
130
SIGNATURES
The
registrant hereby certifies that it meets all of the requirements for filing on
Form 20-F and that it has duly caused and authorized the undersigned to
sign this annual report on its behalf.
|
ECOPETROL
S.A.
|
||
|
By:
|
/s/ Adriana M. Echeverri
|
|
|
Name: Adriana
M. Echeverri
|
||
|
Title: Chief
Financial Officer
|
||
|
By:
|
/s/ Javier G. Gutiérrez
|
|
|
Name: Javier
G. Gutiérrez
|
||
|
Title: Chief
Executive Officer
|
||
Date: July
14, 2010
131
ANNEX
I
DESCRIPTION
OF EXPLORATION AND PRODUCTION CONTRACTS
|
Region
|
Contract
Name
|
Type of
Agreement
|
Purpose
|
Operator
|
Partners
|
Ownership
Percentage
|
Term of
Contract
|
Expiration
Date
|
Right of
Reversion
upon
Termination
|
Royalty
|
||||||||||
|
Southern
|
Abanico
|
Joint
Venture
|
E&P
|
Kappa
Resources Colombia Limited
|
Kappa
Resources Colombia Limited
|
50%
|
28
years
|
October 11,
2024
|
Yes
|
5%
to 25%
|
||||||||||
|
Minor
Fields
|
Alcaravan
|
Joint
Venture
|
E&P
|
Harken
de Colombia Ltd.
|
Harken
de Colombia Ltd.
|
50%
|
28
years
|
February 13,
2021
|
No
|
20%
|
||||||||||
|
Southern
|
Ambrosia
|
Joint
Venture
|
E&P
|
Interoil
|
Interoil
|
30%
|
25
years
|
December 27,
2027
|
Yes
|
8%
to 25%
|
||||||||||
|
Minor
Fields
|
Arjona
|
Discovered
Undeveloped Field
|
E&P-
Discovered and Undeveloped Field
|
Vetra-
NCT Consortium
|
Vetra-
NCT Consortium
|
35%
|
10
years
|
March 9,
2017
|
Yes
|
8%
to 25%
|
||||||||||
|
Southern
|
Armero
|
Joint
Venture
|
E&P
|
Interoil
|
Interoil
|
50%
|
28
years
|
December 31,
2010
|
Yes
|
20%
|
||||||||||
|
Minor
Fields
|
Barranca
Lebrija
|
Discovered
Undeveloped Field
|
Develop
Field
|
Union
Temporal Mocam
|
Union
Temporal Mocam
|
8%
|
10
years
|
December 31,
2013
|
Yes
|
20%
|
||||||||||
|
Minor
Fields
|
Bocachico
|
Joint
Venture- Sole Risk
|
E&P
|
Harken
de Colombia Ltd.
|
Harken
de Colombia Ltd.
|
0%
|
28
years
|
March 7,
2022
|
Yes
|
20%
|
||||||||||
|
Minor
Fields
|
Bolivar
|
Joint
Venture- Sole Risk
|
E&P
|
Harken
de Colombia Ltd.
|
Harken
de Colombia Ltd - Harken Energy Corporation
|
0%
|
28
years
|
June 12,
2024
|
Yes
|
20%
|
||||||||||
|
Southern
|
Boqueron
|
Joint
Venture
|
E&P
|
Petrobras
|
Petrobras/Nexen
|
50%
|
28
years
|
October 2,
2023
|
Yes
|
5%
to 25%
|
||||||||||
|
Southern
|
Caguan
|
Joint
Venture
|
E&P
|
Petrobras
|
Petrobras/
Pacific
|
50%
|
28
years
|
December 31,
2011
|
Yes
|
20%
|
||||||||||
|
Minor
Fields
|
Camoa
|
Discovered
Undeveloped Field
|
E&P-
Discovered and Undeveloped Field
|
Drilling
and Workover Services Ltda.
|
Drilling
and Workover Services Ltda.
|
20%
|
10
years
|
December 28,
2013
|
Yes
|
6%
to 25%
|
||||||||||
|
Catatumbo-Orinoquía
|
Campo
Rico
|
Joint
Venture
|
E&P
|
Emerald
Energy PLC Sucursal Colombia
|
Emerald
Energy PLC Sucursal Colombia
|
50%
|
25
years
|
May 24,
2027
|
Yes
|
8%
to 25%
|
||||||||||
|
Minor
Fields
|
Capachos
|
Joint
Venture
|
E&P
|
Repsol
YPF
|
Repsol
YPF
|
50%
|
28
years
|
September 15,
2025
|
Yes
|
5%
to 8%
|
||||||||||
|
Central
|
Caracara
|
Joint
Venture
|
E&P
|
CEPCOLSA
|
CEPCOLSA
|
30%
|
28
years
|
April 9,
2029
|
Yes
|
8%
to 25%
|
||||||||||
|
Mid
– Magdalena Valley
|
Carare
las Monas
|
Joint
Venture
|
Production
|
Petrosantander
|
Petrosantander
|
30%
|
Until
economic limit
|
Until
economic limit
|
Yes
|
20%
|
||||||||||
|
Minor
Fields
|
Carbonera
la Silla
|
Discovered
Undeveloped Field
|
E&P-
Discovered and Undeveloped Field
|
Mompos
Oil Company Inc.
|
Mompos
Oil Company Inc.
|
6%
|
10
years
|
October 25,
2014
|
Yes
|
20%
|
||||||||||
|
Catatumbo-Orinoquía
|
Casanare
|
Joint
Venture
|
E&P
|
Perenco
|
Perenco
- Hocol and Homcol
|
64%
|
Until
economic limit
|
Until
economic limit
|
No
|
20%
|
||||||||||
|
Minor
Fields
|
Cerrito
|
Joint
Venture
|
E&P
|
Kappa
Resources Colombia Limited
|
Kappa
Resources Colombia Limited
|
0%
|
27.5
years
|
August 17,
2029
|
Yes
|
20%
|
||||||||||
|
Minor
Fields
|
Chaparral
|
Joint
Venture
|
E&P
|
Vetra
Exploracion y Produccion Colombia
|
Vetra
Exploracion y Produccion Colombia
|
50%
|
28
years
|
October 4,
2012
|
Yes
|
8%
to 25%
|
||||||||||
|
Minor
Fields
|
Chenche
|
Discovered
Undeveloped Field
|
E&P
|
Vetra
Exploracion y Produccion Colombia
|
Vetra
Exploracion y Produccion Colombia
|
70%
|
10
years
|
December 28,
2013
|
Yes
|
8%
to 25%
|
||||||||||
|
Minor
Fields
|
Chipalo
|
Joint
Venture- Sole Risk
|
E&P
|
Kappa
Resources Colombia Limited
|
Kappa
Resources Colombia Limited
|
0%
|
28
years
|
February 27,
2026
|
Yes
|
8%
to 25%
|
||||||||||
|
Catatumbo-Orinoquía
|
Chipiron
|
Joint
Venture
|
E&P
|
Occidental
de Colombia Inc.
|
Occidental
de Colombia Inc. and Occidental Andina
|
30%
|
25
years
|
February 13,
2028
|
Yes
|
8%
to 25%
|
||||||||||
|
Mid
– Magdalena Valley
|
Acuerdo
de Cooperación Campo Teca
|
Arbitration
Court
|
E&P
|
Mansarovar
Energy Colombia Ltd.
|
Mansarovar
Energy Colombia Ltd.
|
100%
|
28
years
|
October
08 , 2008/tribunal
|
Yes
|
32%
|
||||||||||
|
Catatumbo-Orinoquía
|
Corocora
|
Joint
Venture
|
E&P
|
Perenco
|
Hocol
S.A - Perenco
|
56%
|
Until
economic limit
|
Until
economic limit
|
No
|
8%
to 25%
|
||||||||||
|
Catatumbo-Orinoquía
|
Cosecha
|
Joint
Venture
|
E&P
|
Occidental
de Colombia Inc.
|
Occidental
de Colombia Inc.
|
30%
|
28
years
|
October 31,
2030
|
Yes
|
8%
to 25%
|
||||||||||
|
Southern
|
CPR
Santana
|
Risk
participation contract
|
E&P
|
Gran
Tierra Colombia
|
Gran
Tierra Colombia
|
65%
|
28
years
|
July 27,
2015
|
Yes
|
20%
|
||||||||||
|
Catatumbo-Orinoquía
|
Cravo
Norte
|
Joint
Venture
|
E&P
|
Occidental
de Colombia Inc.
|
Occidental
de Colombia Inc.
|
59.98%
|
Until
economic limit
|
Until
economic limit
|
No
|
5%
to 25%
|
A-1
|
Minor
Fields
|
Dindal
|
Joint
Venture- Sole Risk
|
E&P
|
SIPETROL
|
SIPETROL
|
60%
|
28
years
|
March 22,
2021
|
Yes
|
20%
|
||||||||||
|
Minor
Fields
|
Entrerrios
|
Discovered
Undeveloped Field
|
E&P-
Discovered and Undeveloped Field
|
Union
Temporal Andina
|
Union
Temporal Andina
|
61%
|
10
years
|
December 28,
2013
|
Yes
|
8%
to 25%
|
||||||||||
|
Southern
|
Espinal
|
Risk
participation contract
|
E&P
|
Petrobras
|
Petrobras
|
55%
|
28
years
|
October,
2015
|
Yes
|
20%
|
||||||||||
|
Catatumbo-Orinoquía
|
Estero
|
Joint
Venture
|
E&P
|
Perenco
|
Perenco
- Hocol and Homcol
|
89%
|
Until
economic limit
|
Until
economic limit
|
No
|
20%
|
||||||||||
|
Catatumbo-Orinoquía
|
Garcero
|
Joint
Venture
|
E&P
|
Perenco
|
Perenco
- Hocol and Homcol
|
76%
|
Until
economic limit
|
Until
economic limit
|
No
|
5%
to 25%
|
||||||||||
|
Minor
Fields
|
Guachiria
|
Joint
Venture
|
E&P
|
Solana
Petroleum Exploration Colombia Limited
|
Solana
Petroleum Exploration Colombia Limited
|
13%
|
28
years
|
September 30,
2031
|
Yes
|
8%
to 25%
|
||||||||||
|
Northeastern
|
Guajira
|
Joint
Venture
|
E&P
|
Chevron
Petroleum Company
|
Chevron
Petroleum Company
|
57%
|
Until
economic limit
|
Until
economic limit
|
No
|
20%
|
||||||||||
|
Minor
Fields
|
Guarimena
|
Discovered
Undeveloped Field
|
E&P-
Discovered and Undeveloped Field
|
Vetra
Exploracion y Produccion Colombia
|
Vetra
Exploracion y Produccion Colombia
|
81%
|
10
years
|
January 17,
2018
|
Yes
|
8%
to 25%
|
||||||||||
|
Southern
|
Guayuyaco
|
Joint
Venture
|
E&P
|
Gran
Tierra Colombia
|
Gran
Tierra Colombia
|
30%
|
28
years
|
May 30,
2030
|
Yes
|
8%
to 25%
|
||||||||||
|
Minor
Fields
|
Hato
Nuevo
|
Discovered
Undeveloped Field
|
E&P
|
NCT
Consortium
|
NCT
Consortium
|
41%
|
10
years
|
July 3,
2016
|
Yes
|
32%
|
||||||||||
|
Southern
|
Hobo
|
Joint
Venture
|
E&P
|
Petrobras
|
Petrobras
|
50%
|
28
years
|
December 31,
2011
|
Yes
|
20%
|
||||||||||
|
Mid
– Magdalena Valley
|
La
Cira
|
Business
Cooperation
|
E&P
|
Ecopetrol
S.A.
|
Occidental
de Colombia and Ecopetrol S.A.
|
52%
|
Until
economic limit
|
Until
economic limit
|
Yes
|
8%
to 20%
|
||||||||||
|
Minor
Fields
|
La
Punta
|
Discovered
Undeveloped Field
|
E&P-
Discovered and Undeveloped Field
|
Vetra
Exploracion y Produccion Colombia
|
Vetra
Exploracion y Produccion Colombia
|
70%
|
10
years
|
December 28,
2013
|
Yes
|
8%
to 25%
|
||||||||||
|
Minor
Fields
|
Las
Quinchas
|
Joint
Venture- Sole Risk
|
E&P
|
Kappa
Resources Colombia Limited
|
Kappa
Resources Colombia Limited
|
7%
|
Until
economic limit
|
Until
economic limit
|
Yes
|
20%
|
||||||||||
|
Minor
Fields
|
Lebrija
|
Joint
Venture- Sole Risk
|
E&P
|
Petroleos
del Norte S.A.
|
Petroleos
del Norte S.A.
|
0%
|
28
years
|
August 26,
2013
|
Yes
|
20%
|
||||||||||
|
Minor
Fields
|
Magangué
|
Joint
Venture
|
E&P
|
Solana
Petroleum Exploration (Colombia Limited)
|
Solana
Petroleum Exploration (Colombia Limited)
|
58%
|
28
years
|
January 1,
2018
|
Yes
|
20%
|
||||||||||
|
Southern
|
Mana
|
Joint
Venture
|
E&P
|
Interoil
|
Interoil
|
30%
|
25
years
|
November 11,
2028
|
Yes
|
8%
to 25%
|
||||||||||
|
Minor
Fields
|
Maracas
|
Joint
Venture- Sole Risk
|
E&P
|
Texican
Oil Ltd.
|
Texican
Oil Ltd.
|
0%
|
28
years
|
March 5,
2024
|
Yes
|
20%
|
||||||||||
|
Southern
|
Matambo
|
Joint
Venture
|
E&P
|
Emerald
Energy PLC Sucursal Colombia
|
Emerald
Energy PLC Sucursal Colombia
|
50%
|
28
years
|
November 29,
2024
|
Yes
|
20%
|
||||||||||
|
Minor
Fields
|
Mugrosa
|
Discovered
Undeveloped Field
|
Develop
Field
|
Cosacol
S.A.
|
Cosacol
S.A.
|
75%
|
10
years
|
July 25,
2015
|
Yes
|
8%
to 25%
|
||||||||||
|
Minor
Fields
|
Nancy-Burdine-
Maxime
|
Discovered
Undeveloped Field
|
E&P
|
Union
Temporal II&B
|
Union
Temporal II&B
|
41%
|
10
years
|
December 28,
2013
|
Yes
|
20%
|
||||||||||
|
Mid
– Magdalena Valley
|
Nare
|
Joint
Venture
|
Production
|
Mansarovar
Energy Colombia Ltd.
|
Mansarovar
Energy Colombia Ltd.
|
50%
|
28
years
|
November 5,
2021
|
Yes
|
20%
|
||||||||||
|
Southern
|
Neiva
|
Incremental
Production
|
E&P
|
Ecopetrol
S.A.
|
Petrominerales
|
31%
|
22
years
|
June 5,
2023
|
Yes
|
8%
to 25%
|
||||||||||
|
Minor
Fields
|
Opon
|
Joint
Venture
|
Production
|
Compañía
Operadora Petrocolombia
|
Compañía
Operadora Petrocolombina
|
0%
|
28
years
|
July 14,
2015
|
Yes
|
20%
|
||||||||||
|
Minor
Fields
|
Opon-6
|
Joint
Venture- Sole Risk
|
E&P
|
Compañía
Operadora Petrocolombia
|
Compañía
Operadora Petrocolombina
|
0%
|
28
years
|
July 14,
2015
|
Yes
|
20%
|
||||||||||
|
Southern
|
Orito
|
Incremental
Production
|
E&P
|
Ecopetrol
S.A.
|
Petrominerales
|
21%
|
22
years
|
June 5,
2023
|
Yes
|
8%
to 25%
|
||||||||||
|
Catatumbo-Orinoquía
|
Orocue
|
Joint
Venture
|
E&P
|
Perenco
|
Perenco
and Hocol
|
63%
|
Until
economic limit
|
Until
economic limit
|
No
|
20%
|
||||||||||
|
Southern
|
Ortega
|
Incremental
Production
|
E&P
|
Ecopetrol
S.A.
|
Hocol
S.A.
|
31%
|
22
years
|
March 18,
2023
|
Yes
|
8%
incremental, 20% basica
|
A-2
|
Mid
– Magdalena Valley
|
Palagua
|
Incremental
Production
|
Production
|
Union
Temporal IJP
|
Union
Temporal Ismocol, Joshi- Petcar- Parko
|
34%
|
22
years
|
July 14,
2023
|
Yes
|
20%
|
||||||||||
|
Southern
|
Palermo
|
Joint
Venture
|
E&P
|
Hocol
S.A.
|
Hocol
S.A.
|
50%
|
28
years
|
April 30,
2012
|
Yes
|
20%
|
||||||||||
|
Minor
Fields
|
Pavas-
Cachira
|
Discovered
Undeveloped Field
|
Develop
Field
|
Ismocol
de Colombia S.A.
|
Union
Temporal Isomocol, Joshi- Petcar- Parko
|
5%
|
10
years
|
December 29,
2013
|
Yes
|
20%
|
||||||||||
|
Northeastern
|
Piedemonte
|
Joint
Venture
|
E&P
|
BP
|
BP
|
50%
|
28
years
|
February 29,
2020
|
Yes
|
20%
|
||||||||||
|
Central
|
Piriri
|
risk
participation contract
|
E&P
|
Metapetroleum
|
Pacific
Rubiales
|
50%
|
28
years
|
June 30,
2016
|
Yes
|
20%
|
||||||||||
|
Minor
Fields
|
Playon
|
Discovered
Undeveloped Field
|
Develop
Field
|
Serinpet
|
Representaciones
y Servicios de Petroleos Serinpet
|
54%
|
10
years
|
July 12,
2015
|
Yes
|
20%
|
||||||||||
|
Minor
Fields
|
Puerto
Barco
|
Discovered
Undeveloped Field
|
E&P-
Discovered and Undeveloped Field
|
Avante
Colombia
|
Vetra
Exploracion y Produccion Colombia - Avante Colombia
|
6%
|
10
years
|
December 29,
2013
|
Yes
|
20%
|
||||||||||
|
Southern
|
Puli
|
Joint
Venture
|
E&P
|
Interoil
|
Interoil
|
50%
|
28
years
|
February 29,
2012
|
Yes
|
20%
|
||||||||||
|
Minor
Fields
|
Quebrada
Roja
|
Discovered
Undeveloped Field
|
Develop
Field
|
Campos
de Producción Consortium
|
Campos
de Producción Consortium
|
58%
|
10
years
|
July 12,
2015
|
Yes
|
20%
|
||||||||||
|
Northeastern
|
Recetor
|
Joint
Venture
|
E&P
|
BP
|
BP
Explotarion Co (Colombia) Ltd. - BP Santiago
|
50%
|
28
years
|
May 29,
2017
|
Yes
|
20%
|
||||||||||
|
Northeastern
|
Rio
Chitamena
|
Joint
Venture
|
E&P
|
BP
|
BP
Explotarion Co (Colombia) Ltd. - BP Santiago
|
50%
|
28
years
|
January 31,
2019
|
Yes
|
20%
|
||||||||||
|
Minor
Fields
|
Rio
de Oro
|
Discovered
Undeveloped Field
|
E&P-
Discovered and Undeveloped Field
|
Avante
Colombia
|
Vetra
Exploracion y Produccion Colombia - Avante Colombia
|
12%
|
10
years
|
December 29,
2013
|
Yes
|
20%
|
||||||||||
|
Southern
|
Rio
Opia
|
Joint
Venture
|
E&P
|
Interoil
|
Interoil
|
30%
|
28
years
|
June 23,
2030
|
Yes
|
8%
to 25%
|
||||||||||
|
Southern
|
Río
Paez (La Hocha)
|
Joint
Venture- Sole Risk
|
E&P
|
Hocol
S.A.
|
Hocol
S.A.
|
0%
|
28
years
|
April 26,
2029
|
Yes
|
5%
La Hocha
|
||||||||||
|
Minor
Fields
|
Río
Seco
|
Joint
Venture- Sole Risk
|
E&P
|
SIPETROL
|
SIPETROL
|
0%
|
28
years
|
August 21,
2023
|
Yes
|
20%
|
||||||||||
|
Minor
Fields
|
Rompida
|
Discovered
Undeveloped Field
|
Develop
Field
|
Vetra
Exploracion y Produccion Colombia
|
Vetra
Exploración y Producción Colombia
|
19%
|
10
years
|
December 30,
2013
|
Yes
|
20%
|
||||||||||
|
Catatumbo-Orinoquía
|
Rondon
|
Joint
Venture
|
E&P
|
Occidental
de Colombia Inc.
|
Occidental
de Colombia Inc.
|
50%
|
28
years
|
January 8,
2023
|
Yes
|
8%
to 25%
|
||||||||||
|
Central
|
Rubiales
|
Joint
venture
|
E&P
|
Metapetroleum
|
Pacific
Rubiales
|
60%
|
28
years
|
June 30,
2016
|
Yes
|
20%
|
||||||||||
|
Southern
|
San
Jacinto (La Cañada Norte)
|
Joint
Venture
|
E&P
|
Hocol
S.A.
|
Hocol
S.A.
|
50%
|
28
years
|
December 22,
2024
|
Yes
|
8%
La Cañada Norte
|
||||||||||
|
Minor
Fields
|
San
Luis
|
Joint
Venture
|
E&P
|
Vetra
Exploracion y Produccion Colombia
|
Vetra
Exploración y Producción Colombia
|
50%
|
28
years
|
May 8,
2014
|
Yes
|
20%
|
||||||||||
|
Northeastern
|
Santiago
de las Atalayas
|
Joint
Venture
|
E&P
|
BP
|
BP
Explotarion Co (Colombia) Ltd. - BP Santiago
|
50%
|
28
years
|
June 30,
2010
|
Yes
|
20%
|
||||||||||
|
Southern
|
Suroriente
|
Incremental
Production
|
E&P
|
Colombia
Energy
|
Colombia
Energy
|
48%
|
22
years
|
June 11,
2024
|
Yes
|
8%
to 25%
|
||||||||||
|
Minor
Fields
|
Tambaqui
|
Joint
Venture- Sole Risk
|
E&P
|
Hupecol
|
Hupecol
|
50%
|
28
years
|
February 28,
2026
|
Yes
|
8%
to 25%
|
||||||||||
|
Minor
Fields
|
Tapir
|
Joint
Venture- Sole Risk
|
E&P
|
Petrolco
|
Petrolco
and Doreal Energy
|
0%
|
28
years
|
February 24,
2023
|
Yes
|
20%
|
||||||||||
|
Northeastern
|
Tauramena
|
Joint
Venture
|
E&P
|
BP
|
BP
Explotarion Co (Colombia) Ltd. - BP Santiago
|
50%
|
28
years
|
July 3,
2016
|
Yes
|
20%
|
||||||||||
|
Catatumbo-Orinoquía
|
Tibú
|
Business
Cooperation
|
E&P
|
Ecopetrol
S.A.
|
Tibú
Consortium formed by Petrobras Colombia Limited and Petrobras Energía de
Colombia
|
60%
|
Undetermined
|
Undetermined
|
no
|
8%
to 25%
|
||||||||||
|
Mid
– Magdalena Valley
|
Tisquirama
|
Joint
Venture
|
Production
|
Petroleos
del Norte S.A.
|
Petroleos
del Norte S.A – Petrosantander
|
60%
|
Until
economic limit
|
Until
economic limit
|
Yes
|
20%
|
||||||||||
|
Minor
Fields
|
Toca
|
Discovered
Undeveloped Field
|
Develop
Field
|
Campos
de Producción Consortium
|
Campos
de Producción Consortium
|
58%
|
10
years
|
July 12,
2015
|
Yes
|
8%
|
A-3
|
Minor
Fields
|
Tolima
B
|
Joint
Venture- Sole Risk
|
E&P
|
Vetra
Exploracion y Produccion Colombia
|
Vetra
Exploracion y Produccion Colombia
|
50%
|
28
years
|
June 12,
2014
|
Yes
|
20%
|
||||||||||
|
Central
|
Upia
B
|
Joint
Venture
|
E&P
|
Petrobras
|
PETROBRAS
|
50%
|
28
years
|
Feb 29,
2012
|
Yes
|
20%
|
||||||||||
|
Minor
Fields
|
Colorado
|
Services
and Technical Cooperation
|
Production
|
Universidad
Industrial de Santander
|
Universidad
Industrial de Santander
|
1%
|
10
Years
|
2016
|
No
|
20%
|
||||||||||
|
Minor
Fields
|
El
piñal
|
Joint
Venture- Sole Risk
|
E&P
|
Petrosantander
|
Petrosantander
|
50%
|
28
years
|
July 28,
2018
|
Yes
|
20%
|
||||||||||
|
Minor
Fields
|
Fortuna
|
Joint
Venture- Sole Risk
|
E&P
|
Emerald
Energy PLC Sucursal Colombia
|
Emerald
Energy PLC Sucursal Colombia
|
20%
|
28
years
|
December18,
2031
|
Yes
|
14,5
and 8%
|
||||||||||
|
Southern
|
Doima
|
Joint
Venture
|
E&P
|
Hocol
S.A.
|
Hocol
S.A
|
39%
|
30
years
|
February
16, 2039
|
Yes
|
6.4%
|
||||||||||
|
Mid
– Magdalena Valley
|
Guariquies
|
Sahered
Risk production contract
|
E&P
|
Ecopetrol
S.A.
|
Ramshorn
|
55%
and R Factor
|
25
years
|
May
24, 2029
|
Yes
|
8%
to 20%
|
||||||||||
|
Minor
Fields
|
Berlin
|
Discovered
Undeveloped Field
|
Develop
Field
|
Sadeven
s.a.
|
Sadeven
s.a.
|
35%
|
10
Years
|
July 17,
2015
|
Yes
|
8%
to 25%
|
||||||||||
|
Minor
Fields
|
Bravo
|
Discovered
Undeveloped Field
|
Develop
Field
|
Sadeven
s.a.
|
Sadeven
s.a.
|
7%
|
10
Years
|
July 17,
2015
|
Yes
|
8%
to 25%
|
||||||||||
|
Minor
Fields
|
Buganviles
|
Joint
Venture
|
E&P
|
Hollywell
Resources S.A. / Kappa Resources S.A.
|
Kappa
Resources S.A.
|
30%
|
28
años
|
27-Nov-08
|
Yes
|
8%
to 25%
|
||||||||||
|
Hocol
|
|
Guarrojo
|
|
E&P
|
|
E&P
|
|
Hocol
S.A.
|
|
|
100%
|
|
24
años
|
|
24-Feb-30
|
|
No
|
|
8%
to 25%
|
A-4
Ecopetrol
S.A. and Subsidiaries
Consolidated
Financial Statements
Years
ended December 31, 2009, 2008 and 2007
F-1
Ecopetrol
S.A. and Subsidiaries
Consolidated
Financial Statements
Years
ended December 31, 2009, 2008 and 2007
Contents
|
Reports
of Independent Registered Public Accounting Firms
|
F-3
|
|
|
Consolidated
Financial Statements
|
||
|
Consolidated
Balance Sheets
|
F-7
|
|
|
Consolidated
Statements of Financial, Economic, Social and Environmental
Activities
|
F-8
|
|
|
Consolidated
Statements of Changes in Shareholders’ Equity
|
F-9
|
|
|
Consolidated
Statements of Cash Flows
|
F-10
|
|
|
Notes
to Consolidated Financial Statements
|
|
F-12
|
F-2

REPORT
OF INDEPENDENT REGISTERED PUBLIC ACCOUNTING FIRM
July
14, 2010
To
the Board of Directors
and
Shareholders of Ecopetrol S. A.
In
our opinion, the accompanying consolidated balance sheets and the related
consolidated statements of financial, economic, social and
environmental activities, of changes in shareholders´ equity and of cash flows
present fairly, in all material respects, the financial position of Ecopetrol S.
A. and its subsidiaries (the “Company”) at December 31, 2009 and 2008, and
the results of their operations and their cash flows for each of the two years
in the period ended December 31, 2009 in conformity with generally accepted
accounting principles for Colombian Government Entities issued by the Contaduría
General de la Nación. Also in our opinion, the Company did not
maintain, in all material respects, effective internal control over financial
reporting as of December 31, 2009, based on criteria established in Internal
Control - Integrated Framework issued by the Committee of Sponsoring
Organizations of the Treadway Commission (COSO) because a material weakness in
internal control over financial reporting related to the preparation and
analysis of the differences existing between generally accepted accounting
principles for Colombian Government Entities and accounting principles generally
accepted in the United States of America, existed as of that date. A
material weakness is a deficiency, or a combination of deficiencies, in internal
control over financial reporting, such that there is a reasonable possibility
that a material misstatement of the annual or interim financial statements will
not be prevented or detected on a timely basis. The material
weakness referred
to above is described in “Management's Report on Internal Control over Financial
Reporting” appearing under Item 15. We considered this
material weakness in determining the nature, timing, and extent of audit tests
applied in our audit of the 2009 consolidated financial statements,
and our opinion regarding the effectiveness of the Company’s internal control
over financial reporting does not affect our opinion on those consolidated
financial statements. The Company's management is responsible for
these financial statements, for maintaining effective internal control over
financial reporting and for its assessment of the effectiveness of internal
control over financial reporting, included in management´s report referred to
above. Our responsibility is to express opinions on these financial
statements and on the Company's internal control over financial reporting based
on our audits (which was an integrated audit in 2009). We conducted
our audits in accordance with generally accepted auditing standards in Colombia
and the standards of the Public Company Accounting Oversight Board (United
States). Those standards require that we plan and perform the audits
to obtain reasonable assurance about whether the financial statements are free
of material misstatement and whether effective internal control over financial
reporting was maintained in all material respects.
F-3

To
the Board of Directors
and
Shareholders of Ecopetrol S. A.
July
14, 2010
Our
audits of the financial statements included examining, on a test basis, evidence
supporting the amounts and disclosures in the financial statements, assessing
the accounting principles used and significant estimates made by management, and
evaluating the overall financial statement presentation. Our audit of
internal control over financial reporting included obtaining an understanding of
internal control over financial reporting, assessing the risk that a material
weakness exists, and testing and evaluating the design and operating
effectiveness of internal control based on the assessed risk. Our
audits also included performing such other procedures as we considered necessary
in the circumstances. We believe that our audits provide a reasonable
basis for our opinions.
Accounting
principles generally accepted for Colombian Government Entities vary in certain
significant respects from accounting principles generally accepted in the United
States of America. Information relating to the nature and effects of
such differences is presented in Note 33 to the consolidated financial
statements.
A
company’s internal control over financial reporting is a process designed to
provide reasonable assurance regarding the reliability of financial reporting
and the preparation of financial statements for external purposes in accordance
with generally accepted accounting principles. A company’s internal
control over financial reporting includes those policies and procedures that
(i) pertain to the maintenance of records that, in reasonable detail,
accurately and fairly reflect the transactions and dispositions of the assets of
the company; (ii) provide reasonable assurance that transactions are
recorded as necessary to permit preparation of financial statements in
accordance with generally accepted accounting principles, and that receipts and
expenditures of the company are being made only in accordance with
authorizations of management and directors of the company; and
(iii) provide reasonable assurance regarding prevention or timely detection
of unauthorized acquisition, use, or disposition of the company’s assets that
could have a material effect on the financial statements.
Because
of its inherent limitations, internal control over financial reporting may not
prevent or detect misstatements. Also, projections of any evaluation
of effectiveness to future periods are subject to the risk that controls may
become inadequate because of changes in conditions, or that the degree of
compliance with the policies or procedures may deteriorate.
F-4
To
the Board of Directors
and
Shareholders of Ecopetrol S. A.
July
14, 2010
As
described in “Management´s Report on Internal Control over Financial Reporting”,
appearing under Item 15, management has excluded Refinería de Cartagena S. A.
and Hocol Petroleum Limited from its assessment of internal control over
financial reporting as of December 31, 2009, because they were acquired by the
Company in purchase business combinations during 2009. We have also excluded
these named subsidiaries from our audit of internal control over financial
reporting. For the year ended December 31, 2009, Refinería de Cartagena S. A.
and Hocol Petroleum Limited total assets represent 5% and 3%, respectively, and
total revenues represent 13% and 6%, respectively, of the related consolidated
financial statement amounts as of and for the year ended December 31, 2009,
prepared in accordance with accounting principles generally accepted for
Colombian Government Entities.
We do not
express an opinion or any other form of assurance on management´s statement
referring to the changes to be implemented to remediate the material weakness in
the internal control over financial reporting.
/s/
PricewaterhouseCoopers Ltda.
Bogotá,
Colombia
F-5
Report
of Independent Registered Public Accounting Firm
To the Shareholders of Ecopetrol S.A.
and subsidiaries
We have audited the accompanying
consolidated balance sheets of Ecopetrol S.A. and subsidiaries (“the Company”)
as of December 31, 2007 and 2006, and the related consolidated statements of
financial, economic and social activities, changes in equity, and cash flows for
each of the three years in the period ended December 31, 2007. These
financial statements are the responsibility of the Company's management.
Our responsibility is to express an opinion on these financial statements based
on our audits.
We conducted our audits in accordance
with the standards of the Public Company Accounting Oversight Board (United
States). Those standards require that we plan and perform the audit to obtain
reasonable assurance about whether the financial statements are free of material
misstatement. We were not engaged to perform an audit of the Company's internal
control over financial reporting. Our audits included consideration of internal
control over financial reporting as a basis for designing audit procedures
that are appropriate in the circumstances, but not for the purpose of
expressing an opinion on the effectiveness of the Company's internal control
over financial reporting. Accordingly, we express no such opinion. An
audit also includes examining, on a test basis, evidence supporting the amounts
and disclosures in the financial statements, assessing the accounting principles
used and significant estimates made by management, and evaluating the overall
financial statement presentation. We believe that our audits provide a
reasonable basis for our opinion.
In our opinion, the financial statements
referred to above present fairly, in all material respects, the consolidated
financial position of Ecopetrol S.A. and subsidiaries at December 31, 2007 and
2006, and the consolidated results of their financial, economic and social
activities and their cash flows for each of the three years in the period ended
December 31, 2007, in conformity with generally accepted accounting principles
for Colombian Governmental Entities issued by the Contaduría General de la
Nación, which differ in certain respects from accounting principles generally
accepted in the United States of America (see Note 33 to the consolidated
financial statements).
|
ERNST
& YOUNG AUDIT LTDA.
|
/s/ Francisco J. González R.
Francisco
J. González R.
Statutory
Auditor
Professional
Card 13442-T
Designated
by Ernst & Young Audit Ltda. – TR
530
|
Bogotá,
D.C., Colombia, February 15, 2008
(except
for Notes 32 and 33 to which the date is May 30, 2008)
F-6
Ecopetrol
S.A. and Subsidiaries
Consolidated
Balance Sheets
|
December 31
|
||||||||
|
2009
|
2008
|
|||||||
|
(In
millions of Colombian pesos)
|
||||||||
|
Assets
|
||||||||
|
Current
Assets:
|
||||||||
|
Cash
and cash equivalents (Notes 2 and
3)
|
$ | 3,562,119 | $ | 2,113,803 | ||||
|
Investments
(Notes 2 and
4)
|
462,258 | 3,749,919 | ||||||
|
Accounts
and notes receivable, net (Notes 2 and
5)
|
2,969,120 | 5,877,282 | ||||||
|
Inventories,
net (Note
6)
|
2,042,697 | 1,611,296 | ||||||
|
Advances
and deposits (Notes 2
and 7)
|
3,018,779 | 2,248,122 | ||||||
|
Pension
plan assets (Note
11)
|
- | 80,263 | ||||||
|
Prepaid
expenses (Note
8)
|
62,815 | 24,215 | ||||||
|
Total
current assets
|
12,117,788 | 15,704,900 | ||||||
|
Non-current
assets:
|
||||||||
|
Investments
(Notes 2 and
4)
|
3,710,739 | 8,688,320 | ||||||
|
Accounts
and notes receivable, net (Note
5)
|
226,781 | 194,912 | ||||||
|
Property,
plant and equipment, net (Note
9)
|
16,782,503 | 8,077,488 | ||||||
|
Natural
and environmental resources, net (Note
10)
|
11,155,381 | 8,054,049 | ||||||
|
Advances
and Deposits (Note
7)
|
253,681 | 271,121 | ||||||
|
Deferred
charges (Note
12)
|
1,886,529 | 1,595,683 | ||||||
|
Other
assets (Note
13)
|
3,034,698 | 935,978 | ||||||
|
Revaluations
(Note
21)
|
6,391,417 | 5,179,961 | ||||||
|
Total
assets
|
$ | 55,559,517 | $ | 48,702,412 | ||||
|
Liabilities
and Shareholders’ Equity
|
||||||||
|
Current
liabilities:
|
||||||||
|
Financial
obligations (Note
14)
|
$ | 437,081 | $ | 281,026 | ||||
|
Accounts
payable and related parties (Notes 2 and
15)
|
3,280,232 | 1,708,647 | ||||||
|
Taxes
payable (Note
16)
|
2,433,022 | 3,906,468 | ||||||
|
Labor
and pension plan obligations (Note
17)
|
165,463 | 129,658 | ||||||
|
Estimated
liabilities and provisions (Notes 2 and
18)
|
1,154,415 | 673,973 | ||||||
|
Total
current liabilities
|
7,470,213 | 6,699,772 | ||||||
|
Long-term
liabilities:
|
||||||||
|
Financial
obligations (Note
14)
|
5,714,354 | 5,473 | ||||||
|
Accounts
payable (Note
15)
|
51,154 | - | ||||||
|
Labor
and pension plan liabilities (Note
17)
|
2,669,331 | 2,164,787 | ||||||
|
Estimated
liabilities and provisions (Note
18)
|
3,411,977 | 2,542,791 | ||||||
|
Other
long-term liabilities (Note
19)
|
2,731,220 | 2,426,921 | ||||||
|
Total
liabilities
|
22,048,249 | 13,839,744 | ||||||
|
Non-controlling
interest (Note
20)
|
941,311 | 242,951 | ||||||
|
Shareholders’
equity (Note 21 and see
accompanying statement)
|
32,569,957 | 34,619,717 | ||||||
|
Total
liabilities and shareholders’ equity
|
$ | 55,559,517 | $ | 48,702,412 | ||||
|
Memorandum
accounts (Note
22)
|
$ | 138,884,829 | $ | 118,874,631 | ||||
The
accompanying notes are an integral part of these consolidated financial
statements
F-7
Consolidated
Statements of Financial, Economic, Social and Environmental
Activities
|
Year ended December 31
|
||||||||||||
|
2009
|
2008
|
2007
|
||||||||||
|
(In
millions of Colombian pesos, except for the net income per
share
expressed in pesos)
|
||||||||||||
|
Revenue
(Note
23)
|
||||||||||||
|
Local
sales
|
$ | 14,058,534 | $ | 21,597,999 | $ | 16,002,997 | ||||||
|
Foreign
sales
|
16,345,856 | 12,298,670 | 6,645,820 | |||||||||
|
FAEP
|
- | - | (316,497 | ) | ||||||||
|
Foreign
sales, net
|
16,345,856 | 12,298,670 | 6,329,323 | |||||||||
|
Total
revenue
|
30,404,390 | 33,896,669 | 22,332,320 | |||||||||
|
Cost
of sales (Note
24)
|
19,906,073 | 19,084,436 | 12,121,833 | |||||||||
| 10,498,317 | 14,812,233 | 10,210,487 | ||||||||||
|
Operating
expenses (Note
25)
|
||||||||||||
|
Administration
|
662,336 | 382,101 | 322,044 | |||||||||
|
Selling
|
1,962,642 | 1,772,774 | 929,305 | |||||||||
|
Operating
income
|
7,873,339 | 12,657,358 | 8,959,138 | |||||||||
|
Non-operating
income (expenses)
|
||||||||||||
|
Financial
income, net (Note
26)
|
495,833 | 4,101,252 | 93,628 | |||||||||
|
Pension
expenses (Notes 17 and
27)
|
(595,157 | ) | (1,144,925 | ) | (1,090,343 | ) | ||||||
|
Inflation
gain (Note
28)
|
22,355 | 30,473 | 41,132 | |||||||||
|
Other
(expenses) income, net (Note
29)
|
(545,526 | ) | 367,046 | (938,251 | ) | |||||||
|
Income
before income tax
|
7,250,844 | 16,011,204 | 7,065,304 | |||||||||
|
Income
tax (Note
16)
|
||||||||||||
|
Current
|
1,948,819 | 3,611,020 | 2,006,484 | |||||||||
|
Deferred
tax
|
165,210 | 770,962 | (120,972 | ) | ||||||||
| 2,114,029 | 4,381,982 | 1,885,512 | ||||||||||
|
Non-controlling
interest
|
(4,761 | ) | 455 | - | ||||||||
|
Net
income
|
$ | 5,132,054 | $ | 11,629,677 | $ | 5,179,792 | ||||||
|
Net
income per share
|
$ | 126.80 | $ | 287.35 | $ | 168.71 | ||||||
The
accompanying notes are an integral part of these consolidated financial
statements.
F-8
Ecopetrol
S.A. and Subsidiaries
Consolidated
Statements of Changes in Shareholders’ Equity
(In
millions of Colombian pesos, except the dividend per share)
Year
ended on December 31, 2009, 2008 and 2007
|
Subscribed and
paid-in capital
|
Additional
paid-in capital
|
Legal and
other reserves
|
Incorporated
Institutional equity and
other
|
Surplus from
equity method
|
Surplus from
revaluations
|
Public accounting
application effect
|
Retained
earnings
|
Total Equity
|
||||||||||||||||||||||||||||
|
Balance
at December 31, 2007
|
$ | 10,113,334 | $ | 3,850,814 | $ | 1,910,686 | $ | 108,730 | $ | (2,271 | ) | $ | 5,647,382 | $ | - | $ | 5,179,792 | $ | 26,808,467 | |||||||||||||||||
|
Distribution
of dividends ($115 per share)
|
- | - | 4,415 | - | - | - | - | (4,658,755 | ) | (4,654,340 | ) | |||||||||||||||||||||||||
|
Subscribed
capital receivable and additional paid-in capital
|
4,457 | 824,607 | - | - | - | - | - | - | 829,064 | |||||||||||||||||||||||||||
|
Addition
to additional paid in capital – execution of warranties
|
- | 3,855 | - | - | - | - | - | - | 3,855 | |||||||||||||||||||||||||||
|
Appropriation
to reserves
|
- | - | 517,639 | - | - | - | - | (517,639 | ) | - | ||||||||||||||||||||||||||
|
Adjustment
in translation of foreign subsidiaries and equity method
|
- | - | - | - | 143,018 | - | - | (3,398 | ) | 139,620 | ||||||||||||||||||||||||||
|
Addition
to incorporated institutional equity
|
- | - | - | 2,635 | - | - | - | - | 2,635 | |||||||||||||||||||||||||||
|
Surplus
from revaluations
|
- | - | - | - | 1,340,356 | (1,479,650 | ) | - | - | (139,294 | ) | |||||||||||||||||||||||||
|
Devaluation
in Property, Plant and Equipment
|
- | - | - | - | - | 1,012,229 | (1,012,229 | ) | - | - | ||||||||||||||||||||||||||
|
Pending
responsibility rulings
|
- | - | - | 814 | - | - | (781 | ) | - | 33 | ||||||||||||||||||||||||||
|
Net
income
|
- | - | - | - | - | - | - | 11,629,677 | 11,629,677 | |||||||||||||||||||||||||||
|
Balance
as of December 31, 2008
|
10,117,791 | 4,679,276 | 2,432,740 | 112,179 | 1,481,103 | 5,179,961 | (1,013,010 | ) | 11,629,677 | 34,619,717 | ||||||||||||||||||||||||||
|
Distribution
of dividends ($220 per share)
|
- | - | - | - | - | - | - | (8,903,953 | ) | (8,903,953 | ) | |||||||||||||||||||||||||
|
Subscribed
capital receivable and additional paid-in capital
|
- | 24,324 | - | - | - | - | - | - | 24,324 | |||||||||||||||||||||||||||
|
Addition
to additional paid-in capital - execution of
warranties
|
- | 16,720 | - | - | - | - | - | - | 16,720 | |||||||||||||||||||||||||||
|
Surplus
from revaluations
|
- | - | - | - | - | 1,211,456 | - | - | 1,211,456 | |||||||||||||||||||||||||||
|
Devaluation
in property, plant and equipment
|
- | - | - | - | - | - | 714,205 | - | 714,205 | |||||||||||||||||||||||||||
|
Appropriation
to legal reserve
|
- | - | 1,163,072 | - | - | - | - | (1,163,072 | ) | - | ||||||||||||||||||||||||||
|
Appropriation
to investment reserves
|
- | - | 1,563,692 | - | - | - | - | (1,563,692 | ) | - | ||||||||||||||||||||||||||
|
Addition
to incorporated institutional equity
|
- | - | - | 43,350 | - | - | - | - | 43,350 | |||||||||||||||||||||||||||
|
Adjustment
in translation of foreign subsidiaries and equity method
|
- | - | - | - | (288,956 | ) | - | - | - | (288,956 | ) | |||||||||||||||||||||||||
|
Unrealized
Income
|
1,040 | 1,040 | ||||||||||||||||||||||||||||||||||
|
Net
income
|
- | - | - | - | - | - | - | 5,132,054 | 5,132,054 | |||||||||||||||||||||||||||
|
Balance
as of December 31, 2009
|
$ | 10,117,791 | $ | 4,720,320 | $ | 5,159,504 | $ | 155,529 | $ | 1,192,147 | $ | 6,391,417 | $ | (298,805 | ) | $ | 5,132,054 | $ | 32,569,957 | |||||||||||||||||
The
accompanying notes are an integral part of these consolidated financial
statements.
F-9
Ecopetrol
S.A. and Subsidiaries
|
Year ended December 31
|
||||||||||||
|
2009
|
2008
|
2007
|
||||||||||
|
(In
millions of Colombian pesos)
|
||||||||||||
|
Cash
flows from operating activities
|
||||||||||||
|
Net
income
|
$ | 5,132,054 | $ | 11,629,677 | $ | 5,179,792 | ||||||
|
Adjustments
to reconcile net income to cash provided by operating
activities:
|
||||||||||||
|
Deferred
Income Tax, net
|
165,210 | 770,962 | (120,972 | ) | ||||||||
|
Depreciation
of Property, Plant and Equipment
|
1,262,643 | 691,488 | 750,074 | |||||||||
|
Amortizations
|
||||||||||||
|
Natural
Resources
|
1,274,979 | 947,788 | 572,743 | |||||||||
|
Abandonment
of installations
|
199,939 | 139,795 | 92,716 | |||||||||
|
Actuarial
Calculation
|
502,665 | 645,770 | 695,057 | |||||||||
|
Intangibles
|
152,235 | 37,496 | 14,892 | |||||||||
|
Deferred
charges
|
94,288 | 73,343 | 173,883 | |||||||||
|
Deferred
monetary correction, net
|
(22,355 | ) | (30,473 | ) | (41,132 | ) | ||||||
|
Provisions
|
||||||||||||
|
Accounts
receivable
|
30,734 | 2,275 | 20,276 | |||||||||
|
Inventories
|
33,161 | 49,380 | 115,944 | |||||||||
|
Property,
Plant and Equipment
|
127,826 | - | 1,790 | |||||||||
|
Legal
Proceedings
|
271,091 | 62,380 | 1,096,117 | |||||||||
|
Other
|
- | 103,062 | - | |||||||||
|
Recovery
of provisions
|
||||||||||||
|
Inventories
|
(118,652 | ) | (8,711 | ) | (21,010 | ) | ||||||
|
Property,
Plant and Equipment
|
(17,091 | ) | (18,813 | ) | - | |||||||
|
Legal
Proceedings
|
(83,258 | ) | (832,788 | ) | (281,507 | ) | ||||||
|
Other
|
(5,564 | ) | (139,554 | ) | (265,436 | ) | ||||||
|
Net
changes in operating assets and liabilities
|
||||||||||||
|
Decrease
(increase) Debtors
|
2,030,376 | 5,946,536 | (1,853,727 | ) | ||||||||
|
Decrease
(increase) Inventories
|
(291,819 | ) | (237,710 | ) | (397,365 | ) | ||||||
|
Decrease
(increase) Deferred and other assets
|
(1,408,834 | ) | (865,556 | ) | 1,198,025 | |||||||
|
(Decrease)
increase Accounts payable
|
1,536,580 | 423,182 | 334,558 | |||||||||
|
(Decrease)
increase Taxes payable
|
(1,473,446 | ) | 988,828 | 855,264 | ||||||||
|
(Decrease)
increase Labor obligations
|
37,684 | (9,246,210 | ) | 25,942 | ||||||||
|
(Decrease)
increase Estimated liabilities and provisions
|
(24,809 | ) | (697,407 | ) | 1,258,884 | |||||||
|
Net
cash provided by operating activities
|
9,405,637 | 10,434,740 | 9,404,808 | |||||||||
|
Cash
flows from investing activities
|
||||||||||||
|
Payment
in acquisition of companies, net of cash acquired
|
(1,082,580 | ) | (1,275,049 | ) | - | |||||||
|
Purchase
of investments
|
(7,939,870 | ) | (27,801,568 | ) | (33,328,213 | ) | ||||||
|
Investments
redemption and sale
|
15,917,196 | 27,054,516 | 28,296,998 | |||||||||
|
Investments
in natural and environmental resources
|
(3,613,355 | ) | (1,844,917 | ) | (2,013,947 | ) | ||||||
|
Additions
to Property, Plant and Equipment
|
(9,237,307 | ) | (4,861,067 | ) | (1,082,887 | ) | ||||||
|
Net
cash used in investing activities
|
(5,955,916 | ) | (8,728,085 | ) | (8,128,049 | ) | ||||||
|
Cash
flows from financing activities
|
||||||||||||
|
Non-controlling
interest
|
698,360 | 242,950 | - | |||||||||
|
Financial
obligations
|
6,140,588 | 106,942 | - | |||||||||
|
Debts
from credit and financing operations
|
21,205 | 128,778 | (39,305 | ) | ||||||||
|
Received
from associates – capitalization
|
41,044 | 832,919 | 5,359,968 | |||||||||
|
Payment
of dividends
|
(8,902,602 | ) | (4,654,340 | ) | (4,475,399 | ) | ||||||
|
Net
cash provided (used) by financing activities
|
(2,001,405 | ) | (3,342,751 | ) | 845,264 | |||||||
|
Net
increase (decrease) in cash and cash equivalents
|
1,448,316 | (1,636,096 | ) | 2,122,023 | ||||||||
|
Cash
and cash equivalents at beginning of year
|
2,113,803 | 3,749,899 | 1,627,876 | |||||||||
|
Cash
and cash equivalents at end of year
|
3,562,119 | 2,113,803 | 3,749,899 | |||||||||
F-10
The
accompanying notes are an integral part of these consolidated financial
statements
|
2009
|
2008
|
2007
|
||||||||||
|
Attachment
1 – Cash and cash equivalents detail
|
||||||||||||
|
Cash
|
$ | 82 | $ | 408 | $ | 399 | ||||||
|
Banks
and savings entities
|
1,508,846 | 1,395,199 | 1,160,069 | |||||||||
|
Special
and in-transit funds
|
1,690,815 | 703,577 | 123,251 | |||||||||
|
Temporary
investments
|
362,376 | 14,619 | 2,466,180 | |||||||||
|
Total
cash and cash equivalents
|
$ | 3,562,119 | $ | 2,113,803 | $ | 3,749,899 | ||||||
F-11
Ecopetrol
S.A. and Subsidiaries
Notes to
the Consolidated Financial Statements
Years
ended December 31, 2009, 2008 and 2007
(Amounts expressed in millions of
Colombian pesos, unless otherwise stated, except amounts in other
currencies, exchange rates and
income per share, which are expressed in unit pesos – throughout
these
financial statements pesos or Ps
refer to Colombian pesos and U.S. Dollar refers to United States
Dollar)
|
1.
|
Economic
Entity and Principal Accounting Policies and
Practices
|
Reporting
Entity
Ecopetrol
S.A. (hereinafter Ecopetrol or the Company) was organized by Law 165 of 1948 and
transformed through Extraordinary Decree 1760 of 2003 (added by Decree 409 of
2006) and Law 1118 of 2006 into a state-owned Company by shares and then into a
mixed economy entity of a commercial character, at national level, related to
the Ministry of Mines and Energy, for an indefinite period. Ecopetrol’s
corporate purpose is the development, in Colombia or abroad, of commercial or
industrial activities corresponding to or related with exploration, production,
refining, transportation, storage, distribution, and selling of hydrocarbons,
their by-products and associated products, and of subsidiary operations,
connected or complementary to these activities in accordance with applicable
regulations. Ecopetrol’s principal domicile is Bogotá, D.C. and it may establish
subsidiaries, branches and agencies in Colombia or abroad.
By means
of the transformation Decree 1760 of June 27, 2003, the integral administration
of the hydrocarbon reserves owned by the Colombian Nation (the Nation), and the
administration of non-strategic assets, represented by shares and the
participation in companies were separated from Ecopetrol. In addition,
Ecopetrol’s basic structure was changed and two entities were created: a) the
Agencia Nacional de Hidrocarburos (ANH) was created to hereinafter issue and
develop the Colombian petroleum policy (formerly the responsibility of
Ecopetrol), and b) Sociedad Promotora de Energía de Colombia S.A., which
received the non-strategic assets owned by Ecopetrol.
Law 1118
of December 27, 2006 changed the legal nature of Ecopetrol S.A., and authorized
the Company to issue shares to be placed in the equity market and acquired by
Colombian individuals or legal entities. Once the shares were issued and placed,
corresponding to 10.1% of the authorized capital, at the end of 2007, the
Company became a Mixed Economy Entity of a commercial nature, at a national
level, controlled by the Ministry of Mines and Energy.
Ecopetrol
entered into a deposit agreement with JPMorgan Chase Bank, N.A., as depositary,
for the issuance of ADRs evidencing ADSs. Each of the ADSs will
represent 20 of Ecopetrol’s common shares or evidence of the right to receive 20
of Ecopetrol’s common shares.
On
September 12, 2008, Ecopetrol submitted to the Securities and Exchange
Commission of the United States (the “SEC”) an application to register the
Company and to register and list the Company’s ADSs evidenced by ADRs on the New
York Stock Exchange (NYSE). The Company’s ADSs began trading on the
NYSE under the symbol “EC” on September 18, 2008.
On
December 3, 2009, the National Commission for the Surveillance of Companies and
Securities of Peru – CONASEV approved the listing of Ecopetrol’s ADRs on the
Lima Stock Exchange and the registration of such securities with the Public
Registry of the Securities Market. The ADRs began trading on the Lima
Stock Exchange on December 4, 2009 under the “EC” symbol.
By means
of a private document issued by Ecopetrol S.A.’s legal representative on
February 13, 2008, which was registered with the Chamber of Commerce of Bogotá,
it was announced that the Group of Companies comprising the Ecopetrol Corporate
Group are the parent Company Ecopetrol S.A. and its subsidiaries Black Gold Re
Limited, Ecopetrol Oleo é Gas do Brasil Ltda., Ecopetrol del Perú S.A. and
Ecopetrol America Inc. Subsequent thereto, the following companies were also
incorporated into the Group of Companies: Andean Chemicals Ltd., the parent
Company of Bioenergy and investor in Propilco S.A., which in turn is the parent
Company of Compounding and Masterbatching Industry Ltda
(“COMAI”).
F-12
Ecopetrol
S.A. and Subsidiaries
Notes to
the Consolidated Financial Statements
Years
ended December 31, 2009, 2008 and 2007
The
subsidiaries consolidated by Ecopetrol are:
|
Subsidiaries
|
Participation
Percentage
ECP
|
Activity
|
Subsidiaries
|
|||
|
Ecopetrol
Oleo é Gas do Brasil
Ltda.
|
100
|
Exploration,
exploitation, transportation, storage,
distribution
and selling of hydrocarbons, by-
|
||||
|
Ecopetrol
del Peru S.A.
|
100
|
products
and products, as well as investigation,
|
-
|
|||
|
Ecopetrol
America Inc.
|
100
|
development
and selling of energy sources
|
||||
|
Black
Gold Re Ltd.
|
100
|
Manage
all business associated with the total or partial, direct or indirect
execution of insurance and reinsurance of Ecopetrol’s and of its affiliate
and/or subsidiary Company risks.
|
-
|
|||
|
Andean
Chemicals Ltd.
|
100
|
Manage
all business associated with Ecopetrol’s, Propilco’s and its affiliate
companies’ operations.
|
Bioenergy
S.A.
Refinería
de Cartagena
Propileno
del Caribe
|
|||
|
ODL
Finance S.A.
|
65
|
Design,
construct, operate, sell, exploit and be the direct or indirect owner of
crude oil pipeline systems for hydrocarbon transportation of private use
in Colombia.
|
ODL
S.A.
ODL
- Colombia Branch office
|
|||
|
Propilco
S.A.
|
100
|
Production
and selling of polypropylene resin
|
Comai
S.A.
|
|||
|
Bionergy
S.A.
|
80
|
Construction
and operation of bio-fuel production plants, and others
related
|
-
|
|||
|
Ecopetrol
Global Energy
|
100
|
Investment
vehicle.
|
Ecopetrol
America Inc
|
|||
|
Ecopetrol
Transportation Company Limited
|
100
|
Investment
vehicle.
|
Ecopetrol
Pipelines International Limited
|
|||
|
Ecopetrol
Pipelines International Limited
|
100
|
Investment
vehicle.
|
-
|
|||
|
Oleoducto
Central S.A. - Ocensa
|
60
|
Crude
oil transportation through pipelines.
|
-
|
|||
|
Refineria
de Cartagena S.A.
|
100
|
Hydrocarbons
refining, selling and distribution.
|
-
|
|||
|
COMAI
- Compounding and Masterbatching Industry Ltda.
|
100
|
Manufacture
of polypropylene compounds and master batches for a wide range of
uses.
|
-
|
|||
|
Hocol
Limited
|
||||||
|
Hocol
Petroleum Limited
|
100
|
Investment
vehicle.
|
Hocol
S.A.
|
|||
|
Homcol
Cayman Inc
|
||||||
|
Oleoducto
de Colombia S.A. – ODC
|
66
|
Crude
oil transportation through pipelines.
|
-
|
Each
subsidiary’s individual financial statements as of December 31, 2009, 2008 and
2007 were used to prepare the consolidated financial statements.
F-13
Ecopetrol
S.A. and Subsidiaries
Notes to
the Consolidated Financial Statements
Years
ended December 31, 2009, 2008 and 2007
|
Number of contracts
|
||||||||||||||||||||
|
Contract Type
|
Ecopetrol
S.A.
|
Hocol
Petroleum
Ltd.
|
Ecopetrol
Oleo é Gas do
Brasil Ltda.
|
Ecopetrol
America Inc.
|
Ecopetrol del
Perú S.A.
|
|||||||||||||||
|
Exploration
|
51 | 9 | 9 | 22 | 5 | |||||||||||||||
|
Production
|
46 | 9 | - | 1 | - | |||||||||||||||
|
Discovered,
undeveloped fields
|
20 | - | - | - | - | |||||||||||||||
|
Sole
risk
|
15 | 1 | - | - | - | |||||||||||||||
|
Incremental
production
|
5 | 1 | - | - | - | |||||||||||||||
|
Production
service with risk
|
3 | - | - | - | - | |||||||||||||||
|
Business
collaboration
|
2 | - | - | - | - | |||||||||||||||
|
Services
and technical collaboration
|
1 | - | - | - | - | |||||||||||||||
| 143 | 20 | 9 | 23 | 5 | ||||||||||||||||
Ecopetrol
carries out production operations in 270 fields, of which it is the operator in
100 fields and 170 fields are operated by third parties.
Ecopetrol
Oleo é Gas do Brasil Ltda has entered into nine exploration contracts, six of
which are operated by Petrobras, one of which is operated by Hess, one of which
is operated by Repsol and one of which is operated by Andarko.
Ecopetrol
America Inc. has a 9.2% participation in a production contract known as “K2”
located in the Gulf of Mexico, which is operated by Anadarko.
Ecopetrol
del Peru S.A. has three exploration contracts known as “101”, “134” and “158”
which are operated by Talisman and two exploration contracts known as “110” and
“117” which are operated by Petrobras Energía del Peru S.A.
Principal
accounting policies and practices
The
Contaduría General de la Nación or CGN adopted new accounting principles for
Colombian state-owned entities in September 2007. These accounting principles
are known as the Régimen de Contabilidad Pública (Regime of Public Accounting or
RCP). Pursuant to CGN Communication No. 20079-101345 of September 28, 2007, RCP
became effective for Ecopetrol beginning with fiscal year ended December 31,
2008. Ecopetrol’s consolidated financial statements at and for the years ended
December 31, 2009 and 2008 have been prepared under RCP. Ecopetrol’s
consolidated financial statements for all prior years were prepared under the
Plan General de Contabilidad Pública (General Governmental Accounting Plan or
PGCP), the former accounting principles issued by the CGN for Colombian
state-owned entities. Both RCP and PGCP are referred to herein as Colombian
Government Entity GAAP.
RCP
modified various aspects of Colombian Government Entity GAAP. The
main modifications pertain to the following items:
|
·
|
Investments,
|
|
·
|
Property,
plant and equipment,
|
|
·
|
Intangibles,
|
|
·
|
Retirement
pensions and
|
|
·
|
Provisions.
|
A more
detail discussion of these RCP modifications is hereinafter provided for each of
the above-listed items.
F-14
Ecopetrol
S.A. and Subsidiaries
Notes to
the Consolidated Financial Statements
Years
ended December 31, 2009, 2008 and 2007
Principles
of Consolidation
The
consolidated financial statements include those of Ecopetrol (as Home Office),
Black Gold Re Ltd., Oleo é Gas Do Brasil Ltda., Ecopetrol del Perú S.A.,
Ecopetrol America Inc., Andean Chemical Ltd., ODL Finance S.A., Propilco S.A.,
Bioenergy S.A., Ecopetrol Global Energy, Ecopetrol Transportation Company
Limited, Ecopetrol Pipelines International Limited, Oleoducto Central S.A.
(OCENSA), Refinería de Cartagena S.A. (“Reficar”), Compounding and
Masterbatching Industry Ltda (COMAI), Hocol Petroleum Limited and Oleoducto de
Colombia S.A. (ODC) (collectively, “the Subsidiaries”), where Ecopetrol combined
direct and indirect, participation, is 100%, 100%, 100%, 100%, 100%, 65%, 100% ,
80%, 100%, 100%, 100%, 60%, 100%, 100%, 100%, 66% , respectively. These
financial statements were consolidated line by line and all transactions and
significant intercompany balances between companies have been
eliminated.
Presentation
Basis
The
preparation of the financial statements was carried out under Colombian
Government Entity GAAP standards and principles issued by the CGN and other
legal provisions. These principles may differ in certain aspects from those
established by other standards and other control authorities and the opinions on
specific matters issued by CGN prevail over other regulations. The accrual
method was applied for the accounting recognition of financial, economic and
social facts.
In
accordance with the rules for the inspection, supervision, and/or control of
Ecopetrol, a normative decision-making structure was established to define the
accounting treatment of operations not envisaged by the CGN, which is as
follows: i) Principal and permanent inspection, supervision, and
control: Residential Public Services Superintendency;
ii) Residual control: Companies Superintendency and iii)
Concurrent control: Financial Superintendency, on the activities of
the Company in its capacity as issuer in the stock
market. International Financial Reporting Standards (IFRS) are used
to measure the normative gap and the accounting principles generally accepted in
the United States are applied to operations related to crude oil and natural
gas.
Segments
In order
to assess the financial results of the Company, the Board of Directors has
divided the Company’s activities into five segments: Exploration and Production;
Refining; Transportation; Market and Supply, and Corporate. The segments are
divided for administrative reasons, and we are not required to disclose
information by segments under RCP.
Materiality
Concept
An
economic fact is material when, due to its nature and amount and the
circumstances that surround it, its knowledge or ignorance can significantly
alter the economic decisions of the users of the financial
information.
The
consolidated financial statements include specific headings in accordance with
legal requirements, or those representing 5% or more of total assets, current
assets, total liabilities, current liabilities, working capital, equity and
results of operations, as appropriate. In addition, lower amounts are shown when
they are deemed to contribute to a better interpretation of financial
information.
F-15
Notes to
the Consolidated Financial Statements
Years
ended December 31, 2009, 2008 and 2007
Use
of Estimates
The
preparation of the consolidated financial statements in accordance with RCP
requires that management make estimates and assumptions that could affect the
recorded amounts of assets, liabilities, results of activities and the attached
notes. These estimates are carried out in accordance with technical criteria
pursuant to regulations and current legal provisions. Actual or market values
could differ from such estimates.
Transactions
in Foreign Currency
Transactions
in foreign currency are entered into in accordance with applicable regulations
and they are recorded at appropriate exchange rates on the transaction date.
Balances denominated in foreign currency are reflected in Colombian pesos at the
representative market exchange rates of $2,044.23, $2,243.59 and $2,014.76 per
US$1 at December 31, 2009, 2008 and 2007, respectively.
The
adjustment for exchange differences generated by foreign currency assets and
liabilities is recorded against results of operations, except when such
adjustment is charged to capital investments in controlled entities, in which
case the equity is accounted.
Pursuant
to RCP, the financing costs (including foreign financing costs) associated with
assets purchased under construction form part of the overall costs of these
assets until they are ready to use.
The
Company in developing its crude oil exploration and production activities can
freely deal in foreign currency provided that it complies with the provisions of
the exchange regime.
With
respect to those subsidiaries whose financial statements were originally
presented in a currency other than the Colombian peso, the financial statements
were first converted to U.S. dollars and then to Colombian
pesos. Market exchange rates at December 31, 2009, 2008 and
2007, as the case may be, were used to translate balance sheet accounts,
weighted average exchange rates were used to translate income statement accounts
and historical exchange rates were used to translate equity statement
accounts.
Joint
Operation Contracts
Joint
venture or common-interest operation contracts are entered into between
Ecopetrol and third parties in order to share the risk, secure capital, maximize
operating efficiency and optimize the recovery of reserves. In these
joint ventures, one party is designated as the operator and each party takes its
share of the crude oil production according to its agreed participation.
Ecopetrol records these investments, revenues, costs and expenses on a timely
basis based on information reported by the operators. When Ecopetrol directly
operates the facilities, it records assets, revenues, costs and expenses,
recognizing at the same time the accounts receivable of the third party for
joint interest billings.
Cash
and Cash Equivalents
Cash and
cash equivalents are represented by cash in banks and highly liquid investments
maturing within three months following their acquisition.
For the
purpose of presentation, investments which have maturities of less than ninety
(90) days are regarded as cash equivalents and are treated as liquidity
management investments.
Cash from
operations with business partners corresponds to advances from both Ecopetrol
and its business partners in the agreed upon participation percentages set for
in the relevant joint venture contract, which will be managed in a joint
exclusive-use bank account.
F-16
Ecopetrol
S.A. and Subsidiaries
Notes to
the Consolidated Financial Statements
Years
ended December 31, 2009, 2008 and 2007
Financial
Derivative Instruments
The
Company enters into hedging agreements to protect itself from the fluctuations
of international crude oil prices and exchange rates. The difference between
amounts paid and income received under hedging operations is recognized as
financial income or expense in the statements of financial, economic, social and
environmental activities. Ecopetrol does not use these financial instruments for
speculative purposes.
Hedging
operations are carried out with banks and other counterparties with a credit
risk rating higher than or equal to A+.
The
Company makes periodic evaluations based on the market risk of hedging
operations, and together with the Board of Directors and Risk Department
determines the need for extension or early termination of the subscribed
contracts, when the result is ineffective vis-á-vis the hedged items. In the
event of settlement, the financial and contractual effects are recognized in the
results of operation, as established by RCP.
Investments
The
investments are classified as: i) Liquidity Management Investments, ii)
Investments for Policy Purposes and, iii) Equity Investments.
Liquidity
management investments correspond to resources invested in debt and equity
securities with the objective of obtaining profits through short term price
fluctuations. Their initial recording corresponds to their historical cost and
they are updated based upon valuation methodologies issued by the Colombian
Finance Superintendency.
Policy
purpose investments are made up of debt securities of national or foreign
entities, acquired in compliance with macroeconomic or internal policies of the
entity, which include investments held through their maturity date and those
available for sale, the former being those which are kept for at least one (1)
year as of the first day on which they were classified for the first time, or
when they were reclassified.
Investments
held to maturity are updated based on the Internal Rate of Return (IRR) included
in the methodologies adopted by the Finance Superintendency and the investments
for the purpose of macroeconomic policy and available for sale should be updated
based on methodologies adopted by the Finance Superintendency for tradable
investments.
Equity
investments are classified in controlled and uncontrolled entities. Equity
investments in controlled entities are recognized at their acquisition cost
whenever it is less than the net book value; otherwise, they are recognized at
the net book value and the difference between the cost of purchase and the net
book value corresponds to goodwill. Their values are updated through the equity
method, as established in Resolution 145 of 2008, issued by the
CGN.
Beginning
in 2008, the RCP incorporated the concept of significant influence for the
recognition of investments in associated entities and established the equity
method to update the value of these investments.
Significant
influence is defined as the power that the entity has, regardless if the
percentage of ownership is less than or equal to 50%, to participate in the
setting and overseeing of financing and operational policies of another entity
for the purpose of obtaining profits from that entity.
Significant
influence may be present in one or more of the following aspects:
|
·
|
Representation
on the Board of Directors or equivalent regulatory organ of the associated
entity.
|
|
·
|
Participation
in policy-making processes.
|
|
·
|
Significant
transactions between the investor and the associated
entity.
|
|
·
|
Secondment
of officers, or
|
|
·
|
Supply
of essential technical
information.
|
F-17
Ecopetrol
S.A. and Subsidiaries
Notes to
the Consolidated Financial Statements
Years
ended December 31, 2009, 2008 and 2007
In
accordance with the Technical Standard Related to Assets of the RCP, the
investments made in foreign currency should be recognized applying the
representative market rate (TRM) of the transaction date. The value must be
re-expressed periodically based on the TRM. For foreign subsidiaries, the equity
method should be applied in Colombian pesos, following the translation of the
financial statements.
Receivables
and Provision for Doubtful Accounts
Receivables
are recognized at their original amount or at the amount accepted by the debtor,
which is subject to periodic updating in accordance with current legal
provisions or agreed contractual terms.
The
provision for doubtful accounts is reviewed and updated periodically in
accordance with the aged analysis of balances, and the evaluation of the
recoverability of individual accounts. The Company carries out the necessary
administrative and legal procedures to recover delinquent accounts receivable as
well as the collection of interest from customers that do not comply with
payment policies.
It is
only possible to write-off accounts and notes receivable against the provision
for doubtful accounts when there is reasonable legal certainty of the total or
partial loss of the asset.
Inventories
Inventories
include assets extracted, transformed and acquired for any reason, to be sold,
intended for transformation and consumed in the production process, or as a part
of services rendered. Ecopetrol uses the perpetual inventory system to account
for raw materials.
Inventories
are recorded at historical costs or at purchase cost, which includes direct and
indirect charges incurred to prepare the inventory for sale or production
conditions.
This
valuation is measured under the weighted average method, considering the
following parameters:
|
•
|
Crude
oil and natural gas inventories for the Company’s own production, at
production cost.
|
|
•
|
Crude
oil purchases, at acquisition costs, including transportation and delivery
costs incurred.
|
|
•
|
Finished
goods inventory, at total production costs (at each
refinery).
|
|
•
|
Work
in progress inventory, at production
costs.
|
|
•
|
Raw
material inventory, at weighted average
cost.
|
Raw
materials and supplies in joint ventures are controlled by the operator and
reported in a joint account at acquisition costs (recorded in the original
currency at average costs). Inventory consumptions are charged to the joint
venture as expense or property, plant and equipment or natural environmental
properties, as appropriate.
Additionally,
inventories are valued at the lower of market value and average cost; and at the
actual cost incurred for in-transit inventories. At the end of the year,
provisions are calculated to recognize impairment, obsolescence, excess,
slow-moving or loss of market value.
Property,
Plant and Equipment and Depreciation
Property,
plant and equipment are recorded at the historical cost, adjusted for inflation
until 2001, which includes financial expenses and exchange differences from
foreign currency financing incurred until the asset is placed in service. When
an asset is sold or retired, the adjusted cost and accumulated depreciation are
written off and any gain or loss is recognized in results of
operations.
F-18
Ecopetrol
S.A. and Subsidiaries
Notes to
the Consolidated Financial Statements
Years
ended December 31, 2009, 2008 and 2007
|
%
|
||||
|
Buildings
and pipelines
|
5 | |||
|
Plants
and equipment
|
10 | |||
|
Transportation
equipment
|
20 | |||
|
Computers
|
33.3 | |||
Regular
disbursements for maintenance and repairs are included in expenses. Significant
disbursements which improve efficiency or extend asset’s useful life are
capitalized.
Until
2007, devaluation had been recorded as the lesser value of the revaluations of
assets and in equity without effect on the results of the
period. However, in compliance with RCP, for 2008 revaluations were
reclassified to the equity account known as “Effect of the Application of the
Rules for Public Accounting”. Beginning in 2009, devaluation of property, plant
and equipment is charged to results.
Natural
and Environmental Resources
The
Company applies the internationally recognized successful efforts method of
accounting for investments in exploration and production areas. The acquisition
of geological and geophysical seismic information is expensed as incurred,
before the discovery of proved reserves. Acquisition costs are capitalized until
the time in which it is determined if exploration drilling was successful. If
exploration drilling results are unsuccessful, all incurred costs are expensed
Once a project is sanctioned for development, the accumulated acquisition and
exploration costs are transferred to the oil investments account. Costs
capitalized also include asset retirement cost. Asset and liability balances
related to asset retirement costs are updated annually. Production and support
equipment are accounted for on a cost basis and are part of the Property, Plant
and Equipment subject to depreciation.
These
investments are amortized using the technical units-of-production method on the
basis of proved developed reserves without royalties by field. The reserves are
based on technical studies prepared internally by the Company’s Department of
Reservoirs and approved by the Company’s Reserves Committee, which follow
estimation methodologies recommended by international organizations of
specialists in hydrocarbon reserves. Proved reserves consist of estimated
quantities of crude oil and natural gas which geological and engineering data
demonstrate with reasonable certainty to be recoverable in future years from
known reservoirs under existing economic and operating conditions, that is,
prices and costs as of the date the estimate is made.
When a
well is declared productive, in compliance with the information provided by the
Exploration Vice-Presidency of Ecopetrol, tangible property (property, plant and
equipment) is capitalized and intangible assets are recognized as an investment
in natural and environmental properties.
When it
is determined that a well located in an exploration zone has no proved reserves,
it is considered a dry or not commercial well and accumulated costs are expensed
in the same period this is known. Costs incurred in geology, seismic and similar
activities are recorded in the income statement when incurred.
The
estimation of hydrocarbon reserves is subject to several uncertainties inherent
to the determination of the proved reserves, production recovery rates, the
timeliness in which investments are made to develop the reservoirs and the
degree of maturity of the fields.
Support
equipment and other property and equipment are depreciated over their estimated
useful lives.
F-19
Ecopetrol
S.A. and Subsidiaries
Notes to
the Consolidated Financial Statements
Years
ended December 31, 2009, 2008 and 2007
The
Company recorded as reserves within the account “natural and environmental
resources” the Nation’s contributions represented by crude oil and natural gas
reserves derived from the reversion of concessions of oilfield areas in favor of
the Nation, given prior to the effectiveness of Decree 1760 of 2003. Reserves
were valued according to the technical-economic model where the value per barrel
resulted from the relation between net present value at a discount rate and
total proved reserves on the contribution date. Depletion is calculated using
the units of production method.
Since
Ecopetrol became an issuer in the Bolsa de Valores de Colombia (BVC) and the
NYSE, the Company has used the methodology approved by the SEC for the
calculation of reserves. On December 31, 2008, the SEC issued a final
rule revising disclosure requirements relating to oil and gas reserves as
contained in Rule 4-10(a) of Regulation S-X. Under the new SEC rule,
reserves are required to be estimated by applying (x) the unweighted arithmetic
average of the first-day-of-the-month price for each month within the year to
(y) year-end quantities of proved reserves (the “SEC average price
methodology”). Prior to this revision, the SEC required reserves to
be estimated by applying (x) the year-end WTI price to (y) year-end quantities
of proved reserves (the “SEC year-end price methodology”). The
Company’s proved reserves as of December 31, 2009 are based on the SEC average
price methodology for U.S. GAAP purposes, which mirrors the average price
methodology used by the Company in Colombia during this period. The Company’s
proved reserves as of December 31, 2008 are based on the SEC year-end price
methodology for purposes of U.S. GAAP which mirrors the year-end price
methodology used by the Company in Colombia during this
period. However, the Company’s proved reserves as of December 31,
2007 are estimated using average prices methodology used by the Company and
under the SEC year-end price methodology for U.S. GAAP purposes. As a
result, the quantity of proved reserves for this period differs from the
estimated quantities of proved reserves in accordance with the SEC year-end
methodology. See Note 33 herein for a discussion of the differences
between Colombian Government Entity GAAP and U.S. GAAP.
On March
7, 2007, Decree 727 was issued replacing Decree 2625 of 2000, which includes
regulations related to reserves valuation and accounting for hydrocarbons
reserves of the Nation in the Company’s financial statements. In addition, it
orders Ecopetrol to register the value of the hydrocarbons exploration or
production rights that it owns. This recording is carried out in memorandum
accounts in compliance with the opinion issued by the CGN; however, these
memorandum accounts are not part of the Company’s balance sheet.
Impairment
of Long-Lived Assets
At the
end of each year, the net value of long-lived assets held and in use is
reviewed, including those to be dismantled or when circumstances or changes
occur indicating that the book value may not be recoverable. The recording of
provisions usually coincides with the formalization of an action plan by
Ecopetrol, including, among others, the offer of such assets to third
parties.
Deferred
Charges
Deferred
charges include deferred income tax, which results from the temporary
differences arising due to the different ways of determining book profit and
taxable income at the end of each period.
They also
include the investments made while negotiating the business collaboration
contract between Ecopetrol and Schlumberger for the purpose of obtaining
incremental production in the Casabe field. Such investments are amortized based
on the units-of-production of the field. In addition, they include
the costs incurred in the Sensor (SAP) project, which costs are amortized using
the straight line method over five (5) years.
F-20
Ecopetrol
S.A. and Subsidiaries
Notes to
the Consolidated Financial Statements
Years
ended December 31, 2009, 2008 and 2007
Other
Assets
Other
assets includes goodwill, which corresponds to the difference between the value
of purchase of the equity investments in controlled entities and their net book
value, which reflects the economic benefits hoped to be achieved from the
investment, originating in good name, specialized personnel, reputation of
privileged credit, prestige due to sale of better products and services,
favorable location and expectations of new businesses, among
others.
Goodwill
is amortized based on generally accepted methodologies during the term in which
the investment recovery is expected, which are reviewed and updated annually
based on actual results and future projections applied to
investments.
Intangible
assets are defined as immaterial goods or goods with no material existence,
which may be identified and controlled and from which future use, exploitation,
economic benefits or service might be obtained under reliable monetary
measurements.
Software,
licenses, patents, and rights, among others, are recognized as intangibles under
the “other assets” heading for their acquisition, development or production
cost. Intangible assets are amortized during (i) periods when it is expected
that benefits will be derived from the incurred costs and expenses or (ii)
during the term of legal or contractual coverage.
Advances
received from Ecogas to cover Build, Operate, Maintain and Transfer (BOMT)
obligations
Pursuant
to specific instructions from CGN, as a result of the sale of Ecogas by the
National Government, the Company recognized as deferred income the net present
value of the future payments scheme, in connection with Ecopetrol’s liability
related to BOMT contractors. These liabilities are due in 2017, the year when
these contractual obligations end.
Revaluations
|
a.
|
Investments
|
Revaluations
and surplus from revaluations correspond to the difference between the
historical cost and the intrinsic value or the price quoted on a stock
exchange.
|
b.
|
Property,
Plant and Equipment
|
Valorizations
and valorization surplus of property, plant and equipment in the equity
correspond to the difference between net book value and the market value for
real estate or the current value in use for plant and equipment, determined by
specialists registered with the Colombian Real Estate Association or by suitable
technical personnel, respectively.
Following
the guidelines established by the CGN under the RCP, the methodology used to
appraise property, plant and equipment is the current value of the assets in use
by going businesses (VAU as per its acronym in Spanish) for economic valuation
of assets, considering current facilities condition and their useful lives in
terms of production capability and ability to generate income. The
revaluation of the property, plant, and equipment includes the excess difference
between the respective appraisal value of these assets and their net book
value.
F-21
Ecopetrol
S.A. and Subsidiaries
Notes to
the Consolidated Financial Statements
Years
ended December 31, 2009, 2008 and 2007
Updating
the appraisal of movable assets is not mandatory when their historic cost,
considered individually, is lower than 35 current monthly legal minimum wages.
Additionally, updating the appraisal of property, plant and equipment as located
in high risk areas is not mandatory.
Financial
Obligations
In
accordance with RCP, public credit operations correspond to any action or
contracts which, under compliance with legal regulations on public credit, are
addressed to supply the Company with resources, goods and services under
specific payment terms such as loans, issue and placement of bonds and public
credit securities, and vendors’ credit.
In regard
to loans, public credit operations must be recorded for the actual disbursed
amount while bonds and securities placed are recorded for their nominal
amount.
Accounts
Payable – Suppliers
Correspond
to obligations incurred by Ecopetrol with third parties in order to comply with
its corporate purpose.
Income
Tax
The
provision for income tax was calculated at the official rate of 33% in 2009 and
2008 and at the official rate of 34% in 2007, respectively, on the greater of
presumptive or taxable income by the accrual method.
The
effect of timing differences involving the payment of a lower or higher income
tax in the current year is recorded as a deferred tax liability or asset,
respectively, provided that a reasonable expectation exists that such
differences will reverse and in the case of the deferred tax asset, that
sufficient taxable income will be generated to recover the tax. The deferred tax
balance was calculated at the rate of 33%.
The
Company uses the special deduction for investment in real productive fixed
assets equivalent to 40% of the effective investment carried out during the
fiscal year. If such assets are sold, or they are no longer used in income
producing activity prior to the expiration of their useful lives, the Company
must reimburse the proportional value of the deduction taken during the
remaining productive lives of the assets in the income tax return corresponding
to the fiscal period in which such fact arises.
Labor
and Pension Obligations
The
system for salaries and fringe benefits for Ecopetrol personnel is governed by
the Collective Labor Agreement 01 of 1977, and in the absence thereof, by the
Labor Code. In addition to fringe benefits, Ecopetrol employees are entitled to
receive additional benefits covered by previous regulations that depend on the
place, type of work, length of service, and basic salary. Annual interest of 12%
is paid on accumulated severance amounts in favor of each employee and the
payment of indemnities is provided for when special circumstances arise that
result in the non voluntary termination of the contract, and in periods other
than the qualifying period.
The
actuarial calculation includes active employees with indefinite term contract,
pensioners and heirs, for pension, health care and education plan; it likewise
includes pension bonuses for temporary employees, active employees and voluntary
retirements.
All
social benefits of employees who joined the Company before 1990 are the direct
responsibility of Ecopetrol, without the involvement of the Colombian social
security entity or institution. The cost of health services of the employee and
his/her relatives registered with the Company is determined by means of the
morbidity table, prepared on the basis of facts occurring during 2009. Likewise,
the experience of Ecopetrol is considered for the calculation of educational
allowances, based on the annual average cost of each business segment,
subdivided in accordance with the class of studies: pre-school, primary, high
school and university.
F-22
Ecopetrol
S.A. and Subsidiaries
Notes to
the Consolidated Financial Statements
Years
ended December 31, 2009, 2008 and 2007
For
employees who joined the Company as of the effectiveness of Law 50 of 1990, the
Company makes periodic contributions for severance, pensions and labor related
injuries to the respective funds that assume all these obligations. Likewise,
Law 797 of January 29 of 2003 determined that Ecopetrol employees who joined the
Company as of January 29, 2003 will be subject to the provisions of the General
Pension Regime.
Pursuant
to Decree 941 of 2002, once the actuarial calculation was approved by the
Ministry of Finance in October 2008 and the mechanism for transfer
(“commutation”) of the corresponding liability was approved by the Ministry of
Social Protection on December 29, 2008, the Company as of December 31, 2008
transferred (“commuted”) the amounts corresponding to its pension liabilities,
to autonomous pension trust funds (PAP). The amount transferred as of December
31, 2008 was $10,092,528 million, which also implied removing the pension trust
fund assets and their corresponding pension liabilities for the same amount from
the balance sheet and transferring them to the memorandum accounts.
The
transferred funds, as well as their earnings, cannot change their destination
nor be restored to the Company until all the pension obligations have been
fulfilled.
The
transferred liabilities correspond only to the pension obligations; those
relating to health care and education services remain Ecopetrol’s direct
obligations.
Purchase
of hydrocarbons
The
Company purchases hydrocarbons that the ANH receives from all the production in
Colombia, at prices established according to section four of Law 756 of 2002 and
Resolution 18-1709 of 2003 of the Ministry of Mines and Energy, considering the
international prices of reference.
Additionally,
it purchases hydrocarbons both from partners as well as from other producers in
Colombia and abroad to meet the needs and operating plans of the
Company.
Recognition
of Income
Income
from crude oil and natural gas sales is recognized at the time of transfer of
title to the buyer, including its risks and benefits. In the case of refined and
petrochemical products, income is recognized when products are shipped by the
refinery; subsequently, they are adjusted in accordance with the volumes
actually delivered. Income from transportation services is recognized when
products are transported and delivered to the buyer in accordance with sale
terms. In other cases, income is recognized at the time it is earned and a true,
probable and quantifiable right to demand its payment arises.
Late
payment interest income on the collection of accounts receivable is recognized
following prudence and realization principles.
Starting
in March 2007, price differentials for gasoline and diesel are granted by the
Nation to refiners such as Ecopetrol, as provided in Law 1111 of 2006 (Budget
Law). Income from said price differentials corresponds to the difference between
the regulated price and the international parity price and was recorded by the
Company in 2008 in accordance with the Ministry of Mines and Energy Resolution
No. 181496 of September 2008, which replaced resolution 180414 of March 2007.
Under the new resolution, interest income relating to these price differentials
was recorded for 2008. In addition, in 2008, both the value of and interest on
the price differential were calculated in U.S. dollars, generating a net gain
due to the difference in the Colombian peso/U.S. dollar exchange rate.
Furthermore, Resolution 182439 and Decree 4839 of December 2008 established the
procedure for the recognition of the price differentials when the amount is
negative (the difference between the parity price and the regulated price is
negative).
In 2009,
the price differential and related interest income was again calculated in
Colombian pesos, including the recognition of interest related to these price
differentials.
F-23
Ecopetrol
S.A. and Subsidiaries
Notes to
the Consolidated Financial Statements
Years
ended December 31, 2009, 2008 and 2007
Cost
of Sales and Expenses
Costs are
recognized at their historic value both for goods purchased for sale, goods
produced for sale and services rendered. Costs are disclosed according to the
sale operation generating such cost.
Expenses
correspond to amounts required for the development of the ordinary activity and
include those caused by extraordinary events. Expenses are disclosed in
accordance with their nature and the occurrence of extraordinary
events.
Costs and
expenses are recognized upon receipt of goods or services or when there is
certainty of the occurrence of the economic fact. Fuel shortages and losses due
to thefts and explosions are recorded as non- operating expenses.
Abandonment
of Fields
The
Company recognizes the liability for future environmental obligations and its
corresponding entry is capitalized as a greater value of natural and
environmental resources assets. The estimation includes plugging costs and
abandonment of wells, dismantling of facilities and environmental recovery of
areas and wells. Amortization is imputed to production costs, using the
technical units-of-production method based on proved developed reserves. Changes
resulting from new estimates of the liability for abandonment and environmental
restoration are capitalized to the respective asset. The related liability is
estimated in foreign currency and is adjusted for exchange difference at the end
of each year as a greater or lesser value of the asset.
Since the
extension of certain association contracts, the abandonment costs are assumed by
the associates in the percentages of participation established in each
contract. Ecopetrol has not allocated funds in order to cover these
obligations, with the exception of association contracts Casanare, Cravo Norte,
Guajira and Cravo Norte Pipeline; however, regarding these contracts, the
Company is required to cover all costs arising from abandonment-related
activities before the contracts were extended.
Accounting
for Contingencies
As of the
date of these consolidated financial statements, conditions that result in
losses for the Company might exist, which will only be known if future specific
circumstances arise. Management, the legal Vice Presidency and legal counsel
evaluate these situations based on their nature, the likelihood that they will
materialize, and the amounts involved, to decide on any changes to the amounts
accrued and/or disclosed. This analysis includes current legal proceedings
against the Company.
After the
change to RCP in 2007, the Company began adjusting the methodology used to
evaluate its legal proceedings and any contingent liability there
under. Such methodology was completed in 2008 and is based on the
credit system of the Nation, which is used by the Ministry of the Interior and
of Justice. Prior to October 31, 2008, Ecopetrol recognized its legal
proceedings under the methodology it had used in the past; however, the new
methodology was applied at December 31, 2008.
Risks
and Uncertainties
The
Company is subject to certain operational risks which are customary to the oil
and gas industry in Colombia, such as terrorism, product theft, crude oil
international price changes, environmental damages, and variations in the
estimations of hydrocarbon reserves.
Net
Income per Share
Net
income per share is calculated based on the weighted average of outstanding
shares of the Company during the year.
F-24
Ecopetrol
S.A. and Subsidiaries
Notes
to the Consolidated Financial Statements
Years
ended December 31, 2009, 2008 and 2007
Memorandum
Accounts
These
accounts represent facts or circumstances from which rights or obligations could
derive and affect the Company. However, Memorandum Accounts are not included in
the Company’s balance sheet.
Reclassifications
Certain
figures in the financial statements of 2008 and 2007 were reclassified for
comparative purposes with those of 2009, as a result of the establishment of new
accounting parameters resulting from the operational reorganization of certain
areas, such as those related to administrative resources, operating expenses,
costs of sales and RCP modifications to Colombian Government Entity
GAAP.
|
2.
|
Assets
and liabilities denominated in foreign
currency
|
Transactions
and balances in foreign currency are translated into Colombian pesos at the
exchange rate certified by the Finance Superintendency of Colombia.
At
December 31, 2009 and 2008, the consolidated financial statements of Ecopetrol
included the following assets and liabilities denominated in foreign currency
(which are translated into Colombian pesos at the closing exchange rates,
$2,044.23 and $2,243.59 for US$1, for 2009 and 2008, respectively).
|
2009
|
2008
|
|||||||||||||||
|
Thousands of
US$ dollars
|
Equivalent
millions of COP
|
Thousands of
US$ dollars
|
Equivalent
millions of COP
|
|||||||||||||
|
Assets:
|
||||||||||||||||
|
Cash
and cash equivalents
|
1,133,720 | $ | 2,317,585 | 1,504,857 | $ | 3,376,282 | ||||||||||
|
Investments
|
1,602,179 | 3,275,223 | 4,243,339 | 9,520,313 | ||||||||||||
|
Accounts
and notes receivables
|
792,713 | 1,620,487 | 1,930,970 | 4,332,305 | ||||||||||||
|
Advances
and deposits
|
120,923 | 247,194 | 171,040 | 383,744 | ||||||||||||
|
Other
assets
|
713,950 | 1,459,478 | - | - | ||||||||||||
| 4,363,485 | $ | 8,919,967 | 7,850,206 | $ | 17,612,644 | |||||||||||
|
Liabilities:
|
||||||||||||||||
|
Financial
obligations
|
1,601,090 | $ | 3,272,996 | 103,171 | 231,473 | |||||||||||
|
Estimated
liabilities and provisions
|
1,519,417 | 3,106,037 | 926,695 | 2,079,124 | ||||||||||||
|
Accounts
payable
|
607,508 | 1,241,886 | 347,957 | 780,670 | ||||||||||||
|
Other
liabilities
|
503,388 | 1,029,041 | 557,331 | 1,250,422 | ||||||||||||
| 4,231,403 | $ | 8,649,960 | 1,935,154 | $ | 4,341,689 | |||||||||||
|
Net
Asset Position
|
132,082 | $ | 270,007 | 5,915,052 | $ | 13,270,955 | ||||||||||
F-25
Ecopetrol
S.A. and Subsidiaries
Notes to
the Consolidated Financial Statements
Years
ended December 31, 2009, 2008 and 2007
|
3.
|
Cash
and cash equivalents
|
|
2009
|
2008
|
|||||||
|
Banks
and saving entities
|
$ | 1,508,846 | $ | 1,395,199 | ||||
|
Special
and revolving funds (1)
|
1,690,815 | 703,577 | ||||||
|
Cash
|
82 | 408 | ||||||
|
Sight
investments (2)
|
362,376 | 14,619 | ||||||
| $ | 3,562,119 | $ | 2,113,803 | |||||
|
(1)
|
Includes
savings in special funds in local and foreign currencies in the amount of
$1,690,781 (2008 - $698,980) and investments in overnight operations in
the amount of $34 (2008 - $4,597). The year-to-year difference
results from higher liquidity needs to support new business opportunities
during the first quarter of 2009.
|
|
(2)
|
Represented
by trust rights and time deposits of $167,403 from Reficar, $124,271 from
Hocol, $54,366 from Ocensa, $6,790 from Oleoducto de Colombia, $6,865 from
Propilco, $2,373 from Ecopetrol Oleo e Gas do Brasil, $305 from Ecopetrol,
and $3 from Bioenergy.
|
Restrictions on banks and
corporations
Payment
made by Ecopetrol to the Neuro Science Center of Cuba for US$98,447 is currently
withheld by the ABN bank, Miami Agency (now Banco Itau Internacional) as part of
the embargo of the United States against Cuba following the Office of Foreign
Assets Control (OFAC) regulations.
|
4.
|
Investments
|
|
2009
|
2008
|
|||||||
|
Current:
|
||||||||
|
Fixed
yield:
|
||||||||
|
Investment
Funds administered by third parties (1)
|
$ | 197,485 | $ | 2,077,218 | ||||
|
Bonds
and securities of private or foreign entities (1)
|
60,330 | 1,099,487 | ||||||
|
Trust
Funds
|
77,929 | 326,941 | ||||||
|
Bonds
issued by the Colombian Government
|
126,375 | 224,053 | ||||||
|
Specific
destination Funds – Legal Contingencies
|
- | 10,212 | ||||||
|
Treasury
Securities – TES
|
- | 6,970 | ||||||
|
Time
deposits
|
- | 5,038 | ||||||
|
Other
investments
|
139 | - | ||||||
|
Total
Current
|
$ | 462,258 | $ | 3,749,919 | ||||
|
Long
Term:
|
||||||||
|
Variable yield - Shares
(3)
|
$ | 777,503 | $ | 2,404,695 | ||||
|
Fixed
yield:
|
||||||||
|
Bonds
and securities of foreign entities
|
1,834,779 | 5,094,596 | ||||||
|
Bonds
issued by the Colombian Government
|
602,039 | 754,054 | ||||||
|
Specific
destination Funds – Legal Contingencies
|
380,463 | 378,461 | ||||||
|
Treasury
Securities- TES
|
94,252 | 56,529 | ||||||
|
Other
investments (2)
|
21,703 | - | ||||||
| 3,710,739 | 8,688,335 | |||||||
|
Less:
Provision for investments protection
|
- | (15 | ) | |||||
|
Total
Long term
|
$ | 3,710,739 | $ | 8,688,320 | ||||
|
(1)
|
During
year 2009 an amount of US$839 million was collected from deposits in three
investment funds which have been destined to working capital and new
acquisitions of the Company.
|
|
(2)
|
Corresponds
to the remaining resources in amount of $21,584 derived from the
production of the Teca Field – Cocorná Association Contract, which are
currently held in trust waiting for the decision of the Arbitration Court
on the continuity of the association contract with Mansarovar Energy
Colombia Ltd.
|
|
(3)
|
A
summary of long-term investments of variable yield as of December 31,
2009, valued under the cost method, is set forth
below:
|
F-26
Ecopetrol
S.A. and Subsidiaries
Notes to
the Consolidated Financial Statements
Years
ended December 31, 2009, 2008 and 2007
|
Number of shares
and/or quotas
|
Participation
percentage
|
Valuation
date
|
Historical
Cost
|
Intrinsic /
Market Value
|
Revaluations
(provisions)
|
||||||||||||||||
|
STRATEGIC
|
|||||||||||||||||||||
|
Sociedad
Portuaria de Olefinas
|
249,992 | 49.99 |
Dec-2009
|
$ | 317 | $ | 417 | $ | 100 | ||||||||||||
|
Zona
Franca de Cartagena S.A.
|
244 | 8.18 |
Dec-2009
|
239 | 669 | 431 | |||||||||||||||
|
Sociedad
Portuaria del Dique
|
10 | 0.5 |
Dec-2009
|
5 | 8 | 3 | |||||||||||||||
|
Total
strategic
|
$ | 561 | $ | 1,094 | $ | 534 | |||||||||||||||
|
NON
STRATEGIC
|
|||||||||||||||||||||
|
Empresa
de Energía de Bogotá
|
6,310,980 | 7.35 |
Nov-2009
|
$ | 169,421 | $ | 503,027 | $ | 333,606 | ||||||||||||
|
Interconexión
Eléctrica S.A
|
58,925,480 | 5.48 |
Dec-2009
|
69,549 | 764,853 | 695,304 | |||||||||||||||
|
Propaise
S.A.
|
18,744,883 | 0.99 |
Dec-2009
|
10 | - | - | |||||||||||||||
|
Total
non-strategic
|
$ | 238,980 | $ | 1,267,880 | $ | 1,028,910 | |||||||||||||||
A summary
of variable yield long-term investments, valued under the equity method, is set
forth below:
|
Number of
shares and/or
quotas
|
Participation
percentage
|
Valuation
date
|
Historical
Cost
|
Adjusted cost
|
Equity method
effect
|
||||||||||||||||
|
Significant
influence
|
|||||||||||||||||||||
|
Serviport
S.A.
|
53,714,116 | 49.00 |
Nov-09
|
$ | 2,081 | $ | 7,433 | $ | 5,352 | ||||||||||||
|
Ecodiesel
Colombia S.A.
|
7,750,000,000 | 50.00 |
Nov-09
|
7,750 | 7,921 | 171 | |||||||||||||||
|
Offshore
International Group(1)
|
250 | 50.00 |
Dec-09
|
404,664 | 363,199 | (41,465 | ) | ||||||||||||||
|
Invercolsa
S.A.(2)
|
889,410,047 | 31.76 |
Nov-09
|
60,282 | 148,844 | 88,562 | |||||||||||||||
|
Arces
Group (3)
|
10,001 | 100.00 |
Dec-09
|
6,000 | 3,919 | (2,081 | ) | ||||||||||||||
|
Amadine
Holding (3)
|
500 | 100.00 |
Dec-09
|
6,657 | 6,646 | (11 | ) | ||||||||||||||
|
Total
|
$ | 487,434 | $ | 537,962 | $ | 50,528 | |||||||||||||||
In
accordance with the RCP, Ecopetrol’s investments in associated companies in
which it has significant influence were valued under the equity method.
Significant influence is defined as the power that the entity has, regardless if
the percentage of ownership is less than or equal to 50%, to participate in the
setting and overseeing of financing and operational policies of another entity
for the purpose of obtaining profits from that entity.
|
(1)
|
Offshore
International Group Inc.
|
In
February 2009, Ecopetrol in association with the Korea National Oil Corporation
- KNOC acquired a 100% stake (50% for each participating company) in Offshore
International Group Inc. (“OIG”) for a total purchase price of $2,453,316
(US$992 million). The transaction generated goodwill of $821,994. The purchase
price is subject to the adjustments which may arise as described in section 2.2
of the related purchase agreement.
OIG is
the U.S. parent of Petro-tech Peruana S.A. Petro-Tech Peruana S.A. is
a Company whose economic activity is the exploration, production and processing
of hydrocarbons in Perú.
|
(2)
|
Restrictions
over variable income long-term
investments
|
The 28th
Bogota Civil Court issued a decision on February 8, 2007 under which Mr.
Fernando Londoño was condemned to return to Ecopetrol the shares that he
acquired in Inversiones de Gases de Colombia S.A. (Invercolsa) as well as the
amount of dividends he received from those shares. The decision was
appealed and is currently awaiting a ruling by at the High Court of Justice
(Civil Court).
In
addition, the Council of State ruled in favor of Ecopetrol in a popular lawsuit
filed by two citizens, whom were ordered the return their shares and dividends
received from these shares to Ecopetrol. The decision was affirmed by
the Constitutional Court. However, because this lawsuit was based on
constitutional jurisdiction, it is not final until decision is reached in a
court of civil jurisdiction.
On
September 10, 2009, the Administrative Court of Cundinamarca issued an order
requiring the legal representative of Invercolsa in order to cancel a collateral
warranty of some of its stock in favor of the Arrendadora Financiera Bolivariana
Internacional S.A. (AFIB). Although Invercolsa was eventually
represented legally, the registry of stock in Ecopetrol’s name is pending a
final decision by the 27th Civil Court of Bogotá.
|
(3)
|
As
of December 31 of 2009 these companies were undergoing liquidation
proceedings
|
F-27
Ecopetrol
S.A. and Subsidiaries
Notes to
the Consolidated Financial Statements
Years
ended December 31, 2009, 2008 and 2007
A summary
of the balances of Ecopetrol’s consolidated subsidiaries as of December 31, 2009
is set forth below:
|
Company
|
Assets
|
Liabilities
|
Equity
|
Results of the
period
|
||||||||||||
|
Black
Gold Re Ltd
|
$ | 230,652 | $ | 5,384 | $ | 225,268 | $ | 14,705 | ||||||||
|
Ecopetrol
Oleo é Gas do Brasil Ltda.
|
31,340 | 10,928 | 20,412 | (139,743 | ) | |||||||||||
|
Ecopetrol
America Inc
|
1,249,328 | 12,880 | 1,236,448 | (318,609 | ) | |||||||||||
|
Ecopetrol
del Perú S.A.
|
81,228 | 10,450 | 70,778 | (3,347 | ) | |||||||||||
|
Andean
Chemicals Limited
|
1,717,785 | 1,193,676 | 524,109 | (65,597 | ) | |||||||||||
|
Polipropileno
del Caribe S.A.
|
983,246 | 354,652 | 628,594 | 47,712 | ||||||||||||
|
Compounding
and Masterbatching Industry Ltda – COMAI.
|
76,539 | 28,516 | 48,023 | 27,114 | ||||||||||||
|
Bioenergy
S.A.
|
64,928 | 6,593 | 58,335 | (2,476 | ) | |||||||||||
|
ODL
Finance S.A.
|
1,381,021 | 959,245 | 421,776 | 12,419 | ||||||||||||
|
Oleoducto
Central
|
1,773,783 | 63,824 | 1,709,959 | - | ||||||||||||
|
Ecopetrol
Transportation Company
|
509,716 | 27,418 | 482,298 | 634 | ||||||||||||
|
Hocol
Petroleum Limited
|
1,901,317 | 608,693 | 1,292,624 | 330,590 | ||||||||||||
|
Oleoducto
de Colombia
|
311,550 | 27,090 | 284,460 | (22,027 | ) | |||||||||||
|
Refinería
de Cartagena
|
3,046,293 | 572,520 | 2,473,773 | (127,854 | ) | |||||||||||
|
Ecopetrol
Global Energy
|
1,242,406 | 8 | 1,242,398 | (316,887 | ) | |||||||||||
A summary
of the balances of Ecopetrol’s consolidated subsidiaries as of December 31, 2008
is set forth below:
|
Company
|
Assets
|
Liabilities
|
Equity
|
Results of the
period
|
||||||||||||
|
Black
Gold Re Ltd
|
$ | 245,470 | $ | 13,277 | $ | 232,193 | $ | 18,515 | ||||||||
|
Ecopetrol
Oleo é Gas do Brasil Ltda.
|
17,727 | 20 | 17,707 | (1,907 | ) | |||||||||||
|
Ecopetrol
America Inc.
|
1,294,425 | 30,068 | 1,264,357 | (243,317 | ) | |||||||||||
|
Ecopetrol
del Perú S.A.
|
25,588 | 6,103 | 19,485 | (43,333 | ) | |||||||||||
|
Andean
Chemicals Limited
|
392,795 | 15,816 | 376,979 | 8,255 | ||||||||||||
|
Polipropileno
del Caribe S.A.
|
970,284 | 410,340 | 559,944 | 53,346 | ||||||||||||
|
ODL
Finance S.A.
|
680,004 | 3,376 | 676,628 | 186 | ||||||||||||
F-28
Ecopetrol
S.A. and Subsidiaries
Notes to
the Consolidated Financial Statements
Years
ended December 31, 2009, 2008 and 2007
The
economic activity and the net results for companies in which Ecopetrol has
investments for the years 2009 and 2008 are set forth below:
|
Company
|
Economic Activity
|
Net result
2009
|
Net result
2008
|
|||||||
|
Interconexión
Eléctrica S.A. (1)
|
Operation,
maintenance, transmission and sale of electrical power.
|
$ | 371,996 | $ | 179,495 | |||||
|
Empresa
de Energía de Bogotá S.A. ESP. (2)
|
Electrical
energy power transmission
|
$ | 786,888 | $ | 230,756 | |||||
|
Invercolsa
S.A. (1)
|
Investments
in energy sector companies including activities inherent to the industry
and commerce of hydrocarbons and mining.
|
$ | 71,903 | $ | 111,773 | |||||
|
Serviport
S.A. (1)
|
Provision
of support services for loading and unloading of crude oil ships, supply
of equipment for the same purpose, load inspections and
measurements.
|
$ | 941 | $ | (500 | ) | ||||
|
Ecodiesel
Colombia S.A. (1)
|
Production,
sale and distribution of bio-fuels and oleo-chemicals.
|
$ | 336 | $ | 76 | |||||
|
Offshore
International Group
|
Exploration,
development, production and processing of hydrocarbons.
|
$ | 69,845 | $ | - | |||||
|
(1)
|
Information
as of November 30, 2009
|
|
(2)
|
Preliminary
information as of December 31, 2009
|
The
classification of treasury investments depends on the use of the funds, their
destination and maturity. Investments whose maturity or realization is shorter
than one year and those which will be utilized within the next business cycle
are held for short term.
A summary
of the Company’s main long-term fixed yield investments as of December 31, 2009
to be redeemed during the next five years is set forth below:
|
Maturity
|
1 - 3 Years
|
3 - 5 Years
|
> 5 Years
|
Total
|
||||||||||||
|
Bonds
and securities of foreign entities
|
$ | 1,681,593 | $ | 101,843 | $ | 51,343 | $ | 1,834,779 | ||||||||
|
Bonds
issued by the Colombian Government
|
311,367 | 290,672 | - | 602,039 | ||||||||||||
|
Treasury
Securities - TES
|
36,149 | 45,905 | 12,198 | 94,252 | ||||||||||||
|
Other
investments
|
21,703 | - | - | 21,703 | ||||||||||||
|
Fund
for legal contingencies
|
61,227 | 139,009 | 180,227 | 380,463 | ||||||||||||
| $ | 2,112,039 | $ | 577,429 | $ | 243,768 | $ | 2,933,236 | |||||||||
A
summary of the Company’s main long-term fixed yield investments as of December
31, 2008 to be redeemed during the next five years is set forth
below:
|
Maturity
|
1 - 3 Years
|
3 - 5 Years
|
> 5 Years
|
Total
|
||||||||||||
|
Private
Bonds
|
$ | 4,145,510 | $ | 757,805 | $ | 191,281 | $ | 5,094,596 | ||||||||
|
Bonds
and securities issued by the Colombian Government
|
144,180 | 442,297 | 167,577 | 754,054 | ||||||||||||
|
Treasury
Securities - TES
|
31,317 | 13,863 | 11,349 | 56,529 | ||||||||||||
|
Fund
for legal contingences
|
131,250 | 159,726 | 87,485 | 378,461 | ||||||||||||
| $ | 4,452,257 | $ | 1,373,691 | $ | 457,692 | $ | 6,283,640 | |||||||||
F-29
Ecopetrol
S.A. and Subsidiaries
Notes to
the Consolidated Financial Statements
Years
ended December 31, 2009, 2008 and 2007
|
5.
|
Accounts
and notes receivable
|
|
2009
|
2008
|
|||||||
|
Current
portion
|
||||||||
|
Customers:
|
||||||||
|
Local
|
$ | 975,743 | $ | 555,405 | ||||
|
Foreign
|
1,202,517 | 530,495 | ||||||
|
Price
differentials to be received from the Ministry of Mines and Energy
(1)
|
263,513 | 3,970,115 | ||||||
|
Other
debtors
|
300,586 | 350,227 | ||||||
|
Related
parties
|
- | 237,236 | ||||||
|
Reimbursements
and investment yields (2)
|
99,798 | 111,977 | ||||||
|
Association
contracts – Joint operations
|
85,582 | 52,821 | ||||||
|
Doubtful
accounts
|
62,038 | 33,008 | ||||||
|
Accounts
receivable from employees
|
16,780 | 29,951 | ||||||
|
Notes
receivable
|
14,661 | 22,680 | ||||||
|
Industrial
service customers
|
11,965 | 17,046 | ||||||
| 3,033,183 | 5,910,961 | |||||||
|
Less
allowance for doubtful accounts
|
(64,063 | ) | (33,679 | ) | ||||
|
Total
current portion
|
$ | 2,969,120 | $ | 5,877,282 | ||||
|
Long-term
portion
|
||||||||
|
Local
customers
|
$ | - | $ | 859 | ||||
|
Loans
to employees (3)
|
204,647 | 149,051 | ||||||
|
Credit
portfolio (4)
|
22,129 | 41,010 | ||||||
|
Others
|
5 | 3,992 | ||||||
|
Total
long-term portion
|
$ | 226,781 | $ | 194,912 | ||||
The aging
determination and classification of the accounts receivable to customers at
December 31, 2009, pursuant to maturity, is set forth below:
|
Maturity in days
|
||||||||||||
| 0 - 180 | 181 - 360 |
More than 361*
|
||||||||||
|
Current
accounts receivable
|
$ | 2,037,815 | $ | - | $ | - | ||||||
|
Past
Due accounts receivable
|
127,899 | 5,777 | 6,769 | |||||||||
| 2,165,714 | 5,777 | 6,769 | ||||||||||
|
Local
customers
|
974,241 | 75 | 1,427 | |||||||||
|
Foreign
customers
|
1,191,473 | 5,702 | 5,342 | |||||||||
| $ | 2,165,714 | $ | 5,777 | $ | 6,769 | |||||||
The aging
determination and classification of the accounts receivable to customers at
December 31, 2008, pursuant to maturity, is set forth below:
|
Maturity in days
|
||||||||||||
| 0 - 180 | 181 - 360 |
More than 361*
|
||||||||||
|
Current
accounts receivable
|
$ | 1,036,244 | $ | 2,131 | $ | 859 | ||||||
|
Past
Due accounts receivable
|
47,525 | - | 1,507 | |||||||||
| 1,083,769 | 2,131 | 2,366 | ||||||||||
|
Local
customers
|
555,405 | - | - | |||||||||
|
Foreign
customers
|
530,495 | - | - | |||||||||
| $ | 1,085,900 | $ | - | $ | - | |||||||
The
movement of the allowance for doubtful accounts is set forth
below:
|
2009
|
2008
|
2007
|
||||||||||
|
Initial
balance
|
$ | 33,679 | $ | 28,665 | $ | 23,847 | ||||||
|
Additions
(New provisions)
|
34,608 | 3,100 | 15,591 | |||||||||
|
Adjustments
to existing allowance
|
(3,445 | ) | 2,319 | 3,064 | ||||||||
|
Recoveries
|
(779 | ) | (405 | ) | (13,837 | ) | ||||||
|
Ending
balance
|
$ | 64,063 | $ | 33,679 | $ | 28,665 | ||||||
F-30
Ecopetrol
S.A. and Subsidiaries
Notes to
the Consolidated Financial Statements
Years
ended December 31, 2009, 2008 and 2007
|
(1)
|
Corresponds
to accounts receivable from the Ministry of Mines and Energy for a total
amount of $263,513 regarding the recognition of the regular motor gasoline
and Diesel price differential and the opportunity cost. During the year
payments in amount of $4,105,909 were received corresponding to the
opportunity cost and price differential of the regular motor gasoline and
Diesel for year 2008. The opportunity cost accrued for 2009 was of
$235,704.
|
|
(2)
|
Made
up by (i) dividends receivable from Interconexión Eléctrica S.A. – ISA in
amount of $2,117 and (ii) return and yield of investments receivable in
amount of $96,669.
|
|
(3)
|
By
means of Leg contracts 058-80 of 1980 and 4008928 of 2006, the
administration, management and control of loans granted to employees by
the Company were given to Cavipetrol. In its capacity as administrator,
Cavipetrol acts as custodian in its database and financial system of the
detail by employee of said loans and their respective
conditions.
|
The
future collections of accounts receivable from Cavipetrol accounts at December
31, 2009 are as follows:
|
Year
|
Amount
|
|||
|
2010
|
$ | 25,488 | ||
|
2011
|
27,782 | |||
|
2012
|
30,282 | |||
|
2013
|
33,008 | |||
|
2014
and following
|
88,087 | |||
| $ | 204,647 | |||
There are
no other important restrictions to accounts and notes receivables’
recovery.
|
(4)
|
A
summary of the long-term recovery portfolio for each of the following five
years is provided below:
|
|
Year 1
|
Year 2
|
Year 3
|
Year 4
|
Year 5
|
||||||||||||||||||||
|
Applicable interest rate
|
Dec-10 to
Nov-11
|
Dec-11 to
Nov-12
|
Dec-12 to
Nov-13
|
Dec-13 to
Nov-14
|
Dec-14 to
Nov-15
|
More than 5
years
|
||||||||||||||||||
|
DTF
previous month
|
$ | 87 | $ | 14 | $ | - | $ | - | $ | - | $ | - | ||||||||||||
|
CPI
+ 6
|
9 | 19 | 19 | 5 | - | - | ||||||||||||||||||
|
CPI
+ 6
|
46 | 61 | 61 | 49 | - | - | ||||||||||||||||||
|
CPI
|
37 | 18 | 18 | 18 | 19 | 79 | ||||||||||||||||||
|
ECP
opportunity rate -Bank Average
|
285 | - | - | - | - | - | ||||||||||||||||||
|
DTF
+ 6 points
|
10 | - | - | - | - | - | ||||||||||||||||||
|
Greater
between 6% EA and CPI for semester starting July 2009
|
9,311 | 2,164 | 6,500 | - | - | - | ||||||||||||||||||
|
DTF
+ 6.25% T.A. percent points in its equivalent to E.A, starting on March
30, 2011
|
3,300 | - | - | - | - | - | ||||||||||||||||||
|
Total
annual recovery
|
$ | 13,085 | $ | 2,276 | $ | 6,598 | $ | 72 | $ | 19 | $ | 79 | ||||||||||||
|
Total
|
$ | 22,129 | ||||||||||||||||||||||
|
DTF:
|
Average
of interest rates for fixed term deposits, promulgated by the
Superintendency of Finance.
|
|
CPI:
|
Consumer
Price Index, as indicated by the Colombian
Government
|
|
ECP:
|
Ecopetrol
|
|
EA:
|
Effective
Annual Rate
|
Additionally,
the long-term credit portfolio includes $1,318 corresponding to benefits granted
to the employees of the Asociación Guajira and the Asociación Las Monas through
housing loans.
No other
significant restrictions exist for the recovery of accounts and notes
receivable.
F-31
Ecopetrol
S.A. and Subsidiaries
Notes to
the Consolidated Financial Statements
Years
ended December 31, 2009, 2008 and 2007
|
6.
|
Inventories
|
|
2009
|
2008
|
|||||||
|
Finished
Products:
|
||||||||
|
Fuels
|
$ | 555,359 | $ | 465,388 | ||||
|
Petrochemicals
|
101,302 | 108,352 | ||||||
|
Crude
oil
|
763,800 | 602,210 | ||||||
|
Natural
gas
|
- | 41 | ||||||
|
Purchased
Products:
|
||||||||
|
Crude
oil
|
23,212 | 35,568 | ||||||
|
Fuel
|
84,189 | 132,295 | ||||||
|
Petrochemicals
|
5,704 | 31,934 | ||||||
|
Natural
gas
|
- | - | ||||||
|
Raw
Materials:
|
||||||||
|
Crude
oil
|
74,343 | 96,970 | ||||||
|
Petrochemicals
|
29,045 | 29,596 | ||||||
|
Natural
gas
|
- | - | ||||||
|
In-process
Products:
|
||||||||
|
Fuel
|
316,129 | 203,328 | ||||||
|
Petrochemicals
|
19,458 | 3,826 | ||||||
|
In
transit inventories
|
21,870 | 11,279 | ||||||
|
Materials
for the production of assets
|
93,298 | 9,907 | ||||||
|
Packing
material
|
- | 2,144 | ||||||
|
In
transit materials
|
- | 5,922 | ||||||
|
Total
|
2,087,709 | 1,738,760 | ||||||
|
Less
allowance for inventories
|
(45,012 | ) | (127,464 | ) | ||||
|
Total
|
$ | 2,042,697 | $ | 1,611,296 | ||||
Below are
the adjustments made to the allowance for inventories for the years ended
December 31, 2009, 2008 and 2007:
|
2009
|
2008
|
2007
|
||||||||||
|
Initial
balance
|
$ | 127,464 | $ | 80,971 | $ | 752 | ||||||
|
Adjustments
to allowance, net
|
(82,452 | ) | 46,493 | 80,219 | ||||||||
|
Ending
balance
|
$ | 45,012 | $ | 127,464 | $ | 80,971 | ||||||
|
7.
|
Advances
and Deposits
|
|
2009
|
2008
|
|||||||
|
Short
term
|
||||||||
|
Official
Entities (1)
|
$ | 2,350,646 | $ | 1,465,401 | ||||
|
Partners
in joint operations (2)
|
474,920 | 578,368 | ||||||
|
Advances
to contractors
|
27,907 | 19,805 | ||||||
|
Agreements
|
19,364 | 16,880 | ||||||
|
Customs
agents
|
12,611 | 14,484 | ||||||
|
Advances
to suppliers
|
42,496 | 82,623 | ||||||
|
Related
parties
|
89,782 | 2,528 | ||||||
|
Advances
for assets acquisition
|
- | 67,308 | ||||||
|
Advances
to employees
|
1,053 | 725 | ||||||
| 3,018,779 | 2,248,122 | |||||||
|
Long-term
|
||||||||
|
Advances
and deposits
|
253,681 | 271,121 | ||||||
|
Total
|
$ | 3,272,460 | $ | 2,519,243 | ||||
|
(1)
|
Includes
transactions with the National Tax and Customs Administration - DIAN for
advance income tax for 2009 in an amount totaling $1,889,555, self
withholdings, and others in an amount totaling $461,091 (in 2008,
$498,671).
|
|
(2)
|
Joint
operations:
|
F-32
Ecopetrol
S.A. and Subsidiaries
Notes to
the Consolidated Financial Statements
Years
ended December 31, 2009, 2008 and 2007
|
2009
|
2008
|
|||||||
|
Contracts
in which Ecopetrol is not the operator:
|
||||||||
|
BP
Exploration Company Colombia
|
$ | 25,845 | $ | 112,230 | ||||
|
Meta
Petroleum Ltd.
|
73,450 | 80,092 | ||||||
|
Mansarovar
Energy Colombia Ltd.
|
3,712 | 48,579 | ||||||
|
Occidental
Andina LLC
|
21,386 | 36,996 | ||||||
|
Petrobras
Colombia Limited
|
33,877 | 31,438 | ||||||
|
Anadarko
Petroleum Corporation
|
2,495 | 25,410 | ||||||
|
Petróleo
Brasileiro S.A. - Petrobras
|
120 | - | ||||||
|
Occidental
de Colombia Inc.
|
10,864 | 16,997 | ||||||
|
BHP
Billiton Petroleum Colombia
|
5,111 | 9,129 | ||||||
|
Hocol
S.A.
|
- | 7,370 | ||||||
|
Petrobras
Internacional Braspetro B.V.
|
5,042 | 3,716 | ||||||
|
CEPSA
Colombia S.A.
|
7,258 | 2,228 | ||||||
|
Perenco
Colombia Limited
|
1,262 | 1,770 | ||||||
|
Kappa
Resources Colombia Ltd.
|
1,694 | 1,199 | ||||||
|
Chevron
Petroleum Company
|
76,693 | - | ||||||
|
Other
operations
|
61,253 | 64,961 | ||||||
|
Contracts
in which Ecopetrol is the operator:
|
||||||||
|
Oleoducto
Caño Limón
|
55,931 | 120,797 | ||||||
|
La
Cira
|
51,415 | 8,303 | ||||||
|
Tibú
|
4,120 | 3,087 | ||||||
|
CRC
2004 – 01
|
1,559 | 730 | ||||||
|
JOA
Caño Sur
|
6,135 | 200 | ||||||
|
JOA
Platanillo
|
- | 22 | ||||||
|
Shared
risk Catleya
|
706 | 20 | ||||||
|
Other
operations
|
24,992 | 3,094 | ||||||
|
Total
|
$ | 474,920 | $ | 578,368 | ||||
|
8.
|
Prepaid
expenses
|
|
2009
|
2008
|
|||||||
|
Insurance
(1)
|
$ | 20,199 | $ | 14,247 | ||||
|
Others
(2)
|
42,616 | 9,968 | ||||||
|
Total
|
$ | 62,815 | $ | 24,215 | ||||
|
(1)
|
$13,242
corresponds to Ecopetrol S.A and is valid to April
2010.
|
|
(2)
|
Includes
mainly the resources paid by America Inc. for cash call in amount of
$38,603; and $2,698 for purchase and maintenance of the vehicles assigned
to top officers of Ecopetrol through
leasing.
|
|
9.
|
Property,
Plant and Equipment, net
|
|
2009
|
2008
|
|||||||
|
Plant
and equipment
|
$ | 13,438,144 | $ | 11,291,735 | ||||
|
Construction
in progress (1)
|
6,487,411 | 3,435,379 | ||||||
|
Pipelines,
networks and lines (2)
|
13,171,399 | 4,081,579 | ||||||
|
Buildings
|
2,184,484 | 1,194,298 | ||||||
|
Equipment
on deposit and in transit
|
1,221,822 | 949,724 | ||||||
|
Transportation
equipment and other fixed assets
|
389,728 | 286,864 | ||||||
|
Computer
equipment
|
313,891 | 281,037 | ||||||
|
Land
|
302,420 | 76,660 | ||||||
|
Total
|
37,509,299 | 21,597,276 | ||||||
|
Accumulated
depreciation
|
(20,226,621 | ) | (12,426,330 | ) | ||||
|
Provision
for property, plant and equipment (3)
|
(500,175 | ) | (1,093,458 | ) | ||||
|
Total
|
$ | 16,782,503 | $ | 8,077,488 | ||||
F-33
Ecopetrol
S.A. and Subsidiaries
Notes to
the Consolidated Financial Statements
Years
ended December 31, 2009, 2008 and 2007
|
(1)
|
The
representative amounts corresponds to infrastructure projects such as the
Barrancabermeja’s Refinery modernization project and fuel hydro treatment
plant; drilling projects of Apiay, Suria and Reforma wells – Direct
Operation; drilling project of the Santiago de las Atalayas well – Joint
Operation; start-up of the injection plants of Isla IV in the Mid
Magdalena; construction of the Chichimene Station; construction of the
naphtha pipeline Mansilla – Tocancipá, and the physical infrastructure
adaptation project of Ecopetrol’s
premises.
|
As a
result of the utilization of the syndicated loan to finance diverse investment
projects, $100,299 which were capitalized corresponds to the net effect of
income and financial expenses.
|
(2)
|
Increase
corresponds mainly to the incorporation of assets from Oleoducto Central
and Oleoducto de Colombia into the Group of Companies’ consolidated
financial statements.
|
|
(3)
|
Corresponds
to the final result of the appraisal made by Ecopetrol to the fixed assets
in the year 2009, which represents the devaluation of assets by comparison
of their net book value and their technical
appraisal.
|
Below is
the activity of the allowance for property, plant and equipment in each of the
years ended December 31, 2009, 2008 and 2007:
|
2009
|
2008
|
2007
|
||||||||||
|
Initial
balance
|
$ | 1,093,458 | $ | 105,118 | $ | 97,227 | ||||||
|
Additions
(new provisions)
|
144,431 | 1,013,116 | 9,037 | |||||||||
|
Provision
from business combination
|
- | 770 | - | |||||||||
|
Adjustment
of existing provisions
|
(714,605 | ) | (6,733 | ) | (1,146 | ) | ||||||
|
Recoveries
|
(23,109 | ) | (18,813 | ) | - | |||||||
|
Ending
balance
|
$ | 500,175 | $ | 1,093,458 | $ | 105,118 | ||||||
Depreciation
expense for years 2009, 2008 and 2007 charged to results amounted to $1,262,643,
$691,488 and $750,074, respectively.
The
residual value is only considered in the valuation process for property, plant
and equipment and only in the eventuality in which the assets are totally
depreciated or are no longer in operating conditions. A 5% general
average of the cost is applied, according to oil industry
practice. This criterion is not applicable to assets classified as
pipelines and buildings, since it is considered that the recoverable costs are
equivalent to the costs of removal and transportation for their
retirement. The assets are depreciated at 100% of their historical
cost adjusted for inflation.
A summary
of property, plant and equipment at December 31, 2009 is set forth
below:
|
Type of asset
|
Adjusted cost
|
Accumulated
depreciation
|
Revaluations
|
Allowances
|
Fair Value
|
|||||||||||||||
|
Plants
and equipment
|
$ | 13,438,144 | $ | 9,410,022 | $ | 3,506,575 | $ | (347,839 | ) | 11,171,442 | ||||||||||
|
Pipelines,
networks and lines
|
13,171,399 | 9,373,243 | 787,908 | (71,262 | ) | 1,661,697 | ||||||||||||||
|
Construction
in progress
|
6,487,411 | - | - | - | - | |||||||||||||||
|
Buildings
|
2,184,484 | 966,755 | 777,504 | (67,442 | ) | 1,812,927 | ||||||||||||||
|
Equipment
on deposit and in transit
|
1,221,822 | - | - | - | - | |||||||||||||||
|
Computer
equipment
|
313,892 | 239,540 | 30,425 | (5,636 | ) | 33,391 | ||||||||||||||
|
Transportation
equipment and other fixed assets
|
389,727 | 237,061 | 96,802 | (7,996 | ) | 93,656 | ||||||||||||||
|
Land
|
302,420 | - | 162,760 | - | 53,938 | |||||||||||||||
|
Total
|
$ | 37,509,299 | $ | 20,226,621 | $ | 5,361,974 | $ | (500,175 | ) | 14,827,051 | ||||||||||
F-34
Ecopetrol
S.A. and Subsidiaries
Notes to
the Consolidated Financial Statements
Years
ended December 31, 2009, 2008 and 2007
A summary
of property, plant and equipment at December 31, 2008 is set forth
below:
|
Type of asset
|
Adjusted cost
|
Accumulated
depreciation
|
Revaluations
|
Allowances
|
Fair Value
|
|||||||||||||||
|
Plants
and equipment
|
$ | 11,291,735 | $ | 8,795,252 | $ | 3,613,491 | $ | (636,241 | ) | 10,978,466 | ||||||||||
|
Pipelines,
networks and lines
|
4,081,579 | 2,644,522 | 308,518 | (158,006 | ) | 714,405 | ||||||||||||||
|
Construction
in progress
|
3,435,379 | - | - | - | 12,224 | |||||||||||||||
|
Buildings
|
1,194,298 | 532,271 | 529,766 | (270,227 | ) | 1,008,253 | ||||||||||||||
|
Equipment
on deposit and in transit
|
949,724 | - | - | - | - | |||||||||||||||
|
Computer
equipment
|
281,037 | 229,026 | 25,617 | (20,789 | ) | 25,581 | ||||||||||||||
|
Transportation
equipment and other fixed assets
|
286,864 | 225,259 | 73,950 | (8,195 | ) | 74,915 | ||||||||||||||
|
Land
|
76,660 | - | 11,668 | - | 26,635 | |||||||||||||||
|
Total
|
$ | 21,597,276 | $ | 12,426,330 | $ | 4,563,010 | $ | (1,093,458 | ) | 12,840,479 | ||||||||||
There are
not restrictions, pledges of bonds over these assets.
|
10.
|
Natural
and Environmental Resources, net
|
|
2009
|
2008
|
|||||||
|
Amortizable
crude oil investments
|
$ | 17,676,586 | $ | 13,727,384 | ||||
|
Less:
Accumulated amortization (1)
|
(8,756,267 | ) | (7,007,255 | ) | ||||
| 8,913,329 | 6,720,129 | |||||||
|
Plugging
and abandonment, dismantling of facilities and environmental recovery
costs
|
2,942,370 | 1,965,902 | ||||||
|
Less:
Accumulated amortization
|
(1,247,047 | ) | (1,091,504 | ) | ||||
| 1,695,323 | 874,398 | |||||||
|
Reservoirs
and appraisals (2)
|
701,590 | 701,590 | ||||||
|
Less:
Accumulated depletion
|
(598,330 | ) | (580,132 | ) | ||||
| 103,260 | 121,458 | |||||||
|
Exploration
in progress (3)
|
443,469 | 338,064 | ||||||
|
Total
|
$ | 11,155,381 | $ | 8,054,049 | ||||
|
(1)
|
Amortization
increase of crude oil investments resulted from the difference on the
applied WTI price which increased from US$44,6 bl. to US$61,18 bl. in
accordance with the SEC methodology. On the other hand $2,996,112 was
capitalized mainly for the Cusiana, Cupiagua, Capachos Sur, Rubiales,
Girasol and Casabe fields, among
others.
|
|
(2)
|
These
reserves were received from the reversions of concession contracts in an
amount totaling $520,218 currently administered by Gerencia Sur and
$181,372 by Magdalena Medio.
|
|
(3)
|
Corresponds
to the exploratory fields from Ecopetrol America Inc $95,806, Ecopetrol
Perú $36,012, Hocol $109,472, Ecopetrol Brasil $14,743 Ecopetrol S.A
$187,436.
|
Amortization
and depletion expense for years 2009, 2008 and 2007 charged to results amounted
to $1,474,918, $1,087,583 and $665,459, respectively.
F-35
Ecopetrol
S.A. and Subsidiaries
Notes to
the Consolidated Financial Statements
Years
ended December 31, 2009, 2008 and 2007
|
11.
|
Pension
Plan Assets
|
Decree
2153 of 1999 required the Company to fund up to 70% of its pension liabilities
existing as of December 31, 1998. In connection therewith, the Company created
guaranteed trust funds with the entities described below and makes annual
contributions thereto.
Pursuant
to Decree 941 of 2002, once the actuarial calculation for pension obligations
was approved by the Ministry of Finance in October 2008 and once the mechanism
for transfer (“commutation”) of the corresponding liability was approved by the
Ministry of Social Security on December 29, 2008, the Company transferred
to pension trust funds an amount equal to the actuarial calculation for pensions
as estimated on December 31, 2008, with a remaining balance of
$80,263.
During
2009, the pension trust funds earned a 14.52% annual yield and generated net
earnings of $1,429,872 as compared to $1,171,960 in 2008. These earnings are not
included in Ecopetrol’s financial results.
At
December 31, 2009 and 2008, the Company had set up the following
trusts:
|
2009
|
2008
|
|||||||
|
Consorcio
Fidubogotá – Fiducolpatria
|
$ | - | $ | 17,399 | ||||
|
Consorcio
Fidupopular – Fiduoccidente
|
- | 14,980 | ||||||
|
Consorcio
Fiduagraria - Fiducoldex - Helm Trust
|
- | 9,610 | ||||||
|
Consorcio
BBVA - Corficolombiana – Fidubogotá
|
- | 9,677 | ||||||
|
Consorcio
Fiducafé - Fiduprevisora - Fidupetrol
|
- | 16,805 | ||||||
|
Consorcio
Fiducolombia - Santander Investment
|
- | 11,792 | ||||||
|
Total
|
- | 80,263 | ||||||
|
Less: short
term redeemable portion (1)
|
$ | - | $ | 80,263 | ||||
|
(1)
|
Amount
reimbursed to Ecopetrol in March 2009 which corresponded to the remainder
resulting from the partial transfer (commutation) of monthly pension
obligations made through the mechanism approved by the Ministry of Social
Security in December 2008.
|
The trend
of the coverage of trust funds with reference to the pension liability for
fiscal year 2008 is as follows:
|
2008
|
||||||||
|
Transferred amount
|
Non-transferred amount
|
|||||||
|
Pension
Liability (*)
|
$ | 10,092,528 | $ | 2,157,286 | ||||
|
Trust
funds
|
$ | 10,172,791 | $ | 80,263 | ||||
|
Coverage
|
100.8 | % | 4 | % | ||||
|
*
|
The
Company’s pension liability includes health care and education reserves
and the actuarial calculation of its joint operations personnel, using the
participation percentage initially agreed to in each respective
contract. These amounts were not part of the transfer of
pension liabilities.
|
The table
below sets forth the adjustments made in the Company’s pension trust funds for
the year ended December 31, 2008:
|
2009
|
2008
|
|||||||
|
Initial
balance
|
$ | 80,263 | $ | 9,495,674 | ||||
|
Yields
|
- | 1,171,960 | ||||||
|
Payments
|
- | (494,843 | ) | |||||
|
Transfer
of pension liability
|
- | (10,092,528 | ) | |||||
|
Reimbursement
from trust funds
|
(80,263 | ) | - | |||||
|
Ending
balance
|
$ | - | $ | 80,263 | ||||
F-36
Ecopetrol
S.A. and Subsidiaries
Notes to
the Consolidated Financial Statements
Years
ended December 31, 2009, 2008 and 2007
|
12.
|
Deferred
Charges
|
|
2009
|
2008
|
|||||||
|
Deferred
income tax
|
$ | 1,408,659 | $ | 1,285,648 | ||||
|
Other
deferred charges (net)
|
419,342 | 235,720 | ||||||
|
Charges
of deferred monetary correction, net
|
58,528 | 66,279 | ||||||
|
Deferred
reinsurance expenses
|
- | 8,036 | ||||||
| $ | 1,886,529 | $ | 1,595,683 | |||||
|
13.
|
Other
Assets
|
|
2009
|
2008
|
|||||||
|
Goodwill
(1)
|
$ | 2,507,552 | $ | 668,614 | ||||
|
National
Royalties Fund
|
76,185 | 82,147 | ||||||
|
Trust
funds (2)
|
83,342 | 77,255 | ||||||
|
Intangibles:
Trademarks, licenses, patents, software (3)
|
96,027 | 45,968 | ||||||
|
Abandonment
of installations fund
|
- | 31,283 | ||||||
|
Deposits
held in trust (4)
|
258,745 | 20,879 | ||||||
|
Other
assets (5)
|
12,847 | 9,832 | ||||||
| $ | 3,034,698 | $ | 935,978 | |||||
|
(1)
|
Goodwill
corresponds to:
|
|
|
(i)
|
$621,099
to the net amount between goodwill and the monthly amortization as of
December 31, 2009 relating to the acquisition of Andean Chemicals Limited
and Polipropileno del Caribe S.A., with an estimated amortization term of
17 years and 8 months, determined based on the net present value of the
investment reduced by the amount of the estimated future cash
flows.
|
|
(ii)
|
$773,492
to the purchase of Offshore International Group, which is subject to the
adjustments that may arise to the purchase price, with an estimated term
for amortization of 14 years determined based on the valuation of the
reserves of block Z2B, the only block in
production.
|
|
(iii)
|
$507,255
as a result of the purchase of IPL Enterprises (now Ecopetrol
Transportation Company) with an estimated term for amortization of 15
years determined based on Ocensa’s outstanding contractual agreements as
of the date of the negotiation.
|
|
|
(iv)
|
$605,706
to the acquisition of Hocol Petroleum Limited with an estimated term for
amortization of 16 years determined based on the net present value of the
estimated future cash flows.
|
|
(2)
|
Includes
|
|
|
(i)
|
Contributions
and share in amount of $68,024 into the National Hydrocarbons Fund created
to support future hydrocarbon investment, exploration and production
contracts in minor fields, projects managed by the private equity fund of
Hydrocarbons of Colombia
|
|
|
(ii)
|
Contributions
of $5,728 to the Procuraduria Fund created for general benefit projects in
municipalities near the Cicuco field under the Company’s direct operation:
Cicuco, Mompox and Talaigua Nueva (the objective of the fund is to
disburse the amounts according to each project’s development, which will
be carried out by the municipalities through agreements with Incoder and
the Ministry of Environment) and
|
|
|
(iii)
|
Contributions
of $9,590 to the Colpet, Condor and Sagoc Fund for possible contingencies
in the liquidation of these former
subsidiaries.
|
|
(3)
|
Intangible
assets corresponds to assets acquired, showing an increase of $50,062 as
compared to December 2008. Assets increase comprises acquisitions of
licenses and software.
|
|
(4)
|
Corresponds
to the FAEP deposits to the National Royalties Fund in favor of Ecopetrol.
Its sole purpose is the payment of debts and financing for development
projects and programs in hydrocarbon producing and non-producing
municipalities and departments. Ecopetrol disburses amounts after the
Ministry of Finance issues the corresponding
approvals.
|
|
(5)
|
Includes
restricted funds in amount of $11,815 (2008 - $73) and $1,015, mainly
represented by legal deposits destined to attend labor, civil and tax
claims.
|
F-37
Ecopetrol
S.A. and Subsidiaries
Notes to
the Consolidated Financial Statements
Years
ended December 31, 2009, 2008 and 2007
|
14.
|
Financial
Obligations
|
Financial
obligations at December 31, 2009 are as follows:
|
2009
|
2008
|
|||||||
|
Short
term
|
||||||||
|
Foreign
currency debt
|
$ | 101,968 | $ | 231,015 | ||||
|
Local
currency debt
|
335,113 | 11 | ||||||
|
Issued
Bonds
|
- | 50,000 | ||||||
|
Total
short term
|
437,081 | 281,026 | ||||||
|
Long
term
|
||||||||
|
Foreign
currency debt
|
13,845 | 561 | ||||||
|
Local
currency debt
|
2,648,009 | 4,912 | ||||||
|
Foreign
currency issued bonds
|
3,052,500 | - | ||||||
|
Total
long term
|
5,714,354 | 5,473 | ||||||
|
Total
|
$ | 6,151,435 | $ | 286,499 | ||||
The
details of Ecopetrol’s financial obligations are as follows:
|
Entity
|
Currency
|
Interest rate
|
USD
(Thousand)
|
COP
(Million)
|
||||||||
|
Short
term
|
||||||||||||
|
Banco
Agrario (1)
|
COP
|
DTF
+ 4 TA
|
- | 1,601 | ||||||||
|
Banco
BBVA (1)
|
COP
|
DTF
+ 4 TA
|
- | 1,465 | ||||||||
|
Banco
BBVA (2)
|
USD
|
0,98%
|
49,174 | 100,523 | ||||||||
|
Banco
Bogota (6)
|
COP
|
25,82%
|
- | 19 | ||||||||
|
Banco
Bogotá (1)
|
COP
|
DTF
+ 4 TA
|
- | 1,889 | ||||||||
|
Banco
Bogotá (2)
|
USD
|
1,19%
|
22,992 | 47,002 | ||||||||
|
Banco
Bogota (3)
|
USD
|
0,43%
|
|
250 | 511 | |||||||
|
Banco
Colmena BCSC (1)
|
COP
|
DTF
+ 4 TA
|
|
- | 163 | |||||||
|
Banco
Av Villas (1)
|
COP
|
DTF
+ 4 TA
|
- | 407 | ||||||||
|
Banco
Occidente (1)
|
COP
|
DTF
+ 4 TA
|
- | 814 | ||||||||
|
Banco
Occidente (5)
|
COP
|
DTF
+ 5 TA
|
- | 67,500 | ||||||||
|
Banco
Popular (1)
|
COP
|
DTF
+ 4 TA
|
- | 1,616 | ||||||||
|
Banco
Popular (5)
|
COP
|
DTF
+ 5 TA
|
- | 30,000 | ||||||||
|
Banco
Santander (1)
|
COP
|
DTF
+ 4 TA
|
- | 488 | ||||||||
|
Banco
Santander (2)
|
USD
|
1,13%
|
5,902 | 12,065 | ||||||||
|
Bancolombia
(1)
|
COP
|
DTF
+ 4 TA
|
- | 12,605 | ||||||||
|
Bancolombia
(6)
|
COP
|
25,08%
|
- | 10 | ||||||||
|
Bank
of New York- Bonds issued Ecopetrol
|
USD
|
49,880 | 101,968 | |||||||||
|
Davivienda
(1)
|
COP
|
DTF
+ 4 TA
|
- | 10,542 | ||||||||
|
Finandina
(4)
|
COP
|
15,34%
|
- | 8 | ||||||||
|
Helm
Bank (1)
|
COP
|
DTF
+ 4 TA
|
- | 1,352 | ||||||||
|
Helm
Bank (2)
|
USD
|
1,09%
|
21,670 | 44,298 | ||||||||
|
Helm
Bank (6)
|
COP
|
24,02%
|
- | 117 | ||||||||
|
Leasing
Bancolombia (5)
|
COP
|
DTF
+ 5.3%TA
|
- | 116 | ||||||||
|
Uniandes
(3)
|
COP
|
9,57%
|
- | 2 | ||||||||
|
Total
short term
|
149,868 | 437,081 | ||||||||||
|
Long
term
|
||||||||||||
|
Banco
Agrario (1)
|
COP
|
DTF
+ 4 TA
|
- | 196,700 | ||||||||
|
Banco
AVVillas (5)
|
COP
|
DTF
+ 5 TA
|
- | 45,000 | ||||||||
|
Banco
BBVA- (1)
|
COP
|
DTF
+ 4 TA
|
- | 180,000 | ||||||||
|
Banco
Bogotá (1)
|
COP
|
DTF
+ 4 TA
|
- | 232,000 | ||||||||
|
Banco
Bogota (5)
|
COP
|
DTF
+ 5 TA
|
- | 340,000 | ||||||||
|
Banco
Colmena BCSC (1)
|
COP
|
DTF
+ 4 TA
|
- | 20,000 | ||||||||
|
Banco
Av Villas (1)
|
COP
|
DTF
+ 4 TA
|
- | 50,000 | ||||||||
|
Banco
Occidente (1)
|
COP
|
DTF
+ 4 TA
|
- | 100,000 | ||||||||
|
Banco
Popular (1)
|
COP
|
DTF
+ 4 TA
|
- | 118,000 | ||||||||
|
Banco
Popular (5)
|
COP
|
DTF
+ 5 TA
|
- | 37,500 | ||||||||
|
Banco
Santander (1)
|
COP
|
DTF
+ 4 TA
|
- | 60,000 | ||||||||
|
Bancolombia (1)
|
COP
|
DTF
+ 4 TA
|
- | 750,000 | ||||||||
|
Bancolombia
(4)
|
COP
|
20.0469%
EA
|
- | 4,180 | ||||||||
|
Bancolombia
(7)
|
COP
|
DTF
+ 5.3%TA
|
- | 622 | ||||||||
|
Bank
of New York- Bonds issued Ecopetrol
|
USD
|
7.625%
|
1,500,000 | 3,066,345 | ||||||||
|
Davivienda (1)
|
COP
|
DTF
+ 4 TA
|
- | 450,000 | ||||||||
|
Helm
Bank - (1)
|
COP
|
DTF
+ 4 TA
|
- | 63,500 | ||||||||
|
Leasing
Bancolombia (6)
|
COP
|
DTF
+ 5.3%TA
|
- | 398 | ||||||||
|
UniAndes
(3)
|
COP
|
9,57%
|
- | 109 | ||||||||
|
Total
long term
|
1,500,000 | 5,714,354 | ||||||||||
|
Total
|
1,649,868 | 6,151,435 | ||||||||||
F-38
Ecopetrol
S.A. and Subsidiaries
Notes to
the Consolidated Financial Statements
Years
ended December 31, 2009, 2008 and 2007
|
(1)
|
Includes:
|
|
|
(i)
|
The
disbursement of the syndicated loan with 11 local banks issued in an
amount of $2,220,200 to finance Ecopetrol’s investment
plans. In order to guarantee coverage of 120% of the credit
amount, Ecopetrol granted the banks a stock pledge over the
shares of stock it owns, either directly or indirectly, in the following
companies:
|
|
Company
|
Amount
|
|||
|
Oleoducto
Central S.A.
|
1,110,035 | |||
|
Refinería
de Cartagena S.A.
|
1,274,796 | |||
|
Polipropileno
del Caribe S.A.
|
279,409 | |||
|
Total
|
2,664,240 | |||
|
|
(ii)
|
On
July 23, 2009 the Company issued US$ 1.5 billion, 7.625% unsecured and
unsubordinated Notes due 2019 (the “Notes”) under Rule 144A/Regulation S,
with registration rights before the SEC. The Notes were issued pursuant to
an Indenture dated as of July 23, 2009 (the “Indenture”) between the
Company and The Bank of New York Mellon, as
trustee.
|
The terms
of the notes are as follows:
|
|
·
|
Coupon:
7,625%
|
|
|
·
|
Make
Whole on Optional Redemption: 50 basis points over equivalent U.S.
Treasury Securities.
|
|
|
·
|
Interests
Payment Dates: July 23 and January 23 of each year, starting January 23,
2010.
|
|
|
·
|
Maturity
Date: July 23, 2019
|
|
|
·
|
Denominations:
US$1.000 / US$1.000
|
Under the
Notes’ terms, the Company is required to comply various covenants that,
among other things:
|
|
·
|
Require
the Company to duly and punctually pay interest on the Notes at the rate
of 7.625% per year on January 23 and July 23 of each year, beginning on
January 23, 2010;
|
|
|
·
|
Require
the Company to duly and punctually pay principal on the Notes on the
maturity date of July 23, 2019;
|
|
|
·
|
Limit
the ability of the Company and its material subsidiaries to incur any
lien, except for certain permitted liens, to secure the payment of public
external indebtedness of the Company or any of its material subsidiaries,
except in cases where the Notes are secured equally and ratably with (or
prior to) such indebtedness (but only for so long as such indebtedness is
so secured); and
|
|
|
·
|
Require
the Company to make an offer to purchase all or any portion of outstanding
Notes held by holders upon the occurrence of a Change of Control
Repurchase Event (as defined in the
Indenture).
|
|
(2)
|
Propilco’s
total debt is denominated in U.S. dollars at December 31, 2009 this debt
totaled US$ 99,738
|
F-39
Ecopetrol
S.A. and Subsidiaries
Notes to
the Consolidated Financial Statements
Years
ended December 31, 2009, 2008 and 2007
|
(3)
|
Comai
|
|
(4)
|
Bioenergy
|
|
(5)
|
ODL
Finance’s debt is guaranteed by the “Ship or Pay (SoP)” contracts
mentioned in note 31: ODL’s long-term debt expires as follows: $130,000 in
2011, $130,000 in 2012, $130,000 in 2013, and $32,500 in
2014.
|
|
(6)
|
Hocol
|
|
(7)
|
Reficar
|
|
15.
|
Accounts
payable and transactions with related
parties
|
|
2009
|
2008
|
|||||||
|
Short
term
|
||||||||
|
Advances
from Partners
|
$ | 555,620 | $ | 532,833 | ||||
|
Deposits
received from third parties
|
817,937 | 397,731 | ||||||
|
Suppliers
|
1,207,724 | 386,237 | ||||||
|
Related
parties
|
- | 19,002 | ||||||
|
Purchase
of hydrocarbons from the Agencia Nacional de Hidrocarburos -
ANH
|
441,533 | 210,056 | ||||||
|
Reimbursement
of exploratory costs
|
141,775 | 120,627 | ||||||
|
Other
payables (1)
|
109,952 | 38,996 | ||||||
|
Dividends
payable (2)
|
3,510 | 2,158 | ||||||
|
Insurance
and reinsurance payable
|
2,181 | 1,007 | ||||||
| $ | 3,280,232 | $ | 1,708,647 | |||||
|
Long
term
|
||||||||
|
Other
payables
|
$ | 51,154 | - | |||||
|
(1)
|
Includes
$37,577 payable to the Fuel Price Stabilization Fund due to the
participation differential generated during
2009.
|
|
(2)
|
It
corresponds to dividends payable to shareholders who bought Company’s
shares on an installment payment plan and are in arrears there under.
Shareholders’ rights have been suspended pursuant with article 397 of the
Commercial Code and will be restored once the installment payments are
brought up to date.
|
Balances
and Transactions with related parties
A summary
of the most significant balances with related parties where Ecopetrol holds
direct investments or interests are set forth below:
|
Accounts
receivable
|
Advances
receivable
|
Accounts
payable
|
||||||||||
|
Hocol
Petroleum Ltd.
|
- | 10,003 | 28,448 | |||||||||
|
Ocensa
S.A.
|
2,123 | - | 296,717 | |||||||||
|
Refinería
de Cartagena S.A.
|
360,138 | - | 35,775 | |||||||||
|
Andean
Chemicals Limited
|
1,170,739 | - | - | |||||||||
|
Black
Gold Re Ltd.(1)
|
- | - | 197,485 | |||||||||
|
Balance
as of December 2009
|
1,533,000 | 10,003 | 558,425 | |||||||||
|
Balance
as of December 2008
|
238,370 | 2,528 | 229,325 | |||||||||
|
(1)
|
Corresponds
to amounts received in
administration.
|
F-40
Ecopetrol
S.A. and Subsidiaries
Notes to
the Consolidated Financial Statements
Years
ended December 31, 2009, 2008 and 2007
The
principal transactions with related parties as of December 31, 2009 are set
forth below:
|
Sales and
services
|
Leases
|
Others
|
||||||||||
|
Revenue:
|
||||||||||||
|
Refinería
de Cartagena S.A.
|
3,701,421 | - | - | |||||||||
|
Ocensa
S.A.
|
18,406 | 15,883 | - | |||||||||
|
Andean
Chemicals Limited
|
- | - | 62,103 | |||||||||
|
Oleoducto
de Colombia S.A.
|
8,084 | - | - | |||||||||
|
Compounding
and Masterbatching (COMAI)
|
73,797 | - | - | |||||||||
|
Year
ended December 31, 2009
|
3,801,708 | 15,883 | 62,103 | |||||||||
|
Year
ended December 31, 2008
|
4,778,329 | 13,849 | 53,954 | |||||||||
|
Purchase of
products
|
Transportation
costs
|
Other
|
||||||||||
|
Expenses:
|
||||||||||||
|
Andean
Chemicals Limited
|
- | - | - | |||||||||
|
Hocol
Petroleum Ltd.
|
93,675 | - | - | |||||||||
|
Ocensa
S.A.
|
- | 540,060 | - | |||||||||
|
Oleoducto
de Colombia S.A.
|
- | 28,880 | - | |||||||||
|
Refinería
de Cartagena S.A.
|
373,199 | - | - | |||||||||
|
Year
ended December 31, 2009
|
466,874 | 568,940 | - | |||||||||
|
Year
ended December 31, 2008
|
- | 577,120 | 29,223 | |||||||||
There are
no special price conditions or non-arms’ length transactions with related
companies. However, for Ocensa S.A. and Oleoducto de Colombia S.A. there is a
maximum tariff determined by the Ministry of Mines and Energy that can be
collected by both companies for the use of their pipeline systems. Their
operation is based on the recovery of total operating and administrative
expenses to determine the transportation unit cost. The cost per barrel is
transferred to each shareholder that uses the system based on the barrels
transported.
During
2009 no shareholder, director, legal representative, officer of the Company has
engaged in any material operation with Ecopetrol. In addition, no shareholder,
director, legal representative, or officer of the Company is a beneficial owner
of 10% or more of the outstanding shares of the Company.
|
16.
|
Taxes
Payable
|
|
2009
|
2008
|
|||||||
|
Income
tax and other taxes
|
$ | 1,940,756 | $ | 3,618,553 | ||||
|
Income
and VAT with holdings
|
194,217 | 129,737 | ||||||
|
Special
tax and surcharge on gasoline (1)
|
124,667 | 92,935 | ||||||
|
Industry
and commerce and other minor taxes
|
123,707 | 20,917 | ||||||
|
Sales
tax payable
|
49,675 | 44,326 | ||||||
|
Total
|
$ | 2,433,022 | $ | 3,906,468 | ||||
|
(1)
|
This
tax is levied on sales and/or consumption of regular and premium gasoline
and diesel. The funds collected for this tax are paid to the National
Treasury Office of the Ministry of Finance. The special tax is paid on the
basis of the percentage participation of each beneficiary in the national
monthly consumption of regular and premium
gasoline.
|
Income
tax returns may be reviewed by the tax authorities within two years of their
filing date. At this date, the terms of filings for the years 2007 and 2008 are
open for review.
F-41
Ecopetrol
S.A. and Subsidiaries
Notes to
the Consolidated Financial Statements
Years
ended December 31, 2009, 2008 and 2007
Currently,
differences exist between the National Tax and Customs Administration (DIAN) and
Ecopetrol regarding the calculation and payment method of the first installment
of the 2003 and 2004 income tax returns because in the opinion of the DIAN the
surtax of such years should have been included in the base. The result of this
proceeding will not affect the Company’s cash flow since the amounts under
discussion have been directly compensated by the DIAN by positively adjusting
the Company’s balances with adjustments the Company had previously requested in
unrelated cases.
Through
its appellate decision dated March 13, 2009 (which became effective as of April
20, 2009), the Council of State partially accepted the claims of Ecopetrol to
modify DIAN’S official liquidation plan, which sought an additional payment by
Ecopetrol in an amount totaling $27,033 (corresponding to the income tax return
for fiscal year 1996 of $1,888 plus default interest). The judicial decision
accepted Ecopetrol’s arguments on the exemption of the income tax on asphalt and
the absence of a penalty for inexact information due to a difference in criteria
and dismissed Ecopetrol’s arguments related to the deductibility of the loss on
the portfolio sale. Pursuant to Resolution 6282-1422 of September
2009, DIAN compensated Ecopetrol for the entire obligation plus default interest
by recording an excess payment pending regarding VAT
collection. Therefore, the application of the corresponding provision
was duly recorded in accounting.
The
provision for income tax was determined on net taxable income, as
follows:
|
2009
|
2008
|
2007
|
||||||||||
|
Current
income tax
|
$ | 1,948,819 | $ | 3,611,020 | $ | 2,006,484 | ||||||
|
Deferred
tax:
|
||||||||||||
|
Asset
|
(69,230 | ) | 494,757 | (155,118 | ) | |||||||
|
Liability
|
234,440 | 276,205 | 34,146 | |||||||||
| 165,210 | 770,962 | (120,972 | ) | |||||||||
| $ | 2,114,029 | $ | 4,381,982 | $ | 1,885,512 | |||||||
The
deferred tax asset is calculated based on the value of accounting provisions not
accepted for tax purposes which are deductible at the time of their utilization,
and the value of asset inflation adjustments originated from 2004 to 2006. The
deferred tax liability results from the differences in the policy for
amortization of crude oil investments which for accounting purposes are
amortized by technical units of production whereas for tax purposes are
amortized through the straight-line method, and the differences in the method
for revaluation of fixed yield investments, which for regulation purposes are
valued through the market method and for tax purposes are valued through the
linear method.
|
2009
|
2008
|
|||||||
|
Deferred
tax asset:
|
||||||||
|
Initial
balance
|
$ | 1,285,648 | $ | 1,779,874 | ||||
|
Net
activity for the year
|
69,230 | (494,757 | ) | |||||
|
Balance
from subsidiaries acquired in 2009
|
53,781 | 531 | ||||||
|
Ending
balance
|
$ | 1,408,659 | $ | 1,285,648 | ||||
|
Deferred
tax liability:
|
||||||||
|
Initial
balance
|
$ | 944,816 | $ | 644,857 | ||||
|
Net
activity for the year
|
234,438 | 276,205 | ||||||
|
Balance
from subsidiaries acquired in 2009
|
15,594 | 23,754 | ||||||
|
Ending
balance
|
$ | 1,194,848 | $ | 944,816 | ||||
F-42
Ecopetrol
S.A. and Subsidiaries
Notes to
the Consolidated Financial Statements
Years
ended December 31, 2009, 2008 and 2007
The
reconciliation of net taxable income is set forth below:
|
2009
|
2008
|
2007
|
||||||||||
|
Income
before income taxes
|
$ | 7,250,844 | $ | 16,011,204 | $ | 7,065,304 | ||||||
|
Monetary
correction gain
|
(3,471 | ) | 25,300 | 23,711 | ||||||||
|
Effect
of tax inflation adjustment
|
108,615 | (87,788 | ) | (391,391 | ) | |||||||
|
Non
deductible costs and expenses
|
1,256,081 | 813,248 | 432,278 | |||||||||
|
Special
deductions and deductible tax expenses
|
(3,291,472 | ) | (2,837,230 | ) | (1,176,608 | ) | ||||||
|
Other
taxable income
|
182,199 | 1,085,307 | 55,972 | |||||||||
|
Income
not constituting income or capital gains
|
(126,460 | ) | (907,847 | ) | (22,772 | ) | ||||||
|
Non
taxable income
|
(727,029 | ) | (1,185,857 | ) | (594,954 | ) | ||||||
|
Non
deductible provisions
|
574,403 | 243,623 | 1,184,895 | |||||||||
|
Non
taxable trust funds yields
|
(250,265 | ) | (890,538 | ) | 238,327 | |||||||
|
Net
exempt income
|
(29,540 | ) | (1,372,083 | ) | (863,946 | ) | ||||||
|
Excess
of presumptive over ordinary income
|
403,226 | - | - | |||||||||
|
Net
effect of consolidation of taxable income
|
(443,949 | ) | 75,269 | - | ||||||||
|
Net
taxable income
|
4,932,722 | 10,972,608 | 5,950,816 | |||||||||
|
Tax
on taxable income
|
1,948,819 | 3,611,020 | 2,023,277 | |||||||||
|
Tax
discounts
|
- | - | (16,793 | ) | ||||||||
|
Net
current income tax
|
$ | 1,948,819 | $ | 3,611,020 | $ | 2,006,484 | ||||||
The
effective tax rate for the twelve-month periods ending December 2009, 2008
and 2007 was 29.16%, 27.37% and 26.69%, respectively.
|
17.
|
Labor
Obligations
|
As a
result of a process that began in 2006, pursuant to Decree 941 of 2002, once the
actuarial calculation for pension obligations was approved by the Ministry of
Finance in October 2008 and once the mechanism for transfer (“commutation”) of
the corresponding liability was approved by Ministry of Social Security on
December 29, 2008, the Company, as of December 31, 2008, transferred
(“commuted”) the amounts corresponding to its pension liabilities to autonomous
pension trust funds (PAP). The amount transferred as of
December 31, 2008 was $10,092,528 million. Therefore, the
Company removed the assets represented in trust funds and their corresponding
pension liabilities from the balance sheet and transferred them to memorandum
accounts. Pursuant to current regulations, transferred funds, as well as their
earnings, cannot change their destination nor be restored to the Company until
all the pension obligations have been paid. Moreover, Ecopetrol
continues to be financially responsible for the transferred pension
liability. At December 31, 2009 the amounts of pension liabilities
was $10,899,026 million and the amounts of autonomous pension trust funds (PAP)
was $10,971,723 million.
F-43
Ecopetrol
S.A. and Subsidiaries
Notes to
the Consolidated Financial Statements
Years
ended December 31, 2009, 2008 and 2007
|
2009
|
2008
|
|||||||
|
Current
|
||||||||
|
Bonuses
and allowances (1)
|
$ | 57,022 | $ | 40,773 | ||||
|
Vacations
|
47,061 | 37,593 | ||||||
|
Severance
(2)
|
42,598 | 32,391 | ||||||
|
Pension
bonds issued and interest (4)
|
- | 848 | ||||||
|
Salaries
and pensions payable
|
13,078 | 12,491 | ||||||
|
Interest
on severance
|
3,347 | 2,996 | ||||||
|
Others
|
2,357 | 2,566 | ||||||
|
Total
current
|
165,463 | 129,658 | ||||||
|
Long
term
|
||||||||
|
Retirement
pensions and other benefits ECP (3)
|
2,583,117 | 2,082,072 | ||||||
|
Retirement
pensions joint operations
|
77,826 | 75,215 | ||||||
|
Pension
bonds issued and interests (4)
|
- | 7,500 | ||||||
|
Other
|
8,388 | - | ||||||
|
Total
long-term
|
2,669,331 | 2,164,787 | ||||||
|
Total
|
$ | 2,834,794 | $ | 2,294,445 | ||||
|
(1)
|
Includes
provision for the 2009 variable compensation bonus in the amount of
$30,339 to be paid in 2010. Also includes provision for retirement bonus
in the amount of $6,829.
|
|
(2)
|
Increase
obeys to the hiring of 560 new employees in
Ecopetrol.
|
|
(3)
|
Corresponds
to the actuarial reserve amount for health and education, which has not
been transferred and has not been
funded.
|
A summary
of the Company’s actuarial liability at December 31, 2009 and 2008 is set
forth below:
|
2009
|
2008
|
Variation
|
||||||||||
|
Health
|
||||||||||||
|
Active
personnel
|
287,909 | 276,496 | 11,413 | |||||||||
|
Pensioners
|
1,789,843 | 1,390,062 | 399,781 | |||||||||
|
Education
|
||||||||||||
|
Active
personnel
|
104,951 | 110,306 | (5,355 | ) | ||||||||
|
Pensioners
|
400,414 | 305,208 | 95,206 | |||||||||
|
Totals
|
2,583,117 | 2,082,072 | 501,045 | |||||||||
|
|
Increase
obeys to 908 additional beneficiaries in the reserve and to the costs
incurred in for health and education in 2009 which are reflected in the
actuarial projection.
|
|
(4)
|
Variation
results from the transfer of the issued pension bonds included in the
actuarial reserves which will be paid through the Autonomous Pension Trust
funds (PAP) and are controlled through the memorandum
accounts.
|
A summary
of personnel covered by the actuarial calculation for 2009 and 2008 is set forth
below:
|
Headcount
|
||||||||
|
2009
|
2008
|
|||||||
|
Bonds
reserve – retired personnel
|
10,017 | 10,391 | ||||||
|
Bonds
reserve – persons retiring after 2010
|
3,374 | 3,410 | ||||||
|
Health
care and education reserve (active and pensioners)
|
17,901 | 17,375 | ||||||
|
Pension
reserve (active and pensioners)
|
16,127 | 16,149 | ||||||
F-44
Ecopetrol
S.A. and Subsidiaries
Notes to
the Consolidated Financial Statements
Years
ended December 31, 2009, 2008 and 2007
|
18.
|
Estimated
Liabilities and Provisions
|
|
2009
|
2008
|
|||||||
|
Current
|
||||||||
|
Provision
for legal proceedings (1) (See Note 30)
|
$ | 680,022 | $ | 547,942 | ||||
|
Provisions
for contingencies (2)
|
96,859 | 87,255 | ||||||
|
Provision
for pension funds (3)
|
2,203 | 4,000 | ||||||
|
Other
provisions
|
192,631 | 34,776 | ||||||
|
Provision
for pension obligations (6)
|
178,594 | - | ||||||
|
Provision
for abandonment, dismantling of facilities and environmental recovery
costs (4)
|
4,106 | - | ||||||
|
Total
current
|
$ | 1,154,415 | $ | 673,973 | ||||
|
Long-
term
|
||||||||
|
Provision
for abandonment, dismantling of facilities and environmental recovery
costs (4)
|
3,013,097 | 1,964,756 | ||||||
|
Provision for
royalties (5)
|
380,933 | 388,674 | ||||||
|
Provision
for pension obligations (6)
|
- | 178,594 | ||||||
|
Other
provisions (7)
|
17,947 | 10,767 | ||||||
|
Total
long-term
|
3,411,977 | 2,542,791 | ||||||
|
Total
|
$ | 4,566,392 | $ | 3,216,764 | ||||
|
(1)
|
The
movement of the provisions for legal proceedings during fiscal years ended
December 2009 and 2008 is set forth
below:
|
|
Number
of cases
|
Provisions
Amount
|
|||||||
|
Initial
balance as of December 2008
|
603 | 547,942 | ||||||
|
Additions
(new provisions)
|
252 | 36,714 | ||||||
|
Adjustments
to existing provisions
|
(135 | ) | 122,691 | |||||
|
Recoveries
|
(29 | ) | (27,325 | ) | ||||
|
Ending
balance as of December 2009
|
691 | 680,022 | ||||||
|
(2)
|
Include
$59,938 for possible payment claims to PDVSA related to the cleaning and
decontamination of the Maracaibo lake in Venezuela; $20,000 related to the
proceeding filed by Compañías Asociadas de Gas - ASOGAS against Ecopetrol
regarding inappropriate billing of the GLP transportation tariff; $3,242
related to spillages with environmental impact; $500 related to the
retirement bonus of Hocol S.A. personnel; $544 related to the success
commission payable to the attorney in law handling the proceeding filed by
Industrias Crizasa against Ecopetrol, and $721 related to potential
liabilities from arbitration
decisions.
|
|
(3)
|
Corresponds
to the estimated pending pension contributions of employees who joined
Ecopetrol after January 29, 2003 (Law 797 of 2003) and until the first
quarter of 2004, who were covered by the General Pension
Regulations.
|
|
(4)
|
Difference
between December 2008 of $1,052,447 includes the updating of liabilities
furnished by the Production Vice-presidency of Ecopetrol of $1,203,773;
the effect from foreign currency exchange of $(188,225); the use of
liabilities related to the abandonment wells in $18,799 for the Casabe, La
Cira-Infantas, Floreña, Cantagallo, Sardinata, Tibú, Petrolea, La Cira,
Palagua, Sabana and Lisama-Llanito fields; $73,832 from Hocol and $10,383
from America Inc.
|
Below are
the movements of the provisions for the abandonment cost, facility dismantling
and environmental recovery costs which correspond to Ecopetrol $2,933; Hocol $74
and America Inc. $10 for the years 2009, 2008 and 2007:
|
2009
|
2008
|
2007
|
||||||||||
|
Initial
Balance
|
$ | 1,964,756 | $ | 1,528,374 | $ | 1,355,989 | ||||||
|
Retirements
and uses
|
(21,964 | ) | (2,853 | ) | (1,296 | ) | ||||||
|
Additions
|
1,188,670 | 54,418 | 94,887 | |||||||||
|
Changes
in estimation
|
80,243 | 208,131 | 214,485 | |||||||||
|
Exchange
rate effect
|
(194,502 | ) | 176,686 | (135,691 | ) | |||||||
|
Final
Balance
|
$ | 3,017,203 | $ | 1,964,756 | $ | 1,528,374 | ||||||
|
(5)
|
Includes
a provision related to a claim of Comuneros of Santiago de las Atalayas
and Pueblo Viejo of Cusiana, originated in Royalties Contracts 15, 15ª and
16 and 16ª executed with Ecopetrol, but declared null and void by the
Colombian Council of State. Of this amount, $90,752 corresponds to the
initial claimed amounts, together with the valuation of the fund where the
amounts are invested and $290,180 corresponds to interests. The decision
on the extraordinary appeal presented by the Comuneros is
pending.
|
|
(6)
|
Corresponds
to the provision of the pension reserve for employees that are expected to
accept the “Plan 70” retirement plan on July 31 of
2010.
|
|
(7)
|
It
corresponds to provision to cover the arbitration regarding Mansarovar
Energy Colombia Ltda. controversy related to the termination date of
Cocorná Association contract.
|
F-45
Ecopetrol
S.A. and Subsidiaries
Notes to
the Consolidated Financial Statements
Years
ended December 31, 2009, 2008 and 2007
|
19.
|
Other
long term liabilities
|
The other
long term liabilities at December 31, 2009 and 2008, correspond to the
following:
|
2009
|
2008
|
|||||||
|
Advances
received from Ecogas for BOMT obligations
|
996,787 | 1,250,281 | ||||||
|
Deferred
income tax liability
|
1,194,848 | 944,816 | ||||||
|
Credit
for deferred monetary correction
|
200,230 | 227,605 | ||||||
|
Other
liabilities (1)
|
339,355 | 2,789 | ||||||
|
Deferred
commissions
|
- | 1,430 | ||||||
|
Total
|
2,731,220 | 2,426,921 | ||||||
|
(1)
|
Includes
$330,238 of ODL Finance which corresponds to credit portfolio
securitization through an Autonomous Trust
Fund.
|
|
20.
|
Non-controlling
Interest
|
|
Subsidiary
|
2009
|
2008
|
% of other
shareholders
|
|||||||||
|
Bioenergy
S.A.
|
11,696 | 8,682 | 20,05 | % | ||||||||
|
ODL
Finance S.A.
|
147,621 | 234,269 | 35,00 | % | ||||||||
|
Oleoducto
Central S.A.
|
684,054 | - | 40,00 | % | ||||||||
|
Oleoducto
de Colombia S.A.
|
97,940 | - | 34,43 | % | ||||||||
| 941,311 | 242,951 | |||||||||||
|
21.
|
Equity
|
|
2009
|
2008
|
|||||||
|
Authorized
capital
|
15,000,000 | 15,000,000 | ||||||
|
Capital
to be subscribed
|
(4,881,872 | ) | (4,881,872 | ) | ||||
|
Subscribed
Capital
|
10,118,128 | 10,118,128 | ||||||
|
Subscribed
capital pending payment
|
(337 | ) | (337 | ) | ||||
|
Subscribed
and paid-in capital
|
10,117,791 | 10,117,791 | ||||||
|
Additional
paid-in capital
|
4,721,457 | 4,704,737 | ||||||
|
Additional
paid-in capital receivable
|
(1,137 | ) | (25,461 | ) | ||||
|
Additional
paid-in capital
|
4,720,320 | 4,679,276 | ||||||
|
Surplus
from revaluations
|
6,391,417 | 5,179,961 | ||||||
|
Devaluation
of assets
|
(298,024 | ) | (1,012,229 | ) | ||||
|
Responsibilities
from pending rulings
|
(781 | ) | (781 | ) | ||||
|
Effects
of RCP application
|
(298,805 | ) | (1,013,010 | ) | ||||
|
Net
income
|
5,132,054 | 11,629,677 | ||||||
|
Legal
reserve
|
3,591,397 | 2,428,325 | ||||||
|
Appropriation
for new explorations
|
1,568,107 | 4,415 | ||||||
|
Accounting
clearance
|
17,804 | 17,804 | ||||||
|
Surplus
from equity method
|
1,287,118 | 1,340,357 | ||||||
|
Incorporated
institutional equity
|
137,725 | 94,375 | ||||||
|
Foreign
exchange conversion adjustment
|
(94,971 | ) | 140,746 | |||||
|
Total
equity
|
32,569,957 | 34,619,717 | ||||||
F-46
Ecopetrol
S.A. and Subsidiaries
Notes to
the Consolidated Financial Statements
Years
ended December 31, 2009, 2008 and 2007
Subscribed
and Paid-in-Capital
The
authorized capital of Ecopetrol is $15,000,000 divided into 60,000,000,000
common shares, with $250 par value each, of which 40,472,512,588 shares have
been subscribed, where 10.1% are held by private shareholders and 89.9% are held
by the Colombian Nation.
Additional
paid-in capital
It
Corresponds to (i) the excess over par value in the sale of shares at the 2007
capitalization for $4,700,882 and (ii) to the value resulting in the new shares
offering for the secondary market equal to $20,575 which resulted from
foreclosing of guarantees of delinquent debtors pursuant to Article 397 of the
Commerce Code.
Effects
of RCP application
Corresponds
to the transfer of negative balances originated from the devaluation of
property, plant and equipment required by the RCP since 2008.
This
line-item also includes responsibilities from pending rulings related to
inventory losses, as required by the RCP.
Legal
Reserve
Legal
reserve is set up with 10% of net income and it may be used to absorb losses or
to be distributed at the liquidation of the Company.
The
Company’s 2008 financial results were available for the General Shareholders’
Meeting that took place on March 26, 2009. At that meeting, the Company’s
Shareholders decided to increase the legal reserve by $1,163,072 by December 31,
2009.
The
reserves also include $1,492,168 in occasional reserves for new explorations and
$75,939 in reserves for profits not realized from Ecopetrol’s
subsidiaries.
Incorporated
Institutional Equity
It
corresponds primarily to the commerciality of Nare, Matambo, Garcero, Corocora,
Estero, and Caracara association contracts relating to Sardinas 6, Remache Norte
3, Abejas 3, Jaguar T5 and T6, Orocué and Guarilaque 7 wells. Variation obeys to
new commercial opportunities presented in 2009 in Corocora, Estero, Garcero and
Campo Rico association contracts for Candalay, Jordan 5, Remache Norte 2 and 5,
Abejas 2 and Vigia wells.
Summary
of Revaluations and Surplus from Revaluations
|
2009
|
2008
|
|||||||
|
Property,
plant and equipment:
|
||||||||
|
Plant
and equipment (1)
|
$ | 3,506,575 | $ | 3,613,491 | ||||
|
Buildings
|
777,504 | 529,766 | ||||||
|
Pipelines
and networks
|
787,908 | 308,518 | ||||||
|
Land
|
162,760 | 11,668 | ||||||
|
Communication
and computer equipment
|
30,424 | 25,616 | ||||||
|
Other
assets
|
96,803 | 73,951 | ||||||
| 5,361,974 | 4,563,010 | |||||||
|
Variable
yield investments:
|
||||||||
|
Interconexión
Eléctrica S.A.
|
695,303 | 348,822 | ||||||
|
Empresa
de Energía de Bogotá S.A. ESP.
|
333,606 | 268,129 | ||||||
|
Propaise
S.A.
|
100 | - | ||||||
|
Zona
Franca Industrial
|
431 | - | ||||||
|
Sociedad
Portuaria El Dique
|
3 | - | ||||||
| 1,029,443 | 616,951 | |||||||
|
Total
|
$ | 6,391,417 | $ | 5,179,961 | ||||
F-47
Ecopetrol
S.A. and Subsidiaries
Notes to
the Consolidated Financial Statements
Years
ended December 31, 2009, 2008 and 2007
|
(1)
|
In
2009 the Company carried out the assets physical count for their valuation
process, giving full compliance to the obligation of performing physical
inventories counts at least every three
years.
|
|
22.
|
Memorandum
Accounts
|
|
2009
|
2008
|
|||||||
|
Debtor
/ Rights:
|
||||||||
|
Exploitation
Rights - Decree 727 of 2007 (1)
|
$ | 46,503,863 | $ | 21,870,515 | ||||
|
Pension
Trust funds (2)
|
10,971,723 | 10,092,528 | ||||||
|
Costs
and expenses (deductible and non deductible)
|
14,422,782 | 9,763,156 | ||||||
|
Other
contingent rights and debtor accounts (3)
|
11,480,671 | 5,420,473 | ||||||
|
Securities
given in custody and guarantee
|
3,045,181 | 9,583,641 | ||||||
|
Execution
of investment projects
|
780,040 | 761,276 | ||||||
|
Legal
proceedings
|
441,675 | 602,436 | ||||||
|
Fiscal
differences
|
313,572 | - | ||||||
| 87,959,507 | 58,094,025 | |||||||
|
Creditor
/ Obligations:
|
||||||||
|
Contractual
guarantees (4)
|
12,420,129 | 26,187,641 | ||||||
|
Pension
trust funds
|
10,899,026 | 10,092,528 | ||||||
|
Non-tax
liabilities
|
5,205,671 | 5,603,395 | ||||||
|
Non-taxable
income
|
5,826,947 | 4,197,768 | ||||||
|
Mandate
contracts (5)
|
1,460,073 | 1,576,785 | ||||||
|
Administration
Funds - Dec 1939 of 2001 and 2652 of 2002
|
972,641 | 972,390 | ||||||
|
Legal
proceedings
|
2,283,219 | 1,636,275 | ||||||
|
Goods
received in custody (6)
|
7,949,960 | 9,214,520 | ||||||
|
Future
BOMT payments
|
504,288 | 713,099 | ||||||
|
Guarantees
granted to Oleoducto Central S.A. (7)
|
- | 404,569 | ||||||
|
Other
contingent obligations (8)
|
3,403,368 | 181,636 | ||||||
| 50,925,322 | 60,780,606 | |||||||
| $ | 138,884,829 | $ | 118,874,631 | |||||
|
(1)
|
As
of December 31, 2009 Ecopetrol updated its estimated volumes of net
reserves (without royalties) determined by the international methodology
for reserves calculations; certification process for 2009 started in
September and results were obtained in January
2010.
|
|
(2)
|
Reflects
the contingent right (debtor account) on the resources delivered to PAP,
to pay the transferred pension liability in order to control the existence
of liquid resources present in the trust fund. The commuted (transferred)
amount as of December 31, 2009 was $10,971,723 ($10,092,528 as of December
31, 2008) which solely corresponds to pension allowances, shares and
pension bonds; the amounts regarding health and education are included in
the pension liabilities owed by Ecopetrol. The commuted (transferred)
amounts, as well as their yields, cannot change destination or be returned
to the Company until the pension obligations have been entirely
covered.
|
A
detail of the trust funds is set forth below:
|
2009
|
2008
|
|||||||
|
Consorcio
Fidubogotá - Fiducolpatria
|
$ | 2,378,039 | $ | 2,187,742 | ||||
|
Consorcio
Fidupopular - Fiduoccidente
|
2,032,621 | 1,883,653 | ||||||
|
Consorcio
Fiduagraria - Fiducoldex - Helm Trust
|
1,306,940 | 1,208,338 | ||||||
|
Consorcio
BBVA - Fidubogotá - Corficolombiana
|
1,331,711 | 1,216,868 | ||||||
|
Consorcio
Fiducafé - Fiduprevisora - Fidupetrol
|
2,299,552 | 2,113,131 | ||||||
|
Consorcio
Fiducolombia - Santander Investment
|
1,622,860 | 1,482,796 | ||||||
|
Total
|
$ | 10,971,723 | $ | 10,092,528 | ||||
|
(3)
|
Balance
of the tax memorandum accounts groups the differences between the values
of both equity and results accounts taken from the tax return for 2008 and
the accounting balances. Differences correspond to concepts such as
revaluations and provisions not accepted by tax regulations, the
difference in the method for amortization of crude oil investments which
for accounting purposes is made by production units and for tax purposes
by the straight-line method, and the effect of the generated inflation
adjustment, among others.
|
F-48
Ecopetrol
S.A. and Subsidiaries
Notes to
the Consolidated Financial Statements
Years
ended December 31, 2009, 2008 and 2007
|
(4)
|
Includes
(i) contracts pending to implement in Pesos, Dollars, and Euros at the
representative market rate at December 31, 2009, (ii) $11,889,152 in
standby letters credit which guarantees contracts entered into by
Ecopetrol in an amount totaling $523,772 and (iii) $7,205 in documentary
credit letters. The difference between December 2008 values are
due to contract balances for 2009.
|
|
(5)
|
Includes
the amount of assets received in custody by Refinería de Cartagena S.A. to
comply with the obligations entered into under the warrant operating
agreement between the Company and said entity to operate the Cartagena
refinery.
|
|
(6)
|
Corresponds
to non-renewable natural resources received by the Nation for $7,883,514
calculated based on SEC prices and discount rates. Additionally, the
balance is represented by the inventories of sold products pending
delivery to customers, for $65,374 from Ecopetrol, $934 from Propilco, $28
from Ocensa and inventories held on consignment for self consumption in
the different plants of Ecopetrol for
$110.
|
|
(7)
|
In
March 2009, Ecopetrol acquired Enbridge Inc.’s shares in Ocensa. As a
result, the contingent obligations to provide the necessary funds to repay
capital contributions and the preferred dividends to the remaining
Ocensa’s shareholders have ended.
|
|
(8)
|
Includes
basically the closed pledge in amount of $2,664,240 of the stock shares
that Ecopetrol owns directly or indirectly in Oleoducto Central, Refinería
de Cartagena S.A. and Polipropileno del Caribe S.A., guaranteeing 120%
coverage of the syndicated loan granted by the local banks. (See note
14)
|
|
23.
|
Revenue
|
|
2009
|
2008
|
2007
|
||||||||||
|
Local
Sales
|
||||||||||||
|
Medium
distillates
|
$ | 5,097,467 | $ | 5,914,627 | $ | 4,889,373 | ||||||
|
Gasoline
|
5,015,900 | 3,644,345 | 3,346,360 | |||||||||
|
Services
|
1,113,075 | 921,652 | 821,197 | |||||||||
|
Natural
gas
|
1,000,517 | 901,414 | 660,171 | |||||||||
|
Plastic
and rubber
|
571,007 | 382,519 | - | |||||||||
|
L.P.G.
and propane
|
469,551 | 612,771 | 604,752 | |||||||||
|
Asphalt
|
314,230 | 390,544 | 257,177 | |||||||||
|
Other
products
|
262,060 | 985,247 | 641,288 | |||||||||
|
Crude
oil
|
18,194 | 4,774,401 | 3,004,629 | |||||||||
| 13,862,001 | 18,527,520 | 14,224,947 | ||||||||||
|
Recognition
of Price differential (1)
|
196,533 | 3,070,479 | 1,778,050 | |||||||||
| 14,058,534 | 21,597,999 | 16,002,997 | ||||||||||
|
Foreign
sales
|
||||||||||||
|
Crude
oil
|
11,815,512 | 8,696,282 | 4,476,137 | |||||||||
|
Fuel
oil
|
1,660,911 | 2,093,012 | 1,560,399 | |||||||||
|
Gasoline
|
1,654,669 | 186,197 | 269,248 | |||||||||
|
Other
products
|
642,877 | 744,957 | 82,348 | |||||||||
|
Natural
gas
|
311,734 | 313,348 | 37 | |||||||||
|
Diesel
|
178,530 | 246,158 | - | |||||||||
|
Traded
gasoline
|
69,866 | - | - | |||||||||
|
Naphtha
|
- | 2,693 | 244,393 | |||||||||
|
Petroleum
savings and stabilization Fund – FAEP
|
- | - | (316,497 | ) | ||||||||
| 16,334,099 | 12,282,647 | 6,316,065 | ||||||||||
|
Premium
income, net
|
11,757 | 16,023 | 13,258 | |||||||||
| 16,345,856 | 12,298,670 | 6,329,323 | ||||||||||
| $ | 30,404,390 | $ | 33,896,669 | $ | 22,332,320 | |||||||
|
(1)
|
Corresponds
to Decree 4839 applied at December 2008 which determines the price
differential (value generated between the parity price and the regulated
price, which may be either negative or positive). As of
December 31, 2009 the negative price differential was $326,453 and is
recorded as a lower income amount of medium distillates and gasoline in
local sales. As of December 31, 2009 the positive differential was
$260,933 (2008 - $3,070,479) in Ecopetrol, affected by a negative price
differential from Cartagena refinery of
$64,400.
|
F-49
Ecopetrol
S.A. and Subsidiaries
Notes to
the Consolidated Financial Statements
Years
ended December 31, 2009, 2008 and 2007
|
24.
|
Cost
of Sales
|
|
2009
|
2008
|
2007
|
||||||||||
|
Variable
Cost
|
||||||||||||
|
Purchase
of hydrocarbons from the ANH (1)
|
$ | 4,358,408 | $ | 5,584,474 | $ | 3,912,315 | ||||||
|
Purchase
of crude oil in association and concession
|
4,130,116 | 3,193,690 | 1,425,945 | |||||||||
|
Imported
products
|
2,739,681 | 3,470,987 | 681,485 | |||||||||
|
Amortization
and depletion
|
1,474,918 | 1,087,583 | 665,459 | |||||||||
|
Process
materials
|
166,785 | 113,427 | 93,017 | |||||||||
|
Electrical
power
|
156,405 | 112,355 | 91,036 | |||||||||
|
Purchase
of natural gas and other products
|
57,335 | 230,977 | 203,697 | |||||||||
|
Depreciation
by production units
|
48,834 | - | - | |||||||||
|
Insurance
premium costs, net
|
554 | 1,898 | 6,237 | |||||||||
|
Costs
of sale of contributions in kind
|
- | - | 432,144 | |||||||||
|
Absorption
of the cost in final inventory balances
|
(55,042 | ) | (239,033 | ) | (390,416 | ) | ||||||
|
Adjustment
in volumes from other assignations and project charges
|
(334,658 | ) | (132,040 | ) | (254,808 | ) | ||||||
|
Fixed
Cost
|
||||||||||||
|
Services
contracted with associations
|
1,290,177 | 1,188,294 | 1,059,522 | |||||||||
|
Maintenance
|
1,274,618 | 831,553 | 593,331 | |||||||||
|
Depreciation
|
1,239,846 | 670,279 | 719,811 | |||||||||
|
Labor
costs
|
918,264 | 751,826 | 531,171 | |||||||||
|
Transportation
services for hydrocarbons
|
637,029 | 581,945 | 648,586 | |||||||||
|
Project
expense
|
524,441 | 571,941 | 696,089 | |||||||||
|
Ecopetrol
contracted services
|
451,222 | 294,351 | 312,768 | |||||||||
|
Taxes
|
326,767 | 199,175 | 127,534 | |||||||||
|
Materials
and operations supplies
|
316,218 | 266,134 | 212,322 | |||||||||
|
Amortization
of deferred charges, intangibles and insurance premiums
|
94,288 | 73,343 | 173,883 | |||||||||
|
Amortization
of actuarial liability
|
82,812 | 207,363 | 161,825 | |||||||||
|
General
costs
|
7,055 | 23,914 | 18,880 | |||||||||
| $ | 19,906,073 | $ | 19,084,436 | $ | 12,121,833 | |||||||
|
(1)
|
Corresponds
to the crude oil and natural gas purchases of Ecopetrol from the Agencia
Nacional de Hidrocarburos derived from national production, both under the
Company’s direct operation and under the operation of third
parties.
|
F-50
Ecopetrol
S.A. and Subsidiaries
Notes to
the Consolidated Financial Statements
Years
ended December 31, 2009, 2008 and 2007
|
25.
|
Operating
Expenses
|
|
2009
|
2008
|
2007
|
||||||||||
|
Administration
|
||||||||||||
|
Labor
|
$ | 281,123 | $ | 189,757 | $ | 156,959 | ||||||
|
Depreciation
and amortization (1)
|
175,032 | 58,705 | 45,059 | |||||||||
|
General
expenses
|
149,644 | 65,087 | 50,146 | |||||||||
|
Maintenance
|
17,361 | 11,295 | 11,730 | |||||||||
|
Rentals
|
17,322 | 10,156 | 24,255 | |||||||||
|
Active
personnel amortization of pension actuarial liability
|
12,770 | 44,055 | 32,494 | |||||||||
|
Taxes
|
9,084 | 3,046 | 1,401 | |||||||||
| 662,336 | 382,101 | 322,044 | ||||||||||
|
Selling
|
||||||||||||
|
Studies
and projects (2)
|
1,396,482 | 912,751 | 425,355 | |||||||||
|
Taxes
|
181,109 | 182,886 | 155,374 | |||||||||
|
General
expenses (3)
|
166,480 | 113,024 | 35,452 | |||||||||
|
Natural
Gas pipeline transportation
|
141,889 | 102,862 | 75,474 | |||||||||
|
Labor
expenses
|
43,495 | 26,759 | 11,622 | |||||||||
|
Non-compliance
gas delivery charges
|
27,851 | - | - | |||||||||
|
Maintenance
|
5,336 | 5,090 | 75,305 | |||||||||
|
Crude
oil pipeline transportation tariff
|
- | 422,697 | 146,721 | |||||||||
|
Active
personnel amortization of pension actuarial liability
|
- | 6,705 | 4,002 | |||||||||
| 1,962,642 | 1,772,774 | 929,305 | ||||||||||
| $ | 2,624,978 | $ | 2,154,875 | $ | 1,251,349 | |||||||
|
(1)
|
In
2009 $139,909 were amortized in regard to goodwill acquired from Offshore
International Group, IPL Enterprise, Hocol, Andean Chemicals Limited and
Propilco (2008 - $27,512).
|
|
(2)
|
These
expenses correspond to seismic and exploratory activities from Ecopetrol
$785,628, Ecopetrol America Inc $350,080, Ecopetrol Oleo e Gas do Brasil
$138,421, Hocol $117,857, Ecopetrol de Peru $4,147, Bioenergy
349.
|
|
(3)
|
Corresponds
mainly to customs operation expenses, leases, freight charges, utilities
and administration contracts from Ecopetrol in the amount of $104,524,
from Propilco in the amount of $57,158, from Comai in the amount of
$2,515, from Hocol in the amount of $2,240 and from Refinería de Cartagena
in the amount of $43.
|
|
26.
|
Financial
Income, Net
|
|
2009
|
2008
|
2007
|
||||||||||
|
Income
|
||||||||||||
|
Exchange
difference gain (1)
|
$ | 14,672,907 | $ | 10,863,242 | $ | 3,772,753 | ||||||
|
Interest
and monetary correction (2)
|
479,694 | 682,542 | 161,125 | |||||||||
|
Income
on valuation of investment portfolio
|
168,442 | 1,640,338 | 808,922 | |||||||||
|
Income
on valuation of derivatives (3)
|
159,245 | 4,782 | - | |||||||||
|
Dividends
in cash
|
31,687 | 39,472 | 25,387 | |||||||||
|
Income
from equity method
|
55,143 | 110,824 | - | |||||||||
|
Others
|
1,802 | - | - | |||||||||
| 15,568,920 | 13,341,200 | 4,768,187 | ||||||||||
|
Expenses
|
||||||||||||
|
Exchange
difference loss (1)
|
(14,798,550 | ) | (8,901,184 | ) | (4,385,021 | ) | ||||||
|
Loss
on valuation of derivatives (3)
|
(84,492 | ) | (74,685 | ) | (43,696 | ) | ||||||
|
Interest
|
(138,801 | ) | (19,376 | ) | (1,021 | ) | ||||||
|
Administration
and securities issuance
|
(23,438 | ) | (52,277 | ) | (76,770 | ) | ||||||
|
Others
|
(27,806 | ) | (6,820 | ) | (1,147 | ) | ||||||
|
Loss
on application of equity method
|
- | (185,606 | ) | (115 | ) | |||||||
|
Discount
on cash purchases of shares
|
- | - | (166,789 | ) | ||||||||
| (15,073,087 | ) | (9,239,948 | ) | (4,674,559 | ) | |||||||
| $ | 495,833 | $ | 4,101,252 | $ | 93,628 | |||||||
F-51
Ecopetrol
S.A. and Subsidiaries
Notes to
the Consolidated Financial Statements
Years
ended December 31, 2009, 2008 and 2007
|
(1)
|
The
8.9% Colombian peso revaluation against the U.S. dollar during 2009 and
the U.S. dollars Company’s indebtedness originated an almost neutral
effect in the results due to the exchange difference. The final effect was
unfavorable in an amount totaling $125,643 compared to a positive exchange
difference during 2008 of $1,962,058, as a result of 11.4% devaluation
during such period. The net position is active in dollars and decreased
from USD 5,9 billion in 2008 to USD 132 million in
2009.
|
|
(2)
|
In
2009, $235,704 was recorded regarding the opportunity cost of the
cumulative receivable balance of the differential price for regular
gasoline and diesel of 2008 in accordance to Resolution 180639 of April 29
of 2009 (2008 - $93,218). Income is estimated for 2009 applying the
following interest rates: 9.29% EA for April’s month payment, 9.344 % EA
for August and 9.398% EA for December (Resolution 180639). In addition the
reference rate for recognition of the opportunity cost of the fuel price
differential during the third quarter of 2009 is 4.142%. The opportunity
cost was recognized for year 2008 based on the definition made by CONFIS
in its meeting of February 21, 2008, equivalent to a rate of 4.48% EA
(Resolution 181496).
|
|
(3)
|
Profits
of $66,862 were recorded at Ecopetrol from asphalt hedging and of $906
were recorded from exchange rates hedging . Losses of $19,021 were
recorded from WTI hedging and of $4,736 from other hedging. Likewise,
Cartagena refinery recorded profits from exchange rate hedging in an
amount totaling $30,742.
|
|
27.
|
Pension
expenses
|
|
2009
|
2008
|
2007
|
||||||||||
|
Amortization
of pension actuarial calculation (1)
|
$ | 407,083 | $ | 986,565 | $ | 955,381 | ||||||
|
Health
care services
|
132,322 | 107,213 | 86,520 | |||||||||
|
Education
services
|
55,752 | 51,147 | 48,442 | |||||||||
| $ | 595,157 | $ | 1,144,925 | $ | 1,090,343 | |||||||
|
(1)
|
In
December 2008 the Company partially commutated (transferred) the amount
corresponding to the pension provisions by transferring said obligations
and funds supporting them to pension trust funds. In 2009 the Company did
not recognize any actuarial amortization of pensions given that the
current yield of the self-standing funds covers the growth on pensions
liability during 2009 for pensions and monthly payments exceeding growth
in $72,696. In 2009 only health and education actuarial amortization was
recognized in amount of $407,083 ($195,341 in
2008).
|
|
28.
|
Inflation
gain
|
The
inflation gain corresponds to the net amortization of the deferred monetary
correction.
|
29.
|
Other
income (expenses), Net
|
|
2009
|
2008
|
2007
|
||||||||||
|
Other
Income
|
||||||||||||
|
Recovery
of provisions (1)
|
$ | 224,565 | $ | 999,866 | $ | 555,438 | ||||||
|
BOMTs
deferred income
|
- | - | 4,008 | |||||||||
|
Recuperation
of exploration expenses
|
148,996 | - | - | |||||||||
|
Expense
recovery
|
61,972 | 7,459 | 39,575 | |||||||||
|
Income
for services
|
48,878 | 3,605 | 6,685 | |||||||||
|
Income
from transferred rights
|
28,116 | - | - | |||||||||
|
Income
from undeveloped discovered fields
|
19,257 | 1,228 | 13,622 | |||||||||
|
Indemnities
received
|
16,305 | 6,367 | 1,703 | |||||||||
|
Recovery
from services to associates
|
14,219 | 22,840 | 70,133 | |||||||||
|
Other
minor income
|
134,885 | 23,303 | 64,062 | |||||||||
|
Income
on sale of property, plant and equipment
|
3,579 | 10,435 | 8,724 | |||||||||
| 700,772 | 1,075,103 | 763,950 | ||||||||||
|
Other
expenses
|
||||||||||||
|
Provisions
(2)
|
(462,812 | ) | (114,035 | ) | (1,240,400 | ) | ||||||
|
Taxes
|
(352,459 | ) | (299,673 | ) | (328,871 | ) | ||||||
|
Tariff
and natural gas pipelines availability – BOMT
|
(89,906 | ) | (95,505 | ) | - | |||||||
|
Fuel
losses
|
(99,771 | ) | (93,854 | ) | (56,648 | ) | ||||||
|
Contributions
and donations
|
(40,497 | ) | (35,293 | ) | (9,535 | ) | ||||||
|
Inspection
quota
|
(26,986 | ) | (25,811 | ) | (25,934 | ) | ||||||
|
Surveillance
and security
|
(23,026 | ) | (16,052 | ) | (14,457 | ) | ||||||
|
Other
minor expenses
|
(151,034 | ) | (26,135 | ) | (23,208 | ) | ||||||
|
Loss
on sale and retirement of assets
|
193 | (1,399 | ) | (3,148 | ) | |||||||
| (1,246,298 | ) | (707,757 | ) | (1,702,201 | ) | |||||||
| $ | (545,526 | ) | $ | 367,046 | $ | (938,251 | ) | |||||
F-52
Ecopetrol
S.A. and Subsidiaries
Notes to
the Consolidated Financial Statements
Years
ended December 31, 2009, 2008 and 2007
|
(1)
|
A
detail of the recovery of provisions is as
follows:
|
|
2009
|
2008
|
2007
|
||||||||||
|
Product
and materials inventories
|
$ | 118,652 | $ | 8,711 | $ | 21,010 | ||||||
|
Legal
Proceedings
|
83,258 | 832,788 | 46,934 | |||||||||
|
Fixed
assets, receivable and others
|
17,091 | 18,813 | 27,355 | |||||||||
|
Other
recoveries
|
5,564 | - | - | |||||||||
|
Investment
|
- | 130,543 | 1,322 | |||||||||
|
Taxes
|
- | 9,011 | 117,680 | |||||||||
|
BOMT
Provisions
|
- | - | 221,055 | |||||||||
|
Project
expenses
|
- | - | 120,082 | |||||||||
| $ | 224,565 | $ | 999,866 | $ | 555,438 | |||||||
|
(2)
|
A
detail of provisions is as follows:
|
|
Legal
Proceedings
|
$ | (271,091 | ) | $ | (59,305 | ) | $ | (1,096,117 | ) | |||
|
Products
and materials inventories
|
(33,161 | ) | (49,379 | ) | (115,944 | ) | ||||||
|
Receivables
|
(30,734 | ) | (2,275 | ) | (20,276 | ) | ||||||
|
Devaluation
of property, plant and equipment
|
(127,826 | ) | - | - | ||||||||
|
Contributions
to pension funds
|
- | (3,076 | ) | - | ||||||||
|
Investments
|
- | - | (6,273 | ) | ||||||||
|
Property,
plant and equipment and other
|
- | - | 1,790 | |||||||||
| $ | (462,812 | ) | $ | (114,035 | ) | $ | (1,240,400 | ) |
|
30.
|
Contingencies
|
Ecopetrol
has recognized provisions corresponding to reasonable estimates intended to
cover future situations deriving from loss contingencies or the occurrence of
future events that could affect its financial position and results of
operations.
The
methodology used by the Legal Vice Presidency is based on the credit system of
the Nation, which is used by the Ministry of Interior and Justice and includes
an analysis of factors such as procedural risk, strength of the claim, proof of
the claim, strength of the response, proof of the response, level of
jurisprudence and results of first instance decision.
A summary
of the most significant proceedings (with amounts of claims greater than $10
billion) for which provisions have been recognized according to the evaluations
of the internal and external attorneys of the Company, as of December 31, 2009,
is set forth below:
|
Proceeding
|
Claim
|
Amount of the
Provision
|
||||
|
Foncoeco
(*)
|
Profit
participation fund of the employees and ex employees of
Ecopetrol
|
139,933 | ||||
|
Municipio
de Aguazul, Tauramena
|
Class
Action. Administrative proceeding of the Solidarity Contribution Fund to
the electricity self-taxation
|
139,688 | ||||
F-53
Ecopetrol
S.A. and Subsidiaries
Notes to
the Consolidated Financial Statements
Years
ended December 31, 2009, 2008 and 2007
|
Proceeding
|
Claim
|
Amount of the
Provision
|
||||
|
Municipio
de Arauca
|
Class
Action. Contributions to the solidarity and redistribution of income fund
as a consequence of the generation of electricity, according to the Law
142 of 1994.
|
121,051 | ||||
|
Departamento
del Tolima
|
Class
Action for the recalculation of royalties with 20% specified in Law 141 of
1994.
|
82,287 | ||||
|
Municipio
de Melgar
|
Class
Action requesting the recovery to the Department of Tolima of the amounts
not collected regarding royalties corresponding to the Guandó
well.
|
40,351 | ||||
|
Universidad
de Cartagena and Junta Especial de la Estampilla
|
Constitutional
Action in which the Universidad de Cartagena requests the compliance
action for the payment of the stamp on operations carried out in Bolivar,
especially in Cartagena de Indias port.
|
22,866 | ||||
|
Consorcio
Protécnica Ltda (under liquidation) - Constructora Kepler S.A. De
C.V.
|
Time
over run in construction said to be Ecopetrol’s fault that altered the
economic and financial equilibrium of the contract against the contracting
consortium .
|
10,000 | ||||
|
*
|
Expert’s
report of 2005 calculated in $542,000 the damages owed by Ecopetrol in the
Ordinary Civil Action filed by Foncoeco which claims that Ecopetrol must
pay principal and interest on the profit participation fund for the
employees of the Company which was established by the Board of Directors.
It is the opinion of the Company’s management and its legal advisors that
there are sufficient arguments to demonstrate that this lawsuit will not
proceed, particularly because the basis of the report includes amounts not
authorized by the Board of Directors, therefore, at December 2009 closing
date a provision in amount of just $139,933 (2008 - $100,000).was recorded
for this proceeding.
|
|
31.
|
Commitments
|
Cocorna
Association Contract – Campo Teca
Upon
expiration of the Cocorna Association Contract on October 8, 2008 Ecopetrol
received from its associate Mansarovar Energy Colombia LTD. the Teca field that
was operated and located near Puerto Nare municipalities (Antioquia), Puerto
Triunfo (Antioquia) and Puerto Boyacá (Boyacá). It has 219 wells that in 2009
produced an average of 1,798 daily barrels of heavy crude oil of 12.5 degrees
API.
Notwithstanding
the expiration of the Cocorna Association Contract and the Teca field was
delivered to Ecopetrol, there is a difference in interpretation between the two
companies regarding the date of expiration as Mansarovar Energy
Colombia Ltd. claims that it should be June 18, 2011. The two companies have
agreed to present the differences in interpretation before Arbitration
Panel.
While
waiting for the Arbitration Panel to make a decision, Ecopetrol entered into an
agreement with Mansarovar Energy Colombia Ltd. for it to continue operating the
Teca field. All income to Mansarovar (which is set at 50% of production) as well
as the total expenses of the Teca field operation will be administered through a
Management and Payment Trust, until the Arbitration Panel makes a decision. The
remaining resources in the trust will be assigned to the Company who wins the
arbitration.
The
municipalities and the department of the said area will continue to receive
royalties of 20%, which corresponds to the percentage set forth in the expired
association contract. Additional royalties of 12%, which were determined by Law
on the date of expiration, will be deposited into the Management and Payment
Trust’s royalties account and will generate the appropriate
interest.
F-54
Ecopetrol
S.A. and Subsidiaries
Notes to
the Consolidated Financial Statements
Years
ended December 31, 2009, 2008 and 2007
Natural
Gas Supply Contracts
In
addition to existing contracts, the Company has entered into new contracts for
sale or supply of natural gas with third parties, such as Gecelca ESP, Alcanos
S.A. ESP, E2, Gas Natural S.A. ESP, Empresas Públicas de Medellín, among others.
During 2009, Ecopetrol sold 578.66 GBTUD average for $1,305,419 (including
exports). Likewise, Ecopetrol entered into a new agreement with the National
Hydrocarbon Agency (ANH) for the sale of royalties.
In
December 2009, Ecopetrol conducted the auction of 32.8 GBTUD of natural gas from
the Cusiana extension project (LTO2), achieving the highest marketing price in
the primary market, which positively impacted the incorporation of reserves from
the foothills.
During
the last quarter of 2009, the unfavorable weather condition, known as “El Niño”,
caused a high thermoelectric generation of gas in Colombia. As a
result, gas sales exceeded historical levels. Additionally, in order to increase
the thermal generation levels, the Company provided an average of 2.4 KBD
diesel.
Hedging
operations
Call
Options
Hedging
Description
Hedging
operations were performed by means of call options. Using this strategy
Ecopetrol S.A. protects itself from price increase risk on the relevant index.
The underlying assets hedged by this strategy are the asphalt shipments traded
in the local market by the Company which has a valuation index of USGC
3%.
As of
December 31, 2009, the following call options were exercised as
follows:
|
Counterpart
|
Effective date
in 2010
|
Expiration date
in 2010
|
Volume
|
STRIKE
PRICE
|
CALL
PRICE
|
||||||||
|
BP.
Products North America Inc.
|
January
1
|
December
31
|
480,000
Bls.
|
US$ |
71
|
9.80 | |||||||
|
J.
Aron & Company (Goldman Sachs)
|
January
1
|
December
31
|
600,000
Bls.
|
US$ |
71
|
9.73 | |||||||
|
JP
Morgan
|
January
1
|
December
31
|
480,000
Bls.
|
US$ |
71
|
9.85 | |||||||
|
Morgan
Stanley
|
January
1
|
December
31
|
480,000
Bls.
|
US$ |
70
|
9.96 | |||||||
Hedge
Instruments
Long
positions on call options over the USGC index
A summary
of hedge instruments is as follows:
|
Counterpart
|
Effective date in
2010
|
Maturity in 2010
|
Volume
|
STRIKE
PRICE
|
|||||||
|
Morgan
Stanley
|
January
1
|
January
30
|
300,000
|
Bls. | US$ | 1.02 | |||||
F-55
Ecopetrol
S.A. and Subsidiaries
Notes to
the Consolidated Financial Statements
Years
ended December 31, 2009, 2008 and 2007
Swap -
Spread
Hedge
description
A
Swap-Spread hedge operation was performed over the price difference between NY
1% and USGC 3% indexes, thus guaranteeing a competitive discount factor for the
Company on the Ecopetrol valuation index. The aforementioned indexes are used to
negotiate fuel oil shipments.
Hedge
Instruments
Swap
instruments with long and short positions over each index
respectively.
Earn
outs in acquired companies
As part
of the Company’s acquisitions of Hocol Petroleum Ltd. and Offshore International
Group (“OIG”), the Company took over future commitments, called “earn outs”,
which must be recognized by the buyer to the seller, depending on the behavior
of variables such as the crude oil price and the reserves.
Hocol Petroleum
Ltd.
|
1.
|
An
additional amount might have to be paid in February 2011 depending on the
behavior of the crude oil average price per barrel. Below is a
summary of the additional amount to be paid depending on the actual
recorded WTI crude barrel price between January 1, 2010 and December 31,
2010:
|
If the
WTI crude barrel price is:
|
|
•
|
Less
than US$55, the amount to be paid is
zero
|
|
|
•
|
Higher
than US$55 and less than US$60, the amount to be paid is US$25 million;
or
|
|
|
•
|
Higher
than US$60 and less than US$65, the amount to be paid is US$40
million.
|
|
|
•
|
Higher
than US$65, the amount to be paid is US$65
million.
|
|
2.
|
An
additional payment, in a maximum amount of US$50 million, may have to be
paid in the first quarter of 2013 depending on the exploratory results of
the Huron well. The amount to be paid will be determined by considering
that, during a maximum period of two years (until December 2012), there
should be 2P type certified reserves. The calculation of the additional
payment is as follows: the reserves volume is multiplied by a percentage
(between 6% and 8%) of the average WTI price during a given period of time
to determine the base price to pay, subject to the maximum limit
established.
|
Offshore
International Group (“OIG”)
If during
the two years after the acquisition of “OIG” (which occurred on February 6,
2009), the average price of crude oil per barrel is more than US$60, but less or
equal than US$70, an additional amount equal to US$200 million will have to be
paid by Ecopetrol. If during that time frame, the average price per
barrel is more than US$70, the amount to be paid will be US$300 million.
Ecopetrol will be responsible for 50% of this commitment.
Ship
or Pay Contracts
Ecopetrol
and ODL have entered into two Ship-or-Pay contracts: (i) The first supports the
financing tariff obligation for 5 years and is collected through a trust fund in
charge of paying the debt amortization payments to “Grupo Aval”, and (ii) the
second supports the securitization obligation for 7 years. Under each of these
contracts, the invoicing, collection and payment obligations have been
transferred to the trust funds. Each of these contracts commits daily
transportation of 30,000 barrels during the first phase and 60,000 barrels
during the second phase.
F-56
Ecopetrol
S.A. and Subsidiaries
Notes to
the Consolidated Financial Statements
Years
ended December 31, 2009, 2008 and 2007
Refinare
Ecopetrol
was notified in July 2009 about a legal proceeding initiated by Refinería del
Nare S.A. (“Refinare”) in which Ecopetrol was one of the named
defendants. Refinare argues that, as a result of a criminal
proceeding initiated against it by the Hydrocarbons Police Unit, Ecopetrol
suspended all commercial relations with Refinare, which in turn resulted in the
mandatory liquidation it now faces. The amount of the damages sought by Refinare
for this alleged wrong-doing totaled approximately $710 million at December 31,
2009. However, under the Company’s internal evaluation, this claim is
highly likely to prove unsuccessful. As such, at December 31, 2009,
the Company did not record a provision related to this claim.
|
32.
|
Subsequent
Events
|
Savia
- Perú
In
February 2010, an announcement was made regarding the change of Petro-Tech
Peruana’s name to Savia – Perú, which is the main subsidiary of Offshore
International Group (“OIG”).
Ecopetrol
Response to Refinare Litigation
On
February 8, 2010, Ecopetrol sent its response to the Refinare litigation
mentioned above. Ecopetrol argued, among others, that: 1) it was
forced by law to enter the criminal proceedings which the General Prosecutor's
Office of Colombia brought against Refinare, 2) it did not have a monopoly in
the market, nor did it abuse its presumed dominant position in the market with
respect to the oil demand supplied by Refinare, 3) it did not engage in any
behavior that could be considered unfair competition, and 4) it was under no
legal obligation to sell crude oil to Refinare.
Additionally,
Ecopetrol argued that: 1) the complaint had partially expired with respect to
the alleged illegal competition and presumed acts of jurisdictional error, 2)
Ecopetrol does not have any influence on the decisions by the General
Prosecutor's Office of Colombia, and 3) Refinare had reached liquidation as a
result of its own economic condition.
Cocorna
Association Contract – Campo Teca
On
February 12, 2010, the Arbitration Panel convened by Ecopetrol S.A. and
Mansarovar Energy Colombia Ltda. issued its decision concerning the expiration
date of the Cocorna Association Contract (See note 31). The Arbitration Panel
ruled in favor of Ecopetrol, thereby generating income in the Company’s
financial statements of in the amount of $17,946 million. This amount
will be recognized in the financial results of the Company for the fiscal year
ending 2010.
Dry
wells – Ecopetrol S.A.
In May
2010, Ecopetrol recognized six dry wells, which are Tupale 1, Merey, Sonero 1,
Torrontes 1, Hechicera and Merecure. The cost associated with the exploration
activities as of December 31, 2009 was $32,351, and this amount was recognized
at the end of 2009 for U.S. GAAP purposes in the income statement.
Dry
wells – Ecopetrol America Inc. – Palomino and Soluki
On April
and May 2010, two wells were declared dry in America Inc., Palomino-1 (25%
Ecopetrol’s participation) and Saluki (35% Ecopetrol’s participation).
Exploration activities in the mentioned wells began in January and February
2010, respectively. Costs associated with the exploration were recognized in the
first and second quarter of 2010. For that reason, there is no impact on the
financial statements as of December 31, 2009.
F-57
Ecopetrol
S.A. and Subsidiaries
Notes to
the Consolidated Financial Statements
Years
ended December 31, 2009, 2008 and 2007
|
33.
|
Differences
between Colombian Governmental Entity accounting principles and U.S.
GAAP
|
The
Company's financial statements are prepared in accordance with Colombian
Government Entity GAAP (RCP). These principles and regulations differ
in certain significant respects from accounting principles generally accepted in
the United States of America (U.S. GAAP), and therefore this note presents
reconciliations of net income and shareholders’ equity determined under RCP to
those same amounts as determined according to U.S. GAAP. Also
presented in this note are those disclosures required under U.S. GAAP but not
required under RCP.
F-58
Ecopetrol
S.A. and Subsidiaries
Notes to
the Consolidated Financial Statements
Years
ended December 31, 2009, 2008 and 2007
A)
Reconciliation of net income attributable to Ecopetrol S.A.:
The
following table presents the reconciliation of net income per Colombian
Government Entity GAAP to net income under U.S. GAAP attributable to Ecopetrol
S.A. for the years ended December 31, 2009, 2008 and 2007:
|
2009
|
2008
|
2007
|
|||||||||||
|
Consolidated
net income under Colombian Government Entity GAAP
|
$ | 5,132,054 | $ | 11,629,677 | $ | 5,179,792 | |||||||
|
i.
|
Investment
securities:
|
||||||||||||
|
a. Unrealized
gain (loss)
|
639,073 | (924,715 | ) | 69,657 | |||||||||
|
b. Impairment
|
28,083 | 163,902 | (78,123 | ) | |||||||||
|
ii.
|
Investments
in non-marketable securities:
|
||||||||||||
|
a. Equity
method
|
(182,623 | ) | 164,734 | (36,960 | ) | ||||||||
|
b. Variable
Interest Entity (VIE)
|
320,600 | (367,743 | ) | 11,658 | |||||||||
|
iii.
|
Derivatives
|
25,505 | - | 6 | |||||||||
|
iv.
|
Exchange
of non-monetary assets
|
23,640 | 55,623 | 606,751 | |||||||||
|
v.
|
Deferred
charges
|
(35,722 | ) | (228 | ) | 240,293 | |||||||
|
vi.
|
Employee
benefit plans
|
(1,416,598 | ) | (1,451,179 | ) | (1,045,374 | ) | ||||||
|
vii.
|
Provisions,
allowances and contingencies
|
(24,833 | ) | 1,082,434 | 925,380 | ||||||||
|
viii.
|
Deferred
income taxes
|
(210,119 | ) | (159,891 | ) | (624,185 | ) | ||||||
|
ix.
|
Revenue
recognition:
|
||||||||||||
|
a. Revenue
– FAEP
|
- | - | 329,355 | ||||||||||
|
b. Cost
of sales – over and under
|
(111,126 | ) | (8,887 | ) | 16,607 | ||||||||
|
c. Other
income
|
10,765 | - | (97,127 | ) | |||||||||
|
x.
|
Inflation
adjustment
|
112,290 | 128,837 | 230,822 | |||||||||
|
xi.
|
Inventories
|
22,565 | 10,274 | (67,089 | ) | ||||||||
|
xii.
|
Lease
accounting
|
(43,163 | ) | 39,744 | (393,131 | ) | |||||||
|
xiii.
|
Prior
year adjustments
|
- | - | 574 | |||||||||
|
xiv.
|
Property,
plant and equipment:
|
||||||||||||
|
a.
Interest
|
(63,779 | ) | - | 1,228 | |||||||||
|
c.
Impairment
|
(395,044 | ) | (121,296 | ) | (65,137 | ) | |||||||
|
d.
Capitalized expenses
|
(236,219 | ) | 76,167 | - | |||||||||
|
e.
Exchange difference
|
(16,028 | ) | - | - | |||||||||
|
xv.
|
Depreciation,
Depletion and Amortization
|
484,593 | (1,478,851 | ) | 227,754 | ||||||||
|
xvi.
|
Asset
retirement obligations
|
401,695 | (70,014 | ) | 10,039 | ||||||||
|
xvii.
|
Equity
contributions:
|
||||||||||||
|
a. Incorporated
institutional equity
|
20,692 | 21,217 | 9,304 | ||||||||||
|
b. Contributions
in kind
|
- | - | 432,144 | ||||||||||
|
c. Reversion
of concession rights contributed as capital
|
18,199 | 24,117 | 17,562 | ||||||||||
|
xviii.
|
Public
offering costs and discount on issuance of shares
|
- | - | 242,885 | |||||||||
|
xix.
|
Indebtedness
cost
|
8,800 | - | - | |||||||||
|
xx.
|
Business
combinations:
|
||||||||||||
|
a. Goodwill
|
139,909 | 27,512 | - | ||||||||||
|
b. Fair
value adjustments to assets and liabilities acquired
|
25,217 | 449 | - | ||||||||||
|
xxi.
|
Non-controlling
Interest
|
(99,958 | ) | - | - | ||||||||
|
Consolidated
net income under U.S. GAAP attributable to Ecopetrol S.A.
|
$ | 4,578,468 | $ | 8,841,883 | $ | 6,144,685 | |||||||
F-59
Ecopetrol
S.A. and Subsidiaries
Notes to
the Consolidated Financial Statements
Years
ended December 31, 2009, 2008 and 2007
B) Reconciliation
of Shareholders’ equity attributable to Ecopetrol S.A.:
The
following table presents a reconciliation of Ecopetrol shareholders’ equity
under Colombian Governmental Entity GAAP to Ecopetrol shareholders’ equity under
U.S. GAAP as of December 31, 2009 and 2008:
|
2009
|
2008
|
||||||||
|
Consolidated
shareholders’ equity under Colombian Government Entity
GAAP
|
$ | 32,569,957 | $ | 34,619,717 | |||||
|
i.
|
Investment
securities:
|
||||||||
|
a. Unrealized
gain
|
581,841 | - | |||||||
|
ii.
|
Investments
in non-marketable securities:
|
||||||||
|
a. Equity
method
|
(1,507,543 | ) | (991,927 | ) | |||||
|
b. Variable
Interest Entity (VIE)
|
320,600 | (320,600 | ) | ||||||
|
d. Valuation
surplus
|
(1,029,443 | ) | (616,951 | ) | |||||
|
iii.
|
Derivatives
|
30,489 | - | ||||||
|
iv.
|
Exchange
of non-monetary assets
|
686,014 | 662,374 | ||||||
|
v.
|
Deferred
charges
|
25,697 | (7,133 | ) | |||||
|
vi.
|
Employee
benefit plans
|
(1,511,824 | ) | (563,814 | ) | ||||
|
vii.
|
Provisions
– allowance and contingencies
|
16,477 | 183,852 | ||||||
|
viii.
|
Deferred
income taxes
|
212,175 | 470,044 | ||||||
|
ix.
|
Revenue
recognition:
|
||||||||
|
b. Cost
of sales – over and under
|
(89,261 | ) | 10,984 | ||||||
|
c. Other
income
|
4,433 | - | |||||||
|
x.
|
Inflation
adjustment
|
(3,568,525 | ) | (863,496 | ) | ||||
|
xi.
|
Inventories
|
(31,017 | ) | (66,570 | ) | ||||
|
xii.
|
Lease
accounting
|
399,734 | 444,117 | ||||||
|
xiv.
|
Property,
plant and equipment:
|
||||||||
|
a. Interest
|
(24,011 | ) | 39,768 | ||||||
|
b. Revaluation
of property, plant and equipment and public accounting
effect
|
(5,361,974 | ) | (3,505,449 | ) | |||||
|
c. Impairment
|
(692,398 | ) | (297,319 | ) | |||||
|
d. Capitalized
expenses
|
(774,373 | ) | (555,684 | ) | |||||
|
e. Exchange
difference
|
(233,563 | ) | (217,535 | ) | |||||
|
xv.
|
Depreciation,
Depletion and Amortization
|
2,295,829 | (820,184 | ) | |||||
|
xvi.
|
Asset
retirement obligations
|
425,351 | (24,054 | ) | |||||
|
xvii.
|
Equity
contributions:
|
||||||||
|
a. Incorporated
institutional equity
|
(82,870 | ) | (60,907 | ) | |||||
|
c. Reversion
of concession rights contributed as capital
|
(103,260 | ) | (121,459 | ) | |||||
|
xix.
|
Indebtedness
cost
|
8,800 | - | ||||||
|
xx.
|
Business
combinations:
|
||||||||
|
a. Goodwill
|
116,805 | 48,471 | |||||||
|
b. Fair
value adjustments to assets and liabilities acquired
|
(196,291 | ) | (20,510 | ) | |||||
|
xxi.
|
Non-controlling
Interest
|
54,072 | - | ||||||
|
Consolidated
Ecopetrol shareholders’ equity under U.S. GAAP
|
$ | 22,541,921 | $ | 27,425,735 | |||||
F-60
Ecopetrol
S.A. and Subsidiaries
Notes to
the Consolidated Financial Statements
Years
ended December 31, 2009, 2008 and 2007
C)
Supplemental consolidated condensed financial statements under U.S.
GAAP
C)
1. Supplemental consolidated condensed balance sheets
The
condensed balance sheets of the Company as of December 31, 2009 and 2008 under
U.S. GAAP are presented below:
|
2009
|
2008
|
|||||||
|
Assets
|
||||||||
|
Current
assets:
|
||||||||
|
Cash
and cash equivalents
|
$ | 3,861,532 | $ | 4,812,595 | ||||
|
Investments
|
||||||||
|
Available
for sale
|
178,832 | 1,345,760 | ||||||
|
Held
to maturity
|
7,876 | - | ||||||
|
Accounts
and notes receivable, net
|
2,530,379 | 5,891,412 | ||||||
|
Inventories
|
1,929,977 | 1,569,165 | ||||||
|
Advances
and deposits
|
1,200,682 | 887,634 | ||||||
|
Prepaid
expenses and other assets
|
62,759 | 25,492 | ||||||
|
Deferred
income taxes
|
1,015,488 | 1,968,177 | ||||||
|
Total
current assets
|
10,787,525 | 16,500,235 | ||||||
|
Investments
|
||||||||
|
Available
for sale
|
4,118,555 | 7,327,755 | ||||||
|
Held
to maturity
|
130,740 | 179,096 | ||||||
|
Accounts
and notes receivable, net
|
226,781 | 194,912 | ||||||
|
Restricted
assets
|
380,463 | 388,892 | ||||||
|
Property,
plant and equipment, net
|
13,098,446 | 7,696,192 | ||||||
|
Natural
and environmental resources, net
|
9,431,458 | 6,456,158 | ||||||
|
Goodwill
|
2,385,113 | 627,610 | ||||||
|
Deferred
charges and other assets
|
1,280,359 | 793,339 | ||||||
|
Deferred
income taxes
|
1,475,559 | - | ||||||
|
Direct
finance lease long-term
|
19,254 | 80,263 | ||||||
|
Total
Assets
|
$ | 43,334,253 | $ | 40,244,452 | ||||
|
Liabilities
and shareholders’ equity
|
||||||||
|
Current
liabilities:
|
||||||||
|
Financial
obligations
|
$ | 437,111 | $ | 281,841 | ||||
|
Accounts
payable and related parties
|
3,571,680 | 1,834,041 | ||||||
|
Capital
lease liability
|
82,356 | 102,657 | ||||||
|
Taxes
payable
|
567,271 | 2,570,886 | ||||||
|
Labor
and pension plan obligations
|
165,472 | 340,537 | ||||||
|
Estimated
liabilities and provisions
|
1,122,409 | 677,214 | ||||||
|
Total
current liabilities
|
5,946,299 | 5,807,176 | ||||||
|
Financial
obligations, long-term
|
5,725,099 | 5,473 | ||||||
|
Accounts
payable, long-term
|
248,571 | 279,882 | ||||||
|
Capital
lease liability
|
278,594 | 388,591 | ||||||
|
Pension
plan obligation and other labor obligations, long-term
|
4,359,751 | 2,518,307 | ||||||
|
Deferred
income tax, long-term
|
- | 774,463 | ||||||
|
Estimated
liabilities and provisions
|
2,841,371 | 1,748,014 | ||||||
|
Other
long-term liabilities
|
809,334 | 478,039 | ||||||
|
Total
non-current liabilities
|
14,262,720 | 6,192,769 | ||||||
|
Total
liabilities
|
20,209,019 | 11,999,945 | ||||||
|
Shareholders’
equity of Ecopetrol
|
22,541,921 | 27,425,735 | ||||||
|
Non-controlling
interest
|
583,313 | 818,772 | ||||||
|
Total
Equity
|
23,125,234 | 28,244,507 | ||||||
|
Total
liabilities and shareholders’ equity
|
$ | 43,334,253 | $ | 40,244,452 | ||||
F-61
Ecopetrol
S.A. and Subsidiaries
Notes to
the Consolidated Financial Statements
Years
ended December 31, 2009, 2008 and 2007
C)
2. Supplemental consolidated condensed statements of
income
The
condensed statements of income of the Company for the years ended December 31,
2009, 2008 and 2007 under U.S. GAAP are presented below:
|
2009
|
2008
|
2007
|
||||||||||
|
Revenue:
|
||||||||||||
|
Local
sales
|
$ | 13,808,720 | $ | 21,550,543 | $ | 16,138,874 | ||||||
|
Foreign
sales
|
15,742,854 | 12,298,670 | 6,645,820 | |||||||||
|
Total
revenue
|
29,551,574 | 33,849,213 | 22,784,694 | |||||||||
|
Cost
of sales
|
19,136,478 | 17,927,991 | 10,942,526 | |||||||||
| 10,415,096 | 15,921,222 | 11,842,168 | ||||||||||
|
Operating
expenses:
|
||||||||||||
|
Administration
|
1,990,603 | 4,246,426 | 2,431,443 | |||||||||
|
Selling
|
1,967,139 | 1,834,485 | 955,626 | |||||||||
|
Operating
income
|
6,457,354 | 9,840,311 | 8,455,099 | |||||||||
|
Non-operating
income, net
|
549,981 | 3,587,132 | 255,549 | |||||||||
|
Income
before income tax
|
7,007,335 | 13,427,443 | 8,710,648 | |||||||||
|
Income
tax:
|
||||||||||||
|
Current
income tax
|
1,948,819 | 3,648,451 | 2,045,997 | |||||||||
|
Deferred
income tax
|
375,329 | 930,853 | 498,593 | |||||||||
| 2,324,148 | 4,579,304 | 2,544,590 | ||||||||||
|
Net
income
|
4,683,187 | 8,848,139 | 6,166,058 | |||||||||
|
Less:
Net (income) attributable to Non-controlling interest
|
(104,719 | ) | (6,256 | ) | (21,373 | ) | ||||||
|
Net
Income attributable to Ecopetrol S.A.
|
$ | 4,578,468 | $ | 8,841,883 | $ | 6,144,685 | ||||||
|
Earnings
per share (Basic and diluted) attributable to Ecopetrol common
shareholders
|
$ | 113.13 | $ | 218.47 | $ | 166.42 | ||||||
|
Weighted-average
shares outstanding (Basic and diluted)
|
40,472,512,588 | 40,472,512,588 | 36,922,352,491 | |||||||||
F-62
Ecopetrol
S.A. and Subsidiaries
Notes to
the Consolidated Financial Statements
Years
ended December 31, 2009, 2008 and 2007
C)
3. Supplemental consolidated condensed statements of cash
flows
The
condensed statements of cash flows of the Company for the years ended December
31, 2009, 2008 and 2007 under U.S. GAAP are presented below:
|
2009
|
2008
|
2007
|
||||||||||
|
Cash
flows provided by operating activities:
|
||||||||||||
|
Net
income
|
$ | 4,683,187 | $ | 8,848,139 | $ | 6,166,058 | ||||||
|
Adjustments
to reconcile net income to cash provided by operating
activities:
|
||||||||||||
|
Equity
method in non-marketable securities
|
182,623 | (106,845 | ) | 36,960 | ||||||||
|
Depreciation,
depletion and amortization
|
4,144,035 | 3,177,935 | 1,467,372 | |||||||||
|
Impairment
|
395,044 | 113,087 | 65,137 | |||||||||
|
Provisions
|
547,354 | (569,969 | ) | 86,746 | ||||||||
|
Deferred
income tax
|
375,329 | 930,853 | 498,594 | |||||||||
|
Exchange
(loss) gain
|
(496,983 | ) | (1,390,953 | ) | 408,181 | |||||||
|
Net
changes in operating assets and liabilities:
|
||||||||||||
|
Accounts
and notes receivable
|
3,336,133 | (2,383,061 | ) | 1,534,251 | ||||||||
|
Inventories
|
(32,049 | ) | (255,090 | ) | (316,950 | ) | ||||||
|
Deferred
charges and other assets
|
(28,095 | ) | (245,528 | ) | (33,721 | ) | ||||||
|
Accounts
payable and related parties
|
1,398,162 | 326,967 | (171,444 | ) | ||||||||
|
Taxes
payable
|
(2,678,083 | ) | 1,374,621 | 509,612 | ||||||||
|
Labor
obligations
|
311,513 | 401,445 | 1,231,621 | |||||||||
|
Estimated
liabilities and provisions
|
162,188 | 668,220 | 130,729 | |||||||||
|
Negative
goodwill
|
(182,868 | ) | - | - | ||||||||
|
Fair
value of pre-existent participation of business
combination
|
107,545 | - | - | |||||||||
|
Net
cash provided by operating activities
|
12,225,035 | 10,889,822 | 11,613,146 | |||||||||
|
Cash
flows from investing activities:
|
||||||||||||
|
Payment
for purchase of companies, net of cash acquired
|
(4,061,289 | ) | (1,274,751 | ) | - | |||||||
|
Purchase
of investment securities
|
(7,921,615 | ) | (27,814,744 | ) | (33,328,213 | ) | ||||||
|
Redemption
of investment securities
|
12,250,389 | 25,975,418 | 34,664,456 | |||||||||
|
Investment
in natural and environmental resources
|
(2,934,666 | ) | (3,574,418 | ) | (1,866,544 | ) | ||||||
|
Additions
to property, plant and equipment
|
(6,417,866 | ) | (3,869,577 | ) | (1,176,142 | ) | ||||||
|
Net
cash used in investing activities
|
(9,085,047 | ) | (10,558,072 | ) | (1,706,443 | ) | ||||||
|
Cash
flows from financing activities:
|
||||||||||||
|
Non-controlling
interest obligations
|
(340,178 | ) | 240,918 | (14,893 | ) | |||||||
|
Payment
of financial obligations
|
(310,420 | ) | (99,888 | ) | (425,879 | ) | ||||||
|
Proceeds
from financial obligations
|
6,152,400 | 235,720 | - | |||||||||
|
Proceeds
from issuance of shares
|
41,044 | 832,919 | 4,625,066 | |||||||||
|
Cash
paid to acquire a non-controlling interest
|
(998,903 | ) | - | - | ||||||||
|
Dividends
paid
|
(8,902,602 | ) | (4,652,182 | ) | (8,538,936 | ) | ||||||
|
Net
cash used in financing activities
|
(4,358,659 | ) | (3,442,513 | ) | (4,354,642 | ) | ||||||
|
Effect
of exchange rate changes on cash
|
(267,608 | ) | 83,923 | (116,558 | ) | |||||||
|
Net
(decrease) increase in cash and cash equivalents
|
(951,063 | ) | (3,194,687 | ) | 5,668,619 | |||||||
|
Cash
and cash equivalents at beginning of year
|
4,812,595 | 8,007,282 | 2,338,663 | |||||||||
|
Cash
and cash equivalents at end of year
|
$ | 3,861,532 | $ | 4,812,595 | $ | 8,007,282 | ||||||
F-63
Ecopetrol
S.A. and Subsidiaries
Notes to
the Consolidated Financial Statements
Years
ended December 31, 2009, 2008 and 2007
|
2009
|
2008
|
2007
|
||||||||||
|
Supplemental
cash flows information
|
||||||||||||
|
Cash
paid during the year
|
||||||||||||
|
Interest
|
$ | 107,343 | $ | 9,874 | $ | 23,426 | ||||||
|
Income
taxes
|
$ | 3,934,441 | $ | 1,869,475 | $ | 1,457,015 | ||||||
|
Non cash transactions
|
||||||||||||
|
Liabilities
assumed in business combinations
|
$ | 891,112 | $ | 184,807 | $ | - | ||||||
|
Exchange
of non-monetary assets
|
$ | - | $ | - | $ | 234,731 | ||||||
|
Assets
acquired through leasing contracts
|
$ | - | $ | 12,659 | $ | - | ||||||
|
Increase
of natural and environmental resources through asset retirement
obligations
|
$ | 96,766 | $ | 137,903 | $ | 83,088 | ||||||
Under Colombian Government Entity GAAP
as in effect for 2007, some deposits with banks were considered as short – term
investments because they produce yields and the Company has defined them to be
used for specific purposes. Under U.S. GAAP, these deposits are
considered cash. The amounts reclassified as of December 31, 2009,
2008 and 2007 were $275,552, $2,404,159 and $4,133,705. These
deposits are valued at fair value.
F-64
Ecopetrol
S.A. and Subsidiaries
Notes to
the Consolidated Financial Statements
Years
ended December 31, 2009, 2008 and 2007
C)
4. Supplemental consolidated statements of shareholders’
equity
The
statements of shareholders’ equity of the Company for the years ended December
31, 2009, 2008 and 2007 under U.S. GAAP are as follows:
|
Common Stock
|
||||||||||||||||||||||||||||||||||||
|
Millions
of
shares
|
Value
|
Additional
paid-
in-capital
|
Comprehensive
Income
|
Retained
earnings
|
Accumulated
Other
Comprehensive
income (loss)
|
Ecopetrol’s
Equity
|
Non-Controlling
Interest
|
Total Equity
|
||||||||||||||||||||||||||||
|
Balance
at January 1, 2007
|
36,385 | $ | 4,244,943 | $ | - | $ | - | $ | 15,443,181 | $ | (1,672,738 | ) | $ | 18,015,386 | $ | 565,119 | $ | 18,580,505 | ||||||||||||||||||
|
Issuance
of company shares
|
4,088 | 5,868,391 | $ | 3,607,929 | - | (4,851,254 | ) | - | 4,625,066 | 529 | 4,625,595 | |||||||||||||||||||||||||
|
Distribution
of dividends
|
- | - | - | - | (8,538,936 | ) | - | (8,538,936 | ) | (15,418 | ) | (8,554,354 | ) | |||||||||||||||||||||||
|
Other
contributions
|
- | - | - | - | 71,424 | - | 71,424 | - | 71,424 | |||||||||||||||||||||||||||
|
Net
income
|
- | - | - | $ | 6,166,058 | 6,144,685 | - | 6,144,685 | 21,373 | 6,166,058 | ||||||||||||||||||||||||||
|
Other
Comprehensive income, net of tax:
|
||||||||||||||||||||||||||||||||||||
|
Unrealized
earnings on investment securities, net of tax effect of
$(6,364)
|
- | - | - | 12,918 | - | - | 12,918 | - | 12,918 | |||||||||||||||||||||||||||
|
Amortization
of actuarial loss, net of tax effect of $(358,277)
|
- | - | - | 727,415 | - | - | 727,415 | - | 727,415 | |||||||||||||||||||||||||||
|
Translation
adjustment
|
- | - | - | (66,933 | ) | - | - | (66,927 | ) | (6 | ) | (66,933 | ) | |||||||||||||||||||||||
|
Total
other comprehensive income
|
- | - | - | 673,400 | - | 673,406 | - | - | - | |||||||||||||||||||||||||||
|
Comprehensive
income
|
- | - | - | $ | 6,839,458 | - | - | - | - | - | ||||||||||||||||||||||||||
|
Balance
at December 31, 2007
|
40,473 | 10,113,334 | 3,607,929 | - | 8,269,100 | (999,332 | ) | 20,991,031 | 571,597 | 21,562,628 | ||||||||||||||||||||||||||
|
Business
combination
|
8,718 | 8,718 | ||||||||||||||||||||||||||||||||||
|
Issuance
of company shares
|
- | 4,457 | 828,462 | - | - | - | 832,919 | 217,378 | 1,050,297 | |||||||||||||||||||||||||||
|
Distribution
of dividends
|
- | - | - | - | (4,654,340 | ) | - | (4,654,340 | ) | (141,634 | ) | (4,795,974 | ) | |||||||||||||||||||||||
|
Other
contributions
|
- | - | - | - | (23,742 | ) | - | (23,742 | ) | 139,566 | 115,824 | |||||||||||||||||||||||||
|
Comprehensive
income:
|
- | - | - | - | - | - | - | - | - | |||||||||||||||||||||||||||
|
Net
income
|
- | - | - | $ | 8,848,139 | 8,841,883 | - | 8,841,883 | 6,256 | 8,848,139 | ||||||||||||||||||||||||||
|
Other
Comprehensive income, net of tax:
|
||||||||||||||||||||||||||||||||||||
|
Unrealized
earnings on investment securities, net of tax effect of
$(236,974)
|
- | - | - | 524,729 | - | - | 524,729 | - | 524,729 | |||||||||||||||||||||||||||
|
Amortization
of actuarial loss, net of tax effect of $(302,050)
|
- | - | - | 613,251 | - | - | 613,251 | - | 613,251 | |||||||||||||||||||||||||||
|
Translation
adjustment
|
- | - | - | 316,895 | - | - | 300,004 | 16,891 | 316,895 | |||||||||||||||||||||||||||
|
Total
other comprehensive income
|
- | - | - | 1,454,875 | - | 1,437,984 | - | - | - | |||||||||||||||||||||||||||
|
Comprehensive
income
|
- | - | - | $ | 10,303,014 | - | - | - | - | - | ||||||||||||||||||||||||||
|
Balance
at December 31, 2008
|
40,473 | 10,117,791 | 4,436,391 | 12,432,901 | 438,652 | 27,425,735 | 818,772 | 28,244,507 | ||||||||||||||||||||||||||||
|
Business
combination
|
- | - | - | - | - | - | - | 21,530 | 21,530 | |||||||||||||||||||||||||||
|
Acquired
non-controlling interest
|
- | - | (432,766 | ) | - | - | - | (432,766 | ) | (281,692 | ) | (714,458 | ) | |||||||||||||||||||||||
|
Other
non-controlling interest
|
- | - | - | - | - | - | - | 22,767 | 22,767 | |||||||||||||||||||||||||||
|
Issuance
of company shares
|
- | - | 41,044 | - | - | - | 41,044 | - | 41,044 | |||||||||||||||||||||||||||
|
Distribution
of dividends
|
- | - | - | - | (8,903,953 | ) | - | (8,903,953 | ) | (89,736 | ) | (8,993,689 | ) | |||||||||||||||||||||||
|
Comprehensive
income:
|
- | - | - | - | - | - | - | - | - | |||||||||||||||||||||||||||
|
Net
income
|
- | - | - | $ | 4,683,187 | 4,578,468 | - | 4,578,468 | 104,719 | 4,683,187 | ||||||||||||||||||||||||||
|
Other
Comprehensive income, net of tax:
|
||||||||||||||||||||||||||||||||||||
|
Unrealized
earnings on investment securities, net of tax effect of
$15,389
|
- | - | - | (74,844 | ) | - | - | (74,844 | ) | - | (74,844 | ) | ||||||||||||||||||||||||
|
Amortization
of actuarial loss, net of tax effect of $(95,697)
|
- | - | - | 194,295 | - | - | 194,295 | - | 194,295 | |||||||||||||||||||||||||||
|
Translation
adjustment
|
- | - | - | (299,105 | ) | - | - | (286,058 | ) | (13,047 | ) | (299,105 | ) | |||||||||||||||||||||||
|
Total
other comprehensive income
|
- | - | - | (179,654 | ) | - | (166,607 | ) | - | - | - | |||||||||||||||||||||||||
|
Comprehensive
income
|
- | - | - | $ | 4,503,533 | - | - | - | - | - | ||||||||||||||||||||||||||
|
Balance
at December 31, 2009
|
40,473 | $ | 10,117,791 | $ | 4,044,669 | $ | 8,107,416 | $ | 272,045 | $ | 22,541,921 | $ | 583,313 | $ | 23,125,234 | |||||||||||||||||||||
F-65
Ecopetrol
S.A. and Subsidiaries
Notes to
the Consolidated Financial Statements
Years
ended December 31, 2009, 2008 and 2007
C)
5. Supplemental consolidated Comprehensive Income
|
2009
|
2008
|
2007
|
||||||||||
|
Net
Income
|
$ | 4,683,187 | $ | 8,848,139 | $ | 6,166,058 | ||||||
|
Other
Comprehensive income, net of tax:
|
||||||||||||
|
Unrealized
earnings on investment securities, net of tax:
|
(74,844 | ) | 524,729 | 12,918 | ||||||||
|
Amortization
of actuarial loss, net of tax
|
194,295 | 613,251 | 727,415 | |||||||||
|
Translation
adjustment
|
(299,105 | ) | 316,895 | (66,933 | ) | |||||||
|
Total
other comprehensive income
|
(179,654 | ) | 1,454,875 | 673,400 | ||||||||
|
Comprehensive
income
|
4,503,533 | 10,303,014 | 6,839,458 | |||||||||
|
Comprehensive
income attributable to the non-controlling interest
|
(91,672 | ) | (23,147 | ) | (21,367 | ) | ||||||
|
Comprehensive
income attributable to Ecopetrol
|
$ | 4,411,861 | $ | 10,279,867 | $ | 6,818,091 | ||||||
A detail
of accumulated other comprehensive income attributable to Ecopetrol, including
the related income tax effects, is presented below:
|
2009
|
||||||||||||
|
Before-Income Tax
|
(Income Tax Expense)
|
Net of Income Tax
|
||||||||||
|
Amount
|
or Benefit
|
Amount
|
||||||||||
|
Unrealized
gain on securities available for sale
|
$ | 745,649 | $ | (246,065 | ) | $ | 499,584 | |||||
|
Pension
liability - net unamortized actuarial loss
|
(260,451 | ) | 85,949 | (174,502 | ) | |||||||
|
Cumulative
translation adjustment
|
(53,037 | ) | - | (53,037 | ) | |||||||
|
Other
comprehensive income (loss)
|
$ | 432,161 | $ | (160,115 | ) | $ | 272,045 | |||||
|
2008
|
||||||||||||
|
Before-Income Tax
|
(Income Tax Expense)
|
Net of Income Tax
|
||||||||||
|
Amount
|
or Benefit
|
Amount
|
||||||||||
|
Unrealized
gain on securities available for sale
|
$ | 835,882 | $ | (261,454 | ) | $ | 574,428 | |||||
|
Pension
liability - net unamortized actuarial loss
|
(550,443 | ) | 181,646 | (368,797 | ) | |||||||
|
Cumulative
translation adjustment
|
233,021 | - | 233,021 | |||||||||
|
Other
comprehensive income (loss)
|
$ | 518,460 | $ | (79,808 | ) | $ | 438,652 | |||||
F-66
Ecopetrol
S.A. and Subsidiaries
Notes to
the Consolidated Financial Statements
Years
ended December 31, 2009, 2008 and 2007
|
2007
|
||||||||||||
|
Before-Income Tax
|
(Income Tax Expense)
|
Net of Income Tax
|
||||||||||
|
Amount
|
or Benefit
|
Amount
|
||||||||||
|
Unrealized
gain on securities available for sale
|
$ | 74,179 | $ | (24,480 | ) | $ | 49,699 | |||||
|
Pension
liability - net unamortized actuarial loss
|
(1,465,744 | ) | 483,696 | (982,048 | ) | |||||||
|
Cumulative
translation adjustment
|
(66,983 | ) | - | (66,983 | ) | |||||||
|
Other
comprehensive income (loss)
|
$ | (1,458,548 | ) | $ | 459,216 | $ | (999,332 | ) | ||||
D)
Summary of significant differences between Colombian Government Entity GAAP and
U.S. GAAP and required U.S. GAAP disclosures
|
i.
|
INVESTMENT
SECURITIES
|
The
Company’s investments include both marketable securities and non-marketable
securities. Under RCP, the Company classifies investment securities
based on the form of their investment return, either as fixed-yield investment
or as variable-yield investments. Fixed-yield investments generally
represent debt securities and are initially recorded at cost with subsequent
adjustments to fair market value recorded in the income
statement. Variable-yield investments generally represent equity
securities or interests in other entities and are initially recorded at
cost. Subsequent adjustments to fair value are made with increases in
fair value resulting in an increase to equity, while decreases in fair value are
charged to the income statement. Fair values are determined using
quoted market prices, if and when available. Absent quoted market
prices, these investments are recorded at Management’s estimate of fair value
using discounted cash flow techniques.
Under
U.S. GAAP, the Company has classified its investment securities as held to
maturity or available for sale, as defined in ASC Sub-topic 320-10-25,
Accounting for Certain Investments in Debt and Equity Securities. Debt security
investments for which the Company has demonstrated its positive ability and
intent to hold until maturity are classified as
held-to-maturity. Such investments are reported at amortized
cost. Investments classified as available-for-sale are reported at
fair value, with unrealized gains and losses reported, net of taxes, as a
component of other comprehensive income.
In the
event any other than temporary impairment of the values of the investments
occurs, the impairment loss is recorded in income.
The
Company’s short-term and long-term investments at December 31, 2009, 2008 and
2007 consist of the following:
F-67
Ecopetrol
S.A. and Subsidiaries
Notes to
the Consolidated Financial Statements
Years
ended December 31, 2009, 2008 and 2007
|
As of December 31, 2009
|
Aggregated
Fair
Value
|
Gross
Unrealized
Holding
Gains
|
Gross
Unrealized
Holding
Losses
|
Gross
Recognized
Losses
|
Cost
Basis
|
|||||||||||||||
|
Short-term
Investments - Available for Sale Securities:
|
||||||||||||||||||||
|
Securities
issued or secured by Colombian government
|
$ | 126,376 | $ | 5,472 | $ | (965 | ) | $ | (6,813 | ) | $ | 128,682 | ||||||||
|
Securities
issued or secured by government sponsored
enterprise (GSEs)
|
41,863 | 4,472 | - | - | 37,391 | |||||||||||||||
|
Securities
issued or secured by financial entities
|
10,593 | 1,093 | - | - | 9,500 | |||||||||||||||
|
Total
Short-term Investments Classified as Available for Sale
|
178,832 | 11,037 | (965 | ) | (6,813 | ) | 175,573 | |||||||||||||
|
Long-term
Investments - Available for Sale Securities:
|
||||||||||||||||||||
|
Securities
issued or secured by Colombian government
|
879,484 | 70,477 | (464 | ) | (9,189 | ) | 818,660 | |||||||||||||
|
Securities
issued or secured by government sponsored
enterprise (GSEs)
|
1,670,687 | 48,475 | - | - | 1,622,212 | |||||||||||||||
|
Securities
issued or secured by financial entities
|
592 | - | (412 | ) | - | 1,004 | ||||||||||||||
|
Securities
issued or secured by government USA
|
251,926 | - | (23,241 | ) | - | 275,167 | ||||||||||||||
|
Securities
issued by mixed – economy governmental entities
|
916,785 | 640,740 | - | - | 276,045 | |||||||||||||||
|
Total
Long-term Investments Classified as Available for Sale
|
3,719,474 | 759,692 | (24,117 | ) | (9,189 | ) | 2,993,088 | |||||||||||||
|
Total Available
for Sale
|
$ | 3,898,306 | $ | 770,729 | $ | (25,082 | ) | $ | (16,002 | ) | $ | 3,168,661 | ||||||||
|
Aggregated Fair
Value
|
Gross Unrealized
Holding Gains
|
Gross
Unrealized
Holding Losses
|
Net Carrying
Amount
|
|||||||||||||
|
Short-term
Investments - Held to Maturity Securities:
|
||||||||||||||||
|
Other
debt securities
|
$ | 8,280 | $ | 404 | $ | - | $ | 7,876 | ||||||||
|
Total
Short-term Investments Classified as Held to Maturity
|
8,280 | 404 | - | 7,876 | ||||||||||||
|
Long-term
Investments- Held to Maturity Securities:
|
||||||||||||||||
|
Securities
issued or secured by Colombian government
|
129,769 | 9,343 | - | 120,426 | ||||||||||||
|
Securities
issued or secured by government USA
|
10,950 | 636 | - | 10,314 | ||||||||||||
|
Total
Long-term Investments Classified as Held to Maturity
|
140,719 | 9,979 | - | 130,740 | ||||||||||||
|
Total
Held to Maturity
|
$ | 148,999 | $ | 10,383 | $ | - | $ | 138,616 | ||||||||
F-68
|
Aggregated
Fair
Value
|
Gross
Unrealized
Holding
Gains
|
Gross
Unrealized
Holding
Losses
|
Gross
Recognized
Losses
|
Cost
Basis
|
||||||||||||||||
|
As
of December 31, 2008
|
||||||||||||||||||||
|
Short-term
Investments - Available for Sale Securities:
|
||||||||||||||||||||
|
Securities
issued or secured by Colombian government
|
$ | 239,819 | $ | 17,825 | $ | (5,559 | ) | $ | - | $ | 227,553 | |||||||||
|
Securities
issued or secured by government sponsored enterprise
|
989,949 | 148,808 | (4,158 | ) | - | 845,299 | ||||||||||||||
|
Securities
issued or secured by financial entities
|
92,535 | 13,026 | - | - | 79,509 | |||||||||||||||
|
Other
debt securities
|
23,457 | 3,175 | - | - | 20,282 | |||||||||||||||
|
Total
Short-term Investments classified as Available for Sale
|
1,345,760 | 182,834 | (9,717 | ) | - | 1,172,643 | ||||||||||||||
|
Long-term
Investments - Available for Sale Securities:
|
||||||||||||||||||||
|
Securities
issued or secured by Colombian government
|
821,342 | 123,957 | (6,259 | ) | - | 724,733 | ||||||||||||||
|
Securities
issued or secured by government sponsored enterprise
|
2,515,761 | 427,156 | (215 | ) | (390 | ) | 2,110,413 | |||||||||||||
|
Securities
issued or secured by financial entities
|
596,792 | 110,263 | (64 | ) | 487,898 | |||||||||||||||
|
Securities
issued or secured by government USA
|
2,169,197 | 35,436 | (27,653 | ) | - | 2,161,414 | ||||||||||||||
|
Other debt
securities
|
1,452 | 144 | - | (95 | ) | 1,403 | ||||||||||||||
|
Total
Long-term Investments classified as Available for Sale
|
6,104,544 | 696,956 | (34,191 | ) | (485 | ) | 5,485,861 | |||||||||||||
|
Total Available for
Sale
|
$ | 7,450,304 | $ | 879,790 | $ | (43,908 | ) | $ | (485 | ) | $ | 6,658,504 | ||||||||
|
Aggregated
Fair
Value
|
Gross
Unrecognized
Holding
Gains
|
Gross
Unrecognized
Holding
Losses
|
Net
Carrying
Amount
|
|||||||||||||
|
Long-term
Investments- Held to Maturity Securities
|
||||||||||||||||
|
Securities
issued or secured by Colombian government
|
$ | 132,133 | $ | 993 | $ | (2,533 | ) | $ | 133,693 | |||||||
|
Securities
issued or secured by government USA
|
12,436 | 1,129 | - | 11,307 | ||||||||||||
|
Other
debt securities
|
35,829 | 1,733 | - | 34,096 | ||||||||||||
|
Total
Long-term Investments Classified as Held to Maturity
|
$ | 180,398 | $ | 3,855 | $ | (2,533 | ) | $ | 179,096 | |||||||
F-69
Ecopetrol
S.A. and Subsidiaries
Notes to
the Consolidated Financial Statements
Years
ended December 31, 2009, 2008 and 2007
|
Aggregated
Fair
Value
|
Gross
Unrealized
Holding
Gains
|
Gross
Unrealized
Holding
Losses
|
Gross
Recognized
Losses
|
Cost
Basis
|
||||||||||||||||
|
As of December 31,
2007
|
||||||||||||||||||||
|
Short-term
Investments - Available for Sale Securities:
|
||||||||||||||||||||
|
Securities
issued or secured by Colombian government
|
$ | 60,382 | $ | 2,084 | $ | (1,380 | ) | $ | - | $ | 59,678 | |||||||||
|
Securities
issued or secured by government entities
|
1,226,125 | 16,436 | (11,757 | ) | (76,343 | ) | 1,297,789 | |||||||||||||
|
Securities
issued or secured by financial entities
|
397,306 | 8,080 | (3,642 | ) | (15,968 | ) | 408,836 | |||||||||||||
|
Other
debt securities
|
136,457 | 4,255 | (496 | ) | (8,462 | ) | 141,160 | |||||||||||||
|
Total
Short-term Investments Classified as Available for Sale
|
1,820,270 | 30,855 | (17,275 | ) | (100,773 | ) | 1,907,463 | |||||||||||||
|
Long-term
Investments - Available for Sale Securities:
|
||||||||||||||||||||
|
Securities
issued or secured by Colombian government
|
63,165 | 1,251 | (186 | ) | - | 62,101 | ||||||||||||||
|
Securities
issued or secured by government entities
|
2,287,235 | 71,024 | (27,247 | ) | (104,033 | ) | 2,347,491 | |||||||||||||
|
Securities
issued or secured by financial entities
|
249,275 | 11,019 | (1,164 | ) | (1,179 | ) | 240,600 | |||||||||||||
|
Other
debt securities
|
113,553 | 7,751 | (1,846 | ) | (2,002 | ) | 109,651 | |||||||||||||
|
Total
Long-term Investments Classified as Available for Sale
|
2,713,228 | 91,045 | (30,443 | ) | (107,214 | ) | 2,759,843 | |||||||||||||
|
Total
Available for Sale
|
$ | 4,533,498 | $ | 121,900 | $ | (47,718 | ) | $ | (207,987 | ) | $ | 4,667,306 | ||||||||
|
Aggregated
Fair
Value
|
Gross
Unrecognized
Holding
Gains
|
Gross
Unrecognized
Holding
Losses
|
Net
Carrying
Amount
|
|||||||||||||
|
Long-term
Investments- Held to Maturity Securities
|
||||||||||||||||
|
Securities
issued or secured by government entities
|
$ | 82,210 | $ | 2,766 | $ | - | $ | 79,444 | ||||||||
|
Other
debt securities
|
59,014 | 2,737 | (102 | ) | 56,379 | |||||||||||
|
Total
Long-term Investments Classified as Held to Maturity
|
$ | 141,224 | $ | 5,503 | $ | (102 | ) | $ | 135,823 | |||||||
The
maturities of fixed-income investments at December 31, 2009 and 2008 are as
follows:
|
As of December 31, 2009
|
||||||||||||||||
|
Available for Sale
|
Held to Maturity
|
|||||||||||||||
|
Cost Basis
|
Fair Value
|
Cost Basis
|
Fair Value
|
|||||||||||||
|
Due
in one year or less
|
$ | 175,573 | $ | 178,832 | $ | 7,876 | $ | 8,280 | ||||||||
|
Due
in one year to five years
|
2,737,281 | 3,475,706 | 130,740 | 140,719 | ||||||||||||
|
Due
in five years to ten years
|
255,807 | 243,768 | - | - | ||||||||||||
|
Total
|
$ | 3,168,661 | $ | 3,898,306 | $ | 138,616 | $ | 148,999 | ||||||||
|
As of December 31, 2008
|
||||||||||||||||
|
Available
for Sale
|
Held
to Maturity
|
|||||||||||||||
|
Cost Basis
|
Fair Value
|
Cost Basis
|
Fair Value
|
|||||||||||||
|
Due
in one year or less
|
$ | 1,172,643 | $ | 1,345,759 | $ | 60,254 | $ | 63,986 | ||||||||
|
Due
in one year to five years
|
5,157,100 | 5,765,696 | 118,842 | 116,412 | ||||||||||||
|
Due
in five years to ten years
|
328,761 | 338,849 | - | - | ||||||||||||
|
Total
|
$ | 6,658,504 | $ | 7,450,304 | $ | 179,096 | $ | 180,398 | ||||||||
Proceeds
from the sale of investment securities available for sale, gains and losses
resulting from such sales are as follows:
|
2009
|
2008
|
2007
|
||||||||||
|
Proceeds
from sales
|
$ | 9,693,609 | $ | 6,820,433 | $ | 805,550 | ||||||
|
Gains
|
25,759 | 15,626 | 747 | |||||||||
|
Losses
|
5,308 | 7,901 | 933 | |||||||||
F-70
Ecopetrol
S.A. and Subsidiaries
Notes to
the Consolidated Financial Statements
Years
ended December 31, 2009, 2008 and 2007
Realized
gains and losses on securities available for sale at December 31, 2009, 2008 and
2007 were:
|
2009
|
2008
|
2007
|
||||||||||
|
Losses
|
$ | 727,697 | $ | 188,060 | $ | 27,730 | ||||||
|
Gains
|
$ | 38,539 | $ | 48,108 | $ | 5,219 | ||||||
Foreign
Exchange Gains and Losses on Securities Available for Sale
Under
RCP, changes in account balances resulting from variations in foreign currency
exchange rates are reflected in the Company’s net income. Under U.S.
GAAP, any change in value of available-for-sale debt securities as a result of
changes in foreign currency exchange rates is reflected in equity as required
under the guidance in ASC subtopic 320-10-35. The amount reclassified
from earnings under RCP purposes to other comprehensive income for U.S. GAAP
purposes includes $88,278, $635,430 and $37,817 in 2009, 2008 and 2007,
respectively that correspond to exchange rate differences.
|
a.
|
Unrealized
gain (loss)
|
Available-for-sale
securities in an unrealized loss position as of December 31, 2009, 2008 and 2007
are as follows:
|
Less than 12 months
|
More than 12 months
|
|||||||||||||||
|
Gross Unrealized Loss
|
Market Value
|
Gross Unrealized Loss
|
Market Value
|
|||||||||||||
|
2009
|
$ | (7,779 | ) | $ | 27,013 | $ | (28,857 | ) | $ | 337,965 | ||||||
|
2008
|
$ | (27,867 | ) | $ | 1,258,847 | $ | (16,041 | ) | $ | 268,894 | ||||||
|
2007
|
$ | (36,424 | ) | $ | 883,748 | $ | (11,294 | ) | $ | 187,604 | ||||||
|
b.
|
Impairment
|
Impairment
of investment securities are reported differently under RCP and U.S.
GAAP. Under RCP, impairment is also charged to earnings in the
current period, but recoveries in value can be recorded up to the amount that
was originally impaired. Under U.S. GAAP, other-than-temporary
impairment should be charged to earnings in the current period and a new cost
basis for the security is established. Subsequent increases in the
cost basis of an impaired investment as a result of a recovery in fair value are
included in Other Comprehensive Income.
The
Company has a policy under which they conduct periodic reviews of marketable
securities to assess whether other-than-temporary impairment
exists. A number of factors are considered in performing an
impairment analysis of securities. Those factors
include:
|
a)
|
the
length of time and the extent to which the market value of the security
has been less than cost;
|
|
b)
|
the
financial condition and near-term prospects of the issuer, including any
specific events which influence the operations of the issuer (such as
changes in technology that may impair the earnings potential of the
investment, or the discontinuance of a segment of a business that may
affect the future earnings potential);
and
|
|
c)
|
carries
out the analysis as instructed in ASC paragraph 320-10-65-1 which includes
the comparison of the fair value and the amortized cost, evaluates the
intention to sell the security and if it is more-likely-than-not that the
Company will be required to sell the security prior to recovery, including
the existence of a credit
loss.
|
The
Company also takes into account changes in global and regional economic
conditions and changes related to specific issuers or industries that could
adversely affect these values.
F-71
Ecopetrol
S.A. and Subsidiaries
Notes to
the Consolidated Financial Statements
Years
ended December 31, 2009, 2008 and 2007
Ecopetrol’s
marketable security portfolio consists only of debt securities, such as treasury
investments, bonds, and commercial paper. For this reason, the Company has an
internal policy to limit the ratings of their investments and issuers to the
following ratings:
|
Credit Rating Agency
|
Short-term Credit Rating
|
Long-Term Credit Rating
|
||
|
Standard
& Poor’s
|
A-1
|
A
|
||
|
Moody’s
Investors Services
|
P-1
|
A2
|
||
|
Fitch
Ratings
|
F-1
|
A
|
If the
credit rating of an issuer or an investment drops below the aforementioned
limits, the Company must sell the investment within 10
days. Investment securities were assessed for other than temporary
impairment. For U.S. GAAP purposes, the Company recognized impairment
on its investment securities amounting to $28,083, $163,902 and $78,123 in 2009,
2008 and 2007, respectively. For 2008, a major contributing factor to
these losses has been the global financial crisis. For 2009 and 2007
a major contributing factor to these losses has been that Ecopetrol has a large
portion of their investments in securities denominated in U.S.
dollars.
|
ii.
|
INVESTMENTS
IN NON-MARKETABLE SECURITIES
|
|
a.
|
Equity
Method
|
Under
RCP, equity securities for which prices are unquoted, or for which trading
volume is minimal, and the Company does not control the investee, are accounted
for under the cost method and subsequently are valued by the shareholders'
equity comparison method. Under the equity comparison method, the Company
accounts for the difference between its proportionate share of shareholders'
equity of the investee and its acquisition cost, adjusted for inflation through
2001, in a separate valuation account in the assets and equity (valuation
surplus), if the proportionate share of shareholders’ equity of the investee is
higher than its cost or as an allowance for losses, affecting net income, if the
cost is higher than the proportionate share of shareholders’ equity of the
investee. The proportionate share of shareholder’s equity is considered as the
market value for this purpose and is known as intrinsic value. Under this
method, the Company only records dividends as income when received. From 2008
the RCP incorporated the concept of significant influence for the recognition of
investments in associated entities and established the equity method to update
these investments. Until 2007 the investments in associates were recognized
using the equity comparison method.
Under
U.S. GAAP, an investment in a non-marketable equity security is recorded using
the equity method when the investor can exercise significant influence over the
investee, or the cost method when significant influence cannot be exercised.
Investments accounted for using the equity comparison method under RCP are
accounted for using the equity method for U.S. GAAP. Under the equity
method of accounting for U.S. GAAP the carrying value of such an investment is
adjusted to reflect (1) the Company’s proportionate share of earnings or losses
from the investee and (2) additional investments and distributions of
dividends. The Company’s proportionate share of income or loss is
reported in earnings but any dividends or additional investments are reported
only as an adjustment of the carrying amount of the investment. The
income tax consequences that the Company would incur as a result of equity
earnings have been reported by the Company as additional deferred income tax
expenses and deferred tax liabilities.
The
differences between the application of the cost and equity comparison methods
under RCP and the equity method under U.S. GAAP were:
|
·
|
Reversal
of valuations and allowances for losses recorded under
RCP
|
|
·
|
Reversal
of inflation adjustments recorded under
RCP
|
|
·
|
Inclusion
of share of earnings or losses under U.S. GAAP, net of intercompany
eliminations.
|
|
·
|
Inclusion
of share in other comprehensive income under U.S.
GAAP.
|
F-72
Ecopetrol
S.A. and Subsidiaries
Notes to
the Consolidated Financial Statements
Years
ended December 31, 2009, 2008 and 2007
The
summary of the investments valued by the equity method for U.S. GAAP purposes is
shown in the following table:
For
the Year Ended December 31, 2009
|
Company
|
Percentage
Of Voting
Interest
|
Equity
Calculated
under
U.S.
GAAP
|
Equity Under
Colombian
GAAP
|
Assets Under
Colombian
GAAP
|
Liabilities
Under
Colombian
GAAP
|
Net Income
(Loss) Under
Colombian
GAAP
|
Investment
Under U.S.
GAAP
Equity
Method
|
|||||||||||||||||||||
|
Invercolsa
S.A.
|
32 | % | $ | 230,058 | $ | 468,507 | $ | 479,104 | $ | 10,597 | $ | 71,902 | $ | 73,078 | ||||||||||||||
|
Serviport
S.A.
|
49 | % | 4,742 | 15,170 | 17,557 | 2,387 | 941 | 2,324 | ||||||||||||||||||||
|
Offshore
International Group
|
50 | % | 640,866 | 726,398 | 860,151 | 133,753 | 69,845 | 320,433 | ||||||||||||||||||||
|
Ecodiesel
S.A.
|
50 | % | 5,985 | 15,842 | 91,641 | 75,799 | 336 | 2,992 | ||||||||||||||||||||
| $ | 398,827 | |||||||||||||||||||||||||||
For
the Year Ended December 31, 2008
|
Company
|
Percentage
Of Voting
Interest
|
Equity
Calculated
under
U.S.
GAAP
|
Equity Under
Colombian
GAAP
|
Assets Under
Colombian
GAAP
|
Liabilities
Under
Colombian
GAAP
|
Net Income
(Loss) Under
Colombian
GAAP
|
Investment
Under U.S.
GAAP
Equity
Method
|
|||||||||||||||||||||
|
Oleoducto
de Colombia S.A.
|
44 | % | $ | 3,716 | $ | 109,967 | $ | 150,450 | $ | 40,483 | $ | (23,862 | ) | $ | - | |||||||||||||
|
Invercolsa
S.A.
|
32 | % | 262,856 | 501,896 | 503,194 | 1,298 | 111,773 | 83,496 | ||||||||||||||||||||
|
Serviport
S.A.
|
49 | % | 2,909 | 12,768 | 16,092 | 3,324 | (500 | ) | 1,425 | |||||||||||||||||||
|
Refinería
de Cartagena S.A.
|
49 | % | 2,276,788 | 2,601,628 | 3,110,642 | 509,014 | 9,478 | 1,115,624 | ||||||||||||||||||||
|
Ecodiesel
S.A.
|
50 | % | 11,282 | 15,579 | 63,614 | 48,036 | 76 | 5,641 | ||||||||||||||||||||
| $ | 1,206,186 | |||||||||||||||||||||||||||
The
number of shares which the Company owns with respect to its investment in
Invercolsa S.A. has been subject to a legal dispute with another Invercolsa
shareholder. Numerous court decisions have ruled in favor of both the
Company and the other shareholder, with the final outcome still
unknown. As a result of these court decisions, the number of shares
owned by the Company has fluctuated, from the current 31.76% to more than
50%. Consequently, applying appropriate GAAP in both Colombia and the
U.S., which is based on the Company’s percentage ownership of the investee,
would result in different accounting treatment each time a court decision is
handed down. Therefore, until the final legal outcome is known, the
Company has decided to record the investment under the equity method for U.S.
GAAP purposes, applying the lower percentage owned (31.76%) during all of the
years that the Company has had an ownership interest in Invercolsa
S.A. As such, the amount of the Company’s investment is adjusted only
for its proportionate share of Invercolsa’s net income or loss and any dividends
received or additional investments made, and no adjustment is made for changes
in Invercolsa’s estimated fair value.
b. Variable
Interest Entity (VIE)
Under
U.S. GAAP, ASC paragraph 810-10-15-13 requires that consolidated financial
statements include subsidiaries in which the Company has a controlling financial
interest, i.e., a majority voting interest. However, application of
the majority voting interest requirement to certain types of entities may not
identify the party with a controlling financial interest because that interest
may be achieved through other arrangements. Thus, the U.S. GAAP rules
also require a Company to consolidate a variable interest entity if that Company
is a primary beneficiary that will absorb a majority of the entity’s expected
losses, receive a majority of the entity’s expected residual returns, or
both. In determining whether it is a primary beneficiary of a
variable interest entity, a Company shall treat variable interests in that same
entity held by the Company’s related parties as its own
interest. Under RCP, consolidated financial statements only include
subsidiaries in which the Company has the majority voting
interest.
F-73
Ecopetrol
S.A. and Subsidiaries
Notes to
the Consolidated Financial Statements
Years
ended December 31, 2009, 2008 and 2007
Ecopetrol
owned 35.29% of Oleoducto Central S.A. (hereinafter “Ocensa”) until March 2009
when, through a direct transaction with Enbridge Inc., Ecopetrol acquired an
additional 24.71% ownership interest for $998,903 in cash. As of such
date, Ecopetrol’s participation in Ocensa became 60%. Ecopetrol assessed the new
conditions and concluded that Ocensa is no longer a variable interest entity;
instead Ocensa was consolidated as a subsidiary. Until March 2009,
Ocensa, valued at cost under RCP, was treated as a variable interest entity
under U.S. GAAP because Ecopetrol was contractually absorbing 60% of the
operating expenses through tariffs.
According
to Colombian Government Entity GAAP, the acquisition of the 24.71% of the
non-controlling interest is accounted for as an increase in investment and
goodwill; under U.S. GAAP, the ownership interest increase in a subsidiary is an
equity transaction based on Accounting Research Bulletin No. 51, Consolidated
Financial Statements, as amended by FASB Statement No. 160, Non-controlling
Interests in Consolidated Financial Statements (ASC Subtopic 810-10,
Consolidation - Overall) and is accounted for as an equity transaction which
decreases additional paid-in-capital in by the difference between the
non-controlling interest carrying amount and the consideration paid. Under U.S.
GAAP, the additional paid-in capital effect of the transaction was
$610,007. A corresponding deferred income tax effect of $177,241 was
recorded, resulting in a net effect of $432,766.
The
summary of Ocensa’s financial information under U.S. GAAP as of and for the
years ended December 31, 2009, 2008 and 2007 follows:
|
2009
|
2008
|
2007
|
||||||||||
|
Assets
|
$ | 1,175,830 | $ | 1,000,110 | $ | 1,255,285 | ||||||
|
Liabilities
|
61,565 | 106,447 | 371,907 | |||||||||
|
Equity
|
$ | 1,114,265 | $ | 893,663 | $ | 883,378 | ||||||
|
Net
income
|
$ | 404,621 | $ | 10,284 | $ | 33,901 | ||||||
c.
Cost Method Investments
For
investments in non-marketable securities that the Company has determined should
be accounted for under the cost method in accordance with U.S. GAAP, the
inflation adjustment and the valuation recorded under RCP were
reversed. The effect is all recorded in shareholders’
equity.
The
following table lists those non-marketable equity investments held by the
Company at December 31, 2009 and 2008 which are accounted for using the cost
method:
|
December 31, 2009:
|
||||||||||||
|
Investment
|
Number of
Shares
|
Participation
Percentage
|
Cost
|
|||||||||
|
Zona
Franca de Cartagena S.A.
|
244 | 8.18 | $ | 239 | ||||||||
|
Sociedad
Portuaria del Dique
|
10 | 0.5 | 5 | |||||||||
|
Propaise
S.A.
|
18,744,883 | 0.99 | 10 | |||||||||
|
Total
|
$ | 254 | ||||||||||
F-74
Ecopetrol
S.A. and Subsidiaries
Notes to
the Consolidated Financial Statements
Years
ended December 31, 2009, 2008 and 2007
|
December 31, 2008:
|
||||||||||||
|
Investment
|
Number of
Shares
|
Participation
Percentage
|
Cost
|
|||||||||
|
Interconexión
Eléctrica S.A.
|
58,925,480 | 5.48 | $ | 124,113 | ||||||||
|
Empresa
de Energía de Bogotá S.A. ESP.
|
6,310,980 | 7.35 | 151,932 | |||||||||
|
Total
|
$ | 276,045 | ||||||||||
Under
U.S. GAAP ASC paragraph 325-20-35 1A and 2, assets held at cost, including
non-marketable equity investments, should be evaluated for impairment if the
Company is aware of any events or changes in circumstances that may have
significant adverse effects on the fair value of the investment. If
the Company believes such circumstances exist, the Company would estimate the
asset’s fair value and compare that to cost to determine if any impairment is
necessary. The Company believes no such events or changes in
circumstances existed at the balance sheets dates. However, the
Company used market values established under RCP to assess impairment of these
investments and determined that they were not impaired.
|
iii.
|
DERIVATIVES
|
As
discussed in Note xxiii, Ecopetrol adopted new accounting standards for
derivative disclosures on January 1, 2009. Ecopetrol is exposed to market risk
from changes in foreign currency exchange rates, interest rate risk of its
financial obligations and to commodity price risk, resulting from the
fluctuations of international crude oil prices which affect its earnings, cash
flows and financial condition. Ecopetrol manages its exposure to these market
risks through its regular operating and financial activities and, when
appropriate, through the use of derivative financial instruments. Ecopetrol has
established a control to assess, approve and monitor derivative financial
instrument activities. Ecopetrol does not buy, hold or sell derivative financial
instruments for trading purposes. Ecopetrol's primary foreign currency exposures
relate to the U.S. dollar; however, Ecopetrol manages its foreign currency risk
position internally, using non-deliverable forwards, according to the size of
the mismatches between its asset-liability position in U.S. Dollars and its
asset-liability position in Colombian pesos. If no mismatches occur Ecopetrol
has a perfect natural hedge. Ecopetrol also utilizes other derivative agreements
to mitigate changes in the fair value of commodities. None of the derivatives
were designated nor documented for hedge accounting.
The
Company periodically enters into call option contracts to cover the price risk
associated with fluctuations in market prices of asphalt. The option contracts
limit the unfavorable effect that price increase will have on asphalt. The
maximum term over which the Company is managing its exposures to the variability
for commodity price risk is 12 months.
As of
December 31, 2009, the Company had entered into four commodity call options with
an effective date of January 1, 2010 and a termination date of December 31,
2010. Under these call options, Ecopetrol has the right to purchase
2,040,000 bls. equivalent of asphalt.
Total
results recognized related to derivative activities during the periods are as
follow:
|
2009
|
2008
|
2007
|
||||||||||||||||||||||
|
Realized
|
Unrealized
|
Realized
|
Unrealized
|
Realized
|
Unrealized
|
|||||||||||||||||||
|
Options
(1)
|
$ | 66,889 | $ | 25,943 | $ | - | $ | - | $ | - | $ | - | ||||||||||||
|
Swaps
|
(23,757 | ) | (438 | ) | (45,024 | ) | - | - | - | |||||||||||||||
|
Forwards
|
878 | - | (24,879 | ) | - | 43,696 | - | |||||||||||||||||
|
Total
|
$ | 44,010 | $ | 25,505 | $ | (69,903 | ) | $ | - | $ | 43,696 | $ | - | |||||||||||
|
(1)
|
Amounts
include premiums paid
|
F-75
Ecopetrol
S.A. and Subsidiaries
Notes to
the Consolidated Financial Statements
Years
ended December 31, 2009, 2008 and 2007
As a
result of business combination, Ecopetrol included an exchange rate forward from
Reficar of 1,050,600,000 JPY with a termination date on April 30, 2010. The
effect of this forward in the reconciliation of shareholder’s equity was
$4,984.
Under
RCP, the difference between the amounts paid and received under these
arrangements is recognized as financial income or expense. If the net payment
will result in a payment to the counterparty, this is recorded as interest
payable and thus is accrued as a liability. If the net payment will result in a
payment to be received from the counterparty this is recorded as interest
receivable. Both the interest payable and interest receivable resulting from net
payments are recorded using current rates for the period.
U.S. GAAP
requires that all derivative instruments are recorded on the balance sheet at
fair value. Changes in the fair value of derivatives are recorded
each period in current earnings or other comprehensive income, depending on
whether a derivative is designated to be part of an effective cash-flow hedging
transaction or an effective fair-value hedging
transaction. Derivative instruments that do not meet the requirements
of either a cash-flow or fair value hedge would be recorded at fair value on the
balance sheet with the fair value gains and losses of the instrument recorded in
the income statement.
Under
U.S. GAAP, embedded derivative instruments shall be separated from the host
contract, and accounted for using different measurement attributes, if certain
conditions are met. In the case of the Company, some contracts to
which the Company is counterparty include embedded foreign exchange
derivatives. According to ASC paragraph 815-15-15-10 through 13 these
contracts do not require separate accounting for the embedded derivative and the
host contract because contract payments are made in the functional currency of a
party to the contract or contract payments are made in a currency in which the
price of the good or service delivered is routinely denominated in international
commerce.
|
iv.
|
EXCHANGE
OF NON-MONETARY ASSETS
|
During
2007, the Company exchanged fixed assets with a cost of $234,371 for a 49%
interest in Reficar. The Company estimated the fair value of the
investment in $1,369,546. Under RCP, this difference between
the cost of the assets given and the fair value of the assets received was
recorded as an increase to asset revaluation and equity. However,
under ASC Subtopic 845-10-30, the 51% of the difference between the cost of the
assets given and the fair value of the assets received, which the Company
determined to be a more reliable indicator of the value of the exchange, was
recorded in the results of operations as a gain in amounting of
$579,241. The remaining 49% of the difference, equivalent to $556,236
is to be amortized over the useful life of the equipment. The
reconciliation includes $23,640 in 2009; $55,623 in 2008 and $27,812 in 2007
corresponding to the amortization of the deferred gain.
|
v.
|
DEFERRED
CHARGES
|
Under
RCP, the Company deferred certain pre-operating expenses and other deferred
charges, which are expensed as incurred under U.S. GAAP. These
charges include research studies and projects in the research and development
phase. Normal recurring maintenance is also included in this
category.
|
vi.
|
EMPLOYEE
BENEFIT PLANS
|
Under
Colombian Government Entity GAAP, the Company estimates the net present value of
its actuarial liability for all pension and other post-retirement obligations.
Annually, the Company estimates the net present value of the actuarial liability
and adjusts the recorded liability accordingly. The amount of the adjustment is
reflected in the Company’s net income. Funds are set aside to settle this
liability and are reflected as Pension Plan Assets in the Company’s consolidated
balance sheets as of December 2007. As discussed in Note 17, as of December 31,
2008 and 2009, that pension plan assets were effectively netted against the
corresponding pension obligation liability.
F-76
Ecopetrol
S.A. and Subsidiaries
Notes to
the Consolidated Financial Statements
Years
ended December 31, 2009, 2008 and 2007
For other
post-retirement benefits, the payments are made according to seniority and the
salary at the time of retirement, as stipulated in the Collective Labor
Agreement and the Agreement No. 01.
Under the
post-retirement benefits plan for Ecopetrol personnel, the Company covers 90% of
educational expenses for children of employees, including enrollment fees,
tuition and other associated costs. A fixed annual sum, depending on grade
level, is also provided for the acquisition of textbooks. Educational coverage
includes kindergarten, elementary school, high school and college. Ecopetrol’s
financial statements must also show the cost of post-retirement educational
benefits for children of retired employees, since benefits continue irrespective
of retirement or death.
According
to the Collective Labor Agreement and Agreement No. 01, the Company will pay for
health services for employees and enrolled family members. Health services
include: office visits and required laboratory services, drugs, diagnostic
examinations, ambulatory treatment, hospitalization due to illness or accident,
surgery due to illness or accident, maternity and rehabilitation treatments and
orthopedic parts. Therefore, such post-retirement health benefit costs, are
recorded in the RCP Ecopetrol financial statements, since retired workers and
enrolled family members continue to receive full medical coverage. The same is
true for deceased non-retired employees.
U.S. GAAP
requires the recognition of pension, health care and education plans costs based
on actuarial computations under a prescribed methodology which differs from that
used under RCP. For purposes of U.S. GAAP reconciliation, the transition
obligation is calculated at the date the Company adopted the ASC Topic 420, 715,
805, 835, 958 and 980 Employers Accounting for Pensions, is being amortized from
January 1, 1989. The transition obligation for the education and medical plan is
being amortized from January 1, 1995.
In
addition, under Colombian law, the Company must pay pension bonds for certain
employees when they leave Ecopetrol and those bonds payable accrue interest at
the DTF rate, which rate averaged 5.6% for 2009, (10.90% for 2008, and 8.86 %
for 2007).
Additionally,
under Colombian law, employees are entitled to one month salary for each year of
service. This benefit is known as the “severance obligation” or “cesantias”. This benefit
accumulates during the time of employment and is paid to employees upon their
termination or retirement from Ecopetrol. However, employees may request
advanced benefit payments at any time. In 1990, the Colombian government revised
its labor regulations to permit companies, subject to employee approval, to pay
the severance obligation to their employees on a current basis. Law 50 of 1990
also enabled each employee to freely choose yearly which trust fund would manage
the amount accrued during each year in which they are eligible for severance
payments. This amount must be transferred by the company to the trust fund no
later than the next subsequent year.
Under
U.S. GAAP, a curtailment is an event that significantly reduces the expected
years of future service of present employees covered by a pension plan or
eliminates for a significant number of employees by the plan the accrual of
defined benefits for some or all of their future services. Consequently, this
modification reduces the projected benefit obligation. Such reduction is used to
reduce any existing unrecognized prior service cost. The excess, if any, is
amortized on the same basis as the cost of benefit increases.
The
economic assumptions used in the determination of pension obligations under U.S.
GAAP differ from those used under RCP because the latter are established
annually by the Colombian regulations.
The
combined costs for the above mentioned benefit plans, determined using U.S.
GAAP, for the years ended December 31, 2009, 2008 and 2007 are summarized below:
(all obligations were measured at the year end).
F-77
Ecopetrol
S.A. and Subsidiaries
Notes to
the Consolidated Financial Statements
Years
ended December 31, 2009, 2008 and 2007
|
2009
|
2008
|
2007
|
||||||||||||||||||||||||||||||||||
|
Components of net periodic
benefit costs:
|
Pension
|
Other
Benefits (*)
|
Total
|
Pension
|
Other
Benefits
(*)
|
Total
|
Pension
|
Other
Benefits
(*)
|
Total
|
|||||||||||||||||||||||||||
|
Service
cost
|
$ | 21,126 | $ | 40,279 | $ | 61,405 | $ | 57,957 | $ | 20,549 | $ | 78,506 | $ | 58,608 | $ | 20,352 | $ | 78,960 | ||||||||||||||||||
|
Interest
cost
|
1,037,577 | 474,634 | 1,512,211 | 861,042 | 787,838 | 1,648,880 | 757,536 | 302,210 | 1,059,746 | |||||||||||||||||||||||||||
|
Expected
Return on plan assets
|
(1,013,399 | ) | (416,474 | ) | (1,429,873 | ) | (366,541 | ) | (78,806 | ) | (445,347 | ) | (292,564 | ) | (63,184 | ) | (355,748 | ) | ||||||||||||||||||
|
Amortization
of net (gain) or loss
|
- | 1,992,091 | 1,992,091 | 270,231 | 143,337 | 413,568 | 904,528 | 232,876 | 1,137,404 | |||||||||||||||||||||||||||
|
Net
periodic pension cost under U.S. GAAP
|
45,304 | 2,090,530 | 2,135,834 | 822,689 | 872,918 | 1,695,607 | 1,428,108 | 492,254 | 1,920,362 | |||||||||||||||||||||||||||
|
Net
periodic pension cost under Colombian GAAP
|
- | (719,236 | ) | (719,236 | ) | 109,530 | (353,958 | ) | (244,428 | ) | (526,277 | ) | (348,711 | ) | (874,988 | ) | ||||||||||||||||||||
|
Difference
to be recognized under U.S. GAAP
|
$ | 45,304 | $ | 1,371,294 | $ | 1,416,598 | $ | 932,219 | $ | 518,960 | $ | 1,451,179 | $ | 901,831 | $ | 143,543 | $ | 1,045,374 | ||||||||||||||||||
|
*
|
Other
benefits include education, health, pension bonds and accrued
severance.
|
Under
U.S. GAAP, the changes in the benefit obligations and in plan assets for the
above mentioned benefit plans, for the years ended December 31, 2009 and 2008
are summarized below:
|
Pension Plans
|
Other Benefits
|
|||||||||||||||
|
2009
|
2008
|
2009
|
2008
|
|||||||||||||
|
Reconciliation of projected benefit
obligation:
|
||||||||||||||||
|
Projected
benefit obligation as of January 1
|
$ | (8,910,139 | ) | $ | (8,602,489 | ) | $ | (3,838,042 | ) | $ | (2,865,655 | ) | ||||
|
Cost
of service
|
(21,126 | ) | (57,957 | ) | (40,279 | ) | (20,549 | ) | ||||||||
|
Cost
of interest
|
(1,037,577 | ) | (861,042 | ) | (474,634 | ) | (787,838 | ) | ||||||||
|
Actuarial
(gain) loss
|
(920,726 | ) | 116,506 | (701,110 | ) | (341,386 | ) | |||||||||
|
Benefit
payments
|
550,678 | 494,843 | 209,850 | 177,386 | ||||||||||||
|
Projected
benefit obligation as of December 31
|
(10,338,890 | ) | (8,910,139 | ) | (4,844,215 | ) | (3,838,042 | ) | ||||||||
|
Reconciliation
of plan assets:
|
||||||||||||||||
|
Fair
value of plan assets as of January 1
|
8,501,667 | 7,815,380 | 1,671,124 | 1,680,294 | ||||||||||||
|
Reclassification
between plan assets
|
- | 216,553 | - | (216,553 | ) | |||||||||||
|
Actual
return on plan assets
|
1,013,399 | 964,577 | 416,474 | 207,383 | ||||||||||||
|
Company
contributions
|
- | - | - | - | ||||||||||||
|
Benefits
paid
|
(550,678 | ) | (494,843 | ) | - | - | ||||||||||
|
Actuarial
(gain) loss
|
182,017 | - | (262,280 | ) | - | |||||||||||
|
Fair
value of plan assets as of December 31
|
9,146,405 | 8,501,667 | 1,825,318 | 1,671,124 | ||||||||||||
|
Projected
benefit obligation, as of December 31
|
(524,622 | ) | (479,318 | ) | (3,426,309 | ) | (1,545,629 | ) | ||||||||
|
Amounts
recognized in other comprehensive income (loss)
|
(667,863 | ) | 70,846 | 407,412 | (621,289 | ) | ||||||||||
|
Net
liability under U.S. GAAP
|
(1,192,485 | ) | (408,472 | ) | (3,018,897 | ) | (2,166,918 | ) | ||||||||
|
Net
liability under RCP
|
(121,415 | ) | - | (2,578,143 | ) | (2,011,576 | ) | |||||||||
|
Net
effect under pension plan and other benefits
|
$ | (1,071,070 | ) | $ | (408,472 | ) | $ | (440,754 | ) | $ | (155,342 | ) | ||||
F-78
Ecopetrol
S.A. and Subsidiaries
Notes to
the Consolidated Financial Statements
Years
ended December 31, 2009, 2008 and 2007
Net
liability of employee benefit plans is classified as follows:
|
Pension Plans
|
Other Benefits
|
Total
|
||||||||||||||||||||||
|
2009
|
2008
|
2009
|
2008
|
2009
|
2008
|
|||||||||||||||||||
|
Current
portion
|
$ | - | $ | - | $ | (245,315 | ) | $ | (209,523 | ) | $ | (245,315 | ) | $ | (210,294 | ) | ||||||||
|
Long-term
portion
|
(1,192,485 | ) | (408,472 | ) | (2,773,582 | ) | (1,957,395 | ) | (3,966,067 | ) | (2,365,867 | ) | ||||||||||||
|
Net
liability
|
$ | (1,192,485 | ) | $ | (408,472 | ) | $ | (3,018,897 | ) | $ | (2,166,918 | ) | $ | (4,211,382 | ) | $ | (2,575,390 | ) | ||||||
For U.S.
GAAP purposes, plan assets are shown net of the pension
obligations. There are no differences between the fair value of plan
assets under RCP and U.S. GAAP.
Under
U.S. GAAP, the Company applies the provisions of Statement on ASC Topic 420,
715, 805, 835, 958 and 980, as amended by Statement on ASC Topic No. 450, 715
and 958, Employers Disclosure about Pension and Other Post-retirement Benefits,
an amendment to ASC Topic No. 420, 715, 805, 835, 958, 980, 712 and
710. The Company adopted Statement on ASC Topic No. 715 and 958
Employers Accounting for Defined Benefit Pension and Other Postretirement Plans
effective January 1, 2006, in respect of its defined benefits pension, health
and education plans. This standard requires the Company to recognize
the overfunded or underfunded status of each of its defined benefit pension and
other postretirement benefit plans as an asset or liability and to reflect
changes in the funded status through Accumulated Other Comprehensive Income, as
a separate component of shareholders’ equity. The actuarial
calculations are estimated at year end dates.
As of
December 31, 2009 and 2008, the amounts recognized in the balance sheet related
to pension, health, education and severance obligations consist of:
|
2009
|
2008
|
|||||||
|
Long-term
liability
|
||||||||
|
Pension
|
$ | 1,192,485 | $ | 408,472 | ||||
|
Health
|
2,343,212 | 1,586,115 | ||||||
|
Education
|
437,424 | 365,169 | ||||||
|
Bonds
|
(16,381 | ) | 5,340 | |||||
|
Severance
|
9,327 | 771 | ||||||
|
Total
long-term liability
|
$ | 3,966,067 | $ | 2,365,867 | ||||
As of
December 31, 2009, 2008 and 2007, the amounts recognized in accumulated other
comprehensive loss, related to pension, health and education obligations consist
of:
|
2009
|
2008
|
2007
|
||||||||||
|
Other
comprehensive income
|
||||||||||||
|
Actuarial
income (loss)
|
||||||||||||
|
Pension
|
$ | (667,863 | ) | $ | 70,846 | $ | (1,130,480 | ) | ||||
|
Health
|
(887,162 | ) | (1,747,418 | ) | (209,690 | ) | ||||||
|
Education
|
(123,837 | ) | (464,731 | ) | (125,574 | ) | ||||||
|
Bonds
|
1,418,411 | 1,590,860 | - | |||||||||
|
Total
other comprehensive income (loss)
|
(260,451 | ) | (550,443 | ) | (1,465,744 | ) | ||||||
|
Deferred
income tax effect
|
85,949 | 181,646 | 483,696 | |||||||||
|
Total
|
$ | (174,502 | ) | $ | (368,797 | ) | $ | (982,048 | ) | |||
The
Company expects the following amounts in other comprehensive income to be
recognized as components of net periodic pension cost during 2010:
|
Health
|
$ | 636,590 | ||
|
Education
|
$ | 81,203 |
F-79
Ecopetrol
S.A. and Subsidiaries
Notes to
the Consolidated Financial Statements
Years
ended December 31, 2009, 2008 and 2007
For the
pension plan obligation there was a loss of $920,726 during 2009. The
outstanding cumulative loss at December 31, 2009 was $667,863. Since
this accumulated gain is less than 10% of the projected benefit obligation or
the pension assets, no amortization charge in necessary for 2010.
For the
medical plan, there was a liability loss of $616,837 during 2009. The
outstanding cumulative loss at December 31, 2009 was $887,162. Since
this accumulated loss is greater than 10% of the accumulated post-retirement
benefit obligation or the plan assets, an amortization charge of $636,590 is
necessary for 2010.
For the
education plan, there was a liability loss of $84,273 during
2009. The outstanding cumulative loss at December 31, 2009 was
$123,837. Since this accumulated loss is greater than 10% of the
accumulated post-retirement benefit obligation or the pension assets, an
amortization charge of $81,203 is necessary for 2010.
The
economic assumptions adopted are shown below in nominal terms. Those
assumptions used in determining the actuarial present value of the pension
obligation and the projected pension obligations for the plan years were as
follows:
|
2009
|
2008
|
|||||||||||||||||||||||
|
Pension
|
Health
|
Education
|
Pension
|
Health
|
Education
|
|||||||||||||||||||
|
Discount
rate
|
8.50 | % | 8.50 | % | 8.50 | % | 11.98 | % | 11.98 | % | 11.98 | % | ||||||||||||
|
Rate
of compensation and pension increases
|
5.06 | % | 4.00 | % | 4.00 | % | 9.67 | % | 8.67 | % | 7.67 | % | ||||||||||||
|
Expected
rate of return
|
4.33 | % | *** | *** | 4.69 | % | 4.69 | % | 4.69 | % | ||||||||||||||
|
Mortality
table
|
** | ** | ** | * | * | * | ||||||||||||||||||
|
*
|
Colombian
mortality table ISS, male and female,
1981-1989.
|
|
**
|
Colombian
Mortality Table ISS, male, and female,
2005-2008.
|
|
***
|
The
partial transfer does not include health and education
benefits.
|
The rate
of return of the Ecopetrol pension fund during 2009 was 14.52%; this high figure
is mainly due to the low interest rates 8.5% driven by the Central Bank (Banco
de la República) and reflected in the bank system and the capital
market. As a result of falling interest rates, the market value of
the investments corresponding to the pension fund increased and therefore the
rate of return rose substantially. This rate will not be sustainable
in the medium and long term. In order to determine the discount rate,
Ecopetrol has taken into consideration the rate corresponding to the government
bonds, TES, at December 31, 2009, 8.5% and an expected inflation rate equal to
4%, giving a real discount rate of 4.327%.
The
Finance Superintendency concluded a mortality study based on the experience of
the affiliated workers to the pension funds and to the Social Security Institute
ISS, during the years 2005-2008. The resulting mortality table from such study
reflects the current mortality of the Colombian workers. As was expected, the
new table shows lower mortality rates compared with those of the actual
mortality table, ISS, experience 1981-1989. Therefore, Ecopetrol used the new
table to make the actuarial calculations included in the current
valuation.
Estimated
future benefit payments
The
benefit payments, which reflect expected future service, as appropriate, are
expected to be paid as follows:
|
Period
|
Pension Benefits
|
Health Care Benefits
|
Education
Benefits
|
|||||||||
|
2010
|
$ | 555,303 | $ | 162,507 | $ | 70,333 | ||||||
|
2011
|
590,830 | 156,058 | 58,765 | |||||||||
|
2012
|
582,053 | 152,523 | 55,179 | |||||||||
|
2013
|
573,083 | 148,807 | 51,131 | |||||||||
|
2014
|
563,947 | 144,913 | 46,051 | |||||||||
|
Years
2015 – 2019
|
1,913,130 | 477,537 | 121,412 | |||||||||
F-80
Ecopetrol
S.A. and Subsidiaries
Notes to
the Consolidated Financial Statements
Years
ended December 31, 2009, 2008 and 2007
All of
the benefits estimated in the table above are to be paid from plan
assets. The Company does not have any insurance policies that are
intended to cover benefits that plan participants are to receive.
Furthermore,
at the current time the Company does not intend to contribute to the fund in the
upcoming fiscal year. Management believes that the plan assets will
provide for a return sufficient to cover any payments that are necessary to be
made in the upcoming year.
Assumed
health care cost trend rates have an effect on the amounts reported for the
health care plans. A one percentage point change in assumed health
care cost trend rates would have the following effects:
|
1% Percentage Point
|
||||||||
|
Increase
|
Decrease
|
|||||||
|
Effect
on total of service and interest cost
|
$ | 258,622 | $ | 199,141 | ||||
|
Effect
on postretirement benefit obligation
|
$ | 2,831,320 | $ | 2,237,066 | ||||
Plan
assets
Pension
and pension bonds are covered by assets in a single fund with the following
investment allocation:
|
2009
|
2008
|
|||||||
|
Government
securities
|
51 | % | 64 | % | ||||
|
Private
bonds
|
24 | % | 13 | % | ||||
|
Foreign
currency
|
3 | % | 3 | % | ||||
|
Other
|
22 | % | 20 | % | ||||
| 100 | % | 100 | % | |||||
The plan
assets do not contain any shares of stock of Ecopetrol or any of its related
parties.
In 2007,
the Company was in the process of outsourcing administration of its pension plan
to a third party (known as a partial transfer.) As a result of this
process, under RCP, the discount rate was reduced from 4.8% to 4.0%, the effect
of which was an additional pension liability of $869,927. For U.S.
GAAP purposes, the provision was reversed, because the partial transfer is not a
settlement, as defined by ASC topic 712,715, and 958. For U.S. GAAP
purposes, the Company used the discount rate in accordance with ASC Topic 420,
715, 805, 835, 958, and 980 to prepare its actuarial calculation. The
amount reversed at December 31, 2007 was $869,927.
As a
result of the process mentioned above, on October 28, 2008 the Ministry of
Finance and Public Credit approved the partial transfer (“commutation”) of the
pension obligation of the Company, which was then approved by the Ministry of
Social Security, according to the actuarial calculation at December 31, 2008 of
$10,092,528. Because Ecopetrol continues to be financially
responsible for the transferred pension liability, this amount is recognized in
the same way for U.S. GAAP purposes.
|
vii.
|
PROVISIONS,
ALLOWANCES AND CONTINGENCES
|
Prior to
September 5, 2007, under RCP, a provision was recorded for a contingent event at
the time a judgment was issued against the Company, without reference to the
evaluation of the probable final outcome. On September 5, 2007, the
CGN issued Resolution 356 which provides that a provision was to be recorded for
a contingent event if the evaluation of the outcome was evaluated to be
probable. Such methodology evolved in 2008 to be based on the “credit
system” of the Nation used by the Ministry of the Interior and
Justice. Up to October 31, 2008, Ecopetrol recognized the provisions
by the methodology it had been using in the past. The term probable
as used was interpreted in practice under RCP to mean
“more-likely-than-not”. As a result, the provision for legal
processes included in Estimated Liabilities and Provisions was increased by
$951,158 during 2007 to reflect the implementation of the new
rule. Additionally, the amount at which the provision is valued under
RCP is the estimated amount of the loss at the end of the year. In
2008, the modification of the methodology generated a net decrease (recoveries
and new provisions) of $425,376, recorded in December 2008. In
addition, in 2009, the modification of the methodology generated a net decrease
(recoveries and new provisions) of $142,452, recorded in December
2009.
F-81
Ecopetrol
S.A. and Subsidiaries
Notes to
the Consolidated Financial Statements
Years
ended December 31, 2009, 2008 and 2007
For U.S.
GAAP, Accounting for Contingencies (ASC 450), provides the guidance for
recording contingencies. Under ASC 450, there are three levels of
assessment of contingent events – probable, reasonably possible and
remote. The term probable in ASC 450 is defined as “the future event
or events are likely to occur”. The term reasonably possible is
defined as “the chance of the future event or events occurring is more than
remote but less than likely”. And the term remote is defined as “the
chance of the future event or events occurring is slight”.
Under ASC
450, an estimated loss related to a contingent event is to be accrued by a
charge to income if both of the following conditions are met:
|
•
|
Information
available prior to issuance of the financial statements indicates that it
is probable that an asset had been impaired or a liability had been
incurred at the date of the financial
statements.
|
|
•
|
The
amount of loss can be reasonably
estimated.
|
The
amount recorded is an estimate of the amount of loss at the date of the
financial statements. If the contingent event is evaluated to be
reasonably possible, no provision for the contingent event may be made, but
disclosure of the event is required.
As a
result of the difference in the definition of “probable” between RCP and U.S.
GAAP, and the general interpretation of the definition in practice in Colombia,
there is a difference in the amount of the provision for legal
proceedings. This difference increased significantly during 2007 as a
result of the rule change issued by the CGN. Additionally, in 2009,
2008 and 2007, there was a difference in the amount at which the provision for
loss is recorded, as described above.
|
viii.
|
DEFERRED
INCOME TAXES
|
Under RCP
(Colombian Government Entity GAAP), deferred income taxes are recognized only
for temporary differences using the liability method. Under U.S.
GAAP, deferred tax must be recorded for all temporary differences between the
financial and tax basis of assets and liabilities.
Under
RCP, a deferred income tax asset is recorded to the extent the company expects
to generate taxable income to recover that amount. Under U.S. GAAP, a valuation
allowance is provided for deferred tax assets to the extent that it is more
likely than not that they will not be realized.
Under
RCP, deferred income taxes are calculated using the statutory tax rate. Under
U.S. GAAP, deferred income taxes are calculated based on rates and tax laws that
are enacted at the reporting date.
Under
RCP, since 2009, goodwill is deductible and does not generate differences
between tax laws and the RCP. Under U.S. GAAP, the goodwill is not amortizable
and generates a temporary difference. As a result, it is necessary to compute
and recognize deferred income taxes for differences resulting from deductions
since the acquisition dates.
The
Company and its subsidiaries file separate income tax returns because the tax
regulations do not allow consolidated income tax returns. There are
no requirements to file tax returns by segments. Tax returns are
required for each legal entity.
The
following information regarding income taxes has been prepared under U.S.
GAAP:
F-82
Ecopetrol
S.A. and Subsidiaries
Notes to
the Consolidated Financial Statements
Years
ended December 31, 2009, 2008 and 2007
Income
Taxes
Total
income taxes for the years ended December 31, 2009, 2008 and 2007 were
comprised as follows:
|
2009
|
2008
|
2007
|
||||||||||
|
Income
tax expense
|
$ | 2,324,148 | $ | 4,579,304 | $ | 2,544,590 | ||||||
|
Income
tax effects based on items of Other Comprehensive Income:
|
||||||||||||
|
Pension
Plan Liability
|
(95,697 | ) | (302,050 | ) | 358,277 | |||||||
|
Available-for-sale
securities
|
15,389 | (236,974 | ) | (6,364 | ) | |||||||
|
Additional
paid in capital
|
177,241 | - | - | |||||||||
| $ | 2,421,081 | $ | 4,040,280 | $ | 2,896,503 | |||||||
Income
tax expense attributable to income from continuing operations consists
of:
|
2009
|
2008
|
2007
|
||||||||||
|
Current
provision
|
$ | 1,948,819 | $ | 3,648,451 | $ | 2,045,997 | ||||||
|
Deferred
tax
|
375,329 | 930,853 | 498,593 | |||||||||
| $ | 2,324,148 | $ | 4,579,304 | $ | 2,544,590 | |||||||
In 2009,
2008 and 2007, subsidiaries in foreign countries have not generated taxable
income and, consequently, they have not incurred income tax
expense.
Tax Rate
Reconciliation
Income
tax expense attributable to income from continuing operations was $2,324,148,
$4,579,304 and $2,544,590 for the years ended December 31, 2009, 2008 and 2007,
respectively, and differed from the amounts computed by applying the income tax
rate of 33% in 2009 and 2008, and 34% in 2007 to pretax income from continuing
operations as a result of the following:
|
2009
|
2008
|
2007
|
||||||||||
|
Nominal
income tax
|
33.00 | % | 33.00 | % | 34.00 | % | ||||||
|
Non
– taxable income
|
0.92 | % | (1.09 | )% | (0.89 | )% | ||||||
|
Non
– deductible expenses
|
2.19 | % | 3.56 | % | 1.14 | % | ||||||
|
Effect
of contribution in kind
|
- | - | (1.69 | )% | ||||||||
|
Others
|
(2.38 | )% | 1.94 | % | 0.08 | % | ||||||
|
Goodwill
fiscal amortization (ASC 830)
|
0.58 | % | - | - | ||||||||
|
Exempt
revenue
|
(0.14 | )% | (3.29 | )% | (3.37 | )% | ||||||
|
Changes
in tax rate
|
- | - | 0.10 | % | ||||||||
|
Effect
of foreign profit taxed at other rate
|
(0.02 | )% | (0.02 | )% | - | |||||||
|
Business
combination
|
(0.98 | )% | - | - | ||||||||
|
Effective
income tax under U.S. GAAP
|
33.17 | % | 34.10 | % | 29.21 | % | ||||||
F-83
Ecopetrol
S.A. and Subsidiaries
Notes to
the Consolidated Financial Statements
Years
ended December 31, 2009, 2008 and 2007
Deferred
Taxes
The
significant components of deferred income tax expense attributable to income
from continuing operations for the years ended December 31, 2009, 2008 and
2007 are as follows:
|
2009
|
2008
|
2007
|
||||||||||
|
Deferred
income tax expense (exclusive of the effects of other components
below):
|
||||||||||||
|
Accounts
payable
|
$ | (21,072 | ) | $ | 8,192 | $ | 111,514 | |||||
|
Inventories,
principally due to inflation adjustments
|
19,168 | (14,554 | ) | (54,565 | ) | |||||||
|
Property,
plant and equipment, principally due to DD&A and inflation
adjustments
|
(568,471 | ) | 521,649 | 190,536 | ||||||||
|
Deferred
charges
|
177,228 | (70,630 | ) | 379,099 | ||||||||
|
Capital
lease assets
|
42,999 | 10,488 | 50,820 | |||||||||
|
Monetary
Correction and other
|
(44,921 | ) | (39,573 | ) | 377,656 | |||||||
|
Investments
|
318,291 | 655,164 | 175,221 | |||||||||
|
Direct
finance leases
|
(6,355 | ) | - | (461,312 | ) | |||||||
|
Estimated
liabilities and provisions
|
(470,479 | ) | (106,139 | ) | 75,919 | |||||||
|
Accounts
and notes receivable
|
(87,778 | ) | (19,110 | ) | (431,134 | ) | ||||||
|
Carryforward
losses
|
(146,932 | ) | - | - | ||||||||
|
Labor
obligations
|
(374,923 | ) | 51,299 | 13,305 | ||||||||
|
Deferred
income
|
8,237 | (156,470 | ) | - | ||||||||
|
Natural
and environmental resources due to inflation adjustments
and capitalized expenses
|
259,483 | (11,979 | ) | (26,418 | ) | |||||||
|
Valuation
allowance
|
93,281 | 4,126 | 8,004 | |||||||||
|
Additional
tax discount on the acquisition of productive assets according to ASC 740
(1)
|
1,321,469 | 637,418 | 462,676 | |||||||||
|
Excess
in presumptive income tax
|
(114,744 | ) | - | - | ||||||||
|
Other
|
(69,965 | ) | (4 | ) | 1,645 | |||||||
|
Amortization
of actuarial loss recorded in OCI
|
(95,697 | ) | (302,050 | ) | (375,343 | ) | ||||||
|
Unrealized
loss in available for sale securities
|
15,389 | (236,974 | ) | (7,428 | ) | |||||||
|
Amortization
of fiscal goodwill according to (ASC 830)
|
30,133 | - | - | |||||||||
|
Acquisitions
adjustments (2)
|
90,988 | - | - | |||||||||
|
Adjustment
to deferred tax assets and liabilities for enacted changes in
tax laws and rates
|
- | - | 8,399 | |||||||||
| $ | 375,329 | $ | 930,853 | $ | 498,594 | |||||||
|
(1)
|
This
value corresponds to the deferred tax generated by the calculation of ASC
740, due to the implementation of the special deduction for investment in
productive assets.
|
|
(2)
|
This
value consists of the net balance of the deferred tax accounts of the
companies we acquired during 2009 at the time of the
acquisition.
|
F-84
Ecopetrol
S.A. and Subsidiaries
Notes to
the Consolidated Financial Statements
Years
ended December 31, 2009, 2008 and 2007
The tax
effects of temporary differences that give rise to significant portions of the
deferred tax assets and deferred tax liabilities at December 31, 2009 and
2008 are presented below:
|
2009
|
2008
|
|||||||
|
Deferred
income tax assets and liabilities
|
||||||||
|
Deferred
income tax assets:
|
||||||||
|
Inventories
|
$ | 60,482 | $ | 79,650 | ||||
|
Investments,
principally due to inflation adjustments
|
456,674 | 1,598,571 | ||||||
|
Accounts
and notes receivable
|
100,458 | 12,686 | ||||||
|
Deferred
income
|
148,233 | 156,470 | ||||||
|
Property,
plant and equipment, principally due to DD&A and inflation
adjustments
|
1,501,499 | 933,028 | ||||||
|
Deferred
charges
|
793 | 178,021 | ||||||
|
Financial
obligation, principally due to capitalized leasing
|
119,113 | 162,112 | ||||||
|
Pension
obligations
|
560,982 | 186,059 | ||||||
|
Accounts
payable
|
134,664 | 113,592 | ||||||
|
Carryforward losses
(1)
|
146,932 | - | ||||||
|
Excess
in presumptive income tax (2)
|
114,744 | - | ||||||
|
Other
|
16,083 | 4 | ||||||
|
Amortization
of fiscal goodwill according to ASC 830
|
376,976 | - | ||||||
|
Estimated
liabilities and provisions (3)
|
1,149,945 | 679,466 | ||||||
|
Total
gross deferred income tax assets
|
4,887,578 | 4,099,659 | ||||||
|
Less
valuation allowance
|
(103,427 | ) | (10,146 | ) | ||||
|
Deferred
income tax assets
|
4,784,151 | 4,089,513 | ||||||
|
Deferred
income tax liabilities
|
||||||||
|
Accounts
and notes receivable
|
- | 6 | ||||||
|
Natural
and environmental properties due to inflation adjustments
and capitalized expenses
|
440,494 | 181,011 | ||||||
|
Monetary
correction and other
|
445,289 | 490,210 | ||||||
|
Investments
|
1,400,966 | 2,224,572 | ||||||
|
Direct
finance lease
|
6,355 | - | ||||||
|
Deferred
income tax liabilities
|
2,293,104 | 2,895,799 | ||||||
|
Net
deferred income tax assets (4)
|
$ | 2,491,047 | $ | 1,193,714 | ||||
|
(1)
|
Carryforward
losses are generated by subsidiaries and according to local tax laws,
these losses will not expire.
|
|
(2)
|
The
excesses in presumptive income tax are generated by subsidiaries and will
expire in 5 years.
|
|
(3)
|
Includes
$14,364 from Ecopetrol del Perú that is calculated at 29% income tax rate,
which is the income tax rate for this
company.
|
|
(4)
|
The
Company does not have the intention to repatriate dividends to the Head
Office from subsidiaries in the short term; for that reason the deferred
income taxes only include the deferred income taxes recognized by the
subsidiaries.
|
The
valuation allowance for deferred income tax assets as of December 31, 2009 and
2008 was $103,427 and $10,146, respectively. In 2009, the valuation
allowance is generated by subsidiaries ODC and Hocol in the amount of $92,112
and $11,315, respectively. The ODC valuation allowance refers to fiscal
accumulated losses which are considered by the company to be unrecoverable. On
the other hand, the Hocol valuation allowance refers to the deferred income tax
provision that Hocol maintains upon the ODC investment, because Hocol does
not have the intention to sell the ODC participation. In 2008, the
valuation allowance was primarily related to the effect for Ecopetrol’s income
tax related to inflation adjustments of lands which was reversed in
2009.
|
ix.
|
REVENUE
RECOGNITION
|
|
a.
|
Revenue
– FAEP
|
The
Colombian government created and regulated in Law 209 of 1995 the savings and
stabilization fund for the oil sector (Fondo de Ahorro y Estabilización
Petrolera, or FAEP) with the exclusive dual purpose of (i) fiscal savings
and macroeconomic stabilization and (ii) government management of overseas
accounts. The law, which was in effect until 2007, required the
Company to defer a certain portion of cash received in U.S. dollars from sales
to third parties into the FAEP. Banco de la República (Colombian
Central Bank) acted as the portfolio manager of the funds and monies withdrawn
in accordance with the formula specified in the law.
F-85
Ecopetrol
S.A. and Subsidiaries
Notes to
the Consolidated Financial Statements
Years
ended December 31, 2009, 2008 and 2007
Under
RCP, contributions to FAEP were recorded as increases to deferred income and an
asset account for the same amount. No revenue was recognized for
contributions to FAEP despite the completion of a sale. Distributions
out of the fund were recorded as revenue, with corresponding decreases in the
deferred income and the FAEP asset accounts. The amount of income
that was deferred under RCP and the cash deposited into the Fund through
December 31, 2007 amounted to $3,844,167. In 2007, an additional
$316,497 was deferred and an equivalent amount was deposited into the fund; and
an exchange loss of $97,127 was recorded in the fund. During 2007,
the Colombian government issued Law 1151 of 2007 by means of Decree 3238 of
August 27, 2007, which rescinded Law 209 of 1995 and declared that Ecopetrol’s
contributions to the fund and not previously distributed to the Company pursuant
to Law 209 belonged to the Colombian government. The total amount
remitted to the Government was $4,063,537.
Until
December 31, 2007, the amount of the deferred income was recognized for U.S.
GAAP purposes, considering that this deferral responded to a Government saving
program with the purpose of maintaining macro-economic stability in the country
and that the transaction with the third party was complete. Further,
the effective receipt by the Government of the fund balance in August 2007 was
treated as a distribution to its sole shareholder under U.S. GAAP.
b.1 Natural
Gas Imbalance
For U.S.
GAAP purposes, the Company utilizes the entitlement method of accounting for
natural gas balancing arrangements by which the amount of natural gas sold is
based on its shared interests in the properties. The Company’s
natural gas imbalance positions at December 31, 2009 and 2008 were $539 and
$8,755 in favor, equivalent to 147,903 MBTU and 777,790 MBTU,
respectively. Under RCP, natural gas imbalances are settled with a
purchase or sale to the partner that are accounted for at the end of each
period.
b.2 Over
and Under
Under
RCP, the Company recognizes receivables from or payables to partners based on
the cost of the inventory.
For U.S.
GAAP purposes, the Company utilizes the entitlement method of accounting for
over and under positions by which the amount of crude oil sold is based on its
shared interest in the properties, and revenue is recognized based on market
prices. The Company’s crude oil imbalance position at December 31,
2009 was $227,900 against Ecopetrol and, at December 31, 2008 was $32,576
against equivalent to 1,674,479 and 360,730 barrels, respectively.
b.3 Cost
of Sales
Under
U.S. GAAP, the related cost of sale for over and under transactions described on
b.2 above amounted to $(111,126), $(8,887) and $16,607 during 2009, 2008 and
2007, respectively, in comparison with the amount recognized under
RCP.
c. Other
income
For U.S.
GAAP purposes, the Company recognized exchange losses originated from FAEP
funds. Under RCP, exchange losses on FAEP funds were offset with
deferred income. Exchange losses were $97,127 in 2007.
x. INFLATION
ADJUSTMENTS
The RCP
consolidated financial statements were adjusted for inflation based on the
variation in the IPC (Colombia’s equivalent to the consumer price index in the
United States) for middle income-earners from January 1, 1992 to December 31,
2001 for Ecopetrol S.A. and from January 1, 1992 to December 31, 2006 for
Oleoducto de Colombia S.A.(“ODC”), Hocol S.A., Oleoducto Central S.A. (“Ocensa”)
and Reficar S.A. The adjustment was applied monthly to non-monetary
assets, equity (except for the valuation surplus) and memorandum
accounts.
F-86
Ecopetrol
S.A. and Subsidiaries
Notes to
the Consolidated Financial Statements
Years
ended December 31, 2009, 2008 and 2007
Financial
statements are only adjusted for inflation under U.S. GAAP when an entity
operates in a hyperinflationary environment. The environment in which
companies have operated has not been hyperinflationary since the early
1990’s. For this reason, inflation adjustments recorded from 1992
until 2001 for Ecopetrol S. A. and until 2006 for the subsidiaries acquired in
2009, which remained as part of the cost of assets, have been excluded for U.S.
GAAP purposes.
xi. INVENTORIES
Under
RCP, inventories are valued at the lower of average cost or sale
price. Under U.S. GAAP, inventories are valued at the lower of
average cost or market value, the determination of which can be made using
several different methods acceptable under U.S. GAAP. An adjustment
has been recorded to reflect the difference in the method used to determine the
valuation of inventories that arises from using sale price instead of market
value, as defined by U.S. GAAP. The effects of this adjustment in the
reconciliation of income were $22,565, $10,274 and ($67,089) in 2009, 2008 and
2007, respectively.
Inventories
are also affected by the effect of adjustments to cost of sales included in this
reconciliation note. These adjustments relate to depreciation,
expenses capitalized in property, plant and equipment, asset retirement cost and
impairment of long lived assets. The effects of these adjustments in
the reconciliation of equity and the corresponding effect in inventory were
$(31,017) and $(66,570) in 2009 and 2008, respectively.
xii. LEASE
ACCOUNTING
Under
both RCP and U.S. GAAP, lessees’ accounting for capital leases and operating
leases are identical. However, the tests used to determine if a lease
is a capital or an operating lease differs between RCP and U.S.
GAAP. In applying the tests in accordance with RCP, the Company has
determined that all leases are operating leases. Under U.S. GAAP some
of these leases should be accounted for as capital leases in accordance with ASC
840-10, Leases. As a result, adjustments were recorded to reflect the
related assets and liabilities, and to recognize interest expense and
de-recognize operating expenses associated with the lease payments.
Build,
Operate, Maintain and Transfer (BOMT)
Three
original leases that were accounted for as capital leases under U.S. GAAP are
BOMT contracts, the use of which are specifically required under Colombian law
for projects that involve the building, operating, maintaining and transferring
of natural gas pipelines for the transportation of natural gas. These
contracts had original terms of 20 years, no renewal provisions, and a purchase
option. The rights to the leased assets were subsequently transferred
to a related Company (ECOGAS) that was sold, but Ecopetrol was not relieved of
the primary obligation under the original lease. This transfer was
considered a sublease accounted for as a direct finance lease.
In 2007,
Ecopetrol received a prepayment of all amounts to be received during the term of
the sublease contract.
The
outstanding amount of rentals, excluding operation and maintenance, payable
under the BOMT obligations that were not relieved during the next years follows
for these three leases:
|
Year
|
USD (million)
|
Pesos
|
||||||
|
2010
|
31 | $ | 63,490 | |||||
|
2011
|
20 | 41,034 | ||||||
|
2012
|
18 | 37,486 | ||||||
|
2013
|
17 | 35,350 | ||||||
|
2014
|
17 | 34,725 | ||||||
|
Payments
after 2014
|
44 | 89,110 | ||||||
| 147 | $ | 301,195 | ||||||
F-87
Ecopetrol
S.A. and Subsidiaries
Notes to
the Consolidated Financial Statements
Years
ended December 31, 2009, 2008 and 2007
Build,
Operate, Maintain and Transfer (BOMT) - Hocol Petroleum Limited
In
addition, the subsidiary Hocol has another BOMT contract, which is accounted for
as an operating lease under Colombian Government Entity GAAP. Under
U.S. GAAP, this BOMT is accounted for as a capital lease in accordance with
Statement on Financial Accounting Standard ASC 840-10, Leases. As a
result, adjustments were recorded to reflect the related assets and
liabilities.
At
December 31, 2009, the capitalized amount and the related liability are as
follows:
|
2009
|
||||
|
Assets
|
||||
|
Property,
plant and equipment (Building offices)
|
$ | 10,987 | ||
|
Accumulated
depreciation
|
(1,481 | ) | ||
|
Net
value
|
$ | 9,506 | ||
|
Liabilities:
|
||||
|
Financial
obligations
|
$ | 11,258 | ||
The
following table shows the net present value (in thousands of dollars) of the
lease payments for the next 5 years:
|
Year
|
USD (million)
|
Pesos
|
||||||
|
2010
|
1.2 | $ | 2,549 | |||||
|
2011
|
1.2 | 2,549 | ||||||
|
2012
|
1.2 | 2,549 | ||||||
|
2013
|
1.3 | 2,549 | ||||||
|
2014
|
0.6 | 1,062 | ||||||
|
Payments
after 2014
|
- | - | ||||||
| 5.5 | $ | 11,258 | ||||||
Embedded
Leasing
Under
RCP, there is no requirement to identify whether the arrangements or contracts
contain leases.
Under
U.S. GAAP, an arrangement contains a lease if both of the following two criteria
are met:
|
1.
|
The
arrangement depends on a specific fixed asset, either identified
contractually or implicitly identified as no alternative item could
feasibly be used.
|
|
2.
|
The
purchaser has the right to control the use of the underlying fixed asset,
such control demonstrated by the existence of any of the following
qualitative conditions:
|
|
|
a)
|
The
purchaser can operate the asset or direct others to operate the asset
while obtaining or controlling more than a minor amount of the asset’s
output;
|
|
|
b)
|
The
purchaser can control physical access to asset while obtaining or
controlling more than a minor amount of the asset’s output;
or
|
|
|
c)
|
Probability
is remote that another party will get more than minor amount of the
asset’s output and the price is not fixed per
unit.
|
Under
U.S. GAAP, if the arrangement contains a lease, ASC 840 is applied by both
purchaser and supplier for recognition, measurement, classification and
disclosure purposes.
In the
case of the Company, it was determined that there were leases included in
various contracts. The most significant embedded lease was determined
to exist in Contract DIJ 970 (Transmetano), Natural gas transportation -
Sebastapol – Medellín pipeline.
F-88
Ecopetrol
S.A. and Subsidiaries
Notes to
the Consolidated Financial Statements
Years
ended December 31, 2009, 2008 and 2007
The
contractor is entitled to receive natural gas at the designated point, and it is
also obligated along with the Company to transport the product throughout the
pipeline and bring it to the delivery point (conducting up to 67 million cubic
feet per day). The contract has duration of 15 years since 1998 until
2012, and it could be extended for periods of 1 year, not longer than 10
years. Leasing payments include the costs of transportation,
administration, operation and pipeline maintenance. At the end of 2009, there is
no extension agreement with Transmetano.
This
contract meets the criteria of Emerging Issues Task Force 01-08, Determining
Whether an Arrangement Contains a Lease (ASC 840) in order to be considered a
lease agreement. Similarly, according to ASC 840, the contract meets
the criteria to be recognized as a capital lease. At December 31,
2009 and 2008, the capitalized amount and the related liability are as
follows:
|
2009
|
2008
|
|||||||
|
Assets
|
||||||||
|
Property,
plant and equipment (Gas pipeline)
|
$ | 83,245 | $ | 83,245 | ||||
|
Accumulated
depreciation
|
(66,596 | ) | (61,046 | ) | ||||
|
Net
value
|
$ | 16,649 | $ | 22,199 | ||||
|
Liabilities:
|
||||||||
|
Financial
obligations
|
$ | 56,903 | $ | 77,513 | ||||
The
following table shows the net present value (in thousands of dollars) of the
lease payments for the next 3 years:
|
Year
|
USD (thousands)
|
Pesos
|
||||||
|
2010
|
8 | $ | 16,162 | |||||
|
2011
|
9 | 18,848 | ||||||
|
2012
|
11 | 21,892 | ||||||
| 28 | $ | 56,902 | ||||||
Other
minor contracts contained capital leases that were adjusted under U.S.
GAAP.
xiii. PRIOR
YEAR ADJUSTMENTS
In
accordance with RCP, adjustments of previously issued financial statements shall
be included in the net income of the period in which they are
discovered. These adjustments do not have any impact on the income
tax because they cannot be considered a deduction in the period in which they
are discovered. Under U.S. GAAP, when comparative statements are
presented, corresponding adjustments shall be made of the amounts of net income,
its components, retained earnings balances, and other affected balances for all
of the periods presented to reflect the retroactive application of the prior
period adjustments. Prior year adjustments were classified in the
year they were incurred as defined by U.S. GAAP.
xiv. PROPERTY,
PLANT AND EQUIPMENT
Under
RCP, property, plant and equipment is recorded at cost and is adjusted for
inflation until 2001. Cost includes administrative expenses until
2004, financial expenses and exchange differences from foreign currency
financing until the asset is placed in service. Normal disbursements
for maintenance and repairs are charged to expense and those significant costs
that improve efficiency or extend the useful life are
capitalized. Under U.S. GAAP, cost includes expenditures until the
asset is placed in service such as installation cost, freight, interest,
retirement cost; construction cost and other direct expenses are capitalized,
with exception of adjustment for inflation and foreign currency
loss. For U.S. GAAP purposes, administrative expenses capitalized
were eliminated from property, plant and equipment. In addition, a
deferred income tax asset resulted from the application of the provisions of ASC
740-10, Accounting for Acquired Temporary Differences in Certain Purchase
Transactions that are not Accounted for as Business Combinations, because the
investment in productive assets creates an additional tax deduction of 40% in
2009, 2008 and 2007.
F-89
Ecopetrol
S.A. and Subsidiaries
Notes to
the Consolidated Financial Statements
Years
ended December 31, 2009, 2008 and 2007
The
following table reflects the net changes in capitalized exploratory wells during
2009, 2008 and 2007 and does not include amounts that were capitalized and
subsequently expensed during the same period.
|
2009
|
2008
|
2007
|
||||||||||
|
Beginning
balance at January 1
|
$ | 218,413 | $ | 206,300 | $ | 113,200 | ||||||
|
Additions
from business combination
|
143,541 | - | - | |||||||||
|
Additions
to capitalized exploratory well costs
|
349,162 | 268,041 | 288,910 | |||||||||
|
Reclassifications
to wells, facilities and equipment based on the determination of proved
reserves
|
(149,130 | ) | (163,817 | ) | (113,900 | ) | ||||||
|
Capitalized
exploratory well costs charged to expense*
|
(198,064 | ) | (92,111 | ) | (81,910 | ) | ||||||
|
Ending
balance at December 31
|
$ | 363,922 | $ | 218,413 | $ | 206,300 | ||||||
*
Includes $32,351 of capitalized exploratory well costs at December 31, 2009 that
were declared as dry wells during 2010.
The
balances at December 31, 2009, 2008 and 2007 correspond to well costs
capitalized during the years ended at those dates.
a. Interest
Under
RCP, the interest is calculated on the total financial obligation together with
other costs related to the debt transactions, recognized in full as a greater
asset value.
Under
U.S. GAAP , the amount of these costs capitalized in an accounting period shall
be determined by applying the capitalization rate (weighted average rate used in
the balance of the obligations on the net financial costs, in other words, costs
less income from unused fund performance) by the average cumulative amount of
the costs for the specified period.
The total
interest capitalized during 2009 under RCP was $127,026 ($0 in 2007) and the
total interest capitalized under U.S. GAAP was $63,247 ($1,228 in 2007). The
effect of this adjustment in the reconciliation of income was $63,779 ($1,228 in
2007). There was no interest capitalized during 2008.
b. Revaluation
of property, plant and equipment and public accounting effect
Valuation
surplus of property, plant and equipment and public accounting effect correspond
to the difference between net book value and the market value for real estate or
the current value in use for plant and equipment, determined by
specialists. These accounts are reflected as Valuations and as
Valuation Surplus from reappraisals of assets and public accounting effect
(components of equity) in the Company’s consolidated balances
sheets. The last valuation was in December 2009. Technical
appraisals are valid for three years.
Under
U.S. GAAP valuation, valuation surplus of assets and public accounting effect
are not permitted.
c. Impairment
Under
RCP, technical appraisals for property, plant and equipment are performed at
least every three years. If the technical study is lower than the
carrying value, the difference is recorded in equity as a reduction of the
property, plant and equipment carrying value even if it reduces the valuation
surplus below zero. Under U.S. GAAP, in accordance with ASC 360-10,
Property, Plant, and Equipment - Impairment or Disposal of Long-Lived Assets
(ASC 360-10), property, plant, and equipment are reviewed for impairment
whenever events or changes in circumstances indicate that the carrying amount of
an asset may not be recoverable. If circumstances require a
long-lived asset to be tested for possible impairment, the Company first
compares undiscounted cash flows expected to be generated by the asset to the
carrying value of the asset. If the carrying value of the long-lived
asset is not recoverable on an undiscounted cash flow basis, impairment is
recognized to the extent that the carrying value exceeds its fair
value. Fair value is determined through various valuation techniques
including discounted cash flow models, quoted market values and third-party
independent appraisals, as considered necessary. For U.S. GAAP
purposes, the Company reviewed property, plant and equipment for impairment as
of December 31, 2009, 2008, and 2007; and recorded impairment losses when
required. For U.S. GAAP purposes, the Company recorded in 2009, 2008
and 2007 $395,044, $121,296 and $65,137, respectively, as additional impairment
charges to reduce the net book value of certain wells and pipelines to their
estimated values.
F-90
Ecopetrol
S.A. and Subsidiaries
Notes to
the Consolidated Financial Statements
Years
ended December 31, 2009, 2008 and 2007
xv. DEPRECIATION,
DEPLETION AND AMORTIZATION
Under
RCP, all tangible equipments, including those used in the production of crude
oil and natural gas, are depreciated on a straight-line basis over the related
estimated useful lives. Intangible crude oil and natural gas assets
reflected on the Company’s consolidated balance sheets as natural and
environmental resources are depleted on a units-of-production basis. Under U.S.
GAAP, all assets, including tangible equipment, used in crude oil and natural
gas producing activities are required to be depreciated or depleted using a
units-of-production method, using proved reserves calculated in accordance with
U.S. GAAP requirements. Therefore, an adjustment to net income per
U.S. GAAP has been recorded to account for the difference in depreciation,
depletion and amortization expense based on the above-described differences in
the methods used.
xvi. ASSET
RETIREMENT OBLIGATIONS
Under
RCP, the Company annually updates an analysis of the estimated liability for
future asset retirement obligations as of each balance sheet
date. The liability is adjusted to the current value and an
offsetting amount is recorded as an adjustment to the asset cost. To
the extent that elements of the liability originate in U.S. dollars, changes in
the foreign currency rates are included in the adjustment to the liability and
the related asset. The component of the asset cost resulting from
this liability is included in the depreciable base of the related
asset.
For
purposes of U.S. GAAP reporting, the Company follows the provisions of
Accounting Standards Codification ASC 360-10 Impairment or Disposal of
Long-Lived Assets. ASC 360-10 requires the Company to recognize a
liability for the present value of all legal obligations associated with the
retirement of tangible, long-lived assets as of the date the related asset was
placed into service, and capitalize an equal amount as an additional cost of the
asset. Each period the liability is accreted using an effective
interest rate method. The accretion is included as an operating
expense. The cost associated with the abandonment obligation, is
included in the computation of depreciation, depletion and
amortization.
An
adjustment has been recorded in the consolidated financial statements to reflect
accretion expense, and the related obligation and assets in accordance with ASC
360-10.
The
following table presents the changes in abandonment obligations for 2009 and
2008 as is required by ASC 360-10.
|
2009
|
2008
|
|||||||
|
Balance
at beginning of period
|
$ | 1,320,058 | $ | 980,082 | ||||
|
Liabilities
incurred in the current period
|
6,131 | 25,902 | ||||||
|
Abandonment
Cost from Business combination
|
58,143 | - | ||||||
|
Liabilities
revised
|
666,706 | 122,005 | ||||||
|
Liabilities
settled
|
(17,435 | ) | (3,120 | ) | ||||
|
Accretion
|
(33,895 | ) | 195,191 | |||||
|
Balance
at end of period
|
$ | 1,999,708 | $ | 1,320,058 | ||||
F-91
Ecopetrol
S.A. and Subsidiaries
Notes to
the Consolidated Financial Statements
Years
ended December 31, 2009, 2008 and 2007
xvii. EQUITY
CONTRIBUTIONS
|
a.
|
INCORPORATED
INSTITUTIONAL EQUITY
|
At the
end of association contracts that were signed prior to January 1, 2004, private
companies are required to transfer, without cost, to Ecopetrol, all producing
wells, facilities and other real estate and assets acquired in executing the
contracts. Under RCP, the Company accounts for the receipt, using the
relinquishing Company’s reported historical cost, by recording an increase to
assets and equity. The assets are then depreciated in accordance with
the Company’s previously disclosed accounting policies. For U.S. GAAP
reporting purposes, these balances and their related impacts on accumulated
depreciation, depletion and amortization, and cost of production have been
removed from the financial statements, based on the fact that the cost of these
assets is zero. The adjustment to conform to U.S. GAAP in 2009 was a
reduction in equity of $82,870 (original value of $137,068 net of $54,198) of
accumulated depreciation of the assets received). The adjustment to conform to
U.S. GAAP in 2008 was a reduction in equity of $60,907 (original value of
$94,414 net of $33,507 of accumulated depreciation of the assets
received).
|
b.
|
CONTRIBUTIONS
IN KIND
|
Under
RCP, contributions of Nation in Kind established by Decree 2625 of 2000 were
recognized as a cost of production during the years that the Decree was in
force, by increasing equity. Contributions in kind established by
Decree 2625 of 2000 were estimated based on the number of oil barrels extracted
at market price in situ. Under U.S. GAAP, costs associated with these
contributions were reverted as they were transactions between entities under
common control in which the transferor had no basis in the
investment.
|
c.
|
REVERSION
OF CONCESSION RIGHTS CONTRIBUTED AS
CAPITAL
|
Under
RCP, the Company recorded as reservoirs the contributions of the Nation
represented by crude oil and natural gas reserves deriving from the reversion of
concessions of oilfield areas in favor of the Nation, given before the
effectiveness of Decree 1760 of 2003. Reserves were valued by means
of the technical-economic model where the value per barrel resulted from the
relation of the net present value obtained at a discount rate and the total
proved reserves on the contribution date.
For U.S.
GAAP purposes, these reversions were considered a transfer of assets between
entities under common control. Ecopetrol, the entity that received the net
assets, recognized the assets transferred at their carrying amounts in the
accounts of the transferring entity at the date of transfer which was zero
value. The unamortized amount reverted at December 31, 2009 and 2008
was $103,260 and $121,459 respectively.
xviii. PUBLIC
OFFERING COSTS AND DISCOUNT ON ISSUANCE OF SHARES
In August
2007, the Company issued shares in an initial public offering in
Colombia. Under RCP, all related costs of this issuance were expensed
as well as a discount granted to shares fully paid in cash. For U.S.
GAAP purposes, direct costs incurred in public offerings and cash discounts are
recorded as a reduction of the proceeds received and, consequently, a reduction
in equity. An adjustment of $242,885 was recorded to recognize the
effect of these amounts in 2007.
xix. INDEBTEDNESS
COST
Under
RCP, the costs of borrowing correspond to interest payable, lender commissions
and other costs related to the debt transactions, the exchange difference for
the interest rate to be paid, the amortization of premiums and discounts in the
placement of bonds and securities, and any income results earned on the
temporary investment of such loans.
Under
U.S. GAAP, the costs of borrowing correspond to interest payable, lender
commissions and other costs related to the debt transactions, and the
amortization of premiums and discounts in the placement of bonds and securities.
It should not offset interest expense with interest income. Unlike
RCP, the cost of borrowing does not include the exchange difference for the
interest rate to be paid, unless such difference forms part of the negotiation
of the interest rate for the transaction.
F-92
Ecopetrol
S.A. and Subsidiaries
Notes to
the Consolidated Financial Statements
Years
ended December 31, 2009, 2008 and 2007
The total
indebtedness cost incurred during 2009 under RCP was $210,362 and the total
indebtedness cost incurred under U.S. GAAP was $201,562. The effect of this
adjustment in the reconciliation of income was $8,800. There were no
indebtedness costs incurred during 2008 and 2007.
xx. BUSINESS
COMBINATIONS
Purchase
method of accounting
Under
RCP, the method of accounting requires that (i) the purchase price be allocated
to the acquired assets and liabilities on the basis of their book value, (ii)
the statement of operations of the acquiring Company for the period in which a
business combination occurs include the income of the acquired Company after the
date of acquisition, and (iii) the costs directly related to the purchase
business combination are expensed as incurred.
In regard
to a business combination, the purchase method of accounting under U.S. GAAP
requires that (i) the purchase price be allocated to the identifiable acquired
assets and liabilities on the basis of fair market value according to the
Purchase Price Allocations analysis, (ii) the statement of operations of the
acquiring Company for the period in which a business combination occurs include
the income of the acquired Company after the date of acquisition, and (iii) the
costs directly related to the purchase of a business combination are expensed as
incurred.
In the
reconciliation of Ecopetrol´s net income and shareholders´ equity between RCP to
U.S. GAAP, the adjustments for each line item have been taken into account the
effects of the acquisitions during the year.
Business
Combinations during 2009
During
2009, Ecopetrol acquired the following ownership interests in the following
companies:
|
Company
|
Acquisition Date
|
% acquired
|
Activity
|
||||
|
Hocol
|
May
27, 2009
|
100 | % |
Investment
vehicle
|
|||
|
Offshore
International Group – “OIG”
|
February
06, 2009
|
50 | % |
Hydrocarbons
exploration and production
|
|||
|
Reficar
|
May
27, 2009
|
51 | % |
Hydrocarbons
refining
|
|||
Reficar
With the
acquisition of the additional 51% of Reficar, Ecopetrol became the owner of 100%
of the company. As a result, Ecopetrol consolidated Reficar’s results in
2009.
Offshore
International Group
The
purchase price allocation pertaining to our acquisition of 50% of Offshore
International Group includes only the information of Savia Peru (formerly
Petro-tech Peruana) as this is OIG’s biggest and most important asset
corresponding to 89% of OIG’s equity.
Hocol
With the
purchase of Hocol, Ecopetrol acquired an additional 21.72% of ODC, As a result,
Ecopetrol became the owner of 66% and consolidated ODC’s results in
2009.
F-93
Ecopetrol
S.A. and Subsidiaries
Notes to
the Consolidated Financial Statements
Years
ended December 31, 2009, 2008 and 2007
The
following table summarizes (i) the consideration given in exchange for ownership
interests in the above-listed companies (ii) the amounts of the assets acquired
and liabilities assumed recognized at the acquisition dates, as well as (iii)
the fair value of the non-controlling interest Ecopetrol held in the
above-listed companies at their respective acquisition dates.
|
Total
|
||||
|
Consideration:
|
||||
|
Cash
|
$ | 4,061,289 | ||
|
Contingent
consideration arrangement
|
22,401 | |||
|
Fair
value of Ecopetrol's equity interest in acquirees held before the business
combination
|
1,213,980 | |||
| $ | 5,297,670 | |||
|
Recognized
amounts of identifiable assets acquired and liabilities
assumed:
|
||||
|
Financial
assets
|
1,963,286 | |||
|
Inventory
|
444,885 | |||
|
Property,
plant, and equipment
|
2,833,678 | |||
|
Other
assets
|
272,738 | |||
|
Financial
liabilities
|
(885,077 | ) | ||
|
Other
liabilities
|
(425,508 | ) | ||
|
Total
identifiable net assets
|
$ | 4,204,002 | ||
|
Non-controlling
interest in acquirees at fair value
|
(511,494 | ) | ||
|
Goodwill
|
$ | 1,605,162 | ||
The
following table shows, by acquired company, the goodwill balance at the end of
2008, the amount of goodwill acquired during 2009, the amount of goodwill
acquired in 2009 before taxes, the amount of deferred income tax on goodwill
(indicating the impact of paragraphs 262 and 263 of ASC 805 (FAS 141-R)), and
the goodwill balance at the end of 2009:
|
Company
|
Balance
2008
|
Goodwill
acquired
during 2009
|
Balance
before tax
2009
|
Deferred
income tax*
|
Balance
2009
|
|||||||||||||||
|
Propilco
- Andean Chemicals
|
$ | 618,617 | $ | - | $ | 618,617 | $ | 899 | $ | 619,516 | ||||||||||
|
Refineria
de Cartagena
|
- | 1,029,840 | 1,029,840 | - | 1,029,840 | |||||||||||||||
|
Offshore
International Group
|
- | 758,190 | 758,190 | (31,426 | ) | 726,764 | ||||||||||||||
|
Bioenergy
|
8,993 | - | 8,993 | - | 8,993 | |||||||||||||||
|
TOTAL
|
$ | 627,610 | $ | 1,788,030 | $ | 2,415,640 | $ | (30,527 | ) | $ | 2,385,113 | |||||||||
*Impact of paragraphs 262 and
263 of ASC 805 (FAS 141-R)
Under
RCP, the following table shows amounts deductible for income tax purposes at
December 31, 2009 (which in the aggregate totaled $1,703,172).
|
Company
|
Goodwill
|
Accumulated
Amortization
|
Balance
|
Net Effect
|
Remaining
time-years
|
|||||||||||||||
|
Andean
Chemicals Ltd
|
$ | 357,629 | $ | (33,655 | ) | $ | 323,974 | $ | 106,911 | 17.8 | ||||||||||
|
Offshore
International Group – “OIG”
|
821,994 | (48,502 | ) | 773,492 | 255,252 | 14.0 | ||||||||||||||
|
Hocol
|
628,456 | (22,750 | ) | 605,706 | 199,883 | 16.0 | ||||||||||||||
|
Total
|
$ | 1,808,079 | $ | (104,907 | ) | $ | 1,703,172 | $ | 562,046 | |||||||||||
Under RCP
in 2009, $139,909 was amortized in regard to goodwill acquired from OIG,
Ecopetrol Transportation Company, Hocol, Andean Chemicals and
Propilco. The amortization in the table above represents the
accumulated amortization of the companies that could be deductible for income
tax.
F-94
Ecopetrol
S.A. and Subsidiaries
Notes to
the Consolidated Financial Statements
Years
ended December 31, 2009, 2008 and 2007
Contingencies
from Business Combinations in 2009
Hocol
Pursuant
to the Hocol Stock Purchase Agreement, a contingent consideration exists,
representing the amount which may become payable by Ecopetrol depending on oil
prices during the period from January 1, 2010 through December 1,
2010.
The
following table represents the amounts payable for each price
scenario:
|
Scenario
|
Average published price/barrel
(in U.S. Dollars)
|
Amount of Contingent Obligation
(in Millions of U.S. Dollars)
|
||||
|
1
|
Less
than $55
|
$ | - | |||
|
2
|
Equal
to $55 and less than $60
|
$ | 25 | |||
|
3
|
Equal
to $60 and less than $65
|
$ | 40 | |||
|
4
|
Equal
or more than $65
|
$ | 65 | |||
For the
calculation of the average price per barrel, the Hocol Stock Purchase Agreement
establishes that Ecopetrol must use the Platts average for the last fiscal
year.
Furthermore,
an additional payment, in the maximum amount of US$50 million, may have to be
paid in the first quarter of 2013 depending on the results of exploration of the
Huron well located in the Niscota field. The amount to be paid will be
determined by considering that during a maximum period of two years (until
December 2012), there should be 2P-type certified reserves.
A
contingent consideration included in the purchase price allocation related to
the Niscota field was calculated at the acquisition date for
$22,401.
The
calculation of the additional payment is as follows: the reserves volume is
multiplied by a percentage (between 6% and 8%) of the average WTI price during a
given period of time in order to determine the base price to pay, subject to the
maximum limit established.
In
summary, a contingency in an amount $83,030 was recorded at December 31, 2009 to
cover potential liabilities associated with the Hocol acquisition.
Offshore
International Group (“OIG”)
Pursuant
to the OIG Stock Purchase Agreement, a contingent obligation exists,
representing the amount which may become payable by Ecopetrol depending on oil
prices during the two year period from February 6, 2009 through February 6,
2011.
The
following table represents the amounts payable for each price
scenario:
|
Scenario
|
Average published price/barrel
(in U.S. Dollars)
|
Amount of Contingent Obligation
(in Millions of U.S. Dollars) *
|
||||
|
1
|
Less
than $60
|
$ | - | |||
|
2
|
More
than $60 and less or equal that $70
|
$ | 200 | |||
|
3
|
More
than $70
|
$ | 300 | |||
*Ecopetrol
must pay 50% of this amount.
A
contingency amount of $183,891 was accounted at December 31, 2009 to cover
potential liabilities associated with the OIG acquisition.
F-95
Ecopetrol
S.A. and Subsidiaries
Notes to
the Consolidated Financial Statements
Years
ended December 31, 2009, 2008 and 2007
The total
liabilities accrued for future contingencies due in 2009 by business
combinations amounted to $266,921.
Fair
value
The
following table summarizes the estimated fair value of the assets acquired and
liabilities assumed of Refineria de Cartagena S.A. (“Reficar”) 51%, Hocol
Petroleum Limited (“HOCOL”) 100%, Oleoducto de Colombia S.A. (“ODC”) 21.72%, and
Offshore International Group at their respective dates of
acquisition:
|
Refinería de
Cartagena
S.A.
|
Hocol
Petroleum
Limited
|
Oleoducto de
Colombia S.A.
|
Offshore
International
Group
|
Total
|
||||||||||||||||
|
Fair
value of assets acquired and liabilities assumed under US GAAP during
2009
|
||||||||||||||||||||
|
Assets
acquired
|
$ | 1,123,775 | $ | 338,586 | $ | 19,622 | $ | 261,587 | $ | 1,743,570 | ||||||||||
|
Property,
plant and equipment, net
|
502,279 | 1,530,386 | 196,583 | 302,216 | 2,531,464 | |||||||||||||||
|
Accounts
receivable
|
272,685 | 317,688 | 9,649 | 37,866 | 637,888 | |||||||||||||||
|
Liabilities
assumed
|
(562,899 | ) | (463,332 | ) | (17,952 | ) | (133,201 | ) | (1,177,384 | ) | ||||||||||
|
Net
Assets Acquired
|
1,335,840 | 1,723,328 | 207,902 | 468,468 | 3,735,538 | |||||||||||||||
|
Total
purchase price net of cash received
|
2,365,680 | 1,623,395 | 124,967 | 1,226,658 | 5,340,700 | |||||||||||||||
|
Goodwill
(Negative goodwill)
|
$ | 1,029,840 | $ | (99,933 | ) | $ | (82,935 | ) | $ | 758,190 | $ | 1,605,162 | ||||||||
The
negative goodwill is recognized as Non-operating income, net in income
statement.
The cash
paid for the acquired companies is described in the following
table:
|
Refinería de
Cartagena S.A.
|
Hocol
Petroleum
Limited
|
Oleoducto de
Colombia S.A.
|
Offshore
International
Group
|
Total
|
||||||||||||||||
|
Cash
Paid
|
$ | 1,206,497 | $ | 1,600,992 | $ | 27,142 | $ | 1,226,658 | $ | 4,061,289 | ||||||||||
The fair
value of assets acquired includes property, plant and equipment in an amount of
$1,611,052.
The fair
value of Ecopetrol’s non-controlling interests in the above-listed companies was
estimated by applying the market price at the acquisition dates according to the
requirements of ASC 805 (FAS 141 –R).
Ecopetrol
recognized a gain of $110,354 as a result of re-appraising to fair value its 60%
equity interest in ODC held before the business combination. The gain is
included in other income in Ecopetrol’s income statement for the year ending
December 31, 2009.
Effect
on Revenues and Earnings
The
revenues and earnings included in Ecopetrol’s consolidated income statement for
the year ended December 31, 2009 reflecting these business combinations and the
revenue and earnings the combined entity would have recorded had the acquisition
dates been January 1, 2009 or January 1, 2008, are as follows:
|
UNAUDITED
PRO FORMA FINANCIAL INFORMATION
|
||||||||
|
2008
|
2009
|
|||||||
|
Consolidated
sales of Ecopetrol, December 31
|
$ | 33,849,213 | $ | 29,551,574 | ||||
|
Sales
of the companies acquired prior to the acquistion
|
7,388,318 | 2,570,354 | ||||||
|
Pro
forma Sales
|
$ | 41,237,531 | $ | 32,121,928 | ||||
|
Net
Earnings of Ecopetrol
|
$ | 8,848,139 | $ | 5,661,562 | ||||
|
Net
earnings of the companies acquired in 2009
|
271,341 | 136,977 | ||||||
|
Pro
forma Earnings
|
$ | 9,119,480 | $ | 5,798,539 | ||||
|
Weighted-average
shares outstanding
|
40,472,512,588 | 40,472,512,588 | ||||||
|
Earnings
per share
|
$ | 225.33 | $ | 143.27 | ||||
F-96
Ecopetrol
S.A. and Subsidiaries
Notes to
the Consolidated Financial Statements
Years
ended December 31, 2009, 2008 and 2007
Bargain
Purchase
The
following table shows the bargain purchase (gain or loss in the pre-existing
participation) of the acquired companies. The gains and losses were calculated
by third party experts who determined the fair value in the purchase price
allocation:
|
Reficar
|
ODC
|
|||||||
|
Percentage
acquired
|
51.00% | 21.72% | ||||||
|
Bargain
Purchase
|
$ | (134,967) | $ | 27,422 | ||||
|
Gain
|
$ | 23,300 | $ | 4,608 | ||||
The total
amount expensed in the acquisition processes of Hocol, Reficar and Offshore
International Group during 2009 was $16,320.
a.
Goodwill
Under
Colombian Government Entity GAAP, goodwill corresponds to the difference between
the acquisition price and the book value of the acquired
company. This amount is amortized during the period in which the
Company expects to receive future benefits. Additionally, under
Colombian Government Entity GAAP, goodwill is not subject to impairment tests
and RCP does not generate negative goodwill in business
combination.
The
descriptions of goodwill generated under RCP during 2009 are as
follows:
Offshore
International Group – “OIG”
The
resulting goodwill from the acquisition of Offshore International Group (“OIG”)
was accounted as intangible assets and is amortized on a monthly basis in the
administrative expenses account over a 14-year term, determined by the net
present value of the investment minus estimated future cash flows. The straight
line method of amortization was applied to the goodwill, which will be reviewed
and updated annually based on the actual life of the biggest production block.
Ecopetrol does not include the results OIG’s operations in its consolidated
financial statements since Ecopetrol does not have control over
OIG.
F-97
Ecopetrol
S.A. and Subsidiaries
Notes to
the Consolidated Financial Statements
Years
ended December 31, 2009, 2008 and 2007
Hocol
The
resulting goodwill from the acquisition of Hocol was recorded as intangible
assets and is amortized on a monthly basis in the administrative expenses
account over a 16-year term, determined by the net present value of the
investment minus the estimated future cash flows. The straight line method of
amortization was applied to the goodwill which will be reviewed and updated
annually based on the Discount Cash Flow applied to the investments.
Accordingly, Ecopetrol reversed $22,750, which corresponds to the amortization
of goodwill of Hocol under RCP.
Reficar
Under
RCP, the increase in ownership in Reficar did not result in goodwill. Under U.S.
GAAP, the resulting goodwill from the acquisition of Reficar was accounted as
intangible assets and will be tested for impairment annually.
Under
U.S. GAAP, Ecopetrol tests goodwill for impairment at least annually using a two
step process that begins with an estimation of the fair value of a reporting
unit. The first step is a screen for potential impairment and the
second step measures the amount of impairment.
Fair
value is determined by reference to market value, if available, or by a
qualified evaluator or pricing model. Determination of a fair value by a
qualified evaluator or pricing model requires management to make assumptions and
use estimates. Management believes that the assumptions and estimates used are
reasonable and supportable in the existing market environment and commensurate
with the risk profile of the assets valued. However, different assumptions and
estimates could be used which would lead to different results. In 2009, the most
significant amounts of goodwill were related to the acquisitions of Reficar and
Offshore International Group. The valuation models used to determine the fair
value of these companies are sensitive to changes in the underlying assumptions.
For example, the prices and volumes of product sales to be achieved and the
prices which will be paid for the purchase of raw materials are assumptions
which may vary in the future. Adverse changes in any of these assumptions could
lead the Company to record a goodwill impairment charge. During 2009, Ecopetrol
conducted a qualitative impairment test of goodwill which showed that no
goodwill had been impaired.
xxi.
NON-CONTROLLING INTEREST
To
determine the attributable non-controlling interest at December 31, 2009,
Ecopetrol used the net equity from all subsidiaries at the beginning of the
period and computed with all variations (net income, retained earnings,
non-controlling interest, distribution of dividends, purchase price allocation,
translation adjustments, and others) the carrying amount of total equity (net
assets) attributable to the non-controlling interest at the end of
2009.
The
following table sets the information for Ecopetrol’s non-controlling interests
in 2008 and 2009, respectively.
|
Ocensa
|
Brazil
|
Peru
|
ODC
|
ODL
|
Bioenergy
|
Total
|
||||||||||||||||||||||
|
Balance
2006
|
$ | 565,119 | $ | - | $ | - | $ | - | $ | - | $ | - | $ | 565,119 | ||||||||||||||
|
Issuance
of company shares
|
- | 45 | 484 | - | - | - | 529 | |||||||||||||||||||||
|
Net
income (loss)
|
21,373 | - | - | - | - | - | 21,373 | |||||||||||||||||||||
|
Distribution
of dividends
|
(15,418 | ) | - | - | - | - | - | (15,418 | ) | |||||||||||||||||||
|
Translation
Adjustments
|
- | 4 | (10 | ) | - | - | - | (6 | ) | |||||||||||||||||||
|
Balance
2007
|
571,074 | 49 | 474 | - | - | - | 571,597 | |||||||||||||||||||||
|
Issuance
of company shares
|
- | - | - | - | 217,378 | 217,378 | ||||||||||||||||||||||
|
Other
Non-controlling Interest
|
- | (45 | ) | (484 | ) | - | - | - | (529 | ) | ||||||||||||||||||
|
Net
income (loss)
|
8,716 | - | - | - | - | (2,460 | ) | 6,256 | ||||||||||||||||||||
|
Distribution
of dividends
|
(141,634 | ) | - | - | - | - | - | (141,634 | ) | |||||||||||||||||||
|
Retained
Earnings
|
140,095 | - | - | - | - | - | 140,095 | |||||||||||||||||||||
|
Purchase
Price Allocation
|
- | - | - | - | - | 8,718 | 8,718 | |||||||||||||||||||||
|
Translation
Adjustments
|
- | ( 4 | ) | 10 | - | 16,885 | - | 16,891 | ||||||||||||||||||||
|
Balance
2008
|
578,251 | - | - | - | 234,263 | 6,258 | 818,772 | |||||||||||||||||||||
|
Acquired
Non-controlling Interest
|
(300,377 | )* | - | - | 21,495 | - | (2,810 | ) | (281,692 | ) | ||||||||||||||||||
|
Equity
reduction declared and paid
|
- | - | - | - | (78,405 | ) | - | (78,405 | ) | |||||||||||||||||||
|
Net
income (loss)
|
161,849 | - | - | (40,320 | ) | (14,274 | ) | (2,536 | ) | 104,719 | ||||||||||||||||||
|
Distribution
of dividends
|
(89,736 | ) | - | - | - | - | - | (89,736 | ) | |||||||||||||||||||
|
Retained
Earnings
|
95,790 | - | - | (1,622 | ) | 464 | 6,540 | 101,172 | ||||||||||||||||||||
|
Purchase
Price Allocation
|
- | - | - | 21,530 | - | - | 21,530 | |||||||||||||||||||||
|
Translation
Adjustments
|
- | - | - | (13,047 | ) | - | (13,047 | ) | ||||||||||||||||||||
|
Balance
2009
|
$ | 445,777 | $ | - | $ | - | $ | 1,083 | $ | 129,001 | $ | 7,452 | $ | 583,313 | ||||||||||||||
*
Corresponds to acquisition of an additional 24.71% ownership interest in Ocensa
for $998,903 in cash. The difference of 610,007 was registered as an additional
paid in capital net of income tax in an amount of $171,241 as a result of
difference between local deductible goodwill.
xxii. EARNINGS
PER SHARE
Under
RCP, earnings per share ("EPS") are calculated by dividing net income by the
weighted average of both common and preferred shares outstanding for each period
presented. The Company does not have any issued or outstanding
preferred shares.
F-98
Ecopetrol
S.A. and Subsidiaries
Notes to
the Consolidated Financial Statements
Years
ended December 31, 2009, 2008 and 2007
U.S. GAAP
requires dual presentation of basic and diluted EPS for entities with complex
capital structures, as well as a reconciliation of the basic EPS calculation
with the diluted EPS calculation. Basic EPS is calculated by dividing net income
available to common shareholders by the weighted average of common shares
outstanding for the corresponding period.
Diluted
EPS assumes the issuance of common shares for all dilutive potential common
shares outstanding during the reporting period. For the years ended December 31,
2009, 2008 and 2007, the Company had a simple capital structure. There are no
stock compensation plans or any other compensation plan involving shares.
Therefore, the Company is not required to present diluted EPS for these
years.
xxiii.
CONCENTRATIONS
At
December 31 2009, 2008 and 2007, 32%, 33% and 26.6%, respectively, of the
Company’s employees belong to unions. Management believes the Company’s
relationships with those unions are good. The current labor agreement with the
union was renewal on September 10, 2009.
In 2007,
two customers of the refinery segment accounted for 14.2% and 12.9%, and one
customer of the production segment accounted for 13.4% of total sales,
respectively. No other customers accounted for more than 10% of total
sales in 2007. In 2008, one customer of the production segment
accounted for 14.2% and one customer of the refinery segment accounted for 11.7%
of the total sales. No other customers accounted for more than 10% of
total sales in 2008. In 2009, one customer of the refining segment accounted for
13.1% of total sales. No other customers accounted for more than 10% of total
sales in 2009. Management
does not believe that the loss of any single significant customer would
materially affect Ecopetrol’s financial position.
The
significant majority of the Company’s assets and activities are located in
Colombia. The financial position and results of operations of those
subsidiaries located outside of Colombia are not material to the
Company.
xxiv. RECENT
U.S. GAAP PRONOUNCEMENTS
In
October 2009, the FASB issued ASU 2009-13, Revenue Recognition (Topic 605):
Multiple-Deliverable Revenue Arrangements (EITF Issue No. 08-1, Revenue
Arrangements with Multiple Deliverables). ASU 2009-13 amends ASC 650-25 to
eliminate the requirement that all undelivered elements have vendor specific
objective evidence of selling price ("VSOE") or third party evidence of selling
price ("TPE") before an entity can recognize the portion of an overall
arrangement fee that is attributable to items that already have been delivered.
In the absence of VSOE and TPE for one or more delivered or undelivered elements
in a multiple-element arrangement, entities will be required to estimate the
selling prices of those elements. The overall arrangement fee will be allocated
to each element (both delivered and undelivered items) based on their relative
selling prices, regardless of whether those selling prices are evidenced by VSOE
or TPE or are based on the entity’s estimated selling price. Application of the
“residual method” of allocating an overall arrangement fee between delivered and
undelivered elements will no longer be permitted upon adoption of ASU 2009-13.
Additionally, the new guidance will require entities to disclose more
information about their multiple-element revenue arrangements. ASU 2009-13 is
effective prospectively for revenue arrangements entered into or materially
modified in fiscal years beginning on or after June 15, 2010. Early adoption is
permitted. The Company expects that the adoption of ASU 2009-13 will not have a
material impact on its consolidated financial statements.
The FASB
issued ASU 2009-16, Transfers and Servicing (Topic 860): Accounting for
Transfers of Financial Assets (FASB Statement No. 166, Accounting for Transfers
of Financial Assets—an amendment of FASB Statement No. 140) in December 2009.
ASU 2009-16 removes the concept of a qualifying special-purpose entity (“QSPE”)
from ASC Topic 860, Transfers and Servicing, and the exception from applying ASC
810-10 to QSPEs, thereby requiring transferors of financial assets to evaluate
whether to consolidate transferees that previously were considered QSPEs.
Transferor-imposed constraints on transferees whose sole purpose is to engage in
securitization or asset-backed financing activities are evaluated in the same
manner under the provisions of the ASU as transferor-imposed constraints on
QSPEs were evaluated under the provisions of Topic 860 prior to the effective
date of the ASU when determining whether a transfer of financial assets
qualifies for sale accounting. The ASU also clarifies the Topic 860
sale-accounting criteria pertaining to legal isolation and effective control and
creates more stringent conditions for reporting a transfer of a portion of a
financial asset as a sale. The ASU is effective for periods beginning after
December 15, 2009, and may not be early adopted. The Company expects that the
adoption of ASU 2009-16 will not have a material impact on its consolidated
financial statements.
F-99
Ecopetrol
S.A. and Subsidiaries
Notes to
the Consolidated Financial Statements
Years
ended December 31, 2009, 2008 and 2007
The FASB
issued ASU 2009-17, Consolidations (Topic 810): Improvements to Financial
Reporting by Enterprises Involved with Variable Interest Entities (FASB
Statement No. 167, Amendments to FASB Interpretation No. 46(R)) in December
2009. ASU 2009-17, which amends the Variable Interest Entity ("VIE") Subsections
of ASC Subtopic 810-10, Consolidation – Overall, revises the test for
determining the primary beneficiary of a VIE from a primarily quantitative risks
and rewards calculation based on the VIE’s expected losses and expected residual
returns to a primarily qualitative analysis based on identifying the party or
related-party group (if any) with (a) the power to direct the activities that
most significantly impact the VIE’s economic performance and (b) the obligation
to absorb losses of, or the right to receive benefits from, the VIE that could
potentially be significant to the VIE. The ASU requires kick-out rights and
participating rights to be ignored in evaluating whether a variable interest
holder meets the power criterion unless those rights are unilaterally
exercisable by a single party or related party group. The ASU also revises the
criteria for determining whether fees paid by an entity to a decision maker or
another service provider are a variable interest in the entity and revises the
Topic 810 scope characteristic that identifies an entity as a VIE if the
equity-at-risk investors as a group do not have the right to control the entity
through their equity interests to address the impact of kick-out rights and
participating rights on the analysis. Finally, the ASU adds a new requirement to
reconsider whether an entity is a VIE if the holders of the equity investment at
risk as a group lose the power, through the rights of those interests, to direct
the activities that most significantly impact the VIE’s economic performance,
and requires a Company to reassess on an ongoing basis whether it is deemed to
be the primary beneficiary of a VIE. ASU 2009-17 is effective for periods
beginning after December 15, 2009 and may not be early adopted. The Company
expects that the adoption of ASU 2009-17 will not have a material impact on its
consolidated financial statements.
xxv. RECENTLY
ADOPTED ACCOUNTING STANDARDS AND U.S. GAAP PRONOUNCEMENTS
In
September 2006, the FASB issued FASB Statement No. 157, Fair Value Measurement
and Disclosure (ASC 820). This statement defines fair value, establishes a
framework for the measurement of fair value, and enhances disclosures about fair
value measurements. The Statement does not require any new fair value measures.
The Statement (as amended by FSP FAS 157-2) is effective for fair value measures
already required or permitted by other standards for fiscal years beginning
after November 15, 2007. The statement is required to be applied prospectively,
except for certain financial instruments. Any transition adjustment will be
recognized as an adjustment to opening retained earnings in the year of
adoption. FSP FAS 157 – 2, “Effective Date of FASB Statement No. 157”, delays
the effective date of this statement for nonfinancial assets and liabilities
that are not measured at fair value on a recurring basis (at least annually)
until fiscal years beginning after November 15, 2008, and interim periods within
those fiscal years. Disclosures required by this statement are presented below
in xxix.
In
December 2007, the FASB issued FASB Statement No. 141(R) (ASC 805), Business
Combinations, and FASB Statement No. 160 (ASC 810), Non controlling Interests in
Consolidated Financial Statements – an amendment to ARB No. 51 (ASC 810).
Statements 141(R) and 160 require most identifiable assets, liabilities, non
controlling interests, and goodwill acquired in a business combination to be
recorded at “full fair value” and require non controlling interests
to be reported as a component of equity, which changes the accounting for
transactions with non controlling interest holders. Both Statements are
effective for periods beginning on or after December 15, 2008, and earlier
adoption is prohibited. Statement 141(R) (ASC 805) will be applied to business
combinations occurring after the effective date. Statement 160 (ASC 810) will be
applied prospectively to all non controlling interests, including any that arose
before the effective date. The adoption of Statement 160 is reflected in
Ecopetrol’s consolidates balance sheet and consolidated income
statement.
F-100
Ecopetrol
S.A. and Subsidiaries
Notes to
the Consolidated Financial Statements
Years
ended December 31, 2009, 2008 and 2007
In
February 2008, the FASB issued FASB Staff Position FAS 140-3, “Accounting for
Transfers of Financial Assets and Repurchase Financing Transactions” (ASC 310
and ASC 860). The objective of the FSP is to provide guidance on accounting for
a transfer of a financial asset and repurchase financing. The FSP presumes that
an initial transfer of a financial asset and a repurchase financing are
considered part of the same arrangement (linked transaction) under Statement
140. However, if certain criteria are met, the initial transfer and repurchase
financing shall not be evaluated as a linked transaction and shall be evaluated
separately under Statement 140. FSP FAS 140-3 is effective for annual and
interim periods beginning after November 15, 2008 and early adoption is not
permitted. There was no impact to the Company.
In March
2008, the FASB issued FASB Statement No. 161 (ASC 815), Disclosures about
Derivative Instruments and Hedging Activities—an amendment of FASB Statement No.
133. This statement requires entities that utilize derivative instruments to
provide qualitative disclosures about their objectives and strategies for using
such instruments, as well as any details of credit-risk-related contingent
features contained within derivatives. The statement also requires entities to
disclose additional information about the amounts and location of derivatives
located within the financial statements, how the provisions of Statement 133
have been applied, and the impact that hedges have on an entity’s financial
position, financial performance, and cash flows. Statement 161 is effective for
fiscal years and interim periods beginning after November 15, 2008. The
disclosure required by this statement had no effect in 2008. For 2009, the
disclosures are presented in Note 33, iii – Derivatives.
In April
2008, the FASB issued FASB Staff Position FAS 142-3, “Determination of the
Useful Life of Intangible Assets.” FSP FAS 142-3 amends the factors that should
be considered in developing renewal or extension assumptions used to determine
the useful life of a recognized intangible asset under Statement 142 (ASC 350).
FSP FAS 142-3 is effective for fiscal years beginning after December 15,
2008.
In June
2009, the FASB issued FAS 168 “Accounting Standards Codification and the
Hierarchy of Generally Accepted Accounting Principles” (ASC 100), the objective
of this Statement is to replace Statement 162 and to establish the FASB
Accounting Standards Codification (Codification) as the source of authoritative
accounting principles recognized by the FASB to be applied by nongovernmental
entities in the preparation of financial statements in conformity with GAAP.
Rules and interpretive releases of the Securities and Exchange Commission (SEC)
under authority of federal securities laws are also sources of authoritative
GAAP for SEC registrants. This Statement shall be effective for financial
statements issued or interim and annual periods ending after September 15, 2009,
except for nonpublic nongovernmental entities that have not followed the
guidance included in the AICPA Technical Inquiry Service (TIS) Section 5100,
“Revenue Recognition,” paragraphs 38–76. Those entities shall account for the
adoption of that guidance as a change in accounting principle on a prospective
basis for revenue arrangements entered into or materially modified in those
fiscal years beginning on or after December 15, 2009, and interim periods within
those years. If an accounting change results from the application of that
guidance, an entity shall disclose the nature and reason for the change in
accounting principle.
In
September 2009, the FASB issued ASU 2009-11, Extractive activities - Oil and Gas
– Amendment to section 932-10-S99, this accounting standard update represents a
technical correction to the SEC observer comment in EITF-90-22 “Accounting for
Gas-Balancing arrangements”. Registrants should account for all significant gas
imbalances consistently, using one accounting method. SEC registrants should
disclose their method of accounting, as well as the amount of any imbalance in
terms of units and value, if significant.
In
January 2010, the FASB issued ASU 2010-03, Oil and Gas Reserve Estimation and
Disclosures. This ASU aligns the oil and gas reserve estimation and disclosure
requirements of FASB ASC Topic 932, Extractive Activities—Oil and Gas, with the
requirements in the SEC Rule, Modernization of the Oil and Gas Reporting
Requirements, which was issued on December 31, 2008 (SAB-113). The amendments to
Topic 932 are effective for annual reporting periods ending on or after December
31, 2009 and should be accounted for as a change in accounting principle
inseparable from a change in estimate. Early application is not permitted.
Disclosures required by this statement are presented below in Note 33, xxix.
Supplemental information on oil and gas producing activities.
F-101
Ecopetrol
S.A. and Subsidiaries
Notes to
the Consolidated Financial Statements
Years
ended December 31, 2009, 2008 and 2007
xxvi. SEGMENT
INFORMATION
The
following segment information has been prepared in accordance with ASC 280,
Disclosure about Segments of an Enterprise and Related
Information. Financial information by business segment is reported in
accordance with the internal reporting system under RCP and shows internal
segment information that is used by the chief operating decision maker to manage
and measure the performance of Ecopetrol.
As of
2009, the Company’s management modified the methodology used to analyze the
financial information of its business segments in a way that better suits the
operations of the Company. Specifically, as from 2009, crude oil
purchases from third parties and ANH and the proceeds from the sales thereof are
presented within the Market and Supply segment. Up to 2008, they were included
in the Exploration and Production segment. The composition of the
segments or the structure of the Company’s internal organizations was not
modified. The segment information for 2008 and 2007 included herein has been
updated for comparison purposes.
The
Company operates under the following segments, which are described as
follows:
Exploration and Production —
this segment includes the Company’s oil & gas exploration and production
activities. Revenue is derived from the sale of crude oil and natural gas to
inter-company segments, at market prices, and to third parties. Revenue is
derived from local sales of crude oil, regulated fuels, non-regulated fuels and
natural gas. Sales are made to local and foreign distributors. Costs include
those costs incurred in production. Expenses include all exploration costs that
are not capitalized.
Refining – this segment
includes the Company’s refining activities. Goods sold, both internally and to
third parties, include refined products such as motor fuels, fuel oils and
petrochemicals at market prices. This segment also includes sales of industrial
services to third parties.
Transportation – this segment
includes the Company’s sales and costs associated with the Company’s pipelines
and other transport activities.
Market and Supply – this
segment includes the Company’s revenues, costs and expenses associated with
distribution, including distribution of purchases from third parties and the ANH
(Agencia Nacional de Hidrocarburos).
Corporate – this segment
includes the financial results and other activities not included in the previous
segments, and all corporate financial management and overhead related with the
Company’s central administration. It also includes actuarial expenses
related with the pension and health-care plans for pensioned
participants.
These
functions have been defined as the operating segments of the Company because
they are the segments (a) that engage in business activities from which revenues
are earned and expenses are incurred; (b) whose operating results are regularly
reviewed by the Company's chief operating decision maker to allocate resources
to the segments and assess their performance; and (c) for which discrete
financial information is available. Internal transfers represent sales to
intercompany segments and are recorded and presented at market
prices.
The
following presents the Company’s balance sheet by segment in accordance with
RCP:
F-102
Ecopetrol
S.A. and Subsidiaries
Notes to
the Consolidated Financial Statements
Years
ended December 31, 2009, 2008 and 2007
As
of December 31, 2009
|
Exploration &
Production
|
Refining
|
Transportation
|
Market and
Supply
|
Corporate
|
Eliminations
|
Total
|
||||||||||||||||||||||
|
Current
assets
|
||||||||||||||||||||||||||||
|
Cash
and cash equivalents
|
$ | 524,575 | $ | 474,419 | $ | 284,071 | $ | 1 | $ | 2,279,053 | $ | - | $ | 3,562,119 | ||||||||||||||
|
Accounts
and notes receivable
|
1,729,683 | 881,807 | 470,252 | 150,352 | 484,201 | (747,175 | ) | 2,969,120 | ||||||||||||||||||||
|
Inventories
|
586,915 | 1,186,598 | 38,168 | 355,879 | - | (124,863 | ) | 2,042,697 | ||||||||||||||||||||
|
Investments
|
- | - | 77,929 | - | 580,802 | (196,473 | ) | 462,258 | ||||||||||||||||||||
|
Other
current assets
|
1,967,700 | 759,092 | 142,117 | 31,653 | 191,035 | (10,003 | ) | 3,081,594 | ||||||||||||||||||||
| 4,808,873 | 3,301,916 | 1,012,537 | 537,885 | 3,535,091 | (1,078,514 | ) | 12,117,788 | |||||||||||||||||||||
|
Investments
in non-consolidated companies
|
1,756,903 | 614,863 | 510,654 | 7,921 | 1,424,157 | - | 4,314,498 | |||||||||||||||||||||
|
Property,
plant and equipment, net
|
16,959,637 | 5,725,580 | 5,000,979 | 16,950 | 234,738 | - | 27,937,884 | |||||||||||||||||||||
|
Other
non-current assets
|
2,813,026 | 3,671,095 | 1,490,849 | 86,227 | 4,266,059 | (1,137,909 | ) | 11,189,347 | ||||||||||||||||||||
|
Non
Current assets
|
21,529,566 | 10,011,538 | 7,002,482 | 111,098 | 5,924,954 | (1,137,909 | ) | 43,441,729 | ||||||||||||||||||||
|
Total
assets
|
$ | 26,338,439 | $ | 13,313,454 | $ | 8,015,019 | $ | 648,983 | $ | 9,460,045 | $ | (2,216,423 | ) | $ | 55,559,517 | |||||||||||||
|
Accounts
payable
|
$ | (1,769,120 | ) | $ | (805,784 | ) | $ | (577,766 | ) | $ | (704,937 | ) | $ | (408,257 | ) | $ | 985,632 | $ | (3,280,232 | ) | ||||||||
|
Financial
obligations (short-term)
|
(20,434 | ) | (214,698 | ) | (99,983 | ) | - | (101,966 | ) | - | (437,081 | ) | ||||||||||||||||
|
Other
Current Liabilities
|
(1,155,241 | ) | (1,602,026 | ) | (408,600 | ) | (34,274 | ) | (552,759 | ) | - | (3,752,900 | ) | |||||||||||||||
|
Current
Liabilities
|
(2,944,795 | ) | (2,622,508 | ) | (1,086,349 | ) | (739,211 | ) | (1,062,982 | ) | 985,632 | (7,470,213 | ) | |||||||||||||||
|
Financial
obligations (long-term)
|
(1,369,726 | ) | (688,452 | ) | (589,832 | ) | - | (3,066,344 | ) | - | (5,714,354 | ) | ||||||||||||||||
|
Other
non Current Liabilities
|
(4,710,256 | ) | (1,686,981 | ) | (652,950 | ) | (32,003 | ) | (2,887,420 | ) | 1,105,928 | (8,863,682 | ) | |||||||||||||||
|
Non-current
liabilities
|
(6,079,982 | ) | (2,375,433 | ) | (1,242,782 | ) | (32,003 | ) | (5,953,764 | ) | 1,105,928 | (14,578,036 | ) | |||||||||||||||
|
Total
Liabilities
|
(9,024,777 | ) | (4,997,941 | ) | (2,329,131 | ) | (771,214 | ) | (7,016,746 | ) | 2,091,560 | (22,048,249 | ) | |||||||||||||||
|
Non-controlling
interest
|
- | (11,696 | ) | (929,615 | ) | - | - | - | (941,311 | ) | ||||||||||||||||||
|
Shareholders’
equity of Ecopetrol
|
(17,313,662 | ) | (8,303,817 | ) | (4,756,273 | ) | 122,231 | (2,443,299 | ) | 124,863 | (32,569,957 | ) | ||||||||||||||||
|
Total
Equity
|
(17,313,662 | ) | (8,315,513 | ) | (5,685,888 | ) | 122,231 | (2,443,299 | ) | 124,863 | (33,511,268 | ) | ||||||||||||||||
|
Total
liabilities and equity
|
$ | (26,338,439 | ) | $ | (13,313,454 | ) | $ | (8,015,019 | ) | $ | (648,983 | ) | $ | (9,460,045 | ) | $ | 2,216,423 | $ | (55,559,517 | ) | ||||||||
|
Capital
expenditures
|
$ | 5,564,438 | $ | 3,578,579 | $ | 3,501,953 | $ | 8,455 | $ | 197,237 | $ | 12,850,662 | ||||||||||||||||
|
Goodwill
|
$ | 1,393,705 | $ | 603,193 | $ | 510,654 | $ | - | $ | - | $ | - | $ | 2,507,552 | ||||||||||||||
As
of December 31, 2008
|
Exploration &
Production
|
Refining
|
Transportation
|
Market and
Supply
|
Corporate
|
Total
|
|||||||||||||||||||
|
Current
assets
|
||||||||||||||||||||||||
|
Cash
and cash equivalents
|
$ | 29,621 | $ | 25,702 | $ | 205,423 | $ | 1 | $ | 1,853,056 | $ | 2,113,803 | ||||||||||||
|
Accounts
and notes receivable
|
889,324 | 713,242 | 108,034 | 3,195 | 4,163,487 | 5,877,282 | ||||||||||||||||||
|
Inventories
|
695,998 | 514,696 | 1,609 | 312,697 | 86,296 | 1,611,296 | ||||||||||||||||||
|
Investments
|
- | - | - | - | 3,749,919 | 3,749,919 | ||||||||||||||||||
|
Other
current assets
|
1,311,415 | 567,679 | 224,437 | 1,573 | 247,496 | 2,352,600 | ||||||||||||||||||
| 2,926,358 | 1,821,319 | 539,503 | 317,466 | 10,100,254 | 15,704,900 | |||||||||||||||||||
|
Investments
in unconsolidated companies
|
636,010 | 1,307,996 | 48,221 | 7,790 | 404,678 | 2,404,695 | ||||||||||||||||||
|
Property,
plant and equipment, net
|
11,532,444 | 2,624,998 | 1,858,477 | 13,260 | 102,358 | 16,131,537 | ||||||||||||||||||
|
Other
non-current assets
|
3,748,875 | 2,256,078 | 884,312 | 37,319 | 7,534,696 | 14,461,280 | ||||||||||||||||||
|
Non
Current assets
|
15,917,329 | 6,189,072 | 2,791,010 | 58,369 | 8,041,732 | 32,997,512 | ||||||||||||||||||
|
Total
assets
|
$ | 18,843,687 | $ | 8,010,391 | $ | 3,330,513 | $ | 375,835 | $ | 18,141,986 | $ | 48,702,412 | ||||||||||||
|
Accounts
payable
|
$ | (751,117 | ) | $ | (532,743 | ) | $ | (287,843 | ) | $ | (3,280 | ) | $ | (133,664 | ) | $ | (1,708,647 | ) | ||||||
|
Other
Current Liabilities
|
(2,818,830 | ) | (1,171,709 | ) | (327,960 | ) | (9,907 | ) | (662,719 | ) | (4,991,125 | ) | ||||||||||||
|
Current
Liabilities
|
(3,569,947 | ) | (1,704,452 | ) | (615,803 | ) | (13,187 | ) | (796,383 | ) | (6,699,772 | ) | ||||||||||||
|
Non-current
liabilities
|
(3,133,747 | ) | (173,241 | ) | (191,295 | ) | (8,360 | ) | (3,633,329 | ) | (7,139,972 | ) | ||||||||||||
|
Total
Liabilities
|
(6,703,694 | ) | (1,877,693 | ) | (807,098 | ) | (21,547 | ) | (4,429,712 | ) | (13,839,744 | ) | ||||||||||||
|
Non-controlling
interest
|
- | (8,682 | ) | (234,269 | ) | - | - | (242,951 | ) | |||||||||||||||
|
Shareholders’
equity of Ecopetrol
|
(12,139,993 | ) | (6,124,016 | ) | (2,289,146 | ) | (354,288 | ) | (13,712,274 | ) | (34,619,717 | ) | ||||||||||||
|
Total
Equity
|
(12,139,993 | ) | (6,132,698 | ) | (2,523,415 | ) | (354,288 | ) | (13,712,274 | ) | (34,862,668 | ) | ||||||||||||
|
Total
liabilities and equity
|
$ | (18,843,687 | ) | $ | ( 8,010,391 | ) | $ | (3,330,513 | ) | $ | (375,835 | ) | $ | (18,141,986 | ) | $ | ( 48,702,412 | ) | ||||||
|
Capital
expenditures
|
$ | 4,911,487 | $ | 776,080 | $ | 939,996 | $ | 7,549 | $ | 69,483 | $ | 6,704,595 | ||||||||||||
|
Goodwill
|
$ | - | $ | 668,614 | $ | - | $ | - | $ | - | $ | 668,614 | ||||||||||||
F-103
Ecopetrol
S.A. and Subsidiaries
Notes to
the Consolidated Financial Statements
Years
ended December 31, 2009, 2008 and 2007
As
of December 31, 2007
|
Exploration &
Production
|
Refining
|
Transportation
|
Market and
Supply
|
Corporate
|
Total
|
|||||||||||||||||||
|
Current
assets
|
||||||||||||||||||||||||
|
Cash
and cash equivalents
|
$ | 117,231 | $ | 503 | $ | 20,008 | $ | 1 | $ | 3,612,156 | $ | 3,749,899 | ||||||||||||
|
Accounts
and notes receivable
|
892,734 | 1,213,755 | 24,147 | 55 | 139,213 | 2,269,904 | ||||||||||||||||||
|
Inventories
|
514,294 | 782,594 | 1,417 | - | 486 | 1,298,791 | ||||||||||||||||||
|
Investments
|
- | - | - | - | 5,954,502 | 5,954,502 | ||||||||||||||||||
|
Other
current assets
|
1,387,466 | 426,403 | 107,142 | 698 | 579,317 | 2,501,026 | ||||||||||||||||||
| $ | 2,911,725 | 2,423,255 | 152,714 | 754 | 10,285,674 | 15,774,122 | ||||||||||||||||||
|
Investments
in unconsolidated companies
|
396,021 | 239,271 | 50,746 | 7,750 | 432,157 | 1,125,945 | ||||||||||||||||||
|
Property,
plant and equipment, net
|
7,887,869 | 1,941,755 | 1,203,771 | 14,105 | 233,368 | 11,280,868 | ||||||||||||||||||
|
FAEP
|
- | - | - | - | - | - | ||||||||||||||||||
|
Pension
Plan assets
|
- | - | - | - | 8,986,861 | 8,986,861 | ||||||||||||||||||
|
Other
non-current assets
|
3,805,094 | 2,603,033 | 737,494 | 46,619 | 3,752,044 | 10,944,284 | ||||||||||||||||||
|
Non
Current assets
|
12,088,984 | 4,784,059 | 1,992,011 | 68,474 | 13,404,430 | 32,337,958 | ||||||||||||||||||
|
Total
assets
|
$ | 15,000,709 | $ | 7,207,314 | $ | 2,144,725 | $ | 69,228 | $ | 23,690,104 | $ | 48,112,080 | ||||||||||||
|
Accounts
payable
|
(803,715 | ) | (530,031 | ) | (112,722 | ) | (15 | ) | (118,087 | ) | (1,564,570 | ) | ||||||||||||
|
Other
Current Liabilities
|
(2,546,871 | ) | (763,965 | ) | (355,851 | ) | (43,398 | ) | (791,129 | ) | (4,501,214 | ) | ||||||||||||
|
Current
Liabilities
|
$ | (3,350,586 | ) | (1,293,996 | ) | (468,573 | ) | (43,413 | ) | (909,216 | ) | (6,065,784 | ) | |||||||||||
|
Non-current
liabilities
|
(2,592,625 | ) | (383,365 | ) | (430,798 | ) | (33,565 | ) | (11,797,475 | ) | (15,237,828 | ) | ||||||||||||
|
Total
Liabilities
|
$ | (5,943,211 | ) | (1,677,361 | ) | (899,371 | ) | (76,978 | ) | (12,706,691 | ) | (21,303,612 | ) | |||||||||||
|
Shareholders’
equity of Ecopetrol
|
$ | (9,057,498 | ) | (5,529,953 | ) | (1,245,354 | ) | 7,750 | (10,983,413 | ) | (26,808,468 | ) | ||||||||||||
|
Total
Liabilities and equity
|
$ | (15,000,709 | ) | $ | (7,207,314 | ) | $ | (2,144,725 | ) | $ | (69,228 | ) | $ | (23,690,104 | ) | $ | (48,112,080 | ) | ||||||
|
Capital
expenditures
|
$ | 2,678,684 | $ | 234,462 | $ | 92,344 | $ | 7,712 | $ | 23,760 | $ | 3,036,962 | ||||||||||||
The
Company’s statement of net income by segment is as follows in accordance with
RCP:
Year
ended December 31, 2009
|
Exploration
&
Production
|
Refining
|
Transportation
|
Market and
Supply
|
Corporate
|
Eliminations
|
Total
|
||||||||||||||||||||||
|
Revenues:
|
||||||||||||||||||||||||||||
|
Local
sales
|
$ | 833,592 | $ | 11,834,414 | $ | 1,579,934 | $ | 4,203,178 | $ | 9,533 | $ | (4,402,117 | ) | $ | 14,058,534 | |||||||||||||
|
Foreign
sales, net
|
7,637,794 | 4,136,988 | - | 4,559,317 | 11,757 | - | 16,345,856 | |||||||||||||||||||||
|
Inter-segment
net operating revenues
|
8,910,816 | 1,328,066 | 1,336,699 | 170,637 | - | (11,746,218 | ) | - | ||||||||||||||||||||
|
Total
Revenue
|
17,382,202 | 17,299,468 | 2,916,633 | 8,933,132 | 21,290 | (16,148,335 | ) | 30,404,390 | ||||||||||||||||||||
|
Cost
of sales
|
5,933,870 | 17,034,428 | 1,454,660 | 8,143,415 | 46,929 | (15,647,927 | ) | 16,965,375 | ||||||||||||||||||||
|
Depreciation,
depletion and amortization
|
1,868,371 | 418,341 | 641,154 | - | 12,832 | - | 2,940,698 | |||||||||||||||||||||
|
Selling
|
1,409,026 | 188,119 | 52,707 | 605,414 | 82,920 | (375,544 | ) | 1,962,642 | ||||||||||||||||||||
|
Administration
expenses
|
253,167 | 202,349 | 156,481 | 51,117 | 761 | (1,539 | ) | 662,336 | ||||||||||||||||||||
|
Costs
and expenses
|
9,464,434 | 17,843,237 | 2,305,002 | 8,799,946 | 143,442 | (16,025,010 | ) | 22,531,051 | ||||||||||||||||||||
|
Operating
income
|
7,917,768 | (543,769 | ) | 611,631 | 133,186 | (122,152 | ) | (123,325 | ) | 7,873,339 | ||||||||||||||||||
|
Financial
income (expenses), net
|
221,444 | (73,909 | ) | (66,610 | ) | 58,065 | 356,843 | - | 495,833 | |||||||||||||||||||
|
Pension
expenses
|
- | - | (4,414 | ) | - | (590,743 | ) | - | (595,157 | ) | ||||||||||||||||||
|
Other
non-operating income (expenses)
|
(100,716 | ) | (60,559 | ) | (130,607 | ) | (10,205 | ) | (219,545 | ) | (1,539 | ) | (523,171 | ) | ||||||||||||||
|
Other
expenses, net
|
120,728 | (134,468 | ) | (201,631 | ) | 47,860 | (453,445 | ) | (1,539 | ) | (622,495 | ) | ||||||||||||||||
|
Income
before income taxes and non-controlling interest
|
8,038,496 | (678,237 | ) | 410,000 | 181,046 | (575,597 | ) | (124,864 | ) | 7,250,844 | ||||||||||||||||||
|
Income
tax benefits (expense)
|
(2,239,098 | ) | 158,400 | (127,082 | ) | (48,966 | ) | 142,717 | - | (2,114,029 | ) | |||||||||||||||||
|
Net
income
|
5,799,398 | (519,837 | ) | 282,918 | 132,080 | (432,880 | ) | (124,864 | ) | 5,136,815 | ||||||||||||||||||
|
Less:
Net loss (income) attributable to Non-controlling
|
(39,270 | ) | 31,272 | 3,237 | - | - | - | (4,761 | ) | |||||||||||||||||||
|
Net
income for the year attributable to Ecopetrol S.A.
|
$ | 5,760,128 | $ | (488,565 | ) | $ | 286,155 | $ | 132,080 | $ | (432,880 | ) | $ | (124,864 | ) | $ | 5,132,054 | |||||||||||
F-104
Ecopetrol
S.A. and Subsidiaries
Notes to
the Consolidated Financial Statements
Years
ended December 31, 2009, 2008 and 2007
|
Year ended December 31, 2008
|
||||||||||||||||||||||||||||
|
Exploration &
Production
|
Refining
|
Transportation
|
Market and
Supply
|
Corporate
|
Eliminations
|
Total
|
||||||||||||||||||||||
|
Revenues:
|
||||||||||||||||||||||||||||
|
Local
sales
|
$ | 734,648 | $ | 14,847,890 | $ | 724,838 | $ | 5,283,230 | $ | 7,393 | $ | - | $ | 21,597,999 | ||||||||||||||
|
Foreign
sales, net
|
4,417,583 | 3,273,018 | - | 4,592,046 | 16,023 | - | 12,298,670 | |||||||||||||||||||||
|
Inter-segment
net operating revenues
|
13,134,513 | 922,252 | 1,092,465 | 167,144 | - | (15,316,374 | ) | - | ||||||||||||||||||||
|
Total
Revenue
|
18,286,744 | 19,043,160 | 1,817,303 | 10,042,420 | 23,416 | (15,316,374 | ) | 33,896,669 | ||||||||||||||||||||
|
Cost
of sales
|
4,032,496 | 18,063,118 | 1,105,176 | 9,146,456 | 5,462 | (15,316,374 | ) | 17,036,334 | ||||||||||||||||||||
|
Depreciation,
depletion and amortization
|
1,505,540 | 351,387 | 188,585 | - | 2,590 | - | 2,048,102 | |||||||||||||||||||||
|
Selling
|
949,457 | 214,408 | 10,840 | 521,685 | 76,384 | - | 1,772,774 | |||||||||||||||||||||
|
Administration
expenses
|
262,634 | 244,159 | 158,562 | 32,578 | (315,832 | ) | - | 382,101 | ||||||||||||||||||||
|
Costs
and expenses
|
6,750,127 | 18,873,072 | 1,463,163 | 9,700,719 | (231,396 | ) | - | 36,555,685 | ||||||||||||||||||||
|
Operating
income
|
11,536,617 | 170,088 | 354,140 | 341,701 | 254,812 | - | 12,657,358 | |||||||||||||||||||||
|
Financial
income (expenses), net
|
909,111 | 62,161 | (82,989 | ) | (106,054 | ) | 3,319,023 | - | 4,101,252 | |||||||||||||||||||
|
Pension
expenses
|
- | - | (6,204 | ) | - | (1,138,721 | ) | - | (1,144,925 | ) | ||||||||||||||||||
|
Other
non-operating income (expenses)
|
129,037 | 173,890 | 140,748 | 825 | (46,981 | ) | - | 397,519 | ||||||||||||||||||||
|
Other
expenses, net
|
1,038,148 | 236,051 | 51,555 | (105,229 | ) | 2,133,321 | - | 3,353,846 | ||||||||||||||||||||
|
Income
before income taxes and non-controlling interest
|
12,574,765 | 406,139 | 405,695 | 236,472 | 2,388,133 | - | 16,011,204 | |||||||||||||||||||||
|
Income
tax benefits (expense)
|
(3,436,850 | ) | (125,797 | ) | (110,596 | ) | (64,629 | ) | (644,110 | ) | - | (4,381,982 | ) | |||||||||||||||
|
Net
income
|
9,137,915 | 280,342 | 295,099 | 171,843 | 1,744,023 | 11,629,222 | ||||||||||||||||||||||
|
Less:
Net loss (income) attributable to Non-controlling
|
- | - | 455 | - | - | - | 455 | |||||||||||||||||||||
|
Net
income for the year attributable to Ecopetrol S.A.
|
$ | 9,137,915 | $ | 280,342 | $ | 295,554 | $ | 171,843 | $ | 1,744,023 | $ | - | $ | 11,629,677 | ||||||||||||||
|
Year ended December 31, 2007
|
||||||||||||||||||||||||||||
|
Exploration &
Production
|
Refining
|
Transportation
|
Market and
Supply
|
Corporate
|
Eliminations
|
Total
|
||||||||||||||||||||||
|
Revenues:
|
||||||||||||||||||||||||||||
|
Local
sales
|
$ | 529,729 | $ | 11,472,108 | $ | 677,938 | $ | 3,317,980 | $ | 5,242 | $ | - | $ | 16,002,997 | ||||||||||||||
|
Foreign
sales
|
1,102,850 | 2,156,388 | - | 3,373,323 | 13,259 | - | 6,645,820 | |||||||||||||||||||||
|
FAEP
|
- | - | - | (316,497 | ) | - | - | (316,497 | ) | |||||||||||||||||||
|
Foreign
sales, net
|
1,102,850 | 2,156,388 | - | 3,056,826 | 13,259 | - | 6,329,323 | |||||||||||||||||||||
|
Inter-segment
net operating revenues
|
9,996,500 | 553,640 | 766,151 | 189,154 | - | (11,505,445 | ) | - | ||||||||||||||||||||
|
Total
Revenue
|
11,629,079 | 14,182,136 | 1,444,089 | 6,563,960 | 18,501 | (11,505,445 | ) | 22,332,320 | ||||||||||||||||||||
|
Cost
of sales
|
3,459,322 | 12,092,084 | 790,255 | 5,496,151 | 5,182 | (11,505,445 | ) | 10,337,549 | ||||||||||||||||||||
|
Depreciation,
depletion and amortization
|
1,173,006 | 356,215 | 191,541 | - | 216 | - | 1,720,978 | |||||||||||||||||||||
|
Selling
|
458,026 | 148,283 | 102,004 | 380,842 | 76,254 | - | 1,165,409 | |||||||||||||||||||||
|
Administration
expenses
|
113,420 | 103,657 | 74,057 | 30,910 | - | - | 322,044 | |||||||||||||||||||||
|
Costs
and expenses
|
5,203,774 | 12,700,239 | 1,157,857 | 5,907,903 | 81,652 | (11,505,445 | ) | 13,545,980 | ||||||||||||||||||||
|
Operating
income
|
6,425,305 | 1,481,897 | 286,232 | 656,057 | (63,151 | ) | - | 8,786,340 | ||||||||||||||||||||
|
Financial
income (expenses), net
|
(45,989 | ) | (25,260 | ) | (16,284 | ) | (47,440 | ) | 228,601 | - | 93,628 | |||||||||||||||||
|
Pension
expenses
|
- | - | (5,660 | ) | - | (1,084,683 | ) | - | (1,090,343 | ) | ||||||||||||||||||
|
Other
non-operating income (expenses)
|
(289,114 | ) | (533,901 | ) | (109,076 | ) | 10,742 | 197,028 | - | (724,321 | ) | |||||||||||||||||
|
Other
expenses, net
|
(335,103 | ) | (559,161 | ) | (131,020 | ) | (36,698 | ) | (659,054 | ) | - | (1,721,036 | ) | |||||||||||||||
|
Income
before income taxes and non-controlling interest
|
6,090,202 | 922,736 | 155,212 | 619,359 | (722,205 | ) | - | 7,065,304 | ||||||||||||||||||||
|
Income
tax benefits (expense)
|
(1,625,288 | ) | (246,250 | ) | (41,421 | ) | (165,288 | ) | 192,735 | - | (1,885,512 | ) | ||||||||||||||||
|
Net
income for the year
|
$ | 4,464,914 | $ | 676,486 | $ | 113,791 | $ | 454,071 | $ | (529,470 | ) | $ | - | $ | 5,179,792 | |||||||||||||
The
following tables illustrate sales by geographic zones:
F-105
Ecopetrol
S.A. and Subsidiaries
Notes to
the Consolidated Financial Statements
Years
ended December 31, 2009, 2008 and 2007
|
Sales
by Geographic Zones December 31, 2009
|
||||||||||
|
Zone
|
Products
|
Value
|
Participation
|
|||||||
|
Colombia*
|
Crude
oil, Refined, Petrochemicals and natural gas
|
$ | 14,134,884 | 46.5 | % | |||||
|
United
States of America
|
Crude
oil, Refined and Petrochemicals
|
10,875,221 | 35.8 | % | ||||||
|
Asia
|
Crude
oil, Refined and Petrochemicals
|
1,431,302 | 4.7 |
%
|
||||||
|
South
America
|
Crude
oil, Refined, Petrochemicals and natural gas
|
561,221 | 1.8 | % | ||||||
|
Central
America and Caribbean
|
Crude
oil, Refined and Petrochemicals
|
1,473,225 | 4.8 | % | ||||||
|
Europe
|
Crude
oil, Refined and Petrochemicals
|
1,207,367 | 4.0 | % | ||||||
|
Other
|
Petrochemicals
|
721,170 | 2.4 | % | ||||||
| $ | 30,404,390 | 100.0 | % | |||||||
*
Includes
sales to free trade zone of $76,350
|
Sales
by Geographic Zones December 31, 2008
|
||||||||||
|
Zone
|
Products
|
Value
|
Participation
|
|||||||
|
Colombia
|
Crude
oil, Refined, Petrochemicals and natural gas
|
$ | 21,597,999 | 63.7 | % | |||||
|
United
States of America
|
Crude
oil, Refined and Petrochemicals
|
7,847,375 | 23.2 | % | ||||||
|
Asia
|
Crude
oil, Refined and Petrochemicals
|
1,516,946 | 4.5 | % | ||||||
|
South
America
|
Crude
oil, Refined, Petrochemicals and natural gas
|
1,024,709 | 3.0 | % | ||||||
|
Central
America and Caribbean
|
Crude
oil, Refined and Petrochemicals
|
1,188,904 | 3.5 | % | ||||||
|
Europe
|
Crude
oil, Refined and Petrochemicals
|
605,655 | 1.8 | % | ||||||
|
Other
|
Petrochemicals
|
115,081 | 0.3 | % | ||||||
| $ | 33,896,669 | 100.0 | % | |||||||
|
Sales
by Geographic Zones December 31, 2007
|
||||||||||
|
Zone
|
Products
|
Value
|
Participation
|
|||||||
|
Colombia
|
Refined
and Petrochemicals
|
$ | 16,002,997 | 71.6 | % | |||||
|
United
States of America
|
Crude
oil and Refined
|
4,531,885 | 20.3 | % | ||||||
|
Central
America and Caribbean
|
Crude
oil and Refined
|
1,109,504 | 5.0 | % | ||||||
|
Europe
|
Crude
oil and Refined
|
673,948 | 3.0 | % | ||||||
|
Rest
of world
|
Crude
oil and Refined
|
13,986 | 0.1 | % | ||||||
| $ | 22,332,320 | 100.0 | % | |||||||
The
following tables illustrate sales of products by Segment:
|
Sales
of products by Segment for the year ended December 31,
2009
|
||||||||||||||||||||||||||||
|
Local
Sales
|
Exploration
&
Production
|
Refining
|
Transportation
|
Market
and
Supply
|
Corporate
|
Eliminations
|
Total
|
|||||||||||||||||||||
|
Medium
distillates
|
$ | 9,571 | $ | 5,087,896 | $ | - | $ | - | $ | - | $ | - | $ | 5,097,467 | ||||||||||||||
|
Gasolines
|
- | 5,015,900 | - | - | - | - | 5,015,900 | |||||||||||||||||||||
|
Crude
Oil
|
- | - | - | 3,636,242 | - | (3,618,048 | ) | 18,194 | ||||||||||||||||||||
|
Other
products
|
194,460 | 456,907 | - | - | - | (75,077 | ) | 576,290 | ||||||||||||||||||||
|
Services
|
61,868 | 56,521 | 1,579,934 | 80,726 | 9,533 | (675,507 | ) | 1,113,075 | ||||||||||||||||||||
|
Natural
Gas
|
547,792 | - | - | 486,210 | - | (33,485 | ) | 1,000,517 | ||||||||||||||||||||
|
L.P.G.
|
19,901 | 449,650 | - | - | - | - | 469,551 | |||||||||||||||||||||
|
Diesel
and gasoline price differentials
|
- | 196,533 | - | - | - | - | 196,533 | |||||||||||||||||||||
|
Plastic
and rubber
|
- | 571,007 | - | - | - | - | 571,007 | |||||||||||||||||||||
|
Total
local sales
|
$ | 833,592 | $ | 11,834,414 | $ | 1,579,934 | $ | 4,203,178 | $ | 9,533 | $ | (4,402,117 | ) | $ | 14,058,534 | |||||||||||||
F-106
Ecopetrol
S.A. and Subsidiaries
Notes to
the Consolidated Financial Statements
Years
ended December 31, 2009, 2008 and 2007
|
Sales of products by Segment for the year ended December 31, 2009
|
||||||||||||||||||||||||||||
|
Foreign Sales
|
Exploration &
Production
|
Refining
|
Transportation
|
Market and
Supply
|
Corporate
|
Eliminations
|
Total
|
|||||||||||||||||||||
|
Crude
oil
|
$ | 7,329,974 | $ | - | $ | - | $ | 4,485,538 | $ | - | $ | - | $ | 11,815,512 | ||||||||||||||
|
Fuel
oil
|
- | 1,660,911 | - | - | - | 1,660,911 | ||||||||||||||||||||||
|
Gasoline
|
- | 1,654,670 | - | 69,865 | - | 1,724,535 | ||||||||||||||||||||||
|
Natural
Gas
|
307,820 | - | - | 3,914 | - | 311,734 | ||||||||||||||||||||||
|
Plastic
and rubber
|
- | 544,912 | - | - | - | 544,912 | ||||||||||||||||||||||
|
Other
products
|
- | 276,495 | - | - | 11,757 | 288,252 | ||||||||||||||||||||||
|
Total
foreign sales
|
$ | 7,637,794 | $ | 4,136,988 | $ | - | $ | 4,559,317 | $ | 11,757 | $ | - | $ | 16,345,856 | ||||||||||||||
|
Sales of products by Segment for the year ended December 31, 2008
|
||||||||||||||||||||||||
|
Local Sales
|
Exploration &
Production
|
Refining
|
Transportation
|
Market and
Supply
|
Corporate
|
Total
|
||||||||||||||||||
|
Medium
distillates
|
$ | 11,032 | $ | 5,903,595 | $ | - | $ | - | $ | - | $ | 5,914,627 | ||||||||||||
|
Gasoline
|
41 | 3,644,304 | - | - | - | 3,644,345 | ||||||||||||||||||
|
Crude
Oil
|
- | - | - | 4,774,401 | - | 4,774,401 | ||||||||||||||||||
|
Other
products
|
179,577 | 1,196,214 | - | - | - | 1,375,791 | ||||||||||||||||||
|
Services
|
55,806 | 61,612 | 724,838 | 72,003 | 7,393 | 921,652 | ||||||||||||||||||
|
Natural
Gas
|
464,588 | - | - | 436,826 | - | 901,414 | ||||||||||||||||||
|
L.P.G.
|
19,901 | 592,870 | - | - | - | 612,771 | ||||||||||||||||||
|
Diesel
and gasoline price differential
|
3,703 | 3,066,776 | - | - | - | 3,070,479 | ||||||||||||||||||
|
Plastic
and rubber
|
- | 382,519 | - | - | - | 382,519 | ||||||||||||||||||
|
Total
local sales
|
$ | 734,648 | $ | 14,847,890 | $ | 724,838 | $ | 5,283,230 | $ | 7,393 | $ | 21,597,999 | ||||||||||||
|
Sales of products by Segment for the year ended December 31, 2008
|
||||||||||||||||||||||||
|
Foreign Sales
|
Exploration &
Production
|
Refining
|
Transportation
|
Market and
Supply
|
Corporate
|
Total
|
||||||||||||||||||
|
Crude
oil
|
$ | 4,107,194 | $ | - | $ | - | $ | 4,589,088 | $ | - | $ | 8,696,282 | ||||||||||||
|
Fuel
oil
|
- | 2,093,012 | - | - | - | 2,093,012 | ||||||||||||||||||
|
Gasoline
|
- | 186,197 | - | - | - | 186,197 | ||||||||||||||||||
|
Naphtha
|
- | 2,693 | - | - | - | 2,693 | ||||||||||||||||||
|
Jet
fuel
|
- | - | - | - | - | - | ||||||||||||||||||
|
Natural
Gas
|
310,389 | - | - | 2,958 | - | 313,347 | ||||||||||||||||||
|
Plastic
and rubber
|
- | 704,034 | - | - | - | 704,034 | ||||||||||||||||||
|
Other
products
|
- | 287,082 | - | - | 16,023 | 303,105 | ||||||||||||||||||
|
Total
foreign sales
|
$ | 4,417,583 | $ | 3,273,018 | $ | - | $ | 4,592,046 | $ | 16,023 | $ | 12,298,670 | ||||||||||||
F-107
Ecopetrol
S.A. and Subsidiaries
Notes to
the Consolidated Financial Statements
Years
ended December 31, 2009, 2008 and 2007
|
Sales of products by Segment for the year ended December 31, 2007
|
||||||||||||||||||||||||
|
Local Sales
|
Exploration
& Production
|
Refining
|
Transportation
|
Market and
Supply
|
Corporate
|
Total
|
||||||||||||||||||
|
Medium
distillates
|
$ | 18,997 | $ | 4,870,376 | $ | - | $ | - | $ | - | $ | 4,889,373 | ||||||||||||
|
Gasoline
|
748 | 3,345,612 | - | - | - | 3,346,360 | ||||||||||||||||||
|
Crude
Oil
|
- | - | - | 3,004,629 | - | 3,004,629 | ||||||||||||||||||
|
Other
products
|
53,186 | 845,279 | - | - | - | 898,465 | ||||||||||||||||||
|
Services
|
27,900 | 49,646 | 677,938 | 60,471 | 5,242 | 821,197 | ||||||||||||||||||
|
Natural
Gas
|
407,291 | - | - | 252,880 | - | 660,171 | ||||||||||||||||||
|
L.P.G.
|
18,649 | 586,103 | - | - | - | 604,752 | ||||||||||||||||||
|
Diesel
and gasoline price differential
|
2,958 | 1,775,092 | - | - | - | 1,778,050 | ||||||||||||||||||
|
Total
local sales
|
$ | 529,729 | $ | 11,472,108 | $ | 677,938 | $ | 3,317,980 | $ | 5,242 | $ | 16,002,997 | ||||||||||||
|
Sales of products by Segment for the year ended December 31, 2007
|
||||||||||||||||||||||||
|
Foreign Sales
|
Exploration &
Production
|
Refining
|
Transportation
|
Market and
Supply
|
Corporate
|
Total
|
||||||||||||||||||
|
Crude
oil
|
$ | 1,102,815 | $ | - | $ | - | $ | 3,373,322 | $ | - | $ | 4,476,137 | ||||||||||||
|
FAEP
|
- | - | - | (316,497 | ) | - | (316,497 | ) | ||||||||||||||||
|
Fuel
oil
|
- | 1,560,399 | - | - | - | 1,560,399 | ||||||||||||||||||
|
Gasoline
|
- | 269,248 | - | - | - | 269,248 | ||||||||||||||||||
|
Naphtha
|
- | 244,393 | - | - | - | 244,393 | ||||||||||||||||||
|
Jet
fuel
|
- | 71,378 | - | - | - | 71,378 | ||||||||||||||||||
|
Natural
Gas
|
35 | - | - | 1 | - | 36 | ||||||||||||||||||
|
Other
products
|
- | 10,970 | - | - | 13,259 | 24,229 | ||||||||||||||||||
|
Total
foreign sales
|
$ | 1,102,850 | $ | 2,156,388 | $ | - | $ | 3,056,826 | $ | 13,259 | $ | 6,329,323 | ||||||||||||
xxvii. RELATED
PARTIES
In
addition to the transactions disclosed in Note 15, Ecopetrol is controlled by
the Colombian Government which owns a majority stake in the Company. Thus
Ecopetrol has numerous transactions with other government entities as well as
state-owned companies in the ordinary course of its business. The most
significant of these transactions are disclosed below:
FAEP –
Ecopetrol was required to defer revenue into a stabilization fund by the
Colombian government. However, this process ended in 2007, at which time
Ecopetrol was required to remit all deferred revenue to the government. For more
information about this transaction, please see Note 33, ix. revenue
recognition.
Price
differentials – The Colombian government regulates the price at which refiners
sell refined products to distributors located in Colombia. For each unit sold,
the price received, for which revenue was recorded, was the regulated price
which was less than what the Company could have received had it sold those
products to customers located outside Colombia at market prices. The amount of
price differential included in revenue in 2009, 2008 and 2007 were ($196,533),
$3,070,479 and $1,778,050, respectively. Additionally, in 2009 and 2008 the
Company recognized interests amounting to $235,704 and $93,218, respectively,
which corresponds to the price differentials recorded. However, in
2007 the Company did not record any interest because the government did not
recognize interest of the debt.
F-108
Ecopetrol
S.A. and Subsidiaries
Notes to
the Consolidated Financial Statements
Years
ended December 31, 2009, 2008 and 2007
Contribution
of Nation in Kind – Decree 2625 of 2000 imposed contributions in kind
(hydrocarbons) of the Colombian Nation that were recognized as cost of
production until March 9, 2007.
Taxes –
Ecopetrol recognizes taxes to the Government and municipalities where it has
facilities. Taxes paid in 2009, 2008 and 2007 are disclosed in the cash flow
statement.
Purchases
of hydrocarbons from ANH – The Company purchases the physical product that the
ANH receives from all producers in Colombia at prices set forth in the Law 756
of 2002 and Resolution 18 1709 of 2003, which reference international prices.
For more information on this transaction please see Notes 1 and 24.
The
following table presents accounts receivable and payable with related parties as
of December 31, 2009 and 2008:
|
2009
|
2008
|
|||||||||||||||
|
Assets
|
Liabilities
|
Assets
|
Liabilities
|
|||||||||||||
|
Ministerio
de Hacienda y Crédito Público
|
$ | 1,015,691 | $ | 130,668 | $ | 1,503,458 | $ | 92,465 | ||||||||
|
Ministerio
de Minas y Energía
|
37,228 | - | 3,777,133 | - | ||||||||||||
|
U.A.E.
Agencia Nacional de Hidrocarburos
|
134,108 | 9,093 | 222,199 | 8 | ||||||||||||
|
E.S.P.
Empresa de Energía de Bogotá S.A.
|
503,217 | - | 169,611 | - | ||||||||||||
|
E.S.P.
Generadora de Energía del Caribe S.A.
|
54,337 | 23,735 | 65,978 | 14,179 | ||||||||||||
|
Interconexión
Eléctrica S.A.
|
766,969 | - | 71,537 | 127 | ||||||||||||
|
Entidades
Territoriales (Departamentos, Municipios)
|
17,438 | 7,399 | 37,915 | 7,824 | ||||||||||||
|
Empresas
Públicas de Medellín
|
33,038 | 62 | 15,169 | 129 | ||||||||||||
|
Isagen
S.A.
|
8,306 | 45 | 5,399 | 616 | ||||||||||||
|
E.S.P.
Transportadora de Gas del Interior S.A.
|
4,666 | - | 2,458 | 2,426 | ||||||||||||
|
Empresa
Colombiana de Gas
|
- | - | 2,193 | - | ||||||||||||
|
E.S.P.
Termoemcali S.A.
|
34,001 | - | 1,367 | 3,861 | ||||||||||||
|
E.S.P.
Gestión Energética S.A.
|
600 | - | 1,173 | 7 | ||||||||||||
|
Central
Hidroeléctrica de Caldas S.A. E.S.P
|
529 | - | 215 | 665 | ||||||||||||
|
Universidad
Industrial de Santander U.I.S.
|
18 | - | 3 | 244 | ||||||||||||
|
Dirección
de Impuestos y Aduanas Nacionales DIAN
|
11,961 | 73,328 | - | 791,021 | ||||||||||||
|
Others
|
484 | 3,855 | 906 | 6,082 | ||||||||||||
| $ | 2,622,591 | $ | 248,185 | $ | 5,876,714 | $ | 919,654 | |||||||||
Other
transactions with related parties during 2009, 2008 and 2007 are:
|
2009
|
2008
|
2007
|
||||||||||||||||||||||
|
Income
|
Expenses
|
Income
|
Expenses
|
Income
|
Expenses
|
|||||||||||||||||||
|
Ministerio
de Minas y Energía
|
$ | - | $ | - | $ | 3,870,348 | $ | - | $ | 1,778,050 | $ | - | ||||||||||||
|
Dirección
de Impuestos y Aduanas Nacionales DIAN
|
19 | 2,344,905 | - | 4,855,718 | - | 2,289,777 | ||||||||||||||||||
|
Entidades
Territoriales (Departamentos, Municipios)
|
15 | 121,396 | - | 133,346 | - | 148,785 | ||||||||||||||||||
|
Contraloría
General de la República
|
- | 33,106 | - | 25,811 | - | 25,934 | ||||||||||||||||||
|
Ministerio
de Defensa Nacional
|
- | 12,128 | - | 15,774 | - | 10,928 | ||||||||||||||||||
|
Ministerio
de Transporte
|
- | - | - | 13,922 | - | 22,572 | ||||||||||||||||||
|
Inversiones
de Gases de Colombia S.A. - Invercolsa
|
- | - | 9,231 | - | 9,219 | - | ||||||||||||||||||
|
Unidad
de Planeación Minero Energética
|
- | 2,308 | - | 2,206 | - | 2,885 | ||||||||||||||||||
|
Others
|
745 | 19,526 | 1,653 | 7,311 | 218 | 2,815 | ||||||||||||||||||
| $ | 779 | $ | 2,533,369 | $ | 3,881,232 | $ | 5,054,088 | $ | 1,787,487 | $ | 2,503,696 | |||||||||||||
F-109
Ecopetrol
S.A. and Subsidiaries
Notes to
the Consolidated Financial Statements
Years
ended December 31, 2009, 2008 and 2007
Material
Related Party Agreements
Set forth
below is a description of the Company's material related party
agreements:
Ecopetrol
entered into a supply agreement with Ecodiesel S.A. in 2007, a Company in which
it has a 50 % equity interest. This agreement is not yet operative and will
begin once the Ecodiesel plant starts its activities. Pursuant to the terms of
the agreement, Ecodiesel must deliver to Ecopetrol and Ecopetrol must purchase
at least 80% of Ecodiesel's monthly biodiesel production. Payments vary
depending on the purchased volumes of biodiesel produced. This agreement expires
on December 31, 2017.
In April
2002, Ecopetrol entered into a service agreement with Sociedad Colombiana de
Servicios Portuarios S.A. or Serviport, a Company in which the Company has a 49%
equity interest. Pursuant to the terms of the agreement, Serviport assists the
Company in its maritime operations in the Coveñas port in exchange for which the
Company pays Serviport approximately US$155,000 per month. This agreement is
renewable annually.
xxviii. FAIR
VALUE
Under
U.S. GAAP the fair value is the price that would be received to sell an asset or
paid to transfer a liability in an orderly transaction between market
participants at the measurement date. ASC 820 establishes a consistent framework
for measuring fair value and provides guidance regarding the disclosures for
each major category of assets and liabilities that are measured at fair value on
a recurring or nonrecurring basis. ASC 820 establishes a three-tier fair value
hierarchy, which prioritizes the inputs used in measuring fair value as
follows:
Level 1:
Observable inputs such as quoted prices in active markets.
Level 2:
Inputs, other than the quoted prices in active markets, that are observable
either directly or indirectly.
Level 3:
Unobservable inputs in which there is little or no market data, which require
the reporting entity to develop its own assumptions.
The
following table presents the assets and liabilities that are measured at fair
value on a recurring basis as of December 31, 2009 and 2008 under U.S.
GAAP:
|
2009
|
2008
|
|||||||||||||||||||
|
|
Fair
Value
|
Level
1
|
Level
2
|
Level
3
|
Fair
Value
|
|||||||||||||||
| Assets | ||||||||||||||||||||
|
Cash
and cash equivalents
|
$ | 3,861,532 | $ | 3,861,532 | $ | - | $ | - | $ | 4,812,595 | ||||||||||
|
Investment
securities
|
4,369,219 | 4,209,008 | 8,280 | 151,931 | 8,201,004 | |||||||||||||||
|
Derivatives
|
66,283 | - | 66,283 | - | - | |||||||||||||||
|
Accounts
Receivable
|
2,760,554 | - | 2,760,554 | - | 6,086,633 | |||||||||||||||
|
Liabilities
|
||||||||||||||||||||
|
Financial
Obligations
|
6,162,210 | - | 6,162,210 | - | 287,314 | |||||||||||||||
|
Accounts
Payable
|
3,820,251 | - | 3,820,251 | - | 2,113,923 | |||||||||||||||
|
Capital
lease
|
496,397 | - | 496,397 | - | 436,102 | |||||||||||||||
The
following methods and assumptions were used to estimate the fair value of each
category of assets and liabilities:
Cash and Cash Equivalents, Accounts
Payable: The carrying amount approximates fair value for short maturity
of these instruments.
F-110
Ecopetrol
S.A. and Subsidiaries
Notes to
the Consolidated Financial Statements
Years
ended December 31, 2009, 2008 and 2007
Investment Securities: The
fair value of debt securities (both available for sale and held to maturity
investments) and equity securities are based on quoted market prices at the
reporting date for those or similar investments.
Derivatives: The fair value is
determined as the present value of expected future cash flows discounted using
the rate U.S. Treasury Rate.
Accounts Receivable and Direct
Finance Lease: The fair value is determined as the present value of
expected future cash flows discounted using the rate provide by financial
institutions for savings and checking accounts in Colombia.
Financial Obligations: The
carrying amount approximates fair value under Subtopic
ASC820-10-15-3-B.
Capital Lease: The fair value
is determined as the present value of expected future payments discounted using
an interest rate for loans which is posted in the financial institutions in
Colombia.
The
following table presents the reconciliation for assets measured at fair value on
a recurring basis using significant unobservable inputs (Level 3) during the
period:
|
Fair Value Measurements Using Significant
Unobservable Inputs (Level 3)
|
||||
|
Investment
Securities
|
||||
|
Beginning
balance
|
$ | - | ||
|
Total
gains or losses (realized/unrealized)
|
- | |||
|
Included
in earnings
|
- | |||
|
Included
in other comprehensive income
|
- | |||
|
Purchases,
issuances, and settlements
|
- | |||
|
Transfers
in and/or out level 3
|
151,931 | |||
|
Ending
balance
|
151,931 | |||
|
The
amount of total gains or losses for the period included in earnings (or
changes in net assets) attributable to the change in unrealized gains or
losses relating to assets still held at the reporting date
|
- | |||
In
accordance with the provisions of the impairment of Long-Lived Assets Subtopic
360-10 long-lived assets held and used were written down to their fair value,
resulting in an impairment charge, which was included in earnings for the
period. The fair value is determined as the present value of expected future
cash flows discounted using the Ecopetrol’s WACC rate:
|
Description
|
2009
|
Level 1
|
Level 2
|
Level 3
|
Total Gains
(Losses)
|
|||||||||||||||
|
Long-lived
assets held and used
|
$ | 370,269 | $ | - | $ | - | $ | 370,269 | $ | 395,044 | ||||||||||
xxix. SUPPLEMENTAL
INFORMATION ON OIL AND GAS PRODUCING ACTIVITIES (UNAUDITED)
In
accordance with the requirements of the United States Securities and Exchange
Commission (SEC), Accounting Standards Codification 932 and the updated 2010-03
“Oil and Gas reserve Estimation and Disclosures” Rule, this section provides
supplemental information on oil and gas exploration and producing activities of
the Company. The information included in items (i) through (iii) provides
historical cost information pertaining to costs incurred in exploration,
property acquisitions and development, capitalized costs and results of
operations. The information included in items (iv) and (v) presents information
on Ecopetrol’s estimated net proved reserve quantities, standardized measure of
estimated discounted future net cash flows related to proved reserves, and
changes in estimated discounted future net cash flows.
F-111
Ecopetrol
S.A. and Subsidiaries
Notes to
the Consolidated Financial Statements
Years
ended December 31, 2009, 2008 and 2007
The
following information corresponds to Ecopetrol’s oil and gas producing
activities at December 31 of 2009, 2008, and 2007 in direct and joint
operations.
Under the
new SEC final rule optional disclosure of possible and probable reserves is
allowed, but the company opted not to do so.
Ecopetrol
estimated its reserves without considering non-traditional
resources.
Table
i – Capitalized costs relating to oil and gas producing
activities
|
2009
|
2008
|
2007
|
||||||||||
|
Natural
and environmental properties – proved properties (1)
|
$ | 12,188,806 | $ | 8,657,429 | $ | 7,026,558 | ||||||
|
Wells,
equipment and facilities – property, plant and equipment
|
5,359,419 | 4,112,318 | 3,899,238 | |||||||||
|
Construction
in progress
|
2,321,427 | 1,828,945 | 1,108,023 | |||||||||
|
Accumulated
depreciation, depletion and amortization
|
(9,883,704 | ) | (7,637,750 | ) | (6,460,233 | ) | ||||||
|
Net
capitalized costs
|
$ | 9,985,948 | $ | 6,960,942 | $ | 5,573,586 | ||||||
|
(1)
|
In
accordance with ASC 410-20, Asset Retirement Obligations, during 2009,
2008 and 2007 an additional $6,131, $25,902 and $60,864 was added,
respectively, to the cost basis of oil and gas wells for wells
drilled.
|
The
Company does not capitalize general and administrative expenses within
exploration and production activities.
Table
ii – Costs incurred in oil and gas exploration property acquisitions and
development activities
Costs
incurred are summarized below and include both amounts expensed and capitalized
in the corresponding period.
|
2009
|
2008
|
2007
|
||||||||||
|
Acquisition
of Proved Properties (1)
|
$ | 2,879,233 | $ | 1,049,402 | $ | - | ||||||
|
Exploration
costs
|
1,273,486 | 941,369 | 497,737 | |||||||||
|
Development
costs
|
4,098,822 | 2,808,888 | 2,163,444 | |||||||||
|
Total
costs incurred
|
$ | 8,251,541 | $ | 4,799,659 | $ | 2,661,181 | ||||||
|
(1)
|
Includes
wells, equipment and facilities associated with Hocol S.A. and
OIG.
|
Table
iii - Results of operations for oil and gas producing activities
|
2009
|
2008
|
2007
|
||||||||||
|
Net
revenues
|
||||||||||||
|
Sales
|
$ | 8,724,917 | $ | 5,152,231 | $ | 1,632,579 | ||||||
|
Transfers
(1)
|
8,910,816 | 13,134,513 | 9,996,500 | |||||||||
|
Total
|
17,635,733 | 18,286,744 | 11,629,079 | |||||||||
|
Production
cost (2)
|
6,493,549 | 4,500,054 | 3,761,656 | |||||||||
|
Depreciation,
depletion and amortization (3)
|
1,123,633 | 775,852 | 545,188 | |||||||||
|
Exploration
expenses (4)
|
1,321,927 | 852,697 | 394,712 | |||||||||
|
Total
|
8,939,109 | 6,128,603 | 4,701,556 | |||||||||
|
Income
before income tax
|
8,696,624 | 12,158,141 | 6,927,523 | |||||||||
|
Income
Tax expense
|
(2,869,886 | ) | (4,012,187 | ) | (2,355,358 | ) | ||||||
|
Results
of operations for producing activities
|
$ | 5,826,738 | $ | 8,145,954 | $ | 4,572,165 | ||||||
F-112
Ecopetrol
S.A. and Subsidiaries
Notes to
the Consolidated Financial Statements
Years
ended December 31, 2009, 2008 and 2007
|
(1)
|
The
Company transferred approximately 51%, 26% and 44% of its crude oil and
gas production; (percentages are based on the sales value in Colombian
pesos) to inter-company business units in 2009, 2008 and 2007,
respectively. Using volumes, those transfers were 35%, 40% and 44%,
respectively, in 2009, 2008 and 2007. The inter-company transfers were
recorded at values equal to the Company’s market
prices.
|
|
(2)
|
Production
costs are lifting costs incurred to operate and maintain productive wells
and related equipment and facilities, including such costs as operating
labor, materials, supplies, and fuel consumed in operations and the costs
of operating natural gas liquids plants. Production costs also include
administrative expenses and depreciation and amortization of equipment
associated with production
activities.
|
|
(3)
|
In
accordance with ASC 410-20, the combined depletion and accretion expense
related to asset retirement obligations that were recognized during 2009,
2008 and 2007 in depreciation, depletion and amortization expense was
approximately ($33,895), $195,191 and $18,392
respectively. The Company’s results of operations from oil and
gas producing activities for the years ending December 31, 2009, 2008
and 2007 are shown above.
|
|
(4)
|
Exploration
expenses include the costs of geological and geophysical activities and
non-productive exploratory wells. Depreciation and amortization expenses
relate to assets employed in development activities. In accordance with
ASU 2010-03, income taxes are based on statutory tax
rates.
|
Table
iv – Reserve information
The
reserve information presented in this section is based on the definitions and
rules used for U.S. GAAP purposes. The estimates for proved oil and gas reserves
used in the preparation of the consolidated financial statements were prepared
by Ecopetrol’s engineers and approved by the Company’s reserves
committee. Our hydrocarbon net proved reserves have been audited in
2009 by Gaffney, Cline & Associates and Ryder Scott, Degolyer and
Macnaughton.
Information
concerning the technical definitions used for the estimated proved reserves is
included in this annual report. The information provided in this annual report
about our 2009 net proved reserves is based on the 2009 audited reserve reports
for 97% of our total reserves prepared by experts under the SEC definitions and
rules. The remaining 3% corresponds to calculations made by us internally using
SEC definitions and rules. Our 2009 crude oil and natural gas net proved
reserves include reserves from our first international production asset located
in the Gulf of Mexico, Perú and Hocol’s assets in Colombia.
Such
estimates are in accordance with guidelines established by the SEC and the
Financial Accounting Standards Board, which require that reserve reports be
prepared under economic and operating conditions existing at the registrant’s
year end with no provision for price and cost escalations except by contractual
arrangements.
On
December 31, 2008, the SEC issued a final rule revising disclosure requirements
relating to oil and gas reserves as contained in Rule 4-10(a) of Regulation
S-X. Under the new SEC rule, reserves are required to be estimated by
applying (x) the unweighted arithmetic average of the first-day-of-the-month
price for each month within the year to (y) year-end quantities of proved
reserves (the “SEC average price methodology”). Prior to this
revision, the SEC required reserves to be estimated by applying (x) the year-end
WTI price to (y) year-end quantities of proved reserves (the “SEC year-end price
methodology”). The Company’s proved reserves as of December 31, 2009
are based on the SEC average price methodology for U.S. GAAP purposes, which
mirrors the average price methodology used by the Company in Colombia during
this period. The Company’s proved reserves as of December 31, 2008 are based on
the SEC year-end price methodology for purposes of U.S. GAAP which mirrors the
year-end price methodology used by the Company in Colombia during this
period. The use of the unweighted arithmetic average price of the
first day of each month within the year, had an upward effect on reserves
because the price was higher than the 2009 year-end prices applied under the
previous rule. However, the Company’s proved reserves as of December
31, 2007 are estimated using average prices methodology used by the Company and
under the SEC year-end price methodology for U.S. GAAP purposes. As a
result, the quantity of proved reserves for this period differs from the
estimated quantities of proved reserves in accordance with the SEC year-end
methodology.
F-113
Ecopetrol
S.A. and Subsidiaries
Notes to
the Consolidated Financial Statements
Years
ended December 31, 2009, 2008 and 2007
Future
development, abandonment and production costs were computed by estimating the
expenditures to be incurred in developing, producing, and abandoning proved oil
and gas reserves at the end of the year, based on year-end costs. Future income
taxes were computed by applying statutory tax rates to the estimated net pre-tax
cash flows after consideration of tax basis and tax credits and carry forwards.
Discounted future net cash flows are calculated using 10% mid period discount
factors. This discounting requires a year-by-year estimate of when the future
expenditures will be incurred and when the reserves will be produced. Most of
the Company’s activities and reserves are located in Colombia.
The
information provided does not represent management’s estimate of the Company’s
expected future cash flows or value of proved oil and gas reserves. Estimates of
proved reserve quantities involve uncertainty and change over time as new
information becomes available.
The
arbitrary valuation methodology prescribed under ASU 2010-03 requires
assumptions as to the timing and amount of future development and production
costs. The calculations are made as of December 31 each year and should not be
relied upon as an indication of the Company’s future cash flows or the value of
its oil and gas reserves.
Proved
oil and gas reserves are those quantities of oil and gas, which, by analysis of
geosciences and engineering data, can be estimated with reasonable certainty to
be economically producible – from a given date forward, from known reservoirs,
and under existing economic conditions, operating methods, and government
regulations – prior to the time at which contracts providing the right to
operate expire, unless evidence indicates that renewal is reasonably certain,
regardless of whether the estimate is a deterministic estimate or probabilistic
estimate.
The
project to extract the hydrocarbons must have commenced or the operator must be
reasonably certain that it will commence the project within a reasonable
time.
The area
of the reservoir considered as proved includes all of the
following:
a. The
area identified by drilling and limited by fluid contacts, if any,
and
b.
Adjacent undrilled portions of the reservoir that can, with reasonable
certainty, be judged to be continuous with it and to contain economically
producible oil or gas on the basis of available geosciences and engineering
data.
In the
absence of data on fluid contacts, proved quantities in a reservoir are limited
by the lowest known hydrocarbons as seen in a well penetration unless
geoscience, engineering, or performance data and reliable technology establishes
a lower contact with reasonable certainty.
Ecopetrol
used deterministic methods that are commonly used internationally to estimate
reserves. These methods have some uncertainty in degradation, and thus, the
estimates should not be interpreted as being exact amounts. These
methods have some uncertainty in gradation, and thus, the estimates should not
be interpreted as being exact amounts.
However,
the technology used to estimate reserves is considered reliable.
According
to ASU 2010-03, proved developed oil and gas reserves are considered to be
proved when they can be expected to be recovered:
|
a)
|
Through
existing wells with existing equipment and operating methods or in which
the cost of the required equipment is relatively minor compared to the
cost of a new well.
|
|
b)
|
Through
installed extraction equipment and infrastructure operational at the time
of the reserves estimate if the extraction is by means not involving a
well.
|
Estimates
of reserves were prepared by geological and engineering methods commonly used in
the oil industry. The method or combination of methods used in the
analysis of each reserve was adopted from experience with similar reserves,
stage of development, quality and completeness of basic data and production
history.
F-114
Ecopetrol
S.A. and Subsidiaries
Notes to
the Consolidated Financial Statements
Years
ended December 31, 2009, 2008 and 2007
The
majority of the producing proved reserves were estimated by applying appropriate
decline curves or other performance relationships. In analyzing
decline curves, reserves were estimated by calculating economic limits that are
based on current economic conditions. In certain cases, where the
methods previously employed could not be used, reserves were estimated by
analogy with similar reserves where more complete data was
available.
The
Colombian Nation is the owner of all mineral interests located in Colombia. The
Company and, by extension of joint association contracts, its partners, are
given the right to explore, develop, produce and sell those reserves, but do not
own them. The reserve quantities and their standardized measure, presented in
the following tables, represent those reserves and their estimated value that
the Company has the right to extract and sell.
The table
below sets forth the Company’s total proved oil and gas reserves together with
their changes therein as of and for the years ended December 31, 2009, 2008 and
2007. The estimates (oil in million barrels, gas in billion cf, gas converted to
million barrels at 5.615 billion cf per million barrels) using the SEC rules in
effect for each respective year. However, as stated previously, the
estimate of reserves at December 31, 2007 was prepared using average prices for
2007 which, differs from the SEC year-end price methodology in effect for
2007.
In 2009,
the Company acquired 100% of Hocol and 50% of Offshore International Group,
which is the owner of Petro-tech Peruana (Savia). These companies
increased the Company ’s total reserves of oil and gas by 3.2% and 2.2%,
respectively. The Company did not consider these additional reserves as
significant to be disclosed separately.
|
2009</di
v>
|
|
2008
|
2007
|
|||||||||||||||||||||||||||||||||
|
Oil
|
Gas
|
Total
|
Oil
|
Gas
|
Total
|
Oil
|
Gas
|
Total
|
||||||||||||||||||||||||||||
|
million
barrels
|
billion
cf
|
million
boe
|
million
barrels
|
billion
cf
|
million
boe
|
million
barrels
|
billion
cf
|
million
boe
|
||||||||||||||||||||||||||||
|
Proved
Reserves:
|
||||||||||||||||||||||||||||||||||||
|
Beginning
of year
|
798.9 | 1,898.9 | 1,137.0 | 857.4 | 1,979.6 | 1,209.9 | 921.2 | 1,860.4 | 1,252.5 | |||||||||||||||||||||||||||
|
Revisions
(1)
|
319.0 | 548.5 | 416.7 | 44.2 | 54.5 | 53.9 | 25.9 | 74.0 | 39.0 | |||||||||||||||||||||||||||
|
Extensions
and discoveries (2)
|
137.3 | 38.6 | 144.2 | 8.3 | 0.8 | 8.4 | 9.8 | 164.1 | 39.0 | |||||||||||||||||||||||||||
|
Production
|
(131.9 | ) | (156.6 | ) | (159.7 | ) | (111.0 | ) | (136.0 | ) | (135.2 | ) | (99.6 | ) | (118.8 | ) | (120.7 | ) | ||||||||||||||||||
|
End
of year
|
1,123.3 | 2,329.4 | 1,538.2 | 798.9 | 1,898.9 | 1,137.0 | 857.4 | 1,979.6 | 1,209.9 | |||||||||||||||||||||||||||
|
Proved
developed reserves:
|
||||||||||||||||||||||||||||||||||||
|
Beginning
of year
|
518.4 | 720.6 | 646.7 | 651.3 | 1,210.5 | 866.9 | 610.7 | 995.4 | 788.0 | |||||||||||||||||||||||||||
|
End
of year
|
630.5 | 1,732.6 | 939.1 | 518.4 | 720.6 | 646.7 | 651.3 | 1,210.5 | 866.9 | |||||||||||||||||||||||||||
|
Proved
undeveloped reserves: (3)
|
||||||||||||||||||||||||||||||||||||
|
Beginning
of year
|
280.5 | 1,178.3 | 490.3 | 206.1 | 769.1 | 343.0 | 310.5 | 865.0 | 464.5 | |||||||||||||||||||||||||||
|
End
of year
|
492.8 | 596.9 | 599.1 | 280.5 | 1,178.3 | 490.3 | 206.1 | 769.1 | 343.0 | |||||||||||||||||||||||||||
|
(1)
|
The
variation in the revisions of new projects in existing fields was 256
mboe, mainly in fields Rubiales (110mboe), Castilla (44 mboe), Chichimene
(32 mboe) and Pauto (15 mboe). New projects in these fields correspond to
78% of all projects.
|
Additionally,
Ecopetrol reclassified (unproved reserves to proved reserves) 211 mboe, mainly
from Cusiana (69 mboe), Pauto (60 mboe), Chichimene (43 mboe), Castilla (30
mboe), that corresponds to 96% of total reclassifications.
In 2009,
the economic limit reduced proved reserves by 62 mboe.
|
(2)
|
The
increase in extension and discoveries of reserves is mainly due to the
inclusion of Petro-tech (Savia), Hocol and K2. Ecopetrol introduced new
reserves by 49 mboe.
|
|
(3)
|
During
2009, our total proved undeveloped reserves increased by 108.8 mboe to
599.2 mboe at December 31, 2009 from 490.4 mboe at December 31,
2008. At December 31, 2009, 82% of our total proved undeveloped
reserves corresponded to crude
oil.
|
F-115
Ecopetrol
S.A. and Subsidiaries
Notes to
the Consolidated Financial Statements
Years
ended December 31, 2009, 2008 and 2007
This note
to the Ecopetrol’s consolidated financial statements presents the Company’s
total proved oil and gas reserves together with the changes therein as of and
for the year end December 31, 2009, 2008 and 2007. The estimate of reserves at
December 31, 2007 was prepared under Ecopetrol’s policy, using average prices
for 2007, which is acceptable in Colombia, but differs from U.S. GAAP, which
requires that reserves be calculated using year-end prices. As a result, the
quantity of estimated proved reserves under Ecopetrol’s 2007 policy differed
from the estimated quantities of proved reserves in accordance with U.S. GAAP
and SEC Rule 4-10 of Regulation S-X. The following table presents the difference
in total proved reserves at December 31, 2007:
|
Quantities under
Ecopetrol’s Policy
|
Quantities under
U.S. GAAP
|
Difference
|
||||||||||
|
Oil,
million of barrels
|
833.2 | 857.4 | (24.2 | ) | ||||||||
|
Gas,
billion cf
|
1,919.6 | 1,979.6 | (60.0 | ) | ||||||||
|
Total,
million boe
|
1,175.1 | 1,209.9 | (34.8 | ) | ||||||||
Table
v – Standardized measure of discounted future net cash flows relating to proved
oil and gas quantities and changes therein
The
standardized measure of discounted future net cash flows, related to the above
proved crude oil and natural gas reserves, is calculated in accordance with the
requirements of ASU 2010-03. Estimated future cash inflows from production under
U.S. GAAP are computed by applying unweighted arithmetic average of the
first-day-of-the-month for oil and gas price to year-end quantities of estimated
net proved reserves.
|
2009
|
2008
|
2007
|
||||||||||
|
Future
cash inflows
|
$ | 137,518,875 | $ | 91,719,056 | $ | 156,132,956 | ||||||
|
Future
costs
|
||||||||||||
|
Production
|
(36,994,366 | ) | (30,923,136 | ) | (49,909,724 | ) | ||||||
|
Development
|
(14,245,475 | ) | (9,185,049 | ) | (4,483,284 | ) | ||||||
|
Income
Taxes
|
(27,574,537 | ) | (18,409,888 | ) | (30,561,458 | ) | ||||||
|
Abandonment
costs
|
(1,430,847 | ) | (645,382 | ) | (1,350,144 | ) | ||||||
|
Future
net cash flow
|
57,273,650 | 32,555,601 | 69,828,346 | |||||||||
|
10%
discount factor
|
(21,813,763 | ) | (13,897,290 | ) | (27,309,680 | ) | ||||||
|
Standardized
measure of discounted net cash flows
|
$ | 35,459,887 | $ | 18,658,311 | $ | 42,518,666 | ||||||
The
following are the principal sources of change in the standardized measure of
discounted net cash flows:
|
2009
|
2008
|
2007
|
||||||||||
|
Net
change in sales and transfer prices and in production (lifting)
cost related to future production
|
$ | 10,994,821 | $ | (21,567,415 | ) | $ | 25,567,846 | |||||
|
Changes
in estimated future development costs
|
(5,847,900 | ) | (3,858,978 | ) | 1,369,555 | |||||||
|
Sales
and transfer of oil and gas produced during the period
|
(11,491,435 | ) | (13,543,509 | ) | (7,425,045 | ) | ||||||
|
Net
change due to extension discoveries
|
1,129,590 | 137,845 | 1,168,704 | |||||||||
|
Net
change due to revisions in quantity estimates
|
16,770,839 | 1,759,641 | 2,175,445 | |||||||||
|
Previously
estimated development costs incurred during the period
|
4,098,822 | 2,808,888 | 2,163,444 | |||||||||
|
Accretion
of discount
|
1,865,831 | 4,251,867 | 2,299,461 | |||||||||
|
Other
– unspecified
|
5,802,156 | (1,906,546 | ) | (2,150,112 | ) | |||||||
|
Net
change in income taxes
|
(6,521,148 | ) | 8,057,853 | (5,645,244 | ) | |||||||
|
Aggregate
change in the Standardized measure of discounted future net cash flows for
the year
|
$ | 16,801,576 | $ | (23,860,354 | ) | $ | 19,524,054 | |||||
F-116