000143710712/312020FYfalseP2Yus-gaap:AccountsPayableAndAccruedLiabilitiesCurrentus-gaap:AccountsPayableAndAccruedLiabilitiesCurrentus-gaap:OtherLiabilitiesNoncurrentus-gaap:OtherLiabilitiesNoncurrent2.5P5YP4YP3YP1Y0DP3Y0DP7Y0D00014371072020-01-012020-12-310001437107us-gaap:CommonClassAMember2020-01-012020-12-310001437107us-gaap:CommonClassBMember2020-01-012020-12-310001437107us-gaap:CommonClassCMember2020-01-012020-12-31iso4217:USD00014371072020-06-30xbrli:shares0001437107us-gaap:CommonClassAMember2021-02-080001437107us-gaap:CommonClassBMember2021-02-080001437107us-gaap:CommonClassCMember2021-02-0800014371072020-12-3100014371072019-12-31iso4217:USDxbrli:shares0001437107disca:SeriesA1PreferredStockMember2019-12-310001437107disca:SeriesA1PreferredStockMember2020-12-310001437107disca:SeriesC1PreferredStockMember2020-12-310001437107disca:SeriesC1PreferredStockMember2019-12-310001437107us-gaap:CommonClassAMember2020-12-310001437107us-gaap:CommonClassAMember2019-12-310001437107us-gaap:CommonClassBMember2019-12-310001437107us-gaap:CommonClassBMember2020-12-310001437107us-gaap:CommonClassCMember2019-12-310001437107us-gaap:CommonClassCMember2020-12-310001437107us-gaap:AdvertisingMember2020-01-012020-12-310001437107us-gaap:AdvertisingMember2019-01-012019-12-310001437107us-gaap:AdvertisingMember2018-01-012018-12-310001437107us-gaap:LicenseAndServiceMember2020-01-012020-12-310001437107us-gaap:LicenseAndServiceMember2019-01-012019-12-310001437107us-gaap:LicenseAndServiceMember2018-01-012018-12-310001437107us-gaap:ServiceOtherMember2020-01-012020-12-310001437107us-gaap:ServiceOtherMember2019-01-012019-12-310001437107us-gaap:ServiceOtherMember2018-01-012018-12-3100014371072019-01-012019-12-3100014371072018-01-012018-12-310001437107disca:SeriesABandCCommonStockMember2020-01-012020-12-310001437107disca:SeriesABandCCommonStockMember2019-01-012019-12-310001437107disca:SeriesABandCCommonStockMember2018-01-012018-12-3100014371072018-12-3100014371072017-12-310001437107us-gaap:PreferredStockMember2017-12-310001437107us-gaap:CommonStockMember2017-12-310001437107us-gaap:AdditionalPaidInCapitalMember2017-12-310001437107us-gaap:TreasuryStockMember2017-12-310001437107us-gaap:RetainedEarningsMember2017-12-310001437107us-gaap:AccumulatedOtherComprehensiveIncomeMember2017-12-310001437107us-gaap:ParentMember2017-12-310001437107us-gaap:NoncontrollingInterestMember2017-12-310001437107srt:CumulativeEffectPeriodOfAdoptionAdjustmentMemberus-gaap:RetainedEarningsMember2017-12-310001437107srt:CumulativeEffectPeriodOfAdoptionAdjustmentMemberus-gaap:AccumulatedOtherComprehensiveIncomeMember2017-12-310001437107srt:CumulativeEffectPeriodOfAdoptionAdjustmentMemberus-gaap:ParentMember2017-12-310001437107srt:CumulativeEffectPeriodOfAdoptionAdjustmentMember2017-12-310001437107us-gaap:RetainedEarningsMember2018-01-012018-12-310001437107us-gaap:ParentMember2018-01-012018-12-310001437107us-gaap:NoncontrollingInterestMember2018-01-012018-12-310001437107us-gaap:AccumulatedOtherComprehensiveIncomeMember2018-01-012018-12-310001437107us-gaap:AdditionalPaidInCapitalMember2018-01-012018-12-310001437107us-gaap:CommonStockMember2018-01-012018-12-310001437107us-gaap:PreferredStockMember2018-12-310001437107us-gaap:CommonStockMember2018-12-310001437107us-gaap:AdditionalPaidInCapitalMember2018-12-310001437107us-gaap:TreasuryStockMember2018-12-310001437107us-gaap:RetainedEarningsMember2018-12-310001437107us-gaap:AccumulatedOtherComprehensiveIncomeMember2018-12-310001437107us-gaap:ParentMember2018-12-310001437107us-gaap:NoncontrollingInterestMember2018-12-310001437107srt:CumulativeEffectPeriodOfAdoptionAdjustmentMemberus-gaap:RetainedEarningsMember2018-12-310001437107srt:CumulativeEffectPeriodOfAdoptionAdjustmentMemberus-gaap:AccumulatedOtherComprehensiveIncomeMember2018-12-310001437107srt:CumulativeEffectPeriodOfAdoptionAdjustmentMemberus-gaap:ParentMember2018-12-310001437107srt:CumulativeEffectPeriodOfAdoptionAdjustmentMember2018-12-310001437107us-gaap:RetainedEarningsMember2019-01-012019-12-310001437107us-gaap:ParentMember2019-01-012019-12-310001437107us-gaap:NoncontrollingInterestMember2019-01-012019-12-310001437107us-gaap:AccumulatedOtherComprehensiveIncomeMember2019-01-012019-12-310001437107us-gaap:PreferredStockMember2019-01-012019-12-310001437107us-gaap:CommonStockMember2019-01-012019-12-310001437107us-gaap:AdditionalPaidInCapitalMember2019-01-012019-12-310001437107us-gaap:TreasuryStockMember2019-01-012019-12-310001437107us-gaap:PreferredStockMember2019-12-310001437107us-gaap:CommonStockMember2019-12-310001437107us-gaap:AdditionalPaidInCapitalMember2019-12-310001437107us-gaap:TreasuryStockMember2019-12-310001437107us-gaap:RetainedEarningsMember2019-12-310001437107us-gaap:AccumulatedOtherComprehensiveIncomeMember2019-12-310001437107us-gaap:ParentMember2019-12-310001437107us-gaap:NoncontrollingInterestMember2019-12-310001437107srt:CumulativeEffectPeriodOfAdoptionAdjustmentMemberus-gaap:RetainedEarningsMember2019-12-310001437107srt:CumulativeEffectPeriodOfAdoptionAdjustmentMemberus-gaap:AccumulatedOtherComprehensiveIncomeMember2019-12-310001437107srt:CumulativeEffectPeriodOfAdoptionAdjustmentMemberus-gaap:ParentMember2019-12-310001437107srt:CumulativeEffectPeriodOfAdoptionAdjustmentMember2019-12-310001437107us-gaap:RetainedEarningsMember2020-01-012020-12-310001437107us-gaap:ParentMember2020-01-012020-12-310001437107us-gaap:NoncontrollingInterestMember2020-01-012020-12-310001437107us-gaap:AccumulatedOtherComprehensiveIncomeMember2020-01-012020-12-310001437107us-gaap:AdditionalPaidInCapitalMember2020-01-012020-12-310001437107us-gaap:PreferredStockMember2020-01-012020-12-310001437107us-gaap:TreasuryStockMember2020-01-012020-12-310001437107us-gaap:CommonStockMember2020-01-012020-12-310001437107us-gaap:PreferredStockMember2020-12-310001437107us-gaap:CommonStockMember2020-12-310001437107us-gaap:AdditionalPaidInCapitalMember2020-12-310001437107us-gaap:TreasuryStockMember2020-12-310001437107us-gaap:RetainedEarningsMember2020-12-310001437107us-gaap:AccumulatedOtherComprehensiveIncomeMember2020-12-310001437107us-gaap:ParentMember2020-12-310001437107us-gaap:NoncontrollingInterestMember2020-12-31disca:segment0001437107us-gaap:RevolvingCreditFacilityMemberus-gaap:LineOfCreditMember2020-03-310001437107us-gaap:RevolvingCreditFacilityMemberus-gaap:LineOfCreditMember2017-08-110001437107disca:A3625SeniorNotesDueMay2030Memberus-gaap:SeniorNotesMember2020-04-300001437107disca:A4650SeniorNotesDueMay2050Memberus-gaap:SeniorNotesMember2020-04-300001437107us-gaap:SeniorNotesMemberdisca:SeniorNotesDue2021Through2023Member2020-12-310001437107us-gaap:RevolvingCreditFacilityMemberus-gaap:LineOfCreditMember2020-01-012020-12-310001437107srt:MinimumMember2020-01-012020-12-310001437107srt:MaximumMember2020-01-012020-12-310001437107us-gaap:AccountingStandardsUpdate201712Memberus-gaap:AccumulatedOtherComprehensiveIncomeMember2018-07-012018-07-01xbrli:pure0001437107disca:UsNetworksMemberdisca:Largest10DistributorsMemberus-gaap:LicenseAndServiceMemberus-gaap:CustomerConcentrationRiskMember2020-01-012020-12-310001437107us-gaap:CreditRiskMember2020-12-310001437107srt:CumulativeEffectPeriodOfAdoptionAdjustmentMemberus-gaap:AccountingStandardsUpdate201613Member2020-01-010001437107disca:UKTVMemberus-gaap:CorporateJointVentureMember2019-06-100001437107disca:BBCStudiosMemberus-gaap:CorporateJointVentureMember2019-06-112019-06-110001437107disca:BBCStudiosMemberus-gaap:CorporateJointVentureMember2019-06-11disca:installment0001437107disca:BBCStudiosMemberdisca:LifestyleBusinessMember2019-06-100001437107disca:BBCStudiosMemberdisca:LifestyleBusinessMember2019-06-112019-06-110001437107disca:ElectronicProgramGuideAndTrademarksMemberdisca:LifestyleBusinessMember2019-06-112019-06-110001437107disca:LifestyleBusinessMember2019-06-110001437107disca:UKTVMemberus-gaap:CorporateJointVentureMember2019-06-110001437107us-gaap:LicensingAgreementsMemberdisca:BBCStudiosMemberus-gaap:CorporateJointVentureMember2019-06-112019-06-110001437107disca:ScrippsNetworksInteractiveMemberdisca:NoElectionOrMixedConsiderationElectionMember2018-03-062018-03-060001437107disca:ScrippsNetworksInteractiveMemberdisca:CashConsiderationElectionMember2018-03-062018-03-060001437107disca:ScrippsNetworksInteractiveMemberdisca:StockConsiderationElectionMember2018-03-062018-03-060001437107disca:ScrippsNetworksInteractiveMember2018-03-060001437107disca:ScrippsNetworksInteractiveMember2018-03-062018-03-060001437107disca:ScrippsNetworksInteractiveMemberus-gaap:CommonClassCMember2018-03-062018-03-060001437107disca:ScrippsNetworksInteractiveMember2018-03-012018-03-31utr:Rate0001437107disca:UsNetworksMemberdisca:ScrippsNetworksInteractiveMember2018-03-060001437107disca:ScrippsNetworksInteractiveMemberdisca:InternationalNetworksMember2018-03-060001437107disca:ScrippsNetworksInteractiveMembersrt:ScenarioPreviouslyReportedMember2018-03-060001437107disca:ScrippsNetworksInteractiveMembersrt:RestatementAdjustmentMember2018-03-060001437107disca:ScrippsNetworksInteractiveMemberus-gaap:TrademarksAndTradeNamesMember2018-03-060001437107disca:ScrippsNetworksInteractiveMemberus-gaap:TrademarksAndTradeNamesMember2018-03-062018-03-060001437107disca:ScrippsNetworksInteractiveMemberus-gaap:CustomerRelationshipsMember2018-03-060001437107disca:ScrippsNetworksInteractiveMemberus-gaap:CustomerRelationshipsMember2018-03-062018-03-060001437107disca:ScrippsNetworksInteractiveMemberus-gaap:OrderOrProductionBacklogMember2018-03-060001437107disca:ScrippsNetworksInteractiveMemberus-gaap:OrderOrProductionBacklogMember2018-03-062018-03-060001437107disca:ScrippsNetworksInteractiveMemberdisca:AffiliateRelationshipsMember2018-03-060001437107disca:ScrippsNetworksInteractiveMemberdisca:AffiliateRelationshipsMember2018-03-062018-03-060001437107us-gaap:OperatingAndBroadcastRightsMemberdisca:ScrippsNetworksInteractiveMember2018-03-060001437107us-gaap:OperatingAndBroadcastRightsMemberdisca:ScrippsNetworksInteractiveMember2018-03-062018-03-060001437107disca:MagnoliaDiscoveryVenturesLLCMember2019-07-190001437107disca:MagnoliaDiscoveryVenturesLLCMemberdisca:MagnoliaDiscoveryVenturesLLCMemberus-gaap:CorporateJointVentureMember2019-07-190001437107disca:MagnoliaDiscoveryVenturesLLCMemberus-gaap:CorporateJointVentureMember2019-07-192019-07-190001437107disca:MagnoliaDiscoveryVenturesLLCMemberus-gaap:CorporateJointVentureMember2019-07-190001437107disca:GolfDigestMember2019-05-132019-05-130001437107disca:GolfDigestMember2019-05-130001437107disca:TrademarksTradeNamesAndLicensingAgreementsMemberdisca:GolfDigestMember2019-05-132019-05-130001437107disca:PlaySportsGroupLimitedMember2019-01-070001437107disca:PlaySportsGroupLimitedMember2019-01-080001437107disca:PlaySportsGroupLimitedMember2019-01-082019-01-080001437107disca:ScrippsNetworksInteractiveHarpoAndVTENMember2018-01-012018-12-310001437107us-gaap:LicenseAndServiceMemberdisca:ScrippsNetworksInteractiveHarpoAndVTENMember2018-01-012018-12-310001437107us-gaap:AdvertisingMemberdisca:ScrippsNetworksInteractiveHarpoAndVTENMember2018-01-012018-12-310001437107disca:OtherRevenueSourcesMemberdisca:ScrippsNetworksInteractiveHarpoAndVTENMember2018-01-012018-12-310001437107disca:EducationBusinessMemberdisca:EducationBusinessMemberus-gaap:DisposalGroupHeldforsaleNotDiscontinuedOperationsMember2019-12-310001437107disca:EducationBusinessMemberus-gaap:DisposalGroupHeldforsaleNotDiscontinuedOperationsMember2019-12-310001437107disca:EducationBusinessMemberus-gaap:DisposalGroupHeldforsaleNotDiscontinuedOperationsMember2019-01-012019-12-310001437107disca:EducationBusinessMember2019-12-310001437107disca:NCMemberus-gaap:EquityMethodInvestmentsMember2020-12-310001437107disca:NCMemberus-gaap:EquityMethodInvestmentsMember2019-12-310001437107disca:DiscoverySolarVenturesLLCMemberus-gaap:EquityMethodInvestmentsMember2020-12-310001437107disca:DiscoverySolarVenturesLLCMemberus-gaap:EquityMethodInvestmentsMember2019-12-310001437107disca:All3MediaMemberus-gaap:EquityMethodInvestmentsMember2020-12-310001437107disca:All3MediaMemberus-gaap:EquityMethodInvestmentsMember2019-12-310001437107disca:OtherEquityInvestmentsMemberus-gaap:EquityMethodInvestmentsMember2020-12-310001437107disca:OtherEquityInvestmentsMemberus-gaap:EquityMethodInvestmentsMember2019-12-310001437107us-gaap:EquityMethodInvestmentsMember2020-12-310001437107us-gaap:EquityMethodInvestmentsMember2019-12-310001437107us-gaap:PrepaidExpensesAndOtherCurrentAssetsMemberus-gaap:CommonStockMember2020-12-310001437107us-gaap:PrepaidExpensesAndOtherCurrentAssetsMemberus-gaap:CommonStockMember2019-12-310001437107us-gaap:OtherNoncurrentAssetsMemberus-gaap:CommonStockMember2020-12-310001437107us-gaap:OtherNoncurrentAssetsMemberus-gaap:CommonStockMember2019-12-310001437107disca:GroupNineMediaMemberdisca:GroupNineMediaMemberus-gaap:OtherNoncurrentAssetsMember2020-12-310001437107disca:GroupNineMediaMemberus-gaap:OtherNoncurrentAssetsMember2020-12-310001437107disca:GroupNineMediaMemberus-gaap:OtherNoncurrentAssetsMember2019-12-310001437107disca:FormulaEMemberus-gaap:OtherNoncurrentAssetsMemberdisca:FormulaEMember2020-12-310001437107disca:FormulaEMemberus-gaap:OtherNoncurrentAssetsMember2020-12-310001437107disca:FormulaEMemberus-gaap:OtherNoncurrentAssetsMember2019-12-310001437107disca:OtherEquityInvestmentsWithoutReadilyDeterminableFairValueMemberus-gaap:OtherNoncurrentAssetsMember2020-12-310001437107disca:OtherEquityInvestmentsWithoutReadilyDeterminableFairValueMemberus-gaap:OtherNoncurrentAssetsMember2019-12-310001437107disca:VariousequitymethodinvestmentsaggregatedMember2020-01-012020-12-310001437107disca:VariousequitymethodinvestmentsaggregatedMember2019-01-012019-12-310001437107disca:VariousequitymethodinvestmentsaggregatedMember2018-01-012018-12-310001437107disca:VariousequitymethodinvestmentsaggregatedMember2020-12-310001437107us-gaap:VariableInterestEntityNotPrimaryBeneficiaryMember2020-12-310001437107us-gaap:VariableInterestEntityNotPrimaryBeneficiaryMember2019-12-310001437107us-gaap:VariableInterestEntityNotPrimaryBeneficiaryMember2020-01-012020-12-310001437107us-gaap:VariableInterestEntityNotPrimaryBeneficiaryMember2019-01-012019-12-310001437107us-gaap:VariableInterestEntityNotPrimaryBeneficiaryMember2018-01-012018-12-310001437107disca:LionsgateMember2020-12-310001437107disca:LionsgateMember2020-01-012020-12-310001437107disca:FuboTVIncMember2020-10-012020-12-310001437107disca:VariousEquityInvestmentsWithoutReadilyDeterminableFairValuesMember2020-12-310001437107us-gaap:CashAndCashEquivalentsMemberus-gaap:FairValueInputsLevel1Memberus-gaap:FairValueMeasurementsRecurringMember2020-12-310001437107us-gaap:CashAndCashEquivalentsMemberus-gaap:FairValueInputsLevel2Memberus-gaap:FairValueMeasurementsRecurringMember2020-12-310001437107us-gaap:CashAndCashEquivalentsMemberus-gaap:FairValueMeasurementsRecurringMemberus-gaap:FairValueInputsLevel3Member2020-12-310001437107us-gaap:CashAndCashEquivalentsMemberus-gaap:FairValueMeasurementsRecurringMember2020-12-310001437107us-gaap:PrepaidExpensesAndOtherCurrentAssetsMemberus-gaap:FairValueInputsLevel1Memberus-gaap:FairValueMeasurementsRecurringMember2020-12-310001437107us-gaap:PrepaidExpensesAndOtherCurrentAssetsMemberus-gaap:FairValueInputsLevel2Memberus-gaap:FairValueMeasurementsRecurringMember2020-12-310001437107us-gaap:PrepaidExpensesAndOtherCurrentAssetsMemberus-gaap:FairValueMeasurementsRecurringMemberus-gaap:FairValueInputsLevel3Member2020-12-310001437107us-gaap:PrepaidExpensesAndOtherCurrentAssetsMemberus-gaap:FairValueMeasurementsRecurringMember2020-12-310001437107us-gaap:OtherNoncurrentAssetsMemberus-gaap:FairValueInputsLevel1Memberus-gaap:FairValueMeasurementsRecurringMember2020-12-310001437107us-gaap:FairValueInputsLevel2Memberus-gaap:OtherNoncurrentAssetsMemberus-gaap:FairValueMeasurementsRecurringMember2020-12-310001437107us-gaap:OtherNoncurrentAssetsMemberus-gaap:FairValueMeasurementsRecurringMemberus-gaap:FairValueInputsLevel3Member2020-12-310001437107us-gaap:OtherNoncurrentAssetsMemberus-gaap:FairValueMeasurementsRecurringMember2020-12-310001437107us-gaap:FairValueInputsLevel1Memberus-gaap:FairValueMeasurementsRecurringMember2020-12-310001437107us-gaap:FairValueInputsLevel2Memberus-gaap:FairValueMeasurementsRecurringMember2020-12-310001437107us-gaap:FairValueMeasurementsRecurringMemberus-gaap:FairValueInputsLevel3Member2020-12-310001437107us-gaap:FairValueMeasurementsRecurringMember2020-12-310001437107us-gaap:AccruedLiabilitiesMemberus-gaap:FairValueInputsLevel1Memberus-gaap:FairValueMeasurementsRecurringMember2020-12-310001437107us-gaap:AccruedLiabilitiesMemberus-gaap:FairValueInputsLevel2Memberus-gaap:FairValueMeasurementsRecurringMember2020-12-310001437107us-gaap:AccruedLiabilitiesMemberus-gaap:FairValueMeasurementsRecurringMemberus-gaap:FairValueInputsLevel3Member2020-12-310001437107us-gaap:AccruedLiabilitiesMemberus-gaap:FairValueMeasurementsRecurringMember2020-12-310001437107us-gaap:OtherNoncurrentLiabilitiesMemberus-gaap:FairValueInputsLevel1Memberus-gaap:FairValueMeasurementsRecurringMember2020-12-310001437107us-gaap:FairValueInputsLevel2Memberus-gaap:OtherNoncurrentLiabilitiesMemberus-gaap:FairValueMeasurementsRecurringMember2020-12-310001437107us-gaap:OtherNoncurrentLiabilitiesMemberus-gaap:FairValueMeasurementsRecurringMemberus-gaap:FairValueInputsLevel3Member2020-12-310001437107us-gaap:OtherNoncurrentLiabilitiesMemberus-gaap:FairValueMeasurementsRecurringMember2020-12-310001437107us-gaap:CashAndCashEquivalentsMemberus-gaap:FairValueInputsLevel1Memberus-gaap:FairValueMeasurementsRecurringMember2019-12-310001437107us-gaap:CashAndCashEquivalentsMemberus-gaap:FairValueInputsLevel2Memberus-gaap:FairValueMeasurementsRecurringMember2019-12-310001437107us-gaap:CashAndCashEquivalentsMemberus-gaap:FairValueMeasurementsRecurringMemberus-gaap:FairValueInputsLevel3Member2019-12-310001437107us-gaap:CashAndCashEquivalentsMemberus-gaap:FairValueMeasurementsRecurringMember2019-12-310001437107us-gaap:PrepaidExpensesAndOtherCurrentAssetsMemberus-gaap:FairValueInputsLevel1Memberus-gaap:FairValueMeasurementsRecurringMember2019-12-310001437107us-gaap:PrepaidExpensesAndOtherCurrentAssetsMemberus-gaap:FairValueInputsLevel2Memberus-gaap:FairValueMeasurementsRecurringMember2019-12-310001437107us-gaap:PrepaidExpensesAndOtherCurrentAssetsMemberus-gaap:FairValueMeasurementsRecurringMemberus-gaap:FairValueInputsLevel3Member2019-12-310001437107us-gaap:PrepaidExpensesAndOtherCurrentAssetsMemberus-gaap:FairValueMeasurementsRecurringMember2019-12-310001437107us-gaap:OtherNoncurrentAssetsMemberus-gaap:FairValueInputsLevel1Memberus-gaap:FairValueMeasurementsRecurringMember2019-12-310001437107us-gaap:FairValueInputsLevel2Memberus-gaap:OtherNoncurrentAssetsMemberus-gaap:FairValueMeasurementsRecurringMember2019-12-310001437107us-gaap:OtherNoncurrentAssetsMemberus-gaap:FairValueMeasurementsRecurringMemberus-gaap:FairValueInputsLevel3Member2019-12-310001437107us-gaap:OtherNoncurrentAssetsMemberus-gaap:FairValueMeasurementsRecurringMember2019-12-310001437107us-gaap:FairValueInputsLevel1Memberus-gaap:FairValueMeasurementsRecurringMember2019-12-310001437107us-gaap:FairValueInputsLevel2Memberus-gaap:FairValueMeasurementsRecurringMember2019-12-310001437107us-gaap:FairValueMeasurementsRecurringMemberus-gaap:FairValueInputsLevel3Member2019-12-310001437107us-gaap:FairValueMeasurementsRecurringMember2019-12-310001437107us-gaap:AccruedLiabilitiesMemberus-gaap:FairValueInputsLevel1Memberus-gaap:FairValueMeasurementsRecurringMember2019-12-310001437107us-gaap:AccruedLiabilitiesMemberus-gaap:FairValueInputsLevel2Memberus-gaap:FairValueMeasurementsRecurringMember2019-12-310001437107us-gaap:AccruedLiabilitiesMemberus-gaap:FairValueMeasurementsRecurringMemberus-gaap:FairValueInputsLevel3Member2019-12-310001437107us-gaap:AccruedLiabilitiesMemberus-gaap:FairValueMeasurementsRecurringMember2019-12-310001437107us-gaap:OtherNoncurrentLiabilitiesMemberus-gaap:FairValueInputsLevel1Memberus-gaap:FairValueMeasurementsRecurringMember2019-12-310001437107us-gaap:FairValueInputsLevel2Memberus-gaap:OtherNoncurrentLiabilitiesMemberus-gaap:FairValueMeasurementsRecurringMember2019-12-310001437107us-gaap:OtherNoncurrentLiabilitiesMemberus-gaap:FairValueMeasurementsRecurringMemberus-gaap:FairValueInputsLevel3Member2019-12-310001437107us-gaap:OtherNoncurrentLiabilitiesMemberus-gaap:FairValueMeasurementsRecurringMember2019-12-310001437107us-gaap:FairValueInputsLevel2Member2020-12-310001437107us-gaap:FairValueInputsLevel2Member2019-12-310001437107us-gaap:MediaContentMember2020-12-310001437107us-gaap:MediaContentMember2019-12-310001437107us-gaap:OtherRestructuringMember2020-01-012020-12-310001437107us-gaap:OtherRestructuringMember2019-01-012019-12-310001437107disca:ScrippsNetworksInteractiveMember2018-01-012018-12-310001437107us-gaap:MediaContentMemberdisca:AmortizationPeriod1Member2020-12-310001437107us-gaap:MediaContentMemberdisca:AmortizationPeriod2Member2020-12-310001437107us-gaap:MediaContentMemberdisca:AmortizationPeriod3Member2020-12-310001437107disca:UsNetworksMember2018-12-310001437107disca:InternationalNetworksMember2018-12-310001437107disca:UsNetworksMember2019-01-012019-12-310001437107disca:InternationalNetworksMember2019-01-012019-12-310001437107disca:UsNetworksMember2019-12-310001437107disca:InternationalNetworksMember2019-12-310001437107disca:UsNetworksMember2020-01-012020-12-310001437107disca:InternationalNetworksMember2020-01-012020-12-310001437107disca:UsNetworksMember2020-12-310001437107disca:InternationalNetworksMember2020-12-310001437107us-gaap:TrademarksMember2020-01-012020-12-310001437107us-gaap:TrademarksMember2020-12-310001437107us-gaap:TrademarksMember2019-12-310001437107us-gaap:CustomerRelationshipsMember2020-01-012020-12-310001437107us-gaap:CustomerRelationshipsMember2020-12-310001437107us-gaap:CustomerRelationshipsMember2019-12-310001437107us-gaap:OtherIntangibleAssetsMember2020-01-012020-12-310001437107us-gaap:OtherIntangibleAssetsMember2020-12-310001437107us-gaap:OtherIntangibleAssetsMember2019-12-310001437107us-gaap:TrademarksMember2020-12-310001437107us-gaap:TrademarksMember2019-12-310001437107srt:EuropeMember2020-04-012020-06-3000014371072020-04-012020-06-300001437107srt:AsiaPacificMember2020-04-012020-06-300001437107srt:AsiaPacificMembersrt:MinimumMember2020-04-012020-06-300001437107srt:AsiaPacificMembersrt:MaximumMember2020-04-012020-06-300001437107srt:EuropeMember2020-07-012020-09-300001437107srt:AsiaPacificMembersrt:MinimumMember2020-07-012020-09-300001437107srt:AsiaPacificMembersrt:MaximumMember2020-07-012020-09-300001437107srt:MinimumMembersrt:EuropeMember2020-07-012020-09-300001437107srt:EuropeMembersrt:MaximumMember2020-07-012020-09-300001437107srt:AsiaPacificMember2020-07-012020-09-300001437107srt:AsiaPacificMember2020-09-300001437107srt:EuropeMember2020-09-300001437107srt:EuropeMember2020-10-012020-10-010001437107srt:MinimumMembersrt:EuropeMember2020-01-012020-12-310001437107srt:EuropeMembersrt:MaximumMember2020-01-012020-12-310001437107srt:EuropeMember2020-12-310001437107srt:AsiaPacificMember2020-10-012020-10-010001437107srt:AsiaPacificMembersrt:MinimumMember2020-10-012020-10-010001437107srt:AsiaPacificMembersrt:MaximumMember2020-10-012020-10-010001437107srt:EuropeMemberdisca:InternationalNetworksMember2019-10-012019-10-010001437107srt:EuropeMemberdisca:InternationalNetworksMember2019-10-010001437107disca:SeniorNotes2.80PercentMember2020-12-310001437107disca:SeniorNotes2.80PercentMember2019-12-310001437107disca:FourPointThreeSevenFivePercentageSeniorNotesMemberus-gaap:DebtInstrumentRedemptionPeriodOneMemberus-gaap:SubsequentEventMember2021-02-190001437107disca:FourPointThreeSevenFivePercentageSeniorNotesMember2019-12-310001437107disca:A2.375SeniorNotesMember2020-12-310001437107disca:A2.375SeniorNotesMember2019-12-310001437107disca:ThreePointThreeZeroPercentSeniorNotesMember2020-12-310001437107disca:ThreePointThreeZeroPercentSeniorNotesMember2019-12-310001437107disca:SeniorNotes3.500PercentMember2020-12-310001437107disca:SeniorNotes3.500PercentMember2019-12-310001437107disca:TwoPointNineFiveSeniorNotesDomain2020-12-310001437107disca:TwoPointNineFiveSeniorNotesDomain2019-12-310001437107disca:ThreePointTwoFivePercentSeniorNotesMember2020-12-310001437107disca:ThreePointTwoFivePercentSeniorNotesMember2019-12-310001437107disca:ThreePointEightPercentSeniorNotesMember2020-12-310001437107disca:ThreePointEightPercentSeniorNotesMember2019-12-310001437107disca:TwoPointFiveSeniorNotesDomain2020-12-310001437107disca:TwoPointFiveSeniorNotesDomain2019-12-310001437107disca:SeniorNotes3.900PercentMember2020-12-310001437107disca:SeniorNotes3.900PercentMember2019-12-310001437107disca:A3.45SeniorNotesMemberDomain2020-12-310001437107disca:A3.45SeniorNotesMemberDomain2019-12-310001437107disca:SeniorNotes3.950PercentMember2020-12-310001437107disca:SeniorNotes3.950PercentMember2019-12-310001437107disca:A4.90SeniorNotesMemberDomainDomain2020-12-310001437107disca:A4.90SeniorNotesMemberDomainDomain2019-12-310001437107disca:A1.90EuroSeniorNotesMemberDomain2020-12-310001437107disca:A1.90EuroSeniorNotesMemberDomain2019-12-310001437107disca:ThreePointNineFiveSeniorNotesDomain2020-12-310001437107disca:ThreePointNineFiveSeniorNotesDomain2019-12-310001437107disca:A4.125PercentSeniorNotesDueMay2029Member2020-12-310001437107disca:A4.125PercentSeniorNotesDueMay2029Member2019-12-310001437107disca:A3625SeniorNotesDueMay2030Member2020-12-310001437107disca:A3625SeniorNotesDueMay2030Member2019-12-310001437107disca:FivePointZeroDomain2020-12-310001437107disca:FivePointZeroDomain2019-12-310001437107disca:SixPointThreeFivePercentSeniorNotesMember2020-12-310001437107disca:SixPointThreeFivePercentSeniorNotesMember2019-12-310001437107disca:FourPointNineFivePercentSeniorNotesMember2020-12-310001437107disca:FourPointNineFivePercentSeniorNotesMember2019-12-310001437107disca:FourPointEightSevenFivePercentSeniorNotesMember2020-12-310001437107disca:FourPointEightSevenFivePercentSeniorNotesMember2019-12-310001437107disca:FivePointTwoSeniorNotesDomain2020-12-310001437107disca:FivePointTwoSeniorNotesDomain2019-12-310001437107disca:A5.300PercentSeniorNotesDueMay2049Member2020-12-310001437107disca:A5.300PercentSeniorNotesDueMay2049Member2019-12-310001437107disca:A4650SeniorNotesDueMay2050Member2020-12-310001437107disca:A4650SeniorNotesDueMay2050Member2019-12-310001437107disca:A4000SeniorNotesDueSeptember2055Member2020-12-310001437107disca:A4000SeniorNotesDueSeptember2055Member2019-12-310001437107us-gaap:LineOfCreditMemberdisca:ProgramFinancingLineOfCreditMember2020-12-310001437107us-gaap:LineOfCreditMemberdisca:ProgramFinancingLineOfCreditMember2019-12-310001437107disca:FourPointThreeSevenFivePercentageSeniorNotesMemberus-gaap:DebtInstrumentRedemptionPeriodOneMemberus-gaap:SubsequentEventMember2021-02-192021-02-190001437107disca:FourPointThreeSevenFivePercentageSeniorNotesMemberus-gaap:DebtInstrumentRedemptionPeriodOneMemberus-gaap:UsTreasuryUstInterestRateMemberus-gaap:SubsequentEventMember2021-02-192021-02-19disca:offer0001437107disca:ExchangeOfferMemberdisca:OldNotesMember2020-12-310001437107disca:ExchangeOfferMemberdisca:A4000SeniorNotesDueSeptember2055Member2020-12-310001437107disca:ExchangeOfferMember2020-12-310001437107disca:OldNotesMemberdisca:CashOffersMember2020-12-310001437107disca:OldNotesMemberdisca:CashOffersMember2020-01-012020-12-310001437107disca:A3625SeniorNotesDueMay2030Memberus-gaap:SeniorNotesMember2020-12-310001437107disca:A4650SeniorNotesDueMay2050Memberus-gaap:SeniorNotesMember2020-12-310001437107disca:SeniorNotesDueMay2030AndMay2050Memberus-gaap:SeniorNotesMember2020-12-310001437107us-gaap:SeniorNotesMemberdisca:SeniorNotesDue2021Through2023Member2020-01-012020-12-310001437107disca:A4.125PercentSeniorNotesDueMay2029Memberus-gaap:SeniorNotesMember2020-12-310001437107us-gaap:SeniorNotesMemberdisca:A5.300PercentSeniorNotesDueMay2049Member2020-12-310001437107us-gaap:SeniorNotesMemberdisca:A4.125And5.300PercentSeniorNotesMember2020-12-310001437107disca:A2.750And5.050PercentSeniorNotesMemberus-gaap:SeniorNotesMember2020-12-310001437107disca:A2.750And5.050PercentSeniorNotesMemberus-gaap:SeniorNotesMember2020-01-012020-12-310001437107us-gaap:SeniorNotesMemberdisca:FivePointSixTwoFivePercentSeniorNotesMember2019-12-310001437107disca:OpenMarketBondMemberdisca:FivePointSixTwoFivePercentSeniorNotesMember2019-12-310001437107us-gaap:SeniorNotesMemberdisca:FivePointSixTwoFivePercentSeniorNotesMember2019-01-012019-12-310001437107disca:ScrippsNetworksInteractiveMemberus-gaap:SeniorNotesMemberdisca:UnexchangedScrippsSeniorNotesMember2020-12-310001437107disca:RevolversublimitforstandbylettersofcreditMember2017-08-310001437107disca:RevolversublimitforswinglineloansMember2017-08-31disca:contractRenewal0001437107us-gaap:RevolvingCreditFacilityMemberus-gaap:LineOfCreditMember2020-12-310001437107us-gaap:CommercialPaperMember2020-12-310001437107disca:EuroDenominatedBorrowingsMemberus-gaap:RevolvingCreditFacilityMemberus-gaap:CommercialPaperMember2020-12-310001437107us-gaap:CommercialPaperMember2019-12-310001437107disca:MeasurementPeriod1Memberus-gaap:RevolvingCreditFacilityMemberdisca:AmendmentNo2ToTheAmendedAndRestatedCreditAgreementMember2020-04-012020-06-300001437107disca:MeasurementPeriod2Memberus-gaap:RevolvingCreditFacilityMemberdisca:AmendmentNo2ToTheAmendedAndRestatedCreditAgreementMember2020-04-012020-06-300001437107us-gaap:RevolvingCreditFacilityMemberdisca:AmendmentNo2ToTheAmendedAndRestatedCreditAgreementMemberdisca:MeasurementPeriod3Member2020-04-012020-06-300001437107disca:MeasurementPeriod4Memberus-gaap:RevolvingCreditFacilityMemberdisca:AmendmentNo2ToTheAmendedAndRestatedCreditAgreementMember2020-04-012020-06-300001437107us-gaap:RevolvingCreditFacilityMemberdisca:AmendmentNo2ToTheAmendedAndRestatedCreditAgreementMember2020-04-012020-06-300001437107us-gaap:LondonInterbankOfferedRateLIBORMemberus-gaap:RevolvingCreditFacilityMemberdisca:AmendmentNo2ToTheAmendedAndRestatedCreditAgreementMember2020-03-310001437107us-gaap:RevolvingCreditFacilityMemberus-gaap:BaseRateMemberdisca:AmendmentNo2ToTheAmendedAndRestatedCreditAgreementMember2020-03-310001437107us-gaap:RevolvingCreditFacilityMemberus-gaap:BaseRateMemberdisca:AmendmentNo2ToTheAmendedAndRestatedCreditAgreementMember2020-06-300001437107us-gaap:LondonInterbankOfferedRateLIBORMemberus-gaap:RevolvingCreditFacilityMemberdisca:AmendmentNo2ToTheAmendedAndRestatedCreditAgreementMember2020-06-300001437107disca:NewYorkCityMember2019-12-310001437107srt:MinimumMemberdisca:NewYorkCityMember2020-12-310001437107disca:NewYorkCityMembersrt:MaximumMember2020-12-310001437107disca:NewYorkCityMember2020-12-310001437107us-gaap:CashFlowHedgingMemberus-gaap:ForeignExchangeForwardMember2020-12-310001437107us-gaap:CashFlowHedgingMemberus-gaap:ForeignExchangeForwardMember2020-10-012020-12-310001437107us-gaap:DesignatedAsHedgingInstrumentMemberus-gaap:CashFlowHedgingMemberus-gaap:ForeignExchangeForwardMember2020-12-310001437107disca:SeniorNotesDueMay2030AndMay2050Memberus-gaap:InterestRateContractMemberus-gaap:CashFlowHedgingMember2020-12-310001437107disca:SeniorNotesDueMay2030AndMay2050Memberus-gaap:InterestRateContractMemberus-gaap:CashFlowHedgingMember2020-01-012020-12-310001437107us-gaap:ForeignExchangeForwardMember2019-12-310001437107us-gaap:InterestRateContractMemberus-gaap:CashFlowHedgingMember2019-12-310001437107disca:A4.125PercentSeniorNotesDueMay2029Memberus-gaap:SeniorNotesMember2019-12-310001437107us-gaap:InterestRateContractMemberdisca:A4.125PercentSeniorNotesDueMay2029Memberus-gaap:DesignatedAsHedgingInstrumentMemberus-gaap:CashFlowHedgingMember2019-01-012019-12-310001437107us-gaap:InterestRateContractMemberus-gaap:DesignatedAsHedgingInstrumentMemberus-gaap:CashFlowHedgingMember2019-12-31disca:instrument0001437107disca:CurrencySwapFixedToFixedMember2019-12-310001437107us-gaap:NetInvestmentHedgingMemberus-gaap:DesignatedAsHedgingInstrumentMemberdisca:CurrencySwapFixedToFixedMember2019-12-31iso4217:CLP0001437107us-gaap:NetInvestmentHedgingMemberdisca:DiscoveryNetworksSLMemberus-gaap:DesignatedAsHedgingInstrumentMemberus-gaap:ForeignExchangeForwardMember2018-12-310001437107us-gaap:CurrencySwapMemberus-gaap:NetInvestmentHedgingMemberdisca:DNIEuropeHoldingsLimitedMemberus-gaap:DesignatedAsHedgingInstrumentMember2018-12-310001437107us-gaap:ForeignExchangeForwardMemberus-gaap:NondesignatedMember2018-12-310001437107us-gaap:ForeignExchangeContractMemberus-gaap:DesignatedAsHedgingInstrumentMemberus-gaap:CashFlowHedgingMember2020-12-310001437107us-gaap:PrepaidExpensesAndOtherCurrentAssetsMemberus-gaap:ForeignExchangeContractMemberus-gaap:DesignatedAsHedgingInstrumentMemberus-gaap:CashFlowHedgingMember2020-12-310001437107us-gaap:OtherNoncurrentAssetsMemberus-gaap:ForeignExchangeContractMemberus-gaap:DesignatedAsHedgingInstrumentMemberus-gaap:CashFlowHedgingMember2020-12-310001437107us-gaap:AccruedLiabilitiesMemberus-gaap:ForeignExchangeContractMemberus-gaap:DesignatedAsHedgingInstrumentMemberus-gaap:CashFlowHedgingMember2020-12-310001437107us-gaap:OtherNoncurrentLiabilitiesMemberus-gaap:ForeignExchangeContractMemberus-gaap:DesignatedAsHedgingInstrumentMemberus-gaap:CashFlowHedgingMember2020-12-310001437107us-gaap:ForeignExchangeContractMemberus-gaap:DesignatedAsHedgingInstrumentMemberus-gaap:CashFlowHedgingMember2019-12-310001437107us-gaap:PrepaidExpensesAndOtherCurrentAssetsMemberus-gaap:ForeignExchangeContractMemberus-gaap:DesignatedAsHedgingInstrumentMemberus-gaap:CashFlowHedgingMember2019-12-310001437107us-gaap:OtherNoncurrentAssetsMemberus-gaap:ForeignExchangeContractMemberus-gaap:DesignatedAsHedgingInstrumentMemberus-gaap:CashFlowHedgingMember2019-12-310001437107us-gaap:AccruedLiabilitiesMemberus-gaap:ForeignExchangeContractMemberus-gaap:DesignatedAsHedgingInstrumentMemberus-gaap:CashFlowHedgingMember2019-12-310001437107us-gaap:OtherNoncurrentLiabilitiesMemberus-gaap:ForeignExchangeContractMemberus-gaap:DesignatedAsHedgingInstrumentMemberus-gaap:CashFlowHedgingMember2019-12-310001437107us-gaap:InterestRateContractMemberus-gaap:DesignatedAsHedgingInstrumentMemberus-gaap:CashFlowHedgingMember2020-12-310001437107us-gaap:PrepaidExpensesAndOtherCurrentAssetsMemberus-gaap:InterestRateContractMemberus-gaap:DesignatedAsHedgingInstrumentMemberus-gaap:CashFlowHedgingMember2020-12-310001437107us-gaap:InterestRateContractMemberus-gaap:OtherNoncurrentAssetsMemberus-gaap:DesignatedAsHedgingInstrumentMemberus-gaap:CashFlowHedgingMember2020-12-310001437107us-gaap:AccruedLiabilitiesMemberus-gaap:InterestRateContractMemberus-gaap:DesignatedAsHedgingInstrumentMemberus-gaap:CashFlowHedgingMember2020-12-310001437107us-gaap:InterestRateContractMemberus-gaap:OtherNoncurrentLiabilitiesMemberus-gaap:DesignatedAsHedgingInstrumentMemberus-gaap:CashFlowHedgingMember2020-12-310001437107us-gaap:PrepaidExpensesAndOtherCurrentAssetsMemberus-gaap:InterestRateContractMemberus-gaap:DesignatedAsHedgingInstrumentMemberus-gaap:CashFlowHedgingMember2019-12-310001437107us-gaap:InterestRateContractMemberus-gaap:OtherNoncurrentAssetsMemberus-gaap:DesignatedAsHedgingInstrumentMemberus-gaap:CashFlowHedgingMember2019-12-310001437107us-gaap:AccruedLiabilitiesMemberus-gaap:InterestRateContractMemberus-gaap:DesignatedAsHedgingInstrumentMemberus-gaap:CashFlowHedgingMember2019-12-310001437107us-gaap:InterestRateContractMemberus-gaap:OtherNoncurrentLiabilitiesMemberus-gaap:DesignatedAsHedgingInstrumentMemberus-gaap:CashFlowHedgingMember2019-12-310001437107us-gaap:CurrencySwapMemberus-gaap:NetInvestmentHedgingMemberus-gaap:DesignatedAsHedgingInstrumentMember2020-12-310001437107us-gaap:PrepaidExpensesAndOtherCurrentAssetsMemberus-gaap:CurrencySwapMemberus-gaap:NetInvestmentHedgingMemberus-gaap:DesignatedAsHedgingInstrumentMember2020-12-310001437107us-gaap:CurrencySwapMemberus-gaap:NetInvestmentHedgingMemberus-gaap:OtherNoncurrentAssetsMemberus-gaap:DesignatedAsHedgingInstrumentMember2020-12-310001437107us-gaap:AccruedLiabilitiesMemberus-gaap:CurrencySwapMemberus-gaap:NetInvestmentHedgingMemberus-gaap:DesignatedAsHedgingInstrumentMember2020-12-310001437107us-gaap:CurrencySwapMemberus-gaap:NetInvestmentHedgingMemberus-gaap:OtherNoncurrentLiabilitiesMemberus-gaap:DesignatedAsHedgingInstrumentMember2020-12-310001437107us-gaap:CurrencySwapMemberus-gaap:NetInvestmentHedgingMemberus-gaap:DesignatedAsHedgingInstrumentMember2019-12-310001437107us-gaap:PrepaidExpensesAndOtherCurrentAssetsMemberus-gaap:CurrencySwapMemberus-gaap:NetInvestmentHedgingMemberus-gaap:DesignatedAsHedgingInstrumentMember2019-12-310001437107us-gaap:CurrencySwapMemberus-gaap:NetInvestmentHedgingMemberus-gaap:OtherNoncurrentAssetsMemberus-gaap:DesignatedAsHedgingInstrumentMember2019-12-310001437107us-gaap:AccruedLiabilitiesMemberus-gaap:CurrencySwapMemberus-gaap:NetInvestmentHedgingMemberus-gaap:DesignatedAsHedgingInstrumentMember2019-12-310001437107us-gaap:CurrencySwapMemberus-gaap:NetInvestmentHedgingMemberus-gaap:OtherNoncurrentLiabilitiesMemberus-gaap:DesignatedAsHedgingInstrumentMember2019-12-310001437107us-gaap:NetInvestmentHedgingMemberus-gaap:ForeignExchangeContractMemberus-gaap:DesignatedAsHedgingInstrumentMember2020-12-310001437107us-gaap:PrepaidExpensesAndOtherCurrentAssetsMemberus-gaap:NetInvestmentHedgingMemberus-gaap:ForeignExchangeContractMemberus-gaap:DesignatedAsHedgingInstrumentMember2020-12-310001437107us-gaap:NetInvestmentHedgingMemberus-gaap:OtherNoncurrentAssetsMemberus-gaap:ForeignExchangeContractMemberus-gaap:DesignatedAsHedgingInstrumentMember2020-12-310001437107us-gaap:AccruedLiabilitiesMemberus-gaap:NetInvestmentHedgingMemberus-gaap:ForeignExchangeContractMemberus-gaap:DesignatedAsHedgingInstrumentMember2020-12-310001437107us-gaap:NetInvestmentHedgingMemberus-gaap:OtherNoncurrentLiabilitiesMemberus-gaap:ForeignExchangeContractMemberus-gaap:DesignatedAsHedgingInstrumentMember2020-12-310001437107us-gaap:NetInvestmentHedgingMemberus-gaap:ForeignExchangeContractMemberus-gaap:DesignatedAsHedgingInstrumentMember2019-12-310001437107us-gaap:PrepaidExpensesAndOtherCurrentAssetsMemberus-gaap:NetInvestmentHedgingMemberus-gaap:ForeignExchangeContractMemberus-gaap:DesignatedAsHedgingInstrumentMember2019-12-310001437107us-gaap:NetInvestmentHedgingMemberus-gaap:OtherNoncurrentAssetsMemberus-gaap:ForeignExchangeContractMemberus-gaap:DesignatedAsHedgingInstrumentMember2019-12-310001437107us-gaap:AccruedLiabilitiesMemberus-gaap:NetInvestmentHedgingMemberus-gaap:ForeignExchangeContractMemberus-gaap:DesignatedAsHedgingInstrumentMember2019-12-310001437107us-gaap:NetInvestmentHedgingMemberus-gaap:OtherNoncurrentLiabilitiesMemberus-gaap:ForeignExchangeContractMemberus-gaap:DesignatedAsHedgingInstrumentMember2019-12-310001437107us-gaap:ForeignExchangeContractMemberus-gaap:NondesignatedMember2020-12-310001437107us-gaap:PrepaidExpensesAndOtherCurrentAssetsMemberus-gaap:ForeignExchangeContractMemberus-gaap:NondesignatedMember2020-12-310001437107us-gaap:OtherNoncurrentAssetsMemberus-gaap:ForeignExchangeContractMemberus-gaap:NondesignatedMember2020-12-310001437107us-gaap:AccruedLiabilitiesMemberus-gaap:ForeignExchangeContractMemberus-gaap:NondesignatedMember2020-12-310001437107us-gaap:OtherNoncurrentLiabilitiesMemberus-gaap:ForeignExchangeContractMemberus-gaap:NondesignatedMember2020-12-310001437107us-gaap:ForeignExchangeContractMemberus-gaap:NondesignatedMember2019-12-310001437107us-gaap:PrepaidExpensesAndOtherCurrentAssetsMemberus-gaap:ForeignExchangeContractMemberus-gaap:NondesignatedMember2019-12-310001437107us-gaap:OtherNoncurrentAssetsMemberus-gaap:ForeignExchangeContractMemberus-gaap:NondesignatedMember2019-12-310001437107us-gaap:AccruedLiabilitiesMemberus-gaap:ForeignExchangeContractMemberus-gaap:NondesignatedMember2019-12-310001437107us-gaap:OtherNoncurrentLiabilitiesMemberus-gaap:ForeignExchangeContractMemberus-gaap:NondesignatedMember2019-12-310001437107us-gaap:CurrencySwapMemberus-gaap:NondesignatedMember2020-12-310001437107us-gaap:PrepaidExpensesAndOtherCurrentAssetsMemberus-gaap:CurrencySwapMemberus-gaap:NondesignatedMember2020-12-310001437107us-gaap:CurrencySwapMemberus-gaap:OtherNoncurrentAssetsMemberus-gaap:NondesignatedMember2020-12-310001437107us-gaap:AccruedLiabilitiesMemberus-gaap:CurrencySwapMemberus-gaap:NondesignatedMember2020-12-310001437107us-gaap:CurrencySwapMemberus-gaap:OtherNoncurrentLiabilitiesMemberus-gaap:NondesignatedMember2020-12-310001437107us-gaap:CurrencySwapMemberus-gaap:NondesignatedMember2019-12-310001437107us-gaap:PrepaidExpensesAndOtherCurrentAssetsMemberus-gaap:CurrencySwapMemberus-gaap:NondesignatedMember2019-12-310001437107us-gaap:CurrencySwapMemberus-gaap:OtherNoncurrentAssetsMemberus-gaap:NondesignatedMember2019-12-310001437107us-gaap:AccruedLiabilitiesMemberus-gaap:CurrencySwapMemberus-gaap:NondesignatedMember2019-12-310001437107us-gaap:CurrencySwapMemberus-gaap:OtherNoncurrentLiabilitiesMemberus-gaap:NondesignatedMember2019-12-310001437107us-gaap:EquityContractMemberus-gaap:NondesignatedMember2020-12-310001437107us-gaap:PrepaidExpensesAndOtherCurrentAssetsMemberus-gaap:EquityContractMemberus-gaap:NondesignatedMember2020-12-310001437107us-gaap:EquityContractMemberus-gaap:OtherNoncurrentAssetsMemberus-gaap:NondesignatedMember2020-12-310001437107us-gaap:AccruedLiabilitiesMemberus-gaap:EquityContractMemberus-gaap:NondesignatedMember2020-12-310001437107us-gaap:EquityContractMemberus-gaap:OtherNoncurrentLiabilitiesMemberus-gaap:NondesignatedMember2020-12-310001437107us-gaap:EquityContractMemberus-gaap:NondesignatedMember2019-12-310001437107us-gaap:PrepaidExpensesAndOtherCurrentAssetsMemberus-gaap:EquityContractMemberus-gaap:NondesignatedMember2019-12-310001437107us-gaap:EquityContractMemberus-gaap:OtherNoncurrentAssetsMemberus-gaap:NondesignatedMember2019-12-310001437107us-gaap:AccruedLiabilitiesMemberus-gaap:EquityContractMemberus-gaap:NondesignatedMember2019-12-310001437107us-gaap:EquityContractMemberus-gaap:OtherNoncurrentLiabilitiesMemberus-gaap:NondesignatedMember2019-12-310001437107us-gaap:PrepaidExpensesAndOtherCurrentAssetsMember2020-12-310001437107us-gaap:OtherNoncurrentAssetsMember2020-12-310001437107us-gaap:AccruedLiabilitiesMember2020-12-310001437107us-gaap:OtherNoncurrentLiabilitiesMember2020-12-310001437107us-gaap:PrepaidExpensesAndOtherCurrentAssetsMember2019-12-310001437107us-gaap:OtherNoncurrentAssetsMember2019-12-310001437107us-gaap:AccruedLiabilitiesMember2019-12-310001437107us-gaap:OtherNoncurrentLiabilitiesMember2019-12-31iso4217:GBP0001437107us-gaap:NetInvestmentHedgingMemberus-gaap:DesignatedAsHedgingInstrumentMemberdisca:SterlingNotesMember2020-12-310001437107us-gaap:ForeignExchangeContractMemberus-gaap:DesignatedAsHedgingInstrumentMemberus-gaap:CashFlowHedgingMember2020-01-012020-12-310001437107us-gaap:ForeignExchangeContractMemberus-gaap:DesignatedAsHedgingInstrumentMemberus-gaap:CashFlowHedgingMember2019-01-012019-12-310001437107us-gaap:ForeignExchangeContractMemberus-gaap:DesignatedAsHedgingInstrumentMemberus-gaap:CashFlowHedgingMember2018-01-012018-12-310001437107us-gaap:InterestRateContractMemberus-gaap:DesignatedAsHedgingInstrumentMemberus-gaap:CashFlowHedgingMember2020-01-012020-12-310001437107us-gaap:InterestRateContractMemberus-gaap:DesignatedAsHedgingInstrumentMemberus-gaap:CashFlowHedgingMember2019-01-012019-12-310001437107us-gaap:InterestRateContractMemberus-gaap:DesignatedAsHedgingInstrumentMemberus-gaap:CashFlowHedgingMember2018-01-012018-12-310001437107us-gaap:AdvertisingMemberus-gaap:ForeignExchangeContractMemberus-gaap:DesignatedAsHedgingInstrumentMemberus-gaap:CashFlowHedgingMember2020-01-012020-12-310001437107us-gaap:AdvertisingMemberus-gaap:ForeignExchangeContractMemberus-gaap:DesignatedAsHedgingInstrumentMemberus-gaap:CashFlowHedgingMember2019-01-012019-12-310001437107us-gaap:AdvertisingMemberus-gaap:ForeignExchangeContractMemberus-gaap:DesignatedAsHedgingInstrumentMemberus-gaap:CashFlowHedgingMember2018-01-012018-12-310001437107us-gaap:ForeignExchangeContractMemberus-gaap:DesignatedAsHedgingInstrumentMemberus-gaap:CashFlowHedgingMemberus-gaap:LicenseAndServiceMember2020-01-012020-12-310001437107us-gaap:ForeignExchangeContractMemberus-gaap:DesignatedAsHedgingInstrumentMemberus-gaap:CashFlowHedgingMemberus-gaap:LicenseAndServiceMember2019-01-012019-12-310001437107us-gaap:ForeignExchangeContractMemberus-gaap:DesignatedAsHedgingInstrumentMemberus-gaap:CashFlowHedgingMemberus-gaap:LicenseAndServiceMember2018-01-012018-12-310001437107us-gaap:CostOfSalesMemberus-gaap:ForeignExchangeContractMemberus-gaap:DesignatedAsHedgingInstrumentMemberus-gaap:CashFlowHedgingMember2020-01-012020-12-310001437107us-gaap:CostOfSalesMemberus-gaap:ForeignExchangeContractMemberus-gaap:DesignatedAsHedgingInstrumentMemberus-gaap:CashFlowHedgingMember2019-01-012019-12-310001437107us-gaap:CostOfSalesMemberus-gaap:ForeignExchangeContractMemberus-gaap:DesignatedAsHedgingInstrumentMemberus-gaap:CashFlowHedgingMember2018-01-012018-12-310001437107us-gaap:InterestRateContractMemberus-gaap:DesignatedAsHedgingInstrumentMemberus-gaap:CashFlowHedgingMemberus-gaap:InterestExpenseMember2020-01-012020-12-310001437107us-gaap:InterestRateContractMemberus-gaap:DesignatedAsHedgingInstrumentMemberus-gaap:CashFlowHedgingMemberus-gaap:InterestExpenseMember2019-01-012019-12-310001437107us-gaap:InterestRateContractMemberus-gaap:DesignatedAsHedgingInstrumentMemberus-gaap:CashFlowHedgingMemberus-gaap:InterestExpenseMember2018-01-012018-12-310001437107us-gaap:InterestRateContractMemberus-gaap:OtherNonoperatingIncomeExpenseMemberus-gaap:DesignatedAsHedgingInstrumentMemberus-gaap:CashFlowHedgingMember2020-01-012020-12-310001437107us-gaap:InterestRateContractMemberus-gaap:OtherNonoperatingIncomeExpenseMemberus-gaap:DesignatedAsHedgingInstrumentMemberus-gaap:CashFlowHedgingMember2019-01-012019-12-310001437107us-gaap:InterestRateContractMemberus-gaap:OtherNonoperatingIncomeExpenseMemberus-gaap:DesignatedAsHedgingInstrumentMemberus-gaap:CashFlowHedgingMember2018-01-012018-12-310001437107us-gaap:DesignatedAsHedgingInstrumentMemberus-gaap:CashFlowHedgingMember2020-01-012020-12-310001437107us-gaap:CurrencySwapMemberus-gaap:NetInvestmentHedgingMemberus-gaap:DesignatedAsHedgingInstrumentMemberus-gaap:InterestExpenseMember2020-01-012020-12-310001437107us-gaap:CurrencySwapMemberus-gaap:NetInvestmentHedgingMemberus-gaap:DesignatedAsHedgingInstrumentMemberus-gaap:InterestExpenseMember2019-01-012019-12-310001437107us-gaap:CurrencySwapMemberus-gaap:NetInvestmentHedgingMemberus-gaap:DesignatedAsHedgingInstrumentMemberus-gaap:InterestExpenseMember2018-01-012018-12-310001437107us-gaap:ForeignExchangeMemberus-gaap:NetInvestmentHedgingMemberus-gaap:DesignatedAsHedgingInstrumentMember2020-01-012020-12-310001437107us-gaap:ForeignExchangeMemberus-gaap:NetInvestmentHedgingMemberus-gaap:DesignatedAsHedgingInstrumentMember2019-01-012019-12-310001437107us-gaap:ForeignExchangeMemberus-gaap:NetInvestmentHedgingMemberus-gaap:DesignatedAsHedgingInstrumentMember2018-01-012018-12-310001437107us-gaap:NetInvestmentHedgingMemberus-gaap:DesignatedAsHedgingInstrumentMemberdisca:SterlingNotesMember2020-01-012020-12-310001437107us-gaap:NetInvestmentHedgingMemberus-gaap:DesignatedAsHedgingInstrumentMemberdisca:SterlingNotesMember2019-01-012019-12-310001437107us-gaap:NetInvestmentHedgingMemberus-gaap:DesignatedAsHedgingInstrumentMemberdisca:SterlingNotesMember2018-01-012018-12-310001437107us-gaap:NetInvestmentHedgingMemberus-gaap:DesignatedAsHedgingInstrumentMember2020-01-012020-12-310001437107us-gaap:NetInvestmentHedgingMemberus-gaap:DesignatedAsHedgingInstrumentMember2019-01-012019-12-310001437107us-gaap:NetInvestmentHedgingMemberus-gaap:DesignatedAsHedgingInstrumentMember2018-01-012018-12-310001437107us-gaap:InterestRateSwapMemberus-gaap:NondesignatedMember2020-01-012020-12-310001437107us-gaap:InterestRateSwapMemberus-gaap:NondesignatedMember2019-01-012019-12-310001437107us-gaap:InterestRateSwapMemberus-gaap:NondesignatedMember2018-01-012018-12-310001437107us-gaap:CrossCurrencyInterestRateContractMemberus-gaap:NondesignatedMember2020-01-012020-12-310001437107us-gaap:CrossCurrencyInterestRateContractMemberus-gaap:NondesignatedMember2019-01-012019-12-310001437107us-gaap:CrossCurrencyInterestRateContractMemberus-gaap:NondesignatedMember2018-01-012018-12-310001437107us-gaap:ForeignExchangeContractMemberus-gaap:NondesignatedMember2020-01-012020-12-310001437107us-gaap:ForeignExchangeContractMemberus-gaap:NondesignatedMember2019-01-012019-12-310001437107us-gaap:ForeignExchangeContractMemberus-gaap:NondesignatedMember2018-01-012018-12-310001437107us-gaap:CreditRiskContractMemberus-gaap:NondesignatedMember2020-01-012020-12-310001437107us-gaap:CreditRiskContractMemberus-gaap:NondesignatedMember2019-01-012019-12-310001437107us-gaap:CreditRiskContractMemberus-gaap:NondesignatedMember2018-01-012018-12-310001437107us-gaap:EquityContractMemberus-gaap:NondesignatedMember2020-01-012020-12-310001437107us-gaap:EquityContractMemberus-gaap:NondesignatedMember2019-01-012019-12-310001437107us-gaap:EquityContractMemberus-gaap:NondesignatedMember2018-01-012018-12-310001437107us-gaap:NondesignatedMemberus-gaap:OtherExpenseMember2020-01-012020-12-310001437107us-gaap:NondesignatedMemberus-gaap:OtherExpenseMember2019-01-012019-12-310001437107us-gaap:NondesignatedMemberus-gaap:OtherExpenseMember2018-01-012018-12-310001437107disca:DiscoveryFamilyMember2020-12-310001437107disca:DiscoveryFamilyMember2019-12-310001437107disca:MotorTrendGroupLLCMember2020-12-310001437107disca:MotorTrendGroupLLCMember2019-12-310001437107disca:OWNMember2020-12-310001437107disca:OWNMember2019-12-310001437107disca:OtherNoncontrollingInterestsMember2020-12-310001437107disca:OtherNoncontrollingInterestsMember2019-12-310001437107disca:DiscoveryFamilyMemberdisca:HasbroIncMember2020-12-310001437107disca:MotorTrendGroupLLCMember2017-09-012017-09-300001437107disca:GoldenTreeAssetManagementL.P.Memberdisca:MotorTrendGroupLLCMember2020-12-31disca:window0001437107disca:SubsequentAcquisitionWindowOneMemberdisca:HarpoMemberMember2017-11-300001437107disca:SubsequentAcquisitionWindowOneMemberdisca:HarpoMemberMember2017-11-302017-11-300001437107disca:SubsequentAcquisitionWindowTwoMemberdisca:HarpoMemberMember2018-11-300001437107disca:SubsequentAcquisitionWindowTwoMemberdisca:HarpoMemberMember2018-11-012018-11-300001437107disca:OWNMemberdisca:OWNMember2020-12-310001437107us-gaap:CommonClassAMemberdisca:OWNMemberus-gaap:CommonStockMember2020-12-012020-12-310001437107disca:OWNMember2020-12-310001437107disca:SubsequentAcquisitionWindowTwoMemberdisca:HarpoMemberMember2017-11-302017-11-30disca:series0001437107us-gaap:CommonStockMember2020-01-012020-12-31disca:votes0001437107us-gaap:PreferredStockMember2020-01-012020-12-310001437107us-gaap:SeriesCPreferredStockMember2020-12-31disca:director0001437107disca:AdvanceNewhouseMemberus-gaap:SeriesAPreferredStockMember2020-01-012020-12-310001437107disca:AdvanceNewhouseMemberus-gaap:SeriesAPreferredStockMember2020-12-310001437107us-gaap:SeriesAPreferredStockMember2020-12-310001437107disca:SeriesA1AndC1ConvertiblePreferredStockMember2018-01-012018-12-310001437107disca:SeriesA1AndC1ConvertiblePreferredStockMember2020-01-012020-12-310001437107disca:SeriesC1PreferredStockMember2019-01-012019-12-310001437107us-gaap:CommonClassCMember2019-01-012019-12-310001437107disca:ScrippsNetworksInteractiveMemberus-gaap:CommonClassCMember2018-03-012018-03-310001437107disca:February2020RepurchaseProgramMemberus-gaap:CommonStockMember2020-02-290001437107disca:April2019RepurchaseProgramMemberus-gaap:CommonStockMember2019-04-300001437107us-gaap:CommonClassAMemberus-gaap:CommonStockMember2020-12-310001437107us-gaap:CommonClassCMemberus-gaap:CommonStockMember2020-12-310001437107us-gaap:CommonClassCMemberus-gaap:CommonStockMember2020-10-012020-12-310001437107us-gaap:CommonClassCMemberus-gaap:CommonStockMember2019-01-012019-12-310001437107us-gaap:CommonClassCMemberus-gaap:CommonStockMember2018-01-012018-12-310001437107disca:April2019RepurchaseProgramMemberus-gaap:CommonClassCMemberus-gaap:CommonStockMember2019-05-312019-05-31disca:contract0001437107disca:April2019RepurchaseProgramMemberus-gaap:CommonClassCMemberus-gaap:CommonStockMember2019-05-310001437107disca:April2019RepurchaseProgramMemberus-gaap:CommonClassCMemberus-gaap:CommonStockMember2019-06-012019-08-310001437107us-gaap:PreferredStockMemberus-gaap:ConvertiblePreferredStockMember2018-01-012018-12-310001437107us-gaap:PreferredStockMemberus-gaap:ConvertiblePreferredStockMember2020-01-012020-12-310001437107us-gaap:PreferredStockMemberus-gaap:ConvertiblePreferredStockMember2019-01-012019-12-310001437107disca:SeriesC1PreferredStockMemberus-gaap:PreferredStockMember2020-01-012020-12-310001437107us-gaap:ForeignExchangeContractMemberus-gaap:AccumulatedForeignCurrencyAdjustmentIncludingPortionAttributableToNoncontrollingInterestMember2020-01-012020-12-310001437107us-gaap:ForeignExchangeContractMemberus-gaap:AccumulatedForeignCurrencyAdjustmentIncludingPortionAttributableToNoncontrollingInterestMember2019-01-012019-12-310001437107us-gaap:ForeignExchangeContractMemberus-gaap:AccumulatedForeignCurrencyAdjustmentIncludingPortionAttributableToNoncontrollingInterestMember2018-01-012018-12-310001437107us-gaap:NetInvestmentHedgingMemberus-gaap:AccumulatedForeignCurrencyAdjustmentIncludingPortionAttributableToNoncontrollingInterestMember2020-01-012020-12-310001437107us-gaap:NetInvestmentHedgingMemberus-gaap:AccumulatedForeignCurrencyAdjustmentIncludingPortionAttributableToNoncontrollingInterestMember2019-01-012019-12-310001437107us-gaap:NetInvestmentHedgingMemberus-gaap:AccumulatedForeignCurrencyAdjustmentIncludingPortionAttributableToNoncontrollingInterestMember2018-01-012018-12-310001437107disca:DisposalGroupNotDiscontinuedOperationGainLossOnDisposalMemberus-gaap:ForeignExchangeContractMemberus-gaap:AccumulatedForeignCurrencyAdjustmentIncludingPortionAttributableToNoncontrollingInterestMember2020-01-012020-12-310001437107disca:DisposalGroupNotDiscontinuedOperationGainLossOnDisposalMemberus-gaap:ForeignExchangeContractMemberus-gaap:AccumulatedForeignCurrencyAdjustmentIncludingPortionAttributableToNoncontrollingInterestMember2019-01-012019-12-310001437107disca:DisposalGroupNotDiscontinuedOperationGainLossOnDisposalMemberus-gaap:ForeignExchangeContractMemberus-gaap:AccumulatedForeignCurrencyAdjustmentIncludingPortionAttributableToNoncontrollingInterestMember2018-01-012018-12-310001437107us-gaap:AccumulatedForeignCurrencyAdjustmentIncludingPortionAttributableToNoncontrollingInterestMember2020-01-012020-12-310001437107us-gaap:AccumulatedForeignCurrencyAdjustmentIncludingPortionAttributableToNoncontrollingInterestMember2019-01-012019-12-310001437107us-gaap:AccumulatedForeignCurrencyAdjustmentIncludingPortionAttributableToNoncontrollingInterestMember2018-01-012018-12-310001437107us-gaap:AccumulatedGainLossCashFlowHedgeIncludingNoncontrollingInterestMember2020-01-012020-12-310001437107us-gaap:AccumulatedGainLossCashFlowHedgeIncludingNoncontrollingInterestMember2019-01-012019-12-310001437107us-gaap:AccumulatedGainLossCashFlowHedgeIncludingNoncontrollingInterestMember2018-01-012018-12-310001437107us-gaap:AccumulatedDefinedBenefitPlansAdjustmentIncludingPortionAttributableToNoncontrollingInterestMember2020-01-012020-12-310001437107us-gaap:AccumulatedDefinedBenefitPlansAdjustmentIncludingPortionAttributableToNoncontrollingInterestMember2019-01-012019-12-310001437107us-gaap:AccumulatedDefinedBenefitPlansAdjustmentIncludingPortionAttributableToNoncontrollingInterestMember2018-01-012018-12-310001437107us-gaap:AociIncludingPortionAttributableToNoncontrollingInterestMember2020-01-012020-12-310001437107us-gaap:AociIncludingPortionAttributableToNoncontrollingInterestMember2019-01-012019-12-310001437107us-gaap:AociIncludingPortionAttributableToNoncontrollingInterestMember2018-01-012018-12-310001437107us-gaap:AccumulatedForeignCurrencyAdjustmentIncludingPortionAttributableToNoncontrollingInterestMember2017-12-310001437107us-gaap:AccumulatedNetInvestmentGainLossIncludingPortionAttributableToNoncontrollingInterestMember2017-12-310001437107us-gaap:AccumulatedGainLossCashFlowHedgeIncludingNoncontrollingInterestMember2017-12-310001437107us-gaap:AccumulatedDefinedBenefitPlansAdjustmentIncludingPortionAttributableToNoncontrollingInterestMember2017-12-310001437107us-gaap:AccumulatedNetInvestmentGainLossIncludingPortionAttributableToNoncontrollingInterestMember2018-01-012018-12-310001437107srt:CumulativeEffectPeriodOfAdoptionAdjustmentMemberus-gaap:AccountingStandardsUpdate201601Memberus-gaap:AccumulatedForeignCurrencyAdjustmentIncludingPortionAttributableToNoncontrollingInterestMember2017-12-310001437107us-gaap:AccumulatedNetInvestmentGainLossIncludingPortionAttributableToNoncontrollingInterestMembersrt:CumulativeEffectPeriodOfAdoptionAdjustmentMemberus-gaap:AccountingStandardsUpdate201601Member2017-12-310001437107srt:CumulativeEffectPeriodOfAdoptionAdjustmentMemberus-gaap:AccountingStandardsUpdate201601Memberus-gaap:AccumulatedGainLossCashFlowHedgeIncludingNoncontrollingInterestMember2017-12-310001437107srt:CumulativeEffectPeriodOfAdoptionAdjustmentMemberus-gaap:AccumulatedDefinedBenefitPlansAdjustmentIncludingPortionAttributableToNoncontrollingInterestMemberus-gaap:AccountingStandardsUpdate201601Member2017-12-310001437107srt:CumulativeEffectPeriodOfAdoptionAdjustmentMemberus-gaap:AccountingStandardsUpdate201601Memberus-gaap:AccumulatedOtherComprehensiveIncomeMember2017-12-310001437107us-gaap:AccumulatedForeignCurrencyAdjustmentIncludingPortionAttributableToNoncontrollingInterestMember2018-12-310001437107us-gaap:AccumulatedNetInvestmentGainLossIncludingPortionAttributableToNoncontrollingInterestMember2018-12-310001437107us-gaap:AccumulatedGainLossCashFlowHedgeIncludingNoncontrollingInterestMember2018-12-310001437107us-gaap:AccumulatedDefinedBenefitPlansAdjustmentIncludingPortionAttributableToNoncontrollingInterestMember2018-12-310001437107us-gaap:AccumulatedNetInvestmentGainLossIncludingPortionAttributableToNoncontrollingInterestMember2019-01-012019-12-310001437107srt:CumulativeEffectPeriodOfAdoptionAdjustmentMemberus-gaap:AccumulatedForeignCurrencyAdjustmentIncludingPortionAttributableToNoncontrollingInterestMemberus-gaap:AccountingStandardsUpdate201802Member2018-12-310001437107us-gaap:AccumulatedNetInvestmentGainLossIncludingPortionAttributableToNoncontrollingInterestMembersrt:CumulativeEffectPeriodOfAdoptionAdjustmentMemberus-gaap:AccountingStandardsUpdate201802Member2018-12-310001437107srt:CumulativeEffectPeriodOfAdoptionAdjustmentMemberus-gaap:AccumulatedGainLossCashFlowHedgeIncludingNoncontrollingInterestMemberus-gaap:AccountingStandardsUpdate201802Member2018-12-310001437107srt:CumulativeEffectPeriodOfAdoptionAdjustmentMemberus-gaap:AccumulatedDefinedBenefitPlansAdjustmentIncludingPortionAttributableToNoncontrollingInterestMemberus-gaap:AccountingStandardsUpdate201802Member2018-12-310001437107srt:CumulativeEffectPeriodOfAdoptionAdjustmentMemberus-gaap:AccumulatedOtherComprehensiveIncomeMemberus-gaap:AccountingStandardsUpdate201802Member2018-12-310001437107us-gaap:AccumulatedForeignCurrencyAdjustmentIncludingPortionAttributableToNoncontrollingInterestMember2019-12-310001437107us-gaap:AccumulatedNetInvestmentGainLossIncludingPortionAttributableToNoncontrollingInterestMember2019-12-310001437107us-gaap:AccumulatedGainLossCashFlowHedgeIncludingNoncontrollingInterestMember2019-12-310001437107us-gaap:AccumulatedDefinedBenefitPlansAdjustmentIncludingPortionAttributableToNoncontrollingInterestMember2019-12-310001437107us-gaap:AccumulatedNetInvestmentGainLossIncludingPortionAttributableToNoncontrollingInterestMember2020-01-012020-12-310001437107us-gaap:AccumulatedForeignCurrencyAdjustmentIncludingPortionAttributableToNoncontrollingInterestMember2020-12-310001437107us-gaap:AccumulatedNetInvestmentGainLossIncludingPortionAttributableToNoncontrollingInterestMember2020-12-310001437107us-gaap:AccumulatedGainLossCashFlowHedgeIncludingNoncontrollingInterestMember2020-12-310001437107us-gaap:AccumulatedDefinedBenefitPlansAdjustmentIncludingPortionAttributableToNoncontrollingInterestMember2020-12-310001437107disca:TheFoodNetworkandCookingChannelMemberdisca:TribuneMediaCompanyMember2020-12-310001437107disca:UsNetworksMemberus-gaap:AdvertisingMemberus-gaap:OperatingSegmentsMember2020-01-012020-12-310001437107us-gaap:AdvertisingMemberdisca:InternationalNetworksMemberus-gaap:OperatingSegmentsMember2020-01-012020-12-310001437107us-gaap:AdvertisingMemberus-gaap:OperatingSegmentsMemberdisca:OtherMember2020-01-012020-12-310001437107disca:UsNetworksMemberus-gaap:OperatingSegmentsMemberdisca:DistributionRevenueMember2020-01-012020-12-310001437107disca:InternationalNetworksMemberus-gaap:OperatingSegmentsMemberdisca:DistributionRevenueMember2020-01-012020-12-310001437107us-gaap:OperatingSegmentsMemberdisca:OtherMemberdisca:DistributionRevenueMember2020-01-012020-12-310001437107disca:DistributionRevenueMember2020-01-012020-12-310001437107disca:UsNetworksMemberdisca:OtherRevenueSourcesMemberus-gaap:OperatingSegmentsMember2020-01-012020-12-310001437107disca:OtherRevenueSourcesMemberdisca:InternationalNetworksMemberus-gaap:OperatingSegmentsMember2020-01-012020-12-310001437107disca:OtherRevenueSourcesMemberus-gaap:OperatingSegmentsMemberdisca:OtherMember2020-01-012020-12-310001437107disca:OtherRevenueSourcesMember2020-01-012020-12-310001437107disca:UsNetworksMemberus-gaap:OperatingSegmentsMember2020-01-012020-12-310001437107disca:InternationalNetworksMemberus-gaap:OperatingSegmentsMember2020-01-012020-12-310001437107us-gaap:OperatingSegmentsMemberdisca:OtherMember2020-01-012020-12-310001437107disca:UsNetworksMemberus-gaap:AdvertisingMemberus-gaap:OperatingSegmentsMember2019-01-012019-12-310001437107us-gaap:AdvertisingMemberdisca:InternationalNetworksMemberus-gaap:OperatingSegmentsMember2019-01-012019-12-310001437107us-gaap:AdvertisingMemberus-gaap:OperatingSegmentsMemberdisca:OtherMember2019-01-012019-12-310001437107disca:UsNetworksMemberus-gaap:OperatingSegmentsMemberdisca:DistributionRevenueMember2019-01-012019-12-310001437107disca:InternationalNetworksMemberus-gaap:OperatingSegmentsMemberdisca:DistributionRevenueMember2019-01-012019-12-310001437107us-gaap:OperatingSegmentsMemberdisca:OtherMemberdisca:DistributionRevenueMember2019-01-012019-12-310001437107disca:DistributionRevenueMember2019-01-012019-12-310001437107disca:UsNetworksMemberdisca:OtherRevenueSourcesMemberus-gaap:OperatingSegmentsMember2019-01-012019-12-310001437107disca:OtherRevenueSourcesMemberdisca:InternationalNetworksMemberus-gaap:OperatingSegmentsMember2019-01-012019-12-310001437107disca:OtherRevenueSourcesMemberus-gaap:OperatingSegmentsMemberdisca:OtherMember2019-01-012019-12-310001437107disca:OtherRevenueSourcesMember2019-01-012019-12-310001437107disca:UsNetworksMemberus-gaap:OperatingSegmentsMember2019-01-012019-12-310001437107disca:InternationalNetworksMemberus-gaap:OperatingSegmentsMember2019-01-012019-12-310001437107us-gaap:OperatingSegmentsMemberdisca:OtherMember2019-01-012019-12-310001437107disca:UsNetworksMemberus-gaap:AdvertisingMemberus-gaap:OperatingSegmentsMember2018-01-012018-12-310001437107us-gaap:AdvertisingMemberdisca:InternationalNetworksMemberus-gaap:OperatingSegmentsMember2018-01-012018-12-310001437107us-gaap:AdvertisingMemberus-gaap:OperatingSegmentsMemberdisca:OtherMember2018-01-012018-12-310001437107disca:UsNetworksMemberus-gaap:OperatingSegmentsMemberdisca:DistributionRevenueMember2018-01-012018-12-310001437107disca:InternationalNetworksMemberus-gaap:OperatingSegmentsMemberdisca:DistributionRevenueMember2018-01-012018-12-310001437107us-gaap:OperatingSegmentsMemberdisca:OtherMemberdisca:DistributionRevenueMember2018-01-012018-12-310001437107disca:DistributionRevenueMember2018-01-012018-12-310001437107disca:UsNetworksMemberdisca:OtherRevenueSourcesMemberus-gaap:OperatingSegmentsMember2018-01-012018-12-310001437107disca:OtherRevenueSourcesMemberdisca:InternationalNetworksMemberus-gaap:OperatingSegmentsMember2018-01-012018-12-310001437107disca:OtherRevenueSourcesMemberus-gaap:OperatingSegmentsMemberdisca:OtherMember2018-01-012018-12-310001437107disca:OtherRevenueSourcesMember2018-01-012018-12-310001437107disca:UsNetworksMemberus-gaap:OperatingSegmentsMember2018-01-012018-12-310001437107disca:InternationalNetworksMemberus-gaap:OperatingSegmentsMember2018-01-012018-12-310001437107us-gaap:OperatingSegmentsMemberdisca:OtherMember2018-01-012018-12-310001437107disca:DistributionCustomersMember2019-12-310001437107disca:DistributionCustomersMembersrt:CumulativeEffectPeriodOfAdoptionAdjustmentMember2019-12-310001437107disca:DistributionCustomersMember2020-01-012020-12-310001437107disca:DistributionCustomersMember2020-12-310001437107disca:AdvertisingAndOtherCustomersMember2019-12-310001437107srt:CumulativeEffectPeriodOfAdoptionAdjustmentMemberdisca:AdvertisingAndOtherCustomersMember2019-12-310001437107disca:AdvertisingAndOtherCustomersMember2020-01-012020-12-310001437107disca:AdvertisingAndOtherCustomersMember2020-12-310001437107disca:DistributionRevenueMember2021-01-012020-12-310001437107disca:ContentLicensingContractsMember2021-01-012020-12-310001437107disca:BrandLicensingContractsMember2021-01-012020-12-310001437107disca:CommonClassAAndCommonClassBMember2020-12-310001437107us-gaap:PerformanceSharesMember2020-01-012020-12-310001437107us-gaap:PerformanceSharesMember2019-01-012019-12-310001437107us-gaap:PerformanceSharesMember2018-01-012018-12-310001437107us-gaap:RestrictedStockUnitsRSUMember2020-01-012020-12-310001437107us-gaap:RestrictedStockUnitsRSUMember2019-01-012019-12-310001437107us-gaap:RestrictedStockUnitsRSUMember2018-01-012018-12-310001437107us-gaap:EmployeeStockOptionMember2020-01-012020-12-310001437107us-gaap:EmployeeStockOptionMember2019-01-012019-12-310001437107us-gaap:EmployeeStockOptionMember2018-01-012018-12-310001437107us-gaap:StockAppreciationRightsSARSMember2020-01-012020-12-310001437107us-gaap:StockAppreciationRightsSARSMember2019-01-012019-12-310001437107us-gaap:StockAppreciationRightsSARSMember2018-01-012018-12-310001437107us-gaap:EmployeeStockMember2020-01-012020-12-310001437107us-gaap:EmployeeStockMember2019-01-012019-12-310001437107us-gaap:EmployeeStockMember2018-01-012018-12-310001437107us-gaap:PerformanceSharesMember2019-12-310001437107us-gaap:PerformanceSharesMember2020-12-310001437107us-gaap:PerformanceSharesMembersrt:MinimumMember2020-01-012020-12-310001437107us-gaap:PerformanceSharesMembersrt:MaximumMember2020-01-012020-12-310001437107us-gaap:RestrictedStockUnitsRSUMember2019-12-310001437107us-gaap:RestrictedStockUnitsRSUMember2020-12-310001437107srt:MinimumMemberus-gaap:RestrictedStockUnitsRSUMember2020-01-012020-12-310001437107srt:MaximumMemberus-gaap:RestrictedStockUnitsRSUMember2020-01-012020-12-310001437107disca:CashSettlementMemberus-gaap:RestrictedStockUnitsRSUMember2020-12-310001437107disca:StockSettlementMemberus-gaap:RestrictedStockUnitsRSUMember2020-01-012020-12-310001437107disca:CashSettlementMemberus-gaap:RestrictedStockUnitsRSUMember2020-01-012020-12-310001437107us-gaap:EmployeeStockOptionMember2019-12-310001437107us-gaap:EmployeeStockOptionMember2020-12-310001437107srt:MinimumMemberus-gaap:EmployeeStockOptionMember2020-01-012020-12-310001437107us-gaap:EmployeeStockOptionMembersrt:MaximumMember2020-01-012020-12-310001437107us-gaap:StockAppreciationRightsSARSMember2019-12-310001437107us-gaap:StockAppreciationRightsSARSMember2020-12-310001437107us-gaap:EmployeeStockMember2020-12-310001437107us-gaap:PensionPlansDefinedBenefitMember2020-12-310001437107us-gaap:PensionPlansDefinedBenefitMember2019-12-310001437107us-gaap:SupplementalEmployeeRetirementPlanDefinedBenefitMember2020-12-310001437107us-gaap:SupplementalEmployeeRetirementPlanDefinedBenefitMember2019-12-310001437107us-gaap:IntersegmentEliminationMemberdisca:CorporateIntersegmentEliminationsMember2020-01-012020-12-310001437107us-gaap:IntersegmentEliminationMemberdisca:CorporateIntersegmentEliminationsMember2019-01-012019-12-310001437107us-gaap:IntersegmentEliminationMemberdisca:CorporateIntersegmentEliminationsMember2018-01-012018-12-310001437107disca:UsNetworksMemberus-gaap:OperatingSegmentsMember2018-12-310001437107disca:InternationalNetworksMemberus-gaap:OperatingSegmentsMember2018-12-310001437107us-gaap:IntersegmentEliminationMember2018-12-310001437107us-gaap:IntersegmentEliminationMember2019-01-012019-12-310001437107disca:UsNetworksMemberus-gaap:OperatingSegmentsMember2019-12-310001437107disca:InternationalNetworksMemberus-gaap:OperatingSegmentsMember2019-12-310001437107us-gaap:IntersegmentEliminationMember2019-12-310001437107us-gaap:IntersegmentEliminationMember2020-01-012020-12-310001437107disca:UsNetworksMemberus-gaap:OperatingSegmentsMember2020-12-310001437107disca:InternationalNetworksMemberus-gaap:OperatingSegmentsMember2020-12-310001437107us-gaap:IntersegmentEliminationMember2020-12-310001437107us-gaap:InternalRevenueServiceIRSMember2020-12-310001437107us-gaap:StateAndLocalJurisdictionMember2020-12-310001437107us-gaap:ForeignCountryMember2020-12-310001437107disca:SeriesA1PreferredStockMember2020-01-012020-12-310001437107disca:SeriesA1PreferredStockMember2019-01-012019-12-310001437107disca:SeriesA1PreferredStockMember2018-01-012018-12-310001437107disca:SeriesC1PreferredStockMember2020-01-012020-12-310001437107disca:SeriesC1PreferredStockMember2018-01-012018-12-310001437107disca:StockOptionsAndRsuMemberMember2020-01-012020-12-310001437107disca:StockOptionsAndRsuMemberMember2019-01-012019-12-310001437107disca:StockOptionsAndRsuMemberMember2018-01-012018-12-310001437107us-gaap:PerformanceSharesMember2020-01-012020-12-310001437107us-gaap:PerformanceSharesMember2019-01-012019-12-310001437107us-gaap:PerformanceSharesMember2018-01-012018-12-310001437107srt:MinimumMemberdisca:BroadcastEquipmentMember2020-01-012020-12-310001437107disca:BroadcastEquipmentMembersrt:MaximumMember2020-01-012020-12-310001437107disca:BroadcastEquipmentMember2020-12-310001437107disca:BroadcastEquipmentMember2019-12-310001437107srt:MinimumMemberus-gaap:OfficeEquipmentMember2020-01-012020-12-310001437107us-gaap:OfficeEquipmentMembersrt:MaximumMember2020-01-012020-12-310001437107us-gaap:OfficeEquipmentMember2020-12-310001437107us-gaap:OfficeEquipmentMember2019-12-310001437107us-gaap:SoftwareAndSoftwareDevelopmentCostsMembersrt:MinimumMember2020-01-012020-12-310001437107us-gaap:SoftwareAndSoftwareDevelopmentCostsMembersrt:MaximumMember2020-01-012020-12-310001437107us-gaap:SoftwareAndSoftwareDevelopmentCostsMember2020-12-310001437107us-gaap:SoftwareAndSoftwareDevelopmentCostsMember2019-12-310001437107us-gaap:BuildingMember2020-01-012020-12-310001437107us-gaap:BuildingMember2020-12-310001437107us-gaap:BuildingMember2019-12-310001437107us-gaap:LeaseholdImprovementsMember2020-01-012020-12-310001437107disca:LibertyGlobalMembersrt:BoardOfDirectorsChairmanMember2020-12-310001437107disca:LibertyBroadbandMembersrt:BoardOfDirectorsChairmanMember2020-12-310001437107disca:LibertyGroupMember2020-01-012020-12-310001437107disca:LibertyGroupMember2019-01-012019-12-310001437107disca:LibertyGroupMember2018-01-012018-12-310001437107us-gaap:EquityMethodInvestmentsMember2020-01-012020-12-310001437107us-gaap:EquityMethodInvestmentsMember2019-01-012019-12-310001437107us-gaap:EquityMethodInvestmentsMember2018-01-012018-12-310001437107disca:OtherrelatedpartiesMember2020-01-012020-12-310001437107disca:OtherrelatedpartiesMember2019-01-012019-12-310001437107disca:OtherrelatedpartiesMember2018-01-012018-12-310001437107disca:ContentMember2020-12-310001437107us-gaap:OtherCreditDerivativesMember2020-12-310001437107srt:MinimumMemberus-gaap:OtherCreditDerivativesMember2020-01-012020-12-310001437107us-gaap:OtherCreditDerivativesMembersrt:MaximumMember2020-01-012020-12-310001437107disca:EducationAndOtherMemberus-gaap:OperatingSegmentsMember2020-01-012020-12-310001437107disca:EducationAndOtherMemberus-gaap:OperatingSegmentsMember2019-01-012019-12-310001437107disca:EducationAndOtherMemberus-gaap:OperatingSegmentsMember2018-01-012018-12-310001437107disca:UsNetworksMember2018-01-012018-12-310001437107disca:InternationalNetworksMember2018-01-012018-12-310001437107disca:EducationAndOtherMember2020-01-012020-12-310001437107disca:EducationAndOtherMember2019-01-012019-12-310001437107disca:EducationAndOtherMember2018-01-012018-12-310001437107country:US2020-01-012020-12-310001437107country:US2019-01-012019-12-310001437107country:US2018-01-012018-12-310001437107us-gaap:NonUsMember2020-01-012020-12-310001437107us-gaap:NonUsMember2019-01-012019-12-310001437107us-gaap:NonUsMember2018-01-012018-12-310001437107country:US2020-12-310001437107country:US2019-12-310001437107country:PL2020-12-310001437107country:PL2019-12-310001437107country:GB2020-12-310001437107country:GB2019-12-310001437107disca:NonUSorUKMember2020-12-310001437107disca:NonUSorUKMember2019-12-310001437107us-gaap:AllowanceForCreditLossMember2019-12-310001437107us-gaap:AllowanceForCreditLossMember2020-01-012020-12-310001437107srt:CumulativeEffectPeriodOfAdoptionAdjustmentMemberus-gaap:AllowanceForCreditLossMemberus-gaap:AccountingStandardsUpdate201613Member2020-01-012020-12-310001437107us-gaap:AllowanceForCreditLossMember2020-12-310001437107us-gaap:ValuationAllowanceOfDeferredTaxAssetsMember2019-12-310001437107us-gaap:ValuationAllowanceOfDeferredTaxAssetsMember2020-01-012020-12-310001437107us-gaap:ValuationAllowanceOfDeferredTaxAssetsMember2020-12-310001437107us-gaap:AllowanceForCreditLossMember2018-12-310001437107us-gaap:AllowanceForCreditLossMember2019-01-012019-12-310001437107us-gaap:ValuationAllowanceOfDeferredTaxAssetsMember2018-12-310001437107us-gaap:ValuationAllowanceOfDeferredTaxAssetsMember2019-01-012019-12-310001437107us-gaap:AllowanceForCreditLossMember2017-12-310001437107us-gaap:AllowanceForCreditLossMember2018-01-012018-12-310001437107us-gaap:ValuationAllowanceOfDeferredTaxAssetsMember2017-12-310001437107us-gaap:ValuationAllowanceOfDeferredTaxAssetsMember2018-01-012018-12-31
UNITED STATES
SECURITIES AND EXCHANGE COMMISSION
Washington, D.C. 20549
| | | | | |
| ☒ | ANNUAL REPORT PURSUANT TO SECTION 13 OR 15(d) OF THE SECURITIES EXCHANGE ACT OF 1934 |
For the fiscal year ended December 31, 2020
OR
| | | | | |
| ☐ | TRANSITION REPORT PURSUANT TO SECTION 13 OR 15(d) OF THE SECURITIES EXCHANGE ACT OF 1934 |
For the transition period from to
Commission File Number: 001-34177
Discovery, Inc.
(Exact name of Registrant as specified in its charter)
| | | | | | | | | | | |
| Delaware | | 35-2333914 |
(State or other jurisdiction of
incorporation or organization) | | (I.R.S. Employer
Identification No.) |
| | |
| 8403 Colesville Road | | 20910 |
| Silver Spring, | Maryland | | (Zip Code) |
| (Address of principal executive offices) | | |
(240) 662-2000
(Registrant’s telephone number, including area code)
Securities registered pursuant to Section 12(b) of the Act:
| | | | | | | | |
| Title of Each Class | Trading Symbols | Name of Each Exchange on Which Registered |
| Series A Common Stock, par value $0.01 per share | DISCA | The Nasdaq Global Select Market |
| Series B Common Stock, par value $0.01 per share | DISCB | The Nasdaq Global Select Market |
| Series C Common Stock, par value $0.01 per share | DISCK | The Nasdaq Global Select Market |
Securities registered pursuant to Section 12(g) of the Act:
None
Indicate by check mark if the Registrant is a well-known seasoned issuer, as defined in Rule 405 of the Securities Act. Yes ý No ¨
Indicate by check mark if the Registrant is not required to file reports pursuant to Section 13 or Section 15(d) of the Act. Yes ¨ No ý
Indicate by check mark whether the Registrant (1) has filed all reports required to be filed by Section 13 or 15(d) of the Securities Exchange Act of 1934 during the preceding 12 months (or for such shorter period that the Registrant was required to file such reports), and (2) has been subject to such filing requirements for the past 90 days. Yes ý No ¨
Indicate by check mark whether the Registrant has submitted electronically every Interactive Data File required to be submitted pursuant to Rule 405 of Regulation S-T (§232.405 of this chapter) during the preceding 12 months (or for such shorter period that the Registrant was required to submit such files). Yes ý No ¨
Indicate by check mark whether the Registrant is a large accelerated filer, an accelerated filer, a non-accelerated filer, smaller reporting company or an emerging growth company. See the definitions of “large accelerated filer,” “accelerated filer” “smaller reporting company” and "emerging growth company" in Rule 12b-2 of the Exchange Act.:
| | | | | | | | | | | | | | | | | | | | |
| | | | | | |
| Large accelerated filer | | ý | | Accelerated filer | | ¨ |
| | | |
| Non-accelerated filer | | ¨ | | Smaller reporting company | | ☐ |
| | | | | | |
| | | | Emerging growth company | | ☐ |
If an emerging growth company, indicate by check mark if the registrant has elected not to use the extended transition period for complying with any new or revised financial accounting standards provided pursuant to Section 13(a) of the Exchange Act. ¨ |
Indicate by check mark whether the registrant has filed a report on and attestation to its management’s assessment of the effectiveness of its internal control over financial reporting under Section 404(b) of the Sarbanes-Oxley Act (15 U.S.C. 7262(b)) by the registered public accounting firm that prepared or issued its audit report. ☒
Indicate by check mark whether the Registrant is a shell company (as defined in Rule 12b-2 of the Exchange Act). Yes ☐ No ý
The aggregate market value of voting and non-voting common stock held by non-affiliates of the Registrant computed by reference to the last sales price of such stock, as of the last business day of the Registrant’s most recently completed second fiscal quarter, which was June 30, 2020, was approximately $10 billion.
Total number of shares outstanding of each class of the Registrant’s common stock as of February 8, 2021 was:
| | | | | |
| Series A Common Stock, par value $0.01 per share | 162,490,752 | |
| Series B Common Stock, par value $0.01 per share | 6,512,378 | |
| Series C Common Stock, par value $0.01 per share | 318,331,065 | |
DOCUMENTS INCORPORATED BY REFERENCE
Certain information required in Item 10 through Item 14 of Part III of this Annual Report on Form 10-K is incorporated herein by reference to the Registrant’s definitive Proxy Statement for its 2021 Annual Meeting of Stockholders, which shall be filed with the Securities and Exchange Commission pursuant to Regulation 14A of the Securities Exchange Act of 1934, as amended, within 120 days of the Registrant’s fiscal year end.
DISCOVERY, INC.
FORM 10-K
TABLE OF CONTENTS
PART I
CAUTIONARY NOTE CONCERNING FORWARD-LOOKING STATEMENTS
Certain statements in this Annual Report on Form 10-K constitute forward-looking statements within the meaning of the Private Securities Litigation Reform Act of 1995, including statements regarding our business, marketing and operating strategies, integration of acquired businesses, new service offerings, financial prospects, and anticipated sources and uses of capital. Words such as “anticipate,” “assume,” “believe,” “continue,” “estimate,” “expect,” “forecast,” “future,” “intend,” “plan,” “potential,” “predict,” “project,” “strategy,” “target” and similar terms, and future or conditional tense verbs like “could,” “may,” “might,” “should,” “will” and “would,” among other terms of similar substance used in connection with any discussion of future operating or financial performance identify forward-looking statements. Where, in any forward-looking statement, we express an expectation or belief as to future results or events, such expectation or belief is expressed in good faith and believed to have a reasonable basis, but there can be no assurance that the expectation or belief will result or be accomplished. The following is a list of some, but not all, of the factors that could cause actual results or events to differ materially from those anticipated:
•changes in the distribution and viewing of television programming, including the expanded deployment of personal video recorders, subscription video on demand, internet protocol television, mobile personal devices and personal tablets and their impact on television advertising revenue;
•continued consolidation of distribution customers and production studios;
•a failure to secure affiliate agreements or the renewal of such agreements on less favorable terms;
•rapid technological changes;
•the inability of advertisers or affiliates to remit payment to us in a timely manner or at all;
•general economic and business conditions, including the impact of the ongoing COVID-19 pandemic;
•industry trends, including the timing of, and spending on, feature film, television and television commercial production;
•spending on domestic and foreign television advertising;
•disagreements with our distributors or other business partners over contract interpretation;
•fluctuations in foreign currency exchange rates, political unrest and regulatory changes in international markets;
•market demand for foreign first-run and existing content libraries;
•the regulatory and competitive environment of the industries in which we, and the entities in which we have interests, operate;
•uncertainties inherent in the development of new business lines and business strategies;
•uncertainties regarding the financial performance of our investments in unconsolidated entities;
•our ability to complete, integrate, maintain and obtain the anticipated benefits and synergies from our proposed business combinations and acquisitions, on a timely basis or at all;
•uncertainties associated with product and service development and market acceptance, including the development and provision of programming for new television and telecommunications technologies, and the success of our new discovery+ streaming product;
•future financial performance, including availability, terms, and deployment of capital;
•the ability of suppliers and vendors to deliver products, equipment, software, and services;
•our ability to achieve the efficiencies, savings and other benefits anticipated from our cost-reduction initiatives;
•the outcome of any pending or threatened litigation;
•availability of qualified personnel;
•the possibility or duration of an industry-wide strike or other job action affecting a major entertainment industry union;
•changes in, or failure or inability to comply with, government regulations, including, without limitation, regulations of the Federal Communications Commission ("FCC") and data privacy regulations and adverse outcomes from regulatory proceedings;
•changes in income taxes due to regulatory changes or changes in our corporate structure;
•changes in the nature of key strategic relationships with partners, distributors and equity method investee partners;
•competitor responses to our products and services and the products and services of the entities in which we have interests;
•threatened or actual cyber or terrorist attacks and military action;
•our level of debt;
•reduced access to capital markets or significant increases in costs to borrow; and
•a reduction of advertising revenue associated with unexpected reductions in the number of subscribers.
These risks have the potential to impact the recoverability of the assets recorded on our balance sheets, including goodwill or other intangibles. Additionally, many of these risks are currently amplified by and may, in the future, continue to be amplified by the prolonged impact of the COVID-19 pandemic. For additional risk factors, refer to Item 1A, “Risk Factors.” These forward-looking statements and such risks, uncertainties, and other factors speak only as of the date of this Annual Report on Form 10-K, and we expressly disclaim any obligation or undertaking to disseminate any updates or revisions to any forward-looking statement contained herein, to reflect any change in our expectations with regard thereto, or any other change in events, conditions or circumstances on which any such statement is based.
ITEM 1. Business.
For convenience, the terms “Discovery,” the “Company,” “we,” “us” or “our” are used in this Annual Report on Form 10-K to refer to both Discovery, Inc. and collectively to Discovery, Inc. and one or more of its consolidated subsidiaries, unless the context otherwise requires. On March 6, 2018, the Company acquired Scripps Networks Interactive, Inc. ("Scripps Networks") and changed its name from "Discovery Communications, Inc." to "Discovery, Inc." (See Note 3 to the accompanying consolidated financial statements.)
Impact of COVID-19
On March 11, 2020, the World Health Organization declared the coronavirus disease 2019 (“COVID-19”) outbreak to be a global pandemic. COVID-19 continues to spread throughout the world, and the duration and severity of its effects and associated economic disruption remain uncertain. Restrictions on social and commercial activity in an effort to contain the virus have had, and are expected to continue to have, a significant adverse impact upon many sectors of the U.S. and global economy, including the media industry. We continue to closely monitor the impact of COVID-19 on all aspects of our business and geographies, including the impact on our customers, employees, suppliers, vendors, distribution and advertising partners, production facilities, and various other third parties.
Beginning in the second quarter of 2020, demand for our advertising products and services decreased due to economic disruptions from limitations on social and commercial activity. These economic disruptions and the resulting effect on the Company slightly eased during the second half of 2020, but the pandemic continued to impact demand through the end of 2020 and this decreased demand is expected to continue into 2021. Many of our third-party production partners that were shut down during most of the second quarter of 2020 due to COVID-19 restrictions came back online in the third quarter of 2020 and, as a result, we have incurred additional costs to comply with various governmental regulations and implement certain safety measures for our employees, talent, and partners. Additionally, certain sporting events that we have rights to were cancelled or postponed, thereby eliminating or deferring the related revenues and expenses, including the Tokyo 2020 Olympic Games, which were postponed to 2021. The postponement of the Olympic Games deferred both Olympic-related revenues and significant expenses from fiscal year 2020 to fiscal year 2021.
In response to the impact of the pandemic, we employed and continue to employ innovative production and programming strategies, including producing content filmed by our on-air talent and seeking viewer feedback on which content to air. We also implemented remote work arrangements effective mid-March 2020 and, to date, these arrangements have not materially affected our ability to operate our business.
The effects of the pandemic may have further negative impacts on our financial position, results of operations, and cash flows. However, we are unable to predict the ongoing impact that COVID-19 will have on our financial position, operating results, and cash flows due to numerous uncertainties. The nature and extent of COVID-19’s effects on our operations and results will depend on future developments, which are highly uncertain and cannot be predicted, including new information that may emerge concerning the severity and the extent of future surges of COVID-19, vaccine distribution and other actions to contain the virus or treat its impact, among others. We will continue to monitor COVID-19 and its impact on our business results and financial condition.
OVERVIEW
We are a global media company that provides content across multiple distribution platforms, including linear platforms such as pay-television ("pay-TV"), free-to-air ("FTA") and broadcast television, authenticated GO applications, digital distribution arrangements, content licensing arrangements and direct-to-consumer ("DTC") subscription products. As one of the world’s largest pay-TV programmers, we provide original and purchased content and live events to approximately 3.7 billion cumulative subscribers and viewers worldwide through networks that we wholly or partially own. We distribute customized content in the U.S. and over 220 other countries and territories in nearly 50 languages. We have an extensive library of content and own most rights to our content and footage, which enables us to leverage our library to quickly launch brands and services into new markets and on new platforms. Our content can be re-edited and updated in a cost-effective manner to provide topical versions of subject matter that can be utilized around the world on a variety of platforms.
Our content spans genres including survival, natural history, exploration, sports, general entertainment, home, food, travel, heroes, adventure, crime and investigation, health, and kids. Our global portfolio of networks includes prominent nonfiction television brands such as Discovery Channel, our most widely distributed global brand, HGTV, Food Network, TLC, Animal Planet, Investigation Discovery, Travel Channel, Science, and MotorTrend (previously known as Velocity domestically and currently known as Turbo in most international countries). Among other networks in the U.S., Discovery also features two Spanish-language services, Discovery en Español and Discovery Familia. Our international portfolio also includes Eurosport, a leading sports entertainment provider and broadcaster of the Olympic Games (the "Olympics") across Europe (excluding Russia), TVN, a Polish media company, as well as Discovery Kids, a leading children's entertainment brand in Latin America. We participate in joint ventures including Magnolia, the recently formed multi-platform venture with Chip and Joanna Gaines, and Group Nine Media ("Group Nine"), a digital media holding company home to top digital brands including NowThis News, the Dodo, Thrillist, PopSugar, and Seeker. We operate production studios, and prior to the sale of our Education Business in April 2018, we sold curriculum-based education products and services. (See Note 3 to the accompanying consolidated financial statements.)
During the fourth quarter of 2020, we announced the global launch of our aggregated DTC product, discovery+, a non-fiction, real life subscription service. In January 2021, we launched discovery+ in the U.S. across several streaming platforms and entered into a partnership with Verizon, which is offering access to discovery+ for up to 12 months to certain of its customers. The global rollout of discovery+ across more than 25 markets has already begun with the U.K. and Ireland, where we have partnered with Sky, and India. We also have a partnership with Vodafone, which will provide discovery+ to existing Vodafone TV and mobile customers in 12 markets across Europe. Upon launch in the U.S., discovery+ included an extensive content library comprised of more than 55,000 episodes and features a wide array of exclusive, original series from the Discovery portfolio of brands that have a strong leadership position. The service is available with ads or on an ad-free tier, providing Discovery with dual revenue streams.
We aim to generate revenues principally from the sale of advertising on our networks and digital products and from fees charged to distributors that carry our network brands and content, primarily including cable, direct-to-home ("DTH") satellite, telecommunication and digital service providers, as well as through DTC subscription services. Other transactions include affiliate and advertising sales representation services, production studios content development and services content licenses, the licensing of our brands for consumer products, and in 2018, curriculum-based products and services. During 2020, advertising, distribution and other revenues were 52%, 46% and 2%, respectively, of consolidated revenues. No individual customer represented more than 10% of our total consolidated revenues for 2020, 2019 or 2018.
We invest in high-quality content for our networks and brands with the objective of building viewership, optimizing distribution revenue, capturing advertising revenue, and creating or repositioning branded channels and business to sustain long-term growth and occupy a desired content niche with strong consumer appeal. Our strategy is to maximize the distribution, ratings and profit potential of each of our branded networks. In addition to growing distribution and advertising revenues for our branded networks, we have extended content distribution across new platforms, including brand-aligned websites, online streaming, mobile devices, video on demand (“VOD”), and broadband channels, which provide promotional platforms for our television content and serve as additional outlets for advertising and distribution revenue. Audience ratings are a key driver in generating advertising revenue and creating demand on the part of cable television operators, DTH satellite operators, telecommunication service providers, and other content distributors who deliver our content to their customers.
Although we utilize certain brands and content globally, we classify our operations in two reportable segments: U.S. Networks, consisting principally of domestic television networks and digital content services, and International Networks, consisting primarily of international television networks and digital content services. Our segment presentation aligns with our management structure and the financial information management uses to make decisions about operating matters, such as the allocation of resources and business performance assessments. Financial information for our segments and the geographical areas in which we do business is set forth in Item 7, “Management’s Discussion and Analysis of Financial Condition and Results of Operations” and Note 23 to the consolidated financial statements included in Item 8, “Financial Statements and Supplementary Data” in this Annual Report on Form 10-K.
Network Brands
Subscriber statistics set forth in this Annual Report on Form 10-K include both wholly-owned networks and networks operated by equity method investees. Domestic subscriber statistics are based on Nielsen Media Research. International subscriber and viewer statistics are derived from internal data coupled with external sources when available. As used herein, a “subscriber” is a single household that receives the applicable network from its cable television operator, DTH satellite operator, telecommunication service provider, or other television provider, including those who receive our networks from pay-TV providers without charge pursuant to various pricing plans that include free periods and/or free carriage. The term “cumulative subscribers” refers to the sum of the total number of subscribers to each of our networks or content services. By way of example, two households that each receive five of our networks from their pay-TV provider represent two subscribers, but 10 cumulative subscribers. The term "viewer" is a single household that receives the signal from one of our networks using the appropriate receiving equipment without a subscription to a pay-TV provider.
Our brands consist of the following:
•Discovery Channel had approximately 86 million subscribers in the U.S. as of December 31, 2020. Discovery Channel and the Discovery HD Showcase brand had approximately 277 million cumulative subscribers and viewers in international markets as of December 31, 2020.
•Discovery Channel is dedicated to creating high-quality, non-fiction content that informs and entertains its viewers about the world in all its wonder, diversity and amazement. The network offers a signature mix of high-end production values and vivid cinematography across genres including science and technology, exploration, adventure, history and in-depth, behind-the-scenes glimpses at the people, places and organizations that shape and share our world.
•In the U.S., Discovery Channel audiences can enjoy their favorite programming anytime, anywhere through the Discovery GO app, which features live and on-demand access.
•Discovery Channel content includes Gold Rush, Naked and Afraid, Deadliest Catch, Fast N' Loud, Street Outlaws, Alaskan Bush People, Expedition Unknown, BattleBots, Undercover Billionaire and Serengeti. Discovery Channel is also home to Shark Week, the network's long-running annual summer TV event.
•Target viewers are adults aged 25 to 54, particularly men.
•HGTV had approximately 87 million subscribers in the U.S. and approximately 166 million subscribers and viewers in international markets as of December 31, 2020.
•HGTV programming content attracts audiences interested specifically in home/lifestyle related topics, including real estate, renovation, restoration, decorating, interior or landscape design and fantasy lifestyles, as well as docu-series and reality competitions focused on those genres.
•In the U.S., HGTV audiences can enjoy their favorite programming anytime, anywhere through the Discovery GO app, which features live and on-demand access.
•Content on HGTV includes: Property Brothers, Brother vs. Brother, Celebrity IOU, Flip or Flop, Christina on the Coast, Flipping 101 with Tarek El Moussa, Home Town, Good Bones, Rock the Block, Design Star, House Hunters, and House Hunters International.
•Target viewers are women with higher incomes in the 25 to 54 age range.
•The most widely distributed ad-supported cable network in the U.S., Food Network had approximately 87 million subscribers in the U.S. and approximately 113 million subscribers and viewers in international markets as of December 31, 2020.
•Food Network programming content attracts audiences interested in food-related entertainment, including competition and travel, as well as food-related topics such as recipes, food preparation, entertaining, and dining out.
•In the U.S., Food Network audiences can enjoy their favorite programming anytime, anywhere through the Discovery GO app, which features live and on-demand access, as well as on the Food Network Kitchen app.
•Content on Food Network includes primetime series Beat Bobby Flay, Chopped, Diners, Drive-ins and Dives, The Great Food Truck Race, Guy’s Grocery Games, Worst Cooks in America, and several seasonal baking championships, as well as daytime series Barefoot Contessa, Giada Entertains, Girl Meets Farm, Guy's Ranch Kitchen, The Kitchen, The Pioneer Woman, Trisha’s Southern Kitchen and Valerie's Home Cooking.
•Target viewers are adults with higher incomes in the 25 to 54 age range, particularly women.
•TLC had approximately 85 million subscribers in the U.S. and 5 million subscribers in Canada that are included in the U.S. Networks segment as of December 31, 2020. TLC content had approximately 356 million cumulative subscribers and viewers in international markets as of December 31, 2020 including the Home & Health, Real Time, and Living brands.
•Offering real-life stories without judgment, TLC shares everyday heart, humor, hope, and human connection with programming genres that include fascinating families, heartwarming transformations and life's milestone moments.
•In the U.S., TLC audiences can enjoy their favorite programming anytime, anywhere through the Discovery GO app, which features live and on-demand access
•Content on TLC includes the 90 Day Fiancé franchise, Little People, Big World, I Am Jazz and Outdaughtered.
•Target viewers are adults aged 25 to 54, particularly women.
•Animal Planet had approximately 84 million subscribers in the U.S. and approximately 187 million subscribers and viewers in international markets as of December 31, 2020.
•Animal Planet is dedicated to creating high quality content with global appeal delivering on its mission to keep the childhood joy and wonder of animals alive by bringing people up close in every way.
•In the U.S., Animal Planet audiences can enjoy their favorite programming anytime, anywhere through the Animal Planet GO app, which features live and on-demand access.
•Content and talent on Animal Planet include Crikey! It's the Irwins, The Zoo, The Zoo: San Diego, Pit Bulls & Parolees, Dr. Jeff: Rocky Mountain Vet, The Aquarium and Puppy Bowl.
•Target viewers are adults aged 25 to 54.
•Investigation Discovery ("ID") had approximately 84 million subscribers in the U.S. and approximately 90 million subscribers and viewers in international markets as of December 31, 2020.
•ID is a leading true crime, mystery and suspense network. From in-depth investigations to heart-breaking mysteries, ID challenges our everyday understanding of culture, society and the human condition.
•In the U.S., ID audiences can enjoy their favorite programming anytime, anywhere through the Discovery GO app, which features live and on-demand access.
•ID content includes On the Case with Paula Zahn, Homicide Hunter: Lt. Joe Kenda, In Pursuit with John Walsh, and the ID Murder Mystery franchise.
•Target viewers are adults aged 25 to 54, particularly women.
•Travel Channel had approximately 83 million subscribers in the U.S. and approximately 46 million subscribers and viewers in international markets as of December 31, 2020.
•Travel Channel is for the bold, daring and spontaneous: adventurers who embrace the thrill of the unexpected, risk-takers who aren’t afraid of a little mystery and anyone who loves a great story.
•In the U.S., Travel Channel audiences can enjoy their favorite programming anytime, anywhere through the Discovery GO app which, features live and on-demand access.
•Content on Travel Channel includes Ghost Adventures, The Osbournes Want to Believe, Expedition Bigfoot and Ghost Nation.
•Target viewers are adults aged 25 to 54.
 &
& 
•MotorTrend had approximately 73 million subscribers in the U.S. and approximately 150 million subscribers and viewers in international markets, where the brand is known as Turbo, as of December 31, 2020.
•Programming on MotorTrend and the MotorTrend App, the leading subscription streaming service dedicated entirely to the motoring world, is engaging and informative, featuring the best of the automotive world as told by top experts and personalities.
•The MotorTrend App offers more than 8,000 episodes and more than 3,600 hours of automotive series and specials including the most complete collection of classic Top Gear (200+ episodes and specials spanning seasons one through 27), the all-new Top Gear America and NASCAR 2020: Under Pressure, plus every season of Speed Racer, Wheeler Dealers, Roadkill, Fast N’ Loud, Bitchin’ Rides, Iron Resurrection, Texas Metal and many more. The MotorTrend App is available on media players and streaming devices including Amazon FireTV, Apple TV, Roku, Google Chromecast and on the web, as well as across iPhone, iPad, and Android mobile devices.
•In the U.S., MotorTrend TV audiences can also enjoy their favorite MotorTrend programming anytime, anywhere through the Discovery GO app, which features live and on-demand access.
•Target viewers are adults aged 25 to 54, particularly men.
•OWN had approximately 74 million subscribers in the U.S. as of December 31, 2020.
•The Oprah Winfrey Network ("OWN") is the first and only network named for, and inspired by a single iconic leader. OWN is a leading destination for premium scripted and unscripted programming from today's most innovative storytellers, with popular series such as Queen Sugar, Greenleaf, Iyanla: Fix My Life, and new dramas Delilah and David Makes Man.
•Target viewers are African-American women aged 25 to 54.
U.S. NETWORKS
U.S. Networks generated revenues of $6.9 billion and adjusted operating income before depreciation and amortization ("Adjusted OIBDA") of $4.0 billion during 2020, which represented 65% and 95% of our total consolidated revenues and Adjusted OIBDA, respectively. Our U.S. Networks segment principally consists of national television networks. Our U.S. Networks segment owns and operates 17 national television networks, including fully distributed television networks such as Discovery Channel, HGTV, Food Network, TLC, and Animal Planet. In addition, we operate the following U.S. Networks: MotorTrend, Investigation Discovery, Travel Channel, Science, Discovery Family, American Heroes Channel, Destination America, Discovery Life, DIY Network, Cooking Channel, Great American Country, and OWN. In 2020, we also provided authenticated U.S. TV Everywhere ("TVE") streaming products that are available to pay-TV subscribers and connect viewers through our GO applications with live and on-demand access to award-winning shows and series from 16 U.S. networks in the Discovery portfolio and from Discovery Familia and Discovery en Español. During 2020, we achieved incremental increases in U.S. digital platform consumption. Furthermore, we provide certain networks to consumers as part of subscription-based over-the-top services provided by DirectTV Now, AT&T Watch, Hulu, SlingTV, fuboTV, and YouTube TV.
U.S. Networks generates revenues from fees charged to distributors of our television networks’ first run content, which includes cable, DTH satellite and telecommunication service providers, referred to as affiliate fees; fees from distributors for licensed content and content to equity method investee networks, referred to as other distribution revenue; fees from advertising sold on our television networks and digital products, which include discovery+, our GO suite of TVE applications and other DTC subscription products; fees from providing sales representation, network distribution services; and revenue from licensing our brands for consumer products. Typically, our television networks are aired pursuant to multi-year carriage agreements that provide for the level of carriage that our networks will receive and for annual graduated rate increases. Carriage of our networks depends on package inclusion, such as whether networks are on the more widely distributed, broader packages or lesser-distributed, specialized packages, also referred to as digital tiers. In the U.S., approximately 95% of distribution revenues come from the top 10 distributors, with whom we have agreements that expire at various times. Distribution fees are typically collected ratably throughout the year. Certain of our DTC products, including the recent launch of our aggregated discovery+ service in January 2021, provide dual revenue streams.
Advertising revenue is generated across multiple platforms and is based on the price received for available advertising spots and is dependent upon a number of factors including the number of subscribers to our channels, viewership demographics, the popularity of our programming, our ability to sell commercial time over a portfolio of channels and leverage multiple platforms to connect advertisers to target audiences. In the U.S., advertising time is sold in the upfront and scatter markets. In the upfront market, advertisers buy advertising time for upcoming seasons and, by committing to purchase in advance, lock in the advertising rates they will pay for the upcoming year. Many upfront advertising commitments include options whereby advertisers may reduce or increase purchase commitments. In the scatter market, advertisers buy advertising closer to the time when the commercials will be run, which often results in a pricing premium compared to the upfront rates. The mix of upfront and scatter market advertising time sold is based upon the economic conditions at the time that upfront sales take place, impacting the sell-out levels management is willing or able to obtain. The demand in the scatter market then impacts the pricing achieved for our remaining advertising inventory. Scatter market pricing can vary from upfront pricing and can be volatile.
During 2020, advertising, distribution and other revenues were 58%, 41% and 1%, respectively, of total net revenues for this segment.
INTERNATIONAL NETWORKS
International Networks generated revenues of $3.7 billion and Adjusted OIBDA of $723 million during 2020, which represented 35% and 17% of our total consolidated revenues and Adjusted OIBDA, respectively. Our International Networks segment principally consists of national and pan-regional television networks and brands that are delivered across multiple distribution platforms. This segment generates revenue from operations in virtually every pay-TV market in the world through an infrastructure that includes operational centers in London, Amsterdam, Warsaw, Milan, Singapore and Miami. Global brands include Discovery Channel, Food Network, HGTV, Animal Planet, TLC, ID, Science and MotorTrend (known as Turbo outside of the U.S.), along with brands exclusive to International Networks, including Eurosport, Discovery Kids, DMAX, Discovery Home & Health, and TVN. TVN was acquired in March 2018, as part of our acquisition of Scripps Networks Interactive, Inc. (the "Scripps Acquisition"). As of December 31, 2020, International Networks operates unique distribution feeds in nearly 50 languages with channel feeds customized according to language needs and advertising sales opportunities. International Networks also has FTA networks in Europe and the Middle East and broadcast networks in Poland, Denmark, Norway, Sweden and Finland, and continues to pursue further international expansion. During 2020, we completed the acquisition of a German free-to-air general entertainment TV channel and completed an acquisition of an independent free-to-air commercial broadcaster in New Zealand.
FTA and broadcast networks generate a significant portion of International Networks' revenue. The penetration and growth rates of television services vary across countries and territories depending on numerous factors including the dominance of different television platforms in local markets. While pay-TV services have greater penetration in certain markets, FTA or broadcast television is dominant in others. International Networks has a large international distribution platform with more than 80 networks, with as many as 23 networks distributed in any particular country or territory across more than 220 countries and territories around the world. International Networks pursues distribution across all television platforms based on the specific dynamics of local markets and relevant commercial agreements.
With the growing demand for consumer content on digital and mobile devices, a suite of international DTC products has been made available to consumers. dplay, our real-life entertainment streaming service, was rebranded to our new global streaming service, discovery+, in the UK and Ireland during the fourth quarter of 2020. The remainder of the dplay markets, including the Nordics, Italy, Spain, and the Netherlands, are expected to follow in 2021. Discovery expects to expand its DTC offering across more than 25 key markets in 2021 by leveraging its library of local-language content, as well as its broad portfolio of live sports. Eurosport’s existing streaming service, Eurosport Player, offers premium and localized sports to fans in 52 markets in Europe. This service is expected to continue to be available until discovery+ launches and Eurosport Player's content is fully integrated onto the service in those markets.
Beginning with Tokyo 2020, scheduled for the summer of 2021, discovery+ will become the streaming home of the Olympics in Europe (excluding Russia) with live and on-demand access. Eurosport will be an official broadcaster of the Olympics in France and the U.K. for Tokyo 2020.
In Germany, we have partnered with ProSiebenSat.1 to launch the streaming service, Joyn, which offers a collection of free-TV content, with programming and live streams from more than 70 channels. In Poland, we have partnered with Cyfrow Polsat to create a video streaming platform that, when launched, following regulatory clearance, will give viewers a single destination to access Polish content including movies, series, documentaries, sports and entertainment.
Effective September 2020, the Company realigned its International Networks management reporting structure. As a result, Australia and New Zealand, which were previously included in the Europe reporting unit, are now included in the Asia-Pacific reporting unit.
In addition to the global networks described in the overview section above, we operate networks internationally that utilize the following brands:
•Eurosport is a household name for live sports entertainment, reaching fans across Europe and Asia via Eurosport 1, Eurosport 2, the network's DTC streaming service, Eurosport Player, and Eurosport.com.
•Subscribers and viewers for each brand as of December 31, 2020 were as follows: Eurosport 1: 192 million and Eurosport 2: 82 million.
•Live, exclusive and premium sports are at the core of what Eurosport does, showcasing sporting events with both local and pan-regional appeal. Viewers in Europe can enjoy live action including coverage of cycling's Grand Tours, all four Grand Slam tennis tournaments, as well as every International Ski Federation World Cup and World Championship event during the winter sports season.
•In addition to pan-European rights, Eurosport invests in exclusive and localized rights to drive local audience and commercial relevance. Important local sports rights include soccer leagues such as Eliteserien in Norway, Allsvenskan in Sweden and European Europa League in Sweden, Lega Basket basketball in Italy and year-round ATP World Tour tennis in France, Czech Republic, Finland, Iceland, Norway, Romania, Russia, Slovakia, and Sweden.
•In the summer of 2021, Discovery expects to present our first Olympic Summer Games, Tokyo 2020, in 50 markets and 19 languages across Europe. discovery+ will be the exclusive streaming home of the Olympic Games, while Eurosport Player will be the destination in markets where discovery+ has not launched. Discovery channels and platforms, such as our free-to-air networks in a selection of the Nordic markets, will also showcase the Olympics and contribute to bringing the Olympic Summer Games to more people in Europe.
•Eurosport Events is the Eurosport Group’s event management division and global promoter of the Fédération Internationale de l'Automobile (“FIA”) World Touring Car Cup and FIA European Rally Championship together with the sport’s governing body, the FIA. It is also a promoter of the new PURE ETCR series, the world’s first all-electric touring car championship that is set to debut in 2021. In March 2020, Eurosport Events signed a long-term agreement with the UCI, the international federation for cycling, to launch and promote a new world league for Track Cycling – the UCI Track Champions League. Expected to debut in November 2021, the series and cycling will benefit from Discovery’s global scale, media platforms and promotion expertise to help grow cycling around the world.
•DMAX had approximately 139 million subscribers and viewers, according to internal estimates, as of December 31, 2020.
•DMAX is a men’s factual entertainment channel in Asia and Europe.
•Discovery Kids had approximately 108 million subscribers and viewers, according to internal estimates, as of December 31, 2020.
•Discovery Kids is the leading pre-school network of Pay TV in Latin America.
•TVN operates a portfolio of free-to-air and pay-TV lifestyle, entertainment, and news networks in Poland, including TVN, TVN7, TTV, HGTV, TVN24, TVN Style, TVN Turbo, TVN24 BiS, TVN Fabu³a, Travel Channel, Food Network, iTVN and iTVNExtra.
•The TVN portfolio, excluding HGTV, Travel Channel and Food Network, had approximately 87 million cumulative subscribers and viewers as of December 31, 2020.
Our International Networks segment also owns and operates the following television networks, which reached the following number of subscribers and viewers via pay-TV and FTA or broadcast networks, respectively, as of December 31, 2020:
| | | | | | | | |
| | International
Subscribers and Viewers
(millions) |
| Tele5 | | 44 |
| Jeet Prime | | 39 |
Nordic broadcast networks (a) | | 32 |
| Really | | 29 |
| Quest Red | | 29 |
| Quest | | 29 |
| Giallo | | 25 |
| Frisbee | | 25 |
| K2 | | 25 |
| Nove | | 25 |
| DKISS | | 19 |
| Discovery HD Theater | | 17 |
| Asian Food Channel | | 16 |
| World | | 15 |
| Metro | | 12 |
| Discovery History | | 10 |
| Discovery Life Poland | | 8 |
| Discovery Family | | 7 |
| Discovery Historia | | 7 |
Discovery en Español (b) | | 7 |
| Fine Living Network | | 6 |
Discovery Familia (b) | | 6 |
| | |
(a) Number of subscribers and viewers corresponds to the sum of the subscribers and viewers to each of the Nordic broadcast networks in Sweden, Norway, Finland and Denmark subject to retransmission agreements with pay-TV providers. The Nordic broadcast networks include Kanal 5, Kanal 9, and Kanal 11 in Sweden, TVNorge, MAX, FEM and VOX in Norway, TV 5, Kutonen, and Frii in Finland, and Kanal 4, Kanal 5, 6'eren, and Canal 9 in Denmark. |
(b) U.S. domestic subscribers data from Nielsen Media Research. |
Similar to U.S. Networks, a significant source of revenue for International Networks relates to fees charged to operators who distribute our linear networks. Such operators primarily include cable and DTH satellite service providers. International television markets vary in their stages of development. Some markets, such as the U.K., are more advanced digital television markets, while others remain in the analog environment with varying degrees of investment from operators to expand channel capacity or convert to digital technologies. Common practice in some markets results in long-term contractual distribution relationships, while customers in other markets renew contracts annually. Distribution revenue for our International Networks segment is largely dependent on the number of subscribers that receive our networks or content, the rates negotiated in the distributor agreements, and the market demand for the content that we provide. International Networks additionally generates revenues through DTC subscription services.
The other significant source of revenue for International Networks relates to advertising sold on our television networks and across distribution platforms, similar to U.S. Networks. Advertising revenue is dependent upon a number of factors, including the development of pay and FTA television markets, the number of subscribers to and viewers of our channels, viewership demographics, the popularity of our programming, and our ability to sell commercial time over a portfolio of channels on multiple platforms. In certain markets, our advertising sales business operates with in-house sales teams, while we rely on external sales representation services in other markets. Outside the U.S., advertisers typically buy advertising closer to the time when the commercials will be run. In developing pay-TV markets, we expect advertising revenue growth will result from subscriber growth, our localization strategy, and the shift of advertising spending from broadcast to pay-TV. In mature markets, such as Western Europe, high proportions of market penetration and distribution are unlikely to drive rapid revenue growth. Instead, growth in advertising sales comes from increasing viewership and pricing and launching new services, either in pay-TV, broadcast, or FTA television environments.
During 2020, advertising, distribution and other revenues were 42%, 54% and 3%, respectively, of total net revenues for this segment. While we have traditionally operated cable networks, in recent years an increasing portion of our international advertising revenue is generated by FTA or broadcast networks, unlike U.S. Networks. During 2020, pay-TV networks generated 33% of International Networks' advertising revenue and FTA or broadcast networks generated 67% of International Networks' advertising revenue. We also have increased efforts to drive revenue growth from digital products such as the dplay DTC entertainment service in select international markets.
International Networks' largest cost is content expense for localized programming. While our International Networks segment maximizes the use of programming from U.S. Networks, we also develop local programming that is tailored to individual market preferences and license the rights to air films, television series and sporting events from third parties. Content acquired from U.S. Networks and content developed locally airing on the same network is amortized similarly, as amortization rates vary by network.
While International Networks and U.S. Networks have similarities with respect to the nature of operations, the generation of revenue and the categories of expense, International Networks have a lower segment margin due to lower economies of scale from being in over 220 markets which requires additional cost for localization to satisfy market variations. International Networks also include sports and FTA broadcast channels, which drive higher costs from sports rights and production and investment in broad entertainment programming for broadcast networks.
In June 2016, the U.K. held a referendum in which voters approved an exit from the European Union (“E.U.”), commonly referred to as “Brexit.” E.U. law provides for a departing member state to have a two-year notice period to negotiate a term of exit, which the U.K. triggered in March 2017 and subsequently extended. In October 2019, a revised draft withdrawal agreement was published detailing the framework of the future relationship between the U.K. and the E.U. This agreement was ratified by the U.K. and European Parliaments and on January 31, 2020, the U.K. formally left the E.U. Brexit may have an adverse impact on advertising, subscribers, distributors and employees, as described in Item 1A, Risk Factors, below. The withdrawal agreement included a transitional period until December 2020. Discovery, like many international media businesses, sought to mitigate this risk by applying for broadcast licenses in remaining E.U. member states, thereby allowing us continued access to the E.U. single market. We have been operating our E.U. pay-TV channels under Dutch jurisdiction since March 2019. Most of our E.U. free to air channels which were previously operating under the U.K. authority, Ofcom, are operating under German jurisdiction as of January 1, 2021. We continue to monitor the situation for potential effects on our distribution and licensing agreements, unusual foreign currency exchange rate fluctuations, and changes to the legal and regulatory landscape.
CONTENT DEVELOPMENT
Our content development strategy is designed to increase viewership, maintain innovation and quality leadership, and provide value for our network distributors and advertising customers. Our content is sourced from a wide range of third-party producers, which include some of the world’s leading nonfiction production companies, as well as independent producers and wholly-owned production studios.
Our production arrangements fall into three categories: produced, coproduced and licensed. Produced content includes content that we engage third parties or wholly owned production studios to develop and produce. We retain editorial control and own most or all of the rights, in exchange for paying all development and production costs. Production of digital-first content such as virtual reality and short-form video is typically done through wholly-owned production studios. Coproduced content refers to program rights on which we have collaborated with third parties to finance and develop either because world-wide rights are not available for acquisition or we save costs by collaborating with third parties. Licensed content is comprised of films or series that have been produced by third parties. Payments for sports rights made in advance of the event are recognized as prepaid content license assets.
International Networks maximizes the use of content from our U.S. Networks. Our non-fiction content tends to be culturally neutral and maintains its relevance for an extended period of time. As a result, a significant amount of our non-fiction content translates well across international borders and is made even more accessible through extensive use of dubbing and subtitles in local languages. Our content can be re-edited and updated in a cost-effective manner to provide topical versions of subject matter that can be utilized around the world. International Networks executes a localization strategy by offering content from U.S. Networks, customized content and localized schedules via our distribution feeds. While our International Networks segment maximizes the use of content from U.S. Networks, we also develop local content that is tailored to individual market preferences and license the rights to air films, television series and sporting events from third-party producers. To that end, during 2018, we entered into a 12-year partnership with the PGA Tour that includes TV and online rights to the PGA Tour outside the United States. Effective January 1, 2019, we announced the launch of GOLFTV, a new live and on-demand international video streaming service providing over 2,000 hours of live golf programming each year and extensive premium content on-demand. Discovery expects to invest more than $2 billion over the course of the partnership, including licensing rights and building the GOLFTV platform.
Our largest single expense is content, which includes content amortization, content impairment and production costs. We amortize the cost of capitalized content rights based on the proportion that the current year's estimated revenues bear to the estimated remaining total lifetime revenues, which normally results in an accelerated amortization method over the estimated useful lives. However, certain networks also utilize a straight-line method of amortization over the estimated useful lives of the content. Content is amortized primarily over periods of two to four years. The costs for multi-year sports programming arrangements are expensed when the event is broadcast based on the estimated relative value of each season in the arrangement. Content assets are reviewed for impairment when impairment indicators are present, such as low viewership or limited expected use. Impairment losses are recorded when content asset carrying value exceeds net realizable value.
COMPETITION
Providing content across various distribution platforms is a highly competitive business worldwide. We experience competition for the development and acquisition of content, distribution of our content, sale of commercial time on our networks and viewership. There is competition from other production studios, other television networks, and online-based content providers for the acquisition of content and creative talent such as writers, producers and directors. Our ability to produce and acquire popular content is an important competitive factor for the distribution of our content, attracting viewers and the sale of advertising. Our success in securing popular content and creative talent depends on various factors such as the number of competitors providing content that targets the same genre and audience, the distribution of our content, viewership, and the production, marketing and advertising support we provide.
Our networks compete with other television networks, including broadcast, cable and local, for the distribution of our content and fees charged to cable television operators, DTH satellite service providers, and other distributors that carry our content. Our ability to secure distribution agreements is necessary to ensure the retention of our audiences. Our contractual agreements with distributors are renewed or renegotiated from time to time in the ordinary course of business. Growth in the number of networks distributed, consolidation and other market conditions in the cable and satellite distribution industry, and increased popularity of other platforms may adversely affect our ability to obtain and maintain contractual terms for the distribution of our content that are as favorable as those currently in place. The ability to secure distribution agreements is dependent upon the production, acquisition and packaging of original content, viewership, the marketing and advertising support and incentives provided to distributors, the product offering across a series of networks within a region, and the prices charged for carriage.
Our networks and digital products compete for the sale of advertising with other television networks, including broadcast, cable, local networks, and other content distribution outlets for their target audiences and the sale of advertising. Our success in selling advertising is a function of the size and demographics of our audiences, quantitative and qualitative characteristics of the audience of each network, the perceived quality of the network and of the particular content, the brand appeal of the network and ratings as determined by third-party research companies, prices charged for advertising and overall advertiser demand in the marketplace.
Our networks and DTC products also compete for their target audiences with all forms of content and other media provided to viewers, including broadcast, cable and local networks, streaming services, pay-per-view and VOD services, DVDs, online activities and other forms of news, information and entertainment.
Our production studios compete with other production and media companies for talent.
INTELLECTUAL PROPERTY
Our intellectual property assets include copyrights in content, trademarks in brands, names and logos, technology platforms, websites, and licenses of intellectual property rights from third parties.
We are fundamentally a content company and the protection of our brands and content is of primary importance. We have also made and will continue to make investments in developing technology platforms to support our digital products and DTC offerings and consider these platforms to be one of our intellectual property assets. To protect our intellectual property assets, we rely upon a combination of copyright, trademark, unfair competition, trade secret and Internet/domain name statutes and laws, and contract provisions. However, there can be no assurance of the degree to which these measures will be successful. Moreover, effective intellectual property protection may be either unavailable or limited in certain foreign territories. Policing unauthorized use of our products and services and related intellectual property is difficult and costly. We seek to limit unauthorized use of our intellectual property through a combination of approaches. However, the steps taken to prevent the infringement of our intellectual property by unauthorized third parties may not be effective.
Third parties may challenge the validity or scope of our intellectual property from time to time, and the success of any such challenges could result in the limitation or loss of intellectual property rights. Irrespective of their validity, such claims may result in substantial costs and diversion of resources which could have an adverse effect on our operations. In addition, piracy, which encompasses the theft of our signal, and unauthorized use of our content, in the digital environment continues to present a threat to revenues from products and services based on our intellectual property. We use external vendors to detect and remove infringing content and leverage our membership in a range of industry groups to address piracy issues.
REGULATORY MATTERS
Our businesses are subject to and affected by regulations of U.S. federal, state and local government authorities, and our international operations are subject to laws and regulations of the countries and international bodies, such as the E.U., in which we operate. Content networks, such as those owned by us, are regulated by the FCC including some regulations that only apply to content networks affiliated with a cable television operator. Other FCC regulations, although imposed on cable television operators and direct broadcast satellite ("DBS") operators and other distributors, affect content networks indirectly. The rules, regulations, policies and procedures affecting our businesses are constantly subject to change. These descriptions are summary in nature and do not purport to describe all present and proposed laws and regulations affecting our businesses.
Program Access
The FCC’s program access rules prevent a satellite-delivered content vendor in which a cable operator has an “attributable” ownership interest from discriminating against unaffiliated multichannel video programming distributors (“MVPDs”), such as cable and DBS operators, in the rates, terms and conditions for the sale or delivery of content. These rules permit the unaffiliated MVPD to initiate a complaint to the FCC against content networks if it believes this rule has been violated.
Program Carriage
The FCC recently made changes to the program carriage rules, which prohibit distributors from favoring their affiliated content networks over unaffiliated similarly situated content networks in the rates, terms and conditions of carriage agreements between content networks and cable operators or other MVPDs. Some of these changes could make it more difficult for us to challenge a distributor’s decision to decline to carry one of our content networks or a distributor's actions mid-contract that discriminate against one of our content networks.
“Must-Carry”/Retransmission Consent
The Communications Act (the “Act”) imposes “must-carry” regulations on cable systems, requiring them to carry the signals of most local broadcast television stations in their market. DBS systems are also subject to their own must-carry rules. The FCC’s implementation of “must-carry” obligations requires cable operators and DBS providers to give broadcasters preferential access to channel space and favorable channel positions. This reduces the amount of channel space that is available for carriage of our networks by cable and DBS operators. The Act also gives broadcasters the choice of opting out of must-carry and invoking the right to retransmission consent, which refers to a broadcaster’s right to require MVPDs, such as cable and satellite operators, to obtain the broadcaster's consent before distributing the broadcaster's signal to the MVPDs' subscribers, often at a substantial cost that reduces the content funds available for independent programmers not affiliated with broadcasters, such as us.
Accessibility, Children's Advertising Restrictions, and CALM Act
Certain of our content networks and some of our IP-delivered video content must provide closed-captioning and audio description of some of their programming. Our content networks and digital products intended primarily for children 12 years of age and under must comply with certain limits on advertising. Commercials embedded in our networks’ content stream also must adhere to certain standards for ensuring that those commercials are not transmitted at louder volumes than our program material.
Obscenity Restrictions
Network distributors are prohibited from transmitting obscene content, and our distribution agreements generally require us to refrain from including such content on our networks.
Regulation of Digital Services
We operate a variety of free, advertising-based and subscription-based digital products and services providing information, entertainment, e-commerce and interactive experiences to consumers in the U.S. and international markets via web, mobile and connected TV platforms. Our digital services are subject to federal and state regulation in the U.S. relating to the privacy and security of personal information collected from our users, including laws pertaining to the acquisition of personal information from children under 13, such as the federal Children's Online Privacy Protection Act and the federal Controlling the Assault of Non-Solicited Pornography and Marketing Act, and that impose data security and security breach obligations on the Company. These laws are continually evolving, with robust new data protection frameworks having been introduced during the past few years in both the U.S. and international markets, such as the California Consumer Privacy Act ("CCPA"), the E.U. General Data Protection Regulation ("GDPR") and Brazil’s General Data Protection Law. Additional federal and state laws and regulations may be adopted with respect to our digital services, covering such issues as data privacy and security, child safety, oversight of user-generated content, advertising, pricing, content, copyrights and trademarks, access by persons with disabilities, distribution, taxation and characteristics and quality of products and services. Our digital products and services available to consumers in international markets are also subject to the laws and regulations of foreign jurisdictions, including, without limitation, consumer protection, data privacy and security, advertising, intellectual property, and content limitations. We must design and operate our digital products and websites in compliance with these laws and regulations.
Foreign Laws and Regulations
The foreign jurisdictions in which our networks are offered have, in varying degrees, laws and regulations governing our businesses.
HUMAN CAPITAL
As of December 31, 2020, we had approximately 9,800 employees, including full-time and part-time employees of our wholly-owned subsidiaries and consolidated ventures. Our employees are located in 36 different countries, with 37% located in the United States and 63% located outside of the United States.
We are a talent-driven business, aiming to attract, develop, and motivate top talent throughout our company. To support these objectives, our human resources programs are designed to provide competitive, locally-relevant benefits, performance-based pay, and customized nonfinancial support and incentives. We also strive to enhance our culture through efforts aimed at making our workplace diverse, engaging and inclusive, and to develop our talent to prepare them for critical roles and leadership positions for the future. We also provide opportunities for our employees to make an impact in their communities through social good initiatives around the world.
Some examples of our human resources programs and initiatives are described below.
Compensation
Our compensation philosophy is to pay for performance, encourage excellence and reward employees who innovate and deliver high-quality results. Our compensation programs are designed to implement our compensation philosophy by:
•paying competitively, across salary grades and geographies;
•applying compensation policies in an internally consistent manner; and
•incenting our employees to deliver on our short- and long-term objectives.
Benefits
We provide an array of benefits and programs that support our employees in their personal and professional lives. Highlights include:
•local medical, dental, and vision plans in many countries around the world to support our employees with access to health care, supplementing any state-provided health care;
•on-site wellness centers in our New York, Silver Spring, Sterling, Knoxville and London offices, a fully-equipped fitness center in our Knoxville office, and access to virtual fitness classes and wellbeing programs;
•family support programs, including on-site childcare in our Knoxville and Warsaw offices, childcare locator services, back-up childcare, maternity/paternity leave, adoption assistance and elder care;
•tools and resources to support the mental wellbeing of our employees and their families, including mental health counselors in our on-site wellness centers and a confidential, dedicated line for employees to contact and speak with a counselor in the event they need mental health support;
•products and services to support employees’ financial wellbeing, including life, accident, and disability insurance plans, discount benefits, financial planning tools, a 401(k) savings plan in the U.S. and retirement/pension plans in another 20 countries;
•offering an employee stock purchase plan, which allows employees globally (where legislation permits) an opportunity to buy Discovery, Inc. stock at a discounted price through convenient after-tax payroll deductions with no commission charges; and
•flexible working arrangements around the globe to enable our employees to better balance work and personal commitments, which were expanded during the COVID-19 pandemic to support our employees’ health and safety.
Diversity, Equity and Inclusion ("DE&I")
Our DE&I objective is to foster a culture of equity, inclusion, and mutual respect. In 2020 we emphasized our DE&I focus through Mosaic – our Diversity, Equity and Inclusion activation. Mosaic covers a range of initiatives, including: Unconscious Bias, Respect & Integrity; Allyship; Recruitment and Career Development; Content Diversity; Supplier Diversity; and Social Impact.
We sponsor over 30 chapters of Employee Resource Groups (“ERGs”) across the globe with more than 2,500 members. ERGs draw upon their collection of unique experiences to help drive our mission of fostering a diverse and inclusive environment and provide important insights to our diversity, equity and inclusion initiatives.
Learning and Development
Our Global Learning & Development ("L&D") team provides learning opportunities for employees around the world. The L&D team uses a variety of delivery methods suitable to the content and audience, including live in-person sessions, virtual workshops, webinars, and asynchronous online learning through our global learning management platform.
Social Good
We have a department dedicated to social good that builds and oversees consumer and employee-facing initiatives and campaigns. We leverage our platforms, resources, and employee base to make an impact in our communities and with our key nonprofit partners. We have corporate partnerships aimed at addressing childhood hunger, racial injustice and wildlife preservation. Our employee-facing initiatives include matching gift and “dollars for doers” programs and sponsoring Impact Day, a global day of employee volunteerism that gives back to the communities where we live and work around the world. We are also committed to using our voice to advocate for action around the issues of our time that are important to our employees. In furtherance of this objective, we support various causes and organizations that promote equal rights, and have committed to a two-year social justice project where Discovery employees will have the opportunity to help reinvestigate likely wrongful conviction cases and attempt to secure pro bono legal services to seek exoneration.
AVAILABLE INFORMATION
All of our filings with the U.S. Securities and Exchange Commission (the “SEC”), including reports on Form 10-K, Form 10-Q and Form 8-K, and all amendments to such filings are available free of charge at the investor relations section of our website, https://corporate.discovery.com, as soon as reasonably practicable after such material is filed with, or furnished to, the SEC. Our annual report, corporate governance guidelines, code of business ethics, audit committee charter, compensation committee charter, and nominating and corporate governance committee charter are also available on our website. In addition, we will provide a printed copy of any of these documents, free of charge, upon written request to: Investor Relations, Discovery, Inc., 8403 Colesville Road, Silver Spring, MD 20910. Additionally, the SEC maintains a website at http://www.sec.gov that contains quarterly, annual and current reports, proxy and information statements, and other information regarding issuers that file electronically with the SEC, including the Company.
The information contained on our website is not part of this Annual Report on Form 10-K and is not incorporated by reference herein.
ITEM 1A. Risk Factors.
Investing in our securities involves risk. In addition to the other information contained in this report, you should consider the following risk factors before investing in our securities.
Risks Related to Our Industry
Our businesses operate in highly competitive industries.
The entertainment and media programming industries in which we operate are highly competitive. We compete with other programming networks for distribution, viewers and advertising. We face increased competition from subscription based streaming services and DTC offerings, including our recently launched discovery+ product, and we also compete for viewers with other forms of media entertainment, such as home video, movies, periodicals, on-line and mobile activities. In particular, websites and search engines have seen significant advertising growth, a portion of which has moved from traditional cable network and satellite advertisers. Businesses, including ours, that offer multiple services, or that may be vertically integrated and offer both video distribution and programming content, may face closer regulatory review from the competition authorities in the countries in which we currently have operations. If our distributors have to pay higher rates to holders of sports broadcasting rights, it might be difficult for us to negotiate higher rates for distribution of our networks. The ability of our businesses to compete successfully depends on a number of factors, including our ability to consistently supply high quality and popular content, access our niche viewership with appealing category-specific content, adapt to new technologies and distribution platforms and achieve widespread distribution. There can be no assurance that we will be able to compete successfully in the future against existing or new competitors, or that increasing competition will not have a material adverse effect on our business, financial condition or results of operations.
The success of our business depends on the acceptance of our entertainment and sports content by our U.S. and foreign viewers, which may be unpredictable and volatile.
The production and distribution of entertainment and sports content are inherently risky businesses because the revenue we derive and our ability to distribute our content depend primarily on consumer tastes and preferences that often change in unpredictable ways. Our success depends on our ability to consistently create and acquire content that meets the changing preferences of viewers in general, in special interest groups, in specific demographic categories and in various international marketplaces. As the home of the Olympic Games in Europe until 2024, we have been developing and innovating new forms of content in connection with the Olympic Games. Our success with the Olympics depends on audience acceptance of this content. If viewers do not find our Olympic Games content acceptable, we could see low viewership, which could lead to low distribution and advertising revenues. The success of our partnership with the PGA Tour, which runs through 2031, is similarly dependent on audience acceptance and viewership. Failing to gain the level of audience acceptance we expect for the PGA Tour content may negatively impact our distribution and advertising revenues over the period of the partnership.
The commercial success of our content also depends upon the quality and acceptance of competing content available in the applicable marketplace. Other factors, including the availability of alternative forms of entertainment and leisure time activities, general economic conditions, piracy, and growing competition for consumer discretionary spending may also affect the audience for our content. Audience sizes for our media networks are critical factors affecting both the volume and pricing of advertising revenue that we receive, and the extent of distribution and the license fees we receive under agreements with our distributors.
Consequently, reduced public acceptance of our entertainment content may decrease our audience share and adversely affect our results of operations.
There has been a shift in consumer behavior as a result of technological innovations and changes in the distribution of content, which may affect our viewership and the profitability of our business in unpredictable ways.
Technology and business models in our industry continue to evolve rapidly. Changes to these business models include (a) the presence of streaming services, which are increasing in number and some of which have a significant and growing subscriber base, and (b) the increased video consumption through subscription steaming services and time-delayed or time-shifted viewing of television programming through on-demand services and DVRs. Consumer behavior related to changes in content distribution and technological innovation affect our economic model and viewership in ways that are not entirely predictable.
Consumers are increasingly viewing content on a time-delayed or on-demand basis from traditional distributors and from streaming services, connected apps and websites and on a wide variety of screens, such as televisions, tablets, mobile phones and other devices. Additionally, devices that allow users to view television programs on a time-shifted basis and technologies that enable users to fast-forward or skip programming, including commercials, such as DVRs and portable digital devices and systems that enable users to store or make portable copies of content may affect the attractiveness of our offerings to advertisers and could therefore adversely affect our revenues. There is increased demand for short-form, user-generated and interactive content, which have different economic models than our traditional content offerings. Likewise, distributors are offering smaller programming packages known as “skinny bundles,” which are delivered at a lower cost than traditional offerings and sometimes allow consumers to create a customized package of networks, that are gaining popularity among consumers. If our networks are not included in these packages or consumers favor alternative offerings, we may experience a decline in viewership and ultimately the demand for our programming, which could lead to lower distribution and advertising revenues.
We have also seen declines in subscribers to the traditional cable bundle. In 2020, total U.S. Networks portfolio subscribers declined 5% while subscribers to our fully distributed networks declined 3%. In order to respond to changes in content distribution models in our industry, we have invested in, developed and launched DTC products including dplay, JOYN, MotorTrend and our new discovery+ product. There can be no assurance, however, that our viewers will respond to our DTC products or that our DTC strategy will be successful, particularly given the increase in DTC products on the market. Each distribution model has different risks and economic consequences for us, so the rapid evolution of consumer preferences may have an economic impact that is not ultimately predictable. Distribution windows are also evolving, potentially affecting revenues from other windows. If we cannot ensure that our distribution methods and content are responsive to our target audiences, our business could be adversely affected.
If our new subscription streaming product, discovery+, fails to attract and retain subscribers, our business may be adversely impacted.
In January 2021, Discovery launched an aggregated DTC product, discovery+. We have incurred and will likely continue to incur significant costs to develop and market discovery+ and there can be no assurance that consumers and advertisers will embrace our offering or that subscribers will activate or renew a subscription.
Our discovery+ offering is a subscription-based streaming product. The subscription-based streaming service marketplace is crowded and competitive, and our success will also be largely dependent on our ability to initially attract, and to ultimately retain, subscribers. Competitors to discovery+ include traditional linear programming networks, including our own linear channels, and other subscription-based streaming services and DTC offerings. If we are unable to effectively market discovery+ or if consumers do not perceive the pricing and related features of discovery+ to be of value versus our competitors, we may not be able to attract and retain subscribers. Our ability to attract and retain subscribers to discovery+ will also depend in part on our ability to provide compelling content choices that are differentiated from that of our competitors and that are more attractive than other sources of entertainment that consumers could choose in their free time. Furthermore, our ability to provide a quality subscriber experience and our relative service levels, may also impact our ability to attract and retain subscribers. If we are unable to attract and retain subscribers to discovery+, our business could be adversely affected.
Consolidation among cable and satellite providers, both domestically and internationally, could have an adverse effect on our revenue and profitability.
Consolidation among cable and satellite operators has given the largest operators considerable leverage in their relationships with programmers, including us. In the U.S., approximately 95% of our distribution revenues come from the top 10 distributors. We currently have agreements in place with the major cable and satellite operators in U.S. Networks and International Networks which expire at various times through 2023. Some of our largest distributors have combined, and as a result, have gained, or may gain, market power, which could affect our ability to maximize the value of our content through those platforms. In addition, many of the countries and territories in which we distribute our networks also have a small number of dominant distributors. Continued consolidation within the industry could reduce the number of distributors to carry our programming, subject our affiliate fee revenue to greater volume discounts, and further increase the negotiating leverage of the cable and satellite television system operators which could have an adverse effect on our financial condition or results of operations.
Failure to renew, renewal with less favorable terms, or termination of our distribution agreements may cause a decline in our revenue.
Because our networks are licensed on a wholesale basis to distributors, such as cable and satellite operators, which in turn distribute them to consumers, we are dependent upon the maintenance of distribution agreements with these operators. These distribution agreements generally provide for the level of carriage our networks will receive, such as channel placement and programming package inclusion (widely distributed, broader programming packages compared to lesser distributed, specialized programming packages) and for payment of a license fee to us based on the number of subscribers that receive our networks.
While the number of subscribers associated with our networks impacts our ability to generate advertising revenue, these per subscriber payments also represent a significant portion of our revenue. Our distribution agreements generally have a limited term which varies by market and distributor, and there can be no assurance that these distribution agreements will be renewed in the future or that they will be renewed on terms that are favorable to us. A reduction in the license fees that we receive per subscriber or in the number of subscribers for which we are paid, including as a result of a loss or reduction in carriage for our networks, could adversely affect our distribution revenue. Such a loss or reduction in carriage could also decrease the potential audience for our programs thereby adversely affecting our advertising revenue. In addition, our distribution agreements are complex and individually negotiated. If we were to disagree with one of our counterparties on the interpretation of a distribution agreement, our relationship with that counterparty could be damaged and our business could be negatively affected.
Interpretation of some terms of our distribution agreements may have an adverse effect on the distribution payments we receive under those agreements.
Some of our distribution agreements contain “most favored nation” clauses. These clauses typically provide that if we enter into an agreement with another distributor which contains certain more favorable terms, we must offer some of those terms to our existing distributors. We have entered into a number of distribution agreements with terms that differ in some respects from those contained in other agreements. While we believe that we have appropriately complied with the most favored nation clauses included in our distribution agreements, these agreements are complex and other parties could reach a different conclusion that, if correct, could have an adverse effect on our financial condition or results of operations.
We face cybersecurity and similar risks, which could result in the disclosure of confidential information, disruption of our programming services, damage to our brands and reputation, legal exposure and financial losses.
We and our partners rely on various technology systems in connection with the production, distribution and broadcast of our programming, and our on-line, mobile and app offerings, as well as our internal systems, involve the storage and transmission of personal and proprietary information. From time to time, hackers target Discovery and our service providers, and our service providers’ systems may be breached due to employee error, malicious code, hacking and phishing attacks, or otherwise. Any such breach or unauthorized access could result in a loss of our proprietary information, which may include user data, a disruption of our services or a reduction of the revenues we are able to generate from such services, damage to our brands and reputation, a loss of confidence in the security of our offerings and services, and significant legal and financial exposure, each of which could potentially have an adverse effect on our business. Additionally, outside parties may attempt to fraudulently induce employees or users to disclose sensitive or confidential information in order to gain access to data and systems. Because the techniques used to obtain unauthorized access, disable or degrade service, or sabotage systems change frequently and often are not recognized until launched against a target, we may be unable to anticipate these techniques or to implement adequate preventative measures, notwithstanding our ongoing efforts to develop and implement robust data security tools, practices, and protocols. We may not have adequate insurance coverage to compensate us for losses associated with cybersecurity and privacy events.
In addition, we face regulatory risk associated with the acquisition, storage, disclosure, use and protection of personal data, including under the E.U. GDPR, the CCPA, and various other domestic and international privacy and data security laws and regulations, which are continually evolving. These evolving data protection laws may require us to expend significant resources to implement additional data protection measures, and our actual or alleged failure to comply with such laws could result in legal claims, regulatory enforcement actions and significant fines and penalties.
Risks Related to the COVID-19 Pandemic
The ongoing COVID-19 pandemic has disrupted, and is expected to continue to disrupt our business operations and poses risks to our business, results of operations and financial position, the nature and extent of which are highly uncertain, rapidly changing and unpredictable.
The continuing global spread of the coronavirus disease 2019, commonly called “COVID-19,” has created significant worldwide operational volatility, uncertainty and disruption.
Countries throughout the world have imposed stringent restrictions on social and commercial activity in an effort to slow the spread of the illness. These restrictions vary by location and have had a significant adverse impact upon many sectors, including the media industry in which we operate. The extent of the impact to our business, customers, employees, vendors, and our distribution, advertising and production partners will depend on future developments, which are highly uncertain and cannot be predicted, including new information that may emerge concerning the severity and the extent of future surges of COVID-19 and the actions to contain the virus or treat its impact, among others. Any negative effect on these third parties could materially adversely impact us.
In particular, our advertising revenues, which represented 52% of our consolidated revenues in 2020, may decrease significantly if our advertising partners in certain sectors (such as travel) continue to reduce their advertising spending, or if we are limited in our ability to create and air new content due to prolonged production shutdowns and delays. The COVID-19 pandemic has caused some of our advertisers to reduce their spending, and future declines in the economic prospects of advertisers or the economy in general due to COVID-19 could continue to negatively impact their advertising expenditures in the future. We may continue to experience decreases in advertising revenues related to live sporting events, which have been cancelled or postponed due to the pandemic. For example, the International Olympic Committee and the Tokyo 2020 Organizing Committee agreed to postpone the 2020 Olympic Games to 2021. The postponement of the Olympic Games has delayed our expected Olympic-related revenue. Further, a prolonged, global recession due to COVID-19 may put pressure on household budgets and cause a decrease in consumer discretionary spending, which may decrease our subscriber numbers, distribution revenues and the rates we are able to charge for advertising.
In addition, we continue to implement remote work arrangements in various geographic locations. While these arrangements have not materially affected our ability to maintain our business operations to date, these arrangements may adversely impact our business operations in the future.
The extent to which COVID-19 will adversely impact our business, financial condition and results of operations will depend on numerous evolving factors, which are highly uncertain, rapidly changing and cannot be predicted, including:
•the duration and scope of the outbreak, including the extent of future surges of the disease, vaccine distribution and other actions to contain the virus or treat its impact;
•governmental, business and individual actions that have been and continue to be taken in response to the outbreak, including travel restrictions, quarantines, social distancing, work-at-home, stay-at-home and shelter-in-place orders and shut-downs;
•the impact of the outbreak on the financial markets and economic activity generally;
•the effect of the outbreak on our investments, customers, vendors and production partners;
•the impact of the outbreak on the health, well-being and productivity of our employees and the potential for disruption to our ability to conduct our operations; and
•the ability of our customers to pay for our services during and following the outbreak.
The COVID-19 pandemic has caused substantial disruption in financial markets and economies worldwide, both of which could result in adverse effects on our business, operations, stock price and ability to raise capital.
The COVID-19 pandemic has negatively impacted the global economy and created significant volatility and disruption in the credit and financial markets, and while some economic disruption may ease from time to time, such disruption is expected to continue and may worsen for an undetermined period of time. The pandemic and continued spread of COVID-19 has caused a global recession. There is a significant degree of uncertainty and lack of visibility as to the extent and duration of such slowdown or recession; however, a prolonged slowdown or recession may adversely affect our credit ratings, stock price, ability to access capital on favorable terms and ability to meet our liquidity needs.
Our actions to limit the adverse effects of COVID-19 on our financial condition may not be successful, as the extent and duration of the adverse effects of the pandemic is not determinable and depends on future developments, which are highly uncertain and cannot be predicted. Events resulting from the effects of COVID-19 may negatively impact our ability to comply with our financial covenants. Also, additional funding may not be available to us on acceptable terms or at all. If adequate funding is not available, we may be required to reduce expenditures, including curtailing our growth strategies and reducing our product development efforts, or forego acquisition opportunities.
Risks Related to our International Operations
We are subject to risks related to our international operations.
We have operations through which we distribute programming outside the United States. As a result, our business is subject to certain risks inherent in international business, many of which are beyond our control. These risks include:
•laws and policies affecting trade and taxes, including laws and policies relating to the repatriation of funds and withholding taxes, and changes in these laws;
•changes in local regulatory requirements, including restrictions on content, imposition of local content quotas and restrictions on foreign ownership;
•differing degrees of protection for intellectual property and varying attitudes towards the piracy of intellectual property;
•significant fluctuations in foreign currency value;
•currency exchange controls;
•the instability of foreign economies and governments;
•war and acts of terrorism;
•anti-corruption laws and regulations such as the Foreign Corrupt Practices Act and the U.K. Bribery Act that impose stringent requirements on how we conduct our foreign operations and changes in these laws and regulations;
•foreign privacy and data protection laws and regulation and changes in these laws; and
•shifting consumer preferences regarding the viewing of video programming.
Events or developments related to these and other risks associated with international trade could adversely affect our revenues from non-U.S. sources, which could have a material adverse effect on our business, financial condition, operating results, liquidity and prospects. Furthermore, some foreign markets where we and our partners operate may be more adversely affected by current economic conditions than the U.S. We also may incur substantial expense as a result of changes, including the imposition of new restrictions, in the existing economic or political environment in the regions where we do business. Acts of terrorism, hostilities, or financial, political, economic or other uncertainties could lead to a reduction in revenue or loss of investment, which could adversely affect our results of operations.
Global economic conditions may have an adverse effect on our business.
Our business is significantly affected by prevailing economic conditions and by disruptions to financial markets. We derive substantial revenues from advertisers, and these expenditures are sensitive to general economic conditions and consumer buying patterns. Financial instability or a general decline in economic conditions in the U.S. and other countries where our networks are distributed could adversely affect advertising rates and volume, resulting in a decrease in our advertising revenues.
Decreases in consumer discretionary spending in the U.S. and other countries where our networks are distributed may affect cable television and other video service subscriptions, in particular with respect to digital service tiers on which certain of our programming networks are carried. This could lead to a decrease in the number of subscribers receiving our programming from multi-channel video programming distributors, which could have a negative impact on our viewing subscribers and distribution revenues. Similarly, a decrease in viewing subscribers would also have a negative impact on the number of viewers actually watching the programs on our programming networks, which could also impact the rates we are able to charge advertisers.
Economic conditions affect a number of aspects of our businesses worldwide and impact the businesses of our partners who purchase advertising on our networks and might reduce their spending on advertising. Economic conditions can also negatively affect the ability of those with whom we do business to satisfy their obligations to us. The general worsening of current global economic conditions could adversely affect our business, financial condition or results of operations, and the worsening of economic conditions in certain parts of the world, specifically, could impact the expansion and success of our businesses in such areas.
As a company that has operations in the United Kingdom, the United Kingdom’s withdrawal from the E.U. could have an adverse impact on our business, results of operations and financial position.
On January 31, 2020, the United Kingdom (“U.K.”) formally withdrew from the E.U., commonly referred to as “Brexit.” The transition period, during which the pre-Brexit rights and obligations on trade, travel and business for the U.K. and the E.U. continued to apply, ended on December 31, 2020. As of January 1, 2021, the relationship between the U.K. and the E.U. is governed by the EU-UK Trade and Co-operation Agreement (“TCA”), which is effective provisionally pending ratification by the European Parliament.
As a result of Brexit, the single market and country of origin principles which have facilitated our cross-border activities from the U.K. into the E.U. have ceased, which could have an adverse impact on our operations and business activities. We have incurred, and may continue to incur, costs, including due to reestablishment of broadcasting entities from the U.K. into the E.U., staff relocations and business travel, to minimize disruption to our businesses in the E.U. There remains potential legal uncertainty and potentially divergent national laws and regulations as the U.K. determines which E.U. laws to replace and/or replicate.
The announcement and implementation of Brexit has caused significant volatility in global stock markets and currency exchange rate fluctuations. With the expansion of our international operations, our exposure to currency exchange rate fluctuation has increased. This increase in exposure could have an adverse effect on our results of operations and net asset balances, due, in part, to currency fluctuations impacting the British pound and the Euro. Brexit may also create global uncertainty, which may cause a decrease in consumer discretionary spending. Decreases in consumer discretionary spending may affect cable television and other video service subscriptions where our networks are distributed. A decrease in the number of subscribers receiving our programming could have a negative impact on our distribution revenues and the rates we are able to charge for advertising. In addition, different market requirements for advertising content may impact our advertising revenues. Any of the foregoing factors may adversely affect our business, results of operations or financial position.
Foreign exchange rate fluctuations may adversely affect our operating results and financial conditions.
We have significant operations in a number of foreign jurisdictions and certain of our operations are conducted and certain of our debt obligations are denominated in foreign currencies. As a result, we have exposure to foreign currency risk as we enter into transactions and make investments denominated in multiple currencies. The value of these currencies fluctuates relative to the U.S. dollar. Our consolidated financial statements are denominated in U.S. dollars, and to prepare those financial statements we must translate the amounts of the assets, liabilities, net sales, other revenues and expenses of our operations outside of the U.S. from local currencies into U.S. dollars using exchange rates for the current period. As we have expanded our international operations, our exposure to exchange rate fluctuations has increased. This increased exposure could have an adverse effect on our reported results of operations and net asset balances. There is no assurance that downward trending currencies will rebound or that stable currencies will remain unchanged in any period or for any specific market.
Increasing complexity of global tax policy and regulations could adversely impact our international business and results of operations.
We continue to face the increasing complexity of operating a global business, as we are subject to tax policy and regulations in multiple non-U.S. jurisdictions. Many foreign jurisdictions are contemplating additional taxes and/or levies on media advertising, including the recently announced proposed levy on media companies under consideration by the Polish government. In addition, many foreign jurisdictions have increased scrutiny and have either changed, or plan to change, their international tax systems due to the Organisation for Economic Co-operation and Development’s (“OECD”) Base Erosion and Profit Shifting (“BEPS”) recommendations. The BEPS recommendations call for enhanced transparency and reporting relating to companies’ entity structures and transfer pricing policies. These have been implemented through various initiatives including the requirement for taxpayers to comply with global country-by-country reporting and the filing of a global master file as well as the introduction of the multilateral instrument (“MLI”) which allows taxing authorities to better take aim at multinational tax avoidance. We continue to address and comply with these compliance and reporting requirements.
Additional complexity has also arisen in state aid: state resources used to provide recipients an advantage on a selective basis that has or could distort competition and affect trade between European member states. In recent years the European Commission (“EC”) has increased their scrutiny on state aid and deviated from the historical E.U. state aid practices. There is great uncertainty about the future of E.U. state aid practices based on the appeals of many significant EC rulings against multinational corporations that are currently being challenged. The potential impact of these rulings is difficult to assess and our transfer pricing analyses conducted pursuant to accepted OECD methodologies may not sufficiently mitigate risk associated with our past or current agreements.
In addition, the determination of our worldwide provision for income taxes and current and deferred tax assets and liabilities requires judgment and estimation. Our income taxes could also be materially adversely affected by earnings being lower than anticipated in jurisdictions that have lower statutory tax rates and higher than anticipated in jurisdictions that have higher statutory tax rates, by changes in the valuation of our deferred tax assets and liabilities, or by changes in worldwide tax laws, regulations, or accounting principles.
In the U.S., President Biden put forth several corporate income tax proposals during his campaign, including a significant increase in the corporate income tax rate and changes in the taxation of non-U.S. income. While it is too early to predict the outcome of these proposals, if enacted, they would have a material impact on our income tax liability.
Risks Related to Our Business Model and Capital Structure
We have a significant amount of debt and may incur significant amounts of additional debt, which could adversely affect our financial health and our ability to react to changes in our business.
As of December 31, 2020, we had approximately $15.4 billion of consolidated debt, of which $335 million is current. Our substantial level of indebtedness increases the possibility that we may be unable to generate cash sufficient to pay when due the principal of, interest on, or other amounts associated with our indebtedness. In addition, we have the ability to draw down our $2.5 billion revolving credit facility in the ordinary course, which would have the effect of increasing our indebtedness. We are also permitted, subject to certain restrictions under our existing indebtedness, to obtain additional long-term debt and working capital lines of credit to meet future financing needs. This would have the effect of increasing our total leverage.
Our substantial leverage could have significant negative consequences on our financial condition and results of operations, including:
•impairing our ability to meet one or more of the financial ratio covenants contained in our revolving credit facility or to generate cash sufficient to pay interest or principal, which could result in an acceleration of some or all of our outstanding debt in the event that an uncured default occurs;
•increasing our vulnerability to general adverse economic and market conditions;
•limiting our ability to obtain additional debt or equity financing;
•requiring the dedication of a substantial portion of our cash flow from operations to service our debt, thereby reducing the amount of cash flow available for other purposes;
•requiring us to sell debt or equity securities or to sell some of our core assets, possibly on unfavorable terms, to meet payment obligations;
•limiting our flexibility in planning for, or reacting to, changes in our business and the markets in which we compete; and
•placing us at a possible competitive disadvantage with less leveraged competitors and competitors that may have better access to capital resources.
Our ability to incur debt and the use of our funds could be limited by the restrictive covenants in the loan agreement for our revolving credit facility.
The loan agreement for our revolving credit facility contains restrictive covenants, as well as requirements to comply with certain leverage and other financial maintenance tests. These covenants and requirements could limit our ability to take various actions, including incurring additional debt, guaranteeing indebtedness and engaging in various types of transactions, including mergers, acquisitions and sales of assets. These covenants could place us at a disadvantage compared to some of our competitors, who may have fewer restrictive covenants and may not be required to operate under these restrictions. Further, these covenants could have an adverse effect on our business by limiting our ability to take advantage of financing, mergers and acquisitions or other opportunities.
Financial performance for our equity method investments and investments without readily determinable fair value may differ from current estimates.
We have equity investments in several entities and the accounting treatment applied for these investments varies depending on a number of factors, including, but not limited to, our percentage ownership and the level of influence or control we have over the relevant entity. Any losses experienced by these entities could adversely impact our results of operations and the value of our investment. In addition, if these entities were to fail and cease operations, we may lose the entire value of our investment and the stream of any shared profits. Some of our ventures may require additional uncommitted funding. We also have significant investments in entities that we have accounted for as investments without readily determinable fair value. If these entities experience significant losses or were to fail and cease operations, our investments could be subject to impairment and the loss of a part or all of our investment value.
As a holding company, we could be unable to obtain cash in amounts sufficient to meet our financial obligations or other commitments.
Our ability to meet our financial obligations and other contractual commitments will depend upon our ability to access cash. We are a holding company, and our sources of cash include our available cash balances, net cash from the operating activities of our subsidiaries, any dividends and interest we may receive from our investments, availability under our credit facility or any credit facilities that we may obtain in the future and proceeds from any asset sales we may undertake in the future. The ability of our operating subsidiaries, including Discovery Communications, LLC, to pay dividends or to make other payments or advances to us will depend on their individual operating results and any statutory, regulatory or contractual restrictions, including restrictions under our credit facility, to which they may be or may become subject. Under the 2017 Tax Cuts and Jobs Act, we were subject to U.S. taxes for the deemed repatriation of certain cash balances held by foreign corporations. The Company intends to continue to permanently reinvest these funds outside of the U.S., and current plans do not demonstrate a need to repatriate them to fund our U.S. operations.
Risks Related to Corporate Structure
We have directors in common with those of Liberty Media Corporation (“Liberty Media”), Liberty Global plc (“Liberty Global”), Qurate Retail Group f/k/a Liberty Interactive Corporation (“Qurate Retail”), Liberty Broadband Corporation ("Liberty Broadband"), and Liberty Latin America Ltd ("LLA"), which may result in the diversion of business opportunities or other potential conflicts.
Liberty Media, Liberty Global, Qurate Retail, Liberty Broadband and LLA (together, the "Liberty Entities") own interests in various U.S. and international companies, such as Charter Communications, Inc. ("Charter"), that have subsidiaries that own or operate domestic or foreign content services that may compete with the content services we offer. We have no rights in respect of U.S. or international content opportunities developed by or presented to the subsidiaries of any Liberty Entities, and the pursuit of these opportunities by such subsidiaries may adversely affect our interests and those of our stockholders. Because we and the Liberty Entities have overlapping directors, the pursuit of business opportunities may serve to intensify the conflicts of interest or appearance of conflicts of interest faced by the respective management teams. Our charter provides that none of our directors or officers will be liable to us or any of our subsidiaries for breach of any fiduciary duty by reason of the fact that such individual directs a corporate opportunity to another person or entity (including any Liberty Entities), for which such individual serves as a director or officer, or does not refer or communicate information regarding such corporate opportunity to us or any of our subsidiaries, unless (a) such opportunity was expressly offered to such individual solely in his or her capacity as a director or officer of us or any of our subsidiaries and (b) such opportunity relates to a line of business in which we or any of our subsidiaries is then directly engaged.
We have directors that are also related persons of Advance/Newhouse and that overlap with those of the Liberty Entities, which may lead to conflicting interests for those tasked with the fiduciary duties of our board.
Our twelve-person board of directors includes three designees of Advance/Newhouse Programming Partnership ("Advance/Newhouse"), including Robert J. Miron, who was the Chairman of Advance/Newhouse until December 31, 2010, and Steven A. Miron, the Chief Executive Officer of Advance/Newhouse. In addition, our board of directors includes two persons who are currently members of the board of directors of Liberty Media, three persons who are currently members of the board of directors of Liberty Global, one person who is currently a member of the board of directors of Qurate Retail, two persons who are currently members of the board of directors of Liberty Broadband, one person who is currently a member of the board of directors of Charter, of which Liberty Broadband owns an equity interest, and two persons who are currently members of the board of directors of LLA. John C. Malone is the Chairman of the boards of all of the Liberty Entities other than LLA and Qurate Retail. The parent company of Advance/Newhouse and the Liberty Entities own interests in a range of media, communications and entertainment businesses.
Advance/Newhouse will elect three directors annually for so long as it owns a specified minimum amount of our Series A-1 convertible preferred stock. The Advance/Newhouse Series A-1 convertible preferred stock, which votes with our common stock on all matters other than the election of directors, represents approximately 24% of the voting power of our outstanding shares. The Series A-1 convertible preferred stock also grants Advance/Newhouse consent rights over a range of our corporate actions, including fundamental changes to our business, the issuance of additional capital stock, mergers and business combinations and certain acquisitions and dispositions.
None of the Liberty Entities own any interest in us. Mr. Malone beneficially owns: shares of Liberty Media representing approximately 47% of the aggregate voting power of its outstanding stock, shares representing approximately 30% of the aggregate voting power of Liberty Global, shares representing approximately 40% of the aggregate voting power of Qurate Retail, shares representing approximately 48% of the aggregate voting power of Liberty Broadband and shares representing approximately 21% of the aggregate voting power (other than with respect to the election of the common stock directors) of our outstanding stock. Mr. Malone controls approximately 27% of our aggregate voting power relating to the election of our nine common stock directors, assuming that the preferred stock owned by Advance/Newhouse has not been converted into shares of our common stock. Our directors who are also directors of the Liberty Entities hold stock and stock-based compensation in the Liberty Entities and hold our stock and stock-based compensation.
These ownership interests and/or business positions could create, or appear to create, potential conflicts of interest when these individuals are faced with decisions that could have different implications for us, Advance/Newhouse and/or the Liberty Entities. For example, there may be the potential for a conflict of interest when we, on the one hand, or Advance/Newhouse and/or one or more of the Liberty Entities, on the other hand, consider acquisitions and other corporate opportunities that may be suitable for the other.
The members of our board of directors have fiduciary duties to us and our stockholders. Likewise, those persons who serve in similar capacities at Advance/Newhouse or a Liberty Entity have fiduciary duties to those companies. Therefore, such persons may have conflicts of interest or the appearance of conflicts of interest with respect to matters involving or affecting both respective companies, and there can be no assurance that the terms of any transactions will be as favorable to us or our subsidiaries as would be the case in the absence of a conflict of interest.
It may be difficult for a third party to acquire us, even if such acquisition would be beneficial to our stockholders.
Certain provisions of our charter and bylaws may discourage, delay or prevent a change in control that a stockholder may consider favorable. These provisions include the following:
•authorizing a capital structure with multiple series of common stock: a Series B that entitles the holders to ten votes per share, a Series A-1 that entitles the holders to one vote per share and a Series C that, except as otherwise required by applicable law, entitles the holders to no voting rights;
•authorizing the Series A-1 convertible preferred stock with special voting rights, which prohibits us from taking any of the following actions, among others, without the prior approval of the holders of a majority of the outstanding shares of such stock:
◦increasing the number of members of the Board of Directors above ten;
◦making any material amendment to our charter or by-laws;
◦engaging in a merger, consolidation or other business combination with any other entity; and
◦appointing or removing our Chairman of the Board or our Chief Executive Officer;
•authorizing the issuance of “blank check” preferred stock, which could be issued by our Board of Directors to increase the number of outstanding shares and thwart a takeover attempt;
•classifying our common stock directors with staggered three-year terms and having three directors elected by the holders of the Series A convertible preferred stock, which may lengthen the time required to gain control of our Board of Directors;
•limiting who may call special meetings of stockholders;
•prohibiting stockholder action by written consent (subject to certain exceptions), thereby requiring stockholder action to be taken at a meeting of the stockholders;
•establishing advance notice requirements for nominations of candidates for election to our Board of Directors or for proposing matters that can be acted upon by stockholders at stockholder meetings;
•requiring stockholder approval by holders of at least 80% of our voting power or the approval by at least 75% of our Board of Directors with respect to certain extraordinary matters, such as a merger or consolidation, a sale of all or substantially all of our assets or an amendment to our charter;
•requiring the consent of the holders of at least 75% of the outstanding Series B common stock (voting as a separate class) to certain share distributions and other corporate actions in which the voting power of the Series B common stock would be diluted by, for example, issuing shares having multiple votes per share as a dividend to holders of Series A common stock; and
•the existence of authorized and unissued stock which would allow our Board of Directors to issue shares to persons friendly to current management, thereby protecting the continuity of our management, or which could be used to dilute the stock ownership of persons seeking to obtain control of us.
We have also adopted a shareholder rights plan in order to encourage anyone seeking to acquire us to negotiate with our Board of Directors prior to attempting a takeover. While the plan is designed to guard against coercive or unfair tactics to gain control of us, the plan may have the effect of making more difficult or delaying any attempts by others to obtain control of us.
Holders of any single series of our common stock may not have any remedies if any action by our directors or officers has an adverse effect on only that series of common stock.
Principles of Delaware law and the provisions of our charter may protect decisions of our Board of Directors that have a disparate impact upon holders of any single series of our common stock. Under Delaware law, the Board of Directors has a duty to act with due care and in the best interests of all of our stockholders, including the holders of all series of our common stock. Principles of Delaware law established in cases involving differing treatment of multiple classes or series of stock provide that a board of directors owes an equal duty to all common stockholders regardless of class or series and does not have separate or additional duties to any group of stockholders. As a result, in some circumstances, our directors may be required to make a decision that is adverse to the holders of one series of common stock. Under the principles of Delaware law referred to above, stockholders may not be able to challenge these decisions if our Board of Directors is disinterested and adequately informed with respect to these decisions and acts in good faith and in the honest belief that it is acting in the best interests of all of our stockholders.
If Advance/Newhouse were to exercise its registration rights, it may cause a significant decline in our stock price, even if our business is doing well.
Advance/Newhouse has been granted registration rights covering all of the shares of common stock issuable upon conversion of the convertible preferred stock held by Advance/Newhouse. Each share of Advance/Newhouse’s Series A-1 convertible preferred stock is currently convertible into nine shares of our Series A common stock and each share of Advance/Newhouse’s Series C-1 convertible preferred stock is convertible into 19.3648 shares of our Series C common stock, subject to certain anti-dilution adjustments. The registration rights, which are immediately exercisable, are transferable with the sale or transfer by Advance/Newhouse of blocks of shares representing 10% or more of the preferred stock it holds. The exercise of the registration rights, and subsequent sale of possibly large amounts of our common stock in the public market, could materially and adversely affect the market price of our common stock.
John C. Malone and Advance/Newhouse each have significant voting power with respect to corporate matters considered by our stockholders.
For corporate matters other than the election of directors, Mr. Malone and Advance/Newhouse each beneficially own shares of our stock representing approximately 21% and 24%, respectively, of the aggregate voting power represented by our outstanding stock. With respect to the election of directors, Mr. Malone controls approximately 27% of the aggregate voting power relating to the election of the nine common stock directors (assuming that the convertible preferred stock owned by Advance/Newhouse (the “A/N Preferred Stock”) has not been converted into shares of our common stock). The A/N Preferred Stock carries with it the right to designate three preferred stock directors to our board (subject to certain conditions) but does not carry voting rights with respect to the election of the nine common stock directors. Also, under the terms of the A/N Preferred Stock, Advance/Newhouse has special voting rights as to certain enumerated matters, including material amendments to the restated charter and bylaws, fundamental changes in our business, mergers and other business combinations, certain acquisitions and dispositions and future issuances of capital stock. Although there is no stockholder agreement, voting agreement or any similar arrangement between Mr. Malone and Advance/Newhouse, by virtue of their respective holdings, Mr. Malone and Advance/Newhouse each have significant influence over the outcome of any corporate transaction or other matter submitted to our stockholders.
General Risks
Theft of our content, including digital copyright theft and other unauthorized exhibitions of our content, may decrease revenue received from our programming and adversely affect our businesses and profitability.
The success of our business depends in part on our ability to maintain the intellectual property rights to our entertainment content. We are fundamentally a content company, and piracy of our brands, television networks, digital content and other intellectual property has the potential to significantly and adversely affect us. Piracy is particularly prevalent in many parts of the world that lack copyright and other protections similar to existing law in the U.S. It is also made easier by technological advances allowing the conversion of content into digital formats, which facilitates the creation, transmission and sharing of high-quality unauthorized copies. Unauthorized distribution of copyrighted material over the Internet is a threat to copyright owners’ ability to protect and exploit their property. The proliferation of unauthorized use of our content may have an adverse effect on our business and profitability because it reduces the revenue that we potentially could receive from the legitimate sale and distribution of our content. Litigation may be necessary to enforce our intellectual property rights, protect trade secrets or to determine the validity or scope of proprietary rights claimed by others.
Domestic and foreign laws and regulations could adversely impact our operating results.
Programming services like ours, and the distributors of our services, including cable operators, satellite operators and other multi-channel video programming distributors, are regulated by U.S. federal laws and regulations issued and administered by various federal agencies, including the FCC, as well as by state and local governments, in ways that affect the daily conduct of our video content business. See the discussion under “Business – Regulatory Matters” above. The U.S. Congress, the FCC and the courts currently have under consideration, and may adopt or interpret in the future, new laws, regulations and policies regarding a wide variety of matters that could, directly or indirectly, affect the operations of our U.S. media properties or modify the terms under which we offer our services and operate.
Similarly, the foreign jurisdictions in which our networks are offered have, in varying degrees, laws and regulations governing our businesses. Programming businesses are subject to regulation on a country-by-country basis. Changes in regulations imposed by foreign governments could also adversely affect our business, results of operations and ability to expand our operations beyond their current scope.
Financial markets are subject to volatility and disruptions that may affect our ability to obtain or increase the cost of financing our operations and our ability to meet our other obligations.
Increased volatility and disruptions in the U.S. and global financial and equity markets may make it more difficult for us to obtain financing for our operations or investments or increase the cost of obtaining financing. Our borrowing costs can be affected by short and long-term debt ratings assigned by independent rating agencies which are based, in significant part, on our performance as measured by credit metrics such as interest coverage and leverage ratios. A low rating could increase our cost of borrowing or make it more difficult for us to obtain future financing. Unforeseeable changes in foreign currencies could negatively impact our results of operations and calculations of interest coverage and leverage ratios.
Acquisitions and other strategic transactions present many risks and we may not realize the financial and strategic goals that were contemplated at the time of any transaction.
From time to time we make acquisitions, investments and enter into other strategic transactions, such as the Scripps Acquisition. In connection with such acquisitions and strategic transactions, we may incur unanticipated expenses, fail to realize anticipated benefits, have difficulty incorporating the acquired businesses, disrupt relationships with current and new employees, subscribers, affiliates and vendors, incur significant debt, or have to delay or not proceed with announced transactions. Additionally, regulatory agencies, such as the FCC or U.S. Department of Justice may impose additional restrictions on the operation of our business as a result of our seeking regulatory approvals for any significant acquisitions and strategic transactions. The occurrence of any of these events could have an adverse effect on our business.
Our inability to successfully acquire and integrate other businesses, assets, products or technologies could harm our operating results.
Our success may depend on opportunities to buy other businesses or technologies that could complement, enhance or expand our current business or products or that might otherwise offer us growth opportunities. We have acquired, and have made strategic investments in, a number of companies (including through joint ventures) in the past, such as the Scripps Acquisition, and we expect to make additional acquisitions and strategic investments in the future. Such transactions may result in dilutive issuances of our equity securities, use of our cash resources, and incurrence of debt and amortization expenses related to intangible assets. Any acquisitions and strategic investments that we are able to identify and complete may be accompanied by a number of risks, including:
•the difficulty of assimilating the operations and personnel of acquired companies into our operations;
•the potential disruption of our ongoing business and distraction of management;
•the incurrence of additional operating losses and operating expenses of the businesses we acquired or in which we invested;
•the difficulty of integrating acquired technology and rights into our services and unanticipated expenses related to such integration;
•the failure to successfully further develop an acquired business or technology and any resulting impairment of amounts currently capitalized as intangible assets;
•the failure of strategic investments to perform as expected or to meet financial projections;
•the potential for patent and trademark infringement and data privacy and security claims against the acquired companies, or companies in which we have invested;
•litigation or other claims in connection with acquisitions, acquired companies, or companies in which we have invested;
•the impairment or loss of relationships with customers and partners of the companies we acquired or in which we invested or with our customers and partners as a result of the integration of acquired operations;
•the impairment of relationships with, or failure to retain, employees of acquired companies or our existing employees as a result of integration of new personnel;
•our lack of, or limitations on our, control over the operations of our joint venture companies;
•the difficulty of integrating operations, systems, and controls as a result of cultural, regulatory, systems, and operational differences;
•in the case of foreign acquisitions and investments, the impact of particular economic, tax, currency, political, legal and regulatory risks associated with specific countries; and
•the impact of known potential liabilities or liabilities that may be unknown, including as a result of inadequate internal controls, associated with the companies we acquired or in which we invested.
Our failure to be successful in addressing these risks or other problems encountered in connection with our past or future acquisitions and strategic investments could cause us to fail to realize the anticipated benefits of such acquisitions or investments, incur unanticipated liabilities, and harm our business generally.
The loss of key personnel or talent could disrupt our business and adversely affect our revenue.
Our business depends upon the continued efforts, abilities and expertise of our corporate and divisional executive teams and entertainment personalities. Following the completion of a merger, like the Scripps Acquisition, current and prospective employees may experience uncertainty about their future roles with Discovery and choose to pursue other opportunities, which could have an adverse effect on Discovery. If key employees depart, our business may be adversely affected. Additionally, we employ or contract with entertainment personalities who may have loyal audiences. These individuals are important to audience endorsement of our programs and other content. There can be no assurance that these individuals will remain with us or retain their current audiences. If we fail to retain key individuals or if our entertainment personalities lose their current audience base, our operations could be adversely affected.
ITEM 1B. Unresolved Staff Comments.
None.
ITEM 2. Properties.
We own and lease approximately 3.33 million square feet of building space in 120 locations around the world.
In the U.S., we have 29 locations including 405 thousand square feet of owned space and 1.37 million square feet that we lease. Principal locations in the U.S. include:
(i) a planned Global headquarters in New York, New York; once completed it will house various business units including Direct-to-Consumer, Corporate functions, U.S. Ad Sales, U.S. Networks and Discovery Digital Studios,
(ii) two leased offices across New York, New York, collectively used to support Corporate functions, U.S. Ad Sales, U.S. Networks, Direct-to-Consumer and Discovery Digital Studios, which will be consolidated into the Global Headquarters after their leases expire in 2021,
(iii) three owned offices in Knoxville, Tennessee, used for general office space, technology support and content production (including studios and production support), and warehouse space, respectively,
(iv) two leased offices in Los Angeles, California, used for general office space by our U.S. Networks, U.S. Ad Sales and Corporate functions, and by our U.S. Networks and content production functions (including production support), respectively,
(v) leased general office space in Miami, Florida, primarily used by our International Networks segment, where work is underway to reduce our real estate footprint in 2021, and
(vi) an owned technical facility in Sterling, Virginia, used to manage all technical aspects of the majority of our global linear and digital businesses.
We also own and lease approximately 1.56 million square feet of building space at 91 locations outside of the U.S. and are rationalizing our overall real estate footprint as individual leases expire.
In Poland, our TVN business unit has 34 locations including 299 thousand square feet of owned space and 392 thousand square feet that we lease. The TVN office locations are used for linear and digital news and entertainment content production, including studios, warehouse, production, technology, broadcasting and supporting office space, and are located primarily in Warsaw and Krakow. Other principal locations outside of the U.S. include the Office, Production and Playout space in the U.K. and France, and Office and Production space in New Zealand, Denmark, Norway, Germany, and Italy.
We have undertaken consolidations across our global real estate portfolio, resulting in a reduction of approximately 196 thousand square feet.
Each property is considered to be in good condition, adequate for its purpose, and suitably utilized according to the individual nature and requirements of the relevant operations. Our policy is to improve and replace property as considered appropriate to meet the needs of the individual operation.
Our facility management response to COVID-19 was immediate and our site teams continue to follow guidelines issued by local, national and regional public and government health authorities. Our enhanced cleaning and disinfecting programs were proactive and are ongoing and we are addressing environmental and building infrastructural components such as air quality, ventilation and filtration.
ITEM 3. Legal Proceedings.
The Company is party to various lawsuits and claims in the ordinary course of business. However, a determination as to the amount of the accrual required for such contingencies is highly subjective and requires judgments about future events. Although the outcome of these matters cannot be predicted with certainty and the impact of the final resolution of these matters on the Company's results of operations in a particular subsequent reporting period is not known, management does not believe that the resolution of these matters will have a material adverse effect on our consolidated financial position, future results of operations or liquidity.
ITEM 4. Mine Safety Disclosures.
Not applicable.
Information about our Executive Officers
Pursuant to General Instruction G(3) to Form 10-K, the information regarding our executive officers required by Item 401(b) of Regulation S-K is hereby included in Part I of this report. The following table sets forth the name and date of birth of each of our executive officers and the office held by such officer as of February 22, 2021.
| | | | | | | | |
| | |
| Name | | Position |
| |
David M. Zaslav
Born January 15, 1960 | | President, Chief Executive Officer and a common stock director. Mr. Zaslav has served as our President and Chief Executive Officer since January 2007 and a common stock director since September 2008. Mr. Zaslav served as President, Cable & Domestic Television and New Media Distribution of NBC Universal, Inc. ("NBC"), a media and entertainment company, from May 2006 to December 2006. Mr. Zaslav served as Executive Vice President of NBC, and President of NBC Cable, a division of NBC, from October 1999 to May 2006. Mr. Zaslav is a member of the board of Sirius XM Radio Inc., Grupo Televisa S.A.B and LionsGate Entertainment Corp. |
| |
Gunnar Wiedenfels
Born September 6, 1977 | | Chief Financial Officer. Mr. Wiedenfels has served as our Chief Financial Officer since April 2017. Prior to joining Discovery, Mr. Wiedenfels served as Chief Financial Officer of ProSiebenSat.1 Media SE ("ProSieben") starting in 2015. Prior to that, he served as ProSieben's Deputy Chief Financial Officer from 2014 to 2015 and served as Chief Group Controller from 2013 to 2015. Previously, he served as ProSieben's Deputy Group Controller, responsible for group-wide budget planning, budget controlling, and management reporting and as Chief Financial Officer, National, where he had commercial responsibility for the group's German- speaking free TV segment. Before this, he worked as a management consultant and engagement manager at McKinsey & Company. In May 2019, Mr. Wiedenfels joined the supervisory board of SAP SE and serves as chairman of their audit committee. |
| | |
Jean-Briac Perrette
Born April 30, 1971
| | President and CEO of Discovery International. Mr. Perrette became CEO of Discovery International (formerly referred to as Discovery Networks International) in June 2016 and President of Discovery Networks International in March 2014. Prior to that, Mr. Perrette served as our Chief Digital Officer from October 2011 to February 2014. Mr. Perrette served in a number of roles at NBC Universal from March 2000 to October 2011, with the last being President of Digital and Affiliate Distribution. |
| | |
Adria Alpert Romm
Born March 2, 1955 | | Chief People and Culture Officer since April 2019. Ms. Romm served as our Chief Human Resources and Diversity Officer from March 2014 to March 2019. Prior to that, Ms. Romm served as our Senior Executive Vice President of Human Resources from March 2007 to February 2014. Ms. Romm served as Senior Vice President of Human Resources of NBC from 2004 to 2007. Prior to 2004, Ms. Romm served as a Vice President in Human Resources for the NBC TV network and NBC staff functions. |
| |
Bruce L. Campbell
Born November 26, 1967 | | Chief Development, Distribution & Legal Officer. Mr. Campbell became our Chief Distribution Officer in October 2015, Chief Development Officer in August 2010 and served as our General Counsel from December 2010 to April 2017. Mr. Campbell served as Digital Media Officer from August 2014 through October 2015. Prior to that, Mr. Campbell served as our President, Digital Media & Corporate Development from March 2007 through August 2010. Mr. Campbell also served as our corporate secretary from December 2010 to February 2012. Mr. Campbell served as Executive Vice President, Business Development of NBC from December 2005 to March 2007, and Senior Vice President, Business Development of NBC from January 2003 to November 2005. |
| | |
| | |
| | |
David Leavy
Born December 24, 1969 | | Chief Corporate Operating Officer. Mr. Leavy served as our Chief Corporate Operations and Communications Officer from March 2016 to June 2019 and became our Chief Corporate Operating Officer in July 2019. Prior to that, Mr. Leavy served as our Chief Communications Officer and Senior Executive Vice President, Corporate Marketing and Business Operations from August 2015 to March 2016. From December 2011 to August 2015, Mr. Leavy served as our Chief Communications Officer and Senior Executive Vice President, Corporate Marketing and Affairs. Prior to that, Mr. Leavy served as our Executive Vice President, Communications and Corporate Affairs and has served in a number of other roles at Discovery since joining in March 2000. |
| | |
| | | | | | | | |
| | |
| Name | | Position |
| |
Lori Locke
Born August 23, 1963
| | Chief Accounting Officer. Ms. Locke joined Discovery as our Chief Accounting Officer in June 2019. Prior to joining Discovery, Ms. Locke served as Vice President, Corporate Controller and Principal Accounting Officer for Gannett Co., Inc. (“Gannett”), a media company, from June 2015 to May 2019. Before joining Gannett, Ms. Locke was Vice President and Corporate Assistant Controller for Leidos, Inc. (formerly SAIC, Inc.), a science, engineering and information technology company, from February 2013 to May 2015. |
| | |
Savalle C. Sims
Born May 21, 1970 | | Executive Vice President and General Counsel. Ms. Sims became Executive Vice President and General Counsel in April 2017. Ms. Sims served as our Executive Vice President and Deputy General Counsel from December 2014 to April 2017. Prior to that, Ms. Sims served as our Senior Vice President, Litigation and Intellectual Property from August 2011 through December 2014. Prior to joining Discovery, Ms. Sims was a partner at the law firm of Arent Fox LLP. |
PART II
ITEM 5. Market for Registrant’s Common Equity, Related Stockholder Matters and Issuer Purchases of Equity Securities.
Our Series A common stock, Series B common stock and Series C common stock are listed and traded on The Nasdaq Global Select Market (“NASDAQ”) under the symbols “DISCA,” “DISCB” and “DISCK,” respectively.
As of February 8, 2021, there were approximately 1,106, 64 and 1,629 record holders of our Series A common stock, Series B common stock and Series C common stock, respectively. These amounts do not include the number of shareholders whose shares are held of record by banks, brokerage houses or other institutions, but include each such institution as one shareholder.
We have not paid any cash dividends on our Series A common stock, Series B common stock or Series C common stock, and we have no present intention to do so. Payment of cash dividends, if any, will be determined by our Board of Directors after consideration of our earnings, financial condition and other relevant factors such as our credit facility's restrictions on our ability to declare dividends in certain situations.
Stock Performance Graph
The following graph sets forth the cumulative total shareholder return on our Series A common stock, Series B common stock and Series C common stock as compared with the cumulative total return of the companies listed in the Standard and Poor’s 500 Stock Index (“S&P 500 Index”) and a peer group of companies (the "Peer Group"). The Peer Group is comprised of The Walt Disney Company, ViacomCBS, Inc. Class B common stock, Fox Corporation Class A common stock and AMC Networks Inc. Class A common stock. The graph assumes $100 originally invested on December 31, 2015 in each of our Series A common stock, Series B common stock and Series C common stock, the S&P 500 Index, and the stocks of the Peer Group, including reinvestment of dividends, for the years ended December 31, 2016, 2017, 2018, 2019 and 2020.
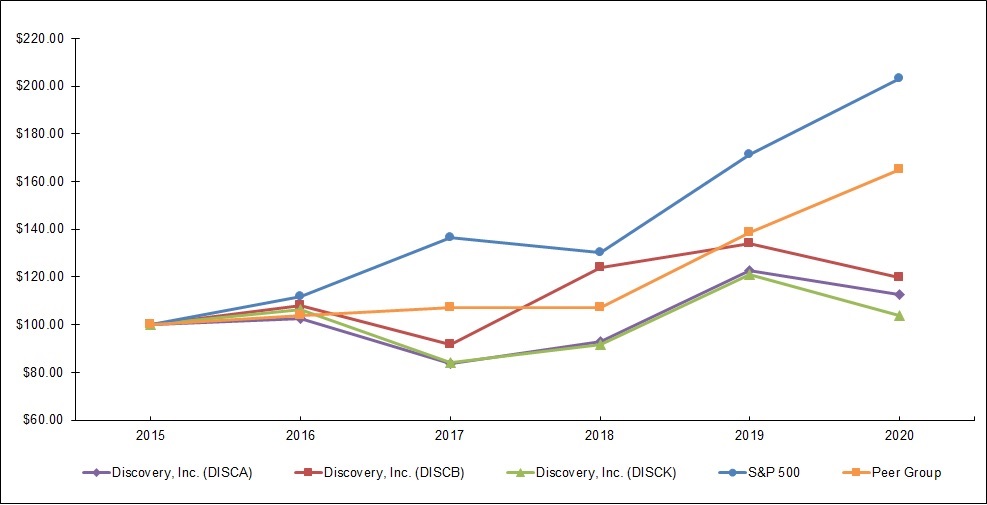
| | | | | | | | | | | | | | | | | | | | | | | | | | | | | | | | | | | | | | |
| | December 31,
2015 | | December 31,
2016 | | December 31, 2017 | | December 31, 2018 | | December 31, 2019 | | December 31, 2020 |
| DISCA | | $ | 100.00 | | | $ | 102.74 | | | $ | 83.89 | | | $ | 92.74 | | | $ | 122.73 | | | $ | 112.79 | |
| DISCB | | $ | 100.00 | | | $ | 107.84 | | | $ | 91.75 | | | $ | 123.94 | | | $ | 134.15 | | | $ | 119.87 | |
| DISCK | | $ | 100.00 | | | $ | 106.19 | | | $ | 83.94 | | | $ | 91.51 | | | $ | 120.90 | | | $ | 103.85 | |
| S&P 500 | | $ | 100.00 | | | $ | 111.96 | | | $ | 136.40 | | | $ | 130.42 | | | $ | 171.49 | | | $ | 203.04 | |
| Peer Group | | $ | 100.00 | | | $ | 103.66 | | | $ | 107.06 | | | $ | 107.22 | | | $ | 138.63 | | | $ | 164.87 | |
Recent Sales of Unregistered Securities
On December 21, 2020, we issued 1,340,954 shares of our Series A common stock in a private transaction exempt from registration under Section 4(a)(2) of the Securities Act to Harpo, Inc. (“Harpo”) in exchange for a portion of Harpo’s equity interest in our consolidated subsidiary OWN LLC (“OWN LLC”), a joint venture between Harpo and our wholly-owned indirect subsidiary, Discovery Communications LLC. We received aggregate consideration valued at approximately $35 million in the form of a portion of Harpo’s equity in OWN LLC.
Purchases of Equity Securities
The following table presents information about our repurchases of common stock that were made through open market transactions during the three months ended December 31, 2020 (in millions, except per share amounts).
| | | | | | | | | | | | | | | | | | | | | | | | | | |
| Period | | Total Number
of Series C Shares
Purchased | | Average Price Paid per Share: Series C (a) | | Total Number
of Shares
Purchased as
Part of Publicly
Announced
Plans or
Programs | | Approximate
Dollar Value of
Shares that May
Yet Be Purchased
Under the Plans or Programs |
| October 1, 2020 - October 31, 2020 | | 7,116,503 | | | $ | 19.01 | | | 7,116,503 | | | $ | 1,477,152,160 | |
| November 1, 2020 - November 30, 2020 | | 3,808,891 | | | $ | 20.41 | | | 3,808,891 | | | $ | 1,399,423,245 | |
| December 1, 2020 - December 31, 2020 | | — | | | $ | — | | | — | | | $ | 1,399,423,245 | |
| Total | | 10,925,394 | | | | | 10,925,394 | | | |
(a) The amounts do not give effect to any fees, commissions or other costs associated with repurchases of shares.
ITEM 7. Management’s Discussion and Analysis of Financial Condition and Results of Operations.
Management’s discussion and analysis of financial condition and results of operations is a supplement to and should be read in conjunction with the accompanying consolidated financial statements and related notes. This section provides additional information regarding our businesses, current developments, results of operations, cash flows, financial condition, contractual commitments and critical accounting policies.
A discussion of our results of operations and liquidity for fiscal 2019 compared to fiscal 2018 can be found under Item 7 in our Annual Report on Form 10-K for the fiscal year ended December 31, 2019, filed on February 27, 2020, which is available free of charge on the SEC’s website at www.sec.gov and our Investor Relations website at ir.corporate.discovery.com.
BUSINESS OVERVIEW
We are a global media company that provides content across multiple distribution platforms, including linear platforms such as pay-TV, FTA and broadcast television, our authenticated GO applications, digital distribution arrangements, content licensing arrangements and DTC subscription products. For a discussion of our global portfolio of networks and joint ventures see our business overview set forth in Item 1, “Business” in this Annual Report on Form 10-K.
Our content spans genres including survival, natural history, exploration, sports, general entertainment, home, food, travel, heroes, adventure, crime and investigation, health and kids. We have an extensive library of content and own most rights to our content and footage, which enables us to leverage our library to quickly launch brands and services into new markets and on new platforms. Our content can be re-edited and updated in a cost-effective manner to provide topical versions of subject matter that can be utilized around the world on a variety of platforms.
We aim to invest in high-quality content for our networks and brands with the objective of building viewership, optimizing distribution revenue, capturing advertising revenue, and creating or repositioning branded channels and business to sustain long-term growth and occupy a desired content niche with strong consumer appeal. Our strategy is to maximize the distribution, ratings and profit potential of each of our branded networks. In addition to growing distribution and advertising revenues for our branded networks, we have extended content distribution across new platforms, including brand-aligned websites, online streaming, mobile devices, VOD, and broadband channels, which provide promotional platforms for our television content and serve as additional outlets for advertising and distribution revenue. Audience ratings are a key driver in generating advertising revenue and creating demand on the part of cable television operators, DTH satellite operators, telecommunication service providers, and other content distributors who deliver our content to their customers.
Although we utilize certain brands and content globally, we classify our operations in two reportable segments: U.S. Networks, consisting principally of domestic television networks and digital content services, and International Networks, consisting primarily of international television networks and digital content services. Our segment presentation aligns with our management structure and the financial information management uses to make decisions about operating matters, such as the allocation of resources and business performance assessments. For further discussion of financial information for our segments and the geographical areas in which we do business, our content development activities, and revenues see our business overview set forth in Item 1, “Business” and Note 23 to the consolidated financial statements included in Item 8, “Financial Statements and Supplementary Data” in this Annual Report on Form 10-K.
Impact of COVID-19
On March 11, 2020, the World Health Organization declared the COVID-19 outbreak to be a global pandemic. COVID-19 continues to spread throughout the world, and the duration and severity of its effects and associated economic disruption remain uncertain. Restrictions on social and commercial activity in an effort to contain the virus have had, and are expected to continue to have, a significant adverse impact upon many sectors of the U.S. and global economy, including the media industry. We continue to closely monitor the impact of COVID-19 on all aspects of our business and geographies, including the impact on our customers, employees, suppliers, vendors, distribution and advertising partners, production facilities, and various other third parties.
Beginning in the second quarter of 2020, demand for our advertising products and services decreased due to economic disruptions from limitations on social and commercial activity. These economic disruptions and the resulting effect on the Company slightly eased during the second half of 2020, but the pandemic continued to impact demand through the end of 2020 and this decreased demand is expected to continue into 2021. Many of our third-party production partners that were shut down during most of the second quarter of 2020 due to COVID-19 restrictions came back online in the third quarter of 2020 and, as a result, we have incurred additional costs to comply with various governmental regulations and implement certain safety measures for our employees, talent, and partners. Additionally, certain sporting events that we have rights to were cancelled or postponed, thereby eliminating or deferring the related revenues and expenses, including the Tokyo 2020 Olympic Games, which were postponed to 2021. The postponement of the Olympic Games deferred both Olympic-related revenues and significant expenses from fiscal year 2020 to fiscal year 2021.
In response to the impact of the pandemic, we employed and continue to employ innovative production and programming strategies, including producing content filmed by our on-air talent and seeking viewer feedback on which content to air. We continue to pursue a number of cost savings initiatives which began during the third and fourth quarters of 2020 and believe will offset a portion of anticipated revenue losses and deferrals, through the implementation of travel, marketing, production and other operating cost reductions, including personnel reductions, restructurings and resource reallocations to align our expense structure to ongoing changes within the industry. We also implemented remote work arrangements effective mid-March 2020 and, to date, these arrangements have not materially affected our ability to operate our business.
In addition, we implemented several measures to preserve sufficient liquidity in the near term. During March 2020, we drew down $500 million under our $2.5 billion revolving credit facility to increase our cash position and maximize flexibility in light of the current uncertainty surrounding the impact of COVID-19. In addition, in April 2020, we entered into an amendment to our revolving credit facility, which increased flexibility under our financial covenants and issued $1.0 billion aggregate principal amount of senior notes due May 2030 and $1.0 billion aggregate principal amount of Senior Notes due May 2050. The proceeds from the notes were used to fund a tender offer for $1.5 billion of certain Senior Notes with maturities ranging from 2021 through 2023 and to repay the $500 million outstanding under our revolving credit facility.
In light of the impact of COVID-19, we assessed goodwill, other intangibles, deferred tax assets, programming assets, and accounts receivable for recoverability based upon latest estimates and judgments with respect to expected future operating results, ultimate usage of content and latest expectations with respect to expected credit losses. We recorded goodwill and other intangible assets impairment charges of $124 million for our Asia-Pacific reporting unit during 2020. Adjustments to reflect increased expected credit losses were not material. Further, hedged transactions were assessed and we have concluded such transactions remain probable of occurrence. Due to significant uncertainty surrounding the impact of COVID-19, management’s judgments could change in the future. The effects of the pandemic may have further negative impacts on our financial position, results of operations, and cash flows. However, the current level of uncertainty over the economic and operational impacts of COVID-19 means the related financial impact cannot be reasonably and fully estimated at this time.
The nature and extent of COVID-19’s effects on our operations and results will depend on future developments, which are highly uncertain and cannot be predicted, including new information that may emerge concerning the severity and the extent of future surges of COVID-19, vaccine distribution and other actions to contain the virus or treat its impact, among others. We will continue to monitor COVID-19 and its impact on our business results and financial condition. Our consolidated financial statements reflect management’s latest estimates and assumptions that affect the reported amounts of assets and liabilities and related disclosures as of the date of the consolidated financial statements and reported amounts of revenue and expenses during the reporting periods presented. Actual results may differ significantly from these estimates and assumptions.
In the United States, the Coronavirus Aid, Relief, and Economic Security Act (“CARES Act”) was enacted on March 27, 2020, and the Consolidated Appropriations Act, 2021 was enacted on December 27, 2020. As of December 31, 2020, we do not expect the CARES Act or the Consolidated Appropriations Act, 2021 to have a material effect on our financial position and results of operations. We continue to monitor other relief measures taken by the U.S. and other governments around the world.
RESULTS OF OPERATIONS
Items Impacting Comparability
The impact of exchange rates on our business is an important factor in understanding period-to-period comparisons of our results. For example, our international revenues are favorably impacted as the U.S. dollar weakens relative to other foreign currencies, and unfavorably impacted as the U.S. dollar strengthens relative to other foreign currencies. We believe the presentation of results on a constant currency basis (ex-FX), in addition to results reported in accordance with GAAP provides useful information about our operating performance because the presentation ex-FX excludes the effects of foreign currency volatility and highlights our core operating results. The presentation of results on a constant currency basis should be considered in addition to, but not a substitute for, measures of financial performance reported in accordance with GAAP.
The ex-FX change represents the percentage change on a period-over-period basis adjusted for foreign currency impacts. The ex-FX change is calculated as the difference between the current year amounts translated at a baseline rate, which is a spot rate for each of our currencies determined early in the fiscal year as part of our forecasting process (the “2020 Baseline Rate”), and the prior year amounts translated at the same 2020 Baseline Rate. In addition, consistent with the assumption of a constant currency environment, our ex-FX results exclude the impact of our foreign currency hedging activities, as well as realized and unrealized foreign currency transaction gains and losses. Results on a constant currency basis, as we present them, may not be comparable to similarly titled measures used by other companies.
Consolidated Results of Operations – 2020 vs. 2019
Our consolidated results of operations for 2020 and 2019 were as follows (in millions).
| | | | | | | | | | | | | | | | | | | | | | | | | | |
| | Year Ended December 31, | | | | |
| | 2020 | | 2019 | | % Change | | % Change (ex-FX) |
| Revenues: | | | | | | | | |
| Advertising | | $ | 5,583 | | | $ | 6,044 | | | (8) | % | | (7) | % |
| Distribution | | 4,866 | | | 4,835 | | | 1 | % | | 1 | % |
| Other | | 222 | | | 265 | | | (16) | % | | (17) | % |
| Total revenues | | 10,671 | | | 11,144 | | | (4) | % | | (4) | % |
| Costs of revenues, excluding depreciation and amortization | | 3,860 | | | 3,819 | | | 1 | % | | 1 | % |
| Selling, general and administrative | | 2,722 | | | 2,788 | | | (2) | % | | (1) | % |
| Depreciation and amortization | | 1,359 | | | 1,347 | | | 1 | % | | 1 | % |
| Impairment of goodwill and other intangible assets | | 124 | | | 155 | | | (20) | % | | (21) | % |
| Restructuring and other charges | | 91 | | | 26 | | | NM | | NM |
| | | | | | | | |
| Total costs and expenses | | 8,156 | | | 8,135 | | | — | % | | — | % |
| Operating income | | 2,515 | | | 3,009 | | | (16) | % | | (15) | % |
| Interest expense, net | | (648) | | | (677) | | | (4) | % | | |
| Loss on extinguishment of debt | | (76) | | | (28) | | | NM | | |
| Loss from equity investees, net | | (105) | | | (2) | | | NM | | |
| Other income (expense), net | | 42 | | | (8) | | | NM | | |
| Income before income taxes | | 1,728 | | | 2,294 | | | (25) | % | | |
| Income tax expense | | (373) | | | (81) | | | NM | | |
| Net income | | 1,355 | | | 2,213 | | | (39) | % | | |
| Net income attributable to noncontrolling interests | | (124) | | | (128) | | | (3) | % | | |
| Net income attributable to redeemable noncontrolling interests | | (12) | | | (16) | | | (25) | % | | |
| Net income available to Discovery, Inc. | | $ | 1,219 | | | $ | 2,069 | | | (41) | % | | |
NM - Not meaningful
Revenues
Our advertising revenue is generated across multiple platforms and consists of consumer advertising, which is sold primarily on a national basis in the U.S. and on a pan-regional or local-language feed basis outside the U.S. Advertising contracts generally have a term of one year or less. Advertising revenue is dependent upon a number of factors, including the stage of development of television markets, the popularity of FTA television, the number of subscribers to our channels, viewership demographics, the popularity of our content and our ability to sell commercial time over a group of channels. Revenue from advertising is subject to seasonality, market-based variations, the mix in sales of commercial time between the upfront and scatter markets, and general economic conditions. Advertising revenue is typically highest in the second and fourth quarters. In some cases, advertising sales are subject to ratings guarantees that require us to provide additional advertising time if the guaranteed audience levels are not achieved. We also generate revenue from the sale of advertising through our digital products on a stand-alone basis and as part of advertising packages with our television networks.
Advertising revenue decreased 8% in 2020. Excluding the impact of foreign currency fluctuations, advertising revenue decreased 7%. The decrease was primarily attributable to a decline in demand stemming from the COVID-19 pandemic at both U.S. and International Networks.
Distribution revenue consists principally of fees from affiliates for distributing our linear networks, supplemented by revenue earned from SVOD content licensing and other emerging forms of digital distribution. The largest component of distribution revenue is comprised of linear distribution services for rights to our networks from cable, DTH satellite and telecommunication service providers. We have contracts with distributors representing most cable and satellite service providers around the world, including the largest operators in the U.S. and major international distributors. Distribution revenues are largely dependent on the rates negotiated in the agreements, the number of subscribers that receive our networks or content, the number of platforms covered in the distribution agreement, and the market demand for the content that we provide. From time to time, renewals of multi-year carriage agreements include significant year one market adjustments to re-set subscriber rates, which then increase at rates lower than the initial increase in the following years. In some cases, we have provided distributors launch incentives, in the form of cash payments or free periods, to carry our networks. Distribution revenue also includes fees charged for bulk content arrangements and other subscription services for episodic content. These digital distribution revenues are impacted by the quantity, as well as the quality, of the content we provide.
As reported and excluding the impact of foreign currency fluctuations, distribution revenue increased 1% in 2020 primarily attributable to changes in contractual affiliate rates at U.S. Networks and International Networks.
Other revenue decreased 16% in 2020. Excluding the impact of foreign currency fluctuations, other revenue decreased 17%.
Costs of Revenues
Our principal component of costs of revenues is content expense. Content expense includes television series, television specials, films, sporting events and digital products. The costs of producing a content asset and bringing that asset to market consist of film costs, participation costs, exploitation costs and manufacturing costs.
As reported and excluding the impact of foreign currency fluctuations, costs of revenues increased 1% in 2020 primarily attributable to increases in content amortization from investments to support our next generation initiatives at U.S. Networks.
Selling, General and Administrative
Selling, general and administrative expenses consist principally of employee costs, marketing costs, research costs, occupancy and back office support fees. Selling, general and administrative expenses decreased 2% in 2020. Excluding the impact of foreign currency fluctuations, selling, general and administrative decreased 1%. The decrease was primarily attributable to a reduction in travel costs as a result of COVID-19 and lower marketing-related expenses, partially offset by an increase in personnel costs to support our next generation platforms, including discovery+.
Depreciation and Amortization
Depreciation and amortization expense includes depreciation of fixed assets and amortization of finite-lived intangible assets. As reported and excluding the impact of foreign currency fluctuations, depreciation and amortization increased 1% in 2020. The increase was primarily attributable to an increase in capital expenditures.
Impairment of Goodwill and Other Intangible Assets
Impairment of goodwill and other intangible assets was $124 million and $155 million in 2020 and 2019.
Restructuring and Other Charges
Restructuring and other charges were $91 million and $26 million in 2020 and 2019. Restructuring and other charges primarily include employee termination costs and other cost reduction efforts.
Interest Expense, net
Interest expense decreased 4% in 2020. The decrease was primarily attributable to a lower average debt balance in 2020, a more favorable interest rate profile on our outstanding senior notes, and incremental interest income related to the change in fair value of our cross-currency swaps.
Loss on Extinguishment of Debt
In 2020, we repurchased $1.5 billion aggregate principal amount of DCL's and Scripps Networks' senior notes. The repurchase resulted in a loss on extinguishment of debt of $76 million. The loss included $67 million of net premiums to par value and $9 million of other charges.
Loss from Equity Investees, net
We reported losses from our equity method investees of $105 million in 2020 compared to losses of $2 million in 2019. The changes are attributable to the Company's share of earnings and losses from its equity investees.
Other Income (Expense), net
The table below presents the details of other income (expense), net (in millions).
| | | | | | | | | | | | | | |
| | Year Ended December 31, |
| | 2020 | | 2019 |
| Foreign currency (losses) gains, net | | $ | (115) | | | $ | 17 | |
| Gain on sale of investment with readily determinable fair value | | 101 | | | — | |
| Gains (losses) on derivatives not designated as hedges | | 29 | | | (52) | |
| Change in the value of investments with readily determinable fair value | | 28 | | | (26) | |
| Expenses from debt modification | | (11) | | | — | |
| Interest income | | 10 | | | 22 | |
| Gain on sale of equity method investments | | 2 | | | 13 | |
| Remeasurement gain on previously held equity interest | | — | | | 14 | |
| Other (expense) income, net | | (2) | | | 4 | |
| Total other income (expense), net | | $ | 42 | | | $ | (8) | |
Income Taxes
The following table reconciles our effective income tax rate to the U.S. federal statutory income tax rate.
| | | | | | | | | | | | | | | | | | | | | | | | | | |
| | Year Ended December 31, |
| | 2020 | | 2019 |
| Pre-tax income at U.S. federal statutory income tax rate | | $ | 363 | | | 21 | % | | $ | 482 | | | 21 | % |
| State and local income taxes, net of federal tax benefit | | (10) | | | — | % | | 27 | | | 1 | % |
| Effect of foreign operations | | 7 | | | — | % | | (21) | | | (1) | % |
| | | | | | | | |
| Noncontrolling interest adjustment | | (29) | | | (2) | % | | (30) | | | (1) | % |
| Impairment of goodwill | | 25 | | | 2 | % | | 32 | | | 1 | % |
| Deferred tax adjustment | | (22) | | | (1) | % | | — | | | — | % |
| Non-deductible compensation | | 17 | | | 1 | % | | 22 | | | 1 | % |
| Change in uncertain tax positions | | 17 | | | 1 | % | | 3 | | | — | % |
| Legal entity restructuring, deferred tax impact | | — | | | — | % | | (445) | | | (19) | % |
| | | | | | | | |
| | | | | | | | |
| | | | | | | | |
| Renewable energy investments tax credits | | — | | | — | % | | (1) | | | — | % |
| | | | | | | | |
| | | | | | | | |
| Other, net | | $ | 5 | | | — | % | | $ | 12 | | | 1 | % |
| Income tax expense | | $ | 373 | | | 22 | % | | $ | 81 | | | 4 | % |
Income tax expense was $373 million and $81 million, and our effective tax rate was 22% and 4% for 2020 and 2019. The increase in income tax expense in 2020 was primarily attributable to the discrete, one-time, non-cash deferred tax benefit of $445 million from legal entity restructurings that was recorded in 2019. Additionally, the increase in income tax expense in 2020 was attributable to an increase in provision for uncertain tax positions and an increase in the effect of foreign operations. Those increases were partially offset by a decrease in pre-tax book income, a tax benefit from a favorable multi-year state resolution, and a favorable deferred tax adjustment in the U.S. that was recorded in 2020.
Segment Results of Operations – 2020 vs. 2019
We evaluate the operating performance of our operating segments based on financial measures such as revenues and Adjusted OIBDA. Adjusted OIBDA is defined as operating income excluding: (i) employee share-based compensation, (ii) depreciation and amortization, (iii) restructuring and other charges, (iv) certain impairment charges, (v) gains and losses on business and asset dispositions, (vi) certain inter-segment eliminations related to production studios, (vii) third-party transaction costs directly related to the acquisition and integration of Scripps Networks and other transactions, and (viii) other items impacting comparability, such as the non-cash settlement of a withholding tax claim. We use this measure to assess the operating results and performance of our segments, perform analytical comparisons, identify strategies to improve performance, and allocate resources to each segment. We believe Adjusted OIBDA is relevant to investors because it allows them to analyze the operating performance of each segment using the same metric management uses. We exclude share-based compensation, restructuring and other charges, certain impairment charges, gains and losses on business and asset dispositions, and acquisition and integration costs from the calculation of Adjusted OIBDA due to their impact on comparability between periods. We also exclude the depreciation of fixed assets and amortization of intangible assets, as these amounts do not represent cash payments in the current reporting period. Certain corporate expenses and inter-segment eliminations related to production studios are excluded from segment results to enable executive management to evaluate segment performance based upon the decisions of segment executives.
Adjusted OIBDA should be considered in addition to, but not a substitute for, operating income, net income and other measures of financial performance reported in accordance with U.S. generally accepted accounting principles (“GAAP”).
The table below presents our Adjusted OIBDA by segment, with a reconciliation of consolidated net income available to Discovery, Inc. to Adjusted OIBDA (in millions).
| | | | | | | | | | | | | | | | | | | | |
| | Year Ended December 31, | | |
| | 2020 | | 2019 | | % Change |
| Net income available to Discovery, Inc. | | $ | 1,219 | | | $ | 2,069 | | | (41) | % |
| Net income attributable to redeemable noncontrolling interests | | 12 | | | 16 | | | (25) | % |
| Net income attributable to noncontrolling interests | | 124 | | | 128 | | | (3) | % |
| Income tax expense | | 373 | | | 81 | | | NM |
| Income before income taxes | | 1,728 | | | 2,294 | | | (25) | % |
| Other (income) expense, net | | (42) | | | 8 | | | NM |
| Loss from equity investees, net | | 105 | | | 2 | | | NM |
| Loss on extinguishment of debt | | 76 | | | 28 | | | NM |
| Interest expense, net | | 648 | | | 677 | | | (4) | % |
| Operating income | | 2,515 | | | 3,009 | | | (16) | % |
| Depreciation and amortization | | 1,359 | | | 1,347 | | | 1 | % |
| Impairment of goodwill and other intangible assets | | 124 | | | 155 | | | (20) | % |
| Employee share-based compensation | | 99 | | | 137 | | | (28) | % |
| Restructuring and other charges | | 91 | | | 26 | | | NM |
| Transaction and integration costs | | 6 | | | 26 | | | (77) | % |
| Loss on asset disposition | | 2 | | | — | | | NM |
| Settlement of a withholding tax claim | | — | | | (29) | | | NM |
| Adjusted OIBDA | | $ | 4,196 | | | $ | 4,671 | | | (10) | % |
| Adjusted OIBDA: | | | | | | |
| U.S. Networks | | 3,975 | | | 4,117 | | | (3) | % |
| International Networks | | 723 | | | 1,057 | | | (32) | % |
| Corporate, inter-segment eliminations, and other | | (502) | | | (503) | | | — | % |
| Adjusted OIBDA | | $ | 4,196 | | | $ | 4,671 | | | (10) | % |
The table below presents the calculation of Adjusted OIBDA (in millions).
| | | | | | | | | | | | | | | | | | | | |
| | Year Ended December 31, | | |
| | 2020 | | 2019 | | % Change |
| Revenue: | | | | | | |
| U.S. Networks | | $ | 6,949 | | | $ | 7,092 | | | (2) | % |
| International Networks | | 3,713 | | | 4,041 | | | (8) | % |
| Corporate, inter-segment eliminations, and other | | 9 | | | 11 | | | (18) | % |
| Total revenue | | 10,671 | | | 11,144 | | | (4) | % |
| Costs of revenues, excluding depreciation and amortization | | 3,860 | | | 3,819 | | | 1 | % |
Selling, general and administrative (a) | | 2,615 | | | 2,654 | | | (1) | % |
| Adjusted OIBDA | | $ | 4,196 | | | $ | 4,671 | | | (10) | % |
| | | | | | |
(a) Selling, general and administrative expenses exclude employee share-based compensation, third-party transaction and integration costs related to the acquisition of Scripps Networks and other transactions, and for 2019, exclude the settlement of a withholding tax claim. |
U.S. Networks
The table below presents, for our U.S. Networks segment, revenues by type, certain operating expenses, and Adjusted OIBDA (in millions).
| | | | | | | | | | | | | | | | | | | | |
| | Year Ended December 31, | | |
| | 2020 | | 2019 | | Change % |
| Revenues: | | | | | | |
| Advertising | | $ | 4,012 | | | $ | 4,245 | | | (5) | % |
| Distribution | | 2,852 | | | 2,739 | | | 4 | % |
| Other | | 85 | | | 108 | | | (21) | % |
| Total revenues | | 6,949 | | | 7,092 | | | (2) | % |
| Costs of revenues, excluding depreciation and amortization | | 1,843 | | | 1,800 | | | 2 | % |
| Selling, general and administrative | | 1,131 | | | 1,175 | | | (4) | % |
| Adjusted OIBDA | | 3,975 | | | 4,117 | | | (3) | % |
| | | | | | |
| Depreciation and amortization | | 899 | | | 950 | | | |
| Restructuring and other charges | | 41 | | | 15 | | | |
| | | | | | |
| Inter-segment eliminations | | 4 | | | 7 | | | |
| Operating income | | $ | 3,031 | | | $ | 3,145 | | | |
Revenues
Advertising revenue decreased 5% in 2020 primarily attributable to softer demand stemming from the COVID-19 pandemic, secular declines in the pay-TV ecosystem and, to a lesser extent, lower overall ratings and a decline in inventory, partially offset by increases in pricing and the continued monetization of content offerings on our next generation platforms (such as our GO suite of TVE applications and DTC subscription products).
Distribution revenue increased 4% in 2020 primarily attributable to increases in contractual affiliate rates and certain non-recurring items, partially offset by a decline in linear subscribers. Excluding these non-recurring items, distribution revenue increased 3% in 2020. Total portfolio subscribers at December 31, 2020 were 5% lower than at December 31, 2019, while subscribers to our fully distributed networks were 3% lower than the prior year.
Other revenue decreased $23 million in 2020.
Costs of Revenues
Costs of revenues increased 2% in 2020 primarily attributable to increases in content amortization from investments to support our next generation initiatives, partially offset by a reduction in production projects as a result of COVID-19 and a non-recurring reserve release established in purchase accounting. Content expense was $1.6 billion and $1.5 billion in 2020 and 2019.
Selling, General and Administrative
Selling, general and administrative expenses decreased 4% in 2020 primarily attributable to a reduction in travel costs as a result of COVID-19 and lower marketing-related expenses, partially offset by an increase in personnel costs to support our next generation platforms, including discovery+.
Adjusted OIBDA
Adjusted OIBDA decreased 3% in 2020.
International Networks
The following table presents, for our International Networks segment, revenues by type, certain operating expenses, and Adjusted OIBDA (in millions).
| | | | | | | | | | | | | | | | | | | | | | | | | | |
| | Year Ended December 31, | | | | |
| | 2020 | | 2019 | | Change % | | Change % (ex-FX) |
| Revenues: | | | | | | | | |
| Advertising | | $ | 1,571 | | | $ | 1,799 | | | (13) | % | | (12) | % |
| Distribution | | 2,014 | | | 2,096 | | | (4) | % | | (3) | % |
| Other | | 128 | | | 146 | | | (12) | % | | (15) | % |
| Total revenues | | 3,713 | | | 4,041 | | | (8) | % | | (7) | % |
| Costs of revenues, excluding depreciation and amortization | | 2,004 | | | 2,016 | | | (1) | % | | (1) | % |
| Selling, general and administrative | | 986 | | | 968 | | | 2 | % | | 3 | % |
| Adjusted OIBDA | | 723 | | | 1,057 | | | (32) | % | | (28)% |
| Depreciation and amortization | | 374 | | | 328 | | | | | |
| Impairment of goodwill and other intangible assets | | 124 | | | 155 | | | | | |
| Restructuring and other charges | | 29 | | | 20 | | | | | |
| Transaction and integration costs | | 4 | | | — | | | | | |
| Inter-segment eliminations | | 1 | | | 20 | | | | | |
| Settlement of a withholding tax claim | | — | | | (29) | | | | | |
| Operating income | | $ | 191 | | | $ | 563 | | | | | |
Revenues
Advertising revenue decreased 13% in 2020. Excluding the impact of foreign currency fluctuations, advertising revenue decreased 12%. The decreases were attributable to a decline in demand stemming from the COVID-19 pandemic and the discontinuation of pay-TV distribution with certain European operators.
Distribution revenue decreased 4% in 2020. Excluding the impact of foreign currency fluctuations, distribution revenue decreased 3%. The decreases were primarily attributable to lower contractual affiliate rates, the discontinuation of pay-TV distribution with certain European operators, and a disruption in the number of sporting events in Europe due to COVID-19, partially offset by higher next generation revenues due to subscriber growth.
Other revenue decreased $18 million in 2020. Excluding the impact of foreign currency fluctuations, other revenue decreased $22 million.
Costs of Revenues
As reported and excluding the impact of foreign currency fluctuations, costs of revenues decreased 1% in 2020. The decreases were primarily attributable to a reduction in the number of sporting events in Europe due to COVID-19. Content expense, excluding the impact of foreign currency fluctuations, was $1.3 billion for 2020 and 2019.
Selling, General and Administrative
Selling, general and administrative expenses increased 2% in 2020. Excluding the impact of foreign currency fluctuations, selling, general, and administrative expenses increased 3%. The increases were primarily attributable to higher personnel costs to support our next generation platforms, partially offset by a reduction in travel costs as a result of COVID-19.
Adjusted OIBDA
Adjusted OIBDA decreased 32% in 2020. Excluding the impact of foreign currency fluctuations, adjusted OIBDA decreased 28%.
Corporate, Inter-segment Eliminations, and Other
The following table presents our unallocated corporate amounts including certain operating expenses, and Adjusted OIBDA (in millions).
| | | | | | | | | | | | | | | | | | | | |
| | Year Ended December 31, | | |
| | 2020 | | 2019 | | % Change |
| Revenues | | $ | 9 | | | $ | 11 | | | (18) | % |
| Costs of revenues, excluding depreciation and amortization | | 13 | | | 3 | | | NM |
| Selling, general and administrative | | 498 | | | 511 | | | (3) | % |
| Adjusted OIBDA | | (502) | | | (503) | | | — | % |
| Employee share-based compensation | | 99 | | | 137 | | | |
| Depreciation and amortization | | 86 | | | 69 | | | |
| Restructuring and other charges | | 21 | | | (9) | | | |
| Transaction and integration costs | | 2 | | | 26 | | | |
| Loss on asset disposition | | 2 | | | — | | | |
| Inter-segment eliminations | | (5) | | | (27) | | | |
| Operating loss | | $ | (707) | | | $ | (699) | | | |
Corporate operations primarily consist of executive management, administrative support services, substantially all of our share-based compensation and transaction and integration costs related to the acquisition of Scripps Networks and other transactions.
LIQUIDITY AND CAPITAL RESOURCES
Liquidity
Sources of Cash
Historically, we have generated a significant amount of cash from operations. During 2020, we funded our working capital needs primarily through cash flows from operations. As of December 31, 2020, we had $2.1 billion of cash and cash equivalents on hand. We are a well-known seasoned issuer and have the ability to conduct registered offerings of securities, including debt securities, common stock and preferred stock, on short notice, subject to market conditions. Access to sufficient capital from the public market is not assured. We also have a $2.5 billion revolving credit facility and commercial paper program described below.
Beginning in February 2020, the COVID-19 pandemic began adversely affecting the availability of borrowings in the commercial paper market. In addition, during the year ended December 31, 2020, we implemented several measures that we believed would preserve sufficient liquidity in the near term in response to the impact of COVID-19, as discussed further below.
•Debt
2020 Senior Notes Activity
During 2020, we commenced five separate private offers to exchange (the “Exchange Offers”) any and all of Discovery Communications, LLC's ("DCL"), our wholly-owned subsidiary, outstanding 5.000% Senior Notes due 2037, 6.350% Senior Notes due 2040, 4.950% Senior Notes due 2042, 4.875% Senior Notes due 2043 and 5.200% Senior Notes due 2047 (collectively, the “Old Notes”) for one new series of DCL 4.000% Senior Notes due September 2055 (the “New Notes”). We completed the Exchange Offers in September 2020, by exchanging $1.4 billion aggregate principal amount of the Old Notes validly tendered and accepted by us pursuant to the Exchange Offers, for $1.7 billion aggregate principal amount of the New Notes (before debt discount of $318 million). The New Notes are fully and unconditionally guaranteed by us and Scripps Networks on an unsecured and unsubordinated basis. The Exchange Offers were accounted for as a debt modification and, as a result, third-party issuance costs totaling $11 million were expensed as incurred.
Also during 2020, we completed offers to purchase for cash (the “Cash Offers”) the Old Notes. Approximately $22 million aggregate principal amount of the Old Notes were validly tendered and accepted for purchase by us pursuant to the Cash Offers, for total cash consideration of $27 million, plus accrued interest. The Cash Offers resulted in a loss on extinguishment of debt of $5 million.
Finally, during 2020, DCL issued $2.0 billion aggregate principal amount of senior notes due in 2030 and 2050. All of DCL's outstanding senior notes are fully and unconditionally guaranteed on an unsecured and unsubordinated basis by Discovery and Scripps Networks and contain certain covenants, events of default and other customary provisions. DCL used the proceeds from the offering to fund a tender offer for $1.5 billion aggregate principal amount of DCL's and Scripps Networks' senior notes, which resulted in a loss on extinguishment of debt of $71 million, and to repay the $500 million outstanding under our revolving credit facility described below.
2019 Senior Notes Activity
During 2019, DCL issued $1.5 billion aggregate principal of senior notes (the "2029 Notes and 2049 Notes").
Revolving Credit Facility and Commercial Paper
We have access to a $2.5 billion revolving credit facility. Borrowing capacity under this credit facility is reduced by the outstanding borrowings under our commercial paper program. During March 2020, we drew down $500 million under the revolving credit facility to increase our cash position and maximize flexibility in light of the uncertainty surrounding the impact of COVID-19 and such amount was repaid during the second quarter of 2020. All obligations of DCL and the other borrowers under the revolving credit facility are unsecured and are fully and unconditionally guaranteed by Discovery.
The credit agreement governing the revolving credit facility (the “Credit Agreement”) contains customary representations, warranties and events of default, as well as affirmative and negative covenants. In the second quarter of 2020, to preserve flexibility in the current environment, we amended certain provisions of the Credit Agreement, including modifying the financial covenants to reset the Maximum Consolidated Leverage Ratio. (See Note 8 to the accompany consolidated financial statements.) As of December 31, 2020, we were in compliance with all covenants and there were no events of default under the Credit Agreement.
Under our commercial paper program and subject to market conditions, DCL may issue unsecured commercial paper notes guaranteed by Discovery and Scripps Networks from time to time up to an aggregate principal amount outstanding at any given time of $1.5 billion, including up to $500 million of Euro-denominated borrowings. The maturities of these notes vary but may not exceed 397 days. The notes may be issued at a discount or at par, and interest rates vary based on market conditions and the credit rating assigned to the notes at the time of issuance. As of December 31, 2020, we had no outstanding commercial paper borrowings. Borrowings under the commercial paper program reduce the borrowing capacity under the revolving credit facility described above.
Uses of Cash
Our primary uses of cash include the creation and acquisition of new content, capital expenditures, business acquisitions, repurchases of our capital stock, income taxes, personnel costs, principal and interest payments on our outstanding senior notes, and funding for various equity method and other investments, including next generation initiatives.
•Content Acquisition
We plan to continue to invest significantly in the creation and acquisition of new content. Additional information regarding contractual commitments to acquire content is set forth in "Commitments and Off-Balance Sheet Arrangements" in this Item 7, "Management's Discussion and Analysis of Financial Condition and Results of Operations."
•Capital Expenditures and Investments in Next Generation Initiatives
We effected capital expenditures of $402 million in 2020, including amounts capitalized to support our next generation platforms, such as discovery+. In addition, we expect to continue to incur significant costs to develop and market discovery+ in the future.
•Investments and Business Combinations
We made business acquisitions of $39 million and $73 million in 2020 and 2019.
During 2020, we purchased $250 million of time deposit investments.
Our uses of cash have included investments in various equity investments. We provide funding to our investees from time to time. We contributed $181 million and $254 million in 2020 and 2019, for investments in and advances to our investees.
•Redeemable Noncontrolling Interest and Noncontrolling Interest
Due to business combinations, we also have redeemable equity balances of $383 million, which may require the use of cash in the event holders of noncontrolling interests put their interests to the Company beginning in 2021. Distributions to redeemable noncontrolling interests and noncontrolling interests totaled $254 million and $250 million in 2020 and 2019.
•Common Stock Repurchases
Historically, we have funded our stock repurchases through a combination of cash on hand, cash generated by operations and the issuance of debt. In February 2020, our Board of Directors authorized additional stock repurchases of up to $2 billion upon completion of our existing $1 billion authorization announced in May 2019. Under the new stock repurchase authorization, management is authorized to purchase shares from time to time through open market purchases at prevailing prices or privately negotiated purchases subject to market conditions and other factors. (See Note 12 to the accompanying consolidated financial statements.) During 2020 and 2019, we repurchased $969 million and $633 million of our Series C common stock.
•Income Taxes and Interest
We expect to continue to make payments for income taxes and interest on our outstanding senior notes. During 2020 and 2019, we made cash payments of $641 million and $562 million for income taxes and $673 million and $708 million for interest on our outstanding debt.
•Debt
2020 Debt Activity
In addition to the tender offers for $1.5 billion aggregate principal amount of DCL's and Scripps Networks' senior notes and repayment of the $500 million outstanding under our revolving credit facility described above, during 2020 we repaid $600 million of senior notes as they came due. We have an additional $335 million of senior notes coming due in June 2021, which will be redeemed on March 21, 2021.
2019 Debt Activity
During 2019, we used the net proceeds from the issuance of the 2029 Notes and 2049 Notes to redeem and repurchase $1.3 billion aggregate principal amount of senior notes. The repayment resulted in a loss on extinguishment of debt of $23 million.
Also during 2019, we redeemed $411 million aggregate principal senior notes, made open market bond repurchases of $55 million, resulting in a loss on extinguishment of debt of $5 million, and redeemed $900 million of senior notes and floating rate notes as they came due.
Cash Flows
Changes in cash and cash equivalents were as follows (in millions).
| | | | | | | | | | | | | | | | |
| | Year Ended December 31, | | |
| | 2020 | | 2019 | | |
| Cash, cash equivalents, and restricted cash, beginning of period | | $ | 1,552 | | | $ | 986 | | | |
| Cash provided by operating activities | | 2,739 | | | 3,399 | | | |
| Cash used in investing activities | | (703) | | | (438) | | | |
| Cash used in financing activities | | (1,549) | | | (2,357) | | | |
| Effect of exchange rate changes on cash, cash equivalents, and restricted cash | | 83 | | | (38) | | | |
| Net change in cash, cash equivalents, and restricted cash | | 570 | | | 566 | | | |
| Cash, cash equivalents, and restricted cash, end of period | | $ | 2,122 | | | $ | 1,552 | | | |
Operating Activities
Cash provided by operating activities was $2.7 billion and $3.4 billion in 2020 and 2019. The decrease was primarily attributable to a decrease in net income excluding non-cash items and, to a lesser extent, a negative fluctuation in working capital activity, primarily due to the timing of payments, partially offset by an increase in receivables collected.
Investing Activities
Cash used in investing activities was $703 million and $438 million in 2020 and 2019. The increase in cash used in investing activities was primarily driven by the purchase of $250 million in time deposit investments in 2020 and, to a lesser extent, an increase in purchases of property and equipment to support our next generation platforms, including discovery+, partially offset by a reduction in investments in and advances to equity investments.
Financing Activities
Cash used in financing activities was $1.5 billion and $2.4 billion in 2020 and 2019. The decrease in cash used in financing activities was primarily attributable to lower net repayments and incremental borrowings of senior notes and the change in net activity under the revolving credit facility, partially offset by an increase in repurchases of stock.
Capital Resources
As of December 31, 2020, capital resources were comprised of the following (in millions).
| | | | | | | | | | | | | | | | | | | | | | | | | | |
| | | December 31, 2020 |
| | | Total
Capacity | | Outstanding
Letters of
Credit | | Outstanding
Indebtedness | | Unused
Capacity |
| Cash and cash equivalents | | $ | 2,091 | | | $ | — | | | $ | — | | | $ | 2,091 | |
| Revolving credit facility and commercial paper program | | 2,500 | | | — | | | — | | | 2,500 | |
Senior notes (a) | | 15,848 | | | — | | | 15,848 | | | — | |
| Total | | $ | 20,439 | | | $ | — | | | $ | 15,848 | | | $ | 4,591 | |
| | | | | | | | |
(a) Interest on senior notes is paid annually, semi-annually or quarterly. Our senior notes outstanding as of December 31, 2020 had interest rates that ranged from 1.90% to 6.35% and will mature between 2021 and 2055. |
We expect that our cash balance, cash generated from operations and availability under the Credit Agreement will be sufficient to fund our cash needs for the next twelve months. Our borrowing costs and access to capital markets can be affected by short and long-term debt ratings assigned by independent rating agencies which are based, in part, on our performance as measured by credit metrics such as interest coverage and leverage ratios.
As of December 31, 2020, we held $161 million of our $2.1 billion of cash and cash equivalents in our foreign subsidiaries. The 2017 Tax Act features a participation exemption regime with current taxation of certain foreign income and imposes a mandatory repatriation toll tax on unremitted foreign earnings. Notwithstanding the U.S. taxation of these amounts, we intend to continue to reinvest these funds outside of the U.S. Our current plans do not demonstrate a need to repatriate them to the U.S. However, if these funds are needed in the U.S., we would be required to accrue and pay non-U.S. taxes to repatriate them. The determination of the amount of unrecognized deferred income tax liability with respect to these undistributed foreign earnings is not practicable.
Summarized Guarantor Financial Information
Basis of Presentation
Each of the Company, DCL, Discovery Communications Holding LLC (“DCH”) and/or Scripps Networks has the ability to conduct registered offerings of debt securities under the Company’s shelf registration statement. As of December 31, 2020, all of the Company’s outstanding registered senior notes have been issued by DCL, a wholly owned subsidiary of the Company and guaranteed by the Company and Scripps Networks, except for $32 million of senior notes outstanding as of December 31, 2020 that have been issued by Scripps Networks and are not guaranteed. (See Note 8 to the accompanying consolidated financial statements.) DCL primarily includes the Discovery Channel and TLC networks in the U.S. DCL is a wholly owned subsidiary of DCH. The Company wholly owns DCH through a 33 1/3% direct ownership interest and a 66 2/3% indirect ownership interest through Discovery Holding Company (“DHC”), a wholly owned subsidiary of the Company. Scripps Networks is 100% owned by the Company.
The tables below present the summarized financial information as combined for Discovery, Inc. (the “Parent”), Scripps Networks and DCL (collectively, the “Obligors”). All guarantees of DCL's senior notes (the “Note Guarantees”) are full and unconditional, joint and several and unsecured, and cover all payment obligations arising under the senior notes. DCH currently is not an issuer or guarantor of any securities and therefore is not included in the summarized financial information included herein.
Note Guarantees issued by Scripps Networks or any subsidiary of the Parent that in the future issues a Note Guarantee (each, a “Subsidiary Guarantor”) may be released and discharged (i) concurrently with any direct or indirect sale or disposition of such Subsidiary Guarantor or any interest therein, (ii) at any time that such Subsidiary Guarantor is released from all of its obligations under its guarantee of payment by DCL, (iii) upon the merger or consolidation of any Subsidiary Guarantor with and into DCL or the Parent or another Subsidiary Guarantor, or upon the liquidation of such Subsidiary Guarantor and (iv) other customary events constituting a discharge of the Obligors’ obligations.
Summarized Financial Information
During 2020, the Company early adopted Rule 13-01 of the SEC's Regulation S-X. In lieu of providing separate unaudited financial statements for the Parent and Scripps Networks as a Subsidiary Guarantor, the Company has included the accompanying summarized combined financial information of the Obligors after the elimination of intercompany transactions and balances among the Obligors and the elimination of equity in earnings from and investments in any subsidiary of the Parent that is a non-guarantor (in millions).
| | | | | | | | | | |
| | | | |
| | December 31, 2020 | | |
| Current assets | | $ | 2,308 | | | |
| Non-guarantor intercompany trade receivables, net | | 217 | | | |
| Noncurrent assets | | 5,905 | | | |
| Current liabilities | | 915 | | | |
| Noncurrent liabilities | | 16,500 | | | |
| | | | | | | | | | |
| | Year Ended December 31, 2020 | | |
| Revenues | | $ | 2,036 | | | |
| Operating income | | 1,041 | | | |
| Net income | | 162 | | | |
| Net income available to Discovery, Inc. | | 146 | | | |
Additional information regarding the changes in our outstanding indebtedness and the significant terms and provisions of our revolving credit facility and outstanding indebtedness is discussed in Note 8 to the accompanying consolidated financial statements included in Item 8, “Financial Statements and Supplementary Data” in this Annual Report on Form 10-K.
COMMITMENTS AND OFF-BALANCE SHEET ARRANGEMENTS
Obligations
As of December 31, 2020, our significant contractual obligations, including related payments due by period, were as follows (in millions).
| | | | | | | | | | | | | | | | | | | | | | | | | | | | | | | | |
| | Payments Due by Period |
| | Total | | Less than 1
Year | | 1-3 Years | | 3-5 Years | | More than
5 Years |
| Long-term debt: | | | | | | | | | | |
| Principal payments | | $ | 15,848 | | | $ | 335 | | | $ | 1,587 | | | $ | 2,293 | | | $ | 11,633 | |
| Interest payments | | 10,646 | | | 646 | | | 1,242 | | | 1,111 | | | 7,647 | |
| Finance lease obligations | | 263 | | | 64 | | | 103 | | | 54 | | | 42 | |
| Operating lease obligations | | 859 | | | 91 | | | 145 | | | 121 | | | 502 | |
| Content | | 5,053 | | | 1,698 | | | 1,105 | | | 1,113 | | | 1,137 | |
| Other | | 1,297 | | | 576 | | | 567 | | | 85 | | | 69 | |
| Total | | $ | 33,966 | | | $ | 3,410 | | | $ | 4,749 | | | $ | 4,777 | | | $ | 21,030 | |
The above table does not include certain long-term obligations as the timing or the amount of the payments cannot be predicted. The current portion of the liability for cash-settled share-based compensation awards was $37 million as of December 31, 2020. Additionally, reserves for unrecognized tax benefits have been excluded from the above table because we are unable to predict reasonably the ultimate amount or timing of settlement. Our unrecognized tax benefits totaled $348 million as of December 31, 2020.
The above table also does not include DCL's revolving credit facility that allows DCL and certain designated foreign subsidiaries of DCL to borrow up to $2.5 billion, including a $100 million sublimit for the issuance of standby letters of credit and a $50 million sublimit for Euro-denominated swing line loans. Borrowing capacity under this agreement is reduced by the outstanding borrowings under the commercial paper program. As of December 31, 2020, the revolving credit facility agreement provided for a maturity date of August 2022 and the option for up to two additional 364-day renewal periods.
From time to time we may provide our equity method investees additional funding that has not been committed to as of December 31, 2020 based on unforeseen investee opportunities or cash flow needs.
Long-term Debt
Principal payments on long-term debt reflect the repayment of our outstanding senior notes, at face value, assuming repayment will occur upon maturity. Interest payments on our outstanding senior notes are projected based on their contractual rate and maturity.
Finance Lease Obligations
We acquire satellite transponders and other equipment through multi-year finance lease arrangements. Principal payments on finance lease obligations reflect amounts due under our finance lease agreements. Interest payments on our outstanding finance lease obligations are based on the stated or implied rate in our finance lease agreements.
Operating Lease Obligations
We obtain office space and equipment under multi-year lease arrangements. Most operating leases are not cancelable prior to their expiration. Payments for operating leases represent the amounts due under the agreements assuming the agreements are not canceled prior to their expiration.
Purchase Obligations
Content purchase obligations include commitments and liabilities associated with third-party producers and sports associations for content that airs on our television networks. Production contracts generally require: purchase of a specified number of episodes; payments over the term of the license; and include both programs that have been delivered and are available for airing and programs that have not yet been produced or sporting events that have not yet taken place. If the content is ultimately never produced, our commitments expire without obligation. The commitments disclosed above exclude content liabilities recognized on the consolidated balance sheet. We expect to enter into additional production contracts and content licenses to meet our future content needs.
Other purchase obligations include agreements with certain vendors and suppliers for the purchase of goods and services whereby the underlying agreements are enforceable, legally binding and specify all significant terms. Significant purchase obligations include transmission services, television rating services, marketing research, employment contracts, equipment purchases, and information technology and other services. We have contracts that do not require the purchase of fixed or minimum quantities and generally may be terminated with a 30-day to 60-day advance notice without penalty, and are not included in the table above past the 30-day to 60-day advance notice period. Amounts related to employment contracts include base compensation and do not include compensation contingent on future events.
Put Rights
We have granted put rights to certain consolidated subsidiaries, which have been excluded from the table above since we are unable to reasonably predict the ultimate amount or timing of any payment. We recorded the carrying value of the noncontrolling interest in the equity associated with the put rights as a component of redeemable noncontrolling interest in the amount of $383 million. (See Note 11 to the accompanying consolidated financial statements.)
Pension Obligations
We sponsor a qualified defined benefit pension plan (“Pension Plan”) that covers certain U.S.-based employees. We also have a non-qualified Supplemental Executive Retirement Plan (“SERP”).
Contractual commitments summarized in the contractual obligations table include payments to meet minimum funding requirements of our Pension Plan in 2021 and estimated benefit payments for our SERP. Payments for the SERP have been estimated over a ten-year period. While benefit payments under these plans are expected to continue beyond 2030, we believe it is not practicable to estimate payments beyond this period.
Noncontrolling Interest
The Food Network and Cooking Channel are operated and organized under the terms of the TV Food Network Partnership (the "Partnership"). We hold interests in the Partnership, along with another noncontrolling owner. During the fourth quarter of 2020, the Partnership agreement was extended and specifies a dissolution date of December 31, 2022. If the term of the Partnership is not extended prior to that date, the Partnership agreement permits us, as holder of 80% of the applicable votes, to reconstitute the Partnership and continue its business. If for some reason the Partnership is not continued, it will be required to limit its activities to winding up, settling debts, liquidating assets and distributing proceeds to the partners in proportion to their partnership interests.
Off-Balance Sheet Arrangements
We have no material off-balance sheet arrangements (as defined in Item 303(a)(4) of Regulation S-K) that have or are reasonably likely to have a current or future effect on our financial condition, changes in financial condition, revenues or expenses, results of operations, liquidity, capital expenditures or capital resources.
RELATED PARTY TRANSACTIONS
In the ordinary course of business, we enter into transactions with related parties, primarily the Liberty Entities and our equity method investees. Information regarding transactions and amounts with related parties is discussed in Note 21 to the accompanying consolidated financial statements included in Item 8, “Financial Statements and Supplementary Data” in this Annual Report on Form 10-K.
NEW ACCOUNTING AND REPORTING PRONOUNCEMENTS
We adopted certain accounting and reporting standards during 2020. Information regarding our adoption of new accounting and reporting standards is discussed in Note 2 to the accompanying consolidated financial statements included in Item 8, “Financial Statements and Supplementary Data” in this Annual Report on Form 10-K.
CRITICAL ACCOUNTING POLICIES AND ESTIMATES
Our consolidated financial statements are prepared in accordance with GAAP, which requires management to make estimates, judgments and assumptions that affect the amounts reported in the consolidated financial statements included in Item 8, "Financial Statements and Supplementary Data" in this Annual Report on Form 10-K and accompanying notes. Management considers an accounting policy to be critical if it is material to reporting our financial condition and results of operations, and if it requires significant judgment and estimates on the part of management in its application. The development and selection of these critical accounting policies have been determined by management and the related disclosures have been reviewed with the Audit Committee of the Board of Directors of the Company. We believe the following accounting policies are critical to our business operations and the understanding of our results of operations and involve the more significant judgments and estimates used in the preparation of our consolidated financial statements.
Uncertain Tax Positions
We are subject to income taxes in numerous U.S. and foreign jurisdictions. From time to time, we engage in transactions or takes filing positions in which the tax consequences may be uncertain and may recognize tax liabilities based on estimates of whether additional taxes and interest will be due. We establish a reserve for uncertain tax positions unless we determine that such positions are more likely than not to be sustained upon examination based on their technical merits, including the resolution of any appeals or litigation processes. We include interest and where appropriate, potential penalties, in our tax reserves. This assessment relies on estimates and assumptions and may involve a series of complex judgments about future events including the status and results of income tax audits with the relevant tax authorities. Significant judgment is exercised in evaluating all relevant information, the technical merits of the tax positions, and the accurate measurement of uncertain tax positions when determining the amount of reserve and whether positions taken on our tax returns are more likely than not to be sustained. This also involves the use of significant estimates and assumptions with respect to the potential outcome of positions taken on tax returns that may be reviewed by tax authorities.
Goodwill and Intangible Assets
Goodwill is allocated to our reporting units, which are our operating segments or one level below our operating segments (the component level). Reporting units are determined by the discrete financial information available for the component and whether it is regularly reviewed by segment management. Components are aggregated into a single reporting unit if they share similar economic characteristics. Our reporting units are as follows: U.S. Networks, Europe, Latin America, and Asia-Pacific.
We evaluate our goodwill for impairment annually as of October 1 or earlier upon the occurrence of substantive unfavorable changes in economic conditions, industry trends, costs, cash flows, or ongoing declines in market capitalization. If we believe that as a result of our qualitative assessment it is not more likely than not that the fair value of a reporting unit is greater than its carrying amount, a quantitative impairment test is required. The quantitative impairment test requires significant judgment in determining the fair value of the reporting units. We determine the fair value of our reporting units by using a combination of the income approach, which incorporates the use of the discounted cash flow (“DCF”) method and the market multiple approach, which incorporates the use of EBITDA multiples based on market data. For the DCF method, we use projections specific to the reporting unit, as well as those based on general economic conditions, which require the use of significant estimates and assumptions. Determining fair value specific to each reporting unit requires the Company to exercise judgment when selecting the appropriate discount rates, control premiums, terminal growth rates, assumed tax rates, relevant comparable company earnings multiples and the amount and timing of expected future cash flows, including revenue growth rates and profit margins. The cash flows employed in the DCF analysis for each reporting unit are based on the reporting unit's budget, long range plan, and recent operating performance. Discount rate assumptions are based on an assessment of the risk inherent in the future cash flows of the respective reporting unit and market conditions.
2020 Impairment Analysis
We concluded that the continued impacts of COVID-19 on the operating results of the Europe reporting unit represented a triggering event in the second quarter of 2020. During the second quarter, we performed a quantitative goodwill impairment analysis for our Europe reporting unit using a DCF valuation model. A market-based valuation model was not weighted in the analysis given the significant volatility in the equity markets. Significant judgments and assumptions in the DCF model included the amount and timing of future cash flows, including revenue growth rates, long-term growth rates of 2%, and a discount rate ranging from 10% to 10.5%. The estimated fair value of the Europe reporting unit exceeded its carrying value and, therefore, no impairment was recorded.
Also during the second quarter of 2020, we determined that it was more likely than not that the fair value was greater than the carrying value for all other reporting units with the exception of the Asia-Pacific reporting unit. We performed a quantitative goodwill impairment analysis for the Asia-Pacific reporting unit and determined that the estimated fair value did not exceed its carrying value, which resulted in a pre-tax impairment charge to write-off the remaining $36 million goodwill balance during the second quarter of 2020. The impairment charge was not deductible for tax purposes. Significant judgments and assumptions included the amount and timing of future cash flows, including revenue growth rates, long-term growth rates ranging from 2% to 2.5%, and a discount rate of 11%. The cash flows employed in the DCF analysis for the Asia-Pacific reporting unit were based on the reporting unit’s budget and long-term business plan. The determination of fair value of our Asia-Pacific reporting unit represents a Level 3 fair value measurement in the fair value hierarchy due to its use of internal projections and unobservable measurement inputs. The goodwill impairment charge did not have an impact on the calculation of our financial covenants under our debt arrangements.
During the third quarter of 2020, we realigned our International Networks management reporting structure. As a result, Australia and New Zealand, which were previously included in the Europe reporting unit, are now included in the Asia-Pacific reporting unit, including the associated goodwill. As a result of this realignment, we performed a quantitative goodwill impairment analysis for our Europe and Asia-Pacific reporting units using a DCF valuation model. A market-based valuation model was not weighted in the analysis given the significant volatility in the equity markets. Significant judgments and assumptions in the DCF model included the amount and timing of future cash flows, including revenue growth rates, long-term growth rates of 2% for Europe and 2% to 2.5% for Asia-Pacific, and a discount rate ranging from 10% to 10.5% for Europe and 11% for Asia-Pacific. The estimated fair value of both the Europe and Asia-Pacific reporting units exceeded their carrying values and, therefore, no impairment was recorded.
During the fourth quarter of 2020, we performed our annual qualitative goodwill impairment assessment for all reporting units and we determined that it was more likely than not that the fair value of those reporting units exceeded their carrying values, except for our Europe and Asia-Pacific reporting units. Given limited headroom of below 20% in its Europe and Asia-Pacific reporting units during the third quarter of 2020, we performed a quantitative goodwill impairment analysis for each of these reporting units using a DCF valuation model. A market-based valuation model was not weighted in the analysis due to significant volatility in the reporting units' equity markets.
The quantitative goodwill impairment analysis for our Europe reporting unit indicated that the estimated fair value exceeded its carry value by approximately 20% and, therefore, no impairment was recorded. Significant judgments and assumptions included the amount and timing of future cash flows, including revenue growth rates, long-term growth rate of 2%, and discount rates ranging from 10.5% to 11%. We noted that a 1.0% increase in the discount rate and a 0.5% decrease in the long-term growth rate would not have resulted in an impairment loss. As of December 31, 2020, the carrying value of goodwill assigned to the Europe reporting unit was $1.9 billion.
The quantitative impairment analysis for our Asia-Pacific reporting unit indicated that estimated fair value did not exceed its carrying value, which resulted in a pre-tax impairment charge to write-off the remaining $85 million goodwill balance. The impairment was a result of increased cost projections for this region committed to during the fourth quarter of 2020 as part of our global discovery+ rollout strategy. The impairment charge was not deductible for tax purposes. Significant judgments and assumptions included the amount and timing of future cash flows, including revenue growth rates, long-term growth rates ranging from 2% to 2.5%, and a discount rate of 11%. The cash flows employed in the DCF analysis for the Asia-Pacific reporting unit were based on the reporting unit’s budget and long-term business plan. The determination of fair value of our Asia-Pacific reporting unit represents a Level 3 fair value measurement in the fair value hierarchy due to its use of internal projections and unobservable measurement inputs. The goodwill impairment charge did not have an impact on the calculation of our financial covenants under our debt arrangements.
Content Rights
Content rights principally consist of television series, specials, films and sporting events. Costs of produced and coproduced content consist of development costs, acquired production costs, direct production costs, certain production overhead costs and participation costs and is capitalized if we have previously generated revenues from similar content in established markets and the content will be used and revenues will be generated for a period of at least one year.
Linear content amortization expense for each period is recognized based on the revenue forecast model, which approximates the proportion that estimated distribution and advertising revenues for the current period represent in relation to the estimated remaining total lifetime revenues. Digital content amortization for each period is recognized based on estimated viewing patterns as there are no direct revenues to associate to the individual content assets and therefore, number of views is most representative of the use of the title. Judgment is required to determine the useful lives and amortization patterns of our content assets.
Critical assumptions used in determining content amortization include: (i) the grouping of content with similar characteristics, (ii) the application of a quantitative revenue forecast model or viewership model based on the adequacy of historical data, (iii) determining the appropriate historical periods to utilize and the relative weighting of those historical periods in the forecast model, (iv) assessing the accuracy of our forecasts and (v) incorporating secondary streams. We then consider the appropriate application of the quantitative assessment given forecasted content use, expected content investment and market trends. Content use and future revenues may differ from estimates based on changes in expectations related to market acceptance, network affiliate fee rates, advertising demand, the number of cable and satellite television subscribers receiving our networks, the number of subscribers to our digital services, and program usage. Accordingly, we continually review our estimates and planned usage and revise our assumptions if necessary.
Consolidation
We have ownership and other interests in and contractual arrangements with various entities, including corporations, partnerships, and limited liability companies. For each such entity, we evaluate our ownership, other interests and contractual arrangements to determine whether we should consolidate the entity or account for its interest as an investment at inception and upon reconsideration events. As part of its evaluation, we initially determine whether the entity is a variable interest entity ("VIE"). Management evaluates key considerations through a qualitative and quantitative analysis in determining whether an entity is a VIE including whether (i) the entity has sufficient equity to finance its activities without additional financial support from other parties, (ii) the ability or inability to make significant decisions about the entity’s operations, and (iii) the proportionality of voting rights of investors relative to their obligations to absorb the expected losses (or receive the expected returns) of the entity. If the entity is a VIE and if we have a variable interest in the entity, we use judgment in determining if we are the primary beneficiary and are thus required to consolidate the entity. In making this determination, we evaluate whether we or another party involved with the VIE (1) has the power to direct the activities of the VIE that most significantly impact the VIE’s economic performance and (2) has the obligation to absorb losses of or receive benefits from the VIE that could be significant to the VIE.
If it is concluded that an entity is not a VIE, we consider our proportional voting interests in the entity and consolidate majority-owned subsidiaries in which a controlling financial interest is maintained. A controlling financial interest is determined by majority ownership and the absence of substantive third-party participation rights. Key factors we consider in determining the presence of substantive third-party participation rights include, but are not limited to, control of the board of directors, budget approval or veto rights, or operational rights that significantly impact the economic performance of the business such as programming, creative development, marketing, and selection of key personnel. Ownership interests in unconsolidated entities for which we have significant influence are accounted for as equity method.
Revenue Recognition
As described in Note 2, we generate advertising revenues primarily from advertising sold on our television networks and websites and distribution revenues from fees charged to distributors of its network content, which include cable, direct-to-home satellite, telecommunications and digital service providers and bundled long-term content arrangements, as well as through DTC subscription services.
Revenue contracts with our advertising customers may include multiple distinct performance obligations. For example, linear and digital advertising contracts may include the airing of spots and/or the satisfaction of an audience guarantee. For such contracts, judgment is required in allocating the contract value to the individual performance obligations based on their relative standalone selling prices. Various factors such as prior transactions, rate cards and other market indicators are used to determine the standalone selling price of each performance obligation and accordingly, how much revenue is allocated to each performance obligation. For these contracts, revenue recorded when each performance obligation has been satisfied and value has been transferred to the customer.
A substantial portion of the advertising contracts in the U.S. and certain international markets guarantee the advertiser a minimum audience level that either the program in which their advertisements are aired or the advertisement will reach. These advertising campaigns are considered to represent a single, distinct performance obligation. For such contracts, judgement is required in measuring progress across the Company’s single performance obligation. Various factors such as pricing specific to the channel, daypart and targeted demographic, as well as estimated audience guarantees, are considered in determining how to appropriately measure progress across the campaigns. Revenues are ultimately recognized based on the audience level delivered multiplied by the average price per impression.
See Item 1A, "Risk Factors" for details on all significant risks that could impact our ability to successfully grow our cash flows.
For an in-depth discussion of each of our significant accounting policies, including our critical accounting policies and further information regarding estimates and assumptions involved in their application, see Note 2 to the accompanying consolidated financial statements included in Item 8, “Financial Statements and Supplementary Data” in this Annual Report on Form 10-K.
ITEM 7A. Quantitative and Qualitative Disclosures about Market Risk.
Our financial position, earnings and cash flows are exposed to market risks and can be affected by, among other things, economic conditions, interest rate changes, foreign currency fluctuations, and changes in the market values of investments. We have established policies, procedures and internal processes governing our management of market risks and the use of financial instruments to manage our exposure to such risks.
Interest Rates
We are exposed to the impact of interest rate changes primarily through our actual and potential borrowing activities. During the year ended December 31, 2020, we had access to a $2.5 billion revolving credit facility, which had no outstanding borrowings as of December 31, 2020. We also have access to a commercial paper program, which had no outstanding borrowings as of December 31, 2020. The interest rate on borrowings under the revolving credit facility is variable based on an underlying index and DCL's then-current credit rating for its publicly traded debt. The revolving credit facility matures in August 2022 and the option for up to two additional 364-day renewal periods. As of December 31, 2020, we had outstanding debt with a book value of $15.8 billion under various public senior notes with fixed interest rates.
Our current objectives in managing exposure to interest rate changes are to limit the impact of interest rates on earnings and cash flows. To achieve these objectives, we may enter into variable interest rate swaps, effectively converting fixed rate borrowings to variable rate borrowings indexed to LIBOR in order to reduce the amount of interest paid. We may also enter into fixed rate forward starting swaps to limit the impact of volatility in interest rates for future issuances of fixed rate debt. As of December 31, 2020, we had entered into forward starting interest rate swap agreements with a notional value of $2 billion for the future issuances of fixed rate debt.
As of December 31, 2020, the fair value of our outstanding public senior notes was $18.7 billion. The fair value of our long-term debt may vary as a result of market conditions and other factors. A change in market interest rates will impact the fair market value of our fixed rate debt. The potential change in fair value of these senior notes from a 100 basis-point increase in quoted interest rates across all maturities, often referred to as a parallel shift in the yield curve, would be a decrease in fair value of approximately $1.7 billion as of December 31, 2020.
Foreign Currency Exchange Rates
We transact business globally and are subject to risks associated with changing foreign currency exchange rates. Market risk refers to the risk of loss arising from adverse changes in foreign currency exchange rates. The risk of loss can be assessed from the perspective of adverse changes in fair values, cash flows and future earnings. Our International Networks segment operates from hubs in EMEA, Latin America and Asia. Cash is primarily managed from five global locations with net earnings reinvested locally and working capital requirements met from existing liquid funds. To the extent such funds are not sufficient to meet working capital requirements, drawdowns in the appropriate local currency are available from intercompany borrowings or drawdowns from our revolving credit facility. The earnings of certain international operations are expected to be reinvested in those businesses indefinitely.
The functional currency of most of our international subsidiaries is the local currency. We are exposed to foreign currency risk to the extent that we enter into transactions denominated in currencies other than our subsidiaries’ respective functional currencies ("non-functional currency risk"). Such transactions include affiliate and ad sales arrangements, content arrangements, equipment and other vendor purchases and intercompany transactions. Changes in exchange rates with respect to amounts recorded in our consolidated balance sheets related to these items will result in unrealized foreign currency transaction gains and losses based upon period-end exchange rates. We also record realized foreign currency transaction gains and losses upon settlement of the transactions. Moreover, we will experience fluctuations in our revenues, costs and expenses solely as a result of changes in foreign currency exchange rates.
We also are exposed to unfavorable and potentially volatile fluctuations of the U.S. dollar, which is our reporting currency, against the currencies of our operating subsidiaries when their respective financial statements are translated into U.S. dollars for inclusion in our consolidated financial statements. Cumulative translation adjustments are recorded in accumulated other comprehensive loss as a separate component of equity. Any increase or decrease in the value of the U.S. dollar against any foreign functional currency of one of our operating subsidiaries will cause us to experience unrealized foreign currency translation gains or losses with respect to amounts already invested in such foreign currencies. Accordingly, we may experience a negative impact on our net income (loss), other comprehensive income (loss) and equity with respect to our holdings solely as a result of changes in foreign currency.
The majority of our foreign currency exposure is to the Euro, Polish zloty, and the British Pound. We may enter into spot, forward and option contracts that change in value as foreign currency exchange rates change to hedge certain exposures associated with affiliate revenue, the cost for producing or acquiring content, certain intercompany transactions or in connection with forecasted business combinations. These contracts hedge forecasted foreign currency transactions in order to mitigate fluctuations in our earnings and cash flows associated with changes in foreign currency exchange rates. Our objective in managing exposure to foreign currency fluctuations is to reduce volatility of earnings and cash flows. The net fair market value of our foreign currency derivative instruments intended to hedge future cash flows held at December 31, 2020 was a liability value of $24 million. Most of our non-functional currency risks related to our revenue, operating expenses and capital expenditures were not hedged as of December 31, 2020. We generally do not hedge against the risk that we may incur non-cash losses upon the translation of the financial statements of our subsidiaries and affiliates into U.S. dollars.
Derivatives
We may use derivative financial instruments to modify our exposure to exogenous events and market risks from changes in foreign currency exchange rates, interest rates, and the fair value of investments with readily determinable fair values. We do not use derivative financial instruments unless there is an underlying exposure. While derivatives are used to mitigate cash flow risk and the risk of declines in fair value, they also limit potential economic benefits to our business in the event of positive shifts in foreign currency exchange rates, interest rates and market values. We do not hold or enter into financial instruments for speculative trading purposes.
Market Values of Investments
In addition to derivatives, we had investments in entities accounted as equity method investments, equity investments, and other highly liquid instruments, such as money market and mutual funds, that are accounted for at fair value. (See Note 4 and Note 5 to the accompanying consolidated financial statements.) Investments in mutual funds include both fixed rate and floating rate interest earning securities that carry a degree of interest rate risk. Fixed rate securities may have their fair market value adversely impacted due to a rise in interest rates, while floating rate securities may produce less income than predicted if interest rates fall. Due in part to these factors, our income from such investments may decrease in the future.
ITEM 8. Financial Statements and Supplementary Data.
MANAGEMENT’S REPORT ON INTERNAL CONTROL OVER FINANCIAL REPORTING
Management of Discovery, Inc. (the “Company”) is responsible for establishing and maintaining adequate internal control over financial reporting, as such term is defined in Rule 13a-15(f) and Rule 15d-15(f) of the Securities Exchange Act of 1934, as amended. The Company’s internal control over financial reporting includes those policies and procedures that (i) pertain to the maintenance of records that, in reasonable detail, accurately and fairly reflect the transactions and disposition of the assets of the Company; (ii) provide reasonable assurance that transactions are recorded as necessary to permit preparation of financial statements in accordance with generally accepted accounting principles, and provide reasonable assurance that receipts and expenditures of the Company are being made only in accordance with authorizations of management and the directors of the Company; and (iii) provide reasonable assurance regarding prevention or timely detection of unauthorized acquisition, use, or disposition of the Company’s assets that could have a material effect on the consolidated financial statements.
Internal control over financial reporting is designed to provide reasonable assurance regarding the reliability of financial reporting and the preparation of financial statements prepared for external purposes in accordance with generally accepted accounting principles. Because of the inherent limitations in any internal control, no matter how well designed, internal control over financial reporting may not prevent or detect misstatements. Also, projections of any evaluation of effectiveness to future periods are subject to the risk that controls may become inadequate because of changes in conditions, or that the degree of compliance with the policies or procedures may deteriorate.
The Company’s management, with the participation of its Chief Executive Officer and Chief Financial Officer, conducted an evaluation of the effectiveness of the Company’s system of internal control over financial reporting as of December 31, 2020 based on the framework set forth in Internal Control – Integrated Framework (2013) issued by the Committee of Sponsoring Organizations of the Treadway Commission. Based on its evaluation, management concluded that, as of December 31, 2020, the Company’s internal control over financial reporting was effective at a reasonable assurance level based on the specified criteria.
The effectiveness of the Company’s internal control over financial reporting as of December 31, 2020 has been audited by PricewaterhouseCoopers LLP, an independent registered public accounting firm, as stated in their report in Item 8 of Part II of this Annual Report on Form 10-K under the caption “Report of Independent Registered Public Accounting Firm.”
Report of Independent Registered Public Accounting Firm
To the Board of Directors and Stockholders of Discovery, Inc.
Opinions on the Financial Statements and Internal Control over Financial Reporting
We have audited the accompanying consolidated balance sheets of Discovery, Inc. and its subsidiaries (the “Company”) as of December 31, 2020 and 2019, and the related consolidated statements of operations, of comprehensive income (loss), of equity and of cash flows for each of the three years in the period ended December 31, 2020, including the related notes and schedule of valuation and qualifying accounts for each of the three years in the period ended December 31, 2020 appearing under Item 15(a)(2) (collectively referred to as the “consolidated financial statements”). We also have audited the Company's internal control over financial reporting as of December 31, 2020, based on criteria established in Internal Control - Integrated Framework (2013) issued by the Committee of Sponsoring Organizations of the Treadway Commission (COSO).
In our opinion, the consolidated financial statements referred to above present fairly, in all material respects, the financial position of the Company as of December 31, 2020 and 2019, and the results of its operations and its cash flows for each of the three years in the period ended December 31, 2020 in conformity with accounting principles generally accepted in the United States of America. Also in our opinion, the Company maintained, in all material respects, effective internal control over financial reporting as of December 31, 2020, based on criteria established in Internal Control - Integrated Framework (2013) issued by the COSO.
Changes in Accounting Principles
As discussed in Note 2 to the consolidated financial statements, the Company changed the manner in which it accounts for goodwill impairment and content in 2020, the manner in which it accounts for leases in 2019, and the manner in which it accounts for revenue from contracts with customers in 2018.
Basis for Opinions
The Company's management is responsible for these consolidated financial statements, for maintaining effective internal control over financial reporting, and for its assessment of the effectiveness of internal control over financial reporting, included in the accompanying Management’s Report on Internal Control over Financial Reporting. Our responsibility is to express opinions on the Company’s consolidated financial statements and on the Company's internal control over financial reporting based on our audits. We are a public accounting firm registered with the Public Company Accounting Oversight Board (United States) (PCAOB) and are required to be independent with respect to the Company in accordance with the U.S. federal securities laws and the applicable rules and regulations of the Securities and Exchange Commission and the PCAOB.
We conducted our audits in accordance with the standards of the PCAOB. Those standards require that we plan and perform the audits to obtain reasonable assurance about whether the consolidated financial statements are free of material misstatement, whether due to error or fraud, and whether effective internal control over financial reporting was maintained in all material respects.
Our audits of the consolidated financial statements included performing procedures to assess the risks of material misstatement of the consolidated financial statements, whether due to error or fraud, and performing procedures that respond to those risks. Such procedures included examining, on a test basis, evidence regarding the amounts and disclosures in the consolidated financial statements. Our audits also included evaluating the accounting principles used and significant estimates made by management, as well as evaluating the overall presentation of the consolidated financial statements. Our audit of internal control over financial reporting included obtaining an understanding of internal control over financial reporting, assessing the risk that a material weakness exists, and testing and evaluating the design and operating effectiveness of internal control based on the assessed risk. Our audits also included performing such other procedures as we considered necessary in the circumstances. We believe that our audits provide a reasonable basis for our opinions.
Definition and Limitations of Internal Control over Financial Reporting
A company’s internal control over financial reporting is a process designed to provide reasonable assurance regarding the reliability of financial reporting and the preparation of financial statements for external purposes in accordance with generally accepted accounting principles. A company’s internal control over financial reporting includes those policies and procedures that (i) pertain to the maintenance of records that, in reasonable detail, accurately and fairly reflect the transactions and dispositions of the assets of the company; (ii) provide reasonable assurance that transactions are recorded as necessary to permit preparation of financial statements in accordance with generally accepted accounting principles, and that receipts and expenditures of the company are being made only in accordance with authorizations of management and directors of the company; and (iii) provide reasonable assurance regarding prevention or timely detection of unauthorized acquisition, use, or disposition of the company’s assets that could have a material effect on the financial statements.
Because of its inherent limitations, internal control over financial reporting may not prevent or detect misstatements. Also, projections of any evaluation of effectiveness to future periods are subject to the risk that controls may become inadequate because of changes in conditions, or that the degree of compliance with the policies or procedures may deteriorate.
Critical Audit Matters
The critical audit matters communicated below are matters arising from the current period audit of the consolidated financial statements that were communicated or required to be communicated to the audit committee and that (i) relate to accounts or disclosures that are material to the consolidated financial statements and (ii) involved our especially challenging, subjective, or complex judgments. The communication of critical audit matters does not alter in any way our opinion on the consolidated financial statements, taken as a whole, and we are not, by communicating the critical audit matters below, providing separate opinions on the critical audit matters or on the accounts or disclosures to which they relate.
Certain Reserves for Uncertain Tax Positions
As described in Notes 2 and 18 to the consolidated financial statements, the Company’s reserves for uncertain tax positions were $348 million as of December 31, 2020. Management establishes a reserve for uncertain tax positions unless management determines that such positions are more likely than not to be sustained upon examination based on their technical merits, including the resolution of any appeals or litigation processes. As disclosed by management, significant judgment is exercised in evaluating all relevant information, the technical merits of the tax positions, and the accurate measurement of uncertain tax positions when determining the amount of the reserve and whether positions taken on the Company’s tax returns are more likely than not to be sustained. This also involves the use of significant estimates and assumptions with respect to the potential outcome of positions taken on tax returns that may be reviewed by tax authorities.
The principal considerations for our determination that performing procedures relating to certain reserves for uncertain tax positions is a critical audit matter are (i) the significant judgment by management when determining certain reserves for uncertain tax positions, including a high degree of estimation uncertainty when determining the reserves and (ii) a high degree of auditor judgment, subjectivity and effort in performing procedures and evaluating audit evidence relating to management’s determination of certain reserves for uncertain tax positions, the technical merits of the tax positions, and the accurate measurement of the uncertain tax positions.
Addressing the matter involved performing procedures and evaluating audit evidence in connection with forming our overall opinion on the consolidated financial statements. These procedures included testing the effectiveness of controls relating to the recognition, measurement, and completeness of uncertain tax positions. These procedures also included, among others (i) testing the information used in the determination of certain reserves for uncertain tax positions, including international and federal filing positions and the related final tax returns; (ii) testing the calculation of liability for certain reserves for uncertain tax positions by jurisdiction, including evaluating management’s assessment of the technical merits of tax positions and estimates of the amount of tax benefit expected to be sustained, as well as the likelihood of the possible estimated outcome; (iii) testing the completeness of management’s assessment of uncertain tax positions and possible outcomes of certain tax positions, and (iv) evaluating the status and results of income tax audits with the relevant tax authorities.
Goodwill Quantitative Impairment Assessments for the Europe Reporting Unit
As described in Notes 2 and 7 to the consolidated financial statements, the Company’s consolidated goodwill balance was $13.1 billion as of December 31, 2020, and the goodwill associated with the Europe reporting unit was $1.9 billion. The Company evaluates goodwill for impairment annually as of October 1 or earlier if an event or other circumstance indicates that they may not recover the carrying value of the asset. Management concluded that the continued impacts of COVID-19 on the operating results of the Europe reporting unit represented a triggering event in the second quarter of 2020. If the carrying amount of the reporting unit exceeds the fair value of the reporting unit, an impairment charge is recorded for the amount by which the carrying amount exceeds the fair value, not to exceed the amount of goodwill recorded for that reporting unit. Management performed quantitative goodwill impairment analyses during the second and fourth quarters of 2020 for the Europe reporting unit using a discounted cash flow (“DCF”) model. Significant judgments and assumptions by management in the DCF model specific to the Europe reporting unit included the amount and timing of expected future cash flows, including revenue growth rates, long-term growth rates and discount rates.
The principal considerations for our determination that performing procedures relating to the goodwill quantitative impairment assessments for the Europe reporting unit is a critical audit matter are (i) the significant judgment by management when developing the fair value measurements of the reporting unit; (ii) a high degree of auditor judgment, subjectivity, and effort in performing procedures and evaluating management’s assumptions related to revenue growth rates, long-term growth rates, and discount rates; and (iii) the audit effort involved the use of professionals with specialized skill and knowledge.
Addressing the matter involved performing procedures and evaluating audit evidence in connection with forming our overall opinion on the consolidated financial statements. These procedures included testing the effectiveness of controls relating to management’s goodwill quantitative impairment assessments, including controls over the valuation of the Company’s reporting units. These procedures also included, among others, testing management’s process for developing the fair value measurements of the Europe reporting unit, evaluating the appropriateness of the discounted cash flow model, testing the completeness and accuracy of underlying data used in the model and evaluating the significant assumptions used by management related to revenue growth rates, long-term growth rates, and discount rates. Evaluating management’s assumptions related to revenue growth rates and long-term growth rates involved evaluating whether the assumptions used by management were reasonable considering (i) the current and past performance of the reporting unit; (ii) the consistency with external market and industry data; and (iii) whether these assumptions were consistent with evidence obtained in other areas of the audit. Professionals with specialized skill and knowledge were used to assist in the evaluation of the discount rates and long-term growth rates.
/s/ PricewaterhouseCoopers LLP
McLean, Virginia
February 22, 2021
We have served as the Company’s auditor since 2008.
DISCOVERY, INC.
CONSOLIDATED BALANCE SHEETS
(in millions, except par value)
| | | | | | | | | | | | | | |
| | December 31, |
| | 2020 | | 2019 |
| ASSETS | | | | |
| Current assets: | | | | |
| Cash and cash equivalents | | $ | 2,091 | | | $ | 1,552 | |
| Receivables, net | | 2,537 | | | 2,633 | |
| Content rights and prepaid license fees, net | | 532 | | | 579 | |
| Prepaid expenses and other current assets | | 970 | | | 453 | |
| Total current assets | | 6,130 | | | 5,217 | |
| Noncurrent content rights, net | | 3,439 | | | 3,129 | |
| Property and equipment, net | | 1,206 | | | 951 | |
| Goodwill | | 13,070 | | | 13,050 | |
| Intangible assets, net | | 7,640 | | | 8,667 | |
| Equity method investments | | 507 | | | 568 | |
| Other noncurrent assets | | 2,095 | | | 2,153 | |
| Total assets | | $ | 34,087 | | | $ | 33,735 | |
| LIABILITIES AND EQUITY | | | | |
| Current liabilities: | | | | |
| Accounts payable | | $ | 397 | | | $ | 463 | |
| Accrued liabilities | | 1,793 | | | 1,678 | |
| Deferred revenues | | 557 | | | 489 | |
| Current portion of debt | | 335 | | | 609 | |
| Total current liabilities | | 3,082 | | | 3,239 | |
| Noncurrent portion of debt | | 15,069 | | | 14,810 | |
| Deferred income taxes | | 1,534 | | | 1,691 | |
| Other noncurrent liabilities | | 2,019 | | | 2,029 | |
| Total liabilities | | 21,704 | | | 21,769 | |
| Commitments and contingencies (See Note 22) | | | | |
| Redeemable noncontrolling interests | | 383 | | | 442 | |
| Equity: | | | | |
| Discovery, Inc. stockholders’ equity: | | | | |
Series A-1 convertible preferred stock: $0.01 par value; 8 shares authorized, issued and outstanding | | — | | | — | |
Series C-1 convertible preferred stock: $0.01 par value; 6 shares authorized; 5 shares issued and outstanding | | — | | | — | |
Series A common stock: $0.01 par value; 1,700 shares authorized; 163 and 161 shares issued; and 162 and 158 shares outstanding | | 2 | | | 2 | |
Series B convertible common stock: $0.01 par value; 100 shares authorized; 7 shares issued and outstanding | | — | | | — | |
Series C common stock: $0.01 par value; 2,000 shares authorized; 547 shares issued; and 318 and 360 shares outstanding | | 5 | | | 5 | |
| Additional paid-in capital | | 10,809 | | | 10,747 | |
Treasury stock, at cost: 230 and 190 shares | | (8,244) | | | (7,374) | |
| Retained earnings | | 8,543 | | | 7,333 | |
| Accumulated other comprehensive loss | | (651) | | | (822) | |
| Total Discovery, Inc. stockholders’ equity | | 10,464 | | | 9,891 | |
| Noncontrolling interests | | 1,536 | | | 1,633 | |
| Total equity | | 12,000 | | | 11,524 | |
| Total liabilities and equity | | $ | 34,087 | | | $ | 33,735 | |
| | | | |
| The accompanying notes are an integral part of these consolidated financial statements. |
DISCOVERY, INC.
CONSOLIDATED STATEMENTS OF OPERATIONS
(in millions, except per share amounts)
| | | | | | | | | | | | | | | | | | | | |
| | Year Ended December 31, |
| | 2020 | | 2019 | | 2018 |
| Revenues: | | | | | | |
| Advertising | | $ | 5,583 | | | $ | 6,044 | | | $ | 5,514 | |
| Distribution | | 4,866 | | | 4,835 | | | 4,538 | |
| Other | | 222 | | | 265 | | | 501 | |
| Total revenues | | 10,671 | | | 11,144 | | | 10,553 | |
| Costs and expenses: | | | | | | |
| Costs of revenues, excluding depreciation and amortization | | 3,860 | | | 3,819 | | | 3,935 | |
| Selling, general and administrative | | 2,722 | | | 2,788 | | | 2,620 | |
| Depreciation and amortization | | 1,359 | | | 1,347 | | | 1,398 | |
| Impairment of goodwill and other intangible assets | | 124 | | | 155 | | | — | |
| Restructuring and other charges | | 91 | | | 26 | | | 750 | |
| Gain on disposition | | — | | | — | | | (84) | |
| Total costs and expenses | | 8,156 | | | 8,135 | | | 8,619 | |
| Operating income | | 2,515 | | | 3,009 | | | 1,934 | |
| Interest expense, net | | (648) | | | (677) | | | (729) | |
| Loss on extinguishment of debt | | (76) | | | (28) | | | — | |
| Loss from equity investees, net | | (105) | | | (2) | | | (63) | |
| Other income (expense), net | | 42 | | | (8) | | | (120) | |
| Income before income taxes | | 1,728 | | | 2,294 | | | 1,022 | |
| Income tax expense | | (373) | | | (81) | | | (341) | |
| Net income | | 1,355 | | | 2,213 | | | 681 | |
| Net income attributable to noncontrolling interests | | (124) | | | (128) | | | (67) | |
| Net income attributable to redeemable noncontrolling interests | | (12) | | | (16) | | | (20) | |
| Net income available to Discovery, Inc. | | $ | 1,219 | | | $ | 2,069 | | | $ | 594 | |
| Net income per share available to Discovery, Inc. Series A, B and C common stockholders: | | | | | | |
| Basic | | $ | 1.82 | | | $ | 2.90 | | | $ | 0.86 | |
| Diluted | | $ | 1.81 | | | $ | 2.88 | | | $ | 0.86 | |
| Weighted average shares outstanding: | | | | | | |
| Basic | | 505 | | | 529 | | | 498 | |
| Diluted | | 672 | | | 711 | | | 688 | |
| | | | | | |
The accompanying notes are an integral part of these consolidated financial statements. |
DISCOVERY, INC.
CONSOLIDATED STATEMENTS OF COMPREHENSIVE INCOME (LOSS)
(in millions)
| | | | | | | | | | | | | | | | | | | | |
| | Year Ended December 31, |
| | 2020 | | 2019 | | 2018 |
| Net income | | $ | 1,355 | | | $ | 2,213 | | | $ | 681 | |
| Other comprehensive income (loss) adjustments, net of tax: | | | | | | |
| Currency translation | | 292 | | | (15) | | | (189) | |
| Pension plan and SERP | | (8) | | | (10) | | | 3 | |
| Derivatives | | (113) | | | 18 | | | 12 | |
| Comprehensive income | | 1,526 | | | 2,206 | | | 507 | |
| Comprehensive income attributable to noncontrolling interests | | (124) | | | (127) | | | (67) | |
| Comprehensive income attributable to redeemable noncontrolling interests | | (12) | | | (17) | | | (20) | |
| Comprehensive income attributable to Discovery, Inc. | | $ | 1,390 | | | $ | 2,062 | | | $ | 420 | |
| | | | | | |
| The accompanying notes are an integral part of these consolidated financial statements. |
DISCOVERY, INC.
CONSOLIDATED STATEMENTS OF CASH FLOWS
(in millions)
| | | | | | | | | | | | | | | | | | | | |
| | | Year Ended December 31, |
| | | 2020 | | 2019 | | 2018 |
| Operating Activities | | | | | | |
| Net income | | $ | 1,355 | | | $ | 2,213 | | | $ | 681 | |
| Adjustments to reconcile net income to cash provided by operating activities: | | | | | | |
| Content rights amortization and impairment | | 2,956 | | | 2,853 | | | 3,288 | |
| Depreciation and amortization | | 1,359 | | | 1,347 | | | 1,398 | |
| Deferred income taxes | | (186) | | | (504) | | | (131) | |
| Equity in losses of equity method investee companies, including cash distributions | | 167 | | | 62 | | | 138 | |
| Loss on extinguishment of debt | | 76 | | | 28 | | | — | |
| Share-based compensation expense | | 110 | | | 142 | | | 80 | |
| Impairment of goodwill and other intangible assets | | 124 | | | 155 | | | — | |
| | | | | | |
| (Gain) loss from derivative instruments, net | | (36) | | | 48 | | | (15) | |
| Realized gain on sale of investments | | (103) | | | (10) | | | — | |
| Remeasurement gain on previously held equity interests | | — | | | (14) | | | — | |
| Loss (gain) on disposition | | 2 | | | — | | | (84) | |
| Other, net | | 14 | | | 52 | | | 141 | |
| Changes in operating assets and liabilities, net of acquisitions and dispositions: | | | | | | |
| Receivables, net | | 105 | | | (7) | | | (84) | |
| Content rights and payables, net | | (3,053) | | | (3,060) | | | (2,883) | |
| Accounts payable and accrued liabilities | | (131) | | | 122 | | | (74) | |
| Foreign currency, prepaid expenses and other assets, net | | (20) | | | (28) | | | 121 | |
| Cash provided by operating activities | | 2,739 | | | 3,399 | | | 2,576 | |
| Investing Activities | | | | | | |
| Purchases of property and equipment | | (402) | | | (289) | | | (147) | |
| Purchases of investments | | (250) | | | — | | | — | |
| Investments in and advances to equity investments | | (181) | | | (254) | | | (61) | |
| Proceeds from dissolution of joint venture and sale of investments | | 69 | | | 125 | | | — | |
| Business acquisitions, net of cash acquired | | (39) | | | (73) | | | (8,565) | |
| | | | | | |
| | | | | | |
| Proceeds from dispositions, net of cash disposed | | — | | | — | | | 107 | |
| | | | | | |
| Other investing activities, net | | 100 | | | 53 | | | 73 | |
| Cash used in investing activities | | (703) | | | (438) | | | (8,593) | |
| Financing Activities | | | | | | |
| Principal repayments of debt, including discount payment | | (2,193) | | | (2,658) | | | (16) | |
| Borrowings from debt, net of discount and issuance costs | | 1,979 | | | 1,479 | | | — | |
| Repurchases of stock | | (969) | | | (633) | | | — | |
| Principal repayments of revolving credit facility | | (500) | | | (225) | | | (200) | |
| Borrowings under revolving credit facility | | 500 | | | — | | | — | |
| Distributions to noncontrolling interests and redeemable noncontrolling interests | | (254) | | | (250) | | | (76) | |
| Borrowings under term loan facilities | | — | | | — | | | 2,000 | |
| Principal repayments of term loans | | — | | | — | | | (2,000) | |
| | | | | | |
| Other financing activities, net | | (112) | | | (70) | | | 9 | |
| Cash used in financing activities | | (1,549) | | | (2,357) | | | (283) | |
| Effect of exchange rate changes on cash, cash equivalents, and restricted cash | | 83 | | | (38) | | | (23) | |
| Net change in cash, cash equivalents, and restricted cash | | 570 | | | 566 | | | (6,323) | |
| Cash, cash equivalents, and restricted cash, beginning of period | | 1,552 | | | 986 | | | 7,309 | |
| Cash, cash equivalents, and restricted cash, end of period | | $ | 2,122 | | | $ | 1,552 | | | $ | 986 | |
| | | | | | |
| The accompanying notes are an integral part of these consolidated financial statements. |
DISCOVERY, INC.
CONSOLIDATED STATEMENTS OF EQUITY
(in millions)
| | | | | | | | | | | | | | | | | | | | | | | | | | | | | | | | | | | | | | | | | | | | | | | | | | | | | | | | | | | | | | | | | | | | |
| | Preferred Stock | | Common Stock | | Additional
Paid-In
Capital | | Treasury
Stock | | Retained
Earnings | | Accumulated
Other
Comprehensive
Loss | | Discovery,
Inc. Stockholders’
Equity | | Noncontrolling
Interests | | Total
Equity |
| | Shares | | Par Value | | Shares | | Par Value | | | | | | | |
| December 31, 2017 | | 14 | | | $ | — | | | 547 | | | $ | 5 | | | $ | 7,295 | | | $ | (6,737) | | | $ | 4,632 | | | $ | (585) | | | $ | 4,610 | | | $ | — | | | $ | 4,610 | |
| Cumulative effect of accounting changes | | — | | | — | | | — | | | — | | | — | | | — | | | 33 | | | (26) | | | 7 | | | — | | | 7 | |
| Net income available to Discovery, Inc. and attributable to noncontrolling interests | | — | | | — | | | — | | | — | | | — | | | — | | | 594 | | | — | | | 594 | | | 67 | | | 661 | |
| Other comprehensive loss | | — | | | — | | | — | | | — | | | — | | | — | | | — | | | (174) | | | (174) | | | — | | | (174) | |
| Share-based compensation | | — | | | — | | | — | | | — | | | 82 | | | — | | | — | | | — | | | 82 | | | — | | | 82 | |
| Tax settlements associated with share-based plans | | — | | | — | | | — | | | — | | | (18) | | | — | | | — | | | — | | | (18) | | | — | | | (18) | |
| Issuance of stock and noncontrolling interest in connection with the acquisition of Scripps Networks Interactive, Inc. ("Scripps Networks") | | — | | | — | | | 139 | | | 1 | | | 3,217 | | | — | | | — | | | — | | | 3,218 | | | 1,700 | | | 4,918 | |
| Dividends paid to noncontrolling interests | | — | | | — | | | — | | | — | | | — | | | — | | | — | | | — | | | — | | | (51) | | | (51) | |
| Redeemable noncontrolling interest adjustments to redemption value | | — | | | — | | | — | | | — | | | — | | | — | | | (5) | | | — | | | (5) | | | — | | | (5) | |
| Issuance of stock in connection with share-based plans | | — | | | — | | | 5 | | | 1 | | | 71 | | | — | | | — | | | — | | | 72 | | | — | | | 72 | |
| December 31, 2018 | | 14 | | | — | | | 691 | | | 7 | | | 10,647 | | | (6,737) | | | 5,254 | | | (785) | | | 8,386 | | | 1,716 | | | 10,102 | |
| Cumulative effect of accounting changes | | — | | | — | | | — | | | — | | | — | | | — | | | 34 | | | (30) | | | 4 | | | — | | | 4 | |
| Net income available to Discovery, Inc. and attributable to noncontrolling interests | | — | | | — | | | — | | | — | | | — | | | — | | | 2,069 | | | — | | | 2,069 | | | 128 | | | 2,197 | |
| Other comprehensive loss | | — | | | — | | | — | | | — | | | — | | | — | | | — | | | (7) | | | (7) | | | — | | | (7) | |
| Preferred stock conversion | | (1) | | | — | | | 22 | | | — | | | — | | | — | | | — | | | — | | | — | | | — | | | — | |
| Share-based compensation | | — | | | — | | | — | | | — | | | 73 | | | — | | | — | | | — | | | 73 | | | — | | | 73 | |
| Repurchases of stock | | — | | | — | | | — | | | — | | | — | | | (637) | | | — | | | — | | | (637) | | | — | | | (637) | |
| Settlement of common stock repurchase contract | | — | | | — | | | — | | | — | | | 5 | | | — | | | — | | | — | | | 5 | | | — | | | 5 | |
| Tax settlements associated with share-based plans | | — | | | — | | | — | | | — | | | (22) | | | — | | | — | | | — | | | (22) | | | — | | | (22) | |
| Dividends paid to noncontrolling interests | | — | | | — | | | — | | | — | | | — | | | — | | | — | | | — | | | — | | | (211) | | | (211) | |
| Issuance of stock in connection with share-based plans | | — | | | — | | | 2 | | | — | | | 44 | | | — | | | — | | | — | | | 44 | | | — | | | 44 | |
| Redeemable noncontrolling interest adjustments to redemption value | | — | | | — | | | — | | | — | | | — | | | — | | | (24) | | | — | | | (24) | | | — | | | (24) | |
| December 31, 2019 | | 13 | | | — | | | 715 | | | 7 | | | 10,747 | | | (7,374) | | | 7,333 | | | (822) | | | 9,891 | | | 1,633 | | | 11,524 | |
| Cumulative effect of an accounting change (See Note 2) | | — | | | — | | | — | | | — | | | — | | | — | | | 2 | | | — | | | 2 | | | — | | | 2 | |
| Cumulative effect of accounting changes of an equity method investee | | — | | | — | | | — | | | — | | | — | | | — | | | (3) | | | — | | | (3) | | | — | | | (3) | |
| Net income available to Discovery, Inc. and attributable to noncontrolling interests | | — | | | — | | | — | | | — | | | — | | | — | | | 1,219 | | | — | | | 1,219 | | | 124 | | | 1,343 | |
| Other comprehensive income | | — | | | — | | | — | | | — | | | — | | | — | | | — | | | 171 | | | 171 | | | — | | | 171 | |
| Share-based compensation | | — | | | — | | | — | | | — | | | 94 | | | — | | | — | | | — | | | 94 | | | — | | | 94 | |
| Repurchases of stock | | — | | | — | | | — | | | — | | | — | | | (965) | | | — | | | — | | | (965) | | | — | | | (965) | |
| Equity exchange with Harpo for step acquisition of OWN (See Note 11) | | — | | | — | | | — | | | — | | | (45) | | | 95 | | | 9 | | | — | | | 59 | | | — | | | 59 | |
| Tax settlements associated with share-based plans | | — | | | — | | | — | | | — | | | (32) | | | — | | | — | | | — | | | (32) | | | — | | | (32) | |
| Dividends paid to noncontrolling interests | | — | | | — | | | — | | | — | | | — | | | — | | | — | | | — | | | — | | | (223) | | | (223) | |
| Issuance of stock in connection with share-based plans | | — | | | — | | | 2 | | | — | | | 43 | | | — | | | — | | | — | | | 43 | | | — | | | 43 | |
| Redeemable noncontrolling interest adjustments to redemption value | | — | | | — | | | — | | | — | | | — | | | — | | | (17) | | | — | | | (17) | | | — | | | (17) | |
| Other adjustments to stockholders' equity | | — | | | — | | | — | | | — | | | 2 | | | — | | | — | | | — | | | 2 | | | 2 | | | 4 | |
| December 31, 2020 | | 13 | | | $ | — | | | 717 | | | $ | 7 | | | $ | 10,809 | | | $ | (8,244) | | | $ | 8,543 | | | $ | (651) | | | $ | 10,464 | | | $ | 1,536 | | | $ | 12,000 | |
| | | | | | | | | | | | | | | | | | | | | | |
The accompanying notes are an integral part of these consolidated financial statements. |
DISCOVERY, INC.
NOTES TO CONSOLIDATED FINANCIAL STATEMENTS
NOTE 1. DESCRIPTION OF BUSINESS AND BASIS OF PRESENTATION
Description of Business
Discovery, Inc. (“Discovery”, the “Company”, "we", "us" or "our") is a global media company that provides content across multiple distribution platforms, including linear platforms such as pay-television ("pay-TV"), free-to-air ("FTA") and broadcast television, authenticated GO applications, digital distribution arrangements, content licensing arrangements and direct-to-consumer (DTC) subscription products. The Company also operates production studios. The Company has organized its operations into two reportable segments: U.S. Networks, consisting principally of domestic television networks and digital content services, and International Networks, consisting primarily of international television networks and digital content services.
Basis of Consolidation
The consolidated financial statements include the accounts of Discovery and its majority-owned subsidiaries in which a controlling interest is maintained, including variable interest entities ("VIE") for which the Company is the primary beneficiary.
For each non-wholly owned subsidiary, the Company evaluates its ownership and other interests to determine whether it should consolidate the entity or account for its ownership interest as an investment. As part of its evaluation, the Company makes judgments in determining whether the entity is a VIE and, if so, whether it is the primary beneficiary of the VIE and is thus required to consolidate the entity. (See Note 4.) If it is concluded that an entity is not a VIE, then the Company considers its proportional voting interests in the entity. The Company consolidates majority-owned subsidiaries in which a controlling financial interest is maintained. A controlling financial interest is determined by majority ownership and the absence of significant third-party participating rights. Ownership interests in entities for which the Company has significant influence that are not consolidated are accounted for as equity method investments.
Intercompany accounts and transactions between consolidated entities have been eliminated.
Use of Estimates
The preparation of financial statements in accordance with U.S. generally accepted accounting principles (“GAAP”) requires management to make estimates, judgments and assumptions that affect the amounts reported in the consolidated financial statements and accompanying notes. Actual results may differ from these estimates.
Significant estimates and judgments inherent in the preparation of the consolidated financial statements include accounting for asset impairments, revenue recognition, estimated credit losses, content rights, leases, depreciation and amortization, business combinations, share-based compensation, defined benefit plans, income taxes, other financial instruments, contingencies, and the determination of whether the Company should consolidate certain entities.
Impact of COVID-19
On March 11, 2020, the World Health Organization declared the coronavirus disease 2019 (“COVID-19”) outbreak to be a global pandemic. COVID-19 continues to spread throughout the world, and the duration and severity of its effects and associated economic disruption remain uncertain. Restrictions on social and commercial activity in an effort to contain the virus have had, and are expected to continue to have, a significant adverse impact upon many sectors of the U.S. and global economy, including the media industry. The Company continues to closely monitor the impact of COVID-19 on all aspects of its business and geographies, including the impact on its customers, employees, suppliers, vendors, distribution and advertising partners, production facilities, and various other third parties.
Beginning in the second quarter of 2020, demand for the Company’s advertising products and services decreased due to economic disruptions from limitations on social and commercial activity. These economic disruptions and the resulting effect on the Company slightly eased during the second half of 2020, but the pandemic continued to impact demand through the end of 2020 and this decreased demand is expected to continue into 2021. Many of the Company’s third-party production partners that were shut down during most of the second quarter of 2020 due to COVID-19 restrictions came back online in the third quarter of 2020 and, as a result, the Company has incurred additional costs to comply with various governmental regulations and implement certain safety measures for the Company's employees, talent, and partners. Additionally, certain sporting events that the Company has rights to were cancelled or postponed, thereby eliminating or deferring the related revenues and expenses, including the Tokyo 2020 Olympic Games, which were postponed to 2021. The postponement of the Olympic Games deferred both Olympic-related revenues and significant expenses from fiscal year 2020 to fiscal year 2021.
DISCOVERY, INC.
NOTES TO CONSOLIDATED FINANCIAL STATEMENTS
In response to the impact of the pandemic, the Company employed and continues to employ innovative production and programming strategies, including producing content filmed by its on-air talent and seeking viewer feedback on which content to air. The Company continues to pursue a number of cost savings initiatives which began during the third and fourth quarters of 2020 and believes will offset a portion of anticipated revenue losses and deferrals, through the implementation of travel, marketing, production and other operating cost reductions, including personnel reductions, restructurings and resource reallocations to align its expense structure to ongoing changes within the industry. The Company also implemented remote work arrangements effective mid-March 2020 and, to date, these arrangements have not materially affected the Company's ability to operate its business.
In addition, the Company implemented several measures to preserve sufficient liquidity in the near term. As described further in Note 8, during March 2020, the Company drew down $500 million under its $2.5 billion revolving credit facility to increase its cash position and maximize flexibility in light of the current uncertainty surrounding the impact of COVID-19. In addition, in April 2020, the Company entered into an amendment to its revolving credit facility, which increased flexibility under its financial covenants and issued $1.0 billion aggregate principal amount of Senior Notes due May 2030 and $1.0 billion aggregate principal amount of Senior Notes due May 2050. The proceeds from the notes were used to fund a tender offer for $1.5 billion of certain senior notes with maturities ranging from 2021 through 2023 and to repay the $500 million outstanding under its revolving credit facility. (See Note 8.)
In light of the impact of COVID-19, the Company assessed goodwill, other intangibles, deferred tax assets, programming assets, and accounts receivable for recoverability based upon latest estimates and judgments with respect to expected future operating results, ultimate usage of content and latest expectations with respect to expected credit losses. The Company recorded goodwill and other intangible assets impairment charges of $124 million for its Asia-Pacific reporting unit during the year ended December 31, 2020. (See Note 7.) Adjustments to reflect increased expected credit losses were not material. Further, hedged transactions were assessed and the Company has concluded such transactions remain probable of occurrence. Due to significant uncertainty surrounding the impact of COVID-19, management’s judgments could change in the future. The effects of the pandemic may have further negative impacts on the Company’s financial position, results of operations, and cash flows. However, the current level of uncertainty over the economic and operational impacts of COVID-19 means the related financial impact cannot be reasonably and fully estimated at this time.
The nature and extent of COVID-19’s effects on the Company’s operations and results will depend on future developments, which are highly uncertain and cannot be predicted, including new information that may emerge concerning the severity and the extent of future surges of COVID-19, vaccine distribution and other actions to contain the virus or treat its impact, among others. The Company will continue to monitor COVID-19 and its impact on the Company’s business results and financial condition. These consolidated financial statements reflect management’s latest estimates and assumptions that affect the reported amounts of assets and liabilities and related disclosures as of the date of the consolidated financial statements and reported amounts of revenue and expenses during the reporting periods presented. Actual results may differ significantly from these estimates and assumptions.
In the United States, the Coronavirus Aid, Relief, and Economic Security Act (“CARES Act”) was enacted on March 27, 2020, and the Consolidated Appropriations Act, 2021 was enacted on December 27, 2020. As of December 31, 2020, the Company does not expect the CARES Act or the Consolidated Appropriations Act, 2021 to have a material effect on its financial position and results of operations. The Company continues to monitor other relief measures taken by the U.S. and other governments around the world.
NOTE 2. SUMMARY OF SIGNIFICANT ACCOUNTING POLICIES
Foreign Currency
The reporting currency of the Company is the U.S. dollar. The functional currency of most of the Company’s international subsidiaries is the local currency. Financial statements of subsidiaries whose functional currency is not the U.S. dollar are translated at exchange rates in effect at the balance sheet date for assets and liabilities and at average exchange rates for revenues and expenses for the respective periods. Cash flows from the Company's operations in foreign countries are generally translated at the weighted average rate for the applicable period in the consolidated statements of cash flows. Such translation adjustments are recorded in accumulated other comprehensive income.
DISCOVERY, INC.
NOTES TO CONSOLIDATED FINANCIAL STATEMENTS
The Company is exposed to foreign currency risk to the extent that it enters into transactions denominated in currencies other than its subsidiaries’ respective functional currencies. Transactions denominated in currencies other than subsidiaries’ functional currencies are recorded based on exchange rates at the time such transactions arise. Such transactions include affiliate and ad sales arrangements, content arrangements, equipment and other vendor purchases and intercompany transactions. Changes in exchange rates with respect to amounts recorded in the Company's consolidated balance sheets related to these items will result in unrealized foreign currency transaction gains and losses based upon period-end exchange rates. The Company also records realized foreign currency transaction gains and losses upon settlement of the transactions. Foreign currency transaction gains and losses resulting from the conversion of the transaction currency to functional currency are included in other income (expense), net.
Cash and Cash Equivalents
Cash and cash equivalents include cash on hand and highly liquid investments with original maturities of 90 days or less.
Receivables
Receivables include amounts billed and currently due from customers and are presented net of an estimate for credit losses. To assess collectability, the Company analyzes market trends, economic conditions, the aging of receivables and customer specific risks, and reserves an amount that it estimates may not be collected. The Company does not require collateral with respect to trade receivables.
Content Rights
Content rights principally consist of television series, specials, films and sporting events. Content aired on the Company’s television networks and digital content offerings is sourced from a wide range of third-party producers, wholly-owned and equity method investee production studios, and sports associations. Content is classified either as produced, coproduced or licensed.
The Company owns most or all of the rights to produced content. The Company collaborates with third parties to finance and develop coproduced content, and it retains significant rights to exploit the programs. Prepaid licensed content includes advance payments for rights to air sporting events that will take place in the future and advance payments for acquired films and television series.
Costs of produced and coproduced content consist of development costs, acquired production costs, direct production costs, certain production overhead costs and participation costs. The Company’s coproduction arrangements generally provide for the sharing of production costs. The Company records its costs but does not record the costs borne by the other party as the Company does not share any associated economics of exploitation.
Licensed content is comprised of films or series that have been previously produced by third parties and the Company retains limited airing rights over a contractual term. Program licenses typically have fixed terms and require payments during the term of the license. The cost of licensed content is capitalized when the cost is known or reasonably determinable, the license period for the programs has commenced, the program materials have been accepted by the Company in accordance with the license agreements, and the programs are available for the first showing. The Company pays in advance of delivery for television series, specials, films and sports rights. Payments made in advance of when the right to air the content is received are recognized as prepaid licensed content. Participation costs are expensed in line with the amortization of production costs. Content distribution, advertising, marketing, general and administrative costs are expensed as incurred.
Linear content amortization expense for each period is recognized based on the revenue forecast model, which approximates the proportion that estimated distribution and advertising revenues for the current period represent in relation to the estimated remaining total lifetime revenues. Digital content amortization for each period is recognized based on estimated viewing patterns as there are no direct revenues to associate to the individual content assets and therefore, number of views is most representative of the use of the title. Judgment is required to determine the useful lives and amortization patterns of the Company’s content assets.
DISCOVERY, INC.
NOTES TO CONSOLIDATED FINANCIAL STATEMENTS
Quarterly, the Company prepares analyses to support its content amortization expense. Critical assumptions used in determining content amortization include: (i) the grouping of content with similar characteristics, (ii) the application of a quantitative revenue forecast model or viewership model based on the adequacy of historical data, (iii) determining the appropriate historical periods to utilize and the relative weighting of those historical periods in the forecast model, (iv) assessing the accuracy of the Company's forecasts and (v) incorporating secondary streams. The Company then considers the appropriate application of the quantitative assessment given forecasted content use, expected content investment and market trends. Content use and future revenues may differ from estimates based on changes in expectations related to market acceptance, network affiliate fee rates, advertising demand, the number of cable and satellite television subscribers receiving the Company’s networks, the number of subscribers to its digital services, and program usage. Accordingly, the Company continually reviews its estimates and planned usage and revises its assumptions if necessary. As part of the Company's assessment of its amortization rates, the Company compares the calculated amortization rates to those that have been utilized during the year. If the calculated rates do not deviate materially from the applied amortization rates, no adjustment is recorded. Any material adjustments from the Company’s review of the amortization rates are applied prospectively in the period of the change for assets in film groups, which represent the largest proportion of the Company's content assets.
The result of the content amortization analysis is either an accelerated method or a straight-line amortization method over the estimated useful lives of generally two to four years. Amortization of capitalized costs for produced and coproduced content begins when a program has been aired. Amortization of capitalized costs for licensed content generally commences when the license period begins and the program is available for use. The Company allocates the cost of multi-year sports programming arrangements over the contract period of each event or season based on the estimated relative value of each event or season. Amortization of sports rights takes place when the content airs.
Capitalized content costs are stated at the lower of cost less accumulated amortization or fair value. Content assets (produced, coproduced and licensed) are predominantly monetized as a group on the Company’s linear networks and digital content offerings. For content assets that are predominantly monetized within film groups, the Company evaluates the fair value of content in aggregate at the group level by considering expected future revenue generation typically by using a discounted cash flow analysis when an event or change in circumstances indicates a change in the expected usefulness of the content or that the fair value may be less than unamortized costs. Estimates of future revenues consider historical airing patterns and future plans for airing content, including any changes in strategy. Given the significant estimates and judgments involved, actual demand or market conditions may be less favorable than those projected, requiring a write-down to fair value. Programming and development costs for programs that the Company has determined will not be produced, are fully expensed in the period the determination is made. The Company’s film groups are generally aligned along the Company’s networks and digital content offerings except for certain international territories wherein content assets are shared across the various networks in the territory and therefore, the territory is the film group. The Company’s rights to the Olympic Games are predominantly monetized on their own as the sublicensing of the rights in certain territories is a significant component of the monetization strategy. Beginning in 2020, all content rights and prepaid license fees are classified as a noncurrent asset, with the exception of content acquired with an initial license period of 12 months or less and prepaid sports rights expected to air within 12 months. (See "Accounting and Reporting Pronouncements Adopted" below and Note 6.)
Investments
The Company holds investments in equity method investees and equity investments with and without readily determinable fair values.
Equity Method Investments
Investments in equity method investees are those for which the Company has the ability to exercise significant influence but does not control and is not the primary beneficiary. Under this method of accounting, the Company typically records its proportionate share of the net earnings or losses of equity method investees and a corresponding increase or decrease to the investment balances. Cash payments to equity method investees such as additional investments, loans and advances and expenses incurred on behalf of investees, as well as payments from equity method investees such as dividends, distributions and repayments of loans and advances are recorded as adjustments to investment balances.
DISCOVERY, INC.
NOTES TO CONSOLIDATED FINANCIAL STATEMENTS
For certain of the Company's equity method investments, such as investments in renewable energy limited liability companies where the capital structure of the equity investment results in different liquidation rights and priorities than what is reflected by the underlying percentage ownership interests, the Company's proportionate share of net earnings is accounted for using the Hypothetical Liquidation at Book Value ("HLBV") methodology available under the equity method of accounting. When applying HLBV, the Company determines the amount that would be received if the investment were to liquidate all of its assets and distribute the resulting cash to the investors based on contractually defined liquidation priorities. The change in the Company's claim on the investee's book value in accordance with GAAP at the beginning and the end of the reporting period, after adjusting for any contributions or distributions, is the Company's share of the earnings or losses for the period.
The Company evaluates its equity method investments for impairment whenever events or changes in circumstances indicate that the carrying amounts of such investments may not be recoverable. (See "Asset Impairment Analysis" below.)
Equity Investments with Readily Determinable Fair Values
Investments in entities or other securities in which the Company has no control or significant influence, is not the primary beneficiary, and have a readily determinable fair value are recorded at fair value based on quoted market prices and are classified as equity securities or equity investments with readily determinable fair value. (See Note 4.) For equity securities with readily determinable fair value, realized gains and losses are recorded in other income (expense), net. (See Note 20.)
Equity Investments without Readily Determinable Fair Values
Equity investments without readily determinable fair value include ownership rights that either (i) do not meet the definition of in-substance common stock or (ii) do not provide the Company with control or significant influence and these investments do not have readily determinable fair values. Equity investments without readily determinable fair value are recorded at cost, less any impairment, and adjusted for subsequent observable price changes as of the date that an observable transaction takes place and are recorded in other income (expense), net. (See Note 20.)
Property and Equipment
Property and equipment are stated at cost less accumulated depreciation and impairments. Internal use software costs are capitalized during the application development stage. Software costs incurred during the preliminary project and post implementation stages are expensed as incurred. Repairs and maintenance expenditures that do not enhance the use or extend the life of property and equipment are expensed as incurred. Depreciation for most property and equipment is recognized using the straight-line method over the estimated useful lives of the assets. (See Note 20.)
Leases
The Company determines if an arrangement is a lease at its inception. Operating lease right-of-use ("ROU") assets are included in "Other noncurrent assets" and operating lease liabilities are included in “Accrued liabilities” and “Other noncurrent liabilities” in the consolidated balance sheets. Finance lease ROU assets are included in "Property and equipment, net" and finance lease liabilities are included in “Accrued liabilities” and “Other noncurrent liabilities” in the consolidated balance sheets.
A rate implicit in the lease when readily determinable is used in arriving at the present value of lease payments. As most of the Company's leases do not provide an implicit rate, the Company uses an incremental borrowing rate based on information available at lease commencement date for most of its leases. The incremental borrowing rate is based on the Company's U.S. dollar denominated senior unsecured borrowing curves using public credit ratings adjusted down to a collateralized basis using a combination of recovery rate and credit notching approaches and translated into major contract currencies as applicable.
The Company's lease terms may include options to extend or terminate the lease when it is reasonably certain that it will exercise that option. The Company does not separate lease components from non-lease components across all lease categories. Instead, each separate lease component and non-lease component are accounted for as a single lease component. In addition, variable lease payments that are based on an index or rate are included in measurement of ROU assets and lease liabilities at lease inception. All other variable lease payments are expensed as incurred and are not included in measurement of ROU assets and lease liabilities. Lease expense for operating leases is recognized on a straight-line basis. For finance leases, the Company recognizes interest expense on lease liabilities using the effective interest method and amortization of ROU assets on a straight-line basis.
DISCOVERY, INC.
NOTES TO CONSOLIDATED FINANCIAL STATEMENTS
Asset Impairment Analysis
Goodwill and Indefinite-lived Intangible Assets
Goodwill is allocated to the Company's reporting units, which are its operating segments or one level below its operating segments. The Company evaluates goodwill and other indefinite-lived intangible assets for impairment annually as of October 1 or earlier if an event or other circumstance indicates that it may not recover the carrying value of the asset. If the Company believes that, as a result of its qualitative assessment, it is more likely than not that the fair value of a reporting unit or other indefinite-lived intangible asset is greater than its carrying amount, the quantitative impairment test is not required. If a qualitative assessment indicates that it is more likely than not that the carrying value of a reporting unit goodwill or other indefinite-lived intangible asset exceeds its fair value, a quantitative impairment test is performed. If the carrying amount of the reporting unit exceeds the fair value of the reporting unit, an impairment charge is recorded for the amount by which the carrying amount exceeds the fair value, not to exceed the amount of goodwill recorded for that reporting unit. The Company has applied the provisions of ASU 2017-04 to quantitative goodwill impairment assessments performed in 2020. (See "Accounting and Reporting Pronouncements Adopted" below and Note 7.)
The Company performs a quantitative impairment test every three years, irrespective of the outcome of the Company's qualitative assessment. During 2019, the Company changed its annual impairment testing date from November 30 to October 1. The Company believes the new date is preferable because it aligns the impairment test with the budgeting and quarter-end closing processes. The Company determined it was impracticable to apply the change in accounting principle retrospectively because it could not determine the goodwill estimate for each reporting unit at the new annual goodwill impairment testing date without the use of hindsight. Accordingly, the Company applied the change in accounting principle prospectively. The change in the annual impairment testing date did not delay, accelerate or avoid an impairment charge.
Long-lived Assets
Long-lived assets such as amortizing trademarks, customer lists, other intangible assets, and property and equipment are not required to be tested for impairment annually, but rather are tested for impairment whenever circumstances indicate that the carrying amount of the asset may not be recoverable. If an impairment analysis is required, the impairment test employed is based on whether the Company’s intent is to hold the asset for continued use or to hold the asset for sale. If the intent is to hold the asset for continued use, the impairment test requires a comparison of undiscounted future cash flows to the carrying value of the asset. If the carrying value of the asset exceeds the undiscounted cash flows, an impairment loss would be recognized equal to the excess of the asset’s carrying value over its fair value, which is typically determined by discounting the future cash flows associated with that asset. If the intent is to hold the asset for sale and certain other criteria are met, the impairment test involves comparing the asset’s carrying value to its fair value less costs to sell. If the carrying value of the asset exceeds the fair value, an impairment loss would be recognized equal to the difference. Significant judgments used for long-lived asset impairment assessments include identifying the appropriate asset groupings and primary assets within those groupings, determining whether events or circumstances indicate that the carrying amount of the asset may not be recoverable, determining the future cash flows for the assets involved and assumptions applied in determining fair value, which include reasonable discount rates, growth rates, market risk premiums and other assumptions about the economic environment.
Equity Method Investments and Equity Investments Without Readily Determinable Fair Value
Equity method investments are reviewed for indicators of other-than-temporary impairment on a quarterly basis. Equity method investments are written down to fair value if there is evidence of a loss in value that is other-than-temporary. The Company may estimate the fair value of its equity method investments by considering recent investee equity transactions, discounted cash flow analysis, recent operating results, comparable public company operating cash flow multiples and in certain situations, balance sheet liquidation values. If the fair value of the investment has dropped below the carrying amount, management considers several factors when determining whether an other-than-temporary decline has occurred, such as the length of the time and the extent to which the estimated fair value or market value has been below the carrying value, the financial condition and the near-term prospects of the investee, the intent and ability of the Company to retain its investment in the investee for a period of time sufficient to allow for any anticipated recovery in market value and general market conditions. The estimation of fair value and whether an other-than-temporary impairment has occurred requires the application of significant judgment and future results may vary from current assumptions. If declines in the value of the equity method investments are determined to be other-than-temporary, a loss is recorded in earnings in the current period as a component of loss from equity investees, net on the consolidated statements of operations.
DISCOVERY, INC.
NOTES TO CONSOLIDATED FINANCIAL STATEMENTS
For equity investments without readily determinable fair value, investments are recorded at cost, less impairment, adjusted for subsequent observable price changes as of the date that an observable transaction takes place. The Company performs a qualitative assessment on a quarterly basis to determine if an investment is impaired. If the qualitative assessment indicates that an investment is impaired, a loss is recorded equal to the difference between the fair value and carrying value in the current period as a component of other income (expense), net. (See Note 4.)
Derivative Instruments
The Company uses derivative financial instruments to modify its exposure to market risks from changes in foreign currency exchange rates, interest rates and from market volatility related to certain equity investments measured at fair value. At the inception of a derivative contract, the Company designates the derivative as one of three types based on the Company's intentions and expectations as to the likely effectiveness as a hedge. The three types are:
(1) a hedge of a forecasted transaction or the variability of cash flows to be received or paid related to a recognized asset or liability ("cash flow hedge");
(2) a hedge of net investments in foreign operations ("net investment hedge"); or
(3) an instrument with no hedging designation. (See Note 10.)
Cash Flow Hedges
The Company designates foreign currency forward and option contracts as cash flow hedges to mitigate foreign currency risk arising from third-party revenue and intercompany licensing agreements. The Company also designates interest rate contracts used to hedge the interest rate risk for certain senior notes and forecasted debt issuances as cash flow hedges. For foreign exchange forward contracts accounted for as cash flow hedges, the entire change in the fair value of the forward contract is recorded in other comprehensive income (loss) and reclassified into the statement of operations in the same line item in which the hedged item is recorded and in the same period as the hedged item affects earnings.
Net Investment Hedges
The Company designates cross-currency swaps and foreign currency forward contracts as hedges of net investments in foreign operations. The Company assesses effectiveness for net investment hedges utilizing the spot-method. The entire change in the fair value of derivatives that qualify as net investment hedges is initially recorded in the currency translation adjustment component of other comprehensive income. While the change in fair value attributable to hedge effectiveness remains in accumulated other comprehensive income (loss) until the net investment is sold or liquidated, the change in fair value attributable to components excluded from the assessment of hedge effectiveness (e.g., forward points, cross currency basis, etc.) is reflected as a component of interest expense, net in the current period.
No Hedging Designation
The Company may also enter into derivative financial instruments that do not qualify for hedge accounting and are not designated as hedges. These instruments are intended to mitigate economic exposures due to exogenous events and changes in foreign currency exchange rates and interest rates. The changes in fair value of derivatives not designated as hedges are recorded in other income (expense), net.
Financial Statement Presentation
Unsettled derivative contracts are recorded at their gross fair values on the consolidated balance sheets. The portion of the fair value that represents cash flows occurring within one year is classified as current, and the portion related to cash flows occurring beyond one year is classified as noncurrent. Gains and losses on designated cash flow and net investment hedges are initially recognized as components of accumulated other comprehensive loss on the consolidated balance sheets and reclassified into the statements of operations in the same line item in which the hedged item is recorded and in the same period as the hedged item affects earnings. The Company records gains and losses for instruments that receive no hedging designation, as a component of other expense, net on the consolidated statements of operations.
Cash flows from designated derivative instruments used as hedges are classified in the consolidated statements of cash flows in the same section as the cash flows of the hedged item. Cash flows from periodic settlement of interest on cross currency swaps and derivative contracts not designated as hedges are reported as investing activities in the consolidated statements of cash flows.
DISCOVERY, INC.
NOTES TO CONSOLIDATED FINANCIAL STATEMENTS
Effective July 1, 2018, the Company early adopted ASU 2017-12. As a result, the Company changed the method by which it assesses effectiveness for net investment hedges from the forward-method to the spot-method. Previous net losses of $87 million incurred under the forward method related to net investment hedges will remain in other comprehensive loss under the currency translation component and will be reclassified to earnings when the net investment is sold or liquidated.
Treasury Stock
When stock is acquired for purposes other than formal or constructive retirement, the purchase price of the acquired stock is recorded in a separate treasury stock account, which is separately reported as a reduction of equity.
When stock is retired or purchased for formal or constructive retirement, the purchase price is initially recorded as a reduction to the par value of the shares repurchased, with any excess purchase price over par value recorded as a reduction to additional paid-in capital related to the series of shares repurchased and any remainder excess purchase price recorded as a reduction to retained earnings. If the purchase price exceeds the amounts allocated to par value and additional paid-in capital related to the series of shares repurchased and retained earnings, the remainder is allocated to additional paid-in capital related to other series of shares.
To determine the cost of treasury stock that is either sold or reissued, the Company uses the last in, first out method. If the proceeds from the re-issuance of treasury stock are greater than the cost, the excess is recorded as additional paid-in capital. If the proceeds from re-issuance of treasury stock are less than the cost, the excess cost first reduces any additional paid-in capital arising from previous treasury stock transactions for that class of stock, and any additional excess is recorded as a reduction of retained earnings.
Revenue Recognition
The Company generates revenues principally from: (i) advertising revenue from advertising sold on its television networks, authenticated TVE applications and websites, (ii) distribution revenues from fees charged to distributors of its network content, which include cable, direct-to-home ("DTH") satellite, telecommunications and digital service providers and bundled long-term content arrangements, as well as through DTC subscription services and (iii) other revenue related to several items including: (a) unbundled rights to sales of network content, including sports rights, (b) production studios content development and services, (c) the licensing of the Company's brands for consumer products and (d) affiliate and advertising sales representation services.
Revenue is recognized upon transfer of control of promised services or goods to customers in an amount that reflects the consideration that the Company expects to receive in exchange for those services or goods. Revenues do not include taxes collected from customers on behalf of taxing authorities such as sales tax and value-added tax. However, certain revenues include taxes that customers pay to taxing authorities on the Company’s behalf, such as foreign withholding tax. Revenue recognition for each source of revenue is also based on the following policies.
Advertising
Advertising revenues are principally generated from the sale of commercial time on linear and digital platforms. A substantial portion of the linear and digital advertising contracts in the U.S. and certain international markets guarantee the advertiser a minimum audience level that either the program in which their advertisements are aired or the advertisement will reach. On the linear platform, the Company provides a service to deliver an advertising campaign which is satisfied by the provision of a minimum number of advertising spots in exchange for a fixed fee over a contract period of one year or less. The Company delivers spots in accordance with these contracts during a variety of day parts and programs. In the agreements governing these advertising campaigns, the Company has also promised to deliver to its customers a guaranteed minimum number of viewers (“impressions”) on a specific television network within a particular demographic (e.g. men aged 18-35). These advertising campaigns are considered to represent a single, distinct performance obligation. Revenues are recognized based on the audience level delivered multiplied by the average price per impression. The Company provides the advertiser with advertising until the guaranteed audience level is delivered, and invoiced advertising revenue receivables may exceed the value of the audience delivery. As such, revenues are deferred until the guaranteed audience level is delivered or the rights associated with the guarantee lapse, which is less than one year. Audience guarantees are initially developed internally, based on planned programming, historical audience levels, the success of pilot programs, and market trends. Actual audience and delivery information is published by independent ratings services.
Digital advertising contracts typically contain promises to deliver guaranteed impressions in specific markets against a targeted demographic during a stipulated period of time. If the specified number of impressions is not delivered, the transaction price is reduced by the number of impressions not delivered multiplied by the contractually stated price per impression. Each promise is considered a separate performance obligation. For digital contracts with an audience guarantee, advertising revenues are recognized as impressions are delivered. Actual audience delivery is typically reported by independent third parties.
DISCOVERY, INC.
NOTES TO CONSOLIDATED FINANCIAL STATEMENTS
For contracts without an audience guarantee, advertising revenues are recognized as each spot airs. The airing of individual spots without a guaranteed audience level are each distinct, individual performance obligations. The Company allocates the consideration to each spot based on its relative standalone selling price. Advertising revenues from digital platforms are recognized as impressions are delivered or the services are performed.
Distribution
Cable operators, DTH satellite operators and telecommunications service providers typically pay royalties via a per-subscriber fee for the right to distribute the Company’s programming under the terms of distribution contracts. The majority of the Company’s distribution fees are collected monthly throughout the year and distribution revenue is recognized over the term of the contracts based on contracted programming rates and reported subscriber levels. The amount of distribution fees due to the Company is reported by distributors based on actual subscriber levels. Such information is generally not received until after the close of the reporting period. In these cases, the Company estimates the number of subscribers receiving the Company’s programming to estimate royalty revenue. Historical adjustments to recorded estimates have not been material. Distribution revenue from fixed-fee contracts is recognized over the contract term based on the continuous delivery of the content to the affiliate. Any monetary incentives provided to distributors are recognized as a reduction of revenue over the service term.
Although the delivery of linear feeds and digital DTC products, such as video-on-demand (“VOD”) and authenticated TVE applications, are considered distinct performance obligations within a distribution arrangement, on demand offerings generally match the programs that are airing on the linear network. Therefore, the Company recognizes revenue for licensing arrangements as the license fee is earned and based on continuous delivery for fixed fee contracts.
For DTC subscription services, the Company recognizes revenue as the license fee is earned over the subscription period.
Revenues associated with digital distribution arrangements are recognized when the Company transfers control of the content and the rights to distribute the content to the customer.
Other
License fees from the sublicensing of sports rights are recognized when the rights become available for airing. Revenue from production studios is recognized when the content is delivered and available for airing by the customer. Royalties from brand licensing arrangements are earned as products are sold by the licensee. Affiliate and ad sales representation services are recognized as services are provided.
Multiple Performance Obligations
Contracts with customers may include multiple distinct performance obligations. Advertising contracts may include sponsorship, production, or product integration in addition to the airing of spots and/or the satisfaction of an audience guarantee. For such contracts, the contract value is allocated to individual performance obligations and recorded as revenue when each performance obligation has been satisfied and value has been transferred to the customer. Distribution contracts also include multiple performance obligations. The Company also enters into certain distribution contracts that include promises to deliver content libraries. There are generally two types of such arrangements: 1) content licensing arrangements that include subscription video on demand (“SVOD”) licensing arrangements and 2) digital DTC content (such as VOD and authenticated TVE applications), which is a performance obligation within the Company's linear distribution arrangements. These contracts vary by customer and in certain instances include a promise by the Company to deliver existing content and new content. For SVOD arrangements, revenue is allocated to each performance obligation based on that performance obligation's relative standalone selling price. In the case of VOD and digital DTC content, content is regularly refreshed over the term of the agreement, as new titles are added and older titles are removed. Consequently, satisfaction of the performance obligations generally occurs in the same pattern as the delivery of the linear feed.
Deferred Revenue
Deferred revenue consists of cash received for television advertising for which the guaranteed viewership has not been provided, product licensing arrangements in which fee collections are in excess of the license value provided, and advanced fees received related to the sublicensing of Olympic rights. The amounts classified as current are expected to be earned within the next year.
Payment terms vary by the type and location of the customer and the products or services offered. The term between invoicing and when payment is due is not significant. For certain products or services and customer types, the Company requires payment before the products or services are delivered to the customer.
DISCOVERY, INC.
NOTES TO CONSOLIDATED FINANCIAL STATEMENTS
Share-Based Compensation Expense
The Company has incentive plans under which performance-based restricted stock units (“PRSUs”), service-based restricted stock units (“RSUs”), stock options, and stock appreciation rights (“SARs”) are issued. In addition, the Company offers an Employee Stock Purchase Plan (the "ESPP"). Share-based compensation expense for all awards is recorded as a component of selling, general and administrative expense. Forfeitures for all awards are recognized as incurred. Excess tax benefits realized from the exercise of stock options and vested RSUs, PRSUs and the ESPP are reported as cash inflows from operating activities on the consolidated statements of cash flows.
PRSUs
Vesting for PRSUs is subject to satisfying objective operating performance conditions or a combination of objective and subjective operating performance conditions. Compensation expense for PRSUs is based on the fair value of the Company’s Series A and C common stock on the date of grant. Compensation expense for PRSUs that vest based on achieving subjective operating performance conditions or in situations where the executive is able to withhold taxes in excess of the maximum statutory requirement, is remeasured at fair value each reporting period until the award is settled. Compensation expense for all PRSUs is recognized ratably, following a graded vesting pattern during the vesting period only when it is probable that the operating performance conditions will be achieved. The Company records a cumulative adjustment to compensation expense for PRSUs if there is a change in the determination of the probability that the operating performance conditions will be achieved.
RSUs
Compensation expense for RSUs is based on the fair value of the award on the date of grant and is recognized ratably during the vesting period.
SARs and Stock Options
Compensation expense for SARs is based on the fair value of the award. Because certain SARs are cash-settled, the Company remeasures the fair value of these awards each reporting period until settlement. Compensation expense for SARs, including changes in fair value, is recognized during the vesting period in proportion to the requisite service that has been rendered as of the reporting date. For awards with graded vesting, the Company measures fair value and records compensation expense separately for each vesting tranche.
Compensation expense for stock options is based on the fair value of the award on the date of grant and is recognized ratably during the vesting period.
The fair values of SARs and stock options are estimated using the Black-Scholes option-pricing model. Because the Black-Scholes option-pricing model requires the use of subjective assumptions, changes in these assumptions can materially affect the fair value of awards. For SARs, the expected term is the period from the grant date to the end of the contractual term of the award unless the terms of the award allow for cash-settlement automatically on the date the awards vest, in which case the vesting date is used. For stock options the simplified method is utilized to calculate the expected term, since the Company does not have sufficient historical exercise data to provide a reasonable basis upon which to estimate the expected term. The simplified method considers the period from the date of grant through the mid-point between the vesting date and the end of the contractual term of the award. Expected volatility is based on a combination of implied volatilities from traded options on the Company’s common stock and historical realized volatility of the Company’s common stock. The dividend yield is assumed to be zero because the Company has no history of paying cash dividends and no present intention to pay dividends. The risk-free interest rate is based on U.S. Treasury zero-coupon issues with a remaining term equal to the expected term of the award.
ESPP
The ESPP enables eligible employees to purchase shares of the Company’s common stock through payroll deductions or other permitted means. The Company recognizes the fair value of the discount associated with shares purchased under the ESPP as share-based compensation expense.
Advertising Costs
Advertising costs are expensed as promotional services are delivered and are presented in selling, general and administrative expenses. Advertising costs paid to third parties totaled $412 million, $390 million and $355 million for years ended December 31, 2020, 2019 and 2018, respectively.
DISCOVERY, INC.
NOTES TO CONSOLIDATED FINANCIAL STATEMENTS
Income Taxes
Income taxes are recorded using the asset and liability method of accounting for income taxes. Deferred income taxes reflect the net tax effect of temporary differences between the carrying amounts of assets and liabilities for financial reporting purposes and the amounts used for income tax purposes. Deferred taxes are measured using rates the Company expects to apply to taxable income in years in which those temporary differences are expected to reverse. A valuation allowance is provided for deferred tax assets if it is more likely than not such assets will be unrealized. The Company also engaged in transactions that make the Company eligible for federal investment tax credits. The Company accounts for federal investment tax credits under the flow-through method, under which the tax benefit generated from an investment tax credit is recorded in the period the credit is generated.
From time to time, the Company engages in transactions in which the tax consequences may be uncertain. Significant judgment is required in assessing and estimating the tax consequences of these transactions. The Company prepares and files tax returns based on its interpretation of tax laws and regulations. In the normal course of business, the Company's tax returns are subject to examination by various taxing authorities. Such examinations may result in future tax and interest assessments by these taxing authorities.
In determining the Company's tax provision for financial reporting purposes, the Company establishes a reserve for uncertain tax positions unless the Company determines that such positions are more likely than not to be sustained upon examination based on their technical merits, including the resolution of any appeals or litigation processes. The Company includes interest and where appropriate, penalties, in its tax reserves. There is significant judgment involved in determining the amount of reserve and whether positions taken on the Company's tax returns are more likely than not to be sustained, which involve the use of significant estimates and assumptions with respect to the potential outcome of positions taken on tax returns that may be reviewed by tax authorities. The Company adjusts its tax reserve estimates periodically because of ongoing examinations by, and settlements with, various taxing authorities, as well as changes in tax laws, regulations and interpretations.
Concentrations Risk
Customers
The Company has long-term contracts with distributors around the world. For the U.S. Networks segment, 95% of distribution revenue comes from the 10 largest distributors. Agreements in place with the 10 largest cable and satellite operators with the U.S. Networks expire at various times from 2021 through 2023. Although the Company seeks to renew its agreements with its distributors prior to expiration of a contract, a delay in securing a renewal that results in a service disruption, a failure to secure a renewal or a renewal on less favorable terms may have a material adverse effect on the Company’s financial condition and results of operations. Not only could the Company experience a reduction in distribution revenue, but it could also experience a reduction in advertising revenue, as viewership is impacted by affiliate subscriber levels.
No individual customer accounted for more than 10% of total consolidated revenues for 2020, 2019 or 2018. As of December 31, 2020 and 2019, the Company’s trade receivables do not represent a significant concentration of credit risk as the customers and markets in which the Company operates are varied and dispersed across many geographic areas.
Financial Institutions
Cash and cash equivalents are maintained with several financial institutions. The Company has deposits held with banks that exceed the amount of insurance provided on such deposits. Generally, these deposits may be redeemed upon demand and are maintained with financial institutions of reputable credit and, therefore, bear minimal credit risk.
Counterparty Credit Risk
The Company is exposed to the risk that the counterparties to outstanding derivative financial instruments will default on their obligations. The Company manages these credit risks through the evaluation and monitoring of the creditworthiness of, and concentration of risk with, the respective counterparties. In this regard, credit risk associated with outstanding derivative financial instruments is spread across a relatively broad counterparty base of banks and financial institutions. The Company also has a limited number of arrangements where collateral is required to be posted in the instance that certain fair value thresholds are exceeded. As of December 31, 2020, the Company had posted $31 million of collateral under these arrangements. As of December 31, 2020, the Company's exposure to counterparty credit risk included derivative assets with an aggregate fair value of $97 million. (See Note 10.)
.
DISCOVERY, INC.
NOTES TO CONSOLIDATED FINANCIAL STATEMENTS
Accounting and Reporting Pronouncements Adopted
Content
In March 2019, the Financial Standards Accounting Board ("FASB") issued Accounting Standards Update ("ASU") 2019-02, which generally aligns the accounting for production costs of episodic television series with the accounting for production costs of films. In addition, ASU 2019-02 modifies certain aspects of the capitalization, impairment, presentation and disclosure requirements in Accounting Standards Codification (“ASC”) 926-20 and the impairment, presentation and disclosure requirements in ASC 920-350. The Company adopted this ASU on January 1, 2020 and will apply the provisions prospectively. In connection with this adoption, the Company elected to treat all content rights and prepaid license fees as a noncurrent asset, with the exception of content acquired with an initial license period of 12 months or less and prepaid sports rights expected to air within 12 months. As of December 31, 2020 and 2019, $532 million and $579 million, respectively, of content rights and prepaid license fees were reflected as a current asset. The Company determined that most of its content is exploited as part of film groups. For such content assets, the unit of account for the impairment assessment is the respective film group. There was no material impact upon adoption to the Consolidated Statements of Operations or the Consolidated Statements of Cash Flows. (See Note 6.)
Goodwill
In January 2017, the FASB issued ASU 2017-04, which simplifies the subsequent measurement of goodwill by eliminating Step 2 from the former two-step goodwill impairment test and eliminating the requirements for any reporting unit with a zero or negative carrying amount to perform a qualitative assessment. Therefore, an entity will recognize impairment charges for the amount by which the carrying amount exceeds the reporting unit's fair value not to exceed the amount of goodwill recorded for that reporting unit. Goodwill impairment will no longer be measured as the excess of the carrying amount of goodwill over its implied fair value determined by assigning the fair value of a reporting unit to all of its assets and liabilities as if it had been acquired in a business combination. The Company adopted this ASU on January 1, 2020 and has applied the provisions to quantitative goodwill impairment assessments performed in 2020. (See Note 7.)
Financial Instruments - Credit Losses
In June 2016, the FASB issued ASU 2016-13, which changes the impairment model for most financial assets and certain other instruments, including trade and other receivables, held-to-maturity debt securities and loans and replaces the incurred loss methodology with a new, forward-looking “expected loss” model that considers the risk of loss over the asset’s contractual life, even if remote, historical experience, current conditions, and reasonable and supportable forecasts of future relevant events. The Company adopted this ASU on January 1, 2020 using a modified retrospective approach and recorded a noncash cumulative effect of adoption as an increase to retained earnings of $2 million to align its credit loss methodology with the new standard. (See Note 14.)
Leases
In February 2016, the FASB issued ASU 2016-02, which requires lessees to recognize almost all of their leases on the balance sheet by recording a right-of-use asset and lease liability. The guidance also requires improved disclosures to help users of the financial statements better understand the amount, timing, and uncertainty of cash flows arising from leases. The Company adopted ASU 2016-02 effective January 1, 2019 and elected to apply the guidance at the effective date without recasting the comparative periods presented. Additionally, the Company elected to apply practical expedients allowing it to not reassess: 1) whether any expired or existing contracts previously assessed as not containing leases are, or contain, leases; 2) the lease classification for any expired or existing leases; and 3) initial direct costs for any existing leases. The Company also elected to not separate lease components from non-lease components across all lease categories. Instead, each separate lease component and non-lease component are accounted for as a single lease component. The Company did not elect to apply the practical expedient to use hindsight in determining the lease term and in assessing the right-of-use assets for impairment. Additionally, the Company did not elect to apply the short-term lease scope exemption.
Revenue from Contracts with Customers
In May 2014, the FASB issued ASU 2014-09, Revenue from Contracts with Customers ("Topic 606"), which updates numerous requirements in U.S. GAAP, eliminates industry-specific guidance, and provides companies with a single model for recognizing revenue from contracts with customers. The core principle of Topic 606 is that a company should recognize revenue to depict the transfer of promised goods or services to customers in an amount that reflects the consideration to which the company expects to be entitled in exchange for those goods or services. The guidance also addresses the accounting for costs incurred as part of obtaining or fulfilling a contract with a customer by adding ASC Subtopic 340-40, Other Assets and Deferred Costs: Contracts with Customers, and requiring that costs of obtaining a contract be recognized as an asset and amortized as goods and services are transferred to the customer, as long as the costs are expected to be recovered.
DISCOVERY, INC.
NOTES TO CONSOLIDATED FINANCIAL STATEMENTS
On January 1, 2018, the Company adopted Topic 606 using the modified retrospective method applied to contracts not completed as of January 1, 2018. Revenues do not include taxes collected from customers on behalf of taxing authorities such as sales tax and value-added tax. However, certain revenues include taxes that customers pay to taxing authorities on the Company’s behalf, such as foreign withholding tax.
Accounting and Reporting Pronouncements Not Yet Adopted
LIBOR
In March 2020, the FASB issued ASU 2020-04, which provides temporary optional expedients and exceptions for applying U.S. GAAP to contract modifications, hedging relationships, and other transactions if certain criteria are met in order to ease the potential accounting and financial reporting burden associated with the expected market transition away from the London Interbank Offered Rate (LIBOR) and other interbank offered rates to alternative reference rates. Additionally, in January 2021, the FASB issued ASU 2021-01, which clarifies the scope of Topic 848 and allows entities to elect certain optional expedients and exceptions when accounting for derivative contracts and certain hedging relationships affected by changes in the interest rates. These ASUs are effective as of March 12, 2020 through December 31, 2022. The Company is currently assessing the impact ASU 2020-04 and ASU 2021-01 will have on its consolidated financial statements and related disclosures, if elected.
Convertible Instruments
In August 2020, the FASB issued ASU 2020-06, which simplifies the accounting for convertible instruments by reducing the number of accounting models available for convertible debt instruments and convertible preferred stock. ASU 2020-06 also amends the guidance for the derivatives scope exception for contracts in an entity’s own equity to reduce form-over-substance-based accounting conclusions, requires the use of the if-converted method for calculating earnings per share for convertible instruments, and makes targeted improvements to the disclosures for convertible instruments and related earnings per share guidance. This ASU is effective for interim and annual periods beginning after December 15, 2021. Early adoption is permitted, but no earlier than fiscal years beginning after December 15, 2020. The Company is currently assessing the impact ASU 2020-06 will have on its consolidated financial statements and related disclosures.
NOTE 3. ACQUISITIONS AND DISPOSITIONS
Acquisitions
UKTV - Lifestyle Business
On June 11, 2019, the Company and BBC Studios (“BBC”) dissolved their 50/50 joint venture, UKTV, a British multi-channel broadcaster, with the Company taking full control of UKTV’s three lifestyle channels (the “Lifestyle Business”) and BBC taking full control of UKTV’s seven entertainment channels (the "Entertainment Business"). Prior to the transaction, the Company held a note receivable from UKTV of $118 million, which was included in equity method investments in the Company’s consolidated balance sheets. Concurrent with the transaction, the note was settled.
To compensate Discovery for the note receivable and for the difference in fair value between the Lifestyle Business and the Entertainment Business retained by BBC, Discovery received cash of $88 million at closing and a note receivable from BBC of $130 million, payable in two equal installments. The first installment was received in June 2020 and the second installment is due in June 2021. The Company used a market-based valuation model to determine the fair value of the previously held 50% equity method investment in the Lifestyle Business and recognized a gain of $5 million during the year ended December 31, 2019 for the difference between the carrying value and the fair value of the of the previously held equity interest. The gain is included in other income (expense), net in the Company's consolidated statement of operations.
The Company applied the acquisition method of accounting to the Lifestyle Business, whereby the excess of the fair value of the business over the fair value of identifiable net assets was allocated to goodwill. The goodwill reflects the workforce and synergies expected from broader exposure to the lifestyle entertainment sector in the U.K. The goodwill recorded as part of this acquisition is included in the International Networks reportable segment and is not amortizable for tax purposes. Intangible assets consist of electronic program guide slots and trademarks and have a weighted average useful life of 6 years. The Company used discounted cash flow ("DCF") analyses, which represent Level 3 fair value measurements, to assess certain components of its purchase price allocation. The measurement period closed in June 2020, with no material adjustments recorded.
DISCOVERY, INC.
NOTES TO CONSOLIDATED FINANCIAL STATEMENTS
The final fair value of Lifestyle Business assets acquired and liabilities assumed, as well as a reconciliation to total assets received in dissolution of the UKTV joint venture, is presented in the table below (in millions).
| | | | | | | | |
| Cash | | $ | 17 | |
| Content rights | | 18 | |
| Intangible assets | | 34 | |
| Goodwill | | 121 | |
| Accrued liabilities | | (12) | |
| | |
| Total assets acquired and liabilities assumed in Lifestyle Business | | 178 | |
| Note receivable from BBC | | 130 | |
| Cash received | | 88 | |
| Net assets received in dissolution of UKTV joint venture | | $ | 396 | |
| | |
| | |
| | |
| | |
| | |
| | |
| | |
| | |
| | |
| | |
| | |
| | |
| | |
| | |
| | |
| | |
| | |
A summary of total assets derecognized in connection with the dissolution of the UKTV joint venture is presented in the table below (in millions).
| | | | | | | | |
| Carrying value of UKTV equity method investment | | $ | 278 | |
| Settlement of note receivable | | 118 | |
| Total assets derecognized in dissolution of UKTV joint venture | | $ | 396 | |
| | |
| | |
| | |
| | |
| | |
| | |
| | |
| | |
| | |
| | |
| | |
| | |
| | |
| | |
| | |
| | |
| | |
| | |
| | |
| | |
| | |
| | |
| | |
| | |
In connection with the above transaction, the Company contemporaneously entered into a ten-year content licensing arrangement with BBC in exchange for license fees over the term.
Scripps Networks
On March 6, 2018, Discovery acquired Scripps Networks. The acquisition of Scripps Networks allows the Company to offer complementary brands with an extensive library of original programming to consumers and to become a scale player with the ability to compete for audiences and advertising revenue. The acquisition is intended to extend Scripps Networks' content to a broader international audience through Discovery's global distribution infrastructure. Finally, the acquisition of Scripps Networks has created cost synergies for the Company.
The consideration paid for the acquisition of Scripps Networks consisted of the following:
(i) for Scripps Networks shareholders that did not make an election or elected to receive the mixed consideration, $65.82 in cash and 1.0584 shares of Discovery Series C common stock for each Scripps Networks share,
(ii) for Scripps Networks shareholders that elected to receive the cash consideration, $90.00 in cash for each Scripps Networks share,
(iii) for Scripps Networks shareholders that elected to receive the stock consideration, 3.9392 shares of Discovery Series C common stock for each Scripps Networks share, and
(iv) transaction costs that Discovery paid for costs incurred by Scripps Networks in conjunction with the acquisition.
DISCOVERY, INC.
NOTES TO CONSOLIDATED FINANCIAL STATEMENTS
The following table summarizes the components of the aggregate consideration paid for the acquisition of Scripps Networks (in millions of dollars and shares, except for per share amounts, share conversion ratio and stock option conversion ratio).
| | | | | | | | |
| Scripps Networks equity | | |
| Scripps Networks shares outstanding | | 131 | |
| Cash consideration per Scripps Networks share | | $ | 65.82 | |
| Cash portion of consideration | | $ | 8,590 | |
| | |
| Scripps Networks shares outstanding | | 131 | |
| Share conversion ratio per Scripps Networks share | | 1.0584 |
| Discovery Series C common stock | | 138 | |
| Discovery Series C common stock price per share | | $ | 23.01 | |
| Equity portion of consideration | | $ | 3,179 | |
| | |
| | |
| Shares awarded under Scripps Networks share-based compensation programs | | 3 | |
| Scripps Networks share-based compensation awards converting to cash | | 2 | |
| Average cash consideration per share awarded less applicable exercise price | | $ | 46.90 | |
| Cash portion of consideration | | $ | 88 | |
| | |
| Scripps Networks share-based compensation awards | | 1 | |
| Share-based compensation conversion ratio (based on intrinsic value per award) | | 3 | |
| Discovery Series C common stock issued (1) or share-based compensation converted (2) | | 3 | |
| Average equity value (intrinsic value of Discovery Series C common stock or options to be issued) | | $ | 15.19 | |
| Share-based compensation equity value | | $ | 51 | |
| Less: post-combination compensation expense | | (12) | |
| Equity portion of consideration | | 39 | |
| | |
| Scripps Networks transaction costs paid by Discovery | | 117 | |
| | |
| | |
| | |
| Total consideration paid | | $ | 12,013 | |
Balances reflect rounding of dollar and share amounts to millions, which may result in differences for recalculated standalone amounts compared with the amounts presented above.
The Company applied the acquisition method of accounting to Scripps Networks' business, whereby the excess of the fair value of the business over the fair value of identifiable net assets was allocated to goodwill. Goodwill reflects workforce and synergies expected from cost savings, operations and revenue enhancements of the combined company that are expected to result from the acquisition. The goodwill recorded as part of this acquisition was allocated to the U.S. Networks and International Networks reportable segments in the amounts of $5.3 billion and $817 million, respectively, and is not amortizable for tax purposes.
The Company used DCF analyses, which represent Level 3 fair value measurements, to assess certain components of its purchase price allocation. The fair value of equity interests previously held by Scripps Networks was determined using the discounted cash flow and market value methods. The fair value of trade-names and trademarks was determined using an income approach based on the relief from royalty method; the remaining intangibles were determined using an income approach based on the excess earnings method. The fair value of interest-bearing debt was determined using publicly-traded prices. For the fair value estimates, the Company used: (i) projected discounted cash flows, (ii) historical and projected financial information, (iii) synergies including cost savings, and (iv) attrition rates, as relevant, that market participants would consider when estimating fair values. In March 2019, the Company finalized the fair value of assets acquired and liabilities assumed. Measurement period adjustments were reflected in the periods in which the adjustments occurred. The adjustments resulted from the receipt of additional financial projections associated with certain equity method investments, contingent liability estimates, deferred income tax adjustments, and true-ups for estimated working capital balances. The fair value of assets acquired and liabilities assumed, measurement period adjustments, as well as a reconciliation to consideration paid is presented in the table below (in millions).
DISCOVERY, INC.
NOTES TO CONSOLIDATED FINANCIAL STATEMENTS
| | | | | | | | | | | | | | | | | | | | |
| | Preliminary | | Measurement Period Adjustments | | Final |
| Accounts receivable | | $ | 783 | | | $ | — | | | $ | 783 | |
| Other current assets | | 421 | | | (9) | | | 412 | |
| Content rights | | 1,088 | | | (14) | | | 1,074 | |
| Property and equipment | | 315 | | | — | | | 315 | |
| Goodwill | | 6,003 | | | 154 | | | 6,157 | |
| Intangible assets | | 9,175 | | | — | | | 9,175 | |
| Equity method investments, including note receivable | | 870 | | | (157) | | | 713 | |
| Other noncurrent assets | | 111 | | | 4 | | | 115 | |
| Current liabilities assumed | | (494) | | | (105) | | | (599) | |
| Debt assumed | | (2,481) | | | — | | | (2,481) | |
| Deferred income taxes | | (1,695) | | | 123 | | | (1,572) | |
| Other noncurrent liabilities | | (383) | | | 4 | | | (379) | |
| Noncontrolling interests | | (1,700) | | | — | | | (1,700) | |
| Total consideration paid | | $ | 12,013 | | | $ | — | | | $ | 12,013 | |
The table below presents a summary of intangible assets acquired and weighted average estimated useful life of these assets.
| | | | | | | | | | | | | | |
| | Fair Value | | Weighted Average Useful Life in Years |
| Trademarks and trade names | | $ | 1,225 | | | 10 |
| Advertiser relationships | | 4,995 | | | 10 |
| Advertising backlog | | 280 | | | 1 |
| Affiliate relationships | | 2,455 | | | 12 |
| Broadcast licenses | | 220 | | | 6 |
| Total intangible assets acquired | | $ | 9,175 | | | |
Magnolia Discovery Ventures
On July 19, 2019, the Company contributed its linear cable network focused on home improvement, DIY Network, to a new joint venture, Magnolia Discovery Ventures, LLC ("Magnolia"), with Chip and Joanna Gaines acting as Chief Creative Officers to the joint venture. The joint venture is expected to replace and rebrand the DIY Network, and include a TVE app and a subscription streaming service planned for a future date.
Upon formation of Magnolia, Discovery received a 75% ownership interest in the joint venture. In exchange for providing services and exclusivity to the joint venture, the Gaines received a 25% ownership interest in the joint venture, a put right after 6.5 years at fair value, potential for an additional 5% incentive equity, and certain guaranteed payments. Discovery consolidated the joint venture under the voting interest consolidation model. Payments to the Gaines for rendering services in their capacity as the Chief Creative Officers of the joint venture will be accounted for as liability-classified share-based awards to non-employees as services are rendered.
Golf Digest
On May 13, 2019, the Company paid $36 million in cash to acquire Golf Digest, a leading golf brand whose content is available across multiple platforms, including print and social media. The Company applied the acquisition method of accounting to Golf Digest, and recorded net assets of $36 million, including net working capital liabilities of $12 million, intangible assets of $25 million and goodwill of $23 million. The measurement period closed in May 2020, with no material adjustments recorded. Intangible assets consist of trademarks and trade names and licensing agreements and have a weighted average useful life of 9 years. The goodwill reflects the workforce and synergies expected from broader exposure to the golf entertainment sector. The goodwill recorded as part of this acquisition is included in the International Networks reportable segment and is not amortizable for tax purposes.
DISCOVERY, INC.
NOTES TO CONSOLIDATED FINANCIAL STATEMENTS
Play Sports Group Limited
On January 8, 2019, the Company acquired a controlling interest in Play Sports Group Limited, increasing Discovery's ownership stake from 20.1% to 70.7%. The Company recognized a gain of $8 million during the year ended December 31, 2019, which represents the difference between the carrying value and the fair value of the previously held 20.1% equity method investment. The gain is included in other income (expense), net in the Company's consolidated statement of operations. The measurement period closed in January 2020, with no material adjustments recorded.
Other
During 2018, 2019, and 2020, the Company completed other immaterial acquisitions.
Pro Forma Financial Information
The following unaudited pro forma information has been presented as if the acquisition of Scripps Networks occurred on January 1, 2017. Pro forma information for the Company's other acquisitions was not material. The information is based on the historical results of operations of the acquired businesses, adjusted for:
1.The allocation of purchase price and related adjustments, including adjustments to amortization expense related to the fair value of intangible assets acquired and the recognition of the noncontrolling interests;
2.Impacts of debt financing, including interest for debt issued and amortization associated with the fair value adjustments of debt assumed;
3.The movement and allocation of all acquisition-related costs incurred during the year ended December 31, 2018 to the year ended December 31, 2017;
4.Associated tax-related impacts of adjustments; and
5.Changes to align accounting policies.
The pro forma results do not necessarily represent what would have occurred if the acquisition of Scripps Networks had taken place on January 1, 2017, nor do they represent the results that may occur in the future. The pro forma adjustments were based on available information and upon assumptions that the Company believes are reasonable to reflect the impact of this acquisition on the Company's historical financial information on a supplemental pro forma basis (in millions). The following table presents the Company's pro forma combined revenues and net income (in millions, except per share value). Pro forma results for the years ended December 31, 2020 and 2019 are not presented below because the results for Scripps Networks are included in the Company's consolidated statement of operations for those years.
| | | | | | | | |
| | |
| | Year Ended December 31, 2018 |
| Revenues | | $ | 11,176 | |
| Net income available to Discovery, Inc. | | 823 | |
| Net income per share - basic | | 1.15 | |
| Net income per share - diluted | | 1.15 | |
Impact of Business Combination
The operations of Scripps Networks discussed above were included in the consolidated financial statements as of the acquisition date of March 6, 2018. The following table presents the revenue and earnings for Scripps Networks as reported within the consolidated financial statements (in millions).
| | | | | | | | |
| | Year ended December 31, 2018 |
| Revenues: | | |
| Advertising | | $ | 2,163 | |
| Distribution | | 795 | |
| Other | | 90 | |
| Total revenues | | $ | 3,048 | |
| Net income available to Discovery, Inc. | | $ | 204 | |
DISCOVERY, INC.
NOTES TO CONSOLIDATED FINANCIAL STATEMENTS
Dispositions
Education Business
In 2018, the Company sold an 88% controlling equity stake in its education business to Francisco Partners for a sale price of $113 million. The Company recorded a gain of $84 million based on net assets disposed of $44 million, including $40 million of goodwill. The impact of the education business on the Company's income before income taxes was a loss of $2 million for the year ended December 31, 2018. Discovery retained a 12% ownership interest in the education business, which is accounted for as an equity method investment. Discovery has long-term trade name license agreements with the education business that are royalty arrangements at fair value.
NOTE 4. INVESTMENTS
The Company’s equity investments consisted of the following (in millions).
| | | | | | | | | | | | | | | | | | | | | | | | | | |
| Category | | Balance Sheet Location | | Ownership | | December 31, 2020 | | December 31, 2019 |
| Equity method investments: | | | | | | | | |
| nC+ | | Equity method investments | | 32% | | $ | 164 | | | $ | 182 | |
Discovery Solar Ventures, LLC (a) | | Equity method investments | | N/A | | 83 | | | 92 | |
| All3Media | | Equity method investments | | 50% | | 76 | | | 75 | |
| Other | | Equity method investments | | | | 184 | | | 219 | |
| Total equity method investments | | | | | | 507 | | | 568 | |
| | | | | | | | |
| Investments with readily determinable fair values | | Prepaid expenses and other current assets | | | | 32 | | | — | |
| Investments with readily determinable fair values | | Other noncurrent assets | | | | 54 | | | 51 | |
| | | | | | | | |
| Equity investments without readily determinable fair values: | | | | | | | | |
Group Nine Media (b) | | Other noncurrent assets | | 25% | | 276 | | | 256 | |
Formula E (c) | | Other noncurrent assets | | 25% | | 65 | | | 65 | |
| Other | | Other noncurrent assets | | | | 200 | | | 193 | |
| Total equity investments without readily determinable fair values | | | | | | 541 | | | 514 | |
| Total equity investments | | | | | | $ | 1,134 | | | $ | 1,133 | |
| | | | | | | | |
(a) Discovery Solar Ventures, LLC invests in limited liability companies that sponsor renewable energy projects related to solar energy. These investments are considered VIEs of the Company and are accounted for under the equity method of accounting using the HLBV methodology for allocating earnings. |
(b) Overall ownership percentage for Group Nine Media is calculated on an outstanding shares basis. The amount shown herein includes a $20 million note receivable balance presented within Prepaid expenses and other current assets on the Company's consolidated balance sheets. |
(c) Ownership percentage for Formula E includes holdings accounted for as an equity method investment and holdings accounted for as an equity investment without a readily determinable fair value. |
Equity Method Investments
Investments in equity method investees are those for which the Company has the ability to exercise significant influence but does not control and is not the primary beneficiary. The Company recorded impairment losses of $8 million, $4 million and $29 million for the years ended December 31, 2020, 2019 and 2018, respectively, because the change in value was considered other-than-temporary. The impairment losses are reflected as a component of loss from equity investees on the Company's consolidated statement of operations.
DISCOVERY, INC.
NOTES TO CONSOLIDATED FINANCIAL STATEMENTS
With the exception of nC+, the carrying values of the Company’s equity method investments are consistent with its ownership in the underlying net assets of the investees. A portion of the Scripps Networks purchase price associated with the investment in nC+ was attributed to amortizable intangible assets. This basis difference is included in the carrying value of nC+ and is amortized over time as a reduction of earnings from nC+. Earnings from nC+ were reduced by the amortization of these intangibles of $10 million, $9 million, and $9 million during the years ended December 31, 2020, 2019 and 2018, respectively. Amortization that reduces the Company's equity in earnings of nC+ for future periods is expected to be $51 million.
Certain of the Company's other equity method investments are VIEs, for which the Company is not the primary beneficiary. As of December 31, 2020, the Company’s maximum exposure for all its unconsolidated VIEs, including the investment carrying values and unfunded contractual commitments made on behalf of VIEs, was approximately $250 million. The Company's maximum estimated exposure excludes the non-contractual future funding of VIEs. The aggregate carrying values of these VIE investments were $123 million as of December 31, 2020 and $160 million as of December 31, 2019. The Company recognized its portion of VIE operating results with net losses of $91 million, $14 million, and $52 million for the years ended December 31, 2020, 2019 and 2018, respectively, in loss from equity investees, net on the consolidated statements of operations.
Investments with Readily Determinable Fair Value
Investments in entities or other securities in which the Company has no control or significant influence, is not the primary beneficiary, and have a readily determinable fair value are classified as equity investments with readily determinable fair value. The investments are measured at fair value based on a quoted market price per unit in active markets multiplied by the number of units held without consideration of transaction costs (Level 1). Gains and losses are recorded in other income (expense), net on the consolidated statements of operations.
The Company owns shares of common stock of Lions Gate Entertainment Corp. ("Lionsgate"), an entertainment company. Formerly, the Company hedged 50% of the Lionsgate shares with an equity collar (the "Lionsgate Collar") and pledged those shares as collateral to the derivative counterparty with changes in fair value reflected as a component of other income (expense), net on the consolidated statements of operations. (See Note 10.) During the year ended December 31, 2020, the Company terminated the Lionsgate Collar. The Company received cash of $44 million and recognized a gain of $7 million, which represents the difference between the carrying value and the fair value of the hedged shares, upon termination. The gain is included in other income (expense), net on the consolidated statements of operations.
During the fourth quarter of 2020, fuboTV Inc., an investment that was formerly determined to not have a readily determinable fair value, was listed on the New York Stock Exchange. As a result, the Company recognized a total gain of $126 million, including a realized gain and receivable of $101 million pertaining to the Company's sale of 4 million fuboTV Inc. shares. Such gain and receivable are recorded in other income (expense), net on the consolidated statements of operations and prepaid expenses and other current assets on the consolidated balance sheets, respectively. (See Note 20.)
The gains and losses related to the Company's investments with readily determinable fair values for the years ended December 31, 2020, 2019 and 2018 are summarized in the table below (in millions).
| | | | | | | | | | | | | | | | | | | | |
| | Year Ended December 31, |
| | 2020 | | 2019 | | 2018 |
| Net gains (losses) recognized during the period on equity securities | | $ | 129 | | | $ | (26) | | | $ | (88) | |
| Less: Net gains recognized on equity securities sold | | 101 | | | — | | | — | |
| Unrealized gains (losses) recognized during reporting period on equity securities still held at the reporting date | | $ | 28 | | | $ | (26) | | | $ | (88) | |
Equity investments without readily determinable fair values assessed under the measurement alternative
Equity investments without readily determinable fair value include ownership rights that either (i) do not meet the definition of in-substance common stock or (ii) do not provide the Company with control or significant influence and these investments do not have readily determinable fair values.
During the year ended December 31, 2020, the Company invested $39 million in various equity investments without readily determinable fair values and concluded that its other equity investments without readily determinable fair values had no indicators that a change in fair value had taken place. As of December 31, 2020, the Company had recorded cumulative upward adjustments of $9 million for its equity investments without readily determinable fair values.
DISCOVERY, INC.
NOTES TO CONSOLIDATED FINANCIAL STATEMENTS
NOTE 5. FAIR VALUE MEASUREMENTS
Fair value is defined as the amount that would be received for selling an asset or paid to transfer a liability in an orderly transaction between market participants. Assets and liabilities carried at fair value are classified in the following three categories:
| | | | | | | | |
| Level 1 | – | Quoted prices for identical instruments in active markets. |
| Level 2 | – | Quoted prices for similar instruments in active markets; quoted prices for identical or similar instruments in markets that are not active; and model-derived valuations in which all significant inputs and significant value drivers are observable in active markets. |
| Level 3 | – | Valuations derived from techniques in which one or more significant inputs are unobservable. |
The table below presents assets and liabilities measured at fair value on a recurring basis (in millions).
| | | | | | | | | | | | | | | | | | | | | | | | | | | | | | | | |
| | | | December 31, 2020 |
| Category | | Balance Sheet Location | | Level 1 | | Level 2 | | Level 3 | | Total |
| Assets | | | | | | | | | | |
| Cash equivalents: | | | | | | | | | | |
| Time deposits | | Cash and cash equivalents | | $ | — | | | $ | 7 | | | $ | — | | | $ | 7 | |
| Treasury securities | | Cash and cash equivalents | | 500 | | | — | | | — | | | 500 | |
| Equity securities: | | | | | | | | | | |
| Money market funds | | Cash and cash equivalents | | — | | | 150 | | | — | | | 150 | |
| Time deposits | | Prepaid expenses and other current assets | | — | | | 250 | | | — | | | 250 | |
| Mutual funds | | Prepaid expenses and other current assets | | 14 | | | — | | | — | | | 14 | |
| Company-owned life insurance contracts | | Prepaid expenses and other current assets | | — | | | 4 | | | — | | | 4 | |
| Mutual funds | | Other noncurrent assets | | 200 | | | — | | | — | | | 200 | |
| Company-owned life insurance contracts | | Other noncurrent assets | | — | | | 48 | | | — | | | 48 | |
| Total | | | | $ | 714 | | | $ | 459 | | | $ | — | | | $ | 1,173 | |
| Liabilities | | | | | | | | | | |
| Deferred compensation plan | | Accrued liabilities | | $ | 28 | | | $ | — | | | $ | — | | | $ | 28 | |
| Deferred compensation plan | | Other noncurrent liabilities | | 220 | | | — | | | — | | | 220 | |
| Total | | | | $ | 248 | | | $ | — | | | $ | — | | | $ | 248 | |
| | | | | | | | | | | | | | | | | | | | | | | | | | | | | | | | |
| | | | December 31, 2019 |
| Category | | Balance Sheet Location | | Level 1 | | Level 2 | | Level 3 | | Total |
| Assets | | | | | | | | | | |
| Cash equivalents: | | | | | | | | | | |
| Time deposits | | Cash and cash equivalents | | $ | — | | | $ | 10 | | | $ | — | | | $ | 10 | |
| Equity securities: | | | | | | | | | | |
| Mutual funds | | Prepaid expenses and other current assets | | 11 | | | — | | | — | | | 11 | |
| Company-owned life insurance contracts | | Prepaid expenses and other current assets | | — | | | 4 | | | — | | | 4 | |
| Mutual funds | | Other noncurrent assets | | 192 | | | — | | | — | | | 192 | |
| Company-owned life insurance contracts | | Other noncurrent assets | | — | | | 45 | | | — | | | 45 | |
| Total | | | | $ | 203 | | | $ | 59 | | | $ | — | | | $ | 262 | |
| Liabilities | | | | | | | | | | |
| Deferred compensation plan | | Accrued liabilities | | $ | 24 | | | $ | — | | | $ | — | | | $ | 24 | |
| Deferred compensation plan | | Other noncurrent liabilities | | 209 | | | — | | | — | | | 209 | |
| Total | | | | $ | 233 | | | $ | — | | | $ | — | | | $ | 233 | |
DISCOVERY, INC.
NOTES TO CONSOLIDATED FINANCIAL STATEMENTS
Equity securities include money market funds, time deposits, investments in mutual funds held in separate trusts, which are owned as part of the Company’s supplemental retirement plans, and company-owned life insurance contracts. (See Note 16.) The fair value of Level 1 equity securities was determined by reference to the quoted market price per share in active markets multiplied by the number of shares held without consideration of transaction costs. The fair value of the deferred compensation plan liability was determined based on the fair value of the related investments elected by employees. Changes in the fair value of the investments are offset by changes in the fair value of the deferred compensation obligation. (See Note 16.) Company-owned life insurance contracts are recorded at their cash surrender value, which approximates fair value (Level 2).
In addition to the financial instruments listed in the tables above, the Company holds other financial instruments, including cash deposits, accounts receivable, accounts payable, and senior notes. The carrying values for such financial instruments, other than the senior notes, each approximated their fair values as of December 31, 2020 and 2019. The estimated fair value of the Company’s outstanding senior notes using quoted prices from over-the-counter markets, considered Level 2 inputs, was $18.7 billion and $17.1 billion as of December 31, 2020 and 2019, respectively.
The Company's derivative financial instruments are discussed in Note 10.
NOTE 6. CONTENT RIGHTS
The following table presents the components of content rights (in millions).
| | | | | | | | | | | | | | |
| | | December 31, |
| | | 2020 | | 2019 |
| Produced content rights: | | | | |
| Completed | | $ | 8,576 | | | $ | 6,976 | |
| In-production | | 731 | | | 582 | |
| Coproduced content rights: | | | | |
| Completed | | 888 | | | 882 | |
| In-production | | 78 | | | 50 | |
| Licensed content rights: | | | | |
| Acquired | | 1,312 | | | 1,101 | |
| Prepaid | | 556 | | | 249 | |
| Content rights, at cost | | 12,141 | | | 9,840 | |
| Accumulated amortization | | (8,170) | | | (6,132) | |
| Total content rights, net | | 3,971 | | | 3,708 | |
| Current portion | | (532) | | | (579) | |
| Noncurrent portion | | $ | 3,439 | | | $ | 3,129 | |
Content expense consisted of the following (in millions).
| | | | | | | | | | | | | | | | | | | | |
| | Year Ended December 31, |
| | 2020 | | 2019 | | 2018 |
| Content amortization | | $ | 2,908 | | | $ | 2,786 | | | $ | 2,858 | |
| Other production charges | | 334 | | | 412 | | | 471 | |
Content impairments | | 48 | | | 67 | | | 430 | |
| Total content expense | | $ | 3,290 | | | $ | 3,265 | | | $ | 3,759 | |
Content expense is generally a component of costs of revenue on the consolidated statements of operations. No content impairments were recorded as a component of restructuring and other charges during the years ended December 31, 2020 and December 31, 2019. Content impairments of $405 million for the year ended December 31, 2018 were due to the strategic programming changes following the acquisition of Scripps Networks and are reflected in restructuring and other charges as further described in Note 17.
DISCOVERY, INC.
NOTES TO CONSOLIDATED FINANCIAL STATEMENTS
As of December 31, 2020, the Company expects to amortize approximately 59%, 26% and 12% of its produced and co-produced content, excluding content in-production, and 55%, 21% and 9% of its licensed content rights in the next three twelve-month operating cycles ended December 31, 2021, 2022 and 2023, respectively.
NOTE 7. GOODWILL AND INTANGIBLE ASSETS
Goodwill
The carrying value and changes in the carrying value of goodwill attributable to each business unit were as follows (in millions).
| | | | | | | | | | | | | | | | | | | | | | |
| | U.S.
Networks | | International
Networks | | | | Total |
| December 31, 2018 | | $ | 10,785 | | | $ | 2,221 | | | | | $ | 13,006 | |
| Acquisitions (Note 3) | | 3 | | | 191 | | | | | 194 | |
| | | | | | | | |
| Impairment of goodwill | | — | | | (155) | | | | | (155) | |
| Foreign currency translation and other adjustments | | 25 | | | (20) | | | | | 5 | |
| December 31, 2019 | | $ | 10,813 | | | $ | 2,237 | | | | | $ | 13,050 | |
| Acquisitions (Note 3) | | — | | | 25 | | | | | 25 | |
| | | | | | | | |
| Impairment of goodwill | | — | | | (121) | | | | | (121) | |
| Foreign currency translation and other adjustments | | — | | | 116 | | | | | 116 | |
| December 31, 2020 | | $ | 10,813 | | | $ | 2,257 | | | | | $ | 13,070 | |
The carrying amount of goodwill at the U.S. Networks segment included accumulated impairments of $20 million as of December 31, 2020 and 2019. The carrying amount of goodwill at the International Networks segment included accumulated impairments of $1.6 billion and $1.5 billion as of December 31, 2020 and 2019, respectively.
Intangible Assets
Finite-lived intangible assets consisted of the following (in millions, except years).
| | | | | | | | | | | | | | | | | | | | | | | | | | | | | | | | | | | | | | | | | |
| | Weighted
Average
Amortization
Period (Years) | | December 31, 2020 | | December 31, 2019 |
| Gross | | Accumulated
Amortization | | Net | | Gross | | Accumulated
Amortization | | Net |
| Intangible assets subject to amortization: | | | | | | | | | | | | | |
| Trademarks | 10 | | $ | 1,751 | | | $ | (715) | | | $ | 1,036 | | | $ | 1,708 | | | $ | (515) | | | $ | 1,193 | |
| Customer relationships | 10 | | 9,551 | | | (3,338) | | | $ | 6,213 | | | 9,446 | | | (2,408) | | | $ | 7,038 | |
| Other | 8 | | 421 | | | (191) | | | 230 | | | 400 | | | (128) | | | 272 | |
| Total | | | $ | 11,723 | | | $ | (4,244) | | | $ | 7,479 | | | $ | 11,554 | | | $ | (3,051) | | | $ | 8,503 | |
Straight-line amortization expense for finite-lived intangible assets reflects the pattern in which the assets' economic benefits are consumed over their estimated useful lives. Amortization expense related to finite-lived intangible assets was $1.1 billion, $1.1 billion and $1.2 billion for the years ended December 31, 2020, 2019 and 2018, respectively.
DISCOVERY, INC.
NOTES TO CONSOLIDATED FINANCIAL STATEMENTS
Amortization expense relating to intangible assets subject to amortization for each of the next five years and thereafter is estimated to be as follows (in millions).
| | | | | | | | | | | | | | | | | | | | | | | | | | | | | | | | | | | | | | |
| | 2021 | | 2022 | | 2023 | | 2024 | | 2025 | | Thereafter |
| Amortization expense | | $ | 1,079 | | | $ | 1,048 | | | $ | 1,014 | | | $ | 928 | | | $ | 901 | | | $ | 2,509 | |
Indefinite-lived intangible assets not subject to amortization (in millions):
| | | | | | | | | | | | | | |
| | | December 31, |
| | | 2020 | | 2019 |
| Trademarks | | $ | 161 | | | $ | 164 | |
Impairment Analysis
2020 Impairment Analysis
The Company concluded that the continued impacts of COVID-19 on the operating results of the Europe reporting unit represented a triggering event in the second quarter of 2020. During the second quarter, the Company performed a quantitative goodwill impairment analysis for its Europe reporting unit using a DCF valuation model. A market-based valuation model was not weighted in the analysis given the significant volatility in the equity markets. Significant judgments and assumptions in the DCF model included the amount and timing of future cash flows, including revenue growth rates, long-term growth rates of 2%, and a discount rate ranging from 10% to 10.5%. The estimated fair value of the Europe reporting unit exceeded its carrying value and, therefore, no impairment was recorded.
Also during the second quarter of 2020, the Company determined that it was more likely than not that the fair value was greater than the carrying value for all other reporting units with the exception of the Asia-Pacific reporting unit. The Company performed a quantitative goodwill impairment analysis for the Asia-Pacific reporting unit and determined that the estimated fair value did not exceed its carrying value, which resulted in a pre-tax impairment charge to write-off the remaining $36 million goodwill balance during the second quarter of 2020. The impairment charge was not deductible for tax purposes. Significant judgments and assumptions included the amount and timing of future cash flows, including revenue growth rates, long-term growth rates ranging from 2% to 2.5%, and a discount rate of 11%. The cash flows employed in the DCF analysis for the Asia-Pacific reporting unit were based on the reporting unit’s budget and long-term business plan. The determination of fair value of the Company’s Asia-Pacific reporting unit represents a Level 3 fair value measurement in the fair value hierarchy due to its use of internal projections and unobservable measurement inputs. The goodwill impairment charge did not have an impact on the calculation of the Company’s financial covenants under the Company’s debt arrangements.
During the third quarter of 2020, the Company realigned its International Networks management reporting structure. As a result, Australia and New Zealand, which were previously included in the Europe reporting unit, are now included in the Asia-Pacific reporting unit, including the associated goodwill. As a result of this realignment, the Company performed a quantitative goodwill impairment analysis for its Europe and Asia-Pacific reporting units using a DCF valuation model. A market-based valuation model was not weighted in the analysis given the significant volatility in the equity markets. Significant judgments and assumptions in the DCF model included the amount and timing of future cash flows, including revenue growth rates, long-term growth rates of 2% for Europe and 2% to 2.5% for Asia-Pacific, and a discount rate ranging from 10% to 10.5% for Europe and 11% for Asia-Pacific. The estimated fair value of both the Europe and Asia-Pacific reporting units exceeded their carrying values and, therefore, no impairment was recorded.
During the fourth quarter of 2020, the Company performed its annual qualitative goodwill impairment assessment for all reporting units and it determined that it was more likely than not that the fair value of those reporting units exceeded their carrying values, except for its Europe and Asia-Pacific reporting units. Given limited headroom of below 20% in its Europe and Asia-Pacific reporting units during the third quarter of 2020, the Company performed a quantitative goodwill impairment analysis for each of these reporting units using a DCF valuation model. A market-based valuation model was not weighted in the analysis due to significant volatility in the reporting units' equity markets.
The quantitative goodwill impairment analysis for the Company’s Europe reporting unit indicated that the estimated fair value exceeded its carry value by approximately 20% and, therefore, no impairment was recorded. Significant judgments and assumptions included the amount and timing of future cash flows, including revenue growth rates, long-term growth rate of 2%, and discount rates ranging from 10.5% to 11%. The Company noted that a 1.0% increase in the discount rate and a 0.5% decrease in the long-term growth rate would not have resulted in an impairment loss. As of December 31, 2020, the carrying value of goodwill assigned to the Europe reporting unit was $1.9 billion.
DISCOVERY, INC.
NOTES TO CONSOLIDATED FINANCIAL STATEMENTS
The quantitative impairment analysis for the Company’s Asia-Pacific reporting unit indicated that estimated fair value did not exceed its carrying value, which resulted in a pre-tax impairment charge to write-off the remaining $85 million goodwill balance. The impairment was a result of increased cost projections for this region committed to during the fourth quarter of 2020 as part of our global discovery+ rollout strategy. The impairment charge was not deductible for tax purposes. Significant judgments and assumptions included the amount and timing of future cash flows, including revenue growth rates, long-term growth rates ranging from 2% to 2.5%, and a discount rate of 11%. The cash flows employed in the DCF analysis for the Asia-Pacific reporting unit were based on the reporting unit’s budget and long-term business plan. The determination of fair value of the Company’s Asia-Pacific reporting unit represents a Level 3 fair value measurement in the fair value hierarchy due to its use of internal projections and unobservable measurement inputs. The goodwill impairment charge did not have an impact on the calculation of the Company’s financial covenants under the Company’s debt arrangements.
2019 Impairment Analysis
During the third quarter of 2019, due to an increasingly challenging business environment in the Asia-Pacific region, which included 1) moderating revenue growth projections, 2) underperformance of certain sports investments, 3) heightened volatility in China and surrounding economies, and 4) a decline in Asia-Pacific stock price multiples for peer media companies, the Company believed the increased risk required it to perform an interim impairment test as of August 31, 2019. The results of the step 1 test indicated that the carrying value of the net assets in the Asia-Pacific reporting unit exceeded its fair value. Given these results, the Company then applied the hypothetical purchase price analysis required by the step 2 test and recognized a pre-tax goodwill impairment charge of $155 million during the year ended December 31, 2019, which was not deductible for tax purposes. The determination of fair value of the Company's Asia-Pacific reporting unit represents a Level 3 fair value measurement in the fair value hierarchy due to its use of internal projections and unobservable measurement inputs.
As of October 1, 2019, the Company performed a quantitative goodwill impairment assessment for all reporting units consistent with the Company's accounting policy. The estimated fair value of each reporting unit exceeded its carrying value and, therefore, no impairment was recorded. The Europe reporting unit, which had headroom of 19%, was the only reporting unit with fair value in excess of carrying value of less than 20%. The fair values of the reporting units were determined using DCF and market-based valuation models. Cash flows were determined based on Company estimates of future operating results and discounted using an internal rate of return based on an assessment of the risk inherent in future cash flows of the respective reporting unit. The market-based valuation models utilized multiples of earnings before interest, taxes, depreciation and amortization. Both the DCF and market-based models resulted in substantially similar fair values.
2018 Impairment Analysis
As of November 30, 2018, the Company performed its annual qualitative goodwill impairment assessment for all reporting units and determined that it was more likely than not that the fair value of those reporting units exceeded their carrying values, except for its Asia-Pacific reporting unit. Based on the results of the qualitative assessment, the Company performed a quantitative step 1 impairment test (comparison of fair value to carrying value) for its Asia-Pacific reporting unit, which indicated that the estimated fair value exceeded its carrying value by approximately 10% and, therefore, no impairment was recorded.
DISCOVERY, INC.
NOTES TO CONSOLIDATED FINANCIAL STATEMENTS
NOTE 8. DEBT
The table below presents the components of outstanding debt (in millions).
| | | | | | | | | | | | | | |
| | December 31, |
| | 2020 | | 2019 |
2.800% Senior Notes, semi-annual interest, due June 2020 | | $ | — | | | $ | 600 | |
4.375% Senior Notes, semi-annual interest, due June 2021 | | 335 | | | 640 | |
2.375% Senior Notes, euro denominated, annual interest, due March 2022 | | 369 | | | 336 | |
3.300% Senior Notes, semi-annual interest, due May 2022 | | 168 | | | 496 | |
3.500% Senior Notes, semi-annual interest, due June 2022 | | 62 | | | 400 | |
2.950% Senior Notes, semi-annual interest, due March 2023 | | 796 | | | 1,167 | |
3.250% Senior Notes, semi-annual interest, due April 2023 | | 192 | | | 350 | |
3.800% Senior Notes, semi-annual interest, due March 2024 | | 450 | | | 450 | |
2.500% Senior Notes, sterling denominated, annual interest, due September 2024 | | 545 | | | 525 | |
3.900% Senior Notes, semi-annual interest, due November 2024 | | 497 | | | 497 | |
3.450% Senior Notes, semi-annual interest, due March 2025 | | 300 | | | 300 | |
3.950% Senior Notes, semi-annual interest, due June 2025 | | 500 | | | 500 | |
4.900% Senior Notes, semi-annual interest, due March 2026 | | 700 | | | 700 | |
1.900% Senior Notes, euro denominated, annual interest, due March 2027 | | 739 | | | 673 | |
3.950% Senior Notes, semi-annual interest, due March 2028 | | 1,700 | | | 1,700 | |
4.125% Senior Notes, semi-annual interest, due May 2029 | | 750 | | | 750 | |
3.625% Senior Notes, semi-annual interest, due May 2030 | | 1,000 | | | — | |
5.000% Senior Notes, semi-annual interest, due September 2037 | | 548 | | | 1,250 | |
6.350% Senior Notes, semi-annual interest, due June 2040 | | 664 | | | 850 | |
4.950% Senior Notes, semi-annual interest, due May 2042 | | 285 | | | 500 | |
4.875% Senior Notes, semi-annual interest, due April 2043 | | 516 | | | 850 | |
5.200% Senior Notes, semi-annual interest, due September 2047 | | 1,250 | | | 1,250 | |
5.300% Senior Notes, semi-annual interest, due May 2049 | | 750 | | | 750 | |
4.650% Senior Notes, semi-annual interest, due May 2050 | | 1,000 | | | — | |
4.000% Senior Notes, semi-annual interest, due September 2055 | | 1,732 | | | — | |
| | | | |
| Program financing line of credit, quarterly interest based on adjusted LIBOR or variable prime rate | | — | | | 10 | |
| | | | |
| Total debt | | 15,848 | | | 15,544 | |
Unamortized discount, premium and debt issuance costs, net (a) | | (444) | | | (125) | |
| Debt, net of unamortized discount, premium and debt issuance costs | | 15,404 | | | 15,419 | |
| Current portion of debt | | (335) | | | (609) | |
| Noncurrent portion of debt | | $ | 15,069 | | | $ | 14,810 | |
| | | | |
(a) Current portion of unamortized discount, premium, and debt issuance costs, net is less than $1 million. |
Senior Notes
On February 19, 2021, Discovery Communications, LLC (“DCL”), a wholly owned subsidiary of Discovery, Inc., issued a notice for the redemption in full of all $335 million aggregate principal amount outstanding of its 4.375% Notes due June 2021 (the “Notes”) in accordance with the terms of the indenture governing the Notes. The Notes will be redeemed on March 21, 2021 (the “Redemption Date”), at a redemption price with respect to each Note equal to the greater of (i) 100% of the principal amount of the Notes being redeemed and (ii) the sum of the present values of the remaining scheduled payments of principal and interest thereon (exclusive of interest accrued to the Redemption Date) discounted to the Redemption Date on a semi-annual basis at a comparable treasury rate plus 25 basis points, plus accrued interest thereon to the Redemption Date.
DISCOVERY, INC.
NOTES TO CONSOLIDATED FINANCIAL STATEMENTS
For the year ended December 31, 2020, Discovery, Inc. commenced five separate private offers to exchange (the “Exchange Offers”) any and all of Discovery Communications, LLC's ("DCL"), a wholly-owned subsidiary of the Company, outstanding 5.000% Senior Notes due 2037, 6.350% Senior Notes due 2040, 4.950% Senior Notes due 2042, 4.875% Senior Notes due 2043 and 5.200% Senior Notes due 2047 (collectively, the “Old Notes”) for one new series of DCL 4.000% Senior Notes due September 2055 (the “New Notes”). Discovery, Inc. completed the Exchange Offers in September 2020, by exchanging $1.4 billion aggregate principal amount of the Old Notes validly tendered and accepted by Discovery pursuant to the Exchange Offers, for $1.7 billion aggregate principal amount of the New Notes (before debt discount of $318 million). The New Notes are fully and unconditionally guaranteed by the Company and Scripps Networks on an unsecured and unsubordinated basis. The Exchange Offers were accounted for as a debt modification and, as a result, third-party issuance costs totaling $11 million were expensed as incurred.
Also, for the year ended December 31, 2020, the Company completed offers to purchase for cash (the “Cash Offers”) the Old Notes. Approximately $22 million aggregate principal amount of the Old Notes were validly tendered and accepted for purchase by Discovery pursuant to the Cash Offers, for total cash consideration of $27 million, plus accrued interest. The Cash Offers resulted in a loss on extinguishment of debt of $5 million.
Finally, for the year ended December 31, 2020, DCL issued $1.0 billion aggregate principal amount of senior notes due May 2030 and $1.0 billion aggregate principal amount of Senior Notes due May 2050. The proceeds received by DCL were net of a $1 million issuance discount and $20 million of debt issuance costs. DCL used the proceeds from the offering to repurchase $1.5 billion aggregate principal amount of DCL's and Scripps Networks' senior notes in a cash tender offer. The repurchase resulted in a loss on extinguishment of debt of $71 million. The loss included $62 million of net premiums to par value and $9 million of other charges. As further described below, the Company used the remaining proceeds and cash on hand to fully repay the $500 million that was outstanding under its revolving credit facility.
For the year ended December 31, 2019, DCL issued $750 million aggregate principal amount of Senior Notes due 2029 and $750 million due 2049. The proceeds received by DCL were net of a $6 million issuance discount and $12 million of debt issuance costs. DCL used the proceeds from the offering to redeem and repurchase approximately $1.3 billion aggregate principal amount of DCL's and Scripps Networks' senior notes. The redemptions and repurchase resulted in a loss on extinguishment of debt of $23 million for the year ended December 31, 2019. The loss included $20 million of net premiums to par value and $3 million of other non-cash charges.
Also, for the year ended December 31, 2019, the Company redeemed $411 million aggregate principal amount of senior notes due in 2019 and made open market bond repurchases of $55 million, resulting in a loss on extinguishment of debt of $5 million.
As of December 31, 2020, all senior notes are fully and unconditionally guaranteed by the Company and Scripps Networks, except for $32 million of un-exchanged Scripps Networks senior notes acquired in conjunction with the acquisition of Scripps Networks.
Revolving Credit Facility and Commercial Paper Programs
DCL and certain designated foreign subsidiaries of DCL have the capacity to borrow up to $2.5 billion revolving credit facility (the "Credit Facility"), including a $100 million sublimit for the issuance of standby letters of credit and a $50 million sublimit for Euro-denominated swing line loans. The Credit Facility matures in August 2022 with the option for up to two additional 364-day renewal periods and is subject to a maximum consolidated leverage ratio financial covenant of 5.50 to 1.00 at December 31, 2020. As further described below, during the year ended December 31, 2020, the Company entered into an amendment to the Credit Facility. As of December 31, 2020, DCL was in compliance with all covenants and there were no events of default under the Credit Facility.
Additionally, the Company's commercial paper program is supported by the Credit Facility. Under the commercial paper program, the Company may issue up to $1.5 billion, including up to $500 million of Euro-denominated borrowings. Borrowing capacity under the Credit Facility is reduced by any outstanding borrowings under the commercial paper program.
As of December 31, 2020 and 2019, the Company had no outstanding borrowings under the Credit Facility or the commercial paper program.
All obligations of DCL and the other borrowers under the Credit Facility are unsecured and are fully and unconditionally guaranteed by Discovery and Scripps.
DISCOVERY, INC.
NOTES TO CONSOLIDATED FINANCIAL STATEMENTS
Amendment to Revolving Credit Facility
To preserve flexibility in the current environment, in the second quarter of 2020, the Company amended certain provisions of its revolving credit facility, including the following:
The financial covenants were modified to reset the Maximum Consolidated Leverage Ratio as set forth below:
| | | | | |
| Measurement Period Ending | Maximum Consolidated Leverage Ratio |
| March 31, 2020 and June 30, 2020 | 5.00:1.00 |
| September 30, 2020 through March 31, 2021 | 5.50:1.00 |
| June 30, 2021 | 5.00:1.00 |
| September 30, 2021 and thereafter | 4.50:1.00 |
In addition, the restricted payments covenant was modified to add a limitation on restricted payments made in cash unless after giving pro forma effect thereto, the consolidated leverage ratio is less than or equal to 4.50:1.00. Finally, the minimum LIBOR rate and the minimum base rate were each increased from 0% to 0.50% per annum.
Long-term Debt Repayment Schedule
The following table presents a summary of scheduled and estimated debt payments, excluding the revolving credit facility and commercial paper borrowings, for the next five years based on the amount of the Company's debt outstanding as of December 31, 2020 (in millions).
| | | | | | | | | | | | | | | | | | | | | | | | | | | | | | | | | | | | | | |
| | 2021 | | 2022 | | 2023 | | 2024 | | 2025 | | Thereafter |
| Long-term debt repayments | | $ | 335 | | | $ | 599 | | | $ | 988 | | | $ | 1,493 | | | $ | 800 | | | $ | 11,633 | |
NOTE 9. LEASES
The Company has operating and finance leases for transponders, office space, studio facilities, and other equipment. The Company's leases have remaining lease terms of up to 16 years, some of which include options to extend the leases for up to 10 years. Most leases are not cancellable prior to their expiration.
The components of lease cost were as follows (in millions):
| | | | | | | | | | | | | | |
| | Year Ended December 31, |
| | 2020 | | 2019 |
| Operating lease cost | | $ | 116 | | | $ | 114 | |
| | | | |
| Finance lease cost: | | | | |
| Amortization of right-of-use assets | | $ | 52 | | | $ | 44 | |
| Interest on lease liabilities | | 8 | | | 9 | |
| Total finance lease cost | | $ | 60 | | | $ | 53 | |
| | | | |
| Variable lease cost | | $ | 9 | | | $ | 10 | |
DISCOVERY, INC.
NOTES TO CONSOLIDATED FINANCIAL STATEMENTS
Supplemental cash flow information related to leases was as follows (in millions):
| | | | | | | | | | | | | | |
| | Year Ended December 31, |
| | 2020 | | 2019 |
| Cash paid for amounts included in the measurement of lease liabilities: | | | | |
| Operating cash flows from operating leases | | $ | (101) | | | $ | (98) | |
| Operating cash flows from finance leases | | $ | (8) | | | $ | (9) | |
| Financing cash flows from finance leases | | $ | (54) | | | $ | (44) | |
| | | | |
| Right-of-use assets obtained in exchange for lease obligations: | | | | |
| Operating leases | | $ | 51 | | | $ | 369 | |
| Finance leases | | $ | 36 | | | $ | 38 | |
Supplemental balance sheet information related to leases was as follows (in millions):
| | | | | | | | | | | | | | | | | |
| | | December 31, |
| | | 2020 | | 2019 |
| Operating Leases | Location on Balance Sheet | | | | |
| Operating lease right-of-use assets | Other noncurrent assets | | $ | 575 | | | $ | 613 | |
| | | | | |
| Operating lease liabilities (current) | Accrued liabilities | | $ | 71 | | | $ | 82 | |
| Operating lease liabilities (noncurrent) | Other noncurrent liabilities | | 592 | | | 621 | |
| Total operating lease liabilities | | | $ | 663 | | | $ | 703 | |
| | | | | |
| Finance Leases | | | | | |
| Finance lease right-of-use assets | Property and equipment, net | | $ | 220 | | | $ | 231 | |
| | | | | |
| Finance lease liabilities (current) | Accrued liabilities | | $ | 57 | | | $ | 47 | |
| Finance lease liabilities (noncurrent) | Other noncurrent liabilities | | 184 | | | 203 | |
| Total finance lease liabilities | | | $ | 241 | | | $ | 250 | |
| | | | | | | | | | | | | | |
| | December 31, |
| | 2020 | | 2019 |
| Weighted average remaining lease term (in years): | | | | |
| Operating leases | | 12 | | 13 |
| Finance leases | | 5 | | 6 |
| | | | |
| Weighted average discount rate | | | | |
| Operating leases | | 3.37 | % | | 3.77 | % |
| Finance leases | | 3.80 | % | | 3.56 | % |
DISCOVERY, INC.
NOTES TO CONSOLIDATED FINANCIAL STATEMENTS
Maturities of lease liabilities as of December 31, 2020 were as follows (in millions):
| | | | | | | | | | | | | | |
| | Operating Leases | | Finance Leases |
| 2021 | | $ | 91 | | | $ | 64 | |
| 2022 | | 76 | | | 55 | |
| 2023 | | 69 | | | 48 | |
| 2024 | | 63 | | | 31 | |
| 2025 | | 58 | | | 23 | |
| Thereafter | | 502 | | | 42 | |
| Total lease payments | | 859 | | | 263 | |
| Less: Imputed interest | | (196) | | | (22) | |
| Total | | $ | 663 | | | $ | 241 | |
During the year ended December 31, 2019, the Company recorded approximately $370 million of operating lease liabilities associated with its new global headquarters in New York City. As of December 31, 2020, the Company has additional leases that have not yet commenced with total minimum lease payments of approximately $6 million, primarily related to equipment leases. The remaining leases will commence in fiscal year 2021, have lease terms of 4 to 16 years, and include options to extend the terms for up to 10 additional years.
Supplemental Information for Comparative Periods
Rent expense under operating leases was $205 million for the year ended December 31, 2018.
NOTE 10. DERIVATIVE FINANCIAL INSTRUMENTS
The Company uses derivative financial instruments to modify its exposure to market risks from changes in foreign currency exchange rates and interest rates. In addition to the Company's normal course of business cash flow hedging program, the Company entered into the following arrangements:
Cash Flow Hedges
During the year ended December 31, 2020, the Company unwound certain foreign exchange forward contracts designated as cash flow hedges with an aggregate notional amount of $255 million. The Company received cash of $19 million in settlement and expects to realize the unrealized gain in accumulated other comprehensive loss between 2025 and 2030.
Also, during the year ended December 31, 2020, the Company executed forward starting interest rate swap contracts designated as cash flow hedges with a total notional value of $1.6 billion. These contracts will mitigate interest rate risk associated with the forecasted issuance of future fixed-rate public debt. The Company also issued and settled interest rate cash flow hedges with a total notional value of $1 billion following the pricing of its offering of 3.625% Senior Notes due May 2030 and 4.650% Senior Notes due May 2050. (See Note 8.) The $7 million pretax accumulated other comprehensive loss at the termination date will be amortized as an adjustment to interest expense over the respective terms of the newly issued notes.
During the year ended December 31, 2019, the Company executed foreign exchange forward contracts with an aggregate notional amount of $798 million. The forwards were designated as cash flow hedges and will mitigate exposure to foreign exchange rate volatility and the associated impact on earnings related to a portion of forecasted foreign currency revenues from PGA Golf from 2023 through 2030.
Also, during the year ended December 31, 2019, terminated and settled its interest rate cash flow hedges with a total notional value of $500 million following the pricing of its offering of 4.125% senior notes due May 2029. (See Note 8.) The $18 million pretax accumulated other comprehensive loss at the termination date will be amortized as an adjustment to interest expense over the ten-year term of the newly issued notes.
Finally, during the year ended December 31, 2019, the Company executed a forward starting interest rate swap contract designated as a cash flow hedge with a total notional value of $400 million. This contract will mitigate interest rate risk associated with the forecasted issuance of future fixed rate public debt.
DISCOVERY, INC.
NOTES TO CONSOLIDATED FINANCIAL STATEMENTS
Net Investment Hedges
During the year ended December 31, 2019, the Company entered into two fixed-to-fixed cross-currency swaps with an aggregate notional amount of $201 million. The swaps were designated as net investment hedges of NOK assets and GBP assets. The maturity date of both swaps is February 2024. The objective of these swaps is to protect the company against the risk of changes in the foreign currency-equivalent of net investments in the foreign operations due to movements in foreign currency. Contemporaneously, the Company unwound an existing $100 million notional fixed-to-fixed cross currency swap that was designated as a net investment hedge of NOK assets and recorded a gain of $5 million as a cumulative translation adjustment under other comprehensive income (loss).
During the year ended December 31, 2018, the Company entered into a foreign currency forward contract with a notional value of 35.6 billion Chilean Pesos (equivalent to $53 million) at execution date and with a due date of December 15, 2021. This was designated a net investment hedge, hedging against changes in the foreign currency-equivalent of the net investment in the foreign operation due to movements in exchange rates.
Also, during the year ended December 31, 2018, the Company entered into six fixed-to-fixed cross-currency swaps with an aggregate notional amount of $1.7 billion. The swaps were all designated as net investment hedges of Euro assets and GBP assets. The maturity dates of the swaps are 2022 and 2027. The objective of these swaps is to protect the company against the risk of changes in the foreign currency-equivalent of net investments in the foreign operations due to movements in foreign currency.
No Hedging Designation
During the year ended December 31, 2018, the Company entered into three foreign exchange forwards contracts with a notional value of $860 million. The objective of these contracts is to protect the Company against adverse revaluation impact on its Euro denominated debt.
The following table summarizes the impact of derivative financial instruments on the Company's consolidated balance sheets (in millions). There were no amounts eligible to be offset under master netting agreements as of December 31, 2020 and 2019. The fair value of the Company's derivative financial instruments at December 31, 2020 and 2019 was determined using a market-based approach (Level 2).
| | | | | | | | | | | | | | | | | | | | | | | | | | | | | | | | | | | | | | | | | | | | | | | | | | | | | | | | | | | |
| December 31, 2020 | | December 31, 2019 |
| | | Fair Value | | | | Fair Value |
| Notional | | Prepaid expenses and other current assets | | Other non-
current assets | | Accrued liabilities | | Other non-
current liabilities | | Notional | | Prepaid expenses and other current assets | | Other non-
current assets | | Accrued liabilities | | Other non-
current liabilities |
| Cash flow hedges: | | | | | | | | | | | | | | | | | | | |
Foreign exchange | $ | 1,082 | | | $ | 2 | | | $ | 5 | | | $ | 14 | | | $ | 17 | | | $ | 1,631 | | | $ | 29 | | | $ | 7 | | | $ | 5 | | | $ | 16 | |
Interest rate swaps | 2,000 | | | — | | | 11 | | | — | | | 89 | | | 400 | | | — | | | 38 | | | — | | | — | |
Net investment hedges: (a) | | | | | | | | | | | | | | | | | | | |
Cross-currency swaps | 3,544 | | | 34 | | | 41 | | | — | | | 154 | | | 3,535 | | | 37 | | | 70 | | | 7 | | | 94 | |
| Foreign exchange | 44 | | | 2 | | | — | | | — | | | — | | | 52 | | | — | | | 4 | | | — | | | — | |
| | | | | | | | | | | | | | | | | | | |
| | | | | | | | | | | | | | | | | | | |
| No hedging designation: | | | | | | | | | | | | | | | | | | |
| Foreign exchange | 1,035 | | | — | | | — | | | 2 | | | 26 | | | 1,177 | | | — | | | — | | | 13 | | | 50 | |
| | | | | | | | | | | | | | | | | | | |
Cross-currency swaps | 139 | | | 2 | | | — | | | — | | | 13 | | | 279 | | | 3 | | | — | | | — | | | 5 | |
Equity (Lionsgate collar) | — | | | — | | | — | | | — | | | — | | | 65 | | | 19 | | | 18 | | | — | | | — | |
| | | | | | | | | | | | | | | | | | | |
Total | | | $ | 40 | | | $ | 57 | | | $ | 16 | | | $ | 299 | | | | | $ | 88 | | | $ | 137 | | | $ | 25 | | | $ | 165 | |
(a) Excludes £400 million of sterling notes ($545 million equivalent at December 31, 2020) designated as a net investment hedge. (See Note 8.)
DISCOVERY, INC.
NOTES TO CONSOLIDATED FINANCIAL STATEMENTS
The following table presents the pretax impact of derivatives designated as cash flow hedges on income and other comprehensive income (loss) (in millions).
| | | | | | | | | | | | | | | | | | | | |
| | Year Ended December 31, |
| | 2020 | | 2019 | | 2018 |
| Gains (losses) recognized in accumulated other comprehensive loss: | | | | | | |
| Foreign exchange - derivative adjustments | | $ | 14 | | | $ | 17 | | | $ | 34 | |
| Interest rate - derivative adjustments | | (124) | | | 21 | | | — | |
Gains (losses) reclassified into income from accumulated other comprehensive loss: | | | | | | |
| Foreign exchange - advertising revenue | | 1 | | | 6 | | | (1) | |
| Foreign exchange - distribution revenue | | 30 | | | 5 | | | 9 | |
| Foreign exchange - costs of revenues | | 2 | | | 2 | | | 11 | |
| | | | | | |
| | | | | | |
| Interest rate - interest expense | | 1 | | | (2) | | | — | |
Foreign exchange - other expense, net (dedesignated portion) | | — | | | 3 | | | — | |
| | | | | | |
| | | | | | |
| | | | | | |
| | | | | | |
If current fair values of designated cash flow hedges as of December 31, 2020 remained static over the next twelve months, the Company would reclassify $14 million of net deferred losses from accumulated other comprehensive loss into income in the next twelve months. The maximum length of time the Company is hedging exposure to the variability in future cash flows is 35 years.
The following table presents the pretax impact of derivatives designated as net investment hedges on other comprehensive income (loss) (in millions). Other than amounts excluded from effectiveness testing, there were no other gains (losses) reclassified from accumulated other comprehensive loss to income during the years ended December 31, 2020, 2019 and 2018.
| | | | | | | | | | | | | | | | | | | | | | | | | | | | | | | | | | | | | | | | | | | | | | | | | | |
| | Year Ended December 31, | | |
| | Amount of gain (loss) recognized in AOCI | | | | | | Location of gain (loss) recognized in income on derivative (amount excluded from effectiveness testing) | | Amount of gain (loss) recognized in income on derivative (amount excluded from effectiveness testing) |
| | 2020 | | 2019 | | 2018 | | | | | | | | 2020 | | 2019 | | 2018 |
| Cross currency swaps | | $ | (61) | | | $ | 93 | | | $ | 43 | | | | | | | | | Interest expense, net | | $ | 43 | | | $ | 44 | | | $ | 14 | |
| Foreign exchange contracts | | (2) | | | 4 | | | — | | | | | | | | | Other income (expense), net | | — | | | — | | | — | |
| Sterling notes (foreign denominated debt) | | (20) | | | (17) | | | 30 | | | | | | | | | N/A | | — | | | — | | | — | |
| Total | | $ | (83) | | | $ | 80 | | | $ | 73 | | | | | | | | | | | $ | 43 | | | $ | 44 | | | $ | 14 | |
The following table presents the pretax gains (losses) on derivatives not designated as hedges and recognized in other income (expense), net in the consolidated statements of operations (in millions).
| | | | | | | | | | | | | | | | | | | | |
| | Year Ended December 31, |
| | | 2020 | | 2019 | | 2018 |
| Interest rate swaps | | $ | — | | | $ | 1 | | | $ | — | |
| Cross-currency swaps | | (10) | | | — | | | 4 | |
| Foreign exchange derivatives | | 32 | | | (65) | | | 18 | |
| Credit contracts | | — | | | — | | | (1) | |
| Equity | | 7 | | | 13 | | | 29 | |
| Total in other income (expense), net | | $ | 29 | | | $ | (51) | | | $ | 50 | |
| | | | | | |
| | | | | | |
DISCOVERY, INC.
NOTES TO CONSOLIDATED FINANCIAL STATEMENTS
NOTE 11. REDEEMABLE NONCONTROLLING INTERESTS
Redeemable noncontrolling interests are presented outside of permanent equity on the Company's consolidated balance sheet when the put right is outside of the Company's control. Redeemable noncontrolling interests reflected as of the balance sheet date are the greater of the noncontrolling interest balances adjusted for comprehensive income items and distributions or the redemption values remeasured at the period end foreign exchange rates. Adjustments to the carrying amount of redeemable noncontrolling interests to redemption value as a result of changes in exchange rates are reflected in currency translation adjustments, a component of other comprehensive income (loss); however, such currency translation adjustments to redemption value are allocated to Discovery stockholders only. Redeemable noncontrolling interest adjustments of carrying value to redemption value are reflected in retained earnings. The adjustment of carrying value to the redemption value that reflects a redemption in excess of fair value is included as an adjustment to income from continuing operations available to Discovery, Inc. stockholders in the calculation of earnings per share. (See Note 19.) The table below summarizes the Company's redeemable noncontrolling interests balances (in millions).
| | | | | | | | | | | | | | |
| | December 31, |
| | 2020 | | 2019 |
| Discovery Family | | $ | 206 | | | $ | 206 | |
MotorTrend Group LLC ("MTG") | | 112 | | | 118 | |
| Oprah Winfrey Network ("OWN") | | 10 | | | 64 | |
| Other | | 55 | | | 54 | |
| Total | | $ | 383 | | | $ | 442 | |
The table below presents the reconciliation of changes in redeemable noncontrolling interests (in millions).
| | | | | | | | | | | | | | | | | | | | |
| | December 31, |
| | 2020 | | 2019 | | 2018 |
| Beginning balance | | $ | 442 | | | $ | 415 | | | $ | 413 | |
Initial fair value of redeemable noncontrolling interests of acquired businesses | | — | | | 25 | | | — | |
| | | | | | |
| Cash distributions to redeemable noncontrolling interests | | (31) | | | (39) | | | (25) | |
| Equity exchange with Harpo for step acquisition of OWN | | (50) | | | — | | | — | |
| Comprehensive income adjustments: | | | | | | |
Net income attributable to redeemable noncontrolling interests | | 12 | | | 16 | | | 20 | |
| | | | | | |
| Currency translation on redemption values | | 3 | | | 1 | | | 2 | |
| Retained earnings adjustments: | | | | | | |
| Adjustments of carrying value to redemption value (redemption value does not equal fair value) | | — | | | 14 | | | 3 | |
| Adjustments of carrying value to redemption value (redemption value equals fair value) | | 7 | | | 4 | | | — | |
| OWN interest adjustment | | — | | | 6 | | | 2 | |
| Ending balance | | $ | 383 | | | $ | 442 | | | $ | 415 | |
The significant arrangements for redeemable noncontrolling interests are described below:
Discovery Family
Hasbro Inc. ("Hasbro") has the right to put the entirety of its remaining 40% interest in Discovery Family to Discovery at any time during the one-year period beginning December 31, 2021, or in the event a Discovery performance obligation related to Discovery Family is not met. Embedded in the redeemable noncontrolling interest is also a Discovery call right that is exercisable for one year after December 31, 2021. Upon the exercise of the put or call options, the price to be paid for the redeemable noncontrolling interest is a function of the then-current fair market value of the redeemable noncontrolling interest, to which certain discounts and redemption values may apply in specified situations depending upon the party exercising the put or call and the basis for the exercise of the put or call.
DISCOVERY, INC.
NOTES TO CONSOLIDATED FINANCIAL STATEMENTS
MTG
Discovery and GoldenTree created the MTG joint venture in 2017. GoldenTree acquired a put right exercisable during 30-day windows beginning on each of March 25, 2021, September 25, 2022 and March 25, 2024, that requires Discovery to either purchase all of GoldenTree's noncontrolling 32.5% interest in the joint venture at fair value or participate in an initial public offering for the joint venture.
OWN
Harpo has the right to require the Company to purchase Harpo's remaining noncontrolling interest in OWN at fair value during four 90-day windows beginning on July 1, 2018 and every two and a half years thereafter through January 1, 2026. Harpo exercised the first of such remaining put rights in August 2018. In November 2018, the Company and Harpo entered into an amendment to the limited liability company ("LLC") agreement whereby Harpo agreed to withdraw its August 2018 put notice and upon any succeeding redemption, the put payment value will equal the fair value of Harpo's equity interest in OWN plus an incremental 9.337% per annum for the 2.5 year period between the July 1, 2018 put right date and the January 1, 2021 put right date. In December 2020, the Company and Harpo completed an equity exchange and amended the LLC agreement whereby the Company acquired an additional 20.2% ownership interest in OWN from Harpo in exchange for $35 million of the Company's Series A common stock, which was issued from treasury stock. As a result of the exchange, the Company's ownership in OWN increased to approximately 94%. Harpo's remaining put rights are currently exercisable on July 1, 2023 and January 1, 2026.
NOTE 12. EQUITY
Common Stock
The Company has three series of common stock authorized, issued and outstanding as of December 31, 2020: Series A common stock, Series B common stock and Series C common stock. Holders of these three series of common stock have equal rights, powers and privileges, except as otherwise noted. Holders of Series A common stock are entitled to one vote per share and holders of Series B common stock are entitled to ten votes per share on all matters voted on by stockholders, except for directors to be elected by holders of the Company’s Series A-1 convertible preferred stock. Holders of Series C common stock are not entitled to any voting rights, except as required by Delaware law. Generally, holders of Series A common stock and Series B common stock and Series A-1 convertible preferred stock vote as one class, except for certain preferential rights afforded to holders of Series A-1 convertible preferred stock.
Holders of Series A common stock, Series B common stock and Series C common stock will participate equally in cash dividends if declared by the Board of Directors, subject to preferential rights of outstanding preferred stock.
Each share of Series B common stock is convertible, at the option of the holder, into one share of Series A common stock. Series A and Series C common stock are not convertible.
Generally, distributions made in shares of Series A common stock, Series B common stock or Series C common stock will be made proportionally to all common stockholders. In the event of a reclassification, subdivision or combination of any series of common stock, the shares of the other series of common stock will be equally reclassified, subdivided or combined.
In the event of a liquidation, dissolution, or winding up of Discovery, after payment of Discovery’s debts and liabilities and subject to preferential rights of outstanding preferred stock, holders of Series A common stock, Series B common stock and Series C common stock and holders of Series A-1 and Series C-1 convertible preferred stock will share equally in any assets available for distribution to holders of common stock.
Convertible Preferred Stock
The Company has two series of preferred stock authorized, issued and outstanding as of December 31, 2020: Series A-1 convertible preferred stock and Series C-1 convertible preferred stock. Series A-1 convertible preferred stock is convertible into nine shares of the Company's Series A common stock and Series C-1 convertible preferred stock is convertible into 19.3648 shares of the Company's Series C common stock, subject to certain anti-dilution adjustments. Shares of Series A-1 and Series C-1 convertible preferred stock may be independently converted into Series A common stock and Series C common, respectively.
DISCOVERY, INC.
NOTES TO CONSOLIDATED FINANCIAL STATEMENTS
As of December 31, 2020, all outstanding shares of Series A-1 and Series C-1 convertible preferred stock were held by Advance/Newhouse. Holders of Series A-1 and Series C-1 convertible preferred stock have equal rights, powers and privileges, except as otherwise noted. Except for the election of common stock directors, the holders of Series A-1 convertible preferred stock are entitled to vote on matters to which holders of Series A and Series B common stock are entitled to vote, and holders of Series C-1 convertible preferred stock are entitled to vote on matters to which holders of Series C common stock, which is generally non-voting, are entitled to vote pursuant to Delaware law. Series A-1 convertible preferred stockholders vote on an as converted to common stock basis together with the Series A and Series B common stockholders as a single class on all matters except the election of directors. Series C-1 convertible preferred stock is considered the economic equivalent of Series C common stock and is subject to certain transfer restrictions.
Additionally, through its ownership of the Series A-1 convertible preferred stock, Advance/Newhouse has special voting rights on certain matters and the right to elect three directors. Holders of the Company’s common stock are not entitled to vote in the election of such directors. Advance/Newhouse retains these rights so long as it or its permitted transferees own or have the right to vote such shares that equal at least 80% of the shares of Series A convertible preferred stock issued to Advance/Newhouse in connection with the formation of Discovery, as converted to Series A-1 convertible preferred stock, plus any Series A-1 convertible preferred stock released from escrow, as may be adjusted for certain capital transactions. Holders of Series A-1 convertible preferred stock are subject to a right of first offer in favor of Discovery should Advance/Newhouse desire to sell 80% or more of the Series A-1 convertible preferred stock in a “Permitted Transfer” (as defined in the Discovery charter).
Subject to the prior preferences and other rights of any senior stock, holders of Series A-1 and Series C-1 convertible preferred stock will participate equally with common stockholders on an as converted to common stock basis in any cash dividends declared by the Board of Directors.
In the event of a liquidation, dissolution or winding up of Discovery, after payment of Discovery’s debts and liabilities and subject to the prior payment with respect to any stock ranking senior to Series A-1 and Series C-1 convertible preferred stock, the holders of Series A-1 and Series C-1 convertible preferred stock will receive, before any payment or distribution is made to the holders of any common stock or other junior stock, an amount (in cash or property) equal to $0.01 per share. Following payment of such amount and the payment in full of all amounts owing to the holders of securities ranking senior to Discovery’s common stock, holders of Series A-1 and Series C-1 convertible preferred stock will share equally on an as converted to common stock basis with the holders of common stock with respect to any assets remaining for distribution to such holders.
No Series A-1 or C-1 convertible preferred stock was converted during the years ended December 31, 2020 and 2018. During the year ended December 31, 2019, Advance Newhouse Programming Partnership converted 1.1 million of its Series C-1 convertible preferred stock into 22.0 million shares of Series C common stock.
Common Stock Issued in Connection with Scripps Networks Acquisition
In March 2018, the Company issued 139 million shares of Series C common stock as part of the consideration paid for the acquisition of Scripps Networks, inclusive of the conversion of 1 million Scripps Networks share-based compensation awards. (See Note 3.)
Repurchase Programs
Common Stock
The Company has a stock repurchase program that was implemented in 2010. Under the program, management was authorized to purchase shares of the Company's common stock from time to time through open market purchases, privately negotiated transactions at prevailing prices, pursuant to one or more accelerated stock repurchase agreements, or other derivative arrangements as permitted by securities laws and other legal requirements, and subject to stock price, business and market conditions and other factors. The Company's authorization under this program expired in October 2017.
In February 2020, the Company's Board of Directors authorized additional stock repurchases of up to $2 billion upon completion of its existing $1 billion repurchase authorization announced in May 2019. All common stock repurchases, including prepaid common stock repurchase contracts, have been made through open market transactions and have been recorded as treasury stock on the consolidated balance sheets. Over the life of the Company's repurchase programs and as of December 31, 2020, the Company had repurchased 3 million and 229 million shares of Series A and Series C common stock, respectively, for the aggregate purchase price of $171 million and $8.2 billion, respectively. The table below presents a summary of common stock repurchases (in millions).
DISCOVERY, INC.
NOTES TO CONSOLIDATED FINANCIAL STATEMENTS
| | | | | | | | | | | | | | | | | | | | |
| | Year Ended December 31, |
| | 2020 | | 2019 | | 2018 |
| Series C Common Stock: | | | | | | |
| Shares repurchased | | 41.6 | | | 23.2 | | | — | |
| Purchase price | | $ | 965 | | | $ | 637 | | | $ | — | |
In May 2019, the Company made an upfront cash payment of $96 million to enter into two prepaid common stock repurchase contracts for the Company’s Series C common stock. Both contracts settled in cash for $50 million each during June 2019 and August 2019, as the price of Discovery’s Series C common stock was above the strike price at expiration for each contract. The contracts were accounted for as equity transactions.
Convertible Preferred Stock
There were no convertible preferred stock repurchases during 2020, 2019 or 2018. As of December 31, 2020, the Company had repurchased 0.2 million shares of Series C-1 convertible preferred stock for $102 million.
Other Comprehensive Income (Loss)
The table below presents the tax effects related to each component of other comprehensive (loss) income and reclassifications made into the consolidated statements of operations (in millions).
| | | | | | | | | | | | | | | | | | | | | | | | | | | | | | | | | | | | | | | | | | | | | | | | | | | | | |
| Year Ended December 31, 2020 | | Year Ended December 31, 2019 | | Year Ended December 31, 2018 |
|
Pretax | | Tax Benefit (Expense) | |
Net-of-tax | |
Pretax | | Tax Benefit (Expense) | |
Net-of-tax | |
Pretax | | Tax Benefit (Expense) | |
Net-of-tax |
Currency translation adjustments: | | | | | | | | | | | | | | | | | |
| Unrealized gains (losses): | | | | | | | | | | | | | | | | | |
| Foreign currency | $ | 357 | | | $ | 33 | | | $ | 390 | | | $ | (95) | | | $ | 14 | | | $ | (81) | | | $ | (246) | | | $ | (6) | | | $ | (252) | |
| Net investment hedges | (109) | | | 11 | | | (98) | | | 56 | | | 4 | | | 60 | | | 59 | | | — | | | 59 | |
Reclassifications: | | | | | | | | | | | | | | | | | |
Gain on disposition | — | | | — | | | — | | | 6 | | | — | | | 6 | | | 4 | | | — | | | 4 | |
| | | | | | | | | | | | | | | | | |
Total currency translation adjustments | 248 | | | 44 | | | 292 | | | (33) | | | 18 | | | (15) | | | (183) | | | (6) | | | (189) | |
Derivative adjustments: | | | | | | | | | | | | | | | | | |
Unrealized gains (losses) | (110) | | | 24 | | | (86) | | | 38 | | | (9) | | | 29 | | | 34 | | | (8) | | | 26 | |
| Reclassifications from other comprehensive income to net income | (34) | | | 7 | | | (27) | | | (14) | | | 3 | | | (11) | | | (19) | | | 5 | | | (14) | |
| | | | | | | | | | | | | | | | | |
| | | | | | | | | | | | | | | | | |
| | | | | | | | | | | | | | | | | |
| | | | | | | | | | | | | | | | | |
| | | | | | | | | | | | | | | | | |
| | | | | | | | | | | | | | | | | |
Total derivative adjustments | (144) | | | 31 | | | (113) | | | 24 | | | (6) | | | 18 | | | 15 | | | (3) | | | 12 | |
Pension plan and SERP liability: | | | | | | | | | | | | | | | | | |
| | | | | | | | | | | | | | | | | |
| Unrealized gains (losses) | (10) | | | 2 | | | (8) | | | (13) | | | 3 | | | (10) | | | 3 | | | — | | | 3 | |
| Other comprehensive income (loss) adjustments | $ | 94 | | | $ | 77 | | | $ | 171 | | | $ | (22) | | | $ | 15 | | | $ | (7) | | | $ | (165) | | | $ | (9) | | | $ | (174) | |
DISCOVERY, INC.
NOTES TO CONSOLIDATED FINANCIAL STATEMENTS
Accumulated Other Comprehensive Loss
The table below presents the changes in the components of accumulated other comprehensive loss, net of taxes (in millions).
| | | | | | | | | | | | | | | | | | | | | | | | | | | | | | | | |
| | Currency Translation | | AFS (a) | | Derivative Adjustments | | Pension Plan and SERP Liability | | Accumulated
Other
Comprehensive Income (Loss) |
| December 31, 2017 | | $ | (615) | | | $ | 26 | | | $ | 4 | | | $ | — | | | $ | (585) | |
Other comprehensive income (loss) before reclassifications | | (193) | | | — | | | 26 | | | 3 | | | (164) | |
Reclassifications from accumulated other comprehensive loss to net income | | 4 | | | — | | | (14) | | | — | | | (10) | |
| Other comprehensive income (loss) | | (189) | | | — | | | 12 | | | 3 | | | (174) | |
| Reclassifications to retained earnings resulting from the adoption of ASU 2016-01 | | — | | | (26) | | | — | | | — | | | (26) | |
| December 31, 2018 | | (804) | | | — | | | 16 | | | 3 | | | (785) | |
| Other comprehensive income (loss) before reclassifications | | (20) | | | — | | | 29 | | | (10) | | | (1) | |
Reclassifications from accumulated other comprehensive loss to net income | | 6 | | | — | | | (11) | | | — | | | (5) | |
| Other comprehensive income (loss) | | (14) | | | — | | | 18 | | | (10) | | | (6) | |
| Other comprehensive loss attributable to redeemable noncontrolling interests | | (1) | | | — | | | — | | | — | | | (1) | |
| Reclassifications to retained earnings resulting from the adoption of ASU 2018-02 | | (28) | | | — | | | (2) | | | — | | | (30) | |
| December 31, 2019 | | (847) | | | — | | | 32 | | | (7) | | | (822) | |
| Other comprehensive income (loss) before reclassifications | | 292 | | | — | | | (86) | | | (8) | | | 198 | |
Reclassifications from accumulated other comprehensive loss to net income | | — | | | — | | | (27) | | | — | | | (27) | |
| Other comprehensive income (loss) | | 292 | | | — | | | (113) | | | (8) | | | 171 | |
| | | | | | | | | | |
| | | | | | | | | | |
| | | | | | | | | | |
| December 31, 2020 | | $ | (555) | | | $ | — | | | $ | (81) | | | $ | (15) | | | $ | (651) | |
(a) Effective January 1, 2018, unrealized gains and losses on equity investments with readily determinable fair values are recorded in other income (expense), net. (See Note 4.)
NOTE 13. NONCONTROLLING INTEREST
The Company has a controlling interest in the TV Food Network Partnership (the "Partnership"), which includes the Food Network and Cooking Channel. Food Network and Cooking Channel are operated and organized under the terms of the Partnership. The Company holds 80% of the voting interest and 68.7% of the economic interest in the Partnership. During the fourth quarter of 2020, the Partnership agreement was extended and specifies a dissolution date of December 31, 2022. If the term of the Partnership is not extended prior to the dissolution date of December 31, 2022, the Partnership agreement permits the Company, as holder of 80% of the applicable votes, to reconstitute the Partnership and continue its business. If for some reason the Partnership is not continued, it will be required to limit its activities to winding up, settling debts, liquidating assets and distributing proceeds to the partners in proportion to their partnership interests. Ownership interests attributable to the noncontrolling owner are presented as noncontrolling interests on the Company's consolidated financial statements. Under the terms of the Partnership agreement, the noncontrolling owner cannot force a redemption outside of the Company's control. As such, the noncontrolling interests in the Partnership are reflected as a component of permanent equity in the Company's consolidated financial statements.
DISCOVERY, INC.
NOTES TO CONSOLIDATED FINANCIAL STATEMENTS
NOTE 14. REVENUES AND ACCOUNTS RECEIVABLE
Disaggregated Revenue
The following table presents the Company’s revenues disaggregated by revenue source (in millions). Management uses these categories of revenue to evaluate the performance of its businesses and to assess its financial results and forecasts.
| | | | | | | | | | | | | | | | | | | | | | | |
| | | | | | | |
| Year Ended December 31, 2020 |
| U.S. Networks | | International Networks | | Corporate, inter-segment eliminations, and other | | Total |
| Revenues: | | | | | | | |
| Advertising | $ | 4,012 | | | $ | 1,571 | | | $ | — | | | $ | 5,583 | |
| Distribution | 2,852 | | | 2,014 | | | — | | | 4,866 | |
| Other | 85 | | | 128 | | | 9 | | | 222 | |
| Totals | $ | 6,949 | | | $ | 3,713 | | | $ | 9 | | | $ | 10,671 | |
| | | | | | | |
| Year Ended December 31, 2019 |
| U.S. Networks | | International Networks | | Corporate, inter-segment eliminations, and other | | Total |
| Revenues: | | | | | | | |
| Advertising | $ | 4,245 | | | $ | 1,799 | | | $ | — | | | $ | 6,044 | |
| Distribution | 2,739 | | | 2,096 | | | — | | | 4,835 | |
| Other | 108 | | | 146 | | | 11 | | | 265 | |
| Totals | $ | 7,092 | | | $ | 4,041 | | | $ | 11 | | | $ | 11,144 | |
| | | | | | | |
| Year Ended December 31, 2018 |
| U.S. Networks | | International Networks | | Corporate, inter-segment eliminations, and other | | Total |
| Revenues: | | | | | | | |
| Advertising | $ | 3,749 | | | $ | 1,765 | | | $ | — | | | $ | 5,514 | |
| Distribution | 2,456 | | | 2,082 | | | — | | | 4,538 | |
| Other | 145 | | | 302 | | | 54 | | | 501 | |
| Totals | $ | 6,350 | | | $ | 4,149 | | | $ | 54 | | | $ | 10,553 | |
Accounts Receivable and Credit Losses
Receivables include amounts currently due from customers and are presented net of an estimate for lifetime expected credit losses. Allowance for credit losses is measured using historical loss rates for the respective risk categories and incorporating forward-looking estimates. To assess collectability, the Company analyzes market trends, economic conditions, the aging of receivables and customer specific risks, and records a provision for estimated credit losses expected over the lifetime of receivables. The corresponding expense for the expected credit losses is reflected in selling, general and administrative expenses. The Company does not require collateral with respect to trade receivables.
The Company’s accounts receivable balances and the related credit losses arise primarily from distribution and advertising revenue. The Company monitors ongoing credit exposure through active review of customers’ financial conditions, aging of receivable balances, historical collection trends, and expectations about relevant future events that may significantly affect collectability.
DISCOVERY, INC.
NOTES TO CONSOLIDATED FINANCIAL STATEMENTS
Changes in allowance for credit losses consisted of the following (in millions):
| | | | | | | | | | | | | | | | | | | | | | | | | | | | | | | | | | |
| | December 31, 2019 | | Impact of adoption of ASU 2016-13 | | Provisions for credit losses | | Write-offs | | | | December 31, 2020 |
| Distribution customers | | $ | 19 | | | $ | 1 | | | $ | 9 | | | $ | (11) | | | | | $ | 18 | |
| Advertising and other customers | | 35 | | | (3) | | | 21 | | | (12) | | | | | 41 | |
| Total | | $ | 54 | | | $ | (2) | | | $ | 30 | | | $ | (23) | | | | | $ | 59 | |
Contract Liability
A contract liability, such as deferred revenue, is recorded when cash is received in advance of the Company's performance. Total deferred revenues, including both current and noncurrent, were $649 million and $597 million at December 31, 2020 and December 31, 2019, respectively. Noncurrent deferred revenue is a component of other noncurrent liabilities on the consolidated balance sheets. The change in deferred revenue for the year ended December 31, 2020 reflects cash payments received for which the performance obligation was not satisfied prior to the end of the period, partially offset by $309 million of revenues recognized that were included in deferred revenue at December 31, 2019, which was primarily due to an increase in the delivery of advertising commitments during the period. Revenue recognized for the year ended December 31, 2019 related to the deferred revenue balance at December 31, 2018 was $177 million.
Transaction Price Allocated to Remaining Performance Obligations
Most of the Company's distribution contracts are licenses of functional intellectual property where revenue is derived from royalty-based arrangements, for which the guidance allows the application of a practical expedient to record revenues as a function of royalties earned to date instead of estimating incremental royalty contract revenue. Accordingly, in these instances revenue is recognized based upon the royalties earned to date. However, there are certain other distribution arrangements that are fixed price or contain minimum guarantees that extend beyond one year. The Company recognizes revenue for fixed fee distribution contracts on a monthly basis based on minimum monthly fees or by calculating one twelfth of annual license fees specified in its distribution contracts. The transaction price allocated to remaining performance obligations within these fixed price or minimum guarantee distribution revenue contracts was $1.3 billion as of December 31, 2020 and is expected to be recognized over the next five years.
The Company's content licensing contracts and sports sublicensing deals are licenses of functional intellectual property. Certain of these arrangements extend beyond one year. The transaction price allocated to remaining performance obligations on these long-term contracts was $807 million as of December 31, 2020 and is expected to be recognized over the next four years.
The Company's brand licensing contracts are licenses of symbolic intellectual property. Certain of these arrangements extend beyond one year. The transaction price allocated to remaining performance obligations on these long-term contracts was $99 million as of December 31, 2020 and is expected to be recognized over the next 11 years.
The value of unsatisfied performance obligations disclosed above does not include: (i) contracts involving variable consideration for which revenues are recognized in accordance with the usage-based royalty exception, and (ii) contracts with an original expected length of one year or less, such as advertising contracts.
Capitalized Contract Costs
Sales commissions are generally expensed as incurred because contracts for which the sales commissions are generated are one year or less or are not material. Sales commissions are recorded as a component of cost of revenues on the consolidated statements of operations. The financing component of content licensing arrangements is not capitalized, because the period between delivery of the license and customer payment is one year or less or is not material.
NOTE 15. SHARE-BASED COMPENSATION
The Company has various incentive plans under which PRSUs, RSUs, stock options and SARs have been issued. As of December 31, 2020, the Company has reserved a total of 96 million shares of its Series A and Series C common stock for future exercises, vestings and grants of stock options, stock-settled SARs, PRSUs and RSUs. Upon exercise or vesting of stock awards, the Company issues new shares from its existing authorized but unissued shares. There were 58 million shares of common stock in reserves that were available for future issuance under the incentive plans as of December 31, 2020.
DISCOVERY, INC.
NOTES TO CONSOLIDATED FINANCIAL STATEMENTS
Share-Based Compensation Expense
The table below presents the components of share-based compensation expense (in millions).
| | | | | | | | | | | | | | | | | | | | |
| | Year Ended December 31, |
| | 2020 | | 2019 | | 2018 |
| PRSUs | | $ | 8 | | | $ | 46 | | | $ | 24 | |
| RSUs | | 76 | | | 41 | | | 27 | |
| Stock options | | 30 | | | 33 | | | 22 | |
| SARs | | (4) | | | 22 | | | 8 | |
| ESPP and other | | — | | | — | | | (1) | |
| Total share-based compensation expense | | $ | 110 | | | $ | 142 | | | $ | 80 | |
| Tax benefit recognized | | $ | 18 | | | $ | 17 | | | $ | 13 | |
Liability-classified share-based compensation awards include certain PRSUs and SARs. The Company recorded total liabilities for cash-settled and other liability-classified share-based compensation awards of $55 million and $93 million as of December 31, 2020 and 2019, respectively. The current portion of the liability for cash-settled and other liability-classified awards was $37 million and $47 million as of December 31, 2020 and 2019, respectively.
Share-Based Award Activity
PRSUs
The table below presents PRSU activity (in millions, except years and weighted-average grant price).
| | | | | | | | | | | | | | | | | | | | | | | | | | |
| | PRSUs | | Weighted-
Average
Grant
Date Fair Value | | Weighted-Average
Remaining
Contractual
Term
(years) | | Aggregate
Fair
Value |
| Outstanding as of December 31, 2019 | | 2.2 | | | $ | 26.89 | | | 0.5 | | $ | 71 | |
| Granted | | 0.5 | | | $ | 25.70 | | | | | |
| Converted | | (1.2) | | | $ | 26.79 | | | | | $ | 33 | |
| Forfeited | | — | | | $ | — | | | | | |
| Outstanding as of December 31, 2020 | | 1.5 | | | $ | 26.57 | | | 0.0 | | $ | 45 | |
| Vested and expected to vest as of December 31, 2020 | | 1.5 | | | $ | 26.57 | | | 0.0 | | $ | 45 | |
| Convertible as of December 31, 2020 | | 0.9 | | | $ | 26.80 | | | 0.0 | | $ | 28 | |
The Company has granted PRSUs to certain senior level executives. PRSUs represent the contingent right to receive shares of the Company’s Series A or C common stock, substantially all of which vest over three to four years based on continuous service and whether the Company achieves certain operating performance targets. The performance targets for substantially all PRSUs are cumulative measures of the Company’s adjusted operating income before depreciation and amortization (as defined in Note 23), free cash flows and revenues over a three-year period. The number of PRSUs that vest principally range from 0% to 100% based on a sliding scale where achieving or exceeding the performance target will result in 100% of the PRSUs vesting and achieving less than 80% of the target will result in no portion of the PRSUs vesting. Additionally, for certain PRSUs, the Company’s Compensation Committee has discretion in determining the final amount of units that vest, but may not increase the amount of any PRSU award above 100%. Upon vesting, each PRSU becomes convertible into one share of the Company’s Series A or Series C common stock as applicable. Holders of PRSUs do not receive payments of dividends in the event the Company pays a cash dividend until such PRSUs are converted into shares of the Company’s common stock.
As of December 31, 2020, unrecognized compensation cost related to PRSUs was immaterial.
DISCOVERY, INC.
NOTES TO CONSOLIDATED FINANCIAL STATEMENTS
RSUs
The table below presents RSU activity (in millions, except years and weighted-average grant price).
| | | | | | | | | | | | | | | | | | | | | | | | | | |
| |
RSUs | | Weighted-
Average
Grant
Date Fair Value | | Weighted-Average
Remaining
Contractual
Term
(years) | | Aggregate
Fair
Value |
| Outstanding as of December 31, 2019 | | 6.5 | | | $ | 27.14 | | | 1.5 | | $ | 213 | |
| Granted | | 4.6 | | | $ | 25.50 | | | | | |
| Vested | | (1.7) | | | $ | 26.82 | | | | | $ | 45 | |
| Forfeited | | (0.8) | | | $ | 27.13 | | | | | |
| Outstanding as of December 31, 2020 | | 8.6 | | | $ | 26.31 | | | 2.8 | | $ | 259 | |
| Vested and expected to vest as of December 31, 2020 | | 8.6 | | | $ | 26.31 | | | 2.8 | | $ | 259 | |
RSUs represent the contingent right to receive shares of the Company's Series A or C common stock, substantially all of which vest ratably each year over periods of one to four years based on continuous service. As of December 31, 2020, there was $204 million of unrecognized compensation cost related to RSUs, of which $59 million is related to cash settled RSUs. Stock settled RSUs are expected to be recognized over a weighted-average period of 1.2 years and cash settled RSUs are expected to be recognized over a weighted-average period of 3.0 years.
Stock Options
The table below presents stock option activity (in millions, except years and weighted-average exercise price).
| | | | | | | | | | | | | | | | | | | | | | | | | | |
| | Stock Options | | Weighted-
Average
Exercise
Price | | Weighted-
Average
Remaining
Contractual
Term
(years) | | Aggregate
Intrinsic
Value |
| Outstanding as of December 31, 2019 | | 21.4 | | | $ | 29.24 | | | 4.7 | | $ | 83 | |
| Granted | | 1.3 | | | $ | 25.70 | | | | | |
| Exercised | | (0.4) | | | $ | 19.75 | | | | | $ | 3 | |
| Forfeited | | (1.3) | | | $ | 32.66 | | | | | |
| Outstanding as of December 31, 2020 | | 21.0 | | | $ | 29.00 | | | 4.0 | | $ | 41 | |
| Vested and expected to vest as of December 31, 2020 | | 21.0 | | | $ | 29.00 | | | 4.0 | | $ | 41 | |
| Exercisable as of December 31, 2020 | | 6.5 | | | $ | 27.90 | | | 2.6 | | $ | 20 | |
Stock options are granted with an exercise price equal to or in excess of the closing market price of the Company’s Series A or Series C common stock on the date of grant. Substantially all stock options vest ratably over three to four years from the grant date based on continuous service and expire seven to ten years from the date of grant. Stock option awards generally provide for accelerated vesting upon retirement or after reaching a specified age and years of service. The Company received cash payments from the exercise of stock options totaling $8 million, $17 million and $68 million during 2020, 2019 and 2018, respectively. As of December 31, 2020, there was $65 million of unrecognized compensation cost related to stock options, which is expected to be recognized over a weighted-average period of 1.8 years.
The fair value of stock options is estimated using the Black-Scholes option-pricing model. The weighted-average assumptions used to determine the fair value of stock options as of the date of grant during 2020, 2019 and 2018 were as follows.
| | | | | | | | | | | | | | | | | | | | |
| | Year Ended December 31, |
| | 2020 | | 2019 | | 2018 |
| Risk-free interest rate | | 0.89 | % | | 2.67 | % | | 2.74 | % |
| Expected term (years) | | 5 | | 5.5 | | 5.5 |
| Expected volatility | | 31.86 | % | | 30.44 | % | | 29.57 | % |
| Dividend yield | | — | | | — | | | — | |
DISCOVERY, INC.
NOTES TO CONSOLIDATED FINANCIAL STATEMENTS
The weighted-average grant date fair value of options granted during 2020, 2019 and 2018 was $7.57, $8.43 and $7.95, respectively, per option. The total intrinsic value of options exercised during 2020, 2019 and 2018 was $3 million, $4 million and $30 million, respectively.
SARs
The table below presents SAR award activity (in millions, except years and weighted-average grant price).
| | | | | | | | | | | | | | | | | | | | | | | | | | |
| | SARs | | Weighted-
Average
Grant
Price | | Weighted-
Average
Remaining
Contractual
Term
(years) | | Aggregate
Intrinsic
Value |
| Outstanding as of December 31, 2019 | | 4.9 | | | $ | 24.44 | | | 0.8 | | $ | 35 | |
| Granted | | — | | | $ | — | | | | | |
| Settled | | (2.3) | | | $ | 24.88 | | | | | $ | 14 | |
| Forfeited | | — | | | $ | — | | | | | |
| Outstanding as of December 31, 2020 | | 2.6 | | | $ | 24.01 | | | 0.5 | | $ | 12 | |
| Vested and expected to vest as of December 31, 2020 | | 2.6 | | | $ | 24.01 | | | 0.5 | | $ | 12 | |
SAR award grants include cash-settled SARs and stock-settled SARs. Cash-settled SARs entitle the holder to receive a cash payment for the amount by which the price of the Company’s Series A or Series C common stock exceeds the base price established on the grant date. Cash-settled SARs are granted with a base price equal to or greater than the closing market price of the Company’s Series A or Series C common stock on the date of grant. Stock-settled SARs entitle the holder to shares of Series A or Series C common stock in accordance with the award agreement terms.
The fair value of outstanding SARs is estimated using the Black-Scholes option-pricing model. The weighted-average assumptions used to determine the fair value of outstanding SARs were as follows.
| | | | | | | | | | | | | | | | | | | | |
| | Year Ended December 31, |
| | 2020 | | 2019 | | 2018 |
| Risk-free interest rate | | 0.10 | % | | 1.60 | % | | 2.53 | % |
| Expected term (years) | | 0.5 | | 0.8 | | 1.2 |
| Expected volatility | | 42.13 | % | | 30.54 | % | | 36.52 | % |
| Dividend yield | | — | | | — | | | — | |
As of December 31, 2020 and 2019, the weighted-average fair value of SARs outstanding was $5.48 and $8.28 per award. The Company made cash payments of $11 million and $2 million to settle exercised SARs during 2020 and 2019, respectively. The Company made no cash payments to settle exercised SARs during 2018. As of December 31, 2020, there was $2 million of unrecognized compensation cost related to SARs, which is expected to be recognized over a weighted-average period of 0.7 years.
Employee Stock Purchase Plan
The ESPP enables eligible employees to purchase shares of the Company’s common stock through payroll deductions or other permitted means. Unless otherwise determined by the Company’s Compensation Committee, the purchase price for shares offered under the ESPP is 85% of the closing price of the Company’s Series A common stock on the purchase date. The Company’s Board of Directors has authorized 8 million shares of the Company’s common stock to be issued under the ESPP. During the years ended December 31, 2020, 2019 and 2018 the Company issued 254 thousand, 142 thousand and 133 thousand shares under the ESPP, respectively, and received cash totaling $5 million, $3 million and $3 million, respectively.
NOTE 16. RETIREMENT SAVINGS PLANS
The Company has defined contribution, defined benefit, and other savings plans for the benefit of its employees that meet eligibility requirements.
DISCOVERY, INC.
NOTES TO CONSOLIDATED FINANCIAL STATEMENTS
Defined Contribution Plans
Eligible employees may contribute a portion of their compensation to the plans, which may be subject to certain statutory limitations. For these plans, the Company also makes contributions, including discretionary contributions, subject to plan provisions, which vest immediately. The Company made total contributions of $47 million, $37 million and $44 million for the years ended December 31, 2020, 2019 and 2018, respectively. The Company's contributions were recorded in cost of revenues and selling, general and administrative expense in the consolidated statements of operations.
Executive Deferred Compensation Plans
The Company’s savings plans also include a deferred compensation plan through which members of the Company’s executive team in the U.S. may elect to defer a portion of their eligible compensation. The amounts deferred are invested in various mutual funds at the direction of the executive, which are used to finance payment of the deferred compensation obligation. Distributions from the deferred compensation plan are made upon termination or other events as specified in the plan. The Company has established separate rabbi trusts to hold the investments that finance the deferred compensation obligation. The accounts of the separate rabbi trusts are included in the Company’s consolidated financial statements. The investments are included in prepaid expenses and other current assets and other noncurrent assets in the consolidated balance sheets. The deferred compensation obligation is included in accrued liabilities and other noncurrent liabilities in the consolidated balance sheets. The values of the investments and deferred compensation obligation are recorded at fair value. Changes in the fair value of the investments are offset by changes in the fair value of the deferred compensation obligation and are recorded in earnings as a component of other income (expense), net, on the consolidated statements of operations. (See Note 5.)
Defined Benefit Plans
As a result of the acquisition of Scripps Networks in 2018, the Company assumed a defined benefit pension plan (“Pension Plan”) that covers certain U.S. based employees and a non-qualified unfunded Supplemental Executive Retirement Plan (“SERP”) that provides defined pension benefits to eligible executives. Expense recognized in relation to the Pension Plan and SERP is based upon actuarial valuations. Inherent in those valuations are key assumptions including discount rates and, where applicable, expected returns on assets. Discount rates are based on a bond portfolio approach that includes high-quality debt instruments with maturities matching the Company's expected benefit payments from the plans. Expected returns on assets are based on the weighted-average expected rate of return and capital market forecasts for each asset class employed and also consider the Company's historical compounded return on plan assets for 10 and 15-year periods. Benefits are generally based on the employee’s compensation and years of service. Since December 31, 2009, no additional service benefits have been earned by participants under the Pension Plan. The amount of eligible compensation that is used to calculate a plan participant’s pension benefit includes compensation earned by the employee through December 31, 2019, after which time all plan participants have a frozen pension benefit. Net periodic pension cost was not material for the years ended December 31, 2020, 2019 and 2018.
The projected benefit obligation, fair value of plan assets and discount rate used in determining the projected benefit obligations were as follows (in millions).
| | | | | | | | | | | | | | | | | | | | | | | | | | |
| | Pension Plan | | SERP |
| | December 31, |
| | 2020 | | 2019 | | 2020 | | 2019 |
| Projected benefit obligation | | $ | 94 | | | $ | 90 | | | $ | 25 | | | $ | 26 | |
| Fair value of plan assets (Level 1) | | $ | 70 | | | $ | 68 | | | $ | — | | | $ | — | |
| Discount rate | | 1.92 | % | | 2.82 | % | | 1.58 | % | | 2.61 | % |
| | | | | | | | |
NOTE 17. RESTRUCTURING AND OTHER CHARGES
Restructuring and other charges by reportable segment and corporate, inter-segment eliminations, and other were as follows (in millions).
| | | | | | | | | | | | | | | | | | | | |
| | Year Ended December 31, |
| | 2020 | | 2019 | | 2018 |
| U.S. Networks | | $ | 41 | | | $ | 15 | | | $ | 322 | |
| International Networks | | 29 | | | 20 | | | 307 | |
| Corporate, inter-segment eliminations, and other | | 21 | | | (9) | | | 121 | |
| Total restructuring and other charges | | $ | 91 | | | $ | 26 | | | $ | 750 | |
DISCOVERY, INC.
NOTES TO CONSOLIDATED FINANCIAL STATEMENTS
Restructuring charges for the years ended December 31, 2020 and 2019 primarily include charges related to employee termination costs and other cost reduction efforts. During 2020, the Company implemented various cost-savings initiatives including personnel reductions, restructurings and resource reallocations to align its expense structure to ongoing changes within the industry, including economic challenges resulting from the COVID-19 pandemic. These actions are intended to enable the Company to more efficiently operate in a leaner and more directed cost structure and are expected to continue into 2021; however, all such amounts cannot be reasonably estimated at this time as the restructuring plans have not been finalized. Restructuring charges for year ended December 31, 2018 include employee terminations, facility closures, and contract terminations, which include costs to terminate certain production commitments, life of series production and content licensing contracts. Other restructuring charges for the year ended December 31, 2018 consisted of $405 million of content write-offs, which resulted from a global strategic review of content following the acquisition of Scripps Networks.
Changes in restructuring and other liabilities recorded in accrued liabilities by reportable segment and corporate, inter-segment eliminations, and other were as follows (in millions).
| | | | | | | | | | | | | | | | | | | | | | | | | | |
| | U.S. Networks | | International Networks | | Corporate, inter-segment eliminations, and other | | Total |
| December 31, 2018 | | $ | 16 | | | $ | 46 | | | $ | 46 | | | $ | 108 | |
| Net contract termination accruals | | — | | | — | | | (6) | | | (6) | |
| Employee termination accruals, net | | 15 | | | 20 | | | (10) | | | 25 | |
| Other accruals, net | | — | | | — | | | 1 | | | 1 | |
| Cash paid | | (27) | | | (61) | | | (22) | | | (110) | |
| December 31, 2019 | | 4 | | | 5 | | | 9 | | | 18 | |
| Net contract termination accruals | | — | | | — | | | 4 | | | 4 | |
| Employee termination accruals, net | | 41 | | | 29 | | | 13 | | | 83 | |
| Other accruals, net | | — | | | — | | | 4 | | | 4 | |
| Cash paid | | (22) | | | (14) | | | (15) | | | (51) | |
| December 31, 2020 | | $ | 23 | | | $ | 20 | | | $ | 15 | | | $ | 58 | |
NOTE 18. INCOME TAXES
The domestic and foreign components of income before income taxes were as follows (in millions).
| | | | | | | | | | | | | | | | | | | | |
| | | Year Ended December 31, |
| | | 2020 | | 2019 | | 2018 |
| Domestic | | $ | 1,916 | | | $ | 1,910 | | | $ | 1,125 | |
| Foreign | | (188) | | | 384 | | | (103) | |
| Income before income taxes | | $ | 1,728 | | | $ | 2,294 | | | $ | 1,022 | |
DISCOVERY, INC.
NOTES TO CONSOLIDATED FINANCIAL STATEMENTS
The components of the provision for income taxes were as follows (in millions).
| | | | | | | | | | | | | | | | | | | | |
| | | Year Ended December 31, |
| | | 2020 | | 2019 | | 2018 |
| Current: | | | | | | |
| Federal | | $ | 422 | | | $ | 411 | | | $ | 323 | |
| State and local | | 12 | | | 42 | | | 30 | |
| Foreign | | 125 | | | 132 | | | 119 | |
| | 559 | | | 585 | | | 472 | |
| Deferred: | | | | | | |
| Federal | | (14) | | | (54) | | | (113) | |
| State and local | | (24) | | | (8) | | | (21) | |
| Foreign | | (148) | | | (442) | | | 3 | |
| | (186) | | | (504) | | | (131) | |
| Income taxes | | $ | 373 | | | $ | 81 | | | $ | 341 | |
The following table reconciles the Company's effective income tax rates to the U.S. federal statutory income tax rates.
| | | | | | | | | | | | | | | | | | | | | | | | | | | | | | | | | | | | | | |
| | Year Ended December 31, |
| | 2020 | | 2019 | | 2018 |
| Pre-tax income at U.S. federal statutory income tax rate | | $ | 363 | | | 21 | % | | $ | 482 | | | 21 | % | | $ | 215 | | | 21 | % |
| State and local income taxes, net of federal tax benefit | | (10) | | | — | % | | 27 | | | 1 | % | | 10 | | | 1 | % |
| Effect of foreign operations | | 7 | | | — | % | | (21) | | | (1) | % | | 111 | | | 11 | % |
| | | | | | | | | | | | |
| Noncontrolling interest adjustment | | (29) | | | (2) | % | | (30) | | | (1) | % | | (18) | | | (2) | % |
| Impairment of goodwill | | 25 | | | 2 | % | | 32 | | | 1 | % | | — | | | — | % |
| Deferred tax adjustment | | (22) | | | (1) | % | | — | | | — | % | | — | | | — | % |
| Non-deductible compensation | | 17 | | | 1 | % | | 22 | | | 1 | % | | 20 | | | 2 | % |
| Change in uncertain tax positions | | 17 | | | 1 | % | | 3 | | | — | % | | 37 | | | 3 | % |
| Legal entity restructuring, deferred tax impact | | — | | | — | % | | (445) | | | (19) | % | | — | | | — | % |
| | | | | | | | | | | | |
| | | | | | | | | | | | |
| | | | | | | | | | | | |
| Renewable energy investments tax credits | | — | | | — | % | | (1) | | | — | % | | (12) | | | (1) | % |
| | | | | | | | | | | | |
| U.S. legislative changes | | — | | | — | % | | — | | | — | % | | (19) | | | (2) | % |
| Other, net | | 5 | | | — | % | | 12 | | | 1 | % | | (3) | | | — | % |
| Income tax expense | | $ | 373 | | | 22 | % | | $ | 81 | | | 4 | % | | $ | 341 | | | 33 | % |
Income tax expense was $373 million and $81 million, and the Company's effective tax rate was 22% and 4% for 2020 and 2019, respectively. The increase in income tax expense for the year ended December 31, 2020 was primarily attributable to the discrete, one-time, non-cash deferred tax benefit of $445 million from legal entity restructurings that was recorded during the year ended December 31, 2019. Additionally, the increase in income tax expense was attributable to an increase in provision for uncertain tax positions and an increase in the effect of foreign operations. Those increases were partially offset by a decrease in pre-tax book income, a tax benefit from a favorable multi-year state resolution, and a favorable deferred tax adjustment in the U.S. that was recorded during the year ended December 31, 2020.
DISCOVERY, INC.
NOTES TO CONSOLIDATED FINANCIAL STATEMENTS
Income tax expense was $81 million and $341 million, and the Company's effective tax rate was 4% and 33% for 2019 and 2018, respectively. The decrease in income tax expense for the year ended December 31, 2019 was primarily attributable to the discrete, one-time, non-cash deferred tax benefit of $445 million from legal entity restructurings. Additionally, the decrease in income tax expense was attributable to a decrease in the provision for uncertain tax positions and a decrease in the effect of foreign operations, which was mainly driven by the establishment of certain valuation allowances during the year ended December 31, 2018 that did not recur in 2019, and a tax benefit realized during the year ended December 31, 2019 from the final regulations related to the determination of the foreign tax credit released by the U.S. Treasury department and IRS in December 2019. This decrease was partially offset by an increase in income and the impact of a goodwill impairment charge that was non-deductible for tax purposes during the year ended December 31, 2019. Finally, the income tax expense for the year ended December 31, 2018 included a one-time discrete tax benefit from U.S. legislative changes that extended the accelerated deduction of qualified film productions.
Components of deferred income tax assets and liabilities were as follows (in millions).
| | | | | | | | | | | | | | |
| | | December 31, |
| | | 2020 | | 2019 |
| Deferred income tax assets: | | | | |
| Accounts receivable | | $ | 7 | | | $ | 12 | |
| Tax attribute carry-forward | | 354 | | | 311 | |
| | | | |
| Accrued liabilities and other | | 471 | | | 342 | |
| Total deferred income tax assets | | 832 | | | 665 | |
| Valuation allowance | | (257) | | | (307) | |
| Net deferred income tax assets | | 575 | | | 358 | |
| Deferred income tax liabilities: | | | | |
| Intangible assets | | (654) | | | (849) | |
| Content rights | | (163) | | | (148) | |
| Equity method and other investments in partnerships | | (470) | | | (471) | |
| Noncurrent portion of debt | | (85) | | | — | |
| | | | |
| Other | | (140) | | | (106) | |
| Total deferred income tax liabilities | | (1,512) | | | (1,574) | |
| Net deferred income tax liabilities | | $ | (937) | | | $ | (1,216) | |
The Company’s net deferred income tax assets and liabilities were reported on the consolidated balance sheets as follows (in millions).
| | | | | | | | | | | | | | |
| | | December 31, |
| | | 2020 | | 2019 |
| Noncurrent deferred income tax assets (included within other noncurrent assets) | | $ | 597 | | | $ | 475 | |
| Deferred income tax liabilities | | (1,534) | | | (1,691) | |
| Net deferred income tax liabilities | | $ | (937) | | | $ | (1,216) | |
The Company’s loss carry-forwards were reported on the consolidated balance sheets as follows (in millions).
| | | | | | | | | | | | | | | | | | | | |
| | Federal | | State | | Foreign |
| Loss carry-forwards | | $ | 9 | | | $ | 315 | | | $ | 2,303 | |
| Deferred tax asset related to loss carry-forwards | | 2 | | | 16 | | | 269 | |
| Valuation allowance against loss carry-forwards | | — | | | (15) | | | (138) | |
| Earliest expiration date of loss carry-forwards | | 2034 | | 2021 | | 2021 |
DISCOVERY, INC.
NOTES TO CONSOLIDATED FINANCIAL STATEMENTS
A reconciliation of the beginning and ending amounts of unrecognized tax benefits (without related interest and penalty amounts) is as follows (in millions).
| | | | | | | | | | | | | | | | | | | | |
| | | Year Ended December 31, |
| | | 2020 | | 2019 | | 2018 |
| Beginning balance | | $ | 375 | | | $ | 378 | | | $ | 189 | |
| Additions based on tax positions related to the current year | | 31 | | | 54 | | | 43 | |
| Additions for tax positions of prior years | | 4 | | | 11 | | | 52 | |
| Additions for tax positions acquired in business combinations | | — | | | 47 | | | 169 | |
| Reductions for tax positions of prior years | | (5) | | | (47) | | | (9) | |
| Settlements | | (9) | | | (19) | | | (6) | |
| Reductions due to lapse of statutes of limitations | | (51) | | | (50) | | | (52) | |
| Changes due to foreign currency exchange rates | | 3 | | | 1 | | | (8) | |
| Ending balance | | $ | 348 | | | $ | 375 | | | $ | 378 | |
The balances as of December 31, 2020, 2019 and 2018 included $348 million, $375 million and $378 million, respectively, of unrecognized tax benefits that, if recognized, would reduce the Company’s income tax expense and effective tax rate after giving effect to interest deductions and offsetting benefits from other tax jurisdictions. For the year ended December 31, 2020, decreases in unrecognized tax benefits related to multiple audit resolutions and the lapse of statutes of limitations were offset by the uncertainty of allocation and taxation of income among multiple jurisdictions.
The Company and its subsidiaries file income tax returns in the U.S. and various state and foreign jurisdictions. The Company is currently under audit by the Internal Revenue Service for its 2012 to 2015 consolidated federal income tax returns. It is difficult to predict the final outcome or timing of resolution of any particular tax matter. Accordingly, an estimate of any related impact to the reserve for uncertain tax positions cannot currently be determined. With few exceptions, the Company is no longer subject to audit by any jurisdiction for years prior to 2006. Adjustments that arose from the completion of audits for certain tax years have been included in the change in uncertain tax positions in the table above.
It is reasonably possible that the total amount of unrecognized tax benefits related to certain of the Company's uncertain tax positions could decrease by as much as $71 million within the next twelve months as a result of ongoing audits, foreign judicial proceedings, lapses of statutes of limitations or regulatory developments.
As of December 31, 2020, 2019 and 2018, the Company had accrued approximately $53 million, $58 million, and $51 million, respectively, of total interest and penalties payable related to unrecognized tax benefits. The Company recognizes interest and penalties related to unrecognized tax benefits as a component of income tax expense.
NOTE 19. EARNINGS PER SHARE
In calculating earnings per share, the Company follows the two-class method, which distinguishes between classes of securities based on the proportionate participation rights of each security type in the Company's undistributed income. The Company's Series A, B and C common stock is treated as one class and the Series C-1 convertible preferred stock is treated as a separate class for purposes of applying the two-class method. The Company's Series C-1 convertible preferred stock is an in-substance common stock equivalent as it has substantially equal rights and shares equally on an as-converted basis with respect to income available to Discovery, Inc. The Company's Series A-1 convertible preferred stock is also a separate class but is not considered a common stock equivalent and therefore is not presented separately in the calculation of earnings per share. Series A-1 convertible preferred stock is currently convertible into 9 shares of the Company's Series A common stock and Series C-1 convertible preferred stock is convertible into 19.3648 shares of the Company's Series C common stock, subject to certain anti-dilution adjustments. During the years ended December 31, 2020 and 2018, no Series A-1 or C-1 convertible preferred stock was converted. During the year ended December 31, 2019, Advance Newhouse Programming Partnership converted 1.1 million of its Series C-1 convertible preferred stock into 22.0 million shares of Series C common stock.
DISCOVERY, INC.
NOTES TO CONSOLIDATED FINANCIAL STATEMENTS
Net income allocated to Discovery, Inc. Series C-1 convertible preferred stockholders for diluted net income per share is included in net income allocated to Discovery, Inc. Series A, B and C common stockholders for diluted net income per share. The weighted average number of diluted shares outstanding adjusts the weighted average number of shares of Series A, B and C common stock outstanding for the potential dilution that would occur if common stock equivalents, including convertible preferred stock and share-based awards, were converted into common stock or exercised, calculated using the treasury stock method. The computation of the diluted earnings per share of Series A, B and C common stockholders assumes the conversion of Series A-1 and C-1 convertible preferred stock, while the diluted earnings per share amounts of Series C-1 convertible preferred stock does not assume conversion of those shares.
The table below sets forth the computation for income (loss) available to Discovery, Inc. stockholders (in millions). Earnings per share amounts may not recalculate due to rounding.
| | | | | | | | | | | | | | | | | | | | |
| | Year Ended December 31, |
| | 2020 | | 2019 | | 2018 |
| Numerator: | | | | | | |
| Net income | | $ | 1,355 | | | $ | 2,213 | | | $ | 681 | |
| Less: | | | | | | |
Allocation of undistributed income to Series A-1 convertible preferred stock | | (128) | | | (204) | | | (60) | |
Net income attributable to noncontrolling interests | | (124) | | | (128) | | | (67) | |
Net income attributable to redeemable noncontrolling interests | | (12) | | | (16) | | | (20) | |
Redeemable noncontrolling interest adjustments to redemption value | | — | | | (20) | | | (5) | |
| Net income available to Discovery, Inc. Series A, B and C common and Series C-1 convertible preferred stockholders for basic net income per share | | $ | 1,091 | | | $ | 1,845 | | | $ | 529 | |
| Allocation of net income: | | | | | | |
| Series A, B and C common stockholders | | 919 | | | 1,531 | | | 429 | |
| Series C-1 convertible preferred stockholders | | 172 | | | 314 | | | 100 | |
| Total | | 1,091 | | | 1,845 | | | 529 | |
| Add: | | | | | | |
Allocation of undistributed income to Series A-1 convertible preferred stockholders | | 128 | | | 204 | | | 60 | |
| Net income available to Discovery, Inc. Series A, B and C common stockholders for diluted net income per share | | $ | 1,219 | | | $ | 2,049 | | | $ | 589 | |
| | | | | | |
Denominator — weighted average: | | | | | | |
Series A, B and C common shares outstanding — basic | | 505 | | | 529 | | | 498 | |
Impact of assumed preferred stock conversion | | 165 | | | 179 | | | 187 | |
Dilutive effect of share-based awards | | 2 | | | 3 | | | 3 | |
Series A, B and C common shares outstanding — diluted | | 672 | | | 711 | | | 688 | |
Series C-1 convertible preferred stock outstanding — basic and diluted | | 5 | | | 6 | | | 6 | |
| | | | | | |
| Basic net income per share allocated to: | | | | | | |
| Series A, B and C common stockholders | | $ | 1.82 | | | $ | 2.90 | | | $ | 0.86 | |
Series C-1 convertible preferred stockholders | | $ | 35.24 | | | $ | 56.07 | | | $ | 16.65 | |
| | | | | | |
| Diluted net income per share allocated to: | | | | | | |
Series A, B and C common stockholders | | $ | 1.81 | | | $ | 2.88 | | | $ | 0.86 | |
| Series C-1 convertible preferred stockholders | | $ | 35.12 | | | $ | 55.80 | | | $ | 16.58 | |
DISCOVERY, INC.
NOTES TO CONSOLIDATED FINANCIAL STATEMENTS
The table below presents the details of share-based awards that were excluded from the calculation of diluted earnings per share (in millions).
| | | | | | | | | | | | | | | | | | | | |
| | Year Ended December 31, |
| | 2020 | | 2019 | | 2018 |
Anti-dilutive share-based awards | | 24 | | | 17 | | | 15 | |
PRSUs whose performance targets have not yet been achieved | | — | | | — | | 1 |
| | | | | | |
| | | | | | |
| | | | | | |
Only outstanding PRSUs whose performance targets have been achieved as of the last day of the most recent period are included in the dilutive effect calculation.
NOTE 20. SUPPLEMENTAL DISCLOSURES
Property and equipment
Property and equipment consisted of the following (in millions).
| | | | | | | | | | | | | | | | | |
| | | | December 31, |
| | Useful Lives | | 2020 | | 2019 |
Broadcast equipment (a) | 3 - 5 years | | $ | 744 | | | $ | 676 | |
| Office equipment, furniture, fixtures and other | 3 - 5 years | | 734 | | | 606 | |
| Capitalized software costs | 2 - 5 years | | 757 | | | 519 | |
Land, buildings and leasehold improvements (b) | 39 years | | 334 | | | 298 | |
| Property and equipment, at cost | | | 2,569 | | | 2,099 | |
| Accumulated depreciation | | | (1,363) | | | (1,148) | |
| Property and equipment, net | | | $ | 1,206 | | | $ | 951 | |
| | | | | |
(a) Property and equipment includes assets acquired under finance lease arrangements, primarily satellite transponders classified as broadcast equipment. Assets acquired under finance lease arrangements are amortized using the straight-line method over the lesser of the estimated useful lives of the assets or the terms of the related leases. (See Note 9.) |
| | | | | |
(b) Land has an indefinite life and is not depreciated. Leasehold improvements have an estimated useful life of the shorter of five years or the lease term. |
Capitalized software costs are for internal use. The net book value of capitalized software costs was $309 million and $176 million as of December 31, 2020 and 2019, respectively. The related accumulated amortization was $448 million and $343 million as of December 31, 2020 and 2019, respectively.
Depreciation expense for property and equipment totaled $267 million, $207 million and $229 million for the years ended December 31, 2020, 2019 and 2018, respectively.
Accrued Liabilities
Accrued liabilities consisted of the following (in millions):
| | | | | | | | | | | |
| December 31, |
| 2020 | | 2019 |
| Accrued payroll and related benefits | $ | 494 | | | $ | 425 | |
| Content rights payable | 528 | | | 456 | |
| Other accrued liabilities | 771 | | | 797 | |
| Total accrued liabilities | $ | 1,793 | | | $ | 1,678 | |
DISCOVERY, INC.
NOTES TO CONSOLIDATED FINANCIAL STATEMENTS
Other income (expense), net
Other income (expense), net, consisted of the following (in millions):
| | | | | | | | | | | | | | | | | | | | |
| | | Year Ended December 31, |
| | | 2020 | | 2019 | | 2018 |
| Foreign currency (losses) gains, net | | $ | (115) | | | $ | 17 | | | $ | (93) | |
| Gain on sale of investment with readily determinable fair value | | 101 | | | — | | | — | |
| Gains (losses) on derivatives not designated as hedges | | 29 | | | (52) | | | 50 | |
| Change in the value of investments with readily determinable fair value | | 28 | | | (26) | | | (88) | |
| Expenses from debt modification | | (11) | | | — | | | — | |
| Interest income | | 10 | | | 22 | | | 15 | |
| Gain on sale of equity method investments | | 2 | | | 13 | | | — | |
| Remeasurement gain on previously held equity interest | | — | | | 14 | | | — | |
| Other (expense) income, net | | (2) | | | 4 | | | (4) | |
| Total other income (expense), net | | $ | 42 | | | $ | (8) | | | $ | (120) | |
Supplemental Cash Flow Information
| | | | | | | | | | | | | | | | | | | | |
| | Year Ended December 31, |
| | 2020 | | 2019 | | 2018 |
| Cash paid for taxes, net | | $ | 641 | | | $ | 562 | | | $ | 389 | |
| Cash paid for interest | | 673 | | | 708 | | | 740 | |
| Non-cash investing and financing activities: | | | | | | |
Receivable from sale of fuboTV Inc. shares | | 124 | | | — | | | — | |
| Equity issued for the acquisition of Scripps Networks | | — | | | — | | | 3,218 | |
| Disposal of UKTV investment and acquisition of Lifestyle Business | | — | | | 291 | | | — | |
| Accrued purchases of property and equipment | | 48 | | | 47 | | | 39 | |
| Assets acquired under finance lease and other arrangements | | 91 | | | 38 | | | 58 | |
| Equity exchange with Harpo for step acquisition of OWN | | 59 | | | — | | | — | |
| Unsettled stock repurchases | | — | | | 4 | | | — | |
Cash, Cash Equivalents, and Restricted Cash
| | | | | | | | | | | | | | | | | | |
| | | | | | | December 31, 2020 | | December 31, 2019 |
| Cash, cash equivalents, and restricted cash: | | | | | | | | |
| Cash and cash equivalents | | | | | | $ | 2,091 | | | $ | 1,552 | |
Restricted cash - other current assets (a) | | | | | | 31 | | | — | |
| Total cash, cash equivalents, and restricted cash | | | | | | $ | 2,122 | | | $ | 1,552 | |
| | | | | | | | |
(a) Restricted cash includes cash posted as collateral related to forward starting interest rate swap contracts that were executed during years ended December 31, 2020 and 2019. (See Note 10.) |
DISCOVERY, INC.
NOTES TO CONSOLIDATED FINANCIAL STATEMENTS
NOTE 21. RELATED PARTY TRANSACTIONS
In the normal course of business, the Company enters into transactions with related parties. Related parties include entities that share common directorship, such as Liberty Global plc (“Liberty Global”), Liberty Broadband Corporation ("Liberty Broadband") and their subsidiaries and equity method investees (together the “Liberty Group”). Discovery’s Board of Directors includes Mr. Malone, who is Chairman of the Board of Liberty Global and beneficially owns approximately 30% of the aggregate voting power with respect to the election of directors of Liberty Global. Mr. Malone is also Chairman of the Board of Liberty Broadband and beneficially owns approximately 48% of the aggregate voting power with respect to the election of directors of Liberty Broadband. The majority of the revenue earned from the Liberty Group relates to multi-year network distribution arrangements. Related party transactions also include revenues and expenses for content and services provided to or acquired from equity method investees or minority partners of consolidated subsidiaries.
| | | | | | | | | | | | | | | | | | | | |
| | Year Ended December 31, |
| | 2020 | | 2019 (a) | | 2018 (a) |
| Revenues and service charges: | | | | | | |
| Liberty Group | | $ | 686 | | | $ | 668 | | | $ | 640 | |
| Equity method investees | | 223 | | | 210 | | | 270 | |
| Other | | 103 | | | 111 | | | 134 | |
| Total revenues and service charges | | $ | 1,012 | | | $ | 989 | | | $ | 1,044 | |
| Interest income | | $ | — | | | $ | 1 | | | $ | 4 | |
| Expenses | | $ | (244) | | | $ | (224) | | | $ | (257) | |
| Distributions to noncontrolling interests and redeemable noncontrolling interests | | $ | (254) | | | $ | (250) | | | $ | (76) | |
The table below presents amounts due from and to related parties (in millions).
| | | | | | | | | | | | | | |
| | December 31, |
| | 2020 | | 2019 (a) |
| Receivables | | $ | 177 | | | $ | 161 | |
| Payables | | 43 | | | 105 | |
| | | | |
(a) Amounts have been revised to adjust for classification between lines and excluded balances solely within this footnote disclosure. Revised amounts are not material to the previously issued financial statements. |
NOTE 22. COMMITMENTS, CONTINGENCIES, AND GUARANTEES
Commitments
In the normal course of business, the Company enters into various commitments, which primarily include programming and talent arrangements, operating and finance leases (see Note 9), arrangements to purchase various goods and services, and future funding commitments to equity method investees.
| | | | | | | | | | | | | | | | | | | | |
| Year Ending December 31, | | Content | | Other | | Total |
| 2021 | | $ | 1,698 | | | $ | 576 | | | $ | 2,274 | |
| 2022 | | 626 | | | 345 | | | 971 | |
| 2023 | | 479 | | | 222 | | | 701 | |
| 2024 | | 777 | | | 53 | | | 830 | |
| 2025 | | 336 | | | 32 | | | 368 | |
| Thereafter | | 1,137 | | | 69 | | | 1,206 | |
| Total | | $ | 5,053 | | | $ | 1,297 | | | $ | 6,350 | |
DISCOVERY, INC.
NOTES TO CONSOLIDATED FINANCIAL STATEMENTS
Content purchase obligations include commitments and liabilities associated with third-party producers and sports associations for content that airs on our television networks. Production contracts generally require: purchase of a specified number of episodes; payments over the term of the license; and include both programs that have been delivered and are available for airing and programs that have not yet been produced or sporting events that have not yet taken place. If the content is ultimately never produced, our commitments expire without obligation. The commitments disclosed above exclude content liabilities recognized on the consolidated balance sheet.
Other purchase obligations include agreements with certain vendors and suppliers for the purchase of goods and services whereby the underlying agreements are enforceable, legally binding and specify all significant terms. Significant purchase obligations include transmission services, television rating services, marketing research, employment contracts, equipment purchases, and information technology and other services. Some of these contracts do not require the purchase of fixed or minimum quantities and generally may be terminated with a 30-day to 60-day advance notice without penalty, and are not included in the table above past the 30-day to 60-day advance notice period. Amounts related to employment contracts include base compensation, but do not include compensation contingent on future events.
Although the Company had funding commitments to equity method investees as of December 31, 2020, the Company may also provide uncommitted additional funding to its equity method investments in the future. (See Note 4.)
Contingencies
Put Rights
The Company has granted put rights to certain consolidated subsidiaries. (See Note 11.)
Legal Matters
The Company is party to various lawsuits and claims in the ordinary course of business, including claims related to employees, vendors, other business partners or patent issues. However, a determination as to the amount of the accrual required for such contingencies is highly subjective and requires judgment about future events. Although the outcome of these matters cannot be predicted with certainty and the impact of the final resolution of these matters on the Company's results of operations in a particular subsequent reporting period is not known, management does not believe that the resolution of these matters will have a material adverse effect on the Company's future consolidated financial position, future results of operations or cash flows.
During the year ended December 31, 2019, a withholding tax claim recorded as part of the Scripps Networks purchase accounting was settled with a portion of the claim being resolved subsequent to the measurement period, which resulted in a reversal of the remaining accrual and a reduction in selling, general, and administrative expense of $29 million.
Guarantees
There were no guarantees recorded under ASC 460 as of December 31, 2020 and 2019.
In the normal course of business, the Company may provide or receive indemnities that are intended to allocate certain risks associated with business transactions. Similarly, the Company may remain contingently liable for certain obligations of a divested business in the event that a third party does not fulfill its obligations under an indemnification obligation. The Company records a liability for its indemnification obligations and other contingent liabilities when probable and estimable. There were no material amounts for indemnifications or other contingencies recorded as of December 31, 2020 and 2019.
NOTE 23. REPORTABLE SEGMENTS
The Company’s operating segments are determined based on: (i) financial information reviewed by its chief operating decision maker ("CODM"), the Chief Executive Officer ("CEO"), (ii) internal management and related reporting structure, and (iii) the basis upon which the CEO makes resource allocation decisions.
The accounting policies of the reportable segments are the same as the Company’s, except that certain inter-segment transactions that are eliminated for consolidation are not eliminated at the segment level. Inter-segment transactions primarily include advertising and content purchases. The Company does not report assets by segment because this is not used to allocate resources or evaluate segment performance.
DISCOVERY, INC.
NOTES TO CONSOLIDATED FINANCIAL STATEMENTS
The Company evaluates the operating performance of its segments based on financial measures such as revenues and adjusted operating income before depreciation and amortization (“Adjusted OIBDA”). Adjusted OIBDA is defined as operating income excluding: (i) employee share-based compensation, (ii) depreciation and amortization, (iii) restructuring and other charges, (iv) certain impairment charges, (v) gains and losses on business and asset dispositions, (vi) certain inter-segment eliminations related to production studios, (vii) third-party transaction costs directly related to the acquisition and integration of Scripps Networks and other transactions, and (viii) other items impacting comparability, such as the non-cash settlement of a withholding tax claim. (See Note 22.) The Company uses this measure to assess the operating results and performance of its segments, perform analytical comparisons, identify strategies to improve performance and allocate resources to each segment. The Company believes Adjusted OIBDA is relevant to investors because it allows them to analyze the operating performance of each segment using the same metric management uses. The Company excludes share-based compensation, restructuring and other charges, certain impairment charges, gains and losses on business and asset dispositions and acquisition and integration costs from the calculation of Adjusted OIBDA due to their impact on comparability between periods. The Company also excludes depreciation of fixed assets and amortization of intangible assets, as these amounts do not represent cash payments in the current reporting period. Certain corporate expenses and inter-segment eliminations related to production studios are excluded from segment results to enable executive management to evaluate segment performance based upon the decisions of segment executives. Adjusted OIBDA and Total Adjusted OIBDA should be considered in addition to, but not a substitute for, operating income, net income and other measures of financial performance reported in accordance with U.S. GAAP.
Effective January 1, 2019, the Company's definition of Adjusted OIBDA was modified to exclude all employee share-based compensation, whereas only mark-to-market share-based compensation was previously excluded. Over time, the Company has moved to a higher percentage of equity classified awards (in lieu of liability classified awards, which require mark-to-market accounting) under its stock incentive plans and expects to continue this practice in future periods. Since most equity classified awards are non-cash expenses not entirely under management control, the Company has elected to exclude all employee share-based compensation from Adjusted OIBDA beginning in 2019. The revised definition of Adjusted OIBDA will be used by the Company's CODM in evaluating segment performance in 2019. Accordingly, prior period amounts have been recast to reflect the current definition.
The tables below present summarized financial information for each of the Company’s reportable segments and corporate, inter-segment eliminations, and other (in millions).
Revenues
| | | | | | | | | | | | | | | | | | | | |
| | Year Ended December 31, |
| | 2020 | | 2019 | | 2018 |
| U.S. Networks | | $ | 6,949 | | | $ | 7,092 | | | $ | 6,350 | |
| International Networks | | 3,713 | | | 4,041 | | | 4,149 | |
| Corporate, inter-segment eliminations, and other | | 9 | | | 11 | | | 54 | |
| Total revenues | | $ | 10,671 | | | $ | 11,144 | | | $ | 10,553 | |
DISCOVERY, INC.
NOTES TO CONSOLIDATED FINANCIAL STATEMENTS
Reconciliation of Net Income Available to Discovery, Inc. to Adjusted OIBDA
| | | | | | | | | | | | | | | | | | | | |
| | Year Ended December 31, |
| | 2020 | | 2019 | | 2018 |
| Net income available to Discovery, Inc. | | $ | 1,219 | | | $ | 2,069 | | | $ | 594 | |
| Net income attributable to redeemable noncontrolling interests | | 12 | | | 16 | | | 20 | |
| Net income attributable to noncontrolling interests | | 124 | | | 128 | | | 67 | |
| Income tax expense | | 373 | | | 81 | | | 341 | |
| Income before income taxes | | 1,728 | | | 2,294 | | | 1,022 | |
| Other (income) expense, net | | (42) | | | 8 | | | 120 | |
| Loss from equity investees, net | | 105 | | | 2 | | | 63 | |
| Loss on extinguishment of debt | | 76 | | | 28 | | | — | |
| Interest expense, net | | 648 | | | 677 | | | 729 | |
| Operating income | | 2,515 | | | 3,009 | | | 1,934 | |
| Depreciation and amortization | | 1,359 | | | 1,347 | | | 1,398 | |
| Impairment of goodwill and other intangible assets | | 124 | | | 155 | | | — | |
| Employee share-based compensation | | 99 | | | 137 | | | 80 | |
| Restructuring and other charges | | 91 | | | 26 | | | 750 | |
| Transaction and integration costs | | 6 | | | 26 | | | 110 | |
| Loss (gain) on disposition | | 2 | | | — | | | (84) | |
| Settlement of a withholding tax claim | | — | | | (29) | | | — | |
| Adjusted OIBDA | | $ | 4,196 | | | $ | 4,671 | | | $ | 4,188 | |
Adjusted OIBDA
| | | | | | | | | | | | | | | | | | | | |
| | Year Ended December 31, |
| | 2020 | | 2019 | | 2018 |
| U.S. Networks | | $ | 3,975 | | | $ | 4,117 | | | $ | 3,500 | |
| International Networks | | 723 | | | 1,057 | | | 1,077 | |
| Corporate, inter-segment eliminations, and other | | (502) | | | (503) | | | (389) | |
| Adjusted OIBDA | | $ | 4,196 | | | $ | 4,671 | | | $ | 4,188 | |
Content Amortization and Impairment Expense
| | | | | | | | | | | | | | | | | | | | |
| | Year Ended December 31, |
| | 2020 | | 2019 | | 2018 |
| U.S. Networks | | $ | 1,647 | | | $ | 1,548 | | | $ | 1,702 | |
| International Networks | | 1,307 | | | 1,303 | | | 1,584 | |
| Corporate, inter-segment eliminations, and other | | 2 | | | 2 | | | 2 | |
| Total content amortization and impairment expense | | $ | 2,956 | | | $ | 2,853 | | | $ | 3,288 | |
Content expense is generally a component of costs of revenue on the consolidated statements of operations (see Note 6). No content impairments were recorded as a component of restructuring and other charges during the years ended December 31, 2020 and December 31, 2019. Content impairments of $405 million for the year ended December 31, 2018 were due to the strategic programming changes following the acquisition of Scripps Networks and are reflected in restructuring and other charges as further described in Note 17.
DISCOVERY, INC.
NOTES TO CONSOLIDATED FINANCIAL STATEMENTS
Revenues by Geography
| | | | | | | | | | | | | | | | | | | | |
| | | Year Ended December 31, |
| | | 2020 | | 2019 | | 2018 |
| U.S. | | $ | 7,025 | | | $ | 7,152 | | | $ | 6,415 | |
| Non-U.S. | | 3,646 | | | 3,992 | | | 4,138 | |
| Total revenues | | $ | 10,671 | | | $ | 11,144 | | | $ | 10,553 | |
Distribution and advertising revenues are attributed to each country based on viewer location. Other revenues are attributed to each country based on customer location.
Property and Equipment by Geography
| | | | | | | | | | | | | | |
| | | December 31, |
| | | 2020 | | 2019 |
| U.S. | | $ | 645 | | | $ | 432 | |
| Poland | | 180 | | | 184 | |
| U.K. | | 149 | | | 157 | |
| Other non-U.S. | | 232 | | | 178 | |
| Total property and equipment, net | | $ | 1,206 | | | $ | 951 | |
ITEM 9. Changes in and Disagreements With Accountants on Accounting and Financial Disclosure.
None.
ITEM 9A. Controls and Procedures.
Evaluation of Disclosure Controls and Procedures
Our management, with the participation of our Chief Executive Officer and Chief Financial Officer, has evaluated the effectiveness of our disclosure controls and procedures as of December 31, 2020. The term “disclosure controls and procedures,” as defined in Rules 13a-15(e) and 15d-15(e) of the Exchange Act of 1934, as amended (the “Exchange Act”), means controls and other procedures of a company that are designed to ensure that information required to be disclosed by a company in the reports that it files or submits under the Exchange Act is recorded, processed, summarized and reported, within the time periods specified in the SEC’s rules and forms. Disclosure controls and procedures include, without limitation, controls and procedures designed to ensure that information required to be disclosed by a company in the reports that it files or submits under the Exchange Act is accumulated and communicated to the company’s management, including its principal executive and principal financial officers, or persons performing similar functions, as appropriate to allow timely decisions regarding required disclosure. Management recognizes that any controls and procedures, no matter how well designed and operated, can provide only reasonable assurance of achieving their objectives and management necessarily applies its judgment in evaluating the cost-benefit relationship of
possible controls and procedures. Based on the evaluation of our disclosure controls and procedures as of December 31, 2020, our Chief Executive Officer and Chief Financial Officer concluded that, as of such date, our disclosure controls and procedures were effective.
Management’s Annual Report on Internal Control Over Financial Reporting
Management’s report on internal control over financial reporting is set forth in Item 8 of this Annual Report on Form 10-K under the caption “Management’s Report on Internal Control over Financial Reporting,” which is incorporated herein by reference.
Report of the Independent Registered Public Accounting Firm
The report of our independent registered public accounting firm regarding internal control over financial reporting is set forth in Item 8 of this Annual Report on Form 10-K under the caption “Report of Independent Registered Public Accounting Firm,” which is incorporated herein by reference.
Changes in Internal Control Over Financial Reporting
During the three months ended December 31, 2020, there were no changes in our internal control over financial reporting, as defined in Exchange Act Rule 13a-15(f), that have materially affected, or are reasonably likely to materially affect, our internal control over financial reporting.
ITEM 9B. Other Information.
None.
PART III
Certain information required in Item 10 through Item 14 of Part III of this Annual Report on Form 10-K is incorporated herein by reference to our definitive Proxy Statement for our 2021 Annual Meeting of Stockholders (“2021 Proxy Statement”), which shall be filed with the SEC pursuant to Regulation 14A of the Exchange Act within 120 days of our fiscal year end.
ITEM 10. Directors, Executive Officers and Corporate Governance.
Information regarding our directors, compliance with Section 16(a) of the Exchange Act, and our Audit Committee, including committee members and its financial expert, will be set forth in our 2021 Proxy Statement under the captions “Proposal One: Election of Directors,” “Delinquent Section 16(a) Reports,” if applicable, and “Corporate Governance – Board Meetings and Committees – Audit Committee,” respectively, which are incorporated herein by reference.
Information regarding our executive officers is set forth in Part I of this Annual Report on Form 10-K under the caption “Executive Officers of Discovery, Inc.” as permitted by General Instruction G(3) to Form 10-K.
We have adopted a Code of Ethics (the “Code”) that is applicable to all of our directors, officers and employees. Our Board of Directors approved an updated Code in January 2019 and reviews it regularly. A copy of the Code and any amendments or waivers that would be required to be disclosed under applicable SEC rules are available free of charge at the investor relations section of our website, https://corporate.discovery.com. In addition, we will provide a printed copy of the Code, free of charge, upon written request to: Investor Relations, Discovery, Inc., 8403 Colesville Road, Silver Spring, MD 20910.
ITEM 11. Executive Compensation.
Information regarding executive compensation will be set forth in our 2021 Proxy Statement under the captions “Executive Compensation – Compensation Discussion and Analysis” and “Executive Compensation – Executive Compensation Tables,” which are incorporated herein by reference.
Information regarding compensation policies and practices as they relate to our risk management, director compensation, and compensation committee interlocks and insider participation will be set forth in our 2021 Proxy Statement under the captions “Executive Compensation – Compensation Discussion and Analysis – Other Compensation Related Matters – Risk Considerations in our Compensation Programs,” “Corporate Governance – Director Compensation,” and “Corporate Governance – Board Meetings and Committees – Compensation Committee,” respectively, which are incorporated herein by reference.
Information regarding the compensation committee report will be set forth in our 2021 Proxy Statement under the caption “Executive Compensation – Compensation Committee Report” which is incorporated herein by reference.
ITEM 12. Security Ownership of Certain Beneficial Owners and Management and Related Stockholder Matters.
Information regarding securities authorized for issuance under equity compensation plans will be set forth in our 2021 Proxy Statement under the caption “Securities Authorized for Issuance Under Equity Compensation Plans,” which is incorporated herein by reference.
Information regarding security ownership of certain beneficial owners and management will be set forth in our 2021 Proxy Statement under the captions “Security Ownership Information of Certain Beneficial Owners and Management – Security Ownership of Certain Beneficial Owners” and “Security Ownership Information of Certain Beneficial Owners and Management– Security Ownership of Management,” which are incorporated herein by reference.
ITEM 13. Certain Relationships and Related Transactions, and Director Independence.
Information regarding certain relationships and related transactions, and director independence will be set forth in our 2021 Proxy Statement under the captions “Corporate Governance – Transactions with Related Persons” and “Corporate Governance – Director Independence,” respectively, which are incorporated herein by reference.
ITEM 14. Principal Accountant Fees and Services.
Information regarding principal accountant fees and services will be set forth in our 2021 Proxy Statement under the captions “Audit Matters – Audit Firm Fees and Services” and “Audit Matters – Audit Committee Pre-Approval Policy,” which are incorporated herein by reference.
PART IV
ITEM 15. Exhibits and Financial Statement Schedules.
(a) The following documents are filed as part of this Annual Report on Form 10-K:
(1) The following consolidated financial statements of Discovery, Inc. are filed as part of Item 8 of this Annual Report on Form 10-K:
(2) Financial Statement Schedule
Schedule II: Valuation and Qualifying Accounts
Changes in valuation and qualifying accounts consisted of the following (in millions):
| | | | | | | | | | | | | | | | | | | | | | | | | | | | | | | | | |
| | Beginning
of Year | | Additions | | Other (a) | | Write-offs | | End
of Year | |
| 2020 | | | | | | | | | | | |
| Allowance for credit losses | | $ | 54 | | | 30 | | | (2) | | | (23) | | | $ | 59 | | |
| Deferred tax valuation allowance | | $ | 307 | | | 51 | | | — | | | (101) | | | $ | 257 | | |
| 2019 | | | | | | | | | | | |
| Allowance for credit losses | | $ | 46 | | | 15 | | | — | | | (7) | | | $ | 54 | | |
| Deferred tax valuation allowance | | $ | 336 | | | 37 | | | — | | | (66) | | | $ | 307 | | |
| 2018 | | | | | | | | | | | |
| Allowance for credit losses | | $ | 55 | | | 6 | | | — | | | (15) | | | $ | 46 | | |
Deferred tax valuation allowance (b) | | $ | 105 | | | 283 | | | — | | | (52) | | | $ | 336 | | |
| | | | | | | | | | | |
(a) Amount relates to the impact of the adjustment recorded for adoption of ASU 2016-13. | |
(b) Additions to the valuation allowance for deferred tax assets of $195 million relate to balances acquired through acquisitions in 2018, with the remainder charged to income tax expense. | |
All other financial statement schedules required to be filed pursuant to Item 8 and Item 15(c) of Form 10-K have been omitted as the required information is not applicable, not material, or is set forth in the consolidated financial statements or notes thereto.
(3) The following exhibits are filed or furnished as part of this Annual Report on Form 10-K pursuant to Item 601 of SEC Regulation S-K and Item 15(b) of Form 10-K:
| | | | | | | | |
| EXHIBITS INDEX |
| Exhibit No. | Description |
| 2.1 | | |
| | |
| 3.1 | | |
| | |
| 3.2 | | |
| |
| 3.3 | | |
| | |
| 3.4 | | |
| | |
| 3.5 | | |
| | |
| 4.1 | | |
| |
| 4.2 | | |
| |
| 4.3 | | |
| |
| 4.4 | | |
| | |
| 4.5 | | |
| | |
| 4.6 | | |
| | |
| 4.7 | | |
| |
| 4.8 | | |
| | |
| | | | | | | | |
| EXHIBITS INDEX |
| Exhibit No. | Description |
| 4.9 | | |
| | |
| 4.10 | | |
| |
| 4.11 | | |
| | |
| 4.12 | | |
| |
| 4.13 | | |
| | |
| 4.14 | | |
| | |
| 4.15 | | Sixth Supplemental Indenture, dated as of March 7, 2014, among Discovery Communications, LLC, Discovery Communications, Inc., U.S. Bank National Association, as trustee and Evalon Financial Services Limited, UK Branch, as London Paying Agent (incorporated by reference to Exhibit 4.1 to the Form 8-K/A filed on March 7, 2014 (SEC File No. 001-34177)) |
| | |
| 4.16 | | |
| | |
| 4.17 | | Eighth Supplemental Indenture, dated March 19, 2015, among Discovery Communications, LLC, Discovery Communications, Inc., U.S. Bank National Association, as Trustee, and Elavon Financial Services Limited, UK Branch, as London Paying Agent (incorporated by reference to Exhibit 4.1 to the Form 8-K filed on March 19, 2015 (SEC File No. 001-34177)) |
| | |
| 4.18 | | |
| | |
| 4.19 | | |
| | |
| 4.20 | | |
| | |
| | | | | | | | |
| EXHIBITS INDEX |
| Exhibit No. | Description |
| 4.21 | | Thirteenth Supplemental Indenture, dated as of September 21, 2017, among Discovery Communications, LLC, Discovery Communications, Inc., Elavon Financial Service DAC, UK Branch, as London Paying Agent, and U.S. Bank National Association, as Trustee (incorporated by reference to Exhibit 4.3 to the Form 8-K filed on September 21, 2017 (SEC File No. 001-34177)) |
| | |
| 4.22 | | Fourteenth Supplemental Indenture, dated as of April 2, 2018, among Discovery Communications, LLC, Discovery, Inc., Scripps Networks Interactive, Inc. and U.S. Bank National Association, as Trustee (incorporated by reference to Exhibit 4.3 to the Form 8-K filed on April 4, 2018 (SEC File No. 001-34177)) |
| | |
| 4.23 | | Fifteenth Supplemental Indenture, dated as of April 3, 2018, among Discovery Communications, LLC, Discovery, Inc., Scripps Networks Interactive, Inc. and U.S. Bank National Association, as Trustee (incorporated by reference to Exhibit 4.1 to the Form 8-K filed on April 4, 2018 (SEC File No. 001-34177)) |
| | |
| 4.24 | | Sixteenth Supplemental Indenture, dated as of June 29, 2018, among Discovery Communications, LLC, Discovery, Inc., Scripps Networks Interactive, Inc. and U.S. Bank National Association, as Trustee (incorporated by reference to Exhibit 4.1 to the Form 10-Q filed November 9, 2018 (SEC File No. 001-34177)) |
| | |
| 4.25 | | Seventeenth Supplemental Indenture, dated as of May 21, 2019, among Discovery Communications, LLC, Discovery, Inc., Scripps Networks Interactive, Inc. and U.S. Bank National Association, as Trustee (incorporated by reference to Exhibit 4.1 to the Form 8-K filed on May 21, 2019 (SEC File No. 001-34177)) |
| | |
| 4.26 | | Eighteenth Supplemental Indenture, dated as of May 18, 2020, among Discovery Communications, LLC, Discovery, Inc., Scripps Networks Interactive, Inc. and U.S. Bank National Association, as Trustee (incorporated by reference to Exhibit 4.1 to the Form 8-K filed on May 18, 2020 (SEC File No. 001-34177)) |
| | |
| 4.27 | | Nineteenth Supplemental Indenture, dated as of September 21, 2020, among Discovery Communications, LLC, Discovery, Inc., Scripps Networks Interactive, Inc. and U.S. Bank National Association, as Trustee (incorporated by reference to Exhibit 4.1 to the Form 8-K filed on September 21, 2020 (SEC File No. 001-34177)) |
| | |
| 4.28 | | Amended and Restated Credit Agreement, dated February 4, 2016, among Discovery Communications, LLC ("DCL"), certain wholly-owned subsidiaries of DCL, Discovery Communications, Inc., as Facility Guarantor, the lenders from time to time party thereto, and Bank of America, N.A., as Administrative Agent, Swing Line Lender and L/C Lender (incorporated by reference to Exhibit 4.1 to the Form 8-K filed on February 5, 2016 (SEC File No. 001-34177)) |
| | |
| 4.29 | | Amendment No. 1 to Amended and Restated Credit Agreement, dated as of August 11, 2017, among Discovery Communications, LLC ("DCL"), certain wholly-owned subsidiaries of DCL, Discovery Communications, Inc., as Facility Guarantor, the lenders from time to time party thereto, and Bank of America, N.A., as Administrative Agent (incorporated by reference to Exhibit 4.2 to the Form 10-Q filed on November 2, 2017 (SEC File No. 001-34177)) |
| | |
| 4.30 | | Amendment No. 2 to Amended and Restated Credit Agreement, dated as of April 30, 2020, among Discovery Communications, LLC ("DCL"), certain wholly-owned subsidiaries of DCL, Discovery Communications, Inc., as FacilitAmendment No. 2 to Amended and Restated Credit Agreement, dated as of April 30, 2020, among Discovery Communications, LLC ("DCL"), certain wholly-owned subsidiaries of DCL, Discovery Communications, Inc., as Facility Guarantor, the lenders from time to time party thereto, and Bank of America, N.A., as Administrative Agent (incorporated by reference to Exhibit 4.1 to the Form 8-K filed on May 6, 2020 (SEC File No. 001-34177)) |
| | |
| | | | | | | | |
| EXHIBITS INDEX |
| Exhibit No. | Description |
| 4.31 | | Term Loan Credit Agreement, dated as of August 11, 2017, among Discovery Communications, LLC, as the Company, Discovery Communications, Inc., as Facility Guarantor, the lenders from time to time party thereto, Goldman Sachs Bank USA, as Administrative Agent (incorporated by reference to Exhibit 4.3 to the Form 10-Q filed on November 2, 2017 (SEC File No. 001-34177)) |
| | |
| 4.32 | | |
| | |
| 4.33 | | Registration Rights Agreement, dated as of September 21, 2020, among Discovery Communications, LLC, Scripps Networks Interactive, Inc., Discovery, Inc., Deutsche Bank Securities Inc., RBC Capital Markets, LLC, Barclays Capital Inc., BNP Paribas Securities Corp., J.P. Morgan Securities LLC and Mizuho Securities USA LLC (incorporated by reference to Exhibit 4.2 to the Form 8-K filed on September 21, 2020 (SEC File No.001-34177) |
| | |
| 10.1 | | |
| | |
| 10.2 | | |
| | |
| 10.3 | | |
| | |
| 10.4 | | |
| | |
| 10.5 | | |
| | |
| 10.6 | | |
| |
| 10.7 | | |
| | |
| 10.8 | | |
| | |
| 10.9 | | |
| |
| 10.10 | | |
| | |
| 10.11 | | |
| |
| 10.12 | | |
| | | | | | | | |
| EXHIBITS INDEX |
| Exhibit No. | Description |
| | |
| 10.13 | | |
| | |
| 10.14 | | |
| | |
| 10.15 | | |
| | |
| 10.16 | | |
| | |
| 10.17 | | |
| | |
| 10.18 | |
|
| | |
| 10.19 | | |
| | |
| 10.20 | | |
| | |
| 10.21 | | First Amendment to Employment Agreement, dated September 22, 2020, between Dr. Gunnar Wiedenfels and Discovery First Amendment to Employment Agreement, dated September 22, 2020, between Dr. Gunnar Wiedenfels and Discovery Communications, LLC, a wholly owned subsidiary of Discovery, Inc. (incorporated by reference to Exhibit 10.1 to the Form 8-K filed on September 25, 2020 (SEC File No. 001-34177))* |
| | |
| 10.22 | | |
| | |
| 10.23 | | |
| | |
| 10.24 | | |
| | |
| 10.25 | | |
| | | | | | | | |
| EXHIBITS INDEX |
| Exhibit No. | Description |
| | |
| 10.26 | | |
| | |
| 10.27 | | |
| | |
| 21 | | |
| | |
| 22 | | |
| | |
| 23 | | |
| |
| 31.1 | | |
| |
| 31.2 | | |
| |
| 32.1 | | |
| |
| 32.2 | | |
| | |
| 101.INS | | XBRL Instance Document - the instance document does not appear in the Interactive Data File because its XBRL tags are embedded within the Inline XBRL document. |
| |
| 101.SCH | | Inline XBRL Taxonomy Extension Schema Document (filed herewith)† |
| |
| 101.CAL | | Inline XBRL Taxonomy Extension Calculation Linkbase Document (filed herewith)† |
| |
| 101.DEF | | Inline XBRL Taxonomy Extension Definition Linkbase Document (filed herewith)† |
| |
| 101.LAB | | Inline XBRL Taxonomy Extension Label Linkbase Document (filed herewith)† |
| | |
| 101.PRE | | Inline XBRL Taxonomy Extension Presentation Linkbase Document (filed herewith)† |
| |
| 104 | | Cover Page Interactive Data File (formatted as inline XBRL and contained in Exhibit 101) |
* Indicates management contract or compensatory plan, contract or arrangement.
†Attached as Exhibit 101 to this Annual Report on Form 10-K are the following formatted in Inline XBRL (Extensible Business Reporting Language): (i) Consolidated Balance Sheets as of December 31, 2020 and December 31, 2019, (ii) Consolidated Statements of Operations for the Years Ended December 31, 2020, 2019, and 2018, (iii) Consolidated Statements of Comprehensive Income for the Years Ended December 31, 2020, 2019, and 2018, (iv) Consolidated Statements of Cash Flows for the Years Ended December 31, 2020, 2019, and 2018, (v) Consolidated Statements of Equity for the Years Ended December 31, 2020, 2019, and 2018, and (vi) Notes to Consolidated Financial Statements.
ITEM 16. Form 10-K Summary
Not Applicable.
SIGNATURES
Pursuant to the requirements of Section 13 or 15(d) of the Securities Exchange Act of 1934, the registrant has duly caused this report to be signed on its behalf by the undersigned, thereunto duly authorized.
| | | | | | | | | | | | | | |
| | | | |
| | DISCOVERY, INC. (Registrant) |
| | |
| Date: February 22, 2021 | | By: | | /s/ David M. Zaslav |
| | | | David M. Zaslav |
| | | | President and Chief Executive Officer |
Pursuant to the requirements of the Securities Exchange Act of 1934, this report has been signed below by the following persons on behalf of the registrant and in the capacities and on the date indicated.
| | | | | | | | | | | | | | |
| | | | |
| Signature | | Title | | Date |
| | |
| /s/ David M. Zaslav | | President and Chief Executive Officer, and Director (Principal Executive Officer) | | February 22, 2021 |
| David M. Zaslav | | | |
| | |
| /s/ Gunnar Wiedenfels | | Senior Executive Vice President and
Chief Financial Officer
(Principal Financial Officer) | | February 22, 2021 |
| Gunnar Wiedenfels | | | |
| | | | |
| /s/ Lori C. Locke | | Executive Vice President and Chief Accounting Officer
(Principal Accounting Officer) | | February 22, 2021 |
| Lori C. Locke | | | |
| | | | |
| /s/ Robert R. Beck | | Director | | February 22, 2021 |
| Robert R. Beck | | | | |
| | | | |
| /s/ Robert R. Bennett | | Director | | February 22, 2021 |
| Robert R. Bennett | | | | |
| | |
| /s/ Paul A. Gould | | Director | | February 22, 2021 |
| Paul A. Gould | | | | |
| | |
| /s/ Robert L. Johnson | | Director | | February 22, 2021 |
| Robert L. Johnson | | | | |
| | |
| /s/ Kenneth W. Lowe | | Director | | February 22, 2021 |
| Kenneth W. Lowe | | | | |
| | |
| /s/ John C. Malone | | Director | | February 22, 2021 |
| John C. Malone | | | | |
| | | | |
| /s/ Robert J. Miron | | Director | | February 22, 2021 |
| Robert J. Miron | | | | |
| | |
| /s/ Steven A. Miron | | Director | | February 22, 2021 |
| Steven A. Miron | | | | |
| | |
| /s/ Daniel E. Sanchez | | Director | | February 22, 2021 |
| Daniel E. Sanchez | | | | |
| | |
| /s/ Susan M. Swain | | Director | | February 22, 2021 |
| Susan M. Swain | | | | |
| | | | |
| /s/ J. David Wargo | | Director | | February 22, 2021 |
| J. David Wargo | | | | |