UNITED STATES SECURITIES AND EXCHANGE COMMISSION
Washington, D.C. 20549
FORM 6-K
REPORT OF FOREIGN PRIVATE ISSUER
PURSUANT TO RULE 13a-16 OR 15d-16 UNDER
THE SECURITIES EXCHANGE ACT OF 1934
For the month of May, 2023
Commission File Number: 001-38049
Azul S.A.
(Name of Registrant)
Edifício Jatobá, 8th floor, Castelo Branco Office Park
Avenida Marcos Penteado de Ulhôa Rodrigues, 939
Tamboré, Barueri, São Paulo, SP 06460-040, Brazil.
+55 (11) 4831 2880
(Address of Principal Executive Office)
Indicate by check mark whether the registrant files or will file annual reports under cover of Form 20-F or Form 40-F.
Form 20-F x Form 40-F ¨
Indicate by check mark if the registrant is submitting the Form 6-K in paper as permitted by Regulation S-T Rule 101(b)(1):
Yes ¨ No x
Indicate by check mark if the registrant is submitting the Form 6-K in paper as permitted by Regulation S-T Rule 101(b)(7):
Yes ¨ No x
 | First Quarter Results 2023 |
Azul Reports 74% Increase
In EBITDA
Driven by Strong Demand
São Paulo, May 15, 2023 – Azul S.A., “Azul” (B3:AZUL4, NYSE:AZUL), the largest airline in Brazil by number of cities and departures, announces today its results for the first quarter of 2023 (“1Q23”). The following financial information, unless stated otherwise, is presented in Brazilian reais and in accordance with International Financial Reporting Standards (IFRS).
Financial and Operating Highlights
§ In 1Q23, operating revenue reached once again an all-time record as travel demand remained robust. Total operating revenue reached R$4.5 billion, 40.3% higher than in 1Q22.
| § | PRASK and RASK were at record levels for a first quarter, up 23.1% and 17.7% respectively compared to 1Q22, even with a capacity increase of 19.1%. |
§ Yield also reached an all-time record for a first quarter at R$48.5 cents, an increase of 24.2% compared to 1Q22 and up 35.6% versus 1Q19.
| Highlights¹ | 1Q23 | 1Q22 | Change |
| Total operating revenue (R$ million) | 4,478.3 | 3,193.0 | 40.3% |
| Operating income (R$ million) | 462.4 | 70.7 | 391.8 |
| Operating margin (%) | 10.3% | 2.2% | +8.1 p.p. |
| EBITDA (R$ million) | 1,030.1 | 592.7 | 437.4 |
| EBITDA margin (%) | 23.0% | 18.6% | +4.4 p.p. |
| ASKs (million) | 10,799 | 9,064 | 19.1% |
| Average fare (R$) | 590.8 | 449.1 | 31.6% |
| RASK (R$ cents) | 41.47 | 35.23 | 17.7% |
| PRASK (R$ cents) | 38.61 | 31.37 | 23.1% |
| Yield (R$ cents) | 48.50 | 39.03 | 24.2% |
| CASK (R$ cents) | 37.19 | 34.45 | 8.0% |
| CASK ex-fuel (R$ cents) | 21.69 | 21.33 | 1.7% |
| Fuel cost per liter (R$) | 5.25 | 4.25 | 23.6% |
¹ Operating results and EBITDA were adjusted for non-recurring items. Please refer to page 10 for additional details.
| § | EBITDA was R$1,030.1 million in the quarter, representing a margin of 23.0%. EBITDA was up 73.8% compared to 1Q22, even with a 23.6% increase in fuel prices. Operating income was R$462.4 million in the quarter, representing a margin of 10.3%. |
| § | CASK in 1Q23 was 37.19 cents, up 8.0% compared to 1Q22, mainly due to the 23.6% increase in fuel prices. CASK ex-fuel increased only 1.7% mainly driven by our cost reduction initiatives and productivity gains. |
| § | As a result of these efficiency gains, productivity measured in ASKs per FTE increased 13.0%. Fuel consumption per ASK dropped 4.4% in 1Q23 versus 1Q22, as a result of the higher number of next-generation aircraft in our fleet. |
| § | Immediate liquidity ended the quarter at R$1.8 billion. Our operational cash inflows surpassed outflows by over R$1.4 billion, and we continued to deleverage with around R$1.0 billion in debt amortizations, current and COVID-related deferral lease payments, and R$765.5 million in supply chain financing repayment. |
| § | Gross debt decreased R$194.5
million in the quarter to R$21.6 billion. Excluding the impact of new aircraft entering the fleet, gross debt reduced R$378.3 million.
Azul’s leverage, measured as net debt to LTM EBITDA, decreased 0.5x in the quarter from 5.7x in 4Q22 to 5.2x in 1Q23. |
| 1 |
| | First Quarter Results 2023 |
Management Comments
I would like to start by thanking our incredible and passionate Crewmembers for their dedication and hard work during the first quarter of 2023. Again, we delivered an industry-leading operation and a world-class customer experience, all of this as a more efficient airline. For the quarter, our FTEs per aircraft decreased 3.8% versus 1Q22 even with a 19% increase in our ASKs. In addition, in March we were the most on-time airline in the world, following our recognition as “World’s Most On-Time Airline for 2022” from Cirium.
The first quarter of 2023 continued to demonstrate the strength of our business model. We once again achieved record revenues, at R$4.5 billion, 40% up versus 2022. RASK reached R$41.47 cents, an 18% increase from the same period in 2022. PRASK for the quarter increased 23% versus the same period last year, even with a 121% increase in our international capacity. Our EBITDA increased 74% year over year, reaching over R$1.0 billion, resulting in a margin of 23%, even with a 24% increase in fuel prices compared to 1Q22.
On the revenue side, we continue to see a healthy demand environment. While overall PRASK increased 23% versus 1Q22, our domestic PRASK increased an impressive 28%. Demand in the international markets continues very strong, highlighted by our new Paris service, which debuted on April 26th. Together with our recently doubled presence at Congonhas airport, our product offering has never been more relevant, allowing us to showcase to new customers our superior product, broad network, award-winning loyalty program, and unique travel and logistics offerings.
We also continued to efficiently manage our costs during the quarter. Compared to 1Q22, our unit cost ex-fuel was flat, mainly driven by efficiency initiatives and productivity gains implemented during the past few years. Productivity measured in ASKs per full-time employee increased 13% compared to the same period last year. Our call center today handles 25% more calls per crewmember than we did in 2019. Our airports are selling over 40% more in ancillary revenues with the same crewmember compared to 2019 – all of this while maintaining a market-leading Net Promoter Score around 60.
We ended the quarter with immediate liquidity of R$1.8 billion, while our total liquidity, including long-term investments and sublease receivables, security deposits, and maintenance reserves, reached R$5.2 billion. Our operational cash inflows surpassed outflows by over R$1.4 billion, a contribution margin of 29%, and we continued our deleveraging process with around R$1.0 billion in debt amortizations, current and COVID-related deferral lease payments, and R$766 million in supply chain financing repayment.
Our wholly-owned business units maintained their growth trends in 1Q23. TudoAzul, our loyalty program, saw nearly 50% growth in gross billings compared to 1Q22. Azul Viagens had an impressive quarter, growing over 40% in gross bookings versus 1Q22. Azul Cargo, our logistics business, grew 10% in the domestic market compared to the same period in 2022, maintaining its position as the largest air-logistics provider in Brazil with an impressive 33% market share. We also announced the launch of Azul TecOps, a business unit responsible for aircraft maintenance, repairs, and overhauls. This is another high-growth business which leverages Azul’s expertise, operational scale and fleet flexibility to offer high-quality technical services to external customers.
During the first months of 2023, we continued the implementation of our permanent restructuring plan to address the remaining effects from COVID-19 in our capital structure. We published today pro-forma estimates for our gross debt and annual lease payments reflecting commercial agreements with lessors and suppliers to restructure debt and lease payments, subject to certain conditions. We remain committed to this effort, which will make Azul’s financial position mirror our superior operational performance.
Looking ahead, we could not be more excited with the trends we are seeing in the demand environment combined with the steep fall in fuel prices. For example, as we look ahead, fuel prices in the back half of the year are currently 29% below the levels we saw in the first quarter. This, combined with our efficient cost structure, a disciplined capacity environment and our increased presence in Congonhas, lead us to be very optimistic for the rest of the year and beyond.
John Rodgerson, CEO of Azul S.A.
| 2 |
| | First Quarter Results 2023 |
Consolidated Financial Results
The following income statement and operating data should be read in conjunction with the quarterly results comments presented below.
| Income statement (R$ million)¹ | 1Q23 | 1Q22 | % Δ |
| Operating Revenue | |||
| Passenger revenue | 4,169.9 | 2,843.0 | 46.7% |
| Cargo revenue and other | 308.5 | 350.1 | -11.9% |
| Total operating revenue | 4,478.3 | 3,193.0 | 40.3% |
| Operating Expenses | |||
| Aircraft fuel | 1,673.4 | 1,189.0 | 40.7% |
| Salaries and benefits | 537.5 | 434.2 | 23.8% |
| Depreciation and amortization | 567.7 | 522.0 | 8.7% |
| Airport fees | 262.4 | 199.1 | 31.8% |
| Traffic and customer servicing | 195.6 | 133.0 | 47.1% |
| Sales and marketing | 174.0 | 126.9 | 37.2% |
| Maintenance and repairs | 157.9 | 147.2 | 7.3% |
| Other | 447.5 | 371.0 | 20.6% |
| Total Operating Expenses | 4,015.9 | 3,122.4 | 28.6% |
| Operating Result | 462.4 | 70.7 | 554.4% |
| Operating margin | 10.3% | 2.2% | +8.1 p.p. |
| EBITDA | 1,030.1 | 592.7 | 73.8% |
| EBITDA margin | 23.0% | 18.6% | +4.4 p.p. |
| Financial Result² | |||
| Financial income | 53.5 | 48.9 | 9.3% |
| Financial expenses | (1,195.7) | (969.1) | 23.4% |
| Derivative financial instruments, net | (193.9) | 209.9 | n.a. |
| Foreign currency exchange, net | 551.5 | 3,298.4 | -83.3% |
| Result Before Income Taxes² | (322.2) | 2,658.8 | n.a. |
| Income tax and social contribution | - | - | n.a. |
| Deferred income tax and social contribution | - | - | n.a. |
| Net Result² | (322.2) | 2,658.8 | n.a. |
| Net margin | -7.2% | 83.3% | n.a. |
| Adjusted Net Result³ | (727.6) | (808.4) | -10.0% |
| Adjusted net margin³ | -16.2% | -25.3% | +9.1 p.p. |
| Fully diluted shares⁴ | 424.2 | 406.0 | 4.5% |
| Diluted EPS | (0.76) | 6.55 | n.a. |
| Diluted EPS (US$) | (0.15) | 1.25 | n.a. |
| Diluted EPADR (US$) | (0.44) | 3.75 | n.a. |
| Adjusted EPS³ | (1.72) | (1.99) | -13.8% |
| Adjusted EPS³ (US$) | (0.33) | (0.38) | -13.2% |
| Adjusted EPADR (US$)³ | (0.99) | (1.14) | -13.2% |
¹ Operating results and EBITDA were adjusted for non-recurring items. Please refer to page 10 for additional details.
² Financial results adjusted for convertible debenture expenses.
³ Net result and EPS/EPADR adjusted for unrealized derivative results and foreign currency. One ADR equals three preferred shares (PNs).
4 Fully diluted shares adjusted for convertible debentures.
| 3 |
| | First Quarter Results 2023 |
| Operating Data¹ | 1Q23 | 1Q22 | % Δ |
| ASK (million) | 10,799 | 9,064 | 19.1% |
| Domestic | 8,505 | 8,024 | 6.0% |
| International | 2,294 | 1,040 | 120.7% |
| RPK (million) | 8,598 | 7,284 | 18.0% |
| Domestic | 6,703 | 6,442 | 4.1% |
| International | 1,895 | 842 | 125.1% |
| Load factor (%) | 79.6% | 80.4% | -0.7 p.p. |
| Domestic | 78.8% | 80.3% | -1.5 p.p. |
| International | 82.6% | 81.0% | +1.6 p.p. |
| Average fare (R$) | 590.8 | 449.1 | 31.6% |
| Passengers (thousands) | 7,058 | 6,331 | 11.5% |
| Block hours | 137,703 | 117,301 | 17.4% |
| Aircraft utilization (hours per day) | 9.7 | 8.5 | 13.6% |
| Departures | 78,739 | 67,981 | 15.8% |
| Average stage length (km) | 1,160 | 1,128 | 2.9% |
| End of period operating passenger aircraft | 182 | 166 | 9.6% |
| Fuel consumption (thousands of liters) | 318,462 | 279,613 | 13.9% |
| Fuel consumption per ASK | 29.5 | 30.8 | -4.4% |
| Full-time-equivalent employees | 13,651 | 12,944 | 5.5% |
| End of period FTE per aircraft | 75 | 78 | -3.8% |
| Yield (cents) | 48.50 | 39.03 | 24.2% |
| RASK (cents) | 41.47 | 35.23 | 17.7% |
| PRASK (cents) | 38.61 | 31.37 | 23.1% |
| CASK (cents) | 37.19 | 34.45 | 8.0% |
| CASK ex-fuel (cents) | 21.69 | 21.33 | 1.7% |
| Fuel cost per liter (R$) | 5.25 | 4.25 | 23.6% |
| Break-even load factor (%) | 71.4% | 78.6% | -7.2 p.p. |
| Average exchange rate (R$ per US$) | 5.20 | 5.23 | -0.7% |
| End of period exchange rate | 5.08 | 4.74 | 7.2% |
| Inflation (IPCA/LTM) | 5.96% | 11.30% | -5.3 p.p. |
| WTI (average per barrel, US$) | 77.20 | 95.01 | -18.7% |
| Heating oil (US$ per gallon) | 2.92 | 3.07 | -4.8% |
¹ Other operating expenses were adjusted for non-recurring items. Please refer to page 10 for additional details.
Operating Revenue
In 1Q23, Azul´s operating revenue reached once again an all-time record, totaling R$4.5 billion compared to R$3.2 billion in the same period last year, an increase of 40.3%.
Passenger revenue also reached an all-time record, increasing 46.7% on 19.1% higher capacity compared to the same period last year.
PRASK reached record levels for a first quarter, increasing 23.1% compared to 1Q22, enabled by our rational capacity deployment and the sustainable competitive advantages of our business model.
Total RASK also reached record levels for a first quarter, increasing 17.7% compared to 1Q22.
In 1Q23, domestic cargo revenue grew 9.7% year-over-year due to strong domestic demand for our logistics solutions and our exclusive network. Cargo revenue and other totaled R$308.5 million, 11.9% lower than 1Q22, as we redeployed widebody aircraft from dedicated cargo operations to passenger service to take advantage of the faster than expected recovery in international travel.
| 4 |
| | First Quarter Results 2023 |
| R$ cents¹ | 1Q23 | 1Q22 | % Δ |
| Operating revenue per ASK | |||
| Passenger revenue | 38.61 | 31.37 | 23.1% |
| Cargo revenue and other | 2.86 | 3.86 | -26.0% |
| Operating revenue (RASK) | 41.47 | 35.23 | 17.7% |
| Operating expenses per ASK¹ | |||
| Aircraft fuel | 15.50 | 13.12 | 18.1% |
| Salaries and benefits | 4.98 | 4.79 | 3.9% |
| Depreciation and amortization | 5.26 | 5.76 | -8.7% |
| Airport fees | 2.43 | 2.20 | 10.6% |
| Traffic and customer servicing | 1.81 | 1.47 | 23.5% |
| Sales and marketing | 1.61 | 1.40 | 15.1% |
| Maintenance and repairs | 1.46 | 1.62 | -10.0% |
| Other operating expenses | 4.14 | 4.09 | 1.2% |
| Total operating expenses (CASK) | 37.19 | 34.45 | 8.0% |
| Operating income per ASK (RASK/CASK) | 4.28 | 0.78 | 449.3% |
¹ Other operating expenses were adjusted for non-recurring items. Please refer to page 10 for additional details.
Operating Expenses
In 1Q23, we recorded operating expenses of R$4.0 billion compared to R$3.1 billion in 1Q22, representing an increase of 28.6% mainly driven by a 23.6% increase in fuel prices in addition to our capacity increase of 19.1%, partially offset by lower fuel burn, higher employee productivity and cost reduction initiatives.
The breakdown of our main operating expenses compared to 1Q22 is as follows:
| § | Aircraft fuel increased 40.7% to R$1,673.4 million, mostly due to a 23.6% increase in fuel price per liter and a 19.1% increase in total capacity, partially offset by the reduction in fuel burn as a result of our more efficient next-generation fleet. |
| § | Salaries and benefits increased 23.8% to R$537.5 million, driven by our capacity increase of 19.1% and a 7.9% union increase in salaries as a result of collective bargaining agreements with labor unions applicable to all airline employees in Brazil in 2022, partially offset by higher employee productivity. |
| § | Depreciation and amortization increased 8.7% or R$ 45.6 million, driven by the increase in the size of our fleet compared to 1Q22. |
§ Airport fees increased 31.8% or R$ 63.3 million, mostly due to the increase in capacity, especially the 120.7% increase in international capacity, which drives higher fees.
§ Traffic and customer servicing increased to R$195.6 million, primarily due to the resumption of Azul’s renowned onboard service after a two-year suspension due to the pandemic, a 15.8% increase in the number of departures, and the inflation in the period.
§ Sales and marketing increased 37.2% to R$174.0 million, mostly driven by the 46.7% growth in passenger revenue, leading to an increase in credit card fees and commissions, and the increase in international traffic, which generates higher distribution costs.
| § | Maintenance and repairs increased 7.3% or R$10.7 million compared to 1Q22. Maintenance and repairs per ASK decreased 10.0%, mostly due to savings from the insourcing of maintenance events and from the renegotiation of our engine maintenance agreements. |
| § | Other increased 20.6% or R$76.5 million, mainly due to the 19.1% increase in capacity and higher training expenses as we increased our operations over 1Q22, partially offset by a 44% reduction in our international cargo capacity, lower claims in the period, and the 0.7% average appreciation of the real against the dollar. On a per-ASK basis, other increased 1.2%. |
| 5 |
| | First Quarter Results 2023 |
Non-Operating Results
| Net financial results (R$ million)¹ | 1Q23 | 1Q22 | % Δ |
| Net financial expenses | (1,142.2) | (920.2) | 24.1% |
| Derivative financial instruments, net | (193.9) | 209.9 | n.a. |
| Foreign currency exchange, net | 551.5 | 3,298.4 | -83.3% |
| Net financial results | (784.6) | 2,588.1 | n.a. |
¹ Excludes convertible debentures expenses.
Net financial expenses were R$1,142.2 million in the quarter, mainly from the R$655.1 million interest expense on leases and R$146.3 million in interest on loans and financing in 1Q23.
Derivative financial instruments resulted in a net loss of R$193.9 million in 1Q23 mostly due to fuel hedge losses recorded during the period. As of March 31, 2023, Azul had hedged approximately 18% of its expected fuel consumption for the next twelve months by using forward contracts and options.
Foreign currency exchange, net registered a non-cash foreign currency gain of R$551.5 million in 1Q23 due to the 2.6% end of period appreciation of the Brazilian real against the US dollar in the quarter, resulting in a decrease in lease liabilities and loans denominated in foreign currency.
Liquidity and Financing
The information below does not reflect the expected impact of commercial agreements with lessors and suppliers to restructure debt and lease payments, subject to certain conditions. Please refer to the material fact released today for additional details.
Azul ended the quarter with R$1.8 billion in immediate liquidity, including cash and cash equivalents, short-term receivables, and short-term investments, R$743.3 million lower than 4Q22, mainly due to the repayment of R$765.5 million in supply chain financing and around R$1.0 billion payment in leases, loans, COVID-related deferral repayments and interest. This immediate liquidity represented 10.4% of our LTM revenue.
Total liquidity including long-term investments and receivables, security deposits, and maintenance reserves, was R$5.2 billion as of March 31, 2023. Recently, an independent firm appraised our TudoAzul, Azul Cargo and Azul Viagens business units and our brands at more than R$25 billion.
| Liquidity (R$ million) | 1Q23 | 4Q22 | % Δ |
| Cash, cash equivalents and short-term investments | 466.4 | 668.3 | -30.2% |
| Accounts receivable and sublease receivables | 1,332.9 | 1,874.2 | -28.9% |
| Immediate liquidity | 1,799.2 | 2,542.5 | -29.2% |
| Cash as % of LTM revenue | 10.4% | 15.9% | -5.5 p.p. |
| Long-term investments and sublease receivables | 843.7 | 838.9 | 0.6% |
| Security deposits and maintenance reserves | 2,563.7 | 2,539.6 | 1.0% |
| Total Liquidity | 5,206.6 | 5,921.0 | -12.1% |
| 6 |
| | First Quarter Results 2023 |
Azul’s debt amortization schedule as of March 31, 2023 is set out below. The chart converts our dollar-denominated debt to reais using the quarter-end foreign exchange rate of R$5.08.
Loans and financial debt amortization as
of March 31, 2023
(R$ million converted at 5.08 reais per dollar)¹
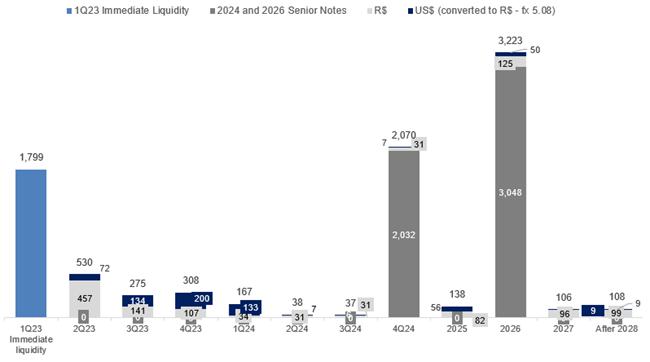
¹ Excludes convertible debentures.
Gross debt decreased R$194.5 million to R$21.6 billion in the quarter, mostly due to our continued deleveraging process with R$958.6 million in payments of loans and leases during the quarter, and by the 2.6%end of period appreciation of the Brazilian real, partially offset by the addition of R$183.7 million in lease liabilities related to new aircraft entering our fleet. Excluding the impact of the new aircraft entering in the fleet, gross debt reduced by R$378.3 million.
| Loans and financing (R$ million)¹ million)restructuring, R$ million)¹ | 1Q23 | 4Q22 | % Δ | 1Q22 | % Δ |
| Operating lease liabilities | 13,765.5 | 13,771.3 | 0.0% | 11,804.8 | 16.6% |
| Finance lease liabilities | 734.6 | 811.5 | -9.5% | 903.1 | -18.7% |
| Other aircraft loans and financing | 793.8 | 792.2 | 0.2% | 1,026.0 | -22.6% |
| Loans and financing | 6,327.1 | 6,440.5 | -1.8% | 6,339.6 | -0.2% |
| % of non-aircraft debt in local currency | 19% | 19% | -0.7 p.p. | 25% | -5.9 p.p. |
| % of total debt in local currency | 6% | 6% | -0.2 p.p. | 8% | -2.6 p.p. |
| Gross debt | 21,621.0 | 21,815.5 | -0.9% | 20,073.6 | 7.7% |
¹ Considers the effect of hedges on debt. Excludes convertible debentures.
As of March 31, 2023, Azul’s average debt maturity excluding lease liabilities and convertible debentures was 2.0 years, with an average interest rate of 8.2%. Average interest rate on local and dollar-denominated obligations were equivalent to CDI + 5% and 6.5%, respectively.
| 7 |
| | First Quarter Results 2023 |
The table below presents additional information related to our leases and includes both current and COVID-related deferral lease payments.
| Lease payments (R$ million) | 1Q23 | 4Q22 | % Δ | 1Q22 | % Δ |
| Operating leases | |||||
| Payments made | 471.4 | 868.3 | -45.7% | 939.7 | -49.8% |
| Weighted average remaining lease term | 7.3 | 7.4 | -0.5% | 7.8 | -6.2% |
| Finance leases | |||||
| Payments made | 52.7 | 43.9 | 20.0% | 60.6 | -13.1% |
| Weighted average remaining lease term | 5.5 | 5.5 | 0.0% | 5.5 | 0.3% |
Azul’s leverage ratio measured as net debt to LTM EBITDA decreased 2.6x year-over-year, from 7.8x to 5.2x. We are confident in our ability to continue reducing leverage organically, a process that should be accelerated by our permanent restructuring plan.
| Key financial ratios (R$ million) | 1Q23 | 4Q22 | % Δ | 1Q22 | % Δ |
| Cash¹ | 2,642.9 | 3,381.4 | -21.8% | 4,134.5 | -36.1% |
| Gross debt² | 21,621.0 | 21,815.5 | -0.9% | 20,073.6 | 7.7% |
| Net debt | 18,978.1 | 18,434.1 | 3.0% | 15,939.1 | 19.1% |
| Net debt / EBITDA³ (LTM) | 5.2x | 5.7x | 0.5x | 7.8x | -2.6x |
¹ Includes cash, cash equivalents, receivables, short and long-term investments.
² Excludes convertible debentures.
³ EBITDA was adjusted for non-recurring items.
Fleet and Capital Expenditures
As of March 31, 2023, Azul had a passenger operating fleet of 182 aircraft and a passenger contractual fleet of 194 aircraft, with an average aircraft age of 7.2 years excluding Cessna aircraft. At the end of 1Q23, the 12 aircraft not included in our operating passenger fleet consisted of 4 ATRs subleased to TAP, 3 Embraer E1s subleased to Breeze, 2 Embraer E1s and 3 Airbus A330ceo in the processing of exiting the fleet.
Azul ended 1Q23 with approximately 76% of its capacity coming from next-generation aircraft, far higher than any competitor in the region.
| Passenger Contractual Fleet¹ | 1Q23 | 4Q22 | % Δ | 1Q22 | % Δ |
| Airbus widebody | 14 | 14 | - | 12 | 16.7% |
| Airbus narrowbody | 53 | 52 | 1.9% | 49 | 8.2% |
| Embraer E2 | 15 | 14 | 7.1% | 9 | 66.7% |
| Embraer E1 | 47 | 49 | -4.1% | 50 | -6.0% |
| ATR | 41 | 41 | - | 39 | 5.1% |
| Cessna | 24 | 24 | - | 19 | 26.3% |
| Total¹ | 194 | 194 | - | 178 | 9.0% |
| Aircraft under operating leases | 168 | 168 | - | 152 | 10.5% |
¹ Includes 7 subleased aircraft.
| Passenger Operating Fleet | 1Q23 | 4Q22 | % Δ | 1Q22 | % Δ |
| Airbus widebody | 11 | 11 | - | 11 | - |
| Airbus narrowbody | 53 | 51 | 3.9% | 49 | 8.2% |
| Embraer E2 | 15 | 13 | 15.4% | 9 | 66.7% |
| Embraer E1 | 42 | 43 | -2.3% | 45 | -6.7% |
| ATR | 37 | 37 | - | 33 | 12.1% |
| Cessna | 24 | 22 | 9.1% | 19 | 26.3% |
| Total | 182 | 177 | 2.8% | 166 | 9.6% |
| 8 |
| | First Quarter Results 2023 |
Capex
Capital expenditures totaled R$81.8 million in 1Q23, mostly due to the capitalization of engine overhaul events and the acquisition of spare parts in the quarter.
| (R$ million) | 1Q23 | 4Q22 | % Δ |
| Aircraft and maintenance and checks | 35.9 | 334.8 | -89.3% |
| Intangible assets | 40.2 | 65.0 | -38.2% |
| Other | 5.7 | 27.0 | -78.9% |
| CAPEX | 81.8 | 426.9 | -80.8% |
Environmental, Social and Governance (“ESG”) Responsibility
The table below presents Azul’s key ESG information according to the Sustainability Accounting Standards Board (SASB) standard for the airline industry:
| ESG Key Indicators | 1Q23 | 4Q22 | % Δ |
| Environmental | |||
| Fuel | |||
| Total fuel consumed per ASK (GJ / ASK) | 1,108 | 1,134 | -2% |
| Total fuel consumed (GJ x 1000) | 11,963 | 11,823 | 1% |
| Fleet | |||
| Average age of operating fleet¹ | 7.2 | 7.1 | 1% |
| Social | |||
| Labor Relations | |||
| Employee gender: male | 59.9% | 59.4% | 0.5 p.p. |
| Employee gender: female | 40.1% | 40.6% | -0.5 p.p. |
| Employee monthly turnover | 0.9% | 0.9% | - |
| % of employee covered under collective bargaining agreements | 100% | 100% | - |
| Volunteers | 4,722 | 4,324 | 9% |
| Governance | |||
| Management | |||
| Independent directors | 91% | 91% | - |
| Percent of Board members that are women | 18% | 18% | - |
| Board of Directors' average age | 59 | 58 | 0.4% |
| Director meeting attendance | 97% | 96% | 1 p.p. |
| Board size | 11 | 11 | - |
| Participation of women in leadership positions | 40% | 40% | - |
¹ Excludes Cessna aircraft
| 9 |
| | First Quarter Results 2023 |
Non-Recurring Items Reconciliation
Our results include the impacts of charges that we deem non-recurring items and should not be considered to compare to prior periods as well as future periods.
In 1Q23, our operating results presented in this release have been adjusted for non-recurring items totaling a net loss of R$294.4 million, mainly due to the fleet adjustments related to our permanent restructuring plan, in addition to advisors fees and other related expenses, and a one-time adjustment related to an engine maintenance agreement terminated in 1Q23 and expected to be replaced before year-end, when this amount should be reversed.
The table below provides a reconciliation of our reported amounts to the adjusted amounts excluding non-recurrent items:
| 1Q23 Non-recurring adjustments | As recorded | Adjustments | Adjusted |
| Operating revenue | 4,478.3 | - | 4,478.3 |
| Operating expense | 4,310.3 | (294.4) | 4,015.9 |
| Other expense | 741.9 | (294.4) | 447.5 |
| Operating income | 168.0 | 294.4 | 462.4 |
| Operating Margin | 3.8% | +6.6 p.p. | 10.3% |
| EBITDA | 735.7 | 294.4 | 1,030.1 |
| EBITDA Margin | 16.4% | +6.6 p.p. | 23.0% |
| 10 |
| | First Quarter Results 2023 |
Forward Outlook
In 2023 we expect our capacity to grow approximately 14% vs. 2022, and combined with the continued revenue growth, our cost-cutting initiatives, and a rational competitive environment, we remain confident of an expected EBITDA for 2023 of around R$5.5 billion excluding non-recurring items.
| Forward Outlook | |
| 2023 Total ASK vs. 2022 | ~14% |
| 2023 EBITDA¹ | ~R$5.5 billion |
| 2023 Leverage² | ~3.5x |
| 2024 Leverage² | ~3.0x |
¹ Excludes non-recurring items.
² Includes cash and cash equivalents, short-term and long-term investments, and receivables. Excludes convertible debentures.
| 11 |
| | First Quarter Results 2023 |
Conference Call Details
Monday, May 15, 2023
11:00 a.m. (EDT) | 12:00 p.m. (Brasília time)
USA: +1 253 215-8782
Brazil: +55 11 4632-2236 or +55 21 3958-7888
Code: 891 8192 2198
Webcast: https://ri.voeazul.com.br/en/
About Azul
Azul S.A. (B3: AZUL4, NYSE: AZUL), the largest airline in Brazil by number of flight departures and cities served, offers 1,000 daily flights to over 150 destinations. With an operating fleet of over 170 aircraft and more than 14,000 Crewmembers, the Company has a network of 300 non-stop routes as of March 2023. Azul was named by Cirium (leading aviation data analysis company) as the most on-time airline in the world in 2022, being the first Brazilian airline to obtain this honor. In 2020 Azul was awarded best airline in the world by TripAdvisor, first time a Brazilian Flag Carrier earns number one ranking in the Traveler’s Choice Awards. For more information visit www.voeazul.com.br/ir.
Contact:
Investor Relations Tel: +55 11 4831 2880 invest@voeazul.com.br |
Media Relations Tel: +55 11 4831 1245 imprensa@voeazul.com.br |
| 12 |
| | First Quarter Results 2023 |
Balance Sheet – IFRS
| (R$ million) | March 31, 2023 | December 31, 2022 | March 31, 2022 |
| Assets | 17,402.2 | 18,721.3 | 17,785.6 |
| Current assets | 3,949.7 | 4,871.9 | 5,030.2 |
| Cash and cash equivalents | 466.4 | 668.3 | 1,857.8 |
| Short-term investments | - | - | 1.5 |
| Accounts receivable | 1,267.1 | 1,804.0 | 1,329.4 |
| Sublease receivables | 65.8 | 70.2 | 69.6 |
| Inventories | 718.9 | 721.7 | 601.8 |
| Security deposits and maintenance reserves | 941.0 | 1,025.2 | 315.1 |
| Taxes recoverable | 234.7 | 234.9 | 152.6 |
| Derivative financial instruments | 21.2 | 36.1 | 261.1 |
| Prepaid expenses | 150.2 | 182.9 | 226.5 |
| Other current assets | 84.5 | 128.7 | 214.8 |
| Non-current assets | 13,452.5 | 13,849.4 | 12,755.4 |
| Long-term investments | 753.8 | 733.0 | 722.1 |
| Sublease receivables | 89.9 | 105.9 | 154.1 |
| Security deposits and maintenance reserves | 1,622.8 | 1,514.4 | 1,561.9 |
| Derivative financial instruments | - | 235.9 | 227.4 |
| Prepaid expenses | 194.0 | 319.0 | 358.3 |
| Other non-current assets | 8.8 | 9.0 | 126.3 |
| Right of use assets – leased aircraft and other assets | 6,629.6 | 6,773.4 | 5,635.8 |
| Right of use assets – maintenance of leased aircraft | 764.5 | 779.2 | 605.5 |
| Property and equipment | 1,925.5 | 1,953.1 | 1,991.1 |
| Intangible assets | 1,463.7 | 1,426.5 | 1,372.9 |
| Liabilities and equity | 17,402.2 | 18,721.3 | 17,785.6 |
| Current liabilities | 15,884.4 | 15,056.1 | 11,796.1 |
| Loans and financing | 1,441.8 | 1,127.7 | 1,510.2 |
| Leases | 4,578.7 | 4,025.9 | 3,010.4 |
| Accounts payable | 2,715.7 | 2,432.8 | 1,561.6 |
| Factoring | - | 753.4 | 165.5 |
| Air traffic liability | 4,091.9 | 4,140.0 | 3,048.0 |
| Salaries and benefits | 491.7 | 479.4 | 478.9 |
| Insurance payable | 62.8 | 85.0 | 44.5 |
| Taxes payable | 135.4 | 193.6 | 88.9 |
| Derivative financial instruments | 139.9 | 69.4 | 66.0 |
| Provisions | 1,079.1 | 834.3 | 970.1 |
| Airport fees | 1,033.7 | 831.9 | 615.7 |
| Other | 113.7 | 82.7 | 236.3 |
| Non-current liabilities | 21,244.5 | 22,672.7 | 21,628.3 |
| Loans and financing | 7,202.8 | 7,508.7 | 7,499.7 |
| Leases | 9,921.4 | 10,556.9 | 9,697.5 |
| Accounts payable | 403.2 | 517.0 | 540.8 |
| Derivative financial instruments | - | 175.2 | 186.9 |
| Provision | 2,140.4 | 2,408.7 | 2,112.5 |
| Airport fees | 504.9 | 502.9 | 477.4 |
| Other non-current liabilities | 1,071.8 | 1,003.4 | 1,113.5 |
| Equity | (19,726.8) | (19,007.5) | (15,638.8) |
| Issued capital | 2,314.0 | 2,313.9 | 2,291.0 |
| Advance for future capital increase | - | 0.1 | 22.9 |
| Capital reserve | 1,990.4 | 1,970.1 | 1,950.8 |
| Treasury shares | (13.1) | (10.2) | (12.0) |
| Accumulated other comprehensive result | 5.3 | 5.3 | 5.8 |
| Accumulated losses | (24,023.3) | (23,286.7) | (19,897.3) |
| 13 |
| | First Quarter Results 2023 |
Cash Flow Statement – IFRS
| (R$ million) | 1Q23 | 1Q22 | % Δ |
| Cash flows from operating activities | |||
| Net profit (loss) for the period | (736.6) | 2,667.0 | n.a. |
| Total non-cash adjustments | |||
| Depreciation and amortization | 567.7 | 522.0 | 8.7% |
| Unrealized derivatives | 275.0 | (306.0) | n.a. |
| Exchange gain and (losses) in foreign currency | (583.3) | (3,424.6) | -83.0% |
| Interest on assets and liabilities, net | 975.9 | 905.9 | 7.7% |
| Provisions | 97.7 | 80.3 | 21.6% |
| Result of lease agreements modification | (22.4) | (0.8) | 2646.4% |
| Other | 214.7 | 15.4 | 1294.8% |
| Changes in operating assets and liabilities | |||
| Trade and other receivables | 439.3 | (361.3) | n.a. |
| Sublease receivables | 11.2 | 15.0 | -25.0% |
| Security deposits and maintenance reserves | 9.4 | (75.2) | n.a. |
| Prepaid expenses | (45.4) | (58.5) | -22.4% |
| Other assets | (497.2) | 0.5 | n.a. |
| Derivatives | (47.8) | 41.1 | n.a. |
| Accounts payable | 349.4 | 253.0 | 38.1% |
| Salaries and benefits | 53.8 | 15.5 | 247.7% |
| Air traffic liability | (93.7) | (93.0) | 0.8% |
| Contingencies | (49.9) | (37.4) | 33.3% |
| Other liabilities | 246.5 | (183.2) | n.a. |
| Interest paid | (120.9) | (213.7) | -43.4% |
| Net cash generated (used) by operating activities | 1,043.1 | (237.9) | n.a. |
| Cash flows from investing activities | |||
| Acquisition of intangible | (40.2) | (42.8) | -6.0% |
| Acquisition of property and equipment | (41.6) | (184.2) | -77.4% |
| Net cash generated (used) in investing activities | (81.8) | (227.0) | -64.0% |
| Cash flows from financing activities | |||
| Loans and financing | |||
| Proceeds | 302.3 | 200.0 | 51.1% |
| Repayment | (327.1) | (83.1) | 293.7% |
| Lease repayment | (407.7) | (820.5) | -50.3% |
| Factoring | (727.4) | - | n.a. |
| Treasury shares | (2.9) | (0.0) | 7102.5% |
| Net cash generated (used) in financing activities | (1,162.8) | (703.6) | 65.3% |
| Exchange gain (loss) on cash and cash equivalents | (0.6) | (47.5) | -98.8% |
| Net decrease in cash and cash equivalents | (202.0) | (1,216.0) | -83.4% |
| Cash and cash equivalents at the beginning of the period | 668.3 | 3,073.8 | -78.3% |
| Cash and cash equivalents at the end of the period | 466.4 | 1,857.8 | -74.9% |
| 14 |
| | First Quarter Results 2023 |
Glossary
Aircraft
Utilization
Average number of block hours per day per aircraft operated.
Available Seat Kilometers (ASK)
Number of aircraft seats multiplied by the number of kilometers flown.
Completion Factor
Percentage of accomplished flights.
Cost per ASK (CASK)
Operating expenses divided by available seat kilometers.
Cost per ASK ex-fuel (CASK ex-fuel)
Operating expenses divided by available seat kilometers excluding fuel expenses.
EBITDA
Earnings before interest, taxes, depreciation, and amortization, adjusted to exclude non-recurring items.
FTE (Full-Time Equivalent)
Equivalent number of employees assuming all work full-time.
Immediate Liquidity
Cash, cash equivalents, short-term investments and receivables
Load Factor
Number of passengers as a percentage of number of seats flown (calculated by dividing RPK by ASK).
LTM
Last twelve months ended on the last day of the quarter presented.
Revenue Passenger Kilometers (RPK)
One-fare paying passenger transported one kilometer. RPK is calculated by multiplying the number of revenue passengers by the number of kilometers flown.
Passenger Revenue per Available Seat Kilometer (PRASK)
Passenger revenue divided by available seat kilometers (also equal to load factor multiplied by yield).
Revenue per ASK (RASK)
Operating revenue divided by available seat kilometers.
Stage Length
The average number of kilometers flown per flight.
Trip Cost
Average cost of each flight calculated by dividing total operating expenses by total number of departures.
Yield
Average amount paid per passenger to fly one kilometer. Usually, yield is calculated as average revenue per revenue passenger kilometer, or cents per RPK.
| 15 |
| | First Quarter Results 2023 |
This press release includes estimates and forward-looking statements within the meaning of the U.S. federal securities laws. These estimates and forward-looking statements are based mainly on our current expectations and estimates of future events and trends that affect or may affect our business, financial condition, results of operations, cash flow, liquidity, prospects and the trading price of our preferred shares, including in the form of ADSs. Although we believe that these estimates and forward-looking statements are based upon reasonable assumptions, they are subject to many significant risks, uncertainties and assumptions and are made in light of information currently available to us. In addition, in this release, the words “may,” “will,” “estimate,” “anticipate,” “intend,” “expect,” “should” and similar words are intended to identify forward-looking statements. You should not place undue reliance on such statements, which speak only as of the date they were made. Azul is not under the obligation to update publicly or to revise any forward-looking statements after we distribute this press release because of new information, future events or other factors. Our independent public auditors have neither examined nor compiled the forward-looking statements and, accordingly, do not provide any assurance with respect to such statements. In light of the risks and uncertainties described above, the future events and circumstances discussed in this release might not occur and are not guarantees of future performance. Because of these uncertainties, you should not make any investment decision based upon these estimates and forward-looking statements.
In this press release, we present EBITDA and EBITDA margin, which are non-IFRS performance measures and are not financial performance measures determined in accordance with IFRS and should not be considered in isolation or as alternatives to operating income or net income or loss, or as indications of operating performance, or as alternatives to operating cash flows, or as indicators of liquidity, or as the basis for the distribution of dividends. Accordingly, you are cautioned not to place undue reliance on this information.
| 16 |
SIGNATURES
Pursuant to the requirements of the Securities Exchange Act of 1934, the registrant has duly caused this report to be signed on its behalf by the undersigned, thereunto duly authorized.
Date: May 15, 2023
Azul S.A.
By: /s/ Alexandre Wagner Malfitani
Name: Alexandre Wagner Malfitani
Title: Chief Financial Officer