UNITED STATES SECURITIES AND EXCHANGE COMMISSION
Washington, D.C. 20549
FORM 6-K
REPORT OF FOREIGN PRIVATE ISSUER
PURSUANT TO RULE 13a-16 OR 15d-16 UNDER
THE SECURITIES EXCHANGE ACT OF 1934
For the month of March, 2021
Commission File Number: 001-38049
Azul S.A.
(Name of Registrant)
Edifício Jatobá, 8th floor, Castelo Branco Office Park
Avenida Marcos Penteado de Ulhôa Rodrigues, 939
Tamboré, Barueri, São Paulo, SP 06460-040, Brazil.
+55 (11) 4831 2880
(Address of Principal Executive Office)
Indicate by check mark whether the registrant files or will file annual reports under cover of Form 20-F or Form 40-F.
Form 20-F x Form 40-F ¨
Indicate by check mark if the registrant is submitting the Form 6-K in paper as permitted by Regulation S-T Rule 101(b)(1):
Yes ¨ No x
Indicate by check mark if the registrant is submitting the Form 6-K in paper as permitted by Regulation S-T Rule 101(b)(7):
Yes ¨ No x
 | Fourth Quarter Results 2020 |
Azul Reports 4Q20 Operating Revenue up 121.5% from 3Q20 and Adjusted EBITDA margin of 10.8%
São Paulo, March 4th, 2021 – Azul S.A., “Azul” (B3:AZUL4, NYSE:AZUL), the largest airline in Brazil by number of cities and departures, announces today its results for the fourth quarter of 2020 (“4Q20”) and for the full year 2020. The following financial information, unless stated otherwise, is presented in Brazilian reais and in accordance with International Financial Reporting Standards (IFRS).
Financial and Operating Highlights
| § | Domestic demand recovery in Brazil continues to be one of the fastest in the world. Azul’s December domestic capacity was 91% of the same period last year, while first quarter 2021 capacity is expected to be above the same period in 2019. |
| 4Q20 | 3Q20 | % ∆ | |
| Adjusted Operating revenues (R$ million)¹ | 1,783.7 | 805.3 | 121.5% |
| Operating expenses (R$ million)¹ | (1,926.8) | (1,477.1) | 30.4% |
| Adjusted EBITDA (R$ million)¹ | 192.9 | (258.0) | n.a. |
| Adjusted EBITDA margin¹ | 10.8% | -32.0% | n.a. |
| ASKs (million) | 6,451.0 | 3,240.1 | 99.1% |
| RPKs (million) | 5,210.5 | 2,539.8 | 105.2% |
| Load factor (%) | 80.8% | 78.4% | +2.4 p.p. |
| Average fare | 307.0 | 262.4 | 17.0% |
| PRASK (Cents) | 23.7 | 19.3 | 22.9% |
| RASK (R$ cents) | 27.6 | 24.9 | 11.2% |
| CASK (cents) | 29.9 | 45.6 | -34.5% |
¹ Adjusted for non-recurring items.
| § | Operating revenue totaled R$1.8 billion in 4Q20, up from R$805.3 million in 3Q20, representing an increase of 121.5% quarter over quarter. |
| § | Operating expenses excluding non-recurring items increased 30.4% quarter over quarter, to R$ 1.9 billion, driven by the capacity ramp-up. |
| § | We generated an adjusted EBITDA profit of R$192.9 million (10.8% margin), compared to a loss of R$258.0 million in 3Q20 (-32.0% margin). |
| § | RPKs increased 105.2% compared to 3Q20 as a consequence of the improved demand environment during the quarter. |
| § | Load factor in 4Q20 reached 80.8% compared to 78.4% in 3Q20, an increase of 2.4 p.p., resulting from the demand recovery and optimal deployment of our flexible fleet. |
| § | RASK and PRASK increased 11.2% and 22.9% respectively, in 4Q20 compared to 3Q20, even with a 99% growth in capacity. |
| § | CASK decreased 34.5% in 4Q20 compared to 3Q20. |
| § | At the end of 4Q20, Azul achieved its highest liquidity position in history. Immediate liquidity, including cash and equivalents, short-term investments and accounts receivables, increased to R$4.0 billion, surpassing our previous target of R$3.9 billion. |
| § | Total liquidity, including long-term investments, unencumbered assets, maintenance reserves and deposits, reached R$7.9 billion. |
| § | Azul Cargo Express recorded 38.4% growth in net revenue quarter over quarter. Compared to 4Q19, revenue increased 64% driven by the broad expansion in all segments of the cargo market, especially e-commerce. |
| 1 |
| | Fourth Quarter Results 2020 |
Management Comments
As always, I would like to start by thanking our crewmembers for their outstanding work and dedication during a very challenging 2020. Thanks to their incredible effort, sacrifice and support, we were able to end the year in a significantly stronger position than we could have imagined when the crisis began.
The Azul management plan was the principal tool that enabled us to actively manage our capacity, reduce fixed costs and engage all stakeholders to increase our liquidity through the year. As a result, I am proud to report that we ended December with cash (cash equivalents, short-term investments and accounts receivables) of over R$4 billion, the highest balance since we founded Azul twelve years ago. This represents a robust platform from which we can now turn our attention to the future.
On the demand and capacity side, we made significant progress during the quarter. Our diversified fleet combined with our unique network advantages resulted in one of the fastest recoveries of any airline in the world. We ended the year with more than 90% of our domestic capacity recovered, while remaining true to our network strategy by being the only carrier in 80% of the routes we fly. As of March 2021, Azul is operating in 117 destinations, an impressive addition of 92 cities served in ten months.
Even more remarkable is that while rebuilding our network at this rapid pace, we saw a strong PRASK increase of 23% in the fourth quarter compared to the previous one, which is further evidence of the demand recovery and the sustainable competitive advantages of our business.
Our logistics business Azul Cargo Express continued to set revenue records. In the fourth quarter, revenues increased 64% compared to the same period last year. I am more proud of the contribution Azul has made in supporting Brazil in its COVID response. To-date we have transported more than 4 million vaccine doses and delivered more than 100 tons in medical equipment (oxygen cylinders, respirators, stretchers and hospital supplies) to critical areas all across the country.
Azul begins 2021 in a strong position, but we are also cognizant of the continuing uncertainty, and therefore we must maintain strong discipline in capacity, costs and cash. Brazil has begun its vaccination efforts with more than 7.6 million doses already applied, but there is still a long way to go. While COVID continues to impact lives all over Brazil, we have seen evidence from other countries that once the vaccine effect takes hold, the health situation improves quickly. As a result, we are optimistic that a similar recovery is ahead of us in the months to come.
One year ago today, we had R$2.2 billion in cash, no vaccines on the horizon and we were flying only 70 flights a day. One year later, we have R$4 billion in cash, 220 million vaccines arriving in the next four months and more than 700 flights a day. We have some challenges ahead, but we certainly feel confident in our competitive position.
At Azul, we are proud of what we have created and are excited about the future. Our crewmembers are more passionate than ever, and we are confident we will emerge stronger from this crisis, and will continue to build and grow the best airline in the world.
John Rodgerson, CEO of Azul S.A.
| 2 |
| | Fourth Quarter Results 2020 |
Consolidated Financial Results
The following revised income statement and operating data should be read in conjunction with the quarterly results comments presented below.
| Income statement (R$ million)¹ | 4Q20 | 4Q19 | % ∆ | 2020 | 2019 | % ∆ |
| OPERATING REVENUES | ||||||
| Passenger | 1,528.3 | 3,098.0 | -50.7% | 5,088.7 | 10,907.9 | -53.3% |
| Cargo and other revenues | 255.4 | 153.9 | 65.9% | 704.5 | 534.4 | 31.8% |
| Total operating revenues | 1,783.7 | 3,251.9 | -45.1% | 5,793.3 | 11,442.3 | -49.4% |
| OPERATING EXPENSES | ||||||
| Aircraft fuel | 451.0 | 831.5 | -45.8% | 1,508.8 | 3,085.6 | -51.1% |
| Salaries, wages and benefits | 419.0 | 502.2 | -16.6% | 1,426.6 | 1,868.4 | -23.6% |
| Depreciation and amortization | 336.0 | 446.8 | -24.8% | 1,726.4 | 1,591.4 | 8.5% |
| Landing fees | 146.2 | 194.4 | -24.8% | 465.6 | 725.0 | -35.8% |
| Traffic and customer servicing | 79.3 | 129.1 | -38.6% | 288.3 | 476.5 | -39.5% |
| Sales and marketing | 103.8 | 123.3 | -15.8% | 329.8 | 444.1 | -25.7% |
| Maintenance materials and repairs | 119.3 | 70.1 | 70.0% | 449.8 | 281.6 | 59.7% |
| Other operating revenue / expenses | 272.2 | 171.7 | 58.6% | 1,059.6 | 938.4 | 12.9% |
| Total operating expenses | 1,926.8 | 2,469.1 | -22.0% | 7,254.9 | 9,410.9 | -22.9% |
| Operating income (loss) | (143.2) | 782.8 | n.a. | (1,461.6) | 2,031.4 | n.a. |
| Operating Margin | -8.0% | 24.1% | n.a. | -25.2% | 17.8% | n.a. |
| EBITDA | 192.9 | 1,229.6 | -84.3% | 264.8 | 3,622.8 | -92.7% |
| EBITDA margin | 10.8% | 37.8% | -27.0 p.p. | 4.6% | 31.7% | -27.1 p.p. |
| FINANCIAL RESULT² | ||||||
| Financial income | 14.4 | 13.0 | 10.4% | 60.3 | 72.1 | -16.3% |
| Financial expenses | (852.8) | (409.8) | 108.1% | (2,470.0) | (1,329.5) | 85.8% |
| Derivative financial instruments | 25.9 | 21.8 | 19.0% | (1,452.1) | 325.5 | n.a. |
| Foreign currency exchange, net | 1,431.3 | 436.0 | 228.2% | (4,384.9) | (391.9) | 1018.9% |
| Result from related party transactions, net | 62.6 | 9.2 | 580.6% | (713.8) | (17.0) | 4109.4% |
| Income (loss) before income taxes² | 538.2 | 853.1 | -36.9% | (10,422.2) | 690.6 | n.a. |
| Income (loss) tax and social contribution | 5.2 | (0.3) | n.a. | (0.0) | (2.2) | -99.5% |
| Deferred income tax | - | 20.0 | n.a. | 242.5 | 135.4 | 79.1% |
| Net income (loss)² | 543.4 | 872.8 | -37.7% | (10,179.7) | 823.7 | n.a. |
| Net margin | 30.5% | 26.8% | +3.6 p.p. | -175.7% | 7.2% | n.a. |
| Adjusted net income (loss)³ | (918.2) | 411.2 | n.a. | (4,601.9) | 845.5 | n.a. |
| Adjusted net margin³ | -51.5% | 12.6% | n.a. | -79.4% | 7.4% | n.a. |
| Weighted avg. of PN equivalent shares | 342.3 | 341.9 | 0.1% | 342.2 | 341.0 | 0.4% |
| Adjusted EPS³ | (2.68) | 1.20 | n.a. | (13.45) | 2.48 | n.a. |
| Adjusted EPADR³ | (1.49) | 0.87 | n.a. | (7.83) | 1.85 | n.a. |
¹ Adjusted for non-recurring items totaling R$143.2 in the 4Q20, R$62.5 million gain in 2020 and R$3.2 billion loss in 4Q19 and 2019. For more information, see page 12.
² Financial results adjusted for convertible debentures expenses.
³ EPS and EPADR adjusted for unrealized derivatives results, foreign currency exchange. One ADR equals three preferred shares (PNs).
| 3 |
| | Fourth Quarter Results 2020 |
| Operating Data | 4Q20 | 4Q19 | % ∆ | 2020 | 2019 | % ∆ |
| ASKs (million) | 6,451 | 9,686 | -33.4% | 20,395 | 35,868 | -43.1% |
| Domestic | 5,968 | 7,432 | -19.7% | 17,158 | 27,521 | -37.7% |
| International | 483 | 2,254 | -78.6% | 3,237 | 8,348 | -61.2% |
| RPKs (million) | 5,211 | 8,080 | -35.5% | 16,311 | 29,941 | -45.5% |
| Domestic | 4,879 | 6,155 | -20.7% | 13,788 | 22,790 | -39.5% |
| International | 331 | 1,925 | -82.8% | 2,522 | 7,151 | -64.7% |
| Load factor (%) | 80.8% | 83.4% | -2.6 p.p. | 80.0% | 83.5% | -3.5 p.p. |
| Domestic | 81.7% | 82.8% | -1.1 p.p. | 80.4% | 82.8% | -2.4 p.p. |
| International | 68.7% | 85.4% | -16.7 p.p. | 77.9% | 85.7% | -7.7 p.p. |
| Average fare (R$) 1 | 307.0 | 419.9 | -26.9% | 343.9 | 394.2 | -12.7% |
| Revenue passengers (thousands) | 4,979 | 7,378 | -32.5% | 14,796 | 27,674 | -46.5% |
| Block hours | 86,930 | 127,498 | -31.8% | 266,881 | 495,362 | -46.1% |
| Aircraft utilization (hours per day) | 6.8 | 10.9 | -37.5% | 5.4 | 11.3 | -51.9% |
| Departures | 52,355 | 77,481 | -32.4% | 158,070 | 295,354 | -46.5% |
| Average stage length (km) | 1,035 | 1,064 | -2.8% | 1,083 | 1,050 | 3.2% |
| End of period operating passenger aircraft | 162 | 140 | 15.7% | 162 | 140 | 15.7% |
| Fuel consumption (thousands of liters) | 205,589 | 318,481 | -35.4% | 650,536 | 1,203,486 | -45.9% |
| Full-time-equivalent employees | 11,946 | 13,189 | -9.4% | 11,946 | 13,189 | -9.4% |
| End of period FTE per aircraft | 74 | 94 | -21.7% | 74 | 94 | -21.7% |
| Yield per passenger kilometer (cents) | 29.33 | 38.34 | -23.5% | 31.20 | 36.43 | -14.4% |
| RASK (cents) | 27.65 | 33.57 | -17.6% | 28.41 | 31.90 | -11.0% |
| PRASK (cents) | 23.69 | 31.98 | -25.9% | 24.95 | 30.41 | -18.0% |
| CASK (cents) 2 | 29.87 | 25.49 | 17.2% | 35.57 | 26.24 | 35.6% |
| CASK ex-fuel (cents) 2 | 22.88 | 16.91 | 35.3% | 28.17 | 17.63 | 59.8% |
| Fuel cost per liter | 2.19 | 2.61 | -16.0% | 2.32 | 2.56 | -9.5% |
| Break-even load factor (%) | 87.3% | 63.3% | +23.9 p.p. | 100.2% | 68.7% | +31.5 p.p. |
| Average exchange rate | 5.40 | 4.12 | 31.2% | 5.16 | 3.95 | 30.7% |
| End of period exchange rate | 5.20 | 4.03 | 28.9% | 5.20 | 4.03 | 28.9% |
| Inflation (IPCA - LTM) | 4.52% | 4.31% | +0.2 p.p. | 3.27% | 3.79% | -0.5 p.p. |
| WTI (average per barrel, US$) | 46.99 | 56.87 | -17.4% | 40.39 | 57.64 | -29.9% |
| Heating Oil (US$) | 128.32 | 191.41 | -33.0% | 125.11 | 193.23 | -35.3% |
¹ Impacted by the reduced international network
² Adjusted for non-recurring items
Operating Revenue
In 4Q20, Azul recorded an operating revenue of R$1.8 billion, compared to R$805.3 million in 3Q20, representing an increase of 121.5% quarter over quarter. Revenues were 45.1% lower than the same period last year, due to the impact of the COVID-19 pandemic on passenger demand. RASK increased 11.2% during the period compared to 3Q20.
Cargo and other revenue increased 65.9% compared to 4Q19, totaling R$255.4 million in 4Q20, and increased 31.8% in the full year compared to 2019, mainly due to the increase in e-commerce cargo revenue.
Passenger traffic (RPK) increased 105.2% on a capacity growth of 99.1%, representing a load factor of 80.8%, 2.4 percentage points higher than 3Q20. PRASK increased 22.9% quarter over quarter driven by higher load factor and yields.
| 4 |
| | Fourth Quarter Results 2020 |
| R$ cents | 4Q20 | 4Q19 | % ∆ | 2020 | 2019 | % ∆ |
| Operating revenue per ASK 1 | ||||||
| Passenger revenue | 23.69 | 31.98 | -25.9% | 24.95 | 30.41 | -18.0% |
| Cargo and other revenues | 3.96 | 1.59 | 149.1% | 3.45 | 1.49 | 131.8% |
| Operating revenue (RASK) | 27.65 | 33.57 | -17.6% | 28.41 | 31.90 | -11.0% |
| Operating expenses per ASK 1 | ||||||
| Aircraft fuel | 6.99 | 8.58 | -18.6% | 7.40 | 8.60 | -14.0% |
| Salaries, wages and benefits | 6.50 | 5.18 | 25.3% | 7.00 | 5.21 | 34.3% |
| Depreciation and amortization | 5.21 | 4.61 | 12.9% | 8.46 | 4.44 | 90.8% |
| Landing fees | 2.27 | 2.01 | 12.9% | 2.28 | 2.02 | 13.0% |
| Traffic and customer servicing | 1.23 | 1.33 | -7.7% | 1.41 | 1.33 | 6.4% |
| Sales and marketing | 1.61 | 1.27 | 26.4% | 1.62 | 1.24 | 30.6% |
| Maintenance materials and repairs | 1.85 | 0.72 | 155.3% | 2.21 | 0.78 | 181.0% |
| Other operating expenses | 4.22 | 1.77 | 138.1% | 5.20 | 2.62 | 98.6% |
| Total operating expenses (CASK) | 29.87 | 25.49 | 17.2% | 35.57 | 26.24 | 35.6% |
| Operating income per ASK (RASK - CASK) | (2.22) | 8.08 | n.a. | (7.17) | 5.66 | n.a. |
¹ Adjusted for non-recurring items totaling R$143.2 in the 4Q20, R$62.5 million gain in 2020 and R$3.2 billion loss in 4Q19 and 2019. For more information, see page 12.
Operating Expenses
Total operating expenses, excluding non-recurring items, increased 30.4% compared to 3Q20. Operating expenses decreased 22.0% or R$542 million year over year, mainly due to lower capacity-related expenses and cost reduction initiatives. The breakdown of our main operating expenses is as follows:
| § | Aircraft fuel decreased 45.8% year over year to R$451.0 million, mostly due to a 33.4% reduction in capacity and a 16% decrease in jet fuel prices. |
| § | Salaries, wages and benefits decreased 16.6% year over year to R$419.0 million, mainly due to lower fixed salary costs from our labor agreements and lower capacity, partially offset by the higher non-cash accounting impact of long-term incentives, to be realized over a period of 8 years, which were driven by the increase in the stock price and corresponding volatility. |
| § | Depreciation and amortization decreased 24.8% or R$110.7 million, driven by the reduction in the right-of-use asset as a result of lease contract renegotiations with lessors in the quarter. |
| § | Landing fees decreased 24.8% or R$48.2 million in 4Q20 compared to the same period last year, mostly due to the 33.4% reduction in capacity year over year. |
| § | Traffic and customer servicing expenses decreased 38.6% or R$49.8 million, mostly due to the 32.5% reduction in the number of passengers transported in 4Q20 compared to 4Q19. |
| § | Sales and marketing decreased 15.8%, or R$19.5 million, mostly driven by a reduction of 50.7% in passenger revenue and marketing initiatives, partly offset by an increase in cargo express shipments, which have higher commission fees. |
| § | Maintenance materials and repairs increased 70% or R$49.2 million, mostly driven by a 31.2% devaluation of the Brazilian real against the U.S. dollar and additional maintenance events in the quarter, performed to prepare the fleet for operational recovery, and which had been previously deferred. |
| § | Other operating expenses increased 58.6% year over year, mostly due to the 31.2% devaluation of the Brazilian real against the U.S. dollar and the revision of several non-cash provisions. |
| 5 |
| | Fourth Quarter Results 2020 |
Non-Operating Results
| Net financial results (R$ million)¹ | 4Q20 | 4Q19 | % ∆ | 2020 | 2019 | % ∆ |
| Financial income | 14.4 | 13.0 | 10.4% | 60.3 | 72.1 | -16.3% |
| Financial expenses | (852.8) | (409.8) | 108.1% | (2,470.0) | (1,329.5) | 85.8% |
| Derivative financial instruments | 25.9 | 21.8 | 19.0% | (1,452.1) | 325.5 | n.a. |
| Foreign currency exchange, net | 1,431.3 | 436.0 | 228.2% | (4,384.9) | (391.9) | 1018.9% |
| Net financial results | 618.8 | 61.1 | 913.2% | (8,246.8) | (1,323.9) | 522.9% |
¹Excludes convertible debentures expenses
Net financial expenses increased 48.8% or R$275.0 million compared to 3Q20, as a result of the lease modification.
Derivative financial instruments resulted in a net gain of R$25.9 million in 4Q20 mostly due to the 7.9% end of period appreciation of the Brazilian real against US Dollar.
As of December 31, 2020, Azul has hedged 11% of its expected fuel consumption for the next twelve months by using mostly heating oil derivatives
Foreign currency exchange, net. Azul recorded a non-cash foreign currency gain of R$1.4 billion, primarily due to the 7.9% end of period appreciation of the Brazilian real against US dollar, resulting in a decrease in debts denominated in foreign currency.
Liquidity and Financing
Azul closed the quarter with R$4.0 billion in immediate liquidity, R$1.7 billion higher than in 3Q20 due to the capital raised in the 4Q20 through the convertible debenture issuance. Cash (including cash and cash equivalents and short-term investments) represents 69.6% of its last twelve months’ revenue. The Company has no restricted cash nor minority interests in its subsidiaries. Considering deposits, maintenance reserves and other unencumbered assets, Azul’s total liquidity was R$7.9 billion as of December 31, 2020, and there is no significant debt repayments expected for the next twelve months.
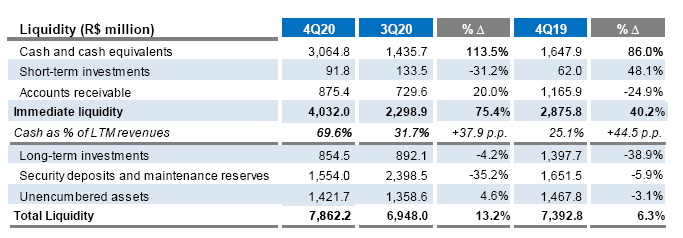
Total debt decreased 4.5% to R$17.2 billion compared to September 30, 2020, mostly due to debt payments made during the quarter and the end-of-period appreciation of the Brazilian real against US dollar, from September 30, 2020 to December 31, 2020.
| 6 |
| | Fourth Quarter Results 2020 |
As of December 31, 2020, Azul’s average debt maturity excluding lease liabilities was 3.2 years with an average interest rate of 6.0%. Local and dollar-denominated obligations average interest rate was 6.2% and 5.4%, respectively.
| Loans and financing (R$ million)¹ | 4Q20 | 3Q20 | % ∆ | 2019 | % ∆ |
| Operating lease liabilities | 11,720.4 | 12,016.9 | -2.5% | 11,118.4 | 5.4% |
| Finance lease liabilities | 800.4 | 1,116.1 | -28.3% | 988.3 | -19.0% |
| Sublease receivables | (312.9) | (344.3) | -9.1% | (279.5) | 12.0% |
| Other aircraft loans and financing | 1,231.6 | 1,346.8 | -8.6% | 1,060.5 | 16.1% |
| Loans and financing | 3,709.3 | 3,825.6 | -3.0% | 2,457.6 | 50.9% |
| Currency hedges | 7.4 | 1.5 | n.a. | (321.7) | n.a. |
| % of non-aircraft debt in local currency | 44% | 40% | +4.0 p.p. | 100% | -55.9 p.p. |
| % of total debt in local currency | 10% | 9% | +1.0 p.p. | 18% | -7.8 p.p. |
| Gross debt | 17,156.1 | 17,962.6 | -4.5% | 15,023.5 | 14.2% |
| Short term | 3,014.6 | 3,524.6 | -14.5% | 1,970.7 | 53.0% |
| Long term | 14,141.5 | 14,437.9 | -2.1% | 13,052.9 | 8.3% |
¹ Considers the effect of hedges on debt, net of aircraft sublease receivables; excludes convertible debentures given current stock price considerably higher than strike price.
The table below presents additional information related to our leases as of December 31, 2020:
| (R$ million) | 4Q20 | 3Q20 | % ∆ | 4Q19 | % ∆ |
| Operating leases | |||||
| Payments made | 356.1 | 192.4 | 85.1% | 499.8 | -28.8% |
| Weighted average remaining lease term | 7.9 | 7.5 | 4.7% | 8.3 | -4.5% |
| Finance leases | |||||
| Payments made | 70.2 | 16.0 | 945.4% | 52.0 | 221.3% |
| Weighted average remaining lease term | 5.5 | 3.7 | 50.5% | 4.2 | 30.6% |
Azul’s key financial ratios and debt maturity are presented below:
| Key financial ratios (R$ million) | 4Q20 | 3Q20 | % ∆ | 4Q19 | % ∆ |
| Cash1 | 4,886.5 | 3,190.9 | 53.1% | 4,273.5 | 14.3% |
| Gross debt² | 17,156.1 | 17,962.6 | -4.5% | 15,023.5 | 14.2% |
| Net debt² | 12,269.6 | 14,771.6 | -16.9% | 10,750.1 | 14.1% |
¹ Includes cash and cash equivalents, accounts receivable and short-term and long-term investments.
² Excludes convertible debentures given current stock price considerably higher than strike price.
| 7 |
| | Fourth Quarter Results 2020 |
|
Non-aircraft Debt Amortization* - as of December 31st (R$ million) |
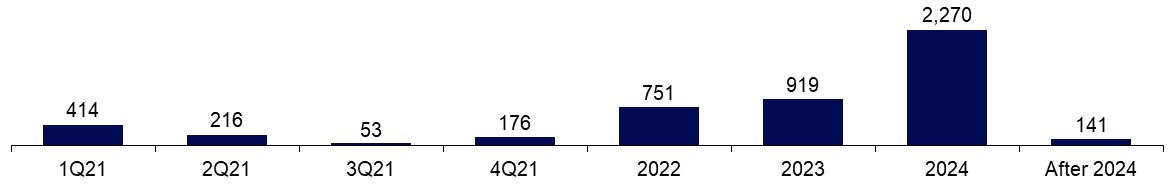
Non-aircraft Debt Amortization* - as of February 28th (R$ million)

|
* Adjusted for currency swaps. |
Fleet and Capital Expenditures
As of December 31, 2020, Azul had a total passenger operating fleet of 162 aircraft and a contractual passenger fleet of 185 aircraft, with an average aircraft age of 8.3 years. Excluding 17 Cessna aircraft, the average aircraft age is 6.9. The 23 aircraft not included in our operating fleet consisted of 9 aircraft subleased to TAP and 1 subleased to Breeze, 12 Embraer E-Jets that were in the process of exiting the fleet and one A320neo family aircraft in the process of entering service.
| Passenger contractual fleet1 | |||||
| Aircraft | 4Q20 | 3Q20 | % ∆ | 4Q19 | % ∆ |
| Airbus widebody | 12 | 10 | 20.0% | 10 | 20.0% |
| Airbus narrowbody | 45 | 44 | 2.3% | 41 | 9.8% |
| Embraer E2 | 9 | 5 | 80.0% | 4 | 125.0% |
| Embraer E1 | 63 | 63 | 0.0% | 70 | -10.0% |
| ATRs | 39 | 39 | 0.0% | 39 | 0.0% |
| Cessna | 17 | 17 | 0.0% | - | n.a. |
| Total | 185 | 178 | 3.9% | 164 | 12.8% |
| Aircraft under operating leases | 156 | 148 | 5.4% | 147 | 6.1% |
¹ Includes 9 aircraft subleased to TAP and 1 subleased to Breeze
| 8 |
| | Fourth Quarter Results 2020 |
| Passenger Operating Fleet | |||||
| Aircraft | 4Q20 | 3Q20 | % ∆ | 4Q19 | % ∆ |
| Airbus widebody | 11 | 10 | 10.0% | 10 | 10.0% |
| Airbus narrowbody | 45 | 43 | 4.7% | 38 | 18.4% |
| Embraer E2 | 7 | 5 | 40.0% | 4 | 75.0% |
| Embraer E1 | 49 | 44 | 11.4% | 55 | -10.9% |
| ATRs | 33 | 33 | 0.0% | 33 | 0.0% |
| Cessna | 17 | 17 | 0.0% | - | n.a. |
| Total | 162 | 152 | 6.6% | 140 | 15.7% |
Capex
Cash capital expenditures, excluding net proceeds from sale of property and equipment, totaled R$34.4 million in 4Q20, compared to R$440.4 million in 4Q19, mostly from the capitalization of engine overhaul events and the acquisition of spare parts.
| (R$ million) | 4Q20 | 3Q20 | % ∆ | 2020 | 2019 | % ∆ |
| Aircraft related | 0.1 | 303.2 | -100.0% | 138.3 | 834.8 | -83.4% |
| Maintenance and checks | 8.2 | 145.1 | -94.3% | 89.0 | 539.5 | -83.5% |
| Pre-delivery payments | - | 7.3 | -100.0% | 20.8 | 28.8 | -27.8% |
| Other | 26.0 | 70.8 | -63.2% | 95.0 | 245.9 | -61.4% |
| Engine maintenance credit facility (OPIC) | - | (86.0) | n.a. | - | (221.0) | n.a. |
| Acquisition of property and equipment | 34.4 | 440.4 | -92.2% | 343.1 | 1,428.0 | -76.0% |
| Net proceeds from sale of property and equipment | - | - | n.a. | (45.7) | (59.4) | -23.1% |
| Net CAPEX | 34.4 | 440.4 | -92.2% | 297.4 | 1,368.6 | -78.3% |
| 9 |
| | Fourth Quarter Results 2020 |
Environmental, Social and Governance (“ESG”) Responsibility
The table below presents Azul’s key ESG information, according to the Sustainability Accounting Standards Board (SASB) standard for the airline industry.

| 10 |
| | Fourth Quarter Results 2020 |
Non-Recurring Items Reconciliation
Non-recurring items totaling R$143.2 million in 4Q20 were recorded under passenger revenue (R$49.1 million), depreciation and amortization (R$47.0 million) and other expenses (R$47.1 million) consisting of lease liability remeasurement and impairment adjustments due to the extended use of the aircraft and the restructuring of our fleet and network.
Maintenance reserve adjustments due to the utilization of A330s on domestic routes to bolster cargo operations and support the recovery in passenger demand, along with other items related to the COVID-19 pandemic, as vouchers granted and not redeemed, were also recognized as non-recurring adjustments.
| 4Q20 Non-recurring adjustments | As recorded | Adjustment | Adjusted |
| Revenue | 1,734.5 | 49.1 | 1,783.7 |
| Passenger revenues | 1,479.2 | 49.1 | 1,528.3 |
| Operating expenses | 2,020.9 | (94.1) | 1,926.8 |
| Depreciation and amortization | 383.0 | (47.0) | 336.0 |
| Other operating expenses | 319.3 | (47.1) | 272.2 |
| Operating income | (286.4) | 143.2 | (143.2) |
| Operating Margin | -17% | +8.5 p.p. | -8% |
| EBITDA | 96.7 | 96.2 | 192.9 |
| EBITDA Margin | 5.6% | +5.2 p.p. | 10.8% |
| 11 |
| | Fourth Quarter Results 2020 |
Conference Call Details
Thursday, March 4th, 2021
10:00 a.m. (EST) | 12:00 p.m. (Brasília time)
USA: +1 412 717-9627
Brazil: +55 11 3181-8565 or +55 11 4210-1803
Verbal Code: Azul
Webcast: www.voeazul.com.br/ir
Replay:
+55 11 3193-1012 or +55 11 2820-4012
Code: 8622178#
About Azul
Azul S.A. (B3: AZUL4, NYSE: AZUL), the largest airline in Brazil by number of flight departures and cities served, offers over 700 daily flights to 116 destinations. With an operating fleet of approximately 140 aircraft and more than 11,800 crewmembers. In 2020, Azul was awarded best airline in Latin America by TripAdvisor Travelers’ Choice and also best regional carrier in South America for the ninth consecutive time by Skytrax. Additionally, in 2019, Azul ranked among the top ten most on–time low-cost carriers in the world, according to OAG. For more information visit www.voeazul.com.br/ir.
Contact:
Investor Relations Tel: +55 11 4831 2880 invest@voeazul.com.br |
Media Relations Tel: +55 11 4831 1245 imprensa@voeazul.com.br |
| 12 |
| | Fourth Quarter Results 2020 |
Balance Sheet – IFRS
| (R$ million) | December 31, 2020 | December 31, 2019 | September 30, 2020 |
| Assets | 15,794.5 | 19,197.5 | 13,926.3 |
| Current assets | 5,417.4 | 4,138.7 | 3,605.3 |
| Cash and cash equivalents | 3,064.8 | 1,647.9 | 1,435.7 |
| Short-term investments | 91.8 | 62.0 | 133.5 |
| Trade and other receivables | 875.4 | 1,165.9 | 729.6 |
| Sublease receivables | 123.5 | 75.1 | 138.9 |
| Inventories | 402.6 | 260.9 | 376.4 |
| Security deposits and maintenance reserves | 318.5 | 258.2 | 461.8 |
| Assets held for sale | - | 51.9 | - |
| Taxes recoverable | 133.7 | 139.7 | 27.5 |
| Derivative financial instruments | 79.2 | 168.1 | 79.2 |
| Prepaid expenses | 136.4 | 139.4 | 75.2 |
| Other current assets | 191.6 | 169.8 | 147.3 |
| Non-current assets | 10,377.0 | 15,058.8 | 10,321.1 |
| Long-term investments | 854.5 | 1,397.7 | 892.1 |
| Sublease receivables | 189.5 | 204.5 | 205.4 |
| Security deposits and maintenance reserves | 1,235.6 | 1,393.3 | 1,936.7 |
| Derivative financial instruments | 349.1 | 657.8 | 315.5 |
| Prepaid expenses | 18.2 | 22.2 | 20.7 |
| Taxes recoverable | - | 244.6 | 282.5 |
| Other non-current assets | 149.5 | 497.6 | 203.9 |
| Property, equipment and right of use assets | 6,410.4 | 9,553.6 | 5,313.2 |
| Intangible assets | 1,170.3 | 1,087.5 | 1,151.3 |
| Liabilities and equity | 15,794.5 | 19,197.5 | 13,926.3 |
| Current liabilities | 10,212.6 | 6,862.0 | 10,841.6 |
| Loans and financing | 858.3 | 481.2 | 1,050.3 |
| Current maturities of lease liabilities | 2,272.3 | 1,585.2 | 2,611.8 |
| Accounts payable | 2,396.5 | 1,626.6 | 2,906.4 |
| Air traffic liability | 2,488.9 | 2,094.3 | 2,270.1 |
| Salaries, wages and benefits | 400.4 | 357.6 | 411.8 |
| Insurance premiums payable | 52.4 | 49.9 | 13.3 |
| Taxes payable | 55.3 | 49.1 | 31.2 |
| Federal tax installment payment program | 13.4 | 13.5 | 15.1 |
| Derivative financial instruments | 173.8 | 81.2 | 195.0 |
| Reimbursement to clients | 221.3 | - | - |
| Provisions | 853.8 | 323.4 | 1,060.1 |
| Other current liabilities | 426.3 | 200.0 | 276.7 |
| Non-current liabilities | 19,730.6 | 15,854.6 | 16,951.0 |
| Loans and financing | 6,502.2 | 3,036.9 | 4,122.1 |
| Long-term obligations under lease liabilities | 10,248.5 | 10,521.4 | 10,521.2 |
| Accounts payable | 323.1 | - | - |
| Derivative financial instruments | 247.3 | 229.0 | 229.5 |
| Deferred income taxes | - | 242.5 | - |
| Federal tax installment payment program | 108.5 | 119.3 | 112.1 |
| Provision | 1,988.7 | 1,489.9 | 1,765.7 |
| Other non-current liabilities | 312.4 | 215.6 | 200.5 |
| Equity | (14,148.7) | (3,519.2) | (13,866.4) |
| Issued capital | 2,267.0 | 2,243.2 | 2,246.4 |
| Capital reserve | 1,947.9 | 1,928.8 | 1,941.0 |
| Treasury shares | (13.2) | (15.6) | (13.2) |
| Accumulated other comprehensive income (loss) | 0.7 | (159.3) | (6.8) |
| Accumulated losses | (18,351.1) | (7,516.4) | (18,033.7) |
| 13 |
| | Fourth Quarter Results 2020 |
Cash Flow Statement – IFRS
| (R$ million) | 4Q20 | 4Q19 | % ∆ | 2020 | 2019 | % ∆ |
| Cash flows from operating activities | ||||||
| Net income (loss) for the period | (317.4) | (2,313.1) | -86.3% | (10,834.7) | (2,403.1) | 350.9% |
| Total non-cash adjustments | ||||||
| Depreciation and amortization | 383.0 | 2,501.1 | -84.7% | 1,805.6 | 3,670.9 | -50.8% |
| Unrealized derivatives | 729.4 | (25.5) | n.a. | 2,207.5 | (367.8) | n.a. |
| Exchange (gain) and losses in foreign currency | (1,558.2) | (432.0) | 260.7% | 4,043.2 | 448.9 | 800.7% |
| Interest expenses on assets and liabilities | 789.5 | 299.7 | 163.4% | 2,165.0 | 1,082.3 | 100.0% |
| Related parties | (60.7) | (18.9) | 221.4% | 687.5 | (3.2) | n.a. |
| Provisions | 369.6 | 842.2 | -56.1% | 701.3 | 917.6 | -23.6% |
| Result of lease agreements modification | (87.7) | - | n.a. | (902.9) | - | n.a. |
| Impairment and other | (158.7) | 39.5 | -501.9% | (372.0) | (11.3) | n.a. |
| Changes in operating assets and liabilities | ||||||
| Trade and other receivables | (129.8) | 258.0 | n.a. | 341.8 | (98.8) | n.a. |
| Sublease receivables | 6.9 | 29.7 | -76.9% | 69.3 | 66.9 | 3.6% |
| Security deposits and maintenance reserves | (64.1) | (76.3) | -16.0% | (173.8) | (49.4) | 251.6% |
| Prepaid expenses | (58.7) | (63.9) | -8.2% | (25.1) | (24.5) | 2.5% |
| Other assets | 100.2 | (10.6) | n.a. | 480.1 | (197.5) | n.a. |
| Derivatives | (4.4) | - | n.a. | (259.3) | (2.4) | 10649.1% |
| Accounts payable | (361.8) | 16.5 | n.a. | 743.8 | 174.6 | 326.0% |
| Salaries, wages and employee benefits | (11.4) | (25.4) | -55.1% | 40.1 | 113.6 | -64.7% |
| Air traffic liability | 431.3 | 131.4 | 228.3% | 607.2 | 421.8 | 43.9% |
| Provision taxes, civil and labor risks | (43.0) | (28.3) | 52.1% | (116.4) | (93.7) | 24.2% |
| Other liabilities | 341.7 | 16.4 | 1989.9% | 247.5 | (78.7) | n.a. |
| Interest paid | (79.5) | (271.5) | -70.7% | (479.1) | (969.1) | -50.6% |
| Income tax and social contribution paid | - | (0.8) | n.a. | (0.3) | (2.4) | n.a. |
| Net cash provided (used) by operating activities | 216.4 | 868.3 | -75.1% | 976.2 | 2,594.6 | -62.4% |
| Cash flows from investing activities | ||||||
| Short-term investment | 42.2 | (20.6) | n.a. | (27.9) | 461.4 | n.a. |
| Long-term investment | 69.8 | - | n.a. | 69.8 | (96.2) | n.a. |
| Cash received on sale of property and equipment | - | - | n.a. | 45.7 | 59.4 | -23.1% |
| Acquisition of subsidiary , net of cash acquired | (21.0) | - | n.a. | (38.7) | - | n.a. |
| Loan granted to third parties | - | - | n.a. | - | (51.0) | n.a. |
| Acquisition of intangible | (40.4) | (53.6) | -24.7% | (109.6) | (132.5) | -17.3% |
| Acquisition of property and equipment | (34.4) | (440.4) | -92.2% | (343.1) | (1,428.0) | -76.0% |
| Net cash generated (used in) investing activities | 16.2 | (514.7) | n.a. | (403.8) | (1,186.8) | -66.0% |
| Cash flows from financing activities | ||||||
| Loans | ||||||
| Proceeds | 1,794.8 | 184.5 | 872.8% | 1,936.2 | 592.3 | 226.9% |
| Repayment | (38.2) | (27.6) | 38.4% | (192.4) | (110.0) | 75.0% |
| Debentures | ||||||
| Repayment | - | (24.2) | n.a. | - | (64.3) | n.a. |
| Repayment lease debt | (392.1) | (381.2) | 2.8% | (834.1) | (1,372.7) | -39.2% |
| Capital increase | 20.6 | 5.2 | 299.4% | 23.8 | 37.8 | -37.0% |
| Treasury shares | - | (7.7) | n.a. | - | (12.9) | n.a. |
| Sales and leaseback | - | - | n.a. | - | 16.3 | n.a. |
| Net cash generated (used in) from financing activities | 1,385.2 | (251.0) | n.a. | 933.5 | (913.5) | n.a. |
| Exchange gain (loss) on cash and cash equivalents | 11.3 | 23.3 | -51.3% | (89.0) | (15.6) | 471.4% |
| Net increase (decrease) in cash and cash equivalents | 1,629.1 | 125.8 | 1195.0% | 1,416.9 | 478.7 | 196.0% |
| Cash and cash equivalents at the beginning of the period | 1,435.7 | 1,522.1 | -5.7% | 1,647.9 | 1,169.1 | 40.9% |
| Cash and cash equivalents at the end of the period | 3,064.8 | 1,647.9 | 86.0% | 3,064.8 | 1,647.9 | 86.0% |
| 14 |
| | Fourth Quarter Results 2020 |
Glossary
Aircraft
Utilization
Average number of block hours per day per aircraft operated.
Available Seat Kilometers (ASK)
Number of aircraft seats multiplied by the number of kilometers flown.
Completion Factor
Percentage of accomplished flights.
Cost per ASK (CASK)
Operating expenses divided by available seat kilometers.
Cost per ASK ex-fuel (CASK ex-fuel)
Operating expenses divided by available seat kilometers excluding fuel expenses.
EBITDA
Earnings before interest, taxes, depreciation, and amortization.
Load Factor
Number of passengers as a percentage of number of seats flown (calculated by dividing RPK by ASK).
Revenue Passenger Kilometers (RPK)
One-fare paying passenger transported one kilometer. RPK is calculated by multiplying the number of revenue passengers by the number of kilometers flown.
Passenger Revenue per Available Seat Kilometer (PRASK)
Passenger revenue divided by available seat kilometers (also equal to load factor multiplied by yield).
Revenue per ASK (RASK)
Operating revenue divided by available seat kilometers.
Stage Length
The average number of kilometers flown per flight.
Trip Cost
Average cost of each flight calculated by dividing total operating expenses by total number
of departures.
Yield
Average amount paid per passenger to fly one kilometer. Usually, yield is calculated as average revenue per revenue passenger kilometer, or cents per RPK.
| 15 |
| | Fourth Quarter Results 2020 |
This press release includes estimates and forward-looking statements within the meaning of the U.S. federal securities laws. These estimates and forward-looking statements are based mainly on our current expectations and estimates of future events and trends that affect or may affect our business, financial condition, results of operations, cash flow, liquidity, prospects and the trading price of our preferred shares, including in the form of ADSs. Although we believe that these estimates and forward-looking statements are based upon reasonable assumptions, they are subject to many significant risks, uncertainties and assumptions and are made in light of information currently available to us. In addition, in this release, the words “may,” “will,” “estimate,” “anticipate,” “intend,” “expect,” “should” and similar words are intended to identify forward-looking statements. You should not place undue reliance on such statements, which speak only as of the date they were made. Azul is not under the obligation to update publicly or to revise any forward-looking statements after we distribute this press release because of new information, future events or other factors. Our independent public auditors have neither examined nor compiled the forward-looking statements and, accordingly, do not provide any assurance with respect to such statements. In light of the risks and uncertainties described above, the future events and circumstances discussed in this release might not occur and are not guarantees of future performance. Because of these uncertainties, you should not make any investment decision based upon these estimates and forward-looking statements.
In this press release, we present EBITDA, which is a non-IFRS performance measure and is not a financial performance measure determined in accordance with IFRS and should not be considered in isolation or as alternatives to operating income or net income or loss, or as indications of operating performance, or as alternatives to operating cash flows, or as indicators of liquidity, or as the basis for the distribution of dividends. Accordingly, you are cautioned not to place undue reliance on this information.
| 16 |
SIGNATURES
Pursuant to the requirements of the Securities Exchange Act of 1934, the registrant has duly caused this report to be signed on its behalf by the undersigned, thereunto duly authorized.
Date: March 4, 2021
Azul S.A.
By: /s/ Alexandre Wagner Malfitani
Name: Alexandre Wagner Malfitani
Title: Chief Financial Officer