![]()
ANNUAL INFORMATION FORM
of
B2GOLD CORP.
March 31, 2017
TABLE OF CONTENTS
- 2 -
B2GOLD CORP.
ANNUAL INFORMATION FORM
INTRODUCTORY NOTES
Date of Information
In this Annual Information Form (“Annual Information Form”), B2Gold Corp., together with its subsidiaries, as the context requires, is referred to as “we”, “our”, “us”, the “Company” or “B2Gold”. All information contained in this Annual Information Form is as at December 31, 2016, unless otherwise stated, being the date of our most recently completed financial year, and the use of the present tense and of the words “is”, “are”, “current”, “currently”, “presently”, “now” and similar expressions in this Annual Information Form is to be construed as referring to information given as of that date.
Cautionary Note Regarding Forward-Looking Information
This Annual Information Form includes certain “forward-looking information” within the meaning of applicable Canadian securities legislation and “forward-looking statements” within the meaning of applicable U.S. securities legislation (collectively “forward-looking statements”), including, but not limited to, projections of future financial and operational performance; statements with respect to future events or future performance; production estimates; anticipated operating and production costs and revenue; estimates of capital expenditures; future demand for and prices of commodities and currencies; and statements regarding anticipated exploration, development, construction, production, permitting and other activities on the Company’s properties, including expected grades and sources of ore to be processed in 2017 and expected gold production in 2017; the projections included in existing technical reports, economic assessments and feasibility studies, including the feasibility study for the Fekola Project; anticipated or potential new technical reports and studies, including the potential findings and conclusions thereof; planned exploration and exploration budgets and the results thereof; the estimated reclamation and closure costs; negotiating and finalizing the terms of the mining convention and signing a shareholder’s agreement with the State of Mali; the ownership of Fekola S.A.; the development and production from the Fekola Project by October 2017 and the expected transitioning from construction to steady-state operations in 2017; the Fekola Project being on schedule, on budget and fully funded; the Fekola mill expansion being completed in late 2017, with potential throughput of up to five million tonnes per year in the initial years of production, and the potential to increase estimated production at the Fekola Project; the updated financial analysis for the Fekola Project being completed by the end of Q3 2017; the timing and cost to complete the relocation of Fadougou according to the relocation action plan; the resolution of the audit by the DENR in relation to the Masbate Gold Project and the final outcome thereof; the plant upgrade at Masbate improving gold recoveries and sustaining throughput; expected amount of the new Masbate Gold Project fleet that will be lease financed; expected amount of Otjikoto Mine fleet expansion that will be lease financed; completion of geotechnical, hydrogeological and design studies for the Wolfshag zone; effects of solar power plant at the Otjikoto Mine on fuel consumption; the completion of permitting and resettlement activities in respect of the Jabali Antenna Pit; production from the Jabali Antenna Pit in the third quarter of 2017; Jabali West underground development commencing in 2017 with production in 2018; expected results of an economic viability study for an open pit operation at San Juan in mid-2017; planned drilling at the Limon Mine; the expected timing to release initial mineral resources for Toega; planned drilling at the Kiaka Project in 2017; the potential rescission of Memorandum #1 in respect of a moratorium placed on new mining projects in the Philippines and the continued issuance of permits at existing operations notwithstanding executive order #79; the likelihood of certain terms and conditions being attached to new and renewed mineral licences in Namibia; the coming into force of proposed new mining legislation in Namibia and their potential impact on the Company; the potential to develop and produce from currently non-producing properties; the delivery of ounces under the Prepaid Sales transactions; the adequacy of capital for continued operations, including access to funding under the debt and equity funding facilities described herein; and estimates regarding the outcome of tax audits. Estimates of mineral resources and reserves are also forward looking statements because they constitute projections, based on certain estimates and assumptions, regarding the amount of minerals that may be encountered in the future and/or the anticipated economics of production, should a production decision be made. All statements in this Annual Information Form that address events or developments that we expect to occur in the future are forward-looking statements. Forward-looking statements are statements that are not historical facts and are generally, although not always, identified by words such as “expect”, “plan”, “anticipate”, “project”, “target”, “potential”, “schedule”, “forecast”, “budget”, “estimate”, “intend” or “believe” and similar expressions or their negative connotations, or that events or conditions “will”, “would”, “may”, “could”, “should” or “might” occur. All such forward-looking statements are based on the opinions and estimates of management as of the date such statements are made.
- 2 -
Forward-looking statements are necessarily based on estimates and assumptions that are inherently subject to known and unknown risks, uncertainties and other factors, many of which are beyond our ability to control, that may cause our actual results, level of activity, performance or achievements to be materially different from those expressed or implied by such forward-looking information. Such factors include, without limitation, the risks, uncertainties and other factors referred to in this Annual Information Form under the heading “Risk Factors” and elsewhere herein.
Forward-looking statements are not a guarantee of future performance, and actual results and future events could materially differ from those anticipated in such statements. All of the forward-looking statements contained in this Annual Information Form are qualified by these cautionary statements.
Although we have attempted to identify important factors that could cause actual results to differ materially from those contained in the forward-looking statements, there may be other factors that cause actual results to differ materially from those which are anticipated, estimated, or intended. There can be no assurance that such information will prove to be accurate, as actual results and future events could differ materially from those anticipated in such statements. You should not place undue reliance on forward-looking statements. Our forward-looking statements reflect current expectations regarding future events and operating performance and speak only as of the date hereof, and we expressly disclaim any intention or obligation to update or revise any forward-looking statements, whether as a result of new information, events or otherwise, except as may be required by applicable securities laws.
Currency and Exchange Rate Information
The financial statements included herein are reported in U.S. dollars. A reference in this Annual Information Form to:
| • | “C$” is to the lawful currency of Canada; | |
| • | “N$” is to the lawful currency of Namibia; | |
| • | “Rand” is the lawful currency of South Africa; | |
| • | “Córdobas” is to the lawful currency of Nicaragua; | |
| • | “PHP” is to the lawful currency of the Philippines; | |
| • | “CFA franc” is the lawful currency of Mali and Burkina Faso; and | |
| • | “$” or “US$” is to the lawful currency of the United States. |
The following table sets forth, for each period indicated, the high and low exchange rates for Canadian dollars expressed in U.S. dollars, the average of such exchange rates during such period, and the exchange rate at the end of such period. These rates are based on the Bank of Canada noon spot rate of exchange.
| Fiscal Year Ended December 31, | ||||||||||
| 2014 | 2015 | 2016 | ||||||||
| Rate at the end of period | US$0.8620 | US$0.7225 | US$0.7448 | |||||||
| Average rate during period | US$0.9054 | US$0.7820 | US$0.7548 | |||||||
| Highest rate during period | US$0.9422 | US$0.8527 | US$0.7972 | |||||||
| Lowest rate during period | US$0.8589 | US$0.7148 | US$0.6854 | |||||||
On March 30, 2017, the noon rate of exchange for one Canadian dollar in United States dollars as reported by the Bank of Canada was C$1.00 = US$0.7531.
- 3 -
Technical Information and Cautionary Note for United States Readers
The disclosure included in this Annual Information Form uses Mineral Reserve and Mineral Resource classification terms that comply with reporting standards in Canada and the Mineral Reserve and Mineral Resource estimates are made in accordance with the Canadian Institute of Mining, Metallurgy and Petroleum (“CIM”) Council – Definitions adopted by CIM Council on May 10, 2014 (the “CIM Standards”), which were adopted by the Canadian Securities Administrators’ (“CSA”) National Instrument 43-101 Standards of Disclosure for Mineral Projects (“NI 43-101”). NI 43-101 is a rule developed by the CSA that establishes standards for all public disclosure an issuer makes of scientific and technical information concerning mineral projects. The following definitions are reproduced from the CIM Standards:
A Modifying Factor or Modifying Factors are considerations used to convert Mineral Resources to Mineral Reserves. These include, but are not restricted to, mining, processing, metallurgical, infrastructure, economic, marketing, legal, environmental, social and governmental factors.
A Mineral Resource is a concentration or occurrence of solid material of economic interest in or on the Earth’s crust in such form, grade or quality and quantity that there are reasonable prospects for eventual economic extraction. The location, quantity, grade or quality, continuity and other geological characteristics of a Mineral Resource are known, estimated or interpreted from specific geological evidence and knowledge, including sampling. Mineral Resources are sub-divided, in order of increasing geological confidence, into Inferred, Indicated and Measured categories.
An Inferred Mineral Resource is that part of a Mineral Resource for which quantity and grade or quality are estimated on the basis of limited geological evidence and sampling. Geological evidence is sufficient to imply but not verify geological and grade or quality continuity. An Inferred Mineral Resource has a lower level of confidence than that applying to an Indicated Mineral Resource and must not be converted to a Mineral Reserve. It is reasonably expected that the majority of Inferred Mineral Resources could be upgraded to Indicated Mineral Resources with continued exploration.
An Indicated Mineral Resource is that part of a Mineral Resource for which quantity, grade or quality, densities, shape and physical characteristics are estimated with sufficient confidence to allow the application of Modifying Factors in sufficient detail to support mine planning and evaluation of the economic viability of the deposit. Geological evidence is derived from adequately detailed and reliable exploration, sampling and testing and is sufficient to assume geological and grade or quality continuity between points of observation. An Indicated Mineral Resource has a lower level of confidence than that applying to a Measured Mineral Resource and may only be converted to a Probable Mineral Reserve.
A Measured Mineral Resource is that part of a Mineral Resource for which quantity, grade or quality, densities, shape, and physical characteristics are estimated with confidence sufficient to allow the application of Modifying Factors to support detailed mine planning and final evaluation of the economic viability of the deposit. Geological evidence is derived from detailed and reliable exploration, sampling and testing and is sufficient to confirm geological and grade or quality continuity between points of observation. A Measured Mineral Resource has a higher level of confidence than that applying to either an Indicated Mineral Resource or an Inferred Mineral Resource. It may be converted to a Proven Mineral Reserve or to a Probable Mineral Reserve.
A Mineral Reserve is the economically mineable part of a Measured and/or Indicated Mineral Resource. It includes diluting materials and allowances for losses, which may occur when the material is mined or extracted and is defined by studies at pre-feasibility or feasibility level as appropriate that include application of Modifying Factors. Such studies demonstrate that, at the time of reporting, extraction could reasonably be justified. The reference point at which Mineral Reserves are defined, usually the point where the ore is delivered to the processing plant, must be stated. It is important that, in all situations where the reference point is different, such as for a saleable product, a clarifying statement is included to ensure that the reader is fully informed as to what is being reported. The public disclosure of a Mineral Reserve must be demonstrated by a pre-feasibility study or feasibility study.
A Probable Mineral Reserve is the economically mineable part of an Indicated, and in some circumstances, a Measured Mineral Resource. The confidence in the Modifying Factors applying to a Probable Mineral Reserve is lower than that applying to a Proven Mineral Reserve.
A Proven Mineral Reserve is the economically mineable part of a Measured Mineral Resource. A Proven Mineral Reserve implies a high degree of confidence in the Modifying Factors.
Unless otherwise indicated, all of our Mineral Reserves and Mineral Resources included in this Annual Information Form have been prepared in accordance with NI 43-101. Canadian standards for public disclosure of scientific and technical information concerning mineral projects differ significantly from the requirements of U.S. securities laws. In particular, and without limiting the generality of the foregoing, the terms “Mineral Reserve”, “Proven Mineral Reserve” and “Probable Mineral Reserve” are Canadian mining terms as defined in accordance with NI 43-101 and CIM Standards. These definitions differ from the definitions in the United States Securities and Exchange Commission’s (the “SEC”) Industry Guide 7 (“Guide 7”) under the U.S. Securities Act of 1933, as amended, and therefore may not qualify as reserves under SEC standards. Under Guide 7 standards, a “final” or “bankable” feasibility study is required to report reserves, the three-year historical average price is used in any reserve or cash flow analysis to designate reserves and the primary environmental analysis or report must be filed with the appropriate governmental authority. Under Guide 7 standards, mineralization may not be classified as a “reserve” unless the determination has been made that the mineralization could be economically and legally produced or extracted at the time the reserve determination is made.
- 4 -
In addition, the terms “Mineral Resource”, “Measured Mineral Resource”, “Indicated Mineral Resource” and “Inferred Mineral Resource” are defined in and required to be disclosed by NI 43-101; however, these terms are not defined terms under Guide 7 and are normally not permitted to be used in reports and registration statements filed with the SEC. Accordingly, resource information contained herein may not be comparable to similar information disclosed by U.S. companies. Investors are cautioned not to assume that any part or all of mineral deposits in these categories will ever be converted into reserves or that they can be mined economically or legally. “Inferred Mineral Resources” have a great amount of uncertainty as to their existence, and great uncertainty as to their economic and legal feasibility. Historical results or feasibility models presented herein are not guarantees or expectations of future performance. It cannot be assumed that all, or any part, of an Inferred Mineral Resource will ever be upgraded to a higher category. Investors are cautioned not to assume that all or any part of an Inferred Mineral Resource exists or that it can be economically or legally mined. Further, while NI 43-101 permits companies to disclose economic projections contained in pre-feasibility studies and preliminary economic assessments, which are not based on “reserves”, U.S. companies are not normally permitted to disclose economic projections for a mineral property in their SEC filings prior to the establishment of “reserves”. Disclosure of “contained ounces” in a resource is permitted disclosure under Canadian reporting standards; however, the SEC normally only permits issuers to report mineralization that does not constitute “reserves” by SEC standards as in-place tonnage and grade without reference to unit measures.
Accordingly, information contained in this Annual Information Form contain descriptions of our mineral deposits that may not be comparable to similar information made public by U.S. companies subject to the reporting and disclosure requirements under the United States federal securities laws and the rules and regulations thereunder.
The term “Qualified Person” as used in this Annual Information Form means a Qualified Person as that term is defined in NI 43-101.
- 5 -
CORPORATE STRUCTURE
Name, Address and Incorporation
We were incorporated under the Business Corporations Act (British Columbia) (the “BCBCA”) on November 30, 2006. Our head office is located at Suite 3100, Three Bentall Centre, 595 Burrard Street, Vancouver, British Columbia, V7X 1J1 and our registered office is located at 1600-925 West Georgia Street, Vancouver, British Columbia, V6C 3L2.
- 6 -
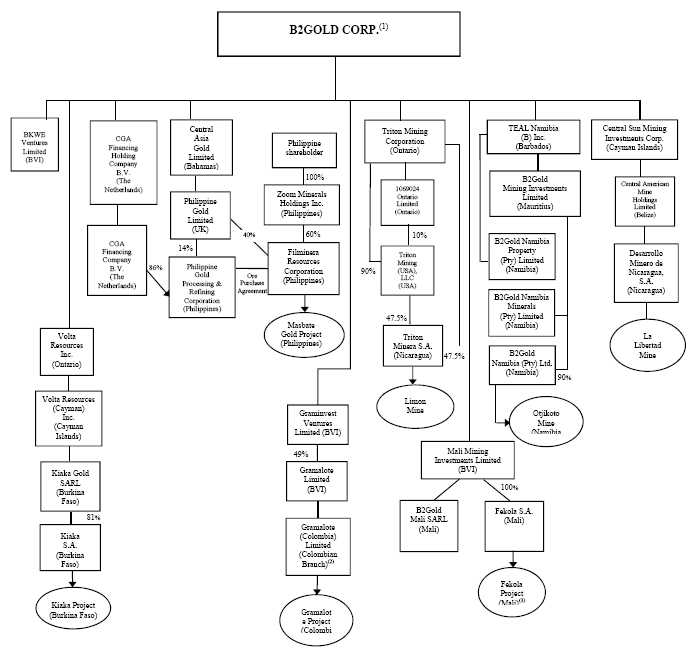
Intercorporate Relationships
A significant portion of our business is carried on through our subsidiaries. A chart showing the names of our material subsidiaries and certain subsidiaries holding an interest in mineral projects described in this Annual Information Form and their respective jurisdiction of incorporation is set out below:
Notes:
| (1) |
All ownership of subsidiaries is 100% unless indicated. Certain subsidiaries are indirectly owned by us through wholly-owned subsidiaries not reflected above. |
| (2) |
Colombian branches are not separate legal entities. |
| (3) |
Please see “Material Properties – Fekola Project – Property Description, Location and Access”, for further information regarding the anticipated ownership of the Fekola Project. |
- 7 -
GENERAL DEVELOPMENT OF THE BUSINESS
We are a Vancouver-based gold producer with four operating mines (two mines in Nicaragua, one mine in the Philippines and one mine in Namibia) and one mine under construction in Mali. In addition, we have a portfolio of other evaluation and exploration projects in several countries including Mali, Colombia, Burkina Faso, Finland and Nicaragua. Our material mineral properties consist of the following three mines and one mine under construction:
| • |
Otjikoto mine (90% ownership), an open pit, and potential underground, gold mine located approximately 300 kilometres (“km”) north of Windhoek, the capital of Namibia (“Otjikoto Mine”); | |
|
| ||
| • |
Masbate mine (ownership as described in “Material Properties – Masbate Gold Project” below), an open pit gold mine, located near the northern tip of the island of Masbate, 360 km south-east of Manila, the capital of the Philippines (“Masbate Gold Project”); | |
|
| ||
| • |
La Libertad mine (100% ownership), an open pit gold mine located 110 km due east of Managua, and 32 km northeast of Juigalpa, Nicaragua (“La Libertad Mine”); and | |
|
| ||
| • |
Fekola gold project (presently 100% ownership ), an open pit gold mine under construction located approximately 40 km south of the city of Kéniéba, Mali (“Fekola Project”). As described in “Material Properties – Fekola Project” below, upon signing of a shareholder’s agreement between the Company and the State of Mali, the Company will contribute a 10% free carried interest in Fekola S.A. to the State of Mali. It is anticipated that the State of Mali will also acquire an additional 10% interest in the Fekola Project. |
Our other significant assets consist of the following mine and two projects:
| • |
Limon mine (95% ownership), an underground gold mine located in northwestern Nicaragua, approximately 100 km northwest of Managua, the capital of Nicaragua (“Limon Mine”); | |
|
| ||
| • |
Kiaka project (81% ownership), a gold project, located 140 km southeast of Ouagadougou, the capital of Burkina Faso (“Kiaka Project”); and | |
|
| ||
| • |
Gramalote project (49% interest as at December 31, 2016, as described in “Other Properties – Gramalote Project” below), a gold project located 230 km northwest of Bogota, the capital of Colombia (“Gramalote Project”). |
Three Year History
Over the three most recently completed financial years, the significant events described below contributed to the development of our business.
2014 Developments
On October 3, 2014, we acquired 100% of the ordinary shares of Papillon Resources Limited, now referred to as Papillon Resources Pty Ltd. (“Papillon”) by way of an Australian scheme of arrangement. The scheme of arrangement was carried out pursuant to the terms and conditions contained in a merger implementation agreement dated June 3, 2014 between us and Papillon. On completion of the transaction, Papillon became our wholly-owned subsidiary and all of the issued and outstanding ordinary shares of Papillon were transferred to us in consideration for the issuance by us to former shareholders of Papillon of 0.661 of a common share of the Company (a “Common Share”) for each Papillon ordinary share held. We also issued Common Shares to Papillon optionholders as consideration for the cancellation of their Papillon stock options based on the in-the-money amount of such Papillon options. In connection with the closing of the transaction, we issued an aggregate of 237,390,819 Common Shares to the former Papillon shareholders and optionholders. The acquisition of Papillon added the Fekola Project in Mali to our property portfolio. See “Material Properties – Fekola Project” below.
- 8 -
On December 11, 2014, we announced that the first gold pour had occurred at the Otjikoto Mine, ahead of schedule.
2015 Developments
In February 2015, we began early earthworks activities at the Fekola Project.
On February 28, 2015, the Otjikoto Mine achieved commercial production, ahead of schedule.
On May 20, 2015, as amended on June 10, 2015, March 11, 2016 and May 10, 2016, we entered into a new $350 million revolving credit facility (the “Credit Facility”) with a syndicate of international banks, which replaced the previous $150 million secured credit facility with a syndicate led by Macquarie Bank Limited dated April 12, 2013 (“Previous Credit Facility”). The Credit Facility allows for an accordion feature whereby upon receipt of additional binding commitments, the Credit Facility may be increased to $450 million any time prior to the maturity date. The syndicate includes HSBC Bank USA, National Association, which acts as administrative agent and lender, HSBC Securities (USA) Inc., which acts as sole lead arranger and sole bookrunner, and The Bank of Nova Scotia, Société Générale and ING Bank N.V, (together, the “Credit Facility Bank Syndicate”). Proceeds from the Credit Facility were used to repay our Previous Credit Facility and for general corporate purposes. The Credit Facility bears interest on a sliding scale of between Libor plus 2.25% to 3.25% based on our consolidated net leverage ratio. The term for the Credit Facility is four years, maturing on May 20, 2019, except that it shall become due on July 1, 2018 in the event that greater than 25% of our convertible notes, initially due on October 1, 2018, remain outstanding or the maturity date of our convertible notes has not been extended to August 1, 2019 or later. On March 14, 2017, the Company received a binding letter of commitment from the Canadian Imperial Bank of Commerce (“CIBC”) to participate in the Company’s Credit Facility. In conjunction with this, the aggregate amount of the Credit Facility was increased from $350 million to $425 million. As of the date of this Annual Information Form and including the CIBC commitment, $225 million remains available for drawdown under the Credit Facility.
The results of an optimized feasibility study for the Fekola Project were announced on June 11, 2015, demonstrating robust economic indicators for the Fekola Project. See “Material Properties – Fekola Project” below for additional information.
On August 10, 2015, we entered into a binding letter agreement with Aurion Resources Ltd. (“Aurion”) setting out the terms of our option to acquire up to a 75% interest in the Kutuvuoma, Ahvenjarvi, Piko-Mustavaara, Palovaara and Soretiavuoma properties located in Finland (the “Finland Properties”), upon certain payments, Common Share issuances and expenditures being made in accordance with the terms of the agreement.
On August 26, 2015, we entered into an earn-in joint venture agreement with Omatjete Mining Company (Proprietary) Limited setting out the terms of our option to earn in stages up to a 100% interest in the Ondundu project located approximately 190 km south west of the Otjikoto Mine.
On November 20, 2015, the official ground-breaking of the Fekola Project took place in connection with the mine construction activities, which were commenced during the fourth quarter of 2015.
2016 Developments
On January 11, 2016, we filed a final short form base shelf prospectus (the “Base Shelf Prospectus”) in each of the provinces of Canada and a corresponding amended shelf registration statement in the United States allowing us to offer up to $300,000,000 of debt securities, warrants, subscription receipts, units or Common Shares, or any combination thereof, from time to time during a 25-month period.
On March 14, 2016, we received approvals for prepaid sales financing arrangements of up to $120 million from our Credit Facility Bank Syndicate (the “Prepaid Sales”). The Prepaid Sales, in the form of metal sales forward contracts, allow us to deliver pre-determined volumes of gold on agreed future delivery dates in exchange for an upfront cash pre-payment (“Prepaid Amount”). The Prepaid Sales arrangements have a term of 33 months commencing March 2016, and settlement will be in the form of physical deliveries of unallocated gold from any of our mines in 24 equal monthly installments during 2017 and 2018. Initial Prepaid Sales contracts have been entered into for the delivery of 49,475 ounces of gold in 2017 and 53,791 in 2018, for total cash Prepaid Amount proceeds of $120 million.
- 9 -
On March 31, 2016, the extension of the Masbate Gold Project’s income tax holiday was approved for a final additional year to June 2017.
On June 8, 2016, the Otjikoto equipment loan facility, entered into on December 4, 2013 (and as amended from time to time) between B2Gold Namibia Minerals (Proprietary) Limited, as borrower, Caterpillar Financial SARL, as arranger, Caterpillar Financial Services Corporation, as original lender, and the Company and B2Gold Namibia (Proprietary) Limited, as guarantors, was amended to extend the term over which loans may be advanced under the facility to December 31, 2016 and an additional $4.5 million was made available for drawdown. As at December 31, 2016, we had drawn down the full amount currently available under the facility.
On August 2, 2016, we decided to proceed with an expansion of the designed mill throughput at the Fekola Project and approved an $18 million expansion budget for additional items including a pebble crusher, one additional leach tank and an additional generator.
On August 11, 2016, we entered into an equity distribution agreement (the “ATM Agreement”) with two placement agents for the sale of Common Shares having up to an aggregate gross offering price of $100 million through “at the market” distributions. The ATM Agreement runs until the earlier of: (i) $100 million worth of Common Shares being issued; (ii) February 11, 2018; or (iii) termination by one of the parties in accordance with the ATM Agreement. The placement agents receive a placement fee of 2% of the gross proceeds from each placement. The offering of Common Shares under the ATM Agreement (the “ATM Offering”) is made pursuant to a prospectus supplement (the “Supplement”) filed in all of the provinces of Canada under our Base Shelf Prospectus. The Supplement is incorporated by reference into the Base Shelf Prospectus for the duration of the ATM Offering. During the year ended December 31, 2016, we issued 14.8 million Common Shares at an average price of $3.17 per Common Share for gross proceeds of $47.1 million (net proceeds of $44.2 million after deducting costs associated with the issuance) under the ATM Agreement. An aggregate commission of $0.9 million was paid to the agents. We are using the proceeds from the ATM Offering to fund ongoing general corporate expenditures, discretionary capital programs, accelerated exploration at the Fekola Project in Mali and exploration and development in Burkina Faso.
In August 2016, Masbate’s mine plan was adjusted to optimize the mine’s development sequence/gold production through to 2017 and beyond. These adjustments included accelerated mining in the Main Vein Stage 1 pit, expanding the Colorado pit and commencing site preparations for later Main Vein stages.
On September 7, 2016, we entered into a Euro 71.4 million term Equipment Facility (the “Equipment Facility”) with Caterpillar Financial SARL, as mandated lead arranger, and Caterpillar Financial Services Corporation, as original lender. The aggregate principal amount of up to Euro 71.4 million is available to our majority-owned subsidiary, Fekola S.A. to finance or refinance the mining fleet and other mining equipment at our Fekola Project in Mali. The Equipment Facility is available for a period that commenced on February 13, 2017 (the “Financial Close Date”) and ends on the earlier of the day when the Equipment Facility is fully drawn and 30 months from the Financial Close Date. The Equipment Facility may be drawn in installments of not less than Euro 5 million, and each such installment shall be treated as a separate equipment loan. The Company is required to maintain a deposit in a debt service reserve account (“DSRA”) equal at all times to the total of the principal, interest and other payments that become payable over the next six month period. Each equipment loan is repayable in 20 equal quarterly installments. The final repayment date shall be five years from the first disbursement under each equipment loan. The interest rate on each loan is a rate per annum equal to EURIBOR plus a margin of 5.10% . A commitment fee of 1.15% per annum on the undrawn balance of each tranche for the first 24 months after December 7, 2016 and 0.5% thereafter is also due, each payable quarterly. In each case, from October 1, 2017, 0.4167% per annum on the undrawn balance of each tranche is also due. We and our subsidiary, Mali Mining Investments Limited, have guaranteed the Equipment Facility and security will be given over equipment which has been financed by the Equipment Facility, related warranty and insurance and over the DSRA.
On September 27, 2016, the Philippine Department of Environment and Natural Resources (“DENR”) announced the preliminary results of mining audits carried out by the DENR in respect of all metallic mines in the Philippines. At that time, DENR spokespersons advised us that the Masbate Gold Project would receive a show-cause letter related to its operations. The DENR subsequently issued the Masbate Gold Project audit report which contains detailed findings from the audit and directed us to provide explanations and comments in response to the audit findings; however, no show-cause order was issued in respect of any findings. The audit findings were related to administrative and regulatory issues, including, without limitation: (a) alleged issues related to certain mining operations occurring in areas not covered by our Environmental Compliance Certificate, which in our view is mistaken and likely arises as a result of incorrect geographical coordinates of the Masbate Gold Project used by the auditors; and (b) alleged issues related to the appropriate approval of mine operating and production plans, the payment of fees for waste and tailing disposal, and a series of alleged infractions of the Philippine Mining Act of 1995 and safety regulations. The audit also includes recommendations related to guidelines to enhance our reclamation planning and practices, and several proposals related to community planning and development which we support. We have provided a comprehensive response to the findings and recommendations in the audit, which we believe addressed the issues raised. As reported by us on February 2, 2017, the DENR announced further results of its mining audit and the Masbate Gold Project was not among the mines announced to be suspended or closed. To date, the Company has not received any updated formal written response from the DENR confirming the results of the audit in respect of the Masbate Gold Project and as such, the final outcome of the audit is not certain. We will continue to work closely with the DENR to maintain compliance with regulations and continue to promote improved quality of life in the communities where we operate. Operations remain uninterrupted at the mine and the projections and guidance for the Masbate Gold Project and the Company on a consolidated basis are provided on this basis.
- 10 -
In December 2016, we completed a merger of Songhoi Resources SARL (“Songhoi”) and Fekola S.A. as result of which Fekola S.A. became the holder of the exploitation permit for the Fekola Project. Upon signing of a Shareholder’s Agreement between the Company and the State of Mali in respect of Fekola S.A. (the “Fekola Shareholder Agreement”), the Company will contribute a 10% free carried interest in Fekola S.A. to the State of Mali, resulting in B2Gold holding a 90% interest in Fekola S.A. The 2012 Mining Code (Mali) (the “2012 Mining Code”) also allows the State of Mali the option to purchase (at market terms) an additional 10% interest, which the State of Mali has confirmed its intent to exercise. Both parties have engaged an independent external valuator to prepare a valuation of the additional 10% interest in Fekola S.A. so that a final purchase price can be determined. We have signed a mining convention in the form prescribed under the 2012 Mining Code with the State of Mali (the “Fekola Convention”). We are in the process of negotiating with the State of Mali to address and clarify certain matters under the 2012 Mining Code and the Fekola Convention as described under the heading “Material Properties – Fekola Project – Property Description and Location”. The Fekola Convention, as it may be amended, is expected to govern the procedural and economic parameters pursuant to which the Company will operate the Fekola Project.
2017 Subsequent Developments
On February 13, 2017, the Financial Close Date was established under the Equipment Facility and the first drawdown in the amount of Euro 24.7 million was advanced on February 20, 2017.
In February 2017, we entered into further Prepaid Sales transactions with the Credit Facility Banking Syndicate totalling $15 million for delivery of 12,780 ounces of gold for delivery between January 31 and May 20, 2019.
DESCRIPTION OF THE BUSINESS
General
We are a Vancouver-based mid-tier gold producer with a strategic focus on acquiring and developing interests in mineral properties with demonstrated potential for hosting economic mineral deposits, with gold deposits as the primary focus. We conduct gold mining operations and exploration and drilling campaigns to define and develop Mineral Resources and Mineral Reserves on our properties with an intention of developing, constructing and operating mines on such properties.
Our corporate objective is to continue growing as a profitable and responsible gold producer through ongoing exploration of our existing projects and accretive acquisitions, irrespective of the gold price.
- 11 -
Principal Product
Our principal product is gold, with gold production forming all of our revenues. There is a global market into which we can sell our gold and, as a result, we are not dependent on a particular purchaser with respect to the sale of the gold that we produce.
Special Skills and Knowledge
Various aspects of our business require specialized skills and knowledge. Such skills and knowledge include the areas of permitting, engineering, geology, metallurgy, logistical planning, implementation of exploration programs, mine construction and development, mine operation, as well as legal compliance, finance and accounting.
Competitive Conditions
The gold exploration and mining business is a competitive business. We compete with numerous other companies and individuals in the search for and the acquisition of quality gold properties, mineral claims, permits, concessions and other mineral interests, as well as recruiting and retaining qualified employees. Our ability to acquire gold properties in the future will depend not only on our ability to develop our present properties, but also on our ability to select and acquire suitable producing properties or prospects for development or mineral exploration.
Employees
Our business is administered principally from our head office in Vancouver, British Columbia, Canada. We also have offices in Managua, Nicaragua; Manila, Philippines; Windhoek, Namibia; Ouagadougou, Burkina Faso; Bamako, Mali; Accra, Ghana; Dakar, Senegal; and Medellin, Colombia. As at the date of this Annual Information Form, we, including our subsidiaries, employ a total of 2,282 full-time employees, 1,847 temporary employees, and 1 supervised worker, for a total of 4,130 employees.
Production at our mining operations is dependent upon the efforts of our employees and our relations with our unionized and non-unionized employees. Some of our employees are represented by labour unions under various collective labour agreements. The collective bargaining agreement covering the workers at Limon Mine is effective until July 1, 2018. The collective bargaining agreement covering the workers at the La Libertad Mine is effective until December 31, 2017. The collective bargaining agreement covering the workers at the Otjikoto Mine is negotiated annually and is in place for 2017 as of March 1, 2017.
Foreign Operations
Our principal operations and assets are located in Nicaragua, the Philippines, Namibia, Mali, Burkina Faso and Colombia. Our operations are exposed to various levels of political, economic and other risks and uncertainties. These risks and uncertainties vary from country to country and include, but are not limited to government regulations (or changes to such regulations), with respect to restrictions on production, export controls, income taxes, expropriation of property, repatriation of profits, environmental legislation, land use, water use, land claims of local people and mine safety. The effect of these factors cannot be accurately predicted. See “Risk Factors”.
Environmental Protection
Our activities are subject to extensive laws and regulations governing the protection of the environment, natural resources and human health. These laws address, among other things, emissions into the air, discharges into water, management of waste, management of hazardous substances, protection of natural resources, antiquities and endangered species and reclamation of lands disturbed by mining operations. We are required to obtain governmental permits and, in some instances, provide bonding requirements under federal, state, or provincial air, water quality, and mine reclamation rules and permits. Violations of environmental, health and safety laws are subject to civil sanctions and, in some cases, criminal sanctions, including the suspension or revocation of permits. The failure to comply with environmental laws and regulations or liabilities related to hazardous substance contamination could result in project development delays, material financial impacts or other material impacts to our projects and activities, fines, penalties, lawsuits by the government or private parties, or material capital expenditures. As noted under the heading “General Development of the Business – Three Year History – 2016 Developments”, the Masbate Gold Project was the subject of an audit by the DENR to assess compliance with, among other things, environmental regulations.
- 12 -
Additionally, environmental laws in some of the countries in which we operate require that we periodically perform audits and environmental impact studies at our mines. These studies could reveal environmental impacts that would require us to make significant capital outlays or cause material changes or delays in our intended activities.
Our current closure and reclamation cost estimate at La Libertad Mine, the Limon Mine, the Masbate Gold Project, the Otjikoto Mine and the Fekola Project is approximately $87.0 million on an undiscounted basis. These estimates are generally based on conceptual level engineering and will be updated periodically to reflect changes in site conditions and the life-of-mine (“LOM”) plans.
Environmental, Occupational Health and Safety, and Regulatory
We have adopted environmental and biodiversity policies designed to ensure environmental risks are adequately addressed while committing to environmental protection for all our activities. We have also adopted occupational health and safety policies designed to ensure the protection and promotion of the safety, human health, and welfare of our employees. We have also implemented Health, Safety & Environmental (“HSE”) Management System Standards and Occupational Health and Safety, Environmental and Biodiversity Performance Standards at the corporate level to provide minimum requirements for the development and implementation of both corporate and site HSE management systems. Our HSE Management System and Performance Standards are based on international standards including compliance with in-country regulations, relevant International Organization for Standardization (“ISO”) and Occupational Health, Safety and Security (“OHSAS”) standards, and reliance on the International Finance Corporation (“IFC”) Performance Standards and international best practices in cases where national regulatory systems are not sufficiently stringent. These management systems enable us to mitigate and manage the potential risks and impacts of our operations.
We implement the HSE management systems and manage HSE performance with dedicated HSE personnel at both the corporate and site levels. In addition, we have in place a Health, Safety, Environment and Social Committee of the board of directors to assist the board of directors in overseeing our health, safety, environmental and corporate social responsibility policies and programs, and our health, safety, environmental and corporate social responsibility performance.
The following is a brief summary of HSE management systems in place across our different projects:
| • |
Masbate Gold Project: Masbate Gold Project has developed and implemented an HSE management system based on our HSE Management System and Performance Standards. The HSE management system and performance includes annual internal auditing of the Masbate Gold Project by independent experts. In addition, the Masbate Gold Project maintains ISO 14001 certification and evaluates its management of cyanide in relation to the International Cyanide Management Code. | |
|
| ||
| • |
La Libertad Mine: La Libertad Mine continues to develop its HSE management system based on our HSE Management System and Performance Standards through its internal management system implementation committee. La Libertad Mine undergoes annual audits by independent experts. In addition, La Libertad Mine continues its work towards certification with the International Cyanide Management Code. | |
|
| ||
| • |
Otjikoto Mine: B2Gold Namibia (Proprietary) Limited (“B2Gold Namibia”) continues to develop and implement a full HSE management system that covers all corporate HSE management systems and performance standards requirements on health, safety, environment, and biodiversity. This includes annual internal audits by independent experts that began in 2015. |
- 13 -
| • |
Limon Mine: Limon Mine continues to develop its HSE management system based on our HSE Management System and Performance Standards led by senior management, the HSE departments, and HSE Management System Coordinators. The HSE management system and performance includes annual internal auditing of the Limon Mine by independent experts. | |
|
| ||
| • |
Fekola Project: The Fekola Project is currently in the construction phase. During this phase, dedicated HSE personnel are working to implement the components of our HSE management system and performance standards that are relevant to construction. Implementation of an auditable management system will be in place when the facility commences operations. | |
|
| ||
| • |
Regional Exploration Projects: Regional exploration projects adhere to the same HSE policies as the rest of our projects, and apply specific standards, procedures, and processes as are relevant and applicable to the specific site. | |
|
| ||
| • |
Reclamation and Care and Maintenance Sites: Reclamation and care and maintenance sites adhere to the same HSE policies as the rest of our projects, and apply specific standards, procedures, and processes as are relevant and applicable to the site. |
In addition, we work with occupational health, safety, and environmental regulatory agencies to ensure that the performance of our operations is at a level that is acceptable to the regulatory authorities. We encourage open dialogue and have prepared procedures for responding to concerns of all entities with respect to HSE issues.
SUMMARY OF MINERAL RESERVE AND MINERAL RESOURCE ESTIMATES
Mineral Reserves are reported from pit designs and underground stope designs based on Indicated Mineral Resources. Mineral Resources are reported inclusive of those Mineral Resources that have been converted to Mineral Reserves.
Economic parameters such as mining costs, processing costs, metallurgic recoveries and geotechnical considerations have been applied to determine economic viability of the Mineral Reserves based on a gold price of US$1,250 per ounce (“/oz”). Mineral Reserves contained in stockpiles are also included for Masbate and Otjikoto Mines.
Mineral Resources amenable to open pit mining are constrained with conceptual pit shells defined by economic parameters and using a gold price of US$1,400/oz. Mineral Resources amenable to underground mining methods are reported above cutoff grades defined by site operating costs and using a gold price of US$1,400/oz. Gold grades are expressed in grams per tonne of gold (“g/t Au”).
Mineral Reserves and Resource estimates are reported from B2Gold’s Mineral Resource model that has an effective date of December 31, 2016.
Probable Mineral Reserves Statement
| Mine | Tonnes
(t) |
Gold
Grade (g/t Au) |
Contained
Gold Ounces (oz) |
Contained
Gold Kilograms (kg) |
| Fekola | 43,800,000 | 2.37 | 3,340,000 | 103,900 |
| Masbate | 95,290,000 | 0.88 | 2,683,000 | 83,500 |
| Otjikoto | 23,140,000 | 1.33 | 986,000 | 30,700 |
| La Libertad | 1,910,000 | 1.94 | 119,000 | 3,700 |
| Limon | 1,130,000 | 4.20 | 152,000 | 4,700 |
| Total Probable Mineral Reserves (includes Stockpiles) | 7,281,000 | 226,500 |
- 14 -
| Notes: | ||
| 1. |
Mineral Reserves have been classified using the 2014 CIM Definition Standards for Mineral Resources and Mineral Reserves. All tonnage, grade and contained metal content estimates have been rounded; rounding may result in apparent summation differences between tonnes, grade, and contained metal content. | |
| 2. |
Fekola Project: Mineral Reserves are reported on a 90% attributable basis; the remaining 10% interest will be held by the State of Mali. We expect that the State of Mali will exercise its right to acquire an additional 10% interest in the Fekola Project. For further details of our interest in the Fekola Project, see the heading “Material Properties – Fekola Project – Property Description, Location and Access”. The Mineral Reserves have an effective date of December 31, 2016. The Qualified Person for the estimate is Peter Montano, P.E., who is our Project Director. Mineral Reserves are based on a conventional open pit mining method, gold price of US$1,250/oz, metallurgical recovery of 92.7%, and average operating cost estimates of US$2.90/t mined (mining), US$20.25/t processed (processing) and US$3.72/t processed (general and administrative). Reserve model dilution and ore loss was applied through whole block averaging such that at a 0.8 g/t Au cutoff there is a 2.8% increase in tonnes, a 3.1% reduction in grade and 0.5% reduction in ounces when compared to the Mineral Resource model. An additional 5% dilution and 2% ore loss was applied during pit optimization and scheduling. Mineral Reserves are reported above a cutoff grade of 0.8 g/t Au. | |
| 3. |
Masbate Gold Project: Mineral Reserves are reported on a 100% attributable basis. Pursuant to the ore sales and purchase agreement between Filminera Resources Corporation (“Filminera”) and Philippine Gold Processing & Refining Corporation (“PGPRC”), our wholly-owned subsidiary, PGPRC has the right to purchase all ore from the Masbate Gold Project. The Mineral Reserves have an effective date of December 31, 2016. The Qualified Person for the estimate is Kevin Pemberton, P.E., who is our Chief Mine Planning Engineer. Mineral Reserves are based on a conventional open pit mining method, gold price of US$1,250/oz, modeled metallurgical recovery (resulting in average LOM metallurgical recoveries by pit that range from 65% to 82%), and operating cost estimates of US$1.50/t mined (mining), a variable ore differential cost by pit (average cost is US$0.17), US$9.36– 10.18/t processed (processing) and US$2.30–3.84/t processed (general and administrative). Dilution and ore loss were applied through block averaging such that at a cutoff of 0.45 g/t Au, there is a 5% increase in tonnes, a 6% reduction in grade and 1% reduction in ounces when compared to the Mineral Resource model. Mineral Reserves are reported at cutoffs that range from 0.46– 0.49 g/t Au. | |
| 4. |
Otjikoto Mine: Mineral Reserves are reported on a 90% attributable basis; the remaining 10% interest is held by EVI Mining (Proprietary) Ltd., a Namibian empowerment company (“EVI”). The Mineral Reserves have an effective date of December 31, 2016. The Qualified Person for the estimate is Peter Montano, P.E., who is our Project Director. Mineral Reserves that will be mined by open pit methods assume a gold price of US$1,250/oz, metallurgical recovery of 98%, and operating cost estimates of US$1.75/t mined (mining), US$13.00/t processed (processing) and US$3.00/t processed (general and administrative). Dilution and ore loss was applied through block averaging such that at a cutoff of 0.45 g/t Au, there is a 1% decrease in tonnes, a 4% reduction in grade and 5% reduction in ounces when compared to the Mineral Resource model. Mineral Reserves are reported at a cutoff of 0.45 g/t Au. | |
| 5. |
La Libertad Mine: Mineral Reserves are reported on a 100% attributable basis, and have an effective date of December 31, 2016. The Qualified Person for the estimate is Kevin Pemberton, P.E., who is our Chief Mine Planning Engineer. Mineral Reserves are based on a conventional open pit mining method, gold price of US$1,250/oz, metallurgical recoveries that range from 90% to 94%, and operating cost estimates of US$3.88/t mined (mining), US$13.31/t processed (processing) and US$4.13/t processed (general and administrative). Dilution and ore loss was applied to the Jabali material through block averaging such that at a cutoff of 0.75-0.76 g/t Au, there is a 15% increase in tonnes, a 26% reduction in grade and 14% reduction in ounces when compared to the Mineral Resource model. No dilution is applied to spent-ore. Mineral Reserves are reported at cutoffs that range from 0.70–0.76 g/t Au. | |
| 6. |
Limon Mine: Mineral Reserves are reported on a 95% attributable basis; the remaining 5% interest is held by Inversiones Mineras S.A. (“IMISA”). The Mineral Reserves have an effective date of December 31, 2016. The Qualified Person for the estimate is Kevin Pemberton, P.E., who is our Chief Mine Planning Engineer. Mineral Reserves are based on underground long-hole stoping mining methods, gold price of US$1,250/oz, metallurgical recovery of 93.5%, and operating cost estimates of US$58.05–82.39/t of ore mined (mining), US$26.33/t of ore processed (processing) and US$13.14/t processed (general and administrative). Dilution of 20- 30% is applied to most zones in addition to 90% mine recovery for all zones. Mineral Reserves are reported at cutoffs that range from 3.04–3.22 g/t Au. | |
| 7. |
Stockpiles: Mineral Reserves are reported in the totals for the Masbate and Otjikoto mines, and were prepared by mine site personnel at each operation. Ore stockpile balances are derived from mining truck movements to individual stockpiles or detailed surveys, with grade estimated from routine grade control methods. Stockpile cutoffs vary by deposit, from 0.25–0.7 g/t Au. | |
Measured and Indicated Mineral Resource Statement
| Mine |
Tonnes
(t) |
Gold
Grade (g/t Au) |
Contained
Gold Ounces (oz) |
Contained
Gold Kilograms (kg) |
| Measured | ||||
| Kiaka | 27,310,000 | 1.09 | 953,000 | 29,600 |
| Gramalote | 15,980,000 | 0.79 | 406,000 | 12,600 |
| Total Measured Mineral Resources |
1,359,000 | 42,300 | ||
| Indicated | ||||
| Fekola | 65,820,000 | 2.13 | 4,499,000 | 139,900 |
| Masbate | 126,820,000 | 0.89 | 3,649,000 | 113,500 |
| Otjikoto | 30,410,000 | 1.26 | 1,230,000 | 38,200 |
| La Libertad | 2,800,000 | 2.36 | 212,000 | 6,600 |
| Limon | 2,530,000 | 5.06 | 411,000 | 12,800 |
| Kiaka | 96,830,000 | 0.96 | 2,986,000 | 92,900 |
| Gramalote | 70,230,000 | 0.48 | 1,092,000 | 34,000 |
| Total Indicated Mineral Resources (includes Stockpiles) | 14,079,000 | 437,900 | ||
| Measured and Indicated | ||||
| Fekola | 65,820,000 | 2.13 | 4,499,000 | 139,900 |
| Masbate | 126,820,000 | 0.89 | 3,649,000 | 113,500 |
| Otjikoto | 30,410,000 | 1.26 | 1,230,000 | 38,200 |
| La Libertad | 2,800,000 | 2.36 | 212,000 | 6,600 |
| Limon | 2,530,000 | 5.06 | 411,000 | 12,800 |
| Kiaka | 124,140,000 | 0.99 | 3,938,000 | 122,500 |
| Gramalote | 86,220,000 | 0.54 | 1,498,000 | 46,600 |
| Total Measured and Indicated Mineral Resources (includes Stockpiles) | 15,438,000 | 480,200 | ||
- 15 -
Inferred Mineral Resource Statement
| Mine | Tonnes
(t) |
Gold Grade
(g/t Au) |
Contained Gold
Ounces (oz) |
Contained Gold
Kilograms (kg) |
| Fekola | 4,430,000 | 1.73 | 246,000 | 7,600 |
| Masbate | 10,100,000 | 0.74 | 240,000 | 7,500 |
| Otjikoto | 1,720,000 | 5.42 | 299,000 | 9,300 |
| La Libertad | 2,900,000 | 4.94 | 460,000 | 14,300 |
| Limon | 1,000,000 | 4.43 | 142,000 | 4,400 |
| Kiaka | 27,330,000 | 0.93 | 815,000 | 25,300 |
| Gramalote | 143,060,000 | 0.40 | 1,841,000 | 57,200 |
| Total Inferred Mineral Resources |
4,042,000 | 125,700 |
| Notes: | ||
| 1. |
Mineral Resources have been classified using the 2014 CIM Definition Standards for Mineral Resources and Mineral Reserves. Mineral Resources are reported inclusive of those Mineral Resources that have been modified to Mineral Reserves. Mineral Resources that are not Mineral Reserves do not have demonstrated economic viability. All tonnage, grade and contained metal content estimates have been rounded; rounding may result in apparent summation differences between tonnes, grade, and contained metal content. | |
| 2. |
Fekola Project: Mineral Resources are reported on a 90% attributable basis; the remaining 10% interest will be held by the State of Mali. We expect that the State of Mali will exercise its right to acquire an additional 10% interest in the Fekola Project. For further details of our interest in the Fekola Project, see the heading “Material Properties – Fekola Project – Property Description, Location and Access”. The Mineral Resources have an effective date of December 31, 2016. The Qualified Person for the estimate is Tom Garagan, P.Geo., who is our Senior Vice President, Exploration. Mineral Resource estimates assume an open pit mining method, gold price of US$1,400/oz, metallurgical recovery of 92.7%, and average operating cost estimates of US$2.90/t mined (mining), US$20.25/t processed (processing) and US$3.72/t processed (general and administrative). Mineral Resources are reported at a cutoff of 0.6g/t Au. | |
| 3. |
Masbate Gold Project: Mineral Resources are reported on a 100% attributable basis. Pursuant to the ore sales and purchase agreement between Filminera and PGPRC, our wholly-owned subsidiary, PGPRC has the right to purchase all ore from the Masbate Gold Project. The Mineral Resources have an effective date of December 31, 2016. The Qualified Person for the estimate is Tom Garagan, P.Geo., who is our Senior Vice President, Exploration. Mineral Resource estimates assume an open pit mining method, gold price of US$1,400/oz, modeled metallurgical recovery (resulting in average LOM metallurgical recoveries by pit that range from 65% to 82%), and operating cost estimates of US$1.50/t mined (mining), a variable ore differential cost by pit (average cost is US$0.17), US$9.36 –10.18/t processed (processing) and US$2.30 –3.84/t processed (general and administrative). Mineral Resources are reported at an average cutoff of 0.42 g/t Au. | |
- 16 -
| 4. |
Otjikoto Mine: Mineral Resources are reported on a 90% attributable basis; the remaining 10% interest is held by EVI. The Mineral Resources have an effective date of December 31, 2016. The Qualified Person for the estimate is Tom Garagan, P.Geo., who is our Senior Vice President, Exploration. Mineral Resource estimates that are amenable to open pit mining methods assume a gold price of US$1,400/oz, metallurgical recovery of 98%, and operating cost estimates of US$1.75/t mined (mining), US$13.00/t processed (processing) and US$3.00/t processed (general and administrative). Mineral Resources that are amenable to open pit mining are reported at a cutoff of 0.40 g/t Au. Mineral Resources that are amenable to underground mining are reported at cutoff of 3.00 g/t Au. |
|
| 5. |
La Libertad Mine: Mineral Resources are reported on a 100% attributable basis, and have an effective date of December 31, 2016. The Qualified Person for the estimate is Brian Scott, P.Geo., who is our Vice President, Geology and Technical Services. Mineral Resource estimates assume an open pit mining method, gold price of US$1,400/oz, metallurgical recoveries that range from 90% to 94%, and operating cost estimates of US$3.88/t mined (mining), US$13.31/t processed (processing) and US$4.13/t processed (general and administrative). Mineral Resources are reported at cutoffs that range from 0.61–2.85 g/t Au. |
|
| 6. |
Limon Mine: Mineral Resources are reported on a 95% attributable basis; the remaining 5% interest is held by IMISA. Mineral Resources have an effective date of December 31, 2016. The Qualified Person for the estimate is Brian Scott, P.Geo., who is our Vice President, Geology and Technical Services. Mineral Resource estimates assume underground long-hole stoping mining methods, a gold price of US$1,400/oz, metallurgical recovery of 93.5%, and operating cost estimates of US$58.05–82.39/t of ore mined (mining), US$26.33/t of ore processed (processing) and US$13.14/t processed (general and administrative). Mineral Resources are reported at cutoffs that range from 2.7–2.9 g/t Au. |
|
| 7. |
Kiaka Project: Mineral Resources are reported on an 81% attributable basis; the remaining interest is held by GAMS-Mining F&I Ltd (9%) a Cypriot company, and the Government of Burkina Faso (10%). The Mineral Resource estimate has an effective date of January 8, 2013. The Qualified Person for the estimate is Ben Parsons, MSc, MAusIMM (CP), Principal Consultant for SRK Consulting. Mineral Resources assume an open pit mining method, gold price of US$1,400/oz, metallurgical recovery of 89.8%, and operating cost estimates of US$1.58/t mined (mining), US$11.89/t processed (processing, and general and administrative). Mineral Resources are reported at a cutoff of 0.4 g/t Au. |
|
| 8. |
Gramalote Project: Mineral Resources are reported on a 49% attributable basis; the remaining 51% interest is held by AngloGold Ashanti Limited. Mineral Resources have an effective date of October 6, 2015. The Qualified Person for the estimate is Vaughan Chamberlain, FAusIMM, Senior Vice President, Geology and Metallurgy for AngloGold. Mineral Resources assume an open pit mining method, gold price of US$1,400, metallurgical recovery of 95%, and operating cost estimates of US$5.40/t processed (processing) and US$1.19 /t processed (general and administrative). Mineral Resources are reported at a cutoff of 0.1 g/t Au. |
|
| 9. |
Stockpiles: Mineral Resources are reported in the totals for the Masbate and Otjikoto mines, and were prepared by mine site personnel at each operation. Ore stockpile balances are derived from mining truck movements to individual stockpiles or detailed surveys, with grade estimated from routine grade control methods. Stockpile cutoffs vary by deposit, from 0.25–0.7 g/t Au. |
MATERIAL PROPERTIES
Fekola Project
Certain portions of the following information are derived from and based on the technical report entitled “NI 43-101 Technical Report Feasibility Study on the Fekola Gold Project in Mali” that has an effective date of June 30, 2015, and was prepared by Tom Garagan, P.Geo, William Lytle, P.E, Peter Montano, P.E., Ken Jones, P.E., Sandra Hunter, MAusIMM(CP), and David J. T. Morgan, MIEAust CPEng (the “Fekola Feasibility Study”) and is based on the assumptions, qualifications and procedures set out therein. For a more detailed overview of the Fekola Project, please refer to the Fekola Feasibility Study, which is available on SEDAR at www.sedar.com. Information that post-dates the Fekola Feasibility Study is provided by the Company.
Property Description, Location, and Access
The Fekola Project is situated in southwestern Mali, on the border between Mali and Senegal. The Fekola deposit is located about 210 kilometres (“km”) south of Kayes and approximately 40 km south of the city of Kéniéba, in the Kayes Region. From Bamako, the Malian capital, it is about a 480 km drive along the Millennium Highway to Kéniéba, then 40 km along a newly-completed two-way traffic road from the Millennium Highway to the mine site. The mine can also be accessed by road from Dakar in Senegal. The mine is also serviced by a purpose-built gravel airstrip.
Permit number 0070/PM-RM (the “Médinandi Exploitation License”), which has an area of 75 square kilometers (“km2”) was granted on February 13, 2014, and is valid to February 2044, a 30-year term. The Médinandi Exploitation License was initially held in the name of Songhoi. B2Gold initially acquired a 90% interest in Songhoi through the acquisition of Papillon in October 2014, and purchased the remaining 10% non-controlling interest in Songhoi held by Mani SARL (“Mani”) through a subsequent transaction in January 2015.
- 17 -
Fekola S.A., the new Malian exploitation company, was incorporated on March 17, 2016 and merged with Songhoi in December 2016 to become the holder of the Médinandi Exploitation Licence. Upon signing of a Fekola Shareholder Agreement, the Company will contribute a 10% free carried interest in Fekola S.A. to the State of Mali as required under the 2012 Mining Code, so that the shareholding will be distributed as follows: 90% indirectly to B2Gold, through its subsidiary Mali Mining Investments Limited, which owns Fekola S.A. and 10% to the State of Mali. Under the 2012 Mining Code, the State of Mali also has the option to purchase an additional 10% participating interest in Fekola S.A. on market terms, which it has confirmed its intent to exercise. As a result, it is expected that the State of Mali will hold an 20% interest in Fekola S.A. The 2012 Mining Code introduced an option for Malian private investors to acquire for cash at least 5% of the shares of an exploitation company, under the same conditions as other private shareholders. The conditions for the exercise of such right by Malian private investors and the exact obligations of a mining operator have not been specifically set out in either the 2012 Mining Code or the regulations published in 2012 that follow the 2012 Mining Code. We have signed the Fekola Convention in the form required under the 2012 Mining Code that relates to, among other things, the ownership, permitting, reclamation bond requirements, development, operation and taxation applicable to the Fekola Project with the State of Mali. We are currently in the process of negotiating certain matters with the State of Mali including: (i) the Fekola Shareholder Agreement, (ii) the valuation and terms under which the State of Mali may acquire its additional 10% ownership interest in Fekola S.A., and (iii) certain other matters to address and clarify certain issues under the 2012 Mining Code and the Fekola Convention including, the terms of the reclamation bond for the Fekola Project, the right of Malian private investors under the 2012 Mining Code, the final ownership of Fekola S.A. and the entity to operate the Fekola Project. The Fekola Convention, as it may be amended, is expected to govern the procedural and economic parameters pursuant to which the Company will operate the Fekola Project.
The State of Mali owns all of the surface rights in the Fekola Project area and no surface rights have been registered to a private entity. There are a number of small villages in the Exploitation License area, but there are currently no known inhabitants in a “no-go” zone, which is the area required for mining operations, infrastructure, and a 500 metre (“m”) buffer zone around the active blasting area. Farmers and other inhabitants have previously been relocated and compensation has been paid and there are no expected future payments or liabilities associated with the completed relocation effort. The Company has also approved a plan to relocate the village of Fadougou, located adjacent to the main Fekola pit. While the relocation of the village was not a requirement in the construction permit, after extensive stakeholder engagement with the local population, the Company decided to proceed with it because of the near proximity of the village to the mine site. Relocation will be completed in accordance with a Resettlement Action Plan (“RAP”) that was completed by an independent consultant in consultation with all stakeholders. The RAP has been submitted to the appropriate Malian authorities and the Company is currently in the process of acquiring the land necessary for relocation. It is anticipated that the relocation process will take two years to complete.
A 1.65% royalty is payable to Zoumana Traore SARL.
The financial model in the Fekola Feasibility Study was prepared on a pre-tax basis. The 2012 Mining Code introduced an ad valorem tax applicable to all substances, the taxable basis of which is the square-mine value of extracted substances, exported or not, minus intermediary fees and expenses. The tax rate is based on specified mining groups. Gold and other precious metals are levied at a 3% royalty rate.
Value-added tax (“VAT”) is payable in Mali; however, the 2012 Mining Code has a provision that exploitation license holders have a three year VAT exemption period. Corporate income tax in Mali is 30%. For exploitation license holders, there is a 15-year period from the start of production where the corporate income tax is reduced to 25%.
A new tax has been introduced applying to holders of an exploitation license that produce, in one year, more than 10% of the expected quantity fixed in the annual production program approved by its shareholders’ general assembly. This new tax consists of standard taxes and rights applying to operations and results relating to overproduction.
- 18 -
A special tax on certain products (Impôt Spécial sur Certains Produits or “ISCP”), calculated on the basis of turnover exclusive of VAT, also applies and is based on the specified mining group assignment. For a gold project, the applicable ISCP rate in force upon enactment of the 2012 Mining Code was 3%.
To the extent known, there are no other significant factors or risks that might affect access or title, or the right or ability to perform work on, the property, including permitting and environmental liabilities to which the project is subject that are not discussed in this Annual Information Form.
History
A number of companies have completed exploration activities in the general Fekola area, including Société Nationale de Recherches et d’Exploitation des Ressources Minières de Mali, Bureau de Recherches Géologiques et Minières, the Guefest Company, Western African Gold and Exploration S.A., Randgold Resources Ltd., Central African Gold plc (“Central African”) and Papillon.
The work programs included geological reconnaissance, interpretation of Landsat and aeromagnetic data, regional geological and regolith mapping, ground induced polarization (“IP”) geophysical surveys, airborne magnetic and electromagnetic (“EM”) surveys, soil, rock, and termite geochemical sampling, trenching, auger, rotary air blast (“RAB”), air core, reverse circulation (“RC”) and core drilling, Mineral Resource estimates and updates to those estimates, environmental studies to support environmental permit applications, geotechnical and hydrological surveys and water sampling, topographic surveys, metallurgical sampling, upgrading of access roads and the accommodation camp, and mining and technical studies.
Using assumptions and allowances in the 2004 Australasian JORC Code, Papillon completed a scoping-level study in 2012, and a pre-feasibility study in 2013; both studies indicated positive project economics using the assumptions in the studies. We completed the Fekola Feasibility Study in 2015, and subsequently commenced mine development activities. There are no historical estimates that are relevant to the current Mineral Resources and Mineral Reserves.
There has been no formal production from the mine area by the Company; however, there are known areas of artisanal mining activity.
Geological Setting, Mineralization, and Deposit Types
The Fekola deposit is hosted in Birimian Supergroup rocks within the eastern portion of the Paleo-Proterozoic Kédougou–Kéniéba inlier, which covers eastern Senegal and western Mali. It is considered to be an example of an orogenic-style gold deposit.
The deposit is hosted by a moderate to steeply west dipping, folded sequence of marine meta-sediments of the Kofi group, which locally include: minor pelitic sediments; fine grained turbidites, comprising laminated to thin-bedded siliciclastic siltstone and mudstone; and a heterolithic, mass flow breccia, or conglomerate. Thin discontinuous marble units are present as a volumetrically minor rock type inter-bedded with the pelitic units. Minor mafic volcanic, or volcaniclastic units occur locally in the upper and possibly, lower portions of the hanging wall stratigraphy. Weakly feldspar-phyric felsic dykes are locally observed. The deposit has been subjected to greenschist facies metamorphism.
Mineralization has been traced over a strike extent of approximately 1.5 km, to depths of as much as 400 m below surface, and up to 300 m wide. The greatest continuity is observed within a high grade shoot (>2 g/t Au) which plunges approximately 13° to the north–northwest. Mineralization remains open at depth, down plunge, and to the north.
Gold mineralization is associated with fine-grained disseminated pyrite and local pyrite veinlets. The total sulphide content of the deposit is typically less than 5%. Mineralization is also associated with a pervasive, texturally destructive, hydrothermal dolomite alteration. Hydrothermal alteration and gold mineralization appear to be synchronous with the development of north to north–northwest plunging folds within a corridor of ductile, high-strain deformation.
- 19 -
Exploration
Exploration activities completed by the Company include a light detection and ranging (“LIDAR”) survey; regolith and geological mapping; geochemical soil, termite mound, rock chip and grab sampling; ground geophysical surveys (IP, gradient, resistivity, pole–dipole, gravimetric); airborne geophysical surveys (aeromagnetic); and pitting and trenching.
The LIDAR survey was used to generate a contour map of the project area. Regolith mapping was performed to determine which areas of the regolith profile were insitu, and therefore could provide reliable geochemical sampling results. Geochemical sampling was used as a first-pass tool to define areas of gold anomalism. Geophysical data have been used to develop the broad lithological and structural framework for the project area. Pits and trenches were used to provide additional information on areas of gold anomalism, and were completed as part of the geotechnical appraisal of the planned plant and tailings storage facility areas.
In addition to the Fekola deposit, the exploration activities have identified the following prospects:
| • |
Kiwi Zone: The Kiwi zone is located approximately 640m north of the proposed pit limits of the Fekola deposit. At Kiwi, exploration is targeting a potential new mineralization shoot, similar to the shallowly north-northwest plunging, main high-grade portion of the Fekola deposit. The shoot occurs approximately 300m up-dip from the Fekola Deeps zone in what appears to be a separate and distinct zone of mineralized folds within the Fekola shear zone. | |
| • |
Weaver Zone: The Weaver zone is located approximately 2.5km north of the Fekola pit. Structural and lithological modeling of historical drill data suggests that prospective stratigraphy and the shear zone controlling gold mineralization at the Fekola deposit persist along strike to the north of the Fekola pit. Weaver may represent a previously unrecognized shoot-like structure, similar to the Fekola deposit, within the Fekola shear zone. | |
| • |
Anaconda Zone: A significant, near-surface zone of saprolite-hosted gold mineralization has been intersected within an area 1,300m long by 600m wide, across an average drill thickness intercept of 23m. | |
| • |
Adder Zone. This comprises saprolite-hosted gold mineralization located immediately west of and contiguous with Anaconda. Mineralization at Adder occurs within a northerly-trending linear zone approximately 2,450m long by 250m wide, across an average drill hole thickness intercept of 18m. | |
| • |
Cobra Zone. This saprolite and potential hard rock zone has a strong element of structural control and has been defined over a strike length of 2km and averages approximately 20m in width. |
Additional zones of saprolite-hosted gold mineralization have been discovered at Mamba and Boomslang, which occur approximately 1km east of Adder and Anaconda, respectively.
Our current and planned exploration activities are discussed under Fekola Project - Exploration, Development, and Production.
Drilling
Drilling has been completed in support of exploration evaluations, Mineral Resource and Mineral Reserve estimates, mine planning, geotechnical and hydrogeological evaluations, and infrastructure site sterilization and condemnation drilling.
Drilling completed at Fekola includes auger, RAB, aircore, RC, and core drilling methods. Drilling and sampling completed prior to January 2007 are not considered part of the current active database, and are not used in support of Mineral Resource estimation. Drilling completed as of December 31, 2016 on the licences in Mali includes 365 core holes (88,312 m), 1,756 RC holes (199,748 m), 2,122 aircore holes (82,782 m) and 8,906 auger holes (69,959 m).
Drilling that supports the Mineral Resource estimates was completed from January 2007 to May 26, 2016. A total of 685 drill holes (131,750 m) were available in the immediate area of the Mineral Resource estimates. There are 211 core holes (62,834 m), 433 RC holes (54,404 m) and 41 holes (14,512 m) that commenced with an RC collar and were completed with core.
- 20 -
Both RC chips and core are photographed and logged. Recoveries are recorded. Drill hole collar locations are surveyed using global positioning system (“GPS”) instruments. Down-hole surveys are performed at regular down-hole intervals using Reflex instrumentation. Most of the drill holes at Fekola are drilled at -50º to -55º to the east (N90 E) which intersects the main mineralized zone at a high angle. In general, true thicknesses are 70% to 80% of the sampled length.
The 2016 drill program comprised auger, aircore, RC and core drilling, as follows: auger drilling was conducted at Sanoukou, Gouenso and Nounfara (1,151 auger holes for 12,601 m); aircore drilling at Adder, Anaconda, Boomslang, Cobra, Mamba, Python, Tiger, Cardinal, Hawk Crow and Vulture (1,279 drill holes for 49,205 m), RC drilling at Adder, Anaconda, Mamba, Falcon, Eagle, Cardinal, Nightjar and Fekola northeast (237 drill holes for 30,356 m) and core drilling at Kiwi, Anaconda, Adder and Mamba (50 drill holes for 4,856.3 m).
The Kiwi zone adjoins mineralization currently contained within the proposed pit limits of the Fekola deposit. Kiwi hosts near-surface gold mineralization, which has recently been infilled with an additional 18 RC drill holes, totalling approximately 2,400 m. Assay results are pending. This near-surface exploration, combined with the planned follow up of FKD_188 at depth (FKD_188 returned 4.60 m at 11.80 g/t Au from 240.10 m depth), is part of an initiative to advance near-term exploration targets that are proximal to existing and planned Fekola mine infrastructure, with the goal of increasing the Fekola Project’s mine life.
Within the Fekola region, exploration has defined a significant zone of saprolite-hosted gold mineralization across two contiguous target areas known as Anaconda and Adder. At present, the footprint of the combined Anaconda–Adder saprolite zone extends over 4.5 km of strike and up to 500 metres wide at Anaconda and up to 200 metres wide at Adder. Within these zones, saprolite occurs in flat-lying horizons varying from several metres to over 40 m thick. Mineralized intervals within the saprolite are variable in thickness, but across both zones average approximately 13.5 m in true width. In 2016, 72,671 m of combined aircore, RC and core drilling were completed. At both Anaconda and Adder, drilling has been completed on 40 m x 40 m spaced centres and locally, infilled by RC and/or core holes at either 20 m x 20 m, or 5 m x 5 m centres to test the short range variability of mineralization. A program of select aircore hole twinning by PQ diameter core drilling was completed from late 2016 to early 2017. The initial results of the twin core drilling program favourably confirm the results of previous aircore drilling.
Sampling, Analysis, and Data Verification
RC samples are collected at 1 m intervals in plastic bags using a cyclone, and split using a cone or riffle splitter and a three-tier split at the Fekola sample yard. Samples were typically 1.5 -2 kilograms (“kg”), but in 2016, the protocol was changed and samples are currently larger, at about 4 kg. A reference sample, consisting of the material that is left after the second split, is retained for a 12-month period. Core is typically sampled on 1 m average intervals with breaks at lithological contacts and alteration boundaries. Following splitting with a diamond saw, core samples are organized into shipments and the primary laboratory takes possession of the samples at site and transports them to Bamako for preparation and analysis.
From January 2011 to June 2013, the primary laboratory was SGS Kayes, in Mali. The SGS Kayes facility was closed in mid-2013, and samples were subsequently sent to SGS Bamako in Mali from November 2013. SGS Bamako remains the primary laboratory. Currently there are no commercial minerals laboratories that are fully accredited under ISO17025 in West Africa. SGS advised that SGS Bamako is currently being assessed by SANAS under ISO17025. The SGS Kayes and SGS Morila laboratories operated a quality system that SGS considered to be in line with ISO17025 requirements. SGS Morila in southern Mali has been used as a secondary laboratory. Primary samples are sent there periodically, and SGS Morila has also occasionally been used for umpire (check) sampling. Bureau Veritas, Abijan, Ivory Coast, is currently used as a secondary laboratory and for umpire analyses. Samples selected for multi-element analysis are also shipped through the Ivory Coast laboratory to Bureau Veritas/Acme Vancouver. Bureau Veritas advised that the Ivory Coast laboratory is currently operating using protocols that are in line with ISO9001 and ISO17025 requirements. All of the SGS and Bureau Veritas laboratories discussed are independent of B2Gold and its predecessors.
Samples are dried, crushed to 75% passing 2 millimetres (“mm”), and pulverized to 85% passing 2 mm. Gold analysis at SGS consists of a 50 g fire assay with an atomic absorption spectrometer (“AAS”) and/or gravimetric finish, a method which is within industry norms. Bureau Veritas/ACME uses an aqua regia digest, with an inductively-coupled plasma finish for the multi-element analyses.
- 21 -
A portable X-ray fluorescence instrument and workstation is used to determine relative concentrations of various elements within sample pulp rejects. Magnetic susceptibility is measured with a magnetic susceptibility meter.
Density determinations are performed by site personnel on whole core samples, using the water displacement method. There are currently 10,991 density measurements and 2635 density measurements made onsite in 2016.
Quality assurance and quality control (“QA/QC”) measures include regular insertion of certified reference, field duplicate and blank sample materials prior to submission of samples to the laboratory to monitor laboratory accuracy and precision and sampling sequencing and precision. QA/QC sample insertion rates are 1:35 for standards and blanks. QA/QC data are reviewed on a continuous basis as data are imported into the database. Comprehensive QA/QC reports are generated and reviewed by senior staff on a monthly basis. Examination of the QA/QC sample data by personnel from ioGlobal and MPR Geological Consultants on behalf of Papillon, Papillon staff, and subsequently B2Gold personnel, indicates that at the time of the reviews, there was satisfactory performance of field sampling protocols and that the assay laboratories are providing acceptable levels of precision and accuracy. Data imported into the project database are subject to validation, which includes checks on surveys, collar co-ordinates, lithology data, and assay data. The checks are appropriate, and consistent with industry norms.
The checks done previously by Papillon and the continuous QA/QC checks completed by our database administrators, project geologists, and international database manager are in line with industry standards for database verification. No material issues with the project database including sampling protocols, flowsheets, check analysis program or data storage have been identified to date from the checks performed. The project database is acceptable for use in Mineral Resource and Mineral Reserve estimation, and can be used to support mine planning.
Sample security measures practiced included moving of RC samples and core from the drill site to the Fekola camp yard at the end of each drill shift, and tracking of sample shipments using industry-standard procedures. We are of the opinion that the core storage is secure because the Fekola camp is remote, access is strictly controlled and a B2Gold (previously Papillon) representative has always been present in the camp.
Mineral Processing and Metallurgical Testing
Metallurgical test work has been primarily performed by SGS Canada in Lakefield, Ontario ("SGS Lakefield"). SGS Lakefield is accredited to the requirements of ISO/IEC 17025 for relevant mineralogical, geochemical and trade mineral tests conducted for the Fekola Feasibility Study. Additional testing facilities involved in the study include BBA (leach optimization study), FLSmidth (thickener testing) and Jenike and Johanson (ore flow properties for the stockpile reclaim system design).
Completed test work included comminution tests; materials handling properties studies; mineralogical studies; metallurgical composite head analyses, gravity recoverable gold analyses; comparisons of whole ore and carbon-in-leach (“CIL”) methods; evaluations of leach performances; cyanide destruction test work; and evaluation of engineering data, including testing of oxygen uptake, slurry rheology, carbon kinetics and thickener settling rate.
Based on analysis of results the following conclusions can be drawn from the metallurgical and comminution test work programs:
| • |
The Fekola deposit is classified as hard to very hard competency with above average grinding energy requirements and is moderate to highly abrasive. The ore is amenable to primary crushing followed by a semi-autogenous grind (“SAG”) mill and ball mill grinding circuit with pebble crushing (“SABC”). | |
| • |
Fekola ore is predominantly “free milling”, not “preg robbing” and is amenable to gold extraction by conventional cyanidation. | |
| • |
A gravity separation circuit is not warranted for the Fekola deposit. Instead, a carbon column adsorption circuit will be included to recover dissolved gold leached in the grinding circuit to facilitate early recovery of gold, particularly during high gold head grade periods. | |
| • |
The optimum leaching conditions identified are 24 hour cyanidation with 350 ppm sodium cyanide (“NaCN”), initial lead nitrate addition of 100 g/t, pH 10.3 –10.5, dissolved oxygen levels of ~15 ppm and a pulp density of 45% solids. The addition of lead nitrate and dissolved oxygen levels of 15 ppm is found to be beneficial in leach kinetics and overall recovery. Anticipated lime and cyanide addition rates are moderate. |
- 22 -
| • |
The ore typically yields good recoveries (87% to 97%). Test work results show a logarithmic relationship between the measured gold head grade and resulting gold extraction under optimised leach conditions at a grind size of 75 micrometers (“µm”). A grind optimisation study was updated to evaluate the effect of grind size on project economics. The evaluation compared gold revenue against operating and capital expenditure for the grind sizes considered. A grind size (P80) of 75 µm is considered to be the economic optimum for the Fekola Project. | |
| • |
Based on the absence of any preg robbing characteristics and very good adsorption properties, a whole ore leach/carbon-in-pulp (“CIP”) circuit has been selected for the Fekola process flowsheet. There were no deleterious elements in any of the Fekola samples evaluated in the metallurgical test program which negatively affect gold recovery. | |
| • |
The cyanidation tailings responded well to cyanide destruction treatment using the SO2/Air process. |
The ore has a thickener specific settling rate of 0.3 square metres per tonne per day for both the leach and tailings thickener duties.
At a gold head grade of 2.50 g Au/t, the predicted gold extraction is 93.7%, and the estimated plant gold recovery is 92.7% .
Mineral Resource and Mineral Reserve Estimates
Mineral Resources
As of May 26, 2016, a total of 93 core drill holes (16,657 m, and a 13% increase in meterage supporting the estimate) were available since the feasibility model. The new drilling was completed on three target areas, infill drilling on a 20 x 20 m grid covering a portion of saprolite target to evaluate short range grade variability, infill drilling throughout the main Fekola mineralized zones and on the Fekola Deeps target north of the proposed design pit. The new drilling confirmed previous interpretations and models, and provides increased confidence in the Mineral Resource estimate.
The Mineral Resource estimate was updated in August 2016 and is based on mineralization domains at four nominal grade thresholds which were implicitly modelled as three dimensional (“3D”) solids using Leapfrog software. The overall interpretation and dimensions of the mineralization domains were controlled by the lithology model, regional folding, faulting, and shear zones. Assays were capped by mineralization domain and by regolith domains (fresh rock or saprolite) prior to compositing to 3 m downhole intervals. An average density across all mineralization domains was used for tonnage estimates.
Mineralization domain solids models were coded to the blocks using sub-cells and the coded blocks were used as grade estimation domains. Gold grades were estimated into parent blocks using ordinary kriging (“OK”) from the 2 m capped composites for each domain. The sub-cell model was re-blocked to 5 x 10 x 5 m whole blocks to account for the gradational change in gold grades seen at the domain contacts. Variography confirmed observations seen on plots and in 3D. Block grade estimates were validated by visual comparison to composite grades, comparison of global block statistics to the nearest-neighbour (“NN”) model, swath plots to check for local bias, and comparison to the previously reported mineral resource estimate.
Regolith surfaces for base of overburden and base of saprolite (includes laterite and saprock) were modeled. Most (>97%) of the Mineral Resource is hosted in fresh rock.
Mineral Resource classification was assigned to parent blocks. The Indicated Mineral Resource classification required an approximate drill spacing of 40 x 40 m and the Inferred Mineral Resource classification required an approximate drill spacing of 80 x 80 m. Reasonable prospects of eventual economic extraction were assessed by reporting Mineral Resources from the re-blocked model above a gold cutoff grade of 0.6 g/t Au, within a conceptual pit shell run at a gold price of US$1,400/oz and operating costs as of December 2016.
- 23 -
Mineral Resource estimates for the Fekola deposit are reported from B2Gold’s Mineral Resource model that has an effective date of December 31, 2016. No Measured Mineral Resources have been reported.
Fekola Indicated Mineral Resources Statement
| Area | Tonnes
(t) |
Gold
Grade (g/t Au) |
Contained
Gold Ounces (oz) |
Contained
Gold Kilograms (kg) |
| Open Pit | 65,820,000 | 2.13 | 4,499,000 | 139,900 |
Fekola Inferred Mineral Resources Statement
| Area | Tonnes
(t) |
Gold
Grade (g/t Au) |
Contained
Gold Ounces (oz) |
Contained
Gold Kilograms (kg) |
| Open Pit | 4,430,000 | 1.73 | 246,000 | 7,600 |
| Notes: | ||
| 1. |
Mineral Resources have been classified using the 2014 CIM Definition Standards for Mineral Resources and Mineral Reserves. Mineral Resources are reported inclusive of those Mineral Resources that have been modified to Mineral Reserves. Mineral Resources that are not Mineral Reserves do not have demonstrated economic viability. | |
| 2. |
All tonnage, grade and contained metal content estimates have been rounded; rounding may result in apparent summation differences between tonnes, grade, and contained metal content. | |
| 3. |
Mineral Resources are reported on a 90% attributable basis; the remaining 10% interest will be held by the State of Mali. We expect that the State of Mali will exercise its right to acquire an additional 10% interest in the Fekola Project. For further details of our interest in the Fekola Project, see the heading “Material Properties – Fekola Project – Property Description, Location and Access”. | |
| 4. |
The Qualified Person for the estimate is Tom Garagan, P.Geo., who is our Senior Vice President, Exploration. | |
| 5. |
Mineral Resource estimates assume an open pit mining method, gold price of US$1,400/oz, metallurgical recovery of 92.7%, and average operating cost estimates of US$2.90/t mined (mining), US$20.25/t processed (processing) and US$3.72/t processed (general and administrative). | |
| 6. |
Mineral Resources are reported at a cutoff of 0.6 g/t Au. | |
Mineral Reserves
Indicated Mineral Resources were converted to Probable Mineral Reserves based on the August 2016 resource model update, following consideration of the following modifying factors.
Reserve model dilution and ore loss was applied through whole block averaging such that at a 0.8 g/t Au cutoff there is a 2.8% increase in tonnes, a 3.1% reduction in grade and 0.5% reduction in ounces when compared to the Mineral Resource model. An additional waste dilution factor of 5% and ore recovery factor of 98% was applied globally to the block model used in the mining study. The mining cost estimates include grade control drilling and sampling costs to achieve sufficient data resolution for the delineation of the ore outlines. The preliminary owner mining cost estimates were derived from the initial mining equipment productivity and cost estimates. The estimates were compared to the previous contract mining costs and the cost data for similar projects. The equipment ownership costs were included in the estimates for pit optimisation purposes, considering the relatively long mine life compared to the life cycle of the equipment. The average mining cost reported for the optimal pit shell is $2.90 per tonne (“/t”) mined, which includes the equipment ownership cost of $0.35/t. Processing costs for the optimal shell were $20.25/t, and general and administration costs were $3.72/t.
The mining study was initially based on a five million tonne per annum (“Mtpa”) processing rate, which was revised to 4 Mtpa in May 2015 after the completion of the pit designs. The updated mining study reverted to 5 Mtpa to match the design plant throughput of the upgraded processing facility.
A gold price of $1,300/oz was used in the pit optimisations performed in connection with the updated mining study. During review of the pit optimization results, a $1,092/oz gold optimum shell was selected as the design basis for the ultimate pit. The pit optimisation sensitivities included the variation of ±15% ($1,100/oz gold and $1,500/oz gold) around the base case gold price. The 7.65% aggregate royalty was deducted from the revenue by using the net gold price after royalty in pit optimisations. The operating cash flows were discounted at 5% per annum to calculate the indicative net present value (“NPV”) values for the comparison of optimal pit shells and production schedule options.
- 24 -
The grade-dependent equation used for the estimation of the process recoveries was derived from test work results. The block model cutoff of 0.80 g/t Au used in the Mineral Reserve estimate is based on the 92.8% process recovery and the throughput cost, gold price, royalty, and dilution parameters set out above. The 0.8 g/t Au cutoff applied for the Fekola Feasibility Study and the updated mining study was elevated from the true economic cutoff grade and also remains valid under a $1,250/oz gold price assumption.
Provided that the planning and monitoring of operations are carried out as envisaged, there were no impacts identified in the Fekola Feasibility Study or the updated mining study that would materially affect the mining plans and the Mineral Reserve estimates. It is recommended that more detailed geotechnical studies be completed prior to development of the deeper pit phases.
Mineral Reserve estimates for the Fekola deposit are reported from B2Gold’s Mineral Resource model that has an effective date of December 31, 2016, and have been modified from the Indicated Mineral Resources. No Proven Mineral Reserves have been reported. Note that the reported Mineral Reserves are based on the updated Mineral Resource model and mining study. The variance from the Fekola Feasibility Study is immaterial, as it is less than 1% in ore tonnage, grade, and contained gold.
Probable Mineral Reserves Statement
| Area |
Tonnes
(t) |
Gold
Grade (g/t Au) |
Contained
Gold Ounces (oz) |
Contained
Gold Kilograms (kg) |
| Open Pit | 43,800,000 | 2.37 | 3,340,000 | 103,900 |
| Notes: | ||
| 1. |
Mineral Reserves have been classified using the 2014 CIM Definition Standards for Mineral Resources and Mineral Reserves. | |
| 2. |
All tonnage, grade and contained metal content estimates have been rounded; rounding may result in apparent summation differences between tonnes, grade, and contained metal content. | |
| 3. |
Mineral Reserves are reported on a 90% attributable basis; the remaining 10% interest will be held by the State of Mali. We expect that the State of Mali will exercise its right to acquire an additional 10% interest in the Fekola Project. For further details of our interest in the Fekola Project, see the heading “Material Properties – Fekola Project – Property Description, Location and Access”. | |
| 4. |
The Qualified Person for the estimate is Peter Montano, P.E., who is our Project Director. | |
| 5. |
Mineral Reserves are based on a conventional open pit mining method, gold price of US$1,250/oz, metallurgical recovery of 92.7%, and average operating cost estimates of US$2.90/t mined (mining), US$20.25/t processed (processing) and US$3.72/t processed (general and administrative). | |
| 6. |
Reserve model dilution and ore loss was applied through whole block averaging such that at a 0.8 g/t Au cutoff there is a 2.8% increase in tonnes, a 3.1% reduction in grade and 0.5% reduction in ounces when compared to the Mineral Resource model. An additional 5% dilution and 2% ore loss was applied during pit optimization and scheduling. | |
| 7. |
Mineral Reserves are reported above a cutoff grade of 0.8 g/t Au. | |
Except as disclosed elsewhere in this Annual Information Form, there are no undisclosed metallurgical, environmental, permitting, legal, title, taxation, socio-economic, marketing, political and other issues that the Company is aware of that may reasonably be expected to materially affect the Mineral Resources and Mineral Reserves estimates for the Fekola Project.
Mining Operations
A conventional open pit owner-operated mining method was selected, with higher grade material sent to the plant, and lower-grade material stockpiled until the end of the mine life. The mine plan in the Fekola Feasibility Study assumes a mine life of approximately 11 years (including 2017). The ultimate pit is planned for development in a sequence of six stages or cutbacks. The final pit design will be approximately 2 km long, 800 m wide and 320 m deep, with an overall waste to ore (strip) ratio of 4.9 to 1. Pit slopes vary by geotechnical domain, with bench face angles at 75º as a pre-mining assumption. Bench heights are designed at 10 m, but may be revised to 20 m in the more stable domains. A nominal ramp and road width of 27 m, including drainage and safety windrow, was used for dual lane truck operation in the mine design. Ramp widths were reduced to 20 m in mining the lower levels of the phases and in developing the final pit walls. Passing bays or staging areas were provided at reasonable intervals for the single lane section of the ramps. A ramp gradient of 10% was used in the mine design for both single and dual lane ramps.
- 25 -
In addition to increasing project value, the staged pit development will also mitigate the geological, geotechnical and economic risks for the project considering the 2 km length of the proposed Fekola Project open pit. The design of the future pit stages during the operations, especially the last two stages with higher production cost per ounce, can be adjusted progressively depending on the operational experience, exposed ground conditions and changes in economic conditions.
The base case mine production schedule involves the movement of 32 Mtpa material to sustain processing of 5 Mtpa of ore at an average grade of 2.37 g/t Au. High-, medium-, and low-grade ore will be blended throughout the mine life, with high- and medium-grade ore being prioritized to increase produced ounces and project value.
The mining operations are scheduled to work 330 days a year, to allow for downtime and reduced productivity during the rainy season. It is currently assumed that mining operations will take place under wet conditions with borehole and in-pit de-watering programs in place. The planned equipment fleet is conventional for the industry and will provide relative flexibility in the utilisation as up to three pit stages will be mined simultaneously to mine waste and ore at different levels. The mill feed ore will be transported from open pits to the run-of-mine (“ROM”) pad for direct tipping or stockpiling. It is currently assumed that 75% of the ROM feed will need to be stockpiled to regulate the mine production and crusher feed rates.
Gold production under the Fekola Feasibility Study was expected to average 276,000 ounces over the life of the Fekola Project with an average of 350,000 ounces over the first seven years. The open pit phase designs and production plans were subsequently updated to correspond to the updated Mineral Resource model and Mineral Reserve, in addition to the mill capacity increase to 5 Mtpa. Based on the updated production plans, the Fekola Project is now projected to produce an average of 375,000 to 400,000 ounces per year for the first five years of production (2018 to 2022) and 365,000 to 390,000 ounces per year over the first seven years of production (2018 to 2024). The mining schedule has been adjusted to ensure sufficient feed for the October 1, 2017 start date. Mining rates will not materially change to supply the 5 Mtpa plant, as the additional material will be diverted from planned stockpiles. Under the 5 Mtpa updated production plan, the initial mine life for the Fekola Project is expected to be approximately ten years. B2Gold is currently updating the financial analysis for the Fekola Project to include the updated Mineral Reserves, mining production schedule, 5Mtpa process throughput, current costs, and reconciliation to actual construction and pre-stripping progress. The updated model is expected to be complete by the end of Q3 2017.
A single waste rock storage facility (“WRSF”) will be constructed to the west of the open pit, and suitable mine waste will be used for the annual tailings storage facility (“TSF”) raises to the northeast of the pit. Location considerations were based on minimising haulage, surface water drainage and area availability. An overall slope angle of 18° was used in the design of the WRSF faces with 5 m berms located at 10 m vertical intervals.
The table below indicates 2017 planned production.
Production Guidance
| 2017
Guidance/Budget | |
| Gold production (100 basis%; Au oz) |
45,000–55,000 * |
| Tonnes milled (t) | 900,000 |
| Grade milled (g/t Au) | 2.33 |
| Recovery (%) | 91 |
| Note: * = pre-commercial. For the first full year of production in 2018 the guidance estimate is 375,000 to 400,000 ounces. |
Processing and Recovery Operations
Design assumptions were based on the metallurgical test work described under “Mineral Processing and Metallurgical Testing” above. The optimum leaching conditions identified were 24 hour cyanidation with 350 ppm NaCN, initial lead nitrate addition of 100 g/t, pH 10.3 to 10.5, dissolved oxygen levels of ~15 ppm and a pulp density of 45% solids (w/w). The addition of lead nitrate and dissolved oxygen levels of 15 ppm was found to be beneficial in leach kinetics and overall recovery. The ore typically yields good recoveries (87% to 97%). At a gold head grade of 2.50 g Au/t the estimated plant gold recovery is 92.7% .
- 26 -
The mill will use a conventional flowsheet, consisting of single stage primary crushing; a SABC grinding circuit; leach feed thickening with thickener overflow treated through a carbon in column circuit; leaching followed by CIP adsorption; elution and gold recovery to doré; and cyanide destruction, tailings thickening and disposal circuits. The primary gyratory crusher and a SABC grinding circuit will serve with a ball mill in closed circuit with cyclones to achieve the final product size. The cyclone overflow stream will flow by gravity to two linear trash screens operating in parallel ahead of a leach thickener. Sodium cyanide is added to the SAG mill feed to start the gold leaching process. The leach thickener overflow solution is pumped to carbon columns to recover gold already dissolved in the grinding circuit. The thickened slurry is pumped to a leach circuit and then additional sodium cyanide along with lead nitrate and oxygen are added for further gold leaching. A CIP circuit will adsorb dissolved gold onto activated carbon. A pressure Zadra elution circuit will be used to recover gold from loaded carbon to produce doré. A cyanide destruction circuit using SO2 and air will reduce the weak acid dissociable cyanide level in the tailings stream to an environmentally acceptable level. The tailings stream will be thickened to recover water before being pumped to the TSF. Key consumables will include reagents, water, and air services.
The originally designed processing facility was sized to treat 4 Mtpa of ore at an average head grade of 2.5 g/t Au. All major unit operations and equipment were sized with a 25% design margin to allow for future expansion capacity with minimal additional capital expenditure. On August 2, 2016, we decided to proceed with the mill expansion as part of the initial construction, and approved an $18 million expansion budget. With this additional capital investment, the Fekola mill expansion is expected to be completed in late 2017 and commissioned in conjunction with the main plant.
Infrastructure, Permitting, and Compliance Activities
Proposed infrastructure requirements for the Fekola Project are described in the Fekola Feasibility Study, and will include the process plant, TSF, accommodation camp, roads, airstrip, mine services area, open pit, ore stockpiles and WRSFs.
Site buildings will be 'fit for purpose' industrial type structures. Workshops, warehouses and reagent storage sheds will be constructed of a concrete slab on ground with structural steel frame and metal cladding. Offices and amenity buildings will be prefabricated structures for ease of site installation and fit-out. The accommodation camp is located to the south of the process plant and will provide accommodation for international expatriate and African national staff not originating from the local area.
Power supply to the site will be from a combination heavy fuel oil and diesel-fueled power station that will be located adjacent to the process plant. The power station will supply the main high-voltage switchroom inside the processing plant from which power will be distributed. The power station has been sized to accommodate a maximum demand power draw of 29.4 megawatts (“MW”). Fuel will be trucked to site under a contract supply arrangement. Power station fuel storage will accommodate capacity for a 30 day supply under full load conditions.
The planned TSF will be located to the north of the process plant and pit, and adjacent to the eastern WRSF. As designed, the TSF will store a total of 62 million tonnes (“Mt”) of tailings over 12 stages, with a stage lift performed every year in the dry season.
Materials and consumables are transported to site via the 40 km mine access road. Within the mine, gravel or dirt roads will be used for internal site access. The newly-constructed airstrip will be for secure transport of bullion, transportation of construction and operations personnel and emergency medivac purposes.
The Fekola pit footprint is located in an existing natural drainage course, with an upstream catchment of 9 km2, which will be diverted around the pit. The site surface water management system is designed to prevent runoff from events up to and inclusive of a 1-in-100 year recurrence interval storm event from entering the pit. Water for the Fekola Project will be sourced from pit groundwater, surface water (rainfall runoff), dedicated bore holes for potable water use at both the process plant and the accommodation camp, and bore holes at the Falémé River in the event that site water quantity or quality requirements are not met as anticipated by the pit dewatering bore holes and surface water run-off storage.
- 27 -
Effluent from the process plant, mine services and administration areas will be pumped to a vendor package sewage treatment plant system located at the camp. Treated effluent will be in accordance with regulations and acceptable practices. Treatment plant sludge will be suitable for direct landfill burial.
An Environmental and Social Impact Assessment (“ESIA”) was originally completed for the Fekola Project in 2013 and approved by the Ministry of Environment and Sanitation on April 29, 2013. In 2015, subsequent to the completion of the Fekola Feasibility Study, the 2013 ESIA was updated to fill gaps identified in the previous 2013 ESIA, to reflect improvements and modifications to the Fekola Project design and to align the assessment with international standards. As part of the ESIA and ESIA update, a detailed assessment of potential environmental and social impacts from the development of the Fekola Project was conducted. The potential impacts were evaluated for the construction, operations, and decommissioning/post-closure phases of the Fekola Project and rated based on their significance. Potential risks associated with the proposed Fekola Project were also assessed and discussed, as part of the impact assessment process. The assessment and discussion of potential risks associated with the Fekola Project was broadly aligned with internationally-accepted risk assessment methodologies. Following the implementation of proposed mitigation measures and under normal operating conditions, identified potential impacts are not estimated to cause significant long-term, adverse impacts on receptors / the receiving environment.
A mining permit was granted on February 13, 2014, and requires that we begin construction of the Project within three years of the issue of the permit. The permit is valid for up to 30 years and requires renewal every 10 years. About 19 additional approvals and permits are either in hand or under application, and include a Community Development Plan, a conceptual Closure Plan, easements for power and along the Falémé River, water abstraction permits, construction permits, explosives and radio licences, waste management and discharge permits, and vegetation clearance authorizations.
The estimated rehabilitation and closure costs for the Fekola Project are approximately US$20 million over the life of the mine. We are currently in negotiations with the Malian government as to the specifics of the reclamation bond guarantee required.
Capital and Operating Costs
Capital Costs
The overall construction capital cost estimate in the Fekola Feasibility Study is summarized below. The construction capital cost estimate is based on 2015 second quarter pricing and is deemed to have an accuracy of ±15%. The construction capital cost estimate reflects the Fekola Project scope as described in the Fekola Feasibility Study, plus expansions and other additions approved and disclosed to date.
Fekola Project Estimated Construction Capital Cost
| Main Area | Construction Cost
(US$) |
| Construction Indirects | 84,200 |
| Treatment Plant Costs | 102,195,400 |
| Reagents and Plant Service | 23,326,600 |
| Infrastructure | 81,954,800 |
| Mining | 40,467,300 |
| Engineering | 13,206,300 |
| Owners Project Costs | 80,865,100 |
| Owners Operation Costs (Working Capital) | 6,963,300 |
| Subtotal | 349,063,000 |
| Contingency | 45,937,000 |
| Feasibility Total | 395,000,000 |
| Mobile and Power Equipment Expected to be Leased | 66,700,000 |
| 5Mtpa Process Upgrade – Expansion Cost | 18,000,000 |
| Village Relocation (2016–2018) | 20,000,000 |
| Grand Total | 499,700,000 |
| Note: Table excludes $41 million of pre-construction early works sunk costs. |
- 28 -
The Fekola Feasibility Study construction capital cost estimate excluded US$66.7 million in mine fleet and power generation costs which were expected to be lease financed. On September 7, 2016, the Company entered into a Euro 71.4 million term equipment facility with Caterpillar Financial SARL to finance or refinance equipment at the Fekola Project.
In addition to the Fekola Project construction capital costs in the table above, a total of $47 million has been budgeted in 2017 for pre-stripping and additional mine fleet purchases. Following approval of the Fekola mill expansion in 2016 and the acceleration of the production start date to October 1, 2017, open pit pre-stripping and mine fleet purchases have been advanced by six months to ensure ore supply for the earlier mill start-up (and have now been included in the 2017 budget). Pre-stripping and mine fleet purchases for 2017 have been budgeted to approximately $25 million and $22 million, respectively. 2017 post-construction and operational capital costs of $11 million have been budgeted in 2017, including $4 million for aircraft purchases.
Fekola Project LOM post 2017 sustaining capital costs in the Fekola Feasibility Study are summarized below. Deferred capital includes increases in the mining fleet and subsequent TSF stage raises over the LOM, and mine closure and rehabilitation costs. These costs are not included in construction capital costs covered in the table above.
Sustaining Capital Estimate
| Main Area | LOM Cost
(US$) |
| Infrastructure | 51,000,000 |
| Mining | 32,900,000 |
| Closure and Rehabilitation | 20,400,000 |
| Total | 104,300,000 |
| Note: Based on 4 Mtpa Fekola Feasibility Study. |
Operating Costs
B2Gold is currently updating the operating cost model for the Fekola Project to include the updated Mineral Reserves, mining production schedule, 5Mtpa process throughput, current costs, and reconciliation to actual construction and pre-stripping progress. The updated model is expected to be complete by the end of Q3 2017. The information presented below is a summary of the information presented in the Fekola Feasibility Study (July 2015).
The mining operating cost estimate for the Fekola Project was prepared based on an owner operator mining strategy. The table below summarizes the mining operating costs over the LOM based on a 4Mtpa processing plant as estimated in the Fekola Feasibility Study (excluding pre-stripping and stockpiling costs.)
Fekola Project Estimated Operating Cost Summary
Feasibility Estimate (4 Mtpa)
| Cost Centre |
Total over
LOM (US$) |
Rock Mined
(US$/t) |
Ore Mined
(US$/t) |
Production Cost
(US$/oz Au) |
| Load haul and ancillary equipment | 473,035,000 | 1.76 | 9.62 | 137.11 |
| Drilling and blasting | 234,490,000 | 0.87 | 4.77 | 67.97 |
| Maintenance labour and overheads | 65,968,000 | 0.25 | 1.34 | 19.12 |
| Administration and supervision | 30,091,000 | 0.11 | 0.61 | 8.72 |
| Total | 803,584,000 | 2.99 | 16.34 | 232.92 |
| Note: | ||
| • | Figures are based on the Fekola Feasibility Study average LOM estimate for annual gold production of 276,000 ounces per year, assuming processing throughput of 4Mtpa. | |
| • | Unit operating costs with the 5 Mtpa processing case are not expected to be materially different from the 4Mtpa costs outline in the Fekola Feasibility Study. | |
- 29 -
The Fekola Feasibility Study operating cost estimate for the process plant was based on a design treatment rate of 4Mtpa, whole ore treatment and a mill feed head grade assumption of 2.5 g/t Au.
Fekola Process Plant Operating Cost Summary
Feasibility Estimate (4 Mtpa)
| Cost Centre | US$ M/a
|
Ore
(US$/t) |
Production Cost (US$/oz Au) |
| Processing Labour | 3,337,000 | 0.83 | 12.10 |
| Power | 36,808,000 | 9.20 | 133.37 |
| Consumables | 29,097,000 | 7.27 | 105.43 |
| Maintenance Materials | 3,933,000 | 0.98 | 14.26 |
| Subtotal – Processing and Maintenance | 73,185,000 | 18.29 | 265.16 |
| General and Administration | 14,894,000 | 3.72 | 53.96 |
| Total | 88,078,000 | 22.01 | 319.12 |
| Note: | ||
| • | Figures are based on the Fekola Feasibility Study average LOM estimate for annual gold production of 276,000 ounces per year, assuming processing throughput of 4Mtpa. | |
| • | Unit operating costs with the 5 Mtpa processing case are not expected to be materially different from the 4Mtpa costs outline in the Fekola Feasibility Study. | |
Feasibility Study Financial Analysis
B2Gold is currently updating the financial analysis for the Fekola Project to include the updated Mineral Reserves, mining production schedule, 5Mtpa process throughput, current costs, and reconciliation to actual construction and pre-stripping progress. The updated model is expected to be complete by the end of Q3 2017. The information presented below is a summary of the information presented in the Fekola Feasibility Study (July 2015).
The Fekola Project financial model contained in the Fekola Feasibility Study was compiled using the inputs described in such report. Key assumptions were the mining and processing production, project capital costs, and mining, processing, and general costs. The financial model is pre-tax and assumes 100% ownership and a gold price of $1,300/oz. For further details, as well as a sensitivity analysis including a $1,200/oz gold price case, please refer to the Fekola Feasibility Study. As noted under the heading “Fekola Project – Property Description, Location and Access”, we do not expect to maintain a 100% interest in the Fekola Project.
The costs portion of the model includes all mining, processing, general and administration, and distributable (power and laboratory) costs with input from the mining and processing production schedules plus appropriate labour, consumable, operating, maintenance, and other costs. Revenue is also based on the production schedules plus the process recovery, gold price, selling costs, and royalty input. The results of the financial model include the cash flow, income, and cash cost tables, as well as various measures of project value including discounted cash flow and internal rate of return (“IRR”). A sensitivity analysis was performed using gold price, processing cost, mining cost, fuel cost, capital cost, and labour cost as the variables.
- 30 -
Gold production under the Fekola Feasibility Study is expected to average 276,000 ounces over the life of the Fekola Project with an average of 350,000 ounces over the first seven years. Mining costs under the Fekola Feasibility Study is expected to average $2.99/t of total material mined over the life of the mine. Processing and maintenance cost under the Fekola Feasibility Study is $18.29/t processed in design conditions and is expected to average $18.30/t processed during the steady state production in years 2018 through 2029. General and administration costs under the Fekola Feasibility Study are $14.9 million per year during the full mining years, decreasing to $11.1 million when the mining department is no longer operational.
Under the Fekola Feasibility Study assumptions (including a $1,300/oz gold price), the results of the model show robust results including an expected LOM cash flow of $1.66 billion, an IRR of 35%, and an NPV of $1.01 billion at 5%. As presented in the Fekola Feasibility Study sensitivity analysis, with a $1,200/oz gold price the expected life of mine cash flow is $1.34 billion, the IRR is 30%, and the NPV is $796 million at 5%. The total cash cost including 7.65% royalties under the Fekola Feasibility Study is expected to be $652/oz over the life of the mine and $518/oz over the first seven years of production (2018 to 2024). Under the Fekola Feasibility Study assumptions, at a 5% discount rate, the Fekola Project has an expected project payback of approximately 2.25 years from first gold production. The anticipated pre-tax annual cash flow of the Fekola Project under the Fekola Feasibility Study is presented in the table below.
Summary of Projected Annual Cash Flow and Project Value
| Based on Fekola Feasibility Study; assumes US$1,300/oz Au gold price, and 4 Mtpa process rate | |||||
Year |
Net
Production Value (US$) |
Total Cost
of Production (US$) |
Total
Other Operating Costs (US$) |
Pre-Production Costs and Operating Capex (US$) |
Anticipated
Pre- Tax Net Annual Cash flow on Site Operation Activities (US$) |
| 2015 | — | — | -150,000 | -66,000,000 | -66,200,000 |
| 2016 | — | — | -150,000 | -202,000,000 | -202,200,000 |
| 2017 | 21,400,000 | -53,900,000 | -1,790,000 | -138,000,000 | -172,300,000 |
| 2018 | 408,000,000 | -164,000,000 | -31,400,000 | -45,300,000 | 167,300,000 |
| 2019 | 499,000,000 | -167,000,000 | -38,300,000 | -31,400,000 | 262,300,000 |
| 2020 | 390,000,000 | -169,000,000 | -30,000,000 | -28,500,000 | 162,500,000 |
| 2021 | 494,000,000 | -173,000,000 | -38,000,000 | -22,000,000 | 261,000,000 |
| 2022 | 496,000,000 | -177,000,000 | -38,200,000 | -4,340,000 | 276,500,000 |
| 2023 | 418,000,000 | -181,000,000 | -32,100,000 | -5,890,000 | 199,000,000 |
| 2024 | 487,000,000 | -187,000,000 | -37,400,000 | -6,350,000 | 256,300,000 |
| 2025 | 329,000,000 | -173,000,000 | -25,300,000 | -3,240,000 | 127,500,000 |
| 2026 | 306,000,000 | -146,000,000 | -23,600,000 | -773,000 | 135,600,000 |
| 2027 | 277,000,000 | -107,000,000 | -21,400,000 | -2,840,000 | 145,800,000 |
| 2028 | 152,000,000 | -84,600,000 | -11,800,000 | -13,800,000 | 41,800,000 |
| 2029 | 137,000,000 | -84,600,000 | -10,700,000 | -3,110,000 | 38,600,000 |
| 2030 | 65,100,000 | -31,400,000 | -5,130,000 | - | 28,600,000 |
| 2031 | — | — | — | -1,100,000 | -1,100,000 |
| LOM | 4,480,000,000 | -1,900,000,000 | -345,000,000 | -575,000,000 | 1,660,000,000 |
| Notes: | ||
| 1. |
This is a project-based pre-tax analysis and assumes 100% ownership and a gold price of US$1,300/oz. As noted under the heading “Material Properties – Fekola Project – Project Description, Location and Access”, we do not expect to maintain a 100% interest in the Fekola Project. | |
| 2. |
Net production value is the gross production value less refining and transportation costs. | |
| 3. |
Total cost of production is the total cost of production of surface mining, processing and site general. | |
| 4. |
Total other operating costs is the total of all royalties, withholding taxes and other income/expenses. | |
| 5. |
Pre-production costs and operating capital costs are the total of the capital costs required to complete construction, sustaining capital and the purchase of supplies and inventory. | |
| 6. |
B2Gold is currently updating the financial analysis for the Fekola Project to include the updated Mineral Reserves, mining production schedule, 5Mtpa process throughput, current costs, and reconciliation to actual construction and pre-stripping progress. The updated model is expected to be complete by the end of Q3 2017. | |
- 31 -
Exploration, Development, and Production
Subsequent to the Fekola Feasibility Study, we have continued to advance the Fekola Project. Exploration activities in 2016 focused primarily on the definition of saprolite-hosted mineralization on the Anaconda and Adder zones, and further drilling on the Kiwi Zone to try to define another zone of mineralization with a similar geometry as Fekola. Mineralization at Adder and Anaconda has been drilled on 40 m x 40 m centres, with local infill drilling completed on 20 m or 5 m centres. Initial metallurgical and environmental baseline studies were completed in 2016. Preliminary Mineral Resource evaluations and engineering studies are planned for 2017. The Mali exploration budget for 2017 is approximately US $11.6 million to fund 17,000 m of core, 41,000 m of RC, and approximately 30,000 m of aircore and auger drilling on several targets developed in 2016.
Total cumulative forecast for Fekola Project construction costs (from inception to completion) include preconstruction sunk costs of approximately $41 million, feasibility study construction costs of $462 million and $38 million additional construction costs approved in 2016 comprising of $18 million for the Fekola mill expansion and $20 million for relocating the village of Fadougou.
For 2017, the construction budget for the Fekola Project totals approximately $173 million, including $18 million for the Fekola mill expansion and $10 million for relocating the village of Fadougou. In 2017, the Company will complete construction and commission of the Fekola Project and begin the transition from construction to steady-state operations. Primary project areas will include the power house, processing mechanical and electrical installation, tailings storage facility lining, and prestripping in stage one of the Fekola open pit.
In addition to the Fekola Project construction budget above, a total of $47 million has been budgeted in 2017 for pre-stripping and additional mine fleet purchases. Following approval of the Fekola mill expansion in 2016 and the acceleration of the production start date to October 1, 2017, open pit pre-stripping and mine fleet purchases have been advanced by six months to ensure ore supply for the earlier mill start-up (and have now been included in the 2017 budget). Pre-stripping and mine fleet purchases for 2017 have been budgeted to approximately $25 million and $22 million, respectively. 2017 post-construction and operational capital costs of $11 million have been budgeted in 2017, including $4 million for aircraft purchases. B2Gold is currently updating the financial analysis for the Fekola Project to include the updated Mineral Reserves, mining production schedule, 5Mtpa process throughput, current costs, and reconciliation to actual construction and pre-stripping progress. The updated model is expected to be complete by the end of Q3 2017.
As at the date of this Annual Information Form, the Fekola Project mine construction is on target for an October 1, 2017 production start. B2Gold’s construction team continues to develop the Fekola Project and significant activities as at December 31, 2016 include the following: a total of 4,000,000 m3 of material has been moved at site; construction of the TSF and water embankments is 100% complete; lining of the tailings facility commenced in December 2016; installation of mechanical components is on-going with gyratory crusher, pebble crusher, conveyors, reclaim tunnel, leach and CIP tanks; commencement of mill installation started in January 2017; goldroom and reagent storage area construction is well underway; powerhouse construction remains on schedule for a June 2017 commencement of commissioning; pit pre-stripping has commenced ahead of schedule and over 800,000m3 of material has been removed to date; grade control for the ore zones has commenced and the lab on site is under construction (expected to start up in Q2 of 2017); and commissioning team has arrived at site and begun hiring and training the mill/lab operators.
- 32 -
Masbate Gold Project
Certain portions of the following information are derived from and based on the technical report entitled “Masbate Gold Operation, Republic of the Philippines, NI 43-101 Technical Report on Operations” that has an effective date of December 31, 2016, and was prepared by Tom Garagan, P. Geo., Ken Jones, P.E., Kevin Pemberton, P.E. and John Rajala, P.E. (the “Masbate Technical Report”) and is based on the assumptions, qualifications and procedures set out therein. For a more detailed overview of the Masbate Gold Project, please refer to the Masbate Technical Report, which is available on SEDAR at www.sedar.com. Additional information is provided by the Company.
Property Description, Location, and Access
The Masbate Gold Project is located in Masbate Island in the Republic of the Philippines. The mine is situated about 360 km southeast of Manila, the capital of the Philippines, within the municipality of Aroroy, Masbate Province, Region V. The mine site can be accessed by a commercial airline service, which flies daily to Masbate City; from there it is a 70 km drive on a partially-sealed road to the mine site. Alternate access to the site from Masbate City is via a one hour boat ride. A registered light air strip and helipad are located close to the mine. The mine is equipped with a barge loading jetty where heavy equipment and consumables are delivered and offloaded.
Filminera holds 29 patented mineral claims, four mineral production sharing agreements (“MPSAs”), and one exploration permit (“EP”). Collectively these patented claims, MPSAs, and EP cover an area of about 7,147 hectares (“ha”). Expiry dates for the Filminera-held MPSAs range from 2022–2035. One additional MPSA is held in the name of Vicar Mining Corporation (“VMC”). The majority of the Mineral Resources and Mineral Reserves occur on the patented mineral claims that have perpetual rights with no expiry date. There are also a number of MPSA and EP applications, with the MPSA applications covering about 1,360 ha, and the EP applications an additional 7,484 ha, approximately.
B2Gold holds its project interest through indirectly-owned subsidiaries. We have a 40% interest in Filminera and a 100% interest in PGPRC. The remaining 60% interest in Filminera is held by a Philippines-registered company, Zoom Mineral Holdings Inc. (“Zoom”). Filminera owns the majority of the Masbate Gold Project tenements and is responsible for the mining, environmental, social and community relations on the Masbate Gold Project site. PGPRC developed and owns the process plant on the island of Masbate and is responsible for the sale of all gold. PGPRC and Filminera have a contractual relationship, which includes PGPRC purchasing all of the ore production from Filminera at a price equal to the cost for the ore plus a predetermined percentage, while maintaining joint financial and legal liability for the social and environmental obligations under Filipino laws.
Filminera holds the surface rights to all current open pits, WRSFs and stockpiles, the Masbate process plant, TSF and associated infrastructure facilities, such as the causeway, port, airstrip, and housing areas. Additional surface rights will need to be acquired in the areas where the satellite pits are planned.
There is no royalty payable on the Masbate Gold Project; however, a 2% excise tax on gross gold and silver sales is payable annually to the Philippine government under the MPSA regulatory framework, and a 1.5% tax on operating cost as a required expenditure for social development of host communities.
Filminera holds an interest through VMC in the Pajo property, which is held under an approved MPSA which covers an area of approximately 786 ha and expires in 2030. Filminera has the right, at its expense, to explore and, if warranted, develop and operate any mine in the area of MPSA 219-2005-V. VMC would receive a royalty share equivalent to 2% of the gross receipts (less certain expenses) of the mineral products realized from the MPSA.
To the extent known, there are no other significant factors or risks that might affect access or title, or the right or ability to perform work on, the property, including permitting and environmental liabilities to which the project is subject that are not discussed in this Annual Information Form.
History
A number of companies have completed exploration activities in the general Masbate area, including Atlas Consolidated Mining & Development Corporation (“Atlas”), London Fiduciary Trust PLC, Philippines Gold PLC, Thistle Mining Inc., CGA Mining Limited (“CGA”), and B2Gold. Filminera became the in-country operating entity for the Masbate mine in 1997. A number of companies have held an interest in Filminera since that date; most recently, the interest is held by B2Gold.
- 33 -
Work programs completed have included geological mapping, mapping of artisanal workings, geochemical sampling (stream sediment, rock chip, grab, channel and trench, and soil auger), helicopter geophysical surveys (magnetics and radiometrics), an orientation IP survey, core and RC drilling, metallurgical test work, environmental studies, and mining and technical studies.
Early mining activity was halted by the advent of World War II. Atlas undertook open pit and underground mining operations from 1980 to 1994, and reportedly produced about 1.4 million ounces (“Moz”) Au. CGA recommenced mining from open pit sources in 2009, and open pit mining is ongoing. Production from April 2009 to December 2012 was estimated at approximately 0.5 Moz Au.
Artisanal miners have also been active in the Masbate Gold Project area; production from these sources is unknown.
Geological Setting, Mineralization, and Deposit Types
Mineralization is developed in an Early Pliocene volcano–plutonic arc and is controlled by the central segment of the Philippine Fault Zone. Masbate is considered to be an example of a low sulphidation epithermal deposit, and exploration models using this deposit type are considered appropriate for the Masbate Gold Project area.
The Masbate gold deposits that are currently being mined are centred on a 5 km to 7 km wide northwest- to southeast-oriented mineralised volcanic block which is bounded by two interpreted north-west trending fault zones, the Pinanaan Fault to the east and the Malubi–Lanang–Balete Fault to the west. Approximately 31 gold vein deposits and prospects have been identified to date in the wider district, over an area of about 24 x 4 km. The mineralizing system being exploited in the open pit operations has a strike length of about 10 km, from Balete in the south to Pajo in the north. Mineralization has been tested to about 300 m depth, and remains open at depth.
The principal host rock to the gold mineralisation is a fractured andesitic–dacitic, tuffaceous agglomerate. Mineralisation occurs within quartz veins within the agglomerate, and also within associated altered and quartz-stockworked wall rocks and breccias. The primary mineral associated with gold (+silver) mineralisation is quartz, both in the form of fracture-filling quartz veins and in the silicification of the host rocks. Gold is typically hosted in grey to white crystalline to chalcedonic quartz, which can sometimes be manganiferous, and is frequently associated with pyrite, marcasite, and minor amounts of chalcopyrite and sphalerite. Veins typically show epithermal colloform–crustiform banding and hydrothermal vein–breccia textures. High-grade veins are generally narrow (<1 m) but some may reach 20 m in width, while sheeted zones with stockworks can reach as much 75 m in width. Individual veins may be traced for long distances, as much as 2 km. The main gold-bearing mineral is electrum.
Exploration
Exploration activities completed by Filminera include geological mapping, pit mapping, stream sediment, rock chip, grab, channel and trench, and soil auger sampling. The mapping programs have identified alteration zones, fault traces, and quartz veins and quartz breccia zones. Geochemical sampling was used as a first-pass tool to define areas of gold anomalism, and has identified a number of prospects that warrant follow-up exploration. Geophysical data have been used to develop the broad lithological and structural framework for the Masbate Gold Project area. In many examples of known mineralization, magnetic lows are located along the margins of magnetic highs interpreted as unaltered rocks of andesitic composition.
The following areas are planned to be the subject of additional exploration: Pajo, Pajo Twin Peaks, Montana Southeast, OJT, Blue Quartz North, Lanang, Luy-A Mid, Balete North and Bart-Ag East.
- 34 -
Drilling
The current exploration drill hole database, as of December 31, 2016 contains 3,570 core and RC drill holes totalling 425,464 m. Of this total, 380 drill holes (39,985 m) are not used in the Mineral Resource estimate. Completed drilling in 2016 consisted of 89 core holes (11,422 m) and 65 RC holes (9,079 m).
All core from the Philippines Gold campaigns to date has been photographed as a record. RC chips and core are logged for geological and geotechnical information. Core recoveries are recorded. Currently, a standardized digital template is used for logging. Geological information collected includes lithologies, alteration types, vein percentages, sulphides and sulphide content, and structure. Geotechnical information collected includes weathering condition, type of structures, joint spacing, joint condition, and type of joint filling (e.g. gouge, mylonite, breccia, or vein). Magnetic susceptibility is also measured.
Methods used to survey drill hole collar locations have included theodolite, total station, and GPS instruments. Down-hole surveys have been performed at regular down-hole intervals using a number of different instrument types, including Tropari, Ausmine, Eastman, Proshot and Reflex instrumentation.
Due to the subvertical dip of most mineralized zones, the majority of the drill holes intersected them at low angles. As a result the mineralized thickness observed in drill holes does not correspond to the true thickness, which should be determined on a case-by-case basis.
Sampling, Analysis, and Data Verification
Depending on the drill program and drill type, sample lengths have varied from 1–1.5 m. Current sampling is typically conducted on 1 m intervals for RC, core and grade control drilling. Core is halved using a core saw. RC samples are riffle split and sampled using a rig-mounted Metzke cone splitter.
Sample preparation has used crush and pulverization criteria that were in line with industry norms at the time. Current protocols are crushing to 75% passing -2 mm and pulverising to 85% passing 75 µm. Gold assay methods have included AAS and fire assays, and these methods are still in use. The detection limit is 0.01 g/t Au.
Sample preparation and analytical laboratories used have included the following independent laboratories: McPhar Laboratories (accredited to ISO 9001:2000 for selected techniques), SGS Philippines (unknown), SGS Taiwan (ISO 9001 and ISO/IEC 17025), SGS Masbate (not accredited), Intertek, Manila (ISO/IEC 17025), and ACME/Bureau Veritas Vancouver (ISO/IEC 17025). The early sampling campaigns used the Atlas laboratory in Cebu, and the Masbate onsite mine laboratory, neither of which were accredited or independent.
Approximately 3,985 density measurements have been taken, using a range of techniques, including water immersion, waxed sample water immersion, direct measurement of whole core and direct measurement of half core.
Modern QA/QC programs have been in place since at least 2000, and include submission of blank, standard reference and duplicate materials with all sample batches submitted for sample preparation and analysis prior to submission of samples to the laboratory so as to monitor laboratory accuracy and precision, and sampling sequencing and precision. Current insertion rates are approximately one standard, one duplicate, and one blank for each 39 samples submitted. Failures are monitored as results are received and failed batches are resubmitted for assay. The database includes a notation explaining which assay is to be used.
Data imported into the project database are subject to validation, which includes checks on surveys, collar coordinates, lithology data, and assay data. The checks are appropriate, and consistent with industry norms.
Sample security practices were in line with industry norms prevailing at the time the sample was collected. Samples are currently stored in a secure facility prior to being shipped to the preparation and analytical laboratories.
A reasonable level of verification has been completed during the work conducted to date, and no material issues would have been left unidentified from the verification programs undertaken. No problems with the database, sampling protocols, flowsheets, check analysis program, or data storage were identified that were sufficient to preclude the use of the database for estimation purposes.
- 35 -
Mineral Processing and Metallurgical Testing
Metallurgical test work was performed by Atlas prior to commencing operations, and in support of feasibility studies that were undertaken in 1998 and 2006 respectively. These studies supported that the Masbate ores were amenable to conventional cyanidation processes. The feasibility studies completed sufficient variability test work to adequately characterise the material that was in the original mine plan.
At the request of B2Gold, SGS Minerals Services undertook a metallurgical variability test program from 2013–2015 to examine the response of samples from a number of mineralized zones to cyanide leaching using the CIL process. Additional test work was conducted to sufficiently characterize ores to be processed through the plant between 2015 and 2020, and for the LOM. The metallurgical test work completed to date is based on samples that adequately represent the variability of the proposed mine plan.
Average LOM gold recoveries across all deposits and zones are predicted to be 80% for oxide material, 76% for transition material, and 69% for fresh material, with an average overall recovery of 72% for all zones. Stockpiled materials are assigned an average metallurgical recovery of 75% for mine planning purposes.
There are no known deleterious elements that incur penalties in the doré. There are also no known elements in the material to be treated that may cause plant processing issues.
Mineral Resource and Mineral Reserve Estimates
Mineral Resources
The Mineral Resource estimate is based on data from RC and core exploration surface and underground drill holes, exploration trenches, and RC grade control drill holes.
The combined exploration and grade control drill hole database includes 82,399 drill holes (1,685,522 m) and 408 trenches (15,260 m). The exploration database cutoff date was October 27, 2016 and the grade control data cutoff date was August 30, 2016. A number of drill holes were removed from the estimation database because either the drill hole has no assays, or more recent drill hole information is available that supersedes information derived from older drill holes.
Block models constructed include mineralization domains, voids and backfilled historic mining shapes, oxidation surfaces, metallurgical recovery domains, and topographic surfaces.
Exploratory data analysis to determine appropriate domains and domain groups was conducted. Grade caps were applied prior to compositing, and were undertaken by domain. Grade caps ranged from 4–30 g/t Au. In rare cases, local capping is also used to restrict individual samples that may have undue influence after the domain cap is applied.
Grade composites for estimation are created using 3 m “best fit” lengths with hard boundaries on each domain group boundary, unless the domains are grouped together into a single domain group. The 3 m composite length is based on considerations including block estimate size, mining bench heights, mining selectivity and sample lengths.
Variography is completed on all domains and/or domain groups that have sufficient data. Where there are insufficient data for a domain or domain group, a “generic” variogram is used.
Estimation is completed for five types of domains; vein, halo (stockwork), surficial (eluvial/alluvial), dump, and mined-out/void/backfilled stopes. For each domain type, estimation is completed using OK, inverse distance weighting to the second power (“ID2”) and NN interpolation methods. For the halo domains, estimation is also completed using indicator kriging (“IK”), consisting of a single indicator at 0.35 g/t Au. For the final grade estimate, for halo domains, the IK value is used, and for all other domain types the grades estimated from OK are used. Estimation search ellipses were aligned along the vein trends and were based on continuity analysis. In all cases, estimation was completed in three passes.
- 36 -
Block models were validated by visual comparison of composite grades to block model grades on screen, swath plots and NN comparisons at zero Au cutoff grade. Overall, the block grade estimates reasonably match the input data.
Resource confidence classifications were assigned based on a combination of distance between drill holes and distance to the nearest composite. A number of smaller domains with few samples were entirely downgraded to the Inferred category. All stockpiles were classified as Indicated, while all surficial deposits (eluvial/alluvial) were assigned the Inferred confidence category.
Mineral Resources are confined within pit shells that used a gold price of $1,400/oz, and reported above an average gold cutoff grade of 0.42 g/t Au. The Mineral Resource pit shells were run using the same costs, recovery, and pit slope assumptions as those used to constrain the Mineral Reserve estimates.
Mineral Resource estimates for the Masbate Gold Project are reported from B2Gold’s Mineral Resource model that has an effective date of December 31, 2016. No Measured Mineral Resources were estimated.
Masbate Indicated Mineral Resources Statement
| Area | Tonnes
(t) |
Gold
Grade (g/t Au) |
Contained
Gold Ounces (oz) |
Contained
Gold Kilograms (kg) |
| South | 72,850,000 | 0.97 | 2,281,000 | 71,000 |
| North | 24,800,000 | 1.00 | 796,000 | 24,800 |
| ROM Stockpile | 1,370,000 | 1.42 | 63,000 | 1,900 |
| LG Stockpile | 27,790,000 | 0.57 | 509,000 | 15,800 |
| Total | 126,820,000 | 0.89 | 3,649,000 | 113,500 |
Masbate Inferred Mineral Resources Statement
| Area | Tonnes
(t) |
Gold Grade
(g/t Au) |
Contained Gold
Ounces (oz) |
Contained Gold
Kilograms (kg) |
| South | 6,730,000 | 0.73 | 157,000 | 4,900 |
| North | 3,360,000 | 0.77 | 83,000 | 2,600 |
| Total | 10,100,000 | 0.74 | 240,000 | 7,500 |
| Notes: | ||
| 1. |
Mineral Resources have been classified using the 2014 CIM Definition Standards for Mineral Resources and Mineral Reserves. Mineral Resources are reported inclusive of those Mineral Resources that have been modified to Mineral Reserves. Mineral Resources that are not Mineral Reserves do not have demonstrated economic viability. | |
| 2. |
All tonnage, grade and contained metal content estimates have been rounded; rounding may result in apparent summation differences between tonnes, grade, and contained metal content. | |
| 3. |
Mineral Resources are reported on a 100% attributable basis. Pursuant to the ore sales and purchase agreement between Filminera and PGPRC, our wholly-owned subsidiary, PGPRC has the right to purchase all ore from the Masbate Gold Project. | |
| 4. |
The Qualified Person for the estimate is Tom Garagan, P.Geo., who is our Senior Vice President, Exploration. | |
| 5. |
Mineral Resource estimates assume an open pit mining method, gold price of US$1,400/oz, modeled metallurgical recovery (resulting in average LOM metallurgical recoveries by pit that range from 65% to 82%), and operating cost estimates of US$1.50/t mined (mining), a variable ore differential cost by pit (average cost is US$0.17), US$9.36–10.18/t processed (processing) and US$2.30–3.84/t processed (general and administrative). | |
| 6. |
Mineral Resources are reported at an average cutoff of 0.42 g/t Au. | |
| 7. |
North and South designations refer to locations north and south of the Guinobatan River, respectively. | |
- 37 -
Mineral Reserves
Analysis was completed on the Mineral Resource block model to establish an estimate of economically extractable Mineral Reserves. Dilution, ore loss and metallurgical recovery factors were applied to the Mineral Resource model to create a diluted Mineral Reserve model which includes “recoverable” grade estimates.
Open pit optimization was completed on the recoverable grade estimates in the Mineral Reserve block model using commercially-available optimization software using physical and economic parameters including geotechnical characteristics, pit wall and ramp designs, pit access elevations, and mining and processing costs. Only blocks classified as Indicated were included in the pit runs. The economic parameters used for open pit optimization were used to create cutoff grades for reporting of Mineral Reserves. Final pit designs were completed by personnel at the mine site.
Mineral Reserves include stockpiled ore which is derived by mine staff from detailed survey pickup for volume calculation of individual stockpiles, with grade estimated from grade control. Mineral Reserves are contained within six main open pits with the Main Vein and Colorado pits being the largest.
Mineral Reserve estimates for the Masbate Gold Project are reported from our Mineral Resource model that has an effective date of December 31, 2016, and have been modified from the Indicated Mineral Resources. No Proven Mineral Reserves have been reported.
Probable Mineral Reserves Statement
| Area | Tonnes
(t) |
Gold
Grade (g/t Au) |
Contained
Gold Ounces (oz) |
Contained
Gold Kilograms (kg) |
| South | 48,160,000 | 0.98 | 1,519,000 | 47,200 |
| North | 17,950,000 | 1.03 | 593,000 | 18,400 |
| ROM Stockpile | 1,370,000 | 1.42 | 63,000 | 1,900 |
| LG Stockpile | 27,790,000 | 0.57 | 509,000 | 15,800 |
| Total | 95,290,000 | 0.88 | 2,683,000 | 83,500 |
| Notes: | ||
| 1. |
Mineral Reserves have been classified using the 2014 CIM Definition Standards for Mineral Resources and Mineral Reserves. | |
| 2. |
All tonnage, grade and contained metal content estimates have been rounded; rounding may result in apparent summation differences between tonnes, grade, and contained metal content. | |
| 3. |
Mineral Reserves are reported on a 100% attributable basis. Pursuant to the ore sales and purchase agreement between Filminera and PGPRC, our wholly-owned subsidiary, PGPRC has the right to purchase all ore from the Masbate Gold Project. | |
| 4. |
The Qualified Person for the estimate is Kevin Pemberton, P.E., who is our Chief Mine Planning Engineer. | |
| 5. |
Mineral Reserve estimates assume an open pit mining method, gold price of US$1,250/oz, modeled metallurgical recovery (resulting in average LOM metallurgical recoveries by pit that range from 65% to 82%), and operating cost estimates of US$1.50/t mined (mining), a variable ore differential cost by pit (average cost is US$0.17), US$9.36–10.18/t processed (processing) and US$2.30– 3.84/t processed (general and administrative). | |
| 6. |
Dilution and ore loss were applied through block averaging such that at a cut-off of 0.45 g/t Au, there is a 5% increase in tonnes, a 6% reduction in grade and 1% reduction in ounces when compared to the Mineral Resource model. | |
| 7. |
Mineral Reserves are reported at cutoffs that range from 0.46–0.49 g/t Au. | |
| 8. |
North and South designations refer to locations north and south of the Guinobatan River, respectively. | |
Except as disclosed elsewhere in this Annual Information Form, there are no undisclosed metallurgical, environmental, permitting, legal, title, taxation, socio-economic, marketing, political and other issues that the Company is aware of that may reasonably be expected to materially affect the Mineral Resources and Mineral Reserves estimates for the Masbate Gold Project.
- 38 -
Mining Operations
The mine is a conventional truck and shovel open pit operation. Mining activities will end by 2023 while stockpile processing will last until 2031. The mine plan assumes that all necessary permits will be granted in support of the mining operations, and that all the required surface rights can be obtained. The open pit mining sequence involves grade control drilling; drill and blast operations; excavation and hauling of materials to the process plant ROM pad, temporary low-grade ore stockpiles or waste rock storage facility. Mining operations are conducted under an owner-operator model, and activities are scheduled on a 24 hour, seven day per week basis.
Information derived from geotechnical and exploration drilling carried out at the various deposits, together with hydrogeological assessments (where available) and subsequent wall stability analyses and assessments, have been used to prepare “base case” wall design parameters at the feasibility level, which are considered suitable for use for mining purposes. The pit slope design recommendations were provided for the operation by third-party consultants George, Orr and Associates.
Hydrogeological assessments have been performed for the Main Vein, Colorado and Montana open pits. Water management practices envisage use of depressurization holes where necessary, and the potential use of vibrating wire piezometers. No hydrogeological information is currently available for the areas of the satellite pits, and the projected mine plans for these areas should allow for wall depressurisation drilling.
An average of 34 Mtpa of ore and waste will be mined from six different LOM pits. The projected average annual mill throughput is 6.5 Mtpa.
The mining and support equipment fleet has been consistent for the period 2013 to 2016, and is currently capable of annual total movement of 25 Mtpa, to meet the rate proposed in the LOM plan. The increase in the total movement rate to 35 Mtpa will require the addition in 2017 of an additional excavator, six haul trucks and associated support equipment. Replacement of a large proportion of the existing mining equipment that is currently near the end of its economic life is scheduled during the period 2017–2019. Replacement units have a projected economic life sufficient to achieve the completion of mining activities in 2023.
The table below indicates the 2016 actual and 2017 planned production.
Production Guidance
| 2016 Actuals | 2017 Guidance/Budget | |
| Gold production (100 basis%; Au oz) | 206,000 | 175,000–185,000 |
| Tonnes milled (t) | 6,921,000 | 6,800,000 |
| Grade milled (g/t Au) | 1.23 | 1.13 |
| Recovery (%) | 75 | 71.4 |
- 39 -
Processing and Recovery Operations
The process plant is a conventional CIL type facility consisting of primary crushing, two-stage SAG/ball mill grinding with pebble crushing, leaching, carbon adsorption; elution, electrowinning and smelting gold recovery stages; and a cyanide detoxification stage treating process plant tails before disposal in a TSF. Material is ground to 150 µm, and the leach residence time is 28 hours.
Materials handling within the plant consists of 13 conveyor belts that are used to transport ore from the primary and supplementary crushing plants to the grinding and classification area. A 2.1 km long, 630 mm operative diameter high-density polyethylene tailings line runs from the process plant to the TSF.
The plant underwent an upgrade to 6.5 Mtpa in 2016. Currently, using the hardest ore types, the plant can treat 6.5 Mtpa consistently for the LOM. If softer ores are milled, the plant can reach 6.8 Mtpa.
The primary source of process water (85%) is from the tailings dam. The remaining 15% of requirements is provided by water sourced from a weir constructed on the Guinobatan River. Power is generated from the minesite power house which operates on an n+1 configuration (four duty generators, one standby generator), which is a safeguard to ensure that an uninterruptable power supply is always available. An additional generator which will be installed and commissioned by the fourth quarter of 2017 will provide n+2 capability.
No market studies are currently relevant as Masbate is an operating mine producing a readily-saleable commodity in the form of doré. Doré produced by PGPRC typically contains 60% Au and 40% Ag. The doré is exported to Switzerland.
Infrastructure, Permitting, and Compliance Activities
The mine area is fully serviced with roads that currently connect the open pit mines, process plant area, and accommodations areas. The mine airstrip is suitable for daylight operations and is used to transport critical personnel and spare parts. The causeway at Port Barrera is used for barge transport of heavy equipment, lime, bulk materials, spare parts, and other oversized items. A 30 MW heavy fuel oil fueled power plant provides power to the operations.
The TSF was formed by cross-valley type earth fill embankments. The Stage 10 lift from 51 metres Reduced Level (“mRL”) to 54 mRL is scheduled to be commissioned in 2018. Construction to a final height of 71 mRL will be achieved by a continuation of progressive uplifts (Stage 11 to Stage 16) and will require the addition of several additional saddle dams and incorporation of the existing division dam into the main body of the TSF.
Water storage and water management is currently performed through construction and progressive improvement of sediment ponds, silt traps, silt fence, drainage systems, re-vegetation works and appropriate bund walls along haul/access roads, and operations of a number of water storage weirs.
Filminera's environmental protection and management programs have been carried out since the commencement of operations. This was guided by the conditions stipulated in the issued Environmental Compliance Certificate (“ECC”) and outlined/described in the approved Environmental Protection and Enhancement Program, including the Environmental Impact Assessment (“EIA”) documents of the Masbate Gold Project to meet all the necessary regulatory and company standards.
Environmental risk assessments, together with a formal environmental audit and review of ECC conditions are also performed periodically through initiatives by Filminera. Independent consultants, such as GAIA South, BMP Environmental Care of the Philippines, and Integrated Environmental Systems Pty. Ltd. of Australia, have also been used to externally validate environmental compliance and program implementation.
Filminera obtained ISO14001 certification in 2016, and has implemented various environmental monitoring programs, construction/installation of environmental control measures and other initiatives.
- 40 -
B2Gold maintains a comprehensive listing of permitting requirements and key operational documents. The key permits are the MPSAs. Significant permits and documents for the operation include the following:
|
• |
Environmental Compliance Certificate; | |
|
• |
Environmental Protection and Enhancement Program and the Annual Environmental Protection and Enhancement Program, being an annual update of the original document; | |
|
• |
Final Mine Rehabilitation and Decommissioning Plans; | |
|
• |
Waste Water Discharge Permits for key installations including the TSF, water treatment plant, sewerage treatment plants and batching plant; | |
|
• |
Permits to Operate for power generation; | |
|
• |
Importation Clearances; | |
|
• |
Chemical Control Orders; | |
|
• |
Hazardous Waste Generator Registry Certificates. |
Renewal of these documents is an ongoing process for the company depending on the circumstances of the operation and individual permit requirements.
The Company also holds a mineral processing permit, and two additional permits, a Special Forest Land Use Permit and Special Land Use Permit were granted for infrastructure construction and operation outside the MPSA areas, including TSF, WRSFs, and airstrip. Additional permits will be required in support of mining operations at the planned satellite open pits. Permitting activities are underway; however, under Memorandum #1 dated July 8, 2016, the DENR issued a moratorium on the approval of all new mining projects including acceptance, processing and/or approval of applications for mining permits. Memorandum #1 was issued in connection with the audit of existing mines in the Philippines conducted by the DENR in 2016 and it is anticipated, though there can be no assurance, that it will be rescinded once such audit is completed. In addition, Executive Order #79 (“EO#79”) issued on July 6, 2012 provides that no new MPSAs shall be entered into until legislation rationalizing revenue sharing is in effect. However, EO#79 provides that the DENR can continue to grant EPs and the Philippines Mines and Geosciences Bureau has indicated that it will continue to issue permits at existing mine operations notwithstanding EO#79, since these are not part of new MPSAs. Once Memorandum #1 is rescinded, we do not expect that EO#79 will prevent B2Gold from obtaining the permits necessary to conduct planned satellite pit operations.
The community relations group is responsible for the establishment and strengthening of relationships with the various stakeholders to obtain and maintain social acceptability of the operations in the area. Stakeholders include the residents of the host and neighboring communities, local government units (provincial, municipal and barangays), national and regional government agencies, media group, various churches, non-governmental organisations (“NGOs”), educational institutions and the Philippine National Police and Military.
Closure costs, including a 10-year post-closure monitoring program, are estimated at approximately $21.9 million. These costs are revised annually as part of the Asset Retirement Obligation of the Company.
Capital and Operating Costs
Capital Costs
Sustaining capital costs are based on operational experience and LOM projections. The table below presents the 2016 actual costs, the 2017 budgeted costs and the estimated capital costs for the LOM, including 2017.
Capital Costs (US$ million)*
| 2016 Actual | 2017 Budget | LOM Estimated (including 2017) | |
|
Mining |
4.4 | 34.3 | 103.7 |
|
Processing |
18.6 | 12.4 | 76.3 |
|
Site General |
4.4 | 3.7 | 22.7 |
|
Total |
27.4 | 50.4 | 202.7 |
*Note: Totals may not sum due to rounding. The projected LOM for the Masbate Gold Project is approximately six years of mining and approximately 14 years of processing. The capital costs include tailings dam expansions, and standard sustaining costs for mining, processing and general and administration costs for the 14 years of mine life. They also include the expansion fleet for the mine and power expansion in the process plant.
- 41 -
Operating Costs
Actual 2016, budgeted 2017, and estimated LOM operating costs are provided in the table below.
Operating Costs (US$/t)*
| Units | 2016 Actual | 2017 Budget | LOM Estimated (including 2017) | |
|
Mining |
$/t mined | 1.34 | 1.25 | 1.50 |
|
Processing |
$/t processed | 7.58 | 8.28 | 9.36–10.18 |
|
Site General |
$/t processed | 3.67 | 3.67 | 2.30–3.84 |
*Note: Costs are variable depending on whether ore is classified as low-grade or high-grade, and whether the mill feed is classified as oxide or fresh (primary). Costs are based on whether the material being processed is stockpiled or insitu material. The projected LOM for the Masbate Gold Project is approximately six years of mining and approximately 14 years of processing. Operating costs include all mining, processing and general and administration costs including pre-stripping. A variable ore differential cost, averaging US$0.17, is also applied.
The capital cost estimates and operating cost estimates in the tables above are based on the Company’s current estimates and mine plan for the Masbate Gold Project. Our costs in subsequent years may vary significantly from our 2017 and LOM cost estimates as a result of, among other things, current or future non-recurring expenditures, changes to input costs and exchange rates and changes to our current mining operations or mine plan. Our current mine plan for the Masbate Gold Project is based on existing Mineral Reserves. We conduct ongoing exploration and analyses at our operating mines with a view to identifying new Mineral Resources and upgrading existing Mineral Resources to higher confidence levels and potentially into new Mineral Reserves. If new Mineral Reserves are successfully identified it may alter the current mine plan and potentially extend the mine life.
Exploration, Development, and Production
Exploration on the Masbate Gold Project in 2017 has a budget of approximately $5 million, directed to both brownfields infill drilling and testing regional targets for potential near-surface open pit material or higher grade underground targets.
In 2016 mining was conducted in the Main Vein and Colorado open pits. The mine plan will be very similar in 2017, with mining also focused on the Main Vein and Colorado areas. Mining will continue from the Main Vein Stage 3 pushback. In 2017, the Masbate Gold Project is budgeted to process an average of 18,630 tonnes of ore per day for a total of 6.8 million tonnes of ore for the year. Gold grades processed are expected to average 1.13 g/t and gold recoveries are anticipated to average 71.4% . Mill feed is budgeted to consist of 78% transitional/fresh ore and 22% oxide ore. Mining activity is expected to focus on the continued development of the newly widened Colorado pit, development of Main Vein Stage 3 pit and continued operations in Main Vein Stage 2 pit. The Main Vein Stage 1 pit has now been completed.
Gold production in 2017 is expected to be between 175,000 and 185,000 ounces. Masbate Gold Project’s 2016 production benefited from better-than-expected grades from the Main Vein Stage 1 pit and higher recoveries arising from higher-than-budgeted oxide ore from the Colorado pit.
Otjikoto Mine
Certain portions of the following information are derived from and based on the technical report entitled “NI 43-101 Technical Report Feasibility Study: Otjikoto Gold Project, Province of Otjozondjupa, Republic of Namibia” dated February 25, 2013 prepared by, among others, the following Qualified Persons: William Lytle, P.E., Tom Garagan, P.Geo., Hermanus Kriel, Pr.Eng., Glenn Bezuidenhout, Pr.Eng., FSAIMM and Guy Wiid, Pr.Eng., (the “Otjikoto Feasibility Study”) and is based on the assumptions, qualifications and procedures set out therein. For a more detailed overview of the Otjikoto Mine, please refer to the Otjikoto Feasibility Study, which is available on SEDAR at www.sedar.com. Information that post-dates the Otjikoto Feasibility Study is provided by the Company.
- 42 -
Property Description, Location, and Access
The Otjikoto Mine is located in the north-central part of the Republic of Namibia. It is situated approximately 300 km north of Windhoek, the country’s capital, within the Province of Otjozondjupa. The Otjikoto Mine can be accessed off the main B1 road, a primary paved road, from the towns of Otjiwarongo or Otavi located approximately 70 km to the southwest and 50 km to the northwest of the Otjikoto Mine respectively.
Mining Licence (“ML”) 169, covering an area of 6,933.99 ha was granted for a 20 year term, expiring in December, 2032. It can be renewed for a second 20 year term. Surrounding ML169 is an Exclusive Prospecting License (“EPL”) 2410 that has expired and is currently undergoing its 8th renewal of the license, which they do not anticipate any issues receiving approval thereof. EPL2410 has a total area of 47,919 ha (inclusive of ML169). Maintaining ML169 requires payment of an annual fee, development of a works program, environmental compliance, commitment to seek local suppliers for fuel and lubricants, approval of the product take-off agreement, and payment of taxes by permanent employees in Namibia. Maintaining EPL2410 requires payment of an annual fee of N$5,000 and filing of quarterly exploration reports with the Ministry of Mines and Energy (“MME”) and biannual environmental reports with the Ministry of Environment and Tourism (“MET”). Exploration is conducted under the terms of an Environmental Compliance Certificate issued by the MET on June 20, 2002. The ECC was renewed by the MET on February 11, 2013. B2Gold Namibia holds one additional EPL in the Otjikoto area and eight additional EPLs in other areas of Namibia.
B2Gold Namibia (formerly Auryx Gold Namibia (Proprietary) Limited) is 90% owned, indirectly, by B2Gold and 10% by EVI.
We have purchased and consolidated a number of farms into B2Gold Namibia Property (Proprietary) Limited (“B2Gold Namibia Property”), including the Wolfshag, Otjikoto, Gerhardshausen, Okaputa Nord I, and Erhardtshof farms. We hold the surface rights through these farms, and all mine infrastructure and the mine itself are situated within property owned by B2Gold Namibia Property. No additional surface rights are required to support our mining operations.
The Namibian Minerals Act levies a royalty of 3% on the net sales of gold and silver. A VAT of 15% applies to domestic goods and services and 16.5% to imported goods and services. A refund on the 15% VAT on domestic goods and services is available.
The Income Tax Amendment Act, 2015 which, under section 35B inserted into the Income Tax Act, 1981, has introduced a 10% withholding tax on interest payable to non-resident lenders.
To the extent known there are no other significant factors or risks that might affect access or title, or the right or ability to perform work on, the property, including permitting and environmental liabilities to which the project is subject that are not discussed in this Annual Information Form.
History
All of the early exploration activity from the 1960s to the late 1990s focused on base metals. Companies involved included Kennecott Exploration, Falconbridge, Tsumeb Corporation, Anglo American, and Gold Fields Prospecting. However, only a limited portion of the current licenses were held and explored by these companies.
Due to the thickness of cover material, the primary exploration tool was geophysics. Completed surveys included ground magnetics, IP, time domain EM, controlled source audio magnetotellurics, natural source audio magnetotellurics, and frequency domain EM.
- 43 -
During 1998–1999, Avdale Namibia (Proprietary) Limited, a predecessor company to B2Gold Namibia and originally incorporated as a subsidiary of Anglo American, drill tested an intense 9 km long linear magnetic feature centered on the Otjikoto farm, and observed visible gold at the base of some RAB drill holes. Work conducted since the discovery is described under “Otjikoto Mine – Exploration”.
There is no known gold or base metals production prior to our development of the mine. Several small-scale amethyst quarries are present on the property but not in the immediate area of the main deposit. There are no historical estimates that are relevant to the current Mineral Resources and Mineral Reserves.
Geological Setting, Mineralization, and Deposit Types
The Otjikoto deposit is located within the Damara Mobile Belt, within the northern portion of the northeasterly striking “Intracratonic Branch” of the belt. It is considered to be an example of an orogenic-style gold deposit.
The Otjikoto area is predominantly underlain by lithologies belonging to the Neoproterozoic Swakop Group. The Okonguarri Formation hosts the gold mineralization and is overlain and underlain by glacial diamictite horizons of the Ghaub and Chuos Formations, respectively. The Okonguarri Formation consists primarily of thick units of dark grey carbonaceous marble, biotite-schist, graphitic schist and calc-silicate horizons. The schist units are derived from semi-pelitic, pelitic, marl and psammitic units in a turbiditic sedimentary package. The rocks in the Otjikoto area have experienced at least three phases of moderate to tight folding and some thrust faulting. They have also been affected by extensive metasomatism, followed by prograde regional metamorphism that has reached upper greenschist to lower amphibolite facies.
Mineralization in the main Otjikoto deposit is hosted by a north–northeast striking sheeted sulphide (+ magnetite)–quartz + carbonate vein system that has a strike length of about 2.3 km, and extends at depth to at least 475 m below surface. The gold occurs in a series of thin (commonly <10 cm) sheeted veins in the schist and granofels (meta-marls) of the Upper and Middle Okonguarri Formation. The veins and associated mineralization form a series of en-echelon zones oriented at approximately 010–020° north–northeast and plunging at 10–15° (average 12°) to the south–southwest. The majority of the mineralization in the main Otjikoto deposit is hosted in the Central and West shoots. Gold occurs within the vein system as coarse native gold particles that can vary from 5–400 µm, averaging about 100µm in size. Gold can occur adjacent to and within sulphides, along fractures, adjacent to and within garnets, within magnetite, on the edges of amphiboles and chlorite, and as free gold in quartz and carbonate. Mineralization remains open down plunge as presently tested.
Mineralization in the Wolfshag deposit occurs as a rod-like, south–southwest-plunging zone of mineralization coincident with areas of tight to isoclinal folding on the east-southeast side of the west marble. Mineralization is associated with generally concordant (bedding parallel) vein zones that occur within an altered meta-sandstone unit. Wolfshag mineralization occurs as calcite–pyrite veins with minor magnetite and pyrrhotite. The mineralized zone is about 1.6 km long, and extends for about 1,750 m down plunge to a depth of 650 m below surface. The majority of the mineralization occurs within the upper shoot, the WA zone, with the highest grades associated with a fold nose. Gold mineralization generally decreases outward from the fold nose along more favourable strata in the limbs of the fold. The high-grade shoots in the Wolfshag zone plunge at 10–15° to the south–southwest, a direction that is similar to that displayed by the Otjikoto deposit shoots. Individual veins vary in true thickness from a few millimetres to as much as a metre, with vein zones having a true thickness that varies from 20 m in the fold nose of the WA shoot to a few metres along the limbs. The Wolfshag zone remains open at depth down plunge to the southwest.
Exploration
Exploration activities completed by the Company include geological mapping, geochemical soil sampling, airborne geophysical surveys (Aster satellite imagery, electromagnetics, magnetics and radiometrics), and ground geophysical surveys (magnetics, IP).
Airborne geophysical data indicated a distinct magnetic high, and a strong electromagnetic signature over the Otjikoto deposit area. Electromagnetic data interpretations were also useful for delineation of marble horizons. The pole–dipole IP survey proved useful at defining zones with disseminated pyrite and thin lenticular pyrite veins in schist and black shale. Geochemical surveys have identified zones of anomalous gold; however, the coarse gold which is characteristic of the deposit makes it difficult to get a representative sample at any sample site.
- 44 -
During 2016, geological, geophysical and geochemical data in the Otjikoto brownfields area was re-evaluated and a combination of core, RC, and RAB exploration core drill holes were completed on several targets.
Our current and planned exploration activities are discussed under “Otjikoto Mine - Exploration, Development, and Production”.
Drilling
Drilling has been completed in support of exploration evaluations, Mineral Resource and Mineral Reserve estimates, mine planning, geotechnical and hydrogeological evaluations, and infrastructure site sterilization and condemnation drilling. Drilling as of December 31, 2016 on all projects in Namibia includes 1,380 core holes (283,829 m), 509 RC holes (46,876 m) and 1,168 RAB holes (34,245 m).
For the Mineral Resource model, a total of 1,451 core and RC drill holes (248,206 m) were completed between 1999 and October 30, 2015. Of the total, drill holes with assays available include 878 core holes (201,083 m) and 437 RC holes (37,088 m) for a total of 1,315 drill holes (238,171 m). Drill holes with no assays available (geological logging was used for stratigraphic models) include 125 core (9,211 m) and 11 (825 m) RC holes for a total of 136 drill holes (10,036 m).
Subsequent to the Mineral Resource estimate database closeout date, drilling has included 67 core holes (15,740 m), 22 RC holes (4,432 m) and 270 RAB holes (5,339 m).
Sieved RAB samples, RC chips, and core are logged. Core is photographed and recoveries are recorded. Drill hole collar locations are surveyed by a contract professional land surveyor. Down-hole surveys are performed at regular down-hole intervals using Reflex Ez-shot instrumentation. At Otjikoto, 92% of the drill holes were drilled with a vertical inclination. Of those holes drilled with an inclination of < 85º, 80% of these were drilled with an azimuth between 300º and 360º magnetic north.
Sampling, Analysis, and Data Verification
RC samples are collected at 1 m intervals in plastic bags using a cyclone, and split at the drill site using a riffle splitter. Two sample splits are initially produced. A portion of one sample is used for logging purposes. The split samples are transported to the core yard, where they are further split to produce an assay sample, a field duplicate, and a reference sample. Initially, core was typically sampled at 1 m intervals, with a minimum 30–40 cm sample. In 2012, the protocol was changed such that sampling respected the geology. Not all core is sampled. The mineralized zones and a shoulder 3–5 m above and below the mineralized zones are sampled continuously. However, in narrow mineralized zones that are separated by more than 3 m of waste material, a gap in the sampling is allowed.
During the initial exploration programs, Chemex Laboratories, Toronto, Canada and Anglo American Research Laboratories, Johannesburg RSA were used as preparation and analytical laboratories. The laboratories were independent of us, and certified for selected analytical techniques. During definition drilling, analytical laboratories used included SGS Lakefield Research Africa (Pty) Ltd, Moruo Analytical Services and Intertek Genalysis, of Johannesburg, South Africa and Perth, Australia, respectively. Most laboratories also performed sample preparation; however for the Intertek analysis, sample preparation was undertaken at Intertek Genalysis, Walvis Bay, Namibia. Laboratories held accreditations, and were independent of B2Gold. For current programs, ALS Minerals (“ALS”) Swakopmund or ALS Johannesburg is used for sample preparation, ALS Johannesburg for primary analysis and Bureau Vertitas, Swakopmund, Namibia as the check laboratory. All laboratories have accreditations for selected analytical techniques and are independent of the Company.
- 45 -
Sample preparation consists of drying, crushing to -2 mm, and pulverizing to 106 μm. Gold grades are determined using a screen fire assay methodology with either an atomic absorption (“AA”) (<10ppm gold) or gravimetric finish (>10 ppm gold). In addition to gold assays, a multi-element suite of 22 elements can be requested for exploration assays. The most frequently-used multi-element analytical techniques include inductively-coupled plasma mass spectrometry (“ICP-MS”), inductively-coupled plasma atomic emission spectroscopy (“ICP-AES”) and X-ray fluorescence. Sulphur and carbon are also assayed for, using either a LECO or similar carbon and sulphur analyzer.
Density determinations are performed by site personnel on RC and whole core samples using either the water displacement method or pycnometer testing. There are currently a total of 26,008 measurements.
QA/QC measures include regular insertion of certified reference material, field duplicate and blank sample materials prior to submission of samples to the laboratory to monitor laboratory accuracy and precision and sampling sequencing and precision. QA/QC sample insertion rates are typically at the rate of 1:20, but can be at 1:38 for selected sample types. QA/QC results are reviewed daily, and monthly QA/QC reports are prepared documenting the laboratory performance. In addition to the geological QA/QC samples inserted and evaluated during drill programs, the individual laboratories provide their internal QA/QC information with each certificate of analysis. Examination of the QA/QC sample data by our personnel indicates that there was generally satisfactory performance of field sampling protocols and that the assay laboratories are providing reasonable levels of service. The overall precision of the various laboratories is poor, about 20% for pulp duplicates. This is due to the high nugget component of the gold mineralization. The main potential impact of the poor precision is in grade control (ore-waste boundary) around the cutoff grade. Check assays included submission of about 14% of pre-2012 RC and drill core samples to ALS. Given the nuggety nature of the mineralization, the check assay results from ALS correlate reasonably well with those generated by Intertek Genalysis. There is also a QA/QC program in place for density determinations.
Data imported into the project database are subject to validation, which includes checks on surveys, collar coordinates, lithology data, and assay data. The checks are appropriate, and consistent with industry norms. Independent data verification has been undertaken in support of previous technical reports on the project, including by Resource Services Group (2005), and SRK (2007, 2009). Bloy Mineral Resource Evaluation reviewed the database in 2011. Database checks are conducted internally by site database managers, verified independently by our international database manager, and further checked and verified by the personnel responsible for modeling and grade interpolation.
The checks done in previous audits and the continuous QA/QC checks completed by our database administrators, project geologists and international database manager are in line with industry standards for database verification. Our project and QA/QC managers continue to monitor and optimize sampling protocols, sample preparation and analysis flowsheets and check analysis programs to ensure the highest quality of data is made available for mineral resource estimations. The project database is acceptable for use in Mineral Resource and Mineral Reserve estimation.
Sample security measures practiced included moving of RC samples and core from the drill site to the secure B2Gold core yard in Otjiwarongo. Sample shipments are tracked using industry-standard procedures. We are of the opinion that the core storage is secure because access to the Otjiwarongo core yard is strictly controlled and a B2Gold representative has always been present in the camp.
Mineral Processing and Metallurgical Testing
Metallurgical test work has been primarily performed by SGS Lakefield. Additional testing facilities included Jenike & Johanson (materials handling), Rocklab (unconfined compressive strength tests), CANMET (leach optimization), and FLS-Knelson (gravity concentration and intensive leach tests).
Completed test work included materials handling, comminution, unconfined compressive strength tests, chemical composition and mineralogy, leach and gravity tests, leach optimization, leach variability tests, carbon adsorption test work and modelling, cyanide destruction test work, gravity concentration and intensive leach test work, sedimentation and rheological tests, bench scale sedimentation tests, and environmental and geotechnical testing.
- 46 -
Based on analysis of results the following conclusions can be drawn from the test work programs:
|
• |
The variation in head grade between metallurgical composites is an indication of the presence of coarse nugget gold in the samples. Base metal assays were low, and levels of mercury, organic carbon, arsenic, antimony and bismuth were such that they would not present metallurgical processing issues. | |
|
• |
Overall gravity circuit gold recoveries for the three metallurgical recovery composites were very good, ranging from 94.8% to 98.3%. | |
|
|
• |
The optimized leach tests indicated high gold recovery for all ore types. |
|
|
• |
No preg-robbing was noted in the composites. |
|
• |
85th percentile grindability data were used for sizing the grinding circuit and to select the mill power and SAG and ball mill to satisfy plant throughput requirements for both the SAG mill/ball mill and SABC circuit configurations. | |
|
• |
Gravity concentrate intensive leach tests for two of the composites indicated a gold recovery of 99.7% and 99.9% respectively after 48 hours of leaching. The third composite returned +99.9% recovery after 80 hours of leaching. | |
|
|
• |
A mill grind of 80% passing 75 μm (200 mesh) was selected as the design basis. |
|
• |
Flocculant screening showed that an anionic polyacrylamide flocculant with a high molecular weight and medium charge density produced the best settling rates and overflow clarity for all ore types. | |
|
|
• |
SO2/Air cyanide destruction produced acceptable results that met weak acid dissociable cyanide targets. |
No deleterious elements are present in the doré.
Mineral Resource and Mineral Reserve Estimates
Mineral Resources
Otjikoto Model
Interpretations of mineralized zones were created using logged lithology, vein percent, sulphide abundance and gold grade at a nominal 0.3 g/t Au threshold. Grades slightly below 0.3 g/t Au were included along the margins of zones or along strike/dip to maintain continuity. Mineralized zones were divided into eight different stratigraphic/structural domains. Assays were capped prior to compositing at 2 m intervals. The mean densities of whole core samples by major rock type, weathering, and mineralization state were applied to the block model.
A lithology model was created by interpolating an indicator using ID2 for the major rock types. Wireframe models of oxidation/weathering were applied to the block model. Metallurgical domains were defined by oxidation state and dominant sulphide composition, and a polygon “cookie-cutter” was used to tag the block model with these domains.
A grade indicator was created at a nominal 0.8 –0.9 g/t Au threshold. The indicator and high- and low-grade values were estimated using OK. The high and low grades were combined into a single block grade using an 80/20 rule (if the indicator value was greater than 0.8, the block was assigned the high-grade kriged value; if the indicator was lower than 0.2, the block was assigned the low-grade kriged value; between 0.2 and 0.8 the high and low grades were combined using the indicator as the weighting). Block grade estimates were validated by visual comparison to composite grades, comparison of global block statistics to the NN model, and swath plots to check for local bias. In addition, global change-of-support adjusted distributions were compared to block model grade–tonnage curves.
Drill spacing up to 25 x 50 m is categorized as Indicated Resources, and drill spacing beyond Indicated and up to 100 x 100 m is categorized as Inferred. No Measured Mineral Resources were estimated.
Wolfshag Model
Mineralized zones were created using lithology, vein percent and sulphide abundance and a nominal 0.3 g/t Au threshold. Internal to this, a high-grade zone associated with higher percent veining was created at a nominal 2 g/t Au threshold. There are four major stacked domains at Wolfshag named WA to WE, from top to bottom. Assays were capped prior to compositing to 3 m lengths. Mean densities by major rock type, weathering, and mineralization state were applied to the block model. A lithology model was created from detailed 3D geological interpretations of thrusts and marble units.
- 47 -
Grade was interpolated into the block model using OK with hard boundaries between major domains and grade shells. Block estimates were validated by visual comparison to composites, comparison of global block statistics to declustered means, and swath plots to check for local bias. In addition, global change-of-support distributions were compared to block model grade–tonnage curves.
For mineralization amenable to open pit mining, blocks within areas of 25 x 50 m or closer drill spacing were categorized as Indicated. Blocks within 50 x 50 m were categorized as Inferred. Despite meeting the spacing requirements, all blocks in the lower zones (WC–WE) were categorized as Inferred due to uncertainty in the continuity of zones. For underground resource reporting, all blocks within 50 x 50 m spaced drilling were categorized as Inferred. No Measured Mineral Resources were estimated.
Otjikoto and Wolfshag Reporting
The Otjikoto and Wolfshag models were combined prior to pit optimization. Reasonable prospects of eventual economic extraction were assessed by reporting Mineral Resources within a US$1,400/oz Au pit shell and cost estimates as of 2016. Mineral resources amenable to underground mining at Wolfshag are reported from the continuous high-grade zones outside of the open pit resource estimate and above a cutoff grade of 3.0 g/t Au.
Mineral Resource estimates for the Otjikoto Mine are reported from B2Gold’s Mineral Resource model dated December 2015. Models have been depleted to December 31, 2016 topography. The effective date of the Mineral Resources is December 31, 2016. No Measured Mineral Resources were estimated.
Otjikoto Indicated Mineral Resources Statement
|
Area |
Tonnes (t) | Gold Grade (g/t Au) | Contained Gold Ounces (oz) | Contained Gold Kilograms (kg) |
| Otjikoto | 22,900,000 | 1.14 | 839,000 | 26,100 |
| Wolfshag | 3,300,000 | 2.85 | 303,000 | 9,400 |
| ROM Stockpile | 1,480,000 | 1.00 | 48,000 | 1,500 |
| LG Stockpile | 2,720,000 | 0.46 | 40,000 | 1,200 |
| Total | 30,410,000 | 1.26 | 1,230,000 | 38,200 |
Otjikoto Inferred Mineral Resources Statement
| Area | Tonnes (t) | Gold Grade (g/t Au) | Contained Gold Ounces (oz) | Contained Gold Kilograms (kg) |
| Otjikoto Open Pit | 150,000 | 0.70 | 3,000 | 100 |
| Wolfshag Open Pit | 260,000 | 0.68 | 6,000 | 200 |
| Wolfshag Underground | 1,300,000 | 6.92 | 290,000 | 9,000 |
| Total | 1,720,000 | 5.42 | 299,000 | 9,300 |
| Notes: | ||
| 1. |
Mineral Resources have been classified using the 2014 CIM Definition Standards for Mineral Resources and Mineral Reserves. Mineral Resources are reported inclusive of those Mineral Resources that have been modified to Mineral Reserves. Mineral Resources that are not Mineral Reserves do not have demonstrated economic viability. | |
| 2. |
All tonnage, grade and contained metal content estimates have been rounded; rounding may result in apparent summation differences between tonnes, grade, and contained metal content. | |
| 3. |
Mineral Resources are reported on a 90% attributable basis; the remaining 10% interest is held by EVI. | |
- 48 -
| 4. |
The Qualified Person for the estimate is Tom Garagan, P.Geo., who is our Senior Vice President, Exploration. |
|
| 5. |
Mineral Resource estimates that are amenable to open pit mining methods assume a gold price of US$1,400/oz, metallurgical recovery of 98%, and operating cost estimates of US$1.75/t mined (mining), US$13.00/t processed (processing) and US$3.00/t processed (general and administrative). |
|
| 6. |
Mineral Resources that are amenable to open pit mining are reported at a cutoff of 0.40g/t Au. Mineral Resources that are amenable to underground mining are reported at cutoff of 3.00 g/t Au. |
Mineral Reserves
Indicated Mineral Resources were converted to Probable Mineral Reserves following consideration of the following modifying factors and an optimized open pit design. After process upgrades the mill throughput has been increased to 3.3 Mtpa. The metal price assumption was US$1,250/oz, dilution and ore loss were applied through whole block averaging such that both are variable by block, and process recoveries were 98% based on operational results. Operating costs assumed $1.75/t mined for mining costs, US$13.00/t ROM ore for processing costs, and general and administrative costs of US$3.00/t.
Mineral Reserve estimates for the Otjikoto Mine are reported from B2Gold’s Mineral Resource model that has an effective date of December 31, 2016, and have been modified from the Indicated Mineral Resources. No Proven Mineral Reserves have been reported.
Probable Mineral Reserves Statement
| Area | Tonnes (t) | Gold Grade (g/t Au) | Contained Gold Ounces (oz) | Contained Gold Kilograms (kg) |
| Otjikoto | 15,580,000 | 1.24 | 622,000 | 19,400 |
| Wolfshag | 3,350,000 | 2.56 | 276,000 | 8,600 |
| ROM Stockpile | 1,480,000 | 1.00 | 48,000 | 1,500 |
| LG Stockpile | 2,720,000 | 0.46 | 40,000 | 1,200 |
| Total | 23,140,000 | 1.33 | 986,000 | 30,700 |
| Notes: | ||
| 1. |
Mineral Reserves have been classified using the 2014 CIM Definition Standards for Mineral Resources and Mineral Reserves. | |
| 2. |
All tonnage, grade and contained metal content estimates have been rounded; rounding may result in apparent summation differences between tonnes, grade, and contained metal content. | |
| 3. |
Mineral Reserves are reported on a 90% attributable basis; the remaining 10% interest is held by EVI. | |
| 4. |
The Qualified Person for the estimate is Peter Montano, P.E., who is our Project Director. | |
| 5. |
Mineral Reserves that will be mined by open pit methods assume a gold price of US$1,250/oz, metallurgical recovery of 98%, and operating cost estimates of US$1.75/t mined (mining), US$13.00/t processed (processing) and US$3.00/t processed (general and administrative). | |
| 6. |
Dilution and ore loss was applied through block averaging such that at a cutoff of 0.45 g/t Au, there is a 1% decrease in tonnes, a 4% reduction in grade and 5% reduction in ounces when compared to the Mineral Resource model. | |
| 7. |
Mineral Reserves are reported at a cutoff of 0.45 g/t Au. | |
Except as disclosed elsewhere in this Annual Information Form, there are no undisclosed metallurgical, environmental, permitting, legal, title, taxation, socio-economic, marketing, political and other issues that the Company is aware of that may reasonably be expected to materially affect the Mineral Resources and Mineral Reserves estimates for the Otjikoto Mine.
Mining Operations
The Otjikoto Mine is an owner-operated conventional open pit operation, with higher-grade material sent to the plant, and lower-grade material stockpiled until the end of the mine life. The mine plan assumes an active mining life of seven years, and a stockpiling strategy is practiced to achieve processing life of 10 years. The high-grade (>0.6 g/t Au) and low-grade (0.25 –0.60 g/t Au) stockpiles will be mined in years 4–10 including 3 years of operations after active open pit mining ceases. The Otjikoto ultimate pit is planned for development in a sequence of four pit phases (phase one is complete), and the Wolfshag ultimate pit is planned for three pit phases. The Otjikoto ultimate pit will be approximately 1.97 km long, 585 m wide, and 245 m deep, and the Wolfshag ultimate pit will be approximately 1 km long, 600 m wide, and 200 m deep. The projected remaining LOM stripping ratio is 6.7:1 (waste:ore) for Otjikoto and 25.1:1 for Wolfshag.
- 49 -
Pit slopes vary by geotechnical domain, with overall slope angles ranging from 35–45º. Bench heights also vary by geotechnical domain, from 10–20 m. Reserve model dilution and ore loss were applied through whole block averaging such that both dilution and ore losses are variable. A nominal ramp and road width of 27 m, including drainage and safety windrow, was used for dual lane truck operation in the mine design. A ramp gradient of up to 1 in 10 (10%) was used. The last five mine levels will be single-lane, with a practical design width of 16 m. Surface haul roads are 27 m wide.
The base case mine production schedule involves the movement of 35 to 38 Mtpa from a combination of the Otjikoto and Wolfshag open pits, and a total of 211 Mt over the active mining period 2017 through 2023. Of this total, 15 Mt are high-grade ore (>0.6 g/t Au), and about 9.4 Mt are low-grade ore (0.425 –0.6 g/t Au). In practice, a lower cutoff grade is applied to reduce ore loss related to a high nugget effect.
The mining operations are scheduled to work 365 days a year, with reduced production rates during the rainy season. The planned equipment fleet is based on 90 t capacity haul trucks that are conventional for the industry, providing relative flexibility in the utilisation as several pit stages will be mined simultaneously to mine waste and ore at different levels. The mill feed ore will be transported from open pits to the ROM pad for direct tipping or stockpiling. It is assumed that 60% of the ROM feed will be stockpiled to regulate the mine production and crusher feed rates.
A large WRSF has been constructed west of the Otjikoto and Wolfshag open pits. Location considerations were based on minimizing haulage, surface water drainage and area availability. An overall slope angle of 18° was used in the design of the waste dump faces with 5 m berms located at 10 m vertical intervals.
To date Otjikoto has produced 312,008 ounces of gold (2015–2016). The table below indicates the 2016 actual and 2017 planned production.
Production Guidance
| 2016 Actual | 2017 Guidance/Budget | |
| Gold production (100 basis%; Au oz) | 166,000 | 165,000–175,000 |
| Tonnes milled (t) | 3,468,000 | 3,300,000 |
| Grade milled (g/t Au) | 1.52 | 1.59 |
| Recovery (%) | 98.1 | 98 |
Processing and Recovery Operations
Design assumptions were based on the metallurgical test work described above. The mill design is based on a gravity/whole ore leach flowsheet with a nominal treatment rate of 2.5 Mtpa, and a plant availability of 94%. A 25% design factor was included to facilitate a future expansion. This expansion was completed in 2015, and the current mill throughput rate is 3.3 Mtpa. The average recovery for 2016 was 98.1% and long-term assumptions are 98%.
The mill uses a conventional flowsheet whereby gold is recovered by gravity concentration/intensive leaching and by a cyanide leach/CIP process for treatment of gravity tailings. The process flowsheet consists of: crushing; grinding; gravity concentration and intensive cyanidation; cyanide leaching of gravity tailings; CIP; cyanide destruction; tailings disposal; acid wash and elution; electrowinning and gold room; carbon regeneration; reagents make-up and distribution; and air services and plant water services.
- 50 -
Infrastructure, Permitting, and Compliance Activities
The infrastructure established at Otjikoto is described in the Otjikoto Feasibility Study, and includes the process plant, TSF, accommodation camp, roads, airstrip, mine services area, open pits, stockpiles, and WRSFs.
The process plant processes 3.3 Mtpa and deposits tailings in the TSF using the upstream method. The TSF is designed to contain about 36 Mt of tailings.
All water falling directly on the industrial areas (contact water) or otherwise in contact with the mining operations (water within the open pit, water return, and storm water from the TSF) is captured, stored, and used in the mining and processing facilities. Two storm water dams are in place; the first is of a larger capacity, and is designed to hold all water falling on the processing facility terrace during a 1:50 year rainfall event; the second is smaller and designed to contain all runoff from the mining facilities. Two water storage dams have been constructed. One is the reclaim process water dam, which receives water from the TSF and supplies this water to the process plant; the second is the pit dewatering dam that provides water for dust suppression and mineral processing. The mining facility surface water control structures are adjusted on an annual basis to account for the current open pit, WRSF, and road arrangement.
Power is produced on site by heavy fuel oil generators that supply power to the plant at 6.6 kV.
Materials and consumables are transported to site via the B1 national highway. Within the mine, gravel or dirt roads are used for internal site access.
An ESIA that included an Environmental Management Plan and Mine Closure Framework were completed for the Otjikoto pit. B2Gold Namibia received environmental clearance for the Wolfshag open pit operations on January 26, 2015, based on an EIA.
We hold all required permits to conduct the open pit operations.
Closure and reclamation costs are estimated and updated annually. Closure and reclamation costs at the end of 2016 were estimated at US$15.3 million on an undiscounted basis.
Capital and Operating Costs
Capital Costs
Sustaining capital costs are based on operational experience and LOM projections. The table below presents the 2016 actual costs, the 2017 budgeted costs, and the estimated capital costs for the LOM, including 2017. The current LOM projections include active mining into Q1 2023 and processing into Q4 2026.
Capital Costs (US$ million)*
| 2016 Actual | 2017 Budget | LOM Estimated (including 2017) | |
| Mining | 18.13 | 22.2 | 28.9 |
| Processing | 0.86 | 0.40 | 5.96 |
| Site General | 1.97 | 10.2 | 15.4 |
| Total | 20.96 | 32.7 | 50.2 |
*Note: Totals may not sum due to rounding. The projected LOM for the Otjikoto Mine is seven years of mining and 10 years of processing, including 2017. Capital costs include mining fleet replacement and rebuilds, closure costs, and standard rebuild and other capital projects for mining, processing, and site general costs. Deferred stripping costs are excluded. Internal engineering and technical studies related to underground mining potential at Wolfshag are in progress and may result in significant changes to the LOM capital costs.
- 51 -
Operating Costs
Actual 2016, budgeted 2017, and estimated LOM operating costs are provided in the table below.
Operating Costs (US$/t)*
| Units | 2016 Actual | 2017 Budget | LOM Estimated (including 2017) | |
| Mining | $/t mined | 1.54 | 1.56 | 1.58 |
| Processing | $/t processed | 9.15 | 11.65 | 12.87 |
| Site General | $/t processed | 3.96 | 5.24 | 3.59 |
*Note: The projected LOM for the Otjikoto Mine is seven years of mining and 10 years of processing, including 2017. Operating costs include all mining, processing, and site general costs, including prestripping and development. Internal engineering and technical studies related to the underground mining potential at Wolfshag are in progress and may result in significant changes to the LOM operating costs.
The capital cost estimates and operating cost estimates in the tables above are based on the Company’s current estimates and mine plan for the Otjikoto Mine. Our costs in subsequent years may vary significantly from our 2017 and LOM cost estimates as a result of, among other things, current or future non-recurring expenditures, changes to input costs and exchange rates and changes to our current mining operations or mine plan. Our current mine plan for the Otjikoto Mine is based on existing Mineral Reserves. We conduct ongoing exploration and analyses at our operating mines with a view to identifying new Mineral Resources and upgrading existing Mineral Resources to higher confidence levels and potentially into new Mineral Reserves. If new Mineral Reserves are successfully identified it may alter the current mine plan and potentially extend the mine life.
Exploration, Development, and Production
The 2016 exploration program included 7,000 m of exploration core drilling in the Wolfshag Zone to reduce the drill spacing to 25 x 25 m in the projected transition zone from open pit to underground mining. A further 4,082 m of core drilling and 5,510 m of RAB drilling tested a number of brownfields targets.
The exploration budget for 2017 in Namibia is US$5.1 million, and will be directed towards near-mine brownfields targets and prospective regional targets.
The Otjikoto Mine is forecast to produce between 165,000 and 175,000 ounces of gold in 2017, compared to 166,285 ounces produced in 2016. Cash operating costs are expected to be between $510 and $550/oz. The Otjikoto Mine is projected to process 3.3 million tonnes of ore in 2017, with an average grade of 1.59 g/t and recovery of 98%. Mill feed is expected to consist of high grade ore from the Otjikoto Phase 2 pit (35%) and Wolfshag Phase 1 pit (25%). High and medium grade stockpile ore is expected to account for the remainder of the mill feed (40%), as the Otjikoto Phase 2 pit is developed.
LOM production plans for the Otjikoto Mine, incorporating preliminary projections for the Wolfshag open pit and underground mines, have been completed for various options and will be further refined as the detailed geotechnical, hydrogeological, and design studies are completed in 2017. Ongoing studies are leading the Company to re-evaluate the open pit and underground interface. In the meantime, open pit operations at the Otjikoto and Wolfshag pits continue as planned.
For 2017, the Company expects $10 million of the Otjikoto mine fleet expansion purchases to be lease financed. To advance stripping at both the Otjikoto and Wolfshag pits, the mining fleet will be increased by an additional 250t excavator along with additional haul trucks and support equipment. A construction of a solar power plant is expected to reduce fuel consumption and protect against rising oil prices.
- 52 -
La Libertad Mine
Certain portions of the following information are derived from and based on the technical report entitled “NI 43-101 Technical Report, La Libertad Mine, La Libertad Region, Nicaragua” dated March 27, 2015 prepared by Donald E. Hulse, P.E. William J. Crowl, MMSA and Dr. Deepak Malhotra, RM SME (the “Libertad Technical Report”) and is based on the assumptions, qualifications and procedures set out therein. For a more detailed overview of La Libertad Mine, please refer to the Libertad Technical Report, which is available on SEDAR at www.sedar.com. Information that post-dates the Libertad Technical Report is provided by the Company.
Property Description, Location and Access
La Libertad Mine is located in the La Libertad–Santo Domingo Region of the Department of Chontales in Central Nicaragua. The mine is situated approximately 110 km due east of Managua, the capital city of Nicaragua and 32 km northeast of Juigalpa, the capital city of the Department of Chontales. Road access from Managua is initially along a 201 km paved road to Juigalpa, then via a paved stone road for 30 km to the town of La Libertad, and another 5 km along an unsurfaced road to the mine.
The La Libertad exploitation concession, covering an area of 10,950 ha, was granted by Ministerial Decree No. 032-RN-MC/94 for a 40 year term, expiring in 2034. The Ministerial Decree requires that we pay surface taxes on an annual basis, and pay a net 3.0% royalty on gross production revenues (ad valorem tax) payable to the government of Nicaragua.
We also hold two exploration concessions, Buenaventura and Cerro Quiroz that are contiguous with the La Libertad exploitation concession that covers a total of 4,600 ha. Annual fee payments on the mineral concession escalate from US$0.25/ha to US$8.00/ha over the first 10 years, and are US$12.00/ha thereafter.
B2Gold operates through its subsidiary, Desarrollo Minero de Nicaragua S.A. (“Desminic”). Desminic holds 100% of the La Libertad exploitation concession and the Buenaventura exploration concession. The Cerro Quiroz exploration concession is 100% held by the Company. The operating entity for the Cerro Quiroz exploration concession is Cerro Quiroz Gold S.A.
The surface rights in the Mojon, Los Angeles and San Juan areas are held via fee ownership and are sufficient for the current project. The Company negotiated with the land owners to obtain surface access to conduct exploration carried out in the area in 2009 to 2016. The Company has purchased the surface rights over approximately 50% of the area of the current Jabali Inferred Mineral Resource and is currently negotiating the purchase of the remainder. There is a person with no title currently occupying the remaining Jabali property although Desminic has obtained two court orders concerning the property. The first confirms the location with the office of the cadaster, and the second grants the right of forced sale to Desminic of the property. This grants adequate surface rights for operations of the entire LOM plan.
The La Libertad Mine is also subject to a royalty interest granted to IMISA, a holding company formed to represent unionized mine workers in Nicaragua, equal to 2.0% of the value of total production of gold and silver from La Libertad exploitation concession. In Nicaragua, the government is entitled to an ad-valorem tax over the substances extracted from a mineral concession. The amount of ad-valorem tax is 3% for minerals. Under Nicaraguan law, the ad-valorem tax paid is considered a deductible expense for purposes of computing corporate income tax. However, when this law was enacted, it included a grandfathering rule which allowed concessions granted prior to this law to continue operating under its existing regime. Under the mining law applicable at the time, the amount paid as ad-valorem tax is applied as a direct credit against corporate income tax. The total royalty payable on La Libertad Mine production is 5.0% . In addition, under Nicaraguan law, artisanal miners have the right to exploit secondary veins up to a total surface area that may not exceed 1% of the total area granted under a concession. Artisanal mining activities continue on the La Libertad concession.
To the extent known there are no other significant factors or risks that might affect access or title, or the right or ability to perform work on, the property, including permitting and environmental liabilities to which the project is subject that are not discussed in the Annual Information Form.
- 53 -
History
Mining first commenced in the area in the 1860s, and has included large and small mine operations and artisanal mining activity. Production records are incomplete, but suggest that about 199,000 oz was produced from the La Libertad area in the nearly one hundred year period from 1900 to 1999.
Desminic commenced mining in 2001, largely from a series of pits along the main Mojón-Crimea structure. Significant production was also achieved from the Esmeralda structure located parallel to and immediately south of the Mojón pits. The open pit material was fed to a heap leach pad. Mine production from 2001 to March 2007 totalled 6.7 million tonnes, at a grade of 1.66 g/t of gold, producing 207,000 ounces.
We obtained our interest in the project through the acquisition of Central Sun Mining Inc. in 2009, and completed mill construction the same year.
There are no historical estimates that are relevant to the current Mineral Resources and Mineral Reserves.
Geological Setting, Mineralization and Deposit Types
The La Libertad deposit is located within the Central Province of Nicaragua, and is considered to be an example of a low-sulphidation epithermal deposit.
The La Libertad area is underlain by intermediate to felsic pyroclastic rocks of the Oligocene–Miocene age Matagalpa Group. Unconformably overlying these rocks are Miocene-aged mafic to intermediate lavas of the Lower Coyol unit that host the gold mineralization. Pliocene-age mafic lavas and ignimbrites, belonging to the 400–600 m thick Upper Coyol unit, form mesa-like erosional remnants in the region. Several small felsic to mafic intrusive bodies of Tertiary age are distributed along northeast–southwest-trending structural lineaments.
The Mojon vein structure forms a braided quartz vein stockwork system that averages 22 m wide, with a range from 5–40 m over a strike length of 1,500 m. Numerous hanging wall splay veins occur, and are generally narrower and less continuous than the main Mojon vein structure. The main hanging wall (“HW”) splay is approximately 150 m along strike and is mineralized for a distance of about 60–70 m below the floor of the open pit.
The San Juan vein structure, located 2 km southeast of the Mojon trend, has a strike length of approximately 1 km, and consists of two well-defined and drill-tested mineralized shoots. The two shoots have strike lengths of 220 m and 250 m, and have been drill tested to depths of 100–150 m. The San Juan structure includes a stockwork halo that averages 12 m wide, ranging from 10–20 m in width, enveloping a higher-grade central vein that varies in true width from 1–11 m, averaging 3 m wide.
The Jabali vein structure is approximately 6 km long east–west, forming a northerly-dipping quartz vein, quartz breccia, and quartz stockwork system. It has been divided into two zones, Jabali Antenna and Jabali Central. Jabali Antenna has been drill tested over 1.3 km of strike, has a vertical extent of 150–250 m, and ranges in width from 5–29 m. Jabali Central has a vertical extent of 50–150 m, ranges in width from 5–13 m, and has been drill tested over an approximate 2.6 km strike length.
Host rocks are moderately altered immediately adjacent to the stockwork and vein zones. Alteration types are typically silicic and argillic, with minor amounts of propylitic alteration. Weathering may extend downwards for 15–25 m from surface and up to 150 m down the mineralised structures. Manganese oxides are ubiquitous. Goethite, limonite, and jarosite occur as coatings and linings to open spaces and fractures.
Higher gold grades are associated with vuggy, drusy, and banded quartz veins. Pyrite (and its oxidized products) is closely related to gold mineralization but is present in small volumes, generally less than 1%.
- 54 -
Exploration
Exploration activities completed by us include geological mapping, geochemical sampling (rock chip, soil, trench and stream sediment) airborne geophysical surveys (aeromagnetic and radiometric), drilling and topographic surveys.
Geological mapping was used to identify quartz veins, surface lithologies and alteration zones. Geochemical data indicated the presence of more than 30 gold bearing structures in the covered area, with a cluster of higher grade structures concentrated in the central part of La Libertad District, north of La Libertad town, and around the San Juan and Los Angeles structures. The geophysical surveys helped delineate structures that had exploration potential. Topographic surveys were used in support of mine planning.
The exploration activities have focused on defining known target structures with detailed trenching and sampling and testing of some of the more conceptual targets in areas of interest, and known vein resources. The main exploration target is open pit feed for the mill, although higher-grade underground structures are also considered to be targets of interest.
Our current and planned exploration activities are discussed under “La Libertad - Exploration, Development, and Production”.
Drilling
Drilling has been completed in support of exploration evaluations, Mineral Resource and Mineral Reserve estimates, and mine planning. Drilling completed at La Libertad includes RC, and core drilling methods; all of our drilling (since acquisition in 2007) except in the area of spent ore has been completed with core drilling. Drilling as of December 31, 2016 includes a total 1,858 holes (287,868 m); of this total, 1,148 are core holes (162,531 m) and 710 are RC holes (125,337 m). A total of 265 core holes (35,572 m) and 710 RC holes (125,337 m) were complete from 1984–2007, prior to the Company acquiring its interest, with an additional 885 core holes (127,117 m) completed from 2010 to 2016.
Drill data and drill database cutoff dates used in support of the Mineral Resource estimates are as summarized below.
The Jabali resource estimate was supported by 450 core drill holes (67,533 m), drilled between 2010 and 2015. The database cutoff date was January 15, 2016. Subsequent to the database cutoff date, four geotechnical drill holes (731 m) have been drilled at Jabali Antenna.
The San Juan resource estimate was supported by 80 drill holes (11,594 m), completed between 2008 and 2012. The database cutoff date was January 15, 2016. Subsequent to the database cutoff date, seven drill holes (928 m) have been completed. These include two condemnation holes and five geotechnical holes (only two of which intersect the San Juan structure).
The Mojon underground resource estimate was supported by 266 drill holes (50,697 m), drilled between 1995 and 2016. The model includes both the Mojon main area and the HW splay. The database cutoff date was February 19, 2016. A total of 27 drill holes were excluded from the estimate due to suspected location errors, contamination issues or lack of geological information. Subsequent to the database cutoff date, two surface (410 m) and 19 underground drill holes (1,523 m) have been completed.
The spent-ore resource estimate was supported by 244 RC holes (4,291 m) completed between 2007 and 2012. The database cutoff date was October 8, 2015. Surface trench and grab samples were excluded from the estimate. Only grade control information has been added since the resource estimate was completed.
The Tope Inferred Mineral Resource estimate was supported by 32 drill holes (3,354 m), drilled in 2015 and 2016. The drill hole database cutoff was January 15, 2017. In addition to drill holes, mapping and channel samples from small miner workings were used to inform the top ~30 m of the model.
- 55 -
Core is geologically logged, photographed and recoveries are recorded. Drill hole collar locations are surveyed using either a high-precision GPS unit and/or a total station instrument. Down-hole surveys are performed at regular down-hole intervals using Reflex Maxibor II instrumentation in order to monitor any deviation from the azimuth and dip, set at the start of the hole. Drilling azimuths and inclinations are optimized to intersect the vein structures in the best possible way and can vary based on the variable dip and azimuth of the structures. True widths are modeled for resource reporting.
Exploration drilling, completed over a variety of new targets, has yielded some positive initial results and will require follow up drill testing in 2017.
Sampling, Analysis and Data Verification
Core sample lengths are variable. Sampling breaks are based on variable percentages of quartz content, quartz types and amount of sulphides, alteration intensities and lithology contacts. Samples are collected continuously through mineralized zones as well as into the footwall and hanging wall host rocks. Not all core is sampled.
Sample preparation is performed at the mine site laboratory, which we operate and is not independent of the Company. The primary analytical laboratory is currently Acme/Bureau Veritas in Vancouver, Canada; previously ALS Vancouver was used until January 2013. Secondary laboratories have included Skyline Labs in Tucson, Inspectorate in Vancouver, and currently ALS Vancouver is used. The analytical laboratories are independent of us, and certified for selected analytical techniques.
Sample preparation consists of drying, crushing to 85% passing 10 mesh (2 mm), and pulverizing to 85% passing 200 mesh (0.074 mm). Gold grades are determined utilizing a standard fire assay methodology with an AA finish. In addition to gold assays, a multi-element suite of 37 elements can be requested for exploration assays. Multi-element analysis has included ICP-MS and ICP-AES.
Density determinations are performed by site personnel on whole core samples using the wax-coated water immersion method. There are currently a total of 4,572 measurements.
QA/QC measures include regular insertion of certified reference material, field, preparation and pulp duplicates, and blank sample materials prior to submission of samples to the laboratory to monitor laboratory accuracy and precision and sampling sequencing and precision. The mine site laboratory sample preparation performance is also monitored. Approximately 10% of all samples were submitted for check assay by a secondary laboratory. Insertion rates of QA/QC materials are typically 1:39. QA/QC data are monitored daily, and a monthly report is prepared on the results for record purposes.
Data imported into the project database are subject to validation, which includes checks on surveys, collar coordinates, lithology data, and assay data. The checks are appropriate, and consistent with industry norms. Independent data verification has been undertaken in support of previous technical reports on the project, including by Chlumsky, Armbrust and Meyer in 2003, Scott Wilson RPA in 2008, and Gustavson in 2015.
The checks done in previous audits and the continuous QA/QC checks completed by our database administrators, project geologists and international database manager are in line with industry standards for database verification. No material issues with the project database including sampling protocols, flowsheets, check analysis program, or data storage have been identified to date from the checks performed. The project database is acceptable for use in Mineral Resource and Mineral Reserve estimation, and can be used to support mine planning.
Sample security measures practiced included moving core from the drill site to the secure B2Gold core yard inside the facilities of the La Libertad Mine. Sample shipments are tracked using industry-standard procedures.
Mineral Processing and Metallurgical Testing
Metallurgical test work in support of the process plant design was undertaken in 2007. The plant was commissioned in late 2009. Completed test work included comminution, leach tests, settling tests, and cyanide detoxification tests. Gold recovery from the open pit ore was estimated at 94% through the plant. Test work and process modelling on spent-ore indicated that a gold recovery of 80% could be achieved, and that spent-ore could be processed as an incremental addition to mill feed, since it required less crushing and grinding than open pit ore.
- 56 -
Subsequent test work has been performed by Kappes, Cassiday and Associates in Reno, Nevada in 2011 and 2012, and BBA in Toronto and SGS Lakefield in 2014 to evaluate the metallurgical response of the Jabali Central and Jabali Antenna deposits to the La Libertad process plant conditions and optimize leach conditions. Samples from Jabali Central and Jabali Antenna responded well to the La Libertad plant conditions, and recoveries and reagent additions were further enhanced through the test programs.
LOM recoveries are estimated at 90% for the spent-ore, and 94% for the Jabali Central, Jabali Antenna and Mojon mill feed sources.
There are no currently-known deleterious elements that impact gold recoveries from the Jabali ores or the spent-ore.
Mineral Reserves and Mineral Resources
Mineral Resources
Spent-Ore
From 2001 to 2007, La Libertad was a heap leach operation. Ore was crushed to minus 1½ inch, agglomerated with cement, and conveyed to the leach pad, where it was leached for 120 days, followed by a rinse cycle to remove any free cyanide. After rinsing, the ore was removed from the leach pad and placed in a spent-ore discard pile. The spent-ore estimates are supported by physical surveys and drill sampling, and are reported using current topographic surveys and the pre-mining topographic ground surface. The 2015 spent ore resource estimate update uses a block size of 12 x 12 x 3 m, a density of 1.6 t/m3 for all spent-ore, down hole composites of 2 m, and a grade cap of 3.5 g/t Au was applied prior to compositing. Resources are reported from the ID2 estimate using capped Au grades; OK and NN runs are used for validation purposes.
Indicated and Inferred classifications were assigned to blocks on the basis of which drill campaign the underlying drill data was sourced from.
Epithermal Veins
Interpretations of quartz-stockwork and quartz-vein/breccia zones were created for all zones. An additional high-grade vein zone was created internal to the overall vein zone to better segregate high-grade material in the underground models. Overburden, saprolite, and saprock surfaces, fault/structure traces, and where relevant, historic mining areas, were also modelled. Gold and silver assays were capped prior to compositing at 2 or 3 m intervals, depending on the zone. Density was applied to the model based on a combination of rock type and weathering intensity. A full suite of variograms was created for each estimation domain where sufficient data were available. Grades were estimated using OK into 12 x 3 x 6 m for Jabali Central and Antenna open pit models, 6 x 2 x 6 m for Jabali Central, Antenna and San Juan underground models and 5 x 2 x 5 m for the Mojon underground model.
Indicated Mineral Resources potentially amenable to open pit mining were assigned to blocks in contiguous areas of approximately 35 m drill hole spacing; Inferred Mineral Resources were limited to blocks within areas of approximately 60 m spaced drilling.
Reasonable prospects of eventual economic extraction by open pit were assessed for Mojon, Jabali Central, and Jabali Antenna by constraining within a pit shell, using a US$1,400/oz gold price, current operating costs and metallurgical recoveries, and reporting above a gold cutoff grade.
Mineral Resources at San Juan that were considered potentially amenable to underground mining methods were constrained by grade and continuity considerations. An elevation limitation is used at San Juan which restricts estimation to below the level of the water table, so as to avoid impacting artisanal mining operations above the water table. An internal study was initiated in late 2016 to look at the economic viability of an open pit operation at San Juan. Results of the study are expected in mid-2017.
- 57 -
Mineral Resource estimates for La Libertad Mine are reported from B2Gold’s mineral resource models with model dates ranging from February 2016 to January 2017; the December 31, 2016 topographic surface is applied to the models making this date the overall effective date of the estimates. No Measured Mineral Resources were estimated.
La Libertad Indicated Mineral Resources Statement
| Area | Tonnes (t) | Gold Grade (g/t Au) | Contained Gold Ounces (oz) | Contained Gold Kilograms (kg) |
| Jabali Central (open pit) | 830,000 | 2.53 | 67,000 | 2,100 |
| Jabali Antenna (underground) | 540,000 | 4.93 | 86,000 | 2,700 |
| Mojon (underground) | 150,000 | 5.06 | 24,000 | 800 |
| Spent-ore | 1,280,000 | 0.85 | 35,000 | 1,100 |
| Total | 2,800,000 | 2.36 | 212,000 | 6,600 |
La Libertad Inferred Mineral Resources Statement
| Area | Tonnes (t) | Gold Grade (g/t Au) | Contained Gold Ounces (oz) | Contained Gold Kilograms (kg) |
| Total | 2,900,000 | 4.94 | 460,000 | 14,300 |
| Notes: | ||
| 1. |
Mineral Resources have been classified using the 2014 CIM Definition Standards for Mineral Resources and Mineral Reserves. Mineral Resources are reported inclusive of those Mineral Resources that have been modified to Mineral Reserves. Mineral Resources that are not Mineral Reserves do not have demonstrated economic viability. | |
| 2. |
All tonnage, grade and contained metal content estimates have been rounded; rounding may result in apparent summation differences between tonnes, grade, and contained metal content. | |
| 3. |
Mineral Resources are reported on a 100% attributable basis. | |
| 4. |
The Qualified Person for the estimate is Brian Scott, P. Geo., who is our Vice President, Geology and Technical Services. | |
| 5. |
Mineral Resource estimates assume an open pit mining method, gold price of US$1,400/oz, metallurgical recoveries that range from 90% to 94%, and operating cost estimates of US$3.88/t mined (mining), US$13.31/t processed (processing) and US$4.13/t processed (general and administrative). | |
| 6. |
Mineral Resources are reported at cutoffs that range from 0.61–2.85 g/t Au. | |
Mineral Reserves
Indicated Mineral Resources were converted to Probable Mineral Reserves following consideration of modifying factors and optimized open pit designs for Jabali Central and Jabali Antenna. Spent-ore material is also included in Mineral Reserves. The metal price assumption was US$1,250/oz. Dilution and ore loss was applied to the open pit material from Jabali Central and Jabali Antenna through block averaging such that at a cutoff of 0.75 –0.76 g/t Au, there is a 15% increase in tonnes, a 26% reduction in grade and 14% reduction in ounces when compared to the Mineral Resource model. Process recovery for gold ranges from 90% to 94%. No dilution is applied to the spent-ore. Operating cost estimates assume US$3.88/t mined (mining), US$13.31/t (processing) and US$4.13/t (general and administrative).
Mineral Reserve estimates for the La Libertad Mine are reported from B2Gold’s mineral resource models that have an effective date of December 31, 2016, and have been modified from the Indicated Mineral Resources. No Proven Mineral Reserves have been reported.
- 58 -
Probable Mineral Reserves Statement
| Area | Tonnes (t) | Gold Grade (g/t Au) | Contained Gold Ounces (oz) | Contained Gold Kilograms (kg) |
| Jabali Central | 360,000 | 2.50 | 29,000 | 900 |
| Jabali Antenna | 520,000 | 3.55 | 60,000 | 1,900 |
| Spent-ore | 1,030,000 | 0.92 | 30,000 | 900 |
| Total | 1,910,000 | 1.94 | 119,000 | 3,700 |
| Notes: | ||
| 1. |
Mineral Reserves have been classified using the 2014 CIM Definition Standards for Mineral Resources and Mineral Reserves. | |
| 2. |
All tonnage, grade and contained metal content estimates have been rounded; rounding may result in apparent summation differences between tonnes, grade, and contained metal content. | |
| 3. |
Mineral Reserves are reported on a 100% attributable basis. | |
| 4. |
The Qualified Person for the estimate is Kevin Pemberton, P.E., who is our Chief Mine Planning Engineer. | |
| 5. |
Mineral Reserves are based on a conventional open pit mining method, gold price of US$1,250/oz, metallurgical recoveries that range from 90% to 94%, and operating cost estimates of US$3.88/t mined (mining), US$13.31/t processed (processing) and US$4.13/t processed (general and administrative). | |
| 6. |
Dilution and ore loss was applied to the Jabali material through block averaging such that at a cutoff of 0.75–0.76 g/t Au, there is a 15% increase in tonnes, a 26% reduction in grade and 14% reduction in ounces when compared to the Mineral Resource model. No dilution is applied to the spent-ore. | |
| 7. |
Mineral Reserves are reported at cutoffs that range from 0.70–0.76 g/t Au. | |
Except as disclosed elsewhere in this Annual Information Form, there are no undisclosed metallurgical, environmental, permitting, legal, title, taxation, socio-economic, marketing, political and other issues that the Company is aware of that may reasonably be expected to materially affect the Mineral Resources and Mineral Reserves estimates for the La Libertad Mine.
Mining Operations
Mining operations use conventional open pit mining methods at the active Jabali Central pit. Drilling, blasting and ore control are performed by Desminic personnel. Loading and haulage of both ore and waste are performed by a contractor.
La Libertad mining in 2016 focused on the Jabali Central open pit and the spent-ore stockpile, with smaller contributions to mill feed coming from material mined from underground test mining of Mineral Resources at Mojon. The plan for 2017 is very similar, with the majority of the planned tonnes coming from the Jabali Central open pit and the spent-ore stockpile, and likely minor mill feed contributions from continued test mining at Mojon. The mill feed material from the underground test mines is not currently classified as Mineral Reserves. Mineral Resources that are not Mineral Reserves do not have demonstrated economic viability, and there is no certainty that the portion of the future operating plan based on these Mineral Resources will be realized. The grade continuity, drill spacing and metallurgical work currently completed on portions of the vein structures of interest are considered sufficient to support Mineral Reserve estimation. However, conversion of some or all of the underground Mineral Resources to Mineral Reserves will require additional information on mineability from surface and/or underground grade control drilling and underground development to support detailed mine designs and mine planning.
Pit slopes vary by geotechnical domain, with bench face angles ranging from 60–70º. Bench heights also vary by geotechnical domain, from 6–18 m. A nominal ramp and road width of 20 m, maximum road gradient of 10%, and minimum layback width of 20 m is used.
Waste rock from the Jabali pits is currently stored in a WRSF located to the southeast of Jabali central.
The equipment used at the mine is conventional for the industry when conducting truck and shovel open pit mining operations, and includes trucks, excavators, dozers, drill rigs, and light vehicles.
Since re-commencement of production by B2Gold in 2010, the La Libertad mine has produced 817,459 ounces of gold.
- 59 -
The table below indicates the 2016 actual and 2017 planned production.
Production Guidance
| 2016 Actual | 2017 Guidance/Budget | |
| Gold production (100)basis%; Au oz) |
132,000 | 110,000–120,000 |
| Tonnes milled (t) | 2,278,000 | 2,300,000 |
| Grade milled (g/t Au) | 1.90 | 1.73 |
| Recovery (%) | 95 | 94 |
Processing and Recovery Operations
Design assumptions were based on the metallurgical test work described above. The mill design is based on a conventional flowsheet with a nominal treatment rate of 6,250 tpd, and a plant availability of 94%. Mill feed is processed through a grinding circuit consisting of a SAG mill/pebble crusher and two ball mills, then classified by cyclones, thickened, and passed to a series of leach tanks. The leached slurry is processed in a CIP circuit, then loaded carbon is delivered to the ADR plant for stripping, electrowinning and production of gold and silver doré bars.
Tailings are stored in an impoundment to the west of the ADR plant. There is sufficient capacity for the remaining mine life.
Infrastructure, Permitting and Compliance Activities
The infrastructure established at La Libertad includes the process plant, TSF, work camp, roads, mine services area, open pits, heap leach and spent-ore pads, and WRSFs. The process plant processes 2.2 Mtpa and deposits tailings in the TSF using the upstream method. The TSF is designed to contain 14.4 Mt of tailings and is projected to ultimately hold 20 Mt. Additional design stages are not currently permitted. Industrial water for the process plant is reclaimed from tailings, and recycling of water is performed wherever possible. Fresh water is derived from the Mico River. Power is sourced from the national grid. Materials and consumables are transported to site via road. Within the mine, gravel or dirt roads are used for internal site access.
The EIA for the mine was approved in 2008. Addendums to the EIA have been prepared in support of design changes. We currently hold all required permits to operate.
Closure and reclamation costs are estimated and updated annually. Closure and reclamation costs at the end of 2016 were estimated at US$22.9 million.
We maintain cordial relations with the environmental authorities and local communities. In addition, the community relations group is responsible for the establishment and strengthening of relationships with the various stakeholders to obtain and maintain social acceptability of the operations in the area.
Capital and Operating Costs
Capital Costs
Sustaining capital costs are based on operational experience and LOM projections. The table below presents the 2016 actual costs and the 2017 budgeted costs.
- 60 -
Capital Costs (US$ million)
| 2016 Actual | 2017 Budget* | |
| Mining | 9.1 | 11.2 |
| Processing | 6.1 | 5.6 |
| Site General | 0.2 | 0.5 |
| Total | 15.4 | 17.3 |
*Note: Totals may not sum due to rounding. La Libertad mine life, based on Mineral Reserves only, is about one year (2017).
Operating Costs
Actual 2016 and budgeted 2017 operating costs are provided in the table below.
Operating Costs (US$/t)
| Units | 2016 Actual | 2017 Budget* | |
| Mining | $/t mined | 2.95 | 3.88 |
| Processing | $/t processed | 13.41 | 13.31 |
| Site General | $/t processed | 4.39 | 4.13 |
*Note: La Libertad mine life, based on Mineral Reserves only, is about one year (2017). The mining costs only include the open pit mining costs and the associated over haul costs. They do not include any spent ore re-handle.
The capital cost estimates and operating cost estimates in the tables above are based on the Company’s current estimates and mine plan for La Libertad Mine. Our costs in subsequent years may vary significantly from our 2017 cost estimates as a result of, among other things, current or future non-recurring expenditures, changes to input costs and exchange rates and changes to our current mining operations or mine plan. We conduct ongoing exploration and analyses at our operating mines with a view to identifying new Mineral Resources and upgrading existing Mineral Resources to higher confidence levels and potentially into new Mineral Reserves. If new Mineral Reserves are successfully identified it may alter the current mine plan and potentially extend the mine life and may result in different capital and operating costs in subsequent periods.
Exploration, Development and Production
The 2016 exploration program consisted of geological mapping; reconnaissance and surveys of artisanal miner workings; rock chip, soil, stream sediment, trench and channel sampling; a ground magnetic geophysical survey, and core drilling. A total of 54 core holes (7,645 m) were completed for exploration purposes at Santa Julia North, Los Angeles–San Francisco, Chamarro, Socorro, Ceiba, Tope and Mojon. In addition, 33 core holes (3,908.3 m) were completed as infill and geotechnical drill holes from underground or in-pit stations at Mojon Hangingwall, Jabali Antenna, and San Juan.
The exploration budget for the Libertad mine area for 2017 is approximately US$6.7 million to fund approximately 15,250 m of planned core drilling. The program is a balance of brownfields and exploration drilling.
- 61 -
La Libertad Mine is expected to produce between 110,000 and 120,000 ounces of gold in 2017 (compared to 132,431 ounces produced in 2016) at cash operating costs of between $625 and $665/oz and all-in sustaining costs of between $785 and $815/oz. La Libertad’s production forecast assumes that mining from the higher grade Jabali Antenna pit will now enter the production stream in the third quarter of 2017 (dependent upon the successful completion of resettlement activities and receipt of the remaining mining permits). However, as in 2016, La Libertad retains some flexibility in sourcing its ore while the Jabali Antenna permitting and relocation activities are being completed. La Libertad’s cash operating costs per ounce are expected to remain in-line with 2016, as the decrease in planned production is expected to be offset by lower mining costs (as a result of less waste being moved at the Jabali Central pit.)
In 2017, La Libertad is budgeted to process 2.3 million tonnes of ore at an average grade of 1.73 g/t with gold recoveries averaging 94%. Jabali West underground mine development is expected to commence in 2017, and production in 2018.
Our current mine plan at La Libertad is based on existing Mineral Reserves. However, the Company expects that mining operations will continue for a longer period, the length of which will depend on the results of ongoing exploration and mining results. We conduct ongoing exploration and trial mining with a view to upgrade the existing Mineral Resources into Mineral Reserves. If successful, it may be possible to extend the mine operations by an additional two years beyond the existing Mineral Reserves. Mineral Resources are not Mineral Reserves and do not have demonstrated economic viability and it cannot be assumed that all or any part of an Inferred Mineral Resource will be upgraded to an Indicated Mineral Resource as a result of continued exploration. Although the Company has been successful in the past, there is no certainty of converting Mineral Resources to Mineral Reserves and it may not be successful in the future.
OTHER PROPERTIES
Limon Mine
The Limon Mine is located in northwestern Nicaragua approximately 100 km northwest of Managua, the capital of Nicaragua. We hold an indirect 95% interest in Triton Minera S.A. (“Triton”), the mine operator. The remaining 5% of Triton is held by IMISA.
The Limon Mine is within the 12,000 ha “Mina El Limon” mineral concession that has a term of 25 years expiring in April 2027. There are, in addition, three exploration-stage mineral concessions, Bonete-Limon, San Antonio and Villanueva 2, which collectively cover a total of 7,200 ha. Each mineral concession under the Nicaraguan Mining Code is subject to an agreement issued by the government of Nicaragua that includes the rights to explore, develop, mine, extract, export and sell the mineral commodities found and produced from the concession. All of the permits required for exploration, mining and milling activities are in place for the Limon Mine. Escalating annual surface taxes are payable to the Nicaraguan government for the Mina El Limon mineral concession.
RG Exchangeco Inc., a subsidiary of Royal Gold, Inc., holds a 3% net smelter return royalty on gold production from the Limon Mine and certain other concessions. The revenue from the Limon Mine is also subject to a 3% ad valorem tax on gold production payable to the Government of Nicaragua, which is considered a deductible expense for purposes of computing corporate income tax. Net profit is defined as the excess of gross revenue (being all revenue received from the operation by Triton Mining (USA), LLC of its business) over expenses (being specified as costs incurred and charged as expenses by Triton Mining (USA), LLC arising from its business, including working capital and operating expenses, royalties paid, borrowing costs, taxes and general sales and administrative expenses).
- 62 -
The 2016 exploration program at the Limon Mine included geological mapping; rock chip, soil and auger sampling, sampling of tailings deposits for grade and determination of specific gravity, trench sampling and drilling. A total of 50 drill holes (7,096 m) were completed for exploration purposes at Atravesada, Gran Rancho, Limon Central, Los Ñatos, Mercedes, Pozo Bono, San Gil, and Talavera. Our exploration budget for the Limon Mine area for 2017 is approximately US$4.96 million to fund approximately 10,800 m of planned core drilling. The program largely comprises brownfields drilling, including further infill drilling and some additional drilling on potential near surface open pit targets on the property.
In 2016 El Limon produced 45,483 ounces (100% basis) based on a milled tonnage of 467,404 tonnes at an average grade of 3.22 g/t Au. Mill recovery was 94.1 %.
In 2017, the Limon Mine is budgeted to process approximately 0.5 Mt of ore at an average grade of 3.58 g/t Au with gold recoveries averaging 93.5%. Most process ore is expected to come from underground sources (Santa Pancha 1 and Santa Pancha 2 ) and a small amount from an open pit target.
Kiaka Project
The Kiaka Project is located in south–central Burkina Faso in the regional province of Boulgou and Zoundweogo, approximately 140 kilometres southeast of the capital Ouagadougou. Access consists of 100 km of paved road from Ouagadougou to Manga, followed by 40 km of gravel road to the exploration camp.
Burkina Faso has adopted a new Mining Code which came into effect on October 29, 2015. The Mining Code includes increases in corporate income tax, an additional 1% tax for a Local Development Fund and a preferred dividend for the State. These changes are expected to have a negative impact on the future economics of the Kiaka Project.
The Kiaka Project is hosted within an exploitation licence issued on July 8, 2016 (the “Kiaka Licence”) that is 5,402 ha in extent. The Kiaka Licence is held by Kiaka S.A., a Burkinabe company that is 81% owned by us (indirectly through our subsidiary Kiaka Gold SARL), 9% owned by GAMS–Mining F&I Ltd., a Cypriot company, and 10% owned by the Government of Burkina Faso. A condition of the Kiaka Licence grant is that mine construction at the Kiaka Project is completed within two years of the issuance date which is in July 2018, a timeframe that the Company does not expect to meet. The Burkina Faso Mining Code provides for two additional two year exemptions which can be applied for by the Kiaka Licence holder and, if granted, can extend the period for construction to a total of six years. A suspension of the Kiaka Licence can be applied for on the basis that a project is not viable under ambient conditions, as evidenced by an economic study.
To meet the construction requirements of the Kiaka Licence, Kiaka S.A. must apply for, or be granted (by decree), a construction permit by the Ministry of Mines, which it currently does not have. If it obtains or receives a construction permit, certain customs duty and tax exonerations will apply for a period of two years after the issuance of the construction permit decree. If construction is not completed within two years of issuance of the construction permit, the exonerations will no longer be valid for the period beyond the two years. However, if at least 50% of construction has been completed during the two-year period, the Company may apply for an extension of the exonerations for an additional year. If granted, full exonerations will apply for the additional year. Pending completion of further economic analysis of the Kiaka Project, the Company has no current plans to apply for a construction permit at this time.
In 2016, 47 RC drill holes (7,613 m), 14 core holes (3,551.9 m) and 10 RC collar/core tail drill holes (3,103.74 m) were completed to better define the limits of the new zones of gold mineralization at the Toega prospects, and to explore the immediate area for additional mineralization. A program of infill drill holes and metallurgical testing on known mineralization commenced on May 31, 2016, and is ongoing.
Mineral Resource estimation and engineering studies on the main Toega zone are planned for 2017. Studies will be undertaken to determine whether this new prospect area contains sufficient mineral resources to supplement the Kiaka Project, or if it constitutes a viable, standalone gold project.
We plan to spend approximately $2.7 million in 2017 at the Kiaka Project, to continue to fund corporate social responsibility activities and environmental monitoring programs. In addition, we have a $7.6 million exploration budget and plan to complete approximately 20,000 metres of planned RC, diamond and air core drilling. We continue to evaluate our timeline for an optimised feasibility study at Kiaka.
- 63 -
Gramalote Project
The Gramalote Project is located approximately 230 km northwest of the Colombian capital of Bogota and approximately 80 km northeast of Medellin, the regional capital of the Department of Antioquia. As at December 31, 2016, AngloGold Ashanti Limited (“AngloGold”) and B2Gold have a 51% and 49% interest, respectively in the Gramalote property. AngloGold is the manager of the joint venture project.
The Gramalote Project area is covered by 17 contiguous claim blocks totalling 35,322.2 ha. The claims presently include 16 registered concession contracts totalling 25,909.3 ha and one integrated and registered mining concession contract totalling 9,412.9 ha. The claims are registered, or are in the process of being registered, in the name of Gramalote (Colombia) Limited, the Colombian branch of Gramalote Limited that has been formed to hold all of the Gramalote mineral claims. Once in production, state royalties on the gold and silver will be payable, at approximately 3.2% of the gross metal value at the plant site
In 2014, we announced positive results from a preliminary economic assessment for the Gramalote Project. This study assumed open pit mining operations from three deposit areas, with mineralization being processed using a conventional SAG/ball mill circuit and cyanidation via CIP.
We focused during 2014 and 2015 on advancing key prefeasibility activities including conversion of Inferred Mineral Resources into Measured and Indicated Mineral Resources in Gramalote Central, advancing the EIA study, maintaining support within the community and value-enhancing engineering, including optimizing mine planning and earthworks and metallurgical studies. We also completed some exploration core drilling at the Cisneros and La Maria prospects.
The “Programa de Trabajos y Obras de Explotación” (“PTO”) was submitted to the government of Antioquia on February 4, 2015 and was approved on December 23, 2015. The PTO defines the program of work and labor and provides the operational and technical details for the exploitation of the Gramalote Project. On February 11, 2015, the EIA was formally submitted to Autoridad Nacional de Licencias Ambientales, the Colombian national environmental agency. The Gramalote EIA was approved on November 30, 2015.
Work in 2016 was largely limited to care and maintenance activities and certain land payments. B2Gold and AngloGold are continuing with discussions to finalize work programs, spending estimates and funding for 2017.
RISK FACTORS
The exploration, development and mining of natural resources are highly speculative in nature and are subject to significant risks. The risk factors noted below do not necessarily comprise all risks faced by us. Additional risks and uncertainties not presently known to us or that we currently consider immaterial may also impair our business, operations and future prospects. If any of the following risks actually occur, our business may be harmed and our financial condition and results of operations may suffer significantly.
Risks related to our business
Changes in the price of gold and other metals in the world markets, which can fluctuate widely, significantly affect the profitability of our operations and our financial condition and our ability to develop new mines.
The profitability of our operations is significantly affected by changes in the market price of gold and other mineral commodities. Mineral prices fluctuate widely and are affected by numerous factors beyond our control, including:
| • | the level of interest rates; | |
| • | the rate and anticipated rate of inflation; | |
| • | world supply of mineral commodities; | |
| • | consumption patterns; |
- 64 -
| • | purchases and sales of gold by central banks; | |
| • | forward sales by producers; | |
| • | production costs; | |
| • | demand from the jewelry industry; | |
| • | speculative activities; | |
| • | stability of exchange rates; | |
| • | the relative strength of the U.S. dollar and other currencies; | |
| • | changes in international investment patterns; | |
| • | monetary systems; and | |
| • | political and economic events. |
The price of gold increased by approximately 8.05% over the most recently completed fiscal year, with an increase in the price from $1,072.70/oz on January 4, 2016 to $1,159.10/oz on December 29, 2016. Current and future price declines could cause commercial production or the development of new mines to be impracticable. If gold prices decline significantly, or decline for an extended period of time, we might not be able to continue our operations, develop our properties, or fulfill our obligations under our permits and licenses, or under our agreements with our partners. This could result in us losing our interest in some or all of our properties, or being forced to cease operations or development activities or to abandon or sell properties, which could have a negative effect on our profitability and cash flow.
Our future revenues and earnings could also be affected by the prices of other commodities such as fuel and other consumable items. The prices of these commodities are affected by numerous factors beyond our control.
Our failure to achieve production, cost and other estimates could have a material adverse effect on our future cash flows, profitability, results of operations and financial condition.
This Annual Information Form and our other public disclosure contains estimates of future production, operating costs, capital costs and other economic and financial measures with respect to our existing mines and certain of our exploration and development stage projects. The estimates can change or we may be unable to achieve them. Actual production, costs, returns and other economic and financial performance may vary from the estimates depending on a variety of factors, many of which are not within our control. These factors include, but are not limited to:
|
• |
actual ore mined varying from estimates of grade, tonnage, dilution, and metallurgical and other characteristics; | |
|
• |
short-term operating factors such as the need for sequential development of ore bodies and the processing of new or different ore grades from those planned; | |
|
|
• |
mine failures, slope failures or equipment failures; |
|
|
• |
industrial accidents; |
|
|
• |
natural phenomena such as inclement weather conditions, floods, droughts, rock slides and earthquakes; |
|
|
• |
encountering unusual or unexpected geological conditions; |
|
|
• |
changes in power costs and potential power shortages; |
|
|
• |
exchange rate and commodity price fluctuations; |
|
• |
shortages of principal supplies needed for operations, including explosives, fuels, water and equipment parts; | |
|
|
• |
labour shortages or strikes; |
|
|
• |
litigation; |
|
|
• |
terrorism; |
|
|
• |
suspensions or closures imposed by governmental authorities; |
|
|
• |
civil disobedience and protests; |
|
• |
failure to comply with applicable regulations or new restrictions or regulations imposed by governmental or regulatory authorities; | |
|
|
• |
permitting or licensing issues; or |
|
|
• |
shipping interruptions or delays. |
- 65 -
Properties not yet in production, such as the Fekola Project, or slated for expansion, are subject to higher risks as new mining operations often experience unexpected problems during the start-up phase, and production delays and cost adjustments can often happen. Failure to achieve production or cost estimates or material increases in costs could have a material adverse effect on our future cash flows, profitability, results of operations and financial condition.
Mineral exploration and development involves significant risks and uncertainties, which could have a material adverse effect on our business, results of operations and financial condition.
Our business plans and projections rely significantly on the planned development of our non-producing properties, such as the Fekola Project. The development of mineral deposits involves significant risks that even a combination of careful evaluation, experience and knowledge may not eliminate. While the discovery of an ore body may result in substantial rewards, few properties that are explored are ultimately developed into producing mines and no assurance can be given that minerals will be discovered in sufficient quantities or having sufficient grade to justify commercial operations or that funds required for development can be obtained on a timely basis. Major expenses may be required to locate and establish Mineral Reserves, to develop metallurgical processes and to construct mining and processing facilities at a particular site. It is impossible to ensure that the exploration or development programs we or any of our joint venture partners plan will result in a profitable commercial mining operation.
In addition, developments are prone to material cost overruns versus budget. The capital expenditures and time required to develop new mines including building mining and processing facilities for new properties are considerable and changes in cost or construction schedules can significantly increase both the time and capital required to build the mine. The project development schedules are also dependent on obtaining the governmental approvals necessary for the operation of a mine which is often beyond our control. It is not unusual in the mining industry for new mining operations to experience unexpected problems during the start-up phase, resulting in delays and requiring more capital than anticipated.
The combination of these factors may result in our inability to develop our non-producing properties, to achieve or maintain historical or estimated production, revenue or cost levels, or to receive an adequate return on invested capital, which could have a material adverse effect on our business, results of operations and financial condition.
An adverse outcome of the DENR audit could have a materially adverse effect on the Company’s business and operations in the Philippines.
As described under the heading “General Development of the Business – Three Year History”, the Company’s Masbate Gold Project was subject to an audit by the DENR. While the Company believes it has comprehensively responded to the issues raised in the audit, the final outcome of the audit is not certain. Enforcement action, such as a suspension of operations or significant penalties, may have a material and adverse effect on our business, operations, production estimates and financial condition.
Undue reliance should not be placed on estimates of Mineral Reserves and Mineral Resources, since these estimates are subject to numerous uncertainties. Our actual Mineral Reserves could be lower than Mineral Reserve estimates and Mineral Resources may never be converted into Mineral Reserves, which could adversely affect our operating results and financial condition.
The figures for Mineral Reserves and Mineral Resources are estimates only and no assurance can be given that the anticipated tonnages and grades will be achieved, that the indicated level of recovery will be realized or that Mineral Reserves could be mined or processed profitably. There are numerous uncertainties inherent in estimating Mineral Reserves and Mineral Resources, including many factors beyond our control. Such estimation is a subjective process, and the accuracy of any Mineral Reserve or Mineral Resource estimate is a function of the quantity and quality of available data and of the assumptions made and judgments used in engineering and geological interpretation. Short-term operating factors relating to the Mineral Reserves, such as the need for orderly development of the ore bodies or the processing of new or different ore grades, may cause the mining operation to be unprofitable in any particular accounting period. In addition, there can be no assurance that gold recoveries in small scale laboratory tests will be duplicated in larger scale tests under on-site conditions or during production.
- 66 -
Fluctuation in gold prices, results of drilling, metallurgical testing and production, increases in capital and operating costs, including the cost of labour, equipment, fuel and other required inputs and the evaluation of mine plans after the date of any estimate may require revision of such estimate. The volume and grade of Mineral Reserves mined and processed and the recovery rates may not be the same as currently anticipated. Any material reductions in estimates of Mineral Reserves and Mineral Resources, or of our ability to extract these Mineral Reserves, could have a material adverse effect on our results of operations and financial condition.
Mineral Resources that are not Mineral Reserves do not have demonstrated economic viability. Due to uncertainty that may attach to Inferred Mineral Resources, Inferred Mineral Resources may not be upgraded to Measured and Indicated Mineral Resources or Proven and Probable Reserves as a result of continued exploration. Our projections regarding continuing operations and production at La Libertad Mine beyond Mineral Reserves are based on the assumption that we will be able to mine certain Mineral Resources, including Inferred Resources, that have not been classified as Mineral Reserves. Inferred Mineral Resources are considered too speculative geologically to have the economic considerations applied to them that would enable them to be categorized as Mineral Reserves and there is no certainty that such projections will be realized. Although the Company has been successful in converting Mineral Resources to Mineral Reserves in the past, there is no certainty of converting Mineral Resources to Mineral Reserves and it may not be successful in the future.
Our operations across several different countries subject us to various political, economic and other risks that could negatively impact our operations and financial condition.
Our exploration, development and production activities are conducted in various countries, including Nicaragua, the Philippines, Namibia, Mali, Burkina Faso and Colombia and, as such, our operations are exposed to various levels of political, economic and other risks and uncertainties. These risks and uncertainties vary from country to country and include, but are not limited to, the existence or possibility of terrorism; hostage taking; military repression; extreme fluctuations in currency exchange rates; high rates of inflation; labour unrest; the risks of war or civil unrest; expropriation and nationalization; uncertainty as to the outcome of any litigation in foreign jurisdictions; uncertainty as to enforcement of local laws; environmental controls and permitting; restrictions on the use of land and natural resources; renegotiation or nullification of existing concessions; licenses; permits and contracts; illegal mining; changes in taxation policies; restrictions on foreign exchange and repatriation; corruption; unstable legal systems; changing political conditions; changes in mining and social policies; social unrest on account of poverty or unequal income distribution; “black economic empowerment” legislation; currency controls and governmental regulations that favor or require the awarding of contracts to local contractors or require foreign contractors to employ citizens of, or purchase supplies from, a particular jurisdiction or require equity participation by local citizens; and other risks arising out of foreign sovereignty issues.
We have interests in exploration and development properties that are located in developing countries, including Nicaragua, the Philippines, Namibia, Mali, Burkina Faso and Colombia and our mineral exploration and mining activities may be affected in varying degrees by political instability and governmental legislation and regulations relating to foreign investment and the mining industry. Many of these countries have experienced, or are currently experiencing, varying degrees of civil unrest. Changes, if any, in mining or investment policies or shifts in political attitude in Nicaragua, the Philippines, Namibia, Mali, Burkina Faso or Colombia may adversely affect our operations or profitability.
Operations may be affected in varying degrees by:
|
• |
government regulations with respect to, but not limited to, restrictions on production, price controls, exchange controls, export controls, currency remittance, income or other taxes, expropriation of property, foreign investment, maintenance of claims, environmental legislation, land use, land claims of local people, local content and ownership (such as “black economic empowerment” laws), water use and mine safety; and | |
|
• |
the lack of certainty with respect to foreign legal systems, which may not be immune from the influence of political pressure, corruption or other factors that are inconsistent with the rule of law. |
- 67 -
Failure to comply with applicable laws, regulations, and permitting requirements may result in enforcement actions thereunder, including orders issued by regulatory or judicial authorities causing operations to cease or be curtailed, and may include corrective measures requiring capital expenditures, installation of additional equipment, or remedial actions. The occurrence of these various factors and uncertainties cannot be accurately predicted and could have a material adverse effect on our business, financial condition and results of operations.
Furthermore, in the event of a dispute arising from our activities, we may be subject to the exclusive jurisdiction of courts or arbitral proceedings outside of North America or may not be successful in subjecting persons to the jurisdiction of courts in North America, either of which could unexpectedly and adversely affect the outcome of a dispute.
We are subject to taxation in several different jurisdictions, and adverse changes to the taxation laws of such jurisdictions or unanticipated tax consequences of corporate reorganizations, could have a material adverse effect on our profitability.
We are subject to the taxation laws of a number of different jurisdictions. These taxation laws are complicated and subject to changes and are subject to review and assessment in the ordinary course. Any such changes in taxation law or reviews and assessments could result in higher taxes being payable by us, which could adversely affect our profitability. Taxes may also adversely affect our ability to repatriate earnings and otherwise deploy our assets.
In addition, we have recently completed and may complete in the future, corporate reorganizations and reorganizations of the entities holding our projects. In the event that such reorganizations result in the imposition of an unanticipated tax or penalty, it may have a material adverse effect on our business. We may also be subject to ongoing tax audits from time to time. Adverse results of such tax audits may have a negative effect on the business of the Company.
Fluctuations in the price and availability of infrastructure and energy and other commodities could impact our profitability and development of projects.
Mining, processing, development and exploration activities depend, to one degree or another, on adequate infrastructure. Reliable roads, bridges, power sources and water supply are important determinants which affect capital and operating costs. Our inability to secure adequate water and power resources including the possibility of drought in Namibia due to recent weather patterns, as well as other events outside of our control, such as unusual or infrequent weather phenomena, sabotage, community, or government or other interference in the maintenance or provision of such infrastructure, or failure to maintain or extend such infrastructure, could adversely affect our operations, financial condition and results of operations.
Profitability is affected by the market prices and availability of commodities that we use or consume for our operations and development projects. Prices for commodities like diesel fuel, electricity, steel, concrete, and chemicals (including cyanide) can be volatile, and changes can be material, occur over short periods of time and be affected by factors beyond our control. Our operations use a significant amount of energy and depend on suppliers to meet those needs; however, sometimes no alternative source is available. Higher costs for construction materials like steel and concrete, or tighter supplies, can affect the timing and cost of our development projects, and we may decide that it is not economically feasible to continue some or all of our commercial production and development activities, which could have an adverse effect on our profitability.
Higher worldwide demand for critical resources like input commodities, drilling equipment, tires and skilled labour could affect our ability to acquire them and lead to delays in delivery and unanticipated cost increases, which could have an effect on our operating costs, capital expenditures and production schedules.
The Company may be unable to generate sufficient cash to service its debt, the terms of the agreements governing its debt may restrict the Company’s current or future operations and the indebtedness may have a material adverse effect on the Company’s financial condition and results of operations.
The Company's ability to make scheduled payments on the Credit Facility and any other indebtedness will depend on its financial condition and operating performance, which are subject to prevailing economic and competitive conditions and to certain financial, business, legislative, regulatory and other factors beyond its control. If the Company’s cash flows and capital resources are insufficient to fund its debt service obligations, the Company could face substantial liquidity problems and could be forced to reduce or delay investments and capital expenditures or to dispose of material assets or operations, seek additional debt or equity capital or restructure or refinance the Company’s indebtedness, including indebtedness under the Credit Facility. The Company may not be able to effect any such alternative measures on commercially reasonable terms or at all and, even if successful, those alternatives may not allow the Company to meet its scheduled debt service obligations.
- 68 -
In addition, a breach of the covenants, including the financial covenants under the Credit Facility or the Company’s other debt instruments from time to time could result in an event of default under the applicable indebtedness. Such a default may allow the creditors to impose default interest rates or accelerate the related debt, which may result in the acceleration of any other debt to which a cross acceleration or cross default provision applies. In the event a lender accelerates the repayment of the Company’s borrowings, the Company may not have sufficient assets to repay its indebtedness.
The Credit Facility contains a number of covenants that will impose significant operating and financial restrictions on the Company and may limit the Company’s ability to engage in acts that may be in its long term best interest. In particular, the Credit Facility restricts the Company’s ability to dispose of assets to make dividends or distributions and to incur additional indebtedness and grant security interests or encumbrances. As a result of these restrictions, the Company may be limited in how it conducts its business, may be unable to raise additional debt or equity financing, or may be unable to compete effectively or to take advantage of new business opportunities, each of which restrictions may affect the Company’s ability to grow in accordance with its strategy.
Further, the Company’s maintenance of substantial levels of debt could adversely affect its financial condition and results of operations and could adversely affect its flexibility to take advantage of corporate opportunities. Substantial levels of indebtedness could have important consequences to the Company, including:
|
• |
limiting the Company’s ability to obtain additional financing to fund future working capital, capital expenditures, acquisitions or other general corporate requirements, or requiring the Company to make non- strategic divestitures; | |
|
• |
requiring a substantial portion of the Company’s cash flows to be dedicated to debt service payments instead of other purposes, thereby reducing the amount of cash flows available for working capital, capital expenditures, acquisitions and other general corporate purposes; | |
|
|
• |
increasing the Company’s vulnerability to general adverse economic and industry conditions; |
|
|
• |
exposing the Company to the risk of increased interest rates for any borrowings at variable rates of interest; |
|
• |
limiting the Company’s flexibility in planning for and reacting to changes in the industry in which it competes; | |
|
|
• |
placing the Company at a disadvantage compared to other, less leveraged competitors; and |
|
|
• |
increasing the Company’s cost of borrowing. |
- 69 -
Mining is inherently dangerous and subject to conditions or events beyond our control, which could have a material adverse effect on our business, and mineral exploration is speculative and uncertain.
Mining operations generally involve a high degree of risk. Our operations are subject to all the hazards and risks normally encountered in the exploration, development and production of gold, including: unusual and unexpected geologic formations; seismic activity; rock bursts; cave-ins or slides; flooding; pit wall failure; periodic interruption due to inclement or hazardous weather conditions; and other conditions involved in the drilling and removal of material, any of which could result in damage to, or destruction of, mines and other producing facilities, personal injury or death, damage to property, environmental damage and possible legal liability. Milling operations are subject to hazards such as fire, equipment failure or failure of retaining dams around tailings disposal areas, which may result in environmental pollution and consequent liability.
Hedging activities and ore purchase commitments could have a material adverse effect on our business, results of operations and financial condition.
We have entered into a series of “zero-cost put/call” collar contracts for gold with settlements scheduled up to April 26, 2018 with an average floor price of $1,000/oz and an average ceiling price of $1,719/oz. In addition, we have a series of Rand denominated gold forward contracts outstanding for 71,832 ounces of gold as at December 31, 2016 with settlements scheduled up to December 31, 2018 at an average price of 15,044 Rand per ounce.
During the year ended December 31, 2016, we entered into a series of forward contracts for the purchase of fuel, oil, gas oil and diesel, with settlements scheduled between July 2016 and January 2019. During the year ended December 31, 2016, we also entered into a series of interest rate swap contracts for a notional amount of $100 million. Under these contracts, the Company receives a floating rate equal to the three month U.S. dollar LIBOR and pays a fixed rate of 1.04% . These contracts have scheduled settlements between September 2016 and May 2019.
The majority of the Company’s portfolio of fuel derivatives and Rand denominated gold forwards are marked to market through the statement of operations. A 10% change in the forward price of fuel would result in a $3 million change in the value of the fuel derivative portfolio. A 10% change in the United States dollar forward price of gold would result in a $11 million change in the value of the gold forward portfolio and a 10% change in the Rand versus the United States dollar forward rate would result in a $9 million change in the value of the gold forward portfolio. Gold forward contracts covering certain ounces are excluded from IAS 39 and accounted for as executory contracts because they were entered into, and continue to be held, for the purpose of delivery. No fair value gains or losses on these contracts are recorded in the Company’s financial statements.
From time to time we may engage in other commodity hedging transactions intended to reduce the risk associated with fluctuations in metal prices, but there is no assurance that any such transaction will be successful. Furthermore, hedging transactions may prevent us from realizing the full benefit of price increases.
We require licenses, permits and approvals from various governmental authorities to conduct our operations, the failure to obtain or loss of which could have a material adverse effect on our business.
Our mining operations in the Philippines, Mali, Namibia and Nicaragua, and our various exploration and development projects are subject to receiving and maintaining licenses, permits and approvals from appropriate governmental authorities. Although our mining operations currently have all required licenses, permits and approvals that we believe are necessary for operations as currently conducted, no assurance can be provided that we will be able to maintain and renew such permits or obtain any other permits that may be required. With regards to Namibia, any new mineral licences or renewals of existing mineral licences may be subject to certain terms and conditions relating to “Namibianisation” (i.e. transferring a portion (commonly 5%)) of the shareholding in the respective licence holder to Namibian citizens or Namibian controlled companies, as well as undertaking social welfare or community upliftment obligations, specifically in respect of the poor, women and youth in Namibia. It may also be subject to the licence holder appointing a certain percentage of its management (currently 20%) from Namibian citizens, specifically also persons of colour, women or disabled persons. While we understand that such terms and conditions do not currently apply to ML 169 in respect of the Otjikoto Project, although it is not entirely clear, they may be applicable to renewals of EPL’s and ML’s in the future as well as any new grants of mineral licences to B2Gold.
Laws and Regulations in the Philippines may affect the Company’s ability to secure additional permits necessary for the planned new pit operations at the Masbate Gold Project. Under Memorandum #1 dated July 8 2016, the DENR issued a moratorium on the approval of all new mining projects including acceptance, processing, and/or approval of applications for mining permits. We understand that Memorandum #1 will remain in force until it is formally terminated. We also understand that Memorandum #1 was issued in connection with the audit of existing mines in the Philippines conducted by the DENR in 2016 and anticipate that it will be rescinded once such audit is completed; however, there is no assurance when or if such rescission may occur. In addition, EO#79 issued on July 6, 2012 provides that no new MPSAs shall be entered into until new legislation rationalizing revenue sharing is in effect. However, EO#79 provides that the DENR can continue to grant EPs. The Philippines Mines and Geosciences Bureau has indicated that it will continue to issue permits at our existing mine operations notwithstanding EO#79, since these are not part of new MPSAs. Therefore, once Memorandum #1 is rescinded, we do not expect EO#79 to prevent us from obtaining permits necessary to conduct our planned new pit operations.
There have in the past been challenges to permits that were temporarily successful and delays in the renewal of certain permits. There is no assurance that delays will not occur in connection with obtaining necessary renewals of authorizations for existing operations, additional licenses, permits and approvals for future operations, or additional licenses, permits and approvals associated with new legislation. An inability to obtain or conduct our mining operations pursuant to applicable authorizations would materially reduce our production and cash flow and could undermine our profitability.
- 70 -
We are subject to risks relating to environmental regulations and our properties may be subject to environmental hazards, which may have a material adverse effect on our business, operations and financial condition.
Our operations are subject to local laws and regulations regarding environmental matters, including, without limitation, the renewal of environmental clearance certificates, the use or abstraction of water, land use and reclamation, air quality and the discharge of mining wastes and materials. Any changes in these laws could affect our operations and economics. Environmental laws and regulations change frequently, and the implementation of new, or the modification of existing, laws or regulations could harm us. We cannot predict how agencies or courts in foreign countries will interpret existing laws and regulations or the effect that these adoptions and interpretations may have on our business or financial condition. For example, as noted under the heading “General Development of the Business – Three Year History – 2016 Developments”, the DENR recently announced an audit of mines in the Philippines to assess compliance with applicable regulations. The final outcome of such audit in respect of the Masbate Gold Project is not certain.
We may be required to make significant expenditures to comply with governmental laws and regulations. Any significant mining operations will have some environmental impact, including land and habitat impact, arising from the use of land for mining and related activities, and certain impact on water resources near the project sites, resulting from water use, rock disposal and drainage run-off. We may also acquire properties with known or undiscovered environmental risks. Any indemnification from the entity from whom we have acquired such properties may not be adequate to pay all the fines, penalties and costs (such as clean-up and restoration costs) incurred related to such properties.
Some of our properties have been used for mining and related operations for many years before we acquired them and were acquired as is or with assumed environmental liabilities from previous owners or operators. We have been required to address contamination at our properties in the past and may need to continue to do so in the future, either for existing environmental conditions or for leaks or discharges that may arise from our ongoing operations or other contingencies. Contamination from hazardous substances, either at our own properties or other locations for which we may be responsible, may subject us to liability for the investigation or remediation of contamination, as well as for claims seeking to recover for related property damage, personal injury or damage to natural resources. The occurrence of any of these adverse events could have a material adverse effect on our future growth, results of operations and financial position.
Production at certain of our mines involves the use of sodium cyanide, which is a toxic material. Should sodium cyanide leak or otherwise be discharged from the containment system, we may become subject to liability for cleanup work that may not be insured. While appropriate steps will be taken to prevent discharge of pollutants into the ground water and the environment, we may become subject to liability for hazards that we may not be insured against and such liability could be material.
While we believe we do not currently have any material unrecognized under environmental obligations, exploration, development and mining activities may give rise in the future to significant liabilities on our part to the government and third parties and may require us to incur substantial costs of remediation. Additionally, we do not maintain insurance against environmental risks. As a result, any claims against us may result in liabilities that we will not be able to afford, resulting in the failure of our business.
In some jurisdictions, forms of financial assurance are required as security for reclamation activities. The cost of our reclamation activities may materially exceed our provisions for them, or regulatory developments or changes in the assessment of conditions at closed operations may cause these costs to vary substantially, from prior estimates of reclamation liabilities. Under the 2012 Mining Code in Mali, we are required to post a reclamation bond with the State of Mali. We are currently in discussions with the Government of Mali as to the details of this reclamation bond. Until the requirements of the reclamation bond are finalized, we face the risk of being required to post a higher than anticipated bond for such project.
- 71 -
Failure to comply with applicable laws, regulations, and permitting requirements may result in enforcement actions thereunder, including orders issued by regulatory or judicial authorities causing operations to cease or be curtailed, and may include corrective measures requiring capital expenditures, installation of additional equipment, or remedial actions. Parties engaged in exploration operations may be required to compensate those suffering loss or damage by reason of the exploration activities and may have civil or criminal fines or penalties imposed for violations of applicable laws or regulations and, in particular, environmental laws. Amendments to current laws, regulations and permits governing operations and activities of exploration companies, or more stringent implementation thereof, could have a material adverse impact on us and cause increases in expenditures and costs or require abandonment or delays in developing new mining properties.
Our operations are associated with the emission of ‘greenhouse gases’. Ongoing international negotiations which aim to limit greenhouse gas emissions may result in the introduction of new regulations, and may have an adverse impact on our operations.
Our operations are subject to other stringent laws and regulations, which could significantly limit our ability to conduct our business.
In addition to environmental laws and permitting requirements, our activities are subject to stringent laws and regulations governing, among other things, prospecting, development and production; imports and exports; taxes; labour standards, occupational health and mine safety; mineral tenure, land title and land use; water and air quality regulations; protection of endangered and protected species; social legislation; and other matters.
Compliance with these laws may require significant expenditures. If we are unable to comply fully, we may be subject to enforcement actions or other liabilities, or our image may be harmed, all of which could materially affect our operating costs, delay or curtail our operations or cause us to be unable to obtain or maintain required permits. There can be no assurance that we have been or will be at all times in compliance with all applicable laws regulations, that compliance will not be challenged or that the costs of complying with current and future laws and regulations will not materially or adversely affect our business, operations or results.
New laws and regulations, amendments to existing laws and regulations or administrative interpretation, or more stringent enforcement of existing laws and regulations, whether in response to changes in the political or social environment we operate in or otherwise, could have a material and adverse effect on our future cash flow, results of operations and financial condition. For instance, the Nicaraguan government is contemplating a new mining law called “ENIMINAS Law”, which proposes to modify Law 387: Special Law on Mining Exploration and Exploitation which, among others, may result in the creation of a government mining company that would hold a 10% interest on all new companies that request mining concessions or on current companies that require extensions of existing mining concessions. The impact of such law, if approved, on La Libertad and Limon Mines is unknown at this time.
We are subject to a variety of risks associated with joint ventures, which could result in a material adverse effect on our future growth, results of operations and financial position.
A number of the properties in which we have an interest are not wholly-owned by us or the subject of joint venture arrangements with other mining companies and will be subject to the risks normally associated with the conduct of jointly-held projects and joint ventures. The existence or occurrence of one or more of the following circumstances and events could have a material adverse effect on the viability of our interests held through joint ventures, which could have a material adverse effect on our future growth, results of operations and financial conditions:
| • | inability to exert influence over certain strategic decisions made in respect of joint venture properties; | |
|
• |
a joint venture participant having economic or business interests or goals that are, or become, inconsistent with our business interests or goals; | |
| • | bankruptcy of the joint venture participant; | |
| • | disagreement with joint venture participants on how to develop and operate mines efficiently; |
- 72 -
| • | inability of participants to meet their obligations to the joint venture or third parties; and | |
| • | litigation between participants regarding joint venture matters. |
We need to continually obtain additional Mineral Reserves for production of gold and other metals.
We must continually replace and expand our Mineral Reserves and any necessary associated surface rights as our mines produce gold. The LOM estimates for each of our operating mines are based on our best estimate given the information available to us and may not be correct.
We may be unable to identify appropriate acquisition targets or complete desirable acquisitions, and we may be unsuccessful in integrating businesses and assets that we have acquired or may acquire in the future.
As part of our business strategy, we have sought and will continue to seek new operating and development opportunities in the mining industry. In pursuit of such opportunities, we may fail to select appropriate acquisition candidates or negotiate acceptable arrangements, including arrangements to finance acquisitions or integrate the acquired businesses and their personnel into B2Gold. There can be no assurance that we can complete any acquisition or business arrangement that we pursue, or are pursuing, on favorable terms, if at all, or that any acquisitions or business arrangements completed will ultimately benefit our business.
Acquisitions are accompanied by risks, such as a significant decline in the relevant metal price after we commit to complete an acquisition on certain terms; the quality of the mineral deposit acquired proving to be lower than expected; the difficulty of assimilating the operations and personnel of any acquired companies; the potential disruption of our ongoing business; the inability of management to realize anticipated synergies and maximize our financial and strategic position; the failure to maintain uniform standards, controls, procedures and policies; the impairment of relationships with employees, customers and contractors as a result of any integration of new management personnel; and the potential for unknown or unanticipated liabilities associated with acquired assets and businesses, including tax, environmental or other liabilities. There can be no assurance that acquired businesses or assets will be profitable, that we will be able to integrate the acquired businesses or assets successfully or that we will identify all potential liabilities during the course of due diligence. Any of these factors could have a material adverse effect on our business, expansion, results of operations and financial condition.
Fluctuations in foreign currency exchange rates could materially affect our business, financial condition, results of operations and liquidity.
Our assets and operations are located in Canada, the Philippines, Namibia, Nicaragua, Mali, Burkina Faso, Colombia and Finland. We also have gold forward contracts denominated in the South African Rand. As a result, we have foreign currency exposure with respect to items not denominated in U.S. dollars. The three main types of foreign exchange risk we face can be categorized as follows:
|
• |
Transaction exposure: our operations sell commodities and incur costs in different currencies. This creates exposure at the operational level, which may affect our profitability as exchange rates fluctuate; | |
|
• |
Exposure to currency risk: we are exposed to currency risk through a portion of the following assets and liabilities denominated in currencies other than the U.S. dollar: cash and cash equivalents, trade and other receivables, trade and other payables, reclamation and closure costs obligations, warrants and gross balance exposure; and | |
|
• |
Translation exposure: our functional and reporting currency is U.S. dollars. Our other operations may have assets and liabilities denominated in currencies other than the U.S. dollar, with translation foreign exchange gains and losses included from these balances in the determination of profit or loss. Therefore, as the exchange rates between the Canadian dollar, Nicaraguan Córdoba, Philippine peso, Colombian peso, Namibian dollar, West African CFA franc (which is pegged to the Euro), South African Rand and the Euro fluctuate against the United States dollar, we will experience foreign exchange gains and losses, which can have a significant impact on our consolidated operating results. The exchange rate between the Córdoba and the United States dollar varies according to a pattern set by the Nicaraguan Central Bank. The Córdoba has been annually devalued versus the United States dollar by means of a crawling peg mechanism, which currently stands at approximately 5%. |
- 73 -
As a result, fluctuations in currency exchange rates could significantly affect our business, financial condition, results of operations and liquidity.
We rely on outside contractors to conduct certain mining and exploration activities, which could result in a material adverse effect on our business, results of operations and financial condition.
Certain of our mining and exploration activities are conducted by outside contractors. As a result, our operations at these sites will be subject to a number of risks, some of which will be outside of our control, including negotiating agreements with contractors on acceptable terms; the inability to replace a contractor and its operating equipment in the event that either party terminates the agreement; reduced control over such aspects of operations that are the responsibility of the contractor; failure of a contractor to perform under its agreement with us; failure of a contractor to comply with applicable legal and regulatory requirements, to the extent that it is responsible for such compliance; and problems of a contractor with managing its workforce, labour unrest or other employment issues. In addition, we may incur liability to third parties as a result of the actions of a contractor. The occurrence of one or more of these risks could have a material adverse effect on our business, results of operations and financial condition.
We may not be able to obtain additional financing on acceptable terms, or at all.
Future exploration, development, mining, and processing of minerals from our properties, or repayment of current or future indebtedness, could require substantial additional financing. No assurances can be given that we will be able to raise the additional funding that may be required for such activities or repayment of indebtedness, should such funding not be fully generated from operations. To meet such funding requirements, we may be required to undertake additional equity financing, which would be dilutive to shareholders. Debt financing, if available, may involve certain restrictions on operating activities or other financings. There is no assurance that such equity or debt financing will be available to us or that they would be obtained on terms favourable to us, if at all, which may adversely affect our business and financial position. Failure to obtain sufficient financing may result in delaying or indefinite postponement of exploration, development, or production on any or all of our properties, or even a loss of property interests.
There is uncertainty relating to the outcome of discussions with the State of Mali.
We are currently in the process of negotiating certain matters with the State of Mali including: (i) the Fekola Shareholder Agreement, (ii) the valuation and terms under which the State of Mali may acquire its additional 10% ownership interest in Fekola S.A., and (iii) certain other matters to address and clarify certain issues under the 2012 Mining Code and the Fekola Convention, including the terms of the reclamation bond for the Fekola Project, the right of Malian private investors to acquire for cash at least 5% of the shares of Fekola S.A. under the 2012 Mining Code, the final ownership of Fekola S.A. and the entity to operate the Fekola Project. There is no certainty as to the outcome of these discussions and until these matters are settled and the Shareholder Agreement is completed, we do not have certainty on the ultimate corporate structure of Fekola S.A., the State of Mali’s ownership interest in Fekola S.A. or the precise permitting and other requirements that will apply to the Fekola Project. There is also no certainty that the completion of negotiations will fully resolve all uncertainties on these matters.
The Fekola Project is currently under development and we may not be able to successfully establish mining operations or the actual costs or time frame of establishing mining operations may differ materially from the Company’s current estimates.
The development of the Fekola Project will require the construction and operation of an open-pit mine, processing plants and related infrastructure. As a result, we are and will continue to be subject to all of the risks associated with establishing new mining operations including:
|
|
• |
the availability of funds to finance construction and development activities; |
|
|
• |
the receipt of required governmental approvals and permits; |
|
• |
the availability and costs of skilled labour and the ability of key contractors to perform services in the manner contracted for; | |
|
|
• |
unanticipated changes in grade and tonnage of ore to be mined and processed; |
|
|
• |
unanticipated adverse geotechnical conditions; |
|
|
• |
incorrect data on which engineering assumptions are made; |
|
• |
potential increases in construction and operating costs due to changes in the cost of fuel, power, materials, skilled labour, security and supplies; | |
|
|
• |
adequate access to the site and unanticipated transportation costs or disruptions; and |
|
• |
potential opposition or obstruction from non-governmental organizations, environmental groups, terrorists or local groups which may delay or prevent development activities. |
Any delay in the performance of any one or more of the contractors, suppliers, consultants or other persons on which we are dependent in connection with the construction of the Fekola Project, a delay in or failure to receive the required governmental approvals and permits in a timely manner or on reasonable terms, or a delay in or failure in connection with the completion and successful operation of the operational elements in connection with the Fekola Project could delay or prevent the construction and start-up of the mine as planned. There can be no assurances that the current construction and start-up plan for the Fekola Project will be successful.
- 74 -
The actual production, development plans and costs associated with the Fekola Project may differ from the estimates in the Fekola Feasibility Study.
The Fekola Feasibility Study contains estimates of future production, development plans, operating and capital costs, financial returns and other economic and technical estimates relating to the Fekola Project. These estimates are based on a variety of factors and assumptions and there is no assurance that such production, plans, costs or other estimates will be achieved. Actual costs and financial returns may vary significantly from the estimates depending on a variety of factors many of which are not within our control. These factors include, but are not limited to: actual ore mined varying from estimates of grade, tonnage, dilution and metallurgical and other characteristics; the price of gold; short-term operating revisions to mine plans; equipment failures; industrial accidents; natural phenomena; encountering unusual or unexpected geological conditions; changes in power costs and potential power shortages; exchange rate and commodity price fluctuations; shortages of principal supplies needed for development and operations; labor shortages or strikes; high rates of inflation; civil disobedience, protests and acts of civil unrest or terrorism, applicable taxes and restrictions or regulations imposed by governmental or regulatory authorities or other changes in the regulatory environments. Failure to achieve estimates or material increases in costs could have a material adverse impact on our future cash flows, profitability, results of operations and financial condition.
The current estimate of capital expenditures that will be required to be incurred to complete the Fekola Project is based on certain assumptions and analyses made by our management and its advisors in light of their experience and perception of historical trends, current conditions and expected future developments, as well as other factors management believes are appropriate in the circumstances. These estimates, however, and the assumptions upon which they are based, are subject to a variety of risks and uncertainties and other factors that could cause actual expenditures to differ from those estimates. If these estimates prove incorrect, the total capital expenditures required to complete the Fekola Project may increase. We cannot be assured that we will have access to sufficient financing or generate sufficient cash flows to fund any increase in required capital spending from the construction and development of the Fekola Project. There can be no assurances that development and start-up costs and the ongoing operating costs associated with the development of the Fekola Project will be as anticipated and any increase in costs could materially adversely affect our business, results of operations, financial condition and cash flow.
Because our property interests and exploration activities in Namibia are subject to political, economic and other uncertainties, situations may arise that could have a material adverse effect on our business.
The Namibian economy is highly dependent on the mining sector, which, in 2016, was estimated at approximately 13% of GDP. Namibia is also highly dependent on foreign imports, including fuel. These factors make the Namibian economy vulnerable to adverse commodity price fluctuations, which could have a material adverse effect on our business.
In addition, Namibia is a member of the Southern African Customs Union (“SACU”), which provides for a common external tariff and guarantees free movement of goods between its member states. A high proportion of Namibia’s trade is conducted with SACU members and, in its 2016 budget, the Namibian Ministry of Finance stated that a significant risk for revenue growth is the projected reduction of SACU revenue. The Namibian Government is highly dependent on SACU revenue, but Namibia’s share of the SACU revenue is expected to decline in the foreseeable future, as a result of which the Namibian government may be compelled to introduce additional taxes or increase current tax rates, which could have a material adverse effect on our business.
In 2015, Namibia released a first version, and in 2016, Namibia released a second version of the so-called Namibia Equitable Economic Empowerment Framework bill (the “NEEEF Bill”), a controversial bill which proposed, in effect, the forced transfer of 25% of the shares or economic interest in any business enterprise conducting business in Namibia to certain designated persons, being persons of colour, women and disabled persons. Whilst the NEEEF Bill contained various controversial provisions which may render it unconstitutional, the NEEEF Bill caused considerable uncertainty in the Namibian business community and the investor community, on account of which it is still under discussion and revision. It is not clear if and when the NEEEF Bill will become law, and in any event, there would need to be regulations to be operative. As it is only a bill, it is entirely speculative at this time to determine the extent to which the NEEEF Bill would affect B2Gold Namibia in practice.
- 75 -
In 2016, the Namibian parliament passed a new investment law termed the Namibia Investment Promotion Act, 2016, which has not yet come into force. If it should become law, the Namibia Investment Promotion Act, 2016 would materially change the legal basis on which foreign investments are to be made, maintained and withdrawn from Namibia. In essence, the law provides not only for reservation of certain businesses to Namibians, but also requires the approval of the Minister of Industrialisation, Trade and SME Development prior to making an investment, when expanding an investment and when disinvesting, on essentially a discretionary basis. The law also abolishes the recourse of foreign investors to international tribunals by insisting that any disputes be exclusively dealt with under Namibian law and by the Namibian courts. The Namibia Investment Promotion Act, 2016, should it come into force, may be expected to have a negative effect on investor security and new investments into Namibia. In the absence of regulations or guidelines with respect to the approval process, it is entirely at the discretion of the Minister to determine what type of foreign investments, disinvestments or changes to current investments will be allowed, and it is entirely speculative at this time to determine the extent to which the Namibia Investment Promotion Act, 2016 would affect B2Gold Namibia in practice.
Failure to comply with Philippines regulations or political and legal developments in the Philippines could have a material adverse effect on our business, operations and financial condition.
The Constitution of the Philippines provides that all natural resources are owned by the State which may enter into a coproduction, joint venture or production sharing agreement with citizens of the Philippines or corporations or associations whose capital is at least 60% owned by Philippine citizens. Commonwealth Act No. 108, as amended (the “Anti-Dummy Act”), provides penalties for, among others: (a) Filipinos who permit aliens to use them as nominees or dummies so that the aliens could enjoy privileges otherwise reserved for Filipinos or Filipino corporations, and (b) aliens or foreigners who profit from the adoption of these dummy relationships. It also penalizes the act of falsely simulating the existence of minimum stock or capital as owned by citizens of the Philippines or any other country in cases in which a constitutional or legal provision requires that before a corporation or association may exercise or enjoy a right, franchise or privilege, not less than a certain percentage of its capital must be owned by such citizens.
The Anti-Dummy Act likewise prohibits aliens from intervening in the management, operation, administration or control of nationalized business or enterprises, whether as officers, employees or labourers, with or without remuneration, except that aliens may take part in technical aspects only, provided (a) no Filipino can do such technical work, and (b) it is with express authority from the Secretary of Justice. The Anti-Dummy Act also allows the election of aliens as members of the boards of directors or the governing bodies of corporations or associations engaged in partially nationalised activities in proportion to their allowable participation or share in the capital of such entities. Although we believe our structure complies with all Philippine regulations, there is a risk that, given the limited precedents to date in the country, it could be changed or challenged. Our failure to comply with Philippines regulations could have a material adverse effect on our business, operations and financial condition.
Our investments in the Masbate Gold Project may be adversely affected by our lack of sole decision-making authority and disputes between us and the majority owner of Filminera.
The Company, through its subsidiaries, is a minority shareholder in Filminera, which owns the Masbate Gold Project. Zoom is the majority shareholder. As the minority shareholder, we are not in a position to exercise sole decision making authority regarding the Masbate Gold Project. We may be unable to cause Filminera to take, or refrain from taking, actions consistent with our business strategies and objectives. Any change in the identity, management, ownership or strategic direction of Zoom, or any disagreement with Zoom or its owners could materially adversely affect our business and results of operations. If a dispute arises between us and Zoom or its owners that cannot be resolved amicably, we may be unable to further our business strategies and objectives, may not realize the anticipated benefits of our investment in the Masbate Gold Project and associated processing facilities (in which we hold a 100% interest) and may be involved in lengthy and costly proceedings to resolve the dispute, which could materially and adversely affect our business and results of operations.
In addition, pursuant to the ore purchase agreement between PGPRC and Filminera, PGPRC has agreed to purchase all ore from the Masbate Gold Project at a price equal to the production cost for the ore plus a predetermined percentage. Decreases in the market price of gold, increases in production costs at the Masbate Gold Project or a combination of both may make performance by PGPRC under the agreement not economically desirable or feasible. In such a circumstance, we would seek to curtail production at the Masbate Gold Project or negotiate another mutually agreeable resolution with the Philippine shareholder of Filminera; however, we may not be successful in such efforts.
Our interest in the Pajo concession is on a similar basis and is subject to similar risks.
- 76 -
Because our property interests and exploration activities in Burkina Faso are subject to political, economic and other uncertainties, situations may arise that could have an adverse effect on our business.
The new mining code adopted by Burkina Faso in July 2015 introduced changes to the mining legislation, including changes affecting taxation, licensing, the requirement to pay a preferred dividend to the state, requirements for employments of local personnel or contractors and other benefits to be provided to local residents. The Kiaka Licence requires mine construction at the Kiaka Project to be completed within two years of the issuance date, a timeframe that the Company will not be able to meet. The Burkina Faso Mining Code provides for two additional two year exemptions which can extend the period for construction to a total of six years. If the construction has started and the level of investment has exceeded 50%, an additional year for the construction period can also be granted. If all of the exemption periods have been exhausted, the government has the right to withdraw the Kiaka Licence. There can be no assurance that the Company will be granted the exemptions for extending the time frame to complete mine construction. If such exemptions are granted, there can be no assurance that the mine construction can be completed in such time period.
Our operations would be adversely affected if we fail to maintain satisfactory labour relations or attract and retain skilled personnel.
Production at our mining operations is dependent upon the efforts of our employees and B2Gold’s relations with its unionized and non-unionized employees. Some of our employees are represented by labour unions under various collective labour agreements. The collective bargaining agreement covering the workers at Limon Mine is effective until July 1, 2018. The collective bargaining agreement covering the workers at La Libertad Mine is effective until December 31, 2017. Any of the parties involved may present a draft of a new collective bargaining agreement with 60 days prior to expiration date, although the existing collective bargaining agreement will continue in effect until a new one has been approved. We may not be able to satisfactorily renegotiate our collective labour agreements when they expire and may face tougher negotiations or higher wage demands than would be the case for non-unionized labour. In addition, existing labour agreements may not prevent a strike or work stoppage at our facilities in the future. In addition, relations between us and our employees may be affected by changes in the scheme of labour relations that may be introduced by the relevant governmental authorities in those jurisdictions in which we carry on business. Changes in such legislation or in the relationship between us and our employees may have a material adverse effect on our business, financial condition and results of operations.
Our operations at La Libertad and Limon Mines have been disrupted by work stoppages due to illegal road blockades. We are continuing to seek a permanent solution to these disruptions; however, there can be no assurance that a permanent solution will be found and that we will not have to suspend operations again. Suspension of our operations at our mines or properties could have a material adverse effect on our business, financial condition and results of operations.
In Namibia, due to high levels of unemployment, and restrictive immigration policies applied by the Namibian Ministry of Home Affairs, it may be difficult for us to obtain employment permits for skilled personnel that may be required in exploration or mining operations. In addition, Namibia suffers from high levels of poverty. Although the Namibian government spends a significant proportion (the highest single budget amount) on education, education initiatives and programs may take time to take effect. Currently, a significant proportion of the Namibian work-force can be classified as unskilled or semi-skilled labourers, as a result of which it may be difficult for employers to find skilled personnel for specialized tasks. Shortages of suitably qualified personnel in Namibia could have a material adverse effect on our business, financial condition and results of operations. While a collective bargaining agreement covering the workers at Otjikoto Mine is effective until February 28, 2018, we may not be able to satisfactorily renegotiate our collective labour agreements when they expire and may face tougher negotiations or higher wage demands than would be the case for non-unionized labour.
- 77 -
We are subject to risks related to community relations and community action.
As a mining business, we may come under pressure in the jurisdictions in which we operate, or will operate in the future, to demonstrate that other stakeholders (including employees, communities surrounding operations and the countries in which they operate) benefit and will continue to benefit from our commercial activities, and/or that we operate in a manner that will minimize any potential damage or disruption to the interests of those stakeholders. We may face opposition with respect to our current and future development and exploration projects which could materially adversely affect our business, results of operations and financial condition.
Further, certain NGOs, some of which oppose globalization and resource development, are often vocal critics of the mining industry and its practices, including the use of hazardous substances in processing activities. Adverse publicity generated by such NGOs or others related to extractive industries generally, or our operations specifically, could have an adverse effect on our reputation and financial condition and may impact our relationship with the communities in which we operate. They may install road blockades, apply for injunctions for work stoppage and file lawsuits for damages. These actions can relate not only to current activities but also historic mining activities by prior owners and could have a material, adverse effect on our operations. They may also file complaints with regulators in respect of B2Gold’s, and our directors’ and insiders’, regulatory filings, either in respect of us or other companies. Such complaints, regardless of whether they have any substance or basis in fact or law, may have the effect of undermining the confidence of the public or a regulator in B2Gold or such directors or insiders and may adversely affect the price of our securities or our prospects of obtaining the regulatory approvals necessary for advancement of some or all of our exploration and development plans or operations.
Our inability to overcome problems related to weather and climate in the remote areas in which we operate could have a material adverse effect on our business, results of operations and financial condition.
Certain of our operations are located in remote areas and are affected by adverse climate issues, resulting in technical challenges for conducting both geological exploration and mining operations. Although we benefit from modern mining technology, we may sometimes be unable to overcome problems related to weather and climate either expeditiously or at a commercially reasonable cost, which could have a material adverse effect on our business, results of operations and financial condition.
We may encounter conflicts with small scale miners in certain countries which could have a material adverse effect on our operations.
Certain of our exploration and development properties, including the Masbate Gold Project and La Libertad Mine, are subject to small scale and artisanal mining activity. The number of artisanal miners has increased as the price of gold has increased. There is a risk of conflict with the small scale miners which could materially adversely affect our operations. Further development of our mining activities may require the relocation and physical resettlement of artisanal miners and development plans may be impacted as a result. Any delays as a result of potential relocation or resettlement could negatively impact us and may result in additional expenses or prevent further development.
- 78 -
Small scale artisanal miners may use sodium cyanide or mercury which are toxic materials. Should an artisanal miner’s sodium cyanide or mercury leak or otherwise be discharged into our mineral properties, we may become subject to liability for clean-up work that may not be insured. Related clean-up work may have a material adverse effect on our operations.
Small scale miners have been operating in Aroroy, Masbate Province since 1979 without obtaining a valid mining or processing permits issued by the government. Some of these mining and processing operations are within the property of Filminera, and there has been evidence of contamination from tailing and effluent discharges within the Masbate property boundary. Although Filminera is not legally liable for their contamination, Filminera has attempted to limit the activities of these miners and inform the public about the risk of contamination. In line with attempts to limit and control their activities, Filminera, in coordination with the local and national governments, began a process to enter into agreements with small scale miners. The agreements will require the formation of local cooperatives to legally apply for mining and processing permits and work on some areas of our mineral tenements that are not suitable for large scale mining and limited to a definite period of time. There is also a natural conflict in objectives between small scale miners and Filminera, as the small scale miners have no legal rights to mine and are keen to access as much ore as possible. In contrast, Filminera has a stated position of allowing some level of activity; however, Filminera requires it to be contained to nominated areas only and subject to the law governing small scale mining in the country. Accordingly, there are risks that conflict can arise that could materially adversely affect the operations of Filminera.
In Nicaragua, there is a long history of small scale miner activity throughout the country. Nicaraguan law provides that 1% of a concession be available for artisanal (non-mechanized) activity. At La Libertad, we have executed several agreements with local cooperatives, and process a portion of their output from areas that are mutually agreed upon. However, this scenario is changing due to the establishment of an unaffiliated small process plant that will specialize in processing small scale miner ore. There is also independent artisanal mining being carried out. Small scale miner issues are managed by a specific specialized group at La Libertad Mine, and the focus has been to ensure that we and artisanal miners coexist within the concession.
Mineral rights or surface rights to our properties could be challenged, and, if successful, such challenges could have a material adverse effect on our production and results of operations.
Our ability to carry out successful mineral exploration and development activities and mining operations will depend on a number of factors including compliance with our obligations with respect to acquiring and maintaining title to our interest in certain properties. The acquisition of title to mineral properties is a very detailed and time-consuming process. No guarantee can be given that we will be in a position to comply with all such conditions and obligations, or to require third parties to comply with their obligations with respect to such properties. Furthermore, while it is common practice that permits and licenses may be renewed, extended or transferred into other forms of licenses appropriate for ongoing operations, no guarantee can be given that a renewal, extension or a transfer will be granted to us or, if they are granted, that we will be in a position to comply with all conditions that are imposed. A number of our interests are the subject of pending applications to register assignments, extend the term, and increase the area or to convert licenses to concession contracts and there is no assurance that such applications will be approved as submitted.
The interests in our properties may not be free from defects or the material contracts between us and the entities owned or controlled by a foreign government may be unilaterally altered or revoked. There can be no assurances that our rights and title interests will not be revoked or significantly altered to our detriment. There can be no assurances that our rights and title interests will not be challenged or impugned by third parties. Our interests in properties may be subject to prior unregistered liens, agreements, claims or transfers and title may be affected by, among other things, undetected defects or governmental actions.
We depend on key personnel and if we are unable to attract and retain such persons in the future it could have an adverse effect on our operations.
Our success will be largely dependent upon the performance of our key officers, employees and consultants. Locating and developing mineral deposits depends on a number of factors, not the least of which is the technical skill of the exploration, development and production personnel involved. Failure to retain key personnel or to attract or retain additional key individuals with necessary skills could have a materially adverse impact upon our success.
- 79 -
We have not purchased any “key-man” insurance with respect to any of our directors, officers or key employees and have no current plans to do so.
Market price of our Common Shares.
Our Common Shares are publicly traded and are subject to various factors that have historically made our Common Share price volatile. The market price of our Common Shares has experienced, and may continue to experience, significant volatility, which may result in losses to investors. The market price of our Common Shares may increase or decrease in response to a number of events and factors, including: our operating performance and the performance of competitors and other similar companies; volatility in metal prices; the public’s reaction to our press releases on developments at mines and our other properties, material change reports, other public announcements and our filings with the various securities regulatory authorities; changes in earnings estimates or recommendations by research analysts who track our Common Shares or the shares of other companies in the resource sector; changes in general economic and/or political conditions; the number of Common Shares to be publicly traded after an offering of our Common Shares; the arrival or departure of key personnel; acquisitions, strategic alliances or joint ventures involving us or our competitors; and the other risk factors described herein.
In addition, the global stock markets and prices for mining company shares have experienced volatility that often has been unrelated to the operating performance of such companies. These market and industry fluctuations may adversely affect the market price of our Common Shares, regardless of our operating performance. The variables which are not directly related to our success and are, therefore, not within our control, include other developments that affect the market for mining company shares, the breadth of the public market for our Common Shares and the attractiveness of alternative investments.
Failures of information systems or information security threats.
We have entered into agreements with third parties for hardware, software, telecommunications and other information technology (“IT”) services in connection with our operations. Our operations depend, in part, on how well B2Gold and its suppliers protect networks, equipment, IT systems and software against damage from a number of threats, including, but not limited to, cable cuts, damage to physical plants, natural disasters, terrorism, fire, power loss, hacking, computer viruses, vandalism and theft. Our operations also depend on the timely maintenance, upgrade and replacement of networks, equipment, IT systems and software, as well as pre-emptive expenses to mitigate the risks of failures. Any of these and other events could result in information system failures, delays and/or increase in capital expenses, which may adversely impact our reputation and results of operations.
Although to date we have not experienced any known material losses relating to cyber-attacks or other information security breaches, there can be no assurance that it will not incur such losses in the future. Our risk and exposure to these matters cannot be fully mitigated because of, among other things, the evolving nature of these threats. As a result, cyber security and the continued development and enhancement of controls, processes and practices designed to protect systems, computers, software, data and networks from attack, damage or unauthorized access remain a priority. As cyber threats continue to evolve, we may be required to expend additional resources to continue to modify or enhance protective measures or to investigate and remediate any security vulnerabilities. Any of these factors could have a material adverse effect on our results of operations, cash flows and financial position.
Our insurance does not cover all potential losses, liabilities and damage related to our business and certain risks are uninsured or uninsurable.
Although we maintain insurance to protect against certain risks in such amounts as we consider to be reasonable, our insurance will not cover all the potential risks associated with our operations and insurance coverage may not continue to be available or may not be adequate to cover any resulting liability. It is not always possible to obtain insurance against all risks and we may decide not to insure against certain risks because of high premiums or other reasons. Moreover, insurance against risks such as loss of title to mineral property, environmental pollution or other hazards as a result of exploration and production is not generally available to us or to other companies in the mining industry on acceptable terms. Losses from these events may cause us to incur significant costs that could have a material adverse effect upon our financial performance and results of operations.
- 80 -
We may be unable to compete successfully with other mining companies.
The mining industry is intensely competitive in all of its phases, and we compete with many companies possessing greater financial resources and technical facilities than us with respect to the discovery and acquisition of interests in mineral properties, and the recruitment and retention of qualified employees and other persons to carry out our mineral production and exploration activities. Competition in the mining industry could adversely affect our prospects for mineral exploration and development in the future, which could have a material adverse effect on our revenues, operations and financial condition.
We are subject to litigation risks which could have a material adverse effect on our business, results of operations and financial position.
All industries, including the mining industry, are subject to legal claims, with and without merit. We are, from time to time, involved in various claims, legal proceedings and complaints arising in the ordinary course of business. In addition, companies like ours that have experienced volatility in their share price have been subjected to class action securities litigation by shareholders. Defense and settlement costs can be substantial, even for claims that are without merit. Due to the inherent uncertainty of the litigation process, the litigation process could take away from management time and effort and the resolution of any particular legal proceeding to which we may become subject could have a material adverse effect on our business, results of operations and financial position.
We may fail to maintain the adequacy of internal control over financial reporting as required by the Sarbanes-Oxley Act.
Our Common Shares are registered under the U.S. Securities Exchange Act of 1934, as amended, and listed on the NYSE MKT and, accordingly, we are subject to the reporting and other requirements of the U.S. federal securities laws that apply to foreign private issuers, including the requirement to maintain effective internal controls over financial reporting pursuant to Section 404 of the Sarbanes-Oxley Act (“SOX”). SOX requires management to do an annual assessment of our internal controls over financial reporting, and for our external auditors to conduct an independent assessment of their effectiveness.
Our internal controls over financial reporting may not be adequate, or we may not be able to maintain them as required by SOX. We also may not be able to maintain effective internal controls over financial reporting on an ongoing basis, if standards are modified, supplemented or amended from time to time.
If we do not satisfy the SOX requirements on an ongoing and timely basis, investors could lose confidence in the reliability of our financial statements, and this could harm our business and have a negative effect on the trading price of our Common Shares or the market value of our other securities.
Aboriginal and local community title claims and rights to consultation and accommodation may affect our existing operations and development projects.
Governments in many jurisdictions must consult with Aboriginal peoples and local communities with respect to grants of mineral rights and the issuance or amendment of project authorizations. Consultation and other rights of Aboriginal people and local communities may require accommodations, including undertakings regarding employment, royalty payments and other matters. This may affect our ability to acquire within a reasonable time frame effective mineral titles, permits or licenses in these jurisdictions and may affect the timetable and costs of development of mineral properties in these jurisdictions. The risk of Aboriginal title claims also could affect existing operations as well as development projects. These legal requirements may also affect our ability to expand or transfer existing operations or to develop new projects.
- 81 -
We are subject to various anti-corruption laws and regulations and our failure to comply with such laws and regulations may have a material adverse impact on our business, financial condition and results of operations.
We are subject to various U.S., Canadian and foreign anti-corruption laws and regulations such as the Canadian Corruption of Foreign Public Officials Act. In general, these laws prohibit a company and its employees and intermediaries from bribing or making other prohibited payments to foreign officials or other persons to obtain or retain business or gain some other business advantage. According to Transparency International, Nicaragua, the Philippines, Namibia and Mali are perceived as having fairly high levels of corruption relative to Canada. We cannot predict the nature, scope or effect of future regulatory requirements to which our operations might be subject or the manner in which existing laws might be administered or interpreted. Failure to comply with the applicable legislation and other similar foreign laws could expose us and our senior management to civil and/or criminal penalties, other sanctions and remedial measures, legal expenses and reputational damage, all of which could materially and adversely affect our business, financial condition and results of operations. Likewise, any investigation of any alleged violations of the applicable anti-corruption legislation by Canadian or foreign authorities could also have an adverse impact on our business, financial condition and results of operations.
- 82 -
DIVIDENDS
We have not declared any dividends or distributions on our Common Shares since our incorporation. We intend to retain our earnings, if any, to finance growth and expand our operations and do not anticipate paying any dividends or distributions in the foreseeable future. Our board of directors may declare from time to time such cash dividends or distributions out of the monies legally available for dividends or distributions as the board of directors considers advisable. Any future determination to pay dividends or make distributions will be at the discretion of the board of directors and will depend on our capital requirements, results of operations and such other factors as the board considers relevant.
DESCRIPTION OF CAPITAL STRUCTURE
Our authorized share capital consists of an unlimited number of Common Shares and an unlimited number of preferred shares. As at March 30, 2017, 973,203,234 Common Shares (excluding the 29,000 stock options exercised on March 30, 2017) and no preferred shares are issued and outstanding.
Common Shares
Registered holders of Common Shares are entitled to receive notice of and attend all shareholder meetings of shareholders, and are entitled to one vote for each Common Share held. In addition, holders of Common Shares are entitled to receive on a pro rata basis dividends if, as and when declared by our board of directors and, upon liquidation, dissolution or winding-up, are entitled to receive on a pro rata basis our net assets after payment of debts and other liabilities, in each case subject to the rights, privileges, restrictions and conditions attaching to any other series or class of shares, including preferred shares, ranking in priority to, or equal with, the holders of the Common Shares. Any alteration of the rights attached to Common Shares must be approved by at least two-thirds of the Common Shares voted at a meeting of our shareholders.
Preferred Shares
Preferred shares without par value may at any time and from time to time be issued in one or more series. Our board of directors may from time to time by resolution determine the maximum number of preferred shares of any such series or determine there is no maximum, determine the designation of the preferred shares of that series and amend our articles to create, define and attach, and if permitted by the BCBCA, alter, vary or abrogate, any special rights and restrictions to be attached to the preferred shares of that series. Except as provided in the special rights and restrictions attaching to the preferred shares, the holders of preferred shares will not be entitled to receive notice of, attend or vote any meeting of our shareholders. Holders of preferred shares will be entitled to preference with respect to payment of dividends on such shares over the Common Shares, and over any other of our shares ranking junior to the preferred shares with respect to payment of dividends. In the event of our liquidation, dissolution or winding-up, holders of preferred shares will be entitled to preference with respect to distribution of our property or assets over the Common Shares and over any of our other shares ranking junior to the preferred shares with respect to the repayment of capital paid up on, and the payment of any or all accrued and unpaid cumulative dividends whether or not earned or declared, or any or all declared and unpaid non-cumulative dividends, on the preferred shares.
- 83 -
Convertible Notes
In August 2013, we issued $258.8 million aggregate principal amount of notes (“Notes”). The Notes were issued pursuant to a note purchase agreement dated as of August 23, 2013 (the “Note Purchase Agreement”) and an indenture dated as of August 23, 2013 (the “Note Indenture”). The Notes bear interest at 3.25% payable semi-annually in arrears on April 1 and October 1 of each year, beginning on April 1, 2014, and mature on October 1, 2018. The Notes are subordinated in right of payment to our existing and future senior indebtedness, including our indebtedness under the Credit Facility. The Notes will rank senior in right of payment to any future subordinated borrowings. The Notes are effectively junior to any of our secured indebtedness and the Notes are structurally subordinated to all indebtedness and other liabilities of the Company’s subsidiaries.
Holders of the Notes may convert the Notes at their option at any time from July 1, 2018 to the maturity date. The Notes will be convertible, at the holder’s option, at a conversion rate of 254.2912 Common Shares per $1,000 principal amount (equal to an initial conversion price of approximately $3.93 per Common Share), subject to adjustments in certain events. In addition, the holder has the right to exercise the conversion option from January 1, 2014 to July 1, 2018, if (1) the market price of our Common Shares for at least 20 trading days during a period of 30 consecutive trading days ending on the last trading day of the preceding calendar quarter is greater than or equal to 130% of the conversion price on each applicable trading day; (2) during the five business day period after any consecutive five trading day period (the “Measurement Period”) in which the trading price per $1,000 principal amount of Notes for each trading day in the Measurement Period was less than 98% of the product of the last reported sale price of our Common Shares and the conversion rate on each such trading day; (3) the Notes are called for redemption; or (4) upon the occurrence of certain corporate events. The Company may upon conversion by the holder, elect to settle in either cash, Common Shares or a combination of cash and Common Shares, subject to certain circumstances.
We may not redeem the Notes prior to October 6, 2016, except in the event of certain changes in Canadian tax law. On or after October 6, 2016, we may redeem for cash, subject to certain conditions, any or all of the Notes, at our option, if the last reported sale price of our Common Shares for at least 20 trading days during any 30 consecutive trading day period ending within five trading days immediately preceding the date on which we provide notice of redemption exceeds 130% of the conversion price on each applicable trading day. We may also redeem the Notes, if certain tax laws related to Canadian withholding tax change, subject to certain further conditions.
Stock Options
In 2015, our board of directors and our shareholders approved the adoption of an amended and restated stock option plan (the “2015 Stock Option Plan”) for the benefit of our directors, employees and consultants. The purpose of the 2015 Stock Option Plan is to provide eligible persons with an opportunity to purchase our Common Shares and to benefit from the appreciation in the value of such Common Shares. The 2015 Stock Option Plan increases our ability to attract the individuals of exceptional skill by providing them with the opportunity, through the exercise of stock options, to benefit from our growth. The board of directors has the authority to determine the directors, officers, employees and consultants to whom options will be granted, the number of options to be granted to each person and the price at which Common Shares may be purchased, subject to the terms and conditions set forth in the 2015 Stock Option Plan.
Some of the key provisions of the 2015 Stock Option Plan include, among others:
| (a) |
the maximum number of Common Shares issuable pursuant to options granted under the 2015 Stock Option Plan, together with the Common Shares issuable pursuant to all of our other previously established and outstanding or proposed security based compensation arrangements, in aggregate, will be a number equal to 8.5% of the issued and outstanding Common Shares on a non-diluted basis at any time; | |
| (b) |
a restriction that no more than 8.5% of the total number of issued and outstanding Common Shares may be issuable to our insiders pursuant to options granted to insiders under the 2015 Stock Option Plan, together with all of our other previously established and outstanding or proposed share compensation arrangements; |
- 84 -
| (c) |
a restriction that no more than 5% of the total number of issued and outstanding Common Shares may be issuable to any one individual within a one-year period pursuant to options granted under the 2015 Stock Option Plan, together with all of our other previously established and outstanding or proposed share compensation arrangements, unless we have obtained disinterested shareholder approval; | |
| (d) |
the maximum number of Common Shares issuable to a non-employee director, pursuant to the 2015 Stock Option Plan, together with the Common Shares issuable pursuant to all of B2Gold’s other previously established and outstanding or proposed security based compensation arrangements, in aggregate, will not exceed 1% of the total number of issued and outstanding Common Shares on a non- diluted basis at the time of grant and will not exceed a value of $100,000 (based on the fair value of the options at the time of grant) per non-employee director per calendar year; | |
| (e) |
a restriction that no more than 1% of the total number of issued and outstanding Common Shares may be issuable to our non-employee directors, as a group, within a one-year period pursuant to options granted to the non-employee directors under the 2015 Stock Option Plan, together with all of our other previously established and outstanding or proposed share compensation arrangements; | |
| (f) |
the vesting period of all options shall be determined by the board of directors; and | |
| (g) |
options may be exercisable for a period of up to a maximum term of ten years, such period to be determined by our board of directors and the options are non-transferable and non-assignable; |
As at March 30, 2017, there are 40,418,207 stock options outstanding under the 2015 Stock Option Plan. As at March 30, 2017, there are also 1,053,200 options to purchase Common Shares that remain outstanding from the acquisition of Auryx Gold Corp. and Volta Resources Inc. Since January 1, 2017, 8,380,448 stock options were exercised for gross proceeds of $23,690,314.
Restricted Share Unit Plan
On May 7, 2015, our board of directors approved amendments to our Restricted Share Unit Plan (“RSU Plan”), subject to the receipt of shareholder and regulatory approvals, which approvals were obtained by June 12, 2015. Adoption of the RSU Plan was part of our continuing effort to build upon and enhance long term shareholder value. The RSU Plan reflects our commitment to a long term incentive compensation structure that aligns the interests of its employees with the interests of its shareholders.
Restricted share units (the “RSUs”) may be granted by our Compensation Committee, which has been authorized to administer the RSU Plan, to our directors, executive officers and employees (the “Designated Participants”). The Compensation Committee is entitled to exercise its discretion to restrict participation under the RSU Plan. Pursuant to the RSU Plan, 15,000,000 Common Shares are reserved for issuance. As at March 30, 2017, we have issued 10,558,003 Common Shares under the RSU Plan. 1,181,209 RSUs have been granted for which Common Shares have not yet been issued. Accordingly, 3,260,788 RSUs remain available for grant under the RSU Plan.
Some of the key features of the RSU Plan include, among others:
Awarding RSUs
|
• |
The maximum number of Common Shares issuable to insiders, at any time, pursuant to the RSU Plan, together with all of our other security based compensation arrangements, is 8.5% of our issued and outstanding Common Shares at any time. |
|
• |
The maximum number of Common Shares issuable to insiders within any one year period pursuant to the RSU Plan, together with all of our other security based compensation arrangements, is 8.5% of our issued and outstanding Common Shares at any time. |
|
• |
The maximum number of Common Shares issuable to a non-employee director, pursuant to the RSU Plan, together with the Common Shares issuable pursuant to all of B2Gold’s other previously established and outstanding or proposed security based compensation arrangements, in aggregate, will not exceed 1% of the total number of issued and outstanding Common Shares on a non-diluted basis at any time and will not exceed a value of $100,000 (based on the fair value of the options at the time of grant) per non-employee director per calendar year. |
- 85 -
|
• |
Any rights with respect to RSUs will not be transferable or assignable other than for normal estate settlement purposes. |
Vesting
| • | Unless otherwise determined by the Compensation Committee, one-third (1/3) of the RSUs will vest on each of the first, second and third anniversaries of the date that the RSUs are granted. |
| • | In the event that a Designated Participant dies, retires, becomes disabled or is terminated without cause prior to the vesting of the RSUs, the RSUs will vest on a pro rata basis based on the date that employment is terminated and the time remaining until the applicable vesting date. |
|
• |
If a Designated Participant is terminated for cause or resigns without good reason, his or her RSUs will immediately expire as of the date of termination. |
Redemption
| • | Each RSU entitles the holder, subject to the terms of the RSU Plan, to receive a payment in fully-paid Common Shares and will be redeemed five days after the RSU is fully vested. Each RSU will be redeemed for one Common Share. |
MARKET FOR SECURITIES
Trading Price and Volume
Our Common Shares are listed for trading on the TSX under the symbol “BTO”. The following table sets out the market price range and trading volumes of our Common Shares on the TSX for the periods indicated.
| Year | High (C$) | Low (C$) | Volume (no. of shares) | |
| March 1-30 | 4.25 | 3.68 | 138,674,633 | |
| February | 4.64 | 3.89 | 153,818,420 | |
| 2017 | January | 4.03 | 3.20 | 159,736,701 |
| December | 3.50 | 2.69 | 114,442,830 | |
| November | 4.07 | 3.02 | 170,659,573 | |
| October | 3.92 | 2.84 | 115,798,164 | |
| September | 4.08 | 3.24 | 148,329,748 | |
| August | 4.74 | 3.30 | 144,350,024 | |
| July | 4.15 | 3.34 | 123,410,887 | |
| June | 3.28 | 2.32 | 143,383,483 | |
| May | 2.93 | 2.28 | 135,685,499 | |
| April | 2.79 | 2.06 | 116,923,942 | |
| March | 2.28 | 1.40 | 189,495,871 | |
| February | 1.61 | 1.06 | 167,521,741 | |
| 2016 | January | 1.53 | 0.86 | 131,398,120 |
On March 30, 2017, the closing price of our Common Shares on the TSX was C$3.76 per share.
- 86 -
Our Common Shares are listed for trading on the NYSE MKT under the symbol “BTG”. The following table sets out the market price range and trading volumes of our Common Shares on the NYSE MKT for the periods indicated.
| Year | High (US$) | Low (US$) | Volume (no. of shares) |
|
| March 1-30 | 3.20 | 2.74 | 149,083,914 | |
| February | 3.55 | 2.97 | 130,542,625 | |
| 2017 | January | 3.10 | 2.38 | 93,223,113 |
| December | 2.64 | 2.02 | 92,085,106 | |
| November | 3.04 | 2.23 | 102,393,938 | |
| October | 2.94 | 2.15 | 87,620,945 | |
| September | 3.14 | 2.46 | 216,124,368 | |
| August | 3.65 | 2.51 | 133,469,519 | |
| July | 3.19 | 2.59 | 91,433,557 | |
| June | 2.52 | 1.77 | 127,055,924 | |
| May | 2.31 | 1.75 | 61,638,101 | |
| April | 2.23 | 1.57 | 55,734,334 | |
| March | 1.77 | 1.04 | 96,500,597 | |
| February | 1.17 | 0.76 | 44,070,992 | |
| 2016 | January | 1.08 | 0.60 | 40,605,702 |
On March 30, 2017, the closing price of our Common Shares on the NYSE MKT was US$2.82 per share.
Prior Sales
The following table summarizes the issuances of securities convertible or exercisable for Common Shares by us during the most recently completed financial year.
| Price per | |||
| Date of Issue | Number of Securities | Security | Security ($) |
| February 5, 2016 | 12,185,000 | Stock Options | 1.12 |
| February 22, 2016 | 96,246 | Restricted Share Units | 1.43 |
| February 24, 2016 | 70,000 | Stock Options | 1.48 |
| March 21, 2016 | 1,817,821 | Restricted Share Units | 2. 02 |
| April 5, 2016 | 100,000 | Stock Options | 2.12 |
| May 20, 2016 | 575,000 | Stock Options | 2.50 |
| May 26, 2016 | 139,604 | Restricted Share Units | 2.50 |
| June 3, 2016 | 255,000 | Stock Options | 2.37 |
| August 31, 2016 | 836,000 | Stock Options | 3.45 |
| October 11, 2016 | 115,000 | Stock Options | 3.00 |
| January 23, 2017 | 100,000 | Stock Options | 3.76 |
| February 6, 2017 | 75,000 | Stock Options | 4.05 |
| March 29, 2017 | 250,000 | Stock Options | 3.78 |
DIRECTORS AND EXECUTIVE OFFICERS
The following table sets forth the name, municipality, province or state of residence, position held with us, the date of appointment of each of our current directors and executive officers, principal occupation within the immediately preceding five years and the shareholdings of each director and executive officer as at the date of this Annual
- 87 -
Information Form. The statement as to Common Shares beneficially owned, or controlled or directed, directly or indirectly, by the directors and executive officers named below is in each instance based upon information furnished by the person concerned and is as at the date of this Annual Information Form. Our directors hold office until the next annual general meeting of the shareholders or until their successors are duly elected or appointed.
| Name and | Principal | Number of | ||
| Municipality | Occupation During | Director/Officer | Voting | |
| of Residence | Position with B2Gold | Past Five Years | Since | Securities (1) |
| Clive Johnson | President, Chief Executive | President, Chief Executive Officer of | December 17, 2006 | 5,699,039(2) |
| British Columbia, | Officer and Director | B2Gold | ||
| Canada | ||||
| Robert Cross(3)(4)(5) | Chairman and Director | Serves as independent director and, in | October 22, 2007 | 871,660 |
| British Columbia, | some cases, non-executive Chairman | |||
| Canada | of public companies, principally in | |||
| the resource sector | ||||
| Robert Gayton(3)(4)(5) | Director | Consultant to various public | October 22, 2007 | 353,000 |
| British Columbia, | companies since 1987 | |||
| Canada | ||||
| Jerry Korpan(3)(5)(6) | Director | Director of several public natural | November 20, 2007 | 2,500,000 |
| London, England | resource companies | |||
| Bongani Mtshisi(4)(6) | Director | CEO of BSC Resources Ltd. from | December 20, 2011 | 22,800 |
| Johannesburg, | October 2005 to present | |||
| South Africa | ||||
| Kevin Bullock | Director | CEO of Golden Reign Resources Ltd | December 22, 2013 | 83,090 |
| Ontario, Canada | from January 2016 to present; | |||
| formerly the President and Chief | ||||
| Executive Officer of Volta Resources | ||||
| Inc. | ||||
| George Johnson(6) | Director | Senior Vice President of Operations, | March 15, 2016 | 500,000 |
| Washington, USA | B2Gold, until April 30, 2015 | (as Director) | ||
| Roger Richer | Executive Vice President, | Executive Vice President, General | December 17, 2006 | 2,850,000(2) |
| British Columbia, | General Counsel and | Counsel and Secretary of B2Gold | ||
| Canada | Secretary | |||
| Michael Cinnamond | Senior Vice President of | Senior Vice President of Finance and | July 1, 2013 | Nil |
| British Columbia, | Finance and Chief | Chief Financial Officer of B2Gold, | ||
| Canada | Financial Officer | Senior Vice President, | ||
| Administration of B2Gold; formerly a | ||||
| partner at PricewaterhouseCoopers | ||||
| LLP | ||||
| Tom Garagan | Senior Vice President of | Senior Vice President of Exploration | March 8, 2007 | 3,522,943(2) |
| British Columbia, | Exploration | of B2Gold | ||
| Canada | ||||
| Dennis Stansbury | Senior Vice President of | Senior Vice President of Engineering; formerly Senior Vice President of Development and Production | March 8, 2007 | 3,095,785 |
| Nevada, USA | Engineering and Project | and Project Evaluations | ||
| Evaluations | ||||
| William Lytle | Senior Vice President of | Senior Vice President of Operations | December 1, 2010 | Nil |
| Colorado, USA | Operations | of B2Gold; Vice President, Africa of | ||
| B2Gold; Vice President Country | ||||
| Manager, Namibia of B2Gold |
- 88 -
Notes:
| (1) |
The information as to the nature of Common Shares beneficially owned, or controlled or directed, directly or indirectly, by the directors and executive officers, not being within our knowledge, has been furnished by such directors and officers. |
| (2) |
Messrs. Johnson, Richer and Garagan are trustees of the Incentive Trust (the “Trustees”) that holds 1,278,750 Common Shares. The number of Common Shares beneficially owned, or controlled or directed, directly or indirectly by each of Messrs. Johnson, Richer and Garagan as set forth in the table above excludes 426,250 Common Shares that are held pursuant to a declaration of trust dated June 29, 2007 between us and the Trustees, which was established to hold options and shares to be allocated to our directors, officers, employees and service providers as determined by the Trustees. |
| (3) |
Member of the Audit Committee. |
| (4) |
Member of the Compensation Committee. |
| (5) |
Member of the Corporate Governance and Nominating Committee. |
| (6) |
Member of Health, Safety, Environment & Social Committee. |
| (7) |
Barry Rayment was a director until his death on February 23, 2017. |
Shareholdings of Directors and Executive Officers
As at the date of this Annual Information Form, our directors and executive officers, as a group, beneficially owned, or controlled or directed, directly or indirectly, 20,098,317 Common Shares, representing approximately 2% of the issued and outstanding Common Shares.
Cease Trade Orders or Bankruptcies
None of our directors or executive officers is, as at the date of this Annual Information Form, or was within 10 years before the date of this Annual Information Form, a director, chief executive officer or chief financial officer of any company (including B2Gold), that:
| (a) |
was subject to an order that was issued while the director or executive officer was acting in the capacity as director, chief executive officer or chief financial officer; or | |
| (b) |
was subject to an order that was issued after the director or executive officer ceased to be a director, chief executive officer or chief financial officer and which resulted from an event that occurred while that person was acting in the capacity as director, chief executive officer or chief financial officer. |
For the purposes of subsections (a) and (b), “order” means a cease trade order, an order similar to a cease trade order or an order that denied the relevant company access to any exemption under securities legislation, and in each case that was in effect for a period of more than 30 consecutive days.
None of our directors or executive officers, or a shareholder holding a sufficient number of our securities to affect materially control of B2Gold:
| (a) |
is, as at the date of this Annual Information Form, or has been within the 10 years before the date of this Annual Information Form, a director, chief executive officer or chief financial officer of any company (including B2Gold) that, while that person was acting in that capacity, or within a year of that person ceasing to act in that capacity, become bankrupt, made a proposal under any legislation relating to bankruptcy or insolvency or was subject to or instituted any proceedings, arrangement or compromise with creditors or had a receiver, receiver manager or trustee appointed to hold its assets; or | |
| (b) |
has, within the 10 years before the date of this Annual Information Form, become bankrupt, made a proposal under any legislation relating to bankruptcy or insolvency, or was subject to or instituted any proceedings, arrangement or compromise with creditors, or had a receiver, receiver manager or trustee appointed to hold the assets of the director, executive officer or shareholder. |
The foregoing information, not being within our knowledge, has been furnished by the respective directors, officers and shareholders holding a sufficient number of our securities to affect materially control of B2Gold.
- 89 -
Penalties or Sanctions
None of our directors or executive officers, or a shareholder holding a sufficient number of our securities to affect materially the control of B2Gold, has been subject to:
| (a) |
any penalties or sanctions imposed by a court relating to securities legislation or by a securities regulatory authority or has entered into a settlement agreement with a securities regulatory authority; or | |
| (b) |
any other penalties or sanctions imposed by a court or regulatory body that would likely be considered important to a reasonable investor in making an investment decision regarding us. |
The foregoing information, not being within our knowledge, has been furnished by the respective directors, officers and shareholders holding a sufficient number of our securities to affect materially control of B2Gold.
Conflicts of Interest
Our directors and officers may serve as directors or officers of other companies or have significant shareholdings in other resource companies and, to the extent that such other companies may participate in ventures in which we may participate, our directors may have a conflict of interest in negotiating and concluding terms respecting the extent of such participation. In the event that such conflict of interest arises at a meeting of our board of directors, a director who has such a conflict will abstain from voting for or against the approval of such participation or such terms. In addition, all related party transactions must be approved by our corporate governance and nominating committee. From time to time several companies may participate in the acquisition, exploration and development of natural resource properties thereby allowing for the participation in larger programs, permitting involvement in a greater number of programs and reducing financial exposure in respect of any one program. It may also occur that a particular company will assign all or a portion of its interest in a particular program to another of these companies due to the financial position of the company making the assignment. In accordance with the BCBCA, our directors are required to act honestly, in good faith and in our best interests. In determining whether or not we will participate in a particular program and the interest therein to be acquired by it, the directors will primarily consider the degree of risk to which we may be exposed and its financial position at that time.
Our directors and officers are aware of the existence of laws governing the accountability of directors and officers for corporate opportunity and requiring disclosures by the directors of conflicts of interest and we will rely upon such laws in respect of any directors’ and officers’ conflicts of interest or in respect of any breaches of duty by any of its directors and officers. All such conflicts will be disclosed by such directors or officers in accordance with the BCBCA and they will govern themselves in respect thereof to the best of their ability in accordance with the obligations imposed upon them by law. See “Risk Factors”. Our directors and officers of are not aware of any such conflicts of interests.
Code of Ethics
We have adopted a code of ethics, which is applicable to all directors, officers and employees. A copy of the code can be obtained from our website at www.b2gold.com.
AUDIT COMMITTEE
We have established an Audit Committee, comprised of three independent directors, which operates under a charter approved by our board of directors. A copy of the Audit Committee Charter is set out in full in Schedule A to this Annual Information Form. It is the board of directors’ responsibility to ensure that we have an effective internal control framework. The Audit Committee’s primary function is to assist the board of directors to meet its oversight responsibilities in relation to our financial reporting and external audit function, internal control structure and risk management procedures. In doing so, it will be the responsibility of the Audit Committee to maintain free and open communication between the Audit Committee, the external auditors and our management.
- 90 -
The Audit Committee reviews the effectiveness of our financial reporting and internal control policies and its procedures for the identification, assessment, reporting and management of risks. The Audit Committee oversees and appraises the quality of the external audit and internal control procedures, including financial reporting and practices, business ethics, policies and practices, accounting policies, and management and internal controls.
Composition of the Audit Committee
The members of the Audit Committee are: Robert Cross, Robert Gayton (Chairman) and Jerry Korpan. The board of directors has determined that Mr. Gayton qualifies as an audit committee financial expert within the meaning of applicable U.S. securities laws. All of the members of the Audit Committee are (i) independent within the meaning of National Instrument 52-110 — Audit Committees (“NI 52-110”), which provides that a member shall not have a direct or indirect material relationship with us that could, in the view of the board of directors, reasonably interfere with the exercise of a member’s independent judgment; (ii) independent within the meaning of the NYSE MKT Company Guide and Rule 10A-3 under the U.S. Securities Exchange Act of 1934, as amended; and (iii) considered to be financially literate under NI 52-110. As further described below, for a temporary period of time, due to illness and ultimate passing of Barry Rayment, Kevin Bullock, who was not an “independent” director for the purposes of applicable Canadian and U.S. securities laws, was temporarily appointed to fill such vacancy. The Company relied on an exemption as set out below.
The education and experience of each Audit Committee member that is relevant to the performance of his responsibilities as a member of the Audit Committee are as follows:
Robert Cross
Robert Cross has more than 20 years of experience as a financier in the mining and oil & gas sectors. He is a cofounder and Non-Executive Chairman of Bankers Petroleum Ltd., co-founder and Chairman of Petrodorado Energy Ltd., and until October 2007, was the Non-Executive Chairman of Northern Orion Resources Inc. Between 1996 and 1998, Mr. Cross was Chairman and Chief Executive Officer of Yorkton Securities Inc. From 1987 to 1994, he was a Partner, Investment Banking with Gordon Capital Corporation in Toronto. Mr. Cross has an Engineering Degree from the University of Waterloo and received his MBA from Harvard Business School in 1987.
Robert J. Gayton, B.Comm. Ph.D, FCA
Dr. Gayton is a Chartered Professional Accountant and obtained a Ph.D in accounting/finance from the University of California, Berkeley in 1973. Dr. Gayton was a member of the business school faculties at Berkeley and the University of British Columbia from 1965 to 1974. In 1974, Dr. Gayton left academia to join Peat Marwick Mitchell (now KPMG LLP) and established their professional development program. He became a partner in 1976 and transferred to the audit practice in 1979. In 1987, Dr. Gayton left the firm to join a client and since that time has acted as financial advisor/officer to various resource based companies.
Jerry Korpan
Mr. Korpan completed financial executive education courses at the City of London Business School in 1996 where he studied accounting and financial analysis and project and infrastructure finance, among other things. From 2011 to 2015, Mr. Korpan served as a director and a member of the audit committee of Midas Gold Corporation.
Audit Committee Oversight
At no time since the commencement of our most recently completed financial year was a recommendation of the Audit Committee to nominate or compensate an external auditor not adopted by our board of directors.
Reliance on Certain Exemptions
Kevin Bullock, who our board of directors has determined to be non-independent as a result of having received fees for consulting services provided in 2014, served as a member of our Audit Committee from October 31, 2016 to March 22, 2017 in reliance upon the exemptions from audit committee independence requirements provided by Section 3.5 of NI 52-110 and NYSE MKT Company Guide Section 803B(2)(b). The board of directors determined that due to the exceptional and limited circumstances provided by Barry Rayment’s illness and resignation from such committee, Mr. Bullock’s appointment was required by the best interests of our company and our shareholders, and his appointment would not materially adversely affect the ability of the Audit Committee to act independently and to satisfy the other requirements of applicable Canadian and United States securities laws and stock exchange rules. Mr. Bullock satisfied the independence requirements of Rule 10A-3 under the U.S. Securities Exchange Act of 1934. Robert Cross, an independent director, was appointed to the Audit Committee effective March 22, 2017, to replace Kevin Bullock.
- 91 -
At no time since the commencement of our most recently completed financial year have we relied on the exemption in Section 2.4 of NI 52-110 (De Minimis Non-audit Services) or an exemption from NI 52-110, in whole or in part, granted under Part 8 of NI 52-110.
Pre-Approval Policies and Procedures
The Audit Committee pre-approves all audit services to be provided to us by our independent auditors. The Audit Committee’s policy regarding the pre-approval of non-audit services to be provided to us by our independent auditors is that all such services shall be pre-approved by the Audit Committee. Non-audit services that are prohibited to be provided to us by our independent auditors may not be pre-approved. In addition, prior to the granting of any pre-approval, the Audit Committee must be satisfied that the performance of the services in question will not compromise the independence of the independent auditors. All non-audit services performed by our auditor for the fiscal year ended December 31, 2016 have been pre-approved by our Audit Committee. No non-audit services were approved pursuant to the de minimis exemption to the pre-approval requirement.
External Auditor Service Fees
The aggregate fees billed by our external auditors, PricewaterhouseCoopers LLP, in each of the last financial years are as follows:
| Financial Year Ending | Audit Fees(1) | Audit Related Fees(2) | Tax Fees(3) | All Other Fees(4) |
| 2016 | $1,306,580 | $Nil | $23,283 | $3,179 |
| 2015 | $1,251,512 | $Nil | $Nil | $Nil |
Notes:
| (1) |
The aggregate audit fees billed. |
| (2) |
The aggregate fees billed for assurance and related services that are reasonably related to the performance of the audit or review of our financial statements which are not included under the heading “Audit Fees”, including review of interim financial statements, services provided in connection with regulatory filings and engagements relating to offering documents. |
| (3) |
The aggregate fees billed for tax compliance, tax advice and tax planning services. |
| (4) |
The aggregate fees billed for products and services other than as set out under the headings “Audit Fees”, “Audit Related Fees” and “Tax Fees”, including fees related to our compliance processes for the SOX. |
LEGAL PROCEEDINGS
We are, from time to time, involved in various claims, legal proceedings and complaints arising in the ordinary course of business. We cannot reasonably predict the likelihood or outcome of these actions. There are no pending or contemplated legal proceedings to which the Company is a party or of which any of its material properties is the subject that would have a material effect on our financial condition or future results of operations. During the last financial year, the Company has not been subject to any penalties or sanctions imposed by a regulatory body in respect of securities legislation or regulatory requirements or any penalty or sanction that would likely to be considered important to a reasonably investor in making an investment decision. The Company has not entered into any settlement agreement in respect of securities legislation or regulatory requirements.
- 92 -
INTEREST OF MANAGEMENT AND OTHERS IN MATERIAL TRANSACTIONS
No director, executive officer or shareholder holding on record or beneficially, directly or indirectly, more than 10% of our issued shares, or any of their respective associates or affiliates has any material interest, direct or indirect, in any transaction in which we have participated prior to the date of this Annual Information Form, or in any proposed transaction, which has materially affected or will materially affect us.
TRANSFER AGENT AND REGISTRAR
The transfer agent and registrar for the Common Shares is Computershare Investor Services Inc. at its offices in Toronto, Ontario and Vancouver, British Columbia.
MATERIAL CONTRACTS
Except for contracts entered into in the ordinary course of business, the only material contracts that we have entered in the financial year ended December 31, 2016, or before the last financial year but still in effect, are as follows:
| 1. |
The Note Indenture; |
| 2. |
The Note Purchase Agreement; and |
| 3. |
The ATM Agreement. |
Copies of the above material contracts are available under our profile on the SEDAR website at www.sedar.com.
INTEREST OF EXPERTS
The persons referred to below have been named as having prepared or certified a report, valuation, statement or opinion described or included in a filing, or referred to in a filing, made under National Instrument 51-102 – Continuous Disclosure Obligations during, or relating to, our financial year ended December 31, 2016.
Donald E. Hulse P.E., William J. Crowl, MMSA of Gustavson Associates, LLC and Deepak Malhotra, Ph.D. are the authors responsible for the Libertad Technical Report.
Tom Garagan, P. Geo., B.Sc., Ken Jones, P.E., Kevin Pemberton, P.E. and John Rajala, P.E. are the authors responsible for the Masbate Technical Report.
William Lytle, P.E., M.Sc., B.Sc., Tom Garagan, P.Geo, B.Sc., Hermanus Kriel, Pr.Eng., B.Eng., Glenn Bezuidenhout, Pr. Eng., FSAIMM and Guy Wiid, Pr.Eng., M.Sc., B.Sc. are the authors responsible for the Otjikoto Feasibility Study.
Tom Garagan, P.Geo, B.Sc., William Lytle, P.E., M.Sc., B.Sc., Peter Montano, P.E., Ken Jones, P.E., Sandra Hunter, MAusIMM(CP), and David J.T. Morgan, MIEAust CPEng, are the authors responsible for the Fekola Feasibility Study.
To our knowledge, none of the persons above, except for Tom Garagan, our Senior Vice President, Exploration, William Lytle, our Senior Vice President, Operations, Peter Montano, our Project Director, John Rajala, our Vice President, Metallurgy, Kevin Pemberton, our Chief Mine Planning Engineer and Ken Jones, our Manager of Health, Safety, Environment and Permitting held, at the time of or after such person prepared the statement, report or valuation, any registered or beneficial interests, direct or indirect, in any of our securities or other property or of one of its associates or affiliates or is or is expected to be elected, appointed or employed as a director, officer or employee of B2Gold or of any associate or affiliate of B2Gold.
PricewaterhouseCoopers LLP, Chartered Professional Accountants, provided an auditor’s report in respect to our financial statements for the year ended December 31, 2016 dated March 15, 2017. PricewaterhouseCoopers LLP has advised us that they are independent with respect to us in accordance with the Code of Professional Conduct of the Institute of Chartered Professional Accountants of British Columbia.
- 93 -
ADDITIONAL INFORMATION
Additional information, including that relating to directors’ and officers’ remuneration, principal holders of our securities and securities authorized for issuance under equity compensation plans, interests of insiders in material transactions and corporate governance practices, is contained in our management information circular for the annual general meeting of shareholders held on June 10, 2016.
Additional financial information is provided in our comparative financial statements and management’s discussion and analysis for the year ended December 31, 2016, which will be available under our profile on the SEDAR website at www.sedar.com.
Additional information relating to us is available under our profile on the SEDAR website at www.sedar.com.
Dated March 31, 2017.
BY ORDER OF THE BOARD OF DIRECTORS
“Clive Johnson”
Clive Johnson
President & Chief Executive Officer
A-1
SCHEDULE A
AUDIT COMMITTEE CHARTER
| 1. |
OVERALL PURPOSE/OBJECTIVES |
|
The Audit Committee (the “Committee”) of B2Gold Corp. (the “Company”) will assist the Board of Directors of the Company (the “Board”) in fulfilling its responsibilities. The Committee will oversee the financial reporting process, the system of internal control and management of financial risks, the audit process, and the Company’s process for monitoring compliance with laws and regulations and its own code of business conduct. In performing its duties, the Committee will maintain effective working relationships with the Board, management, and the external auditors and monitor the independence of those auditors. To perform his or her role effectively, each Committee member will obtain an understanding of the responsibilities of Committee membership as well as the Company’s business, operations and risks. | |
| 2. |
AUTHORITY |
| 2.1. |
The Board authorizes the Committee, within the scope of its responsibilities, to seek any information it requires from any employee and from external parties, to obtain outside legal or professional advice and to ensure the attendance of Company officers at meetings, as the Committee deems appropriate. | |
| 2.2. |
The Committee shall receive appropriate funding, as determined by the Committee, for payment of compensation to the external auditors and to any legal or other advisers employed by the Committee, and for payment of ordinary administrative expenses of the Committee that are necessary or appropriate in carrying out its duties. |
| 3. |
COMPOSITION, PROCEDURES AND ORGANIZATION |
| 3.1. |
The Committee will be comprised of at least three members of the Board. | |
| 3.2. |
Except as permitted by all applicable legal and regulatory requirements: |
| (a) |
each member of the Committee shall be “independent” as defined in accordance with Canadian Multilateral Instrument 52-110 – Audit Committee, U.S. Securities laws and regulations and applicable stock exchange rules; | |
| (b) |
each member of the Committee will be “financially literate” with the ability to read and understand a set of financial statements that present a breadth and level of complexity of accounting issues that are generally comparable to the breadth and complexity of the issues that can reasonably be expected to be raised by the Company's financial statements. Additionally, at least one member of the Committee shall be financially sophisticated, shall be considered an “audit committee financial expert” within the meaning of the rules of the U.S. Securities and Exchange Commission and shall have past employment experience in finance or accounting, requisite professional certification in accounting, or any other comparable experience or background which results in the individual’s financial sophistication, which may include being or having been a chief executive officer, chief financial officer or other executive officer with financial oversight responsibilities; and | |
| (c) |
none of the members of the Committee may have participated in the preparation of the financial statements of the Company or any current subsidiary of the Company during the past three years. |
| 3.3. |
The Board, at its organizational meeting held in conjunction with each annual general meeting of the shareholders, will appoint the members of the Committee for the ensuing year. The Board may at any time remove or replace any member of the Committee and may fill any vacancy in the Committee. |
A-2
| 3.4. |
The Committee shall elect from its members a Chairman. The Secretary shall be elected from its members, or shall be the Secretary, or the Assistant or Associate Secretary, of the Company. | |
| 3.5. |
Any member of the Committee may be removed or replaced at any time by the Board. A member shall cease to be a member of the Committee upon ceasing to be a director of the Company. | |
| 3.6. |
Meetings shall be held not less than quarterly. Special meetings shall be convened as required. External auditors may convene a meeting if they consider that it is necessary. | |
| 3.7. |
The times and places where meetings of the Committee shall be held and the procedures at such meetings shall be as determined, from time to time, by the Committee. | |
| 3.8. |
Notice of each meeting of the Committee shall be given to each member of the Committee. Subject to the following, notice of a meeting shall be given orally or by letter, telex, telegram, electronic mail, telephone facsimile transmission or telephone not less than 48 hours before the time fixed for the meeting. Notice of regular meetings need state only the day of the week or month, the place and the hour at which such meetings will be held and need not be given for each meeting. Members may waive notice of any meeting. | |
| 3.9. |
The Committee will invite the external auditors, management and such other persons to its meetings as it deems appropriate. However, any such invited persons may not vote at any meetings of the Committee. | |
| 3.10. |
A meeting of the Committee may be held by means of such telephonic, electronic or other communications facilities as permit all persons participating in the meeting to communicate adequately with each other during the meeting. | |
| 3.11. |
The majority of the Committee shall constitute a quorum for the purposes of conducting the business of the Committee. Notwithstanding any vacancy on the Committee, a quorum may exercise all of the powers of the Committee. | |
| 3.12. |
Any decision made by the Committee shall be determined by a majority vote of the members of the Committee present or by consent resolution in writing signed by each member of the Committee. A member will be deemed to have consented to any resolution passed or action taken at a meeting of the Committee unless the member dissents. | |
| 3.13. |
A record of the minutes of, and the attendance at, each meeting of the Committee shall be kept. The approved minutes of the Committee shall be circulated to the Board forthwith. | |
| 3.14. |
The Committee shall report to the Board on all proceedings and deliberations of the Committee at the first subsequent meeting of the Board, and at such other times and in such manner as the Board or the articles of the Company may require or as the Committee in its discretion may consider advisable. | |
| 3.15. |
The Committee will have access to such officers and employees of the Company and to such information respecting the Company, as it considers to be necessary or advisable in order to perform its duties and responsibilities. | |
| 3.16. |
The internal accounting staff, any external accounting consultant(s) and the external auditors of the Company will have a direct line of communication to the Committee and may bypass management if deemed necessary. The external auditors will report directly to the Committee. |
A-3
| 4. |
ROLES AND RESPONSIBILITIES |
|
The roles and responsibilities of the Committee are as follows. |
| 4.1. |
Oversee the accounting and financial reporting processes of the Company and the audits of the financial statements of the Company. | |
| 4.2. |
Review with management its philosophy with respect to controlling corporate assets and information systems, the staffing of key functions and its plans for enhancements. | |
| 4.3. |
Review the terms of reference and effectiveness of any internal audit process, and the working relationship between internal financial personnel and the external auditor. | |
| 4.4. |
Gain an understanding of the current areas of greatest financial risk and whether management is managing these effectively. | |
| 4.5. |
Review significant accounting and reporting issues, including recent professional and regulatory pronouncements, and understand their impact on the financial statements, reviewing with management and the external auditor where appropriate. | |
| 4.6. |
Review any legal matters which could significantly impact the financial statements as reported on by the General Counsel and meet with outside counsel whenever deemed appropriate. | |
| 4.7. |
Review the annual financial statements and the results of the audit with management and the external auditors prior to the release or distribution of such statements, and obtain an explanation from management of all significant variances between comparative reporting periods. | |
| 4.8. |
Review the interim financial statements with management prior to the release or distribution of such statements, and obtain an explanation from management of all significant variances between comparative reporting periods. | |
| 4.9. |
Review all public disclosure concerning audited or unaudited financial information before its public release and approval by the Board, including management’s discussion and analysis, financial information contained in any prospectus, private placement offering document, annual report, annual information form, takeover bid circular, and any annual and interim earnings press releases, and determine whether they are complete and consistent with the information known to Committee members. | |
| 4.10. |
Assess the fairness of the financial statements and disclosures, and obtain explanations from management on whether: |
| (a) |
actual financial results for the financial period varied significantly from budgeted or projected results; | |
| (b) |
generally accepted accounting principles have been consistently applied; | |
| (c) |
there are any actual or proposed changes in accounting or financial reporting practices; and | |
| (d) |
there are any significant, complex and/or unusual events or transactions such as related party transactions or those involving derivative instruments and consider the adequacy of disclosure thereof. |
| 4.11. |
Determine whether the auditors are satisfied that the financial statements have been prepared in accordance with generally accepted accounting principles. |
A-4
| 4.12. |
Focus on judgmental areas, for example those involving valuation of assets and liabilities and other commitments and contingencies. | |
| 4.13. |
Review audit issues related to the Company’s material associated and affiliated companies that may have a significant impact on the Company’s equity investment. | |
| 4.14. |
Ascertain whether any significant financial reporting issues were discussed by management and the external auditor during the fiscal period and the method of resolution. | |
| 4.15. |
Review and resolve any significant disagreement among management and the external auditors in connection with the preparation of the financial statements. | |
| 4.16. |
Be directly responsible for: |
| (a) |
the selection of the firm of external auditors to be proposed for election as the external auditors of the Company; | |
| (b) |
the oversight of the work of the Company’s external auditors; and | |
| (c) |
subject to the grant by the shareholders of the authority to do so, if required, fixing the compensation to be paid to the external auditors. The external auditor shall report directly to the Committee. |
| 4.17. |
Review and approve the proposed audit plan and the external auditors’ proposed audit scope and approach with the external auditor and management and ensure no unjustifiable restriction or limitations have been placed on the scope. | |
| 4.18. |
Explicitly approve, in advance, all audit and non-audit engagements of the external auditors; provided, however, that non-audit engagements may be approved pursuant to a pre-approval policy established by the Committee that (i) is detailed as to the services that may be pre-approved, (ii) does not permit delegation of approval authority to the Company’s management, and (iii) requires that the delegatee or management inform the Committee of each service approved and performed under the policy. Approval for minor non-audit services is subject to applicable securities laws. | |
| 4.19. |
If it so elects, delegate to one or more members of the Committee the authority to grant such pre-approvals. The delegatee’s decisions regarding approval of services shall be reported by such delegatee to the full Committee at each regular Committee meeting. | |
| 4.20. |
Oversee the independence of the external auditors. Obtain from the external auditors a formal written statement delineating all relationships between the external auditors and the Company, consistent with the Independence Standards Board Standard No. 1. Actively engage in a dialogue with the external auditors with respect to any disclosed relationships or services that impact the objectivity and independence of the external auditor. | |
| 4.21. |
Review and approve the Company’s hiring policies regarding partners, employees and former partners and employees of the present and former external auditors of the Company. | |
| 4.22. |
Review the performance of the external auditors, and in the event of a proposed change of auditor, review all issues relating to the change, including the information to be included in any notice of change of auditor as required under applicable securities laws, and the planned steps for an orderly transition. | |
| 4.23. |
Review the post-audit or management letter, containing the recommendations of the external auditor, and management’s response and subsequent follow-up to any identified weakness. |
A-5
| 4.24. |
Review the evaluation of internal controls and management information systems by the external auditor, and, if applicable, the internal audit process, together with management’s response to any identified weaknesses and obtain reasonable assurance that the accounting systems are reliable and that the system of internal controls is effectively designed and implemented. | |
| 4.25. |
Gain an understanding of whether internal control recommendations made by external auditors have been implemented by management. | |
| 4.26. |
Review the process under which the Chief Executive Officer and the Chief Financial Officer evaluate and report on the effectiveness of the Company’s design of internal control over financial reporting and disclosure controls and procedures. | |
| 4.27. |
Obtain regular updates from management and the Company’s legal counsel regarding compliance matters, as well as certificates from the Chief Financial Officer as to required statutory payments and bank covenant compliance and from senior operating personnel as to permit compliance. | |
| 4.28. |
Establish a procedure for the: |
| (a) |
confidential, anonymous submission by employees of the Company of concerns regarding questionable accounting or auditing matters, | |
| (b) |
receipt, retention and treatment of complaints received by the Company regarding accounting, internal accounting controls, or auditing matters. |
| 4.29. |
Meet separately with the external auditors to discuss any matters that the Committee or auditors believe should be discussed privately. | |
| 4.30. |
Endeavour to cause the receipt and discussion on a timely basis of any significant findings and recommendations made by the external auditors. | |
| 4.31. |
Ensure that the Board is aware of matters which may significantly impact the financial condition or affairs of the business. | |
| 4.32. |
Review and assess the adequacy of insurance coverage, including directors’ and officers’ liability coverage. | |
| 4.33. |
Perform other functions as requested by the full Board. | |
| 4.34. |
If it deems necessary, institute special investigations and, if it deems appropriate, hire special counsel or other experts or advisors to assist, and set the compensation to be paid to such special counsel or other experts or advisors. |
| 5. |
GENERAL |
|
In addition to the foregoing, the Committee will: |
| (a) |
assess the Committee’s performance of the duties specified in this charter and report its finding(s) to the Board; | |
| (b) |
review and assess the adequacy of this charter at least annually and recommend any proposed changes to the Board for approval; and | |
| (c) |
perform such other duties as may be assigned to it by the Board from time to time or as may be required by any applicable stock exchanges, regulatory authorities or legislation. |